Attached files
Table of Contents
SECURITIES AND EXCHANGE COMMISSION
Washington, D.C. 20549
FORM 10-K
ANNUAL REPORT PURSUANT TO SECTION 13 OR 15(d)
OF THE SECURITIES EXCHANGE ACT OF 1934
For the fiscal year ended December 31, 2009
Commission file number: 001-33473
HQ SUSTAINABLE MARITIME INDUSTRIES, INC.
(Exact name of Registrant as specified in its charter)
| Delaware | 62-1407522 | |
| (State of incorporation) | (I.R.S. Employer Identification No.) |
1511 Third Avenue, Suite 788,
Seattle, Washington 98101
(Address of principal executive offices)
(206) 621-9888
(Registrant’s telephone number, including area code)
Securities registered pursuant to Section 12(b) of the Act:
| Title Of Each Class |
Name of Exchange on which registered | |
| Common Stock, Par Value $0.001 Per Share | NYSE Amex |
Securities registered pursuant to Section 12(g) of the Act:
None
Indicate by check mark if the registrant is a well-known seasoned issuer, as defined in Rule 405 of the Securities Act. Yes ¨ No x
Indicate by check mark if the registrant is not required to file reports pursuant to Section 13 or Section 15(d) of the Act. Yes ¨ No x
Indicate by check mark whether the registrant (1) has filed all reports required to be filed by Section 13 or 15(d) of the Securities Exchange Act of 1934 during the preceding 12 months (or for such shorter period that the registrant was required to file such reports), and (2) has been subject to such filing requirements for the past 90 days. Yes x No ¨
Indicate by check mark whether the registrant has submitted electronically and posted on its corporate Website, if any, an Interactive Data File required to be submitted and posted pursuant to Rule 405 of Regulation S-T during the preceding 12 months (or for such shorter period that the registration was required to submit and post such files). Yes ¨ No ¨
Indicate by check mark if disclosure of delinquent filers pursuant to Item 405 of Regulation S-K is not contained herein, and will not be contained, to the best of registrant’s knowledge, in definitive proxy or information statements incorporated by reference in Part III of this Form 10-K or any amendment to this Form 10-K. ¨
Indicate by check mark whether the registrant is a large accelerated filer, an accelerated filer, a non-accelerated filer, or a smaller reporting company. See the definitions of “large accelerated filer,” “accelerated filer” and “smaller reporting company” in Rule 12b-2 of the Exchange Act. (Check one):
| Large accelerated filer | ¨ | Accelerated filer | x | |||
| Non-accelerated filer | ¨ (Do not check if a smaller reporting company) | Smaller reporting company | ¨ | |||
Indicate by check mark whether the registrant is a shell company (as defined in Rule 12b-2 of the Act. Yes ¨ No x
The aggregate market value of the registrant’s voting stock (based on the closing sale price quoted on the NYSE Amex Stock Exchange) held by non-affiliates as of June 30, 2009 was approximately $94,313,506.
As of March 10, 2010, there were issued and outstanding 14,681,002 shares of common stock, $0.001 par value per share, and 100,000 shares of Series A preferred stock, $0.001 par value per share.
Table of Contents
1
Table of Contents
Forward Looking Statements — Cautionary Language
Certain statements made in these documents and in other written or oral statements made by HQ Sustainable Maritime Industries, Inc. or on HQ Sustainable Maritime Industries, Inc.’s behalf are “forward-looking statements” within the meaning of the Private Securities Litigation Reform Act of 1995 (“PSLRA”). A forward-looking statement is a statement that is not a historical fact and, without limitation, includes any statement that may predict, forecast, indicate or imply future results, performance or achievements, and may contain words like: “believe”, “anticipate”, “expect”, “estimate”, “project”, “will”, “shall” and other words or phrases with similar meaning in connection with a discussion of future operating or financial performance. In particular, these include statements relating to future actions, trends in our businesses, prospective products, future performance or financial results. HQ Sustainable Maritime Industries, Inc. claims the protection afforded by the safe harbor for forward-looking statements provided by the PSLRA. Forward-looking statements involve risks and uncertainties that may cause actual results to differ materially from the results contained in the forward-looking statements. Risks and uncertainties may cause actual results to vary materially, some of which are described in this filing. The risks included herein are not exhaustive. This annual report on Form 10-K, quarterly reports on Form 10-Q, current reports on Form 8-K and other documents filed with the SEC include additional factors which could impact HQ Sustainable Maritime Industries, Inc.’s business and financial performance. Moreover, HQ Sustainable Maritime Industries, Inc. operates in a rapidly changing and competitive environment. New risk factors emerge from time to time and it is not possible for management to predict all such risk factors. Further, it is not possible to assess the impact of all risk factors on HQ Sustainable Maritime Industries, Inc.’s business or the extent to which any factor, or combination of factors, may cause actual results to differ materially from those contained in any forward-looking statements. Given these risks and uncertainties, investors should not place undue reliance on forward-looking statements as a prediction of actual results. In addition, HQ Sustainable Maritime Industries, Inc. disclaims any obligation to update any forward-looking statements to reflect events or circumstances that occur after the date of the report.
2
Table of Contents
| ITEM 1. | BUSINESS |
As used in this annual report, “we”, “us”, “our”, “HQS”, the “Group”, “Company” or “our company” refers to HQ Sustainable Maritime Industries, Inc. and all of its subsidiaries and affiliated companies including Hainan Quebec Ocean Fishing Co. Ltd., or “HQOF” and Jiahua Marine Bio-Product Company Limited or “Jiahua Marine”.
History
Our company was initially incorporated on September 21, 1989 under the laws of the State of Nevada. On March 17, 2004, Process Equipment, Inc., Process Equipment Acquisition Corporation, a Nevada corporation and wholly-owned subsidiary of Process Equipment, Inc., or PEAC, and Jade Profit Investment Limited, or Jade, a British Virgin Islands limited liability corporation, entered into an agreement and plan of merger with us. Pursuant to that agreement, Process Equipment, Inc., through PEAC, acquired Jade, and 84.42% ownership in Jade’s subsidiary Hainan Quebec Ocean Fishing Co. Ltd, a People’s Republic of China, limited liability corporation, which we refer to as HQOF. As a result of that transaction, HQOF became our main operating subsidiary. In April of 2004, pursuant to the above agreement and plan of merger, the board of directors of Process Equipment, Inc. and a majority of the stockholders approved a name change and change of domicile of that company to Delaware via a merger with the newly formed wholly-owned Delaware subsidiary, HQS. The name change, change of domicile and merger became effective on May 19, 2004, with HQS being the surviving entity in the merger and acquiring all the assets and liabilities of Process Equipment, Inc. On August 17, 2004, we entered into a Purchase Agreement with Sino-Sult Canada (S.S.C.) Limited, a Canadian limited liability corporation (“SSC”), whereby we acquired Sealink Wealth Limited (“Sealink”), SSC’s wholly owned subsidiary incorporated in the British Virgin Islands. Sealink is the sole owner of Hainan Jiahua Marine Bio-Products Co. Ltd., a limited liability company existing in China (“Jiahua Marine”) which is primarily engaged in the production and sales of marine bio-products and healthcare products in the PRC, as described in more detail in this current report.
On April 16, 2004, HQ Sustainable Maritime Marketing Inc. (“HQS Marketing”) was formed and registered in USA, as a wholly-owned subsidiary of HQS. That subsidiary develops and markets our products in the United States.
On June 15, 2004, HQ Sustainable Maritime Marketing (Canada) Inc (“HQS Canada”) was formed in Canada and is wholly owned by HQS. HQS Canada commenced operations in June 2004, and performs business development, sales, and marketing in the Canadian market.
On May 6, 2005, Phoenix Global Creations Limited (“Phoenix”) was formed in British Virgin Islands as a wholly owned subsidiary of HQS. Phoenix was established as an investment holding company and is the parent company of Highest Quality Aquaculture Feed Products Co. Ltd.
On September 20, 2005, HQ Sustainable Maritime Industries (Hong Kong) Limited (“HQS HK”) was formed in Hong Kong and is wholly owned by HQS indirectly. The subsidiary is primarily engaged in the sales of healthcare products in Hong Kong.
On October 1, 2005, Highest Quality Aquaculture Feed Products Co. Ltd (“Feed Mill”) was formed in Hainan, PRC and is wholly owned by HQS indirectly. The construction of the Feed Mill began in 2008 and will produce organic extruded feed for tilapia. All related expenses and capital investments related to the new plant were transacted through the Feed Mill Company. The new Feed Mill has commenced processing in late 2009. The Feed Mill is a wholly owned subsidiary of Phoenix.
On November 29, 2007, Kingly Sun International Ltd (“Kingly Sun”) was formed in British Virgin Islands and is a wholly owned subsidiary of HQS. Kingly Sun was established as an investment holding company. It has been dormant since its incorporation.
On November 29, 2007, Liberal Sky Holdings Ltd (“Liberal Sky”) was formed in British Virgin Islands and is a wholly owned subsidiary of HQS. Liberal Sky was established as an investment holding company. It has been dormant since its incorporation.
On November 29, 2007, Unique Solutions Holdings Ltd (“Unique Solutions”) was formed in British Virgin Islands and is a wholly owned subsidiary of HQS. Unique Solutions was established as an investment holding company. It has been dormant since its incorporation.
On June 10, 2008, Hainan Hongrui Fish Farming Co. Ltd was set up in the PRC and is wholly owned by Kingly Sun. The subsidiary has been dormant since its incorporation.
On October 17, 2008, Hainan Jiabao Aquaculture Co. Ltd was set up in the PRC and is wholly owned by HQOF. The subsidiary has been dormant since its incorporation.
On October 16, 2009, Hainan Yizhao Improved Tilapia Breed Co. Ltd was set up in the PRC and is wholly owned by Liberal Sky Holdings Ltd. The subsidiary has been dormant since its incorporation.
3
Table of Contents
In November 2009, Hainan Jiahua Pharmaceutical Co. Ltd was set up in the PRC and is wholly owned by Jiahua Marine. The subsidiary has been dormant since its incorporation.
Our headquarter office is located at 1511 Third Avenue, Suite 788, Seattle, Washington, and our telephone number is (206) 621–9888. The URL for our website is http://www.hqfish.com.
General Overview
We are a multi-national company with our headquarters and primary sales offices based in Seattle, Washington. We are a vertically integrated aquatic product producer, processor, and farmer (e.g. through cooperative arrangements with pond farmers), with operations in the People’s Republic of China, or the PRC, of all natural tilapia, other aquatic products, and marine bio and healthcare products. We use state-of-the-art and environment-friendly technologies in our production, processing, and cooperative farm operations. Our facilities are currently certified according to the Hazard Analysis and Critical Control Point (“HACCP”) standards, currently assigned a European Union (“EU”) code required for exporting aquatic products to the EU, and are currently certified in accordance with the Aquaculture Certification Counsel (“ACC”) standards. Our products are sold principally to customers in North America, Europe and Asia. Our current sales activity is primarily directed to distributors within the PRC, rather than within the U.S.
Established in 1999, our aquatic farming and processing operations are in Hainan Province, an island in the South China Sea, which is situated within the most desirable latitude for raising tilapia. The Chinese government has designated Hainan Province in southern China a “green” province, where only environmentally friendly agri-food related industry and tourism are permitted. We purchase and process farm bred and farm raised tilapia through cooperative supply arrangements with local farmers and cooperatives. Our supply cooperatives, under our guidance, use feed formulated by us to optimize the all natural growth of farm raised tilapia. Starting in 2009, we began supplying the farmers and cooperatives with feed formulated from our feed processing mill. We believe our tilapia products have achieved such a high level of purity that we market these products as all natural tilapia. In addition, we purchase and process ocean-caught aquatic products through cooperative supply arrangements with local fisherman for our marine bio healthcare products.
In August 2004, the company acquired Hainan Jiahua Marine BioProducts Co. Ltd., or Jiahua Marine, which develops, produces and sells marine bio and healthcare products, including nutraceutical products for the enrichment of our feed formulas, exclusively in China. The principal products of Jiahua Marine are manufactured from fish by-products (tilapia and shark) that include shark cartilage capsules and shark liver oil products that are distributed exclusively in China. The products undergo substantial independent laboratory testing administered by the Ministry of Health in China, which has resulted in a PRC National Certification for these products. These products have various perceived medicinal and health benefits. As part of HQS’s vertical integration plan with respect to tilapia, Jiahua Marine introduced new bio and healthcare products made from tilapia in 2009.
In order to maintain the high quality of our products and to position ourselves for attaining completely organic production certification in the future, we have completed the construction of our own feed mill and processing plant for the production of floating feed formulations. We produce the feed using grains grown without chemical fertilizers, free of antibiotics and fishmeal, and use feed additives manufactured in our nutraceutical plant. We plan for this expanded production to satisfy our own demand through the 20,000 mu (or 3,294 acres) of production in Wenchang and Qionghai, as well as to manufacture feed for others’ farmed operations in Hainan, such as shrimp and other farmed species.
From our headquarters in Seattle, Washington, we market and brand our high-quality, all natural tilapia products under the name TILOVEYA. In early 2009, we introduced a new family of frozen tilapia meals under the brand name “Lillian’s Healthy Gourmet.” This new family of products includes an organic, natural and regular line of frozen tilapia meals.
Industry Overview
Aquaculture Industry
Aquaculture is the farming of aquatic animals or plants. Aquaculture is the fastest growing segment in the food production system and has been for the past two decades. According to a recent study by the World Food and Agriculture Organization (“FAO”) published March 2, 2009 world fisheries production reached a new high of 143.6 million metric tonnes in 2006, including farmed and ocean caught product. The contribution of aquaculture to the world fisheries production in 2006 was 51.7 million tonnes of fish, which is 36% of world fisheries production up from 3.6% in 1970. Global aquaculture accounted for 6% of the fish available for human consumption in 1970. In 2006 global aquaculture accounted for 47% of the fish available for human consumption according to the FAO. The FAO report also describes that over half of the global aquaculture in 2006 was freshwater finfish. Based on the FAO’s projections, it is estimated that in order to maintain the current level of per capita consumption, global aquaculture production will need to reach in excess of 80 million tonnes of fish by 2050.
4
Table of Contents
As the availability of sites for aquaculture is becoming increasingly limited and the ability to develop non-agricultural land is often restricted, the competition to develop additional aquaculture production systems is intensifying. As the intensification for aquaculture production systems increases, the demand for institutional support, services and skilled persons is anticipated to increase, along with the demand for more knowledge-based aquaculture education and training as aquaculture becomes more important worldwide. China remains the largest producer of aquaculture products throughout the world with fisheries in China reportedly producing approximately 41.3 million tonnes of fish in 2004. Within the global aquaculture industry, China accounted for 71.0% of the world’s supply of fish for direct human consumption and 29.9% of the total production by live weight in 2002.
Tilapia Industry
In 2005, according to the American Tilapia Association (“ATA”), tilapia production worldwide was second in volume to carp, and it is projected by the ATA that tilapia will become the most important aquaculture crop in this century, potentially reaching $5.0 billion in global sales by 2010. Commercial production of tilapia has become popular in many countries around the world. Touted as the “new white fish” to replace the depleted ocean stocks of cod, pollock, and hake, world tilapia production continues to rise and at least 100 countries currently raise tilapia, with the PRC being the largest producer. The American Tilapia Association further reports that world production of tilapia products reached approximately 2.5 million metric tonnes in 2007, of which China produced the dominant share of 45.0%.
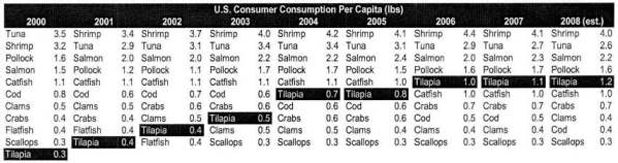
One of the major outlets for Chinese-produced tilapia has been, and should continue to be, the United States. The following chart reflects the increase in per-capita consumption of tilapia in pounds in the United States in relation to other traditional types of seafood.
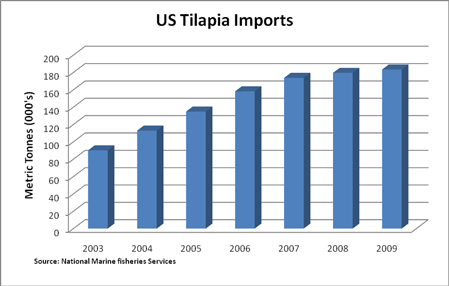
The following chart reflects the increase in imported tilapia to the United States during the periods indicated.
Separately, according to the International Trade Report produced in 2005 by the United States Department of Agriculture, or the USDA, “U.S. per-capita seafood consumption has remained around 15 billion pounds through the late 1980s and 1990s; it is expected to increase as farm-raised products become cheaper. Currently, the United States consumes nearly 12 billion pounds of fish a year. By 2025, demand for seafood is projected to grow by another 4.4 billion pounds (2 million metric tonnes) above what is consumed today. In addition, it is estimated that by 2020, 50% of the U.S. seafood supply will come from aquaculture. Presently, more than 70% of the seafood consumed in the United States is imported, and at least 40% of that is farm-raised. Major changes in U.S. population, along with shifting demographics and economic growth, will alter the U.S. seafood market over the next decade, affecting the selection of products consumed. It is expected that fresh and frozen fish products will account for a growing share of overall seafood consumption, with shrimp remaining at the top. By 2020, shrimp, salmon, tilapia, and catfish will be the top four seafood products consumed.”
According to Globefish.org, during the past ten years, tilapia captured by fisheries have stabilized at 0.6 million metric tonnes, while their aquaculture production has grown from 0.55 million metric tonnes to 2.0 million metric tonnes. Tilapia is one of the top five seafood imports in the world. In 2005, more than $2.4 billion of tilapia was sold worldwide according to the FAO Fishstat 2007. In 2005, tilapia moved up to the fourth-ranked most popular seafood after farm-raised shrimp, tuna and Atlantic salmon in terms of aquaculture products imported into the United States. The United States is now the world’s largest consumer of tilapia, after China, having imported 437 thousand metric tonnes of tilapia in 2007. In terms of volume, frozen whole round fish ranks first, followed by frozen fillets and, lastly, fresh fillets.
The growing consumer demand for seafood is largely evolving from a new public awareness regarding its health and nutritional benefits. The USDA “pyramid” guidelines continue to support frequent fish consumption, and the USDA recently completed a highly technical nutritional analysis report about tilapia for the general public. The USDA’s Agriculture Research Service Lab reports that tilapia is moderate in polyunsaturated fatty acid (0.387 g/100g raw, 0.600 g/100g cooked), moderate in omega 3 fatty acids (0.141g/100g raw, 0.220g/100g cooked) and low in mercury (0.010 parts per million, which we refer to as PPM), which is considered to be non-detectable. With the increased awareness of the health concerns surrounding mercury, tilapia’s low mercury levels (0.010 PPM) distinguish tilapia favorably from other types of fish with higher mercury levels, such as swordfish (0.976 PPM), mackerel (0.730 PPM) and yellow fin tuna (0.325 PPM).
5
Table of Contents
Over-the-Counter Marine Bio and Healthcare Products
Due to its aging population, China is demographically attractive for healthcare companies. According to the Chinese Ministry of Health’s 2009 figures, of the 1.3 billion people in China less than 8% are 65 or older; however, by 2050 that proportion is expected to rise to 24%. It is expected as well that Chinese will benefit from double-digit annual growth in disposable incomes during this period. We anticipate that this will lead to increasing use of western therapeutics and “over the counter” remedies. In addition, the market place is highly fragmented with more than 4,000 manufacturers of such remedies in China, most of whom lack scale and access to capital. From 2009 to 2011, we believe approximately $124 billion will be allocated to healthcare expenditure in China. HQS has benefited from regulatory consolidation that resulted in the imposition of higher Chinese Good Manufacturing Practice (“GMP”) standards in 2007 and intends to be a leader in its emphasis on the highest quality standards.
The marine bio and healthcare products industry in China is also sizable, with approximately $6 billion in sales, which still constitutes only 3% of the world market. Currently, overall sales of these products in China have fallen slightly as compared to the previous year, as consumers gravitate toward branded products meeting international quality standards and with proven benefit for consumers, and away from less known brands and traditional remedies.
In general, sales of marine bio and healthcare products are made through retail and direct sales channels. Direct sales in China are relatively new, and restrictions on direct sales imposed on large foreign companies have been implemented in China, which has allowed for a growth in sales for PRC-based direct sales companies. These restrictions require foreign direct sellers to manufacture their products and to capitalize their businesses in China. Several companies have met these requirements, including HQS through its PRC-subsidiaries, and growth in this sector is expected to be strong in the next few years.
We believe that nutraceutical supplements in the feed industry is a sector that has strong growth potential, as the importance of aquaculture and aquaculture feeds increases. We manufacture actualized feeds, which involves choosing additives to be included in the feed, such as vitamin E, that promote health in fish, thus reducing the need for curative measures such as antibiotics. Once ingested and present in the flesh of the fish, vitamin E increases the shelf life of the fish and also introduces an additional source of vitamin E to its consumers. Other similar nutraceutical supplements can also be used.
Our Products
Tilapia
Tilapia is currently farmed throughout many countries around the world because this fish is disease-resistant, reproduces easily, eats a wide variety of feeds and tolerates a variety of poor water quality even water with low dissolved oxygen levels. Although there are many species of tilapia, only a few species are farmed for human consumption. The most common species that is farmed commercially is the black, or Nile, tilapia that is grown in ponds, cages or rice fields.
In response to increasing demand for tilapia, we export from our subsidiary in the PRC varying quantities of tilapia in different forms to the United States, Europe, Asia and other regions. In 2007 we launched a marketing and distribution initiative in the United States and Europe with our TILOVEYA® brand tilapia. We continue to promote our TILOVEYA® brand with several leading distributors and retailers in Europe and the United States. We also entered into an exclusive agreement with the Beijing division of Newly Weds® Foods, Inc. to introduce an innovative line of battered and breaded flavored TILOVEYA® fillet for the Chinese consumer. In addition, we co-developed a process and natural flavoring giving tilapia the taste, texture and aroma of fresh ocean-caught fish. We will process such products without the drawbacks of ocean-caught product such as ocean waste and, ecological management. The tilapia products sold by us are mainly in the following forms: whole round frozen, gutted and scaled, boneless-skinless tilapia fillets and, more recently, we began selling boneless-skin-on tilapia fillets.
In 2008 and 2009, we developed a family of frozen tilapia meal products under the brand name of “Lillian’s Healthy Gourmet.” The family of products will have three lines focusing on organic, natural and regular frozen meals. These meals will be processed by a variety of manufacturing facilities in North America including Marsan Foods located in Toronto, Canada. Marsan is the top Canadian processor of Private Label entrées and branded Healthcare products. The Company has extended brokerage and distribution arrangements across the United States and is continuing to roll out product and expand its range of value added products from 12 ounce meals to 8 ounce meals and adding flavors. Other value added products are in the pipeline using our Tilapia products catering to an all-natural value added market.
Our principal operating subsidiary with respect to our seafood products is Hainan Quebec Ocean Fishing Co. Ltd., a company organized in the PRC (“HQOF”).
6
Table of Contents
Marine Bio and Healthcare Products
Since the August 2004 acquisition of our wholly-owned subsidiary, Hainan Jiahua Marine BioProducts Co. Ltd. (Jiahua Marine), a Chinese limited liability company, we have also been engaged in the development, production, and sales of marine bio and healthcare products in the PRC. We acquired Jiahua Marine pursuant to a purchase agreement with Sino-Sult Canada Limited (SSC), a Canadian limited liability company, and Sealink Wealth Limited (Sealink), a British Virgin Islands limited liability company, a wholly-owned subsidiary of SSC and the then sole shareholder of Jiahua Marine.
The principal products of Jiahua Marine are manufactured from fish by-products (tilapia and non-endangered shark) that include shark cartilage capsules and shark liver oil products which are distributed exclusively in China. We currently produce over 25 products all of which were developed internally. The products undergo substantial independent laboratory testing in China administered by the Ministry of Health in China and have resulted in a PRC National Certification for these products. These products have various perceived medicinal and health benefits. As part of the HQS’s vertical integration plan of tilapia, Jiahua Marine has introduced new bio and healthcare products made from tilapia in 2008. These products include calcium supplement tablets made from the bones of tilapia and collegian facial creams made from the skin and head of the tilapia.
These products have medicinal and health benefits that include:(1) increasing the efficacy of the immune system, correcting blood acidity, (2) reducing fatigue, (3) improving absorption of oxygen into the blood, (4) activating the anti-cancer cells (a major component of the innate immune system), (5) strengthening of bones, and (6) increasing subcutaneous moisture which has anti-wrinkle qualities. All of our healthcare products have undergone stringent independent laboratory testing in China. These tests are administered by the Ministry of Health in China. As part of this process, several laboratories are selected at random from a pool of top university laboratories to conduct tests which must confirm the results and claims of the applicant company. The applicant company can make claims about the health benefits of its products only after such stringent, independent validation of its claims by selected laboratories have been verified. Our claims in respect of our healthcare products have been rigorously tested and proven in China through the above process. Clinical trials and laboratory testing in China by selected university laboratories have resulted in a PRC National Certification of Excellence.
These products are currently sold throughout China, are naturally derived from ocean-harvested by-products and are winners of Science and Technology Progress Awards in China. Jiahua Marine also had established a long-term relationship with the Qingdao University of Oceanography for research and training relating to the production of our marine bio and healthcare products up to 2006. Currently, HQOF and Jiahua Marine are in preliminary discussion with other universities in the PRC for further research and development.
Shark cartilage–This product is highly alkalescent, it contains chondroitin sulfate and calcium and impacts the human body positively in the following ways:
| • | increases efficiency of immune system and activates NK cells associated with combating cancer, as sharks are cancer free; and |
| • | reduces blood acidity, thus improving: |
| • | blood pressure; |
| • | apoplexy; |
| • | heart disease; |
| • | fertility; and |
| • | Osteoporosis. |
Shark liver oil–This product is rich in squalene and other nutrients, to which we add vitamins D and E, and impacts the human body positively in the following ways:
| • | improves absorption of oxygen in the body; |
| • | eliminates fatigue; and |
| • | Improves health, through the high levels of omega 3 oils. |
As part of the HQS’s vertical integration plan of tilapia, Jiahua Marine has introduced and will continue to introduce new bio and healthcare products made from tilapia in 2010. The products introduced thus far include; (1) Shalitong Capsules which are made from the amino acids of Tilapia and help in the digestive functions of the body; (2) Xueyuan Capsules vitamin supplement including collagen polypeptides and vitamins; (3) Yubaobaokang Capsules which contain iron supplements and increase appetite; and (4) Cephalin Capsules made with Tilapia brain extract improves brain function and memory functions and helps resist the aging process of the brain.
7
Table of Contents
In addition to the marine bio and healthcare products that we currently produce, we started the manufacturing of nutraceuticals generated from palm oil, or other natural or organic matters to enrich feed formulations for tilapia and shrimp farmed in the Hainan area. The enriched feed will have a longer shelf life, and we expect that the benefits of the enriched feed will pass to the end users of our tilapia products, the ultimate customers. These ingredients help improve general health, growth, feed conversion and meat quality of fish and shrimp. Our marine bio and healthcare products processing plant is located in the Wenchang City of Hainan Province and has two production lines, a powder-product line and an oil-product line. These production lines are suited for the manufacture of nutraceutical components. The plant is equipped with a specific gravity molecular separator and accessory equipment for the manufacture of nutraceutical products that serve as feed additives in the production of feed, including tilapia and shrimp feed.
Shrimp
Our principal shrimp product is the white shrimp. Our shrimp is exported to various countries in the following forms: head-on shell-on shrimps, headless shell on shrimps, peeled tail-on shrimps, peeled and deveined shrimps, peeled and undeveined shrimps. All orders can be packaged in accordance with the requirements of the buyer, either block or individually quick frozen.
Our Principal Competitive Strengths
We believe we have the following principal competitive strengths:
| • | Quality All Natural Tilapia Products. We produce all natural tilapia products and have developed a farming system that avoids the use of antibiotics, hormones and other potentially toxic chemicals. Our tilapia is raised in ponds of pure rain water collected for aquaculture. Two other species of fish are introduced into the ponds to maintain the ponds’ health naturally. One of the species is a bottom feeder that cleans up all the waste at the bottom of the ponds (carp), and the other species is a predator fish that eliminates all of the unhealthy fish (snakehead). We formulate feed without fishmeal and produce feed supplements in our healthcare products processing plant to enrich this feed. It is our policy to raise all natural tilapia to distinguish our company from other tilapia producers. The latitude and the pristine environment of the Hainan province of China have provided us with what we believe to be the optimal conditions for all natural aquaculture production. |
| • | Vertically Integrated Operations. Our newly completed feed mill is an important additional step towards our goal of complete vertical integration of our operations, which will allow us to further control and monitor the quality of our aquaculture products, as well as control our costs. The local farmers that we have cooperative arrangements with use our production methods and allow us to constantly monitor the production process for highly consistent production that results in high quality products at the time of harvest. |
| • | Environmental and Quality Assurances. We are a leader in environmental and quality assurances of aquaculture products. We have adopted and implemented stringent quality control measures and procedures throughout the production process, in order to comply with the various environmental and quality standards, such as the HACCP and the EU import standards. We are also certified in accordance with the ACC standards and positioning ourselves for completely organic production certification of our tilapia products in accordance with market demands. We use state-of-the-art technologies in our farming, feed formulation and processing operations. We have adopted modern and environmentally friendly and responsible technology in our production and processing of tilapia, shrimp, and marine bio and healthcare products, which we believe have been recognized as such through the certifications our plants possess. |
| • | Strategic Location in Hainan Province, China. Our processing facilities are geographically well-positioned in Hainan Province to leverage favorable climatic conditions, abundant water supply, pristine environment and a readily available source of labor for our processing plant. We are also located near a seaport, near the city of Wenchang, and our processing facilities are conveniently located near the farmers from whom we obtain our supply of tilapia and shrimp. |
| • | International and Domestic Sales and Marketing Efforts. Our Seattle office allows us to differentiate our TILOVEYA® brand and marketing initiative of our all natural tilapia products. Following the success of the TILOVEYA® brand, we introduced in 2009 a family of frozen tilapia meal products under the brand name of “Lillian’s Healthy Gourmet.” The family of products will have three lines focusing on organic, natural and regular frozen meals. The “Lillian’s Healthy Gourmet” brand will help us continue to establish our products as the all natural tilapia products of choice both domestically and internationally. Sales from both the Seattle and China offices complement our multi-national sales efforts to become a world leader in all natural tilapia products. |
| • | An Established Track Record and Brand Name in the Industry. We have an established track record and recognized brand name in the industry and have received numerous awards and certifications, which we believe reflects the success of the company in distinguishing itself from its competition. |
| • | Competitive Cost Structure. We benefit from competitive cost structures due to the lower labor costs in China as compared to other companies that produce similar products. |
8
Table of Contents
Our Growth Strategies
Our objective is to become the world leader in vertically integrated production, processing and raising of all natural tilapia products. This includes the use of tilapia by-products to increase the range and variety of our marine bio and healthcare products, with a primary focus on increasing our own seafood products. To achieve this goal, we intend to implement the following strategies:
| • | Our newly completed large-scale feed mill to supply our existing and anticipated new cooperative fish farmers with our fish food formula. We anticipate that the new feed mill will help increase our aquatic profit margin, help guarantee our product quality and further vertically integrate our operations; |
| • | We intend to achieve completely organic production of our tilapia products and to pursue organic certification of our farms as market demand dictates; |
| • | We plan to expand direct and retail sales of our health products in China and internationally and to add other products we currently have in the development pipeline; |
| • | We plan to expand our development of health products by using the by-products of tilapia, which will help increase the overall aquatic products’ gross margins; |
| • | We plan to expand our cooperative farming arrangements to increase the availability of tilapia to meet anticipated growth in demand; |
| • | We plan to construct our own tilapia farmed ponds to improve growth time and quality of our product and further vertically integrate our operations; |
Manufacturing and Production
Marine Bio and Healthcare Products
Our plant for processing marine bio and healthcare products consists of two production lines: a powder-product line and an oil-product line. The production lines are equipped with a complete set of imported and domestic made devices, including a vacuum frozen dryer for bio-products, a molecular distillation device, a micro-disintegrator, a packing machine and test instruments. Our raw material treatment workshops (e.g. work area) includes an extraction workshop, a freezing and drying workshop, a powder distillation workshop, and a finished product workshop for our powder line. Our pre-treatment workshops include a cooling and filtration workshop, a molecular distillation workshop, a supplemental items workshop and a capsule workshop for our oil line.
This plant is equipped with a molecular distillation device, which produces a variety of refined oil products including vitamin E used for human consumption and as a supplement to tilapia and other feeds. These vitamins are processed from natural products, such as palm oil. This plant has been certified in accordance with the China National Health Inspection program as a “Chinese Good Manufacturing Practice” (GMP) by the Hainan Provincial Health Bureau. We believe that our nutraceutical business is closely connected to our planned expansion including the completion of our own feed mill described below. Actualized feed additives provide health benefits to the fish, such as increasing health and avoiding the use of curative measures involving antibiotics. The consumers of these fish products in turn benefit from increased shelf life of the fish products, and from the additional sources of vitamin E resulting from the consumption of our products.
Aquaculture Products
Our plant for processing aquatic products is a Canadian designed facility located in Hainan, China. We operate six processing lines, which consist of two filleting lines, two whole round fish processing lines (principally tilapia which is gutted, scaled and gilled), and two block processing lines. This processing plant is capable of processing an average of approximately 40,000 metric tonnes (additional capacity of 10,000 metric tonnes was completed in November of 2009) per year of whole round fish (principally, tilapia), 10,000 metric tonnes per year of fillet tilapia and 3,000 metric tonnes per year of all forms of shrimp. Such capacity may become inadequate to meet our projected demand from our existing customers and the national retail food service chains targeted by us. In 2009 we completed a large scale organic feed mill, to supply our existing and anticipated new cooperative fish farmers with our fish food formula. We have completed taste trials with several national retail food service chains, and, we expect to phase in deliveries in the second half of 2010. The scale of production is a critical factor for such chains, and we expect that expanded production will enable us to enter into larger supply arrangements with several chains.
Construction of Feed Mill and Processing Plant
In order to maintain the high quality of our products, we have constructed our own feed mill that began operations in late 2009 for the production of organic, extruded (floating) feed formulations. This type of feed is the most efficient feed for our farming operations. In early 2010 we will begin producing the feed, free of antibiotics and fishmeal, and use feed additives manufactured in our nutraceutical plant. The feed formulations will be prepared with the benefit of the latest technologies to assure a minimum of toxicity. The feed will be enriched using vitamin E, as well as naturally sourced amino acids, which provide actualized benefits to the fish and the consumers thereof. The floating feed formulations will reduce waste in the aquaculture reservoirs, thus reducing the requirement for chemicals to stabilize reservoir health. The feed mill will allow us to continue our vertically integrated production strategy, ensuring quality control throughout the entire production and processing cycle. We plan to partner with other parties, as appropriate, to produce the optimum formulation of feed. Presently, there is no high quality floating or organic feed production in Hainan. This expanded production will satisfy our own demand through, as well as to manufacture feed for other farmed operations in Hainan such as shrimp and other farmed species. The plant can manufacture some 100,000 metric tonnes annually of feed.
9
Table of Contents
We expect that the new processing plant will provide for value added production, allowing us to make fish sticks and fish patties as well as the fillets and whole round products that we currently manufacture. We expect that it will take approximately nine to twelve months to build the new processing plant.
Distribution Channels
Our current sales activity is primarily directed to distributors within the People’s Republic of China (“PRC”), rather than within the U.S. At the present time, we sell more than 90% of our seafood products in China to Asian clients which are then distributed principally in the United States and Europe, and we sell all of our marine bio and healthcare products exclusively in the PRC. Through our Seattle office, we are able to work directly with wholesale and retail buyers. The programs established with retail distributors are rather different than with wholesalers. Retailers require product introduction and marketing support and pay differently than wholesalers. The latter generally take delivery of product ex-plant and pay through a letter of credit, while the former take delivery in the United States and pay on negotiated terms.
The Seattle office is charged with maintaining existing accounts and introducing our all natural tilapia products to a new target market of retail and food service industry purchasers. We plan to introduce our family of products branded “Lillian’s Healthy Gourmet” throughout North America in 2009. We are currently selling our all natural tilapia products to the European market through distributors and retailers. We are actively seeking to expand our distributor network in Europe for our TILOVEYA® brand.
Currently, all of our marine bio and healthcare products are sold in the PRC. Through our subsidiary Jiahua Marine, we currently sell a range of healthcare products under the brand name “Jiahua” in the PRC.
Our China sales are principally marketed through our offices in Wenchang to customers that include domestic supermarkets, airlines, hotels and local distributors. Direct sales of healthcare products target tourists in various popular destinations in China, such as Sanya, Beihai and the Three Gorges project. Seminars are organized for these tourists that usually result in the purchase of our products. These products are also sold in various chain stores, over the internet, and through mail order sales throughout China.
Advertising and Marketing
Our sales and marketing team consists of ten members that are under the overall supervision of Mr. Harry Wang Hua, our Chief Operating Officer. Our sales and marketing team is responsible for establishing our sales and distribution networks both domestically and internationally, promoting our image and product awareness and maintaining our customer relationships. As part of his duties, Mr. Harry Wang Hua leads our plant management teams for both marine bio and healthcare products and aquaculture products. The Seattle personnel are responsible for increasing awareness and focus of our branding and marketing initiative, the rollout of our all natural TILOVEYA® brand, and the rollout of our family of products under the “Lillian’s Healthy Gourmet” brand.
We believe that our principal operating subsidiary, HQOF, is the only vertically integrated PRC based producer present at the international seafood shows (e.g., Brussels Seafood Show and Boston Seafood Expo). Participation in these industry events enables us to establish high level and immediate contacts with potential buyers. Buyer preferences and our response to these preferences, as well as prices and response to quality and quantity concerns, can be promptly addressed without the usual screening and middleman costs. We plan to aggressively market our products throughout North America, Europe and Asia through such shows.
In February 2006, we established our corporate headquarters, marketing and sales office in Seattle, Washington, thus creating a strong presence in the U.S. market. This office allows us to increase awareness of the importance of our all natural product focus and to reap the benefits of more direct sales, increasing our overall sales, market penetration and profitability. We expect to also be able to broaden the scope of our products to cater to additional seafood purchasing requirements.
Sustainable Farming
The concept of sustainable development has been popularized by the 1987 World Commission on Environment and Development. It defined “sustainable development” as meeting the needs of the present generation, without compromising the needs of future generations. The idea of sustainability has caught up with aquaculture partly because of pressure from environmental groups. In 1998, the Holmenkollen Guidelines for Sustainable Aquaculture were formulated. These guidelines recommended, among other things, that new technologies and management procedures should be utilized so that the quality and quantity of aquaculture products is improved and the risk of adverse effects on the environment and on the livelihood of other people, including future generations, is reduced. The guidelines also recommended (1) strict compliance with the internationally agreed food safety, environmental safety and ethical criteria if genetically modified organisms or hormones are utilized in the production, as well as (2) giving priority to the development of integrated fish farming and of sources for animal feed other than fish protein and fish lipid. We fully endorse the idea of sustainable farming and implement it in our operations through our cooperative supply arrangements.
10
Table of Contents
Organic Farming
We believe that organic farming may be considered to be the next step after sustainable farming. Organic farming is a trend towards simple and moderate farming methods that are inherently sustainable. Organic farming advocates against the use of hormones and certain drugs, genetically modified organisms, very intensive culture systems, use of fish meal from the fish meal industry and oils from animals. As the market demand for sustainable and environmentally sustainable practices increases, the aquaculture industry is in the process of adjusting to such demand by starting to offer organic products. Further, we believe that many companies are finding that the use of waste streams from aquaculture can be used as a nutrient source for the culture of other aquatic flora and fauna, as well as land based agriculture.
We believe that operating costs for organic culture should be lower than intensive farming, with the feed remaining the key operating cost. We have determined that organic production of tilapia is technically possible in Hainan Province. Further, our preliminary evaluation of farm production economics (such as feed costs, feed conversion ratios, growth rates and yields) as they relate to expected market demand indicates that we could engage in organic farming profitably. In late 2009, we finished construction of a large-scale organic feed mill and began pursuing organic certification of our farms in order to commence organic tilapia production. We anticipate that our tilapia products will meet organic standards as defined by The US Department of Agriculture.
In January of 2008 the Company received the Certification attesting to the organic standards for its tilapia production, processing, labeling, marketing and management system. Certification came after an initial annual audit conducted by Beijing Continental Hengtong Certification Co., Ltd. (CHTC), a certifier authorized by The China National Accreditation Service for Conformity (CNAS) and the Certification and Accreditation Administration of the PRC (CNCA).
Our Cooperative Supply Arrangements
We purchase and process farm-bred and ocean caught aquatic products through cooperative supply arrangements with local fishermen and cooperatives. Our farmed tilapia products come from approximately 1,647 pond acres of farms situated in the Wenchang area of Hainan. These farms are grouped through cooperatives to supply us with the highest quality tilapia in accordance with the sustainable farming standards described above.
We strive to implement the principles underlying sustainable farming and elements of organic farming in our cooperative supply arrangements with local fishermen and cooperatives, from which we purchase and process farm-bred and ocean caught aquatic products. Under our related cooperatives, or collaboration agreements, the farmers or holders of the concession retain their proprietary status, while agreeing to operate under planned and scheduled practices put forward by our company as cooperative partner of the concessions. The farmers are trained to our standards for deploying appropriate feeds and using poly-culture techniques, while we monitor compliance with these standards on an on-going basis. The farmers are also required to agree to treat waste water responsibly as a nutrient rich fertilizer for the vegetable fields maintained by neighboring farmers.
We typically have between five and ten cooperative supply agreements, which number may vary from time to time. We believe that these cooperative supply arrangements provide mutual benefits to the parties involved, as they help increase revenues of the local farmers, while ensuring a stable supply of quality raw tilapia to us.
Trademarks and Patents
We have the following patents on our products: Chinese Patent Number 460000X340-2001—Shark Cartilage; Chinese Patent Number 460000X131-2001—Shark Cartilage; Chinese Patent Number 460000X338-2001—Shark Liver Oil; and Patent Number 460000X342-2001—Shark Liver Oil. These patents are for a 20 year period and will expire in 2021. Two products are produced from refined shark cartilage and two from shark liver, both harvested from non-endangered shark species.
We consider our service marks, trademarks, trade secrets, patents and similar intellectual property to be critical to our success. We rely on trademark, patent and trade secret law, as well as confidentiality and license agreements with our employees, customers, partners and others to protect our proprietary rights. We have received patent protection and applied for trademark protection for our products in the PRC. We have also applied for trademark protection in the U.S., as described below, in connection with our branding of all natural tilapia. Effective trademark, service mark, patent and trade secret protection may not be available in every country in which we sell or may in the future sell our products, and our competitors may independently develop formulations and processes that are substantially equivalent or superior to our own.
11
Table of Contents
TILOVEYA®
In May 2006, we introduced our new all natural tilapia brand TILOVEYA® at the European Seafood Exposition in Brussels, the largest seafood show in the world. This brand is designed to celebrate the health benefits of our tilapia produced in Hainan Province, China. Our freshwater tilapia products are made without hormones, antibiotics and free of heavy metals and other toxins associated with ocean sourced products. The United States Patent and Trademark Office (“USPTO”) has issued registrations with respect to the following trademarks as used in connection with our branding of all natural tilapia:
| • | Registration Number 3313536 for the TILOVEYA® mark; and |
| • | Registration Number 3304756 for the TILOVEYA® Logo. |
Lillian’s Healthy Gourmet™
In August of 2008, we developed the concept of a family of products under the brand of “Lillian’s Healthy Gourmet.” This family of products is based on the concept of our all natural tilapia products produced in Hainan Province, China. Individuals should be able to eat a convenient, healthy seafood meal at a reasonable price, while maintaining their demanding life style. This family of products brand “Lillian’s Healthy Gourmet” is designed to meet the need for a convenient, healthy seafood meal at a reasonable price. The USPTO has allowed the following applications for trademark registrations in connection with our branding of the Lillian’s Healthy Gourmet family of products, and registrations will issue once we submit, and the USPTO accepts, affidavits that we are using these marks in commerce:
| • | Application Serial Number 77614994 for the LILLIAN’S HEALTHY GOURMET mark; |
| • | Application Serial Number 77614989 for the LILLIAN’S ORGANIC GOURMET mark; and |
| • | Application Serial Number 77614981 for the LILLIAN’S KITCHEN GOURMET mark. |
Competition
In general, the aquaculture industry is intensely competitive and highly fragmented. The PRC aquaculture industry is further open to competition from local and overseas operators engaged in aquaculture and from other captured fish producers. We compete with various companies, many of which are developing or can be expected to develop products similar to ours. For example, 8th Sea—The Organic Seafood Company currently produces and processes tilapia fillets in Brazil’s Parana state. Our main aquaculture products (tilapia and shrimp) are also facing competition from some other domestic aquaculture producers. Some of the domestic aquaculture processing companies in Hainan Province have obtained certifications similar to those we possess. However, we believe that the competition from such producers is minimal because, to the best of our knowledge, there are no competitors in Hainan Province that have a similar operating scale and production capacity, or that have developed the vertically integrated business model under which we operate.
Many of our competitors are more established than we are, and have significantly greater financial, technical, marketing and other resources than we presently possess. Some of our competitors have greater name recognition and a larger customer base. These competitors may be able to respond more quickly to new or changing opportunities and customer requirements, and may be able to undertake more extensive promotional activities, offer more attractive terms to customers, and adopt more aggressive pricing policies. We intend to create greater brand awareness for our brand name(s) so that we can successfully compete with our competitors. We cannot assure you that we will be able to compete effectively or successfully with current or future competitors, or that the competitive pressures we face will not harm our business.
With respect to potential new competitors, although there are no formal barriers to entry for engaging in similar aquaculture processing production and activities in the PRC, we believe that the high infrastructure costs associated with developing and constructing processing plants and facilities does pose a barrier to potential competitors. Fish farms are tied directly to a processing plant and a new processing plant must either enlist new farms or build its own. Furthermore, measures addressing environmental considerations, such as water quality and waste water processing requirements, are costly to deploy on a greenfield site and are not readily available to all new companies. Accordingly, potential competitors have to mobilize extensive resources in order to maintain a presence similar to ours.
Government Regulation
Our company complies with various national, provincial and local environmental protection laws and regulations, as well as certifications and inspections relating to the quality control of our production and the environmental and social impact of our operations. In addition to statutory and regulatory compliance, we actively ensure the environmental sustainability of our operations. Also, all of our healthcare products have met stringent independent testing by selected university laboratories in China. Our costs of compliance with applicable environmental laws are minimal. Penalties would be levied upon us if we fail to adhere to and maintain our compliance with the applicable environmental regulations in the PRC. Such failure has not occurred in the past, and we generally do not anticipate that it may occur in the future, although no assurance can be given in this regard.
12
Table of Contents
HACCP Standards
Our facilities are certified in accordance with the Hazard Analysis Critical Control Points, or HACCP, standards for exporting aquatic products to the United States. The HACCP standards are developed by the FDA pursuant to the FDA’s HACCP regulation, Title 21, Code of Federal Regulations, part 123, and are used by the FDA to help ensure food safety and control sanitary standards.
These standards focus on monitoring the quality of production and sanitation measures in processing plants for food products, and also take into account the environmental and social impact of the operations of the certified company. Compliance with the HACCP procedures is mandatory, and the successful implementation of these procedures depends on the design and performance of facilities and equipment, and excellent quality control and hygiene practices. HACCP conducts sample laboratory testing on our processed aquatic products to ensure no forbidden substances are present in them. Laboratory testing of our processed aquatic products was initiated by the HACCP in compliance with strict quarantine guidelines imposed by domestic export control government agencies and foreign import control government agencies.
In addition, our facilities continuously pass USDA inspection.
ACC Standards
We have completed the process of certification of our processing plant in China in relation to shrimp and Tilapia processing in accordance with the Aquaculture Certification Counsel, Inc., or the ACC standards. The ACC standards are considered “super HACCP” standards, as they also take into account various environmental and social issues. ACC certification is required by many large retailers in the United States.
The ACC is a U.S.-based, non-governmental body established to certify social, environmental and food safety standards at aquaculture facilities throughout the world. The ACC uses a certification system that combines site inspections and effluent sampling with sanitary controls, therapeutic controls and traceability. Part of the ACC’s mission is to help educate the aquaculture public regarding the benefits of applying best aquaculture practices and the advancing scientific technology that directs them. The ACC believes that, by implementing such standards, seafood producers can better meet the demands of the growing global market for safe, wholesome seafood produced in an environmentally and socially responsible manner. The ACC offers a primarily “process,” rather than “product”, certification, with an orientation toward seafood buyers. Successful participation in the ACC program is visually represented by limited use of a “Best Aquaculture Practices” certification mark. The ACC currently certifies only shrimp hatcheries, farms and processing plants.
Assignment of EU Code
Our facilities have been assigned a European Union (EU), approval registration, referred to as an EU Code, required for exporting aquatic products to the EU. This requirement applies to production both inside and outside of the EU, and defines the applicable standards of the EEC for handling, processing, storing and transporting fish. Our aquatic products processing plant in China must meet or exceed these standards every year, in order to maintain the assigned EU Code. The assignment of the EU Code to us, and our ability to maintain it on an annual basis, evidence the fact that our products meet the EU importable food standards set by the relevant inspection agencies.
ISO Certification
The Company received ISO 9001 and 22000 certifications for both the seafood and feed mill plants in the fourth quarter of 2009.
| • | ISO 9001 is the internationally recognized standard for the quality management of businesses. It applies to the processes that create and control the products and services an organization supplies. It prescribes systematic control of activities to ensure that the needs and expectations of customers are met. It is designed and intended to apply to virtually any product or service, made by any process anywhere in the world. |
| • | ISO 22000 specifies requirements for a food safety management system where an organization in the food chain needs to demonstrate its ability to control food safety hazards in order to ensure that food is safe at the time of human consumption. It is applicable to all organizations, regardless of size, which are involved in any aspect of the food chain and want to implement systems that consistently provide safe products. |
Product Liability Insurance
We have purchased general commercial liability insurance, which provides adequate aggregate product liability insurance based on industry standards. However, there is a possibility that our customers, or the ultimate buyers of our products, may have adverse reactions to the tilapia and other aquatic products or marine bio and healthcare products that we process and sell. Any such adverse reaction may result in actual or potential product liability claims against us, which may not be covered by our insurance or, if covered, may be significantly higher than the insurance amount. Such actual or potential product liability claims may have an adverse effect on our reputation and profitability.
13
Table of Contents
Government Regulation in China
Aquaculture producers in the PRC have to comply with the environmental protection laws and regulations promulgated by the national and local governments of the PRC. Such rules and regulations include, among others, Environmental Protection Law of the PRC, Ocean Environmental Protection Law of the PRC, Regulations on Administration over Dumping of Wastes in the Ocean of the PRC, Ocean Aquatic Industry Administration Regulation, Fishing License Administration Regulation, Regulations on Administration of Hygiene Registration of Exported Food Manufacturers, and Regulations on Administration of Quality Control of Food Processors.
In addition, HACCP and sanitary programs in China in accordance with the FDA’s HACCP standards are verified by the China Inspection and Quarantine Office, or CIQ, which is a branch of the State Administration for Entry-Exit Inspection and Quarantine of the PRC and, in our case, also by the Hainan Entry-Exit Inspection and Quarantine Bureau of the PRC. In addition, the CIQ evaluates the compliance by our processing plant with the EU standards described above under “—Assignment of EU Code.” As a result of such review, our aquatic products processing plant in China has received a CIQ certificate. The CIQ certificate must be renewed on an annual basis.
Our Work with the Hainan Province
We have enjoyed close collaboration with the local government as we conduct our operations in the Hainan Province. We have continued to expand our operations in that area and to foster close ties with the local government through the construction of our large-scale organic feed mill, which was completed in late 2009. See “Business—Manufacturing and Production—Construction of Feed Mill.” The success of our operations in the PRC depends in part on the continued investment by Hainan Province in the development of the local aquaculture industry. While there can be no assurances that such investment will continue, we believe that it should continue for the following reasons. The central government of China has limited Hainan Province to two areas of economic activity, agri-food and tourism. The resulting focus of the Hainan Province on the agri-food and tourism sectors creates a strong potential synergy with private sector companies intent on further development of these sectors. Part of the attraction for investors is the low tax rate in Hainan. In addition, foreign companies setting up new ventures in Hainan do not pay any tax for the two first years of profitable operations, then pays 7.5% for the following three years and 15% thereafter. For this reason, we plan to continue to structure and conduct our operations in China through the use of separate subsidiaries, held by foreign holding companies which are separate and distinct from holding companies already incorporated. In turn, these holding companies are held by HQS. Under these arrangements, we are not considered involved in joint ventures, but rather in wholly owned foreign enterprises, under the local law. Government support for such ventures meeting local needs is positive, and we believe our operations have already demonstrated our ability to channel this support in the manner favorable to our business and Hainan. We believe that not having a joint venture with the local government is the best way to minimize the potential for government interference and to maximize government support, and we plan to continue to conduct our business in China accordingly.
Furthermore, on March 17, 2007, a new PRC Enterprise Income Tax Law (EIT) was promulgated and introduced a new uniform tax regime in the PRC. The EIT became effective on January 1, 2008. That new Law provides, amongst other issues, that income derived from preliminary processing of fishery products and processing of agricultural products will be exempt from the EIT tax rate. Starting in 2008, our existing fish processing unit and our feed mill plant which is under construction will both benefit from a “0” percent tax rate. With regards to our nutraceutical unit, the income tax rate, under the new law, will increase by approximately 2% yearly until it reaches a maximum of 25% in 2012.
Employees
Through our subsidiaries, we currently employ approximately 620 employees, all of whom are full-time employees. They are located predominantly in the PRC. Of our key employees, Harry Wang Hua, He Jian Bo and Wang Fu Hai are located in China and are fully dedicated to our China operations. In addition, Lillian Wang Li, Norbert Sporns, and William Sujian contribute to both our China operations and our U.S. operations, depending on the needs of our business over time.
In addition, during the high season, we hire up to 100 part-time employees. We typically pay our local employees much higher wages than the required minimum wages, in order to attract and retain key employees. We have employment agreements with many of our full-time employees. None of our employees are covered by a collective bargaining agreement, and we believe our employee relations are good.
Properties
We own three processing plants located in Wenchang, Hainan Province, the PRC, and the related manufacturing equipment, office equipment and motor vehicles. We use one plant to process the seafood products we produce, another plant to process our marine bio and healthcare products and, from the last quarter of 2009, a third plant to process of fish feed products.
14
Table of Contents
In addition, we currently lease corporate premises for our United States headquarters located in Seattle, Washington, consisting of approximately 4,170 square feet, from Doncaster Investments NV, Inc. The term of the related lease is sixty months, which term commenced on December 1, 2005 and will end in December 1, 2010. Our base rental payment under the lease is $6,950 per month for 2009 and 2010. In 2010, we will be moving our headquarters to California. We plan on using our new headquarters as, among other things, the center of our United States direct sales effort. In connection with this move, we have leased approximately 5,400 square feet of office space with a base monthly rental of approximately $11,000.
Our properties are in good condition and are sufficient to meet our needs at this time. We do not plan to obtain additional space in the foreseeable future for the above cited plants but we intend to build or acquire additional processing facilities in the near future.
Legal Proceedings
We are currently not involved in any litigation that we believe could have a materially adverse effect on our financial condition or results of operations. There is no action, suit, proceeding, inquiry or investigation before or by any court, public board, government agency, self-regulatory organization or body pending or, to the knowledge of the executive officers of our company or any of our subsidiaries, threatened against or affecting our company, our common stock, any of our subsidiaries or of our company’s or our company’s subsidiaries’ officers or directors in their capacities as such, in which an adverse decision could have a material adverse effect.
Additional Information
HQ Sustainable Maritime Industries, Inc. is incorporated in Delaware. Our principal executive offices are located at 1511 Third Avenue, Suite 788, Seattle, Washington, and the telephone number at that address is (206) 621–9888. Our Internet address is www.hqfish.com. We make available free of charge on our Internet website our annual reports on Form 10-K, quarterly reports on Form 10-Q, current reports on Form 8-K, proxy statements and amendments to those reports as soon as reasonably practicable after we electronically file such material with, or furnish it to, the SEC.
Certain corporate governance materials, including our committee charters and our Code of Ethics, are posted on our website under the heading “Corporate Governance.” From time to time, the corporate governance materials on our website may be updated as necessary to comply with rules issued by the SEC or NYSE Amex, or as desirable to further the continued effective and efficient governance of our company.
| ITEM 1A. | RISK FACTORS |
An investment in our securities involves a high degree of risk. You should carefully consider the following information about these risks, together with the other information contained in this Annual Report on Form 10-K, before investing in our securities. If any of the events anticipated by the risks described below occur, our results of operations and financial condition could be adversely affected which could result in a decline in the value of our securities, causing you to lose all or part of your investment.
Risks Relating To Our Business
We rely on cooperative suppliers and any adverse changes in these relationships may adversely affect us.
We have developed a network of aquaculture farmers in Hainan Province for the supply of tilapia and shrimp by entering into cooperative supply agreements. Pursuant to the cooperative supply agreements, we are assured the necessary supply of aquatic products that meet our quality standards. Smooth continual operation of this cooperative network is essential in controlling our costs, meeting quality standards and the timely fulfillment of our customer orders. Any adverse change to our cooperative network, including any early termination or non-renewal of any supply agreement or any failure of suppliers to fulfill their obligations under the supply agreements, could have a material adverse effect on our business model, operations and competitiveness.
We may require additional capital in the future, which may not be available on favorable terms or at all.
Our future capital requirements will depend on many factors, including industry and market conditions, our ability to successfully implement our branding and marketing initiatives and expansion of our production capabilities. We anticipate that we may need to raise additional funds in order to grow our business and implement our business strategy. We anticipate that any such additional funds would be raised through equity or debt financings. In addition, we may enter into a revolving credit facility or a term loan facility with one or more syndicates of lenders. Any equity or debt financing, if available at all, may be on terms that are not favorable to us. Even if we are able to raise capital through equity or debt financings, as to which there can be no assurance, the interest of existing stockholders in our company will be diluted, and the securities we issue may have rights, preferences and privileges that are senior to those of our common stock or may otherwise materially and adversely affect the holdings or rights of our existing stockholders. If we cannot obtain adequate capital, we may not be able to fully implement our business strategy, and our business, results of operations and financial condition would be adversely affected. See also Management’s Discussion and Analysis of Financial Condition and Results of Operation – Liquidity and Capital resources. In addition, we have and will continue to raise additional capital through private placements or registered offerings, in which broker-dealers will be engaged. The activities of such broker-dealers are highly regulated and we cannot assure that the activities of such broker-dealers will not violate relevant regulations and generate liabilities despite our expectation otherwise.
15
Table of Contents
We depend on the availability of additional human resources for future growth.
We have recently experienced a period of significant growth in our sales volume. We believe that continued expansion is essential for us to remain competitive and to capitalize on the growth potential of our business. Such expansion may place a significant strain on our management and operations and financial resources. As our operations continue to grow, we will have to continually improve our management, operational and financial systems, procedures and controls, and other resources infrastructure, and expand our workforce. There can be no assurance that our existing or future management, operating and financial systems, procedures and controls will be adequate to support our operations, or that we will be able to recruit, retain and motivate our personnel. Further, there can be no assurance that we will be able to establish, develop or maintain the business relationships beneficial to our operations, or to do so or to implement any of the above activities in a timely manner. Failure to manage our growth effectively could have a material adverse effect on our business and the results of our operations and financial condition.
We depend on our key management personnel, and the loss of any of their services could materially adversely affect us.
Our operations are dependent upon the experience and expertise of a small number of key management personnel, which includes Lillian Wang Li, our Chairman of the Board, Norbert Sporns, our Chief Executive Officer and President, and Harry Wang Hua, our Chief Operating Officer. Lillian Wang Li and Harry Wang Hua are brother and sister, and Ms. Wang Li is married to Norbert Sporns. Although we have obtained life insurance on Ms. Wang Li and have begun the process of obtaining life insurance on Mr. Sporns, the loss of the services of any of these key personnel for any reason would likely have a material adverse effect on our business, and the results of our operations and financial condition, or could delay or prevent us from fully implementing our business strategy.
A few of our customers account for a significant portion of our business.
We have derived, and over the near term we expect to continue to derive, a significant portion of our sales from a limited number of customers. For example, our five largest customers accounted for a total of 40.6% of our consolidated sales for the year ended December 31, 2009, and they are all related to the aquaculture product segment. At December 31, 2009, approximately 38.4% of our trade receivables were from transactions with these five largest customers. The loss of any of these customers or non-payment of outstanding amounts due to the company from these customers could materially and adversely affect our results of operations, financial position and liquidity.
We may be unable to continue to take advantage of the seasonal pricing fluctuation in sales of our products, and we may be adversely affected by the seasonal fluctuation in the prices we earn for our products.
We have experienced seasonal fluctuation in the prices we earn for our products, generally in the range of 15 to 20%. Pricing fluctuation occurs during the winter season when fish farms in the northern part of the PRC suspend production due to cold weather conditions. These weather related disruptions in supply permit us to increase the sales prices of our tilapia products. However, there can be no assurance that such premium pricing, benefiting our profitability, can be maintained in the future. Other factors, such as an increase in the cost of feed, might also adversely impact on the cost of fish and lessen our margins and profitability.
Any adverse changes in the supply of our tilapia and other raw materials, including contamination or disease or increased costs of raw materials, may adversely affect our operations or reduce our margins or profits.
We are dependent on the availability of raw materials from Hainan Province and the oceans in that region. The supply of these raw materials can be adversely affected by any material change in the climatic or environmental conditions in and around Hainan Province. In addition, if there is contamination resulting from disease, pollution or other foreign substances, our supply of raw materials could be jeopardized or disrupted. The shortage or lack of raw materials and any consequential change in their cost would, in turn, have a material adverse effect on the cost on our operations and margins and our ability to provide products to our customers.
Any actual contamination of our products resulting from processing, packaging or transit of our products, or negative press from contamination experienced by other companies in our industry may adversely affect our operations or reduce our margins or profits.
We actively seek to control the quality of our products and avoid risk of contamination in our processing, packaging and distribution of such products; however no quality control program is guaranteed to be completely effective. We are dependent on others for the reliable safe transportation of our products to the market place and the quality of our final product as experienced by the consumer may be impacted by disruptions in the transit process beyond our control. In addition, if our competitors experience problems with contamination of their products, even if we do not concurrently suffer similar adverse events, publicity of such problems could negatively impact our reputation. Actual contamination or reports of industry problems with contamination or poor quality may have a material adverse effect on our operations, including an increase in product liability claims, higher quality control and transport costs, reduced margins and decreased consumer interest in our products.
16
Table of Contents
We may be adversely affected by the fluctuation in raw material prices and selling prices of our products.
Neither our products nor the raw materials we use have experienced any significant price fluctuations since we began operation, but there is no assurance that they will not be subject to future price fluctuations or pricing control. The products and raw materials we use may experience price volatility caused by events such as market fluctuations or changes in governmental programs. The market price of these raw materials may also experience significant upward adjustment, if, for instance, there is a material under-supply or over-demand in the market. These price changes may ultimately result in increases in the selling prices of our products, and may, in turn, adversely affect our sales volume, revenue and operating profit.
We could be adversely affected by the occurrence of natural disasters in Hainan Province.
From time to time, Hainan Province experiences typhoons, particularly from June through September of any given year. Natural disasters could impede operations, damage infrastructure necessary to our operations or adversely affect the logistical services to and from Hainan Province. Even though we currently have insurance against damages caused by natural disasters, including typhoons, accidents or similar events, the occurrence of natural disasters in Hainan Province could adversely affect our business, the results of our operations, prospects and financial condition, through business disruptions and/or any losses in excess of our policy limits.
Intense competition from existing and new entities may adversely affect our revenues and profitability.
In general, the aquaculture industry is intensely competitive and highly fragmented. We compete with various companies, many of which are developing or can be expected to develop products similar to ours. For example, 8th Sea–The Organic Seafood Company currently produces and processes tilapia fillets in Brazil’s Parana state. Many of our competitors are more established than we are and have significantly greater financial, technical, marketing and other resources than we presently possess. Some of our competitors have greater name recognition and a larger customer base. These competitors may be able to respond more quickly to new or changing opportunities and customer requirements and may be able to undertake more extensive promotional activities, offer more attractive terms to customers, and adopt more aggressive pricing policies. We intend to create greater awareness for our brand name in an attempt to successfully compete with our competitors. We cannot assure you that we will be able to compete effectively or successfully with current or future competitors or that the competitive pressures we face will not harm our business.
Our operating subsidiaries must comply with environmental protection laws that could adversely affect our profitability.
We are required to comply with the environmental protection laws and regulations promulgated by the national and local governments of the PRC. Some of these regulations govern the level of fees payable to government entities providing environmental protection services and the prescribed standards relating to the discharge of effluent, or liquid waste. Yearly inspections of waste treatment systems require the payment of a license fee which could become a penalty fee if standards are not maintained. Currently, our plant treats all of its effluent completely to level one, which is consistent with releasing potable water back to the environment, and there is currently no charge being levied. Although our production technologies allow us to efficiently control the level of pollution resulting from our production process, and notwithstanding the fact that we have received evidence of compliance with environmental protection requirements from government authorities, due to the nature of our business, effluent wastes are unavoidably generated in the aquaculture production processes. If we fail to comply with any of these environmental laws and regulations in the PRC, depending on the types and seriousness of the violation, we may be subject to, among other things, warning from relevant authorities, imposition of fines, specific performance and/or criminal liability, forfeiture of profits made, being ordered to close down our business operations and suspension of relevant permits.
Our operations, revenue and profitability could be adversely affected by changes in laws and regulations in the countries where we do business.
The governments of countries into which we sell our products, including the United States, Canada and the European Union, from time to time, consider regulatory proposals relating to raw materials, food safety and markets, and environmental regulations, which, if adopted, could lead to disruptions in distribution of our products and increase our operational costs, which, in turn, could affect our profitability. To the extent that we increase our product prices as a result of such changes, our sales volume and revenues may be adversely affected.
Furthermore, these governments may change import regulations or impose additional taxes or duties on certain Chinese imports from time to time. For example, in 2004, the United States government imposed heavy tariffs of more than 100% on certain Chinese shrimp exporters. Similar regulations and fees or new regulatory developments may have a material adverse impact on our operations, revenue and profitability. If one or more of the countries into which we sell our products bars the import or sale of fish or related products from China, our available market would shrink significantly, adversely impacting our results of operations and growth potential.
17
Table of Contents
Our business could be adversely affected by the recent negative public reports on seafood imported from China.
In June 2007, the U.S. Food and Drug Administration issued an alert report on the sale of five types of farm-raised seafood from China in the United States because of unapproved chemical residues. The five types of farm-raised seafood are shrimp, catfish, eel, basa and dace. As a result, in order for the seafood to be sold in the United States, importers must provide independent testing that shows the seafood does not contain the unapproved residues. Although tilapia is not included in the list and we believe our main seafood product, which is tilapia, does not contain any of the unapproved residues, it is possible that our business may be adversely impacted as a result of the recent negative public reports on seafood imported from China.
There could be changes in the policies of the PRC government that may adversely affect our business.
The aquaculture industry in the PRC is subject to policies implemented by the PRC government. The PRC government may, for instance, impose control over aspects of our business such as distribution of raw materials, product pricing and sales. If the raw materials used by us or our products become subject to any form of government control, then depending on the nature and extent of the control and our ability to make corresponding adjustments, there could be a material adverse effect on our business and operating results.
Separately, our business and operating results also could be adversely affected by changes in policies of the Chinese government such as: changes in laws, regulations or the interpretation thereof; confiscatory taxation; restrictions on currency conversion, imports on sources of supplies; or the expropriation or nationalization of private enterprises. Although the Chinese government has been pursuing economic reform policies for approximately two decades to liberalize the economy and introduce free market aspects, there is no assurance that the government will continue to pursue such policies or that such policies may not be significantly altered, especially in the event of a change in leadership, social or political disruption, or other circumstances affecting China’s political, economic and social life.
Certain political and economic considerations relating to PRC could adversely affect our company.
The PRC is passing from a planned economy to a market economy. The Chinese government has confirmed that economic development will follow a model of market economy under socialism. While the PRC government has pursued economic reforms since its adoption of the open-door policy in 1978, a large portion of the PRC economy is still operating under five-year plans and annual state plans adopted by the government that set down national economic development goals. Through these plans and other economic measures, such as control on foreign exchange, taxation and restrictions on foreign participation in the domestic market of various industries, the PRC government exerts considerable direct and indirect influence on the economy. Many of the economic reforms are unprecedented or experimental for the PRC government, and are expected to be refined and improved. Other political, economic and social factors can also lead to further readjustment of such reforms. This refining and readjustment process may not necessarily have a positive effect on our operations or future business development. Our operating results may be adversely affected by changes in the PRC’s economic and social conditions as well as by changes in the policies of the PRC government, which we may not be able to foresee, such as changes in laws and regulations (or the official interpretation thereof), measures which may be introduced to control inflation, changes in the rate or method of taxation, and imposition of additional restrictions on currency conversion.
The recent nature and uncertain application of many PRC laws applicable to us create an uncertain environment for business operations and they could have a negative effect on us.
The PRC legal system is a civil law system. Unlike the common law system, such as the legal system used in the United States, the civil law system is based on written statutes in which decided legal cases have little value as precedents. In 1979, the PRC began to promulgate a comprehensive system of laws and has since introduced many laws and regulations to provide general guidance on economic and business practices in the PRC and to regulate foreign investment. Progress has been made in the promulgation of laws and regulations dealing with economic matters such as corporate organization and governance, foreign investment, commerce, taxation and trade. The promulgation of new laws, changes of existing laws and the abrogation of local regulations by national laws could have a negative impact on our business and business prospects. In addition, as these laws, regulations and legal requirements are relatively recent, their interpretation and enforcement involve significant uncertainty.
If relations between the United States and China worsen, we may be unable to serve a portion of our customer base, the value of our securities could decline and we may have difficulty accessing the U.S. capital markets.
At various times during recent years, the United States and China have had disagreements over political and economic issues. Controversies may arise in the future between these two countries. Any political or trade controversies between the United States and China could adversely affect our ability to continue to sell to U.S. customers, the value of our securities and our ability to access U.S. capital markets.
18
Table of Contents
Governmental control of currency conversion may affect the value of your investment.
The PRC government imposes controls on the convertibility of Renminbi into foreign currencies and, in certain cases, the remittance of currency out of the PRC. Currently, the Renminbi is not a freely convertible currency. Shortages in the availability of foreign currency may restrict our ability to remit sufficient foreign currency to pay dividends, or otherwise satisfy foreign currency denominated obligations. Under existing PRC foreign exchange regulations, payments of current account items, including profit distributions, interest payments and expenditures from the transaction, can be made in foreign currencies without prior approval from the PRC State Administration of Foreign Exchange by complying with certain procedural requirements. However, approval from appropriate governmental authorities is required where Renminbi is to be converted into foreign currency and remitted out of China to pay capital expenses such as the repayment of loans and corporate debt obligations denominated in foreign currencies.
The PRC government may also at its discretion restrict access in the future to foreign currencies for current account transactions. If the foreign exchange control system prevents us from obtaining sufficient foreign currency to satisfy our currency demands, we may not be able to pay certain of our expenses as they come due.
The fluctuation of the Renminbi may materially and adversely affect your investment.
The value of the Renminbi against the U.S. dollar and other currencies may fluctuate and is affected by, among other things, changes in the PRC’s political and economic conditions. Any significant revaluation of the Renminbi may materially and adversely affect our cash flows, revenues and financial condition. For example, to the extent that we need to convert U.S. dollars into Renminbi for our operations, appreciation of the Renminbi against the U.S. dollar could have a material adverse effect on our business, financial condition and results of operations.
Conversely, if we decide to convert our Renminbi into U.S. dollars for the purpose of making dividend payments on our common or preferred stock or for other business purposes and the U.S. dollar appreciates against the Renminbi, the U.S. dollar equivalent of the Renminbi we convert would be reduced. Any significant devaluation of Renminbi may reduce our operation costs in U.S. dollars but may also reduce our earnings in U.S. dollars. In addition, the depreciation of significant U.S. dollar denominated assets could result in a charge to our income statement and a reduction in the value of these assets.
Commencing from July 21, 2005, China has adopted a managed floating exchange rate regime based on market demand and supply with reference to a basket of currencies. The exchange rate of the US dollar against the RMB was adjusted from approximately RMB 8.28 per US dollar to approximately RMB 8.11 per US dollar on July 21, 2005. Since then, The People’s Bank of China administers and regulates the exchange rate of US dollar against RMB taking into account demand and supply of RMB, as well as domestic and foreign economic and financial conditions.
In addition, there can be no assurance that we will be able to obtain sufficient foreign exchange to pay dividends or satisfy other foreign exchange requirements in the future. We currently do not intend to pay dividends.
It may be difficult to effect service of process and enforcement of legal judgments upon our company and our officers and directors because some of them reside outside the United States.
As our operations are presently based in China and some of our key directors and officers reside outside the United States, service of process on our key directors and officers may be difficult to effect within the United States. Also, substantially all of our assets are located outside the United States and any judgment obtained in the United States against us may not be enforceable outside the United States. We have appointed Norbert Sporns, our Chief Executive Officer and President, as our agent to receive service of process in any action against our company in the United States.
Risks Relating to our Common Stock
There are a large number of shares underlying our Series A preferred stock and warrants that may be available for future sale and the sale of these shares may depress the market price of our common stock.
As of December 31, 2009, we had 14,681,002 shares of common stock issued and outstanding. We currently have outstanding Class B warrants to purchase up to 114,583 shares of our common stock and stock purchase warrants to purchase up to 30,000 shares of our common stock issued in connection with the November 2006 financing. In addition, we currently have 100,000 shares of Series A preferred stock issued and outstanding, and the holders of our Series A preferred stock have an option right to convert each share of Series A Preferred Stock into 0.1 shares of our common stock. These shares, including all of the shares issuable upon conversion of our Series A preferred stock and upon exercise of our warrants, may be sold into the market place currently. The sale of these shares may adversely affect the market price of our common stock.
19
Table of Contents
Our principal stockholders, current executive officers and directors own a significant percentage of our company and will be able to exercise significant influence over our company.
Our executive officers and directors and principal stockholders together beneficially own approximately 90.08% of the total voting power of our outstanding voting capital stock, primarily as a result of their ownership of Series A preferred stock of our company which, while convertible into shares of our common stock on a 0.1-for-1 basis, carries 1,000 votes per Series A preferred share rather than the 1 vote per share of our common stock. The Series A preferred stock and the common stock vote together as one class on all matters to be voted upon by the stockholders. In particular, our three largest stockholders, Mr. Sporns, Ms. Wang Li and Mr. Wang Hua, are family members who share approximately 90.05% of the total voting power of our company. Ms. Wang Li is the wife of Mr. Sporns and Mr. Wang Hua is the brother of Ms. Wang Li. These stockholders will be able to determine the composition of our board of directors, will retain the voting power to approve all matters requiring stockholder approval and will continue to have significant influence over our affairs. This concentration of ownership could have the effect of delaying or preventing a change in our control or otherwise discouraging a potential acquirer from attempting to obtain control of us, which in turn could have a material and adverse effect on the market price of the common stock or prevent our stockholders from realizing a premium over the market prices for their shares of common stock.
Investors may experience dilution from any exercise of warrants.
We currently have outstanding Class B warrants to purchase up to 114,583 shares of our common stock and stock purchase warrants to purchase up to 30,000 shares of our common stock. The Class B warrants expire on January 25, 2011 and the stock purchase warrants expire on December 28, 2011.
| ITEM 1B. | UNRESOLVED STAFF COMMENTS |
None.
| ITEM 2. | PROPERTIES |
We own three processing plants located in Wenchang, Hainan Province, the PRC, and the related manufacturing equipment, office equipment and motor vehicles. We use one plant to process the seafood products we produce, a second plant to process our marine bio and healthcare products and beginning in the last quarter of 2009, a third plant to process our fish feed products.
In addition, we currently lease corporate premises for our United States headquarters located in Seattle, Washington, consisting of approximately 4,170 square feet from Doncaster Investments NV, Inc. The term of the lease is sixty months, which term commenced on December 1, 2005, to end December 1, 2010. Our base rental payment under the lease is $6,950 per month for 2009 and 2010. In 2010, we will be moving our headquarters to California. We plan on using our new headquarters as, among other things, the center of our United States direct sales effort. In connection with this move, we have leased approximately 5,400 square feet of office space with a base monthly rental of approximately $11,000.
Our properties are in good condition and are sufficient to meet our needs at this time. We do not plan to obtain additional space in the foreseeable future for the above-cited plants but we intend to build additional processing facilities in the near future.
| ITEM 3. | LEGAL PROCEEDINGS |
We are currently not involved in any litigation that we believe could have a materially adverse effect on our financial condition or results of operations. There is no action, suit, proceeding, inquiry or investigation before or by any court, public board, government agency, self-regulatory organization or body pending or, to the knowledge of the executive officers of our company or any of our subsidiaries, threatened against or affecting our company, our common stock, any of our subsidiaries or of our company’s or our company’s subsidiaries’ officers or directors in their capacities as such, in which an adverse decision could have a material adverse effect.
20
Table of Contents
| ITEM 4. | SUBMISSION OF MATTERS TO A VOTE OF SECURITY HOLDERS |
We held our annual shareholders meeting on December 21, 2009. Proxies for the meeting were solicited pursuant to Section 14(a) of the Securities Exchange Act of 1934, and there was no solicitation in opposition to the board’s solicitation. The matters that were submitted to a vote and the results thereof are set forth below.
| (1) | Proposal to elect seven directors to hold office for a term of one year and until their respective successors are duly elected and qualified. |
| Nominee |
For | Withheld | ||
| Norbert Sporns |
109,014,885 | 3,668,563 | ||
| Lillian Wang |
107,510,582 | 5,172,866 | ||
| Harry Wang Hua |
108,793,394 | 3,890,054 | ||
| Fred Bild |
109,940,732 | 2,742,716 | ||
| Daniel Too |
109,937,590 | 2,745,858 | ||
| Joseph I. Emas |
108,628,084 | 4,055,364 | ||
| Andrew Intrater |
112,123,966 | 559,482 |
| (2) | Proposal to ratify and approve the appointment of Schwartz Levitsky Feldman LLP as the Company’s independent certified public accountants |
| For |
Against |
Abstained | ||
| 112,615,910 | 32,512 | 32,025 |
| (3) | Proposal to approve the 2009 Stock Option Plan |
| For |
Against |
Abstained | ||
| 103,907,884 | 4,998,937 | 623,198 |
21
Table of Contents
PART II
| ITEM 5. | MARKET FOR REGISTRANT’S COMMON EQUITY, RELATED STOCKHOLDER MATTERS AND ISSUER PURCHASES OF EQUITY SECURITIES |
Shares of our common stock commenced trading on May 17, 2007, on the American Stock Exchange (now known as the NYSE Amex Stock Exchange) under the symbol “HQS.” For the periods indicated, the following table sets forth the high and low bid prices per share of common stock.
| 2009 | 2008 | |||||||||||
| High | Low | High | Low | |||||||||
| First Quarter |
$ | 8.50 | $ | 5.40 | $ | 14.20 | $ | 9.04 | ||||
| Second Quarter |
10.31 | 7.48 | 15.40 | 9.51 | ||||||||
| Third Quarter |
9.48 | 7.86 | 16.45 | 3.85 | ||||||||
| Fourth Quarter |
9.08 | 6.28 | 8.24 | 3.29 | ||||||||
On March 10, 2010, the closing bid price of our common stock was $7.91.
Holders of Record
As of December 31, 2009, we had approximately 1,000 holders of record of our common stock. The number of record holders was determined from the records of our transfer agent and does not include beneficial owners of common stock whose shares are held in the names of various security brokers, dealers, and registered clearing agencies.
Recent sales of unregistered securities
On January 7, 2009, we issued 32,500 shares of our Common Stock to two investors, namely the Tail Wind Fund Ltd and Solomon Strategic Holdings, Inc in relation to the payment of interests on the notes issued to those two investors in November 2006. Those shares were issued pursuant to the exemption provided by Section 4(2) under the Securities Act of 1933, for a transaction not involving a public offering.
On January 7, 2009, we issued 5,256 shares of our Common Stock to our four independent non-executive directors, Andrew Intrater, Fred Bild, Daniel Too and Joseph I. Emas, to satisfy our obligations to pay each such director an annual bonus in shares of our common stock pursuant to our independent non-executive director agreements with them. All of those shares were issued pursuant to the exemption provided by Section 4(2) under the Securities Act for a transaction not involving a public offering.
On January 20, 2009, we issued 16,004 shares of our Common Stock to Lucky Ventures Resources Limited in consideration of financial consulting services rendered to us by that company. All of those shares were issued pursuant to the exemption provided by Section 4(2) under the Securities Act for a transaction not involving a public offering.
From January 27 through January 29, 2009, we issued a total of 7,050 shares of our Common Stock to seven investors in our Company in respect of the January 2006 financing. Those shares were issued pursuant the cashless exercise of certain warrants issued to such investors had in connection with the January 2006 financing. All of these shares were issued pursuant to the exemption provided by Section 4(2) under the Securities Act for a transaction not involving a public offering.
From June 9 through June 15, 2009, we issued a total of 46,001 shares of our Common Stock to seven investors in our Company arising from the April 2004 financing. Those shares were issued pursuant a cashless exercise of certain Series C common stock purchase warrants and Series D common stock purchase warrants issued to such investors in connection with the April 2004 financing. All of these shares were issued pursuant to the exemption provided by Section 4(2) under the Securities Act for a transaction not involving a public offering.
From July 8 through September 15, 2009, we issued 83,168 shares of our Common Stock to two investors, namely the Tail Wind Fund Ltd and Solomon Strategic Holdings, Inc in relation to the payment of interests on the notes issued to those two investors in November 2006, and the partial conversion of the convertible notes outstanding during that period. Those shares were issued pursuant to the exemption provided by Section 4(2) under the Securities Act of 1933, for a transaction not involving a public offering.
22
Table of Contents
In October 2009, we issued 968,461 shares of our Common Stock to two investors, namely the Tail Wind Fund Ltd and Solomon Strategic Holdings, Inc in relation to the payment of interests on the notes issued to those two investors in November 2006, and the final conversion of the convertible notes outstanding during that period. Those shares were issued pursuant to the exemption provided by Section 4(2) under the Securities Act of 1933, for a transaction not involving a public offering.
In October, 2009, we issued 6,068 shares of our Common Stock to our four independent non-executive directors, Andrew Intrater, Fred Bild, Daniel Too and Joseph I. Emas, to satisfy our obligations to pay each such director an annual bonus in shares of our common stock pursuant to our independent non-executive director agreements with them. All of those shares were issued pursuant to the exemption provided by Section 4(2) under the Securities Act for a transaction not involving a public offering.
On December 03, 2009, we issued 21,898 shares of our Common Stock to Lucky Ventures Resources Limited in consideration of financial consulting services rendered to us by that company. All of those shares were issued pursuant to the exemption provided by Section 4(2) under the Securities Act for a transaction not involving a public offering.
Transfer agent
Our transfer agent is American Stock Transfer & Trust Company. Its address is 59 Maiden Lane, Plaza Level, New York, New York 10038.
Dividends
We may never pay any dividends to our shareholders. We did not declare any dividends for the years ended December 31, 2009 and 2008. Our Board of Directors does not intend to distribute dividends in the near future. The declaration, payment and amount of any future dividends will be made at the discretion of the Board of Directors, and will depend upon, among other things, the results of our operations, cash flows and financial condition, operating and capital requirements, and other factors as the Board of Directors considers relevant. There is no assurance that future dividends will be paid, and if dividends are paid, there is no assurance with respect to the amount of any such dividend.
Equity Compensation Plan Information
On December 2004, our Board of Directors ratified grants of non-qualified stock options to purchase shares of our common stock under our Stock Option Plan to some of our executive officers and directors, as well as to several of our employees. Each of these new stock options has up to a ten-year term, is subject to the terms and conditions of the Plan, and is priced at $5.60 which represents the fair market value as of the initial grant date of November 23, 2004.
Specifically, in 2004, Norbert Sporns, our Chief Executive Officer, President and director, received 25,000 stock options. Lillian Wang, the Chairman of our Board of Directors, received 25,000 stock options. Harry Wang, our Chief Operating Officer, director and brother of Ms. Wang, received 25,000 stock options; and Fusheng Wang, our director in 2004, Honorary Chairman and father of Ms. Wang, received 50,000 stock options. Together, Norbert Sporns, Harry Wang and Lillian Wang also indirectly control the majority of capital stock of HQS. The stock options granted to each of them, as well as to Fusheng Wang, were fully vested when granted. In addition, our Chief Financial Officer, Jean-Pierre Dallaire, received 10,000 stock options. Mr. Dallaire’s options were vested in 2004 immediately as to 50% of the grant, with the remaining 50% vesting as follows: 1/3 on June 16, 2005, 1/3 on June 16, 2006, and the remaining 1/3 on June 16, 2007.
Further, at the same date, our Board of Directors ratified grants of stock options to thirteen other employees of HQS. These stock options were vested immediately as to 50% of each individual grant, with the remaining 50% vesting as follows: 1/3 on June 16, 2005, 1/3 on June 16, 2006, and the remaining 1/3 on June 16, 2007. In the case of one of the employees, the stock options were fully vested when granted.
Our Board of Directors believes that these stock option grants will help our company to continue to attract, retain and motivate our employees, directors and executive officers. In connection with these grants, our Board of Directors reserved 250,000 shares for issuance under the Plan. In addition, pursuant to the provisions of the Plan, our Board of Directors delegated the full power and authority to administer the Plan, in accordance with its terms, to our Compensation Committee presently consisting of Fred Bild, an independent director, and Daniel Too, also an independent director of HQS.
The following table provides information about option awards under our Stock Option Plan as of December 31, 2009.
23
Table of Contents
| Plan Category |
Number of securities to be issued upon exercise of outstanding options |
Weighted- average exercise price of outstanding options |
Number of securities remaining available for future issuance under employee compensation plans (excluding securities reflected in first column) | ||||
| Equity compensation plans previously approved by security holders |
53,750 | $ | 5.60 | NIL | |||
| Equity compensation plans not approved by security holders |
|||||||
| Total |
53,750 | $ | 5.60 | NIL | |||
The Company did not repurchase any equity securities in 2009.
| ITEM 6. | SELECTED FINANCIAL DATA |
The following tables set forth, for the periods indicated, selected consolidated financial and other data. You should read the selected consolidated financial and other data below in conjunction with our consolidated financial statements and related notes and with Item 7, “Management’s Discussion and Analysis of Financial Condition and Results of Operations,” included within this Form 10-K. We have derived the following selected financial data from our audited consolidated financial statements for the years ended December 31, 2009, 2008, 2007, 2006 and 2005.
| Statement of operation data: |
2009 | 2008 | 2007 | 2006 | 2005 | ||||||||||
| Sales |
$ | 72,292,011 | $ | 67,723,283 | $ | 54,970,211 | $ | 39,095,403 | $ | 27,553,030 | |||||
| Cost of sales |
42,096,207 | 40,594,188 | 30,360,523 | 22,766,234 | 16,670,509 | ||||||||||
| Gross profit |
30,195,804 | 27,129,095 | 24,609,688 | 16,329,169 | 10,882,521 | ||||||||||
| Income from operations |
11,096,496 | 15,048,886 | 12,850,000 | 7,042,230 | 4,582,933 | ||||||||||
| Income before taxes |
10,312,992 | 12,954,028 | 7,035,374 | 1,841,932 | 3,895,092 | ||||||||||
| Net income attributable to shareholders |
8,100,131 | 10,040,688 | 4,486,562 | 873,964 | 3,254,098 | ||||||||||
| Balance Sheet data: |
|||||||||||||||
| Cash and cash equivalents |
36,957,303 | 54,920,548 | 46,959,908 | 11,389,375 | 5,140,159 | ||||||||||
| Working capital |
90,760,981 | 72,203,260 | 61,550,488 | 22,063,084 | 8,434,344 | ||||||||||
| Total assets |
119,805,825 | 100,186,273 | 84,326,866 | 41,852,480 | 24,416,680 | ||||||||||
| Total liabilities |
7,782,218 | 11,913,245 | 15,551,203 | 12,246,745 | 6,555,210 | ||||||||||
| Shareholders’ equity |
112,023,607 | 88,273,028 | 68,775,663 | 29,605,735 | 17,861,470 | ||||||||||
| ITEM 7. | MANAGEMENT’S DISCUSSION AND ANALYSIS OF FINANCIAL CONDITION AND RESULTS OF OPERATIONS |
This Management’s Discussion and Analysis of Financial Condition and Results of Operations includes forward-looking statements. We have based these forward-looking statements on our current plans, expectations and beliefs about future events. There are risks that our actual experience will differ materially from the expectations and beliefs reflected in the forward-looking statements in this section. See “Cautionary Notice Regarding Forward-Looking Statements.”
The following discussion and analysis should be read in conjunction with our consolidated financial statements and the related notes thereto and other financial information contained elsewhere in this Form 10-K.
General overview
We are a leader in all natural vertically integrated aquaculture and aquatic product processing and we have processing facilities located in Hainan, PRC. We have three processing plants in Hainan, one that processes aquatic products providing all natural tilapia and other aquatic products, another that processes marine bio and healthcare products and since December 2009, one that processes feed products. We market our products in Asia, America and Europe. We expanded our operations by completing the construction of our third facility in late 2009, which processes extruded feed, and increases our marketing efforts throughout North America and Europe. Our current sales activity is primarily directed to distributors within PRC, rather than within the U.S.
Recently, we announced that we had entered into a conditional agreement with the government of Tayang Town in the Province of Hainan, PRC in order to work with their cooperative farms, which can produce about 20,000 tonnes of live weight tilapia. We expect this agreement to result in doubling the farming capacity available to us. Currently, there is no financial commitment for the Company since the agreement with the government of Tayang Town is conditioned upon the Company’s investing in the construction of a new feed mill and processing plant in the immediate vicinity of the cooperative farms in Qionghai City and this has not happened yet.
24
Table of Contents
In addition, you should consider the following information as you read the below results of operations discussion and our financial statements and related notes included elsewhere in this Report. From the first quarter of 2004, following our reverse merger with Process Equipment, Inc., we have been operating under the name of HQS. At that time, we owned 84.4% of Hainan Quebec Ocean Fishing Co. Ltd. (“HQOF”), currently our principal operating subsidiary that processes our seafood products. In August 2004, we acquired the remaining ownership interest in HQOF. The fiscal year-end of Process Equipment Inc. was changed from April 30 to December 31 following the reverse merger. In August 2004, we acquired a 100% interest in our current subsidiary Jiahua Marine, which operates a marine bio and healthcare plant, including nutraceuticals, in Hainan Province, China. In the first half of 2005, our aquatic processing plant stopped production in order to add production lines and increase its production capacity to properly meet forecasted incremental demand, which affected some of our operating results during that period.
Our business operations consist of three segments, the marine bio and healthcare product segment, the aquaculture product segment and the feed products segment. Since the acquisition of Jiahua Marine, which represents the marine bio and healthcare product segment, those product sales have represented a significant contribution to the net income of the Company and currently are higher profit margin products than our aquaculture products. The Company expects the sales and contribution to net income to continue during the next year in similar proportions. However, as the marketing efforts increase in connection with the aquaculture product segment and the investment in the feed mill plant and equipment for new processing capacity of extruded feed is completed, the Company expects that the aquaculture product segment will begin to contribute a greater portion of income and a higher profit margin in the future.
Our principal executive office is located at 1511, Third Avenue, Suite 788, Seattle, Washington and our telephone number is (206) 621 9888. Our Internet address is http://www.hqfish.com.
Critical accounting policies and estimates
We prepare our consolidated financial statements in accordance with generally accepted accounting principles in the United States of America. The preparation of these financial statements requires the use of estimates and assumptions that affect the reported amounts of assets and liabilities and the disclosure of contingent assets and liabilities at the date of the financial statements and the reported amount of revenues and expenses during the reporting period. Our management periodically evaluates the estimates and judgments made. Management bases its estimates and judgments on historical experience and on various factors that are believed to be reasonable under the circumstances. Actual results may differ from these estimates as a result of different assumptions or conditions.
The following critical accounting policies affect the more significant judgments and estimates used in the preparation of the Company’s consolidated financial statements.
Inventories
Inventories are stated at the lower of cost and net realizable value. Cost is calculated on the weighted average basis and includes all costs to acquire and other costs incurred in bringing the inventories to their present location and condition. We evaluate the net realizable value of its inventories on a regular basis and record a provision for loss to reduce the computed weighted average cost if it exceeds the net realizable value.
Income taxes
Taxes are calculated in accordance with taxation principles currently effective in the PRC. The Company accounts for income taxes under the provision of Statements of Financial Accounting Standards No. 109, which requires recognition of deferred tax assets and liabilities for the expected future tax consequences of events that have been included in the financial statements or tax returns. We account for income taxes using the liability method. Deferred tax assets and liabilities are recognized for the future tax consequences attributable to differences between the financial statement carrying amounts of existing assets and liabilities and their respective tax bases. Deferred tax assets and liabilities are measured using enacted tax rates expected to apply to taxable income in the years in which those temporary differences are expected to be recovered or settled. The effect on deferred tax assets and liabilities of a change in tax rates is recognized as income in the period that includes the enactment date. A valuation allowance is provided for the amount of deferred tax assets that, based on available evidence, are not expected to be realized.
Related parties
Parties are considered to be related if one party has the ability, directly or indirectly, to control the other party or exercise significant influence over the other party in making financial and operational decisions. Parties are also considered to be related if they are subject to common control or common significant influence. Related parties may be individuals or corporate entities.
25
Table of Contents
Revenue recognition
The Company recognizes revenue when the significant risks and rewards of ownership have been transferred to the customer, including factors such as when persuasive evidence of an arrangement exists, delivery has occurred, the sales price is fixed and determinable, and collectibility is probable. The Company recognizes sales when the merchandise is shipped, title has passed to the customers and collectibility is reasonably assured.
Concentration of credit risk
Financial instruments that potentially subject our company to significant concentrations of credit risk consist primarily of trade accounts receivable. We perform ongoing credit evaluations with respect to the financial condition of our creditors, but do not require collateral. In order to determine the value of our accounts receivable, we record a provision for doubtful accounts to cover probable credit losses. Our management reviews and adjusts this allowance periodically based on historical experience and its evaluation of the collectability of outstanding accounts receivable.
Recent developments
Results of Operations—Year Ended December 31, 2009 Compared to Year Ended December 31, 2008
Total sales for the year ended December 31, 2009 increased by $4,568,728, or 6.7% compared to the same period of 2008. The aquaculture product segment’s sales increased by $159,959 or 0.4% while the health and bio-products segment’s sales increased by $3,136,163 or 14%. Sales of feed products which began in the last quarter of 2009, generated approximately $1.3 million of revenue for the year 2009. Income from operations for the year ended December 31, 2009 decreased by $3,952,390 or 26% when compared to 2008; that decrease was due mostly to a higher provision of doubtful accounts from all our segments and higher marketing and advertising costs from the health and bio-products segment. Net income of $8,100,131 was generated in 2009, decreasing from $10,040,688 in 2008, a decrease of 19% in 2009 due mostly to increased marketing and advertising expenses and doubtful accounts. Financing costs have decreased by $1,565,324 or 59% to $1,097,410 as compared to $2,662,734 for 2008. Financing costs will continue to decrease in 2010 as the promissory notes matured in 2009. The 2009 financing costs included (i) interest on the promissory notes issued in 2006 which have now matured, together with the related warrant amortization costs (non-cash), and (ii) amortization of the embedded conversion option (also non-cash) which will also not repeat in 2010 as the related promissory notes matured in 2009. Those financing costs were recognized as such in accordance with FAS 123R and EITF 00-27.
Segments
Aquatic Products Segment
Hainan Quebec Ocean Fishing Co. Ltd. is engaged in the processing and selling of aquatic products. The revenue contributed by this segment was $45,530,359 and $45,370,400 for the years ended December 31, 2009 and 2008, respectively, a marginal improvement of 0.4%. As in prior years, our aquaculture sales in 2009 and in 2008 were realized from three sources: Tilapia, shrimp and ocean caught fish. In 2009, the value of our tilapia sales was reduced by approximately 8% mostly due to a reduction in the average market prices of our range of products as the volume was stable for both years. The 2008 market prices were inflated in the first half of 2008 after a world shortage of tilapia was in effect related to a difficult 2007-2008 winter in China. In addition, sales of shrimps increased in 2009 compared to 2008 by approximately 20% due to a combination of both increase in volume of about 25% and reduction in prices of about 5%. Sale of shrimps occurred mostly in the second half of the year. Finally, sales originating from ocean caught fish, which also occur mostly in the second half of the year, increased by approximately 8% as a result of a combination of increased volumes of approximately 25% coupled to a reduction in price of approximately 15%. The related gross profit ratio of this segment was 24.3% and 23.6% for the years ended December 31, 2009 and 2008, respectively. This segment contributed $9,091,826 and $9,456,019 to net income for the years ended December 31, 2009 and 2008, respectively. The increase of $662,539 in doubtful accounts led to deterioration in the profitability in 2009 compared to 2008.
Health and Bio-products Segment
Our other manufacturing subsidiary, Jiahua Marine, is engaged in the manufacturing and selling of marine bio and healthcare products. During the years ended December 31, 2009 and 2008, Jiahua Marine realized sales of $25,489,046 and $22,352,883, respectively, an increase of 14%. The increase in sales in 2009 compared to 2008 was the result of a combination of increase in sales prices by approximately 10% with reduced volumes of 13% from our old shark related products, added to the increase in the sale of new products of approximately $2,760,000. The gross profit ratio for this segment was 75.1% and 73.4% for the years ended December 31, 2009 and 2008, respectively. That improvement in gross profit experienced in 2009 was the result of a different sales mix, added to new products marketed during the year. The major expense of this segment was advertising, representing 29.4% and 19.8% of revenue for the years ended December 31, 2009 and 2008, respectively. The net income contributed by this segment was $5,204,027 and $8,736,289 for the years ended December 31, 2009 and 2008, respectively, a decrease of 40% in the year 2009, mostly resulting from the combination of increased marketing and advertising expenses and increased doubtful accounts.
26
Table of Contents
Feed Products Segment
Our new feed mill facility was completed in the last quarter in 2009. After trial runs, sales of feed products began in December 2009 and generated approximately $1.3 million of revenue with a gross profit margin of 0.6% or $8,142 for the year ended December 31, 2009. The low gross profit margin realized in 2009 is due to non-absorption of costs corresponding to a low level of activity in that segment, typical of start-up operations. We expect 2010 to show improved gross profit margins as sales increase next year.
Operations
Sales. For the year ended December 31, 2009, sales increased by $4,568,728, or 7 %, to $72,292,011 from $67,723,283 for the year ended December 31, 2008. This increase in sales was the result mostly of better performances of the bio-products segment (with increased sales of $3,136,163) and the new feed product segment (with sales of $1,272,606). Sales from the aquaculture product segment increased by $159,959, or 0.4 % for the year ended December 31, 2009.
Cost of Sales. Cost of sales increased by $1,502,019, or 4 %, to $42,096,207 from $40,594,188 for the year ended December 31, 2009, as compared to the year ended December 31, 2008. The overall gross profit margin increased from 40% for the year ended December 31, 2008 to 42% for the year ended December 31, 2009, due to the improved margins in the bio-products and aquatic products segments, offset by low 2009 margins from the feed products segment.
Selling and distribution expenses. Selling and distribution expenses decreased by $157,493, or 10 %, from $1,550,860 to $1,393,367 for the year ended December 31, 2009, as compared to 2008. The decrease was due to overall reduced transportation costs in the current year from the aquaculture product segment.
Marketing and advertising expenses. Marketing and advertising expenses increased by $3,060,792, or 69 %, from $4,426,378 to $7,487,170 for the year ended December 31, 2009, as compared to 2008. Increase in those expenses is mostly due to the publicity programs for new products in order to increase market penetration to the targeted customers and raise consumer awareness. In 2009, we brought back the ratio of marketing and advertising expenses to bio-products sales to 29%, comparative to the pre 2008 ratio. Such ratio is consistent with industry practices in this highly competitive segment
General and administrative expenses. For the year ended December 31, 2009, general and administrative expenses increased by $562,474, or 9%, to $6,768,467, as compared to 2008. The major part of the increase was the result of additional costs related to freight and storage costs (approximately $75,000), rental costs (approximately $70,000), marketing and product development costs (approximately $125,000), professional fees (approximately $90,000), and other U.S. head office expenses.
Depreciation and amortization. Depreciation and amortization decreased by $52,284 to $335,917 for the year ended December 31, 2009, mostly as a result of reduced amortization of intangible assets in 2009 compared to 2008 and fixed assets coming to the end of their useful lives in 2009.
Doubtful accounts/(Recovery of). Doubtful accounts expense amounted to $3,114,387 for the year ended December 31, 2009 compared to a recovery of $491,223 for the year ended 2008, an increase $3,605,610. The increase in the 2009 provision, originating mostly from our bio-products segment, was required in order to provide against potential losses in our receivables which did not materialize to date. These potential losses relate to sales of new health and bio-products in 2009, in order to penetrate new customers by offering extended collection periods, thus extending our collection risks.
Income from operations. Income from operations decreased to $11,096,496 in financial year 2009, from $15,048,886 in 2008, a deterioration of $3,952,390 or 26%. Although we realized increased sales and gross profit in 2009, this deterioration is primarily the result of the increased doubtful accounts expense of $3,605,610 added to increased marketing and advertising expense of $3,060,972 as described above.
Finance costs. Finance costs decreased to $1,097,410 for the year ended December 31, 2009 from $2,662,734 for the year ended December 31, 2008, a reduction of $1,565,324 or 58.8 %. In 2008, finance costs were affected by penalties for late filing of the registration statement of the underlying shares related to those convertible notes issued in November 2006 (approximately $1,621,000), added to the result of a final settlement amounting to approximately $699,000 from the American Arbitration Association in relation with financial fees payable to one of our financial service suppliers. Such one time costs did not occur in 2009. In 2008 as in 2009, financing costs also included recognition of the carrying interests on the promissory notes issued in November 2006 added to the continued combination of amortization of the future conversion of warrants (non–cash) attributed to investors on those November 2006 notes of $5,000,000, added to the amortization of the embedded conversion option (non–cash) related to the same notes. Such carrying interests on promissory notes and amortization will not be repeated in 2010 as the promissory notes matured in 2009.
27
Table of Contents
Fair value change in derivative financial instruments. Effective January 01, 2009, in recognition of new accounting standards related to the fair value of our outstanding warrants and embedded conversion feature of our promissory notes in accordance with FASB ASC 815-40 and SFAS No.133, we recognized in our income statement the change in value (“mark-to-market”) from January 1, 2009 to December 31, 2009 of those two items included in our current liabilities. For fiscal year 2009, we recognized an income of $678,378 corresponding to the reduction in the fair value of those two financial instruments between January 1, 2009 and December 31, 2009. In fiscal year 2010, there will not be any change in value related to the embedded conversion feature of our promissory notes as they matured in December 2009. The fair value change of our outstanding warrants will continue to be evaluated annually until their expiration and the corresponding change will be charged or credited to our income in the corresponding period.
Other expense/(income). Other expense amounted to $364,472 in 2009 compared to other income of $567,876 in 2008. The 2009 balance was mostly the result of a non-recurring loss on disposal of machinery of approximately $447,000 during the last quarter of 2009, while in 2008, the other income was mostly the result of a gain on disposal of machinery of approximately $495,000.
Income before income taxes. Income before income taxes decreased by $2,641,036 to $10,312,992 for the year ended December 31, 2009, from $12,954,028 in 2008. The 2009 reduction in income from operations of $3,952,390 originating essentially from increased doubtful accounts and marketing and advertising expenses was partially offset by a decrease in financing costs of $1,565,324, as described above.
Current income tax. Current income taxes increased by $228,836 to $2,323,812 from $2,094,976 for the year ended December 31, 2009 and December 31, 2008, respectively. Current income tax was higher in 2009 due to the application of the new PRC Enterprise Income Tax Law (EIT), which became effective on January 1, 2008, which increased the tax rates from 18% in 2008 to 20% in 2009 on our bio-product segment. That new Law provides, amongst other issues, that income derived from preliminary processing of fishery products is now income tax exempt while the tax rate on our bio-product segment is increasing yearly until it reaches 25% in 2012.
Deferred income tax. Deferred income taxes decreased from an expense of $818,364 in 2008 to an income $110,951 for year ended December 31, 2009. The recovery of 2009 was the result of timing differences.
Net income attributable to shareholders. Net income attributable to shareholders decreased from $10,040,688 for the year ended December 31, 2008, to $8,100,131 for the year ended December 31, 2009. That significant reduction of 19% in net income was mostly the result of higher marketing and advertising expenses from the bio-products segment and doubtful accounts expense from both segments incurred in 2009, as described above.
Results of Operations—Year Ended December 31, 2008 Compared to Year Ended December 31, 2007
Total sales for the year ended December 31, 2008 increased by $12,753,072, or 23% compared to the same period of 2007. The aquaculture product segment’s sales increased by $9,121,963, or 25% while the health and bio-products segment’s sales increased by $3,631,109 or 19 %. Income from operations for the year ended December 31, 2008 increased by 17% when compared to 2007; that improvement was due mostly to the higher sales and gross profit of 2008 originating from both of our segments. A net income of $10,040,688 was generated in 2008, increasing from $4,486,562 in 2007, an increase of 124% in 2008. That significant increase in 2008 is attributable to the increased sales and gross profit of 2008 from both our segments, coupled to a reduction of financing costs in 2008 and no income taxes from our aquaculture products segment since January 2008. Financing costs have decreased by $3,194,383 or 55% to $2,662,734 as compared to $5,857,117 for 2007. Financing costs will continue to decrease in 2009 as the maturity of the promissory notes, triggering the warrants amortization costs (non-cash) and the related amortization of the embedded conversion option (also non-cash), will occur in November 2009. Those financing costs are recognized as such in accordance with FAS 123R and EITF 00-27.
Segments
Manufacturing and selling of aquatic products
Hainan Quebec Ocean Fishing Co. Ltd. is engaged in the processing and selling of aquatic products. The revenue contributed by this segment was $45,370,400 and $36,248,437 for the years ended December 31, 2008 and 2007, respectively, an improvement of 25%. Our aquaculture sales in 2008 and in 2007 were realized from three sources: tilapia, shrimp and ocean caught fish. Of the total increase in sales during 2008 compared to 2007, 46% originated from tilapia, 32% originated from shrimp and 22% from ocean caught fish. The tilapia increase in sales in 2008 compared to 2007 was mostly the result of increased prices in the first half of 2008, because market conditions forced the prices up as a result of a supply shortage in the industry due to an especially harsh 2007-2008 freezing winter in China. Shrimp sales increased in 2008 compared to 2007 due to a combination of both increase in volume and price. Volume of shrimp sold increased by 18% while prices increased by approximately 17%. Sales of shrimp occurred mostly in the second half of the year. Finally, sales originating from ocean caught fish, which also occur mostly in the second half of the year, were the result of a combination of increased prices of 20% and increased volumes of approximately 35%. In 2008, the production capacity of our fish processing plant was increased by 50%, effective as of the third quarter of the year. The related gross profit ratio of this segment was 25% and 27% for the years ended December 31, 2008 and 2007, respectively. The second half of 2008 showed a recovery in the percentage of gross profit as compared to the first half of the year when gross profit margins were hurt significantly due to the international markets’ failure to recognize the difficult position of the tilapia industry during that period. This segment contributed $9,963,357 and $6,299,304 to net income for the years ended December 31, 2008 and 2007, respectively. The significant increase in sales and related gross profit of this segment in 2008, combined with bad debt recovery and no income taxes since January 2008, led to favorable improvement in the profitability in 2008 compared to 2007.
28
Table of Contents
Manufacturing and selling of health and bio-products
Our other manufacturing subsidiary, Jiahua Marine, is engaged in the manufacturing and selling of marine bio and healthcare products. During the years ended December 31, 2008 and 2007, Jiahua Marine realized sales of $22,352,883 and $18,721,774, respectively, an increase of 19%. Approximately 88% of the increase in sales in 2008 compared to 2007 was the result of a combination of increase in volumes and sales prices originating from our shark processed related products. The gross profit ratio from this segment was 75% and 84% for the years ended December 31, 2008 and 2007, respectively. That reduction in gross profit experienced in 2008 was the result of a different sales mix, added to development costs incurred in relation to new products to be marketed in 2009, and finally to market penetration costs incurred from the second half of 2008. The major expense of this segment was advertising, representing 20% and 28% of revenue for the year ended December 31, 2008 and 2007, respectively. The net income contributed by this segment was $8,999,699 and $7,984,935 for the years ended December 31, 2008 and 2007, respectively, an increase of 13% in the year in 2008.
Operations
Sales. For the year ended December 31, 2008, sales increased by $12,753,072, or 23%, to $67,723,283 from $54,970,211. This significant increase in sales was the result of better performances of both segments in 2008. Sales from the aquaculture product segment increased by $9,121,963, or 25%, while sales from the health and bio product segment increased by $3,631,109, or 19% in 2008, compared to 2007. In 2008, the production capacity of our fish processing plant increased by 50%, effective as of the third quarter of the year.
Cost of Sales. Cost of sales increased by $10,233,665, or 34%, to $40,594,918 from $30,360,523 for the year ended December 31, 2008, as compared to the year ended December 31, 2007. The overall gross profit margin decreased from 45 % for the year ended December 31, 2007 to 40 % for the year ended December 31, 2008, mostly due to the margin decrease in the health and bio-product segment related to product mix, the development costs of new products to be marketed in 2009 and the market penetration costs incurred in 2008.
Selling and distribution expenses. Selling and distribution expenses increased by $709,597, or 84%, from $841,263 to $1,550,860 for the year ended December 31, 2008, as compared to 2007. The increase was the result of higher sales volumes realized in the current year from both our segments, including higher transportation costs.
Marketing and advertising expenses. Marketing and advertising expenses decreased by $735,921, or 14%, from $5,162,299 to $4,426,378 for the year ended December 31, 2008, as compared to 2007. The reduction in those expenses is mostly due to the winding down of publicity programs for those products that have successfully penetrated the targeted markets and that have raised consumer awareness about our products. In 2008, we continued to maintain a high level of advertising in order to sustain our market share in this highly competitive market as is consistent with industry practices.
General and administrative expenses. For the year ended December 31, 2008, general and administrative expenses increased by $1,405,631, or 29%, to $6,205,992, as compared to 2007. The major part of the increase was the result of additional costs related to Sarbanes Oxley’s documentation and audit requirements of section 404 (approximately $215,000), increased franchise tax from State of Delaware (approximately $263,000), branding-related expenses (approximately $105,000), traveling (approximately $173,000), investors’ relations (approximately $47,000) and other U.S. head office expenses.
Depreciation and amortization. Depreciation and amortization increased by $104,523 to $388,201 for the year ended December 31, 2008, mainly as a result of acquisition of fixed assets in 2008 triggering new depreciation charges.
(Recovery of)/Provision for doubtful accounts. Recovery of doubtful accounts amounted to $491,223 for the year ended December 31, 2008 compared to a provision of $672,086 for the year ended 2007. The 2008 recovery originated from the aquaculture segment where the statistical estimate provided in 2007 reversed in 2008.
Income from operations. Income from operations increased to $15,048,886 in financial year 2008, compared to $12,850,000 in 2007, an improvement of 17%. That improvement in 2008 is mostly the result of increased sales and related gross profit from both our segments in 2008 as described above, added to bad debt recovery and offset by increased selling, marketing and general and administrative expenses.
29
Table of Contents
Finance costs. Finance costs decreased to $2,662,734 from $5,857,117 for the year ended December 31, 2008 as compared to the previous year, a reduction of $3,194,383 or 55%. Included in the 2008 finance costs are the non-recurring costs of $699,000 recognized in relation to the final judgment on the Westminster Securities and John O’Shea claims against the Company and settled in the first half of 2008. In addition, by virtue of a Waiver and Amendment Agreement dated February 22, 2008 and relating to the promissory notes issued in November 2006, included also in the first half of 2008 are the non-recurring costs of penalties and interests amounting to approximately $1,621,000 regarding the late filing of the registration statement relating to the underlying shares of the convertible notes issued in November 2006. Finally, the carrying interests on the promissory notes issued in 2006 added to the continued combination of amortization of the future conversion of warrants (non–cash) attributed to investors on those notes of $10,225,000 issued in 2006, and to the amortization of the embedded conversion option (also non–cash) related to the same notes. Those non-cash financing costs were recognized in accordance with FAS 123R and EITF 00-27. Such amortization will be repeated, on a pro-rata basis, until maturity of the underlying notes. Finance costs will continue to decrease in 2009 as the maturity of the promissory notes will occur in November 2009.
Other income. Other income amounted to $567,876 in 2008 compared to $42,491 in 2007. The 2008 balance was mostly the result of a non-recurring gain on disposal of fixed assets of approximately $495,000 during the last quarter of 2008.
Income before income taxes. Income before income taxes increased by $5,918,654 to $12,954,028 for the year ended December 31, 2008, from $7,035,374 in 2007. That significant increase is the result of increased income from operations as described above coupled with a reduction in finance costs.
Current income tax. Current income taxes decreased by $453,836 to $2,094,976 from $2,548,812 for the year ended December 31, 2008 and December 31, 2007, respectively. Income taxes were lower in 2008 due to the application of the new PRC Enterprise Income Tax Law (EIT), which became effective on January 1, 2008. That new Law provides, amongst other issues, that income derived from preliminary processing of fishery products is now exempted from income tax while it stood at 15% in 2007. Furthermore, with regards to our nutraceutical unit, the income tax rate increased to 18% in 2008 from 15% in 2007; for that segment, the income tax rate will gradually increase to a maximum of 25% by 2012.
Deferred income tax. Deferred income taxes increased from NIL in 2007 to $818,364 for year ended December 31, 2008. The increase was the result of a non-recurring write-off of deferred taxation representing an expense of approximately $818,000 related to the sale of fixed assets. Otherwise, there was no deferred income tax recognized in both financial years as there were no other material timing differences to justify recognition of such deferred tax expenses.
Net income attributable to shareholders. Net income attributable to shareholders increased significantly from $4,486,562 for the year ended December 31, 2007, to $10,040,688 for the year ended December 31, 2008. That increase of 124% in net income was the result of increased sales and gross profit from both segments in 2008, added to a reduction in finance costs and income taxes as described above.
Quarterly Results
The following table contains unaudited quarterly results for the years ended December 31, 2009 and 2008:
| Quarters Ended | ||||||||||||||
| 31-Mar | 30-Jun | 30-Sep | 31-Dec | |||||||||||
| Year Ended December 31, 2009 |
||||||||||||||
| REVENUES |
$ | 10,840,821 | $ | 16,009,757 | $ | 22,156,867 | $ | 23,284,566 | ||||||
| GROSS PROFIT |
$ | 4,753,314 | $ | 6,811,936 | $ | 10,008,841 | $ | 9,371,576 | ||||||
| NET INCOME |
$ | 1,341,925 | $ | 1,084,736 | $ | 4,047,434 | $ | 1,626,036 | ||||||
| Basic net income per common share |
$ | 0.092 | $ | 0.088 | $ | 0.297 | $ | 0.12 | ||||||
| Diluted net income per common share |
$ | 0.089 | $ | 0.086 | $ | 0.268 | $ | 0.12 | ||||||
| Year Ended December 31, 2008 |
||||||||||||||
| REVENUES |
$ | 9,210,490 | $ | 14,531,487 | $ | 22,470,184 | $ | 21,511,122 | ||||||
| GROSS PROFIT |
$ | 3,646,451 | $ | 4,690,252 | $ | 9,232,080 | $ | 9,560,312 | ||||||
| NET INCOME/(LOSS) |
$ | (1,029,443 | ) | $ | (993,438 | ) | $ | 5,614,682 | $ | 6,448,887 | ||||
| Basic net income/(loss) per common share |
$ | (0.089 | ) | $ | (0.083 | ) | $ | 0.466 | $ | 0.549 | ||||
| Diluted net income/(loss) per common share |
$ | (0.089 | ) | $ | (0.083 | ) | $ | 0.427 | $ | 0.530 | ||||
30
Table of Contents
Liquidity and Capital Resources
Our cash and cash equivalents decreased by $17,963,245 during the financial year 2009, to $36,957,303. As at December 31, 2009, working capital was $90,760,982 compared to $72,203,260 at December 31, 2008. The funds generated by the operating activities during 2009 were used mainly to support the increase in our receivables and inventory levels.
Total assets increased by $19,619,552 to $119,805,825 at December 31, 2009, from $100,186,273 as of December 31, 2008. Stockholders’ equity increased by $23,750,579, or 27%, to $112,023,607 as at December 31, 2009, from $88,273,028 as of December 31, 2008.
To date, we have financed our operations through the combination of our operating revenues, equity and debt financing (in connection with which we have at times incurred significant costs), short–term bank loans, and the use of shares of our common stock issued as payment for services rendered to us by third parties. In the past, we issued shares of our common stock and warrants in private placement transactions to help finance our operations, and to pay for professional services (such as financial consulting, market development, legal services and public relations services). We recognized these services on our books as operating or deferred expenses and amortized over their estimated useful life. The number of shares we issued for these purposes were determined as of the dates of invoices relating to such services, and the shares were valued at their market prices on those respective dates. In addition, as required by PRC laws, we establish yearly reserves shown in the stockholders’ equity section of our balance sheet. Those reserves, which are created by a transfer from the retained earnings account, limit our capacity to pay dividends to stockholders until the retained earnings become positive. The laws and regulations of the PRC restrict any form of distribution of statutory surplus reserve, whether by cash dividends or for use in the US operations. As of December 31, 2009, the remaining statutory surplus reserve required is approximately $2.33 million (2008: $3.25 million). As we are in an expansion phase, we do not intend to pay dividends to stockholders in the foreseeable future. To date, we have not paid any dividends.
We are currently in the process of examining various financing opportunities to obtain additional liquidities to help finance our operations, as well as support our additional cash requirements related to volume increases that we anticipate might occur in the future, specifically in the inventory and receivables build–up. No assurances can be given that additional debt or equity financing we may require will be available to us or, even if available, that such financing will be on terms favorable to us.
At present, about 40.6% of our consolidated sales are derived from our five largest clients, and our results of operations therefore depend on a small number of clients (38% in 2008). As part of our short and medium–term business plan, including our recent efforts to raise funds to support the anticipated expansion of our operations, we intend to invest in our infrastructure to construct a new processing plant. We expect that this will allow us to meet forecasted incremental demand for our products in the United States and Europe. As a result, we plan to develop and serve new clients, which should reduce our dependence on individual clients to more acceptable levels.
In order to ensure sufficient funds to meet our future needs for capital, management believes that we will continue to evaluate opportunities to raise financing through some combination of commercial bank borrowings, the private or public sale of equity, or issuance of debt securities from time to time. However, future equity or debt financing may not be available to us at all, or if available, may not be on terms acceptable to us. If we are unable to obtain financing in the future, we will continue to develop our business on a reduced scale based on our existing capital resources.
The ratio of current assets to current liabilities increased to 12.7 times ($98,543,199/$7,782,218) at December 31, 2009, from 7.1 times ($84,116,505/$11,913,245) at December 31, 2008.
Contractual Obligations
We have various contractual obligations that are recorded as liabilities in our consolidated financial statements. Other items, such as purchase commitments, are not recognized as liabilities in our consolidated financial statements but are required to be disclosed. For example, we are contractually committed to make certain minimum lease payments for the use of property and equipment under operating lease agreements and arrangements we classify as capital leases.
31
Table of Contents
The following table summarizes (in millions) our significant contractual obligations and commercial commitments at December 31, 2009 and the future periods in which such obligations and commitments are expected to be settled in cash. In addition, the table reflects the timing of principal payments on outstanding borrowings. This table does not reflect regular recurring trade payables incurred in the normal course of business and generally due within 30 days of service. Additional details regarding these obligations are provided in notes to the consolidated financial statements also included herein, as referenced in the table:
| Less than 1 year | 1-3 years | 3-5 years | More than 5 years | Total | ||||||||||
| Operating leases |
$ | 209,115 | $ | 159,054 | $ | 39,763 | $ | 407,932 | ||||||
| Purchase and other commitments |
$ | 27,812 | $ | 27,812 | ||||||||||
| Total |
$ | 236,927 | $ | 159,054 | $ | 39,763 | $ | 435,744 | ||||||
Off-Balance Sheet Transactions
We have no off-balance sheet arrangements or transactions with unconsolidated, special purpose entities.
| ITEM 7A. | QUANTITATIVE AND QUALITATIVE DISCLOSURES ABOUT MARKET RISK |
We do not hold any derivative instruments and do not engage in any hedging activities. Because most of our purchases and sales are made in RMB, any exchange rate change affecting the value of the RMB relative to the U.S. dollar could have an effect on our financial results as reported in U.S. dollars. If the RMB were to depreciate against the U.S. dollar, amounts reported in U.S. dollars would be correspondingly reduced. If the RMB were to appreciate against the U.S. dollar, amounts reported in U.S. dollars would be correspondingly increased.
32
Table of Contents
| ITEM 8. | CONSOLIDATED FINANCIAL STATEMENT AND SUPPLEMENTARY DATA |
33
Table of Contents
Management is responsible for the preparation and integrity of the Consolidated Financial Statements appearing in this Annual Report. The Consolidated Financial Statements were prepared in conformity with accounting principles generally accepted in the United States and include amounts based on management’s estimates and judgments.
Management is also responsible for establishing and maintaining an adequate system of internal control over financial reporting as defined in Rules 13a-15(f) and 15d-l5(f) promulgated under the Securities Exchange Act of 1934. We maintain a system of internal controls that is designed to provide reasonable assurance as to the fair and reliable preparation and presentation of the Consolidated Financial Statements in accordance with generally accepted accounting principles, as well as to safeguard assets from unauthorized use or disposition.
Our control environment is the foundation for our system of internal control over financial reporting and is embodied in our Code of Conduct. Our internal control over financial reporting includes written policies and procedures that:
| • | pertain to the maintenance of records that, in reasonable detail, accurately and fairly reflect the transactions of the Company; |
| • | provide reasonable assurance that transactions are recorded as necessary to permit preparation of financial statements in accordance with generally accepted accounting principles; |
| • | provide reasonable assurance that receipts and expenditures of the Company are made in accordance with the appropriate authorization of management and the directors of the Company; and |
| • | provide reasonable assurance regarding prevention or timely detection of unauthorized acquisition, use or disposition of assets that could have a material effect on the consolidated financial statements. Internal control over financial reporting includes the controls themselves, monitoring and internal auditing practices and remedial actions to correct deficiencies as they are identified. |
Management evaluated the effectiveness of the Company’s internal control over financial reporting as of December 31, 2009. Management based such assessment upon the criteria set forth in Internal Control—Integrated Framework issued by the Committee of Sponsoring Organizations of the Treadway Commission. This evaluation included review of the documentation of controls, evaluation of the design effectiveness of controls, testing of the operating effectiveness of controls and a conclusion on this evaluation. Although there are inherent limitations in the effectiveness of any system of internal controls over financial reporting, based on our evaluation, we have concluded that our internal controls over financial reporting were effective as of December 31, 2009.
Schwartz Levitsky Feldman LLP, an independent registered public accounting firm, has audited the consolidated financial statements included in this Report and, as part of their audit, has issued its report, included herein in Item 8, on the effectiveness of our internal control over financial reporting.
| Norbert Sporns | Jean- Pierre Dallaire | |
| President and Chief Executive Officer |
Chief Financial Officer |
34
Table of Contents
CHARTERED ACCOUNTANTS
LICENSED PUBLIC ACCOUNTANTS
TORONTO • MONTREAL
REPORT OF INDEPENDENT REGISTERED PUBLIC ACCOUNTING FIRM
To the Shareholders of
HQ Sustainable Maritime Industries, Inc.
We have audited the accompanying consolidated balance sheet of HQ Sustainable Maritime Industries, Inc. (the “Company”) as at December 31, 2009, and December 31, 2008, and the related consolidated statements of income and comprehensive income, cash flows and changes in shareholders’ equity for the two years ended December 31, 2009, and 2008. These consolidated financial statements are the responsibility of the management of HQ Sustainable Maritime Industries, Inc. Our responsibility is to express an opinion on these consolidated financial statements based on our audit.
We conducted our audit in accordance with the standards of the Public Company Accounting Oversight Board (United States). Those standards require that we plan and perform the audit to obtain reasonable assurance about whether the consolidated financial statements are free of material misstatement. An audit includes examining, on a test basis, evidence supporting the amounts and disclosures in the consolidated financial statements. An audit also includes assessing the accounting principles used and significant estimates made by management, as well as evaluating the overall financial statement presentation. We believe that our audit provides a reasonable basis for our opinion.
In our opinion, these consolidated financial statements referred to above present fairly, in all material respects, the financial position of the Company as of December 31, 2009, and December 31, 2008, respectively, and the results of its income and comprehensive income and its cash flows for the two years ended December 31, 2009, and 2008, in conformity with generally accepted accounting principles in the United States of America.
We have also audited, in accordance with the standards of the Public Company Accounting Oversight Board (United States), the Company’s internal control over financial reporting as of December 31, 2009, based on criteria established in Internal Control-Integrated Framework issued by the Committee of Sponsoring Organizations of the Treadway Commission (COSO), and our report dated March 2, 2010, except for note 24, which is as of March 10, 2010, expressed an unqualified opinion on the effectiveness of the Company’s internal control over financial reporting.
The consolidated financial statements of HQ Sustainable Maritime Industries, Inc. and Subsidiaries for the year ended December 31, 2007 were audited by other auditors whose report dated March 27, 2008 expressed an opinion without qualification on those consolidated financial statements.
| /s/ Schwartz Levitsky Feldman LLP | ||
| Toronto, Ontario, Canada | Chartered Accountants | |
| March 2, 2010, except for note 24 which is as of March 10, 2010 | Licensed Public Accountants | |
35
Table of Contents

REPORT OF INDEPENDENT REGISTERED PUBLIC ACCOUNTING FIRM
To the Board of Directors and Stockholders
HQ Sustainable Maritime Industries, Inc. and Subsidiaries
Delaware
We have audited the accompanying consolidated statements of income and comprehensive income, changes in stockholders’ equity, and cash flows of HQ Sustainable Maritime Industries, Inc. and Subsidiaries for the year ended December 31, 2007. HQ Sustainable Maritime Industries, Inc. and Subsidiaries’ management is responsible for these consolidated financial statements. Our responsibility is to express an opinion on these consolidated financial statements based on our audits.
We conducted our audits in accordance with the standards of the Public Company Accounting Oversight Board (United States). Those standards require that we plan and perform the audit to obtain reasonable assurance about whether the consolidated financial statements are free of material misstatement. The Company is not required to have, nor were we engaged to perform, an audit of its internal control over financial reporting. Our audit included consideration of internal control over financial reporting as a basis for designing audit procedures that are appropriate in the circumstances, but not for the purpose of expressing an opinion on the effectiveness of the Company’s internal control over financial reporting. Accordingly, we express no such opinion. An audit also includes examining, on a test basis, evidence supporting the amounts and disclosures in the consolidated financial statements, assessing the accounting principles used and significant estimates made by management, as well as evaluating the overall consolidated financial statement presentation. We believe that our audits provide a reasonable basis for our opinion.
In our opinion, the consolidated statements of income and comprehensive income, changes in stockholders’ equity, and cash flows referred to above present fairly, in all material respects, the results of HQ Sustainable Maritime Industries, Inc. and Subsidiaries’ operations and cash flows for the year ended December 31, 2007, in conformity with accounting principles generally accepted in the United States of America.
| /s/ Rotenberg & Co., LLP |
| Rotenberg & Co., LLP |
| Rochester, New York |
| March 27, 2008 |
New York • Penn Yan • Rochester
36
Table of Contents
CHARTERED ACCOUNTANTS
LICENSED PUBLIC ACCOUNTANTS
TORONTO • MONTREAL
REPORT OF INDEPENDENT REGISTERED PUBLIC ACCOUNTING FIRM
ON INTERNAL CONTROL OVER FINANCIAL REPORTING
To the Shareholders of
HQ Sustainable Maritime Industries, Inc.
We have audited HQ Sustainable Maritime Industries, Inc.’s (the “Company”) internal control over financial reporting as of December 31, 2009, based on criteria established in Internal Control-Integrated Framework issued by the Committee of Sponsoring Organizations of the Treadway Commission (the COSO criteria). The Company’s management is responsible for maintaining effective internal control over financial reporting, and for its assessment of the effectiveness of internal control over financial reporting included in the accompanying Report of Management on Internal Control Over Financial Reporting. Our responsibility is to express an opinion on the Company’s internal control over financial reporting based on our audit.
We conducted our audit in accordance with the standards of the Public Company Accounting Oversight Board (United States). Those standards require that we plan and perform the audit to obtain reasonable assurance about whether effective internal control over financial reporting was maintained in all material respects. Our audit included obtaining an understanding of internal control over financial reporting, assessing the risk that a material weakness exists, testing and evaluating the design and operating effectiveness of internal control based on the assessed risk. Our audit also included performing such other procedures as we considered necessary in the circumstances. We believe that our audit provides a reasonable basis for our opinion.
A Company’s internal control over financial reporting is a process designed to provide reasonable assurance regarding the reliability of financial reporting and the preparation of financial statements for external purposes in accordance with generally accepted accounting principles. A Company’s internal control over financial reporting includes those policies and procedures that (1) pertain to the maintenance of records that, in reasonable detail, accurately and fairly reflect the transactions and dispositions of the assets of the Company; (2) provide reasonable assurance that transactions are recorded as necessary to permit preparation of financial statements in accordance with generally accepted accounting principles, and that receipts and expenditures of the Company are being made only in accordance with authorizations of management and directors of the Company; and (3) provide reasonable assurance regarding prevention or timely detection of unauthorized acquisition, use, or disposition of the Company’s assets that could have a material effect on the financial statements.
Because of its inherent limitations, internal control over financial reporting may not prevent or detect misstatements. Also, projections of any evaluation of effectiveness to future periods are subject to the risk that controls may become inadequate because of changes in conditions, or that the degree of compliance with the policies or procedures may deteriorate.
In our opinion, the Company maintained, in all material respects, effective internal control over financial reporting as of December 31, 2009, based on the COSO criteria.
We have also audited, in accordance with the standards of the Public Company Accounting Oversight Board (United States), the consolidated balance sheet of the Company as at December 31, 2009, and December 31, 2008, and the related consolidated statement of income and comprehensive income, cash flows and changes in shareholders’ equity for the two years ended December 31, 2009, and 2008 and our report dated March 2, 2010, except for note 24, which is as of March 10, 2010, expressed an unqualified opinion thereon.
| /s/ Schwartz Levitsky Feldman LLP | ||
| Toronto, Ontario, Canada | Chartered Accountants | |
| March 2, 2010, except for note 24 which is as of March 10, 2010 | Licensed Public Accountants | |
37
Table of Contents
HQ SUSTAINABLE MARITIME INDUSTRIES, INC. AND SUBSIDIARIES
(INCORPORATED IN THE STATE OF DELAWARE
WITH LIMITED LIABILITY)
CONSOLIDATED BALANCE SHEETS
AS OF DECEMBER 31, 2009 AND 2008
| 2009 | 2008 | |||||
| ASSETS |
||||||
| CURRENT ASSETS: |
||||||
| Cash and cash equivalents |
$ | 36,957,303 | $ | 54,920,548 | ||
| Trade receivables, net of provisions (Note 4) |
58,186,055 | 27,689,410 | ||||
| Inventories (Note 6) |
2,204,931 | 1,041,628 | ||||
| Prepayments (Note 7) |
1,194,910 | 464,919 | ||||
| TOTAL CURRENT ASSETS |
98,543,199 | 84,116,505 | ||||
| PROPERTY, PLANT AND EQUIPMENT, NET (Note 5) |
20,150,568 | 8,315,593 | ||||
| CONSTRUCTION IN PROGRESS |
21,384 | 6,622,501 | ||||
| INTANGIBLE ASSETS (Note 8) |
979,738 | 1,112,904 | ||||
| 21,151,690 | 16,050,998 | |||||
| OTHER ASSETS |
||||||
| Deferred taxes (Note 12) |
110,936 | — | ||||
| Deferred expenses |
— | 18,770 | ||||
| 110,936 | 18,770 | |||||
| TOTAL ASSETS |
$ | 119,805,825 | $ | 100,186,273 | ||
The accompanying notes are an integral part of the consolidated financial statements
38
Table of Contents
HQ SUSTAINABLE MARITIME INDUSTRIES, INC. AND SUBSIDIARIES
(INCORPORATED IN THE STATE OF DELAWARE
WITH LIMITED LIABILITY)
CONSOLIDATED BALANCE SHEETS
AS OF DECEMBER 31, 2009 AND 2008
| 2009 | 2008 | |||||
| LIABILITIES AND STOCKHOLDERS’ EQUITY |
||||||
| CURRENT LIABILITIES: |
||||||
| Accounts payable and accrued liabilities (Note 9) |
$ | 6,770,470 | $ | 5,787,514 | ||
| Taxes payable |
566,054 | 823,382 | ||||
| Due to directors (Note 10) |
— | 698,429 | ||||
| Derivative liabilities (Note 13) |
445,694 | — | ||||
| Current portion of promissory notes (Note 25) |
— | 4,603,920 | ||||
| TOTAL CURRENT LIABILITIES |
7,782,218 | 11,913,245 | ||||
| COMMITMENTS AND CONTINGENCIES (Note 18) |
||||||
| SHAREHOLDERS’ EQUITY |
||||||
| Preferred stock, $0.001 par value, 10,000,000 shares authorized, 100,000 shares issued and outstanding |
100 | 100 | ||||
| Common stock, $0.001 par value, 200,000,000 shares authorized, 14,681,002 and 12,085,846 shares issued and outstanding as of December 31, 2009 and December 31, 2008 respectively |
14,681 | 12,086 | ||||
| Additional paid-in capital |
79,281,209 | 61,572,410 | ||||
| Accumulated other comprehensive income |
9,508,756 | 9,615,956 | ||||
| Retained earnings |
15,737,809 | 10,510,961 | ||||
| Appropriation of retained earnings (reserves) (Note 14) |
7,481,052 | 6,561,515 | ||||
| TOTAL SHAREHOLDERS’ EQUITY |
112,023,607 | 88,273,028 | ||||
| TOTAL LIABILITIES AND SHAREHOLDERS’ EQUITY |
$ | 119,805,825 | $ | 100,186,273 | ||
The accompanying notes are an integral part of the consolidated financial statements
39
Table of Contents
HQ SUSTAINABLE MARITIME INDUSTRIES, INC. AND SUBSIDIARIES
(INCORPORATED IN THE STATE OF DELAWARE
WITH LIMITED LIABILITY)
CONSOLIDATED STATEMENTS OF INCOME AND COMPREHENSIVE INCOME
FOR THE YEARS ENDED DECEMBER 31, 2009, 2008 AND 2007
| 2009 | 2008 | 2007 | ||||||||||
| Sales |
$ | 72,292,011 | $ | 67,723,283 | $ | 54,970,211 | ||||||
| Cost of sales |
42,096,207 | 40,594,188 | 30,360,523 | |||||||||
| Gross profit |
30,195,804 | 27,129,095 | 24,609,688 | |||||||||
| Selling and distribution expenses |
1,393,367 | 1,550,860 | 841,263 | |||||||||
| Marketing and advertising |
7,487,170 | 4,426,378 | 5,162,299 | |||||||||
| General and administrative expenses |
6,768,467 | 6,205,993 | 4,800,361 | |||||||||
| Depreciation and amortization |
335,917 | 388,201 | 283,679 | |||||||||
| Doubtful accounts (Recovery) |
3,114,387 | (491,223 | ) | 672,086 | ||||||||
| Income from operations |
11,096,496 | 15,048,886 | 12,850,000 | |||||||||
| Finance costs |
1,097,410 | 2,662,734 | 5,857,117 | |||||||||
| Fair value change in derivative financial instruments (note 13) |
(678,378 | ) | — | — | ||||||||
| Other expense (income) |
364,472 | (567,876 | ) | (42,491 | ) | |||||||
| Income before income taxes |
10,312,992 | 12,954,028 | 7,035,374 | |||||||||
| Income taxes |
||||||||||||
| Current |
2,323,812 | 2,094,976 | 2,548,812 | |||||||||
| Deferred |
(110,951 | ) | 818,364 | — | ||||||||
| Net income attributable to shareholders |
8,100,131 | 10,040,688 | 4,486,562 | |||||||||
| OTHER COMPREHENSIVE INCOME |
||||||||||||
| Foreign currency translation income |
(107,200 | ) | 5,025,896 | 2,977,694 | ||||||||
| COMPREHENSIVE INCOME |
$ | 7,992,931 | $ | 15,066,584 | $ | 7,464,256 | ||||||
| NET INCOME PER SHARE |
||||||||||||
| Basic |
$ | 0.616 | $ | 0.843 | $ | 0.587 | ||||||
| Diluted |
$ | 0.596 | $ | 0.785 | $ | 0.543 | ||||||
| WEIGHTED AVERAGE COMMON SHARES OUTSTANDING |
||||||||||||
| Basic |
13,154,320 | 11,905,739 | 7,635,124 | |||||||||
| Diluted |
13,397,342 | 13,198,438 | 8,989,469 | |||||||||
The accompanying notes are an integral part of the consolidated financial statements
40
Table of Contents
HQ SUSTAINABLE MARITIME INDUSTRIES, INC. AND SUBSIDIARIES
(INCORPORATED IN THE STATE OF DELAWARE
WITH LIMITED LIABILITY)
CONSOLIDATED STATEMENTS OF STOCKHOLDERS’ EQUITY
FOR THE YEARS ENDED DECEMBER 31, 2009, 2008 AND 2007
| Common Stock | Preferred Stock | Additional paid in Capital |
||||||||||||
| Share | Par Value | Share | Par Value | |||||||||||
| Balance at January 1, 2007 |
6,416,856 | $ | 6,417 | 100,000 | $ | 100 | $ | 25,441,626 | ||||||
| Issuance of common stock and warrants |
5,094,461 | 5,094 | — | — | 31,700,578 | |||||||||
| Net income for the year |
— | — | — | — | — | |||||||||
| Transfer to reserve |
— | — | — | — | — | |||||||||
| Balance at December 31, 2007 |
11,511,317 | $ | 11,511 | 100,000 | $ | 100 | $ | 57,142,204 | ||||||
| Issuance of common stock and warrants |
574,529 | 575 | — | — | 4,430,206 | |||||||||
| Net income for the year |
— | — | — | — | — | |||||||||
| Transfer to reserve |
— | — | — | — | — | |||||||||
| Balance at December 31, 2008 |
12,085,846 | $ | 12,086 | 100,000 | $ | 100 | $ | 61,572,410 | ||||||
| Cumulative effect of change in accounting principles (Note 13) |
— | — | — | — | (2,449,493 | ) | ||||||||
| Issuance of common stock and warrants |
2,595,156 | 2,595 | — | — | 20,158,292 | |||||||||
| Net income for the year |
— | — | — | — | — | |||||||||
| Transfer to reserve |
— | — | — | — | — | |||||||||
| Balance at December 31, 2009 |
14,681,002 | $ | 14,681 | 100,000 | $ | 100 | $ | 79,281,209 | ||||||
41
Table of Contents
HQ SUSTAINABLE MARITIME INDUSTRIES, INC. AND SUBSIDIARIES
(INCORPORATED IN THE STATE OF DELAWARE
WITH LIMITED LIABILITY)
CONSOLIDATED STATEMENTS OF STOCKHOLDERS’ EQUITY
FOR THE YEARS ENDED DECEMBER 31, 2009, 2008 AND 2007
| Appropriation of retained earnings (reserves) |
Accumulated other comprehensive income |
Retained earnings (deficit) |
Total | ||||||||||||
| Balance at January 1, 2007 |
$ | 3,229,072 | $ | 1,612,366 | $ | (683,846 | ) | $ | 29,605,735 | ||||||
| Issuance of common stock and warrants |
— | — | — | 31,705,672 | |||||||||||
| Net income for the year |
— | — | 4,486,562 | 4,486,562 | |||||||||||
| Transfer to reserve |
1,428,891 | — | (1,428,891 | ) | — | ||||||||||
| Foreign currency translation adjustment |
— | 2,977,694 | — | 2,977,694 | |||||||||||
| Balance at December 31, 2007 |
$ | 4,657,963 | $ | 4,590,060 | $ | 2,373,825 | $ | 68,775,663 | |||||||
| Issuance of common stock and warrants |
— | — | — | 4,430,781 | |||||||||||
| Net income for the year |
— | — | 10,040,688 | 10,040,688 | |||||||||||
| Transfer to reserve |
1,903,552 | — | (1,903,552 | ) | — | ||||||||||
| Foreign currency translation adjustment |
— | 5,025,896 | — | 5,025,896 | |||||||||||
| Balance at December 31, 2008 |
$ | 6,561,515 | $ | 9,615,956 | $ | 10,510,961 | $ | 88,273,028 | |||||||
| Cumulative effect of change in accounting principles (Note 13) |
— | — | (1,953,746 | ) | (4,403,239 | ) | |||||||||
| Issuance of common stock and warrants |
— | — | — | 20,160,887 | |||||||||||
| Net income for the year |
— | — | 8,100,131 | 8,100,131 | |||||||||||
| Transfer to reserve |
919,537 | — | (919,537 | ) | — | ||||||||||
| Foreign currency translation adjustment |
— | (107,200 | ) | — | (107,200 | ) | |||||||||
| Balance at December 31, 2009 |
$ | 7,481,052 | $ | 9,508,756 | $ | 15,737,809 | $ | 112,023,607 | |||||||
The accompanying notes are an integral part of the consolidated financial statements
42
Table of Contents
HQ SUSTAINABLE MARITIME INDUSTRIES, INC. AND SUBSIDIARIES
(INCORPORATED IN THE STATE OF DELAWARE
WITH LIMITED LIABILITY)
CONSOLIDATED STATEMENTS OF CASH FLOWS
FOR THE YEARS ENDED DECEMBER 31, 2009, 2008 AND 2007
| 2009 | 2008 | 2007 | ||||||||||
| OPERATING ACTIVITIES |
||||||||||||
| Net income |
$ | 8,100,131 | $ | 10,040,688 | $ | 4,486,562 | ||||||
| Non-cash items: |
||||||||||||
| Depreciation and amortization |
1,442,895 | 1,456,456 | 1,217,284 | |||||||||
| Loss/(gain) on disposal of property, plant & equipment |
446,598 | (491,253 | ) | 53,603 | ||||||||
| Write off of property, plant & equipment |
— | — | 41,637 | |||||||||
| Financial and other non cash services |
1,327,330 | 3,032,822 | 5,164,795 | |||||||||
| Deferred income taxes |
(110,953 | ) | 818,362 | — | ||||||||
| Fair value change in derivative financial instruments |
(678,378 | ) | — | — | ||||||||
| Change in non-cash working capital items: |
||||||||||||
| Inventories |
(1,164,186 | ) | (76,042 | ) | (168,858 | ) | ||||||
| Trade receivables, net of provisions |
(30,492,188 | ) | (656,094 | ) | (7,276,981 | ) | ||||||
| Prepayments |
(747,028 | ) | (44,576 | ) | 34,577 | |||||||
| Tax recoverable |
||||||||||||
| Accounts payable and accrued expenses |
964,546 | (1,329,386 | ) | 5,113,418 | ||||||||
| Taxes payable |
(270,815 | ) | (166,708 | ) | 624,860 | |||||||
| Cash flow (used in)/generated from operating activities |
(21,182,048 | ) | 12,584,269 | 9,290,897 | ||||||||
| INVESTING ACTIVITIES |
||||||||||||
| Acquisition of property, plant and equipment-net |
(6,969,607 | ) | (1,310,683 | ) | (745,546 | ) | ||||||
| Sale proceeds of disposal of property, plant & equipment |
22,165 | 495,449 | — | |||||||||
| Construction in progress |
(21,388 | ) | (5,398,904 | ) | (634,905 | ) | ||||||
| Cash flow used in investing activities |
(6,968,830 | ) | (6,214,138 | ) | (1,380,451 | ) | ||||||
| FINANCING ACTIVITIES |
||||||||||||
| Net cash proceeds from issuance of common stock |
10,774,720 | 137,536 | 28,570,475 | |||||||||
| Convertible promissory notes issued, net of cash repayments |
— | — | — | |||||||||
| Due (to)/from directors |
(708,220 | ) | (845,921 | ) | (153,915 | ) | ||||||
| Repayment to related parties |
— | — | (198,553 | ) | ||||||||
| Bank loan payments |
— | — | (1,255,203 | ) | ||||||||
| Cash flow (used in)/generated from financing activities |
10,066,500 | (708,385 | ) | 26,962,804 | ||||||||
| NET CHANGE IN CASH AND CASH EQUIVALENTS |
(18,084,378 | ) | 5,661,746 | 34,873,250 | ||||||||
| EFFECT OF EXCHANGE RATE CHANGES ON CASH AND CASH EQUIVALENTS |
121,133 | 2,298,894 | 697,283 | |||||||||
| Cash and cash equivalents, beginning of year |
54,920,548 | 46,959,908 | 11,389,375 | |||||||||
| Cash and cash equivalents, end of year |
$ | 36,957,303 | $ | 54,920,548 | $ | 46,959,908 | ||||||
| SUPPLEMENTARY CASH FLOWS DISCLOSURES |
||||||||||||
| Interest paid |
— | — | — | |||||||||
| Taxes paid |
$ | 2,580,697 | $ | 2,263,701 | $ | 1,155,429 | ||||||
| SUPPLEMENTARY DISCLOSURE OF NON-CASH INVESTING AND FINANCING ACTIVITIES |
||||||||||||
| Common shares issued for services |
$ | 725,425 | $ | 4,425,432 | $ | 173,000 | ||||||
| Reclassification of Construction in Progress to Land Use Rights |
$ | — | $ | — | $ | 964,002 | ||||||
43
Table of Contents
HQ SUSTAINABLE MARITIME INDUSTRIES, INC. AND SUBSIDIARIES
NOTES TO THE CONSOLIDATED FINANCIAL STATEMENTS
FOR THE YEARS ENDED DECEMBER 31, 2009 AND 2008
NOTE 1 – ORGANIZATION AND PRINCIPAL ACTIVITIES
Our company was initially incorporated on September 21, 1989 under the laws of the State of Nevada. On March 17, 2004, Process Equipment, Inc., Process Equipment Acquisition Corporation, a Nevada corporation and wholly-owned subsidiary of Process Equipment, Inc., or PEAC, and Jade Profit Investment Limited, or Jade, a British Virgin Islands limited liability corporation, entered into an agreement and plan of merger with us. Pursuant to that agreement, Process Equipment, Inc., through PEAC, acquired Jade, and 84.42% ownership in Jade’s subsidiary Hainan Quebec Ocean Fishing Co. Ltd, a People’s Republic of China, limited liability corporation, which we refer to as HQOF. As a result of that transaction, HQOF became our main operating subsidiary. In April of 2004, pursuant to the above agreement and plan of merger, the board of directors of Process Equipment, Inc. and a majority of the stockholders approved a name change and change of domicile of that company to Delaware via a merger with the newly formed wholly-owned Delaware subsidiary, HQS. The name change, change of domicile and merger became effective on May 19, 2004, with HQS being the surviving entity in the merger and acquiring all the assets and liabilities of Process Equipment, Inc. On August 17, 2004, we entered into a Purchase Agreement with Sino-Sult Canada (S.S.C.) Limited, a Canadian limited liability corporation (“SSC”), whereby we acquired Sealink Wealth Limited (“Sealink”), SSC’s wholly owned subsidiary incorporated in the British Virgin Islands. Sealink is the sole owner of Hainan Jiahua Marine Bio-Products Co. Ltd., a limited liability company existing in China (“Jiahua Marine”) which is primarily engaged in the production and sales of marine bio-products and healthcare products in the PRC, as described in more detail in this current report.
Further, as previously disclosed in the above current report, effective August 17, 2004, HQS caused Jade Profit Investment Limited, its wholly-owned subsidiary, to acquire the minority equity interest equal to 15.58% that Jade did not already own in Hainan Quebec Ocean Fishing Company Limited, HQS’s principal operating subsidiary. This purchase was effected by Jade pursuant to the Purchase Agreement, dated as of August 17, 2004, between Jade and Hainan Fuyuan Investment Company Limited, the holder of the minority equity interest of HQOF being acquired by Jade. Jade has previously obtained all requisite governmental approvals in the PRC in order to consummate this transaction.
The Group is principally engaged in the vertically integrated business of aquaculture through cooperative supply agreements, ocean product harvesting, and processing and sales of farm-bred and ocean harvested aquatic products. The principal products of HQOF are cross-bred hybrid of tilapia and white-legged shrimp, which are exported, directly and indirectly, to the United States, Canada, Japan and European countries. The major market is for export.
The Group is also engaged in the production and sales of marine bio-products and healthcare products in the PRC. The principal products of Jiahua Marine Bio-Product Company Limited (100% held subsidiary of Sealink) are Shark Cartilage Capsule, Shark Liver Oil and Shark Liver (Soft gel). The major market is domestic in the PRC.
NOTE 2 – BASIS OF PRESENTATION
The consolidated financial statements include the accounts of HQS and all its subsidiaries (“The Group”). All material inter-company accounts and transactions have been eliminated. The consolidated financial statements are prepared in accordance with generally accepted accounting principles used in the United States of America.
On July 1, 2009, the Company adopted Financial Accounting Standards Board (“FASB”) Accounting Standards Codification (“ASC”) 105-10 (formerly Statement of Financial Accounting Standards (“SFAS”) No. 168, The FASB Accounting Standards Codification and Hierarchy of Generally Accepted Accounting Principles, a replacement of FASB Statement No. 162 ). ASC 105-10 establishes the FASB ASC as the source of authoritative accounting principles recognized by the FASB to be applied in preparation of financial statements in conformity with generally accepted accounting principles in the United States of America. The adoption of this standard had no impact on the Company’s consolidated financial statements.
NOTE 3 – ACCOUNTING POLICIES
A. CASH AND CASH EQUIVALENTS
The Group considers cash and cash equivalents to include cash on hand and demand deposits with banks with an original maturity of three months or less.
B. INVENTORIES
Inventories are stated at the lower of cost and net realizable value. Cost is calculated on the weighted average basis and includes all costs to acquire and other costs incurred in bringing the inventories to their present location and condition. The Company evaluates the net realizable value of its inventories on a regular basis and records a provision for loss to reduce the computed weighted average cost if it exceeds the net realizable value.
44
Table of Contents
C. CONSTRUCTION IN PROGRESS
Construction in progress represents buildings under construction and plant and equipment pending installation as of December 31, 2009 and 2008, and is stated at cost. Cost includes construction of buildings, acquisitions and installation of equipment, and interest charges arising from borrowings used to finance assets during the period of construction or installation and testing. No provision for depreciation is made on assets under construction until such time as the relevant assets are completed and ready for their intended commercial use.
D. LONG-LIVE ASSETS
The Company has adopted ASC 360 formerly SFAS 144, “Accounting for the Impairment or Disposal of Long-lived Assets”. Property, plant and equipment and intangible assets are reviewed periodically for impairment losses whenever events or changes in circumstances indicate that the carrying amount of an asset may not be fully recoverable. If required, an impairment loss is recognized as the difference between the carrying value and the fair value of the assets.
In January 2002, the Company adopted ASC 350, “Intangibles – Goodwill and Other”, impairment of long-lived assets is monitored on a continuing basis, and is assessed based on the undiscounted cash flows generated by the underlying assets. In the event that the carrying amount of long-lived assets exceeds the undiscounted future cash flows, then the carrying amount of such assets is adjusted to their fair value.
E. PROPERTY, PLANT AND EQUIPMENT
Property, plant and equipment are carried at cost. The cost of repairs and maintenance is expensed as incurred; major replacements and improvements are capitalized. When assets are retired or disposed of, the cost and accumulated depreciation are removed from the accounts, and any resulting gains or losses are included in income in the year of disposition. Depreciation is calculated on a straight-line basis over the estimated useful life of the assets. The percentages applied are:
| Buildings and leasehold improvement |
10 – 40 years | |
| Plant and machinery |
5 – 10 years | |
| Motor vehicles |
5 – 10 years | |
| Office equipment and furnishings |
5 – 10 years |
F. FAIR VALUE OF FINANCIAL INSTRUMENTS
The carrying value of financial instruments including cash, receivables, accounts payable and accrued expenses and debt, approximates their fair value at December 31, 2009 and 2008 due to the relatively short-term nature of these instruments.
G. INCOME TAXES
Taxes are calculated in accordance with taxation principles currently effective in the PRC. The Company accounts for income taxes using the liability method. Deferred tax assets and liabilities are recognized for the future tax consequences attributable to differences between the financial statement carrying amounts of existing assets and liabilities and their respective tax bases. Deferred tax assets and liabilities are measured using enacted tax rates expected to apply to taxable income in the years in which those temporary differences are expected to be recovered or settled. The effect on deferred tax assets and liabilities of a change in tax rates is recognized as income in the period that includes the enactment date. A valuation allowance is provided for the amount of deferred tax assets that, based on available evidence, are not expected to be realized.
H. RELATED PARTIES
Parties are considered to be related if one party has the ability, directly or indirectly, to control the other party or exercise significant influence over the other party in making financial and operational decisions. Parties are also considered to be related if they are subject to common control or common significant influence. Related parties may be individuals or corporate entities. The Company conducts business with several related parties in the ordinary course of business. All transactions have been recorded at fair market value of the goods or services exchanged.
45
Table of Contents
I. FOREIGN CURRENCY TRANSLATION
We follow FASB ASC 830-30, “Foreign Currency Translation”, for both the translation and re-measurement of balance sheet and income statement items into U.S. dollars. Resulting translation adjustments are reported as a separate component of accumulated comprehensive income (loss) in stockholders’ equity.
The Group maintains its books and accounting records in Renminbi (“RMB”), the PRC’s currency, being the functional currency. Transactions denominated in foreign currencies are translated into the functional currency at the exchange rates prevailing on the transaction dates. Assets and liabilities denominated in foreign currencies are translated into the functional currency at the exchange rates prevailing at the balance sheet date. Any translation gains (losses) are recorded in exchange reserve as a component of shareholders’ equity. Income and expenditures are translated at the average exchange rate of the year
| 2009 | 2008 | 2007 | ||||
| Year-end RMB : US$ exchange rate |
6.8280 | 6.8240 | 7.3046 | |||
| Average RMB : US$ exchange rate |
6.8270 | 7.0643 | 7.5603 |
On January 1, 1994, the PRC government introduced a single rate of exchange as quoted daily by the People’s Bank of China (the “Unified Exchange Rate”). The quotation of the exchange rates does not imply free convertibility of RMB to other foreign currencies. All foreign exchange transactions continue to take place either through the Bank of China or other banks authorized to buy and sell foreign currencies at the exchange rates quoted by the People’s Bank of China. Approval of foreign currency payments by the Bank of China or other institutions requires submitting a payment application form together with supplier’s invoices, shipping documents and signed contracts.
Commencing from July 21, 2005, China has adopted a managed floating exchange rate regime based on market demand and supply with reference to a basket of currencies. The exchange rate of the US dollar against the RMB was adjusted from approximately RMB 8.28 per US dollar to approximately RMB 8.11 per US dollar on July 21, 2005. Since then, the PBOC administers and regulates the exchange rate of US dollar against RMB taking into account demand and supply of RMB, as well as domestic and foreign economic and financial conditions.
J. USE OF ESTIMATES
The preparation of financial statements in conformity with generally accepted accounting principles in the United States of America requires management to make estimates and assumptions that affect the reported amounts of assets and liabilities and disclosure of contingent assets and liabilities at the date of the financial statements, and the reported amounts of revenue and expenses during the reporting period including allowance for doubtful accounts, inventory provision, income taxes, derivative liability and stock-based compensation. Actual results when ultimately realized could differ from those estimates.
K. REVENUE RECOGNITION
The Company recognizes revenue when the significant risks and rewards of ownership have been transferred to the customer, including factors such as when persuasive evidence of an arrangement exists, delivery has occurred, the sales price is fixed and determinable, and collectibility is probable. The Company recognizes sales when the merchandise is shipped, title has passed to the customers and collectibility is reasonably assured.
L. EMPLOYEES’ BENEFITS
Mandatory contributions are made to the Government’s health, retirement benefit and unemployment schemes at the statutory rates in force during the period, based on gross salary payments. The cost of these payments is charged to the statement of income in the same period as the related salary cost.
46
Table of Contents
M. SEGMENTS
No geographical segment analysis is provided for the years ended December 31, 2009, 2008 and 2007 as less than 10% of consolidated revenues and less than 10% of consolidated income from operations is attributable to the segment other than the Mainland China.
Segment information is consistent with how management reviews the businesses, makes investing and resource allocation decisions and assesses operating performance. The segment data presented reflects this segment structure. The Company reports financial and operating information in the following three business segments: aquaculture product, health & bio-product and feed product.
Selected information in the segment structure is presented in the following tables for the years ended December 31, 2009, 2008 and 2007:
Business Segment for the year ended December 31, 2009
| Aquaculture Product |
Health and Bio-product |
Feed Product |
Unallocated Items |
Consolidation | ||||||||||||||||
| Sales to external customers |
$ | 45,530,359 | $ | 25,489,046 | $ | 1,272,606 | $ | — | $ | 72,292,011 | ||||||||||
| Cost of sales |
34,481,063 | 6,350,680 | 1,264,464 | — | 42,096,207 | |||||||||||||||
| Gross profit |
11,049,296 | 19,138,366 | 8,142 | — | 30,195,804 | |||||||||||||||
| Selling and distribution expenses |
688,678 | 690,377 | 14,312 | — | 1,3993,367 | |||||||||||||||
| Marketing and advertising |
— | 7,485,565 | — | 1,605 | 7,487,170 | |||||||||||||||
| General and administrative expenses |
789,862 | 591,157 | 375,927 | 5,011,521 | 6,768,467 | |||||||||||||||
| Depreciation and amortization |
17,700 | 110,129 | 80,133 | 127,955 | 335,917 | |||||||||||||||
| Doubtful accounts |
163,858 | 2,923,367 | 27,162 | — | 3,114,387 | |||||||||||||||
| Finance costs |
(60,513 | ) | (73,406 | ) | (3,736 | ) | 1,235,065 | 1,097,410 | ||||||||||||
| Fair value change in derivative financial instruments |
— | — | — | (678,378 | ) | (678,378 | ) | |||||||||||||
| Income/(loss) before income taxes |
9,091,826 | 7,416,888 | (485,654 | ) | (5,710,068 | ) | 10,312,992 | |||||||||||||
| Income taxes |
— | 2,212,861 | — | — | 2,212,861 | |||||||||||||||
| Net Income/(loss) for the year |
$ | 9,091,826 | $ | 5,204,027 | $ | (485,654 | ) | $ | (5,710,068 | ) | $ | 8,100,131 | ||||||||
| Segment assets |
$ | 54,814,916 | $ | 38,077,803 | $ | 23,250,508 | $ | 3,662,598 | $ | 119,805,825 | ||||||||||
| Segment liabilities |
$ | 2,575,786 | $ | 2,482,090 | $ | 364,838 | $ | 2,359,504 | $ | 7,782,218 | ||||||||||
Business Segment for the year ended December 31, 2008
| Aquaculture Product |
Health and Bio-product |
Unallocated Items |
Consolidation | |||||||||
| Sales to external customers |
$ | 45,370,400 | $ | 22,352,883 | $ | — | $ | 67,723,283 | ||||
| Cost of sales |
34,648,017 | 5,946,171 | — | 40,594,188 | ||||||||
| Gross profit |
10,722,383 | 16,406,712 | — | 27,129,095 | ||||||||
47
Table of Contents
| Aquaculture Product |
Health and Bio-product |
Unallocated Items |
Consolidation | |||||||||||||
| Selling and distribution expenses |
872,589 | 678,271 | — | 1,550,860 | ||||||||||||
| Marketing and advertising |
— | 4,426,378 | — | 4,426,378 | ||||||||||||
| General and administrative expenses |
855,546 | 562,794 | 4,787,653 | 6,205,993 | ||||||||||||
| Depreciation and amortization |
23,557 | 107,157 | 257,487 | 388,201 | ||||||||||||
| (Recovery of)/doubtful account |
(498,681 | ) | 7,458 | — | (491,223 | ) | ||||||||||
| Finance costs |
(40,667 | ) | (152,747 | ) | 2,856,148 | 2,662,734 | ||||||||||
| Income/(loss) before income taxes |
10,320,298 | 10,785,850 | (8,152,120 | ) | 12,954,028 | |||||||||||
| Income taxes |
864,279 | 2,049,061 | — | 2,913,340 | ||||||||||||
| Net Income/(loss) for the year |
$ | 9,456,019 | $ | 8,736,789 | $ | (8,152,120 | ) | $ | 10,040,688 | |||||||
| Segment assets |
$ | 49,054,644 | $ | 36,026,012 | $ | 15,105,617 | $ | 100,186,273 | ||||||||
| Segment liabilities | $ | 2,541,594 | $ | 2,271,766 | $ | 7,099,885 | $ | 11,913,245 | ||||||||
Business Segment for the year ended December 31, 2007
| Aquaculture Product |
Health and Bio-product |
Unallocated Items |
Consolidation | |||||||||||
| Sales to external customers |
$ | 36,248,437 | $ | 18,721,774 | $ | — | $ | 54,970,211 | ||||||
| Cost of sales |
27,051,668 | 3,308,855 | — | 30,360,523 | ||||||||||
| Gross profit |
9,196,769 | 15,412,919 | — | 24,609,688 | ||||||||||
| Selling and distribution expenses |
371,939 | 469,324 | — | 841,263 | ||||||||||
| Marketing and advertising |
— | 5,162,299 | — | 5,162,299 | ||||||||||
| General and administrative expenses |
856,068 | 237,655 | 3,706,638 | 4,800,361 | ||||||||||
| Depreciation and amortization |
(16,963 | ) | 84,176 | 216,466 | 283,679 | |||||||||
| Doubtful accounts |
664,873 | 5,644 | 1,569 | 672,086 | ||||||||||
| Finance costs |
1,717 | 112,937 | 5,742,463 | 5,857,117 | ||||||||||
| Income/(loss) before income taxes |
7,478,613 | 9,380,535 | (9,823,774 | ) | 7,035,374 | |||||||||
| Income taxes |
1,179,309 | 1,395,600 | (26,097 | ) | 2,548,812 | |||||||||
| Net Income/(loss) for the year |
$ | 6,299,304 | $ | 7,984,935 | $ | (9,797,677 | ) | $ | 4,486,562 | |||||
| Segment assets |
$ | 34,238,892 | $ | 25,076,495 | $ | 25,011,479 | $ | 84,326,866 | ||||||
| Segment liabilities |
$ | 4,208,988 | $ | 1,965,657 | $ | 9,376,558 | $ | 15,551,203 | ||||||
N. COMPREHENSIVE INCOME
The Group has adopted ASC 220 formerly SFAS 130, “Reporting of Comprehensive Income.” ASC 220 establishes standards for the reporting and display of comprehensive income, its components and accumulated balances in a full set of general-purpose financial statements. ASC 220 defines comprehensive income to include all changes in equity except those resulting from investments by owners and distributions to owners, including adjustments to minimum pension liabilities, accumulated foreign currency translation, and unrealized gains or losses on marketable securities.
O. CONCENTRATION OF CREDIT RISK
Financial instruments that potentially subject the Company to significant concentrations of credit risk consist primarily of trade accounts receivable. The Company performs ongoing credit evaluations with respect to the financial condition of its customers, but does not require collateral. In order to determine the value of the Company’s accounts receivable, the Company records a provision for doubtful accounts to cover probable credit losses. Management reviews and adjusts this allowance periodically based on historical experience and its evaluation of the collectability of outstanding accounts receivable.
P. SHIPPING AND HANDLING COSTS
Handling and shipping costs are classified in cost of sales and in selling and distribution expenses in the income statement and are expensed as incurred.
Q. ADVERTISING COSTS
Advertising costs are expensed as incurred.
R. NET INCOME PER COMMON SHARE
Net income per common share is computed in accordance with ASC 260-10, “Earnings Per Share”. Basic earnings per common share is calculated by dividing income available to common shareholders by the weighted-average number of common shares outstanding for each period. Diluted earnings per common share is calculated by adjusting the weighted-average shares outstanding assuming conversion of all potentially dilutive convertible securities.
S. DEFERRED EXPENSES
Deferred expenses represent the unamortized portion of finders’ fees related to the convertible promissory notes issued in November 2006.
T. INTANGIBLE ASSETS
Intangible assets are recognized if it is probable that the future economic benefits attributable to the assets will flow to the Company, and if the cost of the assets can be measured reliably. After initial recognition, intangible assets are measured at cost less any impairment losses. Intangible assets with definite useful lives are amortized on a straight-line basis over their useful lives.
U. RECENT PRONOUNCEMENTS
In May 2009, FASB issued ASC 855, Subsequent Events, which establishes general standards of for the evaluation, recognition and disclosure of events and transactions that occur after the balance sheet date. Although there is new terminology, the standard is based on the same principles as those that currently exist in the auditing standards. The standard, which includes a new required disclosure of the date through which an entity has evaluated subsequent events, is effective for interim or annual periods ending after June 15, 2009. The adoption of ASC 855 did not have a material effect on the Company’s consolidated financial statements.
48
Table of Contents
In June 2009, the FASB issued guidance now codified as ASC 105, Generally Accepted Accounting Principles as the single source of authoritative accounting principles recognized by the FASB to be applied by nongovernmental entities in the preparation of financial statements in conformity with U.S. GAAP, aside from those issued by the SEC. ASC 105 does not change current U.S. GAAP, but is intended to simplify user access to all authoritative U.S. GAAP by providing all authoritative literature related to a particular topic in one place. The adoption of ASC 105 did not have a material impact on the Company’s consolidated financial statements, but did eliminate all references to pre-codification standards.
In August 2009, FASB issued an amendment to the accounting standards related to the measurement of liabilities that are recognized or disclosed at fair value on a recurring basis. This standard clarifies how a company should measure the fair value of liabilities and that restrictions preventing the transfer of a liability should not be considered as a factor in the measurement of liabilities within the scope of this standard. This standard is effective for the Company on October 1, 2009. The adoption of this amendment did not have a material effect on the Company’s consolidated financial statements.
In October 2009, FASB issued an amendment to the accounting standards related to the accounting for revenue in arrangements with multiple deliverables including how the arrangement consideration is allocated among delivered and undelivered items of the arrangement. Among the amendments, this standard eliminated the use of the residual method for allocating arrangement considerations and requires an entity to allocate the overall consideration to each deliverable based on an estimated selling price of each individual deliverable in the arrangement in the absence of having vendor-specific objective evidence or other third party evidence of fair value of the undelivered items. This standard also provides further guidance on how to determine a separate unit of accounting in a multiple-deliverable revenue arrangement and expands the disclosure requirements about the judgments made in applying the estimated selling price method and how those judgments affect the timing or amount of revenue recognition. This standard, for which the Company is currently assessing the impact, will become effective on January 1, 2011.
In October 2009, the FASB issued an amendment to the accounting standards related to certain revenue arrangements that include software elements. This standard clarifies the existing accounting guidance such that tangible products that contain both software and non-software components that function together to deliver the product’s essential functionality, shall be excluded from the scope of the software revenue recognition accounting standards. Accordingly, sales of these products may fall within the scope of other revenue recognition standards or may now be within the scope of this standard and may require an allocation of the arrangement consideration for each element of the arrangement. This standard, for which the Company is currently assessing the impact, will become effective on January 1, 2011.
In January 2010, the FASB issued an amendment to ASC 505, Equity, where entities that declare dividends to shareholders that may be paid in cash or shares at the election of the shareholders are considered to be a share issuance that is reflected prospectively in EPS, and is not accounted for as a stock dividend. This standard is effective for interim and annual periods ending on or after December 15, 2009 and is to be applied on a retrospective basis. The adoption of this standard is not expected to have a significant impact on the Company’s consolidated financial statements.
In January 2010, the FASB issued an amendment to ASC 820, Fair Value Measurements and Disclosure, to require reporting entities to separately disclose the amounts and business rationale for significant transfers in and out of Level 1 and Level 2 fair value measurements and separately present information regarding purchase, sale, issuance, and settlement of Level 3 fair value measures on a gross basis. This standard, for which the Company is currently assessing the impact, is effective for interim and annual reporting periods beginning after December 15, 2009 with the exception of disclosures regarding the purchase, sale, issuance, and settlement of Level 3 fair value measures which are effective for fiscal years beginning after December 15, 2010.
The Company has implemented all new accounting pronouncements that are in effect and that may impact its financial statements and does not believe that there are any other new accounting pronouncements that have been issued that might have a material impact on its consolidated financial statements.
V. DERIVATIVE FINANCIAL INSTRUMENTS
Upon the adoption of EITF 07-05 “Determining Whether an Instrument (or Embedded Feature) Is Indexed to an Entity’s Own Stock” on January 1, 2009, certain of our financial instruments with “down-round” protection features are no longer considered indexed to our Company’s stock for purposes of determining whether they meet the first part of the scope exception in ASC 815-10-15-74 (pre-Codification SFAS133.11(a)). As such, these instruments no longer meet the conditions to obtain equity classification and are required to be carried as derivative liabilities, at fair value with changes in fair value reflected in our income (loss).
The following table summarizes the components of derivative liabilities as of December 31, 2009:
| Class B Warrants |
$ | 321,188 | |
| Tail Wind Warrants |
124,506 | ||
| Fair values |
$ | 445,694 | |
The following is a list of the common shares indexed to derivative financial instruments as of December 31, 2009:
| Class B Warrants |
114,583 | |
| Tail Wind Warrants |
30,000 | |
| Total number of common shares indexed to derivative instruments |
144,583 | |
W. EMPLOYEE STOCK OPTIONS
The company accounts for stock-based compensation following Accounting Standards Codification (ASC) 718, “Stock Compensation,” which requires recognition of compensation expense for grants of stock, stock options, and other equity instruments, over the vesting periods of such grants, based on the estimated grant-date fair values of those grants. The Company generally uses the straight-line method of amortization for stock-based compensation.
NOTE 4 – TRADE RECEIVABLES
The Group’s trade receivables at December 31, 2009 and 2008 are summarized as follows:
| 2009 | 2008 | |||||
| Trade receivables |
$ | 60,736,950 | $ | 27,175,264 | ||
| Other receivables |
865,490 | 813,271 | ||||
| 61,602,440 | 27,988,535 | |||||
| Less: Provision for doubtful accounts |
3,416,385 | 299,125 | ||||
| Balance at end of year |
$ | 58,186,055 | $ | 27,689,410 | ||
49
Table of Contents
The activity in the Group’s provision for doubtful accounts during the year ended December 31, 2009 and 2008 is summarized as follows:
| 2009 | 2008 | ||||||
| Balance at beginning of year |
$ | 299,125 | $ | 672,558 | |||
| Add/(less): Provision / (recovery) during the year |
3,114,387 | (491,223 | ) | ||||
| Exchange difference transfer to exchange reserve |
2,873 | 117,790 | |||||
| Balance at end of year |
$ | 3,416,385 | $ | 299,125 | |||
NOTE 5 – PROPERTY, PLANT AND EQUIPMENT, NET
| 2009 | 2008 | |||||
| Cost: |
||||||
| Buildings and leasehold improvement |
$ | 10,692,007 | $ | 3,705,261 | ||
| Plant and machinery |
16,629,138 | 11,451,662 | ||||
| Motor vehicles |
230,937 | 217,901 | ||||
| Office equipment and furnishings |
395,461 | 308,691 | ||||
| 27,947,543 | 15,683,515 | |||||
| Less: Accumulated depreciation: |
||||||
| Buildings and leasehold improvement |
894,763 | 691,039 | ||||
| Plant and machinery |
6,611,414 | 6,455,502 | ||||
| Motor vehicles |
140,814 | 53,403 | ||||
| Office equipment and furnishings |
149,984 | 167,978 | ||||
| 7,796,975 | 7,367,922 | |||||
| Property, plant and equipment, net |
$ | 20,150,568 | $ | 8,315,593 | ||
Depreciation expenses relating to property, plant and equipment was $1,309,729 and $1,248,342 for the year ended December 31, 2009 and 2008, respectively.
NOTE 6 – INVENTORIES
The inventories at December 31, 2009 and December 31, 2008 are summarized as follows:
| 2009 | 2008 | |||||
| Raw materials |
$ | 521,798 | $ | 183,232 | ||
| Work-in-progress |
303,643 | 156,416 | ||||
| Finished goods |
1,379,490 | 701,980 | ||||
| $ | 2,204,931 | $ | 1,041,628 | |||
NOTE 7 – PREPAYMENTS
The Group’s prepayment at December 31, 2009 and 2008 are summarized as follows:
| 2009 | 2008 | |||||
| Advances to suppliers |
$ | 784,730 | $ | 322,392 | ||
| Prepaid expenses |
410,180 | 142,527 | ||||
| $ | 1,194,910 | $ | 464,919 | |||
50
Table of Contents
NOTE 8 – INTANGIBLE ASSETS
At December 31, 2009 and 2008, the Group’s intangible assets are comprised of the following:
| 2009 | 2008 | |||||
| Land use rights, at cost |
$ | 1,031,895 | $ | 1,031,895 | ||
| Sales network, at cost |
550,000 | 550,000 | ||||
| Intangible assets, at cost |
1,581,895 | 1,581,895 | ||||
| Less: Accumulated amortization, land use rights |
52,157 | 25,791 | ||||
| Less: Accumulated amortization, sales network |
550,000 | 443,200 | ||||
| Intangible assets, net |
$ | 979,738 | $ | 1,112,904 | ||
LAND USE RIGHTS:
According to the Law in China, the government owns all the land in China. Companies or individuals are authorized to possess and use the land only through land use rights granted by the Chinese government. Land use rights are being amortized using the straight-line method over the lease term of 40 years. The estimated amortization for each of the next five years will be approximately $25,800.
SALES NETWORK:
In 2006, the Company entered into an agreement with an unrelated third party by which it was agreed to purchase a sales network in order for us to develop the American market for our branded seafood products. The cost of the network, established at $550,000, is amortized on a 36 months period, starting in August 2006. At December 31, 2009, it was totally amortized.
NOTE 9 – ACCOUNTS PAYABLE AND ACCRUED LIABILITIES
Accounts payable and accrued liabilities at December 31, 2009 and 2008 are summarized as follows:
| 2009 | 2008 | |||||
| Accounts payables |
$ | 2,302,942 | $ | 1,005,921 | ||
| Other payables |
1,569,666 | 2,735,484 | ||||
| Accrued liabilities |
2,897,862 | 2,046,109 | ||||
| $ | 6,770,470 | $ | 5,787,514 | |||
NOTE 10 – DUE TO DIRECTORS
The net amounts represented at December 31, 2008 were non-interest bearing and are without terms and maturity. They consisted mainly of net advances from shareholders of the Company and were shown in current liabilities. The amounts due to directors of $698,429 was repaid subsequently to December 31, 2008.
NOTE 11 – INCOME TAXES
Deferred tax assets and liabilities are recognized for the future tax consequences attributable to differences between the financial statement carrying amounts of existing assets and liabilities and their respective tax basis. Deferred tax assets and liabilities are measured using enacted tax rates expected to apply to taxable income in the years in which those temporary differences are expected to be recovered or settled. The effect on deferred tax assets and liabilities of a change in tax rates is recognized as income in the period that includes the enactment date. A valuation allowance is provided for the amount of deferred tax assets that, based on available evidence, are not expected to be realized.
The Company’s subsidiaries registered in the PRC are subject to state and local income taxes within the PRC at the applicable tax rates on the taxable income as reported in their PRC statutory financial statements in accordance with the relevant income tax laws applicable to foreign enterprises. On March 17, 2007, a new PRC Enterprise Income Tax Law (EIT) was promulgated and introduced a new uniform tax regime in the PRC. The EIT became effective on January 1, 2008. That new Law provides, amongst other issues, that income derived from processing of fishery products and processing of agricultural products will be exempt from the EIT tax rate. Starting in 2008, HQOF benefits from a “0”% tax rate. Jiahua Marine was subject to a tax rate under the new law, which increased by 2% in 2009 and will increase gradually until it reaches a maximum of 25% in 2012.
The reconciliation of the effective income tax rate of the Company to the statutory income tax rate in the PRC for 2009 is as follows:
| HQOF | Jiahua Marine | |||||
| Statutory tax rate |
0 | % | 20 | % | ||
| Tax holidays and concessions |
— | — | ||||
| Effective tax rate |
0 | % | 20 | % | ||
Income taxes are calculated on a separate entity basis. Currently there is no tax benefit or burden recorded for the United States. The effective income tax rate on a consolidated basis is 22.5%, 16.2% and 36.2% for the years ended December 31, 2009, 2008 and 2007 respectively.
51
Table of Contents
NOTE 12 – DEFERRED TAXES
The deferred tax asset is primarily a result of temporary difference between accounting and tax basis for property, plant and equipment, and other reserves from the company’s operation in the PRC.
At December 31, 2009, the company had estimated U.S. net operating losses (“NOLs”) of approximately $10 million. If not utilized, the NOLs will expire at various times between 2024 and 2029. The benefit from these NOLs has been fully offset by a valuation allowance.
A valuation allowance for NOLs is provided when it is more likely than not that NOLs will not be realized. Realization is dependent upon the generation of future taxable income or the reversal of net operating incomes during the periods in which those NOLs become deductible in the U.S. We consider the history of taxable income in recent years, the projected future taxable income and tax planning strategies to make this assessment.
Deferred taxation is calculated under the liability method in respect of taxation effect arising from all timing differences, which are expected with reasonable probability to crystallize in the foreseeable future.
NOTE 13 – DERIVATIVE LIABILITIES
Effective January 1, 2009, the Company adopted the provisions of Emerging Issues Task Force (EITF) EITF 07-05, Determining Whether an Instrument (or Embedded Feature) is Indexed to an Entity’s Own Stock, (“EITF 07-05”). EITF 07-05 applies to any freestanding financial instruments or embedded features that have the characteristics of a derivative, as defined by SFAS No. 133, “Accounting for Derivative Instruments and Hedging Activities,” and to any freestanding financial instruments that are potentially settled in an entity’s own common stock. As of January 1, 2009, as a result of adopting EITF 07-05, warrants to purchase 409,358 shares of our common stock previously treated as equity pursuant to the derivative treatment exemption were no longer afforded equity treatment. As such, effective January 1, 2009, we were required to reclassify those warrants at their fair value to liabilities. Furthermore, since the promissory notes in the liabilities section carry an embedded conversion feature, this feature was also recognized as a derivative instrument under EITF 07-05. ASC 815 “Derivatives and Hedging” (pre-Codification SFAS133) requires that the fair value of these liabilities be re-measured at the end of every reporting period with the change in value reported in the statement of operations. The difference between the amounts the warrants and the embedded conversion feature were originally recorded in the financials and the fair value of the instruments on January 1, 2009 was considered a cumulative effect of a change in accounting principle and required adjustment to the opening balance of retained earnings in the amount of $1,953,746.
We estimate fair values of derivative financial instruments using various techniques (and combinations thereof) that are considered to be consistent with the objective of measuring fair values. In selecting the appropriate technique, we consider, among other factors, the nature of the instrument, the market risks that it embodies and the expected means of settlement. For less complex derivative instruments, such as free-standing warrants, we generally use the Black-Scholes-Merton (“BSM”) option valuation technique, because it embodies all of the requisite assumptions (including trading volatility, estimated terms, and risk free rates) necessary to fair value these instruments. For complex derivative instruments, such as embedded conversion options embedded in hybrid debt instruments, we generally use the Monte Carlo Simulation (“MCS”) valuation technique because it embodies all of the requisite assumptions (including credit risk, interest-rate risk and exercise/conversion behaviors) that are necessary to fair value these more complex instruments. Estimating fair values of derivative financial instruments requires the development of significant and subjective estimates that may, and are likely to, change over the duration of the instrument with related changes in internal and external market factors. Since derivative financial instruments are initially and subsequently carried at fair values, our income (loss) will reflect the volatility in these estimate and assumption changes.
The following tables summarize the components of derivative liabilities as of December 31, 2009 and the remeasurement date, January 1, 2009:
| December 31, 2009 | Remeasurement date January 1, 2009 |
|||||||
| Embedded conversion feature (a) |
$ | — | $ | (3,521,357 | ) | |||
| Class A Warrants (b) |
— | (62,602 | ) | |||||
| Class B Warrants |
(321,188 | ) | (444,937 | ) | ||||
| Class C Warrants (b) |
— | (160,624 | ) | |||||
| Class D Warrants (b) |
— | (99,461 | ) | |||||
| Tail Wind Warrants |
(124,506 | ) | (114,258 | ) | ||||
| Fair values |
$ | (445,694 | ) | $ | (4,403,239 | ) | ||
| Significant assumptions (or ranges) (BSM) | ||||||||
| Trading market values |
$ | 7.83 | $ | 7.04 | ||||
| Term (years) |
.06-2.46 | 1.04-1.99 | ||||||
| Exercise price |
$ | 5.00-$16.80 | $ | 5.00-$6.00 | ||||
| Volatility |
86.08%-152.88 | % | 88.92% - 96.91 | % | ||||
| Risk-free rate |
.11% - 4.75 | % | .47% - 1.14 | % | ||||
| Significant assumptions (or ranges) (MCS) |
||||||||
| Trading market values |
— | $ | 7.83 | |||||
| Term (years) |
— | .83 | ||||||
| Conversion price |
— | $ | 5.00 | |||||
| Volatility |
— | 112.70%-152.61 | % | |||||
| Interest risk adjusted rate |
— | 4.33%-4.75 | % | |||||
| Credit risk adjusted yield |
— | 12.92 | % | |||||
| (a) | As of the December 31, 2009, the embedded conversion feature had a fair value of zero since the convertible note was fully converted during the year ended December 31, 2009. |
| (b) | As of the December 31, 2009, these warrants had a fair value of zero since they either were exercised or expired during the year ended December 31, 2009. |
The following tables summarize the effects on our income (loss) associated with changes in the fair values of our derivative financial instruments:
| Year Ended December 31, 2009 |
||||
| Embedded conversion feature |
$ | 292,407 | ||
| Class A Warrants |
62,602 | |||
| Class B Warrants |
123,749 | |||
| Class C Warrants |
116,984 | |||
| Class D Warrants |
92,884 | |||
| Tail Wind Warrants |
(10,248 | ) | ||
| $ | 678,378 | |||
ASC 820-10-55-62 Fair Value Measurements and Disclosures (pre Codification FAS No. 157 Fair Value Measurements) provides that for assets and liabilities measured at fair value on a recurring basis using significant unobservable inputs (Level 3) during the period, a reconciliation is required of the beginning and ending balances. The reconciliation of our derivative liabilities measured at fair value on a recurring basis using significant unobservable inputs (Level 3) as of December 31, 2009 is as follows:
| Beginning balance, January 1, 2009 |
$ | (4,403,239 | ) | |
| Total gains or (losses) included in earnings |
678,378 | |||
| Purchases, sales, issuances and settlements, (net) |
3,279,167 | |||
| Ending balance, December 31, 2009 |
$ | (445,694 | ) | |
NOTE 14 – APPROPRIATION OF RETAINED EARNINGS (RESERVES)
The reserves are comprised of the following:
| 2009 | 2008 | |||||
| Statutory surplus reserve |
$ | 6,380,064 | $ | 5,460,527 | ||
| Public welfare reserve |
1,064,042 | 1,064,042 | ||||
| Capital reserve |
36,946 | 36,946 | ||||
| $ | 7,481,052 | $ | 6,561,515 | |||
The reserves are disclosed separately in the statement of changes in equity as appropriation of retained earnings. Pursuant to the relevant laws and regulations of Wholly Owned Foreign Enterprises, the profits of the companies, which are based on their PRC statutory financial statements, are available for distribution in the form of cash dividends after they have satisfied all the PRC tax liabilities, provided for losses of previous years, and made appropriations to reserves, as determined by the board of directors in accordance with the PRC accounting standards and regulations.
As stipulated by the relevant laws and regulations for enterprises operating in the PRC, HQOF and Jiahua Marine (both wholly-owned foreign enterprises) are required to make annual appropriations to two reserves, consisting of the statutory surplus reserve and public welfare reserve. In accordance with the relevant PRC regulations and the articles of association of the respective companies, the companies are required to allocate a certain percentage of their net income, as determined in accordance with the PRC accounting standards applicable to the companies, to the statutory surplus reserve until such reserve reaches 50% of the registered capital of the companies.
Net income as reported in the US GAAP financial statements differs from that reported in the PRC statutory financial statements. In accordance with the relevant laws and regulations in the PRC, profits available for distribution are based on the statutory financial statements. If HQOF has foreign currency available after meeting its operational needs, HQOF may make its profit distributions in foreign currency to the extent foreign currency is available. Otherwise, it is necessary to obtain approval and convert such distributions at an authorized bank.
NOTE 15 – EMPLOYEE STOCK OPTION PLAN
In December 2004, our board of directors ratified grants of non-qualified stock options to purchase shares of our common stock under our Stock Option Plan to some of our executive officers and directors, who qualify as employees for valuation purposes, as well as to several of our employees. The following number of share options and related values are shown after giving effect to the reverse stock split that occurred in January 2007. Each of these new stock options have up to a ten-year term, are subject to the terms and conditions of the Plan, and have an exercise price of $5.60. Specifically, Norbert Sporns, our Chief Executive Officer, President and director, received 25,000 stock options; Lillian Wang, the Chairman of our board of directors, received 25,000 stock options; Harry Wang, our Chief Operating Officer, director and brother of Ms. Wang, received 25,000 stock options; and Fusheng Wang, director (who resigned in 2006) and Honorary Chairman and father of Ms. Wang, received 50,000 stock options. Together, Norbert Sporns, Harry Wang and Lillian Wang also indirectly control the majority of capital stock of HQS. The stock options granted to each of them, as well as to Fusheng Wang, were fully vested when granted. In addition, our Chief Financial Officer, Jean-Pierre Dallaire, received 10,000 stock options. Mr. Dallaire’s options were vested in 2004 as to 50% of the grant, with the remaining 50% vesting as follows: 1/3 on June 16, 2005, 1/3 on June 16, 2006, and the remaining 1/3 on June 16, 2007. Further, at the same date, our board of directors ratified grants of stock options to thirteen other employees of HQS. These stock options were vested then as to 50% of each individual grant, with the remaining 50% vesting as follows: 1/3 on June 16, 2005, 1/3 on June 16, 2006, and the remaining 1/3 on June 16, 2007. In the case of one of the employees, the stock options were fully vested when granted.
52
Table of Contents
Our board of directors believes that these stock option grants will help our company to continue to attract, retain and motivate our employees, directors and executive officers. In connection with these grants, our board of directors reserved 250,000 shares for issuance under the Plan. In addition, pursuant to the provisions of the Plan, our board of directors delegated the full power and authority to administer the Plan, in accordance with its terms, to our Compensation Committee presently consisting of Fred Bild, an independent director, and Daniel Too, also an independent director of HQS.
Information concerning the plan incentive and non-qualified stock options is as follows:
| Options | Exercise Price Per Share | ||||
| December 31, 2007 (Vested) |
63,750 | $ | 5.60 | ||
| Options vested in 2008 |
— | $ | 5.60 | ||
| Options canceled/forfeited in 2008 |
— | ||||
| Options exercised in 2008 |
10,000 | $ | 5.60 | ||
| December 31, 2008 (Vested) |
53,750 | $ | 5.60 | ||
| Options vested in 2009 |
— | $ | — | ||
| Options canceled/forfeited in 2009 |
— | ||||
| Options exercised in 2009 |
$ | — | |||
| December 31, 2009 (Vested) |
53,750 | $ | 5.60 | ||
The table below summarizes information with respect to stock options outstanding as of December 31, 2009:
| Exercise Price |
Options Outstanding | Remaining Contractual Life |
Options Exercisable |
Exercise Price of Exercisable Options | |||||
| $ 5.60 |
53,750 | Up to June 2014 | 53,750 | $ | 5.60 | ||||
The aggregate intrinsic value of the options outstanding as at December 31, 2009 is $77,400. No options were granted in 2008 and 2009.
NOTE 16 – SIGNIFICANT CONCENTRATION
The Group grants credit to its customers, generally on an open account basis. The Group’s five largest customers accounted for 40.6% of the consolidated sales for the year ended December 31, 2009 and they are all related to the aquaculture product segment. At December 31, 2009, approximately 38.4% of trade receivables were from trade transactions with the aforementioned five largest customers.
For the year ended December 31, 2008, the Group’s five largest customers accounted for 38.6% of the consolidated sales for the year. At December 31, 2008, approximately 46.3% of trade receivables were from trade transactions with the aforementioned five largest customers.
NOTE 17 – WARRANTIES
The Group did not incur any warranty costs for both years ended December 31, 2009 and 2008.
53
Table of Contents
NOTE 18 – COMMITMENTS AND CONTINGENCIES
A. CAPITAL COMMITMENTS
As of December 31, 2009, there were capital commitments amounting to $27,812, which were mainly related to the construction work of the feed mill.
B. LEASE COMMITMENTS
The Company has entered into operating leases, for rental of office space and other services, which expire on different dates. The minimum future payments under these commitments for the next five years are as follows:
| 2010 |
$ | 209,115 | |
| 2011 |
53,018 | ||
| 2012 |
53,018 | ||
| 2013 |
53,018 | ||
| 2014 |
39,763 | ||
| Thereafter |
— | ||
| Total |
$ | 407,932 | |
C. LEGAL PROCEEDINGS
We are currently not involved in any litigation that we believe could have a materially adverse effect on our financial condition or results of operations. There is no action, suit, proceeding, inquiry or investigation before or by any court, public board, government agency, self-regulatory organization or body pending or, to the knowledge of the executive officers of our company or any of our subsidiaries, threatened against or affecting our company, our common stock, any of our subsidiaries or of our company’s or our company’s subsidiaries’ officers or directors in their capacities as such, in which an adverse decision could have a material adverse effect.
NOTE 19 – CAPITAL STRUCTURE
Common stock consists of authorized shares of 200,000,000 with a par value of $0.001 per share. Common stock issued and outstanding as of December 31, 2009 and 2008 was 14,681,002 and 12,085,846, respectively.
Preferred stock consists of authorized shares of 10,000,000 with a par value of $0.001 per share. Preferred shares amounting to 100,000 have been designated as Series A preferred stock. The Series A preferred stock is entitled to superior voting rights and is also convertible into common shares.
During the years ended December 31, 2009 and 2008, the Company had the following transactions affecting its common stock:
| 2009 |
Shares issued | Value of Consideration | |||
| To public as part of follow-on offering |
1,408,750 | $ | 10,774,720 | ||
| To suppliers for financial and other services |
133,355 | $ | 725,425 | ||
| To investors for conversion of promissory notes and exercise of warrants |
1,053,051 | $ | 8,660,742 | ||
| Total |
2,595,156 | $ | 20,160,887 | ||
| 2008 |
Shares issued | Value of Consideration | |||
| To suppliers for financial and other services |
415,522 | $ | 4,425,432 | ||
| To investors for exercise of warrants |
157,007 | $ | 5,349 | ||
| Total |
574,529 | $ | 4,430,781 | ||
NOTE 20 – EARNINGS PER SHARE
Basic earnings per share are computed by dividing income available to common shareholders by the weighted-average number of common shares outstanding during the period. Diluted earnings per common share is computed by adjusting the weighted average common shares outstanding assuming conversion of all potentially dilutive convertible securities
The following is a reconciliation of the numerators and the denominators of the basic and diluted earnings per share (EPS) computation at December 31, 2009, 2008 and 2007.
| 2009 | |||||||||
| Income (Numerator) |
Shares (Denominator) |
Per Share Amount | |||||||
| Basic EPS |
|||||||||
| Net income available to common shareholders |
$ | 8,100,131 | 13,154,320 | $ | 0.620 | ||||
| Effect of dilutive securities stock options issued to employees and investors |
(113,501 | ) | 243,022 | — | |||||
| Diluted EPS |
|||||||||
| Net income available to common stockholders plus assumed conversions |
$ | 7,986,630 | 13,397,342 | $ | 0.596 | ||||
| 2008 | ||||||||
| Income (Numerator) |
Shares (Denominator) |
Per Share Amount | ||||||
| Basic EPS |
||||||||
| Net income available to common shareholders |
$ | 10,040,688 | 11,905,739 | $ | 0.84 | |||
| Effect of dilutive securities stock options issued to employees and investors |
325,000 | 1,292,689 | — | |||||
| Diluted EPS |
||||||||
| Net income available to common stockholders plus assumed conversions |
$ | 10,365,688 | 13,198,438 | $ | 0.79 | |||
| 2007 | ||||||||
| Income (Numerator) |
Shares (Denominator) |
Per Share Amount | ||||||
| Basic EPS |
||||||||
| Net income available to common shareholders |
$ | 4,486,562 | 7,635,124 | $ | 0.587 | |||
| Effect of dilutive securities stock options issued to employees and investors |
394,446 | 1,354,345 | — | |||||
| Diluted EPS |
||||||||
| Net income available to common stockholders plus assumed conversions |
$ | 4,881,008 | 8,989,469 | $ | 0.5438 | |||
54
Table of Contents
NOTE 21 – CURRENT VULNERABILITY DUE TO CERTAIN CONCENTRATIONS
The Group faces a number of risks and challenges since its operations are in the PRC. The Group’s operations in the PRC are subject to special considerations and significant risks not typically associated with companies in North America and Western Europe. The Group’s results may be adversely affected by changes in the political and social conditions in the PRC, and by changes in governmental policies with respect to laws and regulations, anti-inflationary measures, currency conversion and remittance abroad, and rates and methods of taxation, among other things.
NOTE 22 – QUARTERLY INFORMATION (UNAUDITED)
The following table contains unaudited quarterly results for the years ended December 31, 2009, 2008 and 2007:
| Quarters Ended | ||||||||||||||
| 31-Mar | 30-Jun | 30-Sep | 31-Dec | |||||||||||
| Year Ended December 31, 2009 |
||||||||||||||
| REVENUES |
$ | 10,840,821 | $ | 16,009,757 | $ | 22,156,867 | $ | 23,284,566 | ||||||
| GROSS PROFIT |
$ | 4,503,183 | $ | 6,562,453 | $ | 9,758,592 | $ | 9,371,576 | ||||||
| NET INCOME |
$ | 1,341,925 | $ | 1,084,736 | $ | 4,047,434 | $ | 1,626,036 | ||||||
| Basic net income per common share |
$ | 0.092 | $ | 0.088 | $ | 0.297 | $ | 0.12 | ||||||
| Diluted net income per common share |
$ | 0.089 | $ | 0.086 | $ | 0.268 | $ | 0.12 | ||||||
| Year Ended December 31, 2008 |
||||||||||||||
| REVENUES |
$ | 9,210,490 | $ | 14,531,487 | $ | 22,470,184 | $ | 21,511,122 | ||||||
| GROSS PROFIT |
$ | 3,646,451 | $ | 4,690,252 | $ | 9,232,080 | $ | 9,560,312 | ||||||
| NET INCOME/(LOSS) |
$ | (1,029,443 | ) | $ | (993,438 | ) | $ | 5,614,682 | $ | 6,448,887 | ||||
| Basic net income/(loss) per common share |
$ | (0.089 | ) | $ | (0.083 | ) | $ | 0.466 | $ | 0.549 | ||||
| Diluted net income/(loss) per common share |
$ | (0.089 | ) | $ | (0.083 | ) | $ | 0.427 | $ | 0.530 | ||||
| Year Ended December 31, 2007 |
||||||||||||||
| REVENUES |
$ | 7,849,730 | $ | 13,660,698 | $ | 15,779,385 | $ | 17,680,398 | ||||||
| GROSS PROFIT |
$ | 2,590,446 | $ | 6,525,333 | $ | 7,739,924 | $ | 7,753,985 | ||||||
| NET INCOME/(LOSS) |
$ | (1,566,495 | ) | $ | 832,081 | $ | 3,453,806 | $ | 1,767,170 | |||||
| Basic net income/(loss) per common share |
$ | (0.23 | ) | $ | 0.110 | $ | 0.436 | $ | 0.2315 | |||||
| Diluted net income/(loss) per common share |
$ | — | $ | 0.102 | $ | 0.378 | $ | 0.1966 | ||||||
NOTE 23 – COMPARATIVE FIGURES
Certain comparative figures have been reclassified to conform with the current year’s presentation.
NOTE 24 – SUBSEQUENT EVENTS
In preparing the consolidated financial statements, the Company has evaluated all subsequent events and transactions for potential recognition or disclosure through the date the consolidated financial statements were issued, and determined there were no subsequent events to report as of that date.
NOTE 25 – CONVERTIBLE PROMISSORY NOTES AND WARRANTS
Effective January 25, 2006, the Company closed on a financing transaction with a group of private investors for an amount of $5,225,000. After deducting commissions and other costs of the offering of $522,500, the Company received net proceeds of $4,702,500. The Notes matured January 25, 2008. The Notes were convertible into shares of the Company’s Common Stock at a per share conversion price at the rate of $6.00 per share of Common Stock. The Company followed EITF 00-27, the issue 98-5 model in recording the convertible notes and warrants in its financial statements. The Notes were accruing interest on the principal amount at a rate per annum of eight percent (8 percent) from January 25, 2006 payable in arrears, subject to the terms and conditions of the Notes, together with principal amount payments, up to January 25, 2008.
One Class A Warrant and one Class B Warrant were issued for each two shares of Common Stock which would be issued on the Closing Date assuming the complete conversion of the Note issued on the Closing Date at the rate of $6.00 per share of Common Stock. The exercise price to acquire a share of Common Stock upon exercise of a Class A or B Warrant shall be $6.00 . The Class A Warrants shall be exercisable until January 25, 2009 (three (3) years after the closing of the financing). The Class B Warrants shall be exercisable until January 25, 2011 (five (5) years after the closing of the financing). The Company also issued certain Finders’ Warrants to purchase 87,083 shares of Common Stock similar to and carrying the same rights as the Class B Warrants issuable to the Investors.
The offer and sale of the securities above were effected in reliance on the exemptions for sales of securities not involving a public offering, as set forth in Rule 506 promulgated under the Securities Act of 1933, as amended (the “Securities Act”) and in Section 4(2) and Section 4(6) of the Securities Act and/or Rule 506 of Regulation D.
The Company evaluated the convertible debt and warrants under the guide EITF 00-19, “Accounting for Derivative Financial Instruments Indexed to, and potentially settled in, a Company’s Own Stock”, with regards to the control over the form of ultimate settlement of the instruments. The Company classified the warrants as equity under the guide EITF 00-19. The related registration statement became effective on June 15, 2006.
Furthermore, effective November 8, 2006, the Company completed another financing transaction with a group of private investors for an amount of $5,000,000, bearing interest at 6.5 percent per annum. The financing consisted of two components: (a) promissory notes of the Company, in the principal aggregate amount of $5,000,000 due November 1, 2009 and (b) warrants registered in the name of each Investor to purchase an aggregate of up to 200,000 shares of our Common Stock. The Notes are convertible into shares of the Company’s $0.001 par value Common Stock at a conversion price of $5.00 per share. The Warrants expire on the fifth (5th) anniversary of the effective date of the reverse stock split. In 2008, 170,000 such warrants were exercised leaving a balance of 30,000 unexercised at December 31, 2008. The exercise price to acquire a share of Common Stock is equal to the Conversion Price under the Notes, currently at the rate of $5.00 per share of Common Stock.
During the year ended December 31, 2009, the convertible notes were fully converted into the Company’s Common Stock.
| ITEM 9. | CHANGES IN AND DISAGREEMENTS WITH ACCOUNTANTS ON ACCOUNTING AND FINANCIAL DISCLOSURE |
None.
| ITEM 9A. | CONTROLS AND PROCEDURES |
As of the end of the period covered by this report, the Company conducted an evaluation, under the supervision and with the participation of the Company’s chief executive officer and chief financial officer, of the effectiveness of the design and operation of the Company’s disclosure controls and procedures as defined in Rule 13a-15(e) and 15d-15(e) under the Securities Exchange Act of 1934, as amended (“Exchange Act”). Based on this evaluation, the Company’s chief executive officer and chief financial officer concluded that as of the end of such period such disclosure controls and procedures were effective to provide reasonable assurance that they were reasonably designed to ensure that information required to be disclosed by the Company in reports it files or submits under the Exchange Act (i) is recorded, processed, summarized and reported within the time period specified in the rules and forms of the Securities and Exchange Commission and (ii) is accumulated and communicated to its management, including its principal executive and principal financial officers, or persons performing similar functions, as appropriate to allow timely decisions regarding required disclosure.
There were no changes in the Company’s internal control over financial reporting (as defined in Rule 13a-15(f) and 15d-15(f) promulgated under the Exchange Act) during the fourth quarter of 2008 that materially affected, or are reasonably likely to materially affect, the Company’s internal control over financial reporting.
Management’s Report on Internal Control over Financial Reporting is set forth in Part II, Item 8 of this Annual Report on Form 10-K.
| ITEM 9B. | OTHER INFORMATION |
None.
55
Table of Contents
PART III
| ITEM 10. | DIRECTORS, EXECUTIVE OFFICERS, PROMOTERS, CONTROL PERSONS AND CORPORATE GOVERNANCE COMPLIANCE WITH SECTION 16(a) OF THE EXCHANGE ACT. |
Executive Officers, Directors and Key Employees
Our executive officers and directors, and their ages and positions as of March 12, 2010 are as follows:
| Name |
Age | Position | ||
| Lillian Wang Li | 53 | Chairman of the Board of Directors and Secretary Secretary and Director | ||
| Norbert Sporns | 56 | Chief Executive Officer, President and Director | ||
| Harry Wang Hua | 47 | Chief Operating Officer and Director | ||
| Jean-Pierre Dallaire | 58 | Chief Financial Officer | ||
| Andrew Intrater | 47 | Independent non-executive Director | ||
| Fred Bild | 74 | Independent non-executive Director | ||
| Kevin M. Fitzsimmons* | 53 | Independent non-executive Director | ||
| Daniel Too | 58 | Independent non-executive Director | ||
| * | Mr. Fitzsimmons was appointed to the Board effective March 8, 2010. Mr. Fitzsimmons succeeded Mr. Joseph I. Emas, who resigned from the Board effective March 8, 2010, for personal reasons. |
Our other key employees and their ages and positions as of March 12, 2010 are as follows:
| Name |
Age | Position | ||
| William Sujian | 40 | International Sales and Compliance Officer | ||
| He Jian Bo | 42 | Manager Finance Department | ||
| Wang Fu Hai | 64 | Chief Production Controller and Engineer | ||
Biographies
Lillian Wang Li—Chairman of Board of Directors and Secretary—Ms. Wang Li is one of our founders, and has served as our Secretary and Chairman of our board of directors since March 2004, when we effected the reverse merger with Process Equipment, Inc. Prior to joining HQS, between June 1994 and March 2004, she worked for SSC where her responsibilities included project development and financing, particularly in relation to China projects using Western technologies. She is responsible for the general administration, strategic planning and financial management of HQS. She has over twenty five years of experience in management of Chinese and Canadian businesses, particularly with respect to financial matters.
Norbert Sporns—Chief Executive Officer, President and Director—Mr. Sporns is one of our founders, and has served as our Chief Executive Officer and President and as a director since March 2004. Prior to joining HQS, between June 1994 and March 2004, he worked for SSC, where he was instrumental in completing Western sourced funding for China projects, as well as interfacing with Western technology providers managing Western supply and systems deployment in China. Mr. Sporns has also served as the Chief Executive Officer of Red Coral Group Limited since February 2003. He has extensive experience in project development and investment consultancy.
Harry Wang Hua—Chief Operating Officer and Director—Mr. Wang Hua is one of our founders, and has served as our Chief Operating Officer and as a director since March 2004. He is responsible for the establishment of the production facilities and their operation at HQS. Mr. Wang also leads our plant management teams and our sales teams. Mr. Wang has over fifteen years of experience in managing startup companies in China and in Canada and also has expertise in training middle managers in China in accordance with Western management standards. Prior to joining HQS, between June 1994 and March 2004, he was a director of SSC, where his primary task was to identify projects in China for which Western technologies and funding were available. Mr. Wang Hua has also served as a director of Red Coral Group Limited since June 1994.
Jean-Pierre Dallaire—Chief Financial Officer and Financial Controller —Mr. Dallaire is our Chief Financial Officer and Financial Controller. Prior to joining HQS in September 2004, he worked for SSC from June 2000 to September 2004, in the position of the Chief Financial Officer. Prior to that, Mr. Dallaire worked for Canada’s largest engineering company, where he was responsible for cash flow projections and financial supervision of projects.
56
Table of Contents
Fred Bild—Independent non-executive Director—Mr. Bild has been a director since June 2004. He is currently a Visiting Professor at the University of Montreal where he has taught since January 1995. For over thirty-six years, Mr. Bild has served as a Canadian diplomat in Ottawa and in various functions at embassies abroad including Cultural Attaché (Tokyo), Economic Counselor and Deputy Chief of Mission (Paris) and Canadian Ambassador to Thailand, China and Mongolia.
Daniel Too—Independent non-executive Director—Mr. Too has been a director since September 2004. He has extensive business experience in Asia and possesses a deep understanding of the business difficulties associated with working in China. He had been the Managing Director of Delta Elevator Far East and until recently Mr. Too also serves as Director of Voker Chemical Paint Limited.
Kevin M. Fitzsimmons—Independent non-executive Director—Dr. Fitsimmons was appointed a director of the Company in March 2010. He has been a professor of environmental science at the University of Arizona, department of soil, water and environmental science since 1981, where his research specialty is tilapia aquaculture. Dr. Fitzsimmons holds degrees (BS and PhD) from University of Arizona and MS from the University of West Florida. He has 30 years experience with tilapia research and development and has assisted the industry’s growth on a global basis. Dr. Fitzsimmons has organized and chaired the last six International Symposia on Tilapia in Aquaculture, the major industry forum on research, production, processing and marketing of tilapia. He has also consulted and assisted with tilapia development for The World Bank, Mexican, Chinese, Indian, Egyptian, Guyanese, and Indonesian governments. Dr. Fitzsimmons was elected and served a term as President of the World Aquaculture Society. As a Fulbright Scholar he spent a sabbatical in Bangkok Thailand where he holds an adjunct professorship at the Asian Institute of Technology. For ten years, the Chinese government has asked Dr. Fitzsimmons to help organize and co-chair the Annual Tilapia Development Conference sponsored by the China Aquatic Products Processing and Marketing Association. He also frequently guest lectures at universities in China. He maintains an active research program with close to $500,000 in annual grant funding with support from the private sector, US government agencies, NGO’s and multi-national groups including World Fish Center, FAO, and Network for Aquaculture Centers in Asia. His books and articles on tilapia farming and biology are widely used in academia and on farm.
Andrew Intrater—Independent non-executive Director— Mr. Intrater has been a director since June 1, 2007. Mr. Intrater is the Chairman and CEO of Columbus Acquisition Corp. and the Chief Executive Officer of Columbus Nova, a private investment firm with offices in New York, Los Angeles, Charlotte and Moscow where he has held this position since Columbus Nova’s inception in January 2000. Columbus Nova manages in excess of $2 billion of investor capital and debt in a variety of credit and private equity businesses. Mr. Intrater also serves as the Senior Managing Partner of Columbus Nova’s investment business, including Columbus Nova Capital and Columbus Nova Opportunity Fund, and is a former Director of Renova Group of companies. Columbus Nova is the U.S.-based affiliate of the Renova Group, one of the largest Russian strategic investors in the metallurgical, oil, machine engineering, mining, chemical, construction, housing & utilities and financial sectors, with net assets of over $9 billion. From 1985 to 2000, Mr. Intrater served as President and Chief Operating Officer of Oryx Technology Corp., and its predecessor, ATI, a leading manufacturer of semi-conductor testing equipment, based in Silicon Valley. Mr. Intrater serves as Chairman of the board of directors of Moscow Cablecom Corp., a company listed on the Nasdaq Global Market. Mr. Intrater is also a member of the board of directors of Oryx Technology Corp., Clareos, Inc. and Ethertouch, Ltd. Mr. Intrater received a B.S. from Rutgers University.
William Sujian—International Sales and Compliance Officer—Mr. Sujian joined HQS in July 2004, and is currently our International Sales and Compliance Officer. He has over 12 years of experience in international trade and project development. He is familiar with both Western and Asian business practices. His functions include the supervision of the China based sales team and supervision of compliance with our code of ethics and business conduct. Prior to 2002, Mr. Sujian worked for SSC in the position of the General Manager for China.
He Jian Bo—Manager Finance Department—Mr. Jian Bo joined us in July 2002. He is currently the Manager of the Finance Department of HQS. Prior to joining us, he worked for several years for PricewaterhouseCoopers and was responsible for the restructuring of companies in China.
Wang Fu Hai—Chief Production Controller— Mr. Fu Hai joined us in July 1997. He is currently our Chief Production Controller and Engineer. Prior to his tenure with HQSM, he was the manager of Project Department Hainan Jiahua Ocean Organism Co., Ltd. He has solid experience in production coordination and control.
See “Certain Relationships and Related Transactions—Family Relationships” for a description of family relationships among certain of our executive officers.
57
Table of Contents
Section 16(a) Beneficial Ownership Reporting Compliance
Section 16(a) of the Exchange Act requires our directors and executive officers, and persons who beneficially own more than 10% of any class of our equity securities, who collectively we generally refer to as insiders, to file with the SEC initial reports of beneficial ownership and reports of changes in beneficial ownership of common stock and other equity securities of the company. Our insiders are required by SEC regulation to furnish us with copies of all Section 16(a) reports they file. Based solely upon a review of the copies of the forms furnished to us, we believe that the following insiders made late filings for the 2009 fiscal year and prior years.
| • | Jean-Pierre Dallaire timely filed a Form 5 to report one late transaction and his status as an insider. |
| • | Andrew Intrater timely filed two Forms 5 to report two late transactions and his status as an insider. Mr. Intrater also filed one late filing to report one late transaction. |
| • | Trond Ringstad filed one late filing to report his status as an insider. |
| • | Daniel Too timely filed a Form 5 to report one late transaction. Mr. Too also filed two late filings to report six late transactions and his status as an insider. |
| • | Fred Bild timely filed a Form 5 to report one late transaction. Mr. Bild also filed two late filings to report thirteen late transactions and his status as an insider. |
| • | Joseph Emas filed one late filing to report two late transactions. |
| • | Lillian Wang timely filed a Form 5 to report three late transactions. |
| • | Norbert Sporns timely filed a Form 5 to report three late transactions. |
| • | Harry Wang timely filed a Form 5 to report four late transactions. |
| • | Red Coral Group Ltd. timely filed a Form 5 to report four late transactions. |
Compensation of Directors
Our bylaws provide that, unless otherwise restricted by our certificate of incorporation, our board of directors has the authority to fix the compensation of directors. The directors may be paid their expenses, if any, related to attendance at each meeting of the board of directors and may be paid a fixed sum for attendance at each meeting of the board of directors or a stated salary as our director. Our bylaws further provide that no such payment will preclude any director from serving our company in any other capacity and receiving compensation therefore. Further, members of special or standing committees may be given compensation for attending committee meetings.
In addition, effective in 2004, our non-employee directors, Messrs. Bild and Too, have entered into independent non-executive director agreement with us. The non-executive director agreement between Mr. Bild and us became effective in June 2004 while the agreement with Mr. Too became effective on September 2, 2004. Under these agreements, each non-employee director agreed to serve as our non-executive independent director commencing in 2004, until the next meeting of our shareholders, unless terminated earlier, provided, however, that during such term of service the directors may also hold officer and non-executive director positions at other entities not affiliated with us. In consideration of the directors’ services under these agreements, during their respective terms, we agreed to pay each director pro rata quarterly portions of a total annual cash fee of $15,000. Such base annual fee is increased annually, on January 1 of each calendar year, by not less than ten percent (10%). Our board of directors, in its discretion, may approve an increase of such annual base fee in excess of ten percent (10%). During the respective terms of these agreements, we also agreed to pay each director an annual bonus of not less than $15,000 payable in shares of our common stock. We also agreed to reimburse any reasonable expenses paid or incurred by each non-employee director in connection with the performance of his duties and responsibilities for us.
In 2008, two of our non-employee directors, Messrs. Intrater and Emas entered into independent non-executive director agreements with us. The non-executive director agreements between us and each of Messrs. Intrater and Emas became effective in August 2008. Under these agreements, each of those two non-employee directors agreed to serve as our non-executive independent directors commencing in 2008, until the next meeting of our shareholders, unless terminated earlier, provided, however, that during such term of service the directors may also hold officer and non-executive director positions at other entities not affiliated with us. In consideration of the directors’ services under these agreements, during their respective terms, we agreed to pay each director pro rata quarterly portions of a total annual cash fee of $30,000 for Mr. Intrater ant $20,000 for Mr. Emas. Such base annual fee is increased annually, on January 1 of each calendar year, by not less than ten percent (10%). Our board of directors, in its discretion, may approve an increase of such annual base fee in excess of ten percent (10%). During the respective terms of these agreements, we also agreed to pay each director an annual bonus of not less than $20,000 payable in shares of our common stock. We also agreed to reimburse any reasonable expenses paid or incurred by each non-employee director in connection with the performance of his duties and responsibilities for us.
58
Table of Contents
Board Committees and Independence
All of our directors serve until the next annual meeting of shareholders and until their successors are elected by the holders of our common stock, or until their earlier death, retirement, resignation or removal. Our bylaws set the authorized number of directors at not less than one or more than nine, with the actual number fixed by our board of directors. Currently, our board of directors consists of seven members. Our bylaws authorized the board of directors to designate from among its members one or more committees and alternate members thereof, as they deem desirable, each consisting of one or more of the directors, with such powers and authority (to the extent permitted by law and these bylaws) as may be provided in such resolution.
Our board of directors has established two committees to date, an audit committee and a compensation committee. The audit committee consists of Messrs. Andrew Intrater, Fred Bild and Daniel Too, and the compensation committee consists of Messrs. Fred Bild and Daniel Too. Our board of directors has determined that each of these directors is “independent” within the meaning of the applicable rules and regulations of the SEC and the American Stock Exchange.
In addition, we believe one of our independent directors, Mr. Andrew Intrater, qualifies as an “audit committee financial expert” as the term is defined by the applicable SEC rules and regulations and American Stock Exchange listing standards, which we believe is consistent with his experience. In the course of his career, Mr. Intrater serves as the Senior Managing Partner at Columbus Nova’s investment business and is the Chief Executive Officer of Columbus Nova, a private investment firm. At the time of the listing of our common stock on the American Stock Exchange, we were required to certify to the American Stock Exchange that our audit committee has, and will continue to have, at least one member who has past employment experience in finance or accounting, requisite professional certification in accounting, or other comparable experience or background that results in the individual’s financial sophistication.
Audit Committee
The audit committee assists our board of directors in its oversight of the company’s accounting and financial reporting processes and the audits of the company’s financial statements, including (i) the quality and integrity of the company’s financial statements, (ii) the company’s compliance with legal and regulatory requirements, (iii) the independent auditors’ qualifications and independence and (iv) the performance of the company’s internal audit functions and independent auditors, as well as other matters which may come before it as directed by the board of directors. Further, the audit committee, to the extent it deems necessary or appropriate, among its several other responsibilities, shall:
| • | be responsible for the appointment, compensation, retention, termination and oversight of the work of any independent auditor engaged for the purpose of preparing or issuing an audit report or performing other audit, review or attest services for the Company; |
| • | discuss the annual audited financial statements and the quarterly unaudited financial statements with management and the independent auditor prior to their filing with the SEC in the Company’s Annual Report on Form 10-K and Quarterly Reports on Form 10-Q; |
| • | review with the company’s financial management on a periodic basis (a) issues regarding accounting principles and financial statement presentations, including any significant changes in the company’s selection or application of accounting principles, and (b) the effect of any regulatory and accounting initiatives, as well as off-balance sheet structures, on the financial statements of the company; |
| • | monitor the Company’s policies for compliance with federal, state, local and foreign laws and regulations and the Company’s policies on corporate conduct; |
| • | maintain open, continuing and direct communication between the board of directors, the Committee and both the company’s independent auditors and its internal auditors; and |
| • | Monitor our compliance with legal and regulatory requirements, with the authority to initiate any special investigations of conflicts of interest, and compliance with federal, state and local laws and regulations, including the Foreign Corrupt Practices Act. |
Mr. Intrater is the chairman of our audit committee, and the other members are Messrs. Bild and Too. We consider Mr. Intrater to be our audit committee financial expert within the meaning of the applicable Securities and Exchange Commission rules and regulations.
Compensation Committee
The compensation committee aids our board of directors of directors in meeting its responsibilities relating to the compensation of the company’s executive officers and to administer all incentive compensation plans and equity-based plans of the company, including the plans under which company securities may be acquired by directors, executive officers, employees and consultants. Further, the compensation committee, to the extent it deems necessary or appropriate, among its several other responsibilities, shall:
| • | review periodically the company’s philosophy regarding executive compensation to (i) ensure the attraction and retention of corporate officers; (ii) ensure the motivation of corporate officers to achieve the Company’s business objectives, and (iii) align the interests of key management with the long-term interests of the Company’s shareholders; |
59
Table of Contents
| • | review and approve corporate goals and objectives relating to Chief Executive Officer compensation and other executive officers of the company; |
| • | make recommendations to the board of directors regarding compensation for non-employee directors, and review periodically non-employee director compensation in relation to other comparable companies and in light of such factors as the Committee may deem appropriate; and |
| • | Review periodically reports from management regarding funding of the company’s pension, retirement, long-term disability and other management welfare and benefit plans. |
Mr. Too is the chairman of our compensation committee, and the other member is Mr. Bild.
Code of Ethics
We have adopted a code of ethics that applies to all of our executive officers, directors and employees. Code of ethics codifies the business and ethical principles that govern all aspects of our business. This document will be made available in print, free of charge, to any shareholder requesting a copy in writing from our Secretary at our U.S. headquarters in Seattle, Washington. A copy of our code of ethics is available on our website at www.hqfish.com, under “Investor Relations—Corporate Governance—Code of Ethics.”
| ITEM 11. | EXECUTIVE COMPENSATION |
Compensation Discussion and Analysis
Executive Compensation Philosophy
Our compensation program is designed to attract, retain and motivate highly qualified executives and drive sustainable growth. We compensate our executives named in the “Summary Compensation Table,” which we refer to as “named executive officers” or “NEOs,” through a combination of base salary, incentive, and cash bonuses. Cash bonuses are designed to reward current performance and are based on the Company’s performance, the executive’s performance and the executive’s adherence to our core values.
Our Compensation Committee
The responsibilities of the Compensation Committee are to:
| • | oversee development and administration of the Company’s executive compensation plans; set the compensation of the Chief Executive Officer and other executive officers; review and consider the performance of the Chief Executive Officer and other officers; |
| • | oversee the evaluation of the Chief Executive Officer and other members of management; and review and approve employment, severance, change-in-control, termination and retirement arrangements for all officers. |
The Compensation Committee has not delegated its authority for officer compensation, but has delegated all of its authority under the Company’s equity plan to the Chief Executive Officer to grant equity awards to employees below the officer level.
Officer compensation decisions are made by the Compensation Committee after discussing recommendations with the Chief Executive Officer. He may attend Compensation Committee meetings to discuss the financial performance of the Company and the performance of individual executives.
The members of the Compensation Committee are Fred Bild and Daniel Too. The Board has determined that all of the members of the Compensation Committee are independent under the Company’s Corporate Governance Guidelines and the AMEX Corporate Governance Rules. No member of the Compensation Committee was or is an officer or employee of the Company or any of its subsidiaries.
Overview of Our Executive Compensation
Our compensation objectives are to:
| • | attract first-class executive talent |
| • | retain key leaders |
| • | reward past performance |
60
Table of Contents
| • | motivate future performance |
| • | foster the identification and development of leadership potential in key talent |
The compensation framework for our named executive officers consists of the following three key elements:
| • | Base salary; |
| • | Annual cash bonuses; and |
| • | Long-term incentives (including the grant of stock options) |
In addition to these key elements of compensation, our compensation framework includes limited fringe benefits, perquisites, severance and other benefits.
Our executive compensation program is designed to develop and motivate the collective and individual abilities of our management team. In establishing the type and size of executive compensation awards, the Compensation Committee considers the factors listed below under “Performance Criteria.”
Base Salaries
Our named executive officers receive a majority of their overall cash compensation as base salary. Generally, base salaries have not been based upon specific measures of corporate performance, but are determined upon the recommendations of the Chief Executive Officer, based upon his determination of each employee’s individual performance, position and responsibilities, and contributions to both our financial performance and ethical culture, and approved by the Compensation Committee. We kept the original terms of the employment agreements including the amount of salaries for the named executive officers over the years.
Annual Bonuses
Pursuant to employment agreements, the named executive officers are entitled to an annual cash bonus in an amount no less than $100,000 for Mr. Harry Wang, $100,000 for Ms. Lillian Wang, $50,000 for Mr. Norbert Sporns and $25,000 Mr. Jean-Pierre Dallaire. The Compensation Committee determines whether to pay any annual cash bonus to the named executive officers in excess of these thresholds and the amount of such excess. The Compensation Committee makes this determination at the end of each fiscal year, based on the factors described below under “Performance Criteria.”
For each of the last four fiscal years, the Compensation Committee increased the cash bonus for each of the named executive officers by 10%. Although the Compensation Committee does not directly link the amounts of annual cash bonuses to the Company’s financial performance when determining the amount of these bonuses, the Compensation Committee considered the fact that the Company’s income from operations increased substantially over 10% in each of the past four years. The amount of the cash bonus for each named executive officer for each of the last three years is set forth below under “Summary Compensation Table.”
Long-Term Incentives
The Compensation Committee believes that the grant of non-cash, long-term compensation, primarily in the form of long-term incentive awards, to our named executive officers is appropriate to attract, motivate and retain such individuals, and enhance stockholder value through the use of non-cash, equity incentive compensation opportunities. The Compensation Committee believes that our best interests will be advanced by enabling our named executive officers, who are responsible for our management, growth and success, to receive compensation in the form of long-term incentive awards. Since long-term awards will increase in value in conjunction with an increase in the value of our common stock, the awards are designed to provide our named executive officers with an incentive to remain with us.
Perquisites
Our compensation framework includes limited fringe benefits, perquisites and other benefits. Based on the employment agreements entered into between the Company and the named executives, the named executives are eligible to participate in incentive, savings, retirement (401(k)), and welfare benefit plans, including without limitation, health medical, dental, vision, life (including accidental death and dismemberment) and disability insurance plans. Since our main operation is in China and the named executive officers maintain personal residences in China and other places than Seattle, our headquarters office, the company also supports the rent for the named executive officers during their stay in Seattle.
The Company periodically reviews the perquisites that named executive officers receive. These perquisites are relatively few in number, and the Compensation Committee believes that its policies regarding perquisites are conservative compared to other companies.
61
Table of Contents
The total costs to the Company for providing perquisites and personal benefits to the named executive officers during fiscal 2008 are shown in the “Summary Compensation Table.”
Our Executive Compensation Principles
The following core principles reflect the compensation philosophy of the Company with respect to the named executive officers, as established and refined from time to time by the Compensation Committee:
| 1. | Compensation should reinforce the Company’s business objectives and values. |
| 2. | Compensation should be performance-related. |
| 3. | There should be flexibility in allocating the various compensation elements. |
| 4. | Incentive compensation should balance short-term and long-term performance. |
| 5. | Named executive officers should have financial risk and reward tied to their business decisions. |
These principles are intended to motivate the named executive officers to improve the Company’s financial performance; to be personally accountable for the performance of the business units, divisions, or functions for which they are responsible; and to collectively make decisions about the Company’s business that will deliver stockholder value. Below is a description of how these principles are implemented.
1. Compensation should reinforce the Company’s business objectives and values.
Our executive compensation program includes the incentives necessary to reward the contributions and leadership that serve to increase profits, revenue, and operating cash flow; enhance confidence in our financial stewardship; create and maintain the high morale and commitment of our employees; and enhance our reputation as a responsible corporate citizen.
2. Compensation should be performance-related.
We consider both business performance and the competitive marketplace when we design, deliver and fund our compensation programs. We pay for performance by rewarding superior performers with premium compensation. We reward named executive officers when the Company performs well. Likewise, we award lower compensation if the Company does not perform well. The Compensation Committee believes that a significant portion of a named executive officer’s total compensation should be at risk and tied to how well the Company, the individual, and the individual’s business unit, division, or function performs.
3. There should be flexibility in allocating the various compensation elements.
The Compensation Committee does not target any specific mix of elements of compensation in cash versus equity, in short-term compensation versus long-term compensation, or in fixed pay versus variable pay. Instead, the Compensation Committee has the flexibility to establish compensation consistent with the principle that the majority of pay should be at risk through short-term and long-term incentives.
4. Incentive compensation should balance short-term and long-term performance.
While the Compensation Committee seeks to structure a balance between achieving strong annual results and ensuring the Company’s long-term viability and success, it does not target a specific mix of short-term and long-term incentives. Named executive officers are regularly provided incentive opportunities based on both short-term and long-term achievements. Participation in the Company’s short-term and long-term incentive programs increases with positions at higher levels of responsibility such as those held by named executive officers who have the greatest influence over time on the Company’s strategic direction and results.
5. Named executive officers should have financial risk and reward tied to their business decisions.
The Compensation Committee believes that named executive officers should have a financial interest in the Company’s long-term results. Consequently, we require our named executive officers to be stockholders of the Company and provide them various ways to do so. In addition, the majority of our named executives’ compensation is designed to be at risk through short-term and long-term incentives.
Prohibition Against Speculative Transactions
Our Code of Business Conduct and Ethics, which applies to all of our employees and directors, prohibits speculative transactions in our stock such as short sales, puts, calls or other similar options to buy or sell our stock.
62
Table of Contents
Guidelines For Trades By Insiders
We maintain policies that govern trading in our stock by officers and directors required to report under Section 16 of the Securities Exchange Act of 1934 (the “Exchange Act”), as well as certain other employees who regularly have access to material non-public information about us. These policies include pre-approval requirements for all trades and periodic trading “black-out” periods designed with reference to our quarterly financial reporting schedule. We also require pre-approval of all trading plans adopted pursuant to Rule 10b5-1 promulgated under the Exchange Act. To mitigate the potential for abuse, no trades are allowed under a plan within 30 days after adoption. We discourage termination or amendment of plans by prohibiting trades under new or amended plans within 90 days following a plan termination or amendment.
Performance Criteria
The Compensation Committee considers the following criteria when it establishes the type and size of executive compensation awards:
| • | financial performance (e.g., growing revenue and improving profitability and cash flow); |
| • | leadership effectiveness (e.g., communicating and implementing the Company’s strategic direction, implementing and executing strategic succession plans, setting the appropriate moral and ethical tone, strengthening the Company’s leadership as a model corporate citizen, executing short-term and long-term business plans); |
| • | improving the product line and the marketing of our products; |
| • | continuing to explore opportunities to extend market reach; and |
| • | employee satisfaction (e.g., retaining key talent, creating a positive employee environment, and providing employee development opportunities). |
The Compensation Committee expects a high level of collaborative and individual performance and contributions, consistent with our named executive officer level of responsibility. The Compensation Committee discusses and evaluates the quality of the overall performance of the CEO after considering the CEO’s self-assessment and Company performance. The CEO in turn uses a similar process when reviewing performance of the other executives and makes recommendations to the Compensation Committee.
The Compensation Committee does not assign any particular weightings to the performance criteria listed above. Nonetheless, the Compensation Committee carefully reviews the Company’s financial performance, including income from operations, when determining the size of compensation awards. While the Compensation Committee carefully considers the Company’s actual financial performance, compensation is not directly tied to that measure.
Tax Implications of Executive Compensation
Section 162(m) of the Internal Revenue Code limits to $1 million per year the federal income tax deduction to public corporations for compensation paid for any fiscal year to the corporation’s Chief Executive Officer and certain other named executive officers (excluding the CFO) included in the “Summary Compensation Table.” This limitation does not apply to qualifying “performance-based compensation.”
The Company can deduct annual short-term incentives paid to named executive officers who are subject to Section 162(m) as performance-based compensation. The Compensation Committee defined Performance Profit as income from continuing operations before income taxes, equity income, discontinued operations, extraordinary items, and cumulative effect of change in accounting principles, but excluding restructuring charges as identified in the audited financial statements.
It is the Company’s goal to have compensation paid to its top officers qualify as tax deductible for federal tax purposes under Section 162(m) of the Internal Revenue Code. However, the Compensation Committee also believes it is appropriate to provide competitive compensation opportunities even though all compensation paid may not be fully tax deductible in any given year.
The non-performance-based compensation paid in cash to our executive officers for the 2009 fiscal year did not exceed the $1 million limit per officer, and the Compensation Committee does not anticipate that the non-performance-based compensation to be paid in cash to our executive officers for fiscal year 2010 will exceed that limit. In addition, the Compensation Committee does not anticipate that non-performance-based compensation to be paid in equity incentives to our executive officers for fiscal 2010 will exceed the $1 million limit per officer. However, the occurrence of certain events, including a change of control or a significant increase in the value of our common stock, could cause certain compensation to exceed the limit.
Accounting Implications of Executive Compensation
Base salaries and the short-term incentives are expensed over the period in which they are earned.
The long-term incentives used to reward named executive officers are primarily comprised of equity awards, including stock options. These equity awards are recorded according to Statement of Financial Accounting Standards (FAS) No. 123(R), “Share-Based Payments,” which states that the equity awards should be measured at fair value on the date of grant and expensed during the requisite service period for those equity awards that are expected to vest.
63
Table of Contents
Conclusion
The foregoing discussion describes the compensation objectives and policies which were utilized with respect to our named executive officers during 2009. In the future, as the Compensation Committee continues to review each element of the executive compensation program with respect to our named executive officers, the objectives of our executive compensation program, as well as the methods which the Compensation Committee utilizes to determine both the types and amounts of compensation to award to our named executive officers, may change.
Report of the Compensation Committee of the Board of Directors
The Compensation Committee has reviewed and discussed the Compensation Discussion and Analysis with the management of the Company. Based upon its review and discussions, the Compensation Committee recommended to the Board of Directors that the Compensation Discussion and Analysis be incorporated by reference in the Company’s Annual Report on Form 10-K for the year ended December 31, 2009.
Fred Bild
Daniel Too
Executive Compensation
The following table sets forth information concerning the annual compensation earned by our named executive officers. Each of the named executive officers has an employment agreement that influences or defines certain of the elements of compensation shown below.
SUMMARY COMPENSATION TABLE
| Name and Principal Position |
Year | (A)Salary ($) | (B)Bonus ($) | Stock Awards ($) |
Option Awards ($) |
Non-Equity Incentive Plan Compensation ($) |
Change in Pension Value and Nonqualified Deferred Compensation Earnings ($) |
(C)All Other Compensation ($) |
Total ($) | |||||||||
| Norbert Sporns |
2009 | 241,576 | 80,526 | 30,442 | 352,544 | |||||||||||||
| 2008 | 219,615 | 73,205 | 33,210 | 326,030 | ||||||||||||||
| 2007 | 199,650 | 60,550 | 31,800 | 298,000 | ||||||||||||||
| Lillian Wang Li |
2009 | 241,576 | 161,051 | 30,442 | 433,069 | |||||||||||||
| 2008 | 219,615 | 146,410 | 33,210 | 399,235 | ||||||||||||||
| 2007 | 199,650 | 133,000 | 31,800 | 364,550 | ||||||||||||||
| Harry Wang Hua |
2009 | 161,051 | 161,051 | — | 322,102 | |||||||||||||
| 2008 | 146,410 | 146,410 | — | 292,820 | ||||||||||||||
| 2007 | 133,100 | 133,100 | — | 266,200 | ||||||||||||||
| Jean-Pierre Dallaire |
2009 | 161,051 | 40,141 | 49,749 | 250,941 | |||||||||||||
| 2007 | 146,410 | 36,492 | 47,330 | 230,232 | ||||||||||||||
| 2008 | 133,100 | 33,275 | 35,760 | 202,565 | ||||||||||||||
| (A) | The 2009 base salaries for all named executive officers as determined by their employment agreements. On April 1, 2004, the Company entered into a five-year employment agreement with each of Mr. Harry Wang, Ms. Lillian Wang, and Mr. Norbert Sporns (collectively, the “Executives”). Subsequently on April 11, 2005, the Company entered into Amendment No.1 to Employment Agreement with each of the Executives. Pursuant to their respective terms, each of the employment agreements automatically renewed for an additional five (5) year term as of April 1, 2009. The agreements provide an annual base salary of US$100,000.00 for Mr. Wang, US$150,000.00 for Ms. Wang, and US$150,000.00 for Mr. Sporns, less all applicable taxes and other appropriate deductions. The base salary is increased annually in an amount no less than ten percent (10%) of the respective base salary. The Company’s Board of Directors (the “Board”) has the sole discretion to decide whether an Executive’s base salary may be increased by more than ten percent (10%). |
64
Table of Contents
On September 1, 2004, the Company entered into a five-year employment agreement with Mr. Jean Pierre Dallaire to serve as the Chief Financial Officer of the Company. Pursuant to its terms, Mr. Dallaire’s employment agreement automatically renewed for an additional five (5) year term as of September 1, 2009. The agreement provides an annual base salary of US$100,000.00 for Mr. Dallaire. The base salary is increased annually in an amount no less than ten percent (10%). The Board has the sole discretion to decide whether Mr. Dallaire’s base salary may be increased by more than ten percent (10%). Mr. Dallaire’s employment agreement contains non-competition, non-solicitation, confidentiality, and related provisions that are relatively standard for executive employment agreements.
| (B) | The bonus for all named executive officers as determined by their employment agreements and the Board. The Executives are entitled to an annual bonus of no less than $100,000.00 for Mr. Wang, $100,000.00 for Ms. Wang, $50,000.00 for Mr. Sporns and $25,000.00 for Mr. Dallaire for each calendar year. The decision to pay any annual bonus to the Executive in excess of these threshold amounts, and the amount of any annual bonus increment in excess of these threshold amounts, will be within the Board’s sole discretion based on its review of the operating performance of the Company during the preceding fiscal year. |
The Executives are eligible for non-qualified stock options under the stock option plan of the Company (the “Stock Option Plan”), subject to certain terms and conditions. Pursuant to the Stock Option Plan, the Company shall grant to each of the Executives an option to purchase an aggregate of twenty percent (20%) of the then fully diluted shares of the Company’s common voting stock that are available under the Stock Option Plan. In addition, at the beginning of each quarter during the term of the employment agreement, the Company shall grant to each of the Executives an option to purchase five percent (5%) of the then fully diluted shares of the Company’s common voting stock. Fifty percent (50%) of the options granted on the Grant Date (as defined in the agreements) is vested and exercisable from and after the Grant Date and the remaining fifty percent (50%) of the options vest and become exercisable on the first anniversary of the Grant Date. Subsequent grants of stock options vest and are exercisable pursuant to the terms and conditions of the Stock Option Plan. None of the options have been awarded to the Executives pursuant to the Stock Option Plan since 2004.
The Executives are eligible to participate in incentive, savings, retirement (401(k)), and welfare benefit plans, including without limitation, health medical, dental, vision, life (including accidental death and dismemberment) and disability insurance plans. The Company will purchase directors and officers liability insurance for the Executives.
Mr. Dallaire is eligible for non-qualified stock options under the Stock Option Plan, subject to certain terms and conditions. The Company shall grant Mr. Dallaire an option to purchase an aggregate of ten percent (10%) of the then fully diluted shares of the Company’s common voting stock available under the Stock Option Plan. In addition, at the beginning of each quarter during the term of this agreement, the Company shall grant to Mr. Dallaire an option to purchase two and one half percent (2.5%) of the then fully diluted shares of the Company’s common voting stock. Fifty percent (50%) of the options granted on the Grant Date shall be vested and exercisable from and after the Grant Date and the remaining fifty percent (50%) of the options granted on the Grant Date shall be vested and become exercisable on the first anniversary of the Grant Date. Subsequent grants of stock options shall be vested and be exercisable pursuant to the terms and conditions of the Stock Option Plan.
Mr. Dallaire is eligible to participate in incentive, savings, retirement (401(k)), and welfare benefit plans, including without limitation, health medical, dental, vision, life (including accidental death and dismemberment) and disability insurance plans. The Company shall purchase directors and officers liability insurance for Mr. Dallaire.
| (C) | This column represents the payment of perquisites and personal benefits, including rental payment the Company supports for the named executive officers during their stay in Seattle and the insurance issued to Jean-Pierre Dallaire, our CFO, whereby he is reimbursed his premiums for health insurance, medication and disability according to the employment agreement he entered into with the Company. No such insurance has been issued to other named executive officers. |
65
Table of Contents
The following table sets forth information concerning outstanding equity awards held by our named executive officers as of December 31, 2009.
OUTSTANDING EQUITY AWARDS AT DECEMBER 31, 2009
| Option Awards (A) | Stock Awards | |||||||||||||||||
| Name |
Number of Securities Underlying Unexercised Options (#) |
Number of Securities Underlying Unexercised Options (#) |
Equity Incentive Plan Awards: Number of Securities Underlying Unexercised Unearned Options (#) |
Option Exercise Price ($) |
Option Expiration Date |
Number of Shares or Units of Stock That Have Not Vested (#) |
Market Value of Shares or Units of Stock That Have Not Vested ($) |
Equity Incentive Plan Awards: Number of Unearned Shares, Units or Other Rights That Have Not Vested (#) |
Equity Incentive Plan Awards: Market or Payout Value of Unearned Shares, Units or Other Rights That Have Not Vested ($) | |||||||||
| Exercisable | Unexercisable | |||||||||||||||||
| Norbert Sporns |
— | — | — | — | — | — | — | — | — | |||||||||
| Lillian Wang Li |
— | — | — | — | — | — | — | — | — | |||||||||
| Harry Wang Hua |
— | — | — | — | — | — | — | — | — | |||||||||
| Jean-Pierre Dallaire |
— | — | — | — | — | — | — | — | — | |||||||||
| (A) | All stock options are 100% vested and exercisable. There have been no stock options granted by the Company since June 2004. At December 31, 2009, all options above were exercised. |
The following table sets forth information concerning options that were exercised by our named executive officers during 2009 and stock awards held by our named executive officers that vested during 2009.
2009 OPTION EXERCISES AND STOCK VESTED TABLE
| Option Awards | Stock Awards | |||||||
| Name |
Number of Shares Acquired on Exercise (#) |
Value Realized on Exercise ($) |
Number of Shares Acquired on Vesting (#) |
Value Realized on Vesting ($) | ||||
| Norbert Sporns |
NIL | NIL | — | — | ||||
| Lillian Wang Li |
NIL | — | — | |||||
| Harry Wang Hua |
— | — | ||||||
| Jean-Pierre Dallaire |
NIL | — | — | |||||
66
Table of Contents
The following table sets forth information concerning nonqualified deferred compensation of our named executive officers.
2009 NONQUALIFIED DEFERRED COMPENSATION TABLE
| Name |
Executive Contributions in Last Fiscal Year ($) |
Registrant Contributions in Last Fiscal Year ($) |
(A)Aggregate Earnings in Last Fiscal Year ($) |
(B) Aggregate Withdrawals / Distributions ($) |
(C)Aggregate Balance at Last Fiscal Year-End ($) | |||||
| Norbert Sporns |
— | — | 322,102 | 322,102 | NIL | |||||
| Lillian Wang Li |
— | — | 402,627 | 402,627 | NIL | |||||
| Harry Wang Hua |
— | — | 322,102 | 1,455,642 | NIL | |||||
| Jean-Pierre Dallaire |
— | — | 201,192 | 177,520 | 40,141 | |||||
| (A) | These amounts were reported as the amount of salary and bonus earned by the named executive officer in the last completed fiscal year in the above Summary Compensation Table. |
| (B) | Aggregate withdrawals/distributions is the aggregate dollar amount of all withdrawals by the named executive officer during the last fiscal year. This amount includes compensation that was earned in 2009 and in prior years. |
| (C) | Aggregate balance is the total amount of salary and bonus earned by the named executive officer in the last completed fiscal year and in prior years that has been deferred as of December 31, 2009. Each named executive officer may defer his or her compensation by his or her own choice. |
The following table sets forth information concerning the compensation of our non-management directors for the year ended December 31, 2009.
2009 DIRECTOR COMPENSATION TABLE
| Name |
(A)Fees Earned or Paid in Cash ($) |
(A)Stock Awards ($) |
Option Awards ($) |
Non-Equity Incentive Plan Compensation ($) |
Change in Pension Value and Nonqualified Deferred Compensation Earnings ($) |
(B)All Other Compensation ($) |
Total ($) | |||||||
| Norbert Sporns |
— | — | — | — | — | 33,210 | 33,210 | |||||||
| Lillian Wang Li |
— | — | — | — | — | 33,210 | 33,210 | |||||||
| Harry Wang Hua |
— | — | — | — | — | — | — | |||||||
| Fred Bild |
24,157 | 15,000 | — | — | — | — | 43,280 | |||||||
| Daniel Too |
24,157 | 15,000 | — | — | — | — | 43,280 | |||||||
| Andrew Intrater |
33,000 | 20,000 | — | — | — | — | 65,000 | |||||||
| Joseph I Emas(C) |
22,000 | 20,000 | — | — | — | — | 50,000 | |||||||
| (A) | The annual remuneration paid in cash of our independent non-executive directors Fred Bild, and Daniel Too was $24,157 (indexed by 10% yearly) plus an annual bonus to them of not less than $15,000 payable in shares of our common stock. Andrew Intrater is remunerated on the basis of $33,000 in cash per year (indexed by 10% yearly), plus $20,000 payable in shares of our common stock. Joseph Emas is remunerated on the basis of $22,000 in cash per year (indexed by 10% yearly) for services provided in 2009 in addition to $20,000 payable in shares of our common stock. |
67
Table of Contents
| (B) | Represents rental payments the Company supports for Mr. Sporns and Ms. Wang Li during their stay in Seattle. |
| (C) | Mr. Emas resigned from the Board and was replaced by Dr. Kevin Fitzsimmons effective March 8, 2010. |
The following table quantifies the payments and benefits that each named executive officer would receive assuming his respective employment were terminated, or upon a change of control, on the last day of our most recent fiscal year, December 31, 2009, for the reason set forth in each of the columns.
2009 POTENTIAL PAYMENTS UPON TERMINATION OR CHANGE IN CONTROL TABLE
| Name |
(A)Benefit | Before Change in Control Termination w/o Cause or for Good Reason |
After Change in Control Termination w/o Cause or for Good Reason |
Voluntary Termination |
Death | Disability | (B)Change in Control | |||||||
| Norbert Sporns |
Basic salary | 241,576 | 1,330,575 | |||||||||||
| Bonus | 80,256 | 443,515 | ||||||||||||
| Lillian Wang Li |
Basic salary | 241,576 | 1,330,535 | |||||||||||
| Bonus | 161,051 | 887,023 | ||||||||||||
| Harry Wang Hua |
Basic salary | 161,051 | 887,023 | |||||||||||
| Bonus | 161,051 | 887,023 | ||||||||||||
| Jean-Pierre Dallaire |
Basic salary | 161,051 | 995,095 | |||||||||||
| Bonus | 40,141 | 248,021 | ||||||||||||
| (A) | The basic salary and bonus provisions are described herein under the description of each named executive officers’ employment agreement. |
| (B) | “Good Reason” shall mean the occurrence, without the Executive’s consent, of any of the following events: (a) the assignment to the Executive of duties that are significantly different from, and that result in a substantial diminution of, the duties that he assumed on the Inception Date; (b) the assignment to the Executive of a title that is different from and subordinate to the title specified in paragraph 2 hereinabove, or (c) a Change of Control “Change of Control” means the Company’s Board votes to approve: (a) any consolidation or merger of the Company pursuant to which fifty percent (50%) or less of the outstanding voting securities of the surviving or resulting company are not owned collectively by the common share and warrant holders of Sino-Sult Canada (S.S.C.) Limited and Red Coral Group Limited, Inc. as of September 1, 2004 (the “Current Control Group”); (b) any sale, lease, exchange or other transfer (in one transaction or a series of related transactions) of all, or substantially all, of the assets of the Company other than any sale, lease, exchange or other transfer to any company where the Company owns, directly or indirectly, 100% of the outstanding voting securities of such company after any such transfer; (c) any person or persons (as such term is used in Section 13(d) of the Exchange Act of 1934, as amended), other than the Current Control Group, shall acquire or become the beneficial owner (within the meaning of Rule 13d-3 under the Exchange Act) whether directly, indirectly, beneficially or of record, of 50% or more of outstanding voting securities of the Company; or (d) commencement by any entity, person, or group (including any affiliate thereof, other than the Company) of a tender offer or exchange offer where the offeree acquires more than 50% of the then outstanding voting securities of the Company. |
68
Table of Contents
Director Compensation
Unless otherwise restricted by the certificate of incorporation, the members of board of directors have the authority to fix the compensation of directors. The directors may be paid their expenses, if any, of attendance at each meeting of the board of directors and may be paid a fixed sum for attendance at each meeting of the board of directors or a stated amount as director. No such payment shall preclude any director from serving the corporation in any other capacity and receiving compensation thereafter. Members of special or standing committees may be allowed, like, for example, compensation for attending committee meetings. The annual remuneration of our independent non-executive directors Fred Bild, and Daniel Too was $15,000 in 2004, in cash (indexed by 10% yearly) plus an annual bonus to them of not less than $15,000 payable in shares of our common stock. Andrew Intrater is remunerated on the basis of $30,000 per year in cash plus an annual bonus of $20,000 payable in shares of our common stock while Joseph Emas is remunerated on the basis of $20,000 in cash per year (indexed by 10% yearly) plus an annual bonus of $20,000 payable in shares of our common stock.
Audit Committee Financial Expert
As stated above, we appointed four independent non-executive directors to our Board of Directors. We consider one of our independent directors, Mr. Andrew Intrater to be an audit committee financial expert within the meaning of the applicable Securities and Exchange Commission rules and regulations.
Compensation Committee Interlocks and Insider Participation
The Compensation Committee consists of Messrs. Bild and Too. None of the members of the Compensation Committee is a current or former officer or employee of the Company or any of our subsidiaries. There are no compensation committee interlocks or insider participation in compensation decisions that are required to be disclosed in this Annual Report on Form 10-K.
Employment Agreements
The following information summarizes the employment agreements we entered into with Lillian Wang Li, our Chairman and Secretary, Harry Wang Hua, our Chief Operating Officer, Norbert Sporns, our Chief Executive Officer and President, and Jean-Pierre Dallaire, our Chief Financial Officer and Financial Controller.
Lillian Wang Li. Under Ms. Wang’s employment agreement, she has agreed to serve as the Chairman of our board of directors and Secretary. Her term of service under this agreement commenced on April 1, 2004 and continues for a term of five (5) years. The agreement provides for a base salary of $150,000 for the first year of the term and an annual increase of at least 10% thereafter. The agreement also provides Ms. Wang with an annual bonus of at least $100,000, and this amount may be increased subject to the decision of our board of directors. The agreement also provides for a grant of options to purchase shares of our common stock. The options include an option to purchase an aggregate of twenty percent (20%) of the then fully diluted shares of our common voting stock made available under our 2004 Stock Incentive Plan, and, at the beginning of each calendar quarter, an option to purchase an aggregate of five percent (5%) of the then fully diluted shares of our common voting stock made available under our 2004 Stock Incentive Plan. No shares of common stock were made available for option grants since the initial grants in 2004, and therefore no option grants were made to Ms. Wang. We and Ms. Wang have an understanding that she would waive any right she might have to receive any options during year 2005 and through the present date under our 2004 Stock Incentive Plan. Each option grant must be evidenced by an option agreement substantially identical to the form included in the employment agreement. The options granted under the employment agreement will have an exercise price of the fair market value per share of our common voting stock on the date the option is granted. We can terminate Ms. Wang’s employment with cause, or without cause upon at least ninety days’ written notice. In the event Ms. Wang’s employment is terminated without cause, she will be eligible to receive (1) monthly payments at her then applicable monthly base salary for the rest of her term from the date of termination of her employment; (2) an annual bonus of $50,000 for the rest of her term from the date of termination of her employment; (3) the value of any earned, but unused vacation days; (4) continued coverage under our company’s benefits plan; and (5) severance in an amount equal to her annual base salary in effect immediately prior to her last date of employment. Pursuant to its terms, the employment agreement automatically renewed for an additional five (5) year term as of April 1, 2009.
Harry Wang Hua. Under Mr. Wang’s employment agreement, he has agreed to serve as our Chief Operating Officer. His term of service under this agreement commenced on April 1, 2004 and continues for a term of five (5) years. The agreement also provides for a base salary of $100,000 for the first year of the term and an annual increase of at least 10 percent thereafter. The agreement also provides Mr. Wang with an annual bonus of at least $100,000, and this amount may be increased subject to the decision of our board of directors. The agreement also provides for the grant of options to purchase shares of our common stock. The options include an option to purchase an aggregate of twenty percent (20%) of the then fully diluted shares of our common voting stock made available under our 2004 Stock Incentive Plan, and, at the beginning of each calendar quarter, an option to purchase an aggregate of five percent (5%) of the then fully diluted shares of our company’s common voting stock made available under the 2004 Stock Incentive Plan. No shares of common stock were made available for option grants since the initial grants in 2004, and therefore no option grants were made to Mr. Wang. We and Mr. Wang have an understanding that he would waive any right he might have to receive any options during year 2005 and through the present date under our 2004 Stock Incentive Plan. Each option grant must be evidenced by an option agreement substantially identical to the form included in the employment agreement. The options granted under the employment agreement will have an exercise price of the fair market value per share of our common voting stock on the date the option is granted. We can terminate Mr. Wang’s employment with cause, or without cause upon at least ninety days’ written notice. In the event Mr. Wang’s employment is terminated without cause, he will be eligible to receive (1) monthly payments at his then applicable monthly base salary for the rest of his term from the date of termination of his employment; (2) an annual bonus of $50,000 for the rest of his term from the date of termination of his employment; (3) the value of any earned, but unused vacation days; (4) continued coverage under our company’s benefits plan; and (5) severance in an amount equal to his annual base salary in effect immediately prior to his last date of employment. Pursuant to its terms, the employment agreement automatically renewed for an additional five (5) year term as of April 1, 2009.
69
Table of Contents
Norbert Sporns. Under Mr. Sporns’ employment agreement, he has agreed to serve as our Chief Executive Officer and President. His term of service under this agreement commenced on April 1, 2004 and continues for a term of five (5) years. The agreement also provides for a base salary of $150,000 for the first year of the term and an annual increase of at least 10% thereafter. The agreement also provides Mr. Sporns with an annual bonus of at least $50,000, and this amount may be increased subject to the decision of our board of directors. The agreement also provides for the grant of options to purchase shares of our common stock. The options include an option to purchase an aggregate of twenty percent (20%) of the then fully diluted shares of our common voting stock made available under our 2004 Stock Incentive Plan, and, at the beginning of each calendar quarter, an option to purchase an aggregate of five percent (5%) of the then fully diluted shares of our company’s common voting stock made available under our 2004 Stock Incentive Plan. No shares of common stock were made available for option grants since the initial grants in 2004, and therefore no option grants were made to Mr. Sporns. We and Mr. Sporns have an understanding that he would waive any right she might have to receive any options during year 2005 and through the present date under our 2004 Stock Incentive Plan. Each option grant must be evidenced by an option agreement substantially identical to the form included in the employment agreement. The options granted under the employment agreement will have an exercise price of the fair market value per share of our common voting stock on the date the option is granted. We can terminate Mr. Sporns’ employment with cause, or without cause upon at least ninety days’ written notice. In the event Mr. Sporns’ employment is terminated without cause, he will be eligible to receive (1) monthly payments at his then applicable monthly base salary for the rest of his term from the date of termination of his employment; (2) an annual bonus of $50,000 for the rest of his term from the date of termination of his employment; (3) the value of any earned, but unused vacation days; (4) continued coverage under our company’s benefits plan; and (5) severance in an amount equal to his annual base salary in effect immediately prior to his last date of employment. Pursuant to its terms, the employment agreement automatically renewed for an additional five (5) year term as of April 1, 2009.
Jean-Pierre Dallaire. Under Mr. Dallaire’s employment agreement, he has agreed to serve as our Chief Financial Officer and Financial Controller. His term of service under this agreement commenced on September 1, 2004 and continues for a term of five (5) years. The agreement provides for a base salary of $100,000 for the first year of the term and an annual increase of at least 10% thereafter. The agreement also provides Mr. Dallaire with an annual bonus of at least $25,000, and this amount may be increased subject to the decision of our board of directors. The agreement also provides for the grant of options to purchase shares of our common stock. The options include an option to purchase an aggregate of ten percent (10%) of the then fully diluted shares of our common voting stock made available under our 2004 Stock Incentive Plan, and, at the beginning of each calendar quarter, an option to purchase an aggregate of two and one-half percent (2.5%) of the then fully diluted shares of our company’s common voting stock made available under our 2004 Stock Incentive Plan. No shares of common stock were made available for option grants since the initial grants in 2004, and therefore no option grants were made to Mr. Dallaire. Each option grant must be evidenced by an option agreement substantially identical to the form included in the employment agreement. The options granted under the employment agreement will have an exercise price of the fair market value per share of our common voting stock on the date the option is granted. We can terminate Mr. Dallaire’s employment with cause, or without cause upon at least ninety days’ written notice. In the event Mr. Dallaire’s employment is terminated without cause, he will be eligible to receive (1) monthly payments at his then applicable monthly base salary for the rest of his term from the date of termination of his employment; (2) an annual bonus of $25,000 for the rest of his term from the date of termination of his employment; (3) the value of any earned, but unused vacation days; (4) continued coverage under our company’s benefits plan; and (5) severance in an amount equal to his annual base salary in effect immediately prior to his last date of employment. Pursuant to its terms, the employment agreement automatically renewed for an additional five (5) year term as of September 1, 2009.
70
Table of Contents
Stock Incentive Plan
The purpose of our 2004 Stock Incentive Plan is to encourage and enable employees, directors and other persons upon whose judgment, initiative and efforts we largely depend upon, to acquire a proprietary interest in our company. Under the Stock Incentive Plan, our board of directors, or a stock option committee appointed by the board of directors, may grant stock options to purchase up to 250,000 shares of our common stock (subject to adjustment due to certain recapitalizations, reorganizations or other corporate events) to our key employees (including officers), directors and consultants. To date, all of the options available under the 2004 Stock Incentive Plan have been granted, and our ability to grant additional options will be subject to first obtaining board and Shareholder approvals. The per share exercise price of options granted under our 2004 Stock Incentive Plan will be not less than 100% of the fair market value per share of common stock on the date the options are granted. Our board of directors or a committee thereof administering the 2004 Stock Incentive Plan has discretion to determine what portions of any awards shall be granted as incentive stock options or ISO’s, stock appreciation rights, or SAR’s, and non-statutory options, and is generally empowered to interpret the 2004 Stock Incentive Plan; to prescribe rules and regulations relating thereto; to determine the terms of the option agreements; to amend the option agreements with the consent of the optionee; to determine the key employees and directors to whom options are to be granted; and to determine the number of shares subject to each option and the exercise price thereof. If any option expires, terminates or is cancelled without having been exercised, the shares subject to the option will again be available for issuance under the Stock Incentive Plan.
Our board of directors did not approve, and therefore, we did not make, any options/SAR grants during the fiscal year ended December 31, 2009.
| ITEM 12. | SECURITY OWNERSHIP OF CERTAIN BENEFICIAL OWNERS AND MANAGEMENT AND RELATED STOCKHOLDER MATTERS |
On December 2004, our Board of Directors ratified grants of non-qualified stock options to purchase shares of our common stock under our Stock Option Plan to some of our executive officers and directors, as well as to several of our employees. Each of these new stock options has up to a ten-year term, is subject to the terms and conditions of the Plan, and is priced at $5.60 which represents the fair market value as of the initial grant date of November 23, 2004.
Specifically, in 2004, Norbert Sporns, our Chief Executive Officer, President and director, received 25,000 stock options. Lillian Wang, the Chairman of our Board of Directors, received 25,000 stock options. Harry Wang, our Chief Operating Officer, director and brother of Ms. Wang, received 25,000 stock options; and Fusheng Wang, our director in 2004, Honorary Chairman and father of Ms. Wang, received 50,000 stock options. Together, Norbert Sporns, Harry Wang and Lillian Wang also indirectly control the majority of capital stock of HQS. The stock options granted to each of them, as well as to Fusheng Wang, were fully vested when granted. In addition, our Chief Financial Officer, Jean-Pierre Dallaire, received 10,000 stock options. Mr. Dallaire’s options were vested in 2004 immediately as to 50% of the grant, with the remaining 50% vesting as follows: 1/3 on June 16, 2005, 1/3 on June 16, 2006, and the remaining 1/3 on June 16, 2007.
Further, at the same date, our Board of Directors ratified grants of stock options to thirteen other employees of HQS. These stock options were vested immediately as to 50% of each individual grant, with the remaining 50% vesting as follows: 1/3 on June 16, 2005, 1/3 on June 16, 2006, and the remaining 1/3 on June 16, 2007. In the case of one of the employees, the stock options were fully vested when granted.
Our Board of Directors believes that these stock option grants will help our company to continue to attract, retain and motivate our employees, directors and executive officers. In connection with these grants, our Board of Directors reserved 250,000 shares for issuance under the Plan. In addition, pursuant to the provisions of the Plan, our Board of Directors delegated the full power and authority to administer the Plan, in accordance with its terms, to our Compensation Committee presently consisting of Fred Bild, an independent director, and Daniel Too, also an independent director of HQS.
The following table sets forth certain information regarding beneficial ownership of common stock as of March 10, 2010, by:
| • | each person known to us to own beneficially more than 5%, in the aggregate, of the outstanding shares of our common stock |
| • | each director; |
| • | each of our chief executive officer and our other two most highly compensated executive officers; and |
| • | all executive officers and directors as a group |
The number of shares beneficially owned and the percent of shares outstanding are based on 14,681,002 shares outstanding as of March 10, 2010. Beneficial ownership is determined in accordance with the rules of the SEC and generally includes voting or investment power with respect to securities. Except as otherwise noted below, the address of each of the shareholders in the table is c/o HQ Sustainable Maritime Industries, Inc., 1511 Third Avenue, Suite 788, Seattle, Washington.
71
Table of Contents
| Beneficial Owner |
Number of Shares of Common Stock (1) |
Percent of Common Stock Beneficially Owned(1) |
Number of Shares of Series A Preferred Stock (2) |
Percent of Series A Preferred Stock Beneficially Owned (2) |
||||||
| Norbert Sporns |
796,761 | 5.4 | % | 24,000 | 24.0 | % | ||||
| Lillian Wang Li |
828,918 | 5.6 | % | 25,000 | 25.0 | % | ||||
| Harry Wang Hua |
1,639,993 | 11.2 | % | 51,000 | 51.0 | % | ||||
| Andrew Intrader (3) |
5,248 | Less than 1 | % | |||||||
| Fred Bild |
10,568 | Less than 1 | % | |||||||
| Daniel Too |
12,443 | Less than 1 | % | |||||||
| Kevin M. Fitzsimmons |
0 | Less than 1 | % | |||||||
| Jean-Pierre Dallaire |
10,000 | Less than 1 | % | |||||||
| All such directors and executive officers as a group (8 persons) |
3,303,931 | 22.5 | % | 100,000 | 100.0 | % | ||||
| Five Percent Shareholders (Other |
||||||||||
| River Road Asset Management, LLC (4) |
907,350 | 6.2 | % | |||||||
| The Tail Wind Fund Ltd. (5) |
778,698 | 5.3 | % | |||||||
| (1) | Beneficially owns the shares indicated, which are owned of record by Red Coral Group Limited and Sino-Sult Canada (S.S.C.) Limited. Each of Mr. Sporns, Ms. Wang and Mr. Wang own respectively 24 percent, 25 percent and 51 percent of the issued capital of Red Coral Group Limited and Sino-Sult Canada (S.S.C.) Limited and share voting and investment power over the shares held by Red Coral Group Limited and Sino-Sult Canada (S.S.C.) Limited. |
| (2) | Beneficially owns the shares indicated, which are owned of record by Sino-Sult Canada (S.S.C.) Limited. Each of Mr. Sporns, Ms. Wang and Mr. Wang own respectively 24 percent, 25 percent and 51 percent of the issued capital of Sino-Sult Canada (S.S.C.) Limited and share voting and investment power over the shares held by Sino-Sult Canada (S.S.C.) Limited. Each share of Series A Preferred Stock has the right to the voting power equal to that of 1,000 shares of the Company’s Common Stock. The voting power of the Series A Preferred Shares remains the same and is not adjusted for any reverse split, namely each Series A Preferred Share continues to have the voting power of 1,000 shares of Common Stock. Each share of Series A Preferred Stock is convertible at a rate of 2 common stock shares for 1 preferred stock share at the option of the beneficial holder, which has been adjusted to reflect a 1 for 20 reverse stock split effectuated on January 31, 2007 to 0.1 shares of common stock for 1 preferred stock share. |
| (3) | The address of this stockholder is c/o Renova U.S. Management LLC, 153 E. 53rd Street, 58th Floor, New York, New York 10022. |
| (4) | Based on a Schedule 13G/A filed by River Road Asset Management, LLC with the SEC on February 16, 2010. The address of the indicated holder is 462 S. 4th Street, Suite 1600, Louisville, KY 40202. |
| (5) | Based on a Schedule 13G/A filed by The Tail Wind Fund Ltd. with the SEC on February 9, 2010. Tail Wind Advisory & Management Ltd., a UK corporation authorized and regulated by the Financial Services Authority of Great Britain (“TWAM”), is the investment manager for The Tail Wind Fund Ltd., and David Crook is the CEO and controlling stockholder of TWAM. Each of TWAM and David Crook expressly disclaims any equitable or beneficial ownership of the shares being registered hereunder and held by The Tail Wind Fund Ltd. |
Changes in Control
We know of no plans or arrangements that will result in a change of control at our company.
Securities Authorized for Issuance Under Equity Compensation Plans
The following table provides information about option awards under our Stock Option Plan as of December 31, 2009.
72
Table of Contents
| Plan Category |
Number of securities to be issued upon exercise of outstanding options |
Weighted- average exercise price of outstanding options |
Number of securities remaining available for future issuance under employee compensation plans (excluding securities reflected in first column) | ||||
| Equity compensation plans previously approved by security holders |
53,750 | $ | 5.60 | NIL | |||
| Equity compensation plans not approved by security holders |
— | — | — | ||||
| Total |
53,750 | $ | 5.60 | NIL | |||
The Company did not repurchase any equity securities in 2009.
| ITEM 13. | CERTAIN RELATIONSHIPS AND RELATED TRANSACTIONS, AND DIRECTOR INDEPENDENCE |
Family Relationships and Related Transactions
In the last three fiscal years, none of our present directors, officers or principal shareholders, nor any family member of the foregoing, nor, to the best of our information and belief, any of our former directors, senior officers or principal shareholders, nor any family member of such former directors, officers or principal shareholders, has or had any material interest, direct or indirect, in any transaction, or in any proposed transaction which has materially affected or will materially affect us, except as follows:
Lillian Wang Li and Harry Wang Hua are brother and sister and Lillian Wang Li is married to Norbert Sporns.
The net amounts due to related parties at December 31, 2009 and December 31, 2008 are non-interest bearing and are without terms of maturity. They consist solely of net advances in the amount of $698,429 as of December 31, 2008 ($0 in 2009) from Mr. Harry Wang, the COO of our company, who is also a director/founder of our company and owns indirectly approximately 11.2% of the issued and outstanding common shares of our Company as of December 31, 2009. The amount due to Mr. Wang is the result of unpaid remuneration since 2004, amount of which is determined by contractual agreement. That amount was paid to Harry Wang during 2009.
Due to the very limited related-party transaction the Company has had which is described above, the Company currently does not have policies and procedures for the review, approval, or ratification of the related-party transaction.
Director Independence
Our board of directors has adopted independence standards consistent with the current listing standards of the NYSE Amex Stock Exchange to assist the board of directors in determining which of its members is independent. Our board of directors has determined that each of Fred Bild, Daniel Too, Joseph I. Emas and Andrew Intrater satisfies our independence standards and further determined that each of them is independent within the meaning of the NYSE Amex Stock Exchange’s listing standards. Effective March 8, 2010, Mr. Emas resigned from the board and was replaced by Dr. Kevin Fitzsimmons. The board of directors has determined that Dr. Fitzsimmons satisfies our independence standards and further determined that he is independent within the meaning of the NYSE Amex Stock Exchange’s listing standards. Our audit committee consists of Messrs. Andrew Intrater, Fred Bild and Daniel Too, and the compensation committee consists of Messrs. Fred Bild and Daniel Too. Our board of directors has determined that each of these directors is “independent” within the meaning of the applicable rules and regulations of the SEC and the NYSE Amex Stock Exchange.
| ITEM 14. | PRINCIPAL ACCOUNTANT FEES AND SERVICES |
(a) Audit Fees
Our auditors Schwartz Levitsky Feldman LLP, billed us aggregate fees in the amount of approximately $275,000 and $240,000 for years ended December 31, 2009 and 2008, respectively. These amounts were billed for professional services our auditors provided for the audit of our annual financial statements and SOX 404 internal controls over financial reporting, review, of our securities offerings and other services typically provided by an accountant in connection with statutory and regulatory filings or engagements for those financial years.
(b) Audit-Related Fees
Schwartz Levitsky Feldman LLP billed us aggregate fees in the amount of approximately $60,000 and $60,000 for years ended December 31, 2009 and 2008, respectively, and for assurance and related services that were reasonably related to the performance of the reviews of our financial statements.
73
Table of Contents
(c) Tax Fees
Schwartz Levitsky Feldman LLP billed us aggregate fees in the amount of $0 for the financial years ended December 31, 2009 and December 31, 2008, for tax compliance, tax advice, and tax planning.
(d) All Other Fees
Schwartz Levitsky Feldman LLP billed us aggregate fees in the amount of approximately $24,000 for the financial year ended December 31, 2009 and $0 for December 31, 2008, for all other fees.
74
Table of Contents
PART IV
| ITEM 15. | EXHIBITS AND FINANCIAL STATEMENT SCHEDULES |
The following documents are filed as part of this report:
1. Financial Statements
2. Financial Statement Schedules
None.
3. Exhibits
| Exhibit No. |
Description | |
| 3.1(a) | Certificate of Incorporation of HQ Sustainable Maritime Industries, Inc., as amended (incorporated by reference to Exhibit 2 to the Schedule 14C of Process Equipment, Inc. (SEC file No. 0-18980), filed with the SEC on April 28, 2004). | |
| 3.1(b) | Certificate of Amendment of Certificate of Incorporation, dated December 28, 2006, of HQ Sustainable Maritime Industries, Inc. (incorporated by reference to Exhibit 3.1 to Amendment No. 1 to Form SB-2 (SEC File Number 333-139454), filed with the SEC on April 20, 2007). | |
| 3.2 | By-laws of HQ Sustainable Maritime Industries, Inc. (incorporated by reference to Exhibit 3 to the Schedule 14C of Process Equipment, Inc. (SEC file No. 0-18980), filed with the SEC on April 28, 2004). | |
| 4.1 | Form of Rights and Preferences of Preferred Stock (incorporated by reference to Form 14C (SEC File Number 0-18980), filed with the SEC on October 3, 2005). | |
| 4.2 | Form of Subscription Agreement between HQ Sustainable Maritime Industries, Inc. and Certain Investors, exhibits attached (incorporated by reference to Exhibit 4.1 to Form 8-K (SEC File Number 0-18980), filed with the SEC on January 26, 2006). | |
| 4.3 | Form of Stock Purchase Agreement by and among Process Equipment, Inc. and certain Investors, dated April 21, 2004 (incorporated by reference to Exhibit 10.19 to Form SB-2 (SEC File Number 333-139454), filed with the SEC on December 18, 2006). | |
| 4.4 | Form of Registration Rights Agreement by and among Process Equipment, Inc. and certain Investors, dated April 21, 2004 (incorporated by reference to Exhibit 10.20 to Form SB-2 (SEC File Number 333-139454), filed with the SEC on December 18, 2006). | |
| 10.1† | Employment Agreement, effective as of April 1, 2004, between HQ Sustainable Maritime Industries, Inc. and Harry Wang (incorporated by reference to Exhibit 10.1 to Form 10-QSB (SEC File Number 0-18980), filed with the SEC on August 13, 2004). | |
| 10.2† | Amendment No. 1 to Employment Agreement, dated July, 2005, between HQ Sustainable Maritime Industries, Inc. and Harry Wang (incorporated by reference to Exhibit 10.16 to Form 10-KSB (SEC File Number 18980), filed with the SEC on April 11, 2005). | |
75
Table of Contents
| Exhibit No. |
Description | |
| 10.3† | Employment Agreement, effective as of April 1, 2004, between HQ Sustainable Maritime Industries, Inc. and Lillian Wang Li (incorporated by reference to Exhibit 10.2 to Form 10-QSB (SEC File Number 0-18980), filed with the SEC on August 13, 2004). | |
| 10.4† | Amendment No. 1 to Employment Agreement, dated July, 2005, between HQ Sustainable Maritime Industries, Inc. and Lillian Wang Li (incorporated by reference to Exhibit 10.15 to Form 10-KSB (SEC File Number 18980), filed with the SEC on April 11, 2005). | |
| 10.5† | Employment Agreement, effective as of April 1, 2004, between HQ Sustainable Maritime Industries, Inc. and Norbert Sporns (incorporated by reference to Exhibit 10.3 to Form 10-QSB (SEC File Number 0-18980), filed with the SEC on August 13, 2004). | |
| 10.6† | Amendment No. 1 to Employment Agreement, dated July, 2005, between HQ Sustainable Maritime Industries, Inc. and Norbert Sporns (incorporated by reference to Exhibit 10.14 to Form 10-KSB (SEC File Number 18980), filed with the SEC on April 11, 2005). | |
| 10.7† | Employment Agreement, dated as of September 1, 2004, between HQ Sustainable Maritime Industries Inc. and Jean-Pierre Dallaire (incorporated by reference to Exhibit 10.3 to Form 10-QSB (Commission file No. 0-18980), filed with the Commission on November 15, 2004). | |
| 10.8† | Employment Agreement, dated as of June 28, 2006, between HQ Sustainable Maritime Industries Inc. and Trond Ringstad (incorporated by reference to Exhibit 10.13 Form SB-2 (Commission file No. 333-139454), filed with the Commission on December 18, 2006). | |
| 10.9† | Independent Non-Executive Director Agreement, dated as of June 15, 2004, between HQ Sustainable Maritime Industries Inc. and Fred Bild (incorporated by reference to Exhibit 10.4 to Form 10-QSB (SEC file No. 0-18980), filed with the SEC on August 13, 2004). | |
| 10.10† | Independent Non-Executive Director Agreement, dated as of June 15, 2004, between HQ Sustainable Maritime Industries Inc. and Jacques Vallée (incorporated by reference to the Report on Form 10-QSB (SEC file No. 0-18980), filed with the SEC on August 13, 2004). | |
| 10.11† | Independent Non-Executive Director Agreement, dated as of September 2, 2004, between HQ Sustainable Maritime Industries Inc. and Daniel Too (incorporated by reference to Exhibit 10.2 to Form 10-QSB (SEC file No. 0-18980), filed with the SEC on November 15, 2004). | |
| 10.12† | Form of Stock Option Grant Notice (incorporated by reference to Exhibit 10.1 to Form 8-K (SEC File Number 0-18980), filed with the SEC on December 3, 2004). | |
| 10.13† | Form of Option Agreement (incorporated by reference to Exhibit 10.2 to Form 8-K (SEC File Number 0-18980), filed with the SEC on December 3, 2004). | |
| 10.14† | Form of Exercise Agreement (incorporated by reference to Exhibit 10.3 to Form 8-K (SEC File Number 0-18980), filed with the SEC on December 3, 2004). | |
| 10.15 | Agreement, dated as of November 4, 2004, between HQ Sustainable Maritime Industries, Inc. and Sino-Sult Canada (S.S.C.) Limited (incorporated by reference to Exhibit 10.1 to Form 10-QSB (SEC file No. 0-18980), filed with the SEC on November 15, 2004). | |
| 10.16 | Form of Purchase Agreement between HQ Sustainable Maritime Industries, Inc. and Certain Investors dated November 8, 2006 (incorporated by reference to Exhibit 4.1 to Form 8-K (SEC File Number 18980), filed with the SEC on November 13, 2006). | |
| 10.17 | Form of Underwriters’ Purchase Option between HQ Sustainable Maritime Industries, Inc. and Several Underwriters (incorporated by reference to Exhibit 10.24 to Amendment No. 2 to Form SB-2 (SEC File Number 333-139454), filed with the SEC on May 24, 2007). | |
| 10.18 | Melbourne Tower Lease, dated November 22, 2005, between Doncaster Investments NV, Inc. and HQ Sustainable Maritime Industries, Inc (incorporated by reference to Exhibit 10.18 to Form SB-2 (SEC File Number 333-139454), filed with the SEC on December 18, 2006). | |
| 10.19 | Waiver and Amendment Agreement between HQ Sustainable Maritime Industries, Inc. and Certain Investors, dated February 22, 2008 (incorporated by reference to Exhibit 10.24 to Amendment No. 5 to Form S-3 (SEC File Number 333-143453), filed with the SEC on May 8, 2008). | |
76
Table of Contents
| Exhibit No. |
Description | |
| 10.20 | Contract for Land Use Rights Transfer between Hainan Hengtian Industry Co., Ltd and Hainan Yu Bao Feedstuff Co., Ltd. dated October 18, 2006 (incorporated by reference to Exhibit 10.25 to Amendment No. 2 to Form SB-2 (SEC File Number 333-139454), filed with the SEC on May 24, 2007). | |
| 10.21 | Contract for Land Attachment Transfer between Hainan Hengtian Industry Co., Ltd and Hainan Yu Bao Feedstuff Co., Ltd. dated December 20, 2006 (incorporated by reference to Exhibit 10.26 to Amendment No. 2 to Form SB-2 (SEC File Number 333-139454), filed with the SEC on May 24, 2007). | |
| 10.22† | 2009 Stock Option Plan (incorporated by reference to Exhibit 10.22 to Annual Report on Form 10-K (SEC File Number 001-33473), filed with the SEC on March 12, 2009). | |
| 21.1 | Subsidiaries of HQ Sustainable Maritime Industries, Inc.* | |
| 23.1 | Consent of Schwartz Levitsky Feldman LLP* | |
| 23.2 | Consent of EFP Rotenberg, LLP* | |
| 31.1 | Certification of Chief Executive Officer Pursuant to Rule 13a-14(a).* | |
| 31.2 | Certification of Chief Financial Officer Pursuant to Rule 13a-14(a).* | |
| 32.1 | Certification of Chief Executive Officer Pursuant to 18 U.S.C. Section 1350.* | |
| 32.2 | Certification of Chief Financial Officer Pursuant to 18 U.S.C. Section 1350.* | |
| † | Denotes a management contract, compensatory plan or arrangement. |
| * | Filed herewith. |
77
Table of Contents
Pursuant to the requirements of Section 13 or 15(d) of the Securities Exchange Act of 1934, the registrant has duly caused this report to be signed on its behalf by the undersigned, thereunto duly authorized.
| By: | /s/ Norbert Sporns | |
| Name: | Norbert Sporns | |
| Title: | Chief Executive Officer and President | |
| March 15, 2010 | ||
| By: | /s/ Jean–Pierre Dallaire | |
| Name: | Jean–Pierre Dallaire | |
| Title: | Chief Financial Officer | |
| March 15, 2010 | ||
Pursuant to the requirements of the Securities Exchange Act of 1934, this report has been signed below by the following persons oh behalf of the registrant and in the capacities and on the dates indicated.
| SIGNATURE |
TITLE |
DATE | ||
| /s/ Norbert Sporns |
Chief Executive Officer, President and Director | March 15, 2010 | ||
| Norbert Sporns | (Principal Executive Officer) | |||
| /s/ Lillian Wang |
Secretary, Chairman of the Board of Directors and Director | March 15, 2010 | ||
| Lillian Wang | ||||
| /s/ Harry Wang |
Chief Operating Officer and Director | March 15, 2010 | ||
| Harry Wang | ||||
| /s/ Andrew Intrater |
Independent Non-Executive Director | March 15, 2010 | ||
| Andrew Intrater | ||||
| /s/ Fred Bild |
Independent Non-Executive Director | March 15, 2010 | ||
| Fred Bild | ||||
| /s/ Daniel Too |
Independent Non-Executive Director | March 15, 2010 | ||
| Daniel Too | ||||
| /s/ Jean-Pierre Dallaire |
Chief Financial Officer | March 15, 2010 | ||
| Jean-Pierre Dallaire | (Principal Accounting Officer) | |||
| /s/ Kevin M. Fitzsimmons |
Independent Non-Executive Director | March 15, 2010 | ||
| Kevin M. Fitzsimmons | ||||
78
Table of Contents
EXHIBIT INDEX
| Exhibit No. |
Description | |
| 3.1(a) | Certificate of Incorporation of HQ Sustainable Maritime Industries, Inc., as amended (incorporated by reference to Exhibit 2 to the Schedule 14C of Process Equipment, Inc. (SEC file No. 0-18980), filed with the SEC on April 28, 2004). | |
| 3.1(b) | Certificate of Amendment of Certificate of Incorporation, dated December 28, 2006, of HQ Sustainable Maritime Industries, Inc. (incorporated by reference to Exhibit 3.1 to Amendment No. 1 to Form SB-2 (SEC File Number 333-139454), filed with the SEC on April 20, 2007). | |
| 3.2 | By-laws of HQ Sustainable Maritime Industries, Inc. (incorporated by reference to Exhibit 3 to the Schedule 14C of Process Equipment, Inc. (SEC file No. 0-18980), filed with the SEC on April 28, 2004). | |
| 4.1 | Form of Rights and Preferences of Preferred Stock (incorporated by reference to Form 14C (SEC File Number 0-18980), filed with the SEC on October 3, 2005). | |
| 4.2 | Form of Subscription Agreement between HQ Sustainable Maritime Industries, Inc. and Certain Investors, exhibits attached (incorporated by reference to Exhibit 4.1 to Form 8-K (SEC File Number 0-18980), filed with the SEC on January 26, 2006). | |
| 4.3 | Form of Stock Purchase Agreement by and among Process Equipment, Inc. and certain Investors, dated April 21, 2004 (incorporated by reference to Exhibit 10.19 to Form SB-2 (SEC File Number 333-139454), filed with the SEC on December 18, 2006). | |
| 4.4 | Form of Registration Rights Agreement by and among Process Equipment, Inc. and certain Investors, dated April 21, 2004 (incorporated by reference to Exhibit 10.20 to Form SB-2 (SEC File Number 333-139454), filed with the SEC on December 18, 2006). | |
| 10.1† | Employment Agreement, effective as of April 1, 2004, between HQ Sustainable Maritime Industries, Inc. and Harry Wang (incorporated by reference to Exhibit 10.1 to Form 10-QSB (SEC File Number 0-18980), filed with the SEC on August 13, 2004). | |
| 10.2† | Amendment No. 1 to Employment Agreement, dated July, 2005, between HQ Sustainable Maritime Industries, Inc. and Harry Wang (incorporated by reference to Exhibit 10.16 to Form 10-KSB (SEC File Number 18980), filed with the SEC on April 11, 2005). | |
| 10.3† | Employment Agreement, effective as of April 1, 2004, between HQ Sustainable Maritime Industries, Inc. and Lillian Wang Li (incorporated by reference to Exhibit 10.2 to Form 10-QSB (SEC File Number 0-18980), filed with the SEC on August 13, 2004). | |
| 10.4† | Amendment No. 1 to Employment Agreement, dated July, 2005, between HQ Sustainable Maritime Industries, Inc. and Lillian Wang Li (incorporated by reference to Exhibit 10.15 to Form 10-KSB (SEC File Number 18980), filed with the SEC on April 11, 2005). | |
| 10.5† | Employment Agreement, effective as of April 1, 2004, between HQ Sustainable Maritime Industries, Inc. and Norbert Sporns (incorporated by reference to Exhibit 10.3 to Form 10-QSB (SEC File Number 0-18980), filed with the SEC on August 13, 2004). | |
| 10.6† | Amendment No. 1 to Employment Agreement, dated July, 2005, between HQ Sustainable Maritime Industries, Inc. and Norbert Sporns (incorporated by reference to Exhibit 10.14 to Form 10-KSB (SEC File Number 18980), filed with the SEC on April 11, 2005). | |
| 10.7† | Employment Agreement, dated as of September 1, 2004, between HQ Sustainable Maritime Industries Inc. and Jean-Pierre Dallaire (incorporated by reference to Exhibit 10.3 to Form 10-QSB (Commission file No. 0-18980), filed with the Commission on November 15, 2004). | |
| 10.8† | Employment Agreement, dated as of June 28, 2006, between HQ Sustainable Maritime Industries Inc. and Trond Ringstad (incorporated by reference to Exhibit 10.13 Form SB-2 (Commission file No. 333-139454), filed with the Commission on December 18, 2006). | |
| 10.9† | Independent Non-Executive Director Agreement, dated as of June 15, 2004, between HQ Sustainable Maritime Industries Inc. and Fred Bild (incorporated by reference to Exhibit 10.4 to Form 10-QSB (SEC file No. 0-18980), filed with the SEC on August 13, 2004). | |
79
Table of Contents
| Exhibit No. |
Description | |
| 10.10† | Independent Non-Executive Director Agreement, dated as of June 15, 2004, between HQ Sustainable Maritime Industries Inc. and Jacques Vallée (incorporated by reference to the Report on Form 10-QSB (SEC file No. 0-18980), filed with the SEC on August 13, 2004). | |
| 10.11† | Independent Non-Executive Director Agreement, dated as of September 2, 2004, between HQ Sustainable Maritime Industries Inc. and Daniel Too (incorporated by reference to Exhibit 10.2 to Form 10-QSB (SEC file No. 0-18980), filed with the SEC on November 15, 2004). | |
| 10.12† | Form of Stock Option Grant Notice (incorporated by reference to Exhibit 10.1 to Form 8-K (SEC File Number 0-18980), filed with the SEC on December 3, 2004). | |
| 10.13† | Form of Option Agreement (incorporated by reference to Exhibit 10.2 to Form 8-K (SEC File Number 0-18980), filed with the SEC on December 3, 2004). | |
| 10.14† | Form of Exercise Agreement (incorporated by reference to Exhibit 10.3 to Form 8-K (SEC File Number 0-18980), filed with the SEC on December 3, 2004). | |
| 10.15 | Agreement, dated as of November 4, 2004, between HQ Sustainable Maritime Industries, Inc. and Sino-Sult Canada (S.S.C.) Limited (incorporated by reference to Exhibit 10.1 to Form 10-QSB (SEC file No. 0-18980), filed with the SEC on November 15, 2004). | |
| 10.16 | Form of Purchase Agreement between HQ Sustainable Maritime Industries, Inc. and Certain Investors dated November 8, 2006 (incorporated by reference to Exhibit 4.1 to Form 8-K (SEC File Number 18980), filed with the SEC on November 13, 2006). | |
| 10.17 | Form of Underwriters’ Purchase Option between HQ Sustainable Maritime Industries, Inc. and Several Underwriters (incorporated by reference to Exhibit 10.24 to Amendment No. 2 to Form SB-2 (SEC File Number 333-139454), filed with the SEC on May 24, 2007). | |
| 10.18 | Melbourne Tower Lease, dated November 22, 2005, between Doncaster Investments NV, Inc. and HQ Sustainable Maritime Industries, Inc (incorporated by reference to Exhibit 10.18 to Form SB-2 (SEC File Number 333-139454), filed with the SEC on December 18, 2006). | |
| 10.19 | Waiver and Amendment Agreement between HQ Sustainable Maritime Industries, Inc. and Certain Investors, dated February 22, 2008 (incorporated by reference to Exhibit 10.24 to Amendment No. 5 to Form S-3 (SEC File Number 333-143453), filed with the SEC on May 8, 2008). | |
| 10.20 | Contract for Land Use Rights Transfer between Hainan Hengtian Industry Co., Ltd and Hainan Yu Bao Feedstuff Co., Ltd. dated October 18, 2006 (incorporated by reference to Exhibit 10.25 to Amendment No. 2 to Form SB-2 (SEC File Number 333-139454), filed with the SEC on May 24, 2007). | |
| 10.21 | Contract for Land Attachment Transfer between Hainan Hengtian Industry Co., Ltd and Hainan Yu Bao Feedstuff Co., Ltd. dated December 20, 2006 (incorporated by reference to Exhibit 10.26 to Amendment No. 2 to Form SB-2 (SEC File Number 333-139454), filed with the SEC on May 24, 2007). | |
| 10.22† | 2009 Stock Option Plan (incorporated by reference to Exhibit 10.22 to Annual Report on Form 10-K (SEC File Number 001-33473), filed with the SEC on March 12, 2009). | |
| 21.1 | Subsidiaries of HQ Sustainable Maritime Industries, Inc.* | |
| 23.1 | Consent of Schwartz Levitsky Feldman LLP* | |
| 23.2 | Consent of EFP Rotenberg, LLP* | |
| 31.1 | Certification of Chief Executive Officer Pursuant to Rule 13a-14(a).* | |
| 31.2 | Certification of Chief Financial Officer Pursuant to Rule 13a-14(a).* | |
| 32.1 | Certification of Chief Executive Officer Pursuant to 18 U.S.C. Section 1350.* | |
| 32.2 | Certification of Chief Financial Officer Pursuant to 18 U.S.C. Section 1350.* | |
| † | Denotes a management contract, compensatory plan or arrangement. |
| * | Filed herewith. |
80