Attached files
| file | filename |
|---|---|
| EX-21 - SUBSIDIARIES - FARMERS CAPITAL BANK CORP | exhibit21.htm |
| EX-23 - CROWE HORWATH CONSENT - FARMERS CAPITAL BANK CORP | croweconsent.htm |
| EX-31.2 - CFO CERTIFICATION - FARMERS CAPITAL BANK CORP | cfocertification.htm |
| EX-31.1 - CEO CERTIFICATION - FARMERS CAPITAL BANK CORP | ceocertification.htm |
| EX-32 - CEO/CFO CERTIFICATIONS - FARMERS CAPITAL BANK CORP | sox906certifications.htm |
| EX-99.2 - CFO CERTIFICATION-TARP - FARMERS CAPITAL BANK CORP | cfotarpcertification.htm |
| EX-99.1 - CEO CERTIFICATION-TARP - FARMERS CAPITAL BANK CORP | ceotarpcertification.htm |
UNITED STATES
SECURITIES AND EXCHANGE COMMISSION
Washington, D.C. 20549
FORM 10-K
|
x
|
ANNUAL REPORT PURSUANT TO SECTION 13 OR 15(d) OF THE SECURITIES EXCHANGE ACT OF 1934
|
For the Fiscal Year Ended December 31, 2009
or
|
o
|
TRANSITION REPORT PURSUANT TO SECTION 13 OR 15(d) OF THE SECURITIES EXCHANGE ACT OF 1934
|
Commission File Number 0-14412
|
Farmers Capital Bank Corporation
|
||
|
(Exact name of registrant as specified in its charter)
|
|
Kentucky
|
61-1017851
|
|
|
(State or other jurisdiction of
incorporation or organization)
|
(I.R.S. Employer
Identification Number)
|
|
P.O. Box 309, 202 West Main St.
|
||
|
Frankfort, Kentucky
|
40601
|
|
|
(Address of principal executive offices)
|
(Zip Code)
|
Registrant's telephone number, including area code: (502) 227-1600
Securities registered pursuant to Section 12(b) of the Act:
|
Common Stock - $.125 per share Par Value
|
The NASDAQ Global Select Market
|
|
|
(Title of each class)
|
(Name of each exchange on which registered)
|
Securities registered pursuant to Section 12(g) of the Act:
|
None
|
||
|
(Title of Class)
|
Indicate by check mark if the registrant is a well-known seasoned issuer, as defined in Rule 405 of the Securities Act.
|
Yes o
|
No x
|
Indicate by check mark if the registrant is not required to file reports pursuant to Section 13 or Section 15(d) of the Act.
|
Yes o
|
No x
|
Indicate by check mark whether the registrant: (1) has filed all reports required to be filed by Section 13 or 15(d) of the Securities Exchange Act of 1934 during the preceding 12 months (or for such shorter period that the registrant was required to file such reports), and (2) has been subject to such filing requirements for the past 90 days.
|
Yes x
|
No o
|
Indicate by check mark if disclosure of delinquent filers pursuant to Item 405 of Regulation S-K (§229.405 of this chapter) is not contained herein, and will not be contained, to the best of registrant's knowledge, in definitive proxy or information statements incorporated by reference in Part III of this Form 10-K or any amendment to this Form 10-K. o
8
Indicate by check mark whether the registrant is a large accelerated filer, an accelerated filer, or a non-accelerated filer, or a smaller reporting company. See the definitions of “large accelerated filer”, “accelerated filer” and “smaller reporting company” in Rule 12b-2 of the Exchange Act.
|
Large accelerated filer o
|
Accelerated filer x
|
|
|
Non-accelerated filer o
|
Smaller reporting company o
|
Indicate by check mark whether the registrant is a shell company (as defined in Rule 12b-2 of the Act)
|
Yes o
|
No x
|
The aggregate market value of the registrant’s outstanding voting stock held by non-affiliates on June 30, 2009 (the last business day of the registrant’s most recently completed second fiscal quarter) was $185 million based on the closing price per share of the registrant’s common stock reported on the NASDAQ.
As of March 11, 2010 there were 7,378,605 shares of common stock outstanding.
Documents incorporated by reference:
Portions of the Registrant’s Proxy Statement relating to the Registrant’s 2010 Annual Meeting of Shareholders are incorporated by reference into Part III.
An index of exhibits filed with this Form 10-K can be found on page 106.
9
FARMERS CAPITAL BANK CORPORATION
FORM 10-K
INDEX
|
Page
|
|||
|
Item 1.
|
11
|
||
|
Item 1A.
|
21
|
||
|
Item 1B.
|
30
|
||
|
Item 2.
|
30
|
||
|
Item 3.
|
31
|
||
|
Item 4.
|
31
|
||
|
Item 5.
|
31
|
||
|
Item 6.
|
34
|
||
|
Item 7.
|
35
|
||
|
Item 7A.
|
60
|
||
|
Item 8.
|
61
|
||
|
Item 9.
|
100
|
||
|
Item 9A.
|
100
|
||
|
Item 9B.
|
101
|
||
|
Item 10.
|
102
|
||
|
Item 11.
|
102
|
||
|
Item 12.
|
102
|
||
|
Item 13.
|
102
|
||
|
Item 14.
|
102
|
||
|
Item 15.
|
102
|
||
|
105
|
|||
|
106
|
|||
10
The disclosures set forth in this item are qualified by Item 1A (“Risk Factors”) beginning on page 16 and the section captioned “Forward-Looking Statements” in Item 7 (“Management’s Discussion and Analysis of Financial Condition and Results of Operations”) beginning on page 35 of this report and other cautionary statements contain elsewhere in this report.
Organization
Farmers Capital Bank Corporation (the “Registrant”, “Company”, “we”, “us”, or “Parent Company”) is a bank holding company. The Registrant was originally formed as a bank holding company under the Bank Holding Company Act of 1956, as amended, on October 28, 1982 under the laws of the Commonwealth of Kentucky. During 2000, the Federal Reserve Board granted the Company financial holding company status. The Company withdrew its financial holding company election subsequent to the sale KHL Holdings, LLC (“KHL Holdings”) during the third quarter of 2009. The Company’s subsidiaries provide a wide range of banking and bank-related services to customers throughout Central and Northern Kentucky. The bank subsidiaries owned by the Company include Farmers Bank & Capital Trust Company ("Farmers Bank"), Frankfort, Kentucky; United Bank & Trust Company ("United Bank"), Versailles, Kentucky; The Lawrenceburg Bank and Trust Company ("Lawrenceburg Bank"), Lawrenceburg, Kentucky; First Citizens Bank (“First Citizens”), Elizabethtown, Kentucky; and Citizens Bank of Northern Kentucky, Inc. (“Citizens Northern”), Newport, Kentucky.
The Company also owns FCB Services, Inc., ("FCB Services"), a nonbank data processing subsidiary located in Frankfort, Kentucky; Kentucky General Life Insurance Company, Inc., (“Kentucky General Life”), an inactive nonbank insurance agency subsidiary located in Frankfort, Kentucky; Kentucky General Holdings, LLC, (“Kentucky General”), in Frankfort, Kentucky, which previously held a 50% voting interest in KHL Holdings prior to its sale. KHL Holdings owned a 100% interest in Kentucky Home Life Insurance Company (“KHL Insurance”) that it acquired in January 2005; FFKT Insurance Services, Inc., (“FFKT Insurance”), a captive property and casualty insurance company in Frankfort, Kentucky; EKT Properties, Inc., established during 2008 to manage and liquidate certain real estate properties repossessed by the Company; and Farmers Capital Bank Trust I (“Trust I”), Farmers Capital Bank Trust II (“Trust II”), and Farmers Capital Bank Trust III (“Trust III”), which are unconsolidated trusts established to complete the private offering of trust preferred securities. In the case of Trust I and Trust II, the proceeds of the offerings were used to finance the cash portion of the acquisition of Citizens Bancorp Inc. (“Citizens Bancorp”). For Trust III, the proceeds of the offering were used to finance the cost of acquiring Company shares under a share repurchase program.
The Company provides a broad range of financial services to individuals, corporations, and others through its 36 banking locations in 23 communities throughout Central and Northern Kentucky. These services primarily include the activities of lending, receiving deposits, providing cash management services, safe deposit box rental, and trust activities. While the chief decision-makers monitor the revenue streams of the various products and services, operations are managed and financial performance is evaluated on a Company-wide basis. Operating segments are aggregated into one as operating results for all segments are similar. Accordingly, all of the financial service operations are considered by management to be aggregated in one reportable operating segment. As of December 31, 2009, the Company had $2.2 billion in consolidated assets.
Organization Chart
Subsidiaries of Farmers Capital Bank Corporation at December 31, 2009 are indicated in the table that follows. Percentages reflect the ownership interest held by the parent company of each of the subsidiaries. Tier 2 subsidiaries are direct subsidiaries of Farmers Capital Bank Corporation. Tier 3 subsidiaries are direct subsidiaries of the Tier 2 subsidiary listed immediately above them. Tier 4 subsidiaries are direct subsidiaries of the Tier 3 subsidiary listed immediately above them. Tier 5 subsidiaries are direct subsidiaries of the Tier 4 subsidiary listed immediately above them.
|
Tier
|
Entity
|
||||
|
1
|
Farmers Capital Bank Corporation, Frankfort, KY
|
||||
|
2
|
United Bank & Trust Company, Versailles, KY 100%
|
||||
|
3
|
EGT Properties, Inc., Georgetown, KY 100%
|
||||
|
4
|
NUBT Properties, LLC, Georgetown, KY 83%
|
||||
|
5
|
Flowing Creek Realty, LLC, Bloomfield, IN 67%
|
||||
|
2
|
The Lawrenceburg Bank and Trust Company, Lawrenceburg KY 100%
|
||||
|
2
|
Farmers Bank & Capital Trust Company, Frankfort, KY 100%
|
||||
|
3
|
Farmers Bank Realty Co., Frankfort, KY 100%
|
||||
|
3
|
Leasing One Corporation, Frankfort, KY 100%
|
||||
11
|
3
|
EG Properties, Inc., Frankfort, KY 100%
|
||||
|
3
|
Austin Park Apartments, LTD, Frankfort, KY 99%
|
||||
|
3
|
FA Properties, Inc., Frankfort, KY 100%
|
||||
|
3
|
FORE Realty, LLC, Frankfort, KY 100%
|
||||
|
3
|
Frankfort Apartments II, LTD, Frankfort, KY 99.9%
|
||||
|
3
|
St. Clair Properties, LLC, Frankfort, KY 95%
|
||||
|
3
|
Farmers Capital Insurance Corporation, Frankfort, KY 100%
|
||||
|
4
|
Farmers Fidelity Insurance Agency, LLP, Lexington, KY 50%
|
||||
|
2
|
First Citizens Bank, Elizabethtown, KY 100%
|
||||
|
2
|
Citizens Bank of Northern Kentucky, Inc., Newport, KY 100%
|
||||
|
3
|
ENKY Properties, Inc., Newport, KY 100%
|
||||
|
4
|
NUBT Properties, LLC, Georgetown, KY 17%
|
||||
|
5
|
Flowing Creek Realty, LLC, Bloomfield, IN 67%
|
||||
|
2
|
FCB Services, Inc., Frankfort, KY 100%
|
||||
|
2
|
Kentucky General Holdings, LLC, Frankfort, KY 100%
|
||||
|
2
|
FFKT Insurance Services, Inc., Frankfort, KY 100%
|
||||
|
2
|
Farmers Capital Bank Trust I, Frankfort, KY 100%
|
||||
|
2
|
Farmers Capital Bank Trust II, Frankfort, KY 100%
|
||||
|
2
|
Farmers Capital Bank Trust III, Frankfort, KY 100%
|
||||
|
2
|
EKT Properties, Inc. Frankfort, KY (100%)
|
||||
|
2
|
Kentucky General Life Insurance Company, Frankfort, KY (Inactive)
|
||||
Farmers Bank and Subsidiaries
Farmers Bank, originally organized in 1850, is a state chartered bank engaged in a wide range of commercial and personal banking activities, which include accepting savings, time and demand deposits; making secured and unsecured loans to corporations, individuals and others; providing cash management services to corporate and individual customers; issuing letters of credit; renting safe deposit boxes; and providing funds transfer services. The bank's lending activities include making commercial, construction, mortgage, and personal loans and lines of credit. The bank serves as an agent in providing credit card loans. It acts as trustee of personal trusts, as executor of estates, as trustee for employee benefit trusts and as registrar, transfer agent and paying agent for bond issues. Farmers Bank is the general depository for the Commonwealth of Kentucky and has been for more than 70 years.
Farmers Bank is the largest bank operating in Franklin County based on total bank deposits in the county. It conducts business in its principal office and four branches within Frankfort, the capital of Kentucky. Franklin County is a diverse community, including government, commerce, finance, industry, medicine, education and agriculture. The bank also serves many individuals and corporations throughout Central Kentucky. On December 31, 2009, it had total consolidated assets of $591 million, including loans net of unearned income of $325 million. On the same date, total deposits were $437 million and shareholders' equity totaled $49.4 million.
On October 23, 2009, the Company announced that it is in the preliminary stages of merging Lawrenceburg Bank into Farmers Bank. The Company applied for regulatory approval for the merger in the first quarter of 2010 with an anticipated effective date for the merger in the second quarter of 2010.
Farmers Bank had nine active subsidiaries during 2009: Farmers Bank Realty Co. ("Farmers Realty"), Leasing One Corporation ("Leasing One"), Farmers Capital Insurance Corporation (“Farmers Insurance”), EG Properties, Inc. (“EG Properties”), FA Properties, Inc. (“FA Properties”), FORE Realty, LLC (“FORE Realty”), St. Clair Properties, LLC (“St. Clair Properties”), Austin Park Apartments, LTD (“Austin Park”), and Frankfort Apartments II, LTD (“Frankfort Apartments”).
Farmers Realty was incorporated in 1978 for the purpose of owning certain real estate used by the Company and Farmers Bank in the ordinary course of business. Farmers Realty had total assets of $3.3 million on December 31, 2009.
12
Leasing One was incorporated in August 1993 to operate as a commercial equipment leasing company. It is located in Frankfort and is currently licensed to conduct business in twelve states. At year-end 2009, it had total assets of $19.6 million, including leases net of unearned income of $13.0 million.
Farmers Insurance was organized in 1988 to engage in insurance activities permitted to the Company under federal and state law. Farmers Bank capitalized this corporation in December 1998. Farmers Insurance acts as an agent for Commonwealth Land Title Co. At year-end 2009 it had total assets of $659 thousand. Farmers Insurance holds a 50% interest in Farmers Fidelity Insurance Company, LLP (“Farmers Fidelity”). The Creech & Stafford Insurance Agency, Inc., an otherwise unrelated party to the Company, also holds a 50% interest in Farmers Fidelity. Farmers Fidelity is a direct writer of property and casualty coverage, both individual and commercial.
In November 2002 Farmers Bank incorporated EG Properties. EG Properties is involved in real estate management and liquidation for certain properties repossessed by Farmers Bank. It had total assets of $3.7 million at December 31, 2009. In July 2008, Farmers Bank incorporated FA Properties, which owns automobiles that are used by the Company and Farmers Bank in the ordinary course of business. It had total assets of $359 thousand at year-end 2009. FORE Realty was organized in December 2009 for the purpose of managing and liquidating certain other properties repossessed by Farmers Bank. It had total assets of $892 thousand at year-end 2009.
Farmers Bank is a limited partner in Austin Park and Frankfort Apartments, two low income housing tax credit partnerships located in Frankfort, Kentucky. These investments provide for federal income tax credits to the Company. Farmers Bank’s aggregate investment in these partnerships was $619 thousand at year-end 2009. In December 2009 Farmers Bank became a limited partner in St. Clair Properties. The objective of St. Clair Properties is to restore and preserve certain qualifying historic structures in Frankfort for which the Company receives federal and state tax credits. Farmers Bank’s investment in St. Clair Properties was $23 thousand at year-end 2009. This amount represents Farmers Bank’s initial investment, which is expected to increase approximately $200 thousand when the final credit amounts are determined.
United Bank and Subsidiaries
On February 15, 1985, the Company acquired United Bank, a state chartered bank originally organized in 1880. It is engaged in a general banking business providing full service banking to individuals, businesses and governmental customers. On November 1, 2008, the Company merged Farmers Bank & Trust Company (“Farmers Georgetown”) and Citizens Bank of Jessamine County (“Citizens Jessamine”) into United Bank. Each of these three banks was previously a wholly-owned subsidiary of the Company. United Bank conducts business in its principal office and two branches in Woodford County, Kentucky, four branches in Scott County, Kentucky, two branches in Fayette County, Kentucky, and four branches in Jessamine County, Kentucky. Based on total bank deposits in Woodford County, United Bank is the second largest bank operating in Woodford County with total consolidated assets of $736 million and total deposits of $537 million at December 31, 2009.
United Bank had one subsidiary during 2009, EGT Properties, Inc. EGT Properties was created in March 2008 as a subsidiary of Farmers Georgetown before its merger with United Bank and is involved in real estate management and liquidation for certain repossessed properties of United Bank. In addition, EGT Properties holds an 83% interest in NUBT Properties, LLC (“NUBT”), the parent company of Flowing Creek Realty, LLC (“Flowing Creek”). Flowing Creek holds real estate that has been repossessed by multiple subsidiaries of the Company along with parties unrelated to the Company. NUBT holds a 67% interest in Flowing Creek and unrelated financial institutions hold the remaining 33% interest. EGT Properties had total assets of $18.6 million at year-end 2009.
Prior to 2009, United Bank operated EV Properties, Inc. (“EV Properties”). EV Properties was involved in real estate management and liquidation for certain properties repossessed by United Bank. EV Properties was dissolved on December 31, 2008.
Lawrenceburg Bank
On June 28, 1985, the Company acquired Lawrenceburg Bank, a state chartered bank originally organized in 1885. It is engaged in a general banking business providing full service banking to individuals, businesses and governmental customers. During 1998, it moved its charter and main office to Harrodsburg, Kentucky in Mercer County. In 2007, it changed from a national to a state chartered bank and subsequently returned its charter location back to Lawrenceburg. Lawrenceburg Bank conducts business at its main office and one branch site in Anderson County, Kentucky, one branch in Mercer County, Kentucky, and one branch in Boyle County, Kentucky. Based on total bank deposits in Anderson County, Lawrenceburg Bank is the largest bank operating in Anderson County. Total assets were $245 million and total deposits were $198 million at December 31, 2009.
On October 23, 2009, the Company announced that it is in the preliminary stages of merging Lawrenceburg Bank into Farmers Bank. The Company applied for regulatory approval for the merger in the first quarter of 2010 with an anticipated effective date for the merger in the second quarter of 2010.
First Citizens
On March 31, 1986, the Company acquired First Citizens, a state chartered bank originally organized in 1964. It is engaged in a general banking business providing full service banking to individuals, businesses and governmental customers. It conducts business at its main
13
office and three branches in Hardin County, Kentucky along with two branch offices in Bullitt County, Kentucky. During 2003 First Citizens incorporated EH Properties, Inc. This company was involved in real estate management and liquidation for certain properties repossessed by First Citizens. EH Properties was dissolved in January, 2007.
On October 8, 2004, First Citizens acquired Financial National Electronic Transfer, Inc. (“FiNET”), a data processing company that specializes in the processing of federal benefit payments and military allotments, headquartered in Radcliff, Kentucky. Effective January 1, 2005 FiNET was merged into First Citizens. These services are now operated using the name of FirstNet.
On November 2, 2006, First Citizens announced the signing of a definitive agreement to acquire the military allotment operation of PNC Bank, National Association based in Elizabethtown, Kentucky. The operation specializes in the processing of data associated with military allotments and federal benefit payments. The transaction was completed on January 12, 2007 and merged into First Citizens and its FirstNet operations.
Based on total bank deposits in Hardin County, First Citizens ranks third in size compared to all banks operating in Hardin County. Total assets were $302 million and total deposits were $257 million at December 31, 2009.
Citizens Northern
On December 6, 2005, the Company acquired Citizens Bancorp in Newport, Kentucky. Citizens Bancorp was subsequently merged into Citizens Acquisition, a former bank holding company subsidiary of the Company. During January 2007, Citizens Acquisition was merged into the Company, leaving Citizens Northern as a direct subsidiary of the Company. Citizens Northern is a state chartered bank organized in 1993 and is engaged in a general banking business providing full service banking to individuals, businesses, and governmental customers. It conducts business in its principal office in Newport and four branches in Campbell County, Kentucky, one branch in Boone County, Kentucky and two branches in Kenton County, Kentucky. Based on total bank deposits in Campbell County, Citizens Northern ranks second in size compared to all banks operating in Campbell County. At year-end 2009 it had total assets and deposits of $274 million and $214 million, respectively. Citizens Financial Services, formerly an investment brokerage subsidiary of Citizens Acquisition, was dissolved during 2006.
In March 2008 Citizens Northern incorporated ENKY Properties, Inc. (“ENKY”). ENKY was established to manage and liquidate certain real estate properties repossessed by Citizens Northern. In addition, ENKY holds a 17% interest in NUBT, the parent company of Flowing Creek. Flowing Creek holds real estate that has been repossessed by multiple subsidiaries of the Company along with parties unrelated to the Company. NUBT holds a 67% interest in Flowing Creek and unrelated financial institutions hold the remaining 33% interest. ENKY had total assets of $1.2 million at year-end 2009.
Farmers Georgetown
On June 30, 1986, the Company acquired Farmers Georgetown, a state chartered bank originally organized in 1850 located in Scott County, Kentucky. On November 1, 2008, the Company merged Farmers Georgetown into United Bank. Based on the deposits at its Scott County locations, United Bank has the largest market presence in Scott County.
Citizens Jessamine
On October 1, 2006, the Company acquired Citizens National Bancshares (“Citizens Bancshares”), the former one-bank holding company of Citizens Jessamine. Citizens Bancshares was subsequently merged into the Company, leaving Citizens Jessamine as a direct subsidiary of the Company. Citizens Jessamine, organized in 1996 as a national charter bank located in Jessamine County, Kentucky, was merged into United Bank on November 1, 2008. Based on the deposits at its Jessamine County locations, United Bank has the largest market presence in Jessamine County.
Nonbank Subsidiaries
FCB Services, organized in 1992, provides data processing services and support for the Company and its subsidiaries. It is located in Frankfort, Kentucky. It also performs data processing services for nonaffiliated entities. FCB Services had total assets of $4.1 million at December 31, 2009.
Kentucky General was incorporated in November 2004. Kentucky General previously held a 50% voting interest in KHL Holdings prior to its sale during the third quarter of 2009. KHL Holdings owned a 100% interest in KHL Insurance that it acquired in 2005. KHL Insurance writes credit life and health insurance in Kentucky.
EKT was created in September 2008 to manage and liquidate certain real estate properties repossessed by the Company’s subsidiary banks. On December 31, 2009, EKT had total assets of $4.1 million.
Kentucky General Life was incorporated during 2000 to engage in insurance activities permitted by federal and state law. This corporation has remained inactive since its inception.
14
Trust I, Trust II, and Trust III are each separate Delaware statutory business trusts sponsored by the Company. The Company completed two private offerings of trust preferred securities during 2005 through Trust I and Trust II totaling $25.0 million. During 2007, the Company completed a private offering of trust preferred securities totaling $22.5 million. The Company owns all of the common securities of each of the Trusts. The Company does not consolidate the Trusts into its financial statements consistent with applicable accounting standards.
FFKT Insurance was incorporated during 2005. It is a captive property and casualty insurance company insuring primarily deductible exposures and uncovered liability related to properties of the Company. It had total assets of $3.8 million at December 31, 2009.
Lending
A significant part of the Company’s operating activities include originating loans, approximately 84% of which are secured by real estate at December 31, 2009. Real estate lending primarily includes loans secured by owner and non-owner occupied one-to-four family residential properties as well as commercial real estate mortgage loans to developers and owners of other commercial real estate. Real estate lending primarily includes both variable and adjustable rate products. Loan rates on variable rate loans generally adjust upward or downward immediately based on changes in the loan’s index, normally prime rate as published in the Wall Street Journal. Rates on adjustable rate loans move upward or downward after an initial fixed term of normally one, three, or five years. Rate adjustments on adjustable rate loans are made annually after the initial fixed term expires and are indexed mainly to shorter-term Treasury indexes. Generally, variable and adjustable rate loans contain provisions that cap the amount of interest rate increases over the life of the loan of up to 600 basis points and lifetime floors of 100 basis points. In addition to the lifetime caps and floors on rate adjustments, loans secured by residential real estate typically contain provisions that limit annual increases at a maximum of 100 basis points. There is typically no annual limit applied to loans secured by commercial real estate.
The Company also makes fixed rate commercial real estate loans to a lesser extent with repayment terms generally not exceeding 12 months. The Company’s subsidiary banks make first and second residential mortgage loans secured by real estate not to exceed 90% loan to value without seeking third party guarantees. Commercial real estate loans are made primarily to small and mid-sized businesses, secured by real estate not exceeding 80% loan to value. Other commercial loans are asset based loans secured by equipment and lines of credit secured by receivables and include lending across a diverse range of business types.
Commercial lending and real estate construction lending, including commercial leasing, generally includes a higher degree of credit risk than other loans, such as residential mortgage loans. Commercial loans, like other loans, are evaluated at the time of approval to determine the adequacy of repayment sources and collateral requirements. Collateral requirements vary to some degree among borrowers and depend on the borrower’s financial strength, the terms and amount of the loan, and collateral available to secure the loan. Credit risk results from the decreased ability or willingness to pay by a borrower. Credit risk also results when a liquidation of collateral occurs and there is a shortfall in collateral value as compared to a loans outstanding balance. For construction loans, inaccurate initial estimates of a project’s costs and the property’s completed value could weaken the Company’s position and lead to the property having a value that is insufficient to satisfy full payment of the amount of funds advanced for the property. Secured and unsecured consumer loans generally are made for automobiles, boats, and other motor vehicles. In most cases loans are restricted to the subsidiaries' general market area.
Supervision and Regulation
The Company and its subsidiaries are subject to comprehensive supervision and regulation that affect virtually all aspects of their operations. These laws and regulations are primarily intended to protect depositors and borrowers and, to a lesser extent, stockholders. Changes in applicable laws, regulations, or in the policies of banking and other government regulators may have a material adverse effect on our current or future business. The following summarizes certain of the more important aspects of the relevant statutory and regulatory provisions.
Supervisory Authorities
The Company is a bank holding company, registered with and regulated by the Federal Reserve Board (“FRB”). All five of its subsidiary banks are Kentucky state-chartered banks. Three of the Company’s subsidiary banks are members of their regional Federal Reserve Bank. The Company and its subsidiary banks are subject to supervision, regulation and examination by the Federal Deposit Insurance Corporation (“FDIC”) and the Kentucky Department of Financial Institutions (“KDFI”). The regulatory authorities routinely examine the Company and its subsidiary banks to monitor their compliance with laws and regulations, financial condition, adequacy of capital and reserves, quality and documentation of loans, payment of dividends, adequacy of systems and controls, credit underwriting and asset liability management, and the establishment of branches. The Company and its subsidiary banks are required to file regular reports with the FRB, the FDIC and the KDFI, as applicable.
Capital
The FRB, the FDIC, and the KDFI require the Company and its subsidiary banks to meet certain ratios of capital to assets in order to conduct their activities. To be well-capitalized, the institutions must generally maintain a Total Capital ratio of 10% or greater, a Tier 1 Capital ratio of 6% or greater, and a leverage ratio of 5% or better. For the purposes of these tests, Tier 1 Capital consists of common equity
15
and related surplus, retained earnings, and a limited amount of qualifying preferred stock, less goodwill (net of certain deferred tax liabilities) and certain core deposit intangibles. Tier 2 Capital consists of non-qualifying preferred stock, certain types of debt and a limited amount of other items. Total Capital is the sum of Tier 1 and Tier 2 Capital.
In measuring the adequacy of capital, assets are generally weighted for risk. Certain assets, such as cash and U.S. government securities, have a zero risk weighting. Others, such as commercial and consumer loans, have a 100% risk weighting. Risk weightings are also assigned for off-balance sheet items such as loan commitments. The various items are multiplied by the appropriate risk-weighting to determine risk-adjusted assets for the capital calculations. For the leverage ratio mentioned above, assets are not risk-weighted.
If the institution fails to remain well-capitalized, it will be subject to a series of restrictions that increase as the capital condition worsens. For instance, federal law generally prohibits a depository institution from making any capital distribution, including the payment of a dividend or paying any management fee to its holding company, if the depository institution would be undercapitalized as a result. Undercapitalized depository institutions may not accept brokered deposits absent a waiver from the FDIC, are subject to growth limitations, and are required to submit a capital restoration plan for approval, which must be guaranteed by the institution’s parent holding company. Significantly undercapitalized depository institutions may be subject to a number of requirements and restrictions, including orders to sell sufficient voting stock to become adequately capitalized, requirements to reduce total assets, and cessation of receipt of deposits from correspondent banks. Critically undercapitalized institutions are subject to the appointment of a receiver or conservator.
Expansion and Activity Limitations
With prior regulatory approval, the Company may acquire other banks or bank holding companies and its subsidiaries may merge with other banks. Acquisitions of banks located in other states may be subject to certain deposit-percentage, age or other restrictions. During the third quarter of 2009, the Company withdrew its financial company election with the sale of its KHL subsidiary. Financial holding companies and their subsidiaries are permitted to acquire or engage in activities such as insurance underwriting, securities underwriting and distribution, travel agency activities, broad insurance agency activities, merchant banking, and other nonbanking activities that the FRB determines to be financial in nature or complementary to these activities. The FRB normally requires some form of notice or application to engage in or acquire companies engaged in such activities. Under the Bank Holding Company Act and Gramm-Leach-Bliley Act, the Company is generally prohibited from engaging in or acquiring direct or indirect control of more than 5% of the voting shares of any company engaged in activities other than those referred to above.
Limitations on Acquisitions of Bank Holding Companies
In general, other companies seeking to acquire control of a bank holding company such as the Company would require the approval of the FRB under the Bank Holding Company Act. In addition, individuals or groups of individuals seeking to acquire control of a bank holding company such as the Company would need to file a prior notice with the FRB (which the FRB may disapprove under certain circumstances) under the Change in Bank Control Act. Control is conclusively presumed to exist if an individual or company acquires 25% or more of any class of voting securities of the bank holding company. Control may exist under the Change in Bank Control Act if the individual or company acquires 10% or more of any class of voting securities of the bank holding company and no shareholder holds a larger percentage of the subject class of voting securities.
Deposit Insurance
All of the Company’s subsidiary banks are members of the FDIC, and their deposits are insured by the FDIC’s Deposit Insurance Fund up to the amount permitted by law. The Company’s subsidiary banks are thus subject to FDIC deposit insurance assessments. The FDIC utilizes a risk-based assessment system that imposes insurance premiums based upon a risk matrix that takes into account a bank’s capital level and supervisory rating. Under the Federal Deposit Insurance Reform Act of 2005, which became law in 2006, the Company received a one-time assessment credit of $1.2 million that can be applied against future premiums, subject to certain limitations. Based on the one-time assessment credit, the Company was not required to pay any deposit insurance premiums in 2006 and unused credits from 2006 limited the amount of deposit insurance premiums to $55 thousand for 2007. Lower credits remained to offset assessments for 2008 and all such credits were exhausted during 2008. Financing Corporation (“FICO”) assessment costs were $166 thousand and $227 thousand for 2009 and 2008, respectively. FICO is a mixed-ownership government corporation established by the Competitive Equality Banking Act of 1987 possessing assessment powers in addition to the FDIC. The FDIC acts as a collection agent for FICO, whose sole purpose was to function as a financing vehicle for the now defunct Federal Savings & Loan Insurance Corporation.
The Company’s participation in the FDIC’s Transaction Account Guarantee Program initiated during the fourth quarter of 2008 has also contributed to an increase in deposit insurance premiums. More information about this program can be found under the heading “Temporary Liquidity Guarantee Program” that follows. During the fourth quarter of 2008 the FDIC increased the deposit insurance from generally $100 thousand for each separately insured depositor to $250 thousand initially effective until December 31, 2009. The increased limits have been extended to June 30, 2013.
In February 2009, the FDIC adopted a long-term deposit insurance fund (“DIF”) restoration plan as well as an additional emergency assessment for 2009. The restoration plan increases base assessment rates for banks in all risk categories with the goal of raising the DIF
16
reserve ratio from its then-current .40% to its statutorily mandated minimum of 1.15% within eight years (as amended). Beginning April 1, 2009 the FDIC establishes a banks initial base assessment rate, ranging between 12 and 45 basis points, depending on the banks risk category. The initial base assessment rate is then adjusted higher or lower to obtain the total base assessment rate. Adjustments to the initial base assessment rate are based on a banks level of unsecured debt, secured liabilities, and brokered deposits. The total base assessment rate ranges between 7 and 77.5 basis points and is applied to a banks assessable deposits when computing the FDIC insurance assessment amount.
The FDIC’s emergency special assessment for 2009 was adopted on May 22 and supersedes its interim rule adopted in March that would have imposed a 20 basis point assessment with an option for an additional 10 basis point assessment. Under the final rule adopted, the FDIC imposed a special assessment of 5 basis points on a bank’s total assets minus Tier 1 capital as of June 30, 2009 and collected September 30, 2009. The Company paid $1.1 million related to the 2009 special assessment. The final rule also authorizes the FDIC to impose up to two additional 5 basis points assessments if needed while capping each assessment at 10 basis points of the banks assessment base.
In addition to the FDIC’s special assessment for 2009, the FDIC in November 2009 approved a final rule requiring banks to prepay their estimated quarterly assessments for the fourth quarter of 2009 as well as all of 2010, 2011, and 2012 on December 30, 2009. The prepayment was adopted by the FDIC in lieu of an additional special assessment as summarized above. The assessment rate to be used for all periods covered in the prepayment plan was the banks assessment rate in effect as of September 30, 2009. The assessment rate will be increased by 3 basis points for all of 2011 and 2012. The prepayment is based on a bank’s regular assessment base (total domestic deposits) as of September 30, 2009, with an estimated quarterly increase of an estimated 5% annual growth rate through the end of 2012. The Company paid $8.2 million on December 30, 2009 related to this assessment. Prepaid FDIC insurance assessments are included in other assets on the Company’s balance sheet.
Other Statutes and Regulations
The Company and its subsidiary banks are subject to a myriad of other statutes and regulations affecting their activities. Some of the more important are:
Anti-Money Laundering. Financial institutions are required to establish anti-money laundering programs that must include the development of internal policies, procedures, and controls; the designation of a compliance officer; an ongoing employee training program; and an independent audit function to test the performance of the programs. The Company and its subsidiary banks are also subject to prohibitions against specified financial transactions and account relationships as well as enhanced due diligence and “know your customer” standards in their dealings with foreign financial institutions and foreign customers. Financial institutions must take reasonable steps to conduct enhanced scrutiny of account relationships in order to guard against money laundering and to report any suspicious transactions. Recent laws provide the law enforcement authorities with increased access to financial information maintained by banks.
Sections 23A and 23B of the Federal Reserve Act. The Company’s subsidiary banks are limited in their ability to lend funds or engage in transactions with the Company or other non-bank affiliates of the Company, and all transactions must be on an arms’-length basis and on terms at least as favorable to the subsidiary bank as prevailing at the time for transactions with unaffiliated companies.
Dividends. The Parent Company’s principal source of cash flow, including cash flow to pay dividends to its shareholders, is the dividends that it receives from its subsidiary banks. Statutory and regulatory limitations apply to the subsidiary banks’ payments of dividends to the Parent Company as well as to the Parent Company’s payment of dividends to its shareholders. A depository institution may not pay any dividend if payment would cause it to become undercapitalized or if it already is undercapitalized. The federal banking agencies may prevent the payment of a dividend if they determine that the payment would be an unsafe and unsound banking practice. Moreover, the federal agencies have issued policy statements that provide that bank holding companies and insured banks should generally only pay dividends out of current operating earnings.
Participation in the Capital Purchase Program (“CPP”) beginning in the first quarter of 2009 includes certain restrictions on the Company’s ability to pay dividends to its common shareholders. The Company is unable to declare dividend payments on shares of its common stock if it is in arrears on the dividends on its Series A preferred stock issued in connection with its participation in the CPP. Additionally, until January 9, 2012 the Company must have approval from the U.S. Treasury (“Treasury”) before it can increase dividends on its common stock above the last quarterly cash dividend per share it declared prior to October 14, 2008, which was $.33 per share. This restriction no longer applies if all of the Series A preferred stock has been redeemed by the Company or transferred by the Treasury. Additional information about the CPP can be found under the caption titled “Emergency Economic Stabilization Act of 2008 (“EESA”)” that follows.
Community Reinvestment Act. The Company’s subsidiary banks are subject to the provisions of the Community Reinvestment Act of 1977 (“CRA”), as amended, and the federal banking agencies’ related regulations, stating that all banks have a continuing and affirmative obligation, consistent with safe and sound operations, to help meet the credit needs for their entire communities, including low and moderate-income neighborhoods. The CRA requires a depository institution’s primary federal regulator, in connection with its examination of the institution or its evaluation of certain regulatory applications, to assess the institution’s record in assessing and meeting the credit
17
needs of the community served by that institution, including low and moderate-income neighborhoods. The regulatory agency’s assessment of the institution’s record is made available to the public.
Insurance Regulation. The Company’s subsidiaries that may underwrite or sell insurance products are subject to regulation by the Kentucky Department of Insurance.
Consumer Regulation. The activities of the Company and its bank subsidiaries are subject to a variety of statutes and regulations designed to protect consumers. These laws and regulations:
|
|
·
|
limit the interest and other charges collected or contracted for by all of the Company’s subsidiary banks;
|
|
|
·
|
govern disclosures of credit terms to consumer borrowers;
|
|
|
·
|
require financial institutions to provide information to enable the public and public officials to determine whether a financial institution is fulfilling its obligation to help meet the housing needs of the community it serves;
|
|
|
·
|
prohibit discrimination on the basis of race, creed, or other prohibited factors in extending credit;
|
|
|
·
|
require all of the Company’s subsidiary banks to safeguard the personal non-public information of its customers, provide annual notices to consumers regarding the usage and sharing of such information and limit disclosure of such information to third parties except under specific circumstances; and
|
|
|
·
|
govern the manner in which consumer debts may be collected by collection agencies.
|
The deposit operations of the Company’s subsidiary banks are also subject to laws and regulations that:
|
|
·
|
require disclosure of the interest rate and other terms of consumer deposit accounts;
|
|
|
·
|
impose a duty to maintain the confidentiality of consumer financial records and prescribe procedures for complying with administrative subpoenas of financial records; and
|
|
|
·
|
govern automatic deposits to and withdrawals from deposit accounts and customers’ rights and liabilities arising from the use of automated teller machines and other electronic banking services.
|
Emergency Economic Stabilization Act of 2008 (“EESA”). EESA was signed into law on October 3, 2008 as a measure to stabilize and provide liquidity to the U.S. financial markets. Under EESA, the Troubled Asset Relief Program (“TARP”) was created. TARP granted the Treasury authority to, among other things, invest in financial institutions and purchase troubled assets in an aggregate amount up to $700 billion.
In connection with TARP, the CPP was launched on October 14, 2008. Under the CPP, the Treasury announced a plan to use up to $250 billion of TARP funds to purchase equity stakes in certain eligible financial institutions, including the Company. The Company was preliminarily approved for $30 million of equity capital in December 2008 with the transaction closing in January 2009. In the transaction, the Company issued 30 thousand shares of fixed-rate cumulative perpetual preferred stock to the Treasury. The Company must pay a 5% cumulative dividend during the first five years the preferred shares are outstanding, resetting to 9% thereafter if not redeemed, and includes certain restrictions on dividend payments of lower ranking equity. Under original terms, the Company could not redeem the preferred shares during the first three years after issuance except with the proceeds from a qualified equity offering as defined in the agreement. Subsequent regulations from Treasury allow CPP participants to now redeem the preferred shares at any time. As conditions relating to CPP evolve, Treasury will likely issue additional regulations as permitted under the program.
As required by the CPP, the Company also issued warrants to the Treasury to purchase common shares equal to 15% of the value of the preferred stock, with the number of warrants and exercise price determined based on the 20-day average closing price of the common shares ending on the day prior to preliminary approval. The warrants allow the U.S. Treasury to purchase 223,992 shares of Company common stock at an exercise price of $20.09 per share. Both the preferred shares and warrants are accounted for as additions to the Company’s regulatory capital.
Temporary Liquidity Guarantee Program (“TLGP”). The TLGP consists of two separate programs implemented by the FDIC in October 2008. This includes the Debt Guarantee Program (“DGP”) and the Transaction Account Guarantee Program (“TAGP”). These programs were initially provided at no cost to participants during the first 30 days. Eligible institutions that do not “opt out” of either of these programs become participants by default and will incur the fees assessed for taking part.
Under the DGP, as amended, eligible participating entities were permitted to issue senior unsecured debt guaranteed by the FDIC through October 31, 2009. The guarantee by the FDIC would expire on the earlier of the maturity date of the debt or December 31, 2012. During October 2009 the FDIC adopted final rules to phase out the DGP. The DGP expired October 31, 2009; however, the FDIC established a six month emergency guarantee facility effective upon the expiration of the DGP. Subject to its prior approval, the FDIC will provide guarantees of senior debt issued after October 31, 2009 through April 30, 2010 with the guarantee expiring on the earlier of the maturity date of the debt or December 31, 2012. The Company chose to opt out of the DGP.
18
Under the TAGP, the FDIC guarantees 100% of certain noninterest bearing transaction accounts up to any amount to participating FDIC insured institutions. The unlimited coverage, initially to expire on December 31, 2009, was extended by the FDIC in August 2009 and is now set to expire on June 30, 2010. The Company opted to participate in the TAGP, including the extension period. All participating institutions initially paid an additional 10 basis point quarterly-assessed fee on certain noninterest bearing transaction accounts that exceed the existing $250 thousand deposit insurance limit. The Company incurred the additional 10 basis point annual fee through the original expiration date of December 31, 2009 of the program. For coverage after December 31, 2009, the program calls for an increase in the annualized assessment based on an institutions risk category. Institutions in risk category one and two will be assessed a 15 basis point and 20 basis point fee, respectively. Institutions in risk category three and four will be assessed a 25 basis point fee.
References under the caption “Supervision and Regulation” to applicable statutes and regulations are brief summaries of portions thereof which do not purport to be complete and which are qualified in their entirety by reference thereto.
Recent Regulatory Events and Increased Capital Requirements
The Company’s subsidiary banks are subject to capital-based regulatory requirements. The Company has historically managed its banks’ capital levels with the goal of meeting the criteria established by its regulators for each bank subsidiaries to be “well-capitalized.” Historically, to be well- capitalized, a depository institution needed to have a Tier 1 leverage capital ratio of at least 5% and a Total risk-based capital ratio of 10%. As of December 31, 2009, each of the Company’s five subsidiary banks satisfied these capital ratios.
Although each of the Company’s subsidiary banks was well-capitalized as of December 31, 2009, some of their capital levels have decreased over the past eighteen months as a result of the economic downturn that began in late 2007. Because of the turmoil in the banking markets and continued difficulty many banks are experiencing with their loan portfolios, bank regulatory agencies are increasingly requiring banks to maintain higher capital reserves as a cushion for dealing with any further deterioration in their loan portfolios in order to maintain well-capitalized status. Following recent examinations, the Company’s banking regulators have required capital infusions in order to satisfy higher minimum capital ratios at three of the Company’s banking subsidiaries and have taken other supervisory actions.
Parent Company. In the summer of 2009, the Federal Reserve Bank of St. Louis (“FRB St. Louis”) conducted an examination of the Parent Company. Primarily due to the regulatory actions and capital requirements at three of the Company’s subsidiary banks, as discussed below, the FRB St. Louis and the KDFI requested that the Parent Company enter into a Memorandum of Understanding. The Company’s board approved entry into the Memorandum of Understanding at a regular board meeting on October 26, 2009. Pursuant to the Memorandum of Understanding, the Company agreed to: (1) develop an acceptable capital plan to ensure that the consolidated organization remains well-capitalized and each of its subsidiary banks meet the capital requirements imposed by their regulator as described below, (2) reduce the next quarterly dividend on the Company’s common stock from $.25 per share to $.10 per share, and (3) not make future interest payments on trust preferred securities or dividends on common or preferred stock without seeking prior approval from FRB St. Louis. The Company received approval for both its regularly scheduled trust preferred payments and dividends on its Series A preferred stock through the end of 2009, as well as a $.10 per share dividend on its common stock that was declared on October 26, 2009. Representatives of FRB St. Louis have indicated to the Company that as long as our subsidiaries show adequate normalized earnings to support the quarterly payments on its trust preferred securities and quarterly dividends on its Series A preferred stock and common stock, they will provide the required prior approval. The Company also received approval for its regularly scheduled trust preferred interest payments through the first quarter of 2010 and dividends on its Series A preferred stock that was paid on February 16, 2010 (the last time such approval was requested by the Company). The Company determined to forego the dividend that has historically been declared on its common stock in the first quarter of 2010 in an effort to conserve capital.
Lawrenceburg Bank. As a result of an examination conducted in March 2009, on May 15, 2009, Lawrenceburg Bank entered into a Memorandum of Understanding with the FRB St. Louis and the KDFI. The Memorandum of Understanding, among other things, requires Lawrenceburg Bank to achieve and maintain a Leverage Ratio of at least 8%. On October 23, 2009, the Company announced that it is in the preliminary stages of merging Lawrenceburg Bank into Farmers Bank. The Company applied for regulatory approval for the merger in the first quarter of 2010 with an anticipated effective date for the merger in the second quarter of 2010. The Company has received regulatory approval from the KDFI, but has yet to receive a response from the FRB St. Louis. In light of the proposed merger of Lawrenceburg Bank into Farmers Bank, the KDFI and FRB St. Louis have agreed that at this time no additional capital needs to be infused in Lawrenceburg Bank. At the time of the planned merger, however, the Company may be required to inject additional capital into Farmers Bank as a result of the merger depending on the operating results of Farmers Bank and Lawrenceburg Bank in the period leading up to the time of the planned merger. At December 31, 2009 Lawrenceburg Bank had a Tier 1 Leverage Ratio of 5.46% and a Total Risk-Based Ratio of 11.50%
Farmers Bank. Farmers Bank was the subject of a regularly scheduled examination by the KDFI which was conducted in mid-September 2009. As a result of this examination, the KDFI and FRB St. Louis have entered into a Memorandum of Understanding with Farmers Bank. The Memorandum of Understanding, among other things, requires that Farmers Bank obtain written consent prior to declaring or paying the Parent Company a cash dividend and to achieve and maintain increasing Leverage Ratios of 7.5%, 7.75%, and 8.0% by December 31, 2009, March 31, 2010, and June 30, 2010, respectively. On October 6, 2009 the Parent Company injected from its reserves $11 million in capital into Farmers Bank. Farmers Bank has further agreed that if at the time of the proposed merger of Lawrenceburg Bank
19
into Farmers Bank, which is anticipated to occur during the second quarter of 2010, the combined bank has a Leverage Ratio of less than 8.0% and the Parent Company has obtained additional capital by that time, the Parent Company will inject additional capital to raise the Leverage Ratio to 8.0%. At December 31, 2009 Farmers Bank had a Tier 1 Leverage Ratio of 7.68% and a Total Risk-Based Ratio of 15.66%.
United Bank. As a result of an examination conducted in late July and early August of 2009, the FDIC proposed United Bank enter into a Cease and Desist Order (“Order”) primarily as a result of its level of non-performing assets. While United Bank articulated to the FDIC and KDFI its strong objection and disagreement that an Order was appropriate (especially given the actions taken by United Bank prior to the examination to identify and manage its non-performing assets), United Bank has negotiated certain content and requirements of the proposed Order and, as a result, voluntarily consented to the Order. Among its requirements, the Order requires United Bank to achieve (1) leverage ratios of 7.5%, 7.75%, and 8.0% by December 31, 2009, March 31, 2010, and June 30, 2010, respectively, and (2) a Total Risk-Based Ratio of 12% immediately. On October 6, 2009 the Parent Company injected $10.5 million from its reserves into United Bank. At December 31, 2009 United Bank had a Tier 1 Leverage Ratio of 7.35% and a Total Risk-Based Ratio of 13.75%. The Leverage Ratio of 7.35% was below the required 7.5% amount at year-end 2009 as stated in the Order; however, the Leverage Ratio was 7.68% after adjusting for the year-end 2009 goodwill impairment charge that reduced total assets at United Bank. The reduction in assets attributed to goodwill did not immediately impact average assets (the denominator in calculating the Leverage Ratio). The impact of the goodwill charge will positively impact the Leverage Ratio beginning in 2010.
The Company may fund any additional external capital requirements of Farmers Bank, United Bank or any of its other banking subsidiaries from future public or private sales of securities at an appropriate time or from existing resources of the Company.
Competition
The Company and its subsidiaries face vigorous competition for banking services from various types of businesses other than commercial banks and savings and loan associations. These include, but are not limited to, credit unions, mortgage lenders, finance companies, insurance companies, stock and bond brokers, financial planning firms, and department stores which compete for one or more lines of banking business. The Company also competes for commercial and retail business not only with banks in Central and Northern Kentucky, but with banking organizations from Ohio, Indiana, Tennessee, Pennsylvania, and North Carolina which have banking subsidiaries located in Kentucky. These competing businesses may possess greater resources and offer a greater number of branch locations, higher lending limits, and may offer other services not provided by the Company. In addition, the Company’s competitors that are not depository institutions are generally not subject to the extensive regulations that apply to the Company and its subsidiary banks. The Company has attempted to offset some of the advantages of its competitors by arranging participations with other banks for loans above its legal lending limits, expanding into additional markets and product lines, and entering into third party arrangements to better compete for its targeted customer base. Competition from other providers of financial services may reduce or limit the Company’s profitability and market share.
The Company competes primarily on the basis of quality of services, interest rates and fees charged on loans, and the rates of interest paid on deposit funds. The business of the Company is not dependent upon any one customer or on a few customers, and the loss of any one or a few customers would not have a material adverse effect on the Company.
No material portion of the business of the Company is seasonal. No material portion of the business of the Company is subject to renegotiation of profits or termination of contracts or subcontracts at the election of the government, though certain contracts are subject to such renegotiation or termination.
The Company is not engaged in operations in foreign countries.
Employees
As of December 31, 2009, the Company and its subsidiaries had 547 full-time equivalent employees. Employees are provided with a variety of employee benefits. A salary savings plan, group life insurance, hospitalization, dental, and major medical insurance along with postretirement health insurance benefits are available to eligible personnel. Employees are not represented by a union. Management and employee relations are good.
The Company maintains a Stock Option Plan (“Plan”) that grants certain eligible employees the option to purchase a limited number of the Company’s common stock. The Plan specifies the conditions and terms that the grantee must meet in order to exercise the options.
In 2004, the Company’s Board of Directors adopted an Employee Stock Purchase Plan (“ESPP”). The ESPP was subsequently approved by the Company’s shareholders and became effective July 1, 2004. Under the ESPP, at the discretion of the Board of Directors, employees of the Company and its subsidiaries can purchase Company common stock at a discounted price and without payment of brokerage costs or other fees and in the process benefit from the favorable tax treatment afforded such plans pursuant to Section 423 of the Internal Revenue Code.
20
Available Information
The Company makes available, free of charge through its website (www.farmerscapital.com), its Code of Ethics, its annual reports on Form 10-K, quarterly reports on Form 10-Q, current reports on Form 8-K, and amendments to these reports filed or furnished pursuant to Section 13(a) or 15(d) of the Exchange Act as soon as reasonably practicable after electronically filing such material with the SEC.
Investing in the Company’s common stock is subject to risks inherent to the Company’s business. The material risks and uncertainties that management believes affect the Company are described below. Before making an investment decision, you should carefully consider the risks and uncertainties described below together with all of the other information included or incorporated by reference in this report. The risks and uncertainties described below are not the only ones facing the Company. Additional risks and uncertainties that management is not aware of or focused on or that management currently deems immaterial may also impair the Company’s business operations. This report is qualified in its entirety by these risk factors.
If any of the following risks actually occur, the Company’s financial condition and results of operations could be materially and adversely affected. If this were to happen, the market price of the Company’s common stock could decline significantly, and shareholders could lose all or part of their investment.
The Company operates in a highly regulated environment and may be adversely affected by changes in federal and state laws and regulations, including rules and policies applicable to participants in the U.S. Treasury’s TARP Capital Purchase Program.
The Company is subject to extensive regulation, supervision and examination by federal and state banking authorities. Any change in applicable regulations or laws could have a substantial adverse impact on the Company and its operations. Additional legislation and regulations that could significantly affect the Company’s powers, authority and operations may be enacted or adopted in the future, which could have a material adverse effect on the Company’s results of operations and financial condition. Further, in the performance of their supervisory duties and enforcement powers, the Company’s banking regulators have significant discretion and authority to prevent or remedy practices they deem as unsafe or unsound or violations of law.
As a recipient of investment by the Treasury in our Series A preferred stock under the CPP, the Company is subject to future regulations of the Treasury and future acts of Congress related to that program. The laws and policies applicable to recipients of capital under the CPP have been significantly revised and supplemented since the inception of that program, and continue to evolve.
The exercise of regulatory authority generally may have a negative impact on the Company’s operations, which may be material on its results of operations and financial condition.
The Company presently is subject to, and in the future may become subject to, additional supervisory actions and/or enhanced regulation that could have a material negative effect on its business, operating flexibility, financial condition and the value of its common stock.
Under federal and state laws and regulations pertaining to the safety and soundness of insured depository institutions, the KDFI (for state-chartered banks), the Board of Governors of the Federal Reserve (the “Federal Reserve”) (for bank holding companies) and separately the FDIC as the insurer of bank deposits, have the authority to compel or restrict certain actions on the Company’s part if they determine that the Company has insufficient capital or are otherwise operating in a manner that may be deemed to be inconsistent with safe and sound banking practices. Under this authority, bank regulators can require the Company to enter into informal or formal enforcement orders, including board resolutions, memoranda of understanding, written agreements and consent or cease and desist orders, pursuant to which the Company would be required to take identified corrective actions to address cited concerns and to refrain from taking certain actions.
As a result of increased levels of nonperforming assets at Farmers Bank, Lawrenceburg Bank and United Bank, the Parent Company, Farmers Bank and Lawrenceburg Bank have entered into separate Memoranda of Understanding with our regulators and United Bank has consented to a Cease and Desist order from its regulators. In the aggregate, these Memoranda of Understanding and the Cease and Desist Order, among other things, require (1) the Company to develop an acceptable capital plan to ensure that the consolidated organization remains well-capitalized and each of its subsidiary banks meet the capital requirements imposed by their regulator as described elsewhere in this report, (2) increase the regulatory capital ratios at these three banks, (3) these three banks refrain from paying dividends to the Parent Company unless approved in advance by the regulators and (4) the Company not make future interest payments on its trust preferred securities or dividends on its common or preferred stock without seeking prior approval from FRB St. Louis. The Company received approval for both its regularly scheduled trust preferred payments and dividends on its Series A preferred stock through the end of 2009, as well as the $.10 per share dividend on its common stock that was declared on October 26, 2009. Representatives of FRB St. Louis have indicated to the Company that as long as its subsidiaries show adequate normalized earnings to support the quarterly
21
payments on its trust preferred securities and dividends on its Series A preferred stock and common stock, they will provide the required prior approval, but there is no guarantee that such adequate normalized earnings will be realized and that such dividends will be approved in the future. The Company also received approval for its regularly scheduled trust preferred interest payments through the first quarter of 2010 and dividends on its Series A preferred stock that was paid on February 16, 2010 (the last time such approval was requested by the Company). The Company determined to forego the dividend that has historically been declared on its common stock in the first quarter of 2010 in an effort to conserve capital.
If the Company is unable to comply with the terms of its current regulatory orders, or is unable to comply with the terms of any future regulatory orders to which it may become subject, then we could become subject to additional, heightened supervisory actions and orders, possibly including cease and desist orders, prompt corrective actions and/or other regulatory enforcement actions. If the Company’s regulators were to take such additional supervisory actions, then we could, among other things, become subject to significant restrictions on our ability to develop any new business, as well as restrictions on our existing business, and we could be required to raise additional capital, dispose of certain assets and liabilities within a prescribed period of time, or both. If one or more of the Company’s banks were unable to comply with regulatory requirements, such banks could ultimately face failure. The terms of any such supervisory action could have a material negative effect on our business, operating flexibility, financial condition and the value of our common stock.
Our nonperforming assets adversely affect our results of operations and financial condition and take significant management time to resolve.
As of December 31, 2009, nonperforming loans totaled $76.3 million or 6.0% of the Company’s total loan portfolio and its nonperforming assets (which include foreclosed real estate) were $108 million or 5.0% of total assets. Additionally, approximately $24.3 million of the Company’s accruing loans were 30-89 days delinquent as of December 31, 2009. Non-performing assets adversely affect the Company’s net income in various ways. If economic conditions do not improve or actually worsen in our markets, the Company could continue to incur additional losses relating to an increase in non-performing assets. The Company does not record interest income on non-accrual loans or other real estate owned, thereby adversely affecting interest income. When the Company takes collateral in foreclosures and similar proceedings, it is required to mark the related loan to the then fair value of the collateral less estimated selling costs, which decreases earnings. These loans and other real estate owned also increase our risk profile and the amount of capital the Company’s regulators believe is appropriate in light of such risks. While the Company seeks to reduce its problem loans through workouts, restructurings and otherwise, decreases in the value of these assets, the underlying collateral or our borrowers’ performance or financial conditions have adversely affected, and may continue to adversely affect, the Company’s results of operations and financial condition. Moreover, the resolution of nonperforming assets requires significant time commitments from management of our banks, which can be detrimental to the performance of their other responsibilities. There can be no assurance that the Company will not experience further increases in nonperforming loans in the future.
Losses from loan defaults may exceed the allowance established for that purpose, which will have an adverse effect on the Company’s financial condition.
Volatility and deterioration in the broader economy increases the Company’s risk of credit losses, which could have a material adverse effect on its operating results. If a significant number of loans in the Company’s portfolio are not repaid, it would have an adverse effect on its earnings and overall financial condition. Like all banks, the Company’s subsidiaries maintain an allowance for loan losses to provide for losses inherent in the loan portfolio. The allowance for loan losses reflects management of each subsidiary’s best estimate of probable incurred credit losses in their loan portfolio at the relevant balance sheet date. This evaluation is primarily based upon a review of the bank’s and the banking industry’s historical loan loss experience, known risks contained in the bank’s loan portfolio, composition and growth of the bank’s loan portfolio and economic factors. Additionally, a bank’s regulators may require additional provision for the loan portfolio in connection with regulatory examinations, agreements or orders. The determination of an appropriate level of loan loss allowance is an inherently difficult process and is based on numerous assumptions. As a result, the Company’s allowance for loan losses may be inadequate to cover actual losses in its loan portfolio. Consequently, the Company risks having additional future provisions for loan losses that may continue to adversely affect its earnings.
If the Company’s local markets experience a prolonged recession, it may be required to make further increases in its allowance for loan losses and to charge off additional loans, which would adversely affect its results of operations and capital.
For the year 2009, the Company recorded a provision for loan losses of $20.8 million, $6.5 million of which was in the fourth quarter, and recorded net loan charge-offs of $14.2 million, $5.2 million of which was in the fourth quarter. This compares to a provision for loan losses of $5.3 million and net loan charge-offs of $2.7 million for 2008, and a $2.0 million provision and $729 thousand of net loan charge-offs which were recorded for the fourth quarter of 2008. During 2009, the Company has experienced increased loan delinquencies and credit losses and do not expect this to change in the near future.
22
Substantially all of the Company’s loans are to businesses and individuals located in Kentucky. A continuing decline in the economy of Central and Northern Kentucky could have a material adverse effect on the Company’s financial condition, results of operations and prospects.
Generally, the Company’s non-performing loans and assets reflect operating difficulties of individual borrowers; however, more recently the deterioration in the general economy has become a significant contributing factor to the increased levels of delinquencies and non-performing loans. Slower sales and excess inventory in the residential housing market has been the primary cause of the increase in delinquencies and foreclosures for residential construction and land development loans. As of December 31, 2009, the Company’s total non-performing loans had increased to $76.3 million or 6.0% of total loans compared to $25.5 million or 1.9% of total loans at December 31, 2008. If current trends in the housing and real estate markets continue, the Company expects that it will continue to experience higher than normal delinquencies and credit losses. Moreover, if a prolonged recession occurs, the Company expects that it could severely impact economic conditions in its market areas and that it could experience significantly higher delinquencies and credit losses. As a result, the Company may be required to make further increases in its provision for loan losses and to charge off additional loans in the future, which could adversely affect the Company’s financial condition and results of operations, perhaps materially. If such additional provisions and charge-offs cause the Company to experience losses, it may be required to contribute additional capital to its bank subsidiaries to maintain capital ratios required by regulators.
The Company’s exposure to credit risk is increased by its real estate development lending.
Real estate development loans have dominated the Company’s increase in impaired loans. Substantially all of the Company’s $56.6 million nonaccrual loans outstanding at December 31, 2009 are secured by real estate. Development lending has historically been considered to be higher credit risk than single-family residential lending. Such loans typically involve larger loan balances to a single borrower or related borrowers. Such loans can be affected by adverse conditions in real estate markets or the economy in general because commercial real estate borrowers’ ability to repay their loans depends on successful development and, in most cases, sale of their property. These loans also involve greater risk because they generally are not fully amortized over the loan period, but have a balloon payment due at maturity of the loan. A borrower’s ability to make a balloon payment typically will depend on being able to either refinance the loan or timely sell the underlying property. In the current economic environment, the ability of borrowers to refinance or sell newly developed property or vacant land has greatly diminished. If the real estate markets were to worsen or not improve, the Company would likely experience increased credit losses and require additional provisions to our allowance for loan losses, which would adversely impact the Company’s earnings and financial condition.
The Company’s investment securities portfolio is comparatively larger than other community banks and it is more dependent on its investment portfolio to generate net income.
Unlike many other community banks, the Company relies more heavily on its investment securities portfolio as a source of interest income because it has a comparatively small loan portfolio. If the Company is not able to successfully manage the interest rate spread on the investment portfolio, its net interest income would decrease, which would adversely affect its results of operations and could negatively impact net income. Investment securities tend to have a lower risk than loans, and as such, generally provide a lower yield.
In 2009 the Company sold and realized net gains on investment securities. The Company may not have the same level of net gains (and may have net realized losses) in future periods on the sale of investment securities, which would reduce earnings. Moreover, due to the current interest rate environment, proceeds from recent sales may be reinvested in investment securities with lower yields which may reduce earnings from investment securities.
The deterioration in the credit markets experienced in 2008 and into 2009 created volatility in the market and illiquidity of certain securities, resulting in significant declines in the market values of those investments. The Company continues to monitor its investment portfolio for deteriorating values and other-than-temporary impairments. Any material other-than-temporary impairments would likewise have an adverse affect on the Company’s results of operations and could lead to additional losses.
If the Company records goodwill in connection with an acquisition and it becomes impaired, the Company’s results of operations would be adversely impacted.
Accounting standards require that the Company account for business combinations using the acquisition method of accounting. Under the acquisition method of accounting, goodwill represents the excess of the fair value of an acquiree over the net of the amounts assigned to assets and liabilities assumed. In accordance with U.S. GAAP, goodwill is evaluated for impairment on an annual basis or more frequently if events or circumstances indicate that a potential impairment to goodwill exists. Such evaluation is based on a variety of factors, including the quoted price of our common stock, market prices of common stock of other banking organizations, common stock trading multiples, discounted cash flows and data from comparable acquisitions.
23
The Company cannot accurately predict the effect of the current economy on its future results of operations or the market price of its stock.
The national economy and the financial services sector in particular continue to face unique challenges when compared to recent history. The Company cannot accurately predict the severity or duration of the current economic downturn, which has adversely impacted its performance and the markets it serves. Any further deterioration in the economies of the nation as a whole or in the Company’s local markets would have an adverse effect, which could be material, on the Company’s financial condition, results of operations and prospects, and could also cause the market price of the Company’s stock to decline. While it is impossible to predict how long these recessionary conditions may exist, the economic downturn could continue to present risks for some time for our industry and the Company.
Interest rate volatility could significantly harm the Company’s results of operations.
The Company’s results of operations are affected by the monetary and fiscal policies of the federal government, the policies of the Company’s regulators, and the prevailing interest rates in the United States and the Company’s markets. In addition, it is increasingly common for the Company’s competitors, who may be aggressively seeking to attract deposits as a result of increased liquidity concerns arising from current economic conditions, to pay rates on deposits that are much higher than normal market rates. A significant component of the Company’s earnings is the net interest income of its subsidiary banks, which is the difference between the income from interest earning assets, such as loans, and the expense of interest bearing liabilities, such as deposits. A change in market interest rates could adversely affect the Company’s earnings if market interest rates change such that the interest it pays on deposits and borrowings increases faster than the interest it collects on loans and investments; or, alternatively, if interest rates earned on earning assets decline faster than those rates paid on interest paying liabilities. Consequently, as with most financial institutions, the Company is sensitive to interest rate fluctuations.
The FDIC has increased deposit insurance premiums to restore and maintain the federal deposit insurance fund, which has increased costs to the Company.
During the second quarter of 2009, the FDIC increased deposit insurance assessment rates generally and imposed a special assessment of five basis points on each insured institution’s total assets less Tier 1 capital. This special assessment was calculated based on the insured institution’s assets at June 30, 2009, and was collected on September 30, 2009. Based on the level of insured deposits in our subsidiary banks as of June 30, 2009, the special assessments on our subsidiary banks totaled approximately $1.1 million. This special assessment is in addition to the regular quarterly risk-based assessment.
In the wake of the rapid depletion of the FDIC’s Deposit Insurance Fund resulting from many recent bank failures, the FDIC announced that all insured institutions will be required to pay the next three years’ quarterly assessments in advance in the fourth quarter of 2009. This resulted in an aggregate payment by the Company’s bank subsidiaries totaling $8.2 million in the fourth quarter of 2009. The three years’ advance payment was recorded as a prepaid asset that will be expensed in approximately equal amounts over the next three years and, thus, only impact earnings in the normal course. However, the advance payment reduced the liquid assets of the Company’s bank subsidiaries at the time of payment.
There can be no assurance that there will not be additional significant deposit insurance premium assessments as the Deposit Insurance Fund is further depleted.
Any future losses may require the Company to raise additional capital; however, such capital may not be available to us on favorable terms or at all.
The Company is required by federal and state regulatory authorities to maintain levels of capital to support its operations. Furthermore, in the wake of recent regularly scheduled examinations of three of its subsidiaries, the Company’s regulators have required these three banks to raise their capital to levels significantly above the well-capitalized benchmark. The Company’s ability to raise additional capital, if needed, will depend on conditions in the capital markets at that time and on the Company’s future financial condition and performance. Accordingly, the Company cannot make assurances with respect to its ability to raise additional capital on favorable terms, or at all. If the Company cannot raise additional capital when needed, its ability to further expand its operations through internal growth and acquisitions could be materially impaired and its financial condition and liquidity could be materially and adversely affected.
24
The tightening of available liquidity could limit the Company’s ability to replace deposits and fund loan demand, which could adversely affect its earnings and capital levels.
A tightening of the credit and liquidity markets and the Company’s inability to obtain adequate funding to replace deposits may negatively affect its earnings and capital levels. In addition to deposit growth, maturity of investment securities and loan payments from borrowers, the Company relies from time to time on advances from the Federal Home Loan Bank and other wholesale funding sources to fund loans and replace deposits. In the event of a further downturn in the economy, these additional funding sources could be negatively affected which could limit the funds available to the Company. The Company’s liquidity position could be significantly constrained if it were unable to access funds from the Federal Home Loan Bank or other wholesale funding sources.
The Company’s financial condition and outlook may be adversely affected by damage to its reputation.
The Company’s financial condition and outlook is highly dependent upon perceptions of its business practices and reputation. Its ability to attract and retain customers and employees could be adversely affected to the extent its reputation is damaged. Negative public opinion could result from its actual or alleged conduct in any number of activities, including regulatory actions taken against the Company, lending practices, corporate governance, regulatory compliance, mergers of its subsidiaries, or sharing or inadequate protection of customer information. Damage to the Company’s reputation could give rise to loss of customers and legal risks, which could have an adverse impact on its financial condition.
The Company faces strong competition from financial services companies and other companies that offer banking services.
The Company conducts most of its operations in Central and Northern Kentucky. The banking and financial services businesses in these areas are highly competitive and increased competition in its primary market areas may adversely impact the level of its loans and deposits. Ultimately, the Company may not be able to compete successfully against current and future competitors. These competitors include national banks, regional banks and other community banks. The Company also faces competition from many other types of financial institutions, including savings and loan associations, finance companies, brokerage firms, insurance companies, credit unions, mortgage banks and other financial intermediaries. In particular, the Company’s competitors include major financial companies whose greater resources may afford them a marketplace advantage by enabling them to maintain numerous locations and mount extensive promotional and advertising campaigns. Areas of competition include interest rates for loans and deposits, efforts to obtain loan and deposit customers and a range in quality of products and services provided, including new technology-driven products and services. If the Company is unable to attract and retain banking customers, it may be unable to continue its loan growth and level of deposits.
The Company’s financial results could be adversely affected by changes in accounting standards or tax laws and regulations.
The Financial Accounting Standards Board and the SEC frequently change the financial accounting and reporting standards that govern the preparation of the Company’s financial statements. In addition, from time to time, federal and state taxing authorities will change the tax laws, regulations, and their interpretations. These changes and their effects can be difficult to predict and can materially and adversely impact how the Company records and reports its financial condition and results of operations.
The short term and long term impact of a likely new capital framework, whether through the current proposal for non-Basel II U.S. banking institutions or through another set of capital standards, is uncertain.
For U.S. banking institutions with assets of less than $250 billion and foreign exposures of less than $10 billion, including the Company and its subsidiaries, a proposal is currently pending that would apply to them the “standardized approach” of the new risk-based capital standards developed by the Basel Committee on Banking Supervision (Basel II). As a result of the recent deterioration in the global credit markets and increases in credit, liquidity, interest rate, and other risks, the U.S. banking regulators have discussed possible increases in capital requirements, separate from the current proposal for the standardized approach of Basel II. Furthermore, in August, the Treasury issued principles for international regulatory reform, which included recommendations for higher capital standards for all banking organizations. Any new capital framework is likely to affect the cost and availability of different types of credit. U.S. banking organizations are likely to be required to hold higher levels of capital and could incur increased compliance costs. Any of these developments, including increased capital requirements, could have a material negative effect on the Company’s business, results of operations and financial condition and require it to raise additional new capital.
25
The price of the Company’s common stock may fluctuate significantly, and this may make it difficult to resell it when you want or at prices you find attractive.
The Company cannot predict how its common stock will trade in the future. The market value of its common stock will likely continue to fluctuate in response to a number of factors including the following, most of which are beyond our control, as well as the other factors described in this “Risk Factors” section:
|
·
|
general economic conditions and conditions in the financial markets,
|
|
·
|
changes in global financial markets, such as interest or foreign exchange rates, stock, commodity or real estate valuations or volatility and other geopolitical events,
|
|
·
|
conditions in our local and national credit, mortgage and housing markets,
|
|
·
|
developments with respect to financial institutions generally, including government regulation,
|
|
·
|
our dividend practice, and
|
|
·
|
actual and anticipated quarterly fluctuations in our operating results and earnings.
|
The market value of the Company’s common stock may also be affected by conditions affecting the financial markets in general, including price and trading fluctuations. These conditions may result in: (1) volatility in the level of, and fluctuations in, the market prices of stocks generally and, in turn, the Company’s common stock and (2) sales of substantial amounts of the Company’s common stock in the market, in each case that could be unrelated or disproportionate to changes in the Company’s operating performance. These broad market fluctuations may adversely affect the market value of the Company’s common stock.
There may be future sales of additional common stock or other dilution of the Company’s equity, which may adversely affect the market price of the Company’s common stock.
The Company is not restricted from issuing additional common stock or preferred stock, including any securities that are convertible into or exchangeable for, or that represent the right to receive, common stock or preferred stock or any substantially similar securities. The market price of the Company’s common stock could decline as a result of sales by the Company of a large number of shares of common stock or preferred stock or similar securities in the market or from the perception that such sales could occur.
The Company’s board of directors is authorized generally to cause it to issue additional common stock, as well as series of preferred stock, without any action on the part of the Company’s shareholders except as may be required under the listing requirements of the NASDAQ Stock Market. In addition, the board has the power, without shareholder approval, to set the terms of any series of preferred stock that may be issued, including voting rights, dividend rights, preferences and other terms. This could include preferences over the common stock with respect to dividends or upon liquidation. If the Company issues preferred stock in the future that has a preference over the common stock with respect to the payment of dividends or upon liquidation, or if the Company issues preferred stock with voting rights that dilute the voting power of the common stock, the rights of holders of the common stock or the market price of the common stock could be adversely affected.
You may not receive dividends on the Company’s common stock.
Holders of the Company’s common stock are entitled to receive dividends only when, as and if its board of directors declares them, and as permitted by its regulators. Although the Company has historically declared quarterly cash dividends on its common stock, it is not required to do so. The Company’s board of directors reduced its quarterly common stock dividend in January 2009 from $.33 per share to $.25 per share and again in October 2009 to $.10 per share. In the first quarter of 2010, the board of directors determined to forego the dividend that has historically been declared on its common stock in the first quarter in an effort to conserve capital. This decision is consistent with those made by other financial organizations as they deal with the difficult economic times and the changing regulatory climate.
The Company has agreed that it will not make interest payments on its trust preferred securities or dividends on its common or preferred stock without prior approval from the FRB St. Louis. The Company requested and received approval for its regularly scheduled interest payment on its trust preferred and the dividend on its Series A preferred stock through the end of 2009, as well as its $.10 per share dividend on its common stock that was declared on October 26, 2009. The Company also received approval for its dividend payment on its Series A preferred stock payable February 16, 2010 and for its regularly scheduled interest payments on its trust preferred securities through the first quarter of 2010 (the last time such approval was requested by the Company).
Representatives of the FRB St. Louis have indicated to the Company that as long as its subsidiaries show adequate normalized earnings to support the quarterly payments on its trust preferred securities and quarterly dividends on its Series A preferred stock and common stock, they will provide the required prior approval. However, there can be no assurance the Company’s regulators will provide such approvals in the future.
26
In addition, the Company’s payment of dividends is subject to certain restrictions as a result of its issuance of Series A preferred stock to the Treasury on January 9, 2009 under the TARP CPP. The dividends declared on the Company’s Series A preferred stock reduce the net income available to common stockholders and reduce earnings per common share. Moreover, under the terms of the Company’s articles of incorporation, it is unable to declare dividend payments on shares of its common stock if it is in arrears on the dividends on the Series A preferred stock. Further, until January 9, 2012, the Company must have the Treasury’s approval before it may increase dividends on its common stock above the amount of the last quarterly cash dividend per share we declared prior to October 14, 2008, which was $.33 per share. This restriction no longer applies if all the Series A preferred stock has been redeemed by the Company or transferred by the Treasury.
Finally, if the Company is in arrears on interest payments on its trust preferred securities, it may not pay dividends on its common stock until such interest obligations are brought current.
The Company’s ability to pay dividends depends upon the results of operations of its subsidiary banks and certain regulatory considerations.
The Parent Company is a bank holding company that conducts substantially all of its operations through its subsidiary banks. As a result, the Company’s ability to make dividend payments on its common stock depends primarily on certain federal and state regulatory considerations and the receipt of dividends and other distributions from its bank subsidiaries. There are various regulatory restrictions on the ability of three of our subsidiary banks to pay dividends or make other payments to the Parent Company and its ability to make payments to its shareholders, including certain regulatory approvals of dividends or distributions. There can be no assurance that the Company will receive such approval or that it will be able to continue to pay its current dividend to shareholders.
The trading volume in the Company’s common stock is less than that of many other similar companies.
The Company’s common stock is listed for trading on the NASDAQ Global Select Stock Market. As of December 31, 2009 the 50-day average trading volume of the Company’s common stock on NASDAQ was 17,814 shares or .24% of the total common shares outstanding. An efficient public trading market is dependent upon the existence in the marketplace of willing buyers and willing sellers of a stock at any given time. The Company has no control over such individual decisions of investors and general economic and market conditions. Given the lower trading volume of the Company’s common stock, larger sales volumes of its common stock could cause the value of its common stock to decrease. Moreover, due to its lower trading volume it may take longer to liquidate your position in the Company’s common stock.
There can be no assurance when the Series A preferred stock and related warrant issued to the Treasury can be redeemed.
Subject to consultation with banking regulators, the Company intends to repurchase the Series A preferred stock, and potentially the warrant, it issued to the Treasury when it believes the credit metrics in its loan portfolio have improved for the long-term and the overall economy has rebounded. However, there can be no assurance when the Series A preferred stock and warrant held by the Treasury can be repurchased, if at all. Until such time as the Series A preferred stock are repurchased, the Company will remain subject to the terms and conditions of those instruments, which, among other things, limit the Company’s ability to repurchase or redeem common stock or increase the dividends on its common stock over $.33 per share prior to 2012. Further, the Company’s continued participation in the CPP subjects it to increased regulatory and legislative oversight, including with respect to executive compensation. These new and any future oversight and legal requirements and implementing standards under the CPP may have unforeseen or unintended adverse effects on the financial services industry as a whole, and particularly on CPP participants such as the Company.
Holders of the Series A preferred stock have rights that are senior to those of the Company’s common stockholders.
The Series A preferred stock that the Company issued to the Treasury is senior to the Company’s shares of common stock, and holders of the Series A preferred stock have certain rights and preferences that are senior to holders of the Company’s common stock. The restrictions on the Company’s ability to declare and pay dividends to common stockholders are discussed above. In addition, the Company and its subsidiaries may not purchase, redeem or otherwise acquire for consideration any shares of the Company’s common stock unless the Company has paid in full all accrued dividends on the Series A preferred stock for all prior dividend periods, other than in certain circumstances. Furthermore, the Series A preferred stock is entitled to a liquidation preference over shares of the Company’s common stock in the event of liquidation, dissolution or winding up.
Holders of the Series A preferred stock have limited voting rights.
Except (1) in connection with the election of two directors to the Company’s board of directors if its dividends on the Series A preferred stock are in arrears and we have missed six quarterly dividends and (2) as otherwise required by law, holders of the Company’s Series A preferred stock have limited voting rights. In addition to any other vote or consent of shareholders required by law or the Company’s articles of incorporation, the vote or consent of holders owning at least 66 2/3% of the shares of Series A preferred stock outstanding is
27
required for (1) any authorization or issuance of shares ranking senior to the Series A preferred stock; (2) any amendment to the rights of the Series A preferred stock that adversely affects the rights, preferences, privileges or voting power of the Series A preferred stock; or (3) consummation of any merger, share exchange or similar transaction unless the shares of Series A preferred stock remain outstanding or are converted into or exchanged for preference securities of the surviving entity other than the Company and have such rights, preferences, privileges and voting power as are not materially less favorable than those of the holders of the Series A preferred stock.
The Company’s common stock constitutes equity and is subordinate to its existing and future indebtedness and its Series A preferred stock, and effectively subordinated to all the indebtedness and other non-common equity claims against its subsidiaries.
Shares of the Company’s common stock represent equity interests in our holding company and do not constitute indebtedness. Accordingly, the shares of the Company’s common stock rank junior to all of its indebtedness and to other non-equity claims on Farmers Capital Bank Corporation with respect to assets available to satisfy such claims. Additionally, dividends to holders of the Company’s common stock are subject to the prior dividend and liquidation rights of the holders of the Company’s Series A preferred stock and any additional preferred stock we may issue. The Series A preferred stock has an aggregate liquidation preference of $30 million.
The Company’s right to participate in any distribution of assets of any of its subsidiaries upon the subsidiary’s liquidation or otherwise, and thus the ability of the Company’s common stock to benefit indirectly from such distribution, will be subject to the prior claims of creditors of that subsidiary. As a result, holders of the Company’s common stock will be effectively subordinated to all existing and future liabilities and obligations of its subsidiaries, including claims of depositors. As of December 31, 2009 our subsidiaries’ total deposits and borrowings were approximately $1.9 billion.
If the Company is unable to redeem its Series A preferred stock after an initial five-year period, the cost of this capital will increase substantially.
If the Company is unable to redeem its Series A preferred stock prior to February 15, 2014, the cost of this capital to us will increase from approximately $1.5 million annually (5.0% per annum of the Series A preferred stock liquidation value) to $2.7 million annually (9.0% per annum of the Series A preferred stock liquidation value). This increase in the annual dividend rate on the Series A preferred stock would have a material negative effect on the earnings the Company can retain for growth and to pay dividends on its common stock.
The current economic environment exposes the Company to higher credit losses and expenses and may result in lower earnings or increase the likelihood of losses.
Although the Company remains well-capitalized, it is operating in a very challenging and uncertain economic environment. Financial institutions, including the Company, are being adversely effected by harsh economic conditions that have impacted not only local markets, but on a national and global scale. Substantial deterioration in real estate and other financial markets have and may continue to adversely impact the Company’s financial performance. Continuing declines in real estate values and home sales volumes, along with job losses and other economic stresses can decrease the value of collateral securing loans extended to borrowers, particularly that of real estate loans. Lower values of real estate securing loans may make it more difficult for the Company to recover amounts it is owed in the event of default by a borrower.
The current economic conditions may result in a higher degree of financial stress on the Company’s borrowers and their customers which could impair the Company’s ability to collect payments on loans, potentially increasing loan delinquencies, nonperforming assets, foreclosures, and higher losses. Current market forces have and may in the future cause the value of investment securities or other assets held by the Company to deteriorate, resulting in impairment charges, higher losses, and lower regulatory capital levels.
Market volatility could adversely impact the Company’s results of operations, liquidity position, and access to additional capital.
The capital and credit markets have experienced heavy volatility and disruptions during the current and preceding year, with unprecedented levels of volatility and disruptions taking place over the last few months of 2008. In many cases, this has led to downward pressure on stock prices and credit availability for certain issuers without regard to those issuers’ underlying financial strength. If market disruptions and volatility continue or worsen, there can be no assurance that the Company will not experience a material adverse effect on its results of operations and liquidity position or on its ability to access additional capital.
There can be no assurance that recently enacted legislation and regulatory initiatives will help stabilize the U.S. financial system.
EESA was signed into law by the President on October 3, 2008 as a measure to stabilize and provide liquidity to the U.S. financial markets. This legislation provides broad authority to the U.S. Treasury to invest directly in qualifying financial institutions, increase FDIC deposit insurance coverage to $250 thousand for interest bearing accounts, and other significant regulatory authority designed to strengthen U.S. financial markets. There can be no assurance, however, that any of the recently enacted legislation or regulatory initiatives or the Company’s participation in such programs will have the desired effect. The failure of EESA, FDIC, or other U.S. government
28
initiatives to stabilize the U.S. financial system and a continuing or worsening of financial market conditions could have a material adverse effect on the Company results of operations, financial condition, or access to credit.
Risks associated with unpredictable economic and political conditions may be amplified as a result of limited market area.
Commercial banks and other financial institutions, including the Company, are affected by economic and political conditions, both domestic and international, and by governmental monetary policies. Conditions such as inflation, value of the dollar, recession, unemployment, high interest rates, short money supply, scarce natural resources, international disorders, terrorism and other factors beyond the Company’s control may adversely affect profitability. In addition, almost all of the Company’s primary business area is located in Central and Northern Kentucky. A significant downturn in this regional economy may result in, among other things, deterioration in the Company’s credit quality or a reduced demand for credit and may harm the financial stability of the Company’s customers. Due to the Company’s regional market area, these negative conditions may have a more noticeable effect on the Company than would be experienced by an institution with a larger, more diverse market area.
The Company’s results of operations are significantly affected by the ability of its borrowers to repay their loans.
Lending money is an essential part of the banking business. However, borrowers do not always repay their loans. The risk of non-payment is affected by:
|
|
·
|
unanticipated declines in borrower income or cash flow;
|
|
|
·
|
changes in economic and industry conditions;
|
|
|
·
|
the duration of the loan; and
|
|
|
·
|
in the case of a collateralized loan, uncertainties as to the future value of the collateral.
|
Due to the fact that the outstanding principal balances can be larger for commercial loans than other types of loans, such loans present a greater risk to the Company than other types of loans when non-payment by a borrower occurs.
In addition, consumer loans typically have shorter terms and lower balances with higher yields compared to real estate mortgage loans, but generally carry higher risks of frequency of default than real estate mortgage and commercial loans. Consumer loan collections are dependent on the borrower’s continuing financial stability, and thus are more likely to be affected by adverse personal circumstances. Furthermore, the application of various federal and state laws, including bankruptcy and insolvency laws, may limit the amount that can be recovered on these loans.
Combining a newly acquired bank or other business entity with the Company’s network of banks may be more difficult, costly or time-consuming than expected.
The Company has generally operated newly acquired banks as independent bank subsidiaries within the network of the Company’s existing banking subsidiaries. Combining newly acquired banks or other entities within this network usually involves converting certain data processing functions from their current format, changing some of the policies and procedures in place, and other integration issues. It is possible that integration processes could result in the loss of key employees or disruption of each company’s ongoing business or inconsistencies in standards, procedures and policies that would adversely affect the Company’s ability to maintain relationships with clients and employees or to achieve the anticipated benefits of a merger. If difficulties with the integration processes occur, we might not achieve the economic benefits we expect resulting from an acquisition. As with any merger of banking institutions, there also may be business disruptions that cause a newly acquired bank to lose customers or cause customers to take their deposits out of the bank and move their business to other financial institutions.
Inability to hire or retain certain key professionals, management and staff could adversely affect revenues and net income.
The Company relies on key personnel to manage and operate its business, including major revenue generating functions such as its loan and deposit portfolios. The loss of key staff may adversely affect the Company’s ability to maintain and manage these portfolios effectively, which could negatively affect our revenues. In addition, loss of key personnel could result in increased recruiting and hiring expenses, which could cause a decrease in our net income.
The Company’s controls and procedures may fail or be circumvented.
The Company’s management regularly reviews and updates its internal controls, disclosure controls and procedures, and corporate governance policies and procedures. Any system of controls, however well-designed and operated, can provide only reasonable, not absolute, assurances that the objectives of the system of controls are met. Any failure or circumvention of the Company’s controls and procedures or failure to comply with regulations related to controls and procedures could have a material and adverse effect on the Company’s business, results of operations, and financial condition.
29
None.
The Company, through its subsidiaries, owns or leases buildings that are used in the normal course of business. The corporate headquarters is located at 202 W. Main Street, Frankfort, Kentucky, in a building owned by the Company. The Company’s subsidiaries own or lease various other offices in the counties and cities in which they operate. See the Notes to Consolidated Financial Statements contained in Item 8, Financial Statement and Supplementary Data, of this Form 10-K for information with respect to the amounts at which bank premises and equipment are carried and commitments under long-term leases.
Unless otherwise indicated, the properties listed below are owned by the Company and its subsidiaries as of December 31, 2009.
Corporate Headquarters
202 – 208 W. Main Street, Frankfort, KY
|
Banking Offices
|
|
125 W. Main Street, Frankfort, KY
|
|
555 Versailles Road, Frankfort, KY
|
|
1401 Louisville Road, Frankfort, KY
|
|
154 Versailles Road, Frankfort, KY
|
|
1301 US 127 South, Frankfort, KY (leased)
|
|
200 E. Main Street, Georgetown, KY
|
|
100 Farmers Bank Drive, Georgetown, KY (leased)
|
|
100 N. Bradford Lane, Georgetown, KY
|
|
3285 Main Street, Stamping Ground, KY
|
|
2509 Sir Barton Way, Lexington, KY (leased)
|
|
3098 Harrodsburg Road, Lexington, KY (leased)
|
|
100 United Drive, Versailles, KY
|
|
146 N. Locust Street, Versailles, KY
|
|
206 N. Gratz, Midway, KY
|
|
128 S. Main Street, Lawrenceburg, KY
|
|
201 West Park Shopping Center, Lawrenceburg, KY
|
|
838 N. College Street, Harrodsburg, KY
|
|
1035 Ben Ali Drive, Danville, KY (leased)
|
|
425 W. Dixie Avenue, Elizabethtown, KY
|
|
3030 Ring Road, Elizabethtown, KY
|
|
111 Towne Drive (Kroger Store) Elizabethtown, KY (leased)
|
|
645 S. Dixie Blvd., Radcliff, KY
|
|
4810 N. Preston Highway, Shepherdsville, KY
|
|
157 Eastbrooke Court, Mt. Washington, KY
|
|
103 Churchill Drive, Newport, KY
|
|
7300 Alexandria Pike, Alexandria, KY
|
|
164 Fairfield Avenue, Bellevue, KY
|
|
8730 US Highway 42, Florence, KY
|
|
34 N. Ft. Thomas Avenue, Ft. Thomas, KY (leased)
|
|
2911 Alexandria Pike, Highland Heights, KY (leased)
|
|
2006 Patriot Way, Independence, KY
|
|
2774 Town Center Blvd., Crestview Hills, KY (leased)
|
|
201 N. Main Street, Nicholasville, KY
|
|
995 S. Main Street (Kroger Store), Nicholasville, KY (leased)
|
|
986 N. Main Street, Nicholasville, KY
|
|
106 S. Lexington Avenue, Wilmore, KY
|
30
Data Processing Center
102 Bypass Plaza, Frankfort, KY
Other
201 W. Main Street, Frankfort, KY
The Company considers its properties to be suitable and adequate based on its present needs.
As of December 31, 2009, there were various pending legal actions and proceedings against the Company arising from the normal course of business and in which claims for damages are asserted. Management, after discussion with legal counsel, believes that these actions are without merit and that the ultimate liability resulting from these legal actions and proceedings, if any, will not have a material adverse effect upon the consolidated financial statements of the Company.
A Special Meeting of Shareholders of the Company was held on November 12, 2009. Following are the voting results of each matter submitted to stockholders:
1. Approval of an amendment to the Company’s Second Amended and Restated Articles of Incorporation to increase the number of authorized shares of the Company’s common stock from 9,608,000 to 14,608,000.
|
For
|
Abstain
|
Against
|
Total
|
|
5,305,292
|
198,434
|
464,343
|
5,968,069
|
2. Approval to grant the proxy holders discretionary authority to vote to adjourn the Special Meeting for up to 120 days to allow for the solicitation of additional proxies if there are insufficient shares voted at the Special Meeting, in person or by proxy, to approve Proposal No. 1.
|
For
|
Abstain
|
Against
|
Total
|
|
5,338,044
|
107,262
|
522,763
|
5,968,069
|
At various times, the Company’s Board of Directors has authorized the purchase of shares of the Company’s outstanding common stock. No stated expiration dates have been established under any of the previous authorizations. There were no shares of common stock repurchased by the Company during the quarter ended December 31, 2009. The maximum number of shares that may still be purchased under previously announced repurchase plans is 84,971.
On January 9, 2009, the Company received a $30.0 million equity investment by issuing 30 thousand shares of Series A, no par value preferred stock to the Treasury pursuant to a Letter Agreement and Securities Purchase Agreement that was previously disclosed by the Company. In addition, the Company issued a warrant to the Treasury allowing it to purchase 224 thousand shares of the Company’s common stock at an exercise price of $20.09. The warrant can be exercised immediately and has a term of 10 years. The Series A preferred stock and warrant were issued in a private placement exempt from registration pursuant to Section 4(2) of the Securities Act of 1933, as amended.
The Company’s participation in the CPP restricts its ability to repurchase its outstanding common stock. Until January 9, 2012, the Company generally must have the Treasury’s approval before it may repurchase any of its shares of common stock, unless all of the Series A preferred stock has been redeemed by the Company or transferred by the Treasury.
31
Performance Graph
The following graph sets forth a comparison of the five-year cumulative total returns among the shares of Company Common Stock, the NASDAQ Composite Index ("broad market index") and Southeastern Banks under 1 Billion Market-Capitalization ("peer group index"). Cumulative shareholder return is computed by dividing the sum of the cumulative amount of dividends for the measurement period and the difference between the share price at the end and the beginning of the measurement period by the share price at the beginning of the measurement period. The broad market index includes over 3,000 domestic and international based common shares listed on The NASDAQ Stock Market. The peer group index consists of 44 banking companies in the Southeastern United States. The Company is among the 44 companies included in the peer group index.
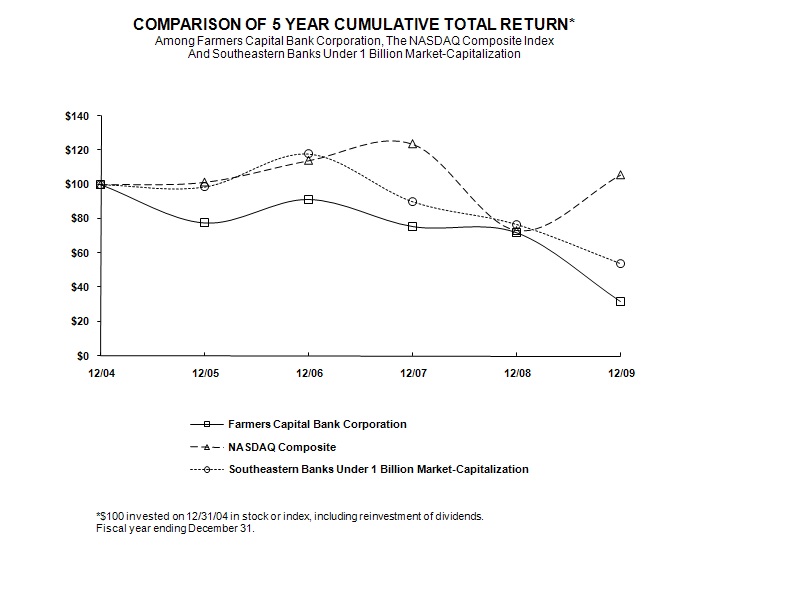
|
2004
|
2005
|
2006
|
2007
|
2008
|
2009
|
|||||||||||||||||||
|
Farmers Capital Bank Corporation
|
$ | 100.00 | $ | 77.62 | $ | 91.32 | $ | 75.54 | $ | 71.92 | $ | 31.71 | ||||||||||||
|
NASDAQ Composite
|
100.00 | 101.33 | 114.01 | 123.71 | 73.11 | 105.61 | ||||||||||||||||||
|
Southeastern Banks Under 1 Billion Market-Capitalization
|
100.00 | 98.61 | 117.88 | 90.06 | 76.83 | 53.94 | ||||||||||||||||||
Corporate Address
The headquarters of Farmers Capital Bank Corporation is located at:
202 West Main Street
Frankfort, Kentucky 40601
Direct correspondence to:
Farmers Capital Bank Corporation
P.O. Box 309
Frankfort, Kentucky 40602-0309
Phone: (502) 227-1668
www.farmerscapital.com
Annual Meeting
The annual meeting of shareholders of Farmers Capital Bank Corporation will be held Tuesday, May 11, 2010 at 11:00 a.m. at the main office of Farmers Bank & Capital Trust Company, Frankfort, Kentucky.
32
Form 10-K
For a free copy of Farmers Capital Bank Corporation's Annual Report on Form 10-K filed with the Securities and Exchange Commission, please write:
C. Douglas Carpenter, Senior Vice President, Secretary, & Chief Financial Officer
Farmers Capital Bank Corporation
P.O. Box 309
Frankfort, Kentucky 40602-0309
Phone: (502) 227-1668
Web Site Access to Filings
All reports filed electronically by the Company to the United States Securities and Exchange Commission, including annual reports on Form 10-K, quarterly reports on Form 10-Q, current reports on Form 8-K, and all amendments to those reports, are available at no cost on the Company’s Web site at www.farmerscapital.com.
|
NASDAQ Market Makers
|
|
|
J.J.B. Hilliard, W.L. Lyons, Inc.
|
Morgan, Keegan and Company
|
|
(502) 588-8400
|
(800) 260-0280
|
|
(800) 444-1854
|
|
|
UBS Securities, LLC
|
Howe Barnes Investments, Inc.
|
|
(859) 269-6900
|
(800) 621-2364
|
|
(502) 589-4000
|
|
The Transfer Agent and Registrar for Farmers Capital Bank Corporation is American Stock Transfer & Trust Company.
American Stock Transfer & Trust Company
Shareholder Relations
59 Maiden Lane - Plaza Level
New York, NY 10038
PH: (800) 937-5449
Fax: (718) 236-2641
Email: Info@amstock.com
Website: www.amstock.com
Additional information is set forth under the captions “Shareholder Information” and “Stock Prices” on page 59 under Part II, Item 7 and Note 17 “Regulatory Matters”, in the notes to the Company's 2009 audited consolidated financial statements on pages 89 to 91 of this Form 10-K and is hereby incorporated by reference.
33
|
Selected Financial Highlights
|
||||||||||||||||||||
|
December 31,
(In thousands, except per share data)
|
2009
|
2008
|
2007
|
2006
|
2005
|
|||||||||||||||
|
Results of Operations
|
||||||||||||||||||||
|
Interest income
|
$ | 100,910 | $ | 113,920 | $ | 114,257 | $ | 92,340 | $ | 65,651 | ||||||||||
|
Interest expense
|
47,065 | 55,130 | 56,039 | 41,432 | 24,409 | |||||||||||||||
|
Net interest income
|
53,845 | 58,790 | 58,218 | 50,908 | 41,242 | |||||||||||||||
|
Provision for loan losses
|
20,768 | 5,321 | 3,638 | 965 | 622 | |||||||||||||||
|
Noninterest income
|
28,169 | 9,810 | 24,157 | 20,459 | 19,867 | |||||||||||||||
|
Noninterest expense
|
115,141 | 60,098 | 58,823 | 53,377 | 42,164 | |||||||||||||||
|
(Loss) income from continuing operations
|
(44,742 | ) | 4,395 | 15,627 | 13,665 | 14,532 | ||||||||||||||
|
Income from discontinued operations1
|
7,707 | 1,240 | ||||||||||||||||||
|
Net (loss) income
|
(44,742 | ) | 4,395 | 15,627 | 21,372 | 15,772 | ||||||||||||||
|
Dividends and accretion on preferred shares
|
(1,802 | ) | ||||||||||||||||||
|
Net (loss) income available to common shareholders
|
(46,544 | ) | 4,395 | 15,627 | 21,372 | 15,772 | ||||||||||||||
|
Per Common Share Data
|
||||||||||||||||||||
|
Basic:
|
||||||||||||||||||||
|
(Loss) income from continuing operations
|
$ | (6.32 | ) | $ | .60 | $ | 2.03 | $ | 1.82 | $ | 2.13 | |||||||||
|
Net (loss) income
|
(6.32 | ) | .60 | 2.03 | 2.85 | 2.31 | ||||||||||||||
|
Diluted:
|
||||||||||||||||||||
|
(Loss) income from continuing operations
|
(6.32 | ) | .60 | 2.03 | 1.82 | 2.12 | ||||||||||||||
|
Net (loss) income
|
(6.32 | ) | .60 | 2.03 | 2.84 | 2.30 | ||||||||||||||
|
Cash dividends declared
|
.85 | 1.32 | 1.32 | 1.43 | 1.32 | |||||||||||||||
|
Book value
|
16.11 | 22.87 | 22.82 | 22.43 | 20.87 | |||||||||||||||
|
Tangible book value2
|
15.44 | 14.81 | 14.43 | 15.81 | 16.04 | |||||||||||||||
|
Selected Ratios
|
||||||||||||||||||||
|
Percentage of (loss) income from continuing operations to:
|
||||||||||||||||||||
|
Average shareholders’ equity (ROE)
|
(22.68 | )% | 2.62 | % | 8.88 | % | 8.49 | % | 10.81 | % | ||||||||||
|
Average total assets3 (ROA)
|
(1.98 | ) | .21 | .83 | .85 | 1.10 | ||||||||||||||
|
Percentage of common dividends declared to income from continuing operations
|
NM
|
220.96 | 64.52 | 78.89 | 61.67 | |||||||||||||||
|
Percentage of average shareholders’ equity to average total assets3
|
8.72 | 7.86 | 9.33 | 10.04 | 10.19 | |||||||||||||||
|
Total shareholders’ equity
|
$ | 147,227 | $ | 168,296 | $ | 168,491 | $ | 177,063 | $ | 154,236 | ||||||||||
|
Total assets
|
2,171,562 | 2,202,167 | 2,068,247 | 1,825,108 | 1,673,943 | |||||||||||||||
|
Other term borrowings and notes payable
|
316,932 | 335,661 | 316,309 | 87,992 | 75,291 | |||||||||||||||
|
Senior perpetual preferred stock
|
28,348 | |||||||||||||||||||
|
Weighted Average Common Shares Outstanding
|
||||||||||||||||||||
|
Basic
|
7,365 | 7,357 | 7,706 | 7,511 | 6,831 | |||||||||||||||
|
Diluted
|
7,365 | 7,357 | 7,706 | 7,526 | 6,864 | |||||||||||||||
1Includes gain on disposals of $6,417 during 2006.
2Represents total common equity less intangible assets divided by the number of common shares outstanding at the end of the period.
3Excludes assets of discontinued operations in 2006 and 2005.
NM-Not meaningful.
34
Glossary of Financial Terms
Allowance for loan losses
A valuation allowance to offset credit losses specifically identified in the loan portfolio, as well as management’s best estimate of probable incurred losses in the remainder of the portfolio at the balance sheet date. Management estimates the allowance balance required using past loan loss experience, an assessment of the financial condition of individual borrowers, a determination of the value and adequacy of underlying collateral, the condition of the local economy, an analysis of the levels and trends of the loan portfolio, and a review of delinquent and classified loans. Actual losses could differ significantly from the amounts estimated by management.
Dividend payout
Cash dividends paid on common shares, divided by net income.
Basis points
Each basis point is equal to one hundredth of one percent. Basis points are calculated by multiplying percentage points times 100. For example: 3.7 percentage points equals 370 basis points.
Interest rate sensitivity
The relationship between interest sensitive earning assets and interest bearing liabilities.
Net charge-offs
The amount of total loans charged off net of recoveries of loans that have been previously charged off.
Net interest income
Total interest income less total interest expense.
Net interest margin
Taxable equivalent net interest income expressed as a percentage of average earning assets.
Net interest spread
The difference between the taxable equivalent yield on earning assets and the rate paid on interest bearing funds.
Other real estate owned
Real estate not used for banking purposes. For example, real estate acquired through foreclosure.
Provision for loan losses
The charge against current income needed to maintain an adequate allowance for loan losses.
Return on average assets (ROA)
Net income (loss) divided by average total assets. Measures the relative profitability of the resources utilized by the Company.
Return on average equity (ROE)
Net income (loss) divided by average shareholders’ equity. Measures the relative profitability of the shareholders' investment in the Company.
Tax equivalent basis (TE)
Income from tax-exempt loans and investment securities have been increased by an amount equivalent to the taxes that would have been paid if this income were taxable at statutory rates. In order to provide comparisons of yields and margins for all earning assets, the interest income earned on tax-exempt assets is increased to make them fully equivalent to other taxable interest income investments.
Weighted average number of common shares outstanding
The number of shares determined by relating (a) the portion of time within a reporting period that common shares have been outstanding to (b) the total time in that period.
35
Management’s Discussion and Analysis of Financial Condition and Results of Operations
The following pages present management’s discussion and analysis of the consolidated financial condition and results of operations of Farmers Capital Bank Corporation (the “Company” or “Parent Company”), a bank holding company, and its bank and nonbank subsidiaries. Bank subsidiaries include Farmers Bank & Capital Trust Company (“Farmers Bank”) in Frankfort, KY and its significant wholly-owned subsidiaries Leasing One Corporation (“Leasing One”) and Farmers Capital Insurance Corporation (“Farmers Insurance”). Leasing One is a commercial leasing company in Frankfort, KY and Farmers Insurance is an insurance agency in Frankfort, KY; First Citizens Bank in Elizabethtown, KY (“First Citizens”); United Bank & Trust Company (“United Bank”) in Versailles, KY which, during 2008, was the surviving company after the merger with two sister companies of Farmers Bank and Trust Company (“Farmers Georgetown”) and Citizens Bank of Jessamine County (“Citizens Jessamine”); United Bank had one subsidiary at year-end 2009, EGT Properties, Inc. EGT Properties is involved in real estate management and liquidation for certain repossessed properties of United Bank.; The Lawrenceburg Bank and Trust Company in Lawrenceburg, KY; Kentucky Banking Centers, Inc. in Glasgow, KY (“KBC”), which was sold during 2006; and Citizens Bank of Northern Kentucky, Inc. (“Citizens Northern”) in Newport, KY (“Citizens Northern”). Citizens Northern had one subsidiary at year-end 2009, ENKY Properties, Inc. ENKY Properties is involved in real estate management and liquidation for certain repossessed properties of Citizens Northern.
The Company has four active nonbank subsidiaries, FCB Services, Inc. (“FCB Services”), Kentucky General Holdings, LLC (“Kentucky General”), FFKT Insurance Services, Inc. (“FFKT Insurance”), and EKT Properties, Inc. (“EKT”). FCB Services is a data processing subsidiary located in Frankfort, KY that provides services to the Company’s banks as well as unaffiliated entities. On August 6, 2009 Kentucky General sold its entire 50% interest in KHL Holdings, LLC to Hamburg Insurance, LLC. KHL Holdings, the parent company of Kentucky Home Life Insurance Company, was a joint venture between the Company and Hamburg Insurance, an otherwise unrelated entity. The Company received gross proceeds of $2.5 million for the sale of KHL Holdings, resulting in a pre-tax gain of $185 thousand. The Company withdrew its financial holding company election upon the sale of KHL Holdings.
FFKT Insurance is a captive property and casualty insurance company insuring primarily deductible exposures and uncovered liability related to properties of the Company. EKT was created in 2008 to manage and liquidate certain real estate properties repossessed by the Company. In addition, the Company has three subsidiaries organized as Delaware statutory trusts that are not consolidated into its financial statements. These trusts were formed for the purpose of issuing trust preferred securities. All significant intercompany transactions and balances are eliminated in consolidation.
For a complete list of the Company’s subsidiaries, please refer to the discussion under the heading “Organization” included in Part 1, Item 1 of this Form 10-K. The following discussion should be read in conjunction with the audited consolidated financial statements and related footnotes that follow.
This report contains forward-looking statements with the meaning of Section 27A of the Securities Act of 1933, as amended (the “Securities Act”) and Section 21E of the Securities Exchange Act of 1934, as amended (the “Exchange Act”), under the Private Securities Litigation Reform Act of 1995 that involve risks and uncertainties. In general, forward-looking statements relate to a discussion of future financial results or projections, future economic performance, future operational plans and objectives, and statements regarding the underlying assumptions of such statements. Although the Company believes that the assumptions underlying the forward-looking statements contained herein are reasonable, any of the assumptions could be inaccurate, and therefore, there can be no assurance that the forward-looking statements included herein will prove to be accurate. Factors that could cause actual results to differ from the results discussed in the forward-looking statements include, but are not limited to: economic conditions (both generally and more specifically in the markets in which the Company and its subsidiaries operate) and lower interest margins; competition for the Company’s customers from other providers of financial services; deposit outflows or reduced demand for financial services and loan products; government legislation, regulation, and changes in monetary and fiscal policies (which changes from time to time and over which the Company has no control); changes in interest rates; changes in prepayment speeds of loans or investment securities; inflation; material unforeseen changes in the liquidity, results of operations, or financial condition of the Company’s customers; changes in the level of non-performing assets and charge-offs; changes in the number of common shares outstanding; the capability of the Company to successfully enter into a definitive agreement for and close anticipated transactions; the possibility that acquired entities may not perform as well as expected; unexpected claims or litigation against the Company; technological or operational difficulties; the impact of new accounting pronouncements and changes in policies and practices that may be adopted by regulatory agencies; acts of war or terrorism; the ability of the parent company to receive dividends from its subsidiaries; the impact of larger or similar financial institutions encountering difficulties, which may adversely affect the banking industry or the Company; the Company or its subsidiary banks' ability to maintain required capital levels and adequate funding sources and liquidity; and other risks or uncertainties detailed in the Company’s filings with the Securities and Exchange Commission, all of which are difficult to predict and many of which are beyond the control of the Company. The Company expressly disclaims any intent or obligation to update any forward-looking statements after the date hereof to conform such statements to actual results or to changes in the Company’s opinions or expectations.
36
Discontinued Operations
In June 2006, the Company announced that it had entered into a definitive agreement to sell KBC, its former wholly-owned subsidiary based in Glasgow, Kentucky. In addition, Farmers Georgetown entered into a definitive agreement during August 2006 to sell its Owingsville and Sharpsburg branches in Bath County (the “Branches”). These sales were completed during the fourth quarter of 2006. Results prior to 2006 included herein have been reclassified to conform to the 2006 presentation which displays the operating results of KBC and the Branches as discontinued operations. These reclassifications had no effect on net income or shareholders’ equity.
Application of Critical Accounting Policies
The Company’s audited consolidated financial statements are prepared in accordance with accounting principles generally accepted in the United States of America and follow general practices applicable to the banking industry. Application of these principles requires management to make estimates, assumptions, and judgments that affect the reported amounts of assets and liabilities and disclosure of contingent assets and liabilities at the date of the financial statements and the reported amounts of revenues and expenses during the reported period. These estimates, assumptions, and judgments are based on information available as of the date of the financial statements; accordingly, as this information changes, the financial statements could reflect different estimates, assumptions, and judgments. Certain policies inherently have a greater reliance on the use of estimates, assumptions, and judgments and as such have a greater possibility of producing results that could be materially different than originally reported. Estimates, assumptions, and judgments are necessary when assets and liabilities are required to be recorded at fair value, when a decline in the value of an asset warrants an impairment write-down or valuation reserve to be established, or when an asset or liability needs to be recorded contingent upon a future event. Carrying assets and liabilities at fair value inherently results in more financial statement volatility from period to period. The fair values and the information used to record valuation adjustments for certain assets and liabilities are based either on quoted market prices or are provided by other third-party sources, when available. When third-party information is not available, valuation adjustments are estimated in good faith by management primarily through the use of internal cash flow modeling techniques.
The most significant accounting policies followed by the Company are presented in Note 1 of the Company’s 2009 audited consolidated financial statements. These policies, along with the disclosures presented in the other financial statement notes and in this management’s discussion and analysis of financial condition and results of operations, provide information on how significant assets and liabilities are valued in the financial statements and how those values are determined. Based on the valuation techniques used and the sensitivity of financial statement amounts to the methods, assumptions, and estimates underlying those amounts, management has identified the determination of the allowance for loan losses, fair value measurements, and accounting for business acquisitions and related goodwill to be the accounting areas that requires the most subjective or complex judgments, and as such could be most subject to revision as new information becomes available.
Allowance for Loan Losses
The allowance for loan losses represents credit losses specifically identified in the loan portfolio, as well as management's estimate of probable incurred credit losses in the loan portfolio at the balance sheet date. Determining the amount of the allowance for loan losses and the related provision for loan losses is considered a critical accounting estimate because it requires significant judgment and the use of estimates related to the amount and timing of expected future cash flows on impaired loans, estimated losses on pools of homogeneous loans based on historical loss experience, and consideration of current economic trends and conditions, all of which may be susceptible to significant change. The loan portfolio also represents the largest asset group on the consolidated balance sheets. Additional information related to the allowance for loan losses that describes the methodology and risk factors can be found under the captions “Asset Quality” and “Nonperforming Assets” in this management’s discussion and analysis of financial condition and results of operation, as well as Notes 1 and 4 of the Company’s 2009 audited consolidated financial statements.
Fair Value Measurements
The carrying value of certain financial assets and liabilities of the Company is impacted by the application of fair value measurements, either directly or indirectly. Fair value is the price that would be received to sell an asset or paid to transfer a liability (exit price) in the principal or most advantageous market for the asset or liability in an orderly transaction between market participants at the measurement date. In certain cases, an asset or liability is measured and reported at fair value on a recurring basis, such as investment securities classified as available for sale. In other cases, management must rely on estimates or judgments to determine if an asset or liability not measured at fair value warrants an impairment write-down or whether a valuation reserve should be established.
The Company estimates the fair value of a financial instrument using a variety of valuation methods. Where financial instruments are actively traded and have quoted market prices, quoted market prices are used for fair value. The Company characterizes active markets as those where transaction volumes are sufficient to provide objective pricing information, with reasonably narrow bid/ask spreads, and where received quoted prices do not vary widely. When the financial instruments are not actively traded, other observable market inputs, such as quoted prices of securities with similar characteristics, may be used, if available, to determine fair value. Inactive markets are characterized by low transaction volumes, price quotations that vary substantially among market participants, or in which minimal information is released publicly.
37
When observable market prices do not exist, the Company estimates fair value primarily by using cash flow and other financial modeling methods. The valuation methods may also consider factors such as liquidity and concentration concerns. Other factors such as model assumptions, market dislocations, and unexpected correlations can affect estimates of fair value. Changes in these underlying factors, assumptions, or estimates in any of these areas could materially impact the amount of revenue or loss recorded.
Additional information regarding fair value measurements can be found in Notes 1 and 18 of the Company’s 2009 audited consolidated financial statements. The following is a summary of the Company’s more significant assets that may be affected by fair value measurements, as well as a brief description of the current accounting practices and valuation methodologies employed by the Company:
Available For Sale Investment Securities
Investment securities classified as available for sale are measured and reported at fair value on a recurring basis. Available for sale investment securities are valued primarily by independent third party pricing services under the market valuation approach that include, but not limited to, the following inputs:
|
·
|
U.S. Treasury securities are priced using dealer quotes from active market makers and real-time trading systems.
|
|
·
|
Marketable equity securities are priced utilizing real-time data feeds from active market exchanges for identical securities.
|
|
·
|
Government-sponsored agency debt securities, obligations of states and political subdivisions, corporate bonds, and other similar investment securities are priced with available market information through processes using benchmark yields, matrix pricing, prepayment speeds, cash flows, live trading data, and market spreads sourced from new issues, dealer quotes, and trade prices, among others sources.
|
At December 31, 2009, all of the Company’s available for sale investment securities were measured using observable market data.
Other Real Estate Owned
Other real estate owned (“OREO”) includes properties acquired by the Company through actual loan foreclosures and is carried at the lower of cost or fair value less estimated costs to sell. Fair value of OREO is generally based on third party appraisals of the property that includes comparable sales data comprised of significant unobservable inputs. If the carrying amount of the OREO exceeds fair value less estimated costs to sell, an impairment loss is recorded through expense. At December 31, 2009 OREO was $31.2 million compared to $14.4 million at year-end 2008.
Impaired Loans
Loans are considered impaired when full payment under the contractual terms is not expected. Impaired loans are measured at the present value of expected future cash flows discounted at the loan’s effective interest rate, at the loan’s observable market price, or at the fair value of the collateral based on recent appraisals if the loan is collateral dependent. If the value of an impaired loan is less than the unpaid balance, the difference is credited to the allowance for loan losses with a corresponding charge to provision for loan losses. Loan losses are charged against the allowance for loan losses when management believes the uncollectibility of a loan is confirmed.
Appraisals used in connection with valuing collateral dependent loans may utilize a single valuation approach or a combination of approaches including comparable sales and the income approach. Appraisers take absorption rates into consideration and adjustments are routinely made in the appraisal process to identify differences between the comparable sales and income data available. Such adjustments are usually significant and typically include significant unobservable inputs for determining fair value. Impaired loans were $108 million and $48.4 million at year-end 2009 and 2008, respectively.
Accounting for Business Acquisitions and Related Goodwill
Prior to January 1, 2009, the Company accounted for its business acquisitions as a purchase in accordance with SFAS No. 141, whereby the purchase price is allocated to the tangible and intangible assets acquired and liabilities assumed based on their estimated fair value. The excess of the purchase price over estimated fair value of the net identifiable assets is allocated to goodwill. Effective January 1, 2009, the Company adopted new accounting guidance that requires the recognition of noncontrolling interests, expensing acquisition related costs, and measuring goodwill or gain from a bargain purchase option, among other requirements.
The Company engages third-party appraisal firms to assist in determining the fair values of certain assets acquired and liabilities assumed. Determining fair value of assets and liabilities requires many assumptions and estimates. These estimates and assumptions are sometimes refined subsequent to the initial recording of the transaction with adjustments to goodwill as information is gathered and final appraisals are completed. The changes in these estimates could impact the amount of tangible and intangible assets (including goodwill) and liabilities ultimately recorded on the Company’s balance sheet as a result of an acquisition, and could materially impact the Company’s operating results subsequent to such acquisition. The Company believes that its estimates have been materially accurate in the past.
38
EXECUTIVE LEVEL OVERVIEW
The Company offers a variety of financial products and services at its 36 banking locations in 23 communities throughout Central and Northern Kentucky. The most significant products and services include consumer and commercial lending and leasing, receiving deposits, providing trust services, and offering other traditional banking products and services. The primary goals of the Company are to continually improve profitability and shareholder value, maintain a strong capital position, provide excellent service to our customers through our community banking structure, and to provide a challenging and rewarding work environment for our employees.
The Company generates a significant amount of its revenue, cash flows, and net income from interest income and net interest income, respectively. Interest income is generated by earnings on the Company’s earning assets, primarily loans and investment securities. Net interest income is the excess of the interest income earned on earning assets over the interest expense paid on amounts borrowed to support those earning assets. Interest expense is paid primarily on deposit accounts and other short and long-term borrowing arrangements. The ability to properly manage net interest income under changing market environments is crucial to the success of the Company.
Managing credit risk, or the risk of loss due to customers or other counterparties not being able to meet their financial obligations under agreed upon terms, is also a factor that can significantly influence the operating results of the Company. The severe downturn in financial markets and in the overall economy during 2008 and into 2009 created unprecedented market volatility. Certain capital markets ceased to function and credit markets were unavailable to many businesses and consumers. In response, the U.S. government took extraordinary steps to stabilize financial markets by enacting broad legislation and regulatory initiatives that included the largest stimulus plan in its history. While there are signs of improvement in the U.S. financial markets and the overall economy, certain key metrics, such as high unemployment and lower real estate values, have had a significant negative impact on the Company’s operations. These events have had a direct impact on the Company in the form of higher nonperforming loans, an increase in the allowance for loan losses, and higher net loan charge-offs.
Following are the more significant events that summarize the Company’s operating results for 2009.
|
·
|
The Company recorded a one-time, non-cash, pretax goodwill impairment charge of $52.4 million during the fourth quarter of 2009 which does not impact regulatory capital. The impairment charge was attributed to the decline in the Company’s common share price, which has suffered similar to other peer financial institutions as a result of continuing economic weaknesses and heightened market concern surrounding the credit risk profile and capital positions of financial institutions.
|
|
·
|
Nonperforming assets have grown as a result of an increasing number of our borrowers that are unable to repay their loans due mainly as a result of the ongoing economic challenges that they and their customers face. This has resulted in lower interest income, a higher provision for loans losses, and impairment charges related to properties that the Company has repossessed in an attempt to satisfy customer loan obligations.
|
|
·
|
The Parent Company and three of its subsidiary banks have entered into agreements with their respective banking regulator primarily as a result of higher levels of nonperforming loans. The agreements with these three bank subsidiaries require them, among other things, to increase and maintain future capital ratios in certain increments over the next two quarters. Although each of the subsidiary banks are considered “well-capitalized” by historically established measures at December 31, 2009, banking authorities are increasingly requiring banks to maintain higher capital levels as a cushion for dealing with further deteriorating loan portfolios.
|
|
·
|
During the first quarter of 2009 the Company received a $30.0 million equity investment by the U.S. Department of Treasury (“Treasury”) as part of its Capital Purchase Program. The Company issued to the Treasury 30 thousand shares of Series A, no par cumulative perpetual preferred stock and a warrant to purchase an additional 223,992 common shares at a price of $20.09.
|
|
·
|
The Company put in motion a plan to improve its capital position toward the end of 2009. Part of that plan includes reducing the quarterly common stock dividend announced during the fourth quarter of 2009 to $.10 per share from the previous amount of $.25 per share. The Company decided to forgo declaring dividends on its common stock entirely in the first quarter of 2010 for an undetermined time period. The Company also filed a registration statement on Form S-3 with the SEC that became effective in the fourth quarter. As part of that filing, equity securities of the Company of up to a maximum aggregate offering price of $70 million could be offered for sale in one or more public or private offerings at an appropriate time. The Company continues to explore potential capital raising scenarios. However, no determination as to if or when a capital raise will be completed has been made. Net proceeds from a potential sale of securities under the registration statement could be used for any corporate purpose determined by the Company’s board of directors.
|
|
·
|
In January 2010, the Company named Lloyd C. Hillard, Jr. as its president and chief executive officer following the resignation of the previous chief executive officer.
|
39
RESULTS OF OPERATIONS
A one-time, non-cash, $46.5 million after tax goodwill impairment charge led to a net loss for the twelve months ended December 31, 2009 of $44.7 million or $6.32 per common share compared to net income of $4.4 million or $.60 per common share for the same twelve months of 2008. The $52.4 million pretax goodwill impairment charge was recorded during the fourth quarter of 2009 and represents the entire amount of goodwill previously reported. The goodwill impairment charge had a negative impact of $6.31 per common share. The impairment charge represents a one-time accounting transaction that had no impact on cash flows, liquidity, or key regulatory capital ratios of the Company or its bank subsidiaries. The goodwill impairment charge was primarily the result of a prolonged decline in the stock price of the Company, a situation similar to many of its peer banks and other financial institutions. Lower stock prices are mainly attributed to the continuing economic weaknesses and increased market concern surrounding the credit risk and capital positions of financial institutions.
Other significant factors impacting net income in the annual comparison include the following:
|
·
|
The provision for loan losses increased $15.4 million in the current twelve months compared to a year ago.
|
|
·
|
Net interest income decreased $4.9 million or 8.4% due mainly to lower interest on earning assets, primarily loans, which were negatively impacted by higher nonaccrual loans and loans that have repriced downward.
|
|
·
|
Net interest margin was 2.85% in the current twelve months, a decrease of 40 basis points from 3.25% in the prior-year twelve months. Net interest spread decreased 37 basis points to 2.61% from 2.98% driven mainly by the loan portfolio.
|
|
·
|
Noninterest income in the current year increased $18.4 million or 187%. The increase is mainly due to the impact of the other-than-temporary impairment (“OTTI”) charge recorded during 2008 related to the Company’s investment in preferred stocks of the Federal Home Loan Mortgage Corporation and the Federal National Mortgage Association (collectively, the “GSE’s”). This non-cash transaction reduced noninterest income during 2008 by $14.0 million. Noninterest income for 2009 was also positively impacted by a $3.7 million increase in net gains on the sale of investment securities.
|
|
·
|
The $55.0 million increase in noninterest expense is mainly attributed to the one-time, non-cash goodwill $52.4 million pre-tax impairment charge previously discussed along with an increase in deposit insurance expense of $2.7 million. The increase in deposit insurance expense is due in part to the special assessment imposed by the Federal Deposit Insurance Corporation during the current year as part of its plan to replenish the Deposit Insurance Fund. The Company was able to offset a portion of its deposit insurance expense in the prior year with a one-time assessment credit it received during 2006.
|
|
·
|
The $7.9 million increase in income tax benefit is due mainly to the impact of the goodwill impairment charge. A portion of the Company’s previously recorded goodwill was created in taxable business combinations and therefore was able to record a tax benefit of $5.9 million attributed to the impairment charge.
|
Return on assets (“ROA”) was (1.98)% in 2009, a decrease of 219 basis points from .21% for the prior year-end. The goodwill impairment charge, provision for loan losses, and net interest margin contributed 232 basis points, 67 basis points, and 40 basis points, respectively to lower ROA in the comparison. These negative effects were partially offset by 79 basis points higher noninterest income as a percentage of average assets and a benefit of 34 basis points attributed to income taxes. Return on equity (“ROE”) for 2009 was (22.68)% compared to 2.62% for 2008. The lower ROE is mainly attributed to the $44.7 million net loss for the year.
Interest Income
Interest income results from interest earned on earning assets, which primarily include loans and investment securities. Interest income is affected by volume (average balance), composition of earning assets, and the related rates earned on those assets. Total interest income for 2009 was $101 million, a decrease of $13.0 million or 11.4% compared to the previous year. Interest income decreased across nearly all major earning asset categories and was driven primarily by lower average rates earned. The Company’s tax equivalent yield on earning assets was 5.2% for 2009, a decrease of 95 basis points compared to 6.2% for 2008.
Interest and fees earned on loans was $76.6 million for 2009, a decrease of $10.0 million or 11.5% compared to $86.6 million a year earlier. The decline in interest and fees on loans is due mainly to a 79 basis point lower average rate earned, which offset a slight increase of $4.4 million or .3% in average loans outstanding in the comparable period. The lower average rate earned on loans is reflective of competitive and economic pressures impacting the pricing of new loans and variable rate loans that have in the aggregate adjusted downward upon their repricing interval. Restructured loans, which often include rate concessions made to the borrower, were $17.9 million at year-end 2009 and had a negative impact on interest income. An increase in the average balance outstanding of nonaccrual loans have also contributed to the decrease in interest income on loans in the comparison. The tax equivalent yield on loans was 5.9% for 2009 compared to 6.7% for 2008.
Interest on taxable investment securities was $20.4 million for 2009, a decrease of $2.5 million or 10.8% compared to $22.9 million a year ago. The decrease is primarily rate driven and reflects a 79 basis point decline in the average rate earned in 2009 to 4.6% from 5.4% in 2008. A $20.1 million or 4.7% increase in volume partially offset the impact from the lower average rate earned in the comparison. The decrease in the average rate earned is mainly due to principal prepayments received on mortgaged-backed securities and other called or sold bonds. The proceeds from these payments were reinvested at rates that were lower than their original book yield. A large portion
40
of these investments had originally been made during periods of higher rates, prior to the dramatic reductions in overall market interest rates that took place in the fourth quarter of 2008. Interest on nontaxable investment securities was $3.6 million for 2009, an increase of $339 thousand or 10.5% compared to 2008 and was driven by an increase in the average balance outstanding of $11.2 million or 12.9%. Average balances outstanding increased as a result of improved interest rate spreads available in the market as compared to other taxable alternatives.
Interest income from short-term temporary investments, which include time deposits in other banks and federal funds sold and securities purchased under agreements to resell, decreased $897 thousand or 74.8% due to a lower average rate earned. The average rate earned on temporary investments for 2009 was .23%, a decrease of 160 basis points compared to 1.83% for 2008. The lower average rate earned is consistent with the available short-term market yields, particularly that of the federal funds rate, which began 2008 at 4.25% before falling sharply to near zero percent by year-end 2008 and remained at that level throughout 2009.
Interest Expense
Interest expense results from incurring interest on interest bearing liabilities, which include interest bearing deposits, federal funds purchased, securities sold under agreements to repurchase, and other short and long-term borrowed funds. Interest expense is affected by volume, composition of interest bearing liabilities, and the related rates paid on those liabilities. Total interest expense was $47.1 million for 2009, a decrease of $8.1 million or 14.6% compared to $55.1 million for the prior year. Interest expense decreased mainly as a result of a lower average rate paid on interest bearing liabilities, particularly on deposits, in an overall lower interest rate environment. The average rate paid on interest bearing liabilities was 2.6% for 2009, a decrease of 58 basis points compared to 3.2% for 2008.
The downward trend in interest expense for 2009 closely resembles the trend for interest income, particularly for shorter-term deposits and borrowing agreements. The federal funds rate was 4.25% at the beginning of 2008. It fell to near zero percent by the end of 2008 and remained at that level for all of 2009. New deposits and other borrowing arrangements as well as the repricing of existing deposits and borrowings at lower market interest rates, particularly for shorter-term instruments, resulted in overall lower interest expense in the comparable periods.
Interest expense on deposit accounts declined $5.8 million or 15.0% in the annual comparison. The decrease in interest expense on deposits was led by lower interest on time deposits of $3.2 million or 9.6%. Although average time deposits increased by $109 million, an 87 basis point lower average rate paid of 3.4% more than offset the higher average outstanding balances. Interest expense on savings and interest bearing demand deposits decreased $1.5 million or 43.5% and $1.1 million or 60.5% in 2009 compared to 2008. The decrease in interest expense on savings and interest bearing demand accounts were largely driven by lower average rates paid of 57 basis points and 41 basis points, respectively and, to a smaller extent, lower average balances outstanding.
Interest expense on short-term and long-term borrowing decreased $1.3 million or 74.6% and $885 thousand or 6.2%, respectively. The decrease in interest expense on borrowings was due mainly to lower average rates paid and, in the case of short-term borrowings, a lower average outstanding balance in 2009 compared to a year ago. The average rate paid on short-term borrowings was .72% for 2009, a decrease of 148 basis points compared to 2.2% for 2008. Average outstanding balances for short-term borrowings declined $18.2 million or 22.5% in 2009 primarily related to reductions in federal funds purchased transactions pertaining to correspondent banking activities. The average rate paid on long-term borrowings was 4.1% for 2009, a decrease of 28 basis points compared to 4.3% for 2008.
Net Interest Income
Net interest income is the most significant component of the Company’s operating earnings. Net interest income is the excess of the interest income earned on earning assets over the interest paid for funds to support those assets. The two most common metrics used to analyze net interest income are net interest spread and net interest margin. Net interest spread represents the difference between the yields on earning assets and the rates paid on interest bearing liabilities. Net interest margin represents the percentage of net interest income to average earning assets. Net interest margin will exceed net interest spread because of the existence of noninterest bearing sources of funds, principally demand deposits and shareholders’ equity, which are also available to fund earning assets. Changes in net interest income and margin result from the interaction between the volume and the composition of earning assets, their related yields, and the associated cost and composition of the interest bearing liabilities. Accordingly, portfolio size, composition, and the related yields earned and the average rates paid can have a significant impact on net interest spread and margin. The table that follows represents the major components of interest earning assets and interest bearing liabilities on a tax equivalent basis. To compare the tax-exempt asset yields to taxable yields, amounts in the table are adjusted to pretax equivalents based on the marginal corporate Federal tax rate of 35%.
Tax equivalent net interest income was $56.4 million for 2009, a decrease of $4.8 million or 7.8% compared to $61.1 million for 2008. The net interest margin was 2.9%, a decrease of 40 basis points from 3.3% in the prior year. Net interest spread accounted for 37 basis points of the lower net interest margin and was 2.6% for 2009 compared to 3.0% for 2008. The impact of noninterest bearing sources of funds negatively impacted net interest margin by 3 basis points in the comparison. The effect of noninterest bearing sources of funds on net interest margin typically decreases as the average cost of funds declines.
41
During 2009, the Company’s tax equivalent yield on total earning assets was 5.2%, a decrease of 95 basis points from 6.2% for 2008. The average cost of funds was 2.6%, a decrease of 58 basis points compared to 3.2% for 2008. This resulted in a net interest spread of 2.6% and 3.0% for year-ends 2009 and 2008 as discussed above. The Company expects its net interest margin to remain relatively flat or increase slightly in the near term according to internal modeling using expectations about future market interest rates, the maturity structure of the Company’s earning assets and liabilities, and other factors. Future results could be significantly different than expectations.
Net interest income for 2009 includes $3.1 million related to the Company’s balance sheet leverage transaction that took place during the fourth quarter of 2007. This represents a decrease of $331 thousand or 9.5% compared to $3.5 million for 2008. The leverage transaction, while positively impacting net interest income and net income, trimmed net interest margin by 15 basis points and 22 basis points for 2009 and 2008, respectively.
The Company continues to actively monitor and proactively manage the rate sensitive components of both its assets and liabilities in a continuously changing and difficult market environment. This task has become increasingly more difficult following the extreme market disruptions and economic downturn that began in 2008. Competition in the Company’s market areas continues to be intense. The overall interest rate environment remains low by historical measures. The Federal Reserve has kept its short-term federal funds target rate near zero percent since mid-December 2008. Current data suggests, however, that the federal funds target rate may begin to tick upwards beginning in 2010. Yields on Treasury securities of medium and longer-term maturity structures have experienced increases already. For instance, two and ten year Treasury notes and bonds increased 37 basis points and 197 basis points at year-end 2009 compared to year-end 2008.
The prime interest rate, which has a significant impact on the Company’s interest income on loans, has moved in a manner similar to that of the short-term federal funds rate. The prime rate was 7.25% to begin 2008, falling 400 basis points to 3.25% by year-end 2008 where it remained throughout all of 2009. Predicting the movement of future interest rates is uncertain. During 2009, the average rates for two of the most significant components of net interest income for the Company, loans and time deposits, both declined. As previously noted, the average rate earned on the Company’s loan portfolio declined 79 basis points to 5.9% during 2009. The average rate paid on time deposits decreased 87 basis points to 3.4% in the year-to-year comparison. Should interest rates on the Company’s earning assets and interest paying liabilities reprice lower, the Company’s yield on earning assets could potentially decrease faster than its cost of funds. Should interest rates reprice higher, the Company’s cost of funds may also increase and could continue to increase faster than the yields on earning assets, resulting in a lower net interest margin.
42
Distribution of Assets, Liabilities and Shareholders’ Equity: Interest Rates and Interest Differential
|
Years Ended December 31,
|
2009
|
2008
|
2007
|
|||||||||||||||||||||||||||||||||
|
Average
|
Average
|
Average
|
Average
|
Average
|
Average
|
|||||||||||||||||||||||||||||||
|
(In thousands)
|
Balance
|
Interest
|
Rate
|
Balance
|
Interest
|
Rate
|
Balance
|
Interest
|
Rate
|
|||||||||||||||||||||||||||
|
Earning Assets
|
||||||||||||||||||||||||||||||||||||
|
Investment securities
|
||||||||||||||||||||||||||||||||||||
|
Taxable
|
$ | 445,329 | $ | 20,424 | 4.59 | % | $ | 425,206 | $ | 22,894 | 5.38 | % | $ | 253,423 | $ | 12,627 | 4.98 | % | ||||||||||||||||||
|
Nontaxable1
|
97,960 | 5,186 | 5.29 | 86,784 | 4,653 | 5.36 | 88,501 | 4,794 | 5.42 | |||||||||||||||||||||||||||
|
Time deposits with banks, federal funds sold and securities purchased under agreements to resell
|
129,092 | 302 | .23 | 65,477 | 1,199 | 1.83 | 70,062 | 3,333 | 4.76 | |||||||||||||||||||||||||||
|
Loans 1,2,3
|
1,306,800 | 77,522 | 5.93 | 1,302,394 | 87,509 | 6.72 | 1,250,423 | 95,825 | 7.66 | |||||||||||||||||||||||||||
|
Total earning assets
|
1,979,181 | $ | 103,434 | 5.23 | % | 1,879,861 | $ | 116,255 | 6.18 | % | 1,662,409 | $ | 116,579 | 7.01 | % | |||||||||||||||||||||
|
Allowance for loan losses
|
(18,965 | ) | (14,757 | ) | (11,486 | ) | ||||||||||||||||||||||||||||||
|
Total earning assets, net of allowance for loan losses
|
1,960,216 | 1,865,104 | 1,650,923 | |||||||||||||||||||||||||||||||||
|
Nonearning Assets
|
||||||||||||||||||||||||||||||||||||
|
Cash and due from banks
|
96,965 | 72,373 | 78,810 | |||||||||||||||||||||||||||||||||
|
Premises and equipment, net
|
41,069 | 40,649 | 38,860 | |||||||||||||||||||||||||||||||||
|
Other assets
|
163,804 | 159,228 | 117,459 | |||||||||||||||||||||||||||||||||
|
Total assets
|
$ | 2,262,054 | $ | 2,137,354 | $ | 1,886,052 | ||||||||||||||||||||||||||||||
|
Interest Bearing Liabilities
|
||||||||||||||||||||||||||||||||||||
|
Deposits
|
||||||||||||||||||||||||||||||||||||
|
Interest bearing demand
|
$ | 247,235 | $ | 713 | .29 | % | $ | 256,129 | $ | 1,805 | .70 | % | $ | 258,992 | $ | 3,684 | 1.42 | % | ||||||||||||||||||
|
Savings
|
256,063 | 1,976 | .77 | 261,692 | 3,499 | 1.34 | 244,299 | 5,299 | 2.17 | |||||||||||||||||||||||||||
|
Time
|
902,066 | 30,508 | 3.38 | 793,561 | 33,741 | 4.25 | 748,939 | 36,174 | 4.83 | |||||||||||||||||||||||||||
|
Federal funds purchased and other short-term borrowings
|
62,948 | 453 | .72 | 81,180 | 1,785 | 2.20 | 97,192 | 4,504 | 4.63 | |||||||||||||||||||||||||||
|
Securities sold under agreements to repurchase and other long-term borrowings
|
331,073 | 13,415 | 4.05 | 330,468 | 14,300 | 4.33 | 127,277 | 6,378 | 5.01 | |||||||||||||||||||||||||||
|
Total interest bearing liabilities
|
1,799,385 | $ | 47,065 | 2.62 | % | 1,723,030 | $ | 55,130 | 3.20 | % | 1,476,699 | $ | 56,039 | 3.79 | % | |||||||||||||||||||||
|
Noninterest Bearing Liabilities
|
||||||||||||||||||||||||||||||||||||
|
Commonwealth of Kentucky deposits
|
34,992 | 37,025 | 37,119 | |||||||||||||||||||||||||||||||||
|
Other demand deposits
|
191,656 | 177,347 | 177,304 | |||||||||||||||||||||||||||||||||
|
Other liabilities
|
38,725 | 31,952 | 19,009 | |||||||||||||||||||||||||||||||||
|
Total liabilities
|
2,064,758 | 1,969,354 | 1,710,131 | |||||||||||||||||||||||||||||||||
|
Shareholders’ equity
|
197,296 | 168,000 | 175,921 | |||||||||||||||||||||||||||||||||
|
Total liabilities and shareholders’ equity
|
$ | 2,262,054 | $ | 2,137,354 | $ | 1,886,052 | ||||||||||||||||||||||||||||||
|
Net interest income
|
56,369 | 61,125 | 60,540 | |||||||||||||||||||||||||||||||||
|
TE basis adjustment
|
(2,524 | ) | (2,335 | ) | (2,322 | ) | ||||||||||||||||||||||||||||||
|
Net interest income
|
$ | 53,845 | $ | 58,790 | $ | 58,218 | ||||||||||||||||||||||||||||||
|
Net interest spread
|
2.61 | % | 2.98 | % | 3.22 | % | ||||||||||||||||||||||||||||||
|
Effect of noninterest bearing sources of funds
|
.24 | .27 | .42 | |||||||||||||||||||||||||||||||||
|
Net interest margin
|
2.85 | % | 3.25 | % | 3.64 | % | ||||||||||||||||||||||||||||||
|
1Income and yield stated at a fully tax equivalent basis using the marginal corporate Federal tax rate of 35%.
|
|
2Loan balances include principal balances on nonaccrual loans.
|
|
3Loan fees included in interest income amounted to $1.8 million, $2.3 million, and $2.7 million for 2009, 2008, and 2007, respectively.
|
43
The following table is an analysis of the change in net interest income.
Analysis of Changes in Net Interest Income (tax equivalent basis)
|
Variance
|
Variance Attributed to
|
Variance
|
Variance Attributed to
|
|||||||||||||||||||||
|
(In thousands)
|
2009/2008 | 1 |
Volume
|
Rate
|
2008/2007 | 1 |
Volume
|
Rate
|
||||||||||||||||
|
Interest Income
|
||||||||||||||||||||||||
|
Taxable investment securities
|
$ | (2,470 | ) | $ | 1,036 | $ | (3,506 | ) | $ | 10,267 | $ | 9,179 | $ | 1,088 | ||||||||||
|
Nontaxable investment securities2
|
533 | 594 | (61 | ) | (141 | ) | (90 | ) | (51 | ) | ||||||||||||||
|
Time deposits with banks, federal funds sold and securities purchased under agreements to resell
|
(897 | ) | 631 | (1,528 | ) | (2,134 | ) | (205 | ) | (1,929 | ) | |||||||||||||
|
Loans2
|
(9,987 | ) | 296 | (10,283 | ) | (8,316 | ) | 3,844 | (12,160 | ) | ||||||||||||||
|
Total interest income
|
(12,821 | ) | 2,557 | (15,378 | ) | (324 | ) | 12,728 | (13,052 | ) | ||||||||||||||
|
Interest Expense
|
||||||||||||||||||||||||
|
Interest bearing demand deposits
|
(1,092 | ) | (61 | ) | (1,031 | ) | (1,879 | ) | (40 | ) | (1,839 | ) | ||||||||||||
|
Savings deposits
|
(1,523 | ) | (73 | ) | (1,450 | ) | (1,800 | ) | 354 | (2,154 | ) | |||||||||||||
|
Time deposits
|
(3,233 | ) | 4,235 | (7,468 | ) | (2,433 | ) | 2,074 | (4,507 | ) | ||||||||||||||
|
Federal funds purchased and other short-term borrowings
|
(1,332 | ) | (333 | ) | (999 | ) | (2,719 | ) | (649 | ) | (2,070 | ) | ||||||||||||
|
Securities sold under agreements to repurchase and other long-term borrowings
|
(885 | ) | 26 | (911 | ) | 7,922 | 8,896 | (974 | ) | |||||||||||||||
|
Total interest expense
|
(8,065 | ) | 3,794 | (11,859 | ) | (909 | ) | 10,635 | (11,544 | ) | ||||||||||||||
|
Net interest income
|
$ | (4,756 | ) | $ | (1,237 | ) | $ | (3,519 | ) | $ | 585 | $ | 2,093 | $ | (1,508 | ) | ||||||||
|
Percentage change
|
100.0 | % | 26.0 | % | 74.0 | % | 100.0 | % | 357.8 | % | (257.8 | )% | ||||||||||||
|
1
|
The changes which are not solely due to rate or volume are allocated on a percentage basis using the absolute values of rate and volume variances as a basis for allocation.
|
|
2
|
Income stated at fully tax equivalent basis using the marginal corporate Federal tax rate of 35%.
|
Noninterest Income
Noninterest income for 2009 was $28.2 million, an increase of $18.4 million or 187% compared to the prior year. The increase in noninterest income in the comparison was primarily the result of the $14.0 million non-cash OTTI charge related to the Company’s GSE preferred stock investments that was recorded as a reduction in noninterest income in the third quarter of 2008 and an additional $766 thousand realized loss on the sale of its GSE investments in the fourth quarter of 2008. Excluding the securities transactions related to the GSE investments, noninterest income increased $3.6 million or 14.8% in the annual comparison.
Net securities gains were $3.5 million for 2009, an increase of $3.7 million compared to net securities losses of $166 thousand for 2008. The net loss from the sale of investment securities during 2008 includes a $766 thousand loss on the sale of the Company’s GSE investments during the fourth quarter. Higher net securities gains in 2009 is a result of an increase in sales activity and continuing refinements to the securities portfolio to be in better position going forward. Net gains on the sale of loans were $1.0 million for 2009, an increase of $627 thousand or 154% compared to 2008 due to higher sales volume that have been boosted by a low interest rate environment and consumer refinancing activity. Allotment processing fees were $5.4 million for 2009, an increase of $612 thousand or 12.8% due to higher processing volumes. Data processing fees jumped $230 thousand or 21.2% in 2009 to $1.3 million. The increase in data processing fees are primarily related to higher transaction volumes from the Commonwealth of Kentucky and an upward trend in processing unemployment-related items.
Service charges and fees on deposit accounts were $9.3 million for 2009. This represents a decrease of $500 thousand or 5.1% compared to $9.8 million for 2008. The decrease in service charges on deposit accounts was driven by lower NSF fees of $445 thousand and experienced throughout most of the Company’s market areas as a result of lower volumes. Trust income decreased $269 thousand or 13.2%, due mainly to an overall decline in managed-account balances, which serves as a key part of the revenue base for collecting fees on these accounts.
Noninterest Expense
Total noninterest expenses were $115 million for 2009, an increase of $55.0 million or 91.6% compared to $60.1 million for 2008. The sharp increase in noninterest expense in 2009 is attributed to a $52.4 million one-time, non-cash goodwill impairment charge and a $2.7 million increase in deposit insurance.
44
The $52.4 million goodwill impairment charge was recorded during the fourth quarter of 2009 as a result of the Company’s annual goodwill impairment testing. During the annual impairment testing, the Company concluded that as a result of continuing economic weaknesses and heightened market concern surrounding the credit risk and capital position of financial institutions, the fair value of the Company’s single reporting unit would more likely than not be below its carrying amount. The Company engaged an independent third party to assist with its goodwill impairment analysis and determined that the implied fair value of its goodwill was significantly less than the carrying value resulting in the non-cash impairment charge.
The $2.7 million increase in deposit insurance expense in 2009 compared to 2008 is due in part to a special assessment imposed by the FDIC during 2009 as part of its plan to replenish the Deposit Insurance Fund. The special assessment accounted for $1.1 million of the increase in deposit insurance for the current year. In addition, deposit insurance expense for 2008 was low as a result of the Company’s ability to offset a portion of its expense with a one-time assessment credit it received during 2006. There are no credits remaining to offset future assessments.
Significant increases in other noninterest expense line items include net other real estate expenses of $1.5 million and net occupancy expense of $476 thousand or 10.5%. The increase in net other real estate expenses correlates with the $16.8 million higher net amount of foreclosed real estate properties held by the Company at year-end 2009 compared to year-end 2008. Expenses relating to these properties generally include amounts to prepare the properties for resale and, in some cases, impairment charges to write down a property’s book value to its fair value less estimated costs to sell as determined by appraisal. The increase in net occupancy expense in 2009 compared to 2008 is mainly attributed to higher depreciation and rent. Depreciation and rent is up mainly as a result of the timing of several new buildings put into service during 2008 whereby less than a full year of expense related to these buildings was recognized in that year. Depreciation expense in 2009 also includes the acceleration of $186 thousand on leasehold improvements recognized upon the termination of a leased property.
Significant decreases in noninterest expense include amortization of intangible assets of $650 thousand or 25.0% and salaries and employee benefits of $358 thousand or 1.2%. Amortization of intangible assets, which relate to customer lists and core deposits from prior acquisitions, is decreasing as a result of amortization schedules that allocate a higher amount of amortization in the earlier periods following an acquisition consistent with how the assets are used. The decrease in salaries and employee benefits correlates with a lower average number of full time equivalent employees, which were 561 for 2009 compared to 577 for 2008. Salary and related payroll taxes decreased $741 thousand or 3.0% consistent with lower head count. Benefit costs increased $372 thousand or 7.0% due to higher claims related to the Company’s self-funded insurance plan. All other noninterest expenses decreased $1.0 million, net. The net decrease represents numerous line items of relatively small amounts as the Company attempts to better manage and reduce overall costs along all line items. The largest decline in this group of accounts represents lower advertising expenses in the amount of $377 thousand.
Income Tax
The Company recorded an income tax benefit for 2009 of $9.2 million compared to a benefit of $1.2 million for 2008. The $7.9 million increase in the income tax benefit recorded in 2009 is due mainly to the impact of the goodwill impairment charge. A portion of the Company’s previously recorded goodwill was created in taxable business combinations and therefore it was able to record a tax benefit of $5.9 million attributed to the impairment charge in 2009. For 2008, the income tax benefit was mainly attributed to the losses associated with the GSE preferred stock investments in the third and fourth quarters of 2008.
FINANCIAL CONDITION
Total assets were $2.2 billion at December 31, 2009, a decrease of $30.6 million or 1.4% from the prior year-end. The decrease in assets is primarily related to the $52.4 million goodwill impairment charge recorded in the fourth quarter of 2009 and a $47.2 million decrease in loans outstanding (net of unearned income and allowance for loan losses). These amounts were partially offset by an increase in cash and equivalents of $27.6 million or 14.4% and investment securities of $21.9 million or 4.1%.
The increase in current end of period cash and cash equivalents compared to year-end 2008 was driven by the cash raised from the preferred stock issued to the Treasury during the first quarter of 2009 and to the overall net funding position of the Company. The Company maintains a cautious and measured lending strategy with tighter loan underwriting standards as it and many of its customers continue to deal with the effects of one of the most severe recessions in many decades. While economic data is beginning to improve by some measures, the overall economy continues to show weaknesses, particularly the high level of unemployment and lower overall real estate values.
Total liabilities were $2.0 billion at December 31, 2009, a decrease of $9.5 million or .5% compared to December 31, 2008. Net deposits increased $39.3 million or 2.5% while net borrowed funds decreased $49.0 million or 11.9%. Shareholders’ equity declined $21.1 million or 12.5% to $147 million at year-end 2009 due mainly to the net loss for the year partially offset by the additional capital raised from the Company’s issuance of $30.0 million of preferred stock to the Treasury.
45
Management of the Company considers it noteworthy to understand the relationship between the Company’s principal subsidiary, Farmers Bank, and the Commonwealth of Kentucky. Farmers Bank provides various services to state agencies of the Commonwealth. As the depository for the Commonwealth, checks are drawn on Farmers Bank by these agencies, which include paychecks and state income tax refunds. Farmers Bank also processes vouchers of the WIC (Women, Infants and Children) program for the Cabinet for Human Resources. The Bank’s investment department also provides services to the Teachers’ Retirement System. As the depository for the Commonwealth, large fluctuations in deposits are likely to occur on a daily basis. Therefore, reviewing average balances is important to understanding the financial condition of the Company as daily deposit balances fluctuate significantly as a result of the Farmers Bank’s relationship with the Commonwealth.
On an average basis, total assets were $2.3 billion for 2009, an increase of $125 million or 5.8% from 2008. The increase in average assets is attributed mainly to higher earning asset balances of $99.3 million or 5.3%. Average temporary investments increased $63.6 million or 97.2% compared to 2008. Average investment securities were up $31.3 million or 6.1%. Average loans increased $4.4 million or .3% for 2009 compared to the average 2008 balance. Deposits averaged $1.6 billion for 2009, an increase of $106 million or 7.0% from the prior year average. Time deposits, the largest portion of total deposits, increased $109 million or 13.7% on average. Average earning assets were 87.5% of total average assets for 2009 compared to 88.0% for 2008.
Loans
Loans, net of unearned income, were $1.3 billion at December 31, 2009, a decrease of $40.6 million or 3.1% compared to year-end 2008. The Company continues to take a measured and cautious approach to loan growth while it works through its nonperforming assets, which have increased sharply as a result of the lingering effects of one of the most severe recessions in recent history. Loans secured by residential real estate grew $21.5 million or 4.8% at year-end 2009 compared to a year earlier. Commercial, financial, and agricultural-backed lending increased $1.7 million or 1.2%. Remaining sectors of the loan portfolio experienced declines as follows: real estate construction $48.8 million or 18.7%, real estate secured by farmland and other commercial enterprises $3.8 million or 1.0%, consumer installment loans of $8.4 million or 18.6%, and commercial lease financing of $2.9 million or 10.7%. On average, loans represent 66.0% of earning assets for 2009 compared to 69.3% for 2008.
When loan demand declines, the available funds are redirected to temporary investments or investment securities, which typically involve a decrease in credit risk and produce lower yields. The Company does not have direct exposure to the subprime mortgage market. The Company does not originate subprime mortgages nor has it invested in bonds that are secured by such mortgages. Subprime mortgage lending is defined by the Company generally as lending to a borrower that would not qualify for a mortgage loan at prevailing market rates or whereby the underwriting decision is based on limited or no documentation of the ability to repay.
The composition of the loan portfolio, net of unearned income, is summarized in the table below.
|
(In thousands)
December 31,
|
2009
|
%
|
2008
|
%
|
2007
|
%
|
2006
|
%
|
2005
|
%
|
||||||||||||||||||||||||||||||
|
Commercial, financial, and agricultural
|
$ | 146,530 | 11.5 | % | $ | 144,788 | 11.0 | % | $ | 154,015 | 11.9 | % | $ | 197,613 | 16.5 | % | $ | 173,797 | 18.1 | % | ||||||||||||||||||||
|
Real estate – construction
|
211,744 | 16.7 | 260,524 | 19.9 | 254,788 | 19.7 | 176,779 | 14.7 | 88,693 | 9.2 | ||||||||||||||||||||||||||||||
|
Real estate mortgage – residential
|
466,018 | 36.6 | 444,487 | 33.9 | 405,992 | 31.5 | 381,081 | 31.8 | 331,508 | 34.4 | ||||||||||||||||||||||||||||||
|
Real estate mortgage – farmland and other commercial enterprises
|
386,626 | 30.4 | 390,424 | 29.7 | 394,900 | 30.6 | 351,793 | 29.4 | 274,411 | 28.5 | ||||||||||||||||||||||||||||||
|
Installment
|
36,727 | 2.9 | 45,135 | 3.4 | 52,028 | 4.0 | 57,116 | 4.8 | 56,169 | 5.8 | ||||||||||||||||||||||||||||||
|
Lease financing
|
24,297 | 1.9 | 27,222 | 2.1 | 30,262 | 2.3 | 33,454 | 2.8 | 37,993 | 4.0 | ||||||||||||||||||||||||||||||
|
Total
|
$ | 1,271,942 | 100.0 | % | $ | 1,312,580 | 100.0 | % | $ | 1,291,985 | 100.0 | % | $ | 1,197,836 | 100.0 | % | $ | 962,571 | 100.0 | % | ||||||||||||||||||||
46
The following table presents commercial, financial, and agricultural loans and real estate construction loans outstanding at December 31, 2009 which, based on remaining scheduled repayments of principal, are due in the periods indicated.
Loan Maturities
|
|
After One But
|
|
||||||||||||||
|
(In thousands)
|
Within One Year
|
Within Five Years
|
After Five Years
|
Total
|
||||||||||||
|
Commercial, financial, and agricultural
|
$ | 54,474 | $ | 49,134 | $ | 42,922 | $ | 146,530 | ||||||||
|
Real estate – construction
|
150,087 | 51,859 | 9,798 | 211,744 | ||||||||||||
|
Total
|
$ | 204,561 | $ | 100,993 | $ | 52,720 | $ | 358,274 | ||||||||
The table below presents commercial, financial, and agricultural loans and real estate construction loans outstanding at December 31, 2009 that are due after one year, classified according to sensitivity to changes in interest rates.
Interest Sensitivity
|
Fixed
|
Variable
|
|||||||
|
(In thousands)
|
Rate
|
Rate
|
||||||
|
Due after one but within five years
|
$ | 66,181 | $ | 34,812 | ||||
|
Due after five years
|
16,777 | 35,943 | ||||||
|
Total
|
$ | 82,958 | $ | 70,755 | ||||
The Company’s loan portfolio is subject to varying degrees of credit risk. Credit risk is mitigated by diversification within the portfolio, limiting exposure to any single customer or industry, rigorous lending policies and underwriting criteria, and collateral requirements. The Company maintains policies and procedures to ensure that the granting of credit is done in a sound and consistent manner. This includes policies on a company-wide basis that require certain minimum standards to be maintained. However, the policies also permit the individual subsidiary companies authority to adopt standards that are no less stringent than those included in the company-wide policies. Credit decisions are made at the subsidiary bank level under guidelines established by policy. The Company’s internal audit department performs loan reviews at each subsidiary bank during the year. This loan review evaluates loan administration, credit quality, documentation, compliance with Company loan standards, and the adequacy of the allowance for loan losses on a consolidated and subsidiary basis.
The provision for loan losses represents charges made to earnings to maintain an allowance for loan losses at an adequate level based on credit losses specifically identified in the loan portfolio, as well as management’s best estimate of probable incurred loan losses in the remainder of the portfolio at the balance sheet date. The allowance for loan losses is a valuation allowance increased by the provision for loan losses and decreased by net charge-offs. Loan losses are charged against the allowance when management believes the uncollectibility of a loan is confirmed. Subsequent recoveries, if any, are credited to the allowance.
Management estimates the allowance balance required using a risk-rated methodology. Many factors are considered when estimating the allowance. These include, but are not limited to, past loan loss experience, an assessment of the financial condition of individual borrowers, a determination of the value and adequacy of underlying collateral, the condition of the local economy, an analysis of the levels and trends of the loan portfolio, and a review of delinquent and classified loans. The allowance for loan losses consists of specific and general components. The specific component relates to loans that are individually classified as impaired or loans otherwise classified as substandard or doubtful. The general component covers non-classified loans and is based on historical loss experience adjusted for current risk factors. Allocations of the allowance may be made for specific loans, but the entire allowance is available for any loan that, in management’s judgment, should be charged off. Actual loan losses could differ significantly from the amounts estimated by management.
The risk-rated methodology includes segregating watch list and past due loans from the general portfolio and allocating specific reserves to these loans depending on their status. For example, watch list loans, which may be identified by the internal loan review risk-rating system or by regulatory examiner classification, are assigned a certain loss percentage while loans past due 30 days or more are assigned a different loss percentage. Each of these percentages considers past experience as well as current factors. The remainder of the general loan portfolio is segregated into three components having similar risk characteristics as follows: commercial loans, consumer loans, and real estate loans. Each of these components is assigned a loss percentage based on their respective three year historical loss percentage. Additional allocations to the allowance may then be made for subjective factors, such as those mentioned above, as determined by senior managers who are knowledgeable about these matters. During 2007, the Company further identified signs of deterioration in certain real estate development loans that continued into 2008 and 2009 and specific allowances related to these loans were recorded.
47
While management considers the allowance for loan losses to be adequate based on the information currently available, additional adjustments to the allowance may be necessary due to changes in the factors noted above. Borrowers may experience difficulty in periods of economic deterioration, and the level of nonperforming loans, charge-offs, and delinquencies could rise and require additional increases in the provision. Regulatory agencies, as an integral part of their examinations, periodically review the allowance for loan losses. These reviews could result in additional adjustments to the provision based upon their judgments about relevant information available during their examination.
In general, the provision for loan losses and related allowance increases as the level of nonperforming and impaired loans, as a percentage of net loans outstanding, increases. The Company’s allowance for loan loss amount has heavily considered past loan loss experience to estimate current loan losses, but it also considers current trends within the portfolio that may not be indicative of past charge-off levels. Adjustments are made to the allowance for loan losses as needed when such matters are identified. Although net charge-offs spiked upward during 2009, the upward trend in net charge-offs during our three year look-back period have been relatively low. Significant weaknesses in the general economy, particularly a softer housing market combined with significant credit tightening throughout the financial services industry began in 2007. Overall economic conditions, including widespread illiquidity and extreme volatility in financial markets, higher unemployment rates, and other unprecedented market conditions, continued to worsen in 2008 and into 2009 before beginning to stabilize toward the end of 2009. Unemployment remains high. These economic conditions resulted in significant stress primarily in the Company’s residential real estate development and commercial real estate sectors of its lending portfolio. As such, the Company increased its allowance amounts for real estate development and commercial real estate lending in consideration of these current factors, even though historic net charge-offs have been relatively low.
For loans that are currently impaired, defined as loans in which the Company does not expect to receive full payment under the contractual terms, the Company expects to recover significantly all of the principal amounts outstanding based on collateral values obtained from independent appraisals. This has resulted in the amount of nonperforming and impaired loans that have increased disproportionately with the related allowance for loan losses. Impaired loans are measured at the present value of expected future cash flows, discounted at the loan’s effective interest rate, at the loan’s observable market price, or at the fair value of the collateral taking into consideration estimated costs to sell if the loan is collateral dependent. Collateral values are updated as warranted by periodically obtaining independent third party appraisals and monitoring sales activity of similar properties in our market area.
The provision for loan losses was $20.8 million in 2009, an increase of $15.4 million compared to $5.3 million for 2008. The increase in the provision for loan losses reflects a higher level of nonperforming loans, primarily nonaccrual and restructured loans that have trended upward as the overall economic environment and certain customers’ ability to repay their loans have deteriorated. Nonperforming loans were $76.3 million at December 31, 2009 compared to $25.5 million at December 31, 2008. This represents a net increase of $50.9 million. Although the Company is beginning to see an increase in the number of smaller-balance credits showing signs of deterioration, a significant amount of the increase in nonperforming loans is attributed to a relatively small number of larger-balance credits. Nine individual larger-balance credits totaling $40.3 million in the aggregate were added to nonperforming status during 2009, $33.6 million of which is secured by real estate developments and the remaining $6.7 million secured by commercial real estate.
Total net charge-offs for the Company were $14.2 million for 2009 and were as follows: real estate lending $9.5 million, lease financing $2.4 million, commercial, financial, and agricultural loans $1.5 million, and installment loans $843 thousand. Net charge-offs increased $11.5 million in 2009 compared to 2008 as follows: real estate lending $8.7 million, lease financing $2.4 million, commercial, financial, and agriculture $350 thousand or 31.7%, and installment loans $70 thousand or 9.1%. Net charge-offs in 2009 were largely driven by lower real estate values along with slower sales and excess inventory primarily related to loans secured by real estate developments. The decline in real estate values is attributed to the overall economic downturn that began in 2007 which has yet to fully stabilize. The increase in net charge-offs for lease financing was driven by a single charge-off in 2009 resulting from fraudulent transactions on the part of a lease customer.
Net charge-offs were 1.09% of average loans for 2009, up 88 basis points from .21% in 2008. The allowance for loan losses was $23.4 million at year-end 2009 and represented 1.84% of loans net of unearned income at year-end 2009 compared to 1.28% at year-end 2008. The allowance for loan losses as a percentage of nonperforming loans was 30.6% and 66.1% at year-end 2009 and 2008, respectively. Management continues to emphasize collection efforts and evaluation of risks within the portfolio. The composition of the Company’s loan portfolio continues to be diverse with no significant concentration to any individual or industry.
48
The table below summarizes the loan loss experience for the past five years.
|
Years Ended December 31, (In thousands)
|
2009
|
2008
|
2007
|
2006
|
2005
|
|||||||||||||||
|
Balance of allowance for loan losses at beginning of year
|
$ | 16,828 | $ | 14,216 | $ | 11,999 | $ | 11,069 | $ | 11,043 | ||||||||||
|
Acquisition of Citizens Jessamine
|
1,066 | |||||||||||||||||||
|
Acquisition of Citizens Northern
|
1,410 | |||||||||||||||||||
|
Loans charged off:
|
||||||||||||||||||||
|
Commercial, financial, and agricultural
|
1,585 | 1,273 | 520 | 486 | 301 | |||||||||||||||
|
Real estate
|
9,618 | 1,824 | 626 | 200 | 288 | |||||||||||||||
|
Installment loans to individuals
|
1,090 | 1,089 | 956 | 839 | 1,254 | |||||||||||||||
|
Lease financing
|
2,475 | 356 | 52 | 254 | 602 | |||||||||||||||
|
Total loans charged off
|
14,768 | 4,542 | 2,154 | 1,779 | 2,445 | |||||||||||||||
|
Recoveries of loans previously charged off:
|
||||||||||||||||||||
|
Commercial, financial, and agricultural
|
130 | 168 | 126 | 262 | 69 | |||||||||||||||
|
Real estate
|
87 | 977 | 241 | 81 | 66 | |||||||||||||||
|
Installment loans to individuals
|
247 | 316 | 319 | 294 | 260 | |||||||||||||||
|
Lease financing
|
72 | 372 | 47 | 41 | 44 | |||||||||||||||
|
Total recoveries
|
536 | 1,833 | 733 | 678 | 439 | |||||||||||||||
|
Net loans charged off
|
14,232 | 2,709 | 1,421 | 1,101 | 2,006 | |||||||||||||||
|
Additions to allowance charged to expense
|
20,768 | 5,321 | 3,638 | 965 | 622 | |||||||||||||||
|
Balance at end of year
|
$ | 23,364 | $ | 16,828 | $ | 14,216 | $ | 11,999 | $ | 11,069 | ||||||||||
|
Average loans net of unearned income
|
$ | 1,306,800 | $ | 1,302,394 | $ | 1,250,423 | $ | 1,051,002 | $ | 805,014 | ||||||||||
|
Ratio of net charge-offs during year to average loans, net of unearned income
|
1.09 | % | .21 | % | .11 | % | .10 | % | .25 | % | ||||||||||
The following table presents an estimate of the allocation of the allowance for loan losses by type for the date indicated. Although specific allocations exist, the entire allowance is available to absorb losses in any particular category.
Allowance For Loan Losses
|
December 31, (In thousands)
|
2009
|
2008
|
2007
|
2006
|
2005
|
|||||||||||||||
|
Commercial, financial, and agricultural
|
$ | 4,782 | $ | 2,474 | $ | 2,505 | $ | 2,223 | $ | 2,840 | ||||||||||
|
Real estate
|
16,937 | 11,217 | 9,201 | 6,497 | 5,849 | |||||||||||||||
|
Installment loans to individuals
|
1,007 | 2,336 | 1,979 | 2,316 | 1,601 | |||||||||||||||
|
Lease financing
|
638 | 801 | 531 | 963 | 779 | |||||||||||||||
|
Total
|
$ | 23,364 | $ | 16,828 | $ | 14,216 | $ | 11,999 | $ | 11,069 | ||||||||||
In addition to the discussion above relating to lending activities, additional information concerning the Company’s asset quality is discussed under the caption “Nonperforming Assets” which follows and “Investment Securities” on page 50.
Nonperforming assets for the Company include nonperforming loans, other real estate owned, and other foreclosed assets. Nonperforming loans consist of nonaccrual loans, restructured loans, and loans past due ninety days or more on which interest is still accruing. Generally, the accrual of interest on loans is discontinued when it is determined that the collection of interest or principal is doubtful, or when a default of interest or principal has existed 90 days or more, unless such loan is well secured and in the process of collection. Restructured loans occur when a lender grants a concession to a financially troubled borrower that it would not otherwise consider. Such concessions may include a reduction of the stated interest rate on a debt, extensions of the maturity date, or a reduction of accrued interest, among others.
Nonperforming assets totaled $108 million at December 31, 2009, an increase of $67.7 million or 169% compared to $40.0 million at year-end 2008. Nonperforming assets have trended upward mainly as a result of ongoing weaknesses in the overall economy that continue to strain the Company and many of its customers, particularly real estate development lending.
Nonaccrual loans were $56.6 million at December 31, 2009, up $35.1 million or 163% compared to $21.5 year-end 2008. There are sixteen nonaccrual credits greater than $1 million with an aggregate outstanding balance of $40.6 million included in the nonaccrual total at year-end 2009, including twelve credits totaling $32.8 million secured by real estate development projects. Interest income reversed from earnings from loans placed on nonaccrual status in 2009 was $1.8 million. The reversal of interest income reduced the yield on earning assets, net interest spread, and net interest margin by 8 basis points in 2009.
49
Restructured loans that are in compliance with their modified terms were $17.9 million at December 31, 2009. This amount is made up primarily of four credits, two with a total outstanding balance of $10.2 million secured by real estate developments and two totaling $6.7 million secured by commercial real estate properties.
Other real estate owned (“OREO”) was $31.2 million at year-end 2009, an increase of $16.8 million or 116%. The increase in OREO is due mainly to the Company taking possession of three larger-balance commercial real estate properties totaling $7.9 million and two larger-balance real estate developments totaling $4.9 million during 2009. Each of these properties previously served as collateral for extensions of credit. Of the larger-balance commercial real estate properties transferred to OREO during 2009, $5.2 million was classified as nonaccrual loans at year-end 2008.
Nonperforming loans were 6.0% of loans net of unearned income at year-end 2009. This represents an increase of 406 basis points compared to 1.9% at year-end 2008 and is attributed to the higher nonaccrual loans and restructured loans as discussed above. Nonperforming loans and nonperforming assets are presented in the table below.
|
2009
|
2008
|
2007
|
2006
|
2005
|
||||||||||||||||
|
Loans accounted for on nonaccrual basis
|
$ | 56,630 | $ | 21,545 | $ | 18,073 | $ | 1,462 | $ | 2,269 | ||||||||||
|
Loans past due 90 days or more and still accruing
|
1,807 | 3,913 | 2,977 | 2,856 | 2,383 | |||||||||||||||
|
Restructured loans
|
17,911 | |||||||||||||||||||
|
Total nonperforming loans
|
76,348 | 25,458 | 21,050 | 4,318 | 4,652 | |||||||||||||||
|
Other real estate owned
|
31,232 | 14,446 | 6,044 | 5,031 | 8,786 | |||||||||||||||
|
Other foreclosed assets
|
38 | 47 | 66 | 54 | 21 | |||||||||||||||
|
Total nonperforming assets
|
$ | 107,618 | $ | 39,951 | $ | 27,160 | $ | 9,403 | $ | 13,459 | ||||||||||
The Company maintains a comprehensive risk-grading and loan review program, which includes a review of loans to assess risk and assign a grade to those loans, review delinquencies, assess loans for needed charge-offs, and placement on non-accrual status. The Company had loans in the amount of $105 million and $76.9 at year-end 2009 and 2008, respectively, which are currently performing but are considered potential problem loans that are not included in the nonperforming loan totals in the table above. These loans, however, are considered in establishing an appropriate allowance for loan losses. The increase in the balance outstanding for potential problem credits is mainly a result of ongoing weaknesses in the overall economy that continue to strain the Company and many of its customers, particularly real estate development lending. Potential problem loans include a variety of borrowers and are secured primarily by real estate, with the single largest relationship totaling $9.8 million. At December 31, 2009 the five largest potential problem credits were $31.4 million in the aggregate and secured by various types of real estate including commercial, construction properties, and residential real estate development.
Potential problem loans are identified on the Company’s watch list and consist of loans that require close monitoring by management and are not necessarily considered classified credits by regulators. Credits may be considered as a potential problem loan for reasons that are temporary or correctable, such as for a deficiency in loan documentation or absence of current financial statements of the borrower. Potential problem loans may also include credits where adverse circumstances are identified that may affect the borrower’s ability to comply with the contractual terms of the loan. Other factors which might indicate the existence of a potential problem loan include the delinquency of a scheduled loan payment, deterioration in a borrower’s financial condition identified in a review of periodic financial statements, a decrease in the value of the collateral securing the loan, or a change in the economic environment in which the borrower operates.
The Company incorporates its potential problem loans into the calculation of its allowance for loan losses using a risk-rated methodology. Certain loans on the Company’s watch list are also considered impaired and specific allowances related to these loans were established in accordance with the appropriate accounting guidance.
Temporary Investments
Temporary investments consist of interest bearing deposits in other banks and federal funds sold and securities purchased under agreements to resell. The Company uses these funds in the management of liquidity and interest rate sensitivity. At December 31, 2009, temporary investments were $182 million, an increase of $79.4 million or 77.0% compared to $103 million at year-end 2008. Temporary investments averaged $129 million during 2009, an increase of $63.6 million or 97.2% from 2008. The increase is a result of the Company’s overall net funding position, which reflects a more conservative lending approach as the Company works through its high level of nonperforming assets in a difficult economy. Temporary investments are reallocated to loans or other investments as market conditions and Company resources warrant.
The investment securities portfolio is comprised primarily of debt securities issued by U.S. government-sponsored agencies, mortgage-backed securities, and tax-exempt securities of states and political subdivisions. Substantially all of the Company’s investment securities
50
are designated as available for sale. Total investment securities were $558 million on December 31, 2009, an increase of $21.9 million or 4.1% compared to $536 million at year-end 2008. Net amortized cost amounts increased $19.5 million or 3.7%. Net unrealized gains related to investments in the available for sale portfolio increased $2.4 million or 31.6%.
The increase in amortized cost amounts of investment securities is attributed to net purchase activity during 2009. The $2.4 million overall increase in net unrealized gains for available for sale investment securities is attributed mainly to a $3.7 million increase in the market value of the Company’s corporate debt securities. Net unrealized losses on corporate debt securities were $1.6 million at year-end 2009 compared to a net unrealized loss of $5.3 million at year-end 2008. Corporate debt securities consist primarily of single-issuer trust preferred capital securities issued by national and global financial services firms. Each of these securities are currently performing and the issuers of these securities are rated as investment grade by major rating agencies, even though down grades have occurred with respect to certain securities within this group of holdings during the first half of 2009. The unrealized loss on corporate debt securities is primarily attributed to the general decline in financial markets and temporary illiquidity and not due to adverse changes in the expected cash flows of the individual securities. Overall market declines, particularly of banking and financial institutions, are a result of significant stress throughout the regional and national economy that occurred during 2008, that, while improving, has not fully stabilized. The gradual improvement in many overall economic measures has resulted in higher market values of these securities for 2009.
Market values of the remaining available for sale investment securities decreased $1.3 million and is attributed to the timing and change in market interest rates. Overall market interest rates increased incrementally during 2009 as reflected in the yield curves, particularly that of longer-term maturity structures. Market values of fixed rate investments are inversely related to changes in market interest rates. Unrealized losses on the Company’s investment securities portfolio at year-end have not been included in income since they are identified as temporary. The fair values of these securities are expected to recover as they approach their maturity dates. The Company does not have the intent to sell these securities and it is likely that it will not be required to sell these securities before their anticipated recovery. The Company does not consider any of the securities to be impaired due to reasons of credit quality or other factors.
Funds made available from sold, maturing or called bonds are redirected to fund higher yielding loan growth, reinvested to purchase additional investment securities, or otherwise employed to improve the composition of the balance sheet. The purchase of nontaxable obligations of states and political subdivisions is one of the primary means of managing the Company’s tax position. The impact of the alternative minimum tax related to the Company’s ability to acquire tax-free obligations at an attractive yield is routinely monitored. The Company does not have direct exposure to the subprime mortgage market. The Company does not originate subprime mortgages nor has it invested in bonds that are secured by such mortgages.
The following table summarizes the carrying values of investment securities on December 31, 2009, 2008, and 2007. The investment securities are divided into available for sale and held to maturity securities. Available for sale securities are carried at the estimated fair value and held to maturity securities are carried at amortized cost. Substantially all of the corporate debt securities comprise of debt issued by large global and national financial services firms.
|
December 31,
|
2009
|
2008
|
2007
|
|||||||||||||||||||||
|
(In thousands)
|
Available
for Sale
|
Held to
Maturity
|
Available
for Sale
|
Held to
Maturity
|
Available
for Sale
|
Held to
Maturity
|
||||||||||||||||||
|
Obligations of states and political subdivisions
|
$ | 108,958 | $ | 975 | $ | 90,838 | $ | 1,814 | $ | 94,181 | $ | 3,844 | ||||||||||||
|
Obligations of U.S. government-sponsored entities
|
90,752 | 34,567 | 88,522 | |||||||||||||||||||||
|
Mortgage-backed securities
|
325,519 | 375,327 | 343,176 | |||||||||||||||||||||
|
U.S. Treasury securities
|
3,002 | 10,256 | 863 | |||||||||||||||||||||
|
Money market mutual funds
|
910 | 374 | 1,396 | |||||||||||||||||||||
|
Corporate debt securities
|
18,732 | 13,991 | 5,132 | |||||||||||||||||||||
|
Equity securities
|
9,148 | 8,942 | 9,363 | |||||||||||||||||||||
|
Total
|
$ | 557,021 | $ | 975 | $ | 534,295 | $ | 1,814 | $ | 542,633 | $ | 3,844 | ||||||||||||
The following table presents an analysis of the contractual maturity and tax equivalent weighted average interest rates of investment securities at December 31, 2009. For purposes of this analysis, available for sale securities are stated at fair value and held to maturity securities are stated at amortized cost. Equity securities in the available for sale portfolio consist primarily of restricted FHLB and Federal Reserve Board stocks, which have no stated maturity and are not included in the maturity schedule that follows.
51
Available for Sale
|
After One But
|
After Five But
|
|||||||||||||||||||||||||||||||
|
Within One Year
|
Within Five Years
|
Within Ten Years
|
After Ten Years
|
|||||||||||||||||||||||||||||
|
(In thousands)
|
Amount
|
Rate
|
Amount
|
Rate
|
Amount
|
Rate
|
Amount
|
Rate
|
||||||||||||||||||||||||
|
Obligations of U.S. government-sponsored entities
|
$ | 13,749 | .7 | % | $ | 30,680 | 1.5 | % | $ | 21,122 | 3.9 | % | $ | 25,201 | 4.4 | % | ||||||||||||||||
|
Obligations of states and political subdivisions
|
7,799 | 2.8 | 41,220 | 2.8 | 34,889 | 3.7 | 25,050 | 3.7 | ||||||||||||||||||||||||
|
Mortgage-backed securities
|
167 | 4.1 | 9,414 | 3.8 | 11,105 | 4.2 | 304,833 | 4.9 | ||||||||||||||||||||||||
|
U.S. Treasury securities
|
1,999 | .5 | 1,003 | .9 | ||||||||||||||||||||||||||||
|
Money market mutual funds
|
910 | .3 | ||||||||||||||||||||||||||||||
|
Corporate debt securities
|
1,125 | 7.0 | 1,296 | 5.6 | 16,311 | 6.1 | ||||||||||||||||||||||||||
|
Total
|
$ | 25,749 | 1.6 | % | $ | 83,613 | 2.5 | % | $ | 67,116 | 3.8 | % | $ | 371,395 | 4.8 | % | ||||||||||||||||
Held to Maturity
|
After One But
|
After Five But
|
|||||||||||||
|
Within One Year
|
Within Five Years
|
Within Ten Years
|
After Ten Years
|
|||||||||||
|
(In thousands)
|
Amount
|
Rate
|
Amount
|
Rate
|
Amount
|
Rate
|
Amount
|
Rate
|
||||||
|
Obligations of states and political subdivisions
|
$ | 975 | 3.6 | % | ||||||||||
The calculation of the weighted average interest rates for each category is based on the weighted average costs of the securities. The weighted average tax rates on exempt states and political subdivisions are computed based on the marginal corporate Federal tax rate of 35%.
Deposits
The Company’s primary source of funding for its lending and investment activities results from its customer deposits, which consist of noninterest and interest bearing demand, savings, and time deposits. On December 31, 2009 total deposits were $1.6 billion, an increase of $39.3 million or 2.5% from year-end 2008. Interest bearing deposits were up $66.3 million or 4.9% to $1.4 billion and noninterest bearing deposits decreased $27.0 million or 11.2% to $215 million. The increase in interest bearing deposits was driven mainly by a $54.5 million or 6.4% increase in time deposits. The decrease in end of period noninterest bearing deposits was driven by lower balances from the Commonwealth of $52.2 million, which offset a $25.2 million net increase in other noninterest bearing deposit account balances. Balances related to the Commonwealth can fluctuate significantly on a daily basis.
Average total deposits were $1.6 billion for 2009, an increase of $106 million or 7.0% compared to average year-end 2008 balances. Average time deposits increased $109 million or 13.7% which offset an $8.9 million or 3.5% decrease in average interest bearing demand account balances and a $5.6 million or 2.2% decrease in average savings account balances. Average noninterest bearing deposit balances were $227 million for 2009, up $12.3 million or 5.7%.
The Company has experienced an increase in time deposits that it perceives to be mainly a result of customers that have moved money out of a volatile stock market and into more stable investments such as certificate of deposits. The Company also believes that increased deposit insurance coverage generally up to $250 thousand has had a net positive impact on outstanding balances.
A summary of average balances and rates paid on deposits follows.
|
Years Ended December 31,
|
2009
|
2008
|
2007
|
|||||||||||||||||||||
|
(In thousands)
|
Average
Balance
|
Average
Rate
|
Average
Balance
|
Average
Rate
|
Average
Balance
|
Average
Rate
|
||||||||||||||||||
|
Noninterest bearing demand
|
$ | 226,648 | $ | 214,372 | $ | 214,423 | ||||||||||||||||||
|
Interest bearing demand
|
247,235 | .29 | % | 256,129 | .70 | % | 258,992 | 1.42 | % | |||||||||||||||
|
Savings
|
256,063 | .77 | 261,692 | 1.34 | 244,299 | 2.17 | ||||||||||||||||||
|
Time
|
902,066 | 3.38 | 793,561 | 4.25 | 748,939 | 4.83 | ||||||||||||||||||
|
Total
|
$ | 1,632,012 | 2.03 | % | $ | 1,525,754 | 2.56 | % | $ | 1,466,653 | 3.08 | % | ||||||||||||
52
Maturities of time deposits of $100,000 or more outstanding at December 31, 2009 are summarized as follows.
|
(In thousands)
|
Amount
|
|||
|
3 months or less
|
$ | 61,261 | ||
|
Over 3 through 6 months
|
65,950 | |||
|
Over 6 through 12 months
|
120,185 | |||
|
Over 12 months
|
79,436 | |||
|
Total
|
$ | 326,832 | ||
Short-term Borrowings
Short-term borrowings are primarily made up of federal funds purchased and securities sold under agreements to repurchase with year-end balances of $46.9 million, $73.2 million, and $80.3 million for 2009, 2008, and 2007, respectively. Such borrowings are generally on an overnight basis. Other short-term borrowings consist of FHLB borrowings totaling $0, $3.5 million, and $0, at year-end 2009, 2008, and 2007, respectively, and demand notes issued to the U.S. Treasury under the treasury tax and loan note option account totaling $274 thousand, $787 thousand, and $440 thousand in 2009, 2008, and 2007 respectively. A summary of short-term borrowings is as follows.
|
(In thousands)
|
2009
|
2008
|
2007
|
|||||||||
|
Amount outstanding at year-end
|
$ | 47,215 | $ | 77,474 | $ | 80,755 | ||||||
|
Maximum outstanding at any month-end
|
105,844 | 125,096 | 155,362 | |||||||||
|
Average outstanding
|
62,946 | 81,180 | 97,192 | |||||||||
|
Weighted average rate at year-end
|
.79 | % | .74 | % | 3.71 | % | ||||||
|
Weighted average rate during the year
|
.72 | 2.20 | 4.63 | |||||||||
The Company’s long-term borrowings consist mainly of securities sold under agreements to repurchase, FHLB advances, and subordinated notes payable to unconsolidated trusts. Securities sold under agreements to repurchase represent long-term obligations whereby the Company borrowed approximately $200 million in multiple fixed rate repurchase agreements with an initial weighted average cost of 3.95%. The borrowings mature in various amounts and time periods as follows: $50.0 million in November 2010, $50.0 million in November 2012, and $100 million in November 2017. The borrowings have a weighted average remaining maturity of 4.9 years. At December 31, 2009 $150 million of the borrowings are putable quarterly and the remaining $50.0 million is putable quarterly beginning in the fourth quarter of 2012. The Company used the proceeds from the borrowing to purchase a like amount of fixed rate GNMA bonds. The GNMA bonds have a current weighted average yield of 5.49% and an estimated weighted average remaining life of 3.6 years.
FHLB advances to the Company’s subsidiary banks are secured by restricted holdings of FHLB stock that banks are required to own as well as certain mortgage loans as required by the FHLB. Such advances are made pursuant to several different credit programs, which have their own interest rates and range of maturities. Interest rates on FHLB advances are generally fixed and range between 2.60% and 6.90%, with a weighted average rate of 3.98%, and remaining maturities of up to 11 years. Long-term fixed rate advances from the FHLB totaling $10.0 million are convertible to a floating interest rate. These advances may convert to a floating interest rate indexed to three-month LIBOR only if LIBOR equals or exceeds 7%. At year-end 2009, the three-month LIBOR was .25%. FHLB advances are generally used to increase the Company’s lending activities and to aid the efforts of asset and liability management by utilizing various repayment options offered by the FHLB. Long-term advances from the FHLB totaled $67.6 million at December 31, 2009, a decrease of $18.5 million or 21.5% from year-end 2008.
The Company has previously completed three private offerings of trust preferred securities through three separate Delaware statutory trusts (the “Trusts”) sponsored by the Company in the aggregate amount of $47.5 million. The combined $25.0 million proceeds from the first two trusts (“Trusts I and II”) established in 2005 were used to fund the acquisition of Citizens Bancorp. Proceeds from the third trust (“Trust III”) were used primarily to acquire Company shares through a tender offer during 2007. The Company owns all of the common securities of each of the three Trusts.
The Trusts used the proceeds from the sale of preferred securities, plus capital of $1.5 million contributed by the Company to establish the trusts, to purchase the Company’s subordinated notes in amounts and bearing terms that parallel the amounts and terms of the respective preferred securities. The subordinated notes of Trusts I and II mature in 2035 and bear a floating interest rate at current three-month LIBOR plus 150 basis points on a $10.3 million portion of the total and at current three-month LIBOR plus 165 basis points on a $15.5 million portion. The subordinated notes of Trust III in the amount of $23.2 million mature in 2037 and bear a fixed interest rate through 2012 of 6.60% and then convert to floating thereafter at three-month LIBOR plus 132 basis points. Interest on each of the notes is payable quarterly.
53
The subordinated notes of Trusts I and II are redeemable in whole or in part, without penalty, at the Company’s option on or after September 30, 2010. The subordinated notes of Trust III are redeemable in whole or in part, without penalty, at the Company’s option on or after November 1, 2012. The subordinated notes are junior in right of payment of all present and future senior indebtedness of the Company. At December 31, 2009, the aggregate balance of the subordinated notes payable to the Trusts was $49.0 million. The weighted average interest rate in effect as of the last determination date in 2009 was 4.11%, a decrease of 183 basis points compared to 5.94% for 2008.
Contractual Obligations
The Company is contractually obligated to make payments as follows.
|
Payments Due by Period
|
||||||||||||||||||||
|
Contractual Obligations (In thousands)
|
Total
|
Less Than
One Year
|
One to Three
Years
|
Three to Five
Years
|
More Than Five
Years
|
|||||||||||||||
|
Time deposits
|
$ | 904,978 | $ | 667,915 | $ | 192,844 | $ | 37,152 | $ | 7,067 | ||||||||||
|
Long-term FHLB debt
|
67,630 | 14,000 | 23,814 | 10,083 | 19,733 | |||||||||||||||
|
Subordinated notes payable
|
48,970 | 48,970 | ||||||||||||||||||
|
Long-term securities sold under agreements to repurchase
|
200,000 | 50,000 | 50,000 | 100,000 | ||||||||||||||||
|
Unfunded postretirement benefit obligations
|
5,928 | 442 | 979 | 1,137 | 3,370 | |||||||||||||||
|
Operating leases
|
6,034 | 639 | 1,053 | 881 | 3,461 | |||||||||||||||
|
Capital lease obligations
|
332 | 248 | 84 | |||||||||||||||||
|
Total
|
$ | 1,233,872 | $ | 733,244 | $ | 268,774 | $ | 49,253 | $ | 182,601 | ||||||||||
Long-term FHLB debt represents FHLB advances pursuant to several different credit programs. Long-term FHLB debt, subordinated notes payable, and securities sold under agreements to repurchase are more fully described under the caption “Long-Term Borrowings” above and in Note 8 of the Company’s 2009 audited consolidated financial statements. Payments for borrowings in the table above do not include interest. Postretirement benefit obligations are actuarially determined and estimated based on various assumptions with payouts projected over the next 10 years. Estimates can vary significantly each year due to changes in significant assumptions. Capital lease obligations represent amounts relating to the acquisition of data processing hardware and software used in the Company’s operations. Operating leases include standard business equipment used in the Company’s day-to-day business as well as the lease of certain branch sites. Operating lease terms generally range from one to five years, with the ability to extend certain branch site leases at the Company’s option. Payments related to leases are based on actual payments specified in the underlying contracts.
Guarantees
During 2007, the Parent Company entered into a guarantee agreement whereby it agreed to become unconditionally and irrevocably the guarantor of the obligations of its bank subsidiaries in connection with the $200 million balance sheet leverage transaction. The amount of borrowings outstanding guaranteed by the Parent Company at December 31, 2009 was $200 million, with various maturity dates ranging from two to eight years. The $200 million outstanding borrowings are secured by GNMA bonds held by the Parent Company’s subsidiary banks valued at 106% of the outstanding borrowings or $212 million. Should any of the subsidiary banks default on its borrowings under the agreement, the GNMA bonds securing the borrowings would be liquidated to satisfy amounts due. If the value of the GNMA bonds fall below the obligation under the contract, the Parent Company is obligated to cover any such shortfall in absence of the subsidiary banks ability to do so. The Parent Company believes its subsidiary banks are fully capable of fulfilling their obligations under the borrowing arrangement and that the Parent Company will not be required to make any payments under the guarantee agreement.
Effects of Inflation
The majority of the Company’s assets and liabilities are monetary in nature. Therefore, the Company differs greatly from most commercial and industrial companies that have significant investments in nonmonetary assets, such as fixed assets and inventories. However, inflation does have an important impact on the growth of assets in the banking industry and on the resulting need to increase equity capital at higher than normal rates in order to maintain an appropriate equity to assets ratio. Inflation also affects other noninterest expense, which tends to rise during periods of general inflation.
Market risk is the risk of loss arising from adverse changes in market prices and rates. The Company’s market risk is comprised primarily of interest rate risk created by its core banking activities of extending loans and receiving deposits. The Company’s success is largely dependent upon its ability to manage this risk. Interest rate risk is defined as the exposure of the Company’s net interest income to adverse movements in interest rates. Although the Company manages other risks, such as credit and liquidity risk, management considers interest rate risk to be its most significant risk, which could potentially have the largest and a material effect on the Company’s financial condition and results of operations. A sudden and substantial change in interest rates may adversely impact the Company’s earnings to the extent that the interest rates earned on assets and paid on liabilities do not change at the same speed, to the same extent, or on the same basis.
54
Other events that could have an adverse impact on the Company’s performance include changes in general economic and financial conditions, general movements in market interest rates, and changes in consumer preferences. The Company’s primary purpose in managing interest rate risk is to effectively invest the Company’s capital and to manage and preserve the value created by its core banking business.
Management believes the most significant impact on financial and operating results is the Company’s ability to react to changes in interest rates. Management seeks to maintain an essentially balanced position between interest sensitive assets and liabilities in order to protect against the effects of wide interest rate fluctuations.
The Company has a Corporate Asset and Liability Management Committee (“ALCO”). ALCO monitors the composition of the balance sheet to ensure comprehensive management of interest rate risk and liquidity. ALCO also provides guidance and support to each ALCO of the Company’s subsidiary banks and is responsible for monitoring risks on a company-wide basis. ALCO has established minimum standards in its asset and liability management policy that each subsidiary bank must adopt. However, the subsidiary banks are permitted to deviate from these standards so long as the deviation is no less stringent than that of the Corporate policy.
The Company uses a simulation model as a tool to monitor and evaluate interest rate risk exposure. The model is designed to measure the sensitivity of net interest income and net income to changing interest rates during the next twelve months. Forecasting net interest income and its sensitivity to changes in interest rates requires the Company to make assumptions about the volume and characteristics of many attributes, including assumptions relating to the replacement of maturing earning assets and liabilities. Other assumptions include, but are not limited to, projected prepayments, projected new volume, and the predicted relationship between changes in market interest rates and changes in customer account balances. These effects are combined with the Company’s estimate of the most likely rate environment to produce a forecast for the next twelve months. The forecasted results are then compared to the effect of a gradual 200 basis point increase and decrease in market interest rates on the Company’s net interest income and net income. Because assumptions are inherently uncertain, the model cannot precisely estimate net interest income or net income or the effect of interest rate changes on net interest income and net income. Actual results could differ significantly from simulated results.
At December 31, 2009, the model indicated that if rates were to gradually increase by 200 basis points over the next twelve months, then net interest income (TE) and net income would increase 1.5% and 6.7%, respectively, compared to forecasted results. The model indicated that if rates were to gradually decrease by 200 basis points over the next twelve months, then net interest income (TE) and net income would decrease 2.7% and 12.5%, respectively, compared to forecasted results.
In the current relatively low interest rate environment, it is not practical or possible to reduce certain deposit rates by the same magnitude as rates on earning assets. The average rate paid on many of the Company’s deposits is below 2%. This situation magnifies the model’s predicted results when modeling a decrease in interest rates, as earning assets with higher yields have more of an opportunity to reprice at lower rates than lower-rate deposits.
LIQUIDITY
Liquidity measures the ability to meet current and future cash flow needs as they become due. For financial institutions, liquidity reflects the ability to meet loan demand, to accommodate possible outflows in deposits, and to react and capitalize on interest rate market opportunities. A financial institution’s ability to meet its current financial obligations is dependent upon the structure of its balance sheet, its ability to liquidate assets, and its access to alternative sources of funds. The Company’s goal is to meet its near-term funding needs by maintaining a level of liquid funds through its asset/liability management. For the longer term, the liquidity position is managed by balancing the maturity structure of the balance sheet. This process allows for an orderly flow of funds over an extended period of time. The Company’s ALCOs, both at the bank subsidiary level and on a consolidated basis, meet regularly and monitors the composition of the balance sheet to ensure comprehensive management of interest rate risk and liquidity.
The Company's objective as it relates to liquidity is to ensure that its subsidiary banks have funds available to meet deposit withdrawals and credit demands without unduly penalizing profitability. In order to maintain a proper level of liquidity, the subsidiary banks have several sources of funds available on a daily basis that can be used for liquidity purposes. Those sources of funds include the subsidiary banks' core deposits, consisting of both business and nonbusiness deposits; cash flow generated by repayment of principal and interest on loans and investment securities; FHLB and other borrowings; and federal funds purchased and securities sold under agreements to repurchase. While maturities and scheduled amortization of loans and investment securities are generally a predictable source of funds, deposit outflows and mortgage prepayments are influenced significantly by general interest rates, economic conditions, and competition in our local markets. As of December 31, 2009, the Company had $141 million in additional borrowing capacity under various FHLB, federal funds, and other borrowing agreements. However, there is no guarantee that these sources of funds will continue to be available to the Company, or that current borrowings can be refinanced upon maturity, although the Company is not aware of any events or uncertainties that are likely to cause a decrease in the Company’s liquidity from these sources. The Parent Company previously had a one-year $15.0 million unsecured line of credit with an unrelated financial institution available for general corporate purposes. This line of credit had no outstanding balance when it matured in June 2009.
55
The Company uses a liquidity ratio to help measure its ability to meet its cash flow needs. This ratio is monitored by ALCO at both the bank level and on a consolidated basis. The liquidity ratio is based on current and projected levels of sources and uses of funds. This measure is useful in analyzing cash needs and formulating strategies to achieve desired results. For example, a low liquidity ratio could indicate that the Company’s ability to fund loans might become more difficult. A high liquidity ratio could indicate that the Company may have a disproportionate amount of funds in low yielding assets, which is more likely to occur during periods of sluggish loan demand or economic difficulties. The Company’s liquidity position was higher at year-end 2009 compared to year-end 2008 and remains within ALCO guidelines and considered by management to be at an adequate level. The increase in the Company’s liquidity measure at year-end 2009 is attributed mainly to higher overall short-term investments, which have risen while the Company has taken a measured and cautious lending strategy in an economic environment that remains challenging. The increase in liquidity is also a by-product of the regulatory agreements that were entered into during 2009 by certain bank subsidiaries of the Company.
At the Parent Company level, liquidity is primarily affected by the receipt of dividends from its subsidiary banks (see Note 17 “Regulatory Matters” of the Company’s 2009 audited consolidated financial statements), cash balances maintained, and borrowings from nonaffiliated sources. The Parent Company’s primary uses of cash include the payment of dividends to its common and preferred shareholders, repurchasing its common stock from time to time, business acquisitions, interest expense on borrowings, and paying for general operating expenses. Due to recent regulatory agreements, dividend payments on the Parent Company’s common and preferred stock and interest payments on its trust preferred borrowings must have regulatory approval before being paid. During the fourth quarter of 2009, the Parent Company declared a dividend on its common stock of $.10 per share, a decrease from $.25 per share in an effort to preserve capital. The Company further cut the dividend on its common stock when it announced in the first quarter of 2010 that it would forgo a dividend declaration. The Parent Company was granted permission by its regulators to declare and pay its preferred stock dividend and make interest payments on its trust preferred borrowings through the first quarter of 2010 (the last time such approval was requested by the Company). Please refer to Note 17 “Regulatory Matters” of the Company’s 2009 audited consolidated financial statements, Item 1A “Risk Factors” of this Form 10-K, and the heading “Capital Resources” below for additional information on the Company’s restrictions and requirements related to the payment of interest and dividends.
The primary source of funds for the Parent Company is the receipt of dividends from its subsidiary banks, cash balances maintained, investments in company-owned life insurance, and borrowings from nonaffiliated sources. Payment of dividends by the Company’s subsidiary banks is subject to certain regulatory restrictions as set forth in national and state banking laws and regulations. At December 31, 2009 each of the Company’s bank subsidiaries were required to obtain regulatory approval before declaring or paying a dividend to the Parent Company. Two of the Company’s subsidiary banks need regulatory approval due to statutory restrictions on the amount of distributions that can be made relative to undistributed net income over a period that includes the current year to date period and the previous two calendar years. The Company expects to receive dividends in 2010 from either or both of these subsidiary banks. The Company’s remaining three subsidiary banks need regulatory approval to declare or pay dividends as a result of increased capital required in connection with recent regulatory exams. Capital ratios at each of the Company’s five subsidiary banks exceed regulatory established “well-capitalized” status at year-end 2009. Additional information concerning recent regulatory exams and regulatory capital requirements can be found in Note 17 “Regulatory Matters” of the Company’s 2009 audited consolidated financial statements, Item 1A “Risk Factors” of this Form 10-K, and under the heading “Capital Resources” below.
The Parent Company had company-owned life insurance investments totaling $10.7 million at year-end 2009. During the first quarter of 2010, the Parent Company initiated the process to surrender these policies as part of its overall strategy to improve the capital position of certain bank subsidiaries. Surrendering these policies for cash will create an associated tax obligation of approximately $1.1 million.
The Parent Company had cash balances of $7.6 million at year-end 2009, an increase of $3.3 million or 75.6% from $4.3 million at the prior year-end. Significant cash receipts of the Parent Company during 2009 include $30.0 million proceeds from issuing preferred stock, $7.5 million dividends received from subsidiaries, and management fees from subsidiaries of $3.1 million. Significant cash payments by the Parent Company during 2009 include $22.6 million additional capital investments in subsidiaries, $9.2 million for the payment of common and preferred dividends, salaries, payroll taxes, and employee benefits of $2.6 million, and interest expense on borrowed funds of $2.2 million.
Liquid assets consist of cash, cash equivalents, and available for sale investment securities. At December 31, 2009, consolidated liquid assets were $775 million, an increase of $50.3 million or 6.9% from year-end 2008. The increase in liquid assets is mainly attributed to $27.6 million higher net cash and equivalents and an increase in available for sale investment securities of $22.7 million. The increase in cash and equivalents is due mainly to an overall increase in deposits, lower loan balances outstanding, and the overall funding position of the Company, which changes as loan demand, deposit levels, and other sources and uses of funds fluctuate. The increase in available for sale investments securities is a result of net purchases during 2009 and a decrease in funding for loans. The Company is taking a measured and caution approach to lending at it continues to work through a high level of nonperforming assets caused mainly by the effects of a lingering economic downturn.
56
Net cash provided by operating activities was $25.0 million for 2009, an increase of $4.4 million or 21.1% compared to $20.7 million for 2008. Net cash used in investing activities was $8.8 million for 2009 compared to $34.7 million a year earlier. The $25.9 million lower net cash outflow in 2009 is mainly due to loan activity and investment securities transactions. Net cash repayments received on loans were $5.9 million for 2009; in 2008, net cash outflows associated with loans were $36.4 million. For securities transactions, net cash used was $16.9 million for 2009 compared to net cash provided of $3.6 million in 2008. Net cash provided by financing activities was $11.3 million in 2009, a decrease of $114 million or 91.0% compared to $126 million for 2008. The decrease in net cash provided by financing activities is attributed to an $80.7 million lower net deposit inflows, $65.1 million lower net borrowings, partially offset by the proceeds from the issuance of preferred stock of $30.0 million. Lower net deposit inflows in 2009 were impacted by a decrease in noninterest bearing deposits from the Commonwealth of Kentucky of $52.2 million.
In December 2009, four of the Company’s subsidiary banks paid an aggregate $8.2 million related to the FDIC’s Deposit Insurance Fund restoration plan that required them to pay three years of insurance premiums in advance. The payment included an estimated quarterly risk-based assessment for the fourth quarter of 2009 and for all of 2010, 2011, and 2012. United Bank requested and was granted a waiver and was not required to make prepayment under the plan. Earnings were not immediately impacted when payment was made since the cash payment was accounted for as a prepayment and recorded as an asset. Rather, earnings will be impacted over a three-year period as the Company records an expense for its regular quarterly assessment with an offsetting credit to the prepaid asset until the asset is exhausted.
Information relating to off-balance sheet arrangements is disclosed in Note 14 of the Company’s 2009 audited consolidated financial statements. These transactions are entered into in the ordinary course of providing traditional banking services and are considered in managing the Company’s liquidity position. The Company does not expect these commitments to significantly affect the liquidity position in future periods. The Company has not entered into any contracts for financial derivative instruments such as futures, swaps, options, or similar instruments.
Company
Shareholders’ equity was $147 million at December 31, 2009, a decrease of $21.1 million or 12.5% compared to December 31, 2008. Retained earnings decreased $52.8 million during 2009 and was driven by the one-time, non-cash $52.4 million (pre-tax) goodwill impairment charge in the fourth quarter and the higher provision for loan losses for the year. The decrease in retained earnings was partially offset by the issuance of $30 million of preferred stock to the Treasury under its Capital Purchase Program (“CPP”) in the first quarter. The preferred stock capital raise, which also included the issuance of common stock warrants by the Company, was recorded at an initial discount of $2.0 million. Dividends paid in 2009, including accretion of discount related to the preferred stock, was $9.2 million. Accumulated other comprehensive income increased $1.1 million driven by a net increase in the unrealized gain on available for sale investment securities.
On October 9, 2009 the Company filed a registration statement on Form S-3 with the SEC that became effective on October 19, 2009. As part of that filing, equity securities of the Company of up to a maximum aggregate offering price of $70 million could be offered for sale in one or more public or private offerings at an appropriate time. The Company continues to explore potential capital raising scenarios. However, no determination as to if or when a capital raise will be completed has been made. Net proceeds from a potential sale of securities under the registration statement could be used for any corporate purpose determined by the Company’s board of directors.
At December 31, 2009 the Company’s tangible capital ratio was 6.56% compared to 5.08% at year-end 2008. The increase in the tangible capital ratio was boosted by the Company’s participation in the CPP in early 2009 as discussed above. The tangible capital ratio is defined as tangible equity as a percentage of tangible assets. This ratio excludes amounts related to goodwill and other intangible assets. Tangible common equity to tangible assets, which further excludes outstanding preferred stock, was 5.25% at December 31, 2009 compared to 5.08% at year-end 2008.
Consistent with the objective of operating a sound financial organization, the Company’s goal is to maintain capital ratios well above the regulatory minimum requirements. The Company's capital ratios as of December 31, 2009 and the regulatory minimums are as follows.
|
Farmers Capital
Bank Corporation
|
Regulatory
Minimum
|
|
|
Tier 1 risk-based
|
13.95%
|
4.00%
|
|
Total risk-based
|
15.20
|
8.00
|
|
Leverage
|
8.15
|
4.00
|
In the summer of 2009 the Federal Reserve Bank of St. Louis (“FRB St. Louis”) conducted an examination of the Parent Company. Primarily due to the regulatory actions and capital requirements at three of the Company’s subsidiary banks (as discussed below), the FRB
57
St. Louis and Kentucky Department of Financial Institutions (“KDFI”) proposed the Company enter into a Memorandum of Understanding. The Company’s board approved entry into the Memorandum of Understanding at a regular board meeting on October 26, 2009. Pursuant to the Memorandum of Understanding, the Company agreed that it would develop an acceptable capital plan to ensure that the consolidated organization remains well-capitalized and each of its subsidiary banks meet the capital requirements imposed by their regulator as described below. The Company also agreed to reduce its next quarterly common stock dividend from $.25 per share down to $.10 per share and not make interest payments on the Company’s trust preferred securities or dividends on its common or preferred stock without prior approval from FRB St. Louis. The Company received approval for both its regularly scheduled trust preferred payments and dividends on its Series A preferred stock through the end of 2009, as well as its $.10 per share dividend on its common stock that was declared on October 26, 2009. Representatives of FRB St. Louis have indicated to the Company that as long as the Company’s subsidiaries show adequate normalized earnings to support the quarterly payments on its trust preferred securities and quarterly dividends on its Series A preferred stock and common stock, they will provide the required prior approval. The Company also received approval for its regularly scheduled trust preferred interest payment through the first quarter of 2010 and dividends on its Series A preferred stock that was paid on February 16, 2010 (the last time such approval was requested by the Company). The Company determined to forego the dividend that has historically been declared on its common stock in the first quarter of 2010 in an effort to conserve capital.
The table below is an analysis of dividend payout ratios and equity to asset ratios for the previous five years.
|
Years Ended December 31,
|
2009
|
2008
|
2007
|
2006
|
2005
|
||||||||||||||||
|
Percentage of common dividends declared to (loss) income from continuing operations
|
NM
|
220.96 | % | 64.52 | % | 78.89 | % | 61.67 | % | ||||||||||||
|
Percentage of average shareholders’ equity to average total assets1
|
8.72 | % | 7.86 | 9.33 | 10.04 | 10.19 | |||||||||||||||
1Excludes assets of discontinued operations in 2006 and 2005.
NM-Not meaningful.
Bank Subsidiaries
The Company’s subsidiary banks are subject to capital-based regulatory requirements which place banks in one of five categories based upon their capital levels and other supervisory criteria. These five categories are: (1) well-capitalized, (2) adequately capitalized, (3) undercapitalized, (4) significantly undercapitalized, and (5) critically undercapitalized. To be well-capitalized, a bank must have a Tier 1 leverage capital ratio (“Leverage Ratio”) of at least 5% and a total risk-based capital ratio (“Risk-Based Ratio”) of at least 10%.1 As of December 31, 2009, the Company’s five subsidiary banks had the following capital ratios for regulatory purposes:
|
Tier 1 Leverage Capital Ratio
|
Total Risk-Based Capital Ratio
|
|||||||
|
Farmers Bank
|
7.68 | % | 15.66 | % | ||||
|
United Bank
|
7.35 | % | 13.75 | % | ||||
|
Lawrenceburg Bank
|
5.46 | % | 11.50 | % | ||||
|
First Citizens Bank
|
7.96 | % | 12.76 | % | ||||
|
Citizens Northern
|
6.23 | % | 10.95 | % | ||||
While each of the Company’s subsidiary banks was well-capitalized as of December 31, 2009, some of their capital levels have decreased over the past eighteen months as a result of the economic downturn that began in 2008. As a result of the turmoil in the banking markets and continued difficulty many banks are experiencing with their loan portfolios, bank regulatory agencies are increasingly requiring banks to maintain higher capital reserves as a cushion for dealing with any further deterioration in their loan portfolios. The agencies that regulate the Company’s banks have determined, in the wake of examinations, that the three Company subsidiaries identified below may require future capital infusions in order to satisfy higher regulatory capital ratios.
Farmers Bank. Farmers Bank was the subject of a regularly scheduled examination by the KDFI which was conducted in mid-September 2009. As a result of this examination, the KDFI and FRB St. Louis have entered into a Memorandum of Understanding with Farmers Bank. The Memorandum of Understanding, among other things, requires that Farmers Bank obtain written consent prior to declaring or paying the Parent Company a cash dividend and to achieve and maintain increasing Leverage Ratios of 7.5%, 7.75%, and 8.0% by
|
1
|
The Leverage Ratio is computed by dividing a bank’s Total Capital, as defined by regulation, by its total average assets.
|
|
The Risk-Based Ratio is computed by dividing a bank’s Total Capital, as defined by regulation, by a risk-weighted sum of the bank's assets, with the risk weighting determined by general standards established by regulation. The safest assets (e.g., government obligations) are assigned a weighting of 0% with riskier assets receiving higher ratings (e.g., ordinary commercial loans are assigned a weighting of 100%).
|
58
December 31, 2009, March 31, 2010, and June 30, 2010, respectively. On October 6, 2009 the Parent Company injected from its reserves $11 million in capital into Farmers Bank. Farmers Bank has further agreed that if at the time of the proposed merger of Lawrenceburg Bank into Farmers Bank, which is anticipated to occur during the second quarter of 2010, the combined bank has a Leverage Ratio of less than 8.0% and the Parent Company has obtained additional capital by that time, the Parent Company will inject additional capital to raise the Leverage Ratio to 8.0%. At December 31, 2009 Farmers Bank had a Tier 1 Leverage Ratio of 7.68% and a Total Risk-Based Ratio of 15.66%.
Lawrenceburg Bank. As a result of an examination conducted in March 2009, on May 15, 2009, Lawrenceburg Bank entered into a Memorandum of Understanding with the FRB St. Louis and the KDFI. The Memorandum of Understanding, among other things, requires Lawrenceburg Bank to achieve and maintain a Leverage Ratio of at least 8%. On October 23, 2009, the Company announced that it is in the preliminary stages of merging Lawrenceburg Bank into Farmers Bank. The Company applied for regulatory approval for the merger in the first quarter of 2010 with an anticipated effective date for the merger in the second quarter of 2010. In light of the proposed merger of Lawrenceburg Bank into Farmers Bank, the KDFI and FRB St. Louis have agreed that at this time no additional capital needs to be infused in Lawrenceburg Bank. At the time of the planned merger, however, the Company may be required to inject additional capital into Farmers Bank as a result of the merger depending on the operating results of Farmers Bank and Lawrenceburg Bank in the period leading up to the time of the planned merger. At December 31, 2009 Lawrenceburg Bank had a Tier 1 Leverage Ratio of 5.46% and a Total Risk-Based Ratio of 11.50%
United Bank. As a result of an examination conducted in late July and early August of 2009, the FDIC proposed United Bank enter into a Cease and Desist Order (“Order”) primarily as a result of its level of non-performing assets. While United Bank articulated to the FDIC and KDFI its strong objection and disagreement that an Order was appropriate (especially given the actions taken by United Bank prior to the examination to identify and manage its non-performing assets), United Bank has negotiated certain content and requirements of the proposed Order and, as a result, voluntarily consented to the Order. Among its requirements, the Order requires United Bank to achieve (1) leverage ratios of 7.5%, 7.75%, and 8.0% by December 31, 2009, March 31, 2010, and June 30, 2010, respectively, and (2) a Total Risk-Based Ratio of 12% immediately. On October 6, 2009 the Parent Company injected $10.5 million from its reserves into United Bank. At December 31, 2009 United Bank had a Tier 1 Leverage Ratio of 7.35% and a Total Risk-Based Ratio of 13.75%. The Leverage Ratio of 7.35% was below the required 7.5% amount at year-end 2009 as stated in the Order; however, the Leverage Ratio was 7.68% after adjusting for the year-end 2009 goodwill impairment charge that reduced total assets at United Bank. The reduction in assets attributed to goodwill did not immediately impact average assets (the denominator in calculating the Leverage Ratio). The impact of the goodwill charge will positively impact the Leverage Ratio beginning in 2010.
The Company may fund any additional external capital requirements of Farmers Bank, United Bank or any of its other banking subsidiaries from future public or private sales of securities at an appropriate time or from existing resources of the Company.
Share Buy Back Program
At various times, the Company’s Board of Directors has authorized the purchase of shares of the Company’s outstanding common stock. No stated expiration dates have been established under any of the previous authorizations. There are 84,971 shares that may still be purchased under the various authorizations. The Company’s participation in the Treasury’s CPP in early 2009 restricts the Company’s ability to purchase its outstanding common stock. Until January 9, 2012 the Company generally must have the Treasury’s approval before it can purchase its outstanding common stock, unless all of the Series A preferred stock issued under the CPP has been redeemed by the Company or transferred by the Treasury.
Shareholder Information
As of February 2, 2010, the Company had 3,075 shareholders of record.
Stock Prices
Farmers Capital Bank Corporation’s common stock is traded on the NASDAQ Stock Market LLC exchange in the Global Select Market tier, with sales prices reported under the symbol: FFKT. The table below lists the stock prices and dividends declared for 2009 and 2008.
59
Stock Prices
|
High
|
Low
|
Dividends Declared
|
||||||||||
|
2009
|
||||||||||||
|
Fourth Quarter
|
$ | 18.04 | $ | 9.08 | $ | .10 | ||||||
|
Third Quarter
|
26.90 | 17.10 | .25 | |||||||||
|
Second Quarter
|
27.11 | 14.62 | .25 | |||||||||
|
First Quarter
|
25.99 | 11.10 | .25 | |||||||||
|
2008
|
||||||||||||
|
Fourth Quarter
|
$ | 30.05 | $ | 16.00 | $ | .33 | ||||||
|
Third Quarter
|
32.70 | 17.25 | .33 | |||||||||
|
Second Quarter
|
26.99 | 17.01 | .33 | |||||||||
|
First Quarter
|
28.40 | 23.20 | .33 | |||||||||
The closing price per share of common stock on December 31, 2009, the last trading day of the Company’s fiscal year, was $10.22. Dividends declared per share were $.85 and $1.32 for 2009 and 2008, respectively.
Recently Issued Accounting Standards
Please refer to the caption “Recently Issued But Not Yet Effective Accounting Standards” in Note 1 of the Company’s 2009 audited consolidated financial statements.
2008 Compared to 2007
Consolidated net income for 2008 was $4.4 million, a decrease of $11.2 million or 71.9% compared to $15.6 million for 2007. Basic and diluted net income per share for 2008 was $.60, a decrease of $1.43 or 70.4% compared to $2.03 per share for 2007. The decrease in net income for 2008 was driven mainly by a $9.7 million aggregate after-tax loss on the Company’s GSE preferred stock investments. The loss on the GSE investments was primarily attributed to the sharp decline in value after the announcement that the GSE’s were suspending dividend payments and being placed into conservatorship. The ratings agencies then followed by downgrading the preferred stocks of the GSE’s to below investment grade.
For 2008, the Company reported a $572 thousand or 1.0% increase in net interest income, primarily as a result of lower interest expense and additional net interest income from the $200 balance sheet leverage transaction that occurred late during 2007. The provision for loan losses increased $1.7 million or 46.3% as the Company increased its allowance for loan losses to 1.28% from 1.10% for 2007 due to credit deterioration. Excluding securities transactions, noninterest income was relatively flat at $23.9 million in 2008 compared to $24.2 million for 2007. Noninterest expense increased $1.3 million or 2.2% in 2008 compared to 2007 led by higher deposit insurance and expenses related to foreclosed real estate.
The overall economic environment that began to show signs of weakness during 2007 deteriorated significantly in 2008, particularly in the third and fourth quarters. Financial markets experienced widespread illiquidity and unprecedented levels of volatility. Slower economic growth (including negative GDP growth in the third and fourth quarters), declines in credit availability, lower consumer confidence, increasing unemployment rates, and lower corporate earnings all contributed to significant economic challenges for the Company in 2008. As a result of the unprecedented market conditions, U.S. government agencies, including the Treasury, the Federal Reserve Board, and others, intervened by enacting broad legislation and regulatory initiatives attempting to stabilize the U.S. financial system. Efforts include injecting hundreds of billions of dollars into banks and other financial services firms, lowering overnight targeted interest rates to near zero percent, increasing deposit insurance coverage, and guaranteeing certain debt, among other actions.
Housing market declines, falling home prices, increasing foreclosures, and higher unemployment negatively impacted the credit quality and certain collateral values of the Company’s real estate loan portfolio, particularly in real estate development. This resulted in higher nonperforming assets and charge-offs and negatively impacted net interest margin.
The information required by this item is incorporated by reference to Part II, Item 7 under the caption “Market Risk Management” on pages 54 and 55 of this Form 10-K.
60
MANAGEMENT’S RESPONSIBILITY FOR FINANCIAL REPORTING
The management of Farmers Capital Bank Corporation has the responsibility for preparing the accompanying consolidated financial statements and for their integrity and objectivity. The statements were prepared in accordance with accounting principles generally accepted in the United States of America. The consolidated financial statements include amounts that are based on management’s best estimates and judgments. Management also prepared other information in the annual report and is responsible for its accuracy and consistency with the financial statements.
The Company’s 2009 consolidated financial statements have been audited by Crowe Horwath LLP independent accountants. Management has made available to Crowe Horwath LLP all financial records and related data, as well as the minutes of Boards of Directors’ meetings. Management believes that all representations made to Crowe Horwath LLP during the audit were valid and appropriate.
 |
 |
|
Lloyd C. Hillard, Jr.
|
C. Douglas Carpenter
|
|
President and CEO
|
Senior Vice President, Secretary, and CFO
|
|
March 12, 2010
|
61
Board of Directors and Shareholders
Farmers Capital Bank Corporation
Frankfort, Kentucky
We have audited the accompanying consolidated balance sheets of Farmers Capital Bank Corporation as of December 31, 2009 and 2008 and the related consolidated statements of operations, comprehensive income (loss), changes in shareholders’ equity, and cash flows for each of the three years in the period ended December 31, 2009. We also have audited Farmer Capital Bank Corporation’s internal control over financial reporting as of December 31, 2009, based on criteria established in Internal Control – Integrated Framework issued by the Committee of Sponsoring Organizations of the Treadway Commission (COSO). Farmers Capital Bank Corporation’s management is responsible for these financial statements, for maintaining effective internal control over financial reporting, and for its assessment of the effectiveness of internal control over financial reporting, included in the accompanying Management’s Report on Internal Control over Financial Reporting. Our responsibility is to express an opinion on these financial statements and an opinion on the company’s internal control over financial reporting based on our audits.
We conducted our audits in accordance with the standards of the Public Company Accounting Oversight Board (United States). Those standards require that we plan and perform the audits to obtain reasonable assurance about whether the financial statements are free of material misstatement and whether effective internal control over financial reporting was maintained in all material respects. Our audits of the financial statements included examining, on a test basis, evidence supporting the amounts and disclosures in the financial statements, assessing the accounting principles used and significant estimates made by management, and evaluating the overall financial statement presentation. Our audit of internal control over financial reporting included obtaining an understanding of internal control over financial reporting, assessing the risk that a material weakness exists, and testing and evaluating the design and operating effectiveness of internal control based on the assessed risk. Our audits also included performing such other procedures as we considered necessary in the circumstances. We believe that our audits provide a reasonable basis for our opinions.
A company’s internal control over financial reporting is a process designed to provide reasonable assurance regarding the reliability of financial reporting and the preparation of financial statements for external purposes in accordance with generally accepted accounting principles. A company’s internal control over financial reporting includes those policies and procedures that (1) pertain to the maintenance of records that, in reasonable detail, accurately and fairly reflect the transactions and dispositions of the assets of the company; (2) provide reasonable assurance that transactions are recorded as necessary to permit preparation of financial statements in accordance with generally accepted accounting principles, and that receipts and expenditures of the company are being made only in accordance with authorizations of management and directors of the company; and (3) provide reasonable assurance regarding prevention or timely detection of unauthorized acquisition, use, or disposition of the company’s assets that could have a material effect on the financial statements.
Because of its inherent limitations, internal control over financial reporting may not prevent or detect misstatements. Also, projections of any evaluation of effectiveness to future periods are subject to the risk that controls may become inadequate because of changes in conditions, or that the degree of compliance with the policies or procedures may deteriorate.
In our opinion, the consolidated financial statements referred to above present fairly, in all material respects, the financial position of Farmers Capital Bank Corporation as of December 31, 2009 and 2008, and the results of its operations and its cash flows for each of the three years in the period ended December 31, 2009, in conformity with accounting principles generally accepted in the United States of America. Also in our opinion Farmers Capital Bank Corporation maintained, in all material respects, effective internal control over financial reporting as of December 31, 2009, based on criteria established in Internal Control – Integrated Framework issued by the COSO.

Crowe Horwath LLP
Louisville, Kentucky
March 12, 2010
62
|
December 31, (In thousands, except share data)
|
2009
|
2008
|
||||||
|
Assets
|
||||||||
|
Cash and cash equivalents:
|
||||||||
|
Cash and due from banks
|
$ | 35,841 | $ | 87,656 | ||||
|
Interest bearing deposits in other banks
|
175,926 | 94,823 | ||||||
|
Federal funds sold and securities purchased under agreements to resell
|
6,569 | 8,296 | ||||||
|
Total cash and cash equivalents
|
218,336 | 190,775 | ||||||
|
Investment securities:
|
||||||||
|
Available for sale, amortized cost of $547,021 (2009) and $526,698 (2008)
|
557,021 | 534,295 | ||||||
|
Held to maturity, fair value of $922 (2009) and $1,667 (2008)
|
975 | 1,814 | ||||||
|
Total investment securities
|
557,996 | 536,109 | ||||||
|
Loans, net of unearned income
|
1,271,942 | 1,312,580 | ||||||
|
Allowance for loan losses
|
(23,364 | ) | (16,828 | ) | ||||
|
Loans, net
|
1,248,578 | 1,295,752 | ||||||
|
Premises and equipment, net
|
39,121 | 43,046 | ||||||
|
Company-owned life insurance
|
36,626 | 35,396 | ||||||
|
Goodwill
|
52,408 | |||||||
|
Other intangible assets, net
|
4,989 | 6,941 | ||||||
|
Other real estate owned
|
31,232 | 14,446 | ||||||
|
Other assets
|
34,684 | 27,294 | ||||||
|
Total assets
|
$ | 2,171,562 | $ | 2,202,167 | ||||
|
Liabilities
|
||||||||
|
Deposits:
|
||||||||
|
Noninterest bearing
|
$ | 214,518 | $ | 241,518 | ||||
|
Interest bearing
|
1,418,915 | 1,352,597 | ||||||
|
Total deposits
|
1,633,433 | 1,594,115 | ||||||
|
Term federal funds purchased and other short-term borrowings
|
47,215 | 77,474 | ||||||
|
Securities sold under agreements to repurchase and other long-term borrowings
|
267,962 | 286,691 | ||||||
|
Subordinated notes payable to unconsolidated trusts
|
48,970 | 48,970 | ||||||
|
Dividends payable
|
925 | 2,427 | ||||||
|
Other liabilities
|
25,830 | 24,194 | ||||||
|
Total liabilities
|
2,024,335 | 2,033,871 | ||||||
|
Shareholders’ Equity
|
||||||||
|
Preferred stock, no par value
1,000,000 shares authorized; 30,000 Series A shares issued and outstanding at December 31, 2009; Liquidation preference of $30,000 at December 31, 2009
|
28,348 | |||||||
|
Common stock, par value $.125 per share; 14,608,000 shares authorized;
7,378,605 and 7,357,362 shares issued and outstanding at
December 31, 2009 and 2008, respectively
|
922 | 920 | ||||||
|
Capital surplus
|
50,476 | 48,222 | ||||||
|
Retained earnings
|
63,617 | 116,419 | ||||||
|
Accumulated other comprehensive income
|
3,864 | 2,735 | ||||||
|
Total shareholders’ equity
|
147,227 | 168,296 | ||||||
|
Total liabilities and shareholders’ equity
|
$ | 2,171,562 | $ | 2,202,167 | ||||
See accompanying notes to consolidated financial statements.
63
|
(In thousands, except per share data)
|
||||||||||||
|
Years Ended December 31,
|
2009
|
2008
|
2007
|
|||||||||
|
Interest Income
|
||||||||||||
|
Interest and fees on loans
|
$ | 76,614 | $ | 86,596 | $ | 94,941 | ||||||
|
Interest on investment securities:
|
||||||||||||
|
Taxable
|
20,424 | 22,894 | 12,627 | |||||||||
|
Nontaxable
|
3,570 | 3,231 | 3,356 | |||||||||
|
Interest on deposits in other banks
|
278 | 133 | 64 | |||||||||
|
Interest on federal funds sold and securities purchased under agreements to resell
|
24 | 1,066 | 3,269 | |||||||||
|
Total interest income
|
100,910 | 113,920 | 114,257 | |||||||||
|
Interest Expense
|
||||||||||||
|
Interest on deposits
|
33,197 | 39,045 | 45,157 | |||||||||
|
Interest on federal funds purchased and other short-term borrowings
|
453 | 1,785 | 4,504 | |||||||||
|
Interest on subordinated notes payable to unconsolidated trusts
|
2,178 | 2,865 | 2,394 | |||||||||
|
Interest on securities sold under agreements to purchase and other long-term borrowings
|
11,237 | 11,435 | 3,984 | |||||||||
|
Total interest expense
|
47,065 | 55,130 | 56,039 | |||||||||
|
Net interest income
|
53,845 | 58,790 | 58,218 | |||||||||
|
Provision for loan losses
|
20,768 | 5,321 | 3,638 | |||||||||
|
Net interest income after provision for loan losses
|
33,077 | 53,469 | 54,580 | |||||||||
|
Noninterest Income
|
||||||||||||
|
Service charges and fees on deposits
|
9,347 | 9,847 | 10,320 | |||||||||
|
Allotment processing fees
|
5,403 | 4,791 | 4,363 | |||||||||
|
Other service charges, commissions, and fees
|
4,414 | 4,346 | 4,164 | |||||||||
|
Data processing income
|
1,317 | 1,087 | 1,227 | |||||||||
|
Trust income
|
1,763 | 2,032 | 2,053 | |||||||||
|
Investment securities gains (losses), net
|
3,488 | (166 | ) | |||||||||
|
Other-than-temporary impairment of investment securities
|
(13,962 | ) | ||||||||||
|
Gains on sale of mortgage loans, net
|
1,034 | 407 | 591 | |||||||||
|
Income from company-owned life insurance
|
1,282 | 1,235 | 1,278 | |||||||||
|
Other
|
121 | 193 | 161 | |||||||||
|
Total noninterest income
|
28,169 | 9,810 | 24,157 | |||||||||
|
Noninterest Expense
|
||||||||||||
|
Salaries and employee benefits
|
29,816 | 30,174 | 31,420 | |||||||||
|
Occupancy expenses, net
|
4,991 | 4,515 | 4,261 | |||||||||
|
Equipment expenses
|
3,075 | 3,187 | 3,232 | |||||||||
|
Data processing and communications expenses
|
5,568 | 5,423 | 4,770 | |||||||||
|
Bank franchise tax
|
2,265 | 2,158 | 2,086 | |||||||||
|
Correspondent bank fees
|
1,009 | 1,040 | 721 | |||||||||
|
Goodwill impairment
|
52,408 | |||||||||||
|
Amortization of intangibles
|
1,952 | 2,602 | 3,362 | |||||||||
|
Deposit insurance expense
|
3,777 | 1,038 | 226 | |||||||||
|
Other real estate expenses, net
|
2,074 | 606 | (155 | ) | ||||||||
|
Other
|
8,206 | 9,355 | 8,900 | |||||||||
|
Total noninterest expense
|
115,141 | 60,098 | 58,823 | |||||||||
|
(Loss) income before income taxes
|
(53,895 | ) | 3,181 | 19,914 | ||||||||
|
Income tax (benefit) expense
|
(9,153 | ) | (1,214 | ) | 4,287 | |||||||
|
Net (loss) income
|
(44,742 | ) | 4,395 | 15,627 | ||||||||
|
Dividends and accretion on preferred shares
|
(1,802 | ) | ||||||||||
|
Net (loss) income available to common shareholders
|
$ | (46,544 | ) | $ | 4,395 | $ | 15,627 | |||||
|
Per Common Share
|
||||||||||||
|
Net (loss) income – basic and diluted
|
$ | (6.32 | ) | $ | .60 | $ | 2.03 | |||||
|
Cash dividends declared
|
.85 | 1.32 | 1.32 | |||||||||
|
Weighted Average Shares Outstanding
|
||||||||||||
|
Basic and diluted
|
7,365 | 7,357 | 7,706 | |||||||||
See accompanying notes to consolidated financial statements.
64
|
(In thousands)
|
||||||||||||
|
Years Ended December 31,
|
2009
|
2008
|
2007
|
|||||||||
|
Net (loss) income
|
$ | (44,742 | ) | $ | 4,395 | $ | 15,627 | |||||
|
Other comprehensive income:
|
||||||||||||
|
Unrealized holding gain on available for sale securities arising during the period on securities held at end of period, net of tax of $2,028, $2,613, and $830, respectively
|
3,767 | 4,853 | 1,542 | |||||||||
|
Reclassification adjustment for prior period unrealized loss previously reported in other comprehensive income recognized during current period, net of tax of $1,187, $85, and $5, respectively
|
(2,204 | ) | (158 | ) | 10 | |||||||
|
Change in unfunded portion of postretirement benefit obligations, net of tax of $234, $613 and $603, respectively
|
(434 | ) | 1,146 | 1,120 | ||||||||
|
Other comprehensive income
|
1,129 | 5,841 | 2,672 | |||||||||
|
Comprehensive (loss) income
|
$ | (43,613 | ) | $ | 10,236 | $ | 18,299 | |||||
See accompanying notes to consolidated financial statements.
65
|
(In thousands, except per share data)
|
Accumulated Other
|
Total
|
||||||||||||||||||||||||||
|
Years Ended
|
Preferred
|
Common Stock
|
Capital
|
Retained
|
Comprehensive
|
Shareholders’
|
||||||||||||||||||||||
|
December 31, 2009, 2008, and 2007
|
Stock
|
Shares
|
Amount
|
Surplus
|
Earnings
|
(Loss) Income
|
Equity
|
|||||||||||||||||||||
|
Balance at January 1, 2007
|
7,895 | $ | 988 | $ | 53,201 | $ | 128,652 | $ | (5,778 | ) | $ | 177,063 | ||||||||||||||||
|
Net income
|
15,627 | 15,627 | ||||||||||||||||||||||||||
|
Other comprehensive income
|
2,672 | 2,672 | ||||||||||||||||||||||||||
|
Cash dividends declared, $1.32 per share
|
(10,082 | ) | (10,082 | ) | ||||||||||||||||||||||||
|
Purchase of common stock
|
(584 | ) | (73 | ) | (6,877 | ) | (11,699 | ) | (18,649 | ) | ||||||||||||||||||
|
Stock options exercised, including related tax benefits
|
63 | 7 | 1,540 | 1,547 | ||||||||||||||||||||||||
|
Shares issued pursuant to Employee Stock Purchase Plan
|
11 | 1 | 253 | 254 | ||||||||||||||||||||||||
|
Expense related to employee stock purchase plan and stock options
|
59 | 59 | ||||||||||||||||||||||||||
|
Balance at December 31, 2007
|
7,385 | 923 | 48,176 | 122,498 | (3,106 | ) | 168,491 | |||||||||||||||||||||
|
Net income
|
4,395 | 4,395 | ||||||||||||||||||||||||||
|
Other comprehensive income
|
5,841 | 5,841 | ||||||||||||||||||||||||||
|
Cash dividends declared, $1.32 per share
|
(9,711 | ) | (9,711 | ) | ||||||||||||||||||||||||
|
Purchase of common stock
|
(43 | ) | (5 | ) | (281 | ) | (763 | ) | (1,049 | ) | ||||||||||||||||||
|
Stock options exercised, including related tax benefits
|
1 | 30 | 30 | |||||||||||||||||||||||||
|
Shares issued pursuant to Employee Stock Purchase Plan
|
14 | 2 | 250 | 252 | ||||||||||||||||||||||||
|
Expense related to employee stock purchase plan
|
47 | 47 | ||||||||||||||||||||||||||
|
Balance at December 31, 2008
|
7,357 | 920 | 48,222 | 116,419 | 2,735 | 168,296 | ||||||||||||||||||||||
|
Issuance of 30,000 shares of Series A preferred stock
|
$ | 28,008 | 28,008 | |||||||||||||||||||||||||
|
Issuance of common stock warrant
|
1,952 | 1,952 | ||||||||||||||||||||||||||
|
Net loss
|
(44,742 | ) | (44,742 | ) | ||||||||||||||||||||||||
|
Other comprehensive income
|
1,129 | 1,129 | ||||||||||||||||||||||||||
|
Cash dividends declared-common, $.85 per share
|
(6,258 | ) | (6,258 | ) | ||||||||||||||||||||||||
|
Preferred stock dividends
|
(1,462 | ) | (1,462 | ) | ||||||||||||||||||||||||
|
Preferred stock discount accretion
|
340 | (340 | ) | |||||||||||||||||||||||||
|
Shares issued pursuant to Employee Stock Purchase Plan
|
22 | 2 | 247 | 249 | ||||||||||||||||||||||||
|
Expense related to employee stock purchase plan
|
55 | 55 | ||||||||||||||||||||||||||
|
Balance at December 31, 2009
|
$ | 28,348 | 7,379 | $ | 922 | $ | 50,476 | $ | 63,617 | $ | 3,864 | $ | 147,227 | |||||||||||||||
See accompanying notes to consolidated financial statements.
66
|
Years Ended December 31, (In thousands)
|
2009
|
2008
|
2007
|
|||||||||
|
Cash Flows from Operating Activities
|
||||||||||||
|
Net (loss) income
|
$ | (44,742 | ) | $ | 4,395 | $ | 15,627 | |||||
|
Adjustments to reconcile net income to net cash provided by operating activities:
|
||||||||||||
|
Depreciation and amortization
|
6,077 | 6,642 | 7,477 | |||||||||
|
Net amortization (accretion) of investment security discounts:
|
||||||||||||
|
Available for sale
|
955 | (179 | ) | (1,132 | ) | |||||||
|
Held to maturity
|
(1 | ) | 1 | |||||||||
|
Provision for loan losses
|
20,768 | 5,321 | 3,638 | |||||||||
|
Goodwill impairment
|
52,408 | |||||||||||
|
Deferred income tax benefit
|
(9,905 | ) | (2,046 | ) | (1,807 | ) | ||||||
|
Noncash stock option expense and employee stock purchase plan expense
|
55 | 47 | 59 | |||||||||
|
Mortgage loans originated for sale
|
(45,806 | ) | (17,347 | ) | (19,684 | ) | ||||||
|
Proceeds from sale of mortgage loans
|
46,994 | 16,185 | 21,081 | |||||||||
|
Gains on sale of mortgage loans, net
|
(1,034 | ) | (407 | ) | (591 | ) | ||||||
|
Loss on disposal of premises and equipment, net
|
183 | 17 | 89 | |||||||||
|
Loss (gain) on sale of repossessed assets
|
1,074 | (149 | ) | (365 | ) | |||||||
|
Net (gain) loss on sale of available for sale investment securities
|
(3,488 | ) | 166 | |||||||||
|
Other-than-temporary impairment of investment securities
|
13,962 | |||||||||||
|
Decrease (increase) in accrued interest receivable
|
2,787 | 1,169 | (1,602 | ) | ||||||||
|
Income from company-owned life insurance
|
(1,230 | ) | (1,225 | ) | (1,242 | ) | ||||||
|
(Increase) decrease in other assets
|
(1,027 | ) | (5,666 | ) | 1,874 | |||||||
|
(Decrease) increase in accrued interest payable
|
(1,126 | ) | (634 | ) | 1,672 | |||||||
|
Increase (decrease) increase in other liabilities
|
2,095 | 432 | (2,656 | ) | ||||||||
|
Net cash provided by operating activities
|
25,037 | 20,683 | 22,439 | |||||||||
|
Cash Flows from Investing Activities
|
||||||||||||
|
Proceeds from maturities and calls of investment securities:
|
||||||||||||
|
Available for sale
|
239,192 | 219,724 | 323,155 | |||||||||
|
Held to maturity
|
840 | 2,030 | 3,943 | |||||||||
|
Proceeds from sale of available for sale investment securities
|
183,002 | 34,055 | 20,009 | |||||||||
|
Purchases of available for sale investment securities
|
(439,983 | ) | (252,167 | ) | (555,792 | ) | ||||||
|
Loans originated for investment, net of principal collected
|
5,920 | (36,357 | ) | (100,328 | ) | |||||||
|
Purchase of PNC Military Allotment operations, net of cash acquired
|
(1,943 | ) | ||||||||||
|
Purchase price refinements of previous acquisitions
|
50 | |||||||||||
|
Investment in unconsolidated trusts
|
(696 | ) | ||||||||||
|
Purchases of premises and equipment
|
(2,165 | ) | (10,640 | ) | (5,245 | ) | ||||||
|
Proceeds from sale of repossessed assets
|
3,978 | 6,348 | 3,473 | |||||||||
|
Proceeds from disposals of equipment
|
422 | 2,357 | 330 | |||||||||
|
Net cash used in investing activities
|
(8,794 | ) | (34,650 | ) | (313,044 | ) | ||||||
| (table continues on next page) | ||||||||||||
67
|
Cash Flows from Financing Activities
|
||||||||||||
|
Net increase in deposits
|
39,318 | 120,018 | 8,407 | |||||||||
|
Net (decrease) increase in federal funds purchased and other short-term borrowings
|
(30,259 | ) | (3,281 | ) | 4,037 | |||||||
|
Proceeds from securities sold under agreements to purchase and other long-term debt
|
27,000 | 249,196 | ||||||||||
|
Repayments of securities sold under agreements to purchase and other long-term debt
|
(18,729 | ) | (7,648 | ) | (20,879 | ) | ||||||
|
Proceeds from issuance of preferred stock, net of issue costs
|
29,961 | |||||||||||
|
Dividends paid, common and preferred stock
|
(9,222 | ) | (9,720 | ) | (11,118 | ) | ||||||
|
Purchase of common stock
|
(1,049 | ) | (18,649 | ) | ||||||||
|
Shares issued under Employee Stock Purchase Plan
|
249 | 252 | 254 | |||||||||
|
Stock options exercised and related tax benefits
|
30 | 1,669 | ||||||||||
|
Net cash provided by financing activities
|
11,318 | 125,602 | 212,917 | |||||||||
|
Net increase (decrease) in cash and cash equivalents
|
27,561 | 111,635 | (77,688 | ) | ||||||||
|
Cash and cash equivalents at beginning of year
|
190,775 | 79,140 | 156,828 | |||||||||
|
Cash and cash equivalents at end of year
|
$ | 218,336 | $ | 190,775 | $ | 79,140 | ||||||
|
Supplemental Disclosures
|
||||||||||||
|
Cash paid during the year for:
|
||||||||||||
|
Interest
|
$ | 48,191 | $ | 55,764 | $ | 54,367 | ||||||
|
Income taxes
|
2,450 | 6,600 | 9,854 | |||||||||
|
Transfers from loans to other real estate
|
20,332 | 14,622 | 3,952 | |||||||||
|
Transfers from premises to other real estate
|
1,506 | |||||||||||
|
See accompanying notes to consolidated financial statements.
|
68
The accounting and reporting policies of Farmers Capital Bank Corporation and subsidiaries conform to accounting principles generally accepted in the United States of America and general practices applicable to the banking industry. Significant accounting policies are summarized below.
Principles of Consolidation and Nature of Operations
The consolidated financial statements include the accounts of Farmers Capital Bank Corporation (the “Company” or “Parent Company”), a bank holding company, and its bank and nonbank subsidiaries. Bank subsidiaries include Farmers Bank & Capital Trust Company (“Farmers Bank”) in Frankfort, KY and its significant wholly-owned subsidiaries Leasing One Corporation (“Leasing One”) and Farmers Capital Insurance Corporation (“Farmers Insurance”). Leasing One is a commercial leasing company in Frankfort, KY and Farmers Insurance is an insurance agency in Frankfort, KY; First Citizens Bank in Elizabethtown, KY; United Bank & Trust Company (“United Bank”) in Versailles, KY which, during 2008, was the surviving company after the merger with two sister companies of Farmers Bank and Trust Company and Citizens Bank of Jessamine County; United Bank had one subsidiary at year-end 2009, EGT Properties, Inc. EGT Properties is involved in real estate management and liquidation for certain repossessed properties of United Bank; The Lawrenceburg Bank and Trust Company (“Lawrenceburg Bank”) in Lawrenceburg, KY; and Citizens Bank of Northern Kentucky, Inc. in Newport, KY (“Citizens Northern”); Citizens Northern had one subsidiary at year-end 2009, ENKY Properties, Inc. ENKY Properties is involved in real estate management and liquidation for certain repossessed properties of Citizens Northern.
The Company has four active nonbank subsidiaries, FCB Services, Inc. (“FCB Services”), Kentucky General Holdings, LLC (“Kentucky General”), FFKT Insurance Services, Inc. (“FFKT Insurance”), and EKT Properties, Inc. (“EKT”). FCB Services is a data processing subsidiary located in Frankfort, KY that provides services to the Company’s banks as well as unaffiliated entities. On August 6, 2009 Kentucky General sold its entire 50% interest in KHL Holdings, LLC to Hamburg Insurance, LLC. KHL Holdings, the parent company of Kentucky Home Life Insurance Company, was a joint venture between the Company and Hamburg Insurance, an otherwise unrelated entity. The Company received gross proceeds of $2.5 million for the sale of KHL Holdings, resulting in a pre-tax gain of $185 thousand. The Company withdrew its financial holding company election upon the sale of KHL Holdings.
FFKT Insurance is a captive property and casualty insurance company insuring primarily deductible exposures and uncovered liability related to properties of the Company. EKT was created in 2008 to manage and liquidate certain real estate properties repossessed by the Company. In addition, the Company has three subsidiaries organized as Delaware statutory trusts that are not consolidated into its financial statements. These trusts were formed for the purpose of issuing trust preferred securities. All significant intercompany transactions and balances are eliminated in consolidation.
The Company provides financial services at its 36 locations in 23 communities throughout Central and Northern Kentucky to individual, business, agriculture, government, and educational customers. Its primary deposit products are checking, savings, and term certificate accounts. Its primary lending products are residential mortgage, commercial lending and leasing, and installment loans. Substantially all loans and leases are secured by specific items of collateral including business assets, consumer assets, and commercial and residential real estate. Commercial loans and leases are expected to be repaid from cash flow from operations of businesses. Farmers Bank has served as the general depository for the Commonwealth of Kentucky for over 70 years and also provides investment and other services to the Commonwealth. Other services include, but are not limited to, cash management services, issuing letters of credit, safe deposit box rental, and providing funds transfer services. Other financial instruments, which potentially represent concentrations of credit risk, include deposit accounts in other financial institutions and federal funds sold.
Use of Estimates
The preparation of financial statements in conformity with accounting principles generally accepted in the United States of America requires management to make estimates and assumptions that affect the reported amounts of assets and liabilities and disclosure of contingent assets and liabilities at the date of the financial statements and the reported amounts of revenues and expenses during the reporting period. Estimates used in the preparation of the financial statements are based on various factors including the current interest rate environment and the general strength of the local economy. Changes in the overall interest rate environment can significantly affect the Company’s net interest income and the value of its recorded assets and liabilities. Actual results could differ from those estimates used in the preparation of the financial statements. The allowance for loan losses, carrying value of real estate, actuarial assumptions used to calculate postretirement benefits, and the fair values of financial instruments are estimates that are particularly subject to change.
Reclassifications
Certain amounts in the accompanying consolidated financial statements presented for prior years have been reclassified to conform to the 2009 presentation. These reclassifications do not affect net income or total shareholders’ equity as previously reported.
69
Segment Information
The Company provides a broad range of financial services to individuals, corporations, and others through its 36 banking locations throughout Central and Northern Kentucky. These services primarily include the activities of lending and leasing, receiving deposits, providing cash management services, safe deposit box rental, and trust activities. While the chief decision-makers monitor the revenue streams of the various products and services, operations are managed and financial performance is evaluated on a Company-wide basis. Operating segments are aggregated into one as operating results for all segments are similar. Accordingly, all of the financial service operations are considered by management to be aggregated in one reportable operating segment.
Cash Flows
For purposes of reporting cash flows, cash and cash equivalents include the following: cash on hand, deposits from other financial institutions that have an initial maturity of less than 90 days when acquired by the Company, federal funds sold, and securities purchased under agreements to resell. Generally, federal funds sold and securities purchased under agreements to resell are purchased and sold for one-day periods. Net cash flows are reported for loan, deposit, and short-term borrowing transactions.
Investment Securities
Investments in debt and equity securities are classified into three categories. Securities that management has the positive intent and ability to hold until maturity are classified as held to maturity. Securities that are bought and held specifically for the purpose of selling them in the near term are classified as trading securities. The Company had no securities classified as trading during 2009, 2008, or 2007. All other securities are classified as available for sale. Securities are designated as available for sale if they might be sold before maturity. Securities classified as available for sale are carried at estimated fair value. Unrealized holding gains and losses for available for sale securities are reported net of deferred income taxes in other comprehensive income. Investments classified as held to maturity are carried at amortized cost.
Interest income includes amortization and accretion of purchase premiums or discounts. Premiums and discounts on securities are amortized using the interest method over the expected life of the securities without anticipating prepayments, except for mortgage backed securities where prepayments are anticipated. Realized gains and losses on the sales of securities are recorded on the trade date and computed on the basis of specific identification of the adjusted cost of each security and are included in noninterest income.
The Company evaluates investment securities for other-than-temporary impairment (“OTTI”) at least on a quarterly basis, and more frequently when economic or market conditions warrant such an evaluation. A decline in the market value of investment securities below cost that is deemed other-than-temporary results in a charge to earnings and the establishment of a new cost basis for the security. Substantially all of the Company’s investment securities are debt securities. In estimating OTTI for debt securities, management considers each of the following: (1) the length of time and extent to which fair value has been less than cost, (2) the financial condition and near-term prospects of the issuer, (3) whether market decline was affected by macroeconomic conditions, and (4) whether the Company has the intent to sell the debt security or more likely than not will be required to sell the debt security before its anticipated recovery in fair value. The assessment of whether an OTTI charge exists involves a high degree of subjectivity and judgment and is based on the information available to the Company at a point in time.
Investment securities classified as available for sale or held-to-maturity are generally evaluated for OTTI under Financial Accounting Standard Board (“FASB”) Accounting Standards CodificationTM (“ASC”) 320, “Investments-Debt and Equity Securities”. In determining OTTI under ASC 320 the Company considers many factors, including those enumerated above. When OTTI occurs, the amount of the OTTI recognized in earnings depends on whether the Company intends to sell the security or it is more likely than not it will be required to sell the security before recovery of its amortized cost basis, less any current-period credit loss. If the Company intends to sell or it is more likely than not it will be required to sell the security before recovery of its amortized cost basis, less any current-period credit loss, the OTTI shall be recognized in earnings equal to the entire difference between the investment’s amortized cost basis and its fair value at the balance sheet date. If the Company does not intend to sell the security and it is not more likely than not that it will be required to sell the security before recovery of its amortized cost basis less any current-period loss, OTTI is separated into the amount representing the credit loss and the amount related to all other factors. The amount of the total OTTI related to the credit loss is determined based on the present value of cash flows expected to be collected and is recognized in earnings. The amount of the total OTTI related to other factors is recognized in other comprehensive income, net of applicable taxes. The previous amortized cost basis less the OTTI recognized in earnings becomes the new amortized cost basis of the investment.
Federal Home Loan Bank (“FHLB”) and Federal Reserve Board stock is carried at cost and periodically evaluated for impairment based on ultimate recovery of par value. Both cash and stock dividends are reported as income.
Loans and Interest Income
Loans that management has the intent and ability to hold for the foreseeable future or until maturity or pay-off are reported at their unpaid principal amount outstanding adjusted for any charge-offs and any deferred fees or costs on originated loans. Interest income on loans is recognized using the interest method based on loan principal amounts outstanding during the period. Interest income also includes amortization and accretion of any premiums or discounts over the expected life of acquired loans at the time of purchase or business
70
acquisition. Net fees and incremental direct costs associated with loan origination are deferred and amortized as yield adjustments over the contractual term of the loans. Generally, the accrual of interest on loans is discontinued when it is determined that the collection of interest or principal is doubtful, or when a default of interest or principal has existed for 90 days or more, unless such loan is well secured and in the process of collection. Past due status is based on the contractual terms of the loan. All interest accrued but not received for loans placed on nonaccrual status is reversed against interest income. Cash payments received on nonaccrual loans generally are applied to principal, and interest income is only recorded once principal recovery is reasonably assured. Loans are returned to accrual status when all the principal and interest amounts contractually due are brought current and future payments are reasonably assured.
Loans Held for Sale
The Company’s operations include a limited amount of mortgage banking. Mortgage banking activities include the origination of fixed-rate residential mortgage loans for sale to various third-party investors. Mortgage loans originated and intended for sale in the secondary market, principally under programs with the Federal Home Loan Mortgage Corporation, the Federal National Mortgage Association, and other commercial lending institutions are carried at the lower of cost or estimated market value determined in the aggregate and included in net loans on the balance sheet until sold. These loans are sold with the related servicing rights either retained or released by the Company depending on the economic conditions present at the time of origination. Mortgage loans held for sale included in net loans totaled $1,951,000 and $2,732,000 at December 31, 2009 and December 31, 2008, respectively. Mortgage banking revenues, including origination fees, servicing fees, net gains or losses on sales of mortgages, and other fee income were .97%, .44%, and .58%, of the Company’s total revenue for the years ended December 31, 2009, 2008, and 2007, respectively.
Provision and Allowance for Loan Losses
The provision for loan losses represents charges made to earnings to maintain an allowance for loan losses at an adequate level based on credit losses specifically identified in the loan portfolio, as well as management’s best estimate of probable incurred loan losses in the remainder of the portfolio at the balance sheet date. The allowance for loan losses is a valuation allowance increased by the provision for loan losses and decreased by net charge-offs. Loan losses are charged against the allowance when management believes the uncollectibility of a loan is confirmed. Subsequent recoveries, if any, are credited to the allowance.
Management estimates the allowance balance required using a risk-rated methodology. Many factors are considered when estimating the allowance. These include, but are not limited to, past loan loss experience, an assessment of the financial condition of individual borrowers, a determination of the value and adequacy of underlying collateral, the condition of the local economy, an analysis of the levels and trends of the loan portfolio, and a review of delinquent and classified loans. The allowance for loan losses consists of specific and general components. The specific component relates to loans that are individually classified as impaired or loans otherwise classified as substandard or doubtful. The general component covers non-classified loans and is based on historical loss experience adjusted for current risk factors. Allocations of the allowance may be made for specific loans, but the entire allowance is available for any loan that, in management’s judgment, should be charged off. Actual loan losses could differ significantly from the amounts estimated by management.
A loan is impaired when, based on current information and events, it is probable that the Company will be unable to collect all amounts due according to the contractual terms of the loan agreement. Loans, for which the terms have been modified, and for which the borrower is experiencing financial difficulties, are considered troubled debt restructurings and classified as impaired.
The risk-rated methodology includes segregating watch list and past due loans from the general portfolio and allocating specific amounts to these loans depending on their status. For example, watch list loans, which may be identified by the internal loan review risk-rating system or by regulatory examiner classification, are assigned a certain loss percentage while loans past due 30 days or more are assigned a different loss percentage. Each of these percentages considers past experience as well as current factors. The remainder of the general loan portfolio is segregated into three components having similar risk characteristics as follows: commercial loans, consumer loans, and real estate loans. Each of these components is assigned a loss percentage based on their respective year historical loss percentage. Additional allocations to the allowance may then be made for subjective factors, such as those mentioned above, as determined by senior managers who are knowledgeable about these matters. During 2007, the Company further identified signs of deterioration in certain real estate development loans that continued into 2008 and 2009 and specific allowances related to these loans were recorded.
The Company accounts for impaired loans in accordance with ASC Topic 310, “Receivables”. ASC Topic 310 requires that impaired loans be measured at the present value of expected future cash flows, discounted at the loan’s effective interest rate, at the loan’s observable market price, or at the fair value of the collateral if the loan is collateral dependent. A loan is impaired when full payment under the contractual terms is not expected. Generally, impaired loans are also in nonaccrual status. In certain circumstances, however, the Company may continue to accrue interest on an impaired loan. Cash receipts on impaired loans are typically applied to the recorded investment in the loan, including any accrued interest receivable. Loans that are part of a large group of smaller-balance homogeneous loans, such as residential mortgage, consumer, and smaller-balance commercial loans, are collectively evaluated for impairment and, accordingly, they are not separately identified for impairment disclosures. Troubled debt restructurings are measured at the present value of estimated future cash flows using the loan’s effective interest rate at inception, or at the fair value of collateral.
71
Mortgage Servicing Rights
Mortgage servicing rights are recognized in other assets on the Company’s consolidated balance sheet at their initial fair value on loans sold. Fair value is based on market price for comparable mortgage servicing contracts. Mortgage servicing rights are subsequently measured using the amortization method in which the mortgage servicing right is expensed in proportion to, and over the period of, estimated net servicing revenues. Impairment is evaluated based on the fair value of the rights, using groupings of the underlying loans as to interest rates. Any impairment of a grouping is reported as a valuation allowance. Capitalized mortgage servicing rights were $463,000 and $333,000 at December 31, 2009 and 2008. No impairment of the asset was determined to exist on either of these dates.
Fair Value of Financial Instruments
Fair values of financial instruments are estimated using relevant market information and other assumptions, as more fully disclosed in Note 18. Fair value estimates involve uncertainties and matters of significant judgment regarding interest rates, credit risk, prepayments, and other factors, especially in the absence of broad markets for particular items. Changes in assumptions or in market conditions could significantly affect the estimates.
Business Combinations
Prior to January 1, 2009, the Company accounted for its business acquisitions as a purchase in accordance with SFAS No. 141, whereby the purchase price is allocated to the tangible and intangible assets acquired and liabilities assumed based on their estimated fair value. The excess of the purchase price over estimated fair value of the net identifiable assets is allocated to goodwill. Effective January 1, 2009, the Company adopted new accounting guidance under ASC Topic 805, “Business Combinations” that requires the recognition of noncontrolling interests, expensing acquisition related costs, and measuring goodwill or gain from a bargain purchase option, among other requirements.
The Company engages third-party appraisal firms to assist in determining the fair values of certain assets acquired and liabilities assumed. Determining fair value of assets and liabilities requires many assumptions and estimates. These estimates and assumptions are sometimes refined subsequent to the initial recording of the transaction with adjustments to goodwill as information is gathered and final appraisals are completed. There were no business combinations completed in 2009, 2008, or 2007.
Goodwill and Other Intangible Assets
Goodwill resulting from business combinations prior to January 1, 2009 represents the excess of the purchase price over the fair value of net assets of businesses acquired. Goodwill resulting from business combinations after January 1, 2009, is generally determined as the excess of the fair value of the consideration transferred, plus the fair value of any noncontrolling interests in the acquiree, over the fair value of the net assets acquired and liabilities assumed as of the acquisition date. Transaction costs, which were previously included as part of the purchase price, are now expensed as incurred. The Company did not enter into a business combination during 2009.
Goodwill and intangible assets acquired in a purchase business combination and determined to have an indefinite useful life are not amortized, but tested for impairment at least annually and more frequently if events or circumstances indicate impairment could have taken place. Such events could include, among others, a significant adverse change in the business climate, an adverse action by a regulator, an unanticipated change in the competitive environment, or a decision to change the Company’s operations or disposal of a subsidiary. The Company performs its annual impairment test during the fourth quarter. Goodwill was the only intangible asset with an indefinite life on the Company’s balance sheets. See Note 21 for further discussion of the Company’s 2009 goodwill impairment analysis.
Intangible assets with definite useful lives are amortized over their estimated useful lives to their estimated residual values. Such intangible assets consist of core deposit and acquired customer relationship intangible assets arising from business acquisitions. They are initially measured at fair value and then are amortized on an accelerated method over their estimated useful lives, which range between seven and 10 years.
Other Real Estate Owned
Other real estate owned and held for sale in the accompanying consolidated balance sheets includes properties acquired by the Company through actual loan foreclosures. Other real estate owned is carried at the lower of cost or fair value less estimated costs to sell. Fair value of assets is generally based on third party appraisals of the property that includes comparable sales data. If the carrying amount exceeds fair value less estimated costs to sell, an impairment loss is recorded through expense. Costs after acquisition are expensed.
Income Taxes
Income tax expense is the total of current year income tax due or refundable and the change in deferred tax assets and liabilities, except for the deferred tax assets and liabilities related to business combinations or components of other comprehensive income. Deferred income tax assets and liabilities result from temporary differences between the tax basis of assets and liabilities and their reported amounts in the consolidated financial statements that will result in taxable or deductible amounts in future years. Deferred tax assets and liabilities are measured using enacted tax rates expected to apply to taxable income in years in which those temporary differences are expected to be recovered or settled. As changes in tax laws or rates are enacted, deferred tax assets and liabilities are adjusted through income tax expense. A valuation allowance, if needed, reduces deferred tax assets to the amount expected to be realized.
72
The Company adopted guidance issued by the FASB with respect to accounting for uncertainty in income taxes as of January 1, 2007. A tax position is recognized as a benefit only if it is “more likely than not” that the tax position would be sustained in a tax examination, with a tax examination being presumed to occur. The amount recognized is the largest amount of tax benefit that is greater than 50% likely of being realized on examination. For tax positions not meeting the “more likely than not” test, no tax benefit is recorded. Adopting this guidance did not materially impact the Company’s results of operations or financial condition.
The Company files a consolidated federal income tax return with its subsidiaries. Federal income tax expense or benefit has been allocated to subsidiaries on a separate return basis.
Premises and Equipment
Premises, equipment, and leasehold improvements are stated at cost less accumulated depreciation and amortization. Depreciation is computed primarily on the straight-line method over the estimated useful lives generally ranging from two to seven years for furniture and equipment and generally ten to 40 years for buildings and related components. Leasehold improvements are amortized over the shorter of the estimated useful lives or terms of the related leases on the straight-line method. Maintenance, repairs, and minor improvements are charged to operating expenses as incurred and major improvements are capitalized. The cost of assets sold or retired and the related accumulated depreciation are removed from the accounts and any resulting gain or loss is included in noninterest income. Land is carried at cost.
Company-owned Life Insurance
The Company has purchased life insurance policies on certain key employees with their knowledge and written consent. Company-owned life insurance is recorded at its cash surrender value, i.e. the amount that can be realized under the insurance contract, on the consolidated balance sheet. The related change in cash surrender value and proceeds received under the policies are reported on the consolidated statement of income under the caption “Income from company-owned life insurance”.
Net Income Per Common Share
Basic net income per common share is determined by dividing net income available to common shareholders by the weighted average total number of common shares issued and outstanding. Net income available to common shareholders represents net income adjusted for preferred stock dividends including dividends declared, accretion of discounts on preferred stock issuances, and cumulative dividends related to the current dividend period that have not been declared as of the end of the period.
Diluted net income per common share is determined by dividing net income available to common shareholders by the total weighted average number of common shares issued and outstanding plus amounts representing the dilutive effect of stock options outstanding and outstanding warrants. The effects of stock options and outstanding warrants are excluded from the computation of diluted earnings per common share in periods in which the effect would be antidilutive. Dilutive potential common shares are calculated using the treasury stock method.
Net income per common share computations were as follows at December 31, 2009, 2008, and 2007.
|
(In thousands, except per share data)
Years Ended December 31,
|
2009
|
2008
|
2007
|
|||||||||
|
Net (loss) income, basic and diluted
|
$ | (44,742 | ) | $ | 4,395 | $ | 15,627 | |||||
|
Preferred stock dividends and discount accretion
|
(1,802 | ) | ||||||||||
|
Net (loss) income available to common shareholders, basic and diluted
|
$ | (46,544 | ) | $ | 4,395 | $ | 15,627 | |||||
|
Average common shares outstanding, basic and diluted
|
7,365 | 7,357 | 7,706 | |||||||||
|
Net (loss) income per common share, basic and diluted
|
$ | (6.32 | ) | $ | .60 | $ | 2.03 | |||||
Stock options for 57,621 shares of common stock for 2009 and 59,621 shares of common stock for 2008 and 2007 were not included in the determination of dilutive earnings per common share because they were antidilutive. There were 223,992 potential common shares associated with a warrant issued to the U.S. Treasury that were excluded from the computation of earnings per common share for 2009 because they were antidilutive. There were no warrants outstanding prior to 2009.
Comprehensive Income
Comprehensive income is defined as the change in equity (net assets) of a business enterprise during a period from transactions and other events and circumstances from nonowner sources. For the Company this includes net income, the after tax effect of changes in the net unrealized gains and losses on available for sale investment securities, and the changes in the funded status of postretirement benefit plans.
73
Dividend Restrictions
Banking regulations require maintaining certain capital levels and may limit the dividends paid to the Company by its bank subsidiaries or by the Company to its shareholders.
Restrictions on Cash
Included in interest bearing deposits in other banks on the consolidated balance sheets are certain amounts that are held at the Federal Reserve Bank in accordance with reserve requirements specified by the Federal Reserve Board of Governors. Prior to 2008, amounts held at the Federal Reserve Bank were included in noninterest cash and due from banks. Since October 2008, these balances earn interest. The reserve requirement was $12,827,000 and $17,877,000 at December 31, 2009 and 2008, respectively.
Equity
Outstanding common shares purchased by the Company are retired. When common shares are purchased, the Company allocates a portion of the purchase price of the common shares that are retired to each of the following balance sheet line items: common stock, capital surplus, and retained earnings.
Trust Assets
Assets of the Company’s trust departments, other than cash on deposit at our subsidiaries, are not included in the accompanying financial statements because they are not assets of the Company.
Transfers of Financial Assets
Transfers of financial assets are accounted for as sales when control over the assets has been relinquished. Control over transferred assets is deemed to be surrendered when the assets have been isolated from the Company, the transferee obtains the right (free of conditions that constrain it from taking advantage of that right) to pledge or exchange the transferred assets, and the Company does not maintain effective control over the transferred assets through an agreement to repurchase them before their maturity.
Long-term Assets
Premises and equipment, core deposit and other intangible assets, and other long-term assets are reviewed for impairment when events indicate their carrying amount may not be recoverable from future undiscounted cash flows. If impaired, the assets are recorded at fair value
Stock-Based Compensation
The Company recognizes compensation cost for its Employee Stock Purchase Plan (“ESPP”) and for stock options granted based on the fair value of these awards at the date of grant. A Black-Scholes model is utilized to estimate the fair value of ESPP and stock option awards. Compensation cost is recognized over the required service period, generally defined as the vesting period, on a straight-line basis.
The Company’s ESPP was approved by its shareholders at the Company’s 2004 annual meeting. The purpose of the ESPP is to provide a means by which eligible employees may purchase, at a discount, shares of common stock of the Company through payroll withholding. The purchase price of the shares is equal to 85% of their fair market value on specified dates as defined in the plan. The ESPP was effective beginning July 1, 2004. There were 21,243, 14,497, and 10,557 shares issued under the plan during 2009, 2008, and 2007, respectively. Compensation expense related to the ESPP included in the accompanying statements of income was $55,000, $47,000, and $47,000 in 2009, 2008, and 2007, respectively.
Following are the weighted average assumptions used and estimated fair market value for the ESPP, which is considered a compensatory plan under ASC Topic 718, “Compensation-Stock Compensation”.
|
ESPP
|
||||||||||||
|
2009
|
2008
|
2007
|
||||||||||
|
Dividend yield
|
4.63 | % | 4.24 | % | 3.97 | % | ||||||
|
Expected volatility
|
56.8 | 24.1 | 15.3 | |||||||||
|
Risk-free interest rate
|
.14 | 1.85 | 4.75 | |||||||||
|
Expected life (in years)
|
.25 | .25 | .25 | |||||||||
|
Fair value
|
$ | 3.67 | $ | 4.05 | $ | 5.12 | ||||||
Adoption of New Accounting Standards
In June 2009 the FASB issued an accounting pronouncement establishing FASB Accounting Standards CodificationTM as the source of authoritative U.S. generally accepted accounting principles (“GAAP”) applicable to all nongovernmental entities effective July 1, 2009. ASC superseded then-existing FASB, American Institute of Certified Public Accountants, Emerging Issues Task Force (“EITF”), and
74
related literature. Rules and interpretive releases of the Securities and Exchange Commission (“SEC”) under the authority of federal securities laws are also sources of GAAP for SEC registrants. All other accounting literature is non-authoritative.
The FASB no longer issues standards in the form of Statements of Financial Accounting Standards, FASB Staff Position’s, or EITF Abstracts. Instead, the FASB will issue Accounting Standards Updates (“ASU”), which will serve only to: (a) update the ASC; (b) provide background information about the guidance; and (c) provide the basis for conclusions on changes in the ASC. The move to ASC changes how companies refer to GAAP in financial statements and accounting policies. Companies will now cite relevant accounting content by referring to the specific Topic, Subtopic, Section, or Paragraph structure of the ASC. The adoption of this accounting pronouncement did not have a material impact on the Company’s consolidated financial position or results of operations.
ASC Topic 805, “Business Combinations”. Effective January 1, 2009, the Company adopted new accounting guidance under ASC Topic 805. ASC Topic 805 establishes principals and requirements for how an acquirer recognizes and measures in its financial statements the identifiable assets acquired, liabilities assumed, and any noncontrolling interest in an acquiree. This standard also provides guidance for recognizing and measuring goodwill or gain from a bargain purchase in a business combination and determines what information to disclose to enable users of the financial statements to evaluate the nature and financial effects of the business combination. This Topic requires acquirers to expense acquisition related costs as incurred rather than allocating such costs to the assets acquired and liabilities assumed under previous accounting guidance.
Other provisions of this Topic requires that assets acquired and liabilities assumed in a business combination that arise from contingencies be recognized at fair value on the date of acquisition if fair value can be reasonably estimated. If fair value of such an asset or liability cannot be reasonably estimated, the asset or liability would generally be recognized in accordance with ASC Topic 450, “Contingencies”. Topic 805 eliminates the requirement to disclose an estimate of the range of outcomes of recognized contingencies at the acquisition date. It also requires that contingent consideration arrangements of an acquiree assumed by the acquirer in a business combination be treated as contingent consideration of the acquirer and should be initially and subsequently measured at fair value.
The provisions of ASC 805 will only impact the Company if it enters into a business combination on or after January 1, 2009. The impact of adopting this accounting guidance will also depend on the nature of any contingencies associated with such acquisitions. There were no business combinations completed in 2009.
ASC Topic 810, “Consolidation”. Effective January 1, 2009, the Company adopted new accounting guidance under ASC Topic 810. This Topic establishes accounting and reporting standards for the noncontrolling interest in a subsidiary and for the deconsolidation of a subsidiary. Under this Topic, a noncontrolling interest in a subsidiary, which is often referred to as a minority interest, is an ownership interest in the consolidated entity that should be reported as a component of equity in the consolidated financial statements.
Other requirements of this Topic require consolidated net income to include the amounts attributable to both the parent and the noncontrolling interest. It also requires disclosure, on the face of the consolidated income statement, of the amounts of consolidated net income attributable to the parent and to the noncontrolling interest. The adoption of this accounting guidance did not have an impact on the Company’s consolidated financial position or results of operations.
ASC Topic 815, “Derivatives and Hedging”. Effective January 1, 2009, the Company adopted new accounting guidance under ASC Topic 815. This Topic amends and expands the prior disclosure requirements to provide enhanced transparency about 1) how and why an entity uses derivative instruments; 2) how derivative instruments and related hedged items are accounted for under SFAS No. 133 and related interpretations; and 3) how derivative instruments and related hedged items affect an entity’s financial position, financial performance, and cash flows. The adoption of this accounting guidance did not have an impact on the Company’s consolidated financial position or results of operations.
ASC Topic 820, “Fair Value Measurements and Disclosures”. Effective for the second quarter of 2009, the Company adopted new accounting guidance under ASC Topic 820. New guidance under this Topic:
|
|
·
|
Affirms that the objective of fair value when the market for an asset is not active is the price that would be received to sell the asset in an orderly transaction.
|
|
|
·
|
Clarifies and includes additional factors for determining whether there has been a significant decrease in market activity for an asset when the market for that asset is not active.
|
|
|
·
|
Eliminates the proposed presumption that all transactions are distressed (not orderly) unless proven otherwise. The new guidance instead requires an entity to base its conclusion about whether a transaction was not orderly on the weight of the evidence.
|
|
|
·
|
Includes an example that provides additional explanation on estimating fair value when the market activity for an asset has declined significantly.
|
75
|
|
·
|
Requires an entity to disclose a change in valuation technique (and the related inputs) resulting from the application of the new guidance and to quantify its effects, if practicable.
|
|
|
·
|
Applies to all fair value measurements when appropriate.
|
The adoption of this accounting guidance did not have a material impact on the Company’s consolidated financial position or results of operations.
ASC Topic 320, “Investments-Debt and Equity Securities”. Effective for the second quarter of 2009, the Company adopted new accounting guidance under ASC Topic 320. New guidance under this Topic:
|
|
·
|
Changes existing guidance for determining whether impairment is other than temporary for debt securities;
|
|
|
·
|
Replaces the existing requirement that the entity’s management assert it has both the intent and ability to hold an impaired security until recovery with a requirement that management assert: (a) it does not have the intent to sell the security; and (b) it is more likely than not it will not have to sell the security before recovery of its cost basis;
|
|
|
·
|
Incorporates examples of factors from existing literature that should be considered in determining whether a debt security is other-than-temporarily impaired;
|
Under ASC Topic 320, declines in the fair value of held-to-maturity and available-for-sale securities below their cost that are deemed to be other than temporary are reflected in earnings as realized losses to the extent the impairment is related to credit losses. The amount of the impairment related to other factors is recognized in other comprehensive income. The adoption of this accounting guidance did not have a material impact on the Company’s consolidated financial position or results of operations. Reference is made to Note 2 for additional disclosures required by this Topic.
ASC Topic 825, “Financial Instruments”. Effective for the second quarter of 2009, the Company adopted new accounting guidance under ASC Topic 825. New accounting guidance under this Topic requires an entity to provide disclosures about fair value of financial instruments in interim financial information. It also amends prior guidance to require those disclosures in summarized financial information at interim reporting periods. Under the new guidance, a publicly traded company shall include disclosures about the fair value of its financial instruments whenever it issues summarized financial information for interim reporting periods. In addition, an entity shall disclose in the body or in the accompanying notes of its summarized financial information for interim reporting periods and in its financial statements for annual reporting periods the fair value of all financial instruments for which it is practicable to estimate that value, whether recognized or not recognized in the statement of financial position. The adoption of this accounting guidance did not have a material impact on the Company’s consolidated financial position or results of operations. Please refer to Note 18 for additional information related to the impact of adopting this guidance.
ASC Topic 820, “Fair Value Measurements and Disclosures”. Effective for the third quarter of 2009, the Company adopted new accounting guidance under ASC Topic 820. ASU 2009-05 includes amendments to Topic 820 for the fair value measurement of liabilities and provides clarification that in circumstances in which a quoted price in an active market for the identical liability is not available, a reporting entity is required to measure fair value using one or more of the techniques provided for in Topic 820. The guidance under ASU 2009-05 was effective October 1, 2009. The adoption of this accounting guidance did not have a material impact on the Company’s consolidated financial position or results of operations.
ASC Topic 860, “Transfers and Servicing”. Effective January 1, 2010, new accounting guidance under ASC Topic 860 will require more information about transfers of financial assets, including securitization transactions, and where entities have continuing exposure to the risks related to transferred financial assets. It eliminates the concept of a “qualifying special-purpose entity,” changes the requirements for derecognizing financial assets, and requires additional disclosures about continuing involvements with transferred financial assets including information about gains and losses resulting from transfers during the period. The Company does not expect the guidance under this Topic to have a material impact on its consolidated results of operations or financial position upon adoption.
ASC Topic 810, “Consolidation”. Effective January 1, 2010, new accounting guidance under ASC Topic 810 amends prior guidance to change how a reporting entity determines when an entity that is insufficiently capitalized or is not controlled through voting (or similar rights) should be consolidated. The determination of whether a reporting entity is required to consolidate another entity is based on, among other things, the other entity’s purpose and design and the reporting entity’s ability to direct the activities of the other entity that most significantly impact the other entity’s economic performance. The new guidance requires a number of new disclosures about an
76
entity’s involvement with variable interest entities and any significant changes in risk exposure due to that involvement. A reporting entity will also be required to disclose how its involvement with a variable interest entity affects the reporting entity’s financial statements. The Company does not expect the guidance under this Topic to have a material impact on its consolidated results of operations or financial position upon adoption.
The following tables summarize the amortized cost and estimated fair values of the securities portfolio at December 31, 2009 and 2008 and the corresponding amounts of gross unrealized gains and losses. The summary is divided into available for sale and held to maturity securities.
|
Amortized
|
Gross
|
Gross
|
Estimated
|
|||||||||||||
|
December 31, 2009 (In thousands)
|
Cost
|
Unrealized Gains
|
Unrealized Losses
|
Fair Value
|
||||||||||||
|
Available For Sale
|
||||||||||||||||
|
Obligations of U.S. government-sponsored entities
|
$ | 90,889 | $ | 162 | $ | 299 | $ | 90,752 | ||||||||
|
Obligations of states and political subdivisions
|
107,190 | 2,423 | 655 | 108,958 | ||||||||||||
|
Mortgage-backed securities – residential
|
315,546 | 10,446 | 473 | 325,519 | ||||||||||||
|
U.S. Treasury securities
|
2,997 | 5 | 3,002 | |||||||||||||
|
Money market mutual funds
|
910 | 910 | ||||||||||||||
|
Corporate debt securities
|
20,341 | 195 | 1,804 | 18,732 | ||||||||||||
|
Equity securities
|
9,148 | 9,148 | ||||||||||||||
|
Total securities – available for sale
|
$ | 547,021 | $ | 13,231 | $ | 3,231 | $ | 557,021 | ||||||||
|
Held To Maturity
|
||||||||||||||||
|
Obligations of states and political subdivisions
|
$ | 975 | $ | 0 | $ | 53 | $ | 922 | ||||||||
|
Amortized
|
Gross
|
Gross
|
Estimated
|
|||||||||||||
|
December 31, 2008 (In thousands)
|
Cost
|
Unrealized Gains
|
Unrealized Losses
|
Fair Value
|
||||||||||||
|
Available For Sale
|
||||||||||||||||
|
Obligations of U.S. government-sponsored entities
|
$ | 34,068 | $ | 507 | $ | 8 | $ | 34,567 | ||||||||
|
Obligations of states and political subdivisions
|
89,268 | 1,894 | 324 | 90,838 | ||||||||||||
|
Mortgage-backed securities – residential
|
364,563 | 10,771 | 7 | 375,327 | ||||||||||||
|
U.S. Treasury securities
|
10,218 | 38 | 10,256 | |||||||||||||
|
Money market mutual funds
|
374 | 374 | ||||||||||||||
|
Corporate debt securities
|
19,265 | 5,274 | 13,991 | |||||||||||||
|
Equity securities
|
8,942 | 8,942 | ||||||||||||||
|
Total securities – available for sale
|
$ | 526,698 | $ | 13,210 | $ | 5,613 | $ | 534,295 | ||||||||
|
Held To Maturity
|
||||||||||||||||
|
Obligations of states and political subdivisions
|
$ | 1,814 | $ | 9 | $ | 156 | $ | 1,667 | ||||||||
At year-end 2009 and 2008, the Company held no investment securities of any single issuer, other than the U.S. Government and its agencies, in an amount greater than 10% of shareholders’ equity.
The amortized cost and estimated fair value of the securities portfolio at December 31, 2009, by contractual maturity, are detailed below. The summary is divided into available for sale and held to maturity securities. Expected maturities may differ from contractual maturities because borrowers may have the right to call or prepay obligations with or without call or prepayment penalties. Equity securities in the available for sale portfolio consist primarily of restricted FHLB and Federal Reserve Board stocks, which have no stated maturity and are not included in the maturity schedule that follows.
77
Mortgage-backed securities are stated separately due to the nature of payment and prepayment characteristics of these securities, as principal is not due at a single date.
|
Available For Sale
|
Held To Maturity
|
|||||||||||||||
|
Amortized
|
Estimated
|
Amortized
|
Estimated
|
|||||||||||||
|
December 31, 2009 (In thousands)
|
Cost
|
Fair Value
|
Cost
|
Fair Value
|
||||||||||||
|
Due in one year or less
|
$ | 25,472 | $ | 25,582 | ||||||||||||
|
Due after one year through five years
|
73,270 | 74,199 | ||||||||||||||
|
Due after five years through ten years
|
55,606 | 56,011 | ||||||||||||||
|
Due after ten years
|
67,979 | 66,562 | $ | 975 | $ | 922 | ||||||||||
|
Mortgage-backed securities – residential
|
315,546 | 325,519 | ||||||||||||||
|
Total
|
$ | 537,873 | $ | 547,873 | $ | 975 | $ | 922 | ||||||||
Gross realized gains and losses on the sale of available for sale investment securities were as follows for the year indicated.
|
(In thousands)
|
2009
|
2008
|
2007
|
|||||||||
|
Gross realized gains
|
$ | 3,560 | $ | 713 | $ | 0 | ||||||
|
Gross realized losses
|
72 | 879 | ||||||||||
|
Net realized gain (loss)
|
$ | 3,488 | $ | (166 | ) | $ | 0 | |||||
|
Income tax provision (benefit) related to net realized gains (losses)
|
$ | 1,221 | $ | (58 | ) | $ | 0 | |||||
|
Proceeds from sales and calls of available for sale investment securities
|
$ | 314,623 | $ | 94,039 | $ | 70,022 | ||||||
Gross losses for 2008 include $766,000 related to the sale of preferred stock investments in Federal National Mortgage Association and Federal Home Loan Mortgage Corporation (“GSE’s”).
Investment securities with a carrying value of $389,001,000 and $428,074,000 at December 31, 2009 and 2008 were pledged to secure public and trust deposits, repurchase agreements, and for other purposes.
Investment securities with unrealized losses at year-end 2009 and 2008 not recognized in income are presented in the tables below. The tables segregate investment securities that have been in a continuous unrealized loss position for less than twelve months from those that have been in a continuous unrealized loss position for twelve months or more. The table also includes the fair value of the related securities.
|
Less than 12 Months
|
12 Months or More
|
Total
|
||||||||||||||||||||||
|
December 31, 2009 (In thousands)
|
Fair Value
|
Unrealized
Losses
|
Fair Value
|
Unrealized
Losses
|
Fair Value
|
Unrealized
Losses
|
||||||||||||||||||
|
Obligations of U.S. government-sponsored entities
|
$ | 39,445 | $ | 299 | $ | 39,445 | $ | 299 | ||||||||||||||||
|
Obligations of states and political subdivisions
|
22,795 | 552 | $ | 3,605 | $ | 156 | 26,400 | 708 | ||||||||||||||||
|
Mortgage-backed securities – residential
|
41,120 | 473 | 41,120 | 473 | ||||||||||||||||||||
|
Corporate debt securities
|
11,710 | 1,804 | 11,710 | 1,804 | ||||||||||||||||||||
|
Total
|
$ | 103,360 | $ | 1,324 | $ | 15,315 | $ | 1,960 | $ | 118,675 | $ | 3,284 | ||||||||||||
|
Less than 12 Months
|
12 Months or More
|
Total
|
||||||||||||||||||||||
|
December 31, 2008 (In thousands)
|
Fair Value
|
Unrealized
Losses
|
Fair Value
|
Unrealized
Losses
|
Fair Value
|
Unrealized
Losses
|
||||||||||||||||||
|
Obligations of U.S. government-sponsored entities
|
$ | 2,237 | $ | 8 | $ | 2,237 | $ | 8 | ||||||||||||||||
|
Obligations of states and political subdivisions
|
8,870 | 404 | $ | 6,545 | $ | 76 | 15,415 | 480 | ||||||||||||||||
|
Mortgage-backed securities – residential
|
4,417 | 6 | 410 | 1 | 4,827 | 7 | ||||||||||||||||||
|
Corporate debt securities
|
10,573 | 2,500 | 3,029 | 2,774 | 13,602 | 5,274 | ||||||||||||||||||
|
Total
|
$ | 26,097 | $ | 2,918 | $ | 9,984 | $ | 2,851 | $ | 36,081 | $ | 5,769 | ||||||||||||
78
Unrealized losses included in the tables above have not been recognized in income since they have been identified as temporary. The Company evaluates investment securities for other-than-temporary impairment at least quarterly, and more frequently when economic or market conditions warrant. Many factors are considered, including: (1) the length of time and the extent to which the fair value has been less than cost, (2) the financial condition and near-term prospects of the issuer, (3) whether market decline was effected by macroeconomic conditions, and (4) whether the Company has the intent to sell the debt security or more likely than not will be required to sell the debt security before its anticipated recovery. The assessment of whether an OTTI charge exists involves a high degree of subjectivity and judgment and is based on the information available to the Company at a point in time.
As of December 31, 2009, the Company’s investment security portfolio had gross unrealized losses of $3.3 million. Unrealized losses on corporate debt securities comprised $1.8 million of the total unrealized loss, an improvement of $3.5 million or 65.8% from December 31, 2008. Corporate debt securities consist primarily of single-issuer trust preferred capital securities issued by national and global financial services firms. Each of these securities is currently performing and the issuers of these securities are rated as investment grade by major rating agencies, even though down grades have occurred with respect to certain securities within this group of holdings during the first half of 2009. The unrealized loss on corporate debt securities is primarily attributed to the general decline in financial markets and temporary illiquidity that began in 2008 and is not due to adverse changes in the expected cash flows of the individual securities. Overall market declines, particularly of banking and financial institutions, are a result of significant stress throughout the regional and national economy that began during 2008 and has not fully stabilized.
The Company attributes the unrealized losses in the other sectors of its securities portfolio mainly to the change in market interest rates represented by a higher yield curve, particularly maturities exceeding two years. In general, market rates exceed the yield available at the time many of the securities in the portfolio were purchased. The Company does not expect to incur a loss on these securities unless they are sold prior to maturity.
Corporate debt securities and other securities with unrealized losses held in the Company’s portfolio at December 31, 2009 are performing according to their contractual terms. The Company does not have the intent to sell these securities and it is likely that it will not be required to sell these securities before their anticipated recovery. The Company does not consider any of the securities to be impaired due to reasons of credit quality or other factors.
During the third quarter of 2008, the Company recorded a non-cash other-than-temporary impairment pre-tax charge of $14.0 million related to its GSE preferred stock investments. This impairment charge resulted from a sharp decline in market value of the GSE investments that occurred after the announcement that the GSE’s were suspending dividend payments and being placed into conservatorship by the Federal Housing Finance Agency. Rating agencies also downgraded the preferred stocks of the GSE’s to below investment grade. During the fourth quarter of 2008 the Company sold its entire holdings of GSE preferred stocks for an additional $766,000 loss.
Major classifications of loans are summarized as follows.
|
December 31, (In thousands)
|
2009
|
2008
|
||||||
|
Commercial, financial, and agricultural
|
$ | 146,530 | $ | 144,788 | ||||
|
Real estate – construction
|
211,744 | 260,524 | ||||||
|
Real estate mortgage – residential
|
466,018 | 444,487 | ||||||
|
Real estate mortgage – farmland and other commercial enterprises
|
386,626 | 390,424 | ||||||
|
Installment loans
|
36,727 | 45,135 | ||||||
|
Lease financing
|
26,765 | 30,234 | ||||||
|
Total loans
|
1,274,410 | 1,315,592 | ||||||
|
Less unearned income
|
(2,468 | ) | (3,012 | ) | ||||
|
Total loans, net of unearned income
|
$ | 1,271,942 | $ | 1,312,580 | ||||
Loans to directors, executive officers, and principal shareholders (including loans to affiliated companies of which they are principal owners) and loans to members of the immediate family of such persons were $24,767,000 and $23,574,000 at December 31, 2009 and 2008, respectively. Such loans were made in the normal course of business on substantially the same terms, including interest rates and
79
collateral, as those prevailing at the time for comparable transactions with other customers and did not involve more than the normal risk of collectability. An analysis of the activity with respect to these loans is presented in the table below.
|
(In thousands)
|
Amount
|
|||
|
Balance, December 31, 2008
|
$ | 23,574 | ||
|
New loans
|
4,164 | |||
|
Repayments
|
(5,477 | ) | ||
|
Loans no longer meeting disclosure requirements, new loans meeting disclosure requirements, and other adjustments, net
|
2,506 | |||
|
Balance, December 31, 2009
|
$ | 24,767 | ||
Activity in the allowance for loan losses was as follows.
|
Years Ended December 31, (In thousands)
|
2009
|
2008
|
2007
|
|||||||||
|
Balance, beginning of year
|
$ | 16,828 | $ | 14,216 | $ | 11,999 | ||||||
|
Provision for loan losses
|
20,768 | 5,321 | 3,638 | |||||||||
|
Recoveries
|
536 | 1,833 | 733 | |||||||||
|
Loans charged off
|
(14,768 | ) | (4,542 | ) | (2,154 | ) | ||||||
|
Balance, end of year
|
$ | 23,364 | $ | 16,828 | $ | 14,216 | ||||||
The Company’s charge-off policy for impaired loans does not differ from the charge-off policy for loans outside the definition of impaired. Loans that are delinquent in excess of 120 days are charged off unless the collateral securing the debt is of such value that any loss appears to be unlikely.
Individually impaired loans were as follows for the dates indicated.
|
Years Ended December 31, (In thousands)
|
2009
|
2008
|
||||||
|
Year-end loans with no allocated allowance for loan losses
|
$ | 47,746 | $ | 4,684 | ||||
|
Year-end loans with allocated allowance for loan losses
|
60,723 | 43,670 | ||||||
|
Total
|
$ | 108,469 | $ | 48,354 | ||||
|
Amount of the allowance for loan losses allocated
|
$ | 7,374 | $ | 3,619 | ||||
|
Years Ended December 31, (In thousands)
|
2009
|
2008
|
2007
|
|||||||||
|
Average of individually impaired loans during year
|
$ | 70,845 | $ | 34,364 | $ | 13,037 | ||||||
|
Interest income recognized during impairment
|
3,866 | 1,070 | 1,382 | |||||||||
|
Cash-basis interest income recognized
|
3,257 | 880 | 683 | |||||||||
Nonperforming loans were as follows.
|
December 31, (In thousands)
|
2009
|
2008
|
||||||
|
Nonaccrual loans
|
$ | 56,630 | $ | 21,545 | ||||
|
Restructured loans
|
17,911 | |||||||
|
Loans past due 90 days or more and still accruing
|
1,807 | 3,913 | ||||||
|
Total nonperforming loans
|
$ | 76,348 | $ | 25,458 | ||||
The Company has allocated $2,262,000 of specific reserves to customers whose loan terms have been modified in troubled debt restructurings as of December 31, 2009. The Company has committed to lend additional amounts totaling up to $350,000 to customers with outstanding loans that are classified as troubled debt restructurings.
80
Premises and equipment consist of the following.
|
December 31, (In thousands)
|
2009
|
2008
|
||||||
|
Land, buildings, and leasehold improvements
|
$ | 53,324 | $ | 54,564 | ||||
|
Furniture and equipment
|
20,406 | 20,607 | ||||||
|
Total premises and equipment
|
73,730 | 75,171 | ||||||
|
Less accumulated depreciation and amortization
|
(34,609 | ) | (32,125 | ) | ||||
|
Premises and equipment, net
|
$ | 39,121 | $ | 43,046 | ||||
Depreciation and amortization of premises and equipment was $3,979,000, $3,883,000, and $3,938,000 in 2009, 2008, and 2007, respectively.
At December 31, 2009 the scheduled maturities of time deposits were as follows.
|
(In thousands)
|
Amount
|
|||
|
2010
|
$ | 667,915 | ||
|
2011
|
116,999 | |||
|
2012
|
75,845 | |||
|
2013
|
31,643 | |||
|
2014
|
5,509 | |||
|
Thereafter
|
7,067 | |||
|
Total
|
$ | 904,978 | ||
Time deposits of $100,000 or more at December 31, 2009 and 2008 were $326,832,000 and $302,215,000, respectively. Interest expense on time deposits of $100,000 or more was $11,159,000, $11,575,000, and $11,869,000 for 2009, 2008, and 2007, respectively.
Deposits from directors, executive officers, and principal shareholders (including deposits from affiliated companies of which they are principal owners) and deposits from members of the immediate family of such persons were $30,025,000 and $28,100,000 at December 31, 2009 and 2008, respectively. Such deposits were accepted in the normal course of business on substantially the same terms as those prevailing at the time for comparable transactions with other customers.
Federal funds purchased and other short-term borrowings represent borrowings with an original maturity of less than one year. Substantially all of the total short-term borrowings are made up of federal funds purchased and securities sold under agreements to repurchase, which represents borrowings that generally mature one business day following the date of the transaction. Information on federal funds purchased and other short-term borrowings is as follows.
|
December 31, (Dollars in thousands)
|
2009
|
2008
|
||||||
|
Federal funds purchased and securities sold under agreement to repurchase
|
$ | 46,941 | $ | 73,187 | ||||
|
Overnight FHLB advances
|
3,500 | |||||||
|
Other
|
274 | 787 | ||||||
|
Total short-term
|
$ | 47,215 | $ | 77,474 | ||||
|
Average balance during the year
|
$ | 62,946 | $ | 81,180 | ||||
|
Maximum month-end balance during the year
|
105,844 | 125,096 | ||||||
|
Average interest rate during the year
|
.72 | % | 2.20 | % | ||||
|
Average interest rate at year-end
|
.79 | .74 | ||||||
81
Long-term securities sold under agreements to repurchase and other borrowings represent borrowings with an original maturity of one year or more. The table below displays a summary of the ending balance and average rate for borrowed funds on the dates indicated.
|
Average
|
Average
|
|||||||||||||||
|
December 31, (Dollars in thousands)
|
2009
|
Rate
|
2008
|
Rate
|
||||||||||||
|
FHLB advances
|
$ | 67,630 | 3.98 | % | $ | 86,116 | 3.85 | % | ||||||||
|
Subordinated notes payable
|
48,970 | 4.11 | 48,970 | 5.94 | ||||||||||||
|
Securities sold under agreements to repurchase
|
200,000 | 3.95 | 200,000 | 3.95 | ||||||||||||
|
Other
|
332 | 2.32 | 575 | 2.32 | ||||||||||||
|
Total long-term
|
$ | 316,932 | 3.98 | % | $ | 335,661 | 4.21 | % | ||||||||
Long-term FHLB advances are made pursuant to several different credit programs, which have their own interest rates and range of maturities. Interest rates on FHLB advances totaling $67,630,000 are fixed and range between 2.60% and 6.90%, averaging 3.98%, over a remaining maturity period of up to 11 years as of December 31, 2009. Long-term FHLB borrowings totaling $30,000,000 at year-end 2009 are putable quarterly. Long-term FHLB advances of $10,000,000 are convertible to a floating interest rate. These advances may convert, at FHLB’s option, to a floating interest rate indexed to the three-month LIBOR only if LIBOR equals or exceeds 7%. At year-end 2009, three-month LIBOR was at .25%.
For FHLB advances, the subsidiary banks pledge FHLB stock and fully disbursed, otherwise unencumbered, 1-4 family first mortgage loans as collateral for these advances as required by the FHLB. Based on this collateral and the Company’s holdings of FHLB stock, the Company is eligible to borrow up to an additional $54,895,000 from the FHLB at year-end 2009.
During 2005 the Company completed two private offerings of trust preferred securities through two separate Delaware statutory trusts sponsored by the Company. Farmers Capital Bank Trust I (“Trust I”) sold $10,000,000 of preferred securities and Farmers Capital Bank Trust II (“Trust II”) sold $15,000,000 of preferred securities. The proceeds from the offerings were used to fund the cash portion of the acquisition of Citizens Bancorp, Inc., the parent company of Citizens Northern.
Farmers Capital Bank Trust III (“Trust III”), a Delaware statutory trust sponsored by the Company, was formed during 2007 for the purpose of financing the cost of acquiring Company shares under a share repurchase program. Trust III sold $22,500,000 of 6.60% (fixed through November 2012, thereafter at a variable rate of interest, reset quarterly, equal to the 3-month LIBOR plus a predetermined spread of 132 basis points) trust preferred securities to the public. The trust preferred securities, which pay interest quarterly, mature on November 1, 2037, or may be redeemed by the Trust at par any time on or after November 1, 2012. Trust I, Trust II, and Trust III are hereafter collectively referred to as the “Trusts”.
The Trusts used the proceeds from the sale of preferred securities, plus capital contributed to establish the trusts, to purchase the Company’s subordinated notes in amounts and bearing terms that parallel the amounts and terms of the respective preferred securities. The subordinated notes to Trust I and Trust II mature in 2035 and in 2037 for Trust III, and bear a floating interest rate (current three-month LIBOR plus 150 basis points in the case of the notes held by Trust I, current three-month LIBOR plus 165 basis points in the case of the notes held by Trust II, and current three-month LIBOR plus 132 basis points in the case of the notes held by Trust III). Interest on the notes is payable quarterly. Interest payments to the Trusts and distributions to preferred shareholders by the Trusts may be deferred for 20 consecutive quarterly periods.
The subordinated notes are redeemable in whole or in part, without penalty, at the Company’s option on or after September 30, 2010 and mature on September 30, 2035 with respect to Trust I and Trust II. For Trust III, the subordinated notes are redeemable in whole or in part, without penalty, at the Company’s option on or after November 1, 2012. The notes are junior in right of payment of all present and future senior indebtedness. At December 31, 2009 and 2008 the balance of the subordinated notes payable to Trust I, Trust II, and Trust III was $10,310,000, $15,464,000, and $23,196,000, respectively. The interest rates in effect as of the last determination date in 2009 were 1.78%, 1.93%, and 6.60% for Trust I, Trust II, and Trust III, respectively. For 2008 these rates were 5.26%, 5.41%, and 6.60% for Trust I Trust II, and Trust III, respectively.
The Company is not considered the primary beneficiary of the Trusts (variable interest entity); therefore the Trusts are not consolidated into its financial statements. Accordingly, the Company does not report the securities issued by the Trusts as liabilities, but instead reports as liabilities the subordinated notes issued by the Company and held by the Trusts. The Company, which owns all of the common securities of the Trusts, accounts for its investment in each of the Trusts as assets. The Company records interest expense on the corresponding notes issued to the Trusts on its statement of income.
82
The subordinated notes may be included in Tier 1 capital (with certain limitations applicable) under current regulatory capital guidelines and interpretations. The amount of subordinated notes in excess of the limit may be included in Tier 2 capital, subject to restrictions.
During 2007, the Company entered into a balance sheet leverage transaction whereby it borrowed $200,000,000 in multiple fixed rate term repurchase agreements with an initial weighted average cost of 3.95% and invested the proceeds in Government National Mortgage Association (“GNMA”) bonds, which were pledged as collateral. The Company is required to secure the borrowed funds by GNMA bonds valued at 106% of the outstanding principal balance. The borrowings have maturity dates ranging from November 2010 to November 2017, with a weighted average remaining maturity of 4.9 years. At December 31, 2009 $150,000,000 of the borrowings are putable quarterly and the remaining $50,000,000 putable quarterly beginning in the fourth quarter of 2012. The repurchase agreements are held by each of the Company’s four subsidiary banks that are participating in the transaction and are guaranteed by the Parent Company.
Maturities of long-term borrowings at December 31, 2009 are as follows.
|
(In thousands)
|
Amount
|
|||
|
2010
|
$ | 64,248 | ||
|
2011
|
12,084 | |||
|
2012
|
61,814 | |||
|
2013
|
2,000 | |||
|
2014
|
8,083 | |||
|
Thereafter
|
168,703 | |||
|
Total
|
$ | 316,932 | ||
The components of income tax expense are as follows.
|
December 31, (In thousands)
|
2009
|
2008
|
2007
|
|||||||||
|
Currently payable
|
$ | 752 | $ | 832 | $ | 6,094 | ||||||
|
Deferred
|
(9,905 | ) | (2,046 | ) | (1,807 | ) | ||||||
|
Total applicable to operations
|
(9,153 | ) | (1,214 | ) | 4,287 | |||||||
|
Deferred tax (credited) charged to components of shareholders’ equity:
|
||||||||||||
|
Unfunded status of postretirement benefits
|
(234 | ) | 617 | (139 | ) | |||||||
|
Net unrealized securities gains
|
841 | 2,528 | 836 | |||||||||
|
Total income taxes
|
$ | (8,546 | ) | $ | 1,931 | $ | 4,984 | |||||
An analysis of the difference between the effective income tax rates and the statutory federal income tax rate follows.
|
December 31,
|
2009
|
2008
|
2007
|
|||||||||
|
Federal statutory rate
|
35.0 | % | 35.0 | % | 35.0 | % | ||||||
|
Changes from statutory rates resulting from:
|
||||||||||||
|
Tax-exempt interest
|
3.0 | (48.1 | ) | (8.1 | ) | |||||||
|
Nondeductible interest to carry tax-exempt obligations
|
(.3 | ) | 5.7 | 1.1 | ||||||||
|
Goodwill impairment
|
(22.7 | ) | ||||||||||
|
Tax credits
|
.8 | (14.6 | ) | (2.7 | ) | |||||||
|
Premium income not subject to tax
|
.6 | (9.2 | ) | (1.9 | ) | |||||||
|
Company-owned life insurance
|
.8 | (13.5 | ) | (2.1 | ) | |||||||
|
Dividend exclusion
|
(4.8 | ) | ||||||||||
|
Other, net
|
(.2 | ) | 11.3 | .2 | ||||||||
|
Effective tax rate on pretax income
|
17.0 | % | (38.2 | )% | 21.5 | % | ||||||
83
The tax effects of the significant temporary differences that comprise deferred tax assets and liabilities at December 31, 2009 and 2008 follows.
|
December 31, (In thousands)
|
2009
|
2008
|
||||||
|
Assets
|
||||||||
|
Allowance for loan losses
|
$ | 8,192 | $ | 5,901 | ||||
|
Deferred directors’ fees
|
269 | 263 | ||||||
|
Postretirement benefit obligations
|
4,419 | 3,727 | ||||||
|
Other real estate owned
|
307 | 82 | ||||||
|
Partnership investments
|
337 | |||||||
|
Self-funded insurance
|
167 | 175 | ||||||
|
Paid time off
|
712 | 712 | ||||||
|
Alternative minimum tax credits
|
814 | 587 | ||||||
|
Low income housing credits
|
38 | 193 | ||||||
|
Intangibles
|
4,002 | |||||||
|
Other
|
63 | 39 | ||||||
|
Total deferred tax assets
|
19,320 | 11,679 | ||||||
|
Liabilities
|
||||||||
|
Depreciation
|
360 | 564 | ||||||
|
Unrealized gains on available for sale investment securities, net
|
3,500 | 2,659 | ||||||
|
Life insurance income
|
144 | |||||||
|
Prepaid expenses
|
616 | 664 | ||||||
|
Discount on investment securities
|
1,098 | 1,111 | ||||||
|
Deferred loan fees
|
1,187 | 1,209 | ||||||
|
Lease financing operations
|
1,996 | 1,886 | ||||||
|
Intangibles
|
2,177 | |||||||
|
Total deferred tax liabilities
|
8,757 | 10,414 | ||||||
|
Net deferred tax asset
|
$ | 10,563 | $ | 1,265 | ||||
In assessing the realizability of deferred tax assets, management considers whether it is more likely than not that some portion or all of the deferred tax assets will not be realized. The ultimate realization of deferred tax assets is dependent upon the generation of future taxable income during the periods in which those temporary differences become deductible. Management considers the scheduled reversal of deferred tax liabilities, projected future taxable income, and tax planning strategies in making this assessment. Based upon the level of historical taxable income and projections for future taxable income over the periods in which the deferred tax assets are deductible, management believes it is more likely than not the Company will realize the benefits of these deductible differences at December 31, 2009.
The Company had no unrecognized tax benefits as of December 31, 2009, 2008, and 2007 and did not recognize any increase in unrecognized benefits during 2009 relative to any tax positions taken in 2009. Should the accrual of any interest or penalties relative to unrecognized tax benefits be necessary, it is the Company’s policy to record such accruals in its income tax expense accounts; no such accruals existed as of December 31, 2009, 2008, or 2007. The Company files U.S. federal and various state income tax returns. The Company is no longer subject to income tax examinations by taxing authorities for the years before 2006.
The Company maintains a salary savings plan that covers substantially all of its employees. For 2009, the Company matched all eligible voluntary tax deferred employee contributions up to 6% of the participant’s compensation. Beginning in 2010, the Company will match in an amount up to 50% of eligible employee deferrals up to a maximum of 6% of the participants’ compensation. The Company may, at the discretion of the Board, contribute an additional amount based upon a percentage of covered employees’ salaries. The Company did not make a discretionary contribution during 2009 or 2008. The Company made a 2% discretionary contribution to the plan during 2007. Discretionary contributions are allocated among participants in the ratio that each participant’s compensation bears to all participants’ compensation. Eligible employees are presented with various investment alternatives related to the salary savings plan. Those alternatives include various stock and bond mutual funds that vary from traditional growth funds to more stable income funds. Company shares are not an available investment alternative in the salary savings plan.
In connection with the acquisition of Citizens Northern, the Company acquired a nonqualified supplemental retirement plan for certain key employees. Benefits provided under this plan are unfunded, and payments to plan participants are made by the Company.
84
The following schedules set forth a reconciliation of the changes in the plans benefit obligation and funded status for the years ended December 31, 2009 and 2008.
|
(In thousands)
|
2009
|
2008
|
||||||
|
Change in Benefit Obligation
|
||||||||
|
Obligation at beginning of year
|
$ | 498 | $ | 462 | ||||
|
Service cost
|
34 | 33 | ||||||
|
Interest cost
|
30 | 26 | ||||||
|
Actuarial loss (gain)
|
8 | (18 | ) | |||||
|
Benefit payments
|
(5 | ) | (5 | ) | ||||
|
Obligation at end of year
|
$ | 565 | $ | 498 | ||||
The following table provides disclosure of the net periodic benefit cost as of December 31 for the years indicated.
|
(In thousands)
|
2009
|
2008
|
||||||
|
Service cost
|
$ | 34 | $ | 33 | ||||
|
Interest cost
|
30 | 26 | ||||||
|
Recognized net actuarial loss
|
6 | 8 | ||||||
|
Net periodic benefit cost
|
$ | 70 | $ | 67 | ||||
|
Major assumptions:
|
||||||||
|
Discount rate
|
6.0 | % | 6.0 | % | ||||
The following table presents estimated future benefit payments in the period indicated.
|
(In thousands)
|
Supplemental
Retirement Plan
|
|||
|
2010
|
$ | 5 | ||
|
2011
|
5 | |||
|
2012
|
48 | |||
|
2013
|
48 | |||
|
2014
|
48 | |||
| 2015-2019 | 237 | |||
|
Total
|
$ | 391 | ||
Amounts recognized in accumulated other comprehensive income as of December 31, 2009 and 2008 are as follows.
|
(In thousands)
|
2009
|
2008
|
||||||
|
Unrecognized net actuarial loss
|
$ | 100 | $ | 99 | ||||
|
Total
|
$ | 100 | $ | 99 | ||||
The estimated costs that will be amortized from accumulated other comprehensive income into net periodic cost over the next fiscal year are as follows.
|
(In thousands)
|
Supplemental Retirement Plan
|
|||
|
Unrecognized net actuarial loss
|
$ | 4 | ||
|
Total
|
$ | 4 | ||
The total retirement plan expense for 2009, 2008, and 2007 was $1,100,000, $1,107,000, and $1,486,000, respectively.
During 1997 the Company’s Board of Directors approved a nonqualified stock option plan (the “Plan”), subsequently approved by the Company’s shareholders, that has periodically provided for the granting of stock options to key employees and officers of the Company. All stock options are awarded at a price equal to the fair market value of the Company’s common stock at the date options are granted and expire ten years from the grant date. Total options granted were 450,000, 54,000, and 40,049 in the years 1997, 2000, and 2004, respectively.
85
The Plan provides for the granting of options to purchase up to 450,000 shares of the Company’s common stock at a price equal to the fair market value of the Company’s common stock on the date the option is granted. The term of the options expires after ten years from the date on which the options are granted. Options granted under the Plan vest ratably over various time periods ranging from three to seven years. All options granted must be held for a minimum of one year before they can be exercised. Forfeited options are available for the granting of additional stock options under the Plan. Options forfeited from the initial grant in 1997 were used to grant options during 2000 and 2004. All outstanding options granted under the Plan are vested. At December 31, 2009 there were 18,600 options available for future grants under the Plan.
A summary of the activity in the Company’s Plan for 2009 is presented below.
|
2009
|
||||||||
|
Weighted
|
||||||||
|
Average
|
||||||||
|
Shares
|
Price
|
|||||||
|
Outstanding at January 1
|
59,621 | $ | 32.63 | |||||
|
Forfeited
|
(2,000 | ) | 34.80 | |||||
|
Outstanding at December 31
|
57,621 | $ | 32.56 | |||||
|
Options exercisable at year-end
|
57,621 | $ | 32.56 | |||||
Options outstanding at year-end 2009 were as follows.
|
Outstanding
|
Exercisable
|
||||||||||||||||||||
|
Weighted Average
|
|||||||||||||||||||||
|
Remaining Contractual
|
Weighted Average
|
Weighted Average
|
|||||||||||||||||||
|
Exercise Price
|
Number
|
Life (Years)
|
Exercise Price
|
Number
|
Exercise Price
|
||||||||||||||||
| $29.75 | 25,572 | .06 | $ | 29.75 | 25,572 | $ | 29.75 | ||||||||||||||
| $34.80 | 32,049 | 4.83 | 34.80 | 32,049 | 34.80 | ||||||||||||||||
|
Outstanding at year-end
|
57,621 | 2.69 | $ | 32.56 | 57,621 | $ | 32.56 | ||||||||||||||
The aggregate intrinsic value for options outstanding and options exercisable at December 31, 2009 was zero since the exercise price of all options was in excess of the market price of the Company’s stock.
The following table presents further information regarding the Company’s stock option Plan during each of the years indicated.
|
(In thousands)
|
2009
|
2008
|
2007
|
|||||||||
|
Tax benefit realized from options exercised
|
$ | 0 | $ | 0 | $ | 123 | ||||||
|
Total intrinsic value of options exercised
|
0 | 1 | 353 | |||||||||
|
Cash received from options exercised
|
0 | 30 | 1,546 | |||||||||
There were no modifications or cash paid to settle stock option awards during 2009, 2008, or 2007. There were no options granted in 2009, 2008, or 2007.
Prior to 2003, the Company provided lifetime medical and dental benefits upon retirement for certain employees meeting the eligibility requirements as of December 31, 1989 (Plan 1). During 2003, the Company implemented an additional postretirement health insurance program (Plan 2). Under Plan 2, any employee meeting the service requirement of 20 years of full time service to the Company and is at least age 55 years of age upon retirement is eligible to continue their health insurance coverage. Under both plans, retirees not yet eligible for Medicare have coverage identical to the coverage offered to active employees. Under both plans, Medicare-eligible retirees are provided with a Medicare Advantage plan. The Company pays 100% of the cost of Plan 1. The Company and the retirees each pay 50% of the cost under Plan 2. Both plans are unfunded.
86
The following schedules set forth a reconciliation of the changes in the plans benefit obligation and funded status for the years ended December 31, 2009 and 2008.
|
(In thousands)
|
2009
|
2008
|
||||||
|
Change in Benefit Obligation
|
||||||||
|
Obligation at beginning of year
|
$ | 10,550 | $ | 11,003 | ||||
|
Service cost
|
454 | 442 | ||||||
|
Interest cost
|
695 | 622 | ||||||
|
Actuarial gain
|
1,104 | (1,244 | ) | |||||
|
Participant contributions
|
71 | 64 | ||||||
|
Benefit payments
|
(350 | ) | (337 | ) | ||||
|
Obligation at end of year
|
$ | 12,524 | $ | 10,550 | ||||
The following table provides disclosure of the net periodic benefit cost as of December 31 for the years indicated.
|
(In thousands)
|
2009
|
2008
|
||||||
|
Service cost
|
$ | 454 | $ | 442 | ||||
|
Interest cost
|
695 | 622 | ||||||
|
Amortization of transition obligation
|
101 | 101 | ||||||
|
Recognized prior service cost
|
257 | 299 | ||||||
|
Recognized net actuarial loss
|
81 | 93 | ||||||
|
Net periodic benefit cost
|
$ | 1,588 | $ | 1,557 | ||||
|
Major assumptions:
|
||||||||
|
Discount rate
|
6.00 | % | 6.00 | % | ||||
|
Retiree participation rate (Plan 1)
|
100.00 | 100.00 | ||||||
|
Retiree participation rate (Plan 2)
|
72.00 | 72.00 | ||||||
Assumed health care cost trend rates have a significant effect on the amounts reported for the health care plans. For measurement purposes, the rate of increase in pre-Medicare medical care claims costs was 9%, 8%, and 7% in 2010, 2011, and 2012, respectively, then grading down by .5% annually to 5% for 2016 and thereafter. For dental claims cost, it was 5% for 2010 and thereafter. A 1% change in the assumed health care cost trend rates would have the following incremental effects:
|
(In thousands)
|
1% Increase
|
1% Decrease
|
||||||
|
Effect on total of service and interest cost components of net periodic postretirement health care benefit cost
|
$ | 255 | $ | (197 | ) | |||
|
Effect on accumulated postretirement benefit obligation
|
2,311 | (1,840 | ) | |||||
The following table presents estimated future benefit payments in the period indicated.
|
(In thousands)
|
Postretirement Medical Benefits
|
||||
|
2010
|
$ | 437 | |||
|
2011
|
457 | ||||
|
2012
|
469 | ||||
|
2013
|
500 | ||||
|
2014
|
541 | ||||
| 2015-2019 | 3,133 | ||||
|
Total
|
$ | 5,537 | |||
Amounts recognized in accumulated other comprehensive income as of December 31, 2009 and 2008 are as follows.
|
(In thousands)
|
2009
|
2008
|
||||||
|
Unrecognized net actuarial loss
|
$ | 2,242 | $ | 1,218 | ||||
|
Unrecognized transition obligation
|
305 | 406 | ||||||
|
Unrecognized prior service cost
|
1,410 | 1,667 | ||||||
|
Total
|
$ | 3,957 | $ | 3,291 | ||||
87
The estimated costs that will be amortized from accumulated other comprehensive income into net periodic cost over the next fiscal year are as follows.
|
(In thousands)
|
Postretirement Medical Benefits
|
|||
|
Transition obligation
|
$ | 101 | ||
|
Unrecognized prior service cost
|
257 | |||
|
Total
|
$ | 358 | ||
The Company leases certain branch sites and certain banking equipment under various operating leases. All of the branch site leases have renewal options of varying lengths and terms. In addition, the Company leases certain data processing equipment that meets the capitalization criteria of ASC Topic 840, “Leases”, and has been recorded as an asset in premises and equipment and a liability in other long-term debt on the balance sheet. The following table presents estimated future minimum rental commitments under these leases for the period indicated.
|
(In thousands)
|
Operating Leases
|
Capital Lease
|
||||||
|
2010
|
$ | 639 | $ | 254 | ||||
|
2011
|
586 | 84 | ||||||
|
2012
|
467 | |||||||
|
2013
|
448 | |||||||
|
2014
|
433 | |||||||
|
Thereafter
|
3,461 | |||||||
|
Total
|
$ | 6,034 | 338 | |||||
|
Less: amount representing interest
|
6 | |||||||
|
Long-term obligation under capital lease
|
$ | 332 | ||||||
Rent expense was $753,000, $727,000, and $723,000 for 2009, 2008, and 2007, respectively.
The Company is a party to financial instruments with off-balance sheet risk in the normal course of business to meet the financing needs of its customers. The financial instruments include commitments to extend credit and standby letters of credit.
These financial instruments involve to varying degrees, elements of credit and interest rate risk in excess of the amount recognized in the consolidated balance sheets. The contract amounts of these instruments reflect the extent of involvement the Company has in particular classes of financial instruments.
Commitments to extend credit are agreements to lend to a customer as long as there is no violation of any condition established in the contract. Commitments generally have fixed expiration dates or other termination clauses and may require the payment of a fee. Since many of the commitments are expected to expire without being drawn upon, the total commitment amount does not necessarily represent future cash requirements. Total commitments to extend credit were $139,538,000 and $184,379,000 at December 31, 2009 and 2008, respectively. The Company evaluates each customer’s creditworthiness on a case-by-case basis. The amount of collateral obtained upon extension of credit, if deemed necessary by the Company, is based on management’s credit evaluation of the counter-party. Collateral held varies, but may include accounts receivable, marketable securities, inventory, premises and equipment, residential real estate, and income producing commercial properties.
Standby letters of credit are conditional commitments issued by the Company to guarantee the performance of a customer to a third party. Since many of the commitments are expected to expire without being drawn upon, the total commitment amount does not necessarily represent future cash requirements. The credit risk involved in issuing letters of credit is essentially the same as that received when extending credit to customers. The fair value of these instruments is not considered material for disclosure. The Company had $18,121,000 and $29,748,000 in irrevocable letters of credit outstanding at December 31, 2009 and 2008, respectively.
88
The contractual amount of financial instruments with off-balance sheet risk was as follows at year-end.
|
December 31,
|
2009
|
2008
|
||||||||||||||
|
(In thousands)
|
Fixed Rate
|
Variable Rate
|
Fixed Rate
|
Variable Rate
|
||||||||||||
|
Commitments to extend credit, including unused lines of credit
|
$ | 35,646 | $ | 103,892 | $ | 56,337 | $ | 128,042 | ||||||||
|
Standby letters of credit
|
3,812 | 14,309 | 5,751 | 23,997 | ||||||||||||
|
Total
|
$ | 39,458 | $ | 118,201 | $ | 62,088 | $ | 152,039 | ||||||||
The Company’s bank subsidiaries actively engage in lending, primarily in their home counties around central and northern Kentucky and adjacent areas. Collateral is received to support these loans as deemed necessary. The more significant categories of collateral include cash on deposit with the Company’s banks, marketable securities, income producing properties, commercial real estate, home mortgages, and consumer durables. Loans outstanding, commitments to make loans, and letters of credit range across a large number of industries and individuals. The obligations are significantly diverse and reflect no material concentration in one or more areas, other than most of the Company’s loans are in Kentucky and secured by real estate and thus significantly affected by changes in the Kentucky economy.
Loss contingencies, including claims and legal actions arising in the ordinary course of business, are recorded as liabilities when the likelihood of loss is probable and an amount or range of loss can be reasonably estimated. As of December 31, 2009, there were various pending legal actions and proceedings against the Company arising from the normal course of business and in which claims for damages are asserted. Management, after discussion with legal counsel, believes that these actions are without merit and that the ultimate liability resulting from these legal actions and proceedings, if any, will not have a material effect upon the consolidated financial statements of the Company.
Payment of dividends by the Company’s subsidiary banks is subject to certain regulatory restrictions as set forth in national and state banking laws and regulations. Generally, capital distributions are limited to undistributed net income for the current and prior two years, subject to the capital requirements described below. At December 31, 2009, two of the Company’s subsidiary banks are required to receive approval from their regulators in order to declare or pay a dividend to the Parent Company because their previous capital distributions in the form of dividends exceed net income for the current and prior two years. Capital distributions exceed retained profits in the three-year period mainly as the result of the goodwill impairment charge recorded during 2009. The Company’s remaining three subsidiary banks are prohibited from declaring or paying a dividend to the Parent Company without obtaining regulatory approval as a result of agreements that were entered into with their primary regulator during 2009. The payment of dividends by the Parent Company to its shareholders is also subject to approval as a result of regulatory agreement. These agreements, discussed in greater detail below, require three of the Company’s subsidiary banks to maintain capital ratios that exceed the regulatory established “well-capitalized” status.
The Company and its subsidiary banks are subject to various regulatory capital requirements administered by the federal banking agencies. Failure to meet minimum capital requirements will initiate certain mandatory and possibly additional discretionary actions by regulators that, if undertaken, could have a direct material effect on the Company’s financial statements. Under capital adequacy guidelines and the regulatory framework for prompt corrective action, the banks must meet specific capital guidelines that involve quantitative measures of the banks’ assets, liabilities, and certain off-balance sheet items as calculated under regulatory accounting practices. The Company and its subsidiary banks’ capital amounts and classification are also subject to qualitative judgments by the regulators about components, risk weightings, and other factors.
Quantitative measures established by regulation to ensure capital adequacy require the Company and its subsidiary banks to maintain minimum amounts and ratios (set forth in the tables below) of total and Tier I capital (as defined in the regulations) to risk-weighted assets (as defined), and of Tier I capital to average assets (as defined). As of December 31, 2009, the most recent notification from the FDIC categorized the banks as well-capitalized under the regulatory framework for prompt corrective action. To be categorized as well-capitalized, the banks must maintain minimum total risk-based, Tier I risk-based, and Tier I leverage ratios as set forth in the tables. There are no conditions or events since that notification that management believes have changed the institutions’ category. As noted below under the caption “Summary of Regulatory Agreements”, three of the Company’s subsidiary banks are required to maintain certain capital ratios that exceed the regulatory established well-capitalized status.
89
The capital amounts and ratios of the consolidated Company and the banks are presented in the following tables.
|
To Be Well-Capitalized
|
||||||||||||||||||||||||
|
For Capital
|
Under Prompt Corrective
|
|||||||||||||||||||||||
|
Actual
|
Adequacy Purposes
|
Action Provisions
|
||||||||||||||||||||||
|
December 31, 2009 (Dollars in thousands)
|
Amount
|
Ratio
|
Amount
|
Ratio
|
Amount
|
Ratio
|
||||||||||||||||||
|
Tier 1 Capital (to Risk-Weighted Assets)
|
||||||||||||||||||||||||
|
Consolidated
|
$ | 185,874 | 13.95 | % | $ | 53,310 | 4.00 | % | N/A | N/A | ||||||||||||||
|
Farmers Bank & Capital Trust Company
|
48,178 | 14.40 | 13,384 | 4.00 | $ | 20,075 | 6.00 | % | ||||||||||||||||
|
The Lawrenceburg Bank & Trust Company
|
13,589 | 10.24 | 5,308 | 4.00 | 7,961 | 6.00 | ||||||||||||||||||
|
First Citizens Bank
|
24,295 | 12.02 | 8,082 | 4.00 | 12,124 | 6.00 | ||||||||||||||||||
|
United Bank & Trust Company
|
56,376 | 12.49 | 18,051 | 4.00 | 27,077 | 6.00 | ||||||||||||||||||
|
Citizens Bank of Northern Kentucky, Inc.
|
18,443 | 9.70 | 7,606 | 4.00 | 11,049 | 6.00 | ||||||||||||||||||
|
Total Capital (to Risk-Weighted Assets)
|
||||||||||||||||||||||||
|
Consolidated
|
$ | 202,616 | 15.20 | % | $ | 106,620 | 8.00 | % | N/A | N/A | ||||||||||||||
|
Farmers Bank & Capital Trust Company
|
52,411 | 15.66 | 26,767 | 8.00 | $ | 33,459 | 10.00 | % | ||||||||||||||||
|
The Lawrenceburg Bank & Trust Company
|
15,253 | 11.50 | 10,615 | 8.00 | 13,269 | 10.00 | ||||||||||||||||||
|
First Citizens Bank
|
25,787 | 12.76 | 16,165 | 8.00 | 20,206 | 10.00 | ||||||||||||||||||
|
United Bank & Trust Company
|
62,051 | 13.75 | 36,103 | 8.00 | 45,128 | 10.00 | ||||||||||||||||||
|
Citizens Bank of Northern Kentucky, Inc.
|
20,829 | 10.95 | 15,213 | 8.00 | 19,016 | 10.00 | ||||||||||||||||||
|
Tier 1 Capital (to Average Assets)
|
||||||||||||||||||||||||
|
Consolidated
|
$ | 185,874 | 8.15 | % | $ | 91,186 | 4.00 | % | N/A | N/A | ||||||||||||||
|
Farmers Bank & Capital Trust Company
|
48,178 | 7.68 | 25,091 | 4.00 | $ | 31,364 | 5.00 | % | ||||||||||||||||
|
The Lawrenceburg Bank & Trust Company
|
13,589 | 5.46 | 9,958 | 4.00 | 12,447 | 5.00 | ||||||||||||||||||
|
First Citizens Bank
|
24,295 | 7.96 | 12,214 | 4.00 | 15,268 | 5.00 | ||||||||||||||||||
|
United Bank & Trust Company
|
56,376 | 7.35 | 30,673 | 4.00 | 38,342 | 5.00 | ||||||||||||||||||
|
Citizens Bank of Northern Kentucky, Inc.
|
18,443 | 6.23 | 11,839 | 4.00 | 14,799 | 5.00 | ||||||||||||||||||
|
To Be Well-Capitalized
|
||||||||||||||||||||||||
|
For Capital
|
Under Prompt Corrective
|
|||||||||||||||||||||||
|
Actual
|
Adequacy Purposes
|
Action Provisions
|
||||||||||||||||||||||
|
December 31, 2008 (Dollars in thousands)
|
Amount
|
Ratio
|
Amount
|
Ratio
|
Amount
|
Ratio
|
||||||||||||||||||
|
Tier 1 Capital (to Risk-Weighted Assets)
|
||||||||||||||||||||||||
|
Consolidated
|
$ | 155,317 | 11.32 | % | $ | 54,861 | 4.00 | % | N/A | N/A | ||||||||||||||
|
Farmers Bank & Capital Trust Co.
|
37,001 | 10.55 | 14,026 | 4.00 | $ | 21,039 | 6.00 | % | ||||||||||||||||
|
The Lawrenceburg Bank & Trust Co.
|
11,665 | 9.34 | 4,995 | 4.00 | 7,492 | 6.00 | ||||||||||||||||||
|
First Citizens Bank
|
19,885 | 10.38 | 7,661 | 4.00 | 11,491 | 6.00 | ||||||||||||||||||
|
United Bank & Trust Co.
|
47,910 | 9.66 | 19,833 | 4.00 | 29,750 | 6.00 | ||||||||||||||||||
|
Citizens Bank of Northern Kentucky
|
18,356 | 9.67 | 7,594 | 4.00 | 11,390 | 6.00 | ||||||||||||||||||
|
Total Capital (to Risk-Weighted Assets)
|
||||||||||||||||||||||||
|
Consolidated
|
$ | 172,145 | 12.55 | % | $ | 109,722 | 8.00 | % | N/A | N/A | ||||||||||||||
|
Farmers Bank & Capital Trust Co.
|
41,397 | 11.81 | 28,052 | 8.00 | $ | 35,066 | 10.00 | % | ||||||||||||||||
|
The Lawrenceburg Bank & Trust Co.
|
13,227 | 10.59 | 9,989 | 8.00 | 12,487 | 10.00 | ||||||||||||||||||
|
First Citizens Bank
|
21,448 | 11.20 | 15,321 | 8.00 | 19,151 | 10.00 | ||||||||||||||||||
|
United Bank & Trust Co.
|
54,074 | 10.91 | 39,667 | 8.00 | 49,583 | 10.00 | ||||||||||||||||||
|
Citizens Bank of Northern Kentucky
|
20,390 | 10.74 | 15,187 | 8.00 | 18,984 | 10.00 | ||||||||||||||||||
|
Tier 1 Capital (to Average Assets)
|
||||||||||||||||||||||||
|
Consolidated
|
$ | 155,317 | 7.37 | % | $ | 84,256 | 4.00 | % | N/A | N/A | ||||||||||||||
|
Farmers Bank & Capital Trust Co.
|
37,001 | 6.05 | 24,468 | 4.00 | $ | 30,585 | 5.00 | % | ||||||||||||||||
|
The Lawrenceburg Bank & Trust Co.
|
11,665 | 5.00 | 9,336 | 4.00 | 11,670 | 5.00 | ||||||||||||||||||
|
First Citizens Bank
|
19,885 | 7.49 | 10,618 | 4.00 | 13,272 | 5.00 | ||||||||||||||||||
|
United Bank & Trust Co.
|
47,910 | 6.37 | 30,081 | 4.00 | 37,601 | 5.00 | ||||||||||||||||||
|
Citizens Bank of Northern Kentucky
|
18,356 | 7.28 | 10,082 | 4.00 | 12,602 | 5.00 | ||||||||||||||||||
90
Summary of Regulatory Agreements
In the summer of 2009 the Federal Reserve Bank of St. Louis (“FRB St. Louis”) conducted an examination of the Parent Company. Primarily due to the regulatory actions and capital requirements at three of the Company’s subsidiary banks (as discussed below), the FRB St. Louis and Kentucky Department of Financial Institutions (“KDFI”) proposed the Company enter into a Memorandum of Understanding. The Company’s board approved our entry into the Memorandum of Understanding at a regular board meeting on October 26, 2009. Pursuant to the Memorandum of Understanding, the Company agreed that it would develop an acceptable capital plan to ensure that the consolidated organization remains well-capitalized and each of its subsidiary banks meet the capital requirements imposed by their regulator as described below. The Company also agreed to reduce its next quarterly common stock dividend from $.25 per share down to $.10 per share and not make interest payments on the Company’s trust preferred securities or dividends on its common or preferred stock without prior approval from FRB St. Louis. The Company received approval for both its regularly scheduled trust preferred payments and dividends on its Series A preferred stock through the end of 2009, as well as its $.10 per share dividend on its common stock that was declared on October 26, 2009. The Company also received approval for its regularly scheduled trust preferred interest payment through the first quarter of 2010 and dividends on its Series A preferred stock that was paid on February 16, 2010 (the last time such approval was requested by the Company). The Company determined to forego the dividend that has historically been declared on its common stock in the first quarter of 2010 in an effort to conserve capital.
While each of the Company’s subsidiary banks was well-capitalized as of December 31, 2009, some of their capital levels have decreased over the past eighteen months as a result of the economic downturn that began in 2008. As a result of the turmoil in the banking markets and continued difficulty many banks are experiencing with their loan portfolios, bank regulatory agencies are increasingly requiring banks to maintain higher capital reserves as a cushion for dealing with any further deterioration in their loan portfolios. The agencies that regulate the Company’s banks have determined, in the wake of examinations, that the three Company subsidiaries identified below may require future capital infusions in order to satisfy higher regulatory capital ratios.
Farmers Bank. Farmers Bank was the subject of a regularly scheduled examination by the KDFI which was conducted in mid-September 2009. As a result of this examination, the KDFI and FRB St. Louis have entered into a Memorandum of Understanding with Farmers Bank. The Memorandum of Understanding, among other things, requires that Farmers Bank obtain written consent prior to declaring or paying the Parent Company a cash dividend and to achieve and maintain increasing Leverage Ratios of 7.5%, 7.75%, and 8.0% by December 31, 2009, March 31, 2010, and June 30, 2010, respectively. On October 6, 2009 the Parent Company injected from its reserves $11 million in capital into Farmers Bank. Farmers Bank has further agreed that if at the time of the proposed merger of Lawrenceburg Bank into Farmers Bank, which is anticipated to occur during the second quarter of 2010, the combined bank has a Leverage Ratio of less than 8.0% and the Parent Company has obtained additional capital by that time, the Parent Company will inject additional capital to raise the Leverage Ratio to 8.0%. At December 31, 2009 Farmers Bank had a Tier 1 Leverage Ratio of 7.68% and a Total Risk-Based Ratio of 15.66%.
Lawrenceburg Bank. As a result of an examination conducted in March 2009, on May 15, 2009, Lawrenceburg Bank entered into a Memorandum of Understanding with the FRB St. Louis and the KDFI. The Memorandum of Understanding, among other things, requires Lawrenceburg Bank to achieve and maintain a Leverage Ratio of at least 8%. On October 23, 2009, the Company announced that it is in the preliminary stages of merging Lawrenceburg Bank into Farmers Bank. The Company applied for regulatory approval for the merger in the first quarter of 2010 with an anticipated effective date for the merger in the second quarter of 2010. In light of the proposed merger of Lawrenceburg Bank into Farmers Bank, the KDFI and FRB St. Louis have agreed that at this time no additional capital needs to be infused in Lawrenceburg Bank. At the time of the planned merger, however, the Company may be required to inject additional capital into Farmers Bank as a result of the merger depending on the operating results of Farmers Bank and Lawrenceburg Bank in the period leading up to the time of the planned merger. At December 31, 2009 Lawrenceburg Bank had a Tier 1 Leverage Ratio of 5.46% and a Total Risk-Based Ratio of 11.50%
United Bank. As a result of an examination conducted in late July and early August of 2009, the FDIC proposed United Bank enter into a Cease and Desist Order (“Order”) primarily as a result of its level of non-performing assets. United Bank has negotiated certain content and requirements of the proposed Order and, as a result, voluntarily consented to the Order. Among its requirements, the Order requires United Bank to achieve (i) leverage ratios of 7.5%, 7.75%, and 8.0% by December 31, 2009, March 31, 2010, and June 30, 2010, respectively, and (ii) a Total Risk-Based Ratio of 12% immediately. On October 6, 2009 the Parent Company injected $10.5 million from its reserves into United Bank. At December 31, 2009 United Bank had a Tier 1 Leverage Ratio of 7.35% and a Total Risk-Based Ratio of 13.75%. The Leverage Ratio of 7.35% was below the required 7.5% amount at year-end 2009 as stated in the Order; however, the Leverage Ratio was 7.68% after adjusting for the year-end 2009 goodwill impairment charge that reduced total assets at United Bank. The reduction in assets attributed to goodwill did not immediately impact average assets (the denominator in calculating the Leverage Ratio). The impact of the goodwill charge will positively impact the Leverage Ratio beginning in 2010.
The Company may fund any additional external capital requirements of Farmers Bank, United Bank or any of its other banking subsidiaries from future public or private sales of securities at an appropriate time or from existing resources of the Company.
91
Fair value is the price that would be received to sell an asset or paid to transfer a liability (exit price) in the principal or most advantageous market for the asset or liability in an orderly transaction between market participants at the measurement date. Accounting standards include a fair value hierarchy which requires an entity to maximize the use of observable inputs and minimize the use of unobservable inputs when measuring fair value. There are three levels of inputs that may be used to measure fair value:
|
|
Level 1:
|
Quoted prices for identical assets or liabilities in active markets that the entity has the ability to access at the measurement date.
|
|
|
Level 2:
|
Significant other observable inputs other than Level 1 prices such as quoted prices for similar assets or liabilities; quoted prices in markets that are not active; or other inputs that are observable or can be corroborated by observable market data.
|
|
|
Level 3:
|
Significant unobservable inputs that reflect a reporting entity’s own assumptions about the assumptions that market participants would use in pricing the asset or liability.
|
Following is a description of the valuation method used for instruments measured at fair value on a recurring basis. For this disclosure, the Company only has available for sale investment securities that meet the requirement.
Available for sale investment securities
Valued primarily by independent third party pricing services under the market valuation approach that include, but not limited to, the following inputs:
|
|
·
|
U.S. Treasury securities are priced using dealer quotes from active market makers and real-time trading systems.
|
|
|
·
|
Marketable equity securities are priced utilizing real-time data feeds from active market exchanges for identical securities.
|
|
|
·
|
Government-sponsored agency debt securities, obligations of states and political subdivisions, corporate bonds, and other similar investment securities are priced with available market information through processes using benchmark yields, matrix pricing, prepayment speeds, cash flows, live trading data, and market spreads sourced from new issues, dealer quotes, and trade prices, among others sources.
|
|
|
·
|
Investments in the Federal Reserve Bank, Federal Home Loan Bank, and other similar stock totaling $9.1 million and $8.9 million at December 31, 2009 and 2008, respectively, is carried at cost and not included in the table below, as they are outside the scope of ASC Topic 820.
|
92
Available for sale investment securities are the Company’s only balance sheet item that meets the disclosure requirements for instruments measured at fair value on a recurring basis. Disclosures as of December 31, 2009 and 2008 are as follows.
|
Fair Value Measurements Using
|
||||||||||||||||
|
(In thousands)
Available For Sale Investment Securities
|
Fair Value
|
Quoted Prices in Active Markets for Identical Assets
(Level 1)
|
Significant Other Observable Inputs
(Level 2)
|
Significant Unobservable Inputs
(Level 3)
|
||||||||||||
|
December 31, 2009
|
||||||||||||||||
|
U.S. Treasury securities
|
$ | 3,002 | $ | 3,002 | ||||||||||||
|
Obligations of U.S. government-sponsored entities
|
90,752 | $ | 90,752 | |||||||||||||
|
Obligations of states and political subdivisions
|
108,958 | 108,958 | ||||||||||||||
|
Mortgage-backed securities – residential
|
325,519 | 325,519 | ||||||||||||||
|
Money market mutual funds
|
910 | 910 | ||||||||||||||
|
Corporate debt securities
|
18,732 | 18,732 | ||||||||||||||
|
Total
|
$ | 547,873 | $ | 3,002 | $ | 544,871 | $ | 0 | ||||||||
|
December 31, 2008
|
||||||||||||||||
|
U.S. Treasury securities
|
$ | 10,256 | $ | 10,256 | ||||||||||||
|
Obligations of U.S. government-sponsored entities
|
34,567 | $ | 34,567 | |||||||||||||
|
Obligations of states and political subdivisions
|
90,838 | 90,838 | ||||||||||||||
|
Mortgage-backed securities – residential
|
375,327 | 375,327 | ||||||||||||||
|
Money market mutual funds
|
374 | 374 | ||||||||||||||
|
Corporate debt securities
|
13,991 | 13,991 | ||||||||||||||
|
Total
|
$ | 525,353 | $ | 10,256 | $ | 515,097 | $ | 0 | ||||||||
The Company is required to measure and disclose certain other assets and liabilities at fair value on a nonrecurring basis to comply with GAAP, primarily to adjust assets to fair value under the application of lower of cost or fair value accounting. Disclosures may also include financial assets and liabilities acquired in a business combination, which are initially measured at fair value and evaluated periodically for impairment.
The Company’s disclosure about assets and liabilities measured at fair value on a nonrecurring basis consists of impaired loans and other real estate owned (“OREO”). Loans are considered impaired when full payment under the contractual terms is not expected. In general, impaired loans are also on nonaccrual status. Impaired loans are measured at the present value of expected future cash flows discounted at the loan’s effective interest rate, at the loan’s observable market price, or at the fair value of the collateral based on recent appraisals if the loan is collateral dependent. If the value of an impaired loan is less than the unpaid balance, the difference is credited to the allowance for loan losses with a corresponding charge to provision for loan losses. Loan losses are charged against the allowance for loan losses when management believes the uncollectibility of a loan is confirmed.
Impaired loans were $108 million and $48.4 million at year-end 2009 and 2008, respectively. Impaired loans in the amount of $60.7 million were written down to their estimated fair value of $55.0 million in 2009. For 2008, impaired loans of $43.7 million were written down to their estimated fair value of $40.7 million. The provision for loan losses in 2009 and 2008 includes $5.8 million and $3.0 million, respectively, related to impaired loans. The fair value of impaired loans with specific allocations of the allowance for loan losses is measured at fair value based on either the present value of expected future cash flows discounted at the loan’s effective interest rate or at the fair value of the underlying collateral based on recent appraisals. These appraisals may utilize a single valuation approach or a combination of approaches including comparable sales and the income approach. Appraisers take absorption rates into consideration and adjustments are routinely made in the appraisal process to identify differences between the comparable sales and income data available. Such adjustments are usually significant and typically result in a Level 3 classification of the inputs for determining fair value.
OREO includes properties acquired by the Company through actual loan foreclosures and is carried at the lower of cost or fair value less estimated costs to sell. Fair value of OREO is generally based on third party appraisals of the property that includes comparable sales data and is considered as Level 3 inputs. If the carrying amount of the OREO exceeds fair value less estimated costs to sell, an impairment loss is recorded through expense. At December 31, 2009 OREO was $31.2 million compared to $14.4 million at year-end 2008. During the year 2009, OREO in the amount of $12.0 million was written down to its estimated fair value of $11.1 million. In 2008, OREO in the amount of $748 thousand was written down to its estimated fair value of $631 thousand. Impairment charges on OREO included in earnings were $877 thousand and $117 thousand for 2009 and 2008, respectively. In addition to the impairment charges, net losses included in earnings from the sale of OREO were $366 thousand for 2009. In 2008, the Company recorded net gains on the sale of OREO of $149 thousand.
93
The following table represents assets measured at fair value on a nonrecurring basis and related impairment charges recorded in earnings for the year indicated.
|
Fair Value Measurements Using
|
||||||||||||||
|
(In thousands)
Description
|
Fair Value
|
Quoted Prices in Active Markets for Identical Assets
(Level 1)
|
Significant Other Observable Inputs
(Level 2)
|
Significant Unobservable Inputs
(Level 3)
|
Impairment Charge
|
|||||||||
|
December 31, 2009
|
||||||||||||||
|
Impaired Loans
|
$ | 54,961 | $ | 54,961 | $ | 5,762 | ||||||||
|
OREO
|
11,140 | 11,140 | 877 | |||||||||||
|
Total
|
$ | 66,101 | $ | 66,101 | $ | 6,639 | ||||||||
|
December 31, 2008
|
||||||||||||||
|
Impaired Loans
|
$ | 40,708 | $ | 40,708 | $ | 2,962 | ||||||||
|
OREO
|
631 | 631 | 117 | |||||||||||
|
Total
|
$ | 41,339 | $ | 41,339 | $ | 3,079 | ||||||||
Fair Value of Financial Instruments
The table that follows represents the estimated fair values of the Company’s financial instruments made in accordance with the requirements of ASC 825, “Financial Instruments”. It excludes fair values presented elsewhere. ASC 825 requires disclosure of fair value information about financial instruments, whether or not recognized in the balance sheet for which it is practicable to estimate that value. The estimated fair value amounts have been determined by the Company using available market information and present value or other valuation techniques. These derived fair values are subjective in nature, involve uncertainties and matters of significant judgment and, therefore, cannot be determined with precision. ASC 825 excludes certain financial instruments and all nonfinancial instruments from the disclosure requirements. Accordingly, the aggregate fair value amounts presented are not intended to represent the underlying value of the Company.
The following methods and assumptions were used to estimate the fair value of each class of financial instruments not presented elsewhere for which it is practicable to estimate that value.
Cash and Cash Equivalents, Accrued Interest Receivable, and Accrued Interest Payable
The carrying amount is a reasonable estimate of fair value.
Investment Securities Held to Maturity
Fair value equals quoted market price, if available. If a quoted market price is not available, fair value is estimated using quoted market prices for similar securities.
FHLB and Similar Stock
Due to restrictions placed on its transferability, it is not practicable to determine fair value.
Loans
The fair value of loans is estimated by discounting the future cash flows using current discount rates at which similar loans would be made to borrowers with similar credit ratings and for the same remaining maturities.
Deposit Liabilities
The fair value of demand deposits, savings accounts, and certain money market deposits is the amount payable on demand at the reporting date and fair value approximates carrying value. The fair value of fixed maturity certificates of deposit is estimated by discounting the future cash flows using the rates currently offered for certificates of deposit with similar remaining maturities.
Federal Funds Purchased and other Short-term Borrowings
The carrying amount is the estimated fair value for these borrowings that reprice frequently in the near term.
Securities Sold Under Agreements to Repurchase, Subordinated Notes Payable, and Other Long-term Borrowings
The fair value of these borrowings is estimated based on rates currently available for debt with similar terms and remaining maturities.
94
Commitments to Extend Credit and Standby Letters of Credit
Pricing of these financial instruments is based on the credit quality and relationship, fees, interest rates, probability of funding, compensating balance, and other covenants or requirements. Loan commitments generally have fixed expiration dates, variable interest rates and contain termination and other clauses that provide for relief from funding in the event there is a significant deterioration in the credit quality of the customer. Many loan commitments are expected to, and typically do, expire without being drawn upon. The rates and terms of the Company’s commitments to lend and standby letters of credit are competitive with others in the various markets in which the Company operates. There are no unamortized fees relating to these financial instruments, as such the carrying value and fair value are both zero.
The carrying amounts and estimated fair values of the Company’s financial instruments are as follows for the periods indicated.
|
December 31,
|
2009
|
2008
|
||||||||||||||
|
Carrying
|
Fair
|
Carrying
|
Fair
|
|||||||||||||
|
(In thousands)
|
Amount
|
Value
|
Amount
|
Value
|
||||||||||||
|
Assets
|
||||||||||||||||
|
Cash and cash equivalents
|
$ | 218,336 | $ | 218,336 | $ | 190,775 | $ | 190,775 | ||||||||
|
Investment securities:
|
||||||||||||||||
|
Available for sale
|
537,873 | 547,873 | 517,756 | 525,353 | ||||||||||||
|
FHLB and similar stock
|
9,148 | N/A | 8,942 | N/A | ||||||||||||
|
Held to maturity
|
975 | 922 | 1,814 | 1,667 | ||||||||||||
|
Loans, net
|
1,248,578 | 1,246,151 | 1,295,752 | 1,309,604 | ||||||||||||
|
Accrued interest receivable
|
9,381 | 9,381 | 12,168 | 12,168 | ||||||||||||
|
Liabilities
|
||||||||||||||||
|
Deposits
|
1,633,433 | 1,640,933 | 1,594,115 | 1,601,567 | ||||||||||||
|
Federal funds purchased and other short-term borrowings
|
47,215 | 47,215 | 77,474 | 77,474 | ||||||||||||
|
Securities sold under agreements to repurchase and other long-term borrowings
|
267,962 | 285,093 | 286,691 | 311,259 | ||||||||||||
|
Subordinated notes payable to unconsolidated trusts
|
48,970 | 28,528 | 48,970 | 18,518 | ||||||||||||
|
Accrued interest payable
|
4,685 | 4,685 | 5,811 | 5,811 | ||||||||||||
Condensed Balance Sheets
|
December 31, (In thousands)
|
2009
|
2008
|
||||||
|
Assets
|
||||||||
|
Cash on deposit with subsidiaries
|
$ | 7,554 | $ | 4,302 | ||||
|
Investment in subsidiaries
|
180,367 | 206,843 | ||||||
|
Other assets
|
11,392 | 11,298 | ||||||
|
Total assets
|
$ | 199,313 | $ | 222,443 | ||||
|
Liabilities
|
||||||||
|
Dividends payable
|
$ | 925 | $ | 2,427 | ||||
|
Subordinated notes payable to unconsolidated trusts
|
48,970 | 48,970 | ||||||
|
Other liabilities
|
2,191 | 2,750 | ||||||
|
Total liabilities
|
52,086 | 54,147 | ||||||
|
Shareholders’ Equity
|
||||||||
|
Preferred stock
|
28,348 | |||||||
|
Common stock
|
922 | 920 | ||||||
|
Capital surplus
|
50,476 | 48,222 | ||||||
|
Retained earnings
|
63,617 | 116,419 | ||||||
|
Accumulated other comprehensive income
|
3,864 | 2,735 | ||||||
|
Total shareholders’ equity
|
147,227 | 168,296 | ||||||
|
Total liabilities and shareholders’ equity
|
$ | 199,313 | $ | 222,443 | ||||
95
Condensed Statements of Operations
|
Years Ended December 31, (In thousands)
|
2009
|
2008
|
2007
|
|||||||||
|
Income
|
||||||||||||
|
Dividends from subsidiaries
|
$ | 7,465 | $ | 9,566 | $ | 22,616 | ||||||
|
Interest
|
53 | 60 | 64 | |||||||||
|
Other noninterest income
|
3,457 | 3,217 | 3,170 | |||||||||
|
Total income
|
10,975 | 12,843 | 25,850 | |||||||||
|
Expense
|
||||||||||||
|
Interest expense-subordinated notes payable to unconsolidated trusts
|
2,178 | 2,865 | 2,394 | |||||||||
|
Interest expense on other borrowed funds
|
20 | |||||||||||
|
Noninterest expense
|
4,097 | 3,986 | 4,391 | |||||||||
|
Total expense
|
6,275 | 6,851 | 6,805 | |||||||||
|
Income before income tax benefit and equity in undistributed income of subsidiaries
|
4,700 | 5,992 | 19,045 | |||||||||
|
Income tax benefit
|
(949 | ) | (1,189 | ) | (1,375 | ) | ||||||
|
Income before equity in undistributed income of subsidiaries
|
5,649 | 7,181 | 20,420 | |||||||||
|
Equity in undistributed income of subsidiaries
|
(50,391 | ) | (2,786 | ) | (4,793 | ) | ||||||
|
Net (loss) income
|
$ | (44,742 | ) | $ | 4,395 | $ | 15,627 | |||||
Condensed Statements of Cash Flows
|
Years Ended December 31, (In thousands)
|
2009
|
2008
|
2007
|
|||||||||
|
Cash Flows From Operating Activities
|
||||||||||||
|
Net (loss) income
|
$ | (44,742 | ) | $ | 4,395 | $ | 15,627 | |||||
|
Adjustments to reconcile net income to net cash provided by operating activities:
|
||||||||||||
|
Equity in undistributed income of subsidiaries
|
50,391 | 2,786 | 4,793 | |||||||||
|
Noncash stock option expense and employee stock purchase plan expense
|
5 | 5 | 13 | |||||||||
|
Change in other assets and liabilities, net
|
(1,043 | ) | (891 | ) | (3,767 | ) | ||||||
|
Deferred income tax expense (benefit)
|
253 | (67 | ) | 555 | ||||||||
|
Net cash provided by operating activities
|
4,864 | 6,228 | 17,221 | |||||||||
|
Cash Flows From Investing Activities
|
||||||||||||
|
Proceeds from sale of available for sale investment securities
|
1,000 | |||||||||||
|
Purchase of available for sale investment securities
|
(1,000 | ) | ||||||||||
|
Investment in unconsolidated trusts
|
(629 | ) | ||||||||||
|
Investment in nonbank subsidiaries
|
(100 | ) | (4,051 | ) | ||||||||
|
Investment in bank subsidiaries
|
(22,500 | ) | (2,362 | ) | (8,000 | ) | ||||||
|
Purchase price refinements of previous acquisitions
|
50 | |||||||||||
|
Net cash used in investing activities
|
(22,600 | ) | (6,413 | ) | (8,579 | ) | ||||||
|
Cash Flows From Financing Activities
|
||||||||||||
|
Proceeds from short-term borrowings
|
2,500 | |||||||||||
|
Repayment of short-term borrowings
|
(2,500 | ) | ||||||||||
|
Proceeds from issuance of preferred stock, net of issue costs
|
29,961 | |||||||||||
|
Dividends paid, common and preferred stock
|
(9,222 | ) | (9,720 | ) | (11,118 | ) | ||||||
|
Purchase of common stock
|
(1,049 | ) | (18,649 | ) | ||||||||
|
Shares issued under Employee Stock Purchase Plan
|
249 | 252 | 254 | |||||||||
|
Stock options exercised
|
30 | 1,546 | ||||||||||
|
Proceeds from long-term debt issued to unconsolidated trusts
|
23,196 | |||||||||||
|
Net cash provided by (used in) financing activities
|
20,988 | (10,487 | ) | (4,771 | ) | |||||||
|
Net increase (decrease) in cash and cash equivalents
|
3,252 | (10,672 | ) | 3,871 | ||||||||
|
Cash and cash equivalents at beginning of year
|
4,302 | 14,974 | 11,103 | |||||||||
|
Cash and cash equivalents at end of year
|
$ | 7,554 | $ | 4,302 | $ | 14,974 | ||||||
96
|
(In thousands, except per share data)
|
||||||||||||||||
|
Quarters Ended 2009
|
March 31
|
June 30
|
Sept. 30
|
Dec. 31
|
||||||||||||
|
Interest income
|
$ | 26,329 | $ | 25,479 | $ | 25,381 | $ | 23,721 | ||||||||
|
Interest expense
|
12,090 | 12,076 | 11,879 | 11,020 | ||||||||||||
|
Net interest income
|
14,239 | 13,403 | 13,502 | 12,701 | ||||||||||||
|
Provision for loan losses
|
1,676 | 5,940 | 6,653 | 6,499 | ||||||||||||
|
Net interest income after provision for loan losses
|
12,563 | 7,463 | 6,849 | 6,202 | ||||||||||||
|
Noninterest income
|
6,725 | 7,825 | 6,528 | 7,091 | ||||||||||||
|
Noninterest expense1
|
15,112 | 16,163 | 15,299 | 68,567 | ||||||||||||
|
Income (loss) before income taxes
|
4,176 | (875 | ) | (1,922 | ) | (55,274 | ) | |||||||||
|
Income tax expense (benefit)
|
871 | (74 | ) | (1,748 | ) | (8,202 | ) | |||||||||
|
Net income (loss)2
|
3,305 | (801 | ) | (174 | ) | (47,072 | ) | |||||||||
|
Dividends and accretion on preferred shares
|
(414 | ) | (462 | ) | (462 | ) | (464 | ) | ||||||||
|
Net income available to common shareholders
|
$ | 2,891 | $ | (1,263 | ) | $ | (636 | ) | $ | (47,536 | ) | |||||
|
Net income (loss) per common share – basic and diluted
|
$ | .39 | $ | (.17 | ) | $ | (.09 | ) | $ | (6.45 | ) | |||||
|
Weighted average shares outstanding, basic and diluted
|
7,357 | 7,363 | 7,367 | 7,371 | ||||||||||||
|
|
1Noninterest expense for the quarter ended December 31, 2009 includes a one-time, non-cash goodwill impairment charge of $52,408.
|
|
|
2The net loss for the quarters ended June 30, 2009 and September 30, 2009 is due mainly to an increase in the provision for loans losses which is attributable to higher levels of nonperforming assets, primarily nonaccrual loans secured by real estate developments.
|
|
(In thousands, except per share data)
|
||||||||||||||||
|
Quarters Ended 2008
|
March 31
|
June 30
|
Sept. 301
|
Dec. 31
|
||||||||||||
|
Interest income
|
$ | 30,035 | $ | 29,037 | $ | 27,859 | $ | 26,989 | ||||||||
|
Interest expense
|
15,280 | 13,686 | 13,085 | 13,079 | ||||||||||||
|
Net interest income
|
14,755 | 15,351 | 14,774 | 13,910 | ||||||||||||
|
Provision for loan losses
|
1,102 | 483 | 1,780 | 1,956 | ||||||||||||
|
Net interest income after provision for loan losses
|
13,653 | 14,868 | 12,994 | 11,954 | ||||||||||||
|
Noninterest income
|
6,387 | 6,191 | (7,865 | ) | 5,097 | |||||||||||
|
Noninterest expense
|
14,380 | 14,392 | 14,879 | 16,447 | ||||||||||||
|
Income before income taxes
|
5,660 | 6,667 | (9,750 | ) | 604 | |||||||||||
|
Income tax expense
|
1,284 | 1,767 | (2,865 | ) | (1,400 | ) | ||||||||||
|
Net income
|
$ | 4,376 | $ | 4,900 | $ | (6,885 | ) | $ | 2,004 | |||||||
|
Net income per common share, basic and diluted
|
.59 | .67 | (.94 | ) | .27 | |||||||||||
|
Weighted average shares outstanding, basic and diluted
|
7,374 | 7,350 | 7,349 | 7,354 | ||||||||||||
|
|
1The reduction in noninterest income and net income during the third quarter is mainly attributed to a $14.0 million non-cash other-than-temporary impairment write-down related to the Company’s investments in preferred stocks issued by Federal Home Loan Mortgage Corporation and Federal National Mortgage Association.
|
Goodwill
The change in the balance for goodwill is as follows.
|
(In thousands)
|
2009
|
2008
|
2007
|
|||||||||
|
Beginning of year
|
$ | 52,408 | $ | 52,408 | $ | 42,822 | ||||||
|
Purchase price refinements of prior acquisitions
|
(77 | ) | ||||||||||
|
Acquired goodwill
|
9,663 | |||||||||||
|
Impairment losses
|
(52,408 | ) | ||||||||||
|
End of year
|
$ | 0 | $ | 52,408 | $ | 52,408 | ||||||
The Company performed its annual goodwill impairment evaluation during the fourth quarter of 2009. Goodwill impairment exists when a Company’s reporting unit’s carrying value of goodwill exceeds its fair value. The Company uses a two-step impairment test whereby Step 1 is to determine if potential impairment exists by comparing the estimated fair value of the Company’s single reporting unit to its
97
carrying value, including goodwill. The second step of the impairment test is necessary only if the carrying value of the reporting unit exceeds its estimated fair value. Step 2 measures the amount of any impairment loss. This step compares the implied fair value of the Company’s goodwill with its carrying amount. If the carrying amount of goodwill exceeds its implied fair value, an impairment loss is recorded in an amount equal to that excess. The loss recognized cannot exceed the carrying amount of goodwill.
The Company’s common share price declined $14.20 or 58.1% on December 31, 2009 compared to December 31, 2008. The decrease was $8.75 or 35.8% during the first quarter before rebounding to $25.17 at the end of the second quarter, an increase of $9.50 or 60.6% for the quarter. The share price further declined to $17.88 and $10.22 at the end of the third and fourth quarters of 2009, respectively. The stock price and market capitalization of the Company as well as other peer banks and financial institutions have suffered as a result of continuing economic weaknesses and heightened market concern surrounding the credit risk and capital positions of financial institutions. The Company concluded during the fourth quarter of 2009 that these events would more likely than not reduce the fair value of its single reporting unit below the carrying value.
|
December 31,
2009
|
September 30,
2009
|
June 30,
2009
|
March 31,
2009
|
December 31,
2008
|
||||||||||||||||
|
Stock price at end of period
|
$ | 10.22 | $ | 17.88 | $ | 25.17 | $ | 15.67 | $ | 24.42 | ||||||||||
|
Weighted average closing stock price for quarter
|
11.64 | 20.23 | 21.36 | 17.80 | 22.07 | |||||||||||||||
|
Book value per common share
|
16.11 | 23.13 | 22.60 | 23.08 | 22.87 | |||||||||||||||
The Company engaged an independent third party to assist with its goodwill impairment analysis. After performing Step 2 of its impairment analyses the Company determined that the implied value of its goodwill was significantly less than the carrying value resulting in a one-time, non-cash pretax impairment charge of $52,408,000 or 100% of its previous carrying value. The impairment charge was recorded in noninterest expense and did not negatively impact the Company’s or its subsidiary banks’ regulatory or tangible capital ratios.
The implied fair value of goodwill under Step 2 of the impairment analysis is determined in the same manner as the amount of goodwill recognized in a business combination. Goodwill recognized in a business combination represents the excess of the fair value of a business acquired over the amounts assigned to all of the assets acquired (including intangible assets such as for core deposits and customer lists) and liabilities assumed. The fair value of assets and liabilities reflect assumptions as to market conditions at the date of impairment testing and significant judgment is applied. Changes to these assumptions could have a material impact on the determination of the implied fair value of goodwill at the date of impairment testing.
In determining the fair value of its single reporting unit, the Company uses a combination of valuation methods including various market approaches using price multiples as well as an income approach utilizing a discounted cash flow analysis. The Company evaluates the results obtained under each valuation methodology to identify and understand the key components and to determine that the results are reasonable and appropriate under the circumstances.
Under Step 1, the Company used four methods to determine the estimated fair value of its single reporting unit. The four different methods include an income approach and three market approaches. The income approach was based on discounted cash flows that required consideration of the cost of capital, residual value, and operating forecasts. An internal five-year forecast of the Company’s balance sheet and income statement activity was developed by considering key business drivers such as anticipated loan and deposit growth. The estimated cash flows over the five-year forecast period were discounted based on the Capital Asset Pricing Model (“CAPM”). The inputs used in the CAPM include a risk-free interest rate, market risk premium, beta value, and a Company-specific risk factor. The Company’s residual value at the end of the five-year discrete forecast period was calculated using the formula for a growing, perpetual annuity.
For the market approach, the Company used three different methods: 1) the Guideline Public Company Method 2) the Mergers and Acquisitions Method and 3) the Company’s Stock Price Method. Under the Guideline Public Company Method, two groups of comparable peer companies were selected: Kentucky banks and regional banks. A book value multiple representing the lower quartile of the comparable companies was used in this analysis with a control premium of 24% added. The Mergers and Acquisitions Method consisted of examining transactions occurring between January 1, 2005 and November 30, 2009 involving commercial banks incorporated in Kentucky. Since there were no merger transactions meeting the criteria (commercial banks incorporated in Kentucky) between November 2008 and November 2009, the valuation under this approach used a price to book multiple representing data from the lower quartile of the transactions examined. The Company Stock Price Method estimates the Company’s market capitalization based on the closing stock price of the Company’s common stock on the valuation date. The number of outstanding common shares multiplied by the closing stock price on the valuation date plus an added control premium of 24% resulted in the total estimated market capitalization of the Company.
The results of the income and market valuation approaches were weighted as follows to arrive at the final calculation of fair value: Guideline Public Company Method 60%; Company Stock Price Method 20%; and income approach (discounted cash flows) 20%. There was no weight given to the Mergers and Acquisitions Method because the most recent comparable transaction was approximately one year
98
old and the mergers and actual acquisition multiples would likely be much lower due to the recent banking crisis. The final calculation of fair value by Step 1 indicated that the carrying value of the Company exceeded its fair value.
Since the carrying value of the Company exceeded its fair value, Step 2 of impairment testing was completed. To determine the implied fair value of goodwill, the fair value determined under Step 1 was allocated to all assets and liabilities of the single reporting unit including any recognized or unrecognized intangible assets. The allocation was done as if the Company was acquired in a business combination and the fair value of the Company was the price paid to acquire the Company. This allocation process is only performed for purposes of testing goodwill for impairment. The carrying values of recognized assets and liabilities (other than goodwill) were not adjusted nor were any new intangible assets recorded. Key valuations in Step 2 were the assessment of core deposit intangibles, the Commonwealth of Kentucky Relationship, the fair value of the loan portfolio, and the fair value of outstanding time deposits and long-term borrowings.
Core deposits were valued using the Cost Savings Method, which is a form of the Income approach and Cost approach, using a 15% discount rate. The Company’s relationship with the Commonwealth of Kentucky was valued using an excess earnings method. The excess earnings method includes the determination of the earnings expected to be generated, estimated attrition rate, and risk associated with the future earnings stream among other assumptions. The Company concluded through this evaluation that its existing core deposit intangible asset was not impaired.
The valuation of the loan portfolio included a discounted cash flow analysis. This analysis first included separating the portfolio into multiple tranches based on risk characteristics and repayment methods. The average time to maturity of the portfolio by tranche was determined and the respective estimated cash flows were discounted using current market interest rates.
Time deposits were valued using a discounted cash flow analysis that considered the estimated remaining time to maturity, the most likely distribution of cash payments, and applying a current market interest rate to the cash flows based on the estimated maturity structure. Long-term borrowings were also valued using a discounted cash flow analysis. This analysis considered the estimated remaining time to maturity, interest rate risk, the amount and timing of estimated cash flows, current market rates, and the presence of any call or put features.
The computations included in the impairment analysis require the Company to make significant estimates and assumptions. Critical assumptions that are used as part of these evaluations include developing cash flow projections and future earnings, selecting appropriate discount rates, systemic and nonsystemic risk factors, selecting relevant market comparables, incorporating general economic and market conditions, repayment assumptions, selecting an appropriate control premium, and projecting market growth.
Acquired Intangible Assets
Acquired core deposit and customer relationship intangible assets were as follows as of December 31 for the years indicated.
|
2009
|
2008
|
|||||||||||||||
|
Amortized Intangible Assets
(In thousands)
|
Gross Carrying
Amount
|
Accumulated
Amortization
|
Gross
Carrying Amount
|
Accumulated
Amortization
|
||||||||||||
|
Core deposit intangibles
|
$ | 12,765 | $ | 8,916 | $ | 12,765 | $ | 7,361 | ||||||||
|
Other customer relationship intangibles
|
3,689 | 2,549 | 3,689 | 2,152 | ||||||||||||
|
Total
|
$ | 16,454 | $ | 11,465 | $ | 16,454 | $ | 9,513 | ||||||||
Aggregate amortization expense of core deposit and customer relationship intangible assets was $1,952,000, $2,602,000, and 3,362,000 for 2009, 2008, and 2007, respectively. Estimated amortization expense for each of the next five years is as follows.
|
(In thousands)
|
Amount
|
|||
|
2010
|
$ | 1,437 | ||
|
2011
|
1,143 | |||
|
2012
|
1,014 | |||
|
2013
|
540 | |||
|
2014
|
405 | |||
On January 9, 2009, as part of the U.S. Department of Treasury’s (“Treasury”) Capital Purchase Program (“CPP”), the Company received a $30.0 million equity investment by issuing 30 thousand shares of Series A, no par value cumulative perpetual preferred stock to the Treasury pursuant to a Letter Agreement and Securities Purchase Agreement that was previously disclosed by the Company. The Company
99
also issued a warrant to the Treasury allowing it to purchase 223,992 shares of the Company’s common stock at an exercise price of $20.09. The warrant can be exercised immediately and has a term of 10 years.
The non-voting Series A preferred shares issued, with a liquidation preference of $1 thousand per share, will pay a cumulative cash dividend quarterly at 5% per annum during the first five years the preferred shares are outstanding, resetting to 9% thereafter if not redeemed. The ability of the Company to declare or pay dividends or distributions on, or purchase, redeem or otherwise acquire for consideration, shares of its common stock will be subject to restrictions, including a restriction against increasing dividends from the last quarterly cash dividend per share ($.33) declared on the common stock prior to October 14, 2008. The redemption, purchase or other acquisition of trust preferred securities of the Company or its affiliates also will be restricted. These restrictions will terminate on the earlier of (a) the third anniversary of the date of issuance of the preferred stock and (b) the date on which the preferred stock has been redeemed in whole or the Treasury has transferred all of the preferred stock to third parties, except that, after the third anniversary of the date of issuance of the preferred stock, if the preferred stock remains outstanding at such time, the Company may not increase its common dividends per share without obtaining consent of the Treasury. If the Company defers dividend payments on its Series A preferred shares for an aggregate of six quarterly dividend periods, the authorized number of directors of the Company will increase by two and the holders of the Series A preferred shares will have the right to elect directors to fill such director positions at the Company’s next annual meeting of stockholders or special meeting called for that purpose.
The Company is also subject to certain of the executive compensation limitations included in the Emergency Economic Stabilization Act of 2008 (“EESA”). In this connection, as a condition to the closing of the preferred stock transaction, the Company’s senior executive officers (as defined in the Purchase Agreement) (the “Senior Executive Officers”), (i) voluntarily waived any claim against the Treasury or the Company for any changes to such officer’s compensation or benefits that are required to comply with the regulation issued by the Treasury under the CPP and acknowledged that the regulation may require modification of the compensation, bonus, incentive and other benefit plans, arrangements and policies and agreements as they relate to the period the Treasury owns the preferred stock of the Company; and (ii) entered into a letter agreement with the Company amending the benefit plans with respect to such Senior Executive Officers as may be necessary, during the period that the Treasury owns the preferred stock of the Company, as necessary to comply with Section 111(b) of EESA.
The Company allocated the proceeds received from the Treasury, net of transaction costs, on a pro rata basis to the Series A preferred stock and the warrant based on their relative fair values. The Company used the Black-Scholes model to estimate the fair value of the warrant. The fair value of the Series A preferred stock was estimated using a discounted cash flow methodology and a discount rate of 13%. The Company assigned $2.0 million and $28.0 million to the warrant and the Series A preferred stock, respectively. The resulting discount on the Series A preferred stock is being accreted up to the $30.0 million liquidation amount over the five year expected life of the Series A preferred stock. The discount accretion is being recorded as additional preferred stock dividends, resulting in an effective dividend yield of 6.56%.
None.
Evaluation of Disclosure Controls and Procedures
As of the end of the period covered by this report, an evaluation was carried out under the supervision and with the participation of our management, including the Company’s Chief Executive Officer and Chief Financial Officer, of the effectiveness of our disclosure controls and procedures (as defined in Exchange Act Rules 13a-15(e) and 15d-15(e) under the Securities Exchange Act of 1934). Based on their evaluation, the Company’s Chief Executive Officer and Chief Financial Officer have concluded that the Company’s disclosure controls and procedures and internal control over financial reporting are, to the best of their knowledge, effective to ensure that information required to be disclosed by the Company in reports that the Company files or submits under the Exchange Act is recorded, processed, summarized and reported within the time periods specified in SEC rules and forms.
The Company’s Chief Executive Officer and Chief Financial Officer have also concluded that there were no changes in the Company’s internal control over financial reporting or in other factors that occurred during the Company’s most recent fiscal quarter that have materially affected, or are reasonably likely to materially affect, the Company’s internal control over financial reporting or any corrective actions with regard to significant deficiencies and material weaknesses in internal control over financial reporting.
Management’s Report on Internal Control Over Financial Reporting
Management Responsibility. Management of the Company is responsible for establishing and maintaining adequate internal control over financial reporting. The Company’s internal control system is designed to provide reasonable assurance to the Company’s management
100
and Board of Directors regarding the reliability of financial reporting and the presentation of published financial statements. However, all internal control systems, no matter how well designed, have inherent limitations.
General Description of Internal Control over Financial Reporting. Internal control over financial reporting refers to a process designed by, or under the supervision of, the Company’s Chief Executive Officer and Chief Financial Officer and effected by the Company’s Board of Directors, management and other personnel, to provide reasonable assurance regarding the reliability of financial reporting and the preparation of financial statements for external purposes in accordance with generally accepted accounting principles and includes those policies and procedures that:
|
|
·
|
Pertain to the maintenance of records that in reasonable detail accurately and fairly reflect the transactions and dispositions of Company assets;
|
|
|
·
|
Provide reasonable assurance that transactions are recorded as necessary to permit preparation of financial statements in accordance with generally accepted accounting principles, and that Company’s receipts and expenditures are being made only in accordance with the authorization of Company’s management and members of the Company’s Board of Directors; and
|
|
|
·
|
Provide reasonable assurance regarding prevention or timely detection of unauthorized acquisitions, uses or dispositions of Company assets that could have a material effect on the Company’s financial statements.
|
Inherent Limitations in Internal Control over Financial Reporting. Internal control over financial reporting cannot provide absolute assurance of achieving financial reporting objectives because of its inherent limitations. Internal control over financial reporting is a process that involves human diligence and compliance and is subject to lapses in judgment and breakdowns resulting from human failures. Internal control over financial reporting also can be circumvented or overridden by collusion or other improper activities. Because of such limitations, there is a risk that material misstatements may not be prevented or detected on a timely basis by internal control over financial reporting. However, these inherent limitations are known features of the financial reporting process, and it is possible to design into the process safeguards to reduce, though not eliminate, this risk.
Management’s Assessment of the Company’s Internal Control over Financial Reporting. Management assessed the effectiveness of the Company’s internal control over financial reporting as of December 31, 2009. In making this assessment, the Company’s management used the criteria for effective internal control over financial reporting set forth by the Committee of Sponsoring Organizations of the Treadway Commission (COSO) in Internal Control-Integrated Framework.
As a result of our assessment of the Company’s internal control over financial reporting, management concluded that the Company’s internal control over financial reporting was effective as of December 31, 2009 to ensure that information required to be disclosed by the Company in reports that it files or submits under the Exchange Act is recorded, processed, summarized and reported within the time periods specified in SEC rules and forms.
Crowe Horwath LLP, the independent registered public accounting firm that audited the Company’s consolidated financial statements included in this Annual Report on Form 10-K, has also audited the effectiveness of the Company’s internal control over financial reporting as of December 31, 2009. The audit report on the effectiveness of the Company’s internal control over financial reporting is combined with the audit report of the Company’s consolidated financial statements on page 62.
None.
101
|
Positions and
|
Years of Service
|
||
|
Offices With
|
With the
|
||
|
Executive Officer1
|
Age
|
the Registrant
|
Registrant
|
|
Lloyd C. Hillard, Jr.
|
63
|
President and CEO, Director2
|
17*
|
The Company has adopted a Code of Ethics that applies to the Company’s directors, officers and employees, including the Company’s chief executive officer and chief financial officer. The Company makes available its Code of Ethics on its Internet website at www.farmerscapital.com.
Additional information required by Item 10 is hereby incorporated by reference from the Company's definitive proxy statement in connection with its annual meeting of shareholders scheduled for May 11, 2010, which will be filed with the Commission on or about April 1, 2010, pursuant to Regulation 14A.
|
*
|
Includes years of service with the Company and its subsidiaries.
|
|
1
|
For Regulation O purposes, Frank W. Sower, Jr., Chairman of the Company’s board of directors, is considered an executive officer in name only.
|
|
2
|
Also a director of Farmers Bank, United Bank (Chairman), Lawrenceburg Bank, First Citizens Bank, Citizens Northern, FCB Services, Farmers Insurance (Chairman), Leasing One (Chairman), Kentucky General (Chairman), FFKT Insurance, EG Properties, EKT Properties, and an administrative trustee of Farmers Capital Bank Trust I, Farmers Capital Bank Trust II, and Farmers Capital Bank Trust III.
|
The information required by Items 11 through 14 is hereby incorporated by reference from the Company's definitive proxy statement in connection with its annual meeting of shareholders scheduled for May 11, 2010, which will be filed with the Commission on or about April 1, 2010, pursuant to Regulation 14A.
|
(a)1.
|
The following consolidated financial statements and report of independent registered accounting firm of the Company is included in Part II, Item 8 on pages 61 through 100:
102
|
(a)2.
|
Financial Statement Schedules
|
All schedules are omitted for the reason they are not required, or are not applicable, or the required information is disclosed elsewhere in the financial statements and related notes thereto.
|
(a)3.
|
Exhibits:
|
|
3.1
|
Articles of Incorporation of Farmers Capital Bank Corporation (incorporated by reference to Quarterly Report on Form 10-Q for the quarterly period ended June 30, 2006, the Quarterly Report on Form 10-Q for the quarterly period ended March 31, 2003, and Current Report on Form 8-K dated January 13, 2009).
|
|
3.2
|
Amended and Restated Bylaws of Farmers Capital Bank Corporation (incorporated by reference to Quarterly Report on Form 10-Q for the quarterly period ended September 30, 2009).
|
|
4.1*
|
Junior Subordinated Indenture, dated as of July 21, 2005, between Farmers Capital Bank Corporation and Wilmington Trust Company, as Trustee, relating to unsecured junior subordinated deferrable interest notes that mature in 2035.
|
|
4.2*
|
Amended and Restated Trust Agreement, dated as of July 21, 2005, among Farmers Capital Bank Corporation, as Depositor, Wilmington Trust Company, as Property and Delaware Trustee, the Administrative Trustees (as named therein), and the Holders (as defined therein).
|
|
4.3*
|
Guarantee Agreement, dated as of July 21, 2005, between Farmers Capital Bank Corporation, as Guarantor, and Wilmington Trust Company, as Guarantee Trustee.
|
|
4.4*
|
Junior Subordinated Indenture, dated as of July 26, 2005, between Farmers Capital Bank Corporation and Wilmington Trust Company, as Trustee, relating to unsecured junior subordinated deferrable interest notes that mature in 2035.
|
|
4.5*
|
Amended and Restated Trust Agreement, dated as of July 26, 2005, among Farmers Capital Bank Corporation, as Depositor, Wilmington Trust Company, as Property and Delaware Trustee, the Administrative Trustees (as named therein), and the Holders (as defined therein).
|
|
4.6*
|
Guarantee Agreement, dated as of July 26, 2005, between Farmers Capital Bank Corporation, as Guarantor, and Wilmington Trust Company, as Guarantee Trustee.
|
|
4.7*
|
Indenture, dated as of August 14, 2007 between Farmers Capital Bank Corporation, as Issuer, and Wilmington Trust Company, as Trustee, relating to fixed/floating rate junior subordinated debt due 2037.
|
|
4.8*
|
Amended and Restated Declaration of Trust, dated as of August 14, 2007, by Farmers Capital Bank Corporation, as Sponsor, Wilmington Trust Company, as Delaware and Institutional Trustee, the Administrative Trustees (as named therein), and the Holders (as defined therein).
|
|
4.9*
|
Guarantee Agreement, dated as of August 14, 2007, between Farmers Capital Bank Corporation, as Guarantor, and Wilmington Trust Company, as Guarantee Trustee.
|
|
4.10
|
Form of Certificate for Fixed Rate Cumulative Perpetual Preferred Stock, Series A
(incorporated by reference to the Current Report on Form 8-K dated January 13, 2009).
|
|
4.11
|
Warrant for Purchase of Shares of Common Stock
(incorporated by reference to the Current Report on Form 8-K dated January 13, 2009).
|
|
10.1
|
Agreement and Plan of Merger, Dated July 1, 2005, as Amended, by and among Citizens Bancorp, Inc., Citizens Acquisition Subsidiary Corp, and Farmers Capital Bank Corporation
(incorporated by reference to Appendix A of Registration Statement filed on Form S-4 on October 11, 2005).
|
|
10.2
|
Amended and Restated Plan of Merger of Citizens National Bancshares, Inc. with and into FCBC Acquisition Subsidiary, LLC (incorporated by reference to Appendix A of Proxy Statement for Special Meeting of Shareholders of Citizens National Bancshares, Inc. and Prospectus in connection with an offer of up to 600,000 shares of its common stock of Farmers Capital Bank Corporation filed on Form 424B3 on August 7, 2006).
|
103
|
10.3
|
Stock Purchase Agreement Dated June 1, 2006 by and among Farmers Capital Bank Corporation, Kentucky Banking Centers, Inc. and Citizens First Corporation. (incorporated by reference to the Quarterly Report on Form 10-Q for the quarterly period ended September 30, 2008).
|
|
21
|
|
|
23
|
|
|
31.1
|
|
|
31.2
|
|
|
32
|
|
|
99.1
|
|
|
99.2
|
|
*
|
Exhibit not included pursuant to Item 601(b)(4)(iii) and (v) of Regulation S-K. The Company will provide a copy of such exhibit to the Securities and Exchange Commission upon request.
|
104
Pursuant to the requirements of Section 13 or 15(d) of the Securities Exchange Act of 1934, the Registrant has duly caused this report to be signed on its behalf by the undersigned, thereunto duly authorized.
|
FARMERS CAPITAL BANK CORPORATION
|
|||
|
By:
|
/s/ Lloyd C. Hillard, Jr. | ||
|
Lloyd C. Hillard, Jr.
|
|||
|
President and Chief Executive Officer
|
|||
|
Date:
|
March 12, 2010 | ||
Pursuant to the requirements of the Securities Exchange Act of 1934, this report has been signed below by the following persons on behalf of the Registrant and in the capacities and on the dates indicated.
| /s/ Lloyd C. Hillard, Jr. |
President, Chief Executive Officer
|
March 12, 2010 |
|
Lloyd C. Hillard, Jr.
|
and Director (principal executive
|
|
|
officer of the Registrant)
|
||
| /s/ Frank W. Sower, Jr. |
Chairman
|
February 25, 2010 |
|
Frank W. Sower, Jr.
|
||
| /s/ Ben F. Brown |
Director
|
February 25, 2010 |
|
Ben F. Brown
|
||
| /s/ Daniel M. Sullivan |
Director
|
March 2, 2010 |
|
Daniel M. Sullivan
|
||
| /s/ R. Terry Bennett |
Director
|
February 27, 2010 |
|
R. Terry Bennett
|
||
| /s/ Shelley S. Sweeney |
Director
|
February 26, 2010 |
|
Shelley S. Sweeney
|
||
| /s/ David R. O'Bryan |
Director
|
March 2, 2010 |
|
David R. O’Bryan
|
||
| /s/ Donald Saelinger |
Director
|
February 25, 2010 |
|
Dr. Donald A. Saelinger
|
||
| /s/ J. D. Sutterlin |
Director
|
February 26,2010 |
|
Dr. John D. Sutterlin
|
||
| /s/ Marvin E. Strong |
Director
|
March 1, 2010 |
|
Marvin E. Strong
|
||
| /s/ J. Barry Banker |
Director
|
March 2, 2010 |
|
J. Barry Banker
|
||
| /s/ Robert Roach, Jr. |
Director
|
February 25, 2010 |
|
Robert Roach, Jr.
|
||
| /s/ Doug Carpenter |
Senior Vice President, Secretary
|
March 12, 2010 |
|
C. Douglas Carpenter
|
and CFO (principal financial and
|
|
|
accounting officer)
|
105
|
Exhibit
|
Page
|
|
|
107
|
||
|
108
|
||
|
109
|
||
|
110
|
||
|
111
|
||
|
112
|
||
|
114
|
106