Attached files
| file | filename |
|---|---|
| EX-31.2 - CERTIFICATION - DIVX INC | dex312.htm |
| EX-32.2 - CERTIFICATION - DIVX INC | dex322.htm |
| EX-32.1 - CERTIFICATION - DIVX INC | dex321.htm |
| EX-23.1 - CONSENT OF INDEPENDENT REGISTERED PUBLIC ACCOUNTING FIRM - DIVX INC | dex231.htm |
| EX-31.1 - CERTIFICATION - DIVX INC | dex311.htm |
| EX-10.26 - LETTER AGREEMENT - DIVX INC | dex1026.htm |
Table of Contents
UNITED STATES
SECURITIES AND EXCHANGE COMMISSION
WASHINGTON, D.C. 20549
FORM 10-K
(Mark One)
| x | ANNUAL REPORT PURSUANT TO SECTION 13 OR 15(d) OF THE SECURITIES EXCHANGE ACT OF 1934 |
For the fiscal year ended December 31, 2009.
OR
| ¨ | TRANSITION REPORT PURSUANT TO SECTION 13 OR 15(d) OF THE SECURITIES EXCHANGE ACT OF 1934 |
For the transition period from to .
Commission file number: 001-33029
DivX, Inc.
(Exact name of registrant as specified in its charter)
| Delaware | 33-0921758 | |
| (State or other jurisdiction of incorporation or organization) |
(I.R.S. Employer Identification No.) | |
| 4780 Eastgate Mall, San Diego, California | 92121 | |
| (Address of principal executive offices) | (Zip Code) | |
Registrant’s telephone number, including area code: (858) 882-0600
Securities registered pursuant to Section 12(b) of the Act:
| Title of each class |
Name of each exchange on which registered | |
| Common Stock, $0.001 par value |
The Nasdaq Stock Market |
Securities registered pursuant to Section 12(g) of the Act: None
Indicate by check mark if the registrant is a well-known seasoned issuer, as defined in Rule 405 of the Securities Act. ¨ Yes x No
Indicate by check mark if the registrant is not required to file reports pursuant to Section 13 or 15(d) of the Act. ¨ Yes x No
Indicate by check mark whether the registrant (1) has filed all reports required to be filed by Section 13 or 15(d) of the Securities Exchange Act of 1934 during the preceding 12 months (or for such shorter period that the registrant was required to file such reports), and (2) has been subject to such filing requirements for the past 90 days. x Yes ¨ No
Indicate by check mark whether the registrant has submitted electronically and posted on its corporate Web site, if any, every Interactive Data File required to be submitted and posted pursuant to Rule 405 of Regulation S-T (§232.405 of this chapter) during the preceding 12 months (or for such shorter period that the registrant was required to submit and post such files). ¨ Yes ¨ No
Indicate by check mark if disclosure of delinquent filers pursuant to Item 405 of Regulation S-K is not contained herein, and will not be contained, to the best of registrant’s knowledge, in definitive proxy or information statements incorporated by reference in Part III of this Form 10-K or any amendment to this Form 10-K. ¨
Indicate by check mark whether the registrant is a large accelerated filer, an accelerated filer, a non-accelerated filer, or a smaller reporting company. See the definitions of “large accelerated filer,” “accelerated filer” and “smaller reporting company” in Rule 12b-2 of the Exchange Act.
| Large accelerated filer ¨ |
Accelerated filer x | |
| Non-accelerated filer ¨ (Do not check if a smaller reporting company) |
Smaller reporting company ¨ | |
Indicate by check mark whether the registrant is a shell company (as defined in Rule 12b-2 of the Exchange Act). ¨ Yes x No
The aggregate market value of the common stock of the registrant as of June 30, 2009 held by non-affiliates was $148,272,805, based upon the closing price of the common stock reported on the NASDAQ Global Select Market on such date. Shares of common stock held by each officer and director (and/or his/her affiliates) and by each person who owns 10 percent or more of the outstanding common stock have been excluded from this calculation because these persons may be considered affiliates. The determination of affiliate status for purposes of this calculation is not necessarily a conclusive determination for other purposes.
The number of shares of common stock outstanding as of March 1, 2010, was 32,822,820.
Documents Incorporated by Reference:
| Document |
Part of Form 10-K | |
| Proxy Statement for the 2010 Annual Meeting of Stockholders |
Part III |
Table of Contents
FORM 10-K
INDEX
| PART I. |
||||
| ITEM 1. |
1 | |||
| ITEM 1A. |
14 | |||
| ITEM 1B. |
35 | |||
| ITEM 2. |
35 | |||
| ITEM 3. |
35 | |||
| ITEM 4. |
36 | |||
| PART II. |
||||
| ITEM 5. |
Market for Registrant’s Common Equity, Related Shareholder Matters and Issuer Purchases of Equity Securities | 37 | ||
| ITEM 6. |
39 | |||
| ITEM 7. |
Management’s Discussion and Analysis of Financial Condition and Results of Operations |
39 | ||
| ITEM 7A. |
63 | |||
| ITEM 8. |
64 | |||
| ITEM 9. |
Changes in and Disagreements With Accountants on Accounting and Financial Disclosure |
64 | ||
| ITEM 9A. |
65 | |||
| ITEM 9B. |
67 | |||
| PART III. |
||||
| ITEM 10. |
68 | |||
| ITEM 11. |
68 | |||
| ITEM 12. |
Security Ownership of Certain Beneficial Owners and Management and Related Stockholder Matters | 68 | ||
| ITEM 13. |
68 | |||
| ITEM 14. |
68 | |||
| PART IV. |
||||
| ITEM 15. |
69 | |||
| 72 | ||||
| F-1 | ||||
| F-39 | ||||
Table of Contents
FORWARD-LOOKING STATEMENTS
This Annual Report on Form 10-K, or Annual Report, contains forward-looking statements that are based on our management’s beliefs and assumptions and on information currently available to our management. The forward-looking statements are contained principally in Item 1—“Business,” Item 1A—“Risk Factors,” Item 7—“Management’s Discussion and Analysis of Financial Condition and Results of Operations,” and Item 7A—Quantitative and Qualitative Disclosures About Market Risk.” Forward-looking statements include information concerning our possible or assumed future results of operations, business strategies, financing plans, competitive position, industry environment, potential growth opportunities and the effects of competition. Forward-looking statements include all statements that are not historical facts and can be identified by terms such as “anticipates,” “believes,” “could,” “seeks,” “estimates,” “expects,” “intends,” “may,” “plans,” “potential,” “predicts,” “projects,” “should,” “will,” “would” or similar expressions and the negatives of those statements.
Forward-looking statements involve known and unknown risks, uncertainties and other factors that may cause our actual results, performance or achievements to be materially different from any future results, performances or achievements expressed or implied by the forward-looking statements. We discuss certain of these risks in greater detail in Item 1A—“Risk Factors.” Given these uncertainties, you should not place undue reliance on these forward-looking statements. Also, forward-looking statements represent our management’s beliefs and assumptions only as of the date of this Annual Report. You should read this Annual Report and the documents that we reference herein and have filed as exhibits with the Securities and Exchange Commission, or SEC, completely and with the understanding that our actual future results may be materially different from what we expect. Except as required by law, we assume no obligation to update these forward-looking statements publicly, or to update the reasons actual results could differ materially from those anticipated in these forward-looking statements, even if new information becomes available in the future.
Table of Contents
PART I
DivX overview
We were incorporated in Delaware in May 2000 with the purpose of making media better through the use of technology. We believe that media is undergoing a profound transformation that will change how individuals and entities obtain information, communicate and express ideas. We believe that there are opportunities within this transformation—opportunities to generate tremendous value by meeting the needs of users of new media and, more importantly, opportunities to influence the evolution and development of media. Our successes to date have been the result of creating value with and for a broad community of constituents including software vendors, consumer hardware device manufacturers, content creators and consumers. Like the evolving markets in which we operate, DivX is open and dynamic.
Our goal is to create products and provide services that improve the way consumers experience media. The first step toward this goal was to build and release a high-quality video compression-decompression software library, or codec, to enable distribution of content across the Internet and through recordable media. As a result, we created the DivX codec. Since the creation of the first DivX codec, DivX codecs have been actively sought out and downloaded by consumers hundreds of millions of times. These downloads include those for which we receive revenue as well as free downloads, such as limited-time trial versions, and downloads provided as upgrades or support to existing end users of our products. After the significant grass-roots adoption of our codecs, the next step toward our goal was to license similar technology to consumer hardware device manufacturers and to certify their products to ensure the interoperable support of DivX-encoded content. We are entitled to receive a royalty and/or license fee for DivX Certified devices shipped by our customers. In addition to licensing revenue from such licensees, we also generate revenue from software licensing, advertising and content distribution.
One aspect of our long term vision is to allow content creators to have the ability to capture their content in the DivX format using any device or software of their choosing and to allow consumers of such content to playback and interact with the content on any device or platform. We bring together consumers of DivX content with content creators both large and small through the development and licensing of media distribution platforms and services.
In January 2009, we released the latest version of our codec, DivX Plus. DivX Plus technology offers consumers and consumer electronics manufacturers an enhanced version of our codecs for certain implementations, including for high definition and mobile content.
In recent years we completed two strategic transactions to complement our organic growth. In November 2007, we acquired MainConcept GmbH, or MainConcept, a leading provider of an H.264 codec solution and a wide range of other high-quality video codecs and technologies for the broadcast, film, consumer electronics and computer software markets. MainConcept solutions are optimized for various platforms including PCs, set-top boxes, portable media players and mobile phones.
In August 2009 we acquired substantially all of the assets of AnySource Media, LLC, or AnySource, technology company developing software and service platforms for Internet-enabled consumer electronics devices. We believe the AnySource transaction will help us meet our goal of expanding our business model to encompass licensing and other revenue opportunities relating to Internet-enabled consumer electronics devices.
Our next steps, which we have begun working toward, are to bring together the millions of DivX consumers with content creators both large and small to build communities around media, including through the development and licensing of media distribution platforms and services for Internet and consumer electronics devices. We are optimistic about the future and believe our opportunities are only beginning to be realized.
1
Table of Contents
The DivX codec solution
The DivX codecs have been developed as a solution to address the opportunity created by the transformation of content. Specifically, we have built the technological platform and galvanized the community necessary to enable a digital media ecosystem of consumers, content creators, software vendors, hardware device manufacturers and advertisers, allowing each participant in this ecosystem to benefit from the participation of the other participants.
The following illustration depicts how DivX provides the foundation and connection for the participants in the digital media ecosystem, all of whom ultimately work to benefit the consumer:
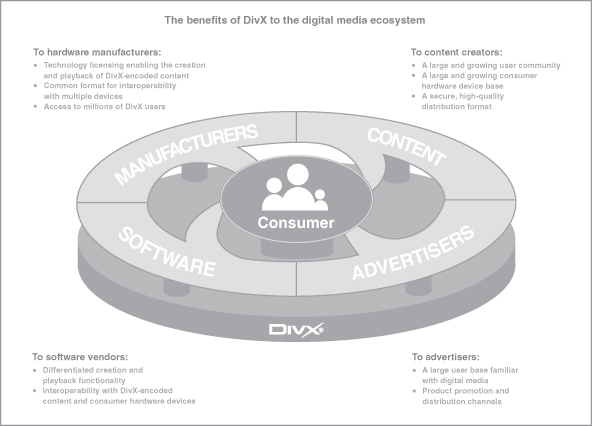
Specifically, our codec ecosystem offers the following benefits to these various participants in the content industry:
To content consumers, the DivX ecosystem provides a high-quality, interoperable digital media format supported by dozens of software products and thousands of models of consumer hardware devices. This allows consumers to access a diverse range of content from large and small content creators and to play back this content when, where and how they want. Moreover, the widespread availability of consumer hardware devices, software and services within the DivX ecosystem makes creating and sharing content easier and more fun for the community of DivX users.
To content creators, the DivX ecosystem provides the ability to cost-effectively and securely create and distribute high-quality content to a large market of consumers and to deliver that content when, where and how consumers want it. The DivX ecosystem gives content creators access to DivX Certified consumer hardware devices as well as millions of digital video savvy consumers who have demonstrated their willingness and ability to seek out high-quality content distributed via the Internet.
2
Table of Contents
To digital media software vendors, the DivX ecosystem allows software vendors to provide easy-to-use products for the creation and playback of content that is interoperable with other DivX Certified devices. By doing so, software vendors can differentiate their products by adding DivX media creation and playback functionality, thus providing useful products that compete with generic operating system bundles.
To consumer hardware device manufacturers, the DivX ecosystem provides the ability to offer recording and playback devices that are interoperable with an array of other DivX Certified devices in a high-quality, secure digital media format that consumers want and use. Manufacturers can thus avoid the cost of supporting many different incompatible formats, allowing them to remain competitive in the face of significant price pressures. Use of DivX technologies and association with the DivX brand enables manufacturers to participate in new content business models from content services provided by others in the DivX ecosystem.
To advertisers, the DivX ecosystem provides access to a large and engaged group of DivX users. This may enable advertisers to communicate with consumers to inform them about available products and services.
Our strategy
Our strategy is to improve the way in which consumers experience media by leveraging the vibrant DivX ecosystem and advances in media technologies. Key elements of this strategy include:
Develop a content and services platform for Internet-enabled devices. We believe that Internet TV will transform the landscape for media distribution and advertising. Based in part on the assets we acquired as a result of our acquisition of AnySource, we are developing DivX TV, a technology designed to enable consumers to stream Internet video directly to an Internet-connected digital television or other Internet-connected consumer electronics devices. We believe that this technology will improve the way consumers experience media and will provide us with new opportunities to provide products and services.
Grow our core licensing business. We believe that our software and consumer hardware partners are integral to our success. In hardware, we are building on the initial success of licensing DivX technologies for implementation in DVD players by growing our licensing business into the emerging categories of Blu-ray players, digital televisions, mobile devices, set-top boxes and other consumer electronics devices. In software, we plan to enhance the value of the DivX technologies to our existing software partners by adding new features to the DivX media format and to increase partnerships across the software market.
Provide content platforms and content-related services that are valued by DivX users. There are millions of DivX users around the world, and we intend to work independently, and with other parties focused on media to develop products and services that enhance the media experience for these users.
Expand the DivX ecosystem through partnerships with the community of diverse content creators. We believe the active engagement of content creators in the DivX ecosystem is essential to realizing the full potential of the digital media transformation. We plan to continue to develop relationships with premium, mid-tier and individual content creators. We intend to partner with creators based not only on the economic potential of their content, but also on the potential for DivX to enhance the value of their content through the power of our platform and community. We also plan to support our content partners in their efforts to distribute their content in the DivX format through their own various digital distribution channels.
Strengthen the DivX brand. We intend to continue building upon the strength of the DivX brand. We plan to ensure that in the future the DivX brand continues to be associated only with those products and services that offer high-quality media experiences. We may also invest in activities beyond our products that are consistent with the DivX vision of better media.
3
Table of Contents
Pursue selected complementary acquisitions, investments and strategic alliances. When the opportunity presents itself, we intend to pursue selected acquisitions, investments or strategic alliances that complement and further our mission to make media better and improve the media experience for consumers. Our primary objectives in these transactions would be to acquire complementary technologies and platforms and expand the consumer and content aspects of our ecosystem. Once we have accomplished such acquisitions, we will spend time and resources integrating them into our businesses.
Our strengths
We believe that the following key strengths uniquely position DivX to continue to enhance and enrich the digital media content experience:
Our demonstrated history of success, innovation and ecosystem creation. We have a history of technology leadership on which we will continue to build. The success of DivX has been driven by the grassroots adoption of our technologies by millions of consumers, due in large part to the strength of our technology. We also have a demonstrated ability to build technologies that support an ecosystem of diverse participants that gain value from their participation.
Our large installed base. DivX technologies and products have been adopted by millions of users who have sought them out and chosen to download them. This success encouraged consumer hardware device manufacturers to build support for DivX technologies into their products. Hundreds of consumer hardware device manufacturers and dozens of integrated circuit manufacturers have incorporated DivX technologies into thousands of models of consumer hardware devices that have shipped into the market. We believe our large user and consumer hardware installed base places us in a strong position to benefit from the transformation of the content industry and growing digital content distribution. The DivX media platform installed base represents a large addressable market for content creators interested in commercial digital distribution of their content.
The DivX brand. The DivX logo appears on products that incorporate DivX technology and indicates to consumers that the product meets our strict standards of interoperability and delivers a high-quality DivX media experience. We believe that consumers recognize the value of the DivX logo, and that this increases the value of the DivX brand to all other participants in the DivX ecosystem.
Our neutral media technology platforms for software, hardware and content. Our technology platforms for the creation, distribution and consumption of media content are not tied exclusively to any specific consumer hardware device manufacturer, software vendor or content provider. We license our technologies to a wide array of companies. We believe our neutral platforms allow us to bring a diverse set of powerful interests together in the DivX ecosystem.
Our ability to understand and partner with various constituents of the digital media industry. We have a demonstrated ability to work with industries that have very different goals. We are as comfortable working within the explosiveness of the Internet industry as we are within the planned and deliberate environment of the consumer hardware industry. We believe this ability will serve us well as we work to add even more diverse participants and industries to the DivX ecosystem.
How we derive revenue
We have four revenue streams. Three of these revenue streams emanate from our technologies, including technology licensing to manufacturers of consumer hardware devices, licenses to independent software vendors and consumers, and services we provide related to digital content distribution over the Internet. Additionally, we derive revenues from advertising and distributing third-party products.
Technology licensing-consumer hardware devices. Our technology licensing revenues from consumer hardware device manufacturers comprise the majority of our total revenues and are derived primarily from royalties and/or
4
Table of Contents
license fees received from original equipment manufacturers, although related revenues are derived from other members of the consumer hardware device supply chain. We license our technologies to original equipment manufacturers, allowing them to build support of DivX technologies into their consumer hardware devices. Our original equipment manufacturer licensees pay us a fee based on the quantity of DivX Certified devices they sell. Our license agreements with original equipment manufacturers typically range from one to two years, and may include the payment of initial fees, volume-based royalties and minimum guaranteed volume levels. Because royalties are generated by the shipment volumes of our consumer hardware device customers, and because sales by consumer hardware device manufacturers are highly seasonal, we typically expect revenues relating to consumer hardware devices to be highly seasonal, with our second quarter revenues in any given calendar year being generally lower than any other quarter in that calendar year.
To ensure high-quality support of the DivX media format in finished consumer electronic products, we also license our technologies to those companies who create the major components in those products. These companies include integrated circuit manufacturers who supply integrated circuits, and original design manufacturers who create reference designs, for DVD players, Blu-ray players, digital televisions, mobile phones, and the other consumer hardware devices distributed by our licensee original equipment manufacturers. In 2009, Samsung Corporation, Ltd. and Sony Corporation accounted for 13% and 12%, respectively, of our total net revenues. In 2008 and 2007, LG Electronics, Inc. accounted for 11% and 10% respectively, of our total net revenues.
To ensure that our licensees’ products conform to our quality standards, we employ a rigorous certification program. Integrated circuit manufacturers, original design manufacturers and original equipment manufacturers are required to have their devices tested and certified prior to distribution. Only DivX Certified devices are permitted to display our logo as evidence that they conform to our standards of high quality.
In the years 2009, 2008 and 2007, we derived 70%, 66% and 70% respectively, of our total net revenues from licensing our technology to original equipment manufacturers, original design manufacturers and integrated circuit manufacturers.
Technology licensing—software. We license our technologies to independent software vendors that incorporate our technologies into software applications for computers and other consumer hardware devices. An independent software vendor typically pays us an initial license fee, in addition to per-unit royalties based on the number of products sold that include our technology. Since our acquisition of MainConcept in November 2007, we also have generated revenues associated with MainConcept’s licensing agreements in areas complementary to our pre-existing revenue streams, including through MainConcept’s focus on the professional video sector. We also license our technologies directly to consumers through several software bundles. We make certain software bundles available free of charge from our website. These bundles incorporate a version of our codec technology, and allow consumers to play and create content in the DivX format. We also make available from our website an enhanced version of the free software bundle, including additional features that increase the quality and control of DivX media playback and creation. This enhanced version is available free of charge for a limited trial period, which is generally 15 days. At the end of the trial period, our users are invited to purchase a license to one or more components of the enhanced bundle by making a one time payment to us. If they choose not to do so, they still enjoy playback and creation functionality equivalent to our free software bundle.
In the years 2009, 2008 and 2007 we derived 22%, 14% and 8% respectively, of our total net revenues from licensing our technology to independent software vendors and licensing our software directly to consumers.
Advertising and third-party product distribution. We derive revenue from advertisements or third party software applications that we embed in or include with the software packages we offer to consumers. In March 2009, we entered into a promotion and distribution agreement with Google. Pursuant to this agreement, we distribute Google products, including the Google Chrome web browser with our software products and Google pays us fees based on successful activations of these products. Pursuant to the terms of the agreement with Google, this
5
Table of Contents
agreement expires on February 28, 2011, or upon the achievement of a maximum distribution commitment. Revenues earned under this agreement accounted for approximately 8% of our total net revenues in 2009. From November 2007 through November 2008, we had agreed with Yahoo! to include and distribute the Yahoo! Toolbar software product with our software products. Yahoo! paid us fees based on the number of downloads or activations of the included software by consumers.
In the years 2009, 2008 and 2007, we derived 8%, 19% and 21% respectively, of our total net revenues from the inclusion of advertisements and third party software applications in our software products.
Content distribution and related services. We derive revenue by acting as an application service provider for third party owners of digital video content by making available our online video delivery system to content providers in return for a revenue share of the download-for-rental or sales revenue generated from the content provider’s customer using our delivery system. We also provide encoding, content storage and distribution services to content providers. The content partner delivers a video-on-demand movie through its website using our Open Video System. We earn a certain percentage of each transaction with the end consumer renting or purchasing such content based on a pre-negotiated revenue share with the content provider. We also encode the content of certain customers into the DivX format and charge certain of these customers for this service or receive an up-front license fee from certain content partners who use our software to encode their own content.
We record revenue related to content distribution arrangements with consumer hardware original equipment manufacturers, or OEMs, who pay us a fee for each copy of DivX-encoded content that is encoded on physical media and bundled with their consumer hardware products.
In the years 2009, 2008 and 2007 we derived 0%, 1% and 1% respectively, of our total net revenues from providing content distribution services to third parties.
Geographic information.
We are a global company with a broad, geographically diverse market presence. For the years 2009, 2008 and 2007, our revenues outside the United States comprised 84%, 75% and 78% respectively, of our total net revenues.
A large number of our consumer hardware device manufacturers are located in Asia. Fees received pursuant to licenses to these consumer hardware device manufacturers accounted for 70%, 62% and 59% of our total net revenues for 2009, 2008 and 2007 respectively. Revenues from customers located in Japan, Korea and Singapore comprised approximately 33%, 25% and 6%, respectively, of our total net revenues in 2009, 25%, 15% and 11% respectively, of our total net revenues in 2008, and 23%,19%, and 8%, respectively, of our total net revenues in 2007.
Domestic revenues comprised approximately 16%, 25% and 22% of our total net revenues in 2009, 2008, and 2007, respectively.
Technologies
Our digital media ecosystem utilizes a series of technologies designed for commercial and consumer users. These technologies enable users to compress, secure, distribute and view digital video and otherwise participate in our digital media ecosystem. The following is a description of the core technologies that form the basis for our digital media ecosystem.
DivX media format. Our DivX media format comprises our DivX video compression technology, DivX file containers with their advanced media features and digital rights management, or DRM.
6
Table of Contents
DivX video compression technology. Our DivX video compression technology reduces the size of high-quality video to a level that can be efficiently distributed over broadband networks. In addition, the newest version of our video compression technology, the DivX Plus Codec, was designed to offer even more efficient compression for certain source files. Both technologies utilize a mixture of video compression tools, including some from the MPEG-4 standard, and are capable of producing high-quality video using only a fraction of the amount of data required by a standard-size DVD or Blu-ray disc. As a result, DivX technology enables a user to store a full- length standard definition movie on a one giga-bite USB drive. DivX technology is designed to offer a balance of compression, complexity and speed. Our technology offers superior visual quality at a high level of compression. The computational efficiencies of our technology make it suitable for integration into low-cost consumer hardware devices and its speed makes it useful in both consumer and professional content creation and editing environments. DivX video technology can be used on video sources with sizes ranging from high definition quality video to video resolutions suitable for a mobile environment.
DivX file containers. Our DivX file containers are designed to hold multimedia data and metadata. The original version of our container is based on the Resource Interchange File Format, which by design gives it some compatibility with other Resource Interchange File Format based file formats such as the Audio Video Interleave file container. Our newest file container is a proprietary implementation built on MKV standards, which by design gives it some compatibility with other MKV-based files.
DivX advanced media features. DivX advanced media features enable DivX users to create enhanced digital media files, including features in the files themselves that are normally associated with the physical media or playback device used, such as DVD-like menus, user-selected multiple-language audio tracks, subtitles, and metadata that allow the content creator to add descriptive information such as title, author and video specifications.
Digital rights management. We have developed a digital rights management, or DRM, that encrypts and manages the playback of protected DivX content on personal computers and consumer hardware devices. When implemented, it ensures that digital video is delivered in a secure manner and used in accordance with rules defined by its publisher. Our digital rights management technology is designed to require minimal system resources, allowing it to be implemented on low-cost consumer hardware devices.
Products and services
Our technologies are incorporated into several software product bundles that we offer directly to consumers, as well as software development kits that we license to hardware and software companies. We also offer certification services to software and hardware companies, and operate a digital media distribution system in which we act as an application service provider to third party content owners.
Consumer software
In addition to the third-party consumer software products that our technologies power, we offer several programs to consumers directly. We have released numerous versions of these programs and are currently working on additional updates and improvements to our DivX consumer software programs. Our consumer software programs currently include the following:
DivX for Windows bundle. Our DivX for Windows bundle includes our DivX community codecs, DivX Player and DivX Web Player. The bundle also includes free trial versions of the Windows versions of the DivX Converter and the DivX Pro video codecs.
DivX Pro for Windows bundle. Like our DivX for Windows bundle, the DivX Pro for Windows bundle includes our DivX Player, and DivX Web Player. However, instead of our DivX community codecs, this bundle includes our DivX Pro video codecs and additionally includes the DivX Converter application.
7
Table of Contents
DivX for Mac bundle. Our DivX for Mac bundle includes Mac OS versions of our DivX community codec, DivX Player and DivX Web Player. The bundle also includes free trial versions of the Mac OS versions of the DivX Converter and the DivX Pro video codec. The DivX for Mac software bundle does not yet support the advanced media features of the DivX format.
DivX Pro for Mac bundle. Our DivX Pro for Mac bundle includes all of the components of the DivX for Mac bundle as well as Mac OS versions of the DivX Converter application and the DivX Pro video codec.
DivX Mobile Player. Our DivX Mobile Player is available for certain mobile handsets, and allows users to playback DivX videos on their handsets from a variety of sources, including side-loading from memory cards or downloading from the Internet, including DivX’s own mobile portal.
DivX Author. Our DivX Author application is available for the Windows OS and allows users to combine and edit multiple videos into a single DivX video, add the advanced features of the DivX format to enhance digital media files, and create slideshows with videos, photos and music.
Technology licensing for independent software vendors and consumer hardware device manufacturers
Software development kits. We typically make our technologies available to partners via software development kits. For hardware licensees, we have “decode” and “encode” software development kits that enable hardware partners to build DivX playback and recording support, respectively, into their products. For software licensees, we offer several software development kits that allow software vendors to build DivX playback and creation support into their products.
Certification Programs. The DivX Certification Program certifies hardware devices and software applications for the creation and playback of DivX video. DivX Certified hardware devices support playback of DivX video, while DivX Certified software applications support the conversion of digital video into the high-quality, highly-compressed DivX media format.
Integrated circuit manufacturers, original design manufacturers, original equipment manufacturers and software vendors are required to have their products certified prior to being marketed as DivX Certified products. For example, integrated circuit manufacturers typically receive a software development kit and certification kit from us, which they use to design an integrated circuit that will meet our standards to be DivX Certified. Manufacturers may distribute those integrated circuits to DivX-licensed original equipment manufacturers and original design manufacturers for inclusion in DivX Certified devices only after those integrated circuits are DivX Certified. Similarly, original design manufacturers, original equipment manufacturers and software vendors must have their products certified prior to being marketed as DivX Certified products.
Our DivX Certified programs currently include the following certification levels:
DivX Plus HD Certified
Devices certified pursuant to the DivX Plus HD certification level ensure device compatibility with files generated using the DivX Plus codec. DivX Plus technology offers enhancements over prior versions of our codecs for certain implementations, including for high definition and mobile content. While files generated using the DivX Plus HD codec will not play back on DivX Home Theater Certified devices, devices certified under the DivX Plus profiles will play DivX video generated with existing DivX codecs as well as the newer DivX Plus HD technology. Devices that are DivX Plus HD Certified for decode play high definition DivX video in 720p and/or 1080p resolution as well as high definition DivX video in the MKV format, support advanced playback features, play DivX formatted Hollywood content as well as standard definition and mobile resolution DivX video.
8
Table of Contents
DivX Ultra Certified
The DivX Ultra Certified Program is a premium certification level that additionally certifies hardware devices and software applications for the creation and playback of high-quality DivX video with advanced features such as motion menus, subtitles, chapter points and alternate audio tracks. DivX Ultra Certified software applications support the conversion of digital video into the high-quality, highly-compressed DivX media format as well as the creation of video with advanced features. Devices that are DivX Ultra Certified for decode support advanced playback features and play DivX formatted Hollywood content as well as DivX content in standard definition and mobile resolution content.
DivX HD Certified
The DivX HD Certified program is a premium certification level that certifies hardware devices and software applications for the creation and playback of high definition video in the DivX format. Devices that are DivX HD Certified for decode play high definition DivX video, Hollywood content purchased in the DivX format, as well as standard definition and mobile resolution DivX videos.
DivX Mobile Theater Certified and DivX Mobile Certified
The DivX Mobile Theater Certified and DivX Mobile Certified programs were developed to allow consumers to create and playback DivX video. Devices that are DivX Mobile Theater Certified for decode can play Hollywood content in the DivX format as well as DivX videos in mobile resolution. Devices that are DivX Mobile Certified for decode can play mobile resolution DivX videos.
DivX Home Theater
The DivX Home Theater Certified program enables the creation and playback of standard definition DivX video. Devices that are DivX Home Theater Certified for decode playback standard definition Hollywood content in the DivX format as well as standard definition and mobile resolution DivX videos.
DivX Certified Recorder/Encoder
The DivX Certified Recorder/Encoder program certifies hardware devices to record video directly in the DivX media format. DivX Certified Recorder/Encoder devices create DivX video that is compatible with all DivX Certified, DivX Plus, and DivX Ultra Certified products.
Open Video System
Our Open Video System, or OVS, is a complete hosted service that allows content creators to deliver high-quality DivX video content over the Internet. We use our OVS to provide content and service providers with encoding services, content storage and distribution services, and use of our DivX media format and digital rights management technology. Using the OVS, a content service provider can launch its own web store and sell content online.
DivX Mobile Media
DivX Mobile Media is a mobile media platform service that allows users to enjoy video content in the DivX format from a variety of sources.
Sales and marketing
Our sales and marketing team markets our technologies to a wide range of integrated circuit manufacturers, original design manufacturers, original equipment manufacturers, retailers, operators and software developers on a worldwide basis. In addition, members of this team market our products to various consumer segments at industry tradeshows such as CES and IFA, and engage in partner and retailer training, product marketing, sales
9
Table of Contents
support and partner co-marketing programs. Members of our sales and marketing team also focus on content and distribution partnerships, co-marketing transactions, advertising partnerships, brand and product marketing, electronic software distribution, business operations and marketing programs. As of December 31, 2009, our sales and marketing team included 106 full-time and part-time employees based in 11 countries.
Product development
We incurred product development costs of approximately $20.6 million, $20.2 million and $18.7 million in 2009, 2008 and 2007 respectively, representing 29%, 21% and 22% respectively, of total net revenues. Our product development team is based out of our headquarters in San Diego, California and following our transactions with AnySource in August 2009 and MainConcept in November 2007, includes team members in Malvern, Pennsylvania, Aachen, Germany and Tomsk, Russia. As of December 31, 2009, our product development team consisted of 191 full-time and part-time employees dedicated to product development and product management, 154 of which were engineers and 19 of which were product managers (with the other 18 filling other related roles).
Our product development team focuses on building our technologies into products that meet the needs of our consumers. This team identifies, investigates and analyzes new long-term opportunities, shapes our technology strategy and provides support for internally developed and externally acquired technologies. Our product development team builds the platform technologies upon which our products are based and conducts our applied research in developing and improving technologies to compress, secure and distribute digital video.
Competition
We face significant competition in the digital media markets in which we operate. We believe that our most significant competitive threat comes from companies that have the collective financial, technical and other resources to develop the technologies, services, products, and partnerships necessary to create a digital media ecosystem that can compete with the DivX ecosystem. Those potential competitors currently include Adobe Systems, Apple Computer, Google, Microsoft, and Yahoo!.
We also compete with companies that offer products or services that compete with specific aspects of our digital media ecosystem. For example, our digital rights management technology competes with technologies from companies such as Apple Computer, ContentGuard, Intertrust Technologies, Microsoft, Nagra Audio, NDS Group and 4C Entity, as well as the internal development efforts of certain of our licensees. Similarly, content distribution providers, such as Amazon.com, Apple Computer, Sonic Solutions, Google, Joost, MovieLink, MySpace.com, a subsidiary of News Corporation, Netflix, Yahoo!, YouTube, a subsidiary of Google, Hulu, LLC, and subscription entertainment services and cable and satellite providers compete with our content distribution services. In addition, we compete with companies such as Yahoo!, VUDU, Inc., Boxee, Inc. and Rovi Corporation and with internally developed proprietary solutions developed by hardware device manufacturers and integrated circuit manufacturers in our development and marketing of technologies to enable the next generation of Internet-enabled consumer electronics devices.
Our proprietary video compression technologies also compete with other video compression technologies, including other implementations of MPEG-4 or implementations of H.264/AVC. In addition, a number of companies such as Adobe Systems, Apple Computer, Ateme, Google, Microsoft, and RealNetworks offer video formats that compete with our proprietary video format.
We also face competition from subscription entertainment services, cable and satellite providers, DVDs and other emerging technologies and products related to content distribution. Our content distribution platforms and services face significant competition from services, such as peer-to-peer and content aggregator services, which allow consumers to directly access an expansive array of content without securing licenses from content providers.
10
Table of Contents
Some of our current or future competitors may have significantly greater financial, technical, marketing and other resources than we do, may enjoy greater brand recognition than we do, or may have more experience or advantages than we have in the markets in which they compete. For example, companies such as Amazon.com, Apple Computer, Google, Microsoft, Sony, Yahoo! and Adobe Systems may have competitive advantages over us because of their greater size and resources and the strength of their respective brand names. In addition, some of our current or potential competitors, such as Apple Computer, Dolby Laboratories, Microsoft and Sony, may be able to offer integrated system solutions in certain markets for entertainment technologies, including audio, video and rights management technologies related to personal computers or the Internet, which could make competing products and technologies that we develop unnecessary. By offering an integrated system solution, these potential competitors also may be able to offer competing products and technologies at lower prices than our products and technologies. Further, many of the consumer hardware and software products that include our technologies also include technologies developed by our competitors. As a result, we must continue to invest significant resources in product development in order to enhance our technologies and our existing products and introduce new high-quality technologies and products to meet the wide variety of such competitive pressures.
Significant Customers
A small number of customers account for a significant percentage of our total net revenues. In 2009, Samsung Corporation, Ltd. and Sony Corporation accounted for 13% and 12%, respectively, of our total net revenues. In 2008, Yahoo! Inc. and LG Electronics, Inc. accounted for 19% and 11%, respectively, of our total net revenues. In 2007, Google, Inc. and LG Electronics, Inc. accounted for 19% and 10%, respectively, of our total net revenues.
Intellectual property
To protect our proprietary rights, we rely on a combination of trademark, copyright, patent, trade secret and other intellectual property laws; employment, confidentiality and invention assignment agreements with our employees and contractors; and confidentiality agreements and protective contractual provisions with our partners, licensees and other third parties.
Trademarks. As of December 31, 2009, we had over 100 trademark registrations and over 90 pending trademark applications in more than 40 countries, including the U.S., for a variety of word marks, logos and slogans. Our trademarks are an integral part of our licensing program. Licensees are allowed to place our trademarks on their products to inform customers that their products incorporate our technology and meet our quality specifications only if such products have been DivX Certified. We also require that our licensees adhere to detailed branding guidelines to ensure that usage of our trademarks and logos are consistent and uphold our image. Our trademarks include, among others, DivX, DivX Certified, DivX Ultra, DivX Plus HD, DivX TV, and DivX Connected.
Copyrights. We have a significant amount of copyright-protected materials, including among other things, software, codecs and textual material. As an additional layer of protection to the common law copyrights we own in our software and other materials, we have also obtained U.S. copyright registrations on more than 20 software products as of December 31, 2009.
Patents. Patents provide important protections to certain of our technologies. As of December 31, 2009, we had six issued U.S. patents and two issued foreign patents. We also hold an exclusive license to one additional U.S. patent. Assuming that all of the appropriate maintenance, renewal, annuity or other governmental fees are paid, we expect that our patents and the patent to which we hold an exclusive license would expire between 2019 and 2027, excluding any additional term for patent term adjustments or patent term extensions. We are in the process of applying for additional patent coverage for various aspects of our technology, including technologies for digital rights management, digital media formats, mobile content delivery, connected devices and video encoding and decoding. As a result, as of December 31, 2009, we had dozens of U.S. and international patent applications on file relating to various aspects of our technology.
11
Table of Contents
Other proprietary rights. Many of our consumer hardware licensees and other partners have contractually recognized our proprietary rights in the file identifiers that identify video content files as encoded using our codec. For instance, a video file encoded using our codec may be identified with a “DIVX” code that can be read and recognized by a consumer hardware device or PC video player. Such consumer hardware licensees and partners have also contractually agreed to limit playback of such “DIVX”-identified files to devices that incorporate our technologies. These contractual agreements enable us to differentiate DivX devices and video files from non-DivX devices and video files.
In addition, we also seek to maintain certain intellectual property and proprietary know-how as trade secrets, and generally require our partners to execute non-disclosure agreements prior to any substantive discussions or disclosures of our technology.
MPEG LA technology licenses. We have entered into a license agreement with MPEG LA, effective January 2000, under its MPEG-4 Part 2 Visual Patent Portfolio. Under this license agreement, we have a royalty-bearing, worldwide, non-exclusive sublicense of certain patents licensed to MPEG LA relating to MPEG-4 technology. One version of our video codec incorporates technologies implementing a portion of the MPEG-4 video standard. Our license agreement with MPEG LA will expire on December 31, 2013, unless the agreement is earlier terminated. We may terminate the license agreement for any reason by providing 30 days prior written notice to MPEG LA. Upon expiration, the license agreement may be renewed by MPEG LA for successive five year periods upon notice of renewal to us. We have also entered into a license agreement with MPEG LA, effective August 2002, under its MPEG-4 Part 10, or AVC, Patent Portfolio. Under this license agreement, we have a royalty-bearing, worldwide, non-exclusive sublicense of certain patents licensed to MPEG LA relating to H.264 technology. The newest version of our video codec, the DivX Plus codec, incorporates technologies implementing a portion of the AVC video standard. Our license agreement with MPEG LA with respect to this technology will expire on December 31, 2010, unless the agreement is earlier terminated. We may terminate the license agreement for any reason by providing 30 days prior written notice to MPEG LA. Upon expiration, the license agreement may be renewed by MPEG LA for successive five year periods upon notice of renewal to us. For the years 2009, 2008, and 2007 we expensed $7.4 million, $2.0 million, and $2.0 million respectively, related to these MPEG LA license agreements. We also expect to incur expenses of approximately $7.4 million in 2010 under these MPEG LA license agreements.
Government regulation
We are subject to a number of foreign and domestic laws and regulations that affect companies that import or export software and technology, including encryption technology, such as the U.S. export control regulations as administered by the U.S. Department of Commerce.
We are also subject to a number of foreign and domestic laws that affect companies conducting business on the Internet. In addition, because of the increasing popularity of the Internet and the growth of online services, laws relating to user privacy, freedom of expression, content, advertising, information security and intellectual property rights are being debated and considered for adoption by many countries throughout the world.
In the U.S., online service providers have been subject to claims of defamation, libel, invasion of privacy and other data protection claims, tort, unlawful activity, copyright or trademark infringement, or other theories based on the nature and content of the materials searched and the ads posted or the content generated by users. In addition, several other federal laws could have an impact on our business. For example, the Digital Millennium Copyright Act has provisions that limit, but do not eliminate, our liability for hosting or linking to third-party websites that include materials that infringe copyrights or other rights, so long as we comply with the statutory requirements of this act. The Children’s Online Privacy Protection Act restricts the ability of online services to collect information from minors, and the Protection of Children from Sexual Predators Act of 1998 requires online service providers to report evidence of violations of federal child pornography laws under certain circumstances.
12
Table of Contents
In addition, the application of existing laws regulating or requiring licenses for certain businesses of our advertisers can be unclear. Existing or new legislation could expose us to substantial liability and restrict our ability to deliver services to our users. We also face risks from legislation that could be passed in the future.
We may be further subject to international laws associated with data protection and other aspects of our business in Europe and elsewhere and the interpretation and application of data protection laws is still uncertain and in flux. In addition, because our services are accessible worldwide, foreign jurisdictions may claim that we are required to comply with their laws.
Employees
As of December 31, 2009, we employed 343 full-time and part-time employees. None of our employees is subject to any collective bargaining agreements. We consider our relationship with our employees to be good.
Executive Officers of the Registrant
Our executive officers serve at the discretion of the Board. The names of our executive officers and their ages, titles, and biographies as of December 31, 2009 are set forth below:
| Name |
Age | Position | ||
| Kevin Hell |
45 | CEO, Director | ||
| Dan L. Halvorson |
44 | CFO and EVP Operations | ||
| David J. Richter |
41 | EVP, Business & Legal Affairs and General Counsel |
Kevin Hell has served as our CEO and a Director since October 2007. From July 2007 to October 2007, Mr. Hell served as our Acting CEO. Between 2002 and 2007, Mr. Hell held a number of management positions within the Company including Chief Marketing Officer and Managing Director, Chief Operating Officer, the Company’s CXO for Partners and Licensing, and President. Mr. Hell is currently responsible for our corporate strategy and overall strategic direction. From July 2001 to May 2002, Mr. Hell served as Senior Vice President of Product Management in the Solutions Group of Palm, a handheld solutions company. From May 1999 to May 2001, Mr. Hell was Vice President of the Connected Home division and Vice President of Corporate Strategy at Gateway Computer, a personal computer manufacturing company. From May 1991 to May 1999, Mr. Hell worked in the Los Angeles office of the Boston Consulting Group, a management consulting firm. Mr. Hell received an M.B.A. from The Wharton School, and a master’s degree in Aeronautics and Astronautics and a B.S. in Mechanical Engineering from Stanford University.
Dan L. Halvorson has served as our Executive Vice President and Chief Financial Officer since July 2007. Mr. Halvorson was promoted to Chief Financial Officer and Executive Vice President Operations in November 2009. From June 2007 to July 2007, Mr. Halvorson served as our Chief Financial Officer and Senior Vice President. Mr. Halvorson is responsible for investor relations, financial and administrative aspects of our strategic and tactical goals, and for management of several operations teams including oversight for MainConcept, the commercial licensing business for DivX, with international operations in Germany and Russia. Mr. Halvorson has served in many senior finance and accounting roles at a number of public companies including various roles from 2000 to 2007 at Novatel Wireless where he was promoted to Chief Financial Officer and Chief Accounting Officer in early 2004. From 1998 to 2000, he was Director of Finance at Dura Pharmaceuticals, which was acquired by Elan in 2000. He was also Director of Finance at Alliance Pharmaceuticals from 1996 to 1998. Previous to his public company roles, Mr. Halvorson spent eight years in public accounting at Deloitte & Touche and PriceWaterhouseCoopers, serving both public and private client companies. Mr. Halvorson is a Certified Public Accountant and holds a Bachelor of Science from San Diego State University.
David J. Richter has served as our Executive Vice President, Business & Legal Affairs and General Counsel since January 2010. Mr. Richter served as our Executive Vice President, Business &Legal Affairs from March 2009 until
13
Table of Contents
January 2010 and prior to that, he served as Executive Vice President, Corporate Development and Legal since July 2007. From June 2007 to July 2007, Mr. Richter served as our General Counsel and Senior Vice President Corporate Development. From April 2006 to June 2007, Mr. Richter served as our General Counsel, Legal and Corporate Development. From May 2004 to April 2006, Mr. Richter served as our General Counsel and, in addition, from January 2005 through April 2006, as our Senior Vice President, Corporate Development. Mr. Richter is responsible for the following teams: legal, business and corporate development, and software product development efforts. Previously, Mr. Richter worked at Maveron, a venture capital firm, as a Principal from January 2002 through March 2004 and as Director, Business Development from July 2000 through December 2001. Mr. Richter received a J.D. from Yale Law School and a B.A. in Government from Cornell University.
Available Information
Our annual reports on Form 10-K, quarterly reports on Form 10-Q, current reports on Form 8-K and all amendments to those reports filed or furnished pursuant to Section 13(a) or 15(d) of the Securities Exchange Act of 1934, or the Exchange Act, are available free of charge on our website (www.divx.com) as soon as reasonably practicable after they are electronically filed with, or furnished to, the SEC.
Before you decide to invest or maintain an interest in our common stock, you should consider carefully the risks described below, together with the other information contained in this Annual Report on Form 10-K. We believe the risks described below are the risks that are material to us as of the date of this Annual Report on Form 10-K. If any of the following risks comes to fruition, our business, financial condition, results of operations and future growth prospects would likely be materially and adversely affected. In these circumstances, the market price of our common stock could decline and you may lose all or part of your investment.
Risks Related to our Business
Our business and prospects depend on the strength of our brand, and if we do not maintain and strengthen our brand, we may be unable to maintain or expand our business.
Maintaining and strengthening the “DivX” brand is critical to maintaining and expanding our business, as well as to our ability to enter into new markets for our technologies and products. If we fail to promote and maintain the DivX brand successfully, our ability to sustain and expand our business and enter into new markets will suffer. Maintaining and strengthening our brand will depend heavily on our ability to continue to develop and provide innovative and high-quality technologies and products for consumers, content owners, consumer hardware device manufacturers and software vendors. Moreover, because we engage in relatively little direct brand advertising, the promotion of our brand depends, among other things, upon hardware device manufacturing partners displaying our trademarks on their products. If these partners choose for any reason not to display our trademarks on their products, or if our partners use our trademarks incorrectly or in an unauthorized manner, the strength of our brand may be diluted or our ability to maintain or increase our brand awareness may be harmed. In addition, if we fail to maintain high-quality standards for products that incorporate our technologies through the quality-control certification process that we require of our licensees, or if we take other steps to commercialize our products and services that our customers or potential customers reject, the strength of our brand could be adversely affected. Further, unauthorized third parties may use our brand in ways that may dilute or undermine its strength.
We expect the market for DVD players to decline as new products are introduced into the market. To the extent that sales of DVD players decline, or alternative technologies in which we do not participate replace DVDs as a dominant medium for consumer video entertainment, our licensing revenue will be adversely affected.
Growth in our revenue over the past several years has been the result, in large part, of the rapid growth in sales of red-laser DVD players incorporating our technologies. For years 2009, 2008 and 2007, we derived approximately
14
Table of Contents
70%, 66% and 70%, respectively, of our total net revenues from technology licensing to consumer hardware device manufacturers, a majority of which are derived from sales of red-laser DVD players incorporating our technologies. However, as the markets for DVD players mature, we expect sales of red-laser DVD players to decline. To the extent that sales of red-laser DVD players decline, our licensing revenue will be adversely affected. In addition, if new technologies are developed for use with DVDs or new technologies are developed that substantially compete with or replace red-laser DVDs as a dominant medium for consumer video entertainment such as the Blu-ray Disc, and if we are unable to develop and successfully market technologies that are incorporated into or compatible with such new technologies, our ability to generate revenues will be adversely affected.
If we are unable to penetrate existing consumer electronics markets or adapt or develop technologies and products for new markets, our business prospects could be limited.
We expect that our future success will depend, in part, upon our ability to successfully penetrate existing markets for digital media technologies, including:
| • | DVD players and recorders; |
| • | MP3 devices; |
| • | Blu-ray players; |
| • | portable media players; |
| • | digital still cameras; |
| • | digital camcorders; |
| • | mobile handsets; |
| • | digital media software applications; |
| • | digital TVs; |
| • | home media centers; |
| • | set-top boxes; |
| • | multi-media storage devices; and |
| • | video game consoles. |
To date, we have penetrated only some of these markets, including the markets for DVD players, Blu-ray players, portable media players, digital still cameras, digital TVs, mobile handsets, digital media software applications, set-top boxes, multi-media storage devices and video game consoles. Our success depends upon our ability to further penetrate these markets, some of which we have only penetrated to a limited extent, and to successfully penetrate those markets in which we currently have no presence. Demand for our technologies in any of these developing markets may not grow or develop, and a sufficiently broad base of consumers and professionals may not adopt or continue to use our technologies. In addition, our ability to generate revenue from these markets may be limited to the extent that service providers in these markets choose to provide competitive technologies and entertainment at little or no cost. Because of our limited experience in certain of these markets, we may not be able to adequately adapt our business and our technologies to the needs of consumers and licensees in these markets.
We face significant competition in various markets, and if we are unable to compete successfully, our ability to generate revenues from our business will suffer.
We face significant competition in the digital media markets in which we operate. We believe that our most significant competitive threat comes from companies that have the collective financial, technical and other
15
Table of Contents
resources to develop the technologies, services, products and partnerships necessary to create a digital media ecosystem that can compete with the DivX ecosystem. Those potential competitors currently include Adobe Systems, Apple Computer, Google, Microsoft, and Yahoo!.
We also compete with companies that offer products or services that compete with specific aspects of our digital media ecosystem. For example, our digital rights management technology competes with technologies from companies such as Apple Computer, ContentGuard, Intertrust Technologies, Microsoft, Nagra Audio, NDS Group and 4C Entity, as well as the internal development efforts of certain of our licensees. Similarly, content distribution providers, such as Amazon.com, Apple Computer, Google, Joost, MovieLink, a subsidiary of Blockbuster Inc., MySpace.com, a subsidiary of News Corporation, Netflix, Yahoo!, YouTube, a subsidiary of Google, Hulu, LLC and subscription entertainment services and cable and satellite providers compete with our content distribution services. In addition, we compete with companies such as Yahoo!, VUDU, Inc., Boxee, Inc. and Rovi Corporation and with internally developed proprietary solutions developed by hardware device manufacturers and integrated circuit manufacturers in our development and marketing of technologies to enable the next generation of Internet-enabled consumer electronics devices.
Our proprietary technologies also compete with other video compression technologies, including other implementations of MPEG-4 or implementations of H.264/AVC. In addition, a number of companies such as Adobe Systems, Apple Computer, Ateme, Google, Microsoft, and RealNetworks offer video formats that compete with our proprietary video format.
We also face competition from subscription entertainment services, cable and satellite providers, DVDs and other emerging technologies and products related to content distribution. Our content distribution platforms and services face significant competition from services, such as peer-to-peer and content aggregator services, which allow consumers to directly access an expansive array of content without securing licenses from content providers.
Some of our current or future competitors may have significantly greater financial, technical, marketing and other resources than we do, may enjoy greater brand recognition than we do, or may have more experience or advantages than we have in the markets in which they compete. For example, companies such as Amazon.com, Apple Computer, Google, Microsoft, Sony, Yahoo! and Adobe Systems may have competitive advantages over us because of their greater size and resources and the strength of their respective brand names. In addition, some of our current or potential competitors, such as Apple Computer, Dolby Laboratories, Microsoft and Sony, may be able to offer integrated system solutions in certain markets for entertainment technologies, including audio, video and rights management technologies related to personal computers or the Internet, which could make competing products and technologies that we develop unnecessary. By offering an integrated system solution, these potential competitors also may be able to offer competing products and technologies at lower prices than our products and technologies. Further, many of the consumer hardware and software products that include our technologies also include technologies developed by our competitors. As a result, we must continue to invest significant resources in product development in order to enhance our technologies and our existing products and introduce new high- quality technologies and products to meet the wide variety of such competitive pressures. Our ability to generate revenues from our business will suffer if we fail to do so successfully.
We are dependent on the sale by our licensees of consumer hardware and software products that incorporate our technologies. Our top 10 licensees by revenue accounted for approximately 58% of our total net revenues during the year 2009, and a reduction in revenues from those licensees or a loss of one or more of our key licensees would adversely affect our licensing revenue.
We derive most of our revenue from the licensing of our technologies to consumer hardware device manufacturers, software vendors and consumers. We derived 92%, 80% and 78% of our total net revenues from licensing our technology during years 2009, 2008 and 2007, respectively. One or a small number of our licensees generally represents a significant percentage of our technology licensing revenues. For example, in 2009,
16
Table of Contents
Samsung and Sony accounted for approximately 13% and 12% of our total net revenues, respectively, and our top 10 licensees by revenue accounted for approximately 58% of our total net revenues. Our technology licensing revenues are particularly dependent upon our relationships with consumer hardware device manufacturers. We cannot control consumer hardware device manufacturers’ and software developers’ product development or commercialization efforts or predict their success. Our license agreements typically require manufacturers of consumer hardware devices and software vendors to pay us a specified royalty for every shipped consumer hardware or software product that incorporates our technologies, but many of these agreements do not require these manufacturers to guarantee us a minimum royalty in any given period. Accordingly, if our licensees sell fewer products incorporating our technologies, or otherwise face significant economic difficulties, our licensing revenues will be adversely affected. Additionally, certain of our license agreements provide for specific royalties based on our estimations of the volumes of certain units consumer hardware device manufacturers are likely to ship during a given term; if our estimates are too low, the actual per-unit revenues received may be lower than expected. Also, certain of our OEM partners have sought to enter into a site license with us, pursuant to which the OEM partner pays a flat royalty fee for use of certain of our technology. If we underestimate the use of our technology by one of our site license partners, the flat royalty rate that we charge may be too low and our revenues may be adversely affected. Our license agreements are generally for two years or less in duration, and a significant number of these agreements expire in any given quarter. Upon expiration of their license agreements, manufacturers and software developers may not renew their agreements or may elect not to enter into new agreements with us on terms as favorable as our current agreements.
Revenues under our promotion and distribution agreement with Google, entered into in March 2009, represented approximately 8% of our total net revenues in 2009. A termination of our promotion and distribution agreement with Google or our failure to renew or replace this agreement would significantly decrease our revenues.
In March 2009, we entered into a promotion and distribution agreement with Google pursuant to which we distribute Google products, including among others the Google Chrome web browser, with our software products, and Google pays us fees based on successful activations of these products. Since March 2009, we have relied on this relationship with Google for a significant portion of our revenue. Revenue derived from the agreement represented approximately 8% of our total net revenues in 2009. If Google’s products do not prove to be as popular among consumers as we anticipate, if our products decline in popularity among consumers, or if Google’s products reach market saturation, we may experience a decrease in revenue under our agreement with Google. In addition, our ability to continue to generate revenues under the agreement is limited by a cap on the total amounts payable by Google under the agreement, after which Google is relieved of further obligations to pay us for successful activations or otherwise. If we meet this cap, our revenues in subsequent periods may decrease. This agreement expires upon the earlier of February 28, 2011 or the date upon which we reach the cap on the total amounts payable by Google to us under the agreement, and Google is under no obligation to renew this agreement. If, upon the expiration of our agreement with Google, we fail to enter into a new agreement with Google or a similar partner on substantially the same or more favorable terms, our future revenues will significantly decrease.
The success of our business depends in part on the availability of premium video content in the DivX format.
To date, only five Hollywood motion picture studios have agreed to make certain video content available in the DivX media format. If we, and/or our consumer electronics partners or retail partners, fail to implement certain technological safeguards mandated under those deals, such format approval agreements may be suspended or terminated, either of which could negatively impact our business. The implementation of these changes could potentially be viewed negatively by consumers and as a result our business could suffer. Additionally, the distribution of such DivX-formatted video content is dependent on third party retailers’ willingness to enter into distribution deals with one or more of our studio partners and DivX and ultimately upon the willingness of consumers to purchase such content from such third party retailers. Finally, our business success depends upon our ability to reach agreement with other major motion picture studios to make their content available in the
17
Table of Contents
DivX media format. In the event that we fail to reach agreement with such studios, the DivX format may become less compelling to consumers and to retailers and potentially to consumer electronics licensees of DivX.
The success of our business depends on the interoperability of our technologies with consumer hardware devices.
To be successful we design our digital media platform to interoperate effectively with a variety of consumer hardware devices, including personal computers, DVD players and recorders, Blu-ray players, digital still cameras, digital camcorders, portable media players, digital TVs, home media centers, set-top boxes, video game consoles, MP3 devices, multi-media storage devices and mobile handsets. We depend on significant cooperation with manufacturers of these devices and the components integrated into these devices, as well as software providers that create the operating systems for such devices, to incorporate our technologies into their product offerings and ensure consistent playback of DivX-encoded files. Currently, a limited number of devices are designed to support our technologies. If we are unsuccessful in causing component manufacturers, device manufacturers and software providers to integrate our technologies into their product offerings, our technologies may become less accessible to consumers, which would adversely affect our revenue potential.
If we fail to develop and deliver innovative technologies and products in response to changes in our industry, including changes in consumer tastes or trends, our revenues could decline.
The markets for our technologies and products are characterized by rapid change and technological evolution. We will need to expend considerable resources on product development in the future to continue to design and deliver enduring and innovative technologies and products. Despite our efforts, we may not be able to develop and effectively market new technologies and products that adequately or competitively address the needs of the changing marketplace. In addition, we may not correctly identify new or changing market trends at an early enough stage to capitalize on market opportunities. At times such changes can be dramatic. Our future success depends to a great extent on our ability to develop and deliver innovative technologies that are widely adopted in response to changes in our industry and that are compatible with the technologies or products introduced by other participants in our industry. If we fail to deliver innovative technologies, we may be unable to meet changes in consumer tastes or trends, which could decrease our revenues.
Our licensing revenue depends in large part upon integrated circuit manufacturers incorporating our technologies into their products for sale to our consumer hardware device manufacturer licensees and if our technologies are not incorporated in these integrated circuits or fewer integrated circuits are sold that incorporate our technologies, our revenues will be adversely affected.
Our licensing revenue from consumer hardware device manufacturers depends in large part upon the availability of integrated circuits that incorporate our technologies. Integrated circuit manufacturers incorporate our technologies into their products, which are then incorporated into consumer hardware devices. We do not manufacture integrated circuits, but rather depend on integrated circuit manufacturers to develop, produce and sell these products to licensed consumer hardware device manufacturers. We do not control the integrated circuit manufacturers’ decision whether or not to incorporate our technologies into their products, and we do not control their product development or commercialization efforts. If we fail to develop new technologies that adequately or competitively address the needs of consumer electronics manufacturers and the needs of the changing marketplace, integrated circuit manufacturers may not be willing to implement our technologies into their products. The process utilized by integrated circuit manufacturers to design, develop, produce and sell their products is generally 12 to 18 months in duration. As a result, if an integrated circuit manufacturer is unwilling or unable to implement our technologies into an integrated circuit that it is producing, we may experience significant delays in generating revenue while we wait for that manufacturer to begin development of a new integrated circuit that may incorporate our technologies. In addition, while the design cycles utilized by integrated circuit manufacturers are typically long, the life cycles of our technologies tend to be short as a result of the rapidly changing technology environment in which we operate. If integrated circuit manufacturers are
18
Table of Contents
unable or unwilling to implement technologies we develop into their products, or if they sell fewer products incorporating our technologies, our revenues will be adversely affected. In addition, if integrated circuit manufacturers incorporate our technology in new ways that make reporting or tracking more difficult, it could adversely affect our ability to collect revenues.
Our business is dependent in part on technologies we license from third parties, and these license rights may be inadequate for our business.
Certain of our technologies and products are dependent in part on the licensing and incorporation of technologies from third parties. For example, we have entered into license agreements with MPEG LA pursuant to which we have acquired rights to use in our technologies and products certain MPEG-4 and AVC intellectual property licensed to MPEG LA. Our licensing agreements with MPEG LA grant us sublicenses only to the rights in the relevant intellectual property licensed to MPEG LA. There are other parties who have competing rights to MPEG-4 and AVC intellectual property, and to the extent that the rights of such other parties conflict with or are superior to the rights licensed to MPEG LA, our rights to utilize MPEG-4 or AVC technology in our technologies and products could be challenged. Our license agreement with MPEG LA, under its MPEG-4 Part 2 Visual Patent Portfolio will expire on December 31, 2013. Our license agreement with MPEG LA, under its MPEG-4 Part 10, or AVC, Patent Portfolio will expire on December 31, 2010. MPEG LA has the right to renew each of these license agreements for successive terms of five years, upon notice to us.
If the technology we license fails to perform as expected, if key licensors do not continue to support their technology or intellectual property because the licensor has gone out of business or otherwise, if a licensor determines not to renew a license agreement upon expiration or if it is determined that any of our licensors are not entitled to license to us any of the technologies or intellectual property that are subject to our current license agreements, then we may incur substantial costs in replacing the licensed technologies or intellectual property or fall behind in our development schedule while we search for a replacement. In addition, replacement technology may not be available for license on commercially reasonable terms, or at all.
In addition, our agreements with licensors generally require us to give them the right to audit our calculations of royalties payable to them. If a licensor challenges the basis of our calculations, the amount of royalties we have to pay them could increase. Any royalties paid as a result of a successful challenge would increase our expenses and could impair our ability to continue to use and re-license technologies or intellectual property from that licensor.
We rely on our licensees to accurately prepare royalty reports for our determination of licensing revenues, and if these reports are inaccurate, our revenues may be under- or over-stated and our forecasts and budgets may be incorrect.
Our licensing revenues are generated primarily from consumer hardware device manufacturers and software vendors who license our technologies and incorporate them into their products. Under these arrangements, these licensees typically pay us a specified royalty for every consumer hardware or software product they ship that incorporates our technologies. We rely on our licensees to accurately report the number of units shipped. We calculate our license fees, prepare our financial reports, projections and budgets, and direct our sales and technology development efforts based in part on these reports. However, it is often difficult for us to independently determine whether or not our licensees are reporting shipments accurately. This is especially true with respect to software incorporating our technologies because software can be copied relatively easily and we often do not have ways to readily determine how many copies have been made. Licensees in specific countries, including China, have a history of underreporting or failing to report shipments of their products that incorporate our technologies. Most of our license agreements permit us to audit our licensees’ records, but audits are generally expensive and time consuming. We have initiated, and intend to initiate, audits with certain of our licensees to determine whether their shipment reports for past periods were accurate. Such audits could harm our relationships with our licensees or may result in the cancellation or termination of our agreements with such
19
Table of Contents
licensees. In addition, the license agreements that we have entered into with most of our licensees impose restrictions on our audit rights, such as limitations on the number of audits we may conduct. To the extent that our licensees understate or fail to report the number of products incorporating our technologies that they ship, we will not collect and recognize revenue to which we are entitled. Alternatively, we have experienced limited instances in which a customer has notified us that it previously reported and paid royalties on units in excess of what the customer actually shipped. In such cases, the customer requested, and we granted, a credit for the excess royalties paid. If a similar event occurs in the future, we may be required to record the credit as a reduction in revenue in the period in which it is granted, and such a reduction could be material.
Current credit and financial market conditions could delay, or prevent consumers from purchasing products incorporating our licensed technology, which could continue to adversely affect our business, financial condition and results of operations.
Our operations and performance depend significantly on worldwide economic conditions. Uncertainty about current global economic conditions pose a risk as consumers may postpone spending and our licensees may postpone producing products incorporating our technology in response to tighter credit and negative financial news, which could have a material negative effect on demand for our products. These and other economic factors have impacted our results and may have a significant impact on our financial condition and operating results in the future.
The current financial turmoil affecting the banking system and financial markets and the possibility that additional financial institutions may consolidate or go out of business has resulted in a tightening in the credit markets, a low level of liquidity in many financial markets, and extreme volatility in fixed income, credit, currency and equity markets. There could be a number of follow-on effects from the credit crisis on our business, including the insolvency of our licensees or their key suppliers or the inability of our licensees to obtain credit to finance development and/or manufacture products that incorporate our technology. In addition, due to the recent tightening of credit markets and concerns regarding the availability of credit, the markets for consumer hardware and software products in which our technologies are incorporated may be negatively affected and consumers may be delayed in obtaining, or may not be able to obtain, necessary credit for their purchases of the consumer hardware and software products that incorporate our technologies, which could in turn result in reduction in shipments by our licensees. Such reductions would adversely affect our licensing and other revenue. If conditions become more severe or continue longer than we anticipate, our forecasted demand may not materialize to the levels we require to achieve our anticipated financial results, which could in turn have a material adverse effect on our revenue, profitability and the market price of our stock.
Any development delays or cost overruns may affect our ability to respond to technological changes, competitive developments or customer requirements and expose us to other adverse consequences.
We have experienced development delays and cost overruns in our development efforts in the past and we may encounter such problems in the future. Delays and cost overruns could affect our ability to respond to technological changes, competitive developments or customer requirements. Also, our technologies and products may contain undetected errors that could cause increased development costs, loss of revenue, adverse publicity, reduced market acceptance of our technologies and products or lawsuits by participants in the consumer hardware or software industries or consumers.
We conduct a substantial portion of our business outside North America and, as a result, we face diverse risks related to engaging in international business.
We have offices in ten foreign countries as well as sales staff in others, and we are dedicating a significant portion of our sales efforts in countries outside North America. We are dependent on international sales for a substantial amount of our total revenues. For the years 2009, 2008 and 2007, our net revenue outside North America comprised 81%, 74% and 77%, respectively, of our total net revenues. We expect that international
20
Table of Contents
sales will continue to represent a substantial portion of our revenues for the foreseeable future. These future international revenues will depend to a large extent on the continued use and expansion of our technologies in entertainment industries worldwide. Increased worldwide use of our technologies is also an important factor in our future growth. We are investing resources into expanding the reach of our technologies into the markets of foreign countries where our technologies have not yet been widely adopted. We may not be successful in our efforts to penetrate new international markets for our products.
We are subject to the risks of conducting business internationally, including:
| • | our ability to enforce our contractual and intellectual property rights, especially in those foreign countries that do not respect and protect intellectual property rights to the same extent that the United States does, which increases the risk of unauthorized and uncompensated use of our technology; |
| • | United States and foreign government trade restrictions, including those that may impose restrictions on importation of programming, technology or components to or from the United States; |
| • | foreign government taxes, regulations and permit requirements, including foreign taxes that we may not be able to offset against taxes imposed upon us in the United States, and foreign tax and other laws limiting our ability to repatriate funds to the United States; |
| • | foreign labor laws, regulations and restrictions; |
| • | changes in diplomatic and trade relationships; |
| • | difficulty in staffing and managing foreign operations; |
| • | fluctuations in foreign currency exchange rates and interest rates, including risks related to any interest rate swap or other hedging activities we undertake; |
| • | political instability, natural disasters, war and/or events of terrorism; and |
| • | the strength of international economies. |
We face risks with respect to conducting business in China due to China’s historically limited recognition and enforcement of intellectual property and contractual rights.
We currently have direct license relationships with many consumer hardware device manufacturers located in China. In addition, a number of the OEMs that license our technologies utilize captive or third-party manufacturing facilities located in China. We expect this to continue in the future as consumer hardware device manufacturing in China continues to increase due to its lower manufacturing cost structure as compared to other industrialized countries. As a result, we face many risks in China, in large part due to China’s historically limited recognition and enforcement of contractual and intellectual property rights. In particular, we have experienced, and expect to continue to experience, problems with China-based consumer hardware device manufacturers underreporting or failing to report shipments of their products that incorporate our technologies, or incorporating our technologies or trademarks into their products without our authorization or without paying us licensing fees. We may also experience difficulty enforcing our intellectual property rights in China, where intellectual property rights are not as respected as they are in the United States, Japan and Europe. Unauthorized use of our technologies and intellectual property rights may dilute or undermine the strength of our brand. Further, if we are not able to adequately monitor the use of our technologies by China-based consumer hardware device manufacturers, or enforce our intellectual property rights in China, our revenue potential could be adversely affected.
Pricing pressures on the consumer hardware device manufacturers and software vendors who incorporate our technologies into their products could limit the licensing fees we charge for our technologies and adversely affect our revenues.
The markets for the consumer hardware and software products in which our technologies are incorporated are intensely competitive and price sensitive. For example, retail prices for consumer hardware devices that include
21
Table of Contents
our digital media platform, such as DVD players, have decreased significantly in recent years, and we expect prices to continue to decrease for the foreseeable future. In response, consumer hardware device manufacturers and software vendors have sought to reduce their product costs, which can result in downward pressure on the licensing fees we charge our licensees who incorporate our technologies into the consumer hardware and software products that they sell. In addition, we have experienced erosion in the average royalty we can charge for specific versions of our technologies to our OEM partners since the release of these technologies. To maintain higher overall per unit royalties, we must continue to introduce new, more highly functional versions of our products for which we can charge a higher royalty. Any inability to introduce such products in the future or other declines in the royalties we charge would adversely affect our revenues.
Digital video technologies could be treated as a commodity in the future, which could expose us to significant pricing pressure.
We believe that the success we have had licensing our digital video technologies to consumer hardware device manufacturers and software vendors is due, in part, to the strength of our brand and the reputation that our technologies have for providing a high-quality video solution. However, as applications that incorporate digital video technologies become increasingly prevalent, we expect more competitors to enter this field with other solutions. Furthermore, to the extent that competitors’ solutions are perceived, accurately or not, to provide the same or greater advantages as our technologies, at a lower or comparable price, there is a risk that video encoding and decoding technologies such as ours will be treated as commodities, exposing us to significant pricing pressure.
Current and future government standards or standards-setting organizations may limit our business opportunities.
Various national governments have adopted or are in the process of adopting standards for digital television broadcasts, including cable and satellite broadcasts. In the event national governments adopt similar standards for video codecs used in consumer hardware devices, software products or Internet applications, our technology may be excluded from such standards. We have not made any efforts to have our technologies adopted as standards by any national governments, nor do we currently expect that our technologies will be adopted as standards by any national government in the future. If national governments adopt standards that exclude our technologies, we will be required to redesign our technologies to comply with such government standards to allow our products to be utilized in those countries. Costs or potential delays in the development of our technologies and products to comply with such government standards could significantly increase our expenses. In addition, standards-setting organizations are adopting or establishing formal technology standards for use in a wide range of consumer hardware devices, software products and Internet applications. We do not typically participate in standards- setting organizations, nor do we typically seek to have our technologies adopted as industry standards. As such, participants in the consumer hardware or software industries or consumers may elect not to purchase our technologies because they have not been adopted by standards-setting organizations or if a competing technology is adopted as an industry standard.
Our business depends in part upon our ability to provide effective digital rights management technology.
Our business depends in part upon our ability to provide effective digital rights management technology that controls access to digital content that addresses, among other things, content providers’ concerns over piracy. We cannot be certain that we can continue to develop, license or acquire such technology, or that content licensors, consumer hardware device manufacturers or consumers will accept such technology. In addition, consumers may be unwilling to accept the use of digital rights management technology that limits their use of content, especially with large amounts of free content readily available. We may need to license digital rights management technology from third parties to support our technologies and products. Such technology may not be available to us on reasonable terms, or at all. If digital rights management technology is not effective, is perceived as not effective or is compromised by third parties, or if laws are enacted that require digital rights management
22
Table of Contents
technology to allow consumers to convert content stored in a protected format into an unprotected format, content providers may not be willing to encode their content using our products and consumer hardware device manufacturers may not be willing to include our technologies in their products.
We have offered and we expect to continue to offer some of our products and technologies for reduced prices or free of charge, and we may not realize the benefits of this marketing strategy.
We have offered and expect to continue to offer some of our products and technologies to consumers for reduced prices or free of charge as part of our overall strategy of developing a digital media ecosystem and promoting additional penetration of our products and technologies into the markets in which we compete. If we offer such products and technologies at reduced prices or free of charge, we will forego all or a portion of the revenue from licensing these products, and we may not realize the intended benefits of this marketing strategy.
Our online video communities and distribution services and platforms are rapidly evolving and may not prove viable.
Online video distribution is a relatively new enterprise, and successful business models for delivering digital media over the Internet are not fully tested. We have not scaled any of our distribution or community services or platforms to a material size. We may fail to develop a viable business model that properly monetizes our technology platforms for online video communities.
We may experience changes in the size of our organization, and we may experience difficulties in managing growth or contraction.
As of December 31, 2009 we had 343 full-time and part-time employees. We may need to expand or contract our managerial, operational, financial and other resources to manage our business, including our relationships with key customers and licensees. Our current facilities and systems may not be the correct size to support this future growth or contraction. We may require additional office space to accommodate our growth. Additional office space may not be available on commercially reasonable terms and may result in a disruption of our corporate culture. Our need to effectively manage our operations, growth and various projects requires that we continue to improve our operational, financial and management controls, reporting systems and procedures and to attract and retain sufficient numbers of talented employees. We may be unable to successfully implement these tasks on a larger scale, which could prevent us from executing our business strategy.
We may experience changes in our senior management which may disrupt our operations.
We may experience disruptions in our operations as a result of changes in our senior management and as the new members of our management team become acclimated to their roles and to our company in general. If we experience any of these disruptions or a loss of management attention to our core business, our operating results could be adversely affected.
Our business, in particular our content distribution offerings and community forums, will suffer if our systems or networks fail, become unavailable or perform poorly so that current or potential users do not have adequate access to our online products and websites.
Our ability to provide our online offerings will depend on the continued operation of our information systems and networks. As our user traffic increases and our products become more complex, we will need more computing power. We have spent, and may again spend, substantial amounts to purchase or lease data centers and equipment and to upgrade our technology and network infrastructure to handle increased traffic on our website and to introduce new technologies and products. These expansions may be expensive and complex and could result in inefficiencies or operational failures. If we do not implement these expansions successfully, or if we experience inefficiencies and operational failures during the implementation, the quality of our technologies
23
Table of Contents
and products and our users’ experience could decline. This could damage our reputation and lead us to lose current and potential users, advertisers and content providers.
In addition, significant or repeated reductions in the performance, reliability or availability of our information systems and network infrastructure could harm our ability to provide our content distribution offerings and advertising platforms. We could experience failures in our systems and networks from our failure to adequately maintain and enhance these systems and networks, natural disasters and similar events, power failures, intentional actions to disrupt our systems and networks and many other causes. The vulnerability of our computer and communications infrastructure is increased because it is largely located at facilities in San Diego, California, an area that is at heightened risk of earthquake, wildfires and flood. We are vulnerable to terrorist attacks, fires, power loss, telecommunications failures, computer viruses, computer denial of service attacks or other attempts to harm our systems. Moreover, much of our facilities are located near the landing path of a military base and are subject to risks related to falling debris and aircraft crashes. We do not currently have fully redundant systems or a formal disaster recovery plan, and we may not have adequate business interruption insurance to compensate us for losses that may occur from a system outage.
Any failure or interruption of the services provided by bandwidth providers, data centers or other key third parties could subject our business to disruption and additional costs and damage our reputation.
We rely on third-party vendors, including data center and bandwidth providers for network access or co-location services that are essential to our business. Any interruption in these services, including any failure to handle current or higher volumes of use, could subject our business to disruption and additional costs and significantly harm our reputation. Our systems are also heavily reliant on the availability of electricity, which also comes from third-party providers. The cost of electricity has risen in recent years with the rising costs of fuel. If the cost of electricity continues to increase, such increased costs could significantly increase our expenses. In addition, if we were to experience a major power outage, it could result in a significant disruption of our business.
Our network is subject to security risks that could harm our reputation and expose us to litigation or liability.
Online commerce and communications depend on the ability to transmit confidential or proprietary information securely over private and public networks. Any compromise of our ability to transmit and store such information and data securely, and any costs associated with preventing or eliminating such problems, could impair our ability to distribute technologies and products or collect revenue, threaten the proprietary or confidential nature of our technology, harm our reputation and expose us to litigation or liability. We also may be required to expend significant capital or other resources to protect against the threat of security breaches or hacker attacks or to alleviate problems caused by such breaches or attacks. Any successful attack or breach of our security could hurt consumer demand for our technologies and products and expose us to consumer class action lawsuits and other liabilities. In addition, our vulnerability to security risks may affect our ability to maintain effective internal controls over financial reporting as contemplated by Section 404 of the Sarbanes-Oxley Act of 2002.
It is not yet clear how laws designed to protect children that use the Internet may be interpreted and enforced, and whether new similar laws will be enacted in the future which may apply to our business in ways that may subject us to potential liability.
The Children’s Online Privacy Protection Act imposes civil and criminal penalties on persons collecting personal information from children under the age of 13. We do not knowingly distribute harmful materials to minors, direct our websites or services to children under the age of 13, or collect personal information from children under the age of 13. However, we are not able to control the ways in which consumers use our technology, and our technology may be used for purposes that violate this or other similar laws. The manner in which such laws may be interpreted and enforced cannot be fully determined, and future legislation similar to this law could subject us to potential liability if we were deemed to be non-compliant with such rules and regulations.
24
Table of Contents
We may be subject to market risk and legal liability in connection with the data collection capabilities of our various online services.
Many components of our online services include interactive components that by their very nature require communication between a client and server to operate. To provide better consumer experiences and to operate effectively, we collect certain information from users. Our collection and use of such information may be subject to United States state and federal privacy and data collection laws and regulations, as well as foreign laws such as the EU Data Protection Directive. We post an extensive privacy policy concerning the collection, use and disclosure of user data, including that involved in interactions between our client and server products. Because of the evolving nature of our business and applicable law, our privacy policy may now or in the future fail to comply with applicable law. Any failure by us to comply with our posted privacy policy, any failure by us to conform our privacy policy to changing aspects of our business or applicable law, or any existing or new legislation regarding privacy issues could impact the market for our online video community service, technologies and products and subject us to fines, litigation or other liability.
Improper conduct by users could subject us to claims and compliance costs.
The terms of use and end-user license agreements for our products and services prohibit a broad range of unlawful or undesirable conduct. However, we are unable to block access in all instances to users who are determined to gain access to our products or services for improper motives. Claims may be threatened or brought against us using various legal theories based on the nature and content of information or media that may be created, posted online or generated by our users or the use of our technology. This risk includes actions by our users to copy or distribute third-party content. Investigating and defending any of these types of claims could be expensive, even if the claims do not ultimately result in liability. In addition, we may incur substantial costs to enforce our terms of use or end-user license agreements and to exclude certain users of our services or products who violate such terms of use or end-user license agreements, or who otherwise engage in unlawful or undesirable conduct.
We may be subject to legal liability for the provision of third-party products, services, content or advertising.
We have entered into, and expect to continue to enter into, arrangements for third-party products, services, content or advertising to be offered in connection with our various content distribution offerings. Certain of these arrangements involve enabling the distribution of digital content owned by third parties, which may subject us to third party claims related to such products, services, content or advertising, including defamation, violation of privacy laws, misappropriation of publicity rights, violation of United States federal CAN-SPAM legislation, and infringement of intellectual property rights. We require users of our services to agree to terms of use that prohibit, among other things, the posting of content that violates third party intellectual property rights, or that is obscene, hateful or defamatory. We have implemented procedures to enforce such terms of use on certain of our services, including taking down content that violates our terms of use for which we have received notification, or that we are aware of, and/or blocking access by, or terminating the accounts of, users determined to be repeat violators of our terms of use. Despite these measures, we cannot guarantee that such unauthorized content will not exist on our services, that these procedures will reduce our liability with respect to such unauthorized third party conduct or content, or that we will be able to resolve any disputes that may arise with content providers or users regarding such conduct or content. Our agreements with these parties may not adequately protect us from these potential liabilities. Investigating and defending any of these types of claims is expensive, even if the claims do not result in liability. If any of these claims results in liability, we could be required to pay damages or other penalties.
We may be subject to assessment of sales taxes and other taxes for our licensing of technology or sale of products.
We do not currently directly collect sales taxes or other taxes on the licensing of our technology, the sale of our products over the Internet, or our distribution of content. Although we have evaluated the tax requirements of
25
Table of Contents
certain major tax jurisdictions with respect to the licensing of our technology or the sale of our products over the Internet, in the past we have licensed or sold, and in the future we may license or sell, our technologies or products to consumers located in jurisdictions where we have not evaluated the tax consequences of such license or sale. We would incur substantial costs if one or more taxing jurisdictions required us to collect sales or other taxes from past licenses of technology or sales or distributions of our products or content over the Internet, particularly because we would be unable to go back to customers to collect sales, value added or other taxes for past licenses, sales or distributions and would likely have to pay such taxes out of our own funds. Certain of our licensing agreements require our partners to pay taxes to applicable taxing jurisdictions as a result of the sale of products that incorporate our technologies. If our licensees fail to pay such taxes, we may become liable for the payment of such taxes.
We also intend to sell content over the Internet to consumers throughout the world in conjunction with certain of our service offerings. We intend to comply with applicable tax requirements of certain major tax jurisdictions with respect to such sales. However, we may sell content to consumers located in jurisdictions where we have not evaluated the tax consequences of such sale. If we fail to comply with tax requirements of tax jurisdictions in which we sell content online, we may become liable for substantial costs or penalties.
Inflation and other unfavorable economic conditions may adversely affect our revenues, margins and profitability.
Our consumer software products, as well as the consumer hardware device and software products that contain our technologies, are discretionary purchases for consumers. Consumers are generally more willing to make discretionary purchases during favorable economic conditions. As a result of inflation or other unfavorable economic conditions, including higher interest rates, increased taxation, higher consumer debt levels and lower availability of consumer credit, consumers’ purchases of discretionary items may decline, which could adversely affect our revenues. In addition, while inflation historically has not had a material effect on our operating results, we may experience inflationary conditions in our cost base due to changes in foreign currency exchange rates that reduce the purchasing power of the United States dollar, increases in selling, general and administrative expenses, reduced interest rates for our cash positions, and other factors. These inflationary conditions may harm our margins and profitability if we are unable to increase our license, advertising and content distribution fees or reduce our costs sufficiently to offset the effects of inflation in our cost base. Our attempts to offset the effects of inflation and cost increases through controlling our expenses, passing cost increases on to our licensees, advertisers and partners or any other method may not succeed.
Failure to comply with applicable current and future government regulations could limit our ability to license our technologies, sell our products or distribute content, and expose us to additional costs and liabilities.
Our operations and business practices are subject to federal, state and local government laws and regulations, as well as international laws and regulations, including those relating to import or export of technology and software, distribution or censorship of content, use of encryption or other digital rights management software and consumer and other safety-related compliance for electronic equipment. Any failure by us to comply with the laws and regulations applicable to us or our technologies, products or our distribution of content could result in our inability to license those technologies, sell those products, or distribute content, additional costs to redesign technologies, products or our methods for distribution of content to meet such laws and regulations, fines or other administrative, civil or criminal liability or actions by the agencies charged with enforcing compliance and, possibly, damages awarded to persons claiming injury as the result of our non-compliance. Changes in or enactment of new statutes, rules or regulations applicable to us could have a material adverse effect on our business.
26
Table of Contents
If we lose the services of key members of our senior management team, we may not be able to execute our business strategy.
Our future success depends in large part upon the continued services of key members of our senior management team. All of our executive officers and key employees are at-will employees, and we do not maintain any key person life insurance policies. The loss of our management or key personnel could seriously harm our ability to execute our business strategy. We also may have to incur significant costs in identifying, hiring, training and retaining replacements for key employees.
We rely on highly skilled personnel, and if we are unable to retain or motivate key personnel or hire qualified personnel, we may not be able to maintain our operations or grow effectively.
Our performance is largely dependent on the talents and efforts of highly skilled individuals. These individuals have acquired specialized knowledge and skills with respect to us and our operations. Except to the extent otherwise required by the laws of foreign jurisdictions in which we have employees, our employment relationship with each of these individuals is on an at-will basis and can be terminated at any time. If any of these individuals or a group of individuals were to terminate their employment unexpectedly, we could face substantial difficulty in hiring qualified successors and could experience a loss in productivity while any such successor obtains the necessary training and experience.
Our future success depends on our continuing ability to identify, hire, develop, motivate and retain highly skilled personnel for all areas of our organization. In this regard, if we are unable to hire and train a sufficient number of qualified employees for any reason, we may not be able to implement our current initiatives or grow effectively. We have in the past maintained a rigorous, highly selective and time-consuming hiring process. We believe that our approach to hiring has significantly contributed to our success to date. However, our highly selective hiring process has made it more difficult for us to hire a sufficient number of qualified employees, and, as we grow, our hiring process may prevent us from hiring the personnel we need in a timely manner. Moreover, the cost of living in the San Diego area, where our corporate headquarters are located, has been an impediment to attracting new employees in the past, and we expect that this will continue to impair our ability to attract and retain employees in the future. If we do not succeed in attracting qualified personnel and retaining and motivating existing personnel, our ability to execute our business strategy may suffer.
Our recent acquisitions, as well as any companies or technologies we may acquire in the future, could prove difficult to integrate and may result in unexpected costs and disruptions to our business.
In August 2009, we acquired substantially all of the assets of AnySource Media, LLC, or AnySource, a company that develops software and service platforms for Internet-enabled consumer electronics devices. We expect to continue to evaluate possible additional acquisitions of technologies and businesses on an ongoing basis. Our recent acquisitions, as well as acquisitions in which we may engage in the future, entail numerous operational and financial risks including certain of the following risks:
| • | exposure to unknown liabilities; |
| • | disruption of our business and diversion of our management’s time and attention to developing acquired products or technologies; |
| • | incurrence of substantial debt or dilutive issuances of securities to pay for acquisitions; |
| • | higher than expected acquisition and integration costs; |
| • | increased amortization expenses; |
| • | difficulty and cost in combining the operations and personnel of any acquired businesses with our operations and personnel; |
27
Table of Contents
| • | impairment of relationships with key suppliers or customers of any acquired businesses due to changes in management and ownership; and |
| • | inability to retain key employees of any acquired businesses. |
We have limited experience in identifying new acquisition targets, successfully completing acquisitions and integrating any acquired products, businesses or technologies into our current infrastructure. Moreover, in the future we may devote resources to potential acquisitions that are never completed or that fail to realize any of their anticipated benefits.
We may not realize the benefits we expect from the transaction with AnySource.
The integration of AnySource’s technologies may be time consuming and expensive, and may disrupt our business. We will need to overcome significant challenges to realize any benefits or synergies from this transaction. These challenges include the timely, efficient and successful execution of a number of post-transaction integration activities, including:
| • | integrating AnySource’s technologies with our technologies; |
| • | entering markets in which we have limited or no prior experience; |
| • | successfully completing the development of AnySource’s technologies; |
| • | developing commercial products based on those technologies; |
| • | retaining and assimilating the key personnel of AnySource; |
| • | attracting additional customers for products based on AnySource’s technologies; |
| • | implementing and maintaining uniform standards, controls, processes, procedures, policies, accounting systems and information systems; and |
| • | managing expenses and any potential legal liability arising from our transaction with AnySource. |
In particular, we may encounter difficulties successfully integrating our operations, technologies, services and personnel with those of AnySource, and our financial and management resources may be diverted from our existing operations. For example, as a result of our transaction with AnySource, we have an additional office in Malvern, Pennsylvania. Maintaining offices in multiple locations could create a strain on our ability to effectively manage our operations and personnel. In addition, the process of integrating operations and technology could cause an interruption of, or loss of momentum in, the activities of one or more of our businesses and the loss of key personnel. The delays or difficulties encountered in connection with the integration of AnySource’s technologies with our technologies could have an adverse effect on our business, results of operations or financial condition. We may not succeed in addressing these risks or any other problems encountered in connection with this transaction. Our inability to successfully integrate the technologies and personnel of AnySource, or any significant delay in achieving integration, including regulatory approval delays, could have a material adverse effect on us and, as a result, on the market price of our common stock.
Our corporate culture has contributed to our success, and if we cannot maintain this culture as we grow, we could lose the innovation, creativity and teamwork fostered by our culture.
We believe that a critical contributor to our success has been our corporate culture, which we believe fosters innovation, creativity and teamwork. As our organization grows and we are required to implement more complex organizational management structures, we may find it increasingly difficult to maintain the beneficial aspects of our corporate culture. This could negatively impact our future success.
28
Table of Contents
Risks related to our finances
Our quarterly operating results and stock price may fluctuate significantly.
We expect our operating results to be subject to quarterly fluctuations. The revenues we generate and our operating results and the market price of our common stock will be affected by numerous factors, including:
| • | demand for our technologies and products; |
| • | introduction, enhancement and market acceptance of technologies and products by us and our competitors; |
| • | price reductions by us or our competitors or changes in how technologies and products are priced; |
| • | the mix of technologies and products offered by us and our competitors; |
| • | the mix of distribution channels through which our technologies and products are licensed and sold; |
| • | our ability to successfully generate revenues from advertising and content distribution; |
| • | the mix of international and United States revenues attributable to our technologies and products; |
| • | costs of intellectual property protection and any litigation; |
| • | timing of payments received by us pursuant to our licensing agreements; |
| • | our ability to hire and retain qualified personnel; |
| • | growth in the use of the Internet; and |
| • | general economic conditions. |
As a result of the variances in quarterly volumes reported by our consumer hardware device manufacturing customers, we expect our revenues to be subject to seasonality, with our second quarter revenues expected to be lower than the revenues we derive in our other quarters. In addition, a substantial majority of our quarterly revenues are based on actual shipment of products incorporating our technologies in that quarter, and not on contractually agreed upon minimum revenue commitments. Because the shipping of products by our consumer hardware and independent software vendor partners are outside our control and difficult to predict, our ability to accurately forecast quarterly revenue is substantially limited. Quarterly fluctuations in our operating results may, in turn, cause the price of our stock to fluctuate substantially. We believe that quarterly comparisons of our financial results are not necessarily meaningful and should not be relied upon as an indication of our future performance.
We may not generate sufficient revenue to be profitable on a quarterly or annual basis in the future.
We may not generate sufficient revenue to be profitable on a quarterly or annual basis in the future. In addition, we devote significant resources to developing and enhancing our technology and to selling, marketing and obtaining content for our technologies and products. We expect our operating expenses to increase, as we, among other things:
| • | develop and grow our community and content distribution platform initiatives; |
| • | expand our domestic and international sales and marketing activities; |
| • | increase our product development efforts to advance our existing technologies and products and develop new technologies and products; |
| • | hire additional personnel; |
| • | upgrade our operational and financial systems, procedures and controls and continued compliance with Section 404 of the Sarbanes-Oxley Act; and |
| • | continue to assume the responsibilities of being a public company. |
29
Table of Contents
We may require additional capital, and raising additional funds by issuing securities, debt financing or through strategic alliances or licensing arrangements may cause dilution to existing stockholders, restrict our operations or require us to relinquish proprietary rights.
We may raise additional funds through public or private equity offerings, debt financings, strategic alliances or licensing arrangements. To the extent that we raise additional capital by issuing equity securities, our existing stockholders’ ownership will be diluted. Any debt financing we enter into may involve covenants that restrict our operations. These restrictive covenants may include limitations on additional borrowing, specific restrictions on the use of our assets as well as prohibitions on our ability to create liens, pay dividends, redeem our stock or make investments. In addition, if we raise additional funds through strategic alliances or licensing arrangements, it may be necessary to relinquish potentially valuable rights to our potential products or proprietary technologies, or grant licenses on terms that are not favorable to us.
Our investments in auction rate securities may not provide us a liquid source of cash.
As of December 31, 2009, we held approximately $18.4 million par value of auction rate securities ($18.0 million estimated fair value, including related put option). During the years 2009 and 2008, approximately $500,000 and $1.3 million, respectively, worth of the Company’s auction rate securities were redeemed. In January 2010, $2.5 million of the Company’s auction rate securities were redeemed. All other auction rate security instruments in our portfolio have failed at auctions since February 2008, and we may not be able to sell these securities in a timely manner to meet a liquidity need. In the event that we are unable to sell the underlying securities at or above our carrying value, or at all, these securities may not provide us a liquid source of cash in the future.
Risks related to our intellectual property
We and our licensees are, and may in the future be, subject to intellectual property rights claims, which are costly to defend, could require us to pay damages and could limit our ability to use certain technologies or content in the future.
Companies in the technology and entertainment industries own large numbers of patents, copyrights, trademarks and trade secrets and they frequently make claims and commence litigation based on allegations of infringement or other violations of intellectual property rights, including those relating to digital media standards such as MPEG-4, H.264, MP3 and AAC or relating to video or music content. We have faced such claims in the past, we currently face such claims, and we expect to face similar claims in the future. For instance, we have been contacted by third parties such as AT&T and LG (one of our most significant customers in consumer hardware technology licensing) regarding the licensing of certain patents characterized by such parties as being essential to the MPEG-4 visual standard or other standards. Regardless of the merits of such claims any disputes with third parties over intellectual property rights could materially and adversely impact our business, including by resulting in the loss of management time and attention to our core business, or reducing the willingness of licensees to incorporate our technologies into their products. We have also received notices that various third parties have, on occasion, contacted certain of our licensees alleging that products incorporating our technology require a license under certain patents which they purport to own or have rights in. Our licensees have faced claims such as these in the past, currently face such claims, and may face similar claims in the future. Regardless of the merits of these allegations, this type of contact could materially impact our business by reducing our ability to generate revenue and drive adoption of our technologies and it could also materially impact our relationships with our licensees and their desires to implement DivX technologies. In the event we determine that we need to obtain a license from any third party, we cannot guarantee that we would be able to obtain such license on commercially reasonable terms, if at all. We may be required to develop non-infringing alternative technologies, which could be very time consuming and expensive, and there is no guarantee that we would be successful in developing such technologies. We have also been asked by content owners to stop the display or hosting of copyrighted materials by our users or ourselves through our service offerings, including notices provided to us pursuant to the Digital Millennium Copyright Act. For example, we were previously engaged in
30
Table of Contents
litigation with UMG, which had requested that we remove materials from Stage6, our online video community service which we shut down on February 29, 2008, and which asserted claims of copyright infringement against us. We settled our litigation with UMG in November 2009. Moreover, content providers may claim that we are contributorily or vicariously liable for third parties’ use of our technology or service offerings to infringe the content providers’ copyrights. Users of our services are subject to terms of use that prohibit the posting of content that violates third party intellectual property rights. We have and will promptly respond to legitimate takedown notices or complaints, including but not limited to those submitted pursuant to the Digital Millennium Copyright Act, notifying us that we are providing unauthorized access to copyrighted content by removing such content and/or any links to such content from our websites. Nevertheless, we cannot guarantee that our prompt removal of content, including removal pursuant to the provisions of the Digital Millennium Copyright Act, will prevent disputes with content providers, that infringing content will not exist on our services, or that we will be able to resolve any disputes that may arise with content providers or users regarding such infringing content. Any intellectual property claims, with or without merit, could be time-consuming, expensive to litigate or settle and could divert management resources and attention. An adverse determination could require that we pay damages, block access to certain content, or stop using technologies found to be in violation of a third party’s rights, and could prevent us from offering our technologies, products or certain content to others. To avoid these restrictions, we may be required to seek a license for the technology or content from additional third parties. Such licenses may not be available on reasonable terms, could require us to pay significant royalties and may significantly increase our cost of revenues. The technologies or content also may not be available for license to us at all. As a result, we may be required to develop alternative non-infringing technologies, or license alternative content, which could require significant effort and expense. If we cannot license or develop technologies or content for any infringing aspects of our business, we may be forced to limit our technology or content offerings and may be unable to compete effectively with entities that offer such technology or content. In addition, from time to time we engage in disputes regarding the licensing of our intellectual property rights, including matters related to our royalty rates and other terms of our licensing arrangements. These types of disputes can be asserted by our licensees or prospective licensees or by other third parties as part of negotiations with us or in private actions seeking monetary damages or injunctive relief. Any disputes with our licensees or potential licensees or other third parties could harm our reputation and expose us to additional costs and other liabilities.
We may be unable to adequately protect the proprietary rights in our technologies and products.
We have six issued patents in the United States and two issued patents in foreign jurisdictions, along with exclusive rights to one additional United States patent. Our ability to obtain patent protection for certain of our technologies and products may be limited as a result of the incorporation of aspects of MPEG-4, MP3, and other standards-based technologies into our technologies and products. We license patents relating to MPEG-4, MP3, and other standards-based technologies from third party licensors. The licensors from whom we have acquired the right to incorporate MPEG-4 and MP3 technologies into our products are not the exclusive owners of the patents relating to such technologies. As a result, our licensors must coordinate enforcement efforts with the owners of such patents to protect or defend against infringements of patents relating to such technology, which can be expensive, time consuming and difficult. Any significant impairment of the intellectual property rights relating to the MPEG-4 or MP3 technologies we license for use in our technologies and products could reduce the value of such technologies, which could impair our ability to compete.
Our ability to compete partly depends on the superiority, uniqueness and value of our technologies, including both internally developed technology and technology licensed from third parties. To protect our proprietary rights, we rely on a combination of trademark, patent, copyright and trade secret laws, confidentiality agreements with our employees and third parties, and protective contractual provisions. Despite our efforts to protect our intellectual property, any of the following occurrences may reduce the value of our intellectual property:
| • | our applications for trademarks or patents may not be granted and, if granted, may be challenged or invalidated; |
| • | issued patents, copyrights and trademarks may not provide us with any competitive advantages; |
31
Table of Contents
| • | our efforts to protect our intellectual property rights may not be effective in preventing misappropriation of our technology or dilution of our trademarks; |
| • | our efforts may not prevent the development and design by others of products or technologies similar to or competitive with, or superior to those that we develop; or |
| • | another party may obtain a blocking patent that would force us to either obtain a license or design around the patent to continue to offer the contested feature or service in our technologies. |
Legislation may be passed that would require companies to share information about their digital rights management technology to permit interoperability with other systems. If this legislation is enacted, we may be required to reveal our proprietary digital rights management code to competitors. Furthermore, if content must be formatted such that it can be played on a media player other than a DivX Certified player, then the demand for DivX Certified players could decrease.
We may be forced to litigate to defend our intellectual property rights or to defend against claims by third parties against us or our customers relating to intellectual property rights.
Disputes regarding the ownership of technologies and rights associated with digital media technologies and online businesses are common and likely to arise in the future. We may be forced to litigate to enforce or defend our intellectual property rights, to protect our trade secrets or to determine the validity and scope of other parties’ proprietary rights. Any such litigation could be very costly and could distract our management from focusing on operating our business.
Our ability to maintain and enforce our trademark rights has a large impact on our ability to prevent third party infringement of our brand and technologies.
We generally rely on enforcing our trademark rights to prevent unauthorized use of our brand and technologies. Our ability to prevent unauthorized uses of our brand and technologies would be negatively impacted if our trademark registrations were overturned in the jurisdictions where we do business. Our brand and logo are widely used by consumers and entities, both licensed and unlicensed, in association with digital video compression technology, and if we are not vigilant in preventing unauthorized or improper use of our trademarks, then our trademarks could become generic and we would lose our ability to assert such trademarks against others. We also have trademark applications pending in a number of jurisdictions that may not ultimately be granted, or if granted, may be challenged or invalidated, in which case we would be unable to prevent unauthorized use of our brand and logo in such jurisdiction. We have not filed trademark registrations in all jurisdictions where our brand and logo are used.
Some software we provide may be subject to “open source” licenses, which may restrict how we use or distribute our software or require that we release the source code of certain products subject to those licenses.
Some of the products we support and some of our proprietary technologies incorporate open source software such as open source MP3 codecs that may be subject to the Lesser Gnu Public License or other open source licenses. The Lesser Gnu Public License and other open source licenses typically require that source code subject to the license be released or made available to the public. Such open source licenses typically mandate that software developed based on source code that is subject to the open source license, or combined in specific ways with such open source software, become subject to the open source license. We take steps to ensure that proprietary software we do not wish to disclose is not combined with, or does not incorporate, open source software in ways that would require such proprietary software to be subject to an open source license. However, few courts have interpreted the Lesser Gnu Public License or other open source licenses, and the manner in which these licenses may be interpreted and enforced is therefore subject to some uncertainty. We also take steps to disclose any source code for which disclosure is required under an open source license, but it is possible that we have or will make mistakes in doing so, which could negatively impact our brand or our adoption in the
32
Table of Contents
community, or could expose us to additional liability. In addition, we rely on multiple software programmers to design our proprietary products and technologies. Although we take steps to ensure that our programmers do not include open source software in products and technologies we intend to keep proprietary, we do not exercise complete control over the development efforts of our programmers and we cannot be certain that our programmers have not incorporated open source software into products and technologies we intend to keep proprietary. In the event that portions of our proprietary technology are determined to be subject to an open source license, or are intentionally released under an open source license, we could be required to publicly release the relevant portions of our source code, which could reduce or eliminate our ability to commercialize our products and technologies. Also, in relying on multiple software programmers to design products and technologies that we intend, or ultimately end up releasing in the open source community, we may discover that one or multiple such programmers have included code or language that would be embarrassing to the company, which could negatively impact our brand or our adoption in the community, or could expose us to additional liability.
If we are not able to maintain our domain names it may negatively impact our brand and our reputation.
We hold the domain name DivX.com as well as other domain names that support our brand and our business. If we are not able to maintain our domain names, consumers may have difficulty accessing our products and services on the Internet. If we are not able to maintain our domain names, other parties who control those Internet sites may engage in activities that damage our brand and our reputation. In addition to maintaining our current domain names, we may not be able to obtain additional domain names to support our brand and our business.
Risks related to the securities markets and investment in our common stock
Market volatility may affect our stock price and the value of your investment.
The current turbulence in the U.S. and global financial markets has caused a decline in stock values across all industries. The market price for our common stock has been and is likely to continue to be volatile. In addition, the market price of our common stock may fluctuate significantly in response to a number of factors, most of which we cannot control, including:
| • | announcements of new products, services or technologies, commercial relationships or other events by us or our competitors; |
| • | regulatory developments in the United States and foreign countries; |
| • | fluctuations in stock market prices and trading volumes of similar companies; |
| • | variations in our quarterly operating results; |
| • | changes in securities analysts’ estimates of our financial performance; |
| • | changes in accounting principles; |
| • | sales of large blocks of our common stock, including sales by our executive officers, directors and significant stockholders; |
| • | additions or departures of key personnel; and |
| • | discussion of us or our stock price by the financial press and in online investor chat rooms or blogs. |
Shares of our common stock are relatively illiquid.
The current turbulence in the U.S. and global financial markets could adversely affect our stock price and our ability to raise additional capital through the sale of equity or debt securities. As of March 1, 2010, we had 32,822,820 shares of common stock outstanding. As a result of our relatively small public float, our common
33
Table of Contents
stock may be less liquid than the stock of companies with broader public ownership. In 2008, we undertook a share repurchase program, which was completed as of June 30, 2008. Prior repurchases, as well as any future repurchases of our common stock, reduce our public float and may cause our common stock to become less liquid. A reduction in the liquidity of our common stock, as a result of the recent share repurchase or otherwise, could have a greater impact on the trading price for our shares than would be the case if our public float were larger.
Anti-takeover provisions in our charter documents and under Delaware law could make an acquisition of us, which may be beneficial to our stockholders, more difficult and may prevent attempts by our stockholders to replace or remove our current management.
Provisions in our certificate of incorporation and bylaws may delay or prevent an acquisition of us or a change in our management. These provisions include a classified board of directors, a prohibition on actions by written consent of our stockholders and the ability of our Board of Directors to issue preferred stock without stockholder approval. In addition, because we are incorporated in Delaware, we are governed by the provisions of Section 203 of the Delaware General Corporation Law, which limits the ability of stockholders owning in excess of 15% of our outstanding voting stock to merge or combine with us. Although we believe these provisions collectively provide for an opportunity to obtain higher bids by requiring potential acquirors to negotiate with our Board of Directors, they would apply even if an offer were considered beneficial by some stockholders. In addition, these provisions may frustrate or prevent any attempts by our stockholders to replace or remove our current management by making it more difficult for stockholders to replace members of our Board of Directors, which is responsible for appointing the members of our management.
We do not intend to pay dividends on our common stock.
We have never declared or paid any cash dividend on our capital stock. We currently intend to retain any future earnings and do not expect to pay any dividends in the foreseeable future.
We will incur increased costs as a result of changes in laws and regulations relating to corporate governance matters.
Changes in the laws and regulations affecting public companies, including the provisions of the Sarbanes-Oxley Act and rules adopted by the SEC and by The Nasdaq Stock Market, will result in increased costs to us as we continue to evaluate the implications of these laws and respond to their requirements. The impact of these laws and regulations could also make it more difficult for us to attract and retain qualified persons to serve on our Board of Directors, our board committees or as executive officers. We are presently evaluating and monitoring developments with respect to these laws and regulations and cannot predict or estimate the amount or timing of additional costs we may incur to respond to their requirements.
If we fail to maintain proper and effective internal controls, our ability to produce accurate financial statements could be impaired, which could adversely affect our ability to operate our business and our stock price.
Ensuring that we have adequate internal financial and accounting controls and procedures in place to help ensure that we can produce accurate financial statements on a timely basis is a costly and time-consuming effort that needs to be re-evaluated frequently. We periodically document, review and, where appropriate, improve our internal controls and procedures for compliance with Section 404 of the Sarbanes-Oxley Act, which requires annual management assessments of the effectiveness of our internal controls over financial reporting and a report by our independent auditors addressing these assessments. Both we and our independent registered public accounting firm periodically test our internal controls in connection with the Section 404 requirements and could, as part of that documentation and testing, identify material weaknesses, significant deficiencies or other areas for further attention or improvement. Our networks are vulnerable to security risks and hacker attacks, which may
34
Table of Contents
affect our ability to maintain effective internal controls as contemplated by Section 404. Implementing any appropriate changes to our internal controls may require specific compliance training for our directors, officers and employees, entail substantial costs to modify our existing accounting systems, and take a significant period of time to complete. Such changes may not, however, be effective in maintaining the adequacy of our internal controls, and any failure to maintain that adequacy, or consequent inability to produce accurate financial statements on a timely basis, could increase our operating costs and could materially impair our ability to operate our business. In addition, disclosure regarding our internal controls or investors’ perceptions that our internal controls are inadequate or that we are unable to produce accurate financial statements may adversely affect our stock price.
Future sales of our common stock may cause our stock price to decline.
As of March 1, 2010, there were 32,880,820 shares of our common stock outstanding. Substantially all of these shares are eligible for sale in the public market, although as of March 1, 2010, 995,265 of these shares were held by directors, executive officers and other affiliates and will be subject to volume limitations under Rule 144. In addition, as of March 1, 2010, we had outstanding warrants to purchase up to 395,000 shares of common stock that, if exercised, will result in these additional shares becoming available for sale. A large portion of these shares and warrants are held by a small number of persons and investment funds. Sales by these stockholders or warrant holders of a substantial number of shares could significantly reduce the market price of our common stock. Moreover, the holders of 635,506 shares of common stock at March 1, 2010 have rights, subject to some conditions, to require us to file registration statements covering the shares they currently hold or to include these shares in registration statements that we may file for ourselves or other stockholders. Additionally, the current turbulence in the U.S. and global financial markets has caused a decline in stock values across all industries.
As of March 1, 2010, an aggregate of approximately 9,149,395 shares of our common stock were reserved for future issuance under our 2000 Stock Option Plan, or 2000 Plan, our 2006 Equity Incentive Plan, or 2006 Plan, and our 2006 Employee Stock Purchase Plan, or 2006 Purchase Plan and the share reserve under our 2006 Plan and our 2006 Purchase Plan are subject to automatic annual increases in accordance with the terms of the plans. These shares can be freely sold in the public market upon issuance. If a large number of these shares are sold in the public market, the sales could reduce the trading price of our common stock and impede our ability to raise future capital.
Item 1B. Unresolved Staff Comments.
None.
We lease approximately 47,000 square feet of space for our headquarters in San Diego, California under an agreement that expires in March 2014. We also lease offices in Malvern, Pennsylvania, Aachen, Germany, Tomsk, Russia, and in various other cities throughout the world.
On October 22, 2007, following the filing of our declaratory relief action which was subsequently dismissed, Universal Music Group, Inc., or UMG, filed a lawsuit against us in the Central District of California, alleging copyright infringement and seeking monetary damages related to our operation of the Stage6 online video community service, which was shut down on February 29, 2008. On November 11, 2009, we entered into a Settlement Agreement with UMG, or the UMG Settlement, pursuant to which UMG and we agreed to dismiss with prejudice all of the pending claims in the UMG litigation. Under the UMG Settlement, upon the occurrence of certain triggers, we may be obligated to pay to UMG either $6 million or $15 million. As of the date of this filing, no amounts are due from us to UMG under the UMG Settlement.
35
Table of Contents
We are also involved in various legal proceedings from time to time arising from the normal course of business activities, including commercial, employment and other matters. In our opinion, resolution of these proceedings is not expected to have a material adverse effect on our operating results or financial condition. However, it is possible that an unfavorable resolution of one or more such proceedings could materially affect our future operating results or financial condition in a particular period.
36
Table of Contents
PART II
Item 5. Market for Registrant’s Common Equity, Related Shareholder Matters and Issuer Purchases of Equity Securities
Our common stock is listed on the Nasdaq Global Select Market under the symbol “DIVX”. As of March 1, 2010, there were approximately 104 shareholders of record. We believe that the number of beneficial owners is substantially greater than the number of record holders because a large portion of our common stock is held of record through brokerage firms in “street name.”
We have not paid any cash dividends on our common stock and do not anticipate paying any cash dividends in the foreseeable future. The high and low sales prices of our common stock for the periods presented were as follows:
| High | Low | |||||
| 2009: |
||||||
| Fourth Quarter |
$ | 5.77 | $ | 4.76 | ||
| Third Quarter |
6.58 | 4.98 | ||||
| Second Quarter |
6.19 | 4.55 | ||||
| First Quarter |
5.92 | 4.09 | ||||
| 2008: |
||||||
| Fourth Quarter |
$ | 7.36 | $ | 3.87 | ||
| Third Quarter |
9.26 | 6.20 | ||||
| Second Quarter |
10.49 | 6.43 | ||||
| First Quarter |
15.44 | 6.12 | ||||
The above price quotations reflect inter-dealer prices, without retail markup, markdown or commission and may not necessarily represent actual transactions.
Purchases of Equity Securities by the Company
Pursuant to the terms of our 2000 Plan, options may typically be exercised prior to vesting. We have the right to repurchase unvested shares from our employees and consultants upon their termination, and it is generally our policy to do so. During the three month period ended December 31, 2009, we made no purchases of our common stock.
Stock Performance Graph
The following stock performance graph and related information shall not be deemed “soliciting material” or to be “filed” with the SEC, nor shall such information be incorporated by reference into any future filing under the Securities Act or Exchange Act, except to the extent that we specifically incorporate it by reference into such filing.
The following stock performance graph compares total stockholder returns for DivX, Inc. from the date of our initial public offering through December 31, 2009 against the newly selected NASDAQ Composite Index and the NASDAQ-100 Technology Sector Index, as well as the indices we used in last year’s performance graph which included the Russell 2000 Index and a peer group comprising DTS, Inc., Dolby Laboratories, Inc., RealNetworks, Inc., Adobe Systems Incorporated, and Google Inc., assuming a $100 investment made on September 22, 2006. Going forward, our stock performance graph will compare DivX’s stock performance to the cumulative total return of the broader market index on which DivX’s stock trades and the published sector index which we feel provides a more relevant analysis of our stock performance versus the peer group comparison.
37
Table of Contents
Each of the comparative measures of cumulative total return assumes reinvestment of dividends. The stock performance shown on the graph below is not necessarily indicative of future price performance.
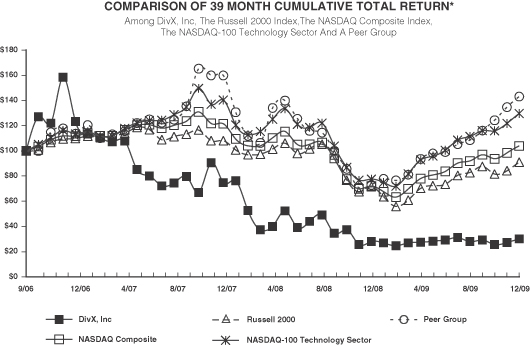
| * | $100 invested on 9/22/06 in stock or 8/31/06 in index, including reinvestment of dividends. |
Year ending December 31, 2009.
Sale of Unregistered Securities
In 2009, we did not sell any securities that were not registered under the Securities Act of 1933, as amended.
Use of Proceeds
Our initial public offering of common stock was effected through a Registration Statement on Form S-1 (File No. 333-133855) that was declared effective by the SEC on September 21, 2006. The Registration Statement covered the offer and sale by us of 7,461,538 shares of our common stock, which we sold to the public on September 27, 2006 at a price of $16.00 per share. Our initial public offering resulted in aggregate proceeds to us of approximately $108.2 million, net of underwriting discounts and commissions of approximately $8.4 million and offering expenses of approximately $2.8 million.
As of December 31, 2009, the remaining $62.8 million of proceeds from our initial public offering are invested in auction rate securities, commercial paper, certificates of deposit, corporate bonds, government agency notes, and money market funds.
38
Table of Contents
Item 6. Selected Financial Data
The following selected financial data has been derived from our audited consolidated financial statements and the accompanying notes. This information should be read in conjunction with Item 7—“Management’s Discussion and Analysis of Financial Condition and Results of Operations,” and with our consolidated financial statements and the accompanying notes set forth at the pages indicated in Item 15(a)(1) of this Report.
| Year | |||||||||||||||
| 2009 | 2008 | 2007 | 2006 | 2005 | |||||||||||
| (in thousands, except per share amounts) | |||||||||||||||
| Income Statement Data: |
|||||||||||||||
| Net revenues |
$ | 70,606 | $ | 93,905 | $ | 84,862 | $ | 59,325 | $ | 33,047 | |||||
| Gross profit |
60,894 | 89,309 | 80,383 | 55,337 | 29,391 | ||||||||||
| Income from operations |
477 | 12,646 | 357 | 14,013 | 3,134 | ||||||||||
| Income before income taxes |
2,424 | 16,612 | 8,234 | 17,002 | 3,357 | ||||||||||
| Net income |
131 | 10,008 | 9,208 | 16,440 | 2,295 | ||||||||||
| Net income per share(1): |
|||||||||||||||
| Basic |
$ | 0.00 | $ | 0.30 | $ | 0.27 | $ | 0.70 | $ | — | |||||
| Diluted |
$ | 0.00 | $ | 0.30 | $ | 0.26 | $ | 0.61 | $ | — | |||||
| Balance Sheet Data: |
|||||||||||||||
| Cash, cash equivalents and investments |
$ | 143,709 | $ | 135,307 | $ | 141,035 | $ | 148,641 | $ | 25,035 | |||||
| Working capital |
133,954 | 115,762 | 138,410 | 147,019 | 22,348 | ||||||||||
| Total assets |
207,598 | 193,401 | 200,888 | 164,386 | 33,164 | ||||||||||
| Long-term debt, inclusive of current portion |
— | — | 153 | 502 | 1,265 | ||||||||||
| Stockholders’ equity |
185,175 | 174,100 | 175,440 | 150,911 | 6,185 | ||||||||||
| (1) | See Note 1 of Notes to Consolidated Financial Statements for an explanation of shares used in computing net income per share. |
Item 7. Management’s Discussion and Analysis of Financial Condition and Results of Operations
You should read the following discussions and analysis of our financial condition and results of our operations in conjunction with our consolidated financial statements and the notes to those statements included elsewhere in this Annual Report. This discussion contains forward-looking statements reflecting our current expectations that involve risks and uncertainties. Our actual results and the timing of events may differ materially from those contained in these forward-looking statements due to a number of factors, including those discussed in Item 1A—“Risk Factors,” and elsewhere in this Annual Report.
Overview
We were incorporated in Delaware in May 2000 with the purpose of making media better through the use of technology. We believe that media is undergoing a profound transformation that will change how individuals and entities obtain information, communicate and express ideas. We believe that there are opportunities within this transformation—opportunities to generate tremendous value by meeting the needs of users of new media and, more importantly, opportunities to influence the evolution and development of media. Our successes to date have been the result of creating value with and for a broad community of constituents including software vendors, consumer hardware device manufacturers, content creators and consumers. Like the evolving markets in which we operate, DivX is open and dynamic.
Our goal is to create products and provide services that improve the way consumers experience media. The first step toward this goal was to build and release a high-quality video compression-decompression software library, or codec, to enable distribution of content across the Internet and through recordable media. As a result, we created the DivX codec. Since the creation of the first DivX codec, DivX codecs have been actively sought out
39
Table of Contents
and downloaded by consumers hundreds of millions of times. These downloads include those for which we receive revenue as well as free downloads, such as limited-time trial versions, and downloads provided as upgrades or support to existing end users of our products. After the significant grass-roots adoption of our codecs, the next step toward our goal was to license similar technology to consumer hardware device manufacturers and to certify their products to ensure the interoperable support of DivX-encoded content. We are entitled to receive a royalty and/or license fee for DivX Certified devices shipped by our customers. In addition to licensing revenue from such licensees, we also generate revenue from software licensing, advertising and content distribution.
One aspect of our long term vision is to allow content creators to have the ability to capture their content in the DivX format using any device or software of their choosing and to allow consumers of such content to playback and interact with the content on any device or platform. We bring together consumers of DivX content with content creators both large and small through the development and licensing of media distribution platforms and services.
In January 2009, we released the latest version of our codec, DivX Plus. DivX Plus technology offers consumers and consumer electronics manufacturers an enhanced version of our codecs for certain implementations, including for high definition and mobile content.
In recent years we completed two strategic transactions to complement our organic growth. In November 2007, we acquired MainConcept GmbH, or MainConcept, a leading provider of an H.264 codec solution and a wide range of other high-quality video codecs and technologies for the broadcast, film, consumer electronics and computer software markets. MainConcept solutions are optimized for various platforms including PCs, set-top boxes, portable media players and mobile phones.
In August 2009 we acquired substantially all of the assets of AnySource Media, LLC, or AnySource, a technology company developing software and service platforms for Internet-enabled consumer electronics devices. We believe the AnySource transaction will help us meet our goal of expanding our business model to encompass licensing and other revenue opportunities relating to Internet-enabled consumer electronics devices.
Our next steps, which we have begun working toward, are to bring together the millions of DivX consumers with content creators both large and small to build communities around media, including through the development and licensing of media distribution platforms and services for Internet and consumer electronics devices. We are optimistic about the future and believe our opportunities are only beginning to be realized.
Sources of revenues
We have four revenue streams. Three of these revenue streams are derived from our technologies, including technology licensing to manufacturers of consumer hardware devices, licensing to independent software vendors and consumers, and providing services related to content distribution over the Internet. Additionally, we derive revenues from advertising and distributing third-party products on our website.
Our technology licensing revenues from consumer hardware device manufacturers comprise the majority of our total net revenues and are derived primarily from royalties and/or license fees received from original equipment manufacturers, although related revenues are derived from other members of the consumer hardware device supply chain. We license our technologies to original equipment manufacturers, allowing them to build support of DivX technologies into their consumer hardware devices. Our original equipment manufacturer licensees pay us a fee based on the quantity of DivX Certified devices they sell. Our license agreements with original equipment manufacturers typically range from one to two years, and may include the payment of initial fees, volume-based royalties and minimum guaranteed volume levels. Because royalties are generated by the shipment volumes of our consumer hardware device customers, and because sales by consumer hardware device manufacturers are highly seasonal, we typically expect revenues relating to consumer hardware devices to be highly seasonal, with our second quarter revenues in any given calendar year being generally lower than any other quarter in that calendar year.
40
Table of Contents
To ensure high-quality support of the DivX media format in finished consumer electronic products, we also license our technologies to those companies who create the major components in those products. These companies include integrated circuit manufacturers who supply integrated circuits, and original design manufacturers who create reference designs, for DVD players, Blu-ray players, digital televisions, mobile phones, and the other consumer hardware devices distributed by our licensee original equipment manufacturers.
We license our technologies to independent software vendors that incorporate our technologies into software applications for computers and other consumer hardware devices. An independent software vendor typically pays us an initial license fee, in addition to per-unit royalties based on the number of products sold that include our technology. Since our acquisition of MainConcept in November 2007, we also have generated revenues associated with MainConcept’s licensing agreements in areas complementary to our pre-existing revenue streams, including through MainConcept’s focus on the professional video sector. We also license our technologies directly to consumers through several software bundles. We make certain software bundles available free of charge from our website. These bundles incorporate a version of our codec technology and allow consumers to play and create content in the DivX format. We also make available from our website an enhanced version of our free software bundles, including additional features that increase the quality and control of DivX media playback and creation. These enhanced versions are available free of charge for a limited trial period, which is generally 15 days. At the end of the trial period, our users are invited to purchase a license to one or more components of the enhanced bundle by making a one time payment to us. If they choose not to do so, they still enjoy playback and creation functionality equivalent to our free software bundle. We believe that downloads of this software benefit our business both directly and indirectly. Our business benefits directly from increased revenues when the user downloads a for-pay version. Our business benefits indirectly when free or trial versions are downloaded, as we believe such downloads increase our installed base and therefore the demand for consumer hardware devices that contain our technologies.
We derive revenue from advertisements or third party software applications that we embed in or include with the software packages we offer to consumers. In March 2009, we entered into a promotion and distribution agreement with Google. Pursuant to this agreement, we distribute Google products, including among other things the Google Chrome web browser, with our software products and Google pays us fees based on successful activations of these products. Pursuant to the terms of the agreement with Google, the agreement expires on February 28, 2011, or upon the achievement of a maximum distribution commitment.
We derive revenue by acting as an application service provider for third party owners of digital video content. We provide content storage and distribution services to certain of these third parties in exchange for a percentage of the revenue they receive from sales of digital content to consumers. We also derive revenues by encoding third-party content into the DivX format to allow such content to be delivered more efficiently via the Internet. We record revenue related to content distribution arrangements with consumer hardware OEMs who pay us a fee for each copy of DivX-encoded content that is encoded on physical media and bundled with their consumer hardware products.
A small number of customers account for a significant percentage of our revenues. In 2009, Samsung Corporation, Ltd. and Sony Corporation accounted for 13% and 12%, respectively, of our total net revenues. In 2008, Yahoo! and LG accounted for 19% and 11%, respectively, of our total net revenues. In 2007, Google and LG accounted for 19% and 10%, respectively, of our total net revenues.
We are a global company with a broad, geographically diverse market presence. We have offices in ten foreign countries as well as sales staff in several others, and our hardware and software products are distributed in over 150 countries and territories. We have historically generated a substantial amount of our revenues from international sales, which have grown to represent an increasingly large percentage of our overall revenues. A large portion of our total revenues come from licensing our technologies to consumer hardware device manufacturers, most of whom are located outside of North America. For the years ended December 31, 2009, 2008 and 2007, our revenues outside North America comprised 81%, 74% and 77%, respectively, of our total net revenues.
41
Table of Contents
Cost of revenues
Our cost of revenues consists primarily of license fees payable to providers of intellectual property that is included in our technologies. Generally, royalties are due to our third-party intellectual property providers based on when certain of our products are sold, subject to contractually agreed-upon limits. To a much lesser extent, cost of revenues also includes depreciation on certain computing equipment and related software, the compensation of related employees, Internet connectivity costs, third-party payment processing fees and allocable overhead. Although this may not be the case in the future, and although we have experienced some variability to our cost of revenue structure in the past, in general our costs of revenues have not been highly variable with revenue volumes. As a result, we generally expect our overall gross margins to fluctuate with revenues.
Selling, general and administrative
The majority of selling, general and administrative expenses consists of employee compensation costs. Selling, general and administrative expense also includes marketing expenses, which include format approval fee amortization expenses, business travel costs, trade show costs, outside consulting fees and allocable overhead. Our headcount for selling, general, and administrative related personnel, including full-time and part-time employees decreased slightly to 152 as of December 31, 2009 from 158 as of December 31, 2008 due to attrition. If the need arises, we may hire additional employees or outside contractors for our selling, general and administrative staff as needed and may increase our selling, general and administrative budget to meet future needs.
Product development
The majority of product development expenses consist of employee compensation for personnel responsible for the development of new technologies and products. Our headcount for product development related personnel, including full-time and part-time employees increased by 37 from 154 as of December 31, 2008 to 191 as of December 31, 2009, including approximately 20 employees added as a result of our acquisition of AnySource Media on August 27, 2009. Product development expense also includes bandwidth expenses, depreciation of computer and related equipment, software license fees and allocable overhead. We expect our product development expenses to increase in 2010 as compared to 2009 as we continue to expand our product offerings, including the development of DivX TV, a software and service platform for Internet-enabled video devices. While we may hire additional employees to meet our business needs, if permanent employees are not available for hire, we may use outside contractors to fulfill our labor needs when and as required to accomplish our operating goals.
Impairment of acquired intangibles
In 2009, no impairment charges were recorded for acquired intangibles. During 2008, we recorded total impairment charges of $1.9 million, of which $1.3 million related to the patented technology license intangible asset acquired in connection with our acquisition of Veatros, L.L.C., a limited liability company, in July 2007. The remaining impairment charge of approximately $600,000 related to the MainConcept tradename, which was acquired as a part of our acquisition of MainConcept in November 2007. As more fully discussed in Note 11 in the accompanying notes to the consolidated financial statements, in management’s impairment analysis of the patented technology intangible asset and of the MainConcept tradename in 2008, we recorded impairment charges of $1.3 million and $600,000, respectively, in 2008 as management concluded that the assets were not fully recoverable. There were no intangible asset impairment charges incurred or recorded during 2009.
Asset Impairment and Restructuring
On February 29, 2008, we shut down Stage6, our online video community service. We evaluated the long-lived assets associated with Stage6 for impairment and concluded that the carrying amount of certain computers and
42
Table of Contents
computer equipment, prepaid assets and an intangible asset were not recoverable and an impairment loss equal to the assets’ remaining carrying values of approximately $350,000 was recorded. In addition, we identified several contractual obligations associated with Stage6 that were determined to have no future economic value. As a result, we recorded a loss of $477,000 on those contractual obligations during 2008.
Litigation settlement gain
In 2009, we recorded a litigation settlement gain of $9.5 million related to our Yahoo! litigation settlement. In 2008, On November 11, 2008, Yahoo! informed us that it intended to discontinue making payments required under the license and distribution agreement we entered into with them in September 2007. As a result, in November 2008, we filed a lawsuit in California Superior Court in Santa Clara County seeking damages from Yahoo! and specific performance under the agreement. On August 18, 2009, we entered into a Settlement Agreement and Mutual Release with Yahoo! pursuant to which Yahoo! paid us $9.5 million in cash in August 2009, and we recorded the cash payment as litigation settlement gain in the consolidated statements of income.
Opportunities, challenges and risks
Our technology licensing revenues from consumer hardware device manufacturers have been primarily dependent upon our licensees’ sales of DVD players that incorporate our technologies. Revenue from technology licensing to consumer hardware device manufacturers decreased by 20% from 2008 to 2009, primarily due to the impact from the broader economic recession and its related negative impact on sales of consumer hardware devices that incorporate our technology. Revenue from technology licensing to consumer hardware device manufacturers increased by 3% from 2007 to 2008 and by 41% from 2006 to 2007. Because our technologies are embedded in DVD players, our licensing revenue is subject to fluctuations based on consumer demand for these products. We expect our revenue growth rates attributable to DVD player sales to decrease as the markets for DVD players mature. We actively promote the incorporation of our video compression technologies for use in other consumer products such as Blu-ray players, digital televisions, mobile phones, set-top boxes and portable media players. Although royalties from these emerging categories of products as a percentage of total net revenues increased from 6% in 2008 to 15% in 2009, there is no assurance we will receive royalties on sales of these products to the level that can compensate for the decrease in royalties on sales of DVD players in the future. If sales of DVD players that incorporate our technologies decreases faster than the increase in the sales of the emerging categories of products, or if our technologies are displaced from these devices by competing technologies, our revenue would be adversely affected.
Historically, the increases in our technology licensing revenues have been driven by increases in the volume of sales of products incorporating our technologies. However, this increase in revenues has been partially offset by declines in the per-unit royalty we derive, which has resulted from a combination of volume-based price discounts and overall pricing pressure on established technology royalties in the market. We believe that if our technology achieves market acceptance as a de facto standard, volumes of devices that incorporate our technologies will continue to increase unless and until our technology fully penetrates the market. To the extent such market acceptance and volume increases occur, we believe that average selling prices of our existing technologies will decline. We may not be able to successfully introduce newer technologies with higher average selling prices into the market to offset any such decline.
One or a small number of our licensees generally represents a significant percentage of our technology licensing revenues. For example, in 2009, Samsung Corporation, Ltd. and Sony Corporation accounted for 13% and 12%, respectively, of our total net revenues. In 2008 and 2007, LG Electronics, Inc. accounted for 11% and 10%, respectively, of our total net revenues. A reduction in these sales or a loss of one or more of our key licensees would adversely affect our licensing revenues.
As technologies consumer hardware devices with video compression capabilities evolve, we must continue to design and deliver innovative technologies that are sought by manufacturers and consumers alike. Part of our
43
Table of Contents
strategy is to have our digital media technologies adopted as de facto industry standards for use in consumer hardware devices. Generally, for a technology to become an industry standard, the royalty rates must not be prohibitively costly as compared to other potential alternatives. As a result, the royalty rates we charge for our technologies will likely be lower than the royalty rates received for technologies not adopted as industry standards, and our long-term ability to raise royalty rates for our technologies could be limited by this trend.
During 2007, a significant portion of our revenues was generated from our agreement with Google. In November of 2007, our agreement with Google expired. Revenues under the Google software distribution and promotion agreement represented approximately 19% of our total net revenues in the year 2007. In September 2007, we entered into a global agreement with Yahoo! to offer consumers who download DivX video software tools a co-branded version of the Yahoo! Toolbar and Internet Explorer 7 optimized for Yahoo!. Through mid-November 2008, Yahoo! paid us fees based on the number of certain distributions or installations of the Yahoo! software by consumers under this agreement. Revenues earned under the Yahoo! agreement accounted for 19% of our total net revenue in the year of 2008. In March 2009, we signed a multi-year agreement with Google Inc. to offer Google products to consumers who download DivX video software tools. The offering, starting with the Google Chrome Browser, launched in the first quarter of 2009 and replaced third party software previously distributed by DivX. In 2009, 8% of our total net revenues were generated from our agreement with Google, Inc. However, this deal may not generate the same amount of revenue as we received pursuant to our prior agreement with Yahoo! and Google may choose not to extend the current agreement when the agreement expires on February 28, 2011.
Acquisitions
In August 2009, we acquired substantially all the assets of AnySource Media, LLC, or AnySource, a technology company developing software and service platforms for Internet-enabled consumer electronics devices. The total consideration for the net assets acquired is up to $15.0 million, consisting of an initial cash payment of $7.5 million, which we made in August 2009, and additional consideration of up to $7.5 million upon the achievement of certain technical product development milestones and certain revenue and distribution milestones. The total acquisition date fair value of the consideration was estimated at $12.5 million, which includes the $7.5 million payment upon the consummation of the transaction and $5.0 million in estimated fair value of contingent consideration. In the fourth quarter of 2009, the first two technical milestones were achieved and $1.4 million additional consideration became due, $750,000 of which was paid as of December 31, 2009. As of December 31, 2009, we reassessed the fair value of the remaining contingent consideration at $4.6 million and recorded the increase in fair value of $400,000 in selling, general and administrative expenses in our consolidated statements of income.
In November 2007, we acquired all outstanding shares of capital stock of MainConcept GmbH, or MainConcept, for approximately $22.6 million. The total purchase price, including acquisition costs of $200,000, was $16.4 million in cash, 88,940 shares of our common stock, which were valued at approximately $1.6 million as of the date of the transaction, and outstanding loans extended to MainConcept by one of its shareholders that we also purchased for an aggregate of approximately $4.4 million. In addition, the purchase agreement provided for additional payments of up to approximately $5.6 million upon the achievement by MainConcept of certain technical product development goals and certain financial milestones in the years of 2007 and 2008. During 2008, the final $2.5 million in milestones achieved was recorded as additional purchase price and allocated to goodwill, which is deductible for U.S. tax purposes. The acquired goodwill is not being amortized for financial reporting purposes, but is assessed periodically for impairment.
In July 2007, we acquired all of the assets of Veatros, L.L.C., or Veatros, a limited liability company engaged in real-time digital video processing for the purposes of producing enhanced video search and discovery services. At the time of acquisition, the operations of Veatros had been wound down and no development projects were in-process. The total purchase price for the acquisition is up to $4.3 million comprised of an initial upfront cash payment of $2.0 million, which we made in July 2007, and subsequent cash payments up to $2.3 million upon the
44
Table of Contents
achievement of certain technology related milestones. We did not acquire any tangible assets or assume any liabilities as a result of the acquisition. We allocated cash payments of $4.3 million to the one identifiable intangible asset, a patented technology license. The asset is being amortized over the remaining life of the patented technology license, or approximately 8 years. In July 2007, subsequent to the asset purchase, our Board of Directors approved a plan to separate our Stage6 operations into a separate private entity, and during the three months ended March 31, 2008, Stage6 was shut down. As a significant portion of the benefit from the acquired patented technology license was originally ascribed to Stage6 future activities, we evaluated the intangible asset for impairment based on the projected benefits solely attributable to our core consumer electronics business. Based on our revised forecasts excluding the Stage6 future activities and discounting the cash flows attributable to our core consumer electronics business, we concluded that the carrying amount of the asset was not fully recoverable and an impairment charge of approximately $3.0 million was recorded in 2007 in the consolidated statements of income for the initial up front cash payment and for the technology milestone. During 2008, technology milestones equal to $1.3 million in the aggregate were achieved. As these technology milestones were attributable to Stage6, the milestones were not considered to be recoverable and as a result, we recorded an impairment charge of $1.3 million in the consolidated statements of income during 2008. All milestones had been achieved and the remaining milestone payment of $250,000 was paid during 2008. As of December 31, 2008, the Company has no remaining liability related to the acquisition of Veatros.
In May 2007, we made an equity investment in deviantART, Inc., or deviantART, a private corporation that aggregates and distributes art via its web community and facilitates an open forum where artists can exhibit their artwork and build community around that art in an effort to drive commerce. Our investment consisted of $3.5 million cash for which we received certain shares of deviantART’s Series A Preferred Stock. As further consideration for our investment, we entered into an advertising and marketing agreement with deviantART. We have allocated approximately $650,000 of the investment to the advertising and marketing agreement, based on its estimated fair value, and the remaining $2.9 million is being carried as an investment. The value allocated to the advertising and marketing agreement was amortized ratably over the period in which the services are being rendered: October 2007 through March 2009. As our ownership is less than 20% of deviantART and we have no influence over its performance, the investment has been accounted for using the cost basis, and is periodically reviewed for impairment. No such impairment has occurred to date. The investment was included in other assets on the consolidated balance sheets.
Critical accounting policies
This discussion and analysis of our financial condition and results of operations is based on our financial statements, which have been prepared in accordance with accounting principles generally accepted in the United States, or U.S. GAAP. The preparation of these financial statements in accordance with U.S. GAAP requires us to use accounting policies and make certain estimates and assumptions that affect the reported amounts of assets and liabilities, the disclosure of contingencies as of the date of the financial statements and the reported amounts of revenue and expenses during a fiscal period. We consider an accounting policy to be critical if it is important to our financial condition and results of operations, and if it requires significant judgment and estimates on the part of management in its application. We have discussed the selection and development of the critical accounting policies with the Audit Committee of our Board of Directors, and the Audit Committee has reviewed our related disclosures. Although we believe that our judgments and estimates are appropriate and reasonable, actual results may differ from those estimates.
We believe the following to be our critical accounting policies because they are both important to the portrayal of our financial condition and results of operations and they require critical management judgments and estimates about matters that are uncertain. If actual results or events differ materially from the judgments and estimates we have employed reporting our financial positions and results, our reported financial condition and results of operation for future periods could be materially affected.
45
Table of Contents
Revenue recognition
We recognize revenue for transactions to sell products and services and to license technology when all four revenue recognition criteria have been met: persuasive evidence of an arrangement exists, we have delivered the product or performed the service, our price to the customer is fixed or determinable and collectibility is reasonably assured. However, determining whether and when some of these criteria have been satisfied often involves assumptions and judgments that can have a significant impact on the timing and amount of revenue we report. For example, for multiple element arrangements we must make assumptions and judgments in order to allocate the total price among the various elements we must deliver, to determine whether undelivered services are essential to the functionality of the delivered products and services, to determine whether vendor-specific evidence of fair value exists for each undelivered element and to determine whether and when each element has been delivered. If we were to change any of these assumptions or judgments, it could cause a material increase or decrease in the amount of revenue that we report in a particular period. Amounts for fees collected or invoiced and due relating to arrangements where revenue cannot be recognized are reflected on our balance sheet as deferred revenue and recognized when the applicable revenue recognition criteria are satisfied.
Our licensing revenue is primarily derived from royalties and/or license fees paid to us by licensees of our intellectual property rights. Revenue in such transactions is recognized during the period in which such customers report to us the number of royalty-eligible units that they have shipped. Revenue from guaranteed minimum-royalty licenses is recognizable upon delivery of the technology license when no further obligations of the Company exist. Certain of our license agreements provide for royalties based on our estimations of the volumes of certain units consumer hardware device manufacturers are estimated to ship during a given term for which we recognize revenue over the term of the contractual agreement. In certain guaranteed minimum-royalty licenses and license agreements based on volume estimates, we enter into extended payment programs with customers. Revenue related to such extended payment programs is recognized at the earlier of when cash is received or when periodic payments become due to us. If we receive non-refundable advance payments from licensees that are allocable to future contract periods or could be creditable against other obligations of the licensee to us, the recognition of the related revenue is deferred until such future period or creditable obligation lapses. Royalties and other license fees are recorded net of reserves for estimated losses, and are recognized when all revenue recognition criteria have been met. We make judgments as to whether collectibility can be reasonably assured based on the licensee’s recent payment history unless significant and persuasive evidence exists that the customer is creditworthy. In the absence of a favorable collection history or significant and persuasive evidence that the customer is creditworthy, we recognize revenue upon receipt of cash, provided that all other revenue recognition criteria have been met.
We have entered into a contractual relationship to license technology to a customer and we also obtained format approval for which we provided consideration to a related customer. In situations where we do not receive an identifiable benefit that is sufficiently separable from our customers purchase of our products or where we cannot reasonably estimate the fair value of the products or services we are purchasing, we record the consideration provided to our customers as an offset to revenues.
We have contracts with original equipment manufacturers, integrated circuit manufacturers, original design manufacturers, independent software vendors, advertisers and content providers. Our revenue recognition policies for each of these arrangements are summarized below.
Technology licensing to original equipment manufacturers. We license our technologies to original equipment manufacturers of consumer hardware devices, and in return each original equipment manufacturer typically pays us a royalty for each royalty-eligible unit the customer ships. Royalty revenue is recognized in the period in which we receive competent evidential matter that revenue has been earned in the form of a shipment report from the customer. If we receive pre-certification license fees from a customer, recognition of this revenue is deferred in its entirety at least until we certify the original equipment manufacturer’s product in accordance with our certification guidelines. If we receive nonrefundable minimum commitments from a customer that are also not allocable to a future contract period, we will recognize the full amount upon billing if collectibility is assured
46
Table of Contents
based on recent payment history, but only if we have no further obligation to provide post-contract support. If we have future support obligations pertaining to minimum commitment agreements, we recognize licensing fees ratably over the length of the agreement because vendor-specific objective evidence does not exist for the unlimited upgrades and support included in the contract.
Technology licensing to integrated circuit manufacturers. We license our technologies to integrated circuit manufacturers and provide support and unlimited upgrades during the contract term so they can incorporate our technologies into the chips they manufacture for consumer hardware devices. The initial license fee is deferred in total until we certify the integrated circuit manufacturer’s product in accordance with our certification guidelines. Because vendor-specific objective evidence does not exist for the service elements, after certification, we recognize the license fee ratably over the remaining length of the associated contract, which is typically two to three years.
Technology licensing to original design manufacturers. We license our technology to original design manufacturer customers and partners who manufacture devices such as DVD players, Blu-ray players, digital televisions, mobile phones, and other consumer hardware devices. Recognition of the related licensing fees is deferred in total until we certify the original design manufacturer’s product in accordance with our certification guidelines, after which we have no further performance obligation.
Technology licensing for software to independent software vendors. We license our technologies for resale to independent software vendors and in return the software vendor pays us a royalty for each unit shipped that incorporates our technologies. Revenue is recognized in the period in which we receive competent evidential matter that revenue has been earned in the form of a shipment report from the software vendor. In addition, in some cases we receive an initial license fee for our software and agree to provide post-contract upgrades and support. In these cases, we recognize the license fees ratably over the length of the contract, as vendor-specific objective evidence typically does not exist for the upgrades and support period implied by the contract. Additionally, we receive maintenance fees under certain contracts for upgrades and support after the initial contract periods. We recognize such maintenance fees ratably over the period of the applicable maintenance period.
Technology licensing for software to consumers. We license our technologies to consumers via our website for a fixed fee per download. The license includes upgrades and support until such time as a new pay version becomes available, which is generally referred to as a “left-of-decimal” upgrade. Payment is made online with a credit card via a third-party payment service provider, who in turn remits aggregate payments to us on a monthly basis. We recognize these revenues ratably over the period ending at the next expected left-of-decimal upgrade, which is typically 24 months from the time of the last upgrade, as vendor-specific objective evidence typically does not exist for the upgrades and support under such licensing agreements.
Advertising and third-party product distribution. We are paid by third-party software companies for distributing their software when such software is downloaded or installed via our website, typically within our own software download products. The related distribution fees are recognized based on the number of downloads and activations. We recognize these fees upon receiving competent evidential documentation from our reporting systems.
Content distribution services. We make available our online video delivery system to content providers in return for a revenue share of the download-for-rental or sales revenue generated from certain of the content provider’s customer using our delivery system. The content partner delivers a video-on-demand movie through its website using our Open Video System. The end consumer renting or purchasing such content must pay by credit card before being allowed to download the content. We earn a certain percentage of each transaction based on a pre-negotiated revenue share with certain of our content-provider customer. Revenue from such revenue share arrangements is recognized monthly based on sales reports, net of any returns or charge backs. In addition, we also receive up-front license fees from certain content partners and we recognize revenue of such license fees over the contract partner’s expected contract period.
47
Table of Contents
Encoding services. We encode the content of certain customers into the DivX format and charge these customers for this service. In some cases revenue is recognized in full after the encoding service is performed if the customer agrees to provide a deposit in full. In other cases revenue is recognized and invoiced based on a calculation of value per unit of DivX-encoded content that is downloaded from a content provider’s site. In addition, we also receive up-front encoding fees from certain content providers and we recognize revenue of such encoding fees over the contract partner’s expected contract period as we cannot separate the encoding fee from our ongoing service obligation.
We record revenue net of allowances for uncollectible sales. We continually monitor customer payment performance and maintain a reserve for estimated amounts that may be uncollectible. In determining our reserve, we evaluate the collectibility of our accounts receivable based upon a variety of factors. In cases where the customer is new and has an undemonstrated ability to pay, we delay recognition of the revenue until such time as the new customer has paid unless significant and persuasive evidence exists that the customer is creditworthy. In cases where we are aware of circumstances that may impair a specific customer’s ability to meet its financial obligations, despite the customer’s payment history, we record a specific allowance against amounts due and thereby reduce the net recognized receivable to the amount reasonably believed to be collectible. For all other customers, we recognize allowances for uncollectible sales based on our actual historical write-off experience in conjunction with the length of time the receivables are past due, customer creditworthiness, geographic risk and the current business environment. Actual future losses from uncollectible accounts may differ from our estimates and may materially affect our consolidated statements of income and our financial condition.
Accounting for income taxes
In preparing our financial statements we are required to make estimates and judgments that affect our accounting for income taxes. This process includes estimating current tax exposure together with assessing temporary differences resulting from differing treatment of items for tax- and financial-accounting purposes. These differences, including differences in the timing of recognition of share-based compensation expense, result in deferred tax assets and liabilities. We also assess the likelihood that our deferred tax assets will be recovered from future taxable income and, to the extent we believe recovery is not more-likely-than-not, we have established a valuation allowance. Significant judgment is required in determining the provision for income taxes, deferred tax assets and liabilities and any valuation allowance against our net deferred tax assets. Our financial position and results of operations may be materially impacted if actual results significantly differ from these estimates or the estimates are adjusted in future periods.
The calculation of our tax liabilities involves dealing with uncertainties in the application of complex tax regulations. In accordance with the applicable accounting guidance for Uncertainty in Income Taxes, we recognize liabilities for uncertain tax positions based on a two-step process. The first step is to evaluate the tax position for recognition by determining if the weight of available evidence indicates that it is more likely than not that the position will be sustained on audit, including resolution of related appeals or litigation processes, if any. If we determine that a tax position will more likely than not be sustained on audit, then the second step requires us to estimate and measure the tax benefit as the largest amount that is more than 50% likely to be realized upon ultimate settlement. It is inherently difficult and subjective to estimate such amounts, as we have to determine the probability of various possible outcomes. We reevaluate these uncertain tax positions on a quarterly basis. This evaluation is based on factors including, but not limited to, changes in facts or circumstances, changes in tax law, effective settlement of audit issues, and new audit activity. Such a change in recognition or measurement would result in the recognition of a tax benefit or an additional charge to the tax provision.
48
Table of Contents
Fair Value Measurements
We follow the applicable accounting standard for the recognition and disclosure of financial assets and liabilities, which requires financial assets and liabilities to be recognized and presented at fair value. Fair value is defined under the applicable guidance as the exchange price that would be received for an asset or paid to transfer a liability (an exit price) in the principal or most advantageous market for the asset or liability in an orderly transaction between market participants on the measure date. Valuation techniques used to measure fair value must maximize the use of observable inputs and minimize the use of unobservable inputs. The standard describes a fair value hierarchy based on three levels of inputs, of which the first two are considered observable and the last unobservable, that may be used to measure fair value which are the following:
Level 1 – Quoted prices in active markets for identical assets or liabilities.
Level 2 – Inputs other than Level 1 that are observable, either directly or indirectly, such as quoted prices for similar assets or liabilities; quoted prices in markets that are not active; or other inputs that are observable or can be corroborated by observable market data for substantially the full term of the assets or liabilities.
Level 3 – Unobservable inputs that are supported by little or no market activity and that are significant to the fair value of the assets or liabilities.
All of the securities classified as Level 3 instruments contain an auction reset feature, or ARS, whose underlying assets are student loans which are substantially backed by the federal government. As of December 31, 2009, we held $18.4 million par value ARS, all of which experienced failed auctions during 2009. The underlying assets of the ARS include $16.8 million which were guaranteed by the U.S. government and the remaining $1.6 million were privately insured. All of these ARS had credit ratings of AAA, except one rated AA1 and two rated A3, by a rating agency. These ARS have contractual maturity dates ranging from 2030 to 2047.
The significant inputs and assumptions we used in the discounted cash flow model to determine the fair value of our ARS, as of December 31, 2009, were as follows:
| • | The discount rate was determined based on the average three-month LIBOR (0.28%) during the fourth quarter of 2009, adjusted by 92 basis points (bps) to reflect the current market conditions for instruments with similar credit quality at the date of valuation. In addition, the discount rate was adjusted for a liquidity discount of approximately 500 bps to reflect the market risk for these investments that has arisen due to the lack of an active market. |
| • | We assigned an additional credit risk discount of approximately 100 bps to the discount rate for all ARS that are not fully backed by the federal government. The total carrying value as of December 31, 2009 of investments not fully backed by the federal government was approximately $1.6 million. |
| • | We applied the discount rate over the expected life of 8 years of the estimated cash flows of the ARS. The projected interest income is based on the future contractual rates set forth in the individual prospectus for each of the ARS. |
In November 2008, we entered into an agreement with UBS AG, or UBS, which provides us certain rights to sell to UBS the ARS which were purchased through them. As of December 31, 2009, we held $14.2 million par value ARS purchased from UBS. We have the option to sell these securities to UBS at par value from June 30, 2010 through July 2, 2012. UBS, at its discretion, may purchase or sell these securities on our behalf at any time provided we receive par value for the securities sold. The issuers of the ARS continue to have the right to redeem the securities at their discretion. The agreement allows for the continuation of the accrual and payment of interest due on the securities. The agreement also provides us with access to loans of up to 75% of the par value of the unredeemed securities until June 30, 2010. These loans would carry interest rates which would be consistent with the interest income on the related auction-rate securities. As of December 31, 2009, we had no loans outstanding under this agreement.
49
Table of Contents
Our right to sell the ARS to UBS commencing June 30, 2010 represents a put option for a payment equal to the par value of the ARS. As the put option is non-transferable and cannot be attached to the ARS if they are sold to another entity other than UBS, it represents a freestanding instrument. We elected the fair value option under the applicable accounting standard for the fair value option for financial assets and liabilities, and recorded the put option in short-term investments in the consolidated balance sheets. The changes in fair value of our right to sell the ARS to UBS and the UBS ARS are recorded in other income (expense), net in the consolidated statements of income.
During 2009, in other income (expense), net in the consolidated statements of income, we recorded a loss of $745,000 and a gain of $930,000 representing the changes in the fair value of the put option and of the ARS, respectively, during the year.
Our significant inputs and assumptions used in the discounted cash flow model to determine the fair value of the put option, as of December 31, 2009, are as follows:
| • | The discount rate was determined based on the 6 month LIBOR (0.25%), adjusted by 10 bps to reflect the credit and performance risk associated with the UBS put option. |
| • | We applied the discount rate over the expected life of 6 months of the estimated cash flows of the put option. The projected interest income is based on the future contractual rates set forth in the individual prospectus for each of the ARS that is included in the put option. |
The remaining $4.2 million par value ARS is held by another investment advisor, who has not made an offer similar to UBS and we continue to classify those ARS as available-for-sale securities. Accordingly, the change in associated market value has been recorded against accumulated other comprehensive loss as of December 31, 2009. If the market conditions deteriorate further, we may be required to record additional unrealized losses in accumulated other comprehensive loss or record an other-than-temporary impairment charge in the consolidated statements of income. We may not be able to liquidate these investments unless the issuer calls the security, a successful auction occurs, a buyer is found outside of the auction process, or the security matures.
Share-based compensation
We recognize share-based compensation expense for costs related to all share-based payments including stock options, based on the fair value of the award at the grant date and over the requisite service period. We use the Black-Scholes option pricing model to estimate the fair value of options granted under employee share-based compensation plans. The Black-Scholes model meets the requirements of the accounting standard regarding share-based compensation, but the fair values generated by the model may not be indicative of the actual fair values of our equity awards as it does not consider certain factors important to those awards to employees, such as continued employment and periodic vesting requirements as well as limited transferability. The Black-Scholes option pricing model requires us to estimate a variety of factors, including the expected term of the option, the volatility of our common stock, the applicable risk-free rate, dividend yield and the forfeiture rate. The expected term used represents the weighted-average period that the stock options are expected to be outstanding. We use the historical volatility of our common stock as well as the historical volatility of a comparable peer group to derive the expected volatility of our common stock. The peer group historical volatility is used due to the limited trading history of our common stock. We use a risk-free interest rate that is based on the implied yield available on U.S. Treasury issued with an equivalent remaining term at the time of grant. We have not paid dividends in the past and currently do not plan to pay any dividends in the foreseeable future and as such, dividend yield is assumed to be zero for the purposes of valuing the stock options granted. The fair value of our restricted stock units is based on the closing market price of our common stock on the date of grant. We evaluate the assumptions used to value stock awards on a quarterly basis. If factors change and we employ different assumptions, share-based compensation expense may differ significantly from what we have recorded in the past. When there are any modifications or cancellations of the underlying unvested securities, we may be required to accelerate, increase or cancel any remaining unearned share-based compensation expense. To the extent that we grant
50
Table of Contents
additional equity securities to employees, our share-based compensation expense will be increased by the additional unearned compensation resulting from those additional grants. We also classify the cash flows resulting from the tax benefits due to tax deductions in excess of the compensation cost recognized for those options (excess tax benefits) as financing cash flows.
Similarly, we also recognize share-based compensation expenses for non-employees. Equity instruments awarded to non-employees are periodically remeasured as the underlying awards vest unless the instruments are fully vested, immediately exercisable and nonforfeitable on date of grant.
Goodwill Impairment
Goodwill represents the excess of the purchase price over the fair value of the net tangible and identifiable intangible assets acquired in a business combination. We perform our goodwill impairment assessment on an annual basis, during the fourth quarter, or more frequently, if changes in facts and circumstances indicate that an impairment may exist in the value of goodwill recorded on our balance sheets.
Our goodwill impairment assessment involves a two-step process. The first step involves comparing the fair values of the applicable reporting units with their aggregate carrying values, including goodwill. If the carrying value of a reporting unit exceeds the reporting unit’s fair value, we perform the second step of the test to determine the amount of any impairment loss. The second step involves measuring the impairment by comparing the implied fair values of the affected reporting unit’s goodwill and intangible assets with the respective carrying values. The performance of our impairment test on indefinite lived assets involves assessing the fair value of each intangible asset as of the assessment date, and comparing the fair value with the carrying value of these assets. If the carrying value exceeds the fair value of these assets, an impairment loss is recognized for the difference between the carrying value and fair value.
We performed our annual impairment assessment on the carrying value of goodwill as of October 1, 2009. At October 1, 2009, we had one reporting unit. We estimated the fair value of our reporting unit using both the income approach valuation methodology that includes the discounted cash flow method, and the market approach which utilizes market multiples and other company-specific data to estimate the fair value. The discounted cash flows for the one reporting unit were based on discrete financial forecasts developed by management for planning purposes. Cash flows beyond the discrete forecasts were estimated using a terminal value calculation, which incorporated historical and forecasted financial trends for the identified reporting unit and considered long-term earnings growth rates. Future cash flows were discounted to present value. Specifically, the income approach valuations included reporting unit cash flow discount rates ranging from 17% to 18%, and terminal value growth rates ranging from 3% to 5%. Publicly available information regarding our market capitalization was also considered in assessing the reasonableness of the cumulative fair value of our reporting unit estimated using the discounted cash flow methodology.
To validate the reasonableness of the reporting unit fair value, we reconciled the aggregated fair value of the reporting unit determined in step one of the goodwill impairment assessment to the market capitalization of our stock to derive the implied control premium. In performing this reconciliation, we used an average stock price over a range of dates around the valuation date, generally 30 days. We assessed the implied control premium to determine if the fair value of the reporting unit estimated in step one of the goodwill impairment assessment was reasonable.
Upon completion of our 2009 annual impairment assessment, we determined that no impairment existed as the estimated fair value of the reporting unit exceeded its carrying value. Significant management judgment is required in the annual impairment assessment and changes in estimates and assumptions that we make in our analysis could affect the estimated fair value of our reporting unit and could result in a goodwill impairment charge in a future period.
51
Table of Contents
Purchased Intangible Assets
In connection with our acquisition of AnySource in August 2009, we recorded $4.4 million of in-process research and development, or IPR&D, as an intangible asset. Prior to 2009, IPR&D was required to be expensed upon acquisition. Effective January 1, 2009, due to changes in the accounting standards regarding business combinations, IPR&D and defensive assets acquired are required to be capitalized. The amounts and useful lives assigned to intangible assets acquired, other than goodwill, impact the amount and timing of future amortization. The value of our intangible assets, including goodwill, may be impacted by future adverse changes such as: (i) any future declines in our operating results, (ii) a decline in the valuation of technology company stocks, including the valuation of our common stock, (iii) a further significant slowdown in the worldwide economy, (iv) any failure to meet the performance projections included in our forecasts of future operating results or (v) the abandonment of any of our acquired IPR&D projects.
In the determination of the fair value of the IPR&D, various factors were considered, such as future revenue contributions, additional licensing costs associated with the underlying technology, and contributory asset charges. The fair value of the IPR&D was calculated using an income approach and the rate utilized to discount net future cash flows to their present values was based on a weighted average cost of capital of approximately 30%. This discount rate was determined after considering our cost of debt adjusted for a risk premium that market participants would require in an investment in companies that are at similar stages of development as AnySource. IPR&D will not be amortized until the product is complete, at which time it is anticipated to be amortized over the estimated useful life of the developed technology of seven years. The useful life of the IPR&D was estimated as the period over which the asset is expected to contribute directly or indirectly to the future cash flows. Up to the point that the product is complete, we will assess the IPR&D annually for impairment, or more frequently if certain indicators are present. We performed our annual impairment test of the IPR&D as of December 31, 2009, and concluded that no impairment existed.
The continued development of acquired IPR&D consists of developing the software and service platform for Internet-enabled consumer electronics devices. At the date of acquisition, the software under development had not reached technological feasibility. The in-process technology had no alternative future use at the date of acquisition and did not otherwise qualify for capitalization. We anticipate this development project to be on-going for several years, with integration in consumer electronics devices starting 2010. We estimate our costs associated with it to be approximately $5.0 million in 2010. Although we believe we are on schedule with the development project as of December 31, 2009, we are aware that there are risks and uncertainties associated with completing the development of the acquired in-process technology on schedule, including the timely, efficient and successful execution of a number of post-transaction integration activities, and potential interruption of, or loss of momentum in, the activities of one or more of our businesses and the loss of key personnel. The delays or difficulties encountered in connection with the integration of AnySource’s technologies with our technologies could have an adverse effect on our business, results of operations or financial condition.
In connection with our acquisition of MainConcept in November 2007, we identified the MainConcept tradename as an intangible asset with an indefinite life, and valued the tradename at $1.8 million. During the annual impairment assessment of the carrying value of the MainConcept tradename as of October 1, 2008, we concluded that the carrying value of the tradename exceeded its fair value, and recorded an impairment charge of approximately $600,000 in the consolidated statements of income of 2008. We estimated the fair value of the tradename using the income approach valuation methodology that includes the discounted cash flow method, based on discrete financial forecasts developed by management for planning purposes and incorporates a terminal value calculation for years beyond the internal forecasts. Future cash flows were also discounted to present value by incorporating present value techniques. Specifically, the income approach valuation used a cash flow discount rate of 17% and a terminal value growth rate of 4%. Upon completion of our annual impairment assessment as of October 1, 2008, we determined that the carrying value of the MainConcept tradename exceeded its fair value, and we recorded an impairment charge of approximately $600,000 in the consolidated statements of income of 2008. In addition, as of December 31, 2008, we determined that the life of the tradename was no longer indefinite based on our revised estimated usage and started to amortize the tradename prospectively over its estimated useful life of 6 years.
52
Table of Contents
Long-lived assets, including as intangible assets, are evaluated for impairment whenever events or changes in circumstances indicate the carrying value of an asset may not be recoverable. We assesses the value of the assets based on the future cash flows the assets are expected to generate, and recognizes an impairment loss when the estimated undiscounted future cash flows that are expected to result from the use of the assets, plus net proceeds expected from disposition of the assets (if any), are less than the carrying value of the assets. When an impairment is identified, we reduce the carrying amount of the assets to estimated fair value based on a discounted cash flow approach or, when available and appropriate, comparable market values.
Contingent Consideration
In connection with certain of our acquisitions, additional contingent considerations were earned and may be earned in the future by the sellers upon completion of certain technical product development milestones and financial milestones. Prior to 2009, we recognized additional contingent consideration as an additional element of the cost of the acquisition, generally goodwill, when the contingency was resolved beyond a reasonable doubt and the additional consideration was issued or became issuable. Due to changes in the accounting standards regarding business combinations, for all acquisitions consummated on or after January 1, 2009, a liability is recognized on the acquisition date for an estimate of the acquisition date fair value of the contingent consideration based on the probability of achieving the milestones and the probability weighted discount on cash flows. Any change in the fair value of contingent milestone consideration subsequent to the acquisition date is recognized in the consolidated statements of income.
Results of Operations
The following table presents our results of operations as a percentage of total net revenues for the years indicated:
| Year ended December 31, | |||||||||
| 2009 | 2008 | 2007 | |||||||
| Net revenues: |
|||||||||
| Technology licensing |
92 | % | 80 | % | 78 | % | |||
| Media and other distribution and services |
8 | 20 | 22 | ||||||
| Total net revenues |
100 | 100 | 100 | ||||||
| Total cost of revenues |
14 | 5 | 5 | ||||||
| Gross margin |
86 | 95 | 95 | ||||||
| Operating expenses: |
|||||||||
| Selling, general and administrative(1) |
70 | 58 | 69 | ||||||
| Product development(1) |
29 | 21 | 22 | ||||||
| Litigation settlement gain |
(14 | ) | — | — | |||||
| Impairment of acquired intangibles |
— | 2 | 3 | ||||||
| Total operating expenses |
85 | 81 | 94 | ||||||
| Income from operations |
1 | 14 | 1 | ||||||
| Interest income (expense), net |
2 | 5 | 9 | ||||||
| Other income (expense), net |
— | (1 | ) | — | |||||
| Income before income taxes |
3 | 18 | 10 | ||||||
| Income tax provision (benefit) |
3 | 7 | (1 | ) | |||||
| Net income |
— | % | 11 | % | 11 | % | |||
|
(1) Includes share-based compensation as follows: |
|||||||||
| Selling, general and administrative |
11 | % | 7 | % | 12 | % | |||
| Product development |
2 | 2 | 2 | ||||||
53
Table of Contents
The following table summarizes and analyzes the net revenues we earned on each of our revenue streams for the years ended December 31, 2009, 2008 and 2007, in absolute dollars (in thousands) and as a percentage of total net revenues:
| Year ended December 31, |
2009-2008 Change |
Year ended December 31, 2007 |
2008-2007 Change |
|||||||||||||||||||
| 2009 | 2008 | $ | % | $ | % | |||||||||||||||||
| Net revenues: |
||||||||||||||||||||||
| Technology licensing |
||||||||||||||||||||||
| Consumer hardware devices |
$ | 49,638 | $ | 61,761 | $ | (12,123 | ) | (20 | )% | $ | 59,952 | $ | 1,809 | 3 | % | |||||||
| % of total net revenues |
70% | 66% | 70% | |||||||||||||||||||
| Software |
15,284 | 13,311 | 1,973 | 15 | 6,393 | 6,918 | 108 | |||||||||||||||
| % of total net revenues |
22% | 14% | 8% | |||||||||||||||||||
| Total technology licensing |
64,922 | 75,072 | (10,150 | ) | (14 | ) | 66,345 | 8,727 | 13 | |||||||||||||
| % of total net revenues |
92% | 80% | 78% | |||||||||||||||||||
| Advertising and third-party product distribution |
5,377 | 18,281 | (12,904 | ) | (71 | ) | 17,972 | 309 | 2 | |||||||||||||
| % of total net revenues |
8% | 19% | 21% | |||||||||||||||||||
| Content distribution and related services |
307 | 552 | (245 | ) | (44 | ) | 545 | 7 | 1 | |||||||||||||
| % of total net revenues |
0% | 1% | 1% | |||||||||||||||||||
| Total net revenues |
$ | 70,606 | $ | 93,905 | $ | (23,298 | ) | (25 | )% | $ | 84,862 | $ | 9,043 | 11 | % | |||||||
Technology licensing—consumer hardware devices: The $12.1 million, or 20%, decrease in revenues from technology licensing to consumer hardware device manufacturers from the year ended December 31, 2008 to the year ended December 31, 2009, resulted primarily from a decrease in net royalty revenues associated with shipped-unit volumes of devices that incorporate our technologies reported to us by our licensee partners. Included in revenues from technology licensing recognized during the year ended December 31, 2009, was $1.7 million of revenue that had been deferred from the prior year under minimum volume commitment and fixed fee commitment arrangements.
The $1.8 million, or 3%, increase in revenues from technology licensing to consumer hardware device manufacturers from the year ended December 31, 2007 to the year ended December 31, 2008, resulted primarily from an increase in net royalty revenues associated with shipped-unit volumes of devices reported to us by our licensee partners. Included in revenues from technology licensing recognized during the year ended December 31, 2008 was $2.4 million which had been deferred from the prior year under minimum volume commitment and fixed fee commitment arrangement.
Technology licensing—software: The $2.0 million, or 15%, increase in revenues from technology licensing to software vendors from the year ended December 31, 2008 to the year ended December 31, 2009, resulted primarily from a $4.0 million increase in revenues generated from our MainConcept video software licensing business, partially offset by a $2.0 million decrease in revenues from our website sales of our consumer video software licensing business, as a result of additional revenue recognized in 2008 upon early termination of the support period over which revenue was being recognized on a prior version of our website software.
The $6.9 million, or 108%, increase in revenues from technology licensing to software vendors from the year ended December 31, 2007 to the year ended December 31, 2008 resulted primarily from our acquisition of MainConcept in November 2007. Total software licensing revenue generated by MainConcept amounted to $6.2 million during the year of 2008. The remaining balance of the increase of $700,000 is primarily due to an increase of $1.0 million in revenues from additional software products sold directly to consumers in 2008 compared to 2007, and an increase of $1.0 million due to revenue recognized upon early termination of the support period over which revenue is being recognized on a prior version of our website software as a result of
54
Table of Contents
our launch of a new version of our website software in January 2009, offset by a decrease of $1.3 million in other software licensing revenues, primarily due to the expiration of our a two-year codec licensing agreement with Google in November 2007.
Advertising and third-party product distribution: The $12.9 million, or 71%, decrease in advertising and third-party product distribution revenue from the year ended December 31, 2008 to the year ended December 31, 2009 resulted primarily from the loss of revenue under our two-year License and Distribution Agreement, or Distribution Agreement that we entered into with Yahoo! on September 27, 2007. Revenue from the year ended December 31, 2008 included $18.0 million revenue from Yahoo! pursuant to the Distribution Agreement, under which Yahoo! paid us fees based on the number of certain distributions or installations of the Yahoo! software by consumers. In November 2008, Yahoo! notified us that they intended to breach the Distribution Agreement, and would discontinue making payments required under the Distribution Agreement. As a result, no revenue from Yahoo! was recorded during the year ended December 31, 2009. On March 9, 2009, we entered into a new promotion and distribution agreement with Google, Inc., or Google, pursuant to which we distribute Google products with our software offerings. Google pays us fees under the agreement based on successful activations of Google’s products. Distribution revenue pursuant to the agreement, starting with Google’s new browser, Chrome, for the year ended December 31, 2009 was $5.4 million, which represented approximately 8% of our total revenue in the year ended December 31, 2009.
The $309,000, or 2%, increase in advertising and third-party product distribution revenue from the year ended December 31, 2007 to the year ended December 31, 2008 resulted primarily from an increase in revenues associated with our distribution agreement with Yahoo! compared to our agreement with Google in 2007. In November 2007, we switched from distribution of the Google software, to instead including and distributing a co-branded Yahoo! toolbar and Internet Explorer browser with our software products under agreement with Yahoo!.
Content distribution and related services: Content distribution and related services revenues decreased $245,000, or 44% from the year ended December 31, 2008 to the year ended December 31, 2009 as a result of a reduction in reported revenue by our Open Video System, or OVS, partners. Content distribution and related services revenues are the result of sales by our OVS customers and encoding and license revenues.
Content distribution and related services revenues remained relatively consistent from $545,000 in the year ended December 31, 2007 to $552,000 in the year ended December 31, 2008. We did not incur significant fluctuations in the business volume of our OVS customers during 2008.
The following table shows the gross profit earned on each of our revenue streams for the years ended December 31, 2009, 2008 and 2007, in absolute dollars (in thousands) and as a percentage of related revenues:
| Year ended December 31, |
2009-2008 Change |
Year ended December 31, 2007 |
2008-2007 Change |
|||||||||||||||||||
| 2009 | 2008 | $ | % | $ | % | |||||||||||||||||
| Gross profit: |
||||||||||||||||||||||
| Technology licensing |
$ | 55,755 | $ | 71,190 | $ | (15,435 | ) | (22 | )% | $ | 62,567 | $ | 8,623 | 14 | % | |||||||
| Gross margin % |
86% | 95% | 94% | |||||||||||||||||||
| Advertising and third-party distribution |
5,022 | 18,070 | (13,048 | ) | (72 | ) | 17,799 | 271 | 2 | |||||||||||||
| Gross margin % |
93% | 99% | 99% | |||||||||||||||||||
| Content distribution and related services |
117 | 49 | 68 | 139 | 17 | 32 | 188 | |||||||||||||||
| Gross margin % |
38% | 9% | 3% | |||||||||||||||||||
| Total gross profit |
$ | 60,894 | $ | 89,309 | $ | (28,415 | ) | (32 | )% | $ | 80,383 | $ | 8,926 | 11 | % | |||||||
| Gross margin % |
86% | 95% | 95% | |||||||||||||||||||
55
Table of Contents
Technology licensing: The decrease in our technology licensing gross profit of $15.4 million, or 22% and the associated decrease in gross margin from the year ended December 31, 2008 to the year ended December 31, 2009, were due primarily to a decrease in our technology licensing revenue and an increase in our H.264 license costs of approximately $5.4 million, associated with the launch of the new version of our website software during the first quarter of 2009.
The increase in overall gross profit, in terms of absolute dollars, from the year ended December 31, 2007 to the year ended December 31, 2008 was primarily due to increased royalties from technology licensing to consumer hardware device manufacturers without a corresponding increase in royalty expenses due to our licensors.
Advertising and third-party product distribution: The decrease in our advertising and third-party distribution gross profit of $13.0 million, or 72%, and the associated gross margin from the year ended December 31, 2008 to the year ended December 31, 2009, were primarily due to loss in toolbar revenue under our advertising services agreement with Yahoo!, partially offset by revenue under our agreement with Google.
The overall gross profit from advertising and third-party product distribution remained relatively consistent from the year ended December 31, 2007 to December 31, 2008. Our cost of advertising and product distribution revenue has remained relatively fixed as a percentage of such revenue because the cost of bandwidth associated with product downloads is directly proportional to the volume of downloads.
Content distribution and related services: The increase in gross profit from our content distribution and related services of $68,000 from the year ended December 31, 2008 to the year ended December 31, 2009 was primarily due to the decrease in bandwidth costs in an amount greater than the decrease in revenues from this line of business.
The increase in gross profit from our content distribution and related services from the year ended December 31, 2007 to the year ended December 31, 2008 was primarily due to certain costs related to the Stage6 service which were incurred during 2007, but no longer incurred after we shut down Stage6 on February 29, 2008.
The following table summarizes and analyzes our operating expenses for the years ended December 31, 2009, 2008 and 2007, in absolute dollars (in thousands) and as a percentage of total net revenues:
| Year ended December 31, |
2009-2008 Change |
Year ended December 31, 2007 |
2008-2007 Change |
|||||||||||||||||||||
| 2009 | 2008 | $ | % | $ | % | |||||||||||||||||||
| Operating expenses: |
||||||||||||||||||||||||
| Selling, general and administrative |
$ | 49,270 | $ | 54,597 | $ | (5,327 | ) | (10 | )% | $ | 58,315 | $ | (3,718 | ) | (6 | )% | ||||||||
| % of total net revenues |
70% | 58% | 69% | |||||||||||||||||||||
| Product development |
20,647 | 20,184 | 463 | 2 | 18,738 | 1,446 | 8 | |||||||||||||||||
| % of total net revenues |
29% | 21% | 22% | |||||||||||||||||||||
| Litigation settlement gain |
(9,500 | ) | — | (9,500 | ) | 100 | — | |||||||||||||||||
| % of total net revenues |
(14)% | — | — | |||||||||||||||||||||
| Impairment of acquired intangibles |
— | 1,882 | (1,882 | ) | (100 | ) | 2,973 | (1,091 | ) | (37 | ) | |||||||||||||
| % of total net revenues |
— | 2% | 3% | |||||||||||||||||||||
| Total operating expenses |
$ | 60,417 | $ | 76,663 | $ | (16,246 | ) | (21 | )% | $ | 80,026 | $ | (3,363 | ) | (4 | )% | ||||||||
Selling, general and administrative: The $5.3 million, or 10%, decrease in selling, general and administrative expenses from the year ended December 31, 2008 to the year ended December 31, 2009 was primarily due to (1) a $2.8 million decrease in compensation and benefits expenses primarily due to our shut-down of our online video community service, Stage 6, on February 29, 2008, and the reduction in our workforce that we implemented in December 2008, (2) a $2.0 million decrease in Internet connectivity related costs and patent royalty costs associated with the shut-down of Stage6, (3) a $1.2 million decrease in marketing, advertising and
56
Table of Contents
promotion expenses, (4) a $1.2 million decrease in travel and entertainment, (5) a $1.1 million decrease in outside professional service fees and recruiting and relocation expenses and (6) a $1.1 million decrease in allocated facility, depreciation and amortization expenses. These decreases were partially offset by a $1.9 million increase in legal service fees primarily relating to our UMG and Yahoo! legal settlement, $1.6 million increase in format fee amortization expenses related to the Warner Brothers format approval agreement and other similar format approval agreements, and an approximately $600,000 increase in share-based compensation expense.
The $3.7 million, or 6%, decrease in selling, general and administrative expenses from the year ended December 31, 2007 to the year ended December 31, 2008 was principally due to a $5.6 million decrease in Internet connectivity related costs and patent royalty costs associated with the shut-down of Stage6, a $3.0 million decrease in share-based compensation expenses, and a $1.0 million decrease in other headcount costs due in part to lower commissions, recruiting expenses and employee benefits, offset by a $5.5 million increase in MainConcept related selling, general and administrative expenses, primarily due to inclusion of a full year of costs for 2008 as compared to inclusion of less than two months of expenses in 2007 as MainConcept was acquired in November 2007, and an approximately $400,000 increase in other expenses, including travel, rent, and utility expenses.
Product development: The $463,000, or 2%, increase in product development expense from the year ended December 31, 2008 to the year ended December 31, 2009 was primarily due to a $600,000 increase in allocated facility and depreciation costs, a $400,000 increase in headcount related costs due to the increase in product development headcount including employees hired as a result of our acquisition of substantially all of the assets of AnySource on August 27, 2009, partially offset by a $350,000 decrease in share-based compensation expenses primarily due to lower expenses recognized for prior year option grants that had a full year of expense in 2008 and became fully expensed during 2009, and a $150,000 decrease in office expense, rent and utility expenses.
The $1.4 million, or 8%, increase in product development expense from the year ended December 31, 2007 to the year ended December 31, 2008 was principally due to a $2.3 million increase in MainConcept related expenses, due to inclusion of a full year of expense resulting from our acquisition of MainConcept in November 2007, offset by $600,000 decrease in payroll and employee benefits resulting from decreased average headcount from 205 for 2007 to 163 for 2008, and a $300,000 decrease in outside services costs in 2008. MainConcept costs primarily include salary and headcount related expenses and outside services costs.
Litigation settlement gain: For the year ended December 31, 2009, we recorded a litigation settlement gain of $9.5 million from our settlement with Yahoo!. On November 11, 2008, Yahoo! informed us that it intended to breach the Distribution Agreement, and to discontinue making payments required under the Distribution Agreement. As a result, in November 2008, we filed a lawsuit in California Superior Court in Santa Clara County seeking damages from Yahoo! and specific performance under the Distribution Agreement. On August 18, 2009, we entered into a Settlement Agreement and Mutual Release with Yahoo! pursuant to which Yahoo! paid us $9.5 million in cash in August 2009, and we recorded the cash payment as litigation settlement gain in the consolidated statements of income.
Impairment of acquired intangibles: For the year ended December 31, 2008, we recorded an impairment charge of $1.3 million related to the patented technology license intangible asset acquired in connection with our acquisition of Veatros in July 2007, and an impairment charge of approximately $600,000 related to the MainConcept tradename, which was acquired in connection with our acquisition of MainConcept in November 2007. We performed an impairment analysis of the finite lived patented technology license and of the indefinite lived tradename and concluded that the assets were not fully recoverable.
Interest income (expense), net: We recorded interest income (expense), net of $1.6 million for the year ended December 31, 2009 compared to $4.4 million for the year ended December 31, 2008. The decrease is reflective of lower interest rates during 2009 compared to 2008.
57
Table of Contents
We recorded interest income (expense), net of $4.4 million for the year ended December 31, 2008 compared to $7.8 million for the year ended December 31, 2007. The decrease is primarily due to lower interest rates and lower average cash and equivalents, and investment balances during 2008. The lower average cash balances primarily resulted from cash used to acquire MainConcept in November 2007 and cash used to repurchase shares of our common stock in 2008, compared to the same period in the prior year.
Other income (expense), net: We recorded other income totaling $301,000 for the year ended December 31, 2009 as compared to other expense of $479,000 for the year ended December 31, 2008. The fluctuations in other income (expenses), net were primarily due to foreign exchange gains or losses on our Euro-based intercompany receivable balances.
We recorded other income (expense), net of $479,000 for the year ended December 31, 2008 as compared to $42,000 for the year ended December 31, 2007. The fluctuations in other income (expenses), net were primarily due to foreign exchange losses on our Euro-based intercompany receivable balance which resulted from our acquisition of MainConcept.
Income tax provision: We recorded an income tax provision of approximately $2.3 million for the year ended December 31, 2009. The effective tax rate for 2009 was approximately 95%. The difference between our effective tax rate and the U.S. federal statutory rate of 35% was primarily due to a $1.4 million impact to our tax provision for a California tax law change that was enacted in February 2009, state income taxes net of federal benefit and non-deductible share-based compensation, partially offset by research and development tax credit.
During the year ended December 31, 2008, we recorded an income tax provision of approximately $6.6 million for the year ended December 31, 2008. The effective tax rate for 2008 was approximately 40%, which differed from the U.S. federal statutory rate of 35% due primarily to state income taxes net of federal benefit and non-deductible share-based compensation, partially offset by research and development tax credit and a tax benefit of $320,000 related to the release of the valuation allowance on certain deferred tax assets recorded on our MainConcept subsidiary during 2008 that became more-likely-than-not recoverable. The elimination of our valuation allowance resulted in a benefit of $320,000 recognized as a non-cash increase in net income for the year ended December 31, 2008.
During the year ended December 31, 2007, we completed our research and development credit documentation process and we determined that it was more likely than not that approximately $1.7 million of the uncertain tax liability should be reversed and we recorded a reduction to our unrecognized tax benefit accrual of $1.7 million and a corresponding decrease in current income tax provision.
Net deferred tax assets are reduced by a valuation allowance if, based on all the available evidence, it is more likely than not that some or all of the deferred tax assets will not be realized. A valuation allowance of $320,000 was provided on deferred tax assets at December 31, 2007. The amount of deferred tax assets considered realizable was determined based on (i) taxable income in prior carry back years; (ii) future reversals of existing taxable temporary differences (i.e. offset gross deferred tax assets against gross deferred tax liabilities); (iii) tax planning strategies; and (iv) future taxable income, exclusive of reversing temporary differences and carryforwards.
We recorded an income tax benefit of approximately $1.0 million for the year ended December 31, 2007. The income tax benefit recorded during 2007 was primarily due to the removal of a reserve on our U.S. deferred tax assets related to our NOL carryforwards and certain research and development credits of approximately $1.8 million, a reduction in our uncertain tax liability of approximately $1.7 million related to the removal of our reserve for research and development credits established as a result of the implementation of the unrecognized tax benefit accrual, and a reduction in the valuation allowance related to our foreign tax credits of approximately $1.1 million. During 2007, we recorded an income tax benefit of approximately $1.8 million as a result of the completion of our Section 382/383 limitation analysis and the completion of a research and development credit
58
Table of Contents
study related to our NOL carryforwards and certain research and development credits. In addition, based on the weight of available evidence, including cumulative profitability in recent years, we determined that it was more likely than not that a portion of our U.S. deferred tax assets would be realized and, as of December 31, 2007, eliminated $1.1 million of our valuation allowance associated with our U.S. deferred tax assets. The elimination of our valuation allowance resulted in a $1.1 million benefit recognized as a non-cash increase in earnings for the year ended December 31, 2007. After we completed our research and development credit documentation process, we determined that it was more likely than not that approximately $1.7 million of the unrecognized tax benefit accrual should be reversed and we recorded a reduction to our uncertain tax liability accrual of $1.7 million and a corresponding decrease in current income tax provision. The effective tax rate for the year ended December 31, 2007 was approximately 46%, excluding the tax benefits described above. The difference between the federal and state statutory combined rate of 40% and our effective tax rate for 2007 is due to the impact of accounting for share-based compensation related to certain share-based awards, and MainConcept acquisition costs, which are treated as permanent differences. In addition, the Company recorded a valuation allowance against the deferred tax asset generated by MainConcept due to the uncertainty of the Company’s ability to utilize this asset.
Liquidity and capital resources
Our financial position included cash, cash equivalents and investments of $143.7 million and $135.3 million at December 31, 2009 and 2008, respectively. We believe our cash and cash equivalents, investments and potential cash flows from operations will be sufficient to satisfy our financial obligations through the next 12 months. In the future, we may acquire complementary businesses or technologies or license complementary technologies from third parties, and we may raise additional capital through future debt or equity financing to the extent we believe necessary to successfully complete these acquisitions or licenses. However, additional financing may not be available to us on favorable terms, if at all, at the time we make such determinations, which could have a material adverse affect on our ability to maintain or improve our liquidity and cash position in the future.
At December 31, 2009, our holdings of auction rate securities, or ARS, including the related put option, was approximately $18.0 million in fair value, $14.2 million of which were included in short-term investments and the remaining $3.8 million was included in long-term investments in the consolidated balance sheets. Our ARS have interest rates that reset every 27 to 34 days. Due to the illiquidity in the financial markets, auctions began to fail for these securities in February 2008 and each auction since then has failed. All of these ARS had credit ratings of AAA, except one rated AA1 and two rated A3, by a rating agency. These securities had contractual maturity dates ranging from 2030 to 2047. The Company is receiving the underlying cash flows on all of its ARS. The principal associated with failed auctions is not expected to be accessible until a successful auction occurs, the issuer redeems the securities, a buyer is found outside of the auction process or the underlying securities mature.
In November 2008, we entered into an agreement with UBS AG, or UBS, which provides us certain rights to sell to UBS the ARS which were purchased through them. As of December 31, 2009, we held $14.2 million par value ARS purchased from UBS. We have the option to sell these securities to UBS at par value from June 30, 2010 through July 2, 2012. UBS, at its discretion, may purchase or sell these securities on our behalf at any time provided we receive par value for the securities sold. If we do not exercise our right to sell these securities, which is non-transferrable and cannot be attached to the ARS if they are sold to another entity other than UBS, before July 2, 2012, it will expire and UBS will have no further rights or obligation to buy our ARS. The issuers of the ARS continue to have the right to redeem the securities at their discretion. The agreement allows for the continuation of the accrual and payment of interest due on the securities. The agreement also provides us with access to loans of up to 75% of the par value of the unredeemed securities until June 30, 2010. As we can exercise our put option with UBS starting June 30, 2010, we have classified the $14.2 million ARS held with UBS to short-term investments as of December 31, 2009.
We have the ability to hold these ARS until maturity. Based on our ability to access our cash and other short-term investments, our expected operating cash flows and other sources of cash, we do not anticipate the lack of liquidity on these investments to affect our ability to operate our business as usual.
59
Table of Contents
In addition to the ARS held by UBS, we also have $3.8 million of ARS with another financial institution. We are unable to predict whether the funds associated with the remainder of the non-UBS ARS will be redeemed prior to their maturity dates and as a result we have classified these remaining ARS as long-term investments as of December 31, 2009.
The following table presents data regarding our liquidity and capital resources as of December 31, 2009 and 2008 (in thousands):
| December 31, | ||||||
| 2009 | 2008 | |||||
| Cash, cash equivalents and investments |
$ | 143,709 | $ | 135,307 | ||
| Working capital |
133,954 | 115,762 | ||||
| Total assets |
207,598 | 193,401 | ||||
| Total debt |
— | — | ||||
Cash Flows
The following table presents our cash flows from operating activities, investing activities and financing activities for the years 2009, 2008 and 2007 (in thousands):
| Years ended December 31, | ||||||||||||
| 2009 | 2008 | 2007 | ||||||||||
| Cash provided by operating activities |
$ | 18,137 | $ | 23,472 | $ | 18,374 | ||||||
| Cash (used in) provided by investing activities |
(48,000 | ) | 25,514 | (92,738 | ) | |||||||
| Cash provided by (used in) financing activities |
1,330 | (19,939 | ) | 2,586 | ||||||||
| Effect of exchange rate changes on cash |
(26 | ) | (137 | ) | — | |||||||
| Total (decrease) increase in cash and cash equivalents |
$ | (28,559 | ) | $ | 28,910 | $ | (71,778 | ) | ||||
Cash provided by operating activities: The $18.1 million of cash provided by operating activities for the year ended December 31, 2009 was primarily due to $15.6 million in net non-cash operating expenses, and approximately $2.5 million provided by changes in operating assets and liabilities. Net non-cash operating expenses reflected in net income include $9.3 million for share-based compensation, $5.9 million in depreciation and amortization, $1.0 million in amortization of discount on investments, and a $375,000 provision for uncollectible account receivables, offset primarily by an approximately $950,000 increase in deferred tax assets and $470,000 in tax benefits from stock option exercises. Changes in operating assets and liabilities were primarily attributable to a decrease in accounts receivable, net of $4.4 million and a $600,000 increase in prepaid expenses and other assets, offset by an increase in net tax receivables of $700,000, a decrease in accrued expenses of approximately $500,000, a decrease in deferred revenue balances of $800,000, and a decrease in accrued compensation and benefits of $450,000.
The $18.4 million of cash provided by operating activities for the year ended December 31, 2007 was primarily due to net income of $9.2 million, share-based compensation of $11.8 million, impairment of acquired intangibles of $3.0 million, depreciation and amortization of $2.4 million, and provision for uncollectible account receivables of $1.0 million, partially offset by the deferred tax benefit of $5.8 million, amortization of discount on short-term investments of $2.1 million, excess tax benefit from stock options exercised of $800,000, and negative changes in other working capital accounts of $300,000 million.
Cash (used in) provided by investing activities: The $48.0 million of cash used in investing activities for the year ended December 31, 2009 were driven by cash used in purchases of investments of $157.8 million, cash paid for the acquisition of AnySource of $8.3 million, cash paid for format fee approval agreements of $1.7 million, and $500,000 of cash paid for the purchases of property and equipments partially offset by sales and maturities of investments of $120.3 million.
60
Table of Contents
The $92.7 million of cash used in investing activities for the year ended December 31, 2007 was primarily for the purchase of investments of $209.8 million, the purchase of deviantART investment of $3.5 million, and the purchase of property and equipment to support the growth of our company, including $20.4 million for the acquisition of MainConcept, $2.3 million for the acquisition of Veatros, $3.5 million for other property and equipments, and $1.5 million cash paid on format approval agreement obligation, partially offset by proceeds from sales and maturities of investments of $147.9 million.
Cash provided by (used in) financing activities: The $1.3 million of net cash provided by financing activities for the year ended December 31, 2009 was primarily due to the proceeds from employee stock purchase plan participation of approximately $860,000, and excess tax benefit from exercises of stock options of $470,000.
The $2.6 million of net cash provided by financing activities for the year ended December 31, 2007 was primarily due to the net proceeds from the issuance of $3.0 million of our common stock and warrants and an excess tax benefit of $825,000, both principally due to the exercise of stock options and warrants and employee stock purchase plan participation, partially offset by approximately $700,000 of payments on our note payable and capital lease obligations, and $500,000 of costs related to our initial public offering.
Contractual obligations
Our contractual obligations at December 31, 2009, were as follows (in thousands):
| Payments due by period | |||||||||||||||
| Total | Less than 1 year |
1-3 years |
3-5 years |
More than 5 years | |||||||||||
| Operating lease obligations |
$ | 4,889 | $ | 1,335 | $ | 2,244 | $ | 1,310 | $ | — | |||||
| Purchase obligations |
3,222 | 1,655 | 1,267 | 300 | — | ||||||||||
| Total contractual obligations |
$ | 8,111 | $ | 2,990 | $ | 3,511 | $ | 1,610 | $ | — | |||||
In addition, we have also entered into certain royalty-bearing license agreements with MPEG LA under which we pay royalties to MPEG LA based on each unit of our software products distributed up to certain contractual maximum royalty amounts. These license agreements with MPEG LA expire through 2013, unless terminated earlier. Maximum annual royalties under these agreements are approximately $7.4 million per year, which we expect to pay for 2010.
Off-Balance Sheet Arrangements
At December 31, 2009 and 2008, we did not have any relationships with unconsolidated entities or financial partnerships, such as entities often referred to as structured finance or special purpose entities, which would have been established for the purpose of facilitating off-balance sheet arrangements or other contractually narrow or limited purposes.
Recently issued accounting standards
In October 2009, the Financial Accounting Standards Board, or FASB issued new revenue recognition standards for arrangements with multiple deliverables, where certain of those deliverables are non-software related. The new standards modify the requirements that must be met for an entity to recognize revenue from the sale of a delivered item that is part of a multiple-element arrangement when other items have not yet been delivered. The new standards eliminate the requirement that all undelivered elements must have either: i) vendor specific objective evidence, or VSOE, or ii) third-party evidence, or TPE, before an entity can recognize the portion of overall arrangement consideration that is attributable to items that already have been delivered. In the absence of VSOE or TPE of the standalone selling price for one or more delivered or undelivered elements in a multiple-element arrangement, entities will be required to estimate the selling prices of those elements. Overall
61
Table of Contents
arrangement consideration will be allocated to each element (both delivered and undelivered items) based on their relative selling prices, regardless of whether those selling prices are evidenced by VSOE or TPE or are based on the entity’s estimated selling price. The residual method of allocating arrangement consideration has been eliminated. Additionally, the new standards modify the software revenue recognition guidance to exclude from its scope tangible products that contain both software and non-software components that function together to deliver a product’s essential functionality. These new updates are effective for revenue arrangements entered into or materially modified in fiscal years beginning on or after June 15, 2010 and are effective for us beginning in the first quarter of fiscal 2011, however early adoption is permitted. We are currently evaluating the impact of adopting these new standards on our consolidated financial position, results of operations and cash flows.
In June 2009, the FASB issued the FASB Accounting Standards Codification, or Codification for financial statements issued for interim and annual periods ending after September 15, 2009. The Codification became the single authoritative source for GAAP. We adopted the Codification as of September 30, 2009. Accordingly, previous references to GAAP accounting standards are no longer used in our disclosures, including the Notes to the Consolidated Financial Statements. We are currently evaluating the impact of adopting these new standards on our consolidated financial position, results of operations and cash flows.
In June 2009, the FASB issued amended standards for determining whether to consolidate a variable interest entity. These new standards amend the evaluation criteria to identify the primary beneficiary of a variable interest entity and requires ongoing reassessment of whether an enterprise is the primary beneficiary of the variable interest entity. The provisions of the new standards are effective for annual reporting periods beginning after November 15, 2009 and interim periods within those fiscal years. These standards will be effective for us beginning in the first quarter of 2010. The adoption of the new standards will not have an impact on our consolidated financial position, results of operations and cash flows.
In May 2009, the FASB issued new standards for subsequent events, which establishes general standards of accounting for and disclosure of events that occur after the balance sheet date but before financial statements are issued or are available to be issued. The new standards became effective for interim and annual reporting periods ended after June 15, 2009. We adopted the new standards during the second quarter of 2009 and, as the standards only require additional disclosures, the adoption did not have an impact on our consolidated financial position, results of operations or cash flows.
In April 2009, the FASB issued new standards for the recognition and measurement of other-than-temporary impairments for debt securities which replaced the pre-existing “intent and ability” indicator. These new standards specify that if the fair value of a debt security is less than its amortized cost basis, an other-than-temporary impairment is triggered in circumstances where (1) an entity has an intent to sell the security, (2) it is more likely than not that the entity will be required to sell the security before recovery of its amortized cost basis, or (3) the entity does not expect to recover the entire amortized cost basis of the security (that is, a credit loss exists). Other-than-temporary impairments are separated into amounts representing credit losses which are recognized in earnings and amounts related to all other factors which are recognized in other comprehensive income (loss). These new standards became effective for interim and annual periods ended after June 15, 2009 and we adopted these standards in the second quarter of 2009. The adoption did not have a material effect on our consolidated financial position, results of operations or cash flows.
In April 2009, the FASB issued new standards which provide guidance on how to determine the fair value of assets and liabilities when the volume and level of activity for the asset or liability has significantly decreased. These new standards also provide guidance on identifying circumstances that indicate a transaction is not orderly. In addition, we are required to disclose in interim as well as annual reporting periods the inputs and valuation techniques used to measure fair value and discussion of changes in valuation techniques. The new standards became effective for interim reporting periods ended after June 15, 2009. We adopted these standards in the second quarter of 2009 and they did not have a material effect on our consolidated financial position, results of operations or cash flows.
62
Table of Contents
In April 2008, the FASB issued new standards which provided guidance on how to determine the useful life of intangible assets by amending the factors an entity should consider in developing renewal or extension assumptions used in determining the useful life of recognized intangible assets. This new guidance applies prospectively to intangible assets that are acquired individually or with a group of other assets in business combinations and asset acquisitions. These standards became effective for financial statements issued for fiscal years beginning after December 15, 2008 and interim periods within those fiscal years. We adopted these new standards in the first quarter of 2009. The effect of the adoption of these new standards is reflected in our 2009 consolidated financial statements.
In December 2007, the FASB revised their guidance for business combinations and non-controlling interests. The new standards establishes principles and requirements for the acquirer of a business to recognize and measure in its financial statements the identifiable assets (including in-process research and development and defensive assets) acquired, the liabilities assumed, and any noncontrolling interest in the acquiree. Prior to the new standards, in-process research and development costs were immediately expensed and acquisition costs were capitalized. Under the new standards, all acquisition costs are expensed as incurred. The standards also provide guidance for recognizing and measuring the goodwill acquired in the business combination and determines what information to disclose to enable users of financial statements to evaluate the nature and financial effects of the business combination. The new standards also amend the provisions for the initial recognition and measurement, subsequent measurement and accounting, and disclosures for assets and liabilities arising from contingencies in business combinations. This update also eliminates the distinction between contractual and non-contractual contingencies. The new standards became effective for financial statements issued for fiscal years beginning after December 15, 2008 and we adopted these new standards in the first quarter of 2009. The effect of the adoption is reflected in our 2009 consolidated financial statements. We expect the new standards to have an impact on our future consolidated financial statements, but the nature and magnitude of the specific effects will depend upon the nature, terms and size of the acquisitions we consummate in the future.
Item 7A. Quantitative and Qualitative Disclosures About Market Risk
Market risk represents the risk of loss that may impact our financial position, results of operations or cash flows due to adverse changes in financial and commodity market prices and rates. The current turbulence in the U.S. and global financial markets has caused a decline in stock values across all industries. We are exposed to market risk primarily in the area of changes in United States interest rates and foreign currency exchange rates as measured against the U.S. dollar. These exposures are directly related to our normal operating and funding activities. We have not used derivative financial or commodity instruments or engaged in hedging activities.
Interest rate risk
All of our fixed income investments are classified as available-for-sale and therefore reported on the balance sheet at market value. The fair value of our cash equivalents and investments are subject to change as a result of changes in market interest rates and investment risk related to the issuers’ credit worthiness. We do not utilize financial contracts to manage our exposure in our investment portfolio to changes in interest rates. We place our cash investments in instruments that meet credit quality standards, as specified in our investment policy guidelines. We have established guidelines relative to diversification and maturities that attempt to maintain safety and liquidity. These guidelines are periodically reviewed and modified to take advantage of interest rate trends. We generally do not utilize derivatives to hedge against increases in interest rates which decrease market values.
At December 31, 2009, we had $143.7 million in cash, cash equivalents and investments, all of which are stated at fair value. A 100 basis point increase or decrease in market interest rates over a three month period would not be expected to have a material impact on the fair value of $14.9 million of our cash and cash equivalents at December 31, 2009, as these consisted of securities with maturities of less than three months.
63
Table of Contents
The weighted-average maturity of our investments excluding ARS as of December 31, 2009 was approximately eight months. A 100 basis point increase or decrease in interest rates over a eight month period for those in effect at December 31, 2009 would, however, decrease or increase, respectively, the remaining $128.8 million of our investments by approximately $700,000. While changes in interest rates may affect the fair value of our investment portfolio, any gains or losses will not be recognized in our consolidated statements of income until the investment is sold or if the reduction in fair value was determined to be other than temporary.
At December 31, 2009, we held approximately $18.4 million of ARS in par value, whose underlying assets are student loans which are substantially backed by the federal government. $14.2 million of our ARS were classified as short-term assets, and the remaining $4.2 million classified as long-term assets. Since February 2008, these auctions have failed and therefore continue to be illiquid and we will not be able to access these funds until a future auction of these investments is successful or a buyer is found outside of the auction process. As a result, our ability to liquidate our investments and fully recover the carrying value of our investments in the near term may be limited or may not exist. If the issuers are unable to successfully close future auctions and their credit ratings deteriorate, we may in the future be required to record an impairment charge on these investments.
In November 2008, we accepted an offer, from UBS AG, or UBS, entitling us to sell at par value ARS originally purchased from UBS at any time during a two-year period from June 30, 2010 through July 2, 2012. As of December 31, 2009, we had approximately $14.2 million of our ARS in par value held at UBS. If UBS has insufficient funding to buy back the ARS and the auction process continues to fail, then we may incur further losses on the carrying value of the ARS.
We believe that, based on our total cash and investments position and our expected operating cash flows, we are able to hold these securities until there is a recovery in the auctions market, which may be at final maturity. As a result, we do not anticipate that the current illiquidity of these ARS will have a material effect on our cash requirement or working capital.
Foreign Currency Exchange Rate Risk
MainConcept generates revenues and incurs costs which are denominated in local currencies. As exchange rates vary, these results when translated into U.S. dollars may vary from expectations and may adversely impact overall expected results.
Additionally, at December 31, 2009, we had a receivable balance denominated in Euros due from MainConcept. Our outstanding receivable balance is translated into U.S. dollars for financial reporting purposes, with unrealized gains and losses included as a component of other income (expense), net. A 100 basis point increase or decrease in foreign currency exchange rates over a three month period from those in effect at December 31, 2009 would not materially impact our financial position, results of operations and cash flows. During the year ended December 31, 2009, we recorded $145,000 of foreign currency gains related to our foreign currency receivable denominated in Euros in other income (expense), net on our consolidated statements of income.
Item 8. Financial Statements and Supplementary Data
Our consolidated financial statements and supplementary data required by this item are set forth at the pages indicated in Item 15(a)(1) and 15(a)(2), respectively.
Item 9. Changes in and Disagreements with Accountants on Accounting and Financial Disclosure
Not applicable
64
Table of Contents
Item 9A. Controls and Procedures
We maintain disclosure controls and procedures that are designed to ensure that information required to be disclosed in our reports filed under the Securities Exchange Act of 1934, as amended, is recorded, processed, summarized and reported within the time periods specified in the SEC’s rules and forms and that such information is accumulated and communicated to our management, including our chief executive officer and chief financial officer, as appropriate, to allow for timely decisions regarding required disclosure. In designing and evaluating the disclosure controls and procedures, management recognizes that any controls and procedures, no matter how well designed and operated, can provide only reasonable assurance of achieving the desired control objectives, and management is required to apply its judgment in evaluating the cost-benefit relationship of possible controls and procedures.
As required by SEC Rule 13a-15(b), we carried out an evaluation, under the supervision and with the participation of our management, including our chief executive officer and chief financial officer, of the effectiveness of the design and operation of our disclosure controls and procedures as of the end of the period covered by this Annual Report. Based on the foregoing, our chief executive officer and chief financial officer concluded that our disclosure controls and procedures were effective at the reasonable assurance level.
There has been no change in our internal control over financial reporting during our most recent quarter that has materially affected, or is reasonably likely to materially affect, our internal control over financial reporting.
Management’s Report on Internal Control over Financial Reporting
The management of DivX, Inc. is responsible for establishing and maintaining adequate internal control over financial reporting, as such term is defined in Exchange Act Rule 13a-15(f) and 15d-15(f) of the Exchange Act. Under the supervision and with the participation of our management, including our principal executive officer and principal financial officer, we conducted an evaluation of the effectiveness of our internal control over financial reporting based on the framework set forth in Internal Control—Integrated Framework issued by the Committee of Sponsoring Organizations of the Treadway Commission. Based on our evaluation under the framework set forth in Internal Control—Integrated Framework, our management concluded that our internal control over financial reporting was effective as of December 31, 2009. The effectiveness of our internal control over financial reporting as of December 31, 2009 has been audited by Ernst & Young LLP, an independent registered public accounting firm, as stated in their report which is included herein.
65
Table of Contents
Report of Independent Registered Public Accounting Firm
The Board of Directors and Stockholders
DivX, Inc.
We have audited DivX, Inc.’s internal control over financial reporting as of December 31, 2009, based on criteria established in Internal Control—Integrated Framework issued by the Committee of Sponsoring Organizations of the Treadway Commission (the COSO criteria). DivX, Inc.’s management is responsible for maintaining effective internal control over financial reporting, and for its assessment of the effectiveness of internal control over financial reporting included in the accompanying Management’s Report on Internal Control over Financial Reporting. Our responsibility is to express an opinion on the company’s internal control over financial reporting based on our audit.
We conducted our audit in accordance with the standards of the Public Company Accounting Oversight Board (United States). Those standards require that we plan and perform the audit to obtain reasonable assurance about whether effective internal control over financial reporting was maintained in all material respects. Our audit included obtaining an understanding of internal control over financial reporting, assessing the risk that a material weakness exists, testing and evaluating the design and operating effectiveness of internal control based on the assessed risk, and performing such other procedures as we considered necessary in the circumstances. We believe that our audit provides a reasonable basis for our opinion.
A company’s internal control over financial reporting is a process designed to provide reasonable assurance regarding the reliability of financial reporting and the preparation of financial statements for external purposes in accordance with generally accepted accounting principles. A company’s internal control over financial reporting includes those policies and procedures that (1) pertain to the maintenance of records that, in reasonable detail, accurately and fairly reflect the transactions and dispositions of the assets of the company; (2) provide reasonable assurance that transactions are recorded as necessary to permit preparation of financial statements in accordance with generally accepted accounting principles, and that receipts and expenditures of the company are being made only in accordance with authorizations of management and directors of the company; and (3) provide reasonable assurance regarding prevention or timely detection of unauthorized acquisition, use, or disposition of the company’s assets that could have a material effect on the financial statements.
Because of its inherent limitations, internal control over financial reporting may not prevent or detect misstatements. Also, projections of any evaluation of effectiveness to future periods are subject to the risk that controls may become inadequate because of changes in conditions, or that the degree of compliance with the policies or procedures may deteriorate.
In our opinion, DivX, Inc. maintained, in all material respects, effective internal control over financial reporting as of December 31, 2009, based on the COSO criteria.
We also have audited, in accordance with the standards of the Public Company Accounting Oversight Board (United States), the consolidated balance sheets as of December 31, 2008 and 2009, and the related consolidated statements of income, stockholders’ equity and cash flows for each of the three years in the period ended December 31, 2009 of DivX, Inc. and our report dated March 12, 2010 expressed an unqualified opinion thereon.
/s/ ERNST & YOUNG LLP
San Diego, California
March 12, 2010
66
Table of Contents
Not applicable.
67
Table of Contents
PART III
Item 10. Directors and Executive Officers of the Registrant
The information required by this item concerning our directors, compliance with Section 16 of the Exchange Act and our code of ethics that applies to our principal executive officer, principal financial officer and principal accounting officer is incorporated by reference from the information set forth in the sections under the headings “Election of Directors,” “Section 16(a) Beneficial Ownership Reporting Compliance” and “Election of Directors—Information Regarding the Board of Directors and Corporate Governance” in our Definitive Proxy Statement to be filed with the Securities and Exchange Commission in connection with the Annual Meeting of Stockholders to be held in 2010 (the “2010 Proxy Statement”).
Information regarding our executive officers is set forth in Item 1—“Business” of this Annual Report under the caption “Executive Officers of the Registrant.”
We have adopted a Code of Business Conduct and Ethics that applies to our directors and employees (including our principal executive officer, principal financial officer, principal accounting officer and controller), and have posted the text of the policy on the “Investors” portion of our website (http://investors.divx.com/documents.cfm). In addition, we intend to promptly disclose on our website in the future (i) the nature of any amendment to the policy that applies to our principal executive officer, principal financial officer, principal accounting officer or controller, or persons performing similar functions and (ii) the nature of any waiver, including an implicit waiver, from a provision of the policy that is granted to one of these specified individuals, the name of such person who is granted the waiver and the date of the waiver.
Item 11. Executive Compensation
The information required by this item is incorporated by reference from the information in the 2010 Proxy Statement under the heading “Compensation of Executive Officers.”
Item 12. Security Ownership of Certain Beneficial Owners and Management and Related Stockholder Matters
The information required by this item is incorporated by reference from the information in the 2010 Proxy Statement under the headings “Equity Compensation Plan Information” and “Security Ownership of Certain Beneficial Owners and Management.”
Item 13. Certain Relationships and Related Transactions
The information required by this item is incorporated by reference from the information in the 2010 Proxy Statement under the headings “Transactions with Related Persons” And “Election of Directors—Information Regarding the Board of Directors and Corporate Governance.”
Item 14. Principal Accountant Fees and Services
The information required by this item is incorporated by reference from the information in the 2010 Proxy Statement under the heading “Ratification of Selection of Independent Auditors—Principal Accountant Fees and Services.”
68
Table of Contents
PART IV
Item 15. Exhibits and Financial Statement Schedules
(a)(1) Financial Statements
The Consolidated Financial Statements of DivX, Inc. and Report of Independent Registered Public Accounting Firm are included in a separate section of this Annual Report beginning on page F-1.
(a)(2) Financial Statement Schedules
Refer to Schedule II, Valuation and Qualifying Accounts, hereto.
Schedules not listed above have been omitted because they are not applicable or are not required or the information required to be set forth therein is included in the Consolidated Financial Statements or Notes thereto.
(a)(3) Exhibits
| Exhibit Number |
Description of Document | |
| 3.1(1) | Form of Amended and Restated Certificate of Incorporation as currently in effect. | |
| 3.2(10) | Form of Amended and Restated Bylaws. | |
| 4.1(1) | Form of Common Stock Certificate. | |
| 10.1+(7) | Form of Indemnity Agreement. | |
| 10.2+(1) | 2000 Stock Option Plan and Form of Stock Option Agreement thereunder. | |
| 10.3+(1) | 2006 Equity Incentive Plan and Form of Stock Option Agreement thereunder. | |
| 10.4+(1) | Amended and restated offer letter dated April 12, 2006, between the Registrant and Fred Gerson. | |
| 10.5+(1) | Offer letter effective January 3, 2006, between the Registrant and Christopher McGurk. | |
| 10.6+(1) | Employment offer letter dated November 21, 2002, as amended, between the Registrant and Kevin Hell. | |
| 10.7+(1) | Employment offer letter dated April 20, 2004 between the Registrant and David J. Richter. | |
| 10.8+(1) | Form of Employee Innovations and Proprietary Rights Assignment Agreement. | |
| 10.9+(1) | 2006 Employee Stock Purchase Plan and Form of Offering Document thereunder. | |
| 10.10+(2) | Employment offer letter dated June 6, 2007, as amended, between the Registrant and Dan L. Halvorson. | |
| 10.11+(3) | Amendment to Employment offer letter dated July 23, 2007, between the Registrant and Dan L. Halvorson. | |
| 10.12*(9) | Promotion and Distribution Agreement dated March 1, 2009 between the Registrant and Google, Inc. and its affiliates. | |
| 10.13+(3) | Amendment to Employment offer letter dated July 23, 2007, between the Registrant and Kevin Hell. | |
| 10.14+(3) | Amendment to Employment offer letter dated November 8, 2007, between the Registrant and Kevin Hell. | |
| 10.15+(4) | DivX, Inc. Change in Control Severance Benefit Plan. | |
69
Table of Contents
| Exhibit Number |
Description of Document | |
| 10.16(5) | Form of Restricted Stock Bonus Agreement under the Registrant’s 2006 Equity Incentive Plan. | |
| 10.17(5) | MPEG-4 Visual Patent Portfolio License dated October 1, 2007 by and between the Registrant and MPEG LA, L.L.C. | |
| 10.18(7) | Amendment to the MPEG-4 Visual Patent Portfolio License dated October 1, 2007 by and between the Registrant and MPEG LA, L.L.C., dated January 1, 2009. | |
| 10.19+(8) | Summary of DivX, Inc. 2009 Executive Cash Bonus Plan. | |
| 10.20(6) | Form of Restricted Stock Unit Agreement under the Registrant’s 2006 Equity Incentive Plan. | |
| 10.21+(7) | Offer Letter dated June 5, 2008, between the Registrant and James C. Brailean. | |
| 10.22+(7) | Severance Agreement, dated December 31, 2008, between the Registrant and Jerome Rota, as amended by that certain letter re: Acceptance of Resignation from the Registrant to Jerome Rota, dated as of February 2, 2009. | |
| 10.23(7) | AVC Patent Portfolio License Agreement, dated October 1, 2007, between the Registrant and MPEG LA, L.L.C. | |
| 10.24+(7) | Offer Letter dated March 5, 2009, between the Registrant and Alex Vieux. | |
| 10.25+(8) | Offer Letter dated June 14, 2008 between the Registrant and Eric Rodli | |
| 10.26+ | Letter Agreement re: Separation and Release between the Registrant and Eric Rodli dated November 5, 2009. | |
| 21.1(7) | Subsidiaries of the Registrant. | |
| 23.1 | Consent of Independent Registered Public Accounting Firm. | |
| 31.1 | Certification of Chief Executive Officer pursuant to Rule 13a-14(a) promulgated under the Securities Exchange Act of 1934. | |
| 31.2 | Certification of Chief Financial Officer pursuant to Rule 13a-14(a) promulgated under the Securities Exchange Act of 1934. | |
| 32.1 | Certification of Chief Executive Officer pursuant to 18 U.S.C. Section 1350 and Rule 13a-14(b) promulgated under the Securities Exchange Act of 1934. | |
| 32.2 | Certification of Chief Financial Officer pursuant to 18 U.S.C. Section 1350 and Rule 13a-14(b) promulgated under the Securities Exchange Act of 1934. | |
| + | Indicates management contract or compensatory plan. |
| * | The Securities and Exchange Commission has granted confidential treatment with respect to certain portions of this exhibit. Omitted portions have been filed separately with the Securities and Exchange Commission (SEC). |
| (1) | Filed as an exhibit to the Registrant’s Registration Statement on Form S-1 (No. 333-133855), originally filed on May 5, 2006. |
| (2) | Filed as an exhibit to the Registrant’s Quarterly Report on Form 10-Q filed with the SEC on August 14, 2007. |
| (3) | Filed as an exhibit to the Registrant’s Quarterly Report on Form 10-Q filed with the SEC on November 14, 2007. |
| (4) | Filed as an exhibit to the Registrant’s Current Report on Form 8-K, filed with the SEC on December 6, 2007. |
| (5) | Filed as an exhibit to the Registrant’s Annual Report on Form 10-K filed with the SEC on March 17, 2008. |
| (6) | Filed as an exhibit to the Registrant’s Quarterly Report on Form 10-Q filed with the SEC on May 12, 2008. |
70
Table of Contents
| (7) | Filed as an exhibit to the Registrant’s Annual Report on Form 10-K filed with the SEC on March 11, 2009. |
| (8) | Filed as an exhibit to the Registrant’s Quarterly Report on Form 10-Q filed with the SEC on May 8, 2009. |
| (9) | Filed as an exhibit to the Registrant’s Amendment No. 1 to Quarterly Report on Form 10-Q/A filed with the SEC on August 27, 2009. |
| (10) | Filed as an exhibit to the Registrant’s Current Report on Form 8-K filed with the SEC on March 1, 2010. |
(b) Exhibits
See Item 15(a)(3) above
(c) Financial Statement Schedules
See Item 15(a)(2) above.
71
Table of Contents
Pursuant to the requirements of Section 13 or 15(d) of the Securities Exchange Act of 1934, the registrant has duly caused this report to be signed on its behalf by the undersigned, thereunto duly authorized.
Date: March 12, 2010
| DIVX, INC. | ||
| By: | /s/ KEVIN HELL | |
| Kevin Hell | ||
| Chief Executive Officer | ||
Pursuant to the requirements of the Securities Exchange Act of 1934, this report has been signed below by the following persons on behalf of the registrant and in the capacities and on the dates indicated.
| Signature |
Title |
Date | ||
| /s/ KEVIN HELL Kevin Hell |
Chief Executive Officer, Director (Principal Executive Officer) |
March 12, 2010 | ||
| /s/ DAN L. HALVORSON Dan L. Halvorson |
Chief Financial Officer and Executive Vice President, Operations (Principal Financial and Accounting Officer) |
March 12, 2010 | ||
| /s/ JAMES C. BRAILEAN James C. Brailean |
Director | March 12, 2010 | ||
| /s/ FRANK CREER Frank Creer |
Director | March 12, 2010 | ||
| /s/ FRED GERSON Fred Gerson |
Director | March 12, 2010 | ||
| /s/ CHRISTOPHER MCGURK Christopher McGurk |
Director | March 12, 2010 | ||
| /s/ JEROME VASHISHT-ROTA Jerome Vashisht-Rota |
Director | March 12, 2010 | ||
72
Table of Contents
Index to Consolidated Financial Statements
| F-2 | ||
| F-3 | ||
| F-4 | ||
| F-5 | ||
| F-6 | ||
| F-7 | ||
| F-39 | ||
F-1
Table of Contents
REPORT OF INDEPENDENT REGISTERED PUBLIC ACCOUNTING FIRM
The Board of Directors and Stockholders
DivX, Inc.
We have audited the accompanying consolidated balance sheets of DivX, Inc. as of December 31, 2009 and 2008, and the related consolidated statements of income, stockholders’ equity, and cash flows for each of the three years in the period ended December 31, 2009. Our audits also included the financial statement schedule listed in the Index at Item 15(a)(2). These financial statements and schedule are the responsibility of the Company’s management. Our responsibility is to express an opinion on these financial statements and schedule based on our audits.
We conducted our audits in accordance with the standards of the Public Company Accounting Oversight Board (United States). Those standards require that we plan and perform the audit to obtain reasonable assurance about whether the financial statements are free of material misstatement. An audit includes examining, on a test basis, evidence supporting the amounts and disclosures in the financial statements. An audit also includes assessing the accounting principles used and significant estimates made by management as well as evaluating the overall financial statement presentation. We believe that our audits provide a reasonable basis for our opinion.
In our opinion, the financial statements referred to above present fairly, in all material respects, the consolidated financial position of DivX, Inc. at December 31, 2009 and 2008, and the consolidated results of its operations and its cash flows for each of the three years in the period ended December 31, 2009, in conformity with U.S. generally accepted accounting principles. Also, in our opinion, the related financial statement schedule, when considered in relation to the basic financial statements taken as a whole, presents fairly, in all material respects the information set forth therein.
We also have audited, in accordance with the standards of the Public Company Accounting Oversight Board (United States), DivX, Inc.’s internal control over financial reporting as of December 31, 2009, based on criteria established in Internal Control-Integrated Framework issued by the Committee of Sponsoring Organizations of the Treadway Commission and our report dated March 12, 2010 expressed an unqualified opinion thereon.
/s/ ERNST & YOUNG LLP
San Diego, California
March 12, 2010
F-2
Table of Contents
Consolidated Balance Sheets
(in thousands, except per share data)
| December 31, | ||||||||
| 2009 | 2008 | |||||||
| Assets |
||||||||
| Current assets: |
||||||||
| Cash and cash equivalents |
$ | 14,883 | $ | 43,442 | ||||
| Short-term investments |
125,047 | 73,897 | ||||||
| Accounts receivable, net of allowance of $258 and $929, at December 31, 2009 and 2008, respectively |
2,521 | 7,263 | ||||||
| Income taxes receivable |
1,011 | 185 | ||||||
| Prepaid expenses |
3,690 | 3,465 | ||||||
| Deferred tax assets, current |
1,025 | 1,841 | ||||||
| Other current assets |
1,379 | 1,082 | ||||||
| Total current assets |
149,556 | 131,175 | ||||||
| Property and equipment, net |
2,143 | 3,811 | ||||||
| Long-term investments |
3,779 | 17,968 | ||||||
| Deferred tax assets, long-term |
13,178 | 10,547 | ||||||
| Purchased intangible assets, net |
13,340 | 10,968 | ||||||
| Goodwill |
18,528 | 10,358 | ||||||
| Other assets |
7,074 | 8,574 | ||||||
| Total assets |
$ | 207,598 | $ | 193,401 | ||||
| Liabilities and stockholders’ equity |
||||||||
| Current liabilities: |
||||||||
| Accounts payable |
$ | 1,853 | $ | 1,319 | ||||
| Accrued liabilities |
1,654 | 2,353 | ||||||
| Accrued compensation and benefits |
2,705 | 3,153 | ||||||
| Accrued format approval fee |
820 | 1,333 | ||||||
| Accrued patent royalties |
725 | 681 | ||||||
| Acquisition related contingent liabilities |
1,976 | — | ||||||
| Income taxes payable |
519 | 389 | ||||||
| Deferred revenue, current |
5,350 | 6,185 | ||||||
| Total current liabilities |
15,602 | 15,413 | ||||||
| Deferred tax liability |
1,995 | 1,559 | ||||||
| Deferred revenue, long-term |
861 | 769 | ||||||
| Accrued format approval fee, long-term |
713 | 1,383 | ||||||
| Acquisition related contingent liabilities, long-term |
2,659 | — | ||||||
| Other long-term liability |
593 | 177 | ||||||
| Total liabilities |
22,423 | 19,301 | ||||||
| Commitments and contingencies |
||||||||
| Stockholders’ equity |
||||||||
| Preferred stock, $0.001 par value; 10,000 shares authorized at December 31, 2009 and 2008; no shares issued and outstanding at December 31, 2009 and 2008 |
— | — | ||||||
| Common stock, $0.001 par value; 200,000 shares authorized as of December 31, 2009 and 2008; 32,819 and 32,461 shares issued and outstanding |
32 | 32 | ||||||
| Additional paid-in capital |
178,319 | 167,684 | ||||||
| Accumulated other comprehensive loss |
(641 | ) | (950 | ) | ||||
| Retained earnings |
7,465 | 7,334 | ||||||
| Total stockholders’ equity |
185,175 | 174,100 | ||||||
| Total liabilities and stockholders’ equity |
$ | 207,598 | $ | 193,401 | ||||
See accompanying notes.
F-3
Table of Contents
Consolidated Statements of Income
(in thousands, except per share data)
| Year ended December 31, | ||||||||||||
| 2009 | 2008 | 2007 | ||||||||||
| Net revenues: |
||||||||||||
| Technology licensing |
$ | 64,922 | $ | 75,072 | $ | 66,345 | ||||||
| Media and other distribution and services |
5,684 | 18,833 | 18,517 | |||||||||
| Total net revenues |
70,606 | 93,905 | 84,862 | |||||||||
| Cost of revenues: |
||||||||||||
| Cost of technology licensing (excludes amortization of purchased developed intangibles) |
9,167 | 3,882 | 3,778 | |||||||||
| Cost of media and other distribution and services(1) |
545 | 714 | 701 | |||||||||
| Total cost of revenues |
9,712 | 4,596 | 4,479 | |||||||||
| Gross profit |
60,894 | 89,309 | 80,383 | |||||||||
| Operating expenses: |
||||||||||||
| Selling, general and administrative(1) |
49,270 | 54,597 | 58,315 | |||||||||
| Product development(1) |
20,647 | 20,184 | 18,738 | |||||||||
| Litigation settlement gain |
(9,500 | ) | — | — | ||||||||
| Impairment of acquired intangibles |
— | 1,882 | 2,973 | |||||||||
| Total operating expenses |
60,417 | 76,663 | 80,026 | |||||||||
| Income from operations |
477 | 12,646 | 357 | |||||||||
| Interest income (expense), net |
1,646 | 4,445 | 7,835 | |||||||||
| Other income (expense), net |
301 | (479 | ) | 42 | ||||||||
| Income before income taxes |
2,424 | 16,612 | 8,234 | |||||||||
| Income tax provision (benefit) |
2,293 | 6,604 | (974 | ) | ||||||||
| Net income |
$ | 131 | $ | 10,008 | $ | 9,208 | ||||||
| Basic net income per share |
$ | 0.00 | $ | 0.30 | $ | 0.27 | ||||||
| Diluted net income per share |
$ | 0.00 | $ | 0.30 | $ | 0.26 | ||||||
| Shares used to compute basic net income per share |
32,628 | 32,946 | 33,939 | |||||||||
| Shares used to compute diluted net income per share |
32,972 | 33,458 | 35,415 | |||||||||
|
(1) Includes share-based compensation as follows: |
||||||||||||
| Cost of revenues |
$ | — | $ | — | $ | 2 | ||||||
| Selling, general and administrative |
7,351 | 6,739 | 9,761 | |||||||||
| Product development |
1,938 | 2,282 | 1,995 | |||||||||
See accompanying notes.
F-4
Table of Contents
Consolidated Statements of Stockholders’ Equity
(in thousands)
| Common Stock | Additional paid-in capital |
Accumulated other comprehensive (loss) income |
(Accumulated deficit) retained earnings |
Total stockholders’ equity |
|||||||||||||||||||
| Shares | Amount | ||||||||||||||||||||||
| Balance at December 31, 2006 |
33,032 | $ | 33 | $ | 153,902 | $ | (72 | ) | $ | (2,952 | ) | $ | 150,911 | ||||||||||
| Cumulative effect adjustment related to the adoption of accounting standards for uncertainties in income taxes |
— | — | — | — | (2,360 | ) | (2,360 | ) | |||||||||||||||
| Common stock options exercised, net of repurchases |
981 | 2 | 1,137 | — | — | 1,139 | |||||||||||||||||
| Shares issued under employee stock purchase plan |
137 | — | 1,906 | — | — | 1,906 | |||||||||||||||||
| Share-based compensation |
— | — | 11,758 | — | — | 11,758 | |||||||||||||||||
| Tax benefit from exercise of stock options |
— | — | 825 | — | — | 825 | |||||||||||||||||
| Common stock warrants exercised |
484 | — | — | — | — | — | |||||||||||||||||
| Issuance of warrants in conjunction with Sony agreement |
— | — | 304 | — | — | 304 | |||||||||||||||||
| Issuance of common stock—MainConcept acquisition |
89 | — | 1,568 | — | — | 1,568 | |||||||||||||||||
| Comprehensive income: |
|||||||||||||||||||||||
| Net income |
— | — | — | — | 9,208 | 9,208 | |||||||||||||||||
| Unrealized gain on short-term investments |
— | — | — | 185 | — | 185 | |||||||||||||||||
| Unrealized loss on foreign currency translation |
— | — | — | (4 | ) | — | (4 | ) | |||||||||||||||
| Total comprehensive income |
— | — | — | — | — | 9,389 | |||||||||||||||||
| Balance at December 31, 2007 |
34,723 | 35 | 171,400 | 109 | 3,896 | 175,440 | |||||||||||||||||
| Common stock options exercised, net of repurchases |
414 | — | 191 | — | — | 191 | |||||||||||||||||
| Shares issued under employee stock purchase plan |
127 | — | 851 | — | — | 851 | |||||||||||||||||
| Share-based compensation |
— | — | 9,021 | — | — | 9,021 | |||||||||||||||||
| Tax shortfall from reversal of deferred tax assets related to stock options |
— | — | (744 | ) | — | — | (744 | ) | |||||||||||||||
| Common stock warrants exercised |
1 | — | — | — | — | — | |||||||||||||||||
| Issuance of warrants in conjunction with format fee agreements |
— | — | 387 | — | — | 387 | |||||||||||||||||
| Common stock repurchased under share repurchase program |
(2,804 | ) | (3 | ) | (13,422 | ) | — | (6,570 | ) | (19,995 | ) | ||||||||||||
| Comprehensive income: |
|||||||||||||||||||||||
| Net income |
— | — | — | — | 10,008 | 10,008 | |||||||||||||||||
| Unrealized loss on investments, net of taxes |
— | — | — | (635 | ) | — | (635 | ) | |||||||||||||||
| Unrealized loss on foreign currency translation, net of taxes |
— | — | — | (424 | ) | — | (424 | ) | |||||||||||||||
| Total comprehensive income |
— | — | — | — | — | 8,949 | |||||||||||||||||
| Balance at December 31, 2008 |
32,461 | 32 | 167,684 | (950 | ) | 7,334 | 174,100 | ||||||||||||||||
| Common stock options exercised, net of repurchases |
143 | — | 19 | — | — | 19 | |||||||||||||||||
| Shares issued under employee stock purchase plan |
215 | — | 857 | — | — | 857 | |||||||||||||||||
| Share-based compensation |
— | — | 9,289 | — | — | 9,289 | |||||||||||||||||
| Tax benefit from exercise of stock options |
— | — | 470 | — | — | 470 | |||||||||||||||||
| Comprehensive income: |
|||||||||||||||||||||||
| Net income |
— | — | — | — | 131 | 131 | |||||||||||||||||
| Unrealized gain on investments, net of taxes |
— | — | — | 187 | — | 187 | |||||||||||||||||
| Unrealized gain on foreign currency translation, net of taxes |
— | — | — | 122 | — | 122 | |||||||||||||||||
| Total comprehensive income |
— | — | — | — | — | 440 | |||||||||||||||||
| Balance at December 31, 2009 |
32,819 | $ | 32 | $ | 178,319 | $ | (641 | ) | $ | 7,465 | $ | 185,175 | |||||||||||
See accompanying notes.
F-5
Table of Contents
Consolidated Statements of Cash Flows
(in thousands)
| Year ended December 31, | ||||||||||||
| 2009 | 2008 | 2007 | ||||||||||
| Cash flows from operating activities: |
||||||||||||
| Net income |
$ | 131 | $ | 10,008 | $ | 9,208 | ||||||
| Adjustments to reconcile net income to net cash provided by operating activities: |
||||||||||||
| Depreciation and amortization |
5,917 | 5,167 | 2,422 | |||||||||
| Accretion of interest expense |
168 | — | — | |||||||||
| Deferred taxes |
(932 | ) | (3,658 | ) | (5,797 | ) | ||||||
| Impairment of acquired intangibles |
— | 1,882 | 2,973 | |||||||||
| Change in acquisition related contingent consideration liability |
412 | — | — | |||||||||
| Impairment of long lived assets |
— | 350 | — | |||||||||
| Loss on disposal of fixed assets |
45 | — | — | |||||||||
| Provision for uncollectible account receivables |
375 | 261 | 968 | |||||||||
| Share-based compensation |
9,289 | 9,021 | 11,758 | |||||||||
| Accretion of discounts and amortization of premiums on investments |
1,001 | (787 | ) | (2,097 | ) | |||||||
| Excess (short fall of) tax benefit from exercise (cancellation) of stock options |
(470 | ) | 744 | (825 | ) | |||||||
| Unrealized (gain) loss on auction rate securities |
(185 | ) | 185 | — | ||||||||
| Foreign currency transaction loss (gain) |
(145 | ) | 236 | — | ||||||||
| Changes in operating assets and liabilities: |
||||||||||||
| Accounts receivable |
4,378 | 3,341 | (3,832 | ) | ||||||||
| Prepaid expenses and other assets |
572 | 2,290 | (1,879 | ) | ||||||||
| Accounts payable |
(1 | ) | (1,259 | ) | 819 | |||||||
| Accrued liabilities |
(473 | ) | (2,871 | ) | 973 | |||||||
| Accrued compensation and benefits |
(448 | ) | (585 | ) | 1,732 | |||||||
| Deferred revenue |
(801 | ) | (1,240 | ) | 2,808 | |||||||
| Income taxes payable (receivable) |
(696 | ) | 387 | (857 | ) | |||||||
| Net cash provided by operating activities |
18,137 | 23,472 | 18,374 | |||||||||
| Cash flows from investing activities: |
||||||||||||
| Purchases of investments |
(157,759 | ) | (120,682 | ) | (209,825 | ) | ||||||
| Proceeds from sales and maturities of investments |
120,258 | 154,927 | 147,935 | |||||||||
| Purchase of property and equipment |
(502 | ) | (1,759 | ) | (3,467 | ) | ||||||
| Cash paid in AnySource acquisition |
(8,250 | ) | — | — | ||||||||
| Cash paid on format approval agreement obligation |
(1,650 | ) | (2,500 | ) | (1,500 | ) | ||||||
| Cash paid in MainConcept acquisition |
(97 | ) | (2,472 | ) | (20,401 | ) | ||||||
| Cash paid in Veatros acquisition |
— | (2,000 | ) | (2,250 | ) | |||||||
| Cash paid in deviantART investment |
— | — | (3,500 | ) | ||||||||
| Restricted cash |
— | — | 270 | |||||||||
| Net cash (used in) provided by investing activities |
(48,000 | ) | 25,514 | (92,738 | ) | |||||||
| Cash flows from financing activities: |
||||||||||||
| Net proceeds from exercise and vesting of stock options, restricted stock awards, and warrants |
3 | 132 | 1,137 | |||||||||
| Proceeds from shares issued under the employee stock purchase plan |
857 | 851 | 1,906 | |||||||||
| Expenses related to initial public offering |
— | — | (467 | ) | ||||||||
| Excess (shortfall of) tax benefit from exercise (cancellation) of stock options |
470 | (744 | ) | 825 | ||||||||
| Repurchase of unvested stock |
— | (27 | ) | (99 | ) | |||||||
| Repurchase of common stock |
— | (19,995 | ) | — | ||||||||
| Payments on notes payable and capital lease obligations |
— | (156 | ) | (716 | ) | |||||||
| Net cash provided by (used in) financing activities |
1,330 | (19,939 | ) | 2,586 | ||||||||
| Effect of exchange rate changes on cash |
(26 | ) | (137 | ) | — | |||||||
| Net (decrease) increase in cash and cash equivalents |
(28,559 | ) | 28,910 | (71,778 | ) | |||||||
| Cash and cash equivalents at beginning of year |
43,442 | 14,532 | 86,310 | |||||||||
| Cash and cash equivalents at end of year |
$ | 14,883 | $ | 43,442 | $ | 14,532 | ||||||
| Supplemental disclosure of non-cash investing and financing activities: |
||||||||||||
| Contingent consideration liability related to AnySource acquisition |
$ | 4,974 | $ | — | $ | — | ||||||
| Format approval agreement obligation |
$ | 150 | $ | 4,173 | $ | — | ||||||
| Issuance of equity in connection with acquisition |
$ | — | $ | — | $ | 1,568 | ||||||
| Issuance of warrants in connection with format approval agreement |
$ | — | $ | 387 | $ | 304 | ||||||
| Supplemental disclosures of cash flow information: |
||||||||||||
| Cash paid for income taxes |
$ | 3,873 | $ | 10,291 | $ | 6,934 | ||||||
| Cash paid for interest |
$ | — | $ | 4 | $ | 21 | ||||||
See accompanying notes.
F-6
Table of Contents
Notes to Consolidated Financial Statements
1. Organization and summary of significant accounting policies
DivX, Inc. (the Company), was incorporated in Delaware on May 16, 2000. The Company creates products and provides services designed to improve the way consumers experience media. The Company’s first product offering was a video compression-decompression software library (codec). In addition to its codec, the Company provides consumer software, including the DivX Player application, from its website, DivX.com. The Company also licenses its technologies to consumer hardware device manufacturers and certifies their products to ensure the interoperable support of DivX-encoded content. In addition to technology licensing to consumer hardware device manufacturers, the Company currently generates revenue from software licensing, advertising, distributing third-party software and services related to content distribution.
Principles of consolidation
The consolidated financial statements include the accounts of DivX, Inc. and its wholly-owned subsidiaries. All significant intercompany accounts and transactions have been eliminated in consolidation. The Company is not a primary beneficiary of any variable interest entity.
Use of estimates
The preparation of financial statements in conformity with U.S. generally accepted accounting principles (GAAP) requires management to make estimates and assumptions that affect the amounts reported in the financial statements and accompanying notes to the financial statements. Actual results could differ from those estimates.
Cash and equivalents
Cash and equivalents consist of cash, money market funds and other highly liquid investments with original maturities of three months or less at the time of acquisition.
Investments
Investments with original maturities greater than approximately three months and remaining maturities less than one year are classified as short-term investments. Investments with remaining maturities greater than one year are classified as long-term investments.
Available-for-sale and trading investments. The Company’s investments consist of taxable municipal notes, some of which may have an auction reset feature (auction rate securities, or ARS), corporate bonds, certificates of deposit, commercial paper, and U.S. government agency securities. The Company designated all investments, except for ARS held by UBS AG (UBS), as available-for-sale and are therefore reported at fair value, with unrealized gains and losses recorded in accumulated other comprehensive loss. The Company classifies ARS held by UBS that are subject to a put option as trading securities. Investments that the Company designates as trading securities are reported at fair value, with gains or losses resulting from changes in fair value recognized in earnings. See Note 2 for further detailed discussion.
Other-than-temporary impairment. All of the Company’s available-for-sale investments are subject to a periodic impairment review. The Company recognizes an impairment charge when a decline in the fair value of its investments below the cost basis is judged to be other-than-temporary. The Company considers various factors in determining whether to recognize an impairment charge, including the length of time and extent to which the fair value has been less than the Company’s cost basis, the financial condition and near-term prospects of the investee, and the Company’s
F-7
Table of Contents
DivX, Inc.
Notes to Consolidated Financial Statements—(Continued)
intent and ability to hold the investment for a period of time sufficient to allow for any anticipated recovery in the market value. During the years ended December 31, 2009, 2008 and 2007 the Company did not record any other-than-temporary impairment charges on its available-for-sale securities.
Fair Value Measurements
The Company records its financial assets and liabilities at fair value, which is defined under the applicable accounting standards as the exchange price that would be received for an asset or paid to transfer a liability (an exit price) in the principal or most advantageous market for the asset or liability in an orderly transaction between market participants on the measure date. The Company uses valuation techniques to measure fair value, maximizing the use of observable inputs and minimizing the use of unobservable inputs. The standard describes a fair value hierarchy based on three levels of inputs, of which the first two are considered observable and the last unobservable, that may be used to measure fair value which are the following:
Level 1 – Quoted prices in active markets for identical assets or liabilities.
Level 2 – Inputs other than Level 1 that are observable, either directly or indirectly, such as quoted prices for similar assets or liabilities; quoted prices in markets that are not active; or other inputs that are observable or can be corroborated by observable market data for substantially the full term of the assets or liabilities.
Level 3 – Unobservable inputs that are supported by little or no market activity and that are significant to the fair value of the assets or liabilities.
Other financial instruments, including cash equivalents, accounts receivable, net of allowance, accounts payable and accrued liabilities, are carried at cost, which management believes approximates fair value because of the short-term maturity of these instruments.
Accounts receivable and allowance for uncollectible sales and accounts
The Company has reflected in its consolidated balance sheets, on a net basis, amounts invoiced to customers that are unpaid when the associated revenue is unearned. The amount of unearned revenue that has been offset against the related accounts receivable totaled approximately $150,000 and $2.3 million at December 31, 2009 and 2008, respectively.
The Company maintains an allowance for estimated uncollectible accounts receivable. The Company estimates the allowance for uncollectible accounts receivable based on its historical experience and records increases or decreases to the allowance as an offset to revenue. In evaluating the adequacy of this allowance the Company considers the length of time the receivables are past due, specific customer creditworthiness, geographic risk, the current business environment and historical discrepancies in business volume reports received from customers. In cases where the customer is new and has not demonstrated the ability to pay, the Company delays recognition of the revenue until such time as the new customer has paid, unless significant and persuasive evidence exists that the customer is creditworthy.
Concentration of credit risk
A significant portion of the Company’s total net revenues comes from a small number of customers. Two customers accounted for 13% and 12%, respectively, of 2009 total net revenues. Two customers accounted for 19% and 11%, respectively, of 2008 total net revenues. Two customers accounted for 19% and 10%, respectively, of 2007 total net revenues.
F-8
Table of Contents
DivX, Inc.
Notes to Consolidated Financial Statements—(Continued)
As the Company does not ship inventory, credit terms are generally provided given consideration to the small financial commitment of the Company’s resources to any customer transaction. A cash deposit is generally not required. Three customers accounted for 28%, 23% and 11%, respectively, of accounts receivable, net as of December 31, 2009. Two customers accounted for 36% and 28%, respectively, of accounts receivable, net as of December 31, 2008.
Strategic Investments
Investments in equity securities of non-publicly traded companies are accounted for under the cost method. Under the cost method, strategic investments in which the Company holds less than a 20% voting interest and does not have the ability to exercise significant influence are carried at the lower of cost or fair value. During 2007 the Company made an equity investment in deviantART, Inc. (deviantART), a private corporation that aggregates and distributes art via its web community and facilitates an open forum where artists can exhibit their artwork and build community around that art in an effort to drive commerce. The Company’s investment consisted of $3.5 million cash for which it received 146,750 shares of Series A Preferred Stock. As further consideration for the Company’s investment, deviantART entered into an advertising and marketing agreement with the Company. The Company allocated approximately $650,000 of the investment to the advertising and marketing agreement, based on its estimated fair value, and the remaining $2.9 million is carried as an investment. The value allocated to the advertising and marketing agreement has been fully amortized over the period in which the services are being rendered, which was October 2007 through March 2009. As the Company’s ownership is less than 20% and has no influence over their operations and is not a significant direct beneficiary of their services, the investment has been accounted for using the cost basis. This investment is included in other assets on the consolidated balance sheets. The Company periodically reviews this investment for other-than-temporary declines in fair value based on the specific identification method and would write down the investments to its fair values if an other-than-temporary decline has occurred. No such impairment has occurred to date.
The Company estimated the fair value of its investment in deviantART for the purposes of impairment testing using the income approach valuation methodology which includes the discounted cash flow method, based on discrete financial forecasts and incorporates a terminal value calculation for years beyond the internal forecasts. Future cash flows were also discounted to present value by incorporating the present value techniques. Specifically, the income approach valuation used a cash flow discount rate of 36% and terminal value growth rates ranging from 4% to 6%.
Goodwill and other long-lived assets
Goodwill represents the excess of the purchase price over the fair value of the net tangible and identifiable intangible assets acquired in a business combination. Goodwill is not amortized but tested annually for impairment, or more frequently if the Company believes indicators of impairment exist. The performance of the goodwill impairment test involves a two-step process. The first step involves comparing the fair values of the applicable reporting units with their aggregate carrying values, including goodwill. If the carrying value of a reporting unit exceeds the reporting unit’s fair value, the Company performs the second step of the test to determine the amount of impairment loss. The second step involves measuring the impairment by comparing the implied fair values of the affected reporting unit’s goodwill and intangible assets with the respective carrying values. The Company performed its annual goodwill impairment test as of October 1, 2009, and determined that no impairment existed.
Long-lived assets, such as property and equipment and intangible assets, are evaluated for impairment whenever events or changes in circumstances indicate the carrying value of an asset may not be recoverable. Property and equipment, consisting primarily of office and computer equipment, are recorded at cost.
F-9
Table of Contents
DivX, Inc.
Notes to Consolidated Financial Statements—(Continued)
Depreciation is computed using the straight-line method over the shorter of the useful lives of the assets or the remaining associated lease terms, which are three to seven years.
Intangible assets resulting from the acquisitions of entities in a business combination accounted for using the purchase method of accounting are recorded at the estimated fair value of the assets acquired. Identifiable intangible assets are comprised of purchased customer relationships, trademarks and tradenames, developed technologies and other intangible assets. Effective January 1, 2009, in-process research and development (IPR&D), and defensive assets acquired are capitalized.
Identifiable intangible assets are amortized using the straight-line method over estimated useful lives ranging from two to eight years by major class as follows:
| Weighted Average Useful Life (years) | ||
| Developed technologies |
7 | |
| Tradename |
5 | |
| Customer lists |
6 | |
| In-process research and development |
7 |
Format Approval Agreements
The Company has executed format approval fee agreements with various digital media content owners and distributors. The present value of the total considerations of these format approval fee agreements are capitalized as intangible assets and are amortized over the shorter of the contractual life or the estimated useful lives of the format fee approval agreements, which is typically four to five years. The short-term and long-term portion of these capitalized assets are included in other current assets and other assets, respectively, in the consolidated balance sheets. The amortization expenses are typically recorded to sales, general and administrative expenses, with the exception of the format approval fee amortization with one customer, which is being recorded against revenues generated from this customer.
Contingent Consideration
In connection with certain of the Company’s acquisitions, additional contingent consideration was earned by the sellers upon completion of certain future development and performance milestones. Prior to 2009, the Company recognized additional contingent consideration as an additional element of the cost of the acquisition, generally goodwill, when the contingency was resolved beyond a reasonable doubt and the additional consideration was issued or became issuable. Due to changes in the accounting standards regarding business combinations, for all acquisitions consummated on or after January 1, 2009, a liability is recognized on the acquisition date for an estimate of the acquisition date fair value of the contingent consideration based on the probability of achieving the milestones and the probability weighted discount on cash flows. Any change in the fair value of the contingent milestone consideration subsequent to the acquisition date is recognized in selling, general and administrative expenses in the consolidated statements of income.
Deferred rent
Rent expense on noncancellable leases containing known future scheduled rent increases are recorded on a straight-line basis over the term of the respective leases beginning when the Company takes possession of the leased property. The difference between rent expense and rent paid is accounted for as deferred rent. Landlord construction allowances and other such lease incentives are recorded as deferred rent and are amortized on a straight-line basis as a reduction to rent expense.
F-10
Table of Contents
DivX, Inc.
Notes to Consolidated Financial Statements—(Continued)
Foreign currency translation
The functional currency of the Company’s foreign subsidiaries is generally their respective local currency. Assets and liabilities are translated into U.S. dollars at the rate of exchange existing at the balance sheet date. Income statement amounts are translated at the average exchange rates for the period. Translation gains and losses are included as a component of accumulated other comprehensive loss in the consolidated balance sheets. Foreign currency transaction gains and (losses) are included in the consolidated statements of income, principally in other income (expense), net.
Revenue recognition
The Company recognizes revenue for transactions to sell products and services and to license technology when four revenue recognition criteria have been met: persuasive evidence of an arrangement exists, delivery has occurred or services have been rendered, the seller’s price to the buyer is fixed or determinable and collectibility is reasonably assured. Revenue from multiple-element arrangements is allocated among separate elements based on their relative fair values, provided the elements have value on a stand-alone basis, there is objective and reliable evidence of fair value, the arrangement does not include a general right of return relative to the delivered item and delivery or performance of the undelivered item(s) is considered probable and substantially in the Company’s control. The maximum revenue recognized on a delivered element is limited to the amount that is not contingent upon the delivery of additional items.
The Company’s licensing revenue is primarily derived from royalties paid to the Company by licensees of the Company’s intellectual property rights. Revenue in such transactions is recognized during the period in which such customers report to the Company the number of royalty-eligible units that they have shipped. Revenue from guaranteed minimum-royalty licenses is recognizable upon delivery of the technology license when no further obligations of the Company exist. Certain of the Company’s license agreements provide for royalties based on its estimations of the volumes of certain units consumer hardware device manufacturers are estimated to ship during a given term for which the Company recognizes revenue over the term of the contractual agreement. In certain guaranteed minimum-royalty licenses and license agreements based on volume estimates, the Company enters into extended payment programs with customers. Revenue related to such extended payment programs is recognized at the earlier of when cash is received or when periodic payments become due to the Company. If the Company receives non-refundable advance payments from licensees that are allocable to a future contract period or could be creditable against other obligations of the licensee to it, the recognition of the related revenue is deferred until such future period or creditable obligation lapses. Royalties and other license fees are recorded net of reserves for estimated losses, and are recognized when all revenue recognition criteria have been met. The Company makes judgments as to whether collectibility can be reasonably assured based on the licensee’s recent payment history unless significant and persuasive evidence exists that the customer is creditworthy. In the absence of a favorable collection history or significant and persuasive evidence that the customer is creditworthy, the Company recognizes revenue upon receipt of cash, provided that all other revenue recognition criteria have been met.
The Company has entered into a contractual relationship to license technology to a customer and the Company also obtained format approval for which it provided consideration to the related customer. In situations where the Company does not receive an identifiable benefit that is sufficiently separable from its customers’ purchase of its products or where it cannot reasonably estimate the fair value of the products or services it is purchasing, the Company records the consideration provided to its customers as an offset to revenues.
The Company recognizes revenue in connection with its software products pursuant to the applicable accounting standards of software revenue recognition. For multiple element software arrangements, the Company recognizes revenue under the residual method when vendor-specific objective evidence of fair value exists for all
F-11
Table of Contents
DivX, Inc.
Notes to Consolidated Financial Statements—(Continued)
of the undelivered elements of the arrangement, but does not exist for one or more of the delivered elements in the arrangement. Under the residual method, at the outset of the arrangement with a customer, the Company defers revenue for the fair value of its undelivered elements and recognizes the revenue for the remainder of the arrangement fee attributable to the elements initially delivered, such as software licenses. If vendor-specific objective evidence does not exist for an undelivered element in a software arrangement, revenue is recognized over the term of the contractual support period or, if unspecified, 24 to 36 months (depending on the estimated length of the product life cycle, which approximates the support period for the specific product), commencing upon delivery of the Company’s software to the customer. Royalty revenue from license agreements with independent software vendors (ISV), who embed the Company’s products into their own is recognized upon receipt of reports from licensees stating the number of products implementing the Company’s technologies on which royalties are due. In the case of prepayments received from an ISV when the Company provides ongoing support to the ISV in the form of future upgrades, enhancements or other services over the term of the arrangement, revenue is recognized ratably over the term of the contract, as vendor-specific objective evidence does not exist for future support services to be provided.
So long as all of the other elements of revenue recognition are met, the Company recognizes revenues on services during the period such services are provided. The Company is paid for distributing certain third-party software, and recognizes revenue based on the number of third-party software activations made via distribution of such software from the Company’s website. The Company is also paid by content providers and commercial content users to license its technology and encode content into the DivX media format, and recognizes related license revenues and encoding revenues over the estimated contractual life or when such contingent encoding services are provided. Additionally, the Company is paid service fees as a percentage of transaction revenue for electronically distributing encoded media for content providers, and recognizes related revenues in the period that third-party reports on such transactions are received by the Company.
Product development costs
The Company includes research and development costs as part of product development expenses. The Company accounts for research and development costs in accordance with the applicable accounting standards, which specify that costs incurred internally in research and development of a computer software product should be charged to expense until technological feasibility has been established for the product. Once technological feasibility is established, all software costs should be capitalized until the product is available for general release to customers. Judgment is required in determining when technological feasibility of a product is established. The Company has determined that technological feasibility for its software products is reached shortly before the products are available for general release to customers. Through December 31, 2009, the Company has expensed all software development costs when incurred because costs incurred after technological feasibility was established and prior to commercial availability was insignificant. Additionally, the Company incurs website development costs, which are required to be capitalized. However, such costs incurred for software acquired or built while in the application and infrastructure development stage has been insignificant. As a result, all related development costs have been expensed in the period incurred.
Income taxes
The Company uses the asset and liability method of accounting for income taxes. Deferred income tax assets or liabilities are recognized based on the temporary differences between financial statement and income tax basis of assets and liabilities using enacted tax rates in effect for the years in which the differences are expected to reverse. Deferred income tax expenses or credits are based on the changes in the deferred income tax assets or liabilities from period to period. A valuation allowance is recorded when it is more likely than not that some of the deferred tax assets will not be realized.
F-12
Table of Contents
DivX, Inc.
Notes to Consolidated Financial Statements—(Continued)
Advertising
The Company expenses advertising costs as incurred. Advertising expenses for the years ended December 31, 2009, 2008 and 2007, were approximately $200,000, $1.0 million and $700,000, respectively. In 2008, the Company incurred approximately $500,000 under its advertising services agreement with Google, which completed in 2008. In addition, in 2008, the deviantART advertising and marketing agreement became fully expensed. The Company recorded approximately $400,000 in advertising expenses during 2008 under the deviantART agreement.
Net income per share data
Basic net income per share, or earnings per share (EPS) is calculated by dividing net income by the weighted average number of common shares outstanding during the year. Diluted EPS is calculated by adjusting outstanding shares, assuming any dilutive effects of options, restricted stock awards, and common stock warrants calculated using the treasury stock method. Under the treasury stock method, an increase in the fair market value of our common stock results in a greater dilutive effect from outstanding options, restricted stock awards, and common stock warrants.
The following table sets forth the computation of basic and diluted net income per share (in thousands, except per share amounts):
| Year ended December 31, | |||||||||
| 2009 | 2008 | 2007 | |||||||
| Numerator: |
|||||||||
| Net income |
$ | 131 | $ | 10,008 | $ | 9,208 | |||
| Denominator: |
|||||||||
| Weighted-average common shares outstanding (basic) |
32,628 | 32,946 | 33,939 | ||||||
| Common equivalent shares from restricted stock awards |
— | 19 | — | ||||||
| Common equivalent shares from common stock warrants |
47 | 50 | 244 | ||||||
| Common and equivalent shares from options to purchase common stock and unvested shares of common stock subject to repurchase |
297 | 443 | 1,232 | ||||||
| Weighted-average common shares outstanding (diluted) |
32,972 | 33,458 | 35,415 | ||||||
| Basic net income per share |
$ | 0.00 | $ | 0.30 | $ | 0.27 | |||
| Diluted net income per share |
$ | 0.00 | $ | 0.30 | $ | 0.26 | |||
Potentially dilutive securities not included in the calculation of diluted net income per share because to do so would be anti-dilutive are as follows (in thousands):
| Year ended December 31, | ||||||
| 2009 | 2008 | 2007 | ||||
| Options to purchase common stock |
5,542 | 3,857 | 3,260 | |||
| Common stock warrants |
345 | 218 | 100 | |||
| Restricted stock awards |
247 | — | — | |||
| Totals |
6,134 | 4,075 | 3,360 | |||
F-13
Table of Contents
DivX, Inc.
Notes to Consolidated Financial Statements—(Continued)
Share-based compensation
The Company has in effect stock incentive plans under which incentive stock options have been granted to employees and non-qualified stock options, restricted stock awards, and common stock warrants have been granted to employees and non-employees, including members of the Board of Directors. The Company recognizes share-based compensation expenses using a fair-value based method. The compensation cost is measured at the grant date, based on the fair value of the award, and is recognized as expense over the requisite service periods. For non-employees, the Company remeasures equity instruments awarded to non-employees periodically as the underlying awards vest unless the instruments are fully vested, immediately exercisable and nonforfeitable on date of grant.
The Company uses the Black-Scholes option pricing model to estimate the fair value of options granted. The Black-Scholes option pricing model was developed for use in estimating the value of traded options that have no vesting restrictions and that are freely transferable. The Black-Scholes model considers, among other factors, the expected life of the award and the expected volatility of our stock price. We evaluate the assumptions used to value stock options and stock purchase rights on a quarterly basis. The Company also classifies the cash flows resulting from the tax benefits due to tax deductions in excess of the compensation cost recognized for those options (excess tax benefits) as financing cash flows. See Note 4 for a detailed discussion of share-based compensation.
Recently issued accounting standards
In October 2009, the Financial Accounting Standards Board (FASB) issued new revenue recognition standards for arrangements with multiple deliverables, where certain of those deliverables are non-software related. The new standards modify the requirements that must be met for an entity to recognize revenue from the sale of a delivered item that is part of a multiple-element arrangement when other items have not yet been delivered. The new standards eliminate the requirement that all undelivered elements must have either: i) vendor specific objective evidence (VSOE), or ii) third-party evidence (TPE), before an entity can recognize the portion of overall arrangement consideration that is attributable to items that already have been delivered. In the absence of VSOE or TPE of the standalone selling price for one or more delivered or undelivered elements in a multiple-element arrangement, entities will be required to estimate the selling prices of those elements. Overall arrangement consideration will be allocated to each element (both delivered and undelivered items) based on their relative selling prices, regardless of whether those selling prices are evidenced by VSOE or TPE or are based on the entity’s estimated selling price. The residual method of allocating arrangement consideration has been eliminated. Additionally, the new standards modify the software revenue recognition guidance to exclude from its scope tangible products that contain both software and non-software components that function together to deliver a product’s essential functionality. These new updates are effective for revenue arrangements entered into or materially modified in fiscal years beginning on or after June 15, 2010 and are effective for us beginning in the first quarter of fiscal 2011, however early adoption is permitted. The Company is currently evaluating the impact of adopting these new standards on the Company’s consolidated financial position, results of operations and cash flows.
In June 2009, the FASB issued the FASB Accounting Standards Codification (the “Codification”) for financial statements issued for interim and annual periods ending after September 15, 2009. The Codification became the single authoritative source for GAAP. The Company adopted the Codification as of September 30, 2009. Accordingly, previous references to GAAP accounting standards are no longer used in the disclosures, including the Notes to the Consolidated Financial Statements. The Codification does not affect the Company’s consolidated financial position, results of operations, or cash flows.
F-14
Table of Contents
DivX, Inc.
Notes to Consolidated Financial Statements—(Continued)
In June 2009, the FASB issued amended standards for determining whether to consolidate a variable interest entity. These new standards amend the evaluation criteria to identify the primary beneficiary of a variable interest entity and requires ongoing reassessment of whether an enterprise is the primary beneficiary of the variable interest entity. The provisions of the new standards are effective for annual reporting periods beginning after November 15, 2009 and interim periods within those fiscal years. These standards will be effective for the Company beginning in the first quarter of 2010. The Company is currently evaluating the impact of adopting these new standards on the Company’s consolidated financial position, results of operations and cash flows.
In May 2009, the FASB issued new standards for subsequent events, which establishes general standards of accounting for and disclosure of events that occur after the balance sheet date but before financial statements are issued or are available to be issued. The new standards became effective for interim and annual reporting periods ended after June 15, 2009. The Company adopted the new standards during the second quarter of 2009 and, as the pronouncement only requires additional disclosures, the adoption did not have an impact on the Company’s consolidated financial position, results of operations or cash flows.
In April 2009, the FASB issued new standards for the recognition and measurement of other-than-temporary impairments for debt securities which replaced the pre-existing “intent and ability” indicator. These new standards specify that if the fair value of a debt security is less than its amortized cost basis, an other-than-temporary impairment is triggered in circumstances where (1) an entity has an intent to sell the security, (2) it is more likely than not that the entity will be required to sell the security before recovery of its amortized cost basis, or (3) the entity does not expect to recover the entire amortized cost basis of the security (that is, a credit loss exists). Other-than-temporary impairments are separated into amounts representing credit losses which are recognized in earnings and amounts related to all other factors which are recognized in other comprehensive income (loss). These new standards became effective for interim and annual periods ended after June 15, 2009 and the Company adopted these standards in the second quarter of 2009. The adoption did not have a material effect on the Company’s consolidated financial position, results of operations or cash flows.
In April 2009, the FASB issued new standards which provide guidance on how to determine the fair value of assets and liabilities when the volume and level of activity for the asset or liability has significantly decreased. These new standards also provide guidance on identifying circumstances that indicate a transaction is not orderly. In addition, the Company is required to disclose in interim as well as annual reporting periods the inputs and valuation techniques used to measure fair value and discussion of changes in valuation techniques. The new standards became effective for interim reporting periods ended after June 15, 2009. The Company adopted these standards in the second quarter of 2009 and they did not have a material effect on the Company’s consolidated financial position, results of operations or cash flows.
In April 2008, the FASB issued new standards which provided guidance on how to determine the useful life of intangible assets by amending the factors an entity should consider in developing renewal or extension assumptions used in determining the useful life of recognized intangible assets. This new guidance applies prospectively to intangible assets that are acquired individually or with a group of other assets in business combinations and asset acquisitions. These standards became effective for financial statements issued for fiscal years beginning after December 15, 2008 and interim periods within those fiscal years. The Company adopted these new standards in the first quarter of 2009. The effect of the adoption of these new standards is reflected in the Company’s 2009 consolidated financial statements.
In December 2007, the FASB revised their guidance for business combinations and non-controlling interests. The new standards establishes principles and requirements for the acquirer of a business to recognize and measure in its financial statements the identifiable assets (including in-process research and development and defensive assets) acquired, the liabilities assumed, and any noncontrolling interest in the acquiree. Prior to the
F-15
Table of Contents
DivX, Inc.
Notes to Consolidated Financial Statements—(Continued)
new standards, in-process research and development costs were immediately expensed and acquisition costs were capitalized. Under the new standards, all acquisition costs are expensed as incurred. The standards also provide guidance for recognizing and measuring the goodwill acquired in the business combination and determines what information to disclose to enable users of financial statements to evaluate the nature and financial effects of the business combination. The new standards also amend the provisions for the initial recognition and measurement, subsequent measurement and accounting, and disclosures for assets and liabilities arising from contingencies in business combinations. This update also eliminates the distinction between contractual and non-contractual contingencies. The new standards became effective for financial statements issued for fiscal years beginning after December 15, 2008 and the Company adopted these new standards in the first quarter of 2009. The effect of the adoption is reflected in the Company’s 2009 consolidated financial statements.
2. Investments and Fair Value Measurements
Investments
The following tables summarize investments by security type (in thousands):
| Amortized Cost |
Gross Unrealized Gains |
Gross Unrealized Losses |
Estimated Fair Value | ||||||||||
| December 31, 2009 |
|||||||||||||
| Trading securities: |
|||||||||||||
| Auction rate securities and put option |
$ | 14,250 | |||||||||||
| Available-for-sale securities: |
|||||||||||||
| Commercial paper |
$ | 4,995 | $ | — | $ | — | 4,995 | ||||||
| Certificates of deposit |
4,153 | — | — | 4,153 | |||||||||
| Corporate bonds |
51,156 | 130 | (41 | ) | 51,245 | ||||||||
| Municipal bonds |
2,005 | 3 | — | 2,008 | |||||||||
| U.S. government agency notes |
48,384 | 31 | (19 | ) | 48,396 | ||||||||
| Total short-term investments |
110,693 | 164 | (60 | ) | 125,047 | ||||||||
| Auction rate securities - long-term investments |
4,120 | — | (341 | ) | 3,779 | ||||||||
| Total investments |
$ | 114,813 | $ | 164 | $ | (401 | ) | $ | 128,826 | ||||
| December 31, 2008 |
|||||||||||||
| Available-for-sale securities: |
|||||||||||||
| Commercial paper |
$ | 6,201 | $ | 1 | $ | (16 | ) | $ | 6,186 | ||||
| Corporate bonds |
31,531 | 43 | (90 | ) | 31,484 | ||||||||
| U.S. government agency notes |
35,990 | 237 | — | 36,227 | |||||||||
| Total short-term investments |
73,722 | 281 | (106 | ) | 73,897 | ||||||||
| Auction rate securities and put option - long-term investments |
18,665 | — | (697 | ) | 17,968 | ||||||||
| Total investments |
$ | 92,387 | $ | 281 | $ | (803 | ) | $ | 91,865 | ||||
F-16
Table of Contents
DivX, Inc.
Notes to Consolidated Financial Statements—(Continued)
The following table summarizes the contractual maturities of the Company’s available-for-sale securities (in thousands):
| December 31, | ||||||
| 2009 | 2008 | |||||
| Less than one year |
$ | 90,114 | $ | 63,810 | ||
| Due in one to five years |
34,933 | 10,087 | ||||
| Due after five years |
3,779 | 17,968 | ||||
| $ | 128,826 | $ | 91,865 | |||
Asset-backed securities have been allocated within the contractual maturities table based upon the set maturity date of the security. Realized gains and losses on investments are included in interest income (expense), net, in the accompanying consolidated statements of income. The Company recorded realized gains on its investments of $44,000 and $61,000 in the years ended December 31, 2009 and 2008, respectively.
As of December 31, 2009, certain of the Company’s ARS with a fair value of approximately $3.8 million had been in a continuous unrealized loss position for a period of more than 12 months. As of December 31, 2009, the unrealized losses on these investments were approximately $340,000. The gross unrealized losses on these ARS Investments as of December 31, 2009 were primarily due to the illiquidity of the Company’s ARS. The Company believes that it will be able to collect all principal and interest amounts due at maturity given the high credit quality of these investments. Since the decline in the market value of these investments is attributable to changes in market conditions and not credit quality, and since the Company has the ability and intent to hold those investments until a recovery of par value, which may be maturity, the Company does not consider these investments to be other-than temporarily impaired as of December 31, 2009.
The Company’s short-term investments consist primarily of commercial paper, certificates of deposit, corporate bonds, U.S. government agency notes, and ARS, which are long-term variable rate bonds tied to short-term interest rates. The Company’s long-term investments consist of ARS. At December 31, 2009, the Company’s holdings of ARS, aggregated approximately $18.0 million in fair value (including related put option), $14.2 million of which were included in short-term investments and the remaining $3.8 million included in long-term investments in the consolidated balance sheets. After the initial issuance of the ARS, the interest rate on the underlying securities is reset periodically, at intervals established at the time of issuance (primarily every 27 to 34 days), based on market demand for a reset period. ARS are bought and sold in the marketplace through a competitive bidding process often referred to as a “Dutch auction.” If there is insufficient interest in the securities at the time of an auction, the auction may not be completed and the rates may be reset to predetermined “penalty” or “maximum” rates. In February 2008, auctions began to fail for these securities and each auction since then has failed. As of December 31, 2009, the Company held $18.4 million par value ARS, all of which experienced failed auctions during the year. The underlying assets of the securities consisted of student loans and municipal bonds, of which $16.8 million were guaranteed by the U.S. government and the remaining $1.6 million were privately insured. All of these ARS had credit ratings of AAA, except one rated AA1 and two rated A3, by a rating agency. These ARS have contractual maturity dates ranging from 2030 to 2047. The Company is receiving the underlying cash flows on all of its ARS. The principal associated with failed auctions is not expected to be accessible until a successful auction occurs, the issuer redeems the securities, a buyer is found outside of the auction process or the underlying securities mature. The Company is unable to predict if these funds will become available before their maturity dates. As such, the ARS were classified as long-term investments as of December 31, 2008.
F-17
Table of Contents
DivX, Inc.
Notes to Consolidated Financial Statements—(Continued)
In November 2008, the Company accepted an offer (the Right), from UBS, entitling it to sell at par value ARS originally purchased from UBS at anytime during a two-year period from June 30, 2010 through July 2, 2012. As of December 31, 2009, the Company held $14.2 million par value ARS purchased from UBS. In accepting the Right, the Company granted UBS the authority to sell or auction the ARS at par at any time up until the expiration date of the offer and released UBS from any claims relating to the marketing and sale of ARS. Although the Company expects to sell its ARS under the Right, if the Right is not exercised before July 2, 2012 it will expire and UBS will have no further rights or obligation to buy the Company’s ARS. In lieu of the Company’s acceptance of the Right, ARS will continue to accrue and pay interest as determined by the auction process or the terms specified in the prospectus of the ARS if the auction process fails. The value of the Right may largely offset the decline in fair value of the ARS subject to the put option issuer’s ability to perform. The issuers of the ARS continue to have the right to redeem the securities at their discretion. The Right also provides the Company with access to loans of up to 75% of the par value of the unredeemed securities until June 30, 2010. These loans would carry interest rates which would be consistent with the interest income on the related ARS. As of December 31, 2009, the Company had no loans outstanding under this Right. UBS’s obligations under the Right are not secured by its assets and do not require UBS to obtain any financing to support its performance obligations under the Rights. As the Company can exercise its Rights with UBS starting June 30, 2010, the $14.2 million ARS held with UBS was classified as short-term investments as of December 31, 2009.
The Company’s Right to sell the ARS to UBS commencing June 30, 2010 represents a put option for a payment equal to the par value of the ARS. As the put option is non-transferable and cannot be attached to the ARS if they are sold to another entity other than UBS, it represents a freestanding instrument between the Company and UBS. The Company elected the fair value option and recorded the put option in long-term investments. During 2008, the Company recorded a gain of $2.3 million representing (i) the initial fair value of the put option, and (ii) the changes in the fair value of the put option from November to the end of the year. The Company recorded a loss of $2.5 million representing (a) the transfer of the UBS ARS from available-for-sale to trading securities and, accordingly, recognizing the unrealized losses previously recorded in accumulated other comprehensive (loss) income in earnings at the election date, and (b) the subsequent changes in fair value from the election date to the end of the year. The transfer from available-for-sale to trading securities was a one-time election. Both the gain from recording the put option at fair value and the loss due to the transfer from available-for-sale to trading securities, as well as subsequent fair value adjustments, were recorded in other income (expense), net in the consolidated statements of income.
During 2009, the Company recorded in other income (expense), net in the consolidated statements of income a loss of $745,000 and a gain of $930,000 representing the changes in the fair value of the put option and of the ARS, respectively. In January 2010, $2.5 million of ARS held by UBS were redeemed at par.
The Company has the ability and intent to hold its non-UBS investments for a period of time sufficient to allow for any anticipated recovery in market value or final settlement at the underlying par value, as the Company believes that the credit ratings and credit support of the security issuers indicate that they have the ability to settle the securities at par value. As such, the Company has determined that no other-than-temporary impairment losses existed as of December 31, 2009.
F-18
Table of Contents
DivX, Inc.
Notes to Consolidated Financial Statements—(Continued)
Fair Value Measurements
The following table represents the Company’s fair value hierarchy for its assets and liabilities measured at fair value on a recurring basis as of December 31, 2009 (in thousands):
| Fair Value | Level 1 | Level 2 | Level 3 | |||||||||
| Assets: |
||||||||||||
| Money market funds |
$ | 9,011 | $ | 9,011 | $ | — | $ | — | ||||
| Short-term investments: |
||||||||||||
| Commercial paper |
4,995 | 4,995 | — | — | ||||||||
| Certification of deposit |
4,153 | 4,153 | — | — | ||||||||
| Corporate bonds |
51,245 | 51,245 | — | — | ||||||||
| Municipal bonds |
2,008 | 2,008 | — | — | ||||||||
| U.S government agency notes |
48,396 | 48,396 | — | — | ||||||||
| Auction rate securities |
12,684 | — | — | 12,684 | ||||||||
| Put option |
1,566 | — | — | 1,566 | ||||||||
| Long-term investments: |
||||||||||||
| Auction rate securities |
3,779 | — | — | 3,779 | ||||||||
| Total assets at fair value |
$ | 137,837 | $ | 119,808 | $ | — | $ | 18,029 | ||||
| Liabilities: |
||||||||||||
| Acquisition related contingent consideration liabilities |
||||||||||||
| Current |
$ | 1,976 | — | — | $ | 1,976 | ||||||
| Long-term |
2,659 | — | — | 2,659 | ||||||||
| Total liabilities at fair value |
$ | 4,635 | — | — | $ | 4,635 | ||||||
Historically, the fair value of ARS approximates par value due to the frequent resets through the auction process. While the Company continues to earn interest on its ARS investments at the contractual rate, these investments are not currently trading and therefore do not have a readily determinable market value. Accordingly, the estimated fair value of the ARS no longer approximates par value. At December 31, 2009, the Company utilized a discounted cash flow approach to arrive at this valuation based on Level 3 inputs for the ARS. The assumptions used in preparing the discounted cash flow model include estimates of, based on data available as of December 31, 2009, interest rates, timing and amount of cash flows, credit and liquidity premiums, and expected holding periods of the ARS. The Company valued the put option asset using a discounted cash flow approach including estimates of, based on Level 3 data available as of December 31, 2009, interest rates, timing and amount of cash flow, adjusted for any bearer risk associated with UBS’s financial ability to repurchase the ARS beginning June 30, 2010. The assumptions used in valuing both the ARS and the put option are volatile and subject to change as the underlying sources of these assumptions and market conditions change.
F-19
Table of Contents
DivX, Inc.
Notes to Consolidated Financial Statements—(Continued)
The following table provides reconciliation for all assets measured at fair value using significant unobservable inputs (Level 3) for the year ended December 31, 2009 (in thousands):
| Fair Value Measurements at Reporting Date Using Significant Unobservable Inputs (Level 3) |
||||||||
| Put Option | ARS | |||||||
| Balance at January 1, 2009 |
$ | 2,311 | $ | 15,657 | ||||
| Redemption of ARS investments |
— | (480 | ) | |||||
| Total gains or (losses): |
||||||||
| Included in accumulated other comprehensive income |
— | 356 | ||||||
| Included in net income |
(745 | ) | 930 | |||||
| Balance at December 31, 2009 |
$ | 1,566 | $ | 16,463 | ||||
On August 27, 2009, the Company acquired substantially all the assets of AnySource Media, LLC, (AnySource), a technology company developing software and service platforms for Internet-enabled video devices. The total consideration for the net assets acquired included contingent consideration of up to $7.5 million upon the achievement of certain technical product development milestones and certain revenue and distribution milestones. On the acquisition date, a liability was recognized for an estimate of the acquisition date fair value of the contingent milestone consideration based on the probability of achieving the milestones and the probability weighted discount on cash flows. As of December 31, 2009, the Company reassessed the fair value of the remaining contingent consideration at $4.6 million.
This fair value measurement is based on significant inputs not observed in the market and thus represents a Level 3 measurement. Level 3 instruments are valued based on unobservable inputs that are supported by little or no market activity and reflect the Company’s own assumptions in measuring fair value. Discount rates considered in the assessment of the acquisition date fair value for the contingent milestones totaling $5.0 million range from approximately 6% to 23%. Future changes in fair value of the contingent milestone consideration, as results of changes in significant inputs such as the discount rate and estimated probabilities of milestone achievements, could have a material effect on the statement of income and financial position in the period of the change.
3. Financial Statement Details
Property and Equipment
Property and equipment consists of the following (in thousands):
| December 31, | ||||||||
| 2009 | 2008 | |||||||
| Computer equipment |
$ | 8,898 | $ | 8,536 | ||||
| Software |
2,107 | 2,071 | ||||||
| Leasehold improvements |
1,329 | 1,177 | ||||||
| Furniture and fixtures |
485 | 495 | ||||||
| Office equipment |
171 | 175 | ||||||
| 12,990 | 12,454 | |||||||
| Less accumulated depreciation and amortization |
(10,847 | ) | (8,643 | ) | ||||
| $ | 2,143 | $ | 3,811 | |||||
F-20
Table of Contents
DivX, Inc.
Notes to Consolidated Financial Statements—(Continued)
Depreciation and amortization expense for property and equipment was $2.3 million, $2.9 million, and $1.9 million for the years ended December 31, 2009, 2008 and 2007.
Purchased Intangible Assets
Purchased intangible assets consist of the following (in thousands):
| December 31, 2009 | December 31, 2008 | |||||||||||||||||||
| Gross | Accumulated Amortization(1) |
Net | Gross | Accumulated Amortization(1) |
Net | |||||||||||||||
| Developed technologies |
$ | 11,075 | $ | (3,702 | ) | $ | 7,373 | $ | 10,814 | $ | (1,916 | ) | $ | 8,898 | ||||||
| Tradename |
1,764 | (838 | ) | 926 | 1,723 | (632 | ) | 1,091 | ||||||||||||
| Customer lists |
1,372 | (676 | ) | 696 | 1,340 | (361 | ) | 979 | ||||||||||||
| In-process research and development |
4,345 | — | 4,345 | — | — | — | ||||||||||||||
| Total purchased intangible assets |
$ | 18,556 | $ | (5,216 | ) | $ | 13,340 | $ | 13,877 | $ | (2,909 | ) | $ | 10,968 | ||||||
| (1) | Included in accumulated amortization is a tradename impairment charge of $632,000, which occurred in 2008. |
Amortization expenses related to purchased intangible assets were $2.2 million, $2.0 million and $277,000 in 2009, 2008 and 2007, respectively, including amortization expenses related to the developed technologies of $1.7 million, $1.8 million and $228,000 in 2009, 2008 and 2007, respectively. All amortization expenses related to purchased intangible assets are included in selling, general and administrative expenses in the consolidated statements of income. The change in the costs of the intangible assets reflects the change in foreign currency exchange rates as such assets are denominated in Euros.
Future estimated amortization expense over the following five-year period is as follows (in thousands):
| 2010 |
$ | 2,265 | |
| 2011 |
2,730 | ||
| 2012 |
2,660 | ||
| 2013 |
2,158 | ||
| 2014 |
1,802 |
Format Approval Agreements
In 2009, the Company executed several format approval agreements with various digital media content owners and distributors, for a total consideration of $850,000. Such format approval agreements allow online retailers to offer titles for secure download in the DivX format. The present value of the total considerations of these format approval fee agreements are capitalized as intangible assets and are amortized over the estimated useful life of the format fee approval agreements, which is typically four to five years. The short-term and long-term portion of these capitalized assets are included in other current assets and other assets, respectively, in the consolidated balance sheet. The amortization expenses are typically recorded to sales, general and administrative expenses in the consolidated statements of income.
In October 2008, the Company executed a format approval and license agreement with Warner Bros. Digital Distribution (WB). This multi-year agreement allows online retailers to distribute video content cleared for electronic distribution by WB, or WB Titles, for secure download in the DivX format. It also allows the Company in 2009 and 2010 to distribute a certain quantity of WB Titles in the DivX format to the general public
F-21
Table of Contents
DivX, Inc.
Notes to Consolidated Financial Statements—(Continued)
via electronic download and/or in conjunction with the sale of consumer electronics products. The total consideration under the format approval and license agreement is up to $5.0 million and fully vested warrants to purchase 320,000 shares of the common stock of DivX with a strike price of $6.85 and an exercise period of 22 months. The value of these warrants at the date of issuance was approximately $300,000. The present value of the future payments and value of the warrants of approximately $4.5 million was capitalized as an intangible asset and is being amortized to sales, general and administrative expense over the estimated period that the format fee approval agreement is expected to provide royalty revenues from the Company’s various customers, which is estimated to be approximately four years.
In June 2008, the Company executed a format approval fee agreement with Sony Pictures Television International (SPTI), covering the world, excluding the U.S., District of Columbia and Canada. This agreement provides for SPTI to allow online retailers to offer SPTI’s titles for secure download in the DivX format for playback on DivX Certified consumer electronics devices. The total consideration paid by the Company to SPTI was a one-time non-refundable fee of $1.0 million and fully vested warrants to purchase 50,000 shares of the common stock of DivX with a strike price of $9.45 and an exercise period of 18 months. The value of these warrants at the date of issuance was approximately $90,000. The total consideration of approximately $1.1 million was capitalized as an intangible asset and is being recorded against revenues generated from Sony Corporation over the estimated useful life of the format fee approval agreement, which is estimated to be five years.
In December 2007, the Company executed a format approval fee agreement with Sony Pictures Television (SPT). This agreement provides for SPT to allow online retailers to offer SPT’s titles for secure download in the DivX format for playback on DivX Certified consumer electronics devices. The total consideration paid by the Company to SPT was a one-time non-refundable fee of $1.5 million and fully vested warrants to purchase 100,000 shares of the common stock of DivX with a strike price of $16.14 and an exercise period of 18 months. The value of these warrants at the date of issuance was approximately $300,000. The total consideration of $1.8 million was capitalized as an intangible asset and is being recorded against revenues generated from Sony Corporation over the estimated useful life of the format approval fee agreement, which is estimated to be five years.
As of December 31, 2009, the Company had $2.3 million in prepaid format approval fees included in prepaid expenses, and $3.4 million of format approval fees included in other assets. The Company also had an accrued format fee liability of $2.3 million, of which $750,000 was included in accounts payable, $820,000 was included in current liabilities, and $713,000 was included in long-term liabilities as of December 31, 2009.
Restructuring Costs
During the first quarter of 2008, the Company shut down Stage6, the Company’s online video community service. As a result of the shut down, the Company evaluated the long-lived assets associated with Stage6 for impairment. Based on the Company’s forecasts, the Company concluded that the carrying amount of certain computers and computer equipment, prepaid assets and an intangible asset were not recoverable. As a result, an impairment loss equal to the assets’ remaining carrying amounts of approximately $350,000 was recorded in selling, general and administrative expenses in the consolidated statements of income in the year of 2008.
In addition, the Company identified several contractual obligations associated with Stage6 that were determined to have no future economic value after the shut down. As a result, the Company recorded a loss of $477,000 on those contractual obligations in operating expenses in the consolidated statements of income in 2008. As of December 31, 2008, no future termination costs existed or were accrued.
F-22
Table of Contents
DivX, Inc.
Notes to Consolidated Financial Statements—(Continued)
4. Stockholders’ equity
Common Stock
The Company had 200,000,000 shares of common stock authorized and 32,818,797 shares of common stock outstanding as of December 31, 2009.
Stock options
In July 2006, the Company adopted its 2006 Equity Incentive Plan (2006 Plan), which became effective immediately following the closing date of the Company’s initial public offering. A total of 10,934,265 shares of common stock are reserved under the 2006 Plan as of December 31, 2009. Such number is automatically increased on January 1 of each year by the lesser of (i) five percent of the total number of shares of common stock outstanding on December 31 of the previous year or (ii) 5,000,000 shares of common stock, subject to adjustments provided in the 2006 Plan, or such smaller amount of shares of common stock as the board of directors or compensation committee may designate. Generally, options granted under the 2006 Plan are exercisable for up to 10 years from the date of grant and vest over a four-year period. The Company also has a 2000 Stock Incentive Plan (2000 Plan). The Company has reserved 6,579,011 shares of common stock for issuance under the 2000 Plan. Generally, options granted under the 2000 Plan are exercisable for up to 10 years from the date of grant and vest over a four-year period. The 2000 Plan allows for early exercise of unvested options. The Company does not make grants from the 2000 Plan. Upon the exercise of an option prior to vesting, the Company has a right to repurchase such shares at the original exercise price to the extent that they have not vested in accordance with the related option agreement. The consideration received for the exercise of an unvested stock option granted is considered a deposit of the exercise price, and thus is a liability that is recorded by the Company. The liability associated with this potential for repurchase, and the related shares, are only reclassified into equity as the option award vests. As a result, the Company has recorded a liability of $2,000, $19,000 and $114,000 as of December 31, 2009, 2008 and 2007, respectively, for the unvested portion of early stock option exercises.
Following is a summary of all stock option activity for the years ended December 31, 2009, 2008 and 2007 (in thousands, except per share amounts):
| Options | Weighted-average exercise price |
Weighted Average Remaining Contractual Term (in years) |
Aggregate Intrinsic Value | ||||||||
| Balance at December 31, 2006 |
1,983 | $ | 5.36 | 7.7 | $ | 35,765 | |||||
| Granted |
4,202 | 16.89 | |||||||||
| Exercised |
(683 | ) | 1.68 | ||||||||
| Canceled |
(1,257 | ) | 16.73 | ||||||||
| Balance at December 31, 2007 |
4,245 | $ | 14.04 | 8.9 | $ | 10,374 | |||||
| Granted |
2,165 | 7.36 | |||||||||
| Exercised |
(277 | ) | 0.87 | ||||||||
| Canceled |
(1,079 | ) | 13.47 | ||||||||
| Balance at December 31, 2008 |
5,054 | $ | 10.44 | 8.6 | $ | 1,688 | |||||
| Granted |
2,435 | 5.08 | |||||||||
| Exercised |
(70 | ) | 2.00 | ||||||||
| Canceled |
(975 | ) | 9.35 | ||||||||
| Balance at December 31, 2009 |
6,444 | $ | 8.67 | 7.7 | $ | 2,849 | |||||
| Vested at December 31, 2009 |
2,627 | $ | 10.39 | 6.5 | $ | 1,627 | |||||
| Vested and expected to vest at December 31, 2009 |
5,668 | $ | 8.95 | 7.5 | $ | 2,556 | |||||
| Exercisable at December 31, 2009 |
2,651 | $ | 10.36 | 7.6 | $ | 1,652 | |||||
F-23
Table of Contents
DivX, Inc.
Notes to Consolidated Financial Statements—(Continued)
The number of shares subject to repurchase that were unvested at December 31, 2009, 2008 and 2007 includes 408, 12,385, and 122,887shares at a weighted average exercise price of $4.76, 1.51, and $0.93, respectively.
As of December 31, 2009, 1,073,873 and 4,558,591 shares were available for future grant under the 2000 Plan and the 2006 Plan, respectively.
2006 Employee Stock Purchase Plan
In July 2006, the Company adopted the 2006 Employee Stock Purchase Plan (Purchase Plan). A total of 550,000 shares of common stock were initially reserved under the Purchase Plan, such number to be automatically increased on January 1 of each year, beginning with January 1, 2007, by the lesser of (i) one and one-half percent of the total number of shares outstanding or (ii) 1,500,000 of common stock, subject to adjustment as provided in the Purchase Plan, for issuance and purchase by employees of the Company to assist them in acquiring a stock ownership interest in the Company and to encourage them to remain employees of the Company. The Purchase Plan is qualified under Section 423 of the Internal Revenue Code and permits eligible employees to purchase common stock at a discount through payroll deductions during specified six-month offering periods. No employee may purchase more than $25,000 worth of common stock in any calendar year.
The purchase price of common stock under the Purchase Plan shall be determined as the lesser of (i) an amount equal to eighty-five percent of the fair market value of the shares of common stock on the offering date or (ii) an amount equal to eighty-five percent of the fair market value of the shares of common stock on the last day of each six-month purchase period.
The Company issued 214,979, 126,789 and 136,898 shares under the Purchase Plan in the years ended December 31, 2009, 2008 and 2007, respectively. As of December 31, 2009, there were 2,060,278 shares reserved for grant under this program.
Restricted Stock Awards
In March 2008, the Board of Directors, pursuant to the 2006 Plan, granted 377,000 restricted stock units (RSUs) to executives and an employee at a fair value of $7.32 per share. These RSUs vest in quarterly increments over a four-year period. Shares of common stock that underlie the RSUs are issued upon vesting of the awards.
Restricted stock award activity for 2009, is as follows in thousands:
| 2009 | ||||||
| Non-vested Restricted Stock Awards |
Weighted Average Grant Date Fair Value | |||||
| Beginning balance |
284 | $ | 7.32 | |||
| Released |
(87 | ) | 7.32 | |||
| Ending balance |
197 | $ | 7.32 | |||
Unvested restricted stock awards are not considered outstanding in the computation of basic earnings per share.
F-24
Table of Contents
DivX, Inc.
Notes to Consolidated Financial Statements—(Continued)
Information regarding restricted stock awards outstanding as of December 31, 2009 is summarized below:
| Number of Shares |
Weighted Average Remaining Vesting Period |
Aggregate Intrinsic Value* (thousands) | |||||
| As of December 31, 2009 |
|||||||
| Shares outstanding |
197 | 1.2 years | $ | 1,110 | |||
| Shares vested and expected to vest |
177 | 1.2 years | $ | 999 | |||
| * | The intrinsic value is calculated as the market value as of end of the year. As reported by the NASDAQ Global Select Market, the market value as of December 31, 2009 was $5.64 per share. |
Warrants
A summary of warrant activity is as follows (in thousands, except per share data):
| December 31, | ||||||||||||||||||
| 2009 | 2008 | 2007 | ||||||||||||||||
| Number of Warrants |
Weighted Average Exercise Price |
Number of Warrants |
Weighted Average Exercise Price |
Number of Warrants |
Weighted Average Exercise Price | |||||||||||||
| Outstanding, beginning of year |
544 | $ | 8.25 | 175 | $ | 10.46 | 583 | $ | 1.00 | |||||||||
| Granted |
— | — | 370 | 7.20 | 100 | 16.14 | ||||||||||||
| Exercised |
— | — | (1 | ) | 0.73 | (508 | ) | 0.73 | ||||||||||
| Expired |
(150 | ) | 13.91 | — | — | — | — | |||||||||||
| Outstanding, end of year |
394 | $ | 6.10 | 544 | $ | 8.25 | 175 | $ | 10.46 | |||||||||
In December 2007 and in June 2008, the Company executed format approval fee agreements with Sony Pictures Television, or SPT, and Sony Pictures Television International, or SPTI, respectively. In October 2008, the Company executed a format approval and license agreement with Warner Brothers, or WB. In connection with the execution of these agreements, the Company issued SPT, SPTI and WB fully vested warrants to purchase 100,000 shares, 50,000 shares and 320,000 shares of the common stock of the Company, respectively. In 2009, fully vested warrants granted under the SPT and SPTI contracts expired. Fully vested warrants granted under the WB contract can be exercised for a strike price of $6.85, over an exercise period of 22 months.
Share Repurchase Program
In March 2008, the Company’s Board of Directors approved a share repurchase program authorizing the Company to repurchase up to $20.0 million of its common stock. The Company completed its share repurchase program by the end of the second quarter of 2008 with the purchases of approximately 2.8 million shares of its common stock for a total purchase price of approximately $20.0 million. Purchases under this program were made through a 10b5-1 program, and open market purchases.
The shares repurchased were retired and additional paid-in-capital was reduced accordingly, to the extent of the average premium with any excess being recorded as a reduction to retained earnings.
F-25
Table of Contents
DivX, Inc.
Notes to Consolidated Financial Statements—(Continued)
Shares of common stock reserved for issuance
As of December 31, 2009 and 2008, shares of common stock reserved for issuance were as follows (In thousands):
| December 31, | ||||
| 2009 | 2008 | |||
| Common stock options outstanding |
6,444 | 5,054 | ||
| Common stock options available for grant |
5,633 | 7,093 | ||
| Warrants |
394 | 544 | ||
| Total common shares reserved for future issuance |
12,471 | 12,691 | ||
5. Share-based Compensation
Stock Options
The Company recognizes all share-based payments to employees in the financial statements as compensation expense, including grants of employee stock options, over the vesting period based on their grant date fair values. To determine share-based compensation, the Company uses the Black-Scholes option pricing model to estimate the fair value of options granted under employee share-based compensation plans. The Black-Scholes option pricing model requires the Company to estimate a variety of factors, including the expected term of the option, the volatility of the Company’s common stock, the applicable risk-free rate, dividend yield and the forfeiture rate. The expected term represents the weighted-average period that the stock options are expected to be outstanding. The Company uses the historical volatility of its common stock as well as the historical volatility of a comparable peer group. The peer group historical volatility is used due to the limited trading history of the Company’s common stock. The Company uses a risk-free interest rate that is based on the implied yield available on U.S. Treasury issued with an equivalent remaining term at the time of grant. The Company has not paid dividends in the past and currently does not plan to pay any dividends in the foreseeable future and as such, dividend yield is assumed to be zero for the purposes of valuing the stock options granted.
The fair value of each option grant is estimated on the date of grant using the Black-Scholes method with the following assumptions in the years ended December 31, 2009, 2008 and 2007:
| 2009 | 2008 | 2007 | |||||||
| Average expected life (in years) |
5.71 | 6.05 | 6.24 | ||||||
| Average interest rate |
2.5 | % | 3.0 | % | 4.6 | % | |||
| Average volatility |
62 | % | 54 | % | 48 | % | |||
| Dividend yield |
— | — | — |
On May 8, 2008, the Board of Directors approved an option repricing program by the Company. Pursuant to the Board of Directors’ approval, the Company reduced the exercise price of all outstanding non-vested, non-qualified stock options granted to all employees (excluding Section 16 officers) who had exercise prices of $11.00 and above. Approximately 250 employees were included in this program. The exercise price of such options was re-set to $9.79 per share, which was equal to 110% of $8.90, the fair market value of the Company’s common stock as of May 8, 2008. This modification to the existing stock options resulted in an approximately $1.5 million incremental increase in value of the related stock options, the incremental stock compensation cost of which will be recognized by the Company ratably over the remaining life of such stock options. During the year ended December 31, 2008, the Company recorded approximately $300,000 in additional share-based compensation expenses directly associated with the re-priced stock options. During the year ended December 31, 2009, the Company recorded approximately $500,000 in additional share-based compensation expenses directly associated with the re-priced stock options.
F-26
Table of Contents
DivX, Inc.
Notes to Consolidated Financial Statements—(Continued)
As of December 31, 2009, there was $16.9 million of unrecognized share-based compensation cost which is expected to be recognized over a weighted-average period of 2.8 years. The Company recorded cash received from the exercise of stock options of $141,000, $241,000 and $1.1 million during the years ended December 31, 2009, 2008 and 2007, respectively. Upon option exercise, the Company issues new shares of common stock.
The estimated weighted-average fair value of an option to purchase one share of common stock granted during 2009, 2008 and 2007 was $2.93, $3.89 and $8.42, respectively. The total intrinsic value of options exercised during 2009, 2008 and 2007 was $228,000, $2.8 million and $10.3 million, respectively. The total fair value of options vested during 2009, 2008 and 2007 was $8.4 million, $8.1 million, and $5.2 million, respectively.
2006 Employee Stock Purchase Plan
The fair value of each compensatory share purchase right is estimated on the date of grant using the Black-Scholes option pricing model. The following assumptions were used in estimating the fair value of the purchase rights during 2009, 2008 and 2007:
| 2009 | 2008 | 2007 | |||||||
| Average expected term (in years) |
0.49 | 0.50 | 0.56 | ||||||
| Average risk-free interest rate |
0.3 | % | 1.4 | % | 4.2 | % | |||
| Average expected volatility |
73 | % | 80 | % | 41 | % | |||
| Dividend yield |
— | — | — |
The weighted-average estimated fair value of each compensatory share purchase right issued during 2009, 2008 and 2007 was $1.73, $2.49, and $5.14, respectively.
Restricted Stock Awards and Warrants
The company recognized the estimated compensation cost of restricted stock awards, net of estimated forfeitures, over the vesting term. The estimated compensation cost is based on the fair value of our common stock on the date of grant. In March 2008, the Board of Directors, pursuant to the 2006 Plan, granted 377,000 shares of restricted stock to executives and an employee at a fair value of $7.32 per share. The restricted stock awards vest in quarterly increments over a four-year period. The Company estimated the aggregate fair value of this award at approximately $2.8 million which is being amortized and recorded as compensation expense ratably over a period of four years. No restricted stock awards were granted in 2009. The total fair value of restricted stock awards vested during 2009 was approximately $640,000.
As of December 31, 2009, the warrants outstanding include primarily the fully vested warrants to purchase 320,000 shares of the common stock of the Company issued in connection with the execution of the format approval fee agreements with WB. Such fully vested warrants can be exercised for strike prices of $6.85, over exercise periods of 22 months. The fair value of these warrants at the date of issuance was assessed at approximately $300,000. The Company determined the value of warrants at the date of grant using the Black-Scholes option pricing model based on the estimated fair value of the underlying stock, a volatility rate of 50%, no dividends, a risk-free interest rate of 1.4%, and an expected life that coincides with the maximum exercise period of the warrants. The value of these warrants is being recorded as a as marketing expense, over the useful life of the format fee agreement of approximately four years.
F-27
Table of Contents
DivX, Inc.
Notes to Consolidated Financial Statements—(Continued)
6. Commitments
The Company has multiple operating leases for facilities and equipment expiring through 2014. As of December 31, 2009, the Company has no outstanding capital leases. Rent expense under operating leases was $1.6 million, $1.2 million, and $1.0 million for the years ended December 31, 2009, 2008, and 2007, respectively.
Future minimum payments under non-cancelable operating leases with initial terms of one year or more consists of the following at December 31, 2009 (in thousands):
| Operating leases | |||
| 2010 |
$ | 1,335 | |
| 2011 |
1,225 | ||
| 2012 |
1,019 | ||
| 2013 |
1,046 | ||
| 2014 |
264 | ||
| Total minimum lease payments |
$ | 4,889 | |
In addition, the Company has also entered into royalty-bearing license agreements with MPEG LA under which it pays royalties to MPEG LA based on each unit of its software products distributed up to certain contractual maximum royalty amounts. These license agreements with MPEG LA expire through 2013, unless terminated earlier. For the years ended December 31, 2009, 2008, and 2007, royalty expenses incurred under these license agreements totaled $7.4 million, $2.0 million, and $2.0 million, respectively.
7. Contingencies
Legal Matters
On October 22, 2007, following the filing of the Company’s declaratory relief action which was subsequently dismissed, Universal Music Group, Inc. (UMG), filed a lawsuit against the Company in the Central District of California, alleging copyright infringement and seeking monetary damages related to the Company’s operation of the Stage6 online video community service, which was shut down on February 29, 2008. On November 11, 2009, the Company entered into a Settlement Agreement with UMG (UMG Settlement) pursuant to which the Company and UMG agreed to dismiss with prejudice all of the pending claims in the UMG litigation. Under the UMG Settlement, upon the occurrence of certain triggers, the Company may be obligated to pay to UMG either $6 million or $15 million. As of the date of this filing, no amounts are due from the Company to UMG under the UMG Settlement.
As the Company does not believe that a loss, if any, under the UMG Settlement is probable, no amounts have been accrued in the accompanying consolidated financial statements.
On November 11, 2008, Yahoo! Inc (Yahoo!) informed the Company that it intended to breach the two-year License and Distribution Agreement (Distribution Agreement) entered into between the Company and Yahoo! on September 27, 2007 and to discontinue making payments required under the Distribution Agreement. As a result, in November 2008, the Company filed a lawsuit in California Superior Court in Santa Clara County seeking damages from Yahoo! and specific performance under the Distribution Agreement. On August 18, 2009, the Company entered into a Settlement Agreement and Mutual Release (Settlement Agreement) with Yahoo!
F-28
Table of Contents
DivX, Inc.
Notes to Consolidated Financial Statements—(Continued)
pursuant to which all claims by Yahoo! and the Company with respect to the matter have been dismissed with prejudice. Also pursuant to the Settlement Agreement, the Company received $9.5 million in cash payments from Yahoo! in August 2009 and recorded the proceeds as litigation settlement gain in the operating expenses section in the consolidated statements of income. Legal costs associated with this litigation and settlement were expensed as incurred.
The Company is also involved in various legal proceedings from time to time arising from the normal course of business activities, including commercial, employment and other matters. In its opinion, resolution of any of its legal matters is not expected to have a material adverse effect on the Company’s operating results or financial condition. However, it is possible that an unfavorable resolution of one or more such proceedings could materially affect the Company’s future operating results or financial condition in a particular period.
8. Income taxes
Income before income taxes is comprised of the following (in thousands):
| Year Ended December 31, | |||||||||||
| 2009 | 2008 | 2007 | |||||||||
| Domestic |
$ | 805 | $ | 20,745 | $ | 9,573 | |||||
| Foreign |
1,619 | (4,133 | ) | (1,339 | ) | ||||||
| $ | 2,424 | $ | 16,612 | $ | 8,234 | ||||||
The components of the income tax provision (benefit) were as follows (in thousands):
| Year ended December 31, | ||||||||||||
| 2009 | 2008 | 2007 | ||||||||||
| Current: |
||||||||||||
| Federal |
$ | 138 | $ | 5,089 | $ | (954 | ) | |||||
| State |
223 | 2,013 | 547 | |||||||||
| Foreign |
3,231 | 3,420 | 3,400 | |||||||||
| Total current |
3,592 | 10,522 | 2,993 | |||||||||
| Deferred |
||||||||||||
| Federal |
(3,014 | ) | (1,676 | ) | (3,361 | ) | ||||||
| State |
1,304 | (620 | ) | (525 | ) | |||||||
| Foreign |
411 | (1,622 | ) | (81 | ) | |||||||
| Total deferred |
(1,299 | ) | (3,918 | ) | (3,967 | ) | ||||||
| Total income tax provision (benefit) |
$ | 2,293 | $ | 6,604 | $ | (974 | ) | |||||
F-29
Table of Contents
DivX, Inc.
Notes to Consolidated Financial Statements—(Continued)
The following is a reconciliation of the expected statutory federal income tax provision (benefit) to the Company’s actual income tax provision (benefit) (in thousands):
| Year ended December 31, | ||||||||||||
| 2009 | 2008 | 2007 | ||||||||||
| Expected income tax provision at federal statutory tax rate |
$ | 849 | $ | 5,816 | $ | 2,882 | ||||||
| State income tax provision (benefit), net of federal benefit |
(166 | ) | 875 | 16 | ||||||||
| Stock compensation |
213 | 449 | 320 | |||||||||
| Foreign income taxes |
3,642 | 3,420 | 3,298 | |||||||||
| Valuation allowance |
— | (320 | ) | (742 | ) | |||||||
| Tax credits |
(3,836 | ) | (3,202 | ) | (3,928 | ) | ||||||
| Net change in reserves |
— | (248 | ) | (1,744 | ) | |||||||
| State tax law change |
1,155 | — | — | |||||||||
| Utilization of net operating loss carryforward |
— | — | (1,825 | ) | ||||||||
| Other |
436 | (186 | ) | 749 | ||||||||
| Income tax provision (benefit) |
$ | 2,293 | $ | 6,604 | $ | (974 | ) | |||||
Significant components of the Company’s deferred taxes as of December 31, 2008 and 2009, are as follows (in thousands):
| Year ended December 31, | ||||||
| 2009 | 2008 | |||||
| Deferred tax assets: |
||||||
| Net operating loss carryforwards |
$ | 984 | $ | 2,269 | ||
| Share-based compensation |
6,487 | 4,859 | ||||
| Accrued expenses |
542 | 544 | ||||
| Amortization expense |
2,654 | 2,029 | ||||
| Research and development and other tax credits |
2,272 | 2,025 | ||||
| Allowance for uncollectible accounts receivable |
79 | 338 | ||||
| State taxes |
199 | 705 | ||||
| Deferred revenue |
343 | 280 | ||||
| Depreciation expense |
464 | 419 | ||||
| Unrealized losses on investments |
149 | 358 | ||||
| Unrealized losses on foreign currency exchange rate conversion |
214 | 292 | ||||
| Other, net |
520 | 151 | ||||
| Total deferred tax assets |
14,907 | 14,269 | ||||
| Less: Deferred tax liabilities - purchased intangible assets |
2,699 | 3,440 | ||||
| Total net deferred tax assets |
$ | 12,208 | $ | 10,829 | ||
At December 31, 2009, the Company has U.S. federal, California and foreign net operating loss carryforwards of approximately $700,000, $600,000 and $2.3 million, respectively. Federal and California net operating loss carryforwards will begin to expire in 2021 and 2011, respectively, unless previously utilized. Foreign net operating loss carryforwards will begin to expire five years from the year they were generated.
During 2007, the Company recorded an income tax benefit of approximately $1.8 million as a result of the completion of the Company’s Section 382/383 limitation analysis pertaining to the Company’s deferred tax
F-30
Table of Contents
DivX, Inc.
Notes to Consolidated Financial Statements—(Continued)
assets related to net operating loss carryforwards and certain research and development credits. It was determined that domestic net operating loss carryforwards, generated prior to November 19, 2001, will be limited to utilization of $372,000 per year under Section 382.
At December 31, 2007, based on the weight of available evidence, including cumulative profitability in recent years, the Company determined that it was more likely than not that a portion of its U.S. deferred tax assets would be realized and, at December 31, 2007, eliminated $1.1 million of valuation allowance associated with its U.S. deferred tax assets. The elimination of valuation allowance resulted in $1.1 million recognized as an increase in earnings for the year ended December 31, 2007.
As a result of its acquisition of MainConcept AG (MainConcept), the Company’s wholly-owned subsidiary, during 2007 (see Note 11), the Company had recorded a deferred tax asset of approximately $1.4 million related to foreign net operating loss carryforwards. At December 31, 2007, the Company had recorded a $320,000 valuation allowance against this asset, which was eliminated during 2008. The elimination of the valuation allowance resulted in a $320,000 increase in earnings for the year ended December 31, 2008. In addition, the Company also recorded a deferred tax liability of approximately $4.3 million relating to purchased intangible assets upon acquisition in 2007.
Effective May 12, 2008, the Company made certain U.S. tax elections to treat MainConcept as a disregarded entity for U.S. income tax purposes. This has the effect of having the income or loss of this foreign subsidiary taxed in the United States as if it were a branch. Further, the U.S. tax elections created tax deductible intangible assets and goodwill. As a result, the Company will receive U.S. tax benefits for the amortization of the purchased intangible assets and tax deductible goodwill, which did not previously exist for U.S. federal income tax purposes. The elections resulted in the recognition of a U.S. deferred tax asset of approximately $2.1 million relating to these future U.S. tax benefits. This deferred tax asset was recorded as a reduction to goodwill during the second quarter of 2008 as part of the finalization of the purchase price allocation.
Effective January 1, 2007, we adopted the new standards of accounting for uncertainties in income taxes, which requires that any liability created for unrecognized tax benefits be disclosed. A reconciliation of the beginning and ending amount of unrecognized tax benefits is as follows (in thousands):
| Unrecognized tax benefits balance at January 1, 2007 |
$ | 3,151 | ||
| Increases related to current year tax positions |
135 | |||
| Reversal of accrued unrecognized tax benefits |
(2,019 | ) | ||
| Decrease in unrecognized tax benefits for years prior to 2007 |
(641 | ) | ||
| Unrecognized tax benefits balance at January 1, 2008 |
$ | 626 | ||
| Increases related to current year tax positions |
49 | |||
| Decrease in unrecognized tax benefits for years prior to 2008 |
(297 | ) | ||
| Unrecognized tax benefits balance at December 31, 2008 |
378 | |||
| Increases related to current year tax positions |
11 | |||
| Unrecognized tax benefits balance at December 31, 2009 |
$ | 389 | ||
All of the unrecognized tax benefits, if recognized, would affect the effective tax rate. The Company does not anticipate there will be a significant change in the unrecognized tax benefits within the next 12 months.
It is the Company’s practice to include interest and penalties that relate to uncertain income tax matters as a component of income tax expense. At December 31, 2009, the Company had accrued approximately, $45,000 of interest and $0 of penalties relating to uncertain tax matters.
F-31
Table of Contents
DivX, Inc.
Notes to Consolidated Financial Statements—(Continued)
The Company files income tax returns in the U.S. and various foreign and state jurisdictions. Due to net operating loss and research and development credit carryovers from earlier years, the Company is subject to income tax examination by tax authorities from our inception to date. The examination of the Company’s U.S. federal income tax return for the 2006 tax year was completed in November 2008. The completion of this examination did not have a material effect on the Company’s financial condition or results of operations. The Company is not currently under audit in any major taxing jurisdiction.
During 2009, the Company had a net shortfall of $838,000 debited to income tax expense (benefit), which related to the reversal of previously recorded deferred tax assets relating to employee share based compensation programs for employees no longer employed at the Company. During 2008, the Company had a net shortfall of $744,000 debited to stockholders’ equity, which related to the reversal of previously recorded deferred tax assets relating employee share-based compensation programs for employees no longer employed at the Company. A tax benefit of $60,000 for the year ended December 31, 2007, related to employee share-based compensation programs were credited to stockholders’ equity.
9. Employee retirement plan
The Company has a 401(k) defined contribution retirement plan covering all employees who have completed one month of service. Participants may contribute up to 15% of annual compensation. The Company may, at its sole discretion, match 50% of employee contributions up to 4% of gross wages. For the years ended December 31, 2009 and 2008, the Company provided a matching contribution of $230,000 and $198,000. For the year ended December 31, 2007 there was no matching contribution made by the Company.
10. Segment information and concentration of risk
Segment information
The Company’s operations are located primarily in the United States, and most of its assets are located in San Diego, California. The Company operates in one segment. Our chief operating decision-maker reviews our operating results on an aggregate basis and manages our operations as a single operating segment. Revenues are derived the following geographic regions from which our customers manufacture products:
| Year Ended December 31, | |||||||||
| 2009 | 2008 | 2007 | |||||||
| (in thousands) | |||||||||
| North America |
$ | 13,030 | $ | 24,425 | $ | 19,140 | |||
| Europe |
8,016 | 11,332 | 15,532 | ||||||
| Asia |
49,455 | 57,953 | 49,865 | ||||||
| Rest of world |
105 | 195 | 325 | ||||||
| Total |
$ | 70,606 | $ | 93,905 | $ | 84,862 | |||
Concentration of risk
The Company has historically generated a substantial amount of its revenue from international sales. Any significant decline in the Company’s international sales could have a material adverse effect on its business, financial condition and results of operations.
For the years 2009, 2008 and 2007, the Company’s revenues outside North America comprised 81%, 74% and 77%, respectively, of its total net revenues. In addition, a large number of the Company’s consumer hardware device manufacturer customers are located in Asia, which comprised 70%, 62% and 59% of the Company’s total net revenues for 2009, 2008 and 2007, respectively.
F-32
Table of Contents
DivX, Inc.
Notes to Consolidated Financial Statements—(Continued)
11. Business Acquisitions and Combinations
AnySource Media
On August 27, 2009, the Company acquired substantially all the assets of AnySource Media, LLC, (AnySource), a technology company developing software and service platforms for Internet-enabled consumer electronics devices. The Company believes that the AnySource transaction will help the Company meet its goal of expanding the business model to encompass licensing and other revenue opportunities relating to Internet-enabled consumer electronics devices. The results of AnySource’s operations have been included in the consolidated financial statements since the acquisition date. The Company acquired AnySource as part of its strategy to expand its technology licensing business to the next generation of Internet-enabled video devices, and to develop new business models around the new software and service platforms.
The total consideration for the net assets acquired is up to $15.0 million, consisting of an initial cash payment of $7.5 million, which the Company made in August 2009, and additional consideration of up to $7.5 million upon the achievement of certain technical product development milestones and certain revenue and distribution milestones. The total acquisition date fair value of the consideration was estimated at $12.5 million as follows (in thousands):
| Initial cash payment to AnySource |
$ | 7,500 | |
| Estimated fair value of contingent milestone consideration |
4,974 | ||
| Total consideration |
$ | 12,474 | |
On the acquisition date, a liability was recognized for an estimate of the acquisition date fair value of the contingent milestone consideration based on the probability of achieving the milestones and the probability weighted discount on cash flows. Any change in the fair value of the contingent milestone consideration subsequent to the acquisition date was and will be recognized in the statements of income. In the fourth quarter of 2009, the first two technical milestones were achieved and $1.4 million additional consideration became due, $750,000 of which was paid as of December 31, 2009. As of December 31, 2009, the Company reassessed the fair value of the remaining contingent consideration at $4.6 million and recorded the increase in fair value of $400,000 in selling, general and administrative expenses in the consolidated statements of income.
This fair value measurement is based on significant inputs not observed in the market and thus represents a Level 3 measurement. Level 3 instruments are valued based on unobservable inputs that are supported by little or no market activity and reflect the Company’s own assumptions in measuring fair value. Discount rates considered in the assessment of the acquisition date fair value for the contingent milestones totaling $5.0 million range from approximately 6% to 23%. Future changes in fair value of the contingent milestone consideration, as results of changes in significant inputs such as the discount rate and estimated probabilities of milestone achievements, could have a material effect on the statement of income and financial position in the period of the change. All acquisition costs related to the transaction were expensed as incurred.
The Company allocated the total consideration to the following assets (in thousands):
| Operating lease security deposit |
$ | 25 | |
| In-process research and development (IPR&D) (included in intangible assets) |
4,345 | ||
| Goodwill |
8,104 | ||
| Total consideration |
$ | 12,474 | |
F-33
Table of Contents
DivX, Inc.
Notes to Consolidated Financial Statements—(Continued)
Under the purchase method of accounting, the identifiable net assets acquired and liabilities assumed were recognized and measured as of the acquisition date based on their estimated fair values. In the determination of the fair value of the IPR&D, various factors were considered, such as future revenue contributions, additional licensing costs associated with the underlying technology, and contributory asset charges. The fair value of the IPR&D was calculated using an income approach and the rate utilized to discount net future cash flows to their present values was based on a weighted average cost of capital of approximately 30%. This discount rate was determined after considering the Company’s cost of debt adjusted for a risk premium that market participants would require in an investment in companies that are at similar stages of development as AnySource.
IPR&D will not be amortized until the product is complete, at which time the Company estimates it will be amortized over the estimated useful life of the developed technology of seven years. The useful life of the IPR&D was estimated as the period over which the asset is expected to contribute directly or indirectly to the future cash flows of the Company. Up to the point that the product is complete, the Company will assess the IPR&D annually for impairment, or more frequently if certain indicators are present. The Company performed its annual impairment test of the IPR&D as of December 31, 2009, and concluded that no impairment existed.
As AnySource was in the development stage when it was acquired by the Company, no revenue was generated by AnySource or included in the Company’s consolidated statements of income since the acquisition date. The expenses incurred by AnySource were included in the Company’s consolidated statements of income since the acquisition date.
The excess of the fair value of the total consideration over the estimated fair value of the net assets was recorded as goodwill. The Company allocated $8.1 million of the total consideration to goodwill. The Company considers the acquired business an addition to its product development effort and not an additional reporting unit or operating segment. The goodwill recorded for the acquisition of AnySource will not be amortized but tested for impairment at least annually, or more frequently if certain indicators are present. In the event that management determines that the value of goodwill has become impaired, the Company will record an accounting charge for the amount of impairment during the fiscal quarter in which the determination is made. The goodwill will be deductible for tax purposes based upon a 15 year tax life.
MainConcept
In November 2007, the Company acquired MainConcept, a German-based provider of audio and video codec technology to complement its organic growth in providing an H.264 codec solution and other high-quality video codecs and technologies for the broadcast, film, consumer electronics and computer software markets. In exchange for all outstanding shares of capital stock, the Company paid approximately $22.6 million. The purchase price, including acquisition costs of $200,000, was $16.4 million in cash, 88,940 shares of the Company’s common stock, which was valued at approximately $1.6 million as of the date of the transaction, and outstanding loans extended to MainConcept by one of its shareholders that the Company also purchased for an aggregate amount of approximately $4.4 million.
F-34
Table of Contents
DivX, Inc.
Notes to Consolidated Financial Statements—(Continued)
The purchase price allocations are shown below (in thousands):
| Cash and investments |
$ | 433 | ||
| Accounts receivable |
594 | |||
| Other current assets |
162 | |||
| Property and equipment |
419 | |||
| Accounts payable and accrued expenses |
(1,120 | ) | ||
| Deferred tax liability, net |
(3,119 | ) | ||
| Long-tem debt |
(295 | ) | ||
| Other long-term liabilities |
(25 | ) | ||
| Net tangible liabilities |
(2,951 | ) | ||
| Developed technologies |
11,337 | |||
| Customer lists |
1,400 | |||
| Tradename |
1,800 | |||
| Goodwill |
11,000 | |||
| Total purchase price |
$ | 22,586 | ||
The MainConcept purchase agreement also provides for additional payments of up to approximately $5.6 million upon the achievement by MainConcept of certain product development goals and certain financial milestones. During the year ended December 31, 2008, the final payment of $2.5 million of milestones were recorded as additional purchase price and allocated to goodwill, which is deductible for U.S. tax purposes. In addition, effective May 12, 2008, the Company made certain U.S. tax elections to treat MainConcept, as a disregarded entity for U.S. income tax purposes. The elections resulted in the recognition of a U.S. deferred tax asset of approximately $2.1 million relating to future U.S. tax benefits. This deferred tax asset was recorded as a reduction to goodwill during 2008 as part of the finalization of the purchase price allocation. During 2008, the Company also recorded purchase accounting adjustments related to deferred revenue of $600,000, and the effect of exchange rate on goodwill of $400,000, both reducing the goodwill balance. During 2009, the Company recorded the effect of exchange rate on goodwill of $250,000, increasing the goodwill balance. During 2009, the Company also recorded a reduction to its goodwill balance associated with the acquisition of MainConcept in the amount of $184,000. The adjustment related to a revision of certain deferred tax assets that were recorded upon acquisition of MainConcept in 2007.
The goodwill recorded for the acquisition of MainConcept is not currently deductible for tax purposes and is assessed annually for impairment. The identifiable intangible assets are amortized over the useful lives of five to seven years for the tradename, developed technologies, six years for tier I customer lists, two years for tier II customer lists. The acquired goodwill is not amortized but assessed annually for impairment.
In connection with the acquisition of MainConcept in November 2007, the Company identified the MainConcept tradename as an intangible asset with an indefinite life, and valued the tradename at $1.8 million. During the annual impairment assessment of the carrying value of the MainConcept tradename as of October 1, 2008, the Company concluded that the carrying value of the tradename exceeded its fair value, and recorded an impairment charge of approximately $600,000 in the consolidated statements of income in 2008. The Company estimated the fair value of the tradename using the income approach valuation methodology that includes the discounted cash flow method, based on discrete financial forecasts for planning purposes and incorporates a terminal value calculation for years beyond the internal forecasts. Future cash flows were also discounted to present value. Specifically, the income approach valuation used a cash flow discount rate of 17% and a terminal value growth rate of 4%. In addition, as of December 31, 2008, the Company determined that the life of the tradename was no longer indefinite based on the Company’s revised estimated usage and started to amortize the
F-35
Table of Contents
DivX, Inc.
Notes to Consolidated Financial Statements—(Continued)
tradename prospectively over its estimated useful life of 6 years. During 2009, the Company recorded approximately $200,000 of tradename amortization expenses.
MainConcept has a variable interest investment in MainConcept-Japan, which functions as a Japanese sales office for MainConcept in consideration for a sales commission. The Company has a 38% interest and does not consolidate MainConcept-Japan as it is not the primary beneficiary of MainConcept-Japan, or any other variable interest entity. Commissions paid to MainConcept-Japan were approximately $1.0 million, $800,000 and $100,000 for the years ended December 31, 2009, 2008 and 2007, respectively.
Veatros
In July 2007, the Company acquired all of the assets of Veatros, L.L.C. (Veatros), a limited liability company engaged in real-time digital video processing for the purposes of producing enhanced video search and discovery services. At the time of acquisition, the operations of Veatros had been wound down and no development projects were in-process. The total purchase price for the acquisition was up to $4.3 million comprised of an initial upfront cash payment of $2.0 million, which the Company made in July 2007, and subsequent cash payments of $2.3 million upon the achievement of certain technology related milestones. The Company did not acquire any tangible assets or assume any liabilities as a result of the acquisition. The Company allocated the cash payments of $4.3 million to one identifiable intangible asset, a patented technology license. The asset is being amortized over the useful life of the patented technology license, or approximately eight years.
In July 2007, subsequent to the asset purchase, the Company’s board of directors approved a plan to separate its Stage6 operations into a separate private entity, and in early 2008 Stage6 was shut down. As a significant portion of the benefit from the acquired patented technology license was originally to be derived from Stage6 future activities, the Company evaluated the intangible asset for impairment as of December 31, 2008 based on the projected benefits solely attributable to our core consumer electronics business. Based on the Company’s revised forecasts excluding the Stage6 future activities and discounting the cash flows attributable to our core consumer electronics business, the Company concluded that the carrying amount of the asset was not fully recoverable and an impairment charge equal to approximately $3.0 million was recorded in 2007 in the consolidated statements of income, as the acquired patented technology license was considered to have a recoverable value of approximately $60,000. During the year of 2008, technology milestones equal to $1.3 million in the aggregate were achieved and paid. As these technology milestones were attributable to Stage6, the milestones were not considered to be recoverable and as a result, the Company recorded an impairment charge of $1.3 million in the consolidated statements of income during 2008. All milestones had been achieved and the Company had no remaining liability related to the acquisition of Veatros as of December 31, 2008.
F-36
Table of Contents
DivX, Inc.
Notes to Consolidated Financial Statements—(Continued)
12. Goodwill impairment
As of December 31, 2009, the Company had a goodwill balance of $18.5 million, which consists of the $8.1 million of goodwill recorded upon the AnySource acquisition in 2009, and $10.4 million of goodwill resulted from the MainConcept acquisition in 2007. The following table provides a summary of changes in the goodwill balance for the years ended December 31, 2008 and December 31, 2009 (in thousands):
| Balance at December 31, 2007 |
$ | 11,000 | ||
| Product development and financial milestones |
2,524 | |||
| Purchase accounting adjustment related to deferred revenue |
(643 | ) | ||
| Impact from “check-the-box” election |
(2,145 | ) | ||
| Effect of exchange rate changes |
(378 | ) | ||
| Balance at December 31, 2008 |
$ | 10,358 | ||
| Goodwill recorded upon AnySource acquisition |
8,104 | |||
| Goodwill adjustment associated with the MainConcept acquisition |
(184 | ) | ||
| Effect of exchange rate changes related to goodwill recorded upon MainConcept acquisition |
250 | |||
| Balance at December 31, 2009 |
$ | 18,528 | ||
The Company performed an annual goodwill impairment analysis as of October 1, 2009, the testing date. At October 1, 2009, the Company had one reporting unit. The Company compared the carrying value of the reporting unit to its estimated fair value. The Company estimated the fair value of the reporting unit primarily using both the income approach valuation methodology that includes the discounted cash flow method, and the market approach which utilizes other company-specific data to estimate the fair value. The discounted cash flows for the reporting unit were based on discrete financial forecasts developed by management for planning purposes. Cash flows beyond the discrete forecasts were estimated using a terminal value calculation, which incorporated historical and forecasted financial trends for the identified reporting unit and considered long-term earnings growth rates. Future cash flows were discounted to present value. Specifically, the income approach valuations included reporting unit cash flow discount rates ranging from 17% to 18%, and terminal value growth rates ranging from 3% to 5%. Publicly available information regarding the Company’s market capitalization was also considered in assessing the reasonableness of the cumulative fair values of our reporting units estimated using the discounted cash flow methodology.
To validate the reasonableness of the reporting unit fair value, the Company reconciled the aggregated fair value of the reporting unit determined in step one of the goodwill impairment test to the market capitalization of DivX stock to derive the implied control premium. In performing this reconciliation, the Company used an average stock price over a range of dates around the valuation date, generally 30 days. The Company assessed the implied control premium to determine if the fair value of the reporting unit estimated in step one of the goodwill impairment test is reasonable.
Upon completion of the October 2009 annual impairment assessment, the Company determined no impairment was indicated as the estimated fair value of the reporting unit exceeded its carrying value. Changes in estimates and assumptions made in conducting the goodwill assessment could affect the estimated fair value of the reporting unit and could result in a goodwill impairment charge in a future period.
13. Selected quarterly financial data (unaudited)
The following table presents selected quarterly financial information for the periods indicated. This information has been derived from the Company’s unaudited quarterly consolidated financial statements, which
F-37
Table of Contents
DivX, Inc.
Notes to Consolidated Financial Statements—(Continued)
in the opinion of management include all adjustments necessary for a fair statement of such information. The quarterly financial results for the third quarter of 2009 include a litigation settlement gain of $9.5 million. The 2008 financial results include impairment charges of $1.0 million, $300,000 and $600,000 in the first, second and fourth quarters of 2008, respectively, for acquired intangible assets. The quarterly per share amounts presented below were calculated separately and may not sum to the annual figures presented in the consolidated statements of income. These operating results are also not necessarily indicative of results for any future period.
| 2009 | |||||||||||||||||||
| Q1 | Q2 | Q3 | Q4 | Total | |||||||||||||||
| (in thousands, except per share amounts) | |||||||||||||||||||
| Net revenues |
$ | 18,677 | $ | 15,234 | $ | 16,635 | $ | 20,060 | $ | 70,606 | |||||||||
| Gross profit |
16,090 | 12,933 | 14,195 | 17,676 | 60,894 | ||||||||||||||
| Income (loss) from operations |
(1,320 | ) | (3,575 | ) | 5,387 | (15 | ) | 477 | |||||||||||
| Income (loss) before income taxes |
(1,116 | ) | (2,614 | ) | 5,854 | 300 | 2,424 | ||||||||||||
| Net income (loss) |
(1,432 | ) | (2,359 | ) | 3,956 | (34 | ) | 131 | |||||||||||
| Net income (loss) per share: |
|||||||||||||||||||
| Basic |
$ | (0.04 | ) | $ | (0.07 | ) | $ | 0.12 | $ | (0.00 | ) | $ | 0.00 | (1) | |||||
| Diluted |
(0.04 | ) | (0.07 | ) | 0.12 | (0.00 | ) | 0.00 | (1) | ||||||||||
| 2008 | |||||||||||||||||||
| Q1 | Q2 | Q3 | Q4 | Total | |||||||||||||||
| (in thousands, except per share amounts) | |||||||||||||||||||
| Net revenues |
$ | 25,022 | $ | 21,319 | $ | 24,409 | $ | 23,155 | $ | 93,905 | |||||||||
| Gross profit |
23,814 | 20,177 | 23,256 | 22,062 | 89,309 | ||||||||||||||
| Income from operations |
1,412 | 1,988 | 5,314 | 3,932 | 12,646 | ||||||||||||||
| Income before income taxes |
3,586 | 3,083 | 5,545 | 4,398 | 16,612 | ||||||||||||||
| Net income |
2,481 | 1,677 | 3,280 | 2,570 | 10,008 | ||||||||||||||
| Net income per share: |
|||||||||||||||||||
| Basic |
$ | 0.07 | $ | 0.05 | $ | 0.10 | $ | 0.08 | $ | 0.30 | |||||||||
| Diluted |
0.07 | 0.05 | 0.10 | 0.08 | 0.30 | ||||||||||||||
| (1) | This row does not foot across due to rounding. |
F-38
Table of Contents
SCHEDULE II—VALUATION AND QUALIFYING ACCOUNTS
FOR THE YEARS ENDED DECEMBER 31, 2009, 2008 and 2007 (in thousands)
| Allowance for Uncollectible Sales and Accounts |
Balance at beginning of year |
Charged to operations |
Deductions from allowance(1) |
Balance at end of year | |||||||||
| For the year ended December 31, 2007 |
$ | 1,424 | $ | 968 | $ | (483 | ) | $ | 1,909 | ||||
| For the year ended December 31, 2008 |
1,909 | 261 | (1,241 | ) | 929 | ||||||||
| For the year ended December 31, 2009 |
929 | 375 | (1,046 | ) | 258 | ||||||||
| (1) | Write-offs net of recoveries. |
F-39