Attached files
Exhibit 13
Dear Stockholder:
I am very thankful to be able to report the accomplishments and financial results for 2008. The company’s earnings and capital levels are very encouraging, considering the state of the nation’s economy and current market conditions.
During 2008, many companies experienced tremendous loss of value in their market capitalization. In the financial industry, much of this decline was due to the imprudent lending and divergence from sound business practices. Unlike many companies, we have not attempted to be all things to all people. As simple as it may sound, we still accept and safeguard deposits, make quality loans and price these functions appropriately. We sharpened our focus and concentrated on doing the things that we do well.
In 2008, we celebrated 100 years since the original 48 stockholders met to form this great company. I attribute much of our continued success to the adherence to the principles of honesty, integrity and service that began in 1908. I can assure you that the current directors, officers and employees understand and take very seriously our place in the history of this company. We have a level of institutional knowledge that allows us to not only survive but prosper in the current market conditions. We work every day to make sure this legacy of service continues.
The attached financials show net income increased by 19.7% over 2007. This equates to basic per share earnings of $1.70 compared to $1.41 for 2007. The assets of The Citizens Bank grew 12.5% with loan growth of 15.2% and deposit growth of 14.4%. I am very pleased to report these positive trends.
Along with these positive financial achievements, we have further deployed our strategic growth plan. We opened two new branch locations in Meridian, MS. The Mid-Town and Broadmoor locations provide additional convenience for our Lauderdale County customers. In September, we opened a new branch in Hattiesburg, MS, which marks our initial move into the south Mississippi market. In November, we moved into our new building in Carthage, MS and based on the dramatically increased traffic count since the move, this has proved to be a wise decision.
In late 2008, after careful analysis and consideration, your Board of Directors deemed it inappropriate to apply for any of the TARP funds. Given the healthy capital position of our bank and the uncertainty about the administration of the program, the Board decided that accepting any of these funds would not be a prudent business decision.
Obviously, I am very pleased with our accomplishments for 2008. At the risk of being repetitive, I realize these accomplishments would not be possible without the wise counsel from a strong Board of Directors. Along with the Board, our stockholders, customers and employees are what make us the strong company that we are.
As we go through 2009, I again pledge to you that all strategies considered and decisions made will be done with the thought of service to our communities and the long-term maximization of your investments.
As always, thank you for your support and interest in this great Company!
Sincerely,
Greg L. McKee
President & Chief Executive Officer
CITIZENS HOLDING COMPANY
Philadelphia, Mississippi
Consolidated Financial Statements
As of December 31, 2009 and 2008 and for the
Years Ended December 31, 2009, 2008 and 2007
CONTENTS
| Report of Independent Registered Public Accounting Firm |
1 | |
| Management’s Assessment of Internal Control over Financial Reporting |
3 | |
| Consolidated Financial Statements |
||
| Consolidated Statements of Condition |
4 | |
| Consolidated Statements of Income |
5 | |
| Consolidated Statements of Comprehensive Income |
6 | |
| Consolidated Statements of Changes in Stockholders’ Equity |
7 | |
| Consolidated Statements of Cash Flows |
8 – 9 | |
| Notes to Consolidated Financial Statements |
10 – 48 | |

REPORT OF INDEPENDENT REGISTERED PUBLIC ACCOUNTING FIRM
To the Board of Directors and Stockholders
Citizens Holding Company
Philadelphia, Mississippi
We have audited the accompanying consolidated statements of condition of Citizens Holding Company and Subsidiary (the “Company”) as of December 31, 2009 and 2008, and the related statements of income, comprehensive income, changes in stockholders’ equity and comprehensive income and cash flows for each of the three years in the period ended December 31, 2009. We also have audited the Company’s internal control over financial reporting as of December 31, 2009, based on criteria established in Internal Control — Integrated Framework issued by the Committee of Sponsoring Organizations of the Treadway Commission. The Company’s management is responsible for these financial statements, for maintaining effective internal control over financial reporting and for its assessment of the effectiveness of internal control over financial reporting included in the accompanying Management’s Assessment of Internal Control Over Financial Reporting. Our responsibility is to express an opinion on these financial statements and an opinion on the Company’s internal control over financial reporting based on our audits.
We conducted our audits in accordance with the standards of the Public Company Accounting Oversight Board (United States). Those standards require that we plan and perform the audits to obtain reasonable assurance about whether the financial statements are free of material misstatement and whether effective internal control over financial reporting was maintained in all material respects. Our audits of the financial statements included examining, on a test basis, evidence supporting the amounts and disclosures in the financial statements, assessing the accounting principles used and significant estimates made by management and evaluating the overall financial statement presentation. Our audit of internal control over financial reporting included obtaining an understanding of internal control over financial reporting, assessing the risk that a material weakness exists and testing and evaluating the design and operating effectiveness of internal control based on the assessed risk. Our audits also included performing such other procedures as we considered necessary in the circumstances. We believe that our audits provide a reasonable basis for our opinions.
A Company’s internal control over financial reporting is a process designed to provide reasonable assurance regarding the reliability of financial reporting and the preparation of financial statements for external purposes in accordance with accounting principles generally accepted in the United States of America. A Company’s internal control over financial reporting
1
includes those policies and procedures that (a) pertain to the maintenance of records that, in reasonable detail, accurately and fairly reflect the transactions and dispositions of the assets of the Company; (b) provide reasonable assurance that transactions are recorded as necessary to permit preparation of financial statements in accordance with accounting principles generally accepted in the United States of America and that receipts and expenditures of the Company are being made only in accordance with authorizations of management and directors of the Company; and (c) provide reasonable assurance regarding prevention or timely detection of unauthorized acquisition, use or disposition of the Company’s assets that could have a material effect on the financial statements.
Because of its inherent limitations, internal control over financial reporting may not prevent or detect misstatements. Also, projections of any evaluation of effectiveness to future periods are subject to the risk that controls may become inadequate because of changes in conditions, or that the degree of compliance with the policies or procedures may deteriorate.
In our opinion, the financial statements referred to above present fairly, in all material respects, the financial position of the Company as of December 31, 2009 and 2008 and the results of its operations and its cash flows for each of the years in the three-year periods ended December 31, 2009, in conformity with accounting principles generally accepted in the United States of America. Also in our opinion, the Company maintained, in all material respects, effective internal control over financial reporting as of December 31, 2009, based on criteria established in Internal Control — Integrated Framework issued by the Committee of Sponsoring Organizations of the Treadway Commission.

Ridgeland, Mississippi
March 11, 2010
2
Citizens Holding Company
Philadelphia, MS 39350
MANAGEMENT’S ASSESSMENT OF INTERNAL CONTROL OVER FINANCIAL REPORTING
Management of Citizens Holding Company (the “Company”) is responsible for establishing and maintaining adequate internal control over financial reporting. Internal control over financial reporting is a process designed under the supervision of the Company’s principal executive and principal financial officers to provide reasonable assurance regarding the reliability of financial reporting and the preparation of the Company’s financial statements for external purposes in accordance with accounting principles generally accepted in the United States of America.
Management, under the direction of the chief executive officer and chief financial officer, assessed the Company’s internal control over financial reporting as of December 31, 2009 based on the criteria for effective internal control over financial reporting established in Internal Control — Integrated Framework issued by the Committee of Sponsoring Organizations of the Treadway Commission. Based on this assessment, management believes that, as of December 31, 2009, the Company maintained effective internal control over financial reporting.
The Company’s internal control over financial reporting includes policies and procedures that (1) pertain to the maintenance of records that in reasonable detail accurately and fairly reflect the transactions and dispositions of the assets of the Company, (2) provide reasonable assurance that transactions are recorded as necessary to permit preparation of financial statements in accordance with generally accepted accounting principles and that receipts and expenditures of the Company are being made only in accordance with authorizations of management and directors of the Company, and (3) provide reasonable assurance regarding prevention or timely detection of unauthorized acquisition, use or disposition of the Company’s assets that could have a material effect on the financial statements.
Because of its inherent limitations, internal control over financial reporting may not prevent or detect misstatements. Projections of any evaluation of effectiveness to future periods are subject to risk that controls may become inadequate because of changes in conditions, or that the degree of compliance with the policies or procedures may deteriorate.
HORNE LLP, the Company’s Independent Registered Public Accounting Firm, has audited the Company’s internal control over financial reporting as of December 31, 2009, as stated in their report, beginning on page 1, which expresses an unqualified opinion on the Company’s internal control over financial reporting as of December 31, 2009.

|

| |
| Greg L. McKee | Robert T. Smith | |
| President and Chief Executive Officer | Treasurer and Chief Financial Officer |
March 11, 2010
3
CITIZENS HOLDING COMPANY
Consolidated Statements of Condition
December 31, 2009 and 2008
| 2009 | 2008 | |||||||
| ASSETS |
||||||||
| Cash and due from banks |
$ | 15,365,612 | $ | 28,844,221 | ||||
| Interest bearing deposits with other banks |
5,232,723 | 1,001,611 | ||||||
| Securities available for sale, at fair value (amortized cost of $319,792,027 in 2009 and $260,105,423 in 2008) |
318,403,999 | 258,023,206 | ||||||
| Loans, net of allowance for loan losses of $5,525,903 in 2009 and $4,479,585 in 2008 |
441,694,562 | 424,225,671 | ||||||
| Bank premises, furniture, fixtures and equipment, net |
18,124,109 | 17,182,082 | ||||||
| Real estate acquired by foreclosure |
3,229,180 | 3,374,803 | ||||||
| Accrued interest receivable |
6,048,718 | 6,265,797 | ||||||
| Cash value of life insurance |
18,783,333 | 17,992,456 | ||||||
| Intangible assets |
3,595,994 | 3,780,685 | ||||||
| Other assets |
9,525,598 | 5,356,800 | ||||||
| Total assets |
$ | 840,003,828 | $ | 766,047,332 | ||||
| LIABILITIES AND STOCKHOLDERS’ EQUITY |
||||||||
| Deposits |
||||||||
| Non-interest bearing deposits |
$ | 87,116,776 | $ | 95,650,137 | ||||
| Interest bearing time deposits |
482,685,809 | 450,277,285 | ||||||
| Total deposits |
569,802,585 | 545,927,422 | ||||||
| Federal funds purchased |
— | 21,000,000 | ||||||
| Securities sold under agreement to repurchase |
114,753,010 | 41,441,052 | ||||||
| Federal Home Loan Bank advances |
74,400,000 | 79,400,000 | ||||||
| Accrued interest payable |
778,989 | 1,365,679 | ||||||
| Deferred compensation payable |
3,870,344 | 3,257,631 | ||||||
| Other liabilities |
1,801,436 | 2,255,910 | ||||||
| Total liabilities |
765,406,364 | 694,647,694 | ||||||
| Commitments and contingencies |
— | — | ||||||
| Stockholders’ equity |
||||||||
| Common stock, $.20 par value, authorized 22,500,000 shares; 4,838,187 shares issued and outstanding at 2009 and 4,849,296 shares issued and outstanding at 2008 |
967,637 | 969,859 | ||||||
| Additional paid-in capital |
3,087,738 | 3,530,390 | ||||||
| Accumulated other comprehensive loss, net of tax benefit of $517,734 in 2009 and $776,667 in 2008 |
(870,294 | ) | (1,305,550 | ) | ||||
| Retained earnings |
71,412,383 | 68,204,939 | ||||||
| Total stockholders’ equity |
74,597,464 | 71,399,638 | ||||||
| Total liabilities and stockholders’ equity |
$ | 840,003,828 | $ | 766,047,332 | ||||
4
CITIZENS HOLDING COMPANY
Consolidated Statements of Income
Years Ended December 31, 2009, 2008, and 2007
| 2009 | 2008 | 2007 | ||||||||||
| Interest income |
||||||||||||
| Interest and fees on loans |
$ | 29,378,692 | $ | 29,427,687 | $ | 28,981,941 | ||||||
| Interest on securities |
||||||||||||
| Taxable |
7,875,294 | 6,578,680 | 4,927,774 | |||||||||
| Non-taxable |
3,610,650 | 3,227,403 | 3,169,536 | |||||||||
| Other interest |
24,544 | 323,793 | 1,020,601 | |||||||||
| Total interest income |
40,889,180 | 39,557,563 | 38,099,852 | |||||||||
| Interest expense |
||||||||||||
| Deposits |
7,938,179 | 9,899,741 | 12,814,534 | |||||||||
| Other borrowed funds |
3,397,562 | 3,875,063 | 3,948,220 | |||||||||
| Total interest expense |
11,335,741 | 13,774,804 | 16,762,754 | |||||||||
| Net interest income |
29,553,439 | 25,782,759 | 21,337,098 | |||||||||
| Provision for loan losses |
(3,013,455 | ) | (1,223,939 | ) | (784,120 | ) | ||||||
| Net interest income after provision for loan losses |
26,539,984 | 24,558,820 | 20,552,978 | |||||||||
| Non-interest income |
||||||||||||
| Service charges on deposit accounts |
4,110,480 | 4,044,485 | 3,859,598 | |||||||||
| Other service charges and fees |
1,374,339 | 1,178,009 | 763,079 | |||||||||
| Net gains (losses) on investment security sales |
573,385 | 8,383 | 29,339 | |||||||||
| Other income |
1,999,428 | 2,632,182 | 3,126,633 | |||||||||
| Total non-interest income |
8,057,632 | 7,863,059 | 7,778,649 | |||||||||
| Non-interest expense |
||||||||||||
| Salaries and employee benefits |
13,257,839 | 12,054,144 | 10,539,810 | |||||||||
| Occupancy expense |
1,815,930 | 1,824,897 | 1,688,809 | |||||||||
| Equipment expense |
2,366,871 | 1,908,785 | 1,528,841 | |||||||||
| Other expense |
8,386,670 | 6,071,220 | 5,691,823 | |||||||||
| Total non-interest expense |
25,827,310 | 21,859,046 | 19,449,283 | |||||||||
| Income before income taxes |
8,770,306 | 10,562,833 | 8,882,344 | |||||||||
| Income tax expense |
1,631,332 | 2,289,066 | 1,968,110 | |||||||||
| Net income |
$ | 7,138,974 | $ | 8,273,767 | $ | 6,914,234 | ||||||
| Net income per share – basic |
$ | 1.47 | $ | 1.70 | $ | 1.41 | ||||||
| Net income per share – diluted |
$ | 1.45 | $ | 1.69 | $ | 1.39 | ||||||
| Average shares outstanding |
||||||||||||
| Basic |
4,854,919 | 4,860,095 | 4,913,946 | |||||||||
| Diluted |
4,913,627 | 4,895,511 | 4,964,475 | |||||||||
The accompanying notes are an integral part of these statements.
5
CITIZENS HOLDING COMPANY
Consolidated Statements of Comprehensive Income
Years Ended December 31, 2009, 2008, and 2007
| 2009 | 2008 | 2007 | ||||||||||
| Net income |
$ | 7,138,974 | $ | 8,273,767 | $ | 6,914,234 | ||||||
| Other comprehensive (loss) income |
||||||||||||
| Unrealized holding (losses) gains on available for sale securities during year |
1,267,574 | (1,384,006 | ) | 172,573 | ||||||||
| Income tax effect |
(472,805 | ) | 516,234 | (64,369 | ) | |||||||
| Net unrealized (losses) gains |
794,769 | (867,772 | ) | 108,204 | ||||||||
| Reclassification adjustment for (gains) losses included in net income |
(573,385 | ) | (8,383 | ) | (29,339 | ) | ||||||
| Income tax effect |
213,872 | 3,127 | 10,943 | |||||||||
| Net (gains) losses included in net income |
(359,513 | ) | (5,256 | ) | (18,396 | ) | ||||||
| Change in minority interest in net unrealized gains |
— | — | (11,169 | ) | ||||||||
| Total other comprehensive (loss) income |
435,256 | (873,028 | ) | 78,639 | ||||||||
| Comprehensive income |
$ | 7,574,230 | $ | 7,400,739 | $ | 6,992,873 | ||||||
The accompanying notes are an integral part of these statements.
6
CITIZENS HOLDING COMPANY
Consolidated Statements of Changes in Stockholders’ Equity
Years Ended December 31, 2009, 2008, and 2007
| Number of Shares Issued |
Common Stock |
Additional Paid-In Capital |
Accumulated Other Comprehensive Income (Loss) |
Retained Earnings |
Total | |||||||||||||||
| Balance, December 31, 2006 |
5,020,228 | 1,004,046 | 3,886,830 | (511,161 | ) | 65,285,558 | 69,665,273 | |||||||||||||
| Net income |
— | — | — | — | 6,914,234 | 6,914,234 | ||||||||||||||
| Dividends paid ($0.73 per share) |
— | — | — | — | (3,576,655 | ) | (3,576,655 | ) | ||||||||||||
| Options exercised, including tax benefit of $10,927 |
3,200 | 640 | 25,915 | — | — | 26,555 | ||||||||||||||
| Shares repurchased |
(160,186 | ) | (32,038 | ) | (3,450,115 | ) | (3,482,153 | ) | ||||||||||||
| Increase investment in subsidiary |
(1,501,433 | ) | (1,501,433 | ) | ||||||||||||||||
| Stock compensation expense |
66,972 | 66,972 | ||||||||||||||||||
| Other comprehensive income, net |
— | — | — | 78,639 | — | 78,639 | ||||||||||||||
| Balance, December 31, 2007 |
4,863,242 | 972,648 | 3,979,717 | (432,522 | ) | 63,671,589 | 68,191,432 | |||||||||||||
| Net income |
— | — | — | — | 8,273,767 | 8,273,767 | ||||||||||||||
| Dividends paid ($0.77 per share) |
— | — | — | — | (3,740,417 | ) | (3,740,417 | ) | ||||||||||||
| Options exercised, including tax benefit of $64,283 |
19,238 | 3,848 | 148,180 | — | — | 152,028 | ||||||||||||||
| Shares repurchased |
(33,184 | ) | (6,637 | ) | (686,101 | ) | — | (692,738 | ) | |||||||||||
| Stock compensation expense |
88,594 | 88,594 | ||||||||||||||||||
| Other comprehensive loss, net |
— | — | — | (873,028 | ) | — | (873,028 | ) | ||||||||||||
| Balance, December 31, 2008 |
4,849,296 | 969,859 | 3,530,390 | (1,305,550 | ) | 68,204,939 | 71,399,638 | |||||||||||||
| Net income |
— | — | — | — | 7,138,974 | 7,138,974 | ||||||||||||||
| Dividends paid ($0.81 per share) |
— | — | — | — | (3,931,530 | ) | (3,931,530 | ) | ||||||||||||
| Options exercised, including tax benefit of $36,200 |
36,391 | 7,278 | 478,470 | — | — | 485,748 | ||||||||||||||
| Shares repurchased |
(47,500 | ) | (9,500 | ) | (1,056,074 | ) | — | (1,065,574 | ) | |||||||||||
| Stock compensation expense |
134,952 | 134,952 | ||||||||||||||||||
| Other comprehensive loss, net |
— | — | — | 435,256 | — | 435,256 | ||||||||||||||
| Balance, December 31, 2009 |
4,838,187 | $ | 967,637 | 3,087,738 | (870,294 | ) | 71,412,383 | $ | 74,597,464 | |||||||||||
The accompanying notes are an integral part of these statements.
7
CITIZENS HOLDING COMPANY
Consolidated Statements of Cash Flows
Years Ended December 31, 2009, 2008, and 2007
| 2009 | 2008 | 2007 | ||||||||||
| Cash flows from operating activities |
||||||||||||
| Net income |
$ | 7,138,974 | $ | 8,273,767 | $ | 6,914,234 | ||||||
| Adjustments to reconcile net income to net cash provided by operating activities |
||||||||||||
| Depreciation |
1,376,513 | 1,306,676 | 1,068,377 | |||||||||
| Amortization of intangibles |
184,691 | 434,385 | 537,503 | |||||||||
| Amortization of premiums and accretion of discounts on investment securities |
2,873,072 | 622,336 | 461,914 | |||||||||
| Stock compensation expense |
85,020 | 50,370 | 41,994 | |||||||||
| Provision for loan losses |
3,013,455 | 1,223,939 | 784,120 | |||||||||
| Realized investment securities (gains) losses |
(573,385 | ) | (8,383 | ) | (29,339 | ) | ||||||
| Deferred income tax benefit |
(879,788 | ) | (192,426 | ) | (286,890 | ) | ||||||
| Net writedown on Other Real Estate Owned |
1,016,854 | — | — | |||||||||
| Earnings from unconsolidated subsidiary |
(67,961 | ) | (91,006 | ) | (112,330 | ) | ||||||
| (Increase) decrease in accrued interest |
217,079 | (1,055,596 | ) | (194,627 | ) | |||||||
| Increase in cash value life insurance |
(790,877 | ) | (298,980 | ) | (846,919 | ) | ||||||
| (Increase) decrease in accrued interest payable |
(586,690 | ) | (549,553 | ) | 761,342 | |||||||
| Increase in deferred compensation liability |
612,713 | 267,691 | 290,157 | |||||||||
| Net change in other operating assets and liabilities |
(3,799,105 | ) | 197,674 | 284,641 | ||||||||
| Net cash provided by operating activities |
9,820,565 | 10,180,894 | 9,674,177 | |||||||||
| Cash flows from investing activities |
||||||||||||
| Proceeds from maturities of securities available-for-sale |
154,364,170 | 18,956,984 | 15,130,290 | |||||||||
| Proceeds from sales of securities available-for-sale |
24,524,623 | 22,985,090 | 22,916,630 | |||||||||
| Purchases of investment securities available-for-sale |
(240,430,083 | ) | (126,739,986 | ) | (53,312,896 | ) | ||||||
| Net change in Shay Investments |
— | 69,044,931 | (55,835,283 | ) | ||||||||
| Net change in sweep accounts |
— | (74,963,424 | ) | 62,195,941 | ||||||||
| Net change in securities sold under agreement to repurchase |
73,311,958 | 41,441,052 | — | |||||||||
| Purchases of bank premises, furniture, fixtures and equipment |
(2,318,540 | ) | (4,199,960 | ) | (3,250,718 | ) | ||||||
| Sale of real estate acquired by foreclosure |
1,010,890 | 388,069 | 2,263,187 | |||||||||
| Net increase in interest bearing deposits with other banks |
(4,231,112 | ) | (388,673 | ) | (216,127 | ) | ||||||
| Net decrease (increase) in federal funds sold |
— | 900,000 | 14,300,000 | |||||||||
| Redemption of Federal Home Loan Bank Stock |
— | 544,300 | 869,000 | |||||||||
| Purchase of Federal Home Loan Bank Stock |
(435,100 | ) | — | — | ||||||||
| Net (increase) decrease in loans |
(22,495,987 | ) | (59,149,746 | ) | (1,130,628 | ) | ||||||
| Cash paid for acquisition of subsidiary stock |
— | — | (2,994,671 | ) | ||||||||
| Net cash (used) provided by investing activities |
(16,699,181 | ) | (111,181,363 | ) | 934,725 | |||||||
8
CITIZENS HOLDING COMPANY
Consolidated Statements of Cash Flows
Years Ended December 31, 2009, 2008, and 2007
2 of 2
| 2009 | 2008 | 2007 | ||||||||||
| Cash flows from financing activities |
||||||||||||
| Net increase (decrease) in deposits |
$ | 23,875,163 | $ | 68,695,118 | $ | 5,385,048 | ||||||
| Net increase (decrease) in federal funds |
(21,000,000 | ) | 16,800,000 | 4,200,000 | ||||||||
| Proceeds from exercise of stock options |
485,748 | 152,028 | 26,555 | |||||||||
| Repurchase of company stock |
(1,065,574 | ) | (692,738 | ) | (3,482,153 | ) | ||||||
| Excess tax benefit on stock option exercises |
36,200 | 8,641 | 10,927 | |||||||||
| Dividends paid to stockholders |
(3,931,530 | ) | (3,740,417 | ) | (3,576,655 | ) | ||||||
| Federal Home Loan Bank advance proceeds |
— | 30,000,000 | — | |||||||||
| Federal Home Loan Bank advance payments |
(5,000,000 | ) | — | (10,000,000 | ) | |||||||
| Net cash provided (used) by financing activities |
(6,599,993 | ) | 111,222,632 | (7,436,278 | ) | |||||||
| Net increase (decrease) in cash and due from banks |
(13,478,609 | ) | 10,222,163 | 3,172,624 | ||||||||
| Cash and due from banks, beginning of year |
28,844,221 | 18,622,058 | 15,449,434 | |||||||||
| Cash and due from banks, end of year |
$ | 15,365,612 | $ | 28,844,221 | $ | 18,622,058 | ||||||
| Supplemental disclosures of cash flow information |
||||||||||||
| Cash paid for |
||||||||||||
| Interest |
$ | 11,922,341 | $ | 14,324,357 | $ | 16,001,411 | ||||||
| Income taxes |
$ | 1,878,868 | $ | 2,057,992 | $ | 1,967,770 | ||||||
| Noncash disclosures |
||||||||||||
| Real estate acquired by foreclosure |
$ | 2,013,641 | $ | 1,822,423 | $ | 1,601,886 | ||||||
| Change in unrealized gain (loss) on investments, net of taxes |
$ | 794,769 | $ | (867,772 | ) | $ | 108,204 | |||||
The accompanying notes are an integral part of these financial statements.
9
CITIZENS HOLDING COMPANY
Years Ended December 31, 2009, 2008 and 2007
NOTES TO CONSOLIDATED FINANCIAL STATEMENTS
Note 1. Summary of Significant Accounting Policies
Basis of Financial Statement Presentation
The accounting policies of Citizens Holding Company and subsidiary conform to accounting principles generally accepted in the United States of America and to general practices within the banking industry. The consolidated financial statements of Citizens Holding Company include the accounts of its wholly-owned subsidiary, The Citizens Bank of Philadelphia, Mississippi (collectively referred to as the “Company”). All significant intercompany transactions have been eliminated in consolidation. As the result of a 1-for-1,000 reverse stock split on January 2, 2007, Citizens Holding Company became the sole owner of The Citizens Bank of Philadelphia, Mississippi.
Nature of Business
The Citizens Bank of Philadelphia, Mississippi (the “Bank”) operates under a state bank charter and provides general banking services. As a state bank, the Bank is subject to regulations of the Mississippi Department of Banking and Consumer Finance and the Federal Deposit Insurance Corporation. Citizens Holding Company is subject to the regulations of the Federal Reserve. The area served by the Bank is Neshoba County, Mississippi and the immediately surrounding areas. In 2008 the Bank expanded into south Mississippi with its new branch in Hattiesburg. Services are provided at several branch offices. In 2009, the Bank opened a loan production office in Biloxi, Mississippi.
Estimates
The preparation of financial statements in conformity with accounting principles generally accepted in the United States of America requires management to make estimates and assumptions that affect the reported amounts of assets and liabilities and disclosure of contingent assets and liabilities at the date of the financial statements and the reported amounts of revenues and expenses during the reporting period. Actual results could differ from those estimates.
Estimates that are particularly susceptible to significant change relate to the determination of the allowance for loan losses and the valuation of real estate acquired in connection with foreclosures or in satisfaction of loans. In connection with the determination of the allowance for loan losses and valuation of foreclosed real estate, management obtains independent appraisals for significant properties.
10
CITIZENS HOLDING COMPANY
Years Ended December 31, 2009, 2008 and 2007
NOTES TO CONSOLIDATED FINANCIAL STATEMENTS
Note 1. Continued
While management uses available information to recognize losses on loans and foreclosed real estate, future additions to the allowance or adjustments to the valuation may be necessary based on changes in local economic conditions. In addition, regulatory agencies, as an integral part of their examination process, periodically review the Company’s allowance for loan losses and valuations of foreclosed real estate. Such agencies may require the Company to recognize additions to the allowance or to make adjustments to the valuation based on their judgments about information available to them at the time of their examination. Due to these factors, it is reasonably possible that the allowance for loan losses and valuation of foreclosed real estate may change materially in the near term.
Cash and Due from Banks
For the purpose of reporting cash flows, cash and due from banks include cash on hand and demand deposits. Cash flows from loans originated by the Company, deposits, and federal funds purchased and sold are reported net in the statement of cash flows. The Company is required to maintain average reserve balances with the Federal Reserve Bank based on a percentage of deposits. The average reserve required by the Federal Reserve Bank at December 31, 2009 and 2008 was $3,187,000 and $2,945,000, respectively.
Interest-bearing deposits with other banks mature within one year and are carried at cost.
At December 31, 2009 and 2008, the Company had deposits in financial institutions in excess of federally insured limits. Management monitors the soundness of the financial institutions and believes there is minimal risk.
Investment Securities
In accordance with Financial Accounting Standards Board ASC Section 320-10-65, Investments-Debt and Equity Securities: Overall: Transition and Open Effective Date Information, securities are classified as “available-for-sale,” “held-to-maturity” or “trading.” Fair values for securities are based on quoted market prices where available. If quoted market prices are not available, fair values are based on quoted market prices of comparable instruments. Gains or losses on the sale of securities are determined using the specific identification method. Currently, the Company has no held-to-maturity or trading securities.
Securities Available-for-Sale
Securities available-for-sale are reported at fair value with unrealized gains and losses reported as a separate component of stockholders’ equity. Securities that are held for indefinite periods of time or used as part of the Company’s asset/liability management strategy and that may be sold in response to interest rate changes, changes in prepayment risk, the need to increase regulatory capital and other similar factors are classified as available-for-sale.
11
CITIZENS HOLDING COMPANY
Years Ended December 31, 2009, 2008 and 2007
NOTES TO CONSOLIDATED FINANCIAL STATEMENTS
Note 1. Continued
Realized gains or losses, determined on the basis of the cost of specific securities sold, are included in earnings. The amortization of premiums and accretion of discounts are recognized in interest income.
Loans and Allowance for Loan Losses
Loans receivable that management has the intent and ability to hold for the foreseeable future or until maturity or payoff are reported at the principal amount outstanding, net of unearned discounts and unearned finance charges. The Company has no loans held-for-sale.
Loan origination and commitment fees and direct loan origination costs attributable to loans held with a maturity of more than one year are recognized as income or expense over the life of the loan.
Unearned discounts on installment loans are recognized as income over the terms of the loans by a method that approximates the interest method. Unearned finance charges and interest on commercial loans are recognized based on the principal amount outstanding. For all other loans, interest is accrued daily on the outstanding balances. For impaired loans, interest is discontinued on a loan when management believes, after considering collection efforts and other factors, that the borrower’s financial condition is such that collection of interest is doubtful. Cash collections on impaired loans are credited to the loan receivable balance, and no interest income is recognized on those loans until the principal balance has been collected. The Company generally discontinues the accrual of interest income when a loan becomes 90 days past due as to principal or interest; however, management may elect to continue the accrual when the estimated net realizable value of collateral is sufficient to cover the principal balance and the accrued interest. Interest income on other nonaccrual loans is recognized only to the extent of interest payments. Upon discontinuance of the accrual of interest on a loan, any previously accrued but unpaid interest is reversed against interest income.
A loan is impaired when management determines that it is probable the Company will be unable to collect all contractual principal and interest payments due in accordance with the terms of the loan agreement. Impaired loans are measured based on the present value of expected future cash flows discounted at the loan’s effective interest rate or, as a practical expedient, at the loan’s observable market price or the fair value of the collateral if the loan is collateral dependent. The amount of impairment, if any, and any subsequent changes are included in the allowance for loan losses.
12
CITIZENS HOLDING COMPANY
Years Ended December 31, 2009, 2008 and 2007
NOTES TO CONSOLIDATED FINANCIAL STATEMENTS
Note 1. Continued
The allowance for loan losses is established through a provision for loan losses charged against net income. Loans determined to be uncollectible are charged against the allowance for loan losses, and subsequent recoveries, if any, are credited to the allowance. The allowance represents an amount, which, in management’s judgment, will be adequate to absorb estimated probable losses on existing loans that may become uncollectible. In order to determine an adequate level of allowance, management utilizes a model that calculates an adequate allowance for loan loss by applying the historical charge-off percentage by loan segment over a 20 quarter period of time to the current loan balances in the corresponding loan segment. Additionally, specific reserves on an individual loan basis may be applied in addition to the allowance calculated using the model. This specific reserve is determined by an extensive review of the borrower’s credit history, capacity to pay, adequacy of collateral and general economic conditions related to the respective loan. This specific reserve will stay in place until such time that the borrower’s obligation is satisfied or the loan is improved greatly.
Large groups of small-balance homogenous loans are collectively evaluated for impairment. Accordingly, the Company does not separately identify individual consumer and residential loans for impairment disclosures.
Company Premises, Furniture, Fixtures and Equipment
The Company’s premises, furniture, fixtures and equipment are stated at cost less accumulated depreciation computed primarily by straight-line methods over the estimated useful lives of the assets. Costs of major additions and improvements are capitalized. Expenditures for maintenance and repairs are charged to expense as incurred.
Real Estate Acquired by Foreclosure
Real estate acquired by foreclosure consists of properties repossessed by the Company on foreclosed loans. These assets are stated at fair value at the date acquired less estimated costs to sell. Losses arising from the acquisition of such property are charged against the allowance for loan losses. Declines in value resulting from subsequent revaluation of the property or losses resulting from disposition of such property are expensed as incurred. Revenue and expenses from operations of other real estate owned are reflected as other income (expense).
13
CITIZENS HOLDING COMPANY
Years Ended December 31, 2009, 2008 and 2007
NOTES TO CONSOLIDATED FINANCIAL STATEMENTS
Note 1. Continued
Cash Value of Life Insurance
The Company has purchased life insurance policies on certain employees and directors. Certain of such policies were acquired to fund deferred compensation arrangements with employees and directors. The cash surrender value of the Company owned policies is carried at the actual cash surrender value of the policy at the balance sheet date.
Intangible Assets
Intangible assets include core deposits purchased and goodwill. Core deposit intangibles are amortized on a straight-line basis over their estimated economic lives ranging from 5 to 10 years. Goodwill and other intangible assets with indefinite lives are not amortized, but are tested at least annually for impairment. Fair values are determined based on market valuation multiples for the Company and comparable businesses based on the assets and cash flow of the Bank, the Company’s only reportable segment. If impairment has occurred, the goodwill or other intangible asset is reduced to its estimated fair value through a charge to expense.
Investment – Insurance Company
The Company accounts for its investment in New South Life Insurance Company (“New South”), a 25% owned affiliate, using the equity method of accounting. The Company’s share of the net income of New South is recognized as income in the Company’s income statement and added to the investment account, and dividends received from New South are used to reduce the investment account. New South has not paid dividends during the years ended December 31, 2009 and 2008.
The fiscal year of New South ends on November 30, and the Company follows the practice of recognizing the net income of New South on that basis.
The investment in New South, which is included in other assets, totaled $2,195,493 and $2,127,532 at December 31, 2009 and 2008, respectively. Income from the investment for the years ended December 31, 2009, 2008, and 2007 included in other income totaled $67,961, $91,006 and $112,330, respectively.
Trust Assets
Assets held by the trust department of the Company in fiduciary or agency capacities are not assets of the Company and are not included in the consolidated financial statements.
14
CITIZENS HOLDING COMPANY
Years Ended December 31, 2009, 2008 and 2007
NOTES TO CONSOLIDATED FINANCIAL STATEMENTS
Note 1. Continued
Income Taxes
Provisions for income taxes are based on taxes payable or refundable for the current year and deferred taxes on temporary differences between the tax bases of assets and liabilities and their reported amounts in the consolidated financial statements. Deferred tax assets and liabilities are included in the financial statements at currently enacted income tax rates applicable to the period in which the deferred tax assets and liabilities are expected to be realized or settled as described in FASB ASC Topic 740, Income Taxes. As changes in tax laws or rates are enacted, deferred tax assets and liabilities are adjusted through the provision for income taxes. Deferred tax assets are reduced by a valuation allowance when, in the opinion of management, it is more likely than not that some portion or all of the deferred tax assets will not be realized.
Comprehensive Income
Comprehensive income includes net earnings reported in the statements of income and changes in unrealized gain (loss) on securities available-for-sale reported as a component of stockholders’ equity. Unrealized gain (loss) on securities available-for-sale, net of related income taxes, is the only component of accumulated other comprehensive income for the Company.
Net Income Per Share
Basic net income per share is computed by dividing net income by the weighted average number of common shares outstanding during the year. Diluted net income per share is based on the weighted average number of shares of common stock outstanding for the periods, including the dilutive effect of the Company’s outstanding stock options. The effect of the dilutive shares for the years 2009, 2008 and 2007 is illustrated in the following table.
| 2009 | 2008 | 2007 | |||||||
| Basic weighted average shares outstanding |
4,854,919 | 4,860,095 | 4,913,946 | ||||||
| Dilutive effect of stock options |
58,708 | 35,416 | 50,529 | ||||||
| Dilutive weighted average shares outstanding |
4,913,627 | 4,895,511 | 4,964,475 | ||||||
| Net income |
$ | 7,138,974 | $ | 8,273,767 | $ | 6,914,234 | |||
| Net income per share-basic |
$ | 1.47 | $ | 1.70 | $ | 1.41 | |||
| Net income per share-diluted |
$ | 1.45 | $ | 1.69 | $ | 1.39 | |||
15
CITIZENS HOLDING COMPANY
Years Ended December 31, 2009, 2008 and 2007
NOTES TO CONSOLIDATED FINANCIAL STATEMENTS
Note 1. Continued
Stock-Based Compensation
At December 31, 2009, 2008 and 2007, the Company had two stock-based compensation plans, which are the 1999 Employees’ Long-Term Incentive Plan and the 1999 Directors’ Stock Compensation Plan. As of January 1, 2006, the Company began accounting for these plans under the recognition and measurement principles of fair value set forth in FASB ASC Topic 718, Compensation-Stock Compensation, (“ASC 718”) which replaced FASB 123R, Share-Based Payment, and FASB ASC Section 718-10-S99, Compensation-Stock Compensation: Overall: SEC Materials, formerly Staff Accounting Bulletin No. 107. ASC 718-10-S99 provides guidance related to share-based payments transactions, including valuation methods (including assumptions such as expected volatility and expected term), the classification of compensation expense, non-GAAP financial measures, first time adoption of ASC 718 in an interim period and disclosure in Management’s Discussion and Analysis subsequent to the adoption of ASC 718.
To determine the expected term of the options granted, the Company chose to use the “simplified” method for “plain vanilla” options as detailed in ASC 718-10-S99 for those options granted prior to December 31, 2007. The Company determined that those options granted comply with the requirements under ASC 718 and used this method for estimating the expected term of the options granted until December 31, 2007. Beginning with options granted after that date, the Company will use the methods prescribed by ASC 718. Volatility is determined by using the standard deviation of the differences of the closing stock price of the Company’s common stock as quoted on the American Stock Exchange (through November 15, 2006, the date of the transfer of the listing of the Corporation’s common stock to The NASDAQ Global Market) or The NASDAQ Global Market (since November 16, 2006) on or about the 15th of each month starting January 15, 2002. Stock prices prior to that date experienced volatility that is not representative of the volatility experienced since that time and therefore are not used in this calculation.
Although the option grants are not subject to an explicit vesting schedule, the Company recognizes that the restriction on exercising options before six months and one day after the grant date constitutes a de facto vesting schedule and must be considered when applying ASC 718. ASC 718 states that a requisite service period may be explicit, implicit or derived and that an implicit service period is one that may be inferred from an analysis of the award’s terms. Based on its analysis of the terms of the option awards, management concluded that the restriction on exercising options until six months and one day have passed since the date of grant constitutes a service period under ASC 718 and the compensation costs should be amortized over this six month period.
On April 29, 2009, the members of the Board of Directors were granted a total of 13,500 options as specified in the 1999 Directors’ Stock Compensation Plan. These options were granted at an exercise price of $21.75 per option, which was the closing price of Citizens Holding Company stock on that day. These options were first exercisable on October 30, 2009 and must be exercised no later than April 29, 2019. No options were granted to officers during 2009.
16
CITIZENS HOLDING COMPANY
Years Ended December 31, 2009, 2008 and 2007
NOTES TO CONSOLIDATED FINANCIAL STATEMENTS
Note 1. Continued
On April 23, 2008, the members of the Board of Directors were granted a total of 13,500 options as specified in the 1999 Directors’ Stock Compensation Plan and 1,500 options were granted to an officer under the 1999 Employees’ Stock Incentive Plan. These options were granted at an exercise price of $18.00 per option, which was the closing price of Citizens Holding Company stock on that day. These options are first exercisable on October 24, 2008 and must be exercised no later than April 23, 2018.
On April 25, 2007, the members of the Board of Directors were granted a total of 13,500 options as specified in the 1999 Directors’ Stock Compensation Plan. These options were granted at an exercise price of $22.00 per option, which was the closing price of Citizens Holding Company stock on that day. These options were first exercisable on October 26, 2007 and must be exercised no later than April 25, 2017. No options were granted to officers during 2007.
The fair value of each option granted is estimated on the date of the grant using the Black-Scholes option-pricing model. The following assumptions were used in estimating the fair value of the options granted in 2009, 2008 and 2007.
| DIRECTORS | ||||||||||||
| Assumption |
2009 | 2008 | 2007 | |||||||||
| Dividend yield |
3.7 | % | 4.1 | % | 3.3 | % | ||||||
| Risk-free interest rate |
2.23 | % | 3.15 | % | 4.76 | % | ||||||
| Expected life |
7.8 years | 8.5 years | 5.3 years | |||||||||
| Expected volatility |
64.24 | % | 44.82 | % | 34.88 | % | ||||||
| Calculated value per option |
$ | 9.96 | $ | 5.92 | $ | 6.23 | ||||||
| Forfeitures |
0 | % | 0 | % | 0 | % | ||||||
| OFFICERS | ||||||||||||
| Assumption |
2009 | 2008 | 2007 | |||||||||
| Dividend yield |
n/a | 4.1 | % | n/a | ||||||||
| Risk-free interest rate |
n/a | 3.15 | % | n/a | ||||||||
| Expected life |
n/a | 6.8 years | n/a | |||||||||
| Expected volatility |
n/a | 44.82 | % | n/a | ||||||||
| Calculated value per option |
n/a | $ | 5.76 | n/a | ||||||||
| Forfeitures |
n/a | 0 | % | n/a | ||||||||
17
CITIZENS HOLDING COMPANY
Years Ended December 31, 2009, 2008 and 2007
NOTES TO CONSOLIDATED FINANCIAL STATEMENTS
Note 1. Continued
Advertising Costs
Advertising costs are charged to expense when incurred. Advertising expense was $644,820, $772,546 and $551,998 for the years ended December 31, 2009, 2008 and 2007, respectively.
Fair Value of Financial Instruments
SFAS No. 107, Disclosures About Fair Value of Financial Instruments (“SFAS 107”), codified in ASC Topic 825, requires disclosure of financial instruments’ fair values, as well as the methodology and significant assumptions used in estimating fair values. These requirements have been incorporated in Note 17. In cases where quoted market prices are not available, fair values are based on estimates using present value or other valuation techniques. Those techniques are significantly affected by the assumptions used, including the discount rate and estimates of future cash flows. In that regard, the derived fair value estimates cannot be substantiated by comparison to independent markets and, in many cases, could not be realized in immediate settlement of the instrument. ASC Topic 825 excludes certain financial instruments from its disclosure requirements. Accordingly, the aggregate fair value amounts presented do not represent the underlying value of the Company and may not be indicative of amounts that might ultimately be realized upon disposition or settlement of those assets and liabilities.
Recent Accounting Pronouncements
Effective January 1, 2008, the Company adopted the provisions of Statement of Financial Accounting Standards No. 157, Fair Value Measurements and Disclosures, (“SFAS 157”), as codified in ASC Topic 820. This statement defines fair value, establishes a hierarchal disclosure framework for measuring fair value, and requires expanded disclosures about fair value measurements. The provisions of this statement apply to all financial instruments that are being measured and reported on a fair value basis. The partial adoption of SFAS 157 did not have any impact on our financial position or results of operations. Effective January 1, 2009, the Company adopted the remaining provisions of SFAS 157 that were delayed by the issuance of FSP FAS 157-2, Effective Date of SFAS 157. The adoption of the remaining provisions of ASC 820, relating to nonfinancial assets and liabilities, did not have a material impact on our financial position or results of operations.
In April 2009, the FASB issued Staff Position No. 141(R)-1, Accounting for Assets Acquired and Liabilities Assumed in a Business Combination That Arise from Contingencies (“FSP 141(R)-1”), codified in ASC 805. FSP 141(R)-1 amends and clarifies existing guidance to address the initial recognition and measurement of an asset acquired or a liability assumed in a business combination that arises from a contingency provided the asset or liability’s fair value on the date of acquisition can be determined. When the fair value, at the acquisition date, of an asset acquired or liability assumed cannot be determined, FSP 141(R)-1 requires using the guidance under ASC 450, “Contingencies”. FSP 141(R)-1 is effective for assets or liabilities arising from contingencies in business combinations that occur following the start of the first annual reporting period beginning on or after December 15, 2008. The adoption of FSP 141(R)-1 will impact the Company’s accounting for and reporting of acquisitions completed after January 1, 2009.
18
CITIZENS HOLDING COMPANY
Years Ended December 31, 2009, 2008 and 2007
NOTES TO CONSOLIDATED FINANCIAL STATEMENTS
Note 1. Continued
In December 2007, the FASB issued SFAS 160, Non-controlling Interests in Consolidated Financial Statements-an Amendment of ARB 51, (“SFAS 160”), codified in ASC Topic 810. This standard amends ARB No. 51, Consolidated Financial Statements, to establish accounting and reporting standards for the noncontrolling interest in a subsidiary and for the deconsolidation of a subsidiary. The Company adopted the provisions of SFAS 160 effective January 1, 2009. The adoption of this statement did not have a material effect on our financial position or results of operations.
In June 2009, the FASB issued SFAS 166, Accounting for Transfers of Financial Assets-an Amendment of FAS 140, (“SFAS 166”), codified in ASC Topic 860. The objective of this standard is to provide implementation guidance on accounting for a transfer of a financial asset and repurchase financing. The amendment presumes that an initial transfer of a financial asset and a repurchase financing are considered part of the same arrangement (linked transaction) under SFAS 166. However, if certain criteria are met, the initial transfer and repurchase financing shall not be evaluated as a linked transaction and shall not be evaluated under FASB 166. We do not believe that the adoption of this statement will have a material effect on our financial position or results of operations.
In March 2008, the FASB issued SFAS 161, Disclosure about Derivative Instruments and Hedging Activities-an Amendment of FAS 153, (“SFAS 161”), codified in ASC Topic 815. This update changes the existing disclosure requirements. SFAS 161 now requires enhanced disclosures about an entity’s derivative and hedging activities. The Company adopted SFAS 161 effective January 1, 2009. The adoption of this statement did not have a material effect on our financial position or results of operations.
In April 2009, the FASB issued three FASB Staff Positions (“FSP”):
| ¨ |
FSP FAS 157-4 as codified in ASC Section 820-10-65, Fair Value Measurements and Disclosures: Overall: Transition and Open Effective Date Information | |
| ¨ |
FSP FAS 115-2 and 124-2 as codified in ASC Section 320-10-65, Investments – Debt and Equity Securities: Overall: Transition and Open Effective Date Information | |
| ¨ |
FSP FAS 107-1 and APB 28-1 as codified in ASC Section 825-10-65, Financial Instruments: Overall: Transition and Open Effective Date Information | |
19
CITIZENS HOLDING COMPANY
Years Ended December 31, 2009, 2008 and 2007
NOTES TO CONSOLIDATED FINANCIAL STATEMENTS
Note 1. Continued
FSP FAS 157-4 indicates that when determining the fair value of an asset or liability that is not a Level 1 fair value measurement, an entity should assess whether the volume and level of activity for the asset or liability have significantly decreased when compared with normal market conditions. If the entity concludes that there has been a significant decrease in the volume and level of activity, a quoted price (e.g., observed transaction) may not be determinative of fair value and may require a significant adjustment. FSP FAS 115-2 and 124-2 modifies the requirements for recognizing other-than-temporarily impaired debt securities and changes the existing impairment model for such securities. These statements also modify the presentation of other-than-temporary impairment losses and increase the frequency of and expand already required disclosures about other-than-temporary impairment for debt and equity securities. FSP FAS 107-1 and APB 28-1 requires publicly traded companies to disclose the fair value of financial instruments within the scope of ASC 825 in interim financial statements, adding to the current requirement to make those disclosures in annual financial statements. This staff position also requires that companies disclose the method or methods and significant assumptions used to estimate the fair value of financial instruments and a discussion of changes, if any, in the method or methods and significant assumptions during the period. The Company adopted the provisions these staff positions effective for the second quarter ended June 30, 2009. The adoption of these staff positions did not have a material effect on our financial position or results of operations.
In May 2009, the FASB issued FAS 165, Subsequent Events (“FAS 165”), codified in ASC Topic 855. This statement requires management to evaluate subsequent events through the date the financial statements are either issued, or available to be issued. Companies will be required to disclose the date through which subsequent events have been evaluated. The Company adopted the provisions of FAS 165 effective in June 2009. The adoption of this statement did not have a material effect on our financial position or results of operations. The Company evaluated subsequent events through the date of issuance of the financial statements.
In June 2009, the FASB issued FAS No.168, The FASB Accounting Standards Codification and the Hierarchy of Generally Accepted Accounting Principles — a replacement of FASB Statement No. 162, which created ASC Topic 105-10. This codification is the source of authoritative GAAP recognized by the FASB to be applied by nongovernmental entities. Rules and interpretive releases of the SEC under authority of federal securities laws are also sources of authoritative GAAP for SEC registrants. The Company adopted the provisions of ASC Topic 105-10 effective September 30, 2009. The adoption of this statement did not have a material effect on our financial position or results of operations.
20
CITIZENS HOLDING COMPANY
Years Ended December 31, 2009, 2008 and 2007
NOTES TO CONSOLIDATED FINANCIAL STATEMENTS
Note 1. Continued
In August 2009, the FASB issued Update No. 2009-05, Fair Value Measurements and Disclosures, which provides additional guidance on the measurement of liabilities at fair value. Specifically, when a quoted price in an active market for the identical liability is not available, the new standard requires that the fair value of a liability be measured using one or more of the valuation techniques that should maximize the use of relevant observable inputs and minimize the use of unobservable inputs. In addition, an entity is not required to include a separate input or adjustment to other inputs relating to the existence of a restriction that prevents the transfer of a liability. The Company adopted this standard effective October 1, 2009 and the adoption did not have a material impact on our consolidated financial statements.
In January 2010, the FASB issued Update No. 2010-06, Fair Value Measurement and Disclosures, which requires the addition of new disclosures and clarifies existing disclosure requirements already included in the guidance for fair value measurements. The new disclosures related to significant transfers in and out of Level 1 and Level 2 fair value measurements and the reasons for the transfers, as well as the clarifications of existing disclosures are effective for interim or annual reporting periods beginning after December 15, 2009. The new disclosures about purchases, sales, issuances and settlements in the roll forward of activity in Level 3 fair value measurements are effective for interim or annual reporting periods beginning after December 15, 2010. This standard clarifies and increases the disclosure requirements for fair value measurements and will not have a material effect on our financial position, results of operations or stockholders’ equity.
In December 2008, the FASB issued FAS FSP No. 132(R)-1, Employers’ Disclosures about Postretirement Benefit Plan Assets (“FSP 132-1”), codified in ASC 715. FSP 132-1 requires further disclosures about the fair value measurements of an employer’s benefit plan assets, including disclosures about the following: how investment allocation decisions are made, including the factors material to an understanding of investment policies and strategies; major categories of plan assets; information about inputs and valuation techniques, including the fair value hierarchy classifications, as defined by ASC 820, Fair Value Measurements and Disclosures, of the major categories of plan assets; the effect of fair value measurements using significant unobservable inputs (Level 3 inputs) on changes in plan assets; and significant concentrations of risk within plan assets. FSP 132-1 is effective for fiscal years beginning on or after December 15, 2009, with early adoption permitted. The Company is currently in the process of evaluating the impact of adopting FSP 132-1 on its financial statements.
In January 2009, the FASB issued Staff Position No. EITF 99-20-1, Amendments to the Impairment Guidance of EITF Issue No. 99-20 (“EITF 99-20-1”), as codified in ASC 325, which amends the existing guidance to achieve a more consistent determination of whether an other-than-temporary impairment has occurred. EITF 99-20-1 also retains and emphasizes the objective of an other-than-temporary impairment assessment and the related disclosure requirements. EITF 99-20-1 was effective for interim and annual reporting periods ending after December 15, 2008, and was to be applied prospectively. Retroactive application was not permitted. The Company adopted EITF 99-20-1 on January 1, 2009 with no material impact on its financial statements.
21
CITIZENS HOLDING COMPANY
Years Ended December 31, 2009, 2008 and 2007
NOTES TO CONSOLIDATED FINANCIAL STATEMENTS
Note 1. Continued
Securities Sold Under Agreements to Repurchase:
Securities sold under agreements to repurchase are accounted for as collateralized financing transactions and are recorded at the amounts at which the securities were sold. Securities, generally U. S. Government, federal agency and state county municipal securities, pledged as collateral under these financing arrangements cannot be sold or re-pledged by the secured party.
Reclassifications
Certain information for 2007 and 2008 has been reclassified to conform to the financial presentation for 2009. Such reclassifications had no effect on net income or stockholders’ equity.
22
CITIZENS HOLDING COMPANY
Years Ended December 31, 2009, 2008 and 2007
NOTES TO CONSOLIDATED FINANCIAL STATEMENTS
Note 2. Intangible Assets
In 2002, the Company acquired CB&T Capital Corporation, a one-bank holding company, whose wholly-owned subsidiary was Citizens Bank & Trust Company in Louisville, Mississippi. In addition to the intangible assets related to the purchase of CB&T Capital Corporation, the Company recorded intangible assets from the purchase of branches located in Kosciusko, Scooba, Forest and Decatur, Mississippi in conjunction with the purchase of Three D Mortgage Company. The following table details the goodwill associated with each purchase, which is no longer being amortized, in accordance with the provisions of FASB ASC Topic 350, Intangibles- Goodwill and Other.
| Purchase |
Total | Life to Date Amortization |
Unamortized Balance | ||||||
| Kosciusko Branch |
$ | 605,122 | $ | 309,285 | $ | 295,837 | |||
| Scooba Branch |
400,000 | 180,000 | 220,000 | ||||||
| Three D Mortgage Company |
76,408 | 10,188 | 66,220 | ||||||
| CB&T Capital Corporation |
2,567,600 | — | 2,567,600 | ||||||
| Total goodwill |
$ | 3,649,130 | $ | 499,473 | $ | 3,149,657 | |||
The Company has also allocated intangible assets to be recognized as core deposit intangibles on the acquisition of the Forest and Decatur branches and the CB&T Capital Corporation acquisition. These transactions are detailed as follows:
| Purchase |
Total | Current Year Amortization |
Life to Date Amortization |
Unamortized Balance | ||||||||
| Decatur and Forest branches |
$ | 2,487,574 | $ | — | $ | 2,487,574 | $ | — | ||||
| CB&T Capital Corporation |
1,846,909 | 184,691 | 1,400,572 | 446,337 | ||||||||
| Total core deposit intangible |
$ | 4,334,483 | $ | 184,691 | $ | 3,888,146 | $ | 446,337 | ||||
Total amortization expense related to all intangible assets for the years ended December 31, 2009, 2008 and 2007 was $184,691, $434,386 and $537,503, respectively. Estimated amortization expense attributable to core deposit intangible assets for the next five years is detailed in the table below. In the last three years, the Company has not added any intangibles.
| Year Ending December 31, |
Amount | ||
| 2010 |
$ | 184,691 | |
| 2011 |
184,691 | ||
| 2012 |
76,955 | ||
| 2013 |
— | ||
| 2014 |
— | ||
23
CITIZENS HOLDING COMPANY
Years Ended December 31, 2009, 2008 and 2007
NOTES TO CONSOLIDATED FINANCIAL STATEMENTS
Note 3. Investment Securities
The amortized cost and fair value of investment securities at December 31, 2009 and 2008 are as follows:
| 2009 |
Amortized Cost |
Gross Unrealized Gains |
Gross Unrealized Losses |
Fair Value | ||||||||
| Securities available-for-sale |
||||||||||||
| Obligations of U.S. Government agencies |
$ | 145,510,118 | $ | 151,135 | $ | 2,339,021 | $ | 143,322,232 | ||||
| Mortgage-backed securities |
67,369,229 | 2,711,951 | 96,578 | 69,984,602 | ||||||||
| Other investments |
106,912,680 | 1,234,642 | 3,050,157 | 105,097,165 | ||||||||
| Total |
$ | 319,792,027 | $ | 4,097,728 | $ | 5,485,756 | $ | 318,403,999 | ||||
| 2008 |
Amortized Cost |
Gross Unrealized Gains |
Gross Unrealized Losses |
Fair Value | ||||||||
| Securities available-for-sale |
||||||||||||
| Obligations of U.S. Government agencies |
$ | 77,947,911 | $ | 733,925 | $ | 311 | $ | 78,681,525 | ||||
| Mortgage-backed securities |
90,868,123 | 1,024,010 | 22,001 | 91,870,132 | ||||||||
| Other investments |
91,289,389 | 374,182 | 4,192,022 | 87,471,549 | ||||||||
| Total |
$ | 260,105,423 | $ | 2,132,117 | $ | 4,214,334 | $ | 258,023,206 | ||||
The following table shows the gross unrealized losses and fair value of the Company’s investments with unrealized losses that are not deemed to be other-than-temporarily impaired (in thousands), aggregated by investment category and length of time that individual securities have been in a continuous unrealized loss position, at December 31, 2009 and 2008 (in thousands):
| December 31, 2009 | Less than 12 months | 12 months or more | Total | |||||||||||||||
| Description of Securities |
Fair Value |
Unrealized Losses |
Fair Value |
Unrealized Losses |
Fair Value |
Unrealized Losses | ||||||||||||
| Obligations of U. S. Government agencies |
$ | 129,816 | $ | 2,339 | $ | — | $ | — | $ | 129,816 | $ | 2,339 | ||||||
| Mortgage-backed securities |
4,648 | 97 | — | — | 4,648 | 97 | ||||||||||||
| Other investments |
28,225 | 1,140 | 17,861 | 1,910 | 46,086 | 3,050 | ||||||||||||
| Total |
$ | 162,689 | $ | 3,576 | $ | 17,861 | $ | 1,910 | $ | 180,550 | $ | 5,486 | ||||||
24
CITIZENS HOLDING COMPANY
Years Ended December 31, 2009, 2008 and 2007
NOTES TO CONSOLIDATED FINANCIAL STATEMENTS
Note 3. Continued
| December 31, 2008 | Less than 12 months | 12 months or more | Total | |||||||||||||||
| Description of Securities |
Fair Value |
Unrealized Losses |
Fair Value |
Unrealized Losses |
Fair Value |
Unrealized Losses | ||||||||||||
| Obligations of U. S. Government agencies |
$ | 15,038 | $ | — | $ | — | $ | — | $ | 15,038 | $ | — | ||||||
| Mortgage-backed securities |
3,450 | 22 | — | — | 3,450 | 22 | ||||||||||||
| Other investments |
44,192 | 2,658 | 12,264 | 1,534 | 56,456 | 4,192 | ||||||||||||
| Total |
$ | 62,680 | $ | 2,680 | $ | 12,264 | $ | 1,534 | $ | 74,944 | $ | 4,214 | ||||||
Mortgage-backed securities. The unrealized losses on the Company’s investment in mortgage-backed securities were caused by interest rate increases. The contractual cash flows of these investments are guaranteed either by the full faith and credit of the United States or by an agency of the United States Government and it is not expected that the securities would be settled at a price less than the amortized cost of the Company’s investment. Because the decline in fair value is attributable to changes in interest rates and not credit quality and because the Company does not intend to sell and it is more-likely-than-not that the Company will not be required to sell these investments until a recovery of fair value, which may be maturity, the Company does not consider these investments to be other-than-temporarily impaired at December 31, 2009 or 2008.
Other investments. The Company’s unrealized loss on other investments relates to state, county and municipal bonds that have seen a decline in value due to changes in interest rates. It is not expected that these securities would be settled at a price less than amortized cost of the Company’s investment. Because the decline in fair value is attributable to changes in interest rates and not credit quality and because the Company does not intend to sell and it is more-likely-than-not that the Company will not be required to sell these investments until a recovery of fair value, which may be at maturity, the Company does not consider these investments to be other-than-temporarily impaired at December 31, 2009 or 2008.
The amortized cost and estimated fair value of securities at December 31, 2009, by contractual maturity, are shown below. Expected maturities will differ from contractual maturities because borrowers may have the right to call or prepay obligations with or without call or prepayment penalties.
25
CITIZENS HOLDING COMPANY
Years Ended December 31, 2009, 2008 and 2007
NOTES TO CONSOLIDATED FINANCIAL STATEMENTS
Note 3. Continued
| Amortized Cost |
Fair Value | ||||
| Securities available-for-sale |
|||||
| Due in one year or less |
$ | 12,137,228 | 12,395,350 | ||
| Due after one year through five years |
69,587,678 | 72,233,347 | |||
| Due after five years through ten years |
31,366,261 | 31,610,633 | |||
| Due after ten years |
206,700,860 | 202,164,669 | |||
| Total |
$ | 319,792,027 | 318,403,999 | ||
Investment securities with carrying values of $136,008,031 and $120,370,045 at December 31, 2009 and 2008, respectively, were pledged as collateral for public deposits.
Gross realized gains and losses are included in other income. Total gross realized gains and gross realized losses from the sale of investment securities for each of the years ended December 31 were:
| 2009 | 2008 | 2007 | |||||||||
| Gross realized gains |
$ | 573,385 | $ | 38,082 | $ | 192,197 | |||||
| Gross realized losses |
— | (29,699 | ) | (162,858 | ) | ||||||
| $ | 573,385 | $ | 8,383 | $ | 29,339 | ||||||
Note 4. Federal Home Loan Bank Stock
The Company, as a member of the Federal Home Loan Bank of Dallas (“FHLB”) system, owns stock in the organization. No ready market exists for the stock, and it has no quoted market value. The Company’s investment in the FHLB is carried at cost of $4,333,100 and $3,888,100 at December 31, 2009 and 2008, respectively, and is included in other investments.
26
CITIZENS HOLDING COMPANY
Years Ended December 31, 2009, 2008 and 2007
NOTES TO CONSOLIDATED FINANCIAL STATEMENTS
Note 5. Loans
The composition of net loans at December 31, 2009 and 2008 is as follows:
| 2009 | 2008 | |||||||
| (In Thousands) | ||||||||
| Commercial, financial and agricultural loans |
$ | 226,170 | $ | 210,272 | ||||
| Real estate – construction loans |
32,599 | 26,654 | ||||||
| Real estate – mortgage loans |
139,358 | 137,410 | ||||||
| Consumer loans |
49,393 | 54,714 | ||||||
| 447,520 | 429,050 | |||||||
| Unearned discount |
(299 | ) | (344 | ) | ||||
| Allowance for loan losses |
(5,526 | ) | (4,480 | ) | ||||
| Loans, net |
$ | 441,695 | $ | 424,226 | ||||
Loans are made principally to customers in the Company’s market. The Company’s lending policy provides that loans collateralized by real estate are normally made with loan-to-value ratios of 80 percent or less. Commercial loans are typically collateralized by property, equipment, inventories and/or receivables with loan-to-value ratios from 50 percent to 80 percent. Real estate mortgage loans are collateralized by personal residences with loan-to-value ratios of 80 percent or less. Consumer loans are typically collateralized by real estate, vehicles and other consumer durable goods. Approximately $53.4 million and $46.2 million of the loans outstanding at December 31, 2009 and 2008, respectively, were variable rate loans.
Changes in the allowance for loan losses at December 31, 2009, 2008 and 2007 are as follows:
| 2009 | 2008 | 2007 | ||||||||||
| Balance, beginning |
$ | 4,479,585 | $ | 3,967,951 | $ | 3,712,375 | ||||||
| Provision for loan losses |
3,013,455 | 1,223,939 | 784,120 | |||||||||
| Loans charged off |
(2,177,656 | ) | (907,946 | ) | (886,798 | ) | ||||||
| Recoveries of loans previously charged off |
210,519 | 195,641 | 358,254 | |||||||||
| Balance, end of year |
$ | 5,525,903 | $ | 4,479,585 | $ | 3,967,951 | ||||||
27
CITIZENS HOLDING COMPANY
Years Ended December 31, 2009, 2008 and 2007
NOTES TO CONSOLIDATED FINANCIAL STATEMENTS
Note 5. Continued
Loans on impaired status (including non-accruals) were $9,899,113, $1,396,885 and $1,441,251 at December 31, 2009, 2008 and 2007, respectively. Allowance for loan losses attributable to the entire balance of nonaccrual (impaired) loans totaled $927,392 and $342,926 at December 31, 2009 and 2008, respectively. Interest income forgone on loans classified as nonaccrual (impaired) during the years ended December 31, 2009, 2008 and 2007 was $1,025,926, $105,395 and $102,452, respectively.
Impaired loans recognized in conformity with ASC 310, Receivables (“ASC 310”) were as follows:
| December 31, | ||||||
| 2009 | 2008 | |||||
| Impaired loans with an allocated allowance for loan losses |
$ | 2,637,915 | $ | 1,396,885 | ||
| Impaired loans without an allocated allowance for loan losses |
7,261,198 | — | ||||
| Total impaired loans |
$ | 9,899,113 | $ | 1,396,885 | ||
| Allocated allowance on impaired loans |
$ | 927,392 | $ | 329,000 | ||
| Year ended December 31, | |||||||||
| 2009 | 2008 | 2007 | |||||||
| Average recorded investment in impaired loans |
$ | 4,517,865 | $ | 352,775 | $ | 290,651 | |||
| Interest income recognized using the accrual basis of income recognition |
$ | 117,886 | $ | 44,509 | $ | 48,317 | |||
| Interest income recognized using the cash basis of income recognition |
$ | — | $ | — | $ | — | |||
28
CITIZENS HOLDING COMPANY
Years Ended December 31, 2009, 2008 and 2007
NOTES TO CONSOLIDATED FINANCIAL STATEMENTS
Note 6. Bank Premises, Furniture, Fixtures and Equipment
Bank premises, furniture, fixtures and equipment consist of the following at December 31, 2009 and 2008:
| 2009 | 2008 | |||||
| Land and buildings |
$ | 19,939,130 | $ | 18,911,633 | ||
| Furniture, fixtures and equipment |
13,125,740 | 11,932,680 | ||||
| 33,064,870 | 30,844,313 | |||||
| Less accumulated depreciation |
14,940,761 | 13,662,231 | ||||
| Total |
$ | 18,124,109 | $ | 17,182,082 | ||
Depreciation expense for the years ended December 31, 2009, 2008 and 2007 was $1,376,513, $1,306,676 and $1,068,377, respectively.
Note 7. Deposits
The composition of deposits is as follows:
| 2009 | 2008 | |||||
| Non-interest bearing |
$ | 87,116,776 | $ | 95,650,137 | ||
| NOW and money market accounts |
183,971,551 | 151,173,161 | ||||
| Savings deposits |
34,466,029 | 32,162,992 | ||||
| Time certificates, $100,000 or more |
142,311,838 | 138,063,237 | ||||
| Other time certificates |
121,936,391 | 128,877,895 | ||||
| Total |
$ | 569,802,585 | $ | 545,927,422 | ||
The scheduled maturities of certificates of deposit at December 31, 2009 are as follows:
| Year Ending December 31, |
Amount | ||
| 2010 |
$ | 243,426,018 | |
| 2011 |
17,913,845 | ||
| 2012 |
2,710,168 | ||
| 2013 |
103,333 | ||
| 2014 |
94,865 | ||
| $ | 264,248,229 | ||
Interest expense for certificates of deposit over $100,000 was approximately $3,746,000, $2,331,000 and $4,193,000 for the years ended December 31, 2009, 2008 and 2007, respectively.
29
CITIZENS HOLDING COMPANY
Years Ended December 31, 2009, 2008 and 2007
NOTES TO CONSOLIDATED FINANCIAL STATEMENTS
Note 8. Federal Home Loan Bank Advances
Pursuant to collateral agreements with the FHLB, advances are collateralized by all the Company’s stock, FHLB securities ($4,333,100 included in securities available-for-sale at December 31, 2009) and qualifying first mortgage and other loans. As of December 31, 2009, the balance in qualifying first mortgage and other loans was $139,357,321. At December 31, 2009, advances from the FHLB, along with their rate and maturity date, consist of the following:
| Advance Amount at December 31, |
Interest Rate |
Final Maturity | ||||||
| 2009 | 2008 | |||||||
| — | 3,000,000 | 5.24 | April 20, 2009 | |||||
| — | 2,000,000 | 5.29 | April 20, 2009 | |||||
| 2,000,000 | 2,000,000 | 4.47 | September 7, 2010 | |||||
| 2,000,000 | 2,000,000 | 4.88 | August 22, 2011 | |||||
| 1,000,000 | 1,000,000 | 4.76 | August 29, 2011 | |||||
| 900,000 | 900,000 | 4.43 | September 19, 2011 | |||||
| 10,000,000 | 10,000,000 | 3.66 | June 17, 2013 | |||||
| 15,000,000 | 15,000,000 | 3.07 | June 24, 2013 | |||||
| 10,000,000 | 10,000,000 | 3.24 | July 16, 2013 | |||||
| 10,000,000 | 10,000,000 | 3.66 | July 16, 2013 | |||||
| 3,500,000 | 3,500,000 | 4.67 | December 16, 2014 | |||||
| 20,000,000 | 20,000,000 | 2.53 | January 09, 2018 | |||||
| $ | 74,400,000 | $ | 79,400,000 | |||||
The scheduled payments for the next five years are as follows:
| Year Due |
Payment | ||
| 2010 |
2,000,000 | ||
| 2011 |
3,900,000 | ||
| 2012 |
— | ||
| 2013 |
45,000,000 | ||
| 2014 |
3,500,000 | ||
| Thereafter |
20,000,000 | ||
| $ | 74,400,000 | ||
30
CITIZENS HOLDING COMPANY
Years Ended December 31, 2009, 2008 and 2007
NOTES TO CONSOLIDATED FINANCIAL STATEMENTS
Note 9. Other Income and Other Expense
The following is a detail of the major income classifications that are included in other income under non-interest income on the income statement.
| Other Income |
2009 | 2008 | 2007 | ||||||
| BOLI insurance |
$ | 652,423 | $ | 703,596 | $ | 714,601 | |||
| Mortgage loan origination fees |
303,309 | 275,672 | 319,044 | ||||||
| Shay Investments income |
— | 441,588 | 1,325,182 | ||||||
| Other income |
1,043,696 | 1,211,326 | 767,806 | ||||||
| Total other income |
$ | 1,999,428 | $ | 2,632,182 | $ | 3,126,633 | |||
During 2009, the Company sold a lot that was formerly a branch site for a gain of $855,537. This branch was consolidated with another branch in the same general area.
During the second quarter of 2008, the Bank received proceeds from bank owned life insurance that insured the life of one of its officers. These net proceeds resulted in an additional $772,771 in other income for 2008.
The following is a detail of the major expense classifications that comprise the other expense line item in the income statement.
| Other Expense |
2009 | 2008 | 2007 | ||||||
| Intangible amortization |
$ | 184,691 | $ | 434,386 | $ | 537,503 | |||
| Advertising |
644,820 | 772,546 | 551,998 | ||||||
| Office supplies |
520,958 | 599,441 | 576,358 | ||||||
| Legal and audit fees |
444,264 | 378,680 | 350,971 | ||||||
| FDIC and state assessments |
1,030,566 | 129,136 | 110,934 | ||||||
| Telephone expense |
668,296 | 483,960 | 418,681 | ||||||
| Other losses |
1,689,491 | 384,949 | 694,061 | ||||||
| Other expenses |
3,203,584 | 2,888,122 | 2,451,317 | ||||||
| Total other expense |
$ | 8,386,670 | $ | 6,071,220 | $ | 5,691,823 | |||
Other losses in 2009 include the write-down on other real estate in the amount of $1,016,854. FDIC and state assessments includes a $373,125 special assessment paid at June 30, 2009.
31
CITIZENS HOLDING COMPANY
Years Ended December 31, 2009, 2008 and 2007
NOTES TO CONSOLIDATED FINANCIAL STATEMENTS
Note 10. Income Taxes
The consolidated provision for income taxes consists of the following:
| 2009 | 2008 | 2007 | ||||||||||
| Currently payable |
||||||||||||
| Federal |
$ | 2,253,185 | $ | 2,258,575 | $ | 1,971,014 | ||||||
| State |
329,940 | 336,321 | 308,964 | |||||||||
| 2,583,125 | 2,594,896 | 2,279,978 | ||||||||||
| Deferred tax benefit |
(951,793 | ) | (305,830 | ) | (311,868 | ) | ||||||
| Income tax expense |
$ | 1,631,332 | $ | 2,289,066 | $ | 1,968,110 | ||||||
The differences between income taxes calculated at the federal statutory rate and income tax expense were as follows:
| 2009 | 2008 | 2007 | ||||||||||
| Federal taxes based on statutory rate |
$ | 2,981,904 | $ | 3,591,363 | $ | 3,019,997 | ||||||
| State income taxes, net of federal benefit |
217,760 | 277,197 | 203,916 | |||||||||
| Tax-exempt investment interest |
(1,178,432 | ) | (991,474 | ) | (940,489 | ) | ||||||
| Other, net |
(389,900 | ) | (588,020 | ) | (315,314 | ) | ||||||
| Income tax expense |
$ | 1,631,332 | $ | 2,289,066 | $ | 1,968,110 | ||||||
At December 31, 2009 and 2008, net deferred tax assets consist of the following:
| 2009 | 2008 | |||||
| Deferred tax assets |
||||||
| Allowance for loan losses |
$ | 2,061,171 | $ | 1,670,885 | ||
| Deferred compensation liability |
1,443,638 | 1,215,096 | ||||
| Unrealized loss on available-for-sale securities |
517,734 | 776,667 | ||||
| Intangible assets |
233,138 | 226,738 | ||||
| Other |
530,992 | 109,233 | ||||
| Total |
4,786,673 | 3,998,619 | ||||
| Deferred tax liabilities |
||||||
| Premises and equipment |
1,254,508 | 1,171,383 | ||||
| Other |
889,252 | 855,109 | ||||
| Total |
2,143,760 | 2,026,492 | ||||
| Net deferred tax asset |
$ | 2,642,913 | $ | 1,972,127 | ||
32
CITIZENS HOLDING COMPANY
Years Ended December 31, 2009, 2008 and 2007
NOTES TO CONSOLIDATED FINANCIAL STATEMENTS
Note 10. Continued
The net deferred tax asset of $2,642,913 and $1,972,127 at December 31, 2009 and 2008, respectively, is included in other assets. The Company has evaluated the need for a valuation allowance related to the above deferred tax assets and, based on the weight of the available evidence, has determined that it is more likely than not that all deferred tax assets will be realized.
As of December 31, 2009, the Company has no unrecognized tax benefits related to federal and state income tax matters. If ultimately recognized, the Company does not anticipate any material increase in the effective tax rate during 2009 relative to any tax positions taken prior to January 1, 2009. As of December 31, 2009, the Company has not accrued for interest and penalties related to uncertain tax positions. It is the Company’s policy to recognize interest and/or penalties related to income tax matters in income tax expense.
The Company and its subsidiary file a consolidated U. S. federal income tax return. The Company is currently open to audit under the statute of limitations by the Internal Revenue Service for the years ended December 31, 2006 through 2009. The Company and its subsidiary’s state income tax returns are open to audit under the statute of limitations for the years ended December 31, 2006 through 2009.
Note 11. Summarized Financial Information of Citizens Holding Company
Summarized financial information of Citizens Holding Company, parent company only, at December 31, 2009 and 2008, and for the years ended December 31, 2009, 2008 and 2007, is as follows:
Balance Sheets
December 31, 2009 and 2008
| 2009 | 2008 | |||||
| Assets |
||||||
| Cash (1) |
$ | 1,065,630 | $ | 1,583,596 | ||
| Investment in bank subsidiary (1) |
73,369,642 | 69,705,967 | ||||
| Other assets (1) |
162,192 | 110,075 | ||||
| Total assets |
$ | 74,597,464 | $ | 71,399,638 | ||
| Liabilities |
||||||
| Other liabilities |
$ | — | $ | — | ||
| Stockholders’ equity |
74,597,464 | 71,399,638 | ||||
| Total liabilities and stockholders’ equity |
$ | 74,597,464 | $ | 71,399,638 | ||
| (1) | Eliminates in consolidation. |
33
CITIZENS HOLDING COMPANY
Years Ended December 31, 2009, 2008 and 2007
NOTES TO CONSOLIDATED FINANCIAL STATEMENTS
Note 11. Continued
Income Statements
Years Ended December 31, 2009, 2008 and 2007
| 2009 | 2008 | 2007 | ||||||||||
| Interest income |
$ | 5,887 | $ | 12,211 | $ | 8,889 | ||||||
| Other income |
||||||||||||
| Dividends from bank subsidiary (1) |
4,047,000 | 4,959,000 | 6,251,760 | |||||||||
| Equity in undistributed earnings of bank subsidiary (1) |
3,228,419 | 3,412,886 | 749,263 | |||||||||
| Other income |
755 | — | — | |||||||||
| Total other income |
7,276,174 | 8,371,886 | 7,001,023 | |||||||||
| Other expense |
223,611 | 168,318 | 147,303 | |||||||||
| Income before income taxes |
7,058,450 | 8,215,779 | 6,862,609 | |||||||||
| Income tax benefit |
(80,524 | ) | (57,988 | ) | (51,625 | ) | ||||||
| Net income |
$ | 7,138,974 | $ | 8,273,767 | $ | 6,914,234 | ||||||
| (1) | Eliminates in consolidation. |
Statements of Cash Flows
Years Ended December 31, 2009, 2008 and 2007
| 2009 | 2008 | 2007 | ||||||||||
| Cash flows from operating activities |
||||||||||||
| Net income |
$ | 7,138,974 | $ | 8,273,767 | $ | 6,914,234 | ||||||
| Adjustments to reconcile net income to net cash provided by operating activities |
||||||||||||
| Equity in undistributed earnings of Bank |
(3,228,419 | ) | (3,412,886 | ) | (749,263 | ) | ||||||
| Stock compensation expense (benefit) |
85,020 | 59,011 | 41,994 | |||||||||
| (Increase) decrease in other assets |
(2,186 | ) | (1,760 | ) | 170 | |||||||
| (Decrease) increase in other liabilities |
— | — | (3,600 | ) | ||||||||
| Net cash provided by operating activities |
3,993,389 | 4,918,132 | 6,203,535 | |||||||||
34
CITIZENS HOLDING COMPANY
Years Ended December 31, 2009, 2008 and 2007
NOTES TO CONSOLIDATED FINANCIAL STATEMENTS
Note 11. Continued
| 2009 | 2008 | 2007 | ||||||||||
| Cash flows from financing activities |
||||||||||||
| Dividends paid to stockholders |
$ | (3,931,530 | ) | $ | (3,740,417 | ) | $ | (3,576,655 | ) | |||
| Proceeds from exercise of stock options |
485,748 | 143,387 | 26,555 | |||||||||
| Repurchase of company stock |
(1,065,574 | ) | (692,738 | ) | (3,482,153 | ) | ||||||
| Net cash used by financing activities |
(4,511,356 | ) | (4,289,768 | ) | (7,032,253 | ) | ||||||
| Net increase (decrease) in cash |
(517,967 | ) | 628,364 | (828,718 | ) | |||||||
| Cash, beginning of year |
1,583,596 | 955,232 | 1,783,950 | |||||||||
| Cash, end of year |
$ | 1,065,630 | $ | 1,583,596 | $ | 955,232 | ||||||
The Bank is required to obtain approval from state regulators before paying dividends. The Bank paid dividends of $4,047,000, $4,959,000 and $6,251,760 to the Citizens Holding Company during the years ended December 31, 2009, 2008 and 2007, respectively.
Note 12. Related Party Transactions
The Company had, and may be expected to have in the future, banking transactions in the ordinary course of business with directors, significant stockholders, principal officers, their immediate families, and affiliated companies in which they are principal stockholders (commonly referred to as related parties). In management’s opinion, such loans are made on substantially the same terms, including interest rates and collateral, as those prevailing at the time for comparable transactions with unrelated parties, and do not involve more than the normal risk of collectibility at the time of the transaction.
The balance of loans made to related parties at December 31, 2009 and 2008 was $793,823 and $990,310, respectively. Advances to related parties during the year ended December 31, 2009 and 2008 totaled $376,367 and $253,426, respectively. Payments received from related parties during the year ended December 31, 2009 and 2008 totaled $572,854 and $256,102.
Deposits from related parties at December 31, 2009 and 2008 approximated $1,967,303 and $1,805,093, respectively.
35
CITIZENS HOLDING COMPANY
Years Ended December 31, 2009, 2008 and 2007
NOTES TO CONSOLIDATED FINANCIAL STATEMENTS
Note 13. Off-Balance Sheet Financial Instruments, Commitments and Contingencies and Concentrations of Risks
Commitments to Extend Credit
In the ordinary course of business, the Company makes various commitments and incurs certain contingent liabilities to fulfill the financing needs of its customers. These commitments and contingent liabilities include commitments to extend credit and issue standby letters of credit. They involve, to varying degrees, elements of credit risk in excess of the amount recognized in the balance sheets. The Company’s exposure to credit loss in the event of nonperformance by the other party to the financial instrument for commitments to extend credit and standby letters of credit is represented by the contractual amount of those instruments. At December 31, 2009 and 2008, commitments related to unused lines of credit were $35,605,204 and $44,441,409, respectively, and standby letters of credit were $8,592,050 and $3,323,809, respectively. The fair value of such commitments is not materially different than stated values. As some of these commitments are expected to expire without being drawn upon, the total commitment amount does not necessarily represent future cash requirements. The Company applies the same credit policies and standards as it does in the lending process when making these commitments. The collateral obtained is based upon the assessed credit worthiness of the borrower. Collateral held varies, but may include accounts receivable, crops, livestock, inventory, property and equipment, residential real estate and income-producing commercial properties.
Interest Rate Risk
The Company is principally engaged in providing short-term and medium-term installment, commercial and agricultural loans with interest rates that are fixed or fluctuate with the prime lending rate. These assets are primarily funded through short-term demand deposits and long-term certificates of deposit with variable and fixed rates. Accordingly, the Company is exposed to interest rate risk because, in changing interest rate environments, interest rate adjustments on assets and liabilities may not occur at the same time or in the same amount. The Company manages the overall rate sensitivity and mix of its asset and liability portfolio and attempts to minimize the effects that interest rate fluctuations will have on its net interest margin.
Legal Proceedings
The Company is party to lawsuits and other claims that arise in the ordinary course of business. The lawsuits assert claims related to the general business activities of the Company. The cases are being vigorously contested. In the regular course of business, management evaluates estimated losses or costs related to litigation, and provision is made for anticipated losses whenever management believes that such losses are probable and can be reasonably estimated. While management believes that the final resolution of pending legal proceedings will not have a material impact on the Company’s financial position or results of operations, the final resolution of such proceedings could have a material adverse effect.
36
CITIZENS HOLDING COMPANY
Years Ended December 31, 2009, 2008 and 2007
NOTES TO CONSOLIDATED FINANCIAL STATEMENTS
Note 13. Continued
Concentration of Risk
The Company makes agricultural, agribusiness, commercial, residential and consumer loans primarily in eastern central Mississippi. A substantial portion of the customers’ abilities to honor their contracts is dependent on their business and the agricultural economy in the area.
Although the Company’s loan portfolio is diversified, there is a relationship in this region between the agricultural economy and the economic performance of loans made to nonagricultural customers. The Company’s lending policies for agricultural and nonagricultural customers require loans to be well-collateralized and supported by cash flows. Collateral for agricultural loans includes equipment, crops, livestock and land. Credit losses from loans related to the agricultural economy are consistent with credit losses experienced in the portfolio as a whole. The concentration of credit in the regional agricultural economy is taken into consideration by management in determining the allowance for loan losses. See Note 5 for a summary of loans by type.
The nature of the Company’s business requires that it maintain amounts due from banks, which at times may exceed federally insured limits. The Company has not experienced any losses in such accounts.
Note 14. Lease Commitment and Total Rental Expense
The Company has operating leases under noncancellable operating lease agreements for banking facilities and equipment. Future minimum rental payments due under the leases are as follows:
| Years Ending December 31, |
Amounts | ||
| 2010 |
$ | 192,214 | |
| 2011 |
137,593 | ||
| 2012 |
112,145 | ||
| 2013 |
— | ||
| 2014 |
— | ||
| $ | 441,952 | ||
The total rental expense included in the income statements for the years ended December 31, 2009, 2008 and 2007 is $181,148, $155,422 and $75,926, respectively.
37
CITIZENS HOLDING COMPANY
Years Ended December 31, 2009, 2008 and 2007
NOTES TO CONSOLIDATED FINANCIAL STATEMENTS
Note 15. Benefit Plans
The Company provides its employees with a profit sharing and savings plan, which allows employees to direct a percentage of their compensation into a tax deferred retirement account, subject to statutory limitations. To encourage participation, the Company provides a 100 percent matching contribution for up to 6 percent of each participant’s compensation, plus discretionary non-matching contributions. Employees are eligible after one year of service. For 2009, 2008 and 2007, the Company’s contributions were $672,397, $599,643 and $558,340, respectively.
Deferred Compensation Plans
The Company provides a deferred compensation plan covering its directors. Participants in the deferred compensation plan can defer a portion of their compensation for payment after attaining age 70. Life insurance contracts have been purchased which may be used to fund payments under the plan. Net expenses related to this plan were $95,445, $83,118 and $127,577 for the plan years ended December 31, 2009, 2008 and 2007, respectively.
The Company has also entered into deferred compensation arrangements with certain officers that provide for payments to such officers or their survivors after retirement. Life insurance policies have been purchased which may be used to fund payments under these arrangements. The obligations of the Company under both the directors and officers deferred compensation arrangements are on a systematic basis over the remaining expected service period of the individual directors and officers.
Note 16. Regulatory Matters
The Company (on a consolidated basis) and the Bank are subject to various regulatory capital requirements administered by federal banking agencies. Failure to meet the minimum regulatory capital requirements can initiate certain mandatory, and possible additional discretionary actions by regulators that, if undertaken, could have a direct material affect on the Company.
Under the regulatory capital adequacy guidelines and the regulatory framework for prompt corrective action, the Company must meet specific capital guidelines involving quantitative measures of the Company’s assets, liabilities and certain off-balance sheet items as calculated under regulatory accounting practices. The Company’s capital amounts and classification under the prompt corrective action guidelines are also subject to qualitative judgments by the regulators about components, risk weightings, and other factors. Quantitative measures established by regulation to ensure capital adequacy require the Company to maintain minimum amounts and ratios of total capital and Tier I capital to risk-weighted assets (as defined in the regulations) and Tier I capital to average assets (as defined in the regulations). Management believes, as of December 31, 2009, that the Company and the Bank meet all capital adequacy requirements to which they are subject.
38
CITIZENS HOLDING COMPANY
Years Ended December 31, 2009, 2008 and 2007
NOTES TO CONSOLIDATED FINANCIAL STATEMENTS
Note 16. Continued
As of December 31, 2009 and 2008, the most recent regulatory notification categorized the Bank as well capitalized. There have been no conditions or events that would cause changes to the capital structure of the Company since this notification. To continue to be categorized as well capitalized under the regulatory framework for prompt corrective action, the Company would have to maintain minimum total risk-based, Tier I risk-based, and Tier I leverage ratios as disclosed below, in comparison with actual capital amounts and ratios:
| Actual | For Capital Adequacy Purposes |
To Be
Well Capitalized under Prompt Corrective Action Provisions |
|||||||||||||
| Amount | Ratio | Amount | Ratio | Amount | Ratio | ||||||||||
| As of December 31, 2009 |
|||||||||||||||
| Total Capital |
|||||||||||||||
| (to Risk-Weighted Assets) |
|||||||||||||||
| Citizens Holding Company |
$77,397,667 | 14.97 | % | $41,369,700 | 8 | % | $ N/A | — | |||||||
| Citizens Bank |
76,169,845 | 14,73 | % | 41,359,028 | 8 | 51,698,785 | 10 | % | |||||||
| Tier I Capital |
|||||||||||||||
| (to Risk-Weighted Assets) |
|||||||||||||||
| Citizens Holding Company |
$71,871,764 | 13.90 | % | $20,684,850 | 4 | N/A | — | ||||||||
| Citizens Bank |
70,643,942 | 13.66 | % | 20,679,514 | 4 | 31,019,271 | 6 | ||||||||
| Tier I Capital |
|||||||||||||||
| (to Average Assets) |
|||||||||||||||
| Citizens Holding Company |
$71,871,764 | 8.72 | % | $32,957,706 | 4 | N/A | — | ||||||||
| Citizens Bank |
70,643,942 | 8.58 | % | 32,920,495 | 4 | 41,150,619 | 5 | ||||||||
| Actual | For Capital Adequacy Purposes |
To Be
Well Capitalized under Prompt Corrective Action Provisions |
|||||||||||||
| Amount | Ratio | Amount | Ratio | Amount | Ratio | ||||||||||
| As of December 31, 2008 |
|||||||||||||||
| Total Capital |
|||||||||||||||
| (to Risk-Weighted Assets) |
|||||||||||||||
| Citizens Holding Company |
$73,404,088 | 15.70 | % | $37,397,753 | 8 | % | $ N/A | — | |||||||
| Citizens Bank |
71,710,418 | 15.35 | % | 37,379,907 | 8 | 46,724,884 | 10 | % | |||||||
| Tier I Capital |
|||||||||||||||
| (to Risk-Weighted Assets) |
|||||||||||||||
| Citizens Holding Company |
$68,924,503 | 14.74 | % | $18,698,876 | 4 | N/A | — | ||||||||
| Citizens Bank |
67,230,832 | 14.39 | % | 18,689,954 | 4 | 28,034,930 | 6 | ||||||||
| Tier I Capital |
|||||||||||||||
| (to Average Assets) |
|||||||||||||||
| Citizens Holding Company |
$68,924,503 | 9.50 | % | $29,008,490 | 4 | N/A | — | ||||||||
| Citizens Bank |
67,230,832 | 9.25 | % | 29,086,979 | 4 | 36,358,723 | 5 | ||||||||
39
CITIZENS HOLDING COMPANY
Years Ended December 31, 2009, 2008 and 2007
NOTES TO CONSOLIDATED FINANCIAL STATEMENTS
Note 17. Fair Values of Financial Instruments
As mentioned in Note 1, effective January 1, 2008, the Company adopted SFAS 157, as codified in ASC Topic 820, that establishes a framework for measuring fair value and required enhanced disclosures about fair value measurements. SFAS 157 clarifies that fair value is an exit price, representing the amount that would be received to sell an asset or paid to transfer a liability in an orderly transaction between market participants. SFAS 157 also requires disclosure about how fair value was determined for assets and liabilities and established a hierarchy for which these assets and liabilities must be grouped, based on significant levels of inputs as follows:
| Level 1 | Quoted prices in active markets for identical assets or liabilities; | |
| Level 2 | Quoted prices in active markets for similar assets and liabilities and inputs that are observable for the asset or liability; or | |
| Level 3 | Unobservable inputs, such as discounted cash flow models or valuations. | |
The determination of where assets and liabilities fall within this hierarchy is based upon the lowest level of input that is significant to the fair value measurement. The fair value estimates, methods and assumptions used by the Company in estimating its fair value disclosures for financial instruments were:
Cash and Due from Banks and Interest Bearing Deposits with Banks
The carrying amounts reported in the balance sheet for these instruments approximate fair value because of their immediate and shorter-term maturities.
Securities Available-for-Sale
Fair values for investment securities are based on quoted market prices, when available. If quoted market prices are not available, fair values are based on quoted market prices of comparable instruments. When neither quoted prices nor comparable instruments are available, unobservable inputs are needed to form an expected future cash flow analysis to establish fair values. Level 2 securities include debt securities including obligations of United States Government agencies and corporations, mortgage-backed securities and state, county and municipal bonds. Level 3 securities consist of a pooled trust preferred security.
40
CITIZENS HOLDING COMPANY
Years Ended December 31, 2009, 2008 and 2007
NOTES TO CONSOLIDATED FINANCIAL STATEMENTS
Note 17. Continued
The following table presents assets and liabilities that are measured at fair value on a recurring basis as of December 31, 2009:
| Quoted Prices in Active Markets for Identical Assets |
Significant Other Observable Inputs |
Significant Unobservable Inputs |
||||||||||
| (Level 1) | (Level 2) | (Level 3) | Totals | |||||||||
| Securities available for sale |
$ | — | $ | 316,258,603 | $ | 2,145,396 | $ | 318,403,999 | ||||
The following table presents assets and liabilities that are measured at fair value on a recurring basis as of December 31, 2008:
| Quoted Prices in Active Markets for Identical Assets |
Significant Other Observable Inputs |
Significant Unobservable Inputs |
||||||||||
| (Level 1) | (Level 2) | (Level 3) | Totals | |||||||||
| Securities available for sale |
$ | — | $ | 258,023,206 | $ | — | $ | 258,023,206 | ||||
41
CITIZENS HOLDING COMPANY
Years Ended December 31, 2009, 2008 and 2007
NOTES TO CONSOLIDATED FINANCIAL STATEMENTS
Note 17. Continued
The following table reports the activity for 2009 in assets measured at fair value on a recurring basis using significant unobservable inputs.
| Fair Value Measurements Using Significant Unobservable Inputs (Level 3) |
||||
| Structured Financial Product | ||||
| Balance at January 1, 2009 |
$ | — | ||
| Total gains or losses (realized or unrealized) |
||||
| Other-than-temporary impairment included in earnings |
— | |||
| Other-than-temporary impairment included |
— | |||
| in other comprehensive income |
— | |||
| Other gains/losses included in other comprehensive income |
(179,709 | ) | ||
| Purchases, issuances and settlements |
— | |||
| Transfers in and/or out of Level 3 |
2,325,105 | |||
| Balance at December 31, 2009 |
$ | 2,145,396 | ||
| The amount of total gains or losses for the period included in earnings attributable to the change in unrealized gains or losses relating to assets still held at reporting date | $ | — | ||
As of December 31, 2009, management determined, based on the current credit ratings, known defaults and deferrals by the underlying banks and the degree to which future defaults and deferrals would be required to occur before the cash flow for the Company’s tranche is negatively impacted, that no other than temporary impairment exists.
The Company recorded no gains or losses in earnings for the period that were attributable to the change in unrealized gains or losses relating to assets still held at the reporting date.
Net Loans
For variable-rate loans that reprice frequently and with no significant change in credit risk, fair values are based on carrying values. The fair values for other loans (i.e., commercial real estate and rental property mortgage loans, commercial and industrial loans, financial institution loans, and agricultural loans) are estimated using discounted cash flow analyses, using interest rates currently being offered for loans with similar terms to borrowers of similar credit quality. The carrying amount of accrued interest receivable approximates its fair value.
42
CITIZENS HOLDING COMPANY
Years Ended December 31, 2009, 2008 and 2007
NOTES TO CONSOLIDATED FINANCIAL STATEMENTS
Note 17. Continued
Impaired Loans
Loans considered impaired as defined in FASB ASC Topic 310-10-35 are reserved for at the time the loan is identified as impaired taking into account the fair value of the collateral less estimated selling costs. Collateral may be real estate and/or business assets including but not limited to, equipment, inventory and accounts receivable. The fair value of real estate is determined based on appraisals by qualified licensed appraisers. The fair value of the business assets is generally based on amounts reported on the business’s financial statements. Appraised and reported values may be adjusted based on management’s historical knowledge, changes in market conditions from the time of valuation and management’s knowledge of the client and the client’s business. Since not all valuation inputs are observable, these nonrecurring fair value determinations are classified Level 3. Impaired loans are reviewed and evaluated on at least a quarterly basis for additional impairment and adjusted accordingly, based on the same factors previously identified.
Other real estate owned
Other real estate owned (“OREO”) is comprised of commercial and residential real estate obtained in partial and total satisfaction of loan obligations. OREO acquired in settlement of indebtedness is recorded at fair value of the real estate, less costs to sell. Subsequently, it may be necessary to record nonrecurring fair value adjustments for decline in fair value. Fair value, when recorded, is determined based on appraisals by qualified licensed appraisers and adjusted for management’s estimates of costs to sell. As such, values for OREO are classified as Level 3.
For assets measured at fair value on a nonrecurring basis during 2009 that were still held in the balance sheet at December 31, 2009, the following table provides the hierarchy level and the fair value of the related assets:
| Quoted Prices in Active Markets for Identical Assets |
Significant Other Observable Inputs |
Significant Unobservable Inputs |
||||||||||
| (Level 1) | (Level 2) | (Level 3) | Totals | |||||||||
| Impaired loans |
$ | — | $ | — | $ | 9,899,113 | $ | 9,899,113 | ||||
| Other real estate owned |
— | — | 3,229,180 | 3,229,180 | ||||||||
| $ | $ | $ | 13,128,293 | $ | 13,128,293 | |||||||
43
CITIZENS HOLDING COMPANY
Years Ended December 31, 2009, 2008 and 2007
NOTES TO CONSOLIDATED FINANCIAL STATEMENTS
Note 17. Continued
For assets measured at fair value on a nonrecurring basis during 2008 that were still held in the balance sheet at December 31, 2008, the following table provides the hierarchy level and the fair value of the related assets:
| Quoted Prices in Active Markets for Identical Assets |
Significant Other Observable Inputs |
Significant Unobservable Inputs |
||||||||||
| (Level 1) | (Level 2) | (Level 3) | Totals | |||||||||
| Impaired loans |
$ | — | $ | — | $ | 1,396,885 | $ | 1,396,885 | ||||
| Other real estate owned |
— | — | 3,374,803 | 3,374,803 | ||||||||
| $ | — | $ | — | $ | 4,771,688 | $ | 4,771,688 | |||||
Impaired loans with a carrying value of $9,899,113 had an allocated allowance for loan losses of $927,392 at December 31, 2009. The allocated allowance is based on the carrying value of the impaired loan and the fair value of the underlying collateral less estimated costs to sell.
The following table reports the activity for 2009 in impaired assets measured at fair value on a recurring basis using significant unobservable inputs.
44
CITIZENS HOLDING COMPANY
Years Ended December 31, 2009, 2008 and 2007
NOTES TO CONSOLIDATED FINANCIAL STATEMENTS
Note 17. Continued
| Fair Value Measurements Using Significant Unobservable Inputs (Level 3) | |||
| Impaired Assets | |||
| Balance at January 1, 2009 |
$ | 4,771,688 | |
| Total gains or losses (realized or unrealized) |
|||
| Other-than-temporary impairment included in earnings |
— | ||
| Other-than-temporary impairment included |
— | ||
| in other comprehensive income |
— | ||
| Other gains/losses included in other comprehensive income |
— | ||
| Purchases, issuances and settlements |
— | ||
| Transfers in and/or out of Level 3 |
8,356,605 | ||
| Balance at December 31, 2009 |
$ | 13,128,293 | |
| The amount of total gains or losses for the period included in earnings attributable to the change in unrealized gains or losses relating to assets still held at reporting date | $ | — | |
In 2008, OREO with a carrying amount of $100,000 was written down to $80,000, resulting in a write-down of $20,000, which was included in the results of operations for the year ended December 31, 2008. After monitoring the carrying amounts for subsequent declines or impairment after foreclosure, management determined that a further fair value adjustment for four parcels of OREO in the total amount of $1,016,854 was necessary and was recorded during the year ended December 31, 2009.
Federal Funds Sold and Purchased; Sweep Account Liability
Due to the short term nature of these instruments, the carrying amount is equal to the fair value.
Deposits
The fair values for demand deposits, NOW and money market accounts and savings accounts are, by definition, equal to the amount payable on demand at the reporting date (i.e., their carrying amounts). The carrying amounts for variable-rate, fixed-term money market accounts and time deposits approximate their fair values at the reporting date. Fair values for fixed-rate time deposits are estimated using a discounted cash flow calculation that applies interest rates currently being offered on certificates to a schedule of aggregated expected monthly maturities on time deposits. The carrying amount of accrued interest payable approximates its fair value.
45
CITIZENS HOLDING COMPANY
Years Ended December 31, 2009, 2008 and 2007
NOTES TO CONSOLIDATED FINANCIAL STATEMENTS
Note 17. Continued
Federal Home Loan Bank Borrowings
The fair value of FHLB advances is based on discounted cash flow analysis.
Off-Balance Sheet Instruments
The fair value of commitments to extend credit and letters of credit are estimated using fees currently charged to enter into similar agreements. The fees associated with these financial instruments are not material.
The following represents the carrying value and estimated fair value of the Company’s financial instruments at December 31, 2009 and 2008:
| 2009 | 2008 | |||||||||||
| Carrying Amount |
Fair Value | Carrying Amount |
Fair Value | |||||||||
| Financial assets |
||||||||||||
| Cash and due from banks |
$ | 15,365,612 | $ | 15,365,612 | $ | 28,844,221 | $ | 28,844,221 | ||||
| Interest bearing deposits with banks |
5,232,723 | 5,232,723 | 1,001,611 | 1,001,611 | ||||||||
| Securities available-for-sale |
318,403,999 | 318,403,999 | 258,023,206 | 258,023,206 | ||||||||
| Net loans |
441,694,562 | 442,075,445 | 424,225,671 | 422,956,707 | ||||||||
| Accrued interest receivable |
6,048,718 | 6,048,718 | 6,265,797 | 6,265,797 | ||||||||
| Financial liabilities |
||||||||||||
| Deposits |
$ | 569,802,585 | $ | 570,022,820 | $ | 545,927,422 | $ | 546,424,671 | ||||
| Federal Home Loan Bank advances |
74,400,000 | 77,219,245 | 79,400,000 | 82,644,119 | ||||||||
| Accrued interest payable |
778,989 | 778,989 | 1,365,679 | 1,365,679 | ||||||||
| Federal funds purchased |
— | — | 21,000,000 | 21,000,000 | ||||||||
| Sweep account liability |
114,753,010 | 114,753,010 | 41,441,052 | 41,441,052 | ||||||||
Note 18. Stock Options
The Company has a directors’ stock compensation plan and employees’ long-term incentive plan. Under the directors’ plan, the Company may grant options for up to 210,000 shares of common stock. The price of each option is equal to the market price determined as of the option grant date. Options granted are exercisable after 6 months and expire after 10 years. Under the employees’ incentive plan, the Company may grant options for up to 7 percent of the total number of shares of common stock, which may be issued and outstanding. Incentive options must be granted within 10 years of the adoption of the plan and expire no later than 10 years from the grant date. The exercise price is equal to the market price of the Company’s stock on the date of grant.
46
CITIZENS HOLDING COMPANY
Years Ended December 31, 2009, 2008 and 2007
NOTES TO CONSOLIDATED FINANCIAL STATEMENTS
Note 18. Continued
Following is a summary of the status of the plans for the years ending December 31, 2009, 2008 and 2007:
| Directors’ Plan | Employees’ Plan | |||||||||||
| Number of Shares |
Average Exercise Price |
Number of Shares |
Weighted Average Exercise Price | |||||||||
| Outstanding at January 1, 2007 |
89,850 | $ | 15.68 | 196,800 | $ | 17.60 | ||||||
| Granted |
13,500 | 22.00 | — | — | ||||||||
| Exercised |
(2,700 | ) | 7.15 | (500 | ) | 14.50 | ||||||
| Expired |
— | — | (4,000 | ) | 20.22 | |||||||
| Outstanding at December 31, 2007 |
100,650 | $ | 16.76 | 192,300 | $ | 17.60 | ||||||
| Granted |
13,500 | 18.00 | 1,500 | 18.00 | ||||||||
| Exercised |
(19,650 | ) | 10.65 | (7,500 | ) | 13.73 | ||||||
| Expired |
(3,000 | ) | 22.98 | (9,500 | ) | 21.72 | ||||||
| Outstanding at December 31, 2008 |
91,500 | $ | 18.05 | 176,800 | $ | 18.63 | ||||||
| Granted |
13,500 | 21.75 | — | — | ||||||||
| Exercised |
(12,000 | ) | 13.74 | (25,150 | ) | 13.65 | ||||||
| Expired |
(4,500 | ) | 22.65 | — | — | |||||||
| Outstanding at December 31, 2009 |
88,500 | $ | 18.05 | 151,650 | $ | 19.63 | ||||||
| Options exercisable at: |
||||||||||||
| December 31, 2009 |
88,500 | $ | 18.05 | 151,650 | $ | 19.63 | ||||||
| Weighted average fair value of Options granted during years |
||||||||||||
| December 31, 2007 |
$ | 6.23 | $ | — | ||||||||
| December 31, 2008 |
$ | 5.92 | $ | 5.76 | ||||||||
| December 31, 2009 |
$ | 9.96 | $ | — | ||||||||
47
CITIZENS HOLDING COMPANY
Years Ended December 31, 2009, 2008 and 2007
NOTES TO CONSOLIDATED FINANCIAL STATEMENTS
Note 18. Continued
The following table presents the outstanding stock options granted in relation to the option price and the weighted average maturity.
| Range of Exercise Prices |
Options Outstanding |
Weighted Average Price |
Weighted Average | ||||
| $10.01 to $15.00 |
63,350 | $ | 13.57 | 2 years, 1 month | |||
| $15.01 to $20.00 |
31,500 | 18.11 | 1 year, 9 months | ||||
| $20.01 to $22.50 |
100,800 | 21.62 | 5 years, 6 months | ||||
| $22.51 and above |
44,500 | 23.51 | 6 years, 3 months | ||||
| Total |
240,150 | $ | 19.39 | 4 years, 3 months | |||
The intrinsic value of options granted under the Directors’ Plan at December 31, 2009 was $315,615 and the intrinsic value of the Employees’ Plan at December 31, 2009 was $455,308 for a total intrinsic value at December 31, 2009 of $770,923. Additionally, the total intrinsic value of options exercised during 2009 and 2008 was $137,805 and $214,746, respectively. There was no unrecognized stock-based compensation expense at December 31, 2009.
48
MANAGEMENT’S DISCUSSION AND ANALYSIS OF FINANCIAL CONDITION AND RESULTS OF OPERATION AS OF DECEMBER 31, 2009, 2008 and 2007
OVERVIEW
The following information discusses the financial condition and results of operations of Citizens Holding Company (the “Company”) as of December 31, 2009, 2008 and 2007. In this discussion, all references to the activities, operations or financial performance of the Company reflect the Company’s activities, operations and financial performance through its wholly-owned subsidiary, The Citizens Bank of Philadelphia, Mississippi (the “Bank”), unless otherwise specifically noted.
Over the past three years, the Company has experienced growth in total assets and deposits as management has capitalized on opportunities for organic growth within our market area and the addition of two branches in 2007 and three in 2008 and a loan production office in 2009. Total assets increased over the three-year period by $218.8 million or 35.2%. In the three year period, earnings decreased in 2007, increased in 2008 and again decreased again in 2009. After higher costs for deposits and lower loan spreads from increased market competition caused the Company’s net interest margin to compress in 2007, the Company rebounded and the cost of deposits decreased greater than the interest received on earning assets and the net interest margin increased. Higher loan loss provision in 2009 along with increased operating expenses caused net income to decrease in 2009. Regardless of the fluctuation in the interest margins, management believes it has made appropriate provisions for loan losses.
During 2009, the Company’s assets grew by $73,956,496, or 9.7%, from 2008, loans increased by $17,468,891, or 4.1% and deposits increased by $23,875,163, or 4.4%. Loans increased in 2009 partially due to the entrance into new markets through the opening of five new branches since the fourth quarter of 2007 and the opening of a loan production office in Biloxi, Mississippi in 2009. Deposit accounts increased by $23,875,163, or 4.4% during 2009. Certificates of deposit ended 2009 at $264,248,229, or 1.0%, lower than 2008. Demand, NOW, savings and money market accounts increased $26,568,066, or 9.5%, to $305,554,356 at December 31, 2009.
During 2008, the Company’s assets increased to $766,047,332, or by 12.5%, from 2007, loans increased to $424,225,671, or by 15.3%, and deposits increased by $68,695,118, or 14.4%. Loans increased in 2008 partially due to the entrance into new markets through the opening of five new branches since the fourth quarter of 2007. All categories of deposit accounts increased during 2008. Certificates of deposit ended 2008 at $266,941,132, or 18.7%, higher than 2007. Demand, NOW, savings and money market accounts increased $26,695,196, or 10.6%, to $278,986,290 at December 31, 2008.
During 2007, the Company’s assets increased to $680,903,631, or 9.6% higher from 2006, loans decreased to $368,025,286, or by 0.3%, and deposits increased by $5,385,048, or 1.1%. Loans decreased in 2007 due to the repayment of several large loans in the portfolio. At the same time that demand and savings accounts decreased, certificates of deposit increased. Certificates of deposit ended 2007 at $224,941,210, or 10.6% higher than 2006. Demand, NOW, savings and money market accounts decreased $16,201,089, or 6.0%, to $252,291,094 at December 31, 2007.
49
In 2009, the Company’s net income after taxes decreased to $7,138,974, a decrease of $1,134,792 over 2008. The decrease in the rates paid on deposits being greater than the decrease in rates on earning assets was not enough to offset the increase in the provision for loan losses and other operating expenses. Net income for 2009 produced, on a fully diluted basis, earnings per share of $1.45 compared to $1.69 in 2008 and $1.39 for 2007.
In 2008, the Company’s net income after taxes increased to $8,273,767, an increase of $1,359,533 over 2007. The decrease in the rates paid on deposits being greater than the decrease in rates on earning assets and the additional revenue related to the branch expansions that occurred during the fourth quarter of 2008, were the major causes of the increase in net income. Net income for 2008 produced, on a fully diluted basis, earnings per share of $1.69 compared to $1.39 in 2007 and $1.65 for 2006.
In 2007, the Company’s net income after taxes decreased to $6,914,234, a decrease of $1,480,290 over 2006. The increase in the rates paid on deposits was a major cause of the decrease along with the additional costs related to the branch expansion expenses recorded in the fourth quarter. Net income for 2007 produced, on a fully diluted basis, earnings per share of $1.39 compared to $1.65 in 2006 and $1.57 for 2005.
The Company’s Return on Average Assets (“ROA”) was 0.88% in 2009, compared to 1.18% in 2008 and 1.08% in 2007. The Company’s Return on Average Equity (“ROE”) was 9.58% in 2009, 11.80% in 2008 and 10.26% in 2007. During these periods, leverage capital ratios (the ratio of equity to average total assets) decreased from 9.98% in 2007 to 9.50% in 2008 to 8.72% in 2009. The ROE in 2009, 2008 and 2007 is a function of the level of net income during those years. The changes in ROA were also a result of the Company’s income increasing in 2008 and decreasing in 2009 and also affected by the increase in total assets during this time period. The Company set the annual dividend payout rate to approximately 55.10% of 2009 earnings per share, as compared to 45.29% in 2008 and 51.77% in 2007. The leverage capital ratio of 8.72% in 2009 remains well above the regulatory requirement of 5% to be considered “well capitalized” under applicable Federal Deposit Insurance Corporation (the “FDIC”) guidelines for the Bank.
CRITICAL ACCOUNTING POLICIES
The preparation of financial statements in conformity with accounting principles generally accepted in the United States of America requires management to make estimates and assumptions that affect the reported amounts of assets and liabilities and disclosure of contingent assets and liabilities at the date of the financial statements and the reported amounts of revenues and expenses during the reporting period. Actual results could differ from those estimates.
The critical accounting policy most important to the presentation of our financial statements relates to the allowance for loan loss and the related provision for loan losses. The allowance for loan losses is available to absorb probable credit losses inherent in the entire loan portfolio. The appropriate level of the allowance is based on a quarterly analysis of the loan
50
portfolio and represents an amount that management deems adequate to provide for inherent losses, including collective impairment as recognized under ASC Subtopic 450-20, Loss Contingencies. The collective impairment is calculated based on loans grouped by grade. Another component of the allowance is losses on loans assessed as impaired under ASC Subtopic 310-10, Loan Impairments. The balance of these loans determined to be impaired under ASC Subtopic 310-10 and their related allowance is included in management’s estimation and analysis of the allowance for loan losses. For a discussion of other considerations in establishing the allowance for loan losses and our loan policies and procedures for addressing credit risk, please refer to the disclosures in this Item under the heading “Provision for Loan Losses and Asset Quality.”
Effective January 1, 2006, the Company adopted FASB ASC Topic 718, Compensation-Stock Compensation using the modified prospective transition method. Under that method of transition, compensation cost recognized in 2006 includes: (a) compensation cost for all share-based payments granted prior to, but not yet vested as of January 1, 2006, based on the grant date fair value estimated in accordance with the original provisions of ASC Topic 718; and (b) compensation cost for all share-based payments granted subsequent to January 1, 2006, based on the grant-date fair value estimated in accordance with the provisions of ASC Topic 718. Generally, all options granted to employees and directors fully vest six months and one day after the date of grant, rather than vesting in tranches over a specified period. At the date of adoption, there were no unvested share-based payments outstanding. Also, given the limited historical amount of forfeited options, the Company has not reduced compensation expense for estimated forfeitures. The Company did not change the amount or terms of any outstanding option arrangements in anticipation of the adoption of ASC Topic 718.
The Company utilizes the Black-Scholes valuation model to determine the fair value of stock options. The Black-Scholes model requires the use of certain assumptions, including the volatility of the Company’s stock price (the Company has used the historical volatility in prior periods to determine the estimated compensation expense), the expected life of the option, the expected dividend rate and the discount rate. The Company does not currently expect to change the model or its methods for determining the assumptions underlying the valuation of future stock option grants. For more information on the Company’s stock options and the assumptions used to calculate the expense of such options, please refer to Note 1, “Summary of Significant Accounting Policies,” and Note 18, “Stock Options” to the Company’s Consolidated Financial Statements included in this Annual Report.
Please refer to Note 1, “Summary of Significant Accounting Policies,” to the Consolidated Financial Statements of the Company included in this Annual Report for a detailed discussion of our other significant accounting policies affecting the Company.
51
DISCLOSURE REGARDING FORWARD-LOOKING STATEMENTS
In addition to historical information, this report contains statements which constitute forward-looking statements and information which are based on management’s beliefs, plans, expectations, assumptions and on information currently available to management. The words “may,” “should,” “expect,” “anticipate,” “intend,” “plan,” “continue,” “believe,” “seek,” “estimate,” and similar expressions used in this report that do not relate to historical facts are intended to identify forward-looking statements. The Company notes that a variety of factors could cause its actual results or experience to differ materially from the anticipated results or other expectations described or implied by such forward-looking statements. The risks and uncertainties that may affect the operation, performance, development and results of the business of the Company and the Bank, include, but are not limited to, the following:
| • | the risk of adverse changes in business conditions in the banking industry generally and in the specific markets in which the Company operates; |
| • | changes in the legislative and regulatory environment that negatively impact the Company and the Bank through increased operating expenses; |
| • | increased competition from other financial institutions; |
| • | the impact of technological advances; |
| • | expectations about the movement of interest rates, including actions that may be taken by the Federal Reserve Board in response to changing economic conditions; |
| • | changes in asset quality and loan demand; |
| • | expectations about overall economic strength and the performance of the economy in the Company’s market area; and |
| • | other risks detailed from time to time in the Company’s filings with the Securities and Exchange Commission. |
The Company undertakes no obligation to update or revise any forward-looking statements subsequent to the date on which they are made.
SELECTED FINANCIAL DATA
The following selected financial data has been taken from the Company’s Consolidated Financial Statements and related notes included in this Annual Report and should be read in conjunction with such consolidated financial statements and related notes. Dollar references in all of the following tables are in thousands except for per share data.
52
The major components of the Company’s operating results for the past five years are summarized in Table 1 - Five Year Financial Summary of Consolidated Statements and Related Statistics.
53
TABLE 1 - FIVE YEAR SUMMARY OF CONSOLIDATED STATEMENTS AND RELATED STATISTICS
| 2009 | 2008 | 2007 | 2006 | 2005 | ||||||||||||
| Summary of Earnings |
||||||||||||||||
| Total Interest Income |
$ | 40,889 | $ | 39,558 | $ | 38,100 | $ | 36,487 | $ | 33,044 | ||||||
| Total Interest Expense |
11,336 | 13,775 | 16,763 | 13,181 | 9,847 | |||||||||||
| Provision for loan losses |
3,013 | 1,224 | 784 | (361 | ) | 1,084 | ||||||||||
| Non-interest income |
8,058 | 7,863 | 7,779 | 6,187 | 5,737 | |||||||||||
| Non-interest expense |
25,827 | 21,859 | 19,449 | 18,623 | 17,517 | |||||||||||
| Income tax expense |
1,631 | 2,289 | 1,968 | 2,836 | 2,366 | |||||||||||
| Net Income |
7,139 | 8,274 | 6,914 | 8,395 | 7,966 | |||||||||||
| Per Share Data |
||||||||||||||||
| Earnings-basic |
$ | 1.47 | $ | 1.70 | $ | 1.41 | $ | 1.67 | $ | 1.59 | ||||||
| Earnings-diluted |
1.45 | 1.69 | 1.39 | 1.65 | 1.57 | |||||||||||
| Cash dividends |
0.81 | 0.77 | 0.73 | 0.69 | 0.65 | |||||||||||
| Book value at year end |
15.42 | 14.70 | 14.02 | 13.88 | 12.73 | |||||||||||
| Selected Year End Actual Balances |
||||||||||||||||
| Loans, net of unearned income |
$ | 447,221 | $ | 428,705 | $ | 371,993 | $ | 372,993 | $ | 379,526 | ||||||
| Allowance for loan losses |
5,526 | 4,480 | 3,968 | 3,712 | 4,562 | |||||||||||
| Securities available for sale |
318,404 | 258,023 | 244,720 | 174,617 | 162,203 | |||||||||||
| Earning assets |
764,780 | 682,747 | 613,756 | 552,843 | 542,441 | |||||||||||
| Total assets |
840,004 | 766,047 | 680,904 | 621,197 | 614,827 | |||||||||||
| Deposits |
569,803 | 545,927 | 477,232 | 471,847 | 473,812 | |||||||||||
| Long term borrowings |
74,947 | 80,211 | 49,400 | 59,400 | 60,049 | |||||||||||
| Shareholders’ equity |
74,597 | 71,400 | 68,191 | 69,665 | 63,774 | |||||||||||
| Selected Year End Average Balances |
||||||||||||||||
| Loans, net of unearned income |
$ | 441,841 | $ | 398,184 | $ | 358,178 | $ | 373,729 | $ | 371,925 | ||||||
| Allowance for loan losses |
4,867 | 4,084 | 3,688 | 4,162 | 4,646 | |||||||||||
| Securities available for sale |
288,777 | 227,547 | 201,620 | 160,537 | 156,333 | |||||||||||
| Earning assets |
732,968 | 634,012 | 575,262 | 527,891 | 528,562 | |||||||||||
| Total assets |
806,213 | 702,190 | 639,305 | 604,137 | 591,872 | |||||||||||
| Deposits |
559,036 | 495,428 | 480,191 | 469,460 | 464,629 | |||||||||||
| Long term borrowings |
79,774 | 82,382 | 54,634 | 59,608 | 54,823 | |||||||||||
| Shareholders’ equity |
74,330 | 70,112 | 67,377 | 66,685 | 63,068 | |||||||||||
54
| 2009 | 2008 | 2007 | 2006 | 2005 | |||||||||||
| Selected Ratios |
|||||||||||||||
| Return on average assets |
0.88 | % | 1.18 | % | 1.08 | % | 1.39 | % | 1.35 | % | |||||
| Return on average equity |
9.58 | % | 11.80 | % | 10.26 | % | 12.59 | % | 12.63 | % | |||||
| Dividend payout ratio |
55.10 | % | 45.29 | % | 51.77 | % | 41.32 | % | 40.86 | % | |||||
| Equity to year end assets |
8.88 | % | 9.32 | % | 10.01 | % | 11.21 | % | 10.49 | % | |||||
| Total risk-based capital to risk-adjusted assets |
14.97 | % | 15.70 | % | 17.06 | % | 17.73 | % | 16.20 | % | |||||
| Leverage capital ratio |
8.72 | % | 9.50 | % | 9.98 | % | 11.30 | % | 10.11 | % | |||||
| Efficiency ratio |
66.48 | % | 62.90 | % | 64.41 | % | 60.05 | % | 58.14 | % | |||||
NET OPERATING INCOME
Net operating income for 2009 decreased by 13.7% to $7,138,974, or $1.47 per share-basic and $1.45 per share-diluted, from the $8,273,767, or $1.70 per share basic and $1.69 per share diluted for 2008. The provision for loan losses for 2009 was $3,013,455 compared to the provision of $1,223,939 in 2008. The increase in the loan loss provision for 2009 was mainly due to management’s assessment of inherent losses in the loan portfolio including the impact caused by current local and national economic conditions along with an increase in loans outstanding. Non-interest income increased by $194,573, or 2.5%, and non-interest expense increased by $3,968,264, or 18.2%, in 2009. Non-interest income for 2009 increased due to normal increases in fees and other service charges and an increase in gains on the sale of investment securities in the amount of $565,002. Non-interest expense increased mainly due to an increase in salaries and benefits and a $901,430 increase in FDIC and state assessment expense. The increase in salaries and benefits is related to our new branches in Lauderdale, Oktibbeha and Lamar counties, our new loan production office in Biloxi and normal raises for our existing officers and employees. The increase in FDIC and state assessment includes a $373,125 special assessment paid in June 2009.
Net operating income for 2008 increased by 19.7% to $8,273,767, or $1.70 per share-basic and $1.69 per share-diluted, from the $6,914,234, or $1.41 per share basic and $1.39 per share diluted for 2007. The provision for loan losses for 2008 was $1,223,939 compared to the provision of $784,120 in 2007. The increase in the loan loss provision for 2008 was mainly due to the increase in loans outstanding. Non-interest income increased by $84,410, or 1.1%, and non-interest expense increased by $2,409,763, or 12.4%, in 2008. Non-interest income for 2008 increased due to normal increases in fees and other service charges and non-interest expense increased mainly due to an increase in salaries and benefits. This increase in salaries and benefits is related to our new branches in Lauderdale, Oktibbeha and Lamar counties and normal raises for our existing officers and employees. During the second quarter of 2008, the Bank received proceeds from bank owned life insurance that insured the life of one of its officers. These net proceeds resulted in an additional $772,771 in other income for the second quarter and year to date.
55
Net operating income for 2007 decreased 17.6% to $6,914,234, or $1.41 per share-basic and $1.39 per share-diluted, from the $8,394,524, or $1.67 per share basic and $1.65 per share diluted for 2006. The provision for loan losses for 2007 was $784,120 compared to the negative provision of $360,910 in 2006. Non-interest income increased by $1,591,128, or 25.8%, and non-interest expense increased by $826,100, or 4.4%, in 2007. Non-interest income for 2007 increased due to an increase in dividends from investments related to a commercial sweep account program and non-interest expense increased mainly due to an increase in salaries and benefits. This increase in salaries and benefits is related to our new branches in Lauderdale and Oktibbeha counties and normal raises for our existing officers and employees.
NET INTEREST INCOME
Net interest income is the most significant component of the Company’s earnings. Net interest income is the difference between interest and fees realized on earning assets, primarily loans and securities, and interest paid on deposits and other borrowed funds. The net interest margin is this difference expressed as a percentage of average earning assets. Net interest income is affected by several factors, including the volume of earning assets and liabilities, the mix of earning assets and liabilities, and interest rates. The discussion below is presented on a tax equivalent basis which management believes to be the best way to analyze net interest income.
Net interest income on a tax equivalent basis was $30,808,000, $27,263,000 and $23,760,000 for the years 2009, 2008 and 2007, respectively. Net interest margin was 4.20%, 4.41% and 4.34% for the same periods. During 2009 and 2008, the yields on interest earning assets declined more than the rates paid on interest bearing deposits. The largest change in both years occurred in the rates paid on certificates of deposit. For the year ended December 31, 2009, the average yield on earnings assets was 5.73%, a decrease of 82 basis points compared to the average yield at December 31, 2008. The average rate paid on interest-bearing liabilities was 1.76%, a decrease of 75 basis points compared to the average rate at December 31, 2008. The volume of earning assets increased 18.9% while the volume of interest-bearing liabilities increased 21.5% in 2009.
For the year ended December 31, 2008, the average yield on earnings assets was 6.55%, a decrease of 60 basis points compared to the average yield at December 31, 2007. The average rate paid on interest-bearing liabilities was 2.51%, a decrease of 87 basis points compared to the average rate at December 31, 2007. The volume of earning assets increased 3.53% while the volume of interest-bearing liabilities decreased 13.75% in 2008.
For the year ended December 31, 2007, the average yield on earnings assets was 7.15%, an increase of 18 basis points compared to the average yield at December 31, 2006. The average rate paid on interest-bearing liabilities was 3.38%, an increase of 40 basis points compared to the average rate at December 31, 2006. The volume of earning assets increased 1.4% while the volume of interest-bearing liabilities increased 3.0% in 2007.
56
During this three-year period, loan demand has remained steady and has allowed the Company to continue to invest its available funds in loans. Loans generally provide the Company with yields that are greater than the yields on typical investment securities.
During 2003, the Company purchased $11.4 million of additional bank-owned life insurance. The income received by the Company on these policies increased the Company’s total investment to approximately $17.7 million at December 31, 2007, $18.0 million at December 31, 2008 and $18.8 million at December 2009. The additional purchases were made to provide a future funding source for certain of the Company’s deferred compensation arrangements. Such insurance also offers more attractive yields than other investment securities.
Table 2 – Average Balance Sheets and Interest Rates sets forth average balance sheet data, including all major categories of interest-earning assets and interest-bearing liabilities, together with the interest earned or interest paid and the average yield or average rate paid on each such category for the fiscal years ended December 31, 2009, 2008 and 2007.
57
TABLE 2 – AVERAGE BALANCE SHEETS AND INTEREST RATES
| Average Balance | Income/Expense | Average Yield/Rate | |||||||||||||||||||||||||
| 2009 | 2008 | 2007 | 2009 | 2008 | 2007 | 2009 | 2008 | 2007 | |||||||||||||||||||
| Loans: |
|||||||||||||||||||||||||||
| Loans, net of unearned |
$ | 441,247 | $ | 397,488 | $ | 357,323 | $ | 29,388 | $ | 29,438 | $ | 28,985 | 6.66 | % | 7.39 | % | 8.11 | % | |||||||||
| Investment Securities |
|||||||||||||||||||||||||||
| Taxable |
196,217 | 128,496 | 93,594 | 7,875 | 6,578 | 4,928 | 4.01 | % | 5.12 | % | 5.27 | % | |||||||||||||||
| Tax-exempt |
89,386 | 78,843 | 76,803 | 4,838 | 4,325 | 4,247 | 5.41 | % | 5.49 | % | 5.53 | % | |||||||||||||||
| Total Investment Securities |
285,603 | 207,339 | 170,397 | 12,713 | 10,903 | 9,175 | 4.45 | % | 5.26 | % | 5.38 | % | |||||||||||||||
| Federal Funds Sold and Other |
7,540 | 12,875 | 19,976 | 15 | 223 | 1,021 | 0.20 | % | 6.55 | % | 5.11 | % | |||||||||||||||
| Total Interest Earning Assets |
734,390 | 617,702 | 547,696 | 42,116 | 40,564 | 39,181 | 5.73 | % | 6.55 | % | 7.15 | % | |||||||||||||||
| Non-Earning Assets |
71,823 | 84,488 | 91,609 | ||||||||||||||||||||||||
| Total Assets |
$ | 806,213 | $ | 702,190 | $ | 639,305 | |||||||||||||||||||||
| Deposits: |
|||||||||||||||||||||||||||
| Interest-bearing Demand Deposits |
$ | 161,362 | $ | 154,909 | $ | 149,111 | $ | 1,198 | $ | 1,823 | $ | 2,805 | 0.74 | % | 1.18 | % | 1.88 | % | |||||||||
| Savings |
33,422 | 31,057 | 30,775 | 182 | 264 | 262 | 0.55 | % | 0.85 | % | 0.85 | % | |||||||||||||||
| Time |
278,439 | 227,562 | 220,364 | 6,531 | 7,787 | 9,724 | 2.35 | % | 3.41 | % | 4.41 | % | |||||||||||||||
| Total Deposits |
473,223 | 413,528 | 400,250 | 7,911 | 9,874 | 12,791 | 1.67 | % | 2.38 | % | 3.20 | % | |||||||||||||||
| Borrowed Funds |
|||||||||||||||||||||||||||
| Short-term Borrowings |
87,169 | 31,316 | 1,892 | 824 | 579 | 96 | 0.95 | % | 1.85 | % | 5.07 | % | |||||||||||||||
| Long-term Borrowings |
79,079 | 81,467 | 53,482 | 2,573 | 2,848 | 2,534 | 3.21 | % | 3.44 | % | 4.74 | % | |||||||||||||||
| Total Borrowed Funds |
166,248 | 112,783 | 55,374 | 3,397 | 3,427 | 2,630 | 2.04 | % | 3.04 | % | 4.75 | % | |||||||||||||||
| Total Interest-Bearing Liabilities |
639,471 | 526,311 | 455,624 | 11,308 | 13,301 | 15,421 | 1.76 | % | 2.51 | % | 3.38 | % | |||||||||||||||
| Non-Interest Bearing Liabilities |
|||||||||||||||||||||||||||
| Demand Deposits |
85,057 | 79,330 | 79,187 | ||||||||||||||||||||||||
| Other Liabilities |
7,355 | 26,437 | 37,117 | ||||||||||||||||||||||||
| Shareholders’ Equity |
74,330 | 70,112 | 67,377 | ||||||||||||||||||||||||
| Total Liabilities and Shareholders’ Equity |
$ | 806,213 | $ | 702,190 | $ | 639,305 | |||||||||||||||||||||
| Interest Rate Spread |
3.97 | % | 4.04 | % | 3.77 | % | |||||||||||||||||||||
| Net Interest Margin |
$ | 30,808 | $ | 27,263 | $ | 23,760 | 4.20 | % | 4.41 | % | 4.34 | % | |||||||||||||||
| Less |
|||||||||||||||||||||||||||
| Tax Equivalent Adjustment |
1,237 | 1,108 | 1,081 | ||||||||||||||||||||||||
| Net Interest Income |
$ | 29,571 | $ | 26,155 | $ | 22,679 | |||||||||||||||||||||
58
Table 3 – Net Average Interest Earning Assets illustrates net interest earning assets and liabilities for 2009, 2008, and 2007.
TABLE 3 – NET AVERAGE INTEREST EARNING ASSETS
| 2009 | 2008 | 2007 | |||||||
| Average interest earning assets |
$ | 734,390 | $ | 617,702 | $ | 547,696 | |||
| Average interest bearing liabilities |
639,471 | 526,311 | 455,624 | ||||||
| Net average interest earning assets |
$ | 94,919 | $ | 91,391 | $ | 92,072 | |||
Table 4 – Volume/Rate Analysis depicts the effect on interest income and interest expense of changes in volume and changes in rate from 2007 through 2009. Variances which were attributable to both volume and rate are allocated proportionately between rate and volume using the absolute values of each for a basis for the allocation. Non-accruing loans are included in the average loan balances used in determining the yields. Interest income on tax-exempt securities and loans has been adjusted to a tax equivalent basis using a federal income tax rate of 34%.
TABLE 4 – VOLUME/RATE ANALYSIS
| 2009 Change from 2008 | 2008 Change from 2007 | |||||||||||||||||||||||
| Volume | Rate | Total | Volume | Rate | Total | |||||||||||||||||||
| INTEREST INCOME |
||||||||||||||||||||||||
| Loans |
$ | 2,914 | (2,964 | ) | $ | (50 | ) | $ | (1,246 | ) | $ | 1,311 | $ | 65 | ||||||||||
| Taxable Securities |
2,718 | (1,421 | ) | 1,297 | 988 | 288 | 1,276 | |||||||||||||||||
| Non-Taxable Securities |
571 | (58 | ) | 513 | (399 | ) | (63 | ) | (462 | ) | ||||||||||||||
| Federal Funds Sold and Other |
(11 | ) | (197 | ) | (208 | ) | 570 | 44 | 614 | |||||||||||||||
| TOTAL INTEREST INCOME |
$ | 6,192 | $ | (4,640 | ) | $ | 1,552 | $ | (87 | ) | $ | 1,580 | $ | 1,493 | ||||||||||
| INTEREST EXPENSE |
||||||||||||||||||||||||
| Interest-bearing demand deposits |
$ | 48 | (673 | ) | (625 | ) | $ | 90 | $ | 187 | 277 | |||||||||||||
| Savings Deposits |
13 | (95 | ) | (82 | ) | (30 | ) | (21 | ) | (51 | ) | |||||||||||||
| Time Deposits |
1,196 | (2,452 | ) | (1,256 | ) | 775 | 1,475 | 2,250 | ||||||||||||||||
| Short-term borrowings |
528 | (283 | ) | 245 | 40 | (4 | ) | 36 | ||||||||||||||||
| Long-term borrowings |
(77 | ) | (198 | ) | (275 | ) | (290 | ) | 17 | (273 | ) | |||||||||||||
| TOTAL INTEREST EXPENSE |
$ | 1,708 | $ | (3,701 | ) | (1,993 | ) | $ | 585 | $ | 1,654 | 2,239 | ||||||||||||
| NET INTEREST INCOME |
$ | 4,484 | $ | (939 | ) | $ | 3,545 | $ | (672 | ) | $ | (74 | ) | $ | (746 | ) | ||||||||
59
LOANS
The loan portfolio constitutes the major earning asset of the Company and, in the opinion of management, offers the best alternative for maximizing net interest margin. The Company’s loan personnel have the authority to extend credit under guidelines established and approved by the Board of Directors. Any aggregate credit that exceeds the authority of the loan officer is forwarded to the Board’s loan committee for approval. The loan committee is composed of certain directors, including the Chairman of the Board. All aggregate credits that exceed the loan committee’s lending authority are presented to the full Board of Directors for ultimate approval or denial. The loan committee not only acts as an approval body to ensure consistent application of the Company’s loan policy but also provides valuable insight through communication and pooling of knowledge, judgment, and experience of its members.
The Company has stated in its loan policy the following objectives for its loan portfolio:
| • | to make loans after sound and thorough credit analysis; |
| • | to properly document all loans; |
| • | to eliminate loans from the portfolio that are under-priced, high risk or difficult and costly to administer; |
| • | to seek good relationships with the customer; |
| • | to avoid undue concentrations of loans; and |
| • | to keep non-accrual loans to a minimum by aggressive collection policies. |
Loan demand in the Company’s market over the past three years declined in 2007 before increasing in 2008 and 2009. In general, the Company’s loan balances increased in 2008 in large part to the expansion into several new markets and the increased presence in the Meridian market and the addition of the Biloxi loan production office. The change in loan demand experienced in 2007 was due to a lack of growth in the market area served by the Company and increased competition from other financial institutions for the available loans. The impact on the housing market caused by the opening of a casino on the nearby Choctaw Indian Reservation in 1995 is beginning to show less of an impact in the area. The impact on the loan portfolio attributable to Hurricane Katrina rebuilding contracts has also lessened, as these loans were repaid in early 2006 as the rebuilding contracts were completed. Real estate mortgage loans originated by the Company increased by 1.4%, or $1,947,501, in 2009, by 15.3%, or $18,237,568, in 2008, and by 3.5%, or $3,968,856, in 2007 compared to the prior year. The growth in mortgage loans in all years was the result of normal growth in our market area.
Commercial and agricultural loans increased by $15,898,110 or 7.6% in 2009, increased by $32,485,352, or 18.3% in 2008, and declined by $8,415,346, or 4.5%, in 2007. Several large loans were paid off in 2007, which were not replaced with other loans or renewals.
60
Commercial and agricultural loans are the largest segment of the loan portfolio and, by nature, bear a higher degree of risk. Management believes the lending practices, policies and procedures applicable to this loan category are adequate to manage any risk represented by the growth of the loans in this category.
Consumer loans declined by $5,320,314, or 9.7% in 2009, declined by $2,000,783, or 3.5% in 2008 and declined by $4,857,228, or 7.9%, in 2007, compared to the prior year. The Company believes that changes in consumer purchasing habits and the increase in loan sources have affected the growth of this segment of loans. Sustained low unemployment may also have lessened the dependence on consumer loans for some purchases.
Table 5 – Loans Outstanding reflects outstanding balances by loan type for the past five years. Additional loan information is presented in Note 5, “Loans,” to the Company’s Consolidated Financial Statements included in this Annual Report.
TABLE 5 – LOANS OUTSTANDING
| AT DECEMBER 31, | |||||||||||||||
| 2009 | 2008 | 2007 | 2006 | 2005 | |||||||||||
| Commercial, financial and agricultural |
$ | 226,171 | $ | 210,272 | $ | 177,787 | $ | 186,202 | $ | 213,444 | |||||
| Real estate - construction |
32,599 | 26,654 | 18,821 | 11,047 | 8,779 | ||||||||||
| Real estate - mortgage |
139,357 | 137,410 | 119,172 | 115,203 | 90,952 | ||||||||||
| Consumer |
49,393 | 54,714 | 56,714 | 61,572 | 67,712 | ||||||||||
| TOTAL LOANS |
$ | 447,520 | $ | 429,050 | $ | 372,494 | $ | 374,024 | $ | 380,887 | |||||
Table 6 – Loan Liquidity and Sensitivity to Changes in Interest Rates reflects the maturity schedule or repricing frequency of all loans. Also presented are fixed and variable rate loans maturing after one year.
TABLE 6 – LOAN LIQUIDITY
| LOAN MATURITIES AT DECEMBER 31, 2009 | ||||||||||||
| 1 YEAR OR LESS |
1 - 5 YEARS |
OVER 5 YEARS |
Total | |||||||||
| Commercial, financial and agricultural |
$ | 45,578 | $ | 162,584 | $ | 12,442 | $ | 220,604 | ||||
| Real estate - construction |
23,935 | 8,475 | 189 | $ | 32,599 | |||||||
| Real estate - mortgage |
14,283 | 98,545 | 31,504 | $ | 144,332 | |||||||
| Consumer |
22,736 | 25,087 | 2,162 | $ | 49,985 | |||||||
| Total loans |
$ | 106,532 | $ | 294,691 | $ | 46,297 | $ | 447,520 | ||||
61
| SENSITIVITY TO CHANGES IN INTEREST RATES | ||||||
| 1 - 5 YEARS |
OVER 5 YEARS | |||||
| Fixed rates |
$ | 276,597 | $ | 33,243 | ||
| Variable rates |
18,094 | 13,054 | ||||
| Total loans |
$ | 294,691 | $ | 46,297 | ||
Each loan the Company makes either has a stated maturity as to when the loan is to be repaid or is subject to an agreement between the Company and the customer governing its progressive reduction. The Company’s policy is that every loan is to be repaid by its stated maturity and not carried as a continuing debt. Generally, the Company requires that principal reductions on a loan must have begun prior to the second renewal date of the loan.
PROVISION FOR LOAN LOSSES AND ASSET QUALITY
The allowance for loan losses represents an amount that in management’s judgment will be adequate to absorb estimated probable losses within the existing loan portfolio. Loans that management determines to be uncollectible are charged against the allowance for loan losses, and subsequent recoveries, if any, are credited to the allowance. Management’s judgment in determining the adequacy of the allowance is based on evaluations of the collectibility of specific loans and prior loss experience. Other factors considered by management include specific economic events, general economic conditions and trends, and loan portfolio mix and growth. The allowance for loan losses is subject to close regulatory review from the FDIC and the Mississippi Department of Banking and Consumer Finance and is also a factor in each agency’s determination of our capital adequacy. The estimation of losses in our loan portfolio is susceptible to changes resulting from changes in the financial condition of individual borrowers and economic conditions in the Company’s market area.
The allowance for loan losses is established through a provision for loan losses charged against net income. This expense is determined by a number of factors, including historical loan losses, assessment of specific credit weaknesses within the portfolio, assessment of the prevailing economic climate, and other factors that may affect the overall condition of the loan portfolio. Management utilized these factors to determine the provision for loan losses for each of 2007, 2008 and 2009. The ratio of net loans charged off to average loans was 0.45% in 2009, 0.18% in 2008 and 0.15% in 2007. The percentages in 2008 and 2007 are representative of normal loan charge-offs while the charge-offs in 2009 reflect the weakness of the economy and the continuing local and national high unemployment. Management evaluates the adequacy of the allowance for loan loss on a monthly basis and makes adjustments to the allowance based on this analysis.
The provision for loan losses in 2009 was $3,013,455 compared to $1,223,939 in 2008 and $784,120 in 2007. The increase in the provision for 2009 was mainly due to the increase in loans outstanding and management’s assessment of inherent losses in the loan portfolio including the impact caused by current local and national economic conditions. The Company uses a
62
model that takes into account historical charge-offs and recoveries and applies that to certain loan segments of our portfolio. At the end of 2009, the total allowance for loan losses was $5,525,903, an amount that management believes to be sufficient to cover estimated probable losses in the loan portfolio.
Activity in the allowance for loan losses is reflected in Table 7 – Analysis of Allowance for Loan Losses. The Company’s policy is to charge-off loans when in management’s opinion the loan is deemed uncollectible. Even after it is charged off, however, the Company makes concerted efforts to maximize recovery of such loan.
63
TABLE 7 – ANALYSIS OF ALLOWANCE FOR LOAN LOSSES
| 2009 | 2008 | 2007 | 2006 | 2005 | ||||||||||||||||
| BALANCE AT BEGINNING OF YEAR |
$ | 4,480 | $ | 3,967 | $ | 3,712 | $ | 4,562 | $ | 4,721 | ||||||||||
| LOANS CHARGED-OFF |
||||||||||||||||||||
| Commercial, financial and agricultural |
1,038 | 350 | 404 | 101 | 861 | |||||||||||||||
| Real estate - construction |
— | 15 | — | 72 | — | |||||||||||||||
| Real estate - mortgage |
746 | 198 | 211 | 30 | 64 | |||||||||||||||
| Consumer |
394 | 345 | 272 | 577 | 642 | |||||||||||||||
| TOTAL CHARGE-OFFS |
2,178 | 908 | 887 | 780 | 1,567 | |||||||||||||||
| CHARGE-OFFS RECOVERED |
||||||||||||||||||||
| Commercial, financial and agricultural |
52 | 57 | 36 | 37 | 189 | |||||||||||||||
| Real estate - construction |
2 | 2 | — | — | — | |||||||||||||||
| Real estate - mortgage |
40 | 33 | 63 | — | 2 | |||||||||||||||
| Consumer |
117 | 105 | 259 | 254 | 133 | |||||||||||||||
| TOTAL RECOVERIES |
211 | 197 | 358 | 291 | 324 | |||||||||||||||
| Net loans charged-off |
1,967 | 711 | 529 | 489 | 1,243 | |||||||||||||||
| Additions charged to operating expense |
3,013 | 1,224 | 784 | (361 | ) | 1,084 | ||||||||||||||
| BALANCE AT END OF YEAR |
$ | 5,526 | $ | 4,480 | $ | 3,967 | $ | 3,712 | $ | 4,562 | ||||||||||
| Loans, net of unearned, at year end |
$ | 447,221 | $ | 428,705 | $ | 371,993 | $ | 372,993 | $ | 379,526 | ||||||||||
| Ratio of allowance to loans at year end |
1.24 | % | 1.05 | % | 1.07 | % | 1.00 | % | 1.20 | % | ||||||||||
| Average loans - net of unearned |
$ | 441,841 | $ | 398,184 | $ | 358,178 | $ | 373,729 | $ | 371,925 | ||||||||||
| Ratio of net loans charged-off to average loans |
0.45 | % | 0.18 | % | 0.15 | % | 0.13 | % | 0.33 | % | ||||||||||
| LOSSES |
||||||||||||||||||||
64
ALLOCATION OF ALLOWANCE FOR LOAN LOSSES
| AT DECEMBER 31, | |||||||||||||||
| 2009 | 2008 | 2007 | 2006 | 2005 | |||||||||||
| Commercial, financial and agricultural |
$ | 2,975 | $ | 2,588 | $ | 2,080 | $ | 1,163 | $ | 1,713 | |||||
| Real estate - construction |
161 | 224 | 160 | 200 | 300 | ||||||||||
| Real estate - mortgage |
1,401 | 518 | 517 | 900 | 900 | ||||||||||
| Consumer |
989 | 1,150 | 1,211 | 1,350 | 1,550 | ||||||||||
| Unallocated |
— | — | — | 99 | 99 | ||||||||||
| Total |
$ | 5,526 | $ | 4,480 | $ | 3,968 | $ | 3,712 | $ | 4,562 | |||||
COMPOSITION OF LOAN PORTFOLIO BY TYPE
| AT DECEMBER 31, | |||||||||||||||
| 2009 | 2008 | 2007 | 2006 | 2005 | |||||||||||
| Commercial, financial and agricultural |
50.54 | % | 49.01 | % | 47.72 | % | 49.79 | % | 56.04 | % | |||||
| Real estate - construction |
7.28 | % | 6.21 | % | 5.05 | % | 2.95 | % | 2.30 | % | |||||
| Real estate - mortgage |
31.14 | % | 32.03 | % | 31.99 | % | 30.80 | % | 23.88 | % | |||||
| Consumer |
11.04 | % | 12.75 | % | 15.24 | % | 16.46 | % | 17.78 | % | |||||
| 100.00 | % | 100.00 | % | 100.00 | % | 100.00 | % | 100.00 | % | ||||||
Loan balances outstanding declined in 2007 before increasing in 2008 and 2009, even though our credit standards have tightened and the competition for loans has increased. The table above illustrates that we had growth in the mortgage real estate, construction real estate and commercial, financial and agricultural categories; however, the Company has shown declines in consumer loans, as a percentage of total loans. The most significant portion of the growth occurred in the mortgage real estate category, primarily on account of the reclassification of certain loans into the mortgage real estate category, as discussed previously. Notwithstanding this growth, a larger portion of the allowance for loan losses is allocated to commercial, financial and agricultural loans and consumer loans. This reflects the higher risks associated with commercial and consumer lending as compared to real estate mortgages and construction loans.
Non-performing assets and the relative percentages of such assets to loan balances are presented in Table 8 – Non-performing Assets. Non-performing loans include non-accrual loans, loans delinquent 90 days or more based on contractual terms and troubled debt restructurings (within the meaning of FASB ASC 310-40-30, Receivables: Troubled Debt Restructuring: Initial Measurement). Management classifies loans as non-accrual when it believes that collection of interest is doubtful. This typically occurs when payments are past due over 90 days, unless the loans are well secured and in the process of collection. Another measurement of asset quality is other real estate owned (OREO), which represents properties acquired by the Company through foreclosure following loan defaults by customers. The percentage of OREO to total loans at December 31, 2009 was 0.72% compared to 0.79% in 2008. OREO decreased in 2009 due to the sale of several parcels that were acquired in foreclosure and a write-down of several parcels to fair market value.
65
Loans on non-accrual status amounted to $9,794,154 in 2009 as compared to $1,396,885 in 2008 and $1,441,251 in 2007. Interest income forgone on loans classified as non-accrual in 2009 was $1,025,926 as compared to $105,395 in 2008 and $102,452 in 2007. Upon the classification of a loan as non-accrual, all interest accrued on the loan prior to the time it is classified as non-accrual is reversed and interest accruals are suspended until such time that the loan is in compliance with its terms and/or deemed collectable.
TABLE 8 – NON-PERFORMING ASSETS
| As of December 31, | ||||||||||||||||||||
| 2009 | 2008 | 2007 | 2006 | 2005 | ||||||||||||||||
| PRINCIPAL BALANCE |
||||||||||||||||||||
| Non-accrual |
$ | 9,794 | $ | 1,397 | $ | 1,441 | $ | 1,629 | $ | 4,347 | ||||||||||
| Accruing loans 90 days or more past due |
1,291 | 911 | 526 | 1,355 | 911 | |||||||||||||||
| TOTAL LOANS |
$ | 11,085 | $ | 2,308 | $ | 1,967 | $ | 2,984 | $ | 5,258 | ||||||||||
| TOTAL NON-PERFORMING LOANS |
$ | 11,085 | $ | 2,308 | $ | 1,967 | $ | 2,984 | $ | 5,258 | ||||||||||
| Income on non-accrual loans not recorded |
$ | 1,026 | $ | 105 | $ | 102 | $ | 123 | $ | 349 | ||||||||||
| Non-performing as a percent of loans |
2.51 | % | 0.54 | % | 0.53 | % | 0.80 | % | 1.39 | % | ||||||||||
| Other real estate owned |
$ | 3,229 | $ | 3,375 | $ | 2,047 | $ | 2,708 | $ | 2,975 | ||||||||||
| OREO as a percent of loans |
0.73 | % | 0.79 | % | 0.55 | % | 0.73 | % | 0.78 | % | ||||||||||
| Allowance as a percent of non-performing loans |
49.95 | % | 194.11 | % | 201.73 | % | 124.40 | % | 86.76 | % | ||||||||||
ASC Subtopic 310-10, Loan Impairments was effective January 1, 1995. These statements changed the methods of estimating the loan loss allowance for problem loans. In general, when management determines that principal and interest due under the contractual terms of a loan are not fully collectible, management must value the loan using discounted future expected cash flows. Management considers the Company’s nonaccrual loans as being impaired under ASC Subtopic 310-10. The balances of impaired (including non-accruals) loans for the years 2009, 2008 and 2007 were $9,899,113, $1,396,885 and $1,441,251, respectively.
66
This table details the impaired loans by category for years ending 2009, 2008 and 2007.
| AT DECEMBER 31, | |||||||||
| 2009 | 2008 | 2007 | |||||||
| Commercial, financial and agricultural |
$ | 7,696,941 | $ | 449,527 | $ | 47,895 | |||
| Real estate - construction |
289,731 | — | — | ||||||
| Real estate - mortgage |
1,679,307 | 252,129 | 157,670 | ||||||
| Consumer |
233,134 | 31,693 | 38,380 | ||||||
| Total loans |
$ | 9,899,113 | $ | 733,349 | $ | 243,945 | |||
Management monitors any loans that are classified under FDIC regulations as loss, doubtful or substandard, even if management has not classified the loans as non-performing or impaired. In addition to loans classified for regulatory purposes, management also designates certain loans for internal monitoring purposes in a “watch” category. Loans may be placed on management’s watch list as a result of delinquent status, management’s concern about the borrower’s financial condition or the value of the collateral securing the loan, a substandard classification during regulatory examinations, or simply as a result of management’s desire to monitor more closely a borrower’s financial condition and performance. Watch category loans may include loans that are still performing and accruing interest and may be current under the terms of the loan agreement but which management has a significant degree of concern about the borrowers’ ability to continue to perform according to the terms of the loan agreement. Watch category loans may also include loans, which, although adequately secured and performing, reflect a past delinquency problem or unfavorable financial trends exhibited by the borrower. Loss exposure on these loans is typically evaluated based primarily upon the estimated liquidation value of the collateral securing the loan.
At December 31, 2009, loans totaling $29,160,110 were included on the watch list of the Company compared to $18,259,591 at December 31, 2008. The majority of these loans are real estate loans that, although adequately collateralized, have experienced frequent delinquencies in scheduled payments. The inclusion of loans on this list does not indicate a greater risk of loss; rather it indicates that the loan possesses one of the several characteristics described above warranting increased oversight by management. During 2009, additional loans were added to the watch list due to the uncertainties in the current economic conditions.
SECURITIES
At December 31, 2009, the Company classified all of its securities as available-for-sale. Securities available-for-sale are reported at fair value, with unrealized gains and losses included as a separate component of equity, net of tax. The Company does not hold any securities classified as held to maturity or held for trading purposes.
Table 9 – Securities and Securities Maturity Schedule summarizes the carrying value of securities from 2007 through 2009 and the maturity distribution at December 31, 2009, by classification.
67
TABLE 9 – SECURITIES
| 2009 | 2008 | 2007 | |||||||
| SECURITIES AVAILABLE FOR SALE |
|||||||||
| U. S. Government Agencies |
$ | 213,307 | $ | 170,552 | $ | 95,511 | |||
| State, County and Muncipal Obligations |
98,119 | 80,717 | 77,072 | ||||||
| Other Securities |
6,978 | 6,754 | 72,137 | ||||||
| TOTAL SECURITIES AVAILABLE FOR SALE |
$ | 318,404 | $ | 258,023 | $ | 244,720 | |||
SECURITIES MATURITY SCHEDULE
| 1 year or less | 1 to 5 years | 5 to 10 years | over 10 years | |||||||||||||||||||||
| Actual Balance |
Average Yield |
Actual Balance |
Average Yield |
Actual Balance |
Average Yield |
Actual Balance |
Average Yield |
|||||||||||||||||
| AVAILABLE-FOR-SALE |
||||||||||||||||||||||||
| U. S. Government Agencies(1) |
$ | 765 | 5.36 | % | $ | 0 | 0.00 | % | $ | 4,817 | 3.83 | % | $ | 207,725 | 3.70 | % | ||||||||
| State, County and Municipal(2) |
2,237 | 5.86 | % | 13,323 | 5.88 | % | 26,554 | 5.71 | % | 56,005 | 5.96 | % | ||||||||||||
| Other Securities |
4,833 | 3.58 | % | 0 | 0.00 | % | 0 | 0.00 | % | 2,145 | 2.69 | % | ||||||||||||
| TOTAL AVAILABLE-FOR-SALE |
$ | 7,835 | 4.40 | % | $ | 13,323 | 5.88 | % | $ | 31,371 | 5.42 | % | $ | 265,875 | 4.17 | % | ||||||||
| (1) | The maturities for the mortgage backed securities included in this line item are based on final maturity. |
| (2) | Average rates were calculated on tax equivalent basis using a marginal federal income tax rate of 34% and a state tax rate of 5%. |
The change in the carrying value of the available-for-sale portfolio is due to market value fluctuations resulting from the changing interest rate environment during 2009. This change is not used in the Tier 1 capital calculation.
The above table shows an increase in all categories of investments during 2009 with the biggest increase in U. S. Government Agencies. The majority of this increase was to purchase securities for our commercial repurchase agreement program with certain customers. As a result of this commercial repurchase agreement program, the Company increased its margin on the balances in this program. The Company strives to maximize the yields on its portfolio while balancing pledging needs and managing risk. The Company seeks to investment most of it funds not needed for loan demand in higher yielding securities and not in the lower yielding federal funds sold.
68
DEPOSITS
The Company offers a wide variety of deposit services to individual and commercial customers, such as non-interest-bearing and interest-bearing checking accounts, savings accounts, money market deposit accounts and certificates of deposit. The deposit base is the Company’s major funding source for earning assets. Time deposits increased in 2009 due to normal growth, no aggressive pricing strategies were employed to increase its market share. During this time, all other segments of deposits increased as well.
A three-year schedule of deposits by type and maturities of time deposits greater than $100,000 is presented in Table 10 – Deposit Information.
TABLE 10 – DEPOSIT INFORMATION
| 2009 | 2008 | 2007 | ||||||||||||||||
| Average Balance |
Average Rate |
Average Balance |
Average Rate |
Average Balance |
Average Rate |
|||||||||||||
| Noninterest-bearing |
$ | 85,057 | $ | 81,194 | $ | 78,225 | ||||||||||||
| Interest-bearing demand |
161,362 | 0.75 | % | 154,909 | 1.18 | % | 149,111 | 1.89 | % | |||||||||
| Savings |
34,178 | 0.55 | % | 31,763 | 0.85 | % | 29,764 | 0.85 | % | |||||||||
| Certificates of deposit |
278,439 | 2.35 | % | 227,562 | 3.41 | % | 224,941 | 4.41 | % | |||||||||
| $ | 559,036 | 1.67 | % | $ | 495,428 | 1.99 | % | $ | 482,041 | 2.70 | % | |||||||
MATURITY RANGES OF TIME CERTIFICATES OF DEPOSIT
OF $100,000 OR MORE
| AS OF DECEMBER 31, 2009 | |||
| 3 months or less |
$ | 51,384 | |
| 3 through 6 months |
63,782 | ||
| 6 through 12 months |
21,835 | ||
| over 12 months |
5,311 | ||
| $ | 142,312 | ||
The Company in its normal course of business will acquire large certificates of deposit, generally from public entities, with a variety of maturities. These funds are acquired on a bid basis and are considered to be part of the deposit base of the Company.
BORROWINGS
Aside from the core deposit base and large denomination certificates of deposit mentioned above, the remaining funding sources utilized by the Company include short-term and long-term borrowings. Short-term borrowings consist of Federal Funds Purchased from other financial institutions on an overnight basis and short-term advances from the FHLB. Long-term borrowings are advances from the FHLB with an initial maturity of greater than one year.
69
TABLE 11 - SHORT-TERM BORROWINGS
| As of December 31, | ||||||||||||
| 2009 | 2008 | 2007 | ||||||||||
| Short-term borrowings |
||||||||||||
| Year-end balance |
$ | 114,753 | $ | 62,441 | $ | 79,163 | ||||||
| Weighted average rate |
0.95 | % | 1.46 | % | 3.96 | % | ||||||
| Maximum month-end balance |
$ | 141,588 | $ | 62,441 | $ | 79,163 | ||||||
| Year to date average balance |
$ | 87,169 | $ | 31,316 | $ | 31,916 | ||||||
| Weighted average rate |
0.95 | % | 1.82 | % | 4.43 | % | ||||||
The Company borrows funds for short periods from the FHLB as an alternative to Federal Funds Purchased. The Company foresees short-term borrowings to be a continued source of liquidity and likely will continue to use these borrowings as a method to fund short-term needs. At December 31, 2009, the Company had the capacity to borrow up to $229,154,830 from the FHLB and other financial institutions in the form of Federal Funds Purchased. The Company generally will use these types of borrowings if loan demand is greater than the growth in deposits. In 2009, the Company decreased its borrowings from the FHLB by $5,000,000 and decreased its Federal Funds Purchased by $21,000,000. In 2008, the sweep account liability of $74,963,424 was eliminated with the termination of the old sweep program and replaced with securities sold under agreement to repurchase in the amount of $41,441,052, resulting in a net decrease of $33,522,372, or 44.7%. This decrease was the result of decreased balances in the existing accounts greater than the amount of new accounts added. In 2009, these balances increased to $114,753,010, an increase of $73,311,958, or 176.9%.
The Company at the end of 2009 had long-term debt in the amount of $74,400,000 to the FHLB for advances and $547,228 payable to the State of Mississippi for advances under the Mississippi Agribusiness Enterprise Loan Program. This program provides interest-free loans to banks to fund loans to qualifying farmers. Farmers that qualify for the program receive 20% of their loan at zero interest. When the loan is repaid, the State of Mississippi receives 20% of the principal payment, which is equal to the amount advanced by the state, and the Company retains the balance of the principal payment. The remaining maturity schedule of the long-term debt at December 31, 2009 is listed below.
| 2009 | |||
| Less than one year |
$ | 2,082 | |
| One year to three years |
3,960 | ||
| Over three years |
68,905 | ||
| Total long-term borrowings |
$ | 74,947 | |
70
NON-INTEREST INCOME AND EXPENSE
Table 12 - Non-Interest Income and Expense illustrates the Company’s non-interest income and expense from 2007 through 2009 and percentage changes between such years.
TABLE 12 - NON-INTEREST INCOME & EXPENSE
| 2009 | % CHANGE FROM ’08 |
2008 | % CHANGE FROM ’07 |
2007 | |||||||||||
| NON-INTEREST INCOME |
|||||||||||||||
| Service charges on deposit accounts |
$ | 4,111 | 1.66 | % | $ | 4,044 | 4.77 | % | $ | 3,860 | |||||
| Other operating income |
3,947 | 3.35 | % | 3,819 | -2.55 | % | 3,919 | ||||||||
| TOTAL NON-INTEREST INCOME |
$ | 8,058 | 2.48 | % | $ | 7,863 | 1.08 | % | $ | 7,779 | |||||
| NON-INTEREST EXPENSE |
|||||||||||||||
| Salaries and employee benefits |
$ | 13,258 | 9.99 | % | $ | 12,054 | 14.36 | % | $ | 10,540 | |||||
| Occupancy expense, including equipment |
4,183 | 12.02 | % | 3,734 | 16.07 | % | 3,217 | ||||||||
| Other operating expense |
8,386 | 38.13 | % | 6,071 | 6.66 | % | 5,692 | ||||||||
| TOTAL NON-INTEREST EXPENSE |
$ | 25,827 | 18.15 | % | $ | 21,859 | 12.39 | % | $ | 19,449 | |||||
Non-interest income typically consists of service charges on checking accounts, including debit card fees, and other financial services. With continued pressure on interest rates, the Company has sought to increase its non-interest income through the expansion of fee income and the development of new services. Currently, the Company’s main sources of non-interest income are service charges on checking accounts, safe deposit box rentals, credit life insurance premiums, title insurance service fees and income contributions from the Company’s credit life insurance subsidiary.
During 2009, non-interest income increased by $194,573, or 2.5%, when compared to 2008. An increase in service charge income from checking accounts and proceeds from gains on sales of investment securities offset a decrease in other income that resulted from the one time receipt of insurance proceeds on the death of a bank officer in 2008.
During 2008, non-interest income increased by $84,410, or 1.1%, when compared to 2007. An increase in service charge income from checking accounts and proceeds from insurance offset by a decrease in dividends received from our sweep program assets were the main sources of this increase. During the second quarter of 2008, the Bank received proceeds from bank owned life insurance that insured the life of one of its officers. These net proceeds resulted in an additional $772,771 in other income for the year.
During 2007, non-interest income increased by $1,591,128, or 25.7%, when compared to 2006. Service charge income from checking accounts and an increase in dividends received from our sweep program assets were the main sources of this increase.
71
Non-interest expenses consist of salaries and benefits, occupancy expense and other overhead expenses incurred by the Company in the transaction of its business. In 2009, non-interest expense increased by $3,968,264, or 18.2%, to $25,827,309. Included in this was an increase in salaries and benefits in the amount of $1,203,696, or 10.0% and an increase in FDIC and state assessments in the amount of $901,430, or 698.0%. Included in the FDIC assessments was a special assessment of $373,125 paid in June of 2009.
In 2008, non-interest expense increased by $2,409,763, or 12.4%, to $21,859,046. Included in this was an increase in salaries and benefits in the amount of $1,514,334, or 7.8%.
In 2007, non-interest expense increased by $826,100, or 4.4%, to $19,449,283. Included in this was an increase in salaries and benefits in the amount of $559,474, or 5.6%.
In 2009, the Company’s efficiency ratio was 66.48%, compared to 62.90% in 2008 and 64.41% in 2007. The efficiency ratio is calculated to measure the cost of generating one dollar of revenue. This ratio is designed to reflect the percentage of one dollar which must be expended to generate one dollar of revenue. The efficiency ratio is calculated by dividing non-interest expense by the sum of net interest income, on a fully tax equivalent basis, and non-interest income. The overall increase in the efficiency ratio over the past three years reflects increases in non-interest expense associated with managing the growth in assets during the period.
INCOME TAXES
The Company records a provision for income taxes currently payable, along with a provision for deferred taxes to be realized in the future. Such deferred taxes arise from differences in timing of certain items for financial statement reporting rather than income tax reporting. The deferred tax amount of $2,642,913 is considered realizable without the use of extraordinary tax planning strategies.
The Company’s effective tax rate was 20.10%, 21.67% and 22.15% in 2009, 2008 and 2007, respectively. The major difference between the effective tax rate applied to the Company’s financial statement income and the federal statutory rate of 34% is interest on tax-exempt securities and loans. In 2008, the Company received tax free proceeds from an insurance policy on the life of an officer. Further tax information is disclosed in Note 10, “Income Taxes” to the Company’s Consolidated Financial Statements included in this Annual Report.
LIQUIDITY AND RATE SENSITIVITY
Liquidity management is the process by which the Company ensures that adequate liquid funds are available to meet its financial commitments on a timely basis. These commitments include honoring withdrawals by depositors, funding credit obligations to borrowers, servicing long-term obligations, making shareholder dividend payments, paying operating expenses, funding capital expenditures and maintaining reserve requirements.
The Company’s predominant sources of funding include: core deposits (consisting of both commercial and individual deposits); proceeds from maturities of securities; repayments of loan principal and interest; Federal Funds Purchased; and short-term and long-term borrowing
72
from the FHLB. In 2009, the Company experienced an increase in deposits and in loans outstanding. Along with these increases, the balances in investment securities also increased along with an increase in the securities sold under agreement to repurchase. Additionally, the Company decreased its balances in FHLB advances by $5,000,000. The Company relies upon non-core sources of funding, such as Federal Funds Purchased and short and long term borrowings from the FHLB, when deposit growth is not adequate to meet its short term needs. While the strategy of using these wholesale funding sources is adequate to cover liquidity deficiencies in the short term, the Company’s goal is to increase core deposits as a source of long term funding. Management does not intend to rely on borrowings from the FHLB as the first choice as a source of funds but prefers to increase core deposits through increased competition for available deposits. Management believes that core deposits can be increased by offering more competitive rates and superior service to our customers.
The deposit base is diversified between individual and commercial accounts, which the Company believes helps it avoid dependence on large concentrations of funds. The Company does not solicit certificates of deposit from brokers. The primary sources of liquidity on the asset side of the balance sheet are federal funds sold and securities classified as available-for-sale. The entire investment securities portfolio is classified in the available-for-sale category, and is available to be sold, should liquidity needs arise. Management, through its Asset Liability Committee (“ALCO”), and the Board review the Company’s liquidity position on a monthly basis. At December 31, 2009, both the ALCO and the Board of Directors determined that the Company’s liquidity position was adequate.
Table 13 - Funding Uses and Sources details the main components of cash flows for 2009 and 2008.
73
TABLE 13 - FUNDING USES AND SOURCES
| 2009 | 2008 | |||||||||||||||||||
| Average | Increase/(decrease) | Average | Increase/(decrease) | |||||||||||||||||
| Balance | Amount | Percent | Balance | Amount | Percent | |||||||||||||||
| FUNDING USES | ||||||||||||||||||||
| Loans, net of unearned income |
$ | 441,841 | $ | 44,353 | 11.16 | % | $ | 397,488 | $ | 40,165 | 11.24 | % | ||||||||
| Taxable securities |
199,361 | 70,865 | 55.15 | % | 128,496 | 34,902 | 37.29 | % | ||||||||||||
| Tax-exempt securities |
87,300 | 8,457 | 10.73 | % | 78,843 | 2,040 | 2.66 | % | ||||||||||||
| Federal funds sold and other |
7,811 | (5,064 | ) | -39.33 | % | 12,875 | (7,101 | ) | -35.55 | % | ||||||||||
| TOTAL USES |
$ | 736,313 | $ | 118,611 | 19.20 | % | $ | 617,702 | $ | 70,006 | 12.78 | % | ||||||||
| FUNDING SOURCES | ||||||||||||||||||||
| Noninterest-bearing deposits |
$ | 85,057 | $ | 3,863 | 4.76 | % | $ | 81,194 | $ | 2,007 | 2.53 | % | ||||||||
| Interest-bearing demand and savings deposits |
195,540 | 9,574 | 5.15 | % | 185,966 | 6,080 | 3.38 | % | ||||||||||||
| Time deposits |
278,439 | 50,877 | 22.36 | % | 227,562 | 7,198 | 3.27 | % | ||||||||||||
| Short-term borrowings |
2,951 | (268 | ) | -8.33 | % | 3,219 | 1,327 | 70.14 | % | |||||||||||
| Commercial repo |
84,218 | 56,121 | 199.74 | % | 28,097 | 28,097 | n/a | |||||||||||||
| Long-term debt |
79,079 | (2,388 | ) | -2.93 | % | 81,467 | 27,985 | 52.33 | % | |||||||||||
| TOTAL SOURCES |
$ | 725,284 | $ | 117,779 | 22.02 | % | $ | 534,811 | $ | 72,694 | 13.59 | % | ||||||||
The Company’s liquidity depends substantially on the ability of the Bank to transfer funds to the Company in the form of dividends. The information under the heading “Market Price and Dividend Information” in this Annual Report discusses federal and state statutory and regulatory restrictions on the ability of the Bank to transfer funds to the Company in the form of dividends.
CAPITAL RESOURCES
The Company and Bank are subject to various regulatory capital guidelines as required by federal and state banking agencies. These guidelines define the various components of core capital and assign risk weights to various categories of assets.
The Federal Deposit Insurance Corporation Improvement Act of 1991 (“FDICIA”) required federal regulatory agencies to define capital tiers. These tiers are: well capitalized, adequately capitalized, undercapitalized, significantly undercapitalized, and critically undercapitalized. Under FDICIA, a “well-capitalized” institution must achieve a Tier 1 risk-based capital ratio of at least 6.00%, a total capital ratio of at least 10.00%, a leverage ratio of at least 5.00% and not be under a capital directive order. These ratios generally measure the percentage of a bank’s capital to all or certain categories of assets. Failure to meet capital requirements can initiate regulatory action that could have a direct material effect on the Company’s financial statements. If a bank is only adequately capitalized, regulatory approval is
74
required before the bank may accept brokered deposits. If undercapitalized, capital distributions, asset growth, and expansion are limited, and the institution is required to submit a capital restoration plan.
During 2009, total capital increased primarily due to earnings that were in excess of dividends. This was somewhat offset by the continuation of the stock repurchase program. The Company put a plan in place to purchase up to 250,000 shares of its stock on the open market. During 2009, this plan purchased 47,500 shares at a total cost of $1,065,574.
Management believes the Company and the Bank meet all the capital requirements to be well-capitalized under the guidelines established by FDICIA as of December 31, 2009, as noted below in Table 14 - Capital Ratios. To be classified as well-capitalized, the Company and Bank must maintain the ratios described above.
75
TABLE 14 – CAPITAL RATIOS
| At December 31, | ||||||||||||
| 2009 | 2008 | 2007 | ||||||||||
| Tier 1 capital |
||||||||||||
| Shareholders’ equity |
$ | 74,598 | $ | 71,400 | $ | 68,191 | ||||||
| Less: Intangibles |
(3,596 | ) | (3,781 | ) | (4,215 | ) | ||||||
| Add/less: Unrealized loss/(gain) on securities |
870 | 1,306 | 433 | |||||||||
| TOTAL TIER 1 CAPITAL |
$ | 71,872 | $ | 68,925 | $ | 64,409 | ||||||
| Total capital |
||||||||||||
| Tier 1 capital |
$ | 71,872 | $ | 68,925 | $ | 64,409 | ||||||
| Allowable allowance for loan losses |
5,526 | 4,479 | 3,968 | |||||||||
| TOTAL CAPITAL |
$ | 77,398 | $ | 73,404 | $ | 68,377 | ||||||
| RISK WEIGHTED ASSETS |
$ | 517,121 | $ | 467,472 | $ | 400,835 | ||||||
| AVERAGE ASSETS (FOURTH QUARTER) |
$ | 823,943 | $ | 725,212 | $ | 645,506 | ||||||
| RISK BASED RATIOS |
||||||||||||
| TIER 1 |
13.90 | % | 14.74 | % | 16.07 | % | ||||||
| TOTAL CAPITAL |
14.97 | % | 15.70 | % | 17.06 | % | ||||||
| LEVERAGE RATIOS |
8.72 | % | 9.50 | % | 9.98 | % | ||||||
Management’s strategy with respect to capital levels is to maintain a sufficient amount of capital to allow the Company to respond to growth and acquisition opportunities in our service area. Over the past three years, the Company has been able to increase the amount of its capital, through retention of earnings, while still increasing the dividend payout ratio to approximately 55.1% of earnings per share. The Company does not currently have any commitments for capital expenditures that would require the Company to raise additional capital by means other than retained earnings. The Company does not plan to change this strategy unless needed to support future acquisition activity.
OFF-BALANCE SHEET ARRANGEMENTS
In the ordinary course of business, the Company makes various commitments and incurs certain contingent liabilities to fulfill the financing needs of its customers. These commitments and contingent liabilities include commitments to extend credit and issue standby letters of credit. These off-balance sheet arrangements are further detailed in Note 13, “Off-Balance Sheet Financial Instruments, Commitments and Contingencies and Concentration of Risks,” in the notes to the Company’s Consolidated Financial Statements included in this Annual Report.
76
CONTRACTUAL OBLIGATIONS
The following table summarizes the contractual obligations of the Company as of December 31, 2009. (in thousands)
| Payments Due by Period | |||||||||||||||
| Total | Less than 1 year |
1-3 Years |
3 - 5 Years |
Over 5 Years | |||||||||||
| Contractual Obligations |
|||||||||||||||
| Long Term Debt |
$ | 74,400 | $ | 2,000 | $ | 3,900 | $ | 48,500 | $ | 20,000 | |||||
| Operating Leases |
442 | 192 | 138 | 112 | — | ||||||||||
| Other Long-term Liabilities |
547 | 82 | 60 | 405 | — | ||||||||||
| Total |
$ | 75,389 | $ | 2,274 | $ | 4,098 | $ | 49,017 | $ | 20,000 | |||||
Long-term debt obligations represent borrowings from the FHLB that have an original maturity in excess of one (1) year. Operating leases are primarily for a lease on one of the Bank’s branches and other leases for mailing equipment. The branch lease is for 60 months and the equipment leases are for various terms. The other long-term liabilities are those obligations of the Company under the Agribusiness Enterprise Loan Program of the State of Mississippi.
QUANTITATIVE AND QUALITATIVE DISCLOSURES ABOUT MARKET RISK
OVERVIEW
The definition of market risk is the possibility of loss that could result from adverse changes in market prices or interest rates. The Company has taken steps to assess the amount of risk that is associated with its asset and liability structure. The Company measures the potential risk on a regular basis and makes changes to its strategies to manage these risks. The Board of Directors reviews important policy limits each month, with a more detailed risk analysis completed on a quarterly basis. These measurement tools are important in allowing the Company to manage market risk and to plan effective strategies to respond to any adverse changes in risk. The Company does not participate in some of the financial instruments that are inherently subject to substantial market risk. All of the financial instruments entered into by the Company are for purposes other than trading.
MARKET/INTEREST RATE RISK MANAGEMENT
Interest rate risk is the primary market risk that management must address. Interest rate risk is the exposure of Company earnings and capital to changes in interest rates. All financial institutions assume interest rate risk as an integral part of normal operations.
77
The primary purpose in managing interest rate risk is to effectively invest capital and preserve the value created by the core banking business of the Company. The Company utilizes an investment portfolio to manage the interest rate risk naturally created through its business activities. The process of managing interest rate risk generally involves both reducing the exposure of the Company’s net interest margin to swings in interest rates and concurrently ensuring that there is sufficient capital and liquidity to support balance sheet growth. The Company uses a quarterly interest rate risk report to evaluate its exposure to interest rate risk, project earnings and manage the composition of the balance sheet and its growth. This report utilizes an immediate 200 basis point rate movement up and down and measures the effect this change has on earnings and the value of equity.
In addition to the quarterly interest rate risk report, the Company employs a number of tools to measure interest rate risk. One tool is static gap analysis, which matches assets with specified maturities to liabilities with corresponding maturities. Although management believes that this does not provide a complete picture of the Company’s exposure to interest rate risk, it does highlight significant short-term repricing volume mismatches. The following table presents the Company’s rate sensitivity static gap analysis at December 31, 2009 ($ in thousands):
| Interest Sensitive Within | ||||||||
| 90 days | One year | |||||||
| Total rate sensitive assets |
$ | 124,160 | $ | 119,525 | ||||
| Total rate sensitive liabilities |
427,038 | 190,377 | ||||||
| Net gap |
$ | (302,878 | ) | $ | (70,852 | ) | ||
The analysis shows a negative gap position over the next three- and twelve-month periods, which indicates that the Company would benefit somewhat from a decrease in market interest rates. Although rate increases would be detrimental to the interest rate risk of the Company, management believes there is adequate flexibility to alter the overall rate sensitivity structure as necessary to minimize exposure to these changes.
Management believes that static gap analysis does not fully capture the impact of interest rate movements on interest sensitive assets and liabilities. Thus, the Company also measures interest rate risk by analyzing interest rate sensitivity and the rate sensitivity gap. Table 15 - Interest Rate Sensitivity provides additional information about the financial instruments that are sensitive to changes in interest rates. This tabular disclosure is limited by its failure to depict accurately the effect on assumptions of significant changes in the economy or interest rates or changes in management’s expectations or intentions relating to the Company’s financial statements. The information in the interest rate sensitivity table below reflects contractual interest rate pricing dates and contractual maturity dates. For indeterminate maturity deposit products (money market, NOW and savings accounts), the tables present principal cash flows in the shortest term. Although these deposits may not reprice within this time frame, the depositors of such funds have the ability to reprice. Weighted average floating rates are based on the rate for that product as of December 31, 2009 and 2008.
78
TABLE 15 - INTEREST RATE SENSITIVITY AS OF DECEMBER 31, 2009
| 2010 | 2011 | 2012 | 2013 | 2014 | Thereafter | Carrying Value |
Fair Value | ||||||||||||||||||||||||
| Loans |
|||||||||||||||||||||||||||||||
| Fixed Rate |
$ | 78,447 | $ | 31,478 | $ | 60,895 | $ | 112,686 | $ | 71,555 | $ | 33,226 | $ | 388,287 | $ | 388,667 | |||||||||||||||
| Average Int Rate |
6.35 | % | 8.12 | % | 7.36 | % | 6.44 | % | 6.28 | % | 7.27 | % | 6.74 | % | |||||||||||||||||
| Floating Rate |
$ | 22,443 | $ | 6,143 | $ | 857 | $ | 1,684 | $ | 9,275 | $ | 13,006 | $ | 53,408 | $ | 53,408 | |||||||||||||||
| Average Int Rate |
4.33 | % | 5.45 | % | 4.15 | % | 4.35 | % | 4.66 | % | 4.76 | % | 4.62 | % | |||||||||||||||||
| Investment securities |
|||||||||||||||||||||||||||||||
| Fixed Rate |
$ | 12,395 | $ | 6,331 | $ | 39,919 | $ | 15,937 | $ | 10,047 | $ | 231,630 | $ | 316,259 | $ | 316,259 | |||||||||||||||
| Average Int Rate |
4.73 | % | 5.01 | % | 5.10 | % | 5.24 | % | 5.54 | % | 4.12 | % | 4.38 | % | |||||||||||||||||
| Floating Rate |
$ | 2,145 | $ | 2,145 | $ | 2,145 | |||||||||||||||||||||||||
| Average Int Rate |
2.69 | % | 2.69 | % | |||||||||||||||||||||||||||
| Other earning assets |
$ | 5,233 | $ | 5,233 | $ | 5,233 | |||||||||||||||||||||||||
| Fixed Rate |
0.24 | % | 0.24 | % | |||||||||||||||||||||||||||
| Average Int Rate |
|||||||||||||||||||||||||||||||
| Floating Rate |
|||||||||||||||||||||||||||||||
| Average Int Rate |
|||||||||||||||||||||||||||||||
| Interest-bearing deposits |
|||||||||||||||||||||||||||||||
| Fixed Rate |
$ | 455,181 | $ | 13,111 | $ | 144 | $ | 468,436 | $ | 468,656 | |||||||||||||||||||||
| Average Int Rate |
1.44 | % | 1.64 | % | 1.56 | % | 1.45 | % | |||||||||||||||||||||||
| Floating Rate |
$ | 6,683 | $ | 4,803 | $ | 2,566 | $ | 103 | $ | 95 | $ | 14,250 | $ | 14,250 | |||||||||||||||||
| Average Int Rate |
1.45 | % | 1.46 | % | 1.45 | % | 1.44 | % | 1.45 | % | 1.45 | % | |||||||||||||||||||
| Other int-bearing liabilities |
|||||||||||||||||||||||||||||||
| Fixed Rate |
$ | 2,000 | $ | 3,900 | $ | 45,000 | $ | 3,500 | $ | 20,000 | $ | 74,400 | $ | 77,219 | |||||||||||||||||
| Average Int Rate |
4.47 | % | 4.75 | % | 3.37 | % | 4.67 | % | 2.53 | % | 3.31 | % | |||||||||||||||||||
| Floating Rate |
$ | 114,753 | $ | 114,753 | $ | 114,753 | |||||||||||||||||||||||||
| Average Int Rate |
0.95 | % | 0.95 | % | |||||||||||||||||||||||||||
79
AS OF DECEMBER 31, 2008
| 2009 | 2010 | 2011 | 2012 | 2013 | Thereafter | Carrying Value |
Fair Value | ||||||||||||||||||||||||
| Loans |
|||||||||||||||||||||||||||||||
| Fixed Rate |
$ | 89,470 | $ | 35,451 | $ | 38,538 | $ | 60,064 | $ | 118,951 | $ | 35,520 | $ | 377,994 | $ | 376,725 | |||||||||||||||
| Average Int Rate |
6.61 | % | 7.75 | % | 7.81 | % | 7.57 | % | 6.40 | % | 7.35 | % | 7.00 | % | |||||||||||||||||
| Floating Rate |
$ | 27,843 | $ | 815 | $ | 721 | $ | 799 | $ | 2,028 | $ | 14,026 | $ | 46,232 | $ | 46,232 | |||||||||||||||
| Average Int Rate |
4.49 | % | 4.39 | % | 4.80 | % | 4.38 | % | 4.50 | % | 4.68 | % | 4.55 | % | |||||||||||||||||
| Investment securities |
|||||||||||||||||||||||||||||||
| Fixed Rate |
$ | 14,136 | $ | 30,340 | $ | 45,024 | $ | 16,000 | $ | 5,037 | $ | 147,486 | $ | 258,023 | $ | 258,023 | |||||||||||||||
| Average Int Rate |
4.45 | % | 4.78 | % | 4.99 | % | 4.35 | % | 5.72 | % | 4.55 | % | 4.74 | % | |||||||||||||||||
| Floating Rate |
|||||||||||||||||||||||||||||||
| Average Int Rate |
|||||||||||||||||||||||||||||||
| Other earning assets |
$ | 1,002 | $ | 1,002 | $ | 1,002 | |||||||||||||||||||||||||
| Fixed Rate |
0.43 | % | 0.43 | % | |||||||||||||||||||||||||||
| Average Int Rate |
|||||||||||||||||||||||||||||||
| Floating Rate |
|||||||||||||||||||||||||||||||
| Average Int Rate |
|||||||||||||||||||||||||||||||
| Interest-bearing deposits |
|||||||||||||||||||||||||||||||
| Fixed Rate |
$ | 401,442 | $ | 27,084 | $ | 352 | $ | 428,878 | $ | 429,376 | |||||||||||||||||||||
| Average Int Rate |
2.15 | % | 3.31 | % | 2.23 | % | 2.22 | % | |||||||||||||||||||||||
| Floating Rate |
$ | 11,803 | $ | 7,044 | $ | 2,404 | $ | 47 | $ | 101 | $ | 21,399 | $ | 21,399 | |||||||||||||||||
| Average Int Rate |
2.32 | % | 1.76 | % | 1.75 | % | 1.70 | % | 1.74 | % | 2.07 | % | |||||||||||||||||||
| Other int-bearing liabilities |
|||||||||||||||||||||||||||||||
| Fixed Rate |
$ | 61,000 | $ | 12,000 | $ | 13,900 | $ | 0 | $ | 10,000 | $ | 3,500 | $ | 100,400 | $ | 103,644 | |||||||||||||||
| Average Int Rate |
2.68 | % | 3.45 | % | 3.96 | % | 0.00 | % | 3.66 | % | 4.67 | % | 3.12 | % | |||||||||||||||||
| Floating Rate |
|||||||||||||||||||||||||||||||
| Average Int Rate |
|||||||||||||||||||||||||||||||
Rate sensitivity gap analysis is another tool management uses to measure interest rate risk. The rate sensitivity gap is the difference between the repricing of interest-earning assets and the repricing of interest-bearing liabilities within certain defined time frames. The Company’s interest rate sensitivity position is influenced by the distribution of interest-earning assets and interest-bearing liabilities among the maturity categories. Table 16 - Rate Sensitivity Gap reflects interest-earning assets and interest-bearing liabilities by maturity distribution as of December 31, 2009. Product lines repricing in time periods predetermined by contractual agreements are included in the respective maturity categories.
80
TABLE 16 - RATE SENSITIVITY GAP AT DECEMBER 31, 2009
| 1 - 90 Days |
91 - 365 Days |
1 - 5 Years |
Over 5 years |
Total | |||||||||||||||
| INTEREST EARNING ASSETS | |||||||||||||||||||
| Loans |
$ | 63,793 | $ | 47,304 | $ | 279,441 | $ | 40,947 | $ | 431,485 | |||||||||
| Investment securities |
55,134 | 72,221 | 129,678 | 56,538 | 313,571 | ||||||||||||||
| Interest Bearing Due From Bank Accounts |
5,233 | — | — | — | 5,233 | ||||||||||||||
| TOTAL INTEREST BEARING ASSETS |
$ | 124,160 | $ | 119,525 | $ | 409,119 | $ | 97,485 | $ | 750,289 | |||||||||
| INTEREST BEARING LIABILITIES | |||||||||||||||||||
| Interest bearing demand deposits |
$ | 172,285 | $ | — | $ | — | $ | — | $ | 172,285 | |||||||||
| Savings and Money Market deposits |
45,913 | — | — | — | 45,913 | ||||||||||||||
| Time deposits |
93,848 | 149,579 | 20,821 | — | 264,248 | ||||||||||||||
| Short term borrowings |
114,753 | — | — | — | 114,753 | ||||||||||||||
| Long term borrowings |
— | 2,000 | 52,947 | 20,000 | 74,947 | ||||||||||||||
| TOTAL INTEREST BEARING LIABILITIES |
$ | 426,799 | $ | 151,579 | $ | 73,768 | $ | 20,000 | $ | 672,146 | |||||||||
| Rate sensitive gap |
$ | (302,639 | ) | $ | (32,054 | ) | $ | 335,351 | $ | 77,485 | $ | 78,143 | |||||||
| Rate sensitive cumulative gap |
(302,639 | ) | (334,693 | ) | 658 | 78,143 | — | ||||||||||||
| Cumulative gap as a percentage of total earning assets |
-40.34 | % | -44.61 | % | 0.09 | % | 10.42 | % | |||||||||||
The purpose of the above table is to measure interest rate risk utilizing the repricing intervals of interest sensitive assets and liabilities. Rate sensitive gaps constantly change as funds are acquired and invested and as rates change. Rising interest rates are likely to increase net interest income in a positive gap position while falling interest rates are beneficial in a negative gap position.
The above rate sensitivity analysis places interest-bearing demand and savings deposits in the shortest maturity category because these liabilities do not have defined maturities. If these deposits were placed in a maturity distribution representative of the Company’s deposit base history, the shortfall of the negative rate sensitive gap position would be reduced in the 1-to-90 day time frame.
81
The rate sensitivity gap table illustrates that the Company had a large negative cumulative gap position for the one-year period ending December 31, 2009. This negative gap position was mainly due to: (1) the interest-bearing and savings deposits being classified in the 1-90 day category; (2) approximately 92.1% of certificates of deposit maturing during the next twelve months; and (3) a significant portion of the Company’s loans maturing after one year.
The interest rate sensitivity and rate sensitivity gap tables, taken together, indicate that the Company continues to be in a liability sensitive position when evaluating the maturities of interest-bearing items. Thus, a decline in the interest rate environment would enhance earnings, while an increase in interest rates would have the opposite effect on corporate earnings. The Company has attempted to mitigate the impact of its interest rate position by increasing the amount of its variable rate loans and also by structuring deposit rates to entice customers to shorten the maturities of their time deposits. The effect of any changes in interest rates on the Company would be mitigated by the fact that interest-bearing demand and savings deposits may not be immediately affected by changes in general interest rates.
Although short and medium term interest rates decreased in 2009 in connection with decreases in the target Federal Funds rate by the Federal Reserve Bank, the effect on the Company was marginal. The Company’s net interest margin in 2009 was 4.20% and in 2008 was 4.41%.
82
Quarterly Financial Trends
| 2009 | ||||||||||||
| First Quarter | Second Quarter | Third Quarter | Fourth Quarter | |||||||||
| Interest Income |
$ | 9,983 | $ | 10,271 | $ | 10,475 | $ | 10,160 | ||||
| Interest Expense |
3,232 | 2,880 | 2,651 | 2,573 | ||||||||
| Net Interest Income |
6,751 | 7,391 | 7,824 | 7,587 | ||||||||
| Provision for Loan Losses |
316 | 824 | 1,124 | 749 | ||||||||
| Non-interest Income |
1,562 | 1,879 | 2,081 | 2,535 | ||||||||
| Non-interest Expense |
5,624 | 6,098 | 6,609 | 7,496 | ||||||||
| Income Taxes |
514 | 508 | 435 | 174 | ||||||||
| Net Income |
$ | 1,859 | $ | 1,840 | $ | 1,737 | $ | 1,703 | ||||
| Per common share: |
||||||||||||
| Basic |
$ | 0.38 | $ | 0.38 | $ | 0.36 | $ | 0.35 | ||||
| Diluted |
$ | 0.38 | $ | 0.37 | $ | 0.35 | $ | 0.35 | ||||
| Cash Dividends |
$ | 0.20 | $ | 0.20 | $ | 0.20 | $ | 0.21 | ||||
| 2008 | ||||||||||||
| First Quarter | Second Quarter | Third Quarter | Fourth Quarter | |||||||||
| Interest Income |
$ | 9,729 | $ | 9,715 | $ | 9,909 | $ | 10,205 | ||||
| Interest Expense |
4,187 | 3,237 | 3,034 | 3,317 | ||||||||
| Net Interest Income |
5,542 | 6,478 | 6,875 | 6,888 | ||||||||
| Provision for Loan Losses |
98 | 559 | 372 | 195 | ||||||||
| Non-interest Income |
2,004 | 2,524 | 1,783 | 1,552 | ||||||||
| Non-interest Expense |
5,359 | 5,461 | 5,480 | 5,559 | ||||||||
| Income Taxes |
450 | 506 | 702 | 631 | ||||||||
| Net Income |
$ | 1,639 | $ | 2,476 | $ | 2,104 | $ | 2,055 | ||||
| Per common share: |
||||||||||||
| Basic |
$ | 0.34 | $ | 0.51 | $ | 0.43 | $ | 0.42 | ||||
| Diluted |
$ | 0.33 | $ | 0.51 | $ | 0.43 | $ | 0.42 | ||||
| Cash Dividends |
$ | 0.19 | $ | 0.19 | $ | 0.19 | $ | 0.20 | ||||
83
MARKET PRICE AND DIVIDEND INFORMATION
MARKET PRICE
The Company’s common stock trades on The NASDAQ Global Market (“NASDAQ”) under the symbol “CIZN”. On December 31, 2009, the common stock’s closing price on NASDAQ was $22.39. The following table sets forth the high and low sales prices for the common stock as reported on NASDAQ, as well as the dividends declared, in each quarter in the past two fiscal years.
| 2008 |
High | Low | Dividends Declared (per common share) | ||||||
| January - March |
$ | 21.99 | $ | 16.55 | $ | 0.19 | |||
| April - June |
22.00 | 19.23 | 0.19 | ||||||
| July - September |
22.01 | 15.88 | 0.19 | ||||||
| October - December |
22.00 | 16.35 | 0.20 | ||||||
| 2009 |
High | Low | Dividends Declared (per common share) | ||||||
| January - March |
$ | 24.00 | $ | 19.02 | $ | 0.20 | |||
| April - June |
36.00 | 21.09 | 0.20 | ||||||
| July - September |
34.85 | 25.10 | 0.20 | ||||||
| October - December |
26.75 | 20.25 | 0.21 | ||||||
On March 11, 2010, shares of the Company’s common stock were held of record by approximately 475 shareholders.
DIVIDENDS
Dividends totaled $0.81 per share for 2009 compared to $0.77 per share for 2008, an increase of 5.2%.
If funds are available, the Company typically declares dividends on a quarterly basis in March, June, September and December with payment following at the end of the month in which the dividend was declared. Funds for the payment by the Company of cash dividends are obtained from dividends, loans or advances received by the Company from the Bank. Accordingly, the declaration and payment of dividends by the Company depend upon the Bank’s earnings and financial condition, general economic conditions, compliance with regulatory requirements, and other factors. The Bank must also receive the approval of the Mississippi Department of Banking and Consumer Finance prior to the payment of a dividend.
84
STOCK PERFORMANCE GRAPH
The following performance graph compares the performance of the Company’s common stock to the NASDAQ Composite Index and the Hemscott Group Index (a peer group of 44 other regional bank holding companies) for the Company’s reporting period. The graph assumes that the value of the investment in the Company’s common stock and each index was $100 at December 31, 2003 and that all dividends were reinvested.
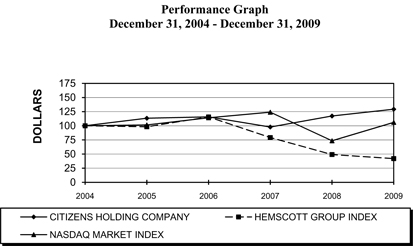
| 12/31/2004 | 12/31/2005 | 12/30/2006 | 12/29/2007 | 12/31/2008 | 12/31/2009 | |||||||
| Citizens Holding Company |
100.00 | 113.29 | 115.78 | 97.74 | 117.27 | 129.27 | ||||||
| NASDAQ Composite |
100.00 | 101.41 | 114.05 | 123.94 | 73.43 | 105.89 | ||||||
| Hemscott Group Index |
100.00 | 98.19 | 115.60 | 79.14 | 49.09 | 41.96 |
| (1) | The bank holding companies included in the peer group are as follows: Atlantic Coast Fed Corp, Auburn National Banc Inc., Bancorpsouth Inc., Banctrust Financial Group, Bank of the Ozarks Inc., Beach First National Bankshares, Britton & Koontz Capital Corporation, Cadence Financial Corp., Cardinal Financial Corp., Centerstate Banks of Florida, Citizens First Corp., Community Trust Bancorp Inc., Crescent Banking Company, Eastern Virginia Bankshares, Farmers Capital Bank Corporation, Fauquier Bancshares Inc., First Advantage Bancorp, First Bancshares Inc. (Mississippi), First |
85
| Financial Service Corp, First Horizon National, First M&F Corporation, FNB Corporation (Florida), FPB Bancorp Inc, Green Bancshares, Inc., Hancock Holding Co., Heritage Financial Group, Home Bancorp Inc, Iberiabank Corporation, Midsouth Bancorp Inc, NB&T Financial Group, Pinnacle Financial Partners, Porter Bancorp, Inc., Premier Financial Bancorp, Regions Financial Corp., Renasant Corporation, Republic Bancorp Inc., S.Y. Bancorp Inc., Simmons First National Corp., Southcoast Financial Corp, Superior Bancorp, Tennessee Commerce Banc, Trustmark Corp., United Security Bancshares, and Whitney Holding Corporation. |
Source: Research Data Group, San Francisco, CA
There can be no assurance that the Company’s common stock performance will continue in the future with the same or similar trends depicted in the performance graph above. The Company does not and will not make or endorse any predictions as to future stock performance.
86
THE CITIZENS BANK OFFICERS
| Greg McKee | Adriana Burt | Scooba and DeKalb Branches | ||
| President and CEO | Assistant Cashier | |||
| Fran Knight | ||||
| Robert T. Smith | Mitch Peden | President | ||
| Senior Vice President and CFO | Assistant Vice-President and | |||
| Information Services Manager | Meridian Branch | |||
| Danny Hicks | ||||
| Senior Vice President | Tammy Pope | Charles Young | ||
| Accounting Officer | Regional Commercial Lender | |||
| Erdis Chaney | ||||
| Vice President & Senior Deposit Officer | Mark Flake | Vikki Gunter | ||
| Assistant Vice-President and | Assistant Vice President | |||
| Ledale Reynolds | Network Services Manager | |||
| Vice President and CIO | Forest Branch | |||
| Greg Jackson | ||||
| Ray Stone | Accounting Officer | Richard Latham | ||
| Vice-President and Senior Credit Officer | Vice President | |||
| Tammy Pope | ||||
| Randy Cheatham | Accounting Officer | Dymple Winstead | ||
| Vice President | Assistant Vice President | |||
| Patsy Smith | ||||
| Mike Guthrie | Assistant Cashier | Decatur Branch | ||
| Vice President | ||||
| Ashley Peebles | Ken Jones | |||
| Murray Johnson | Assistant Cashier | Vice President | ||
| Vice President | ||||
| Deborah Ladd | Louisville Branch | |||
| Jackie Hester | Item Processing Officer | |||
| Vice President and Marketing | Terry Woods | |||
| Linda Goforth | President | |||
| Kaye Johnson | Electronic Banking Officer | |||
| Vice President | Marion Gardner | |||
| Patti Rickles | Assistant Cashier | |||
| Stanley Salter | ACH Officer | |||
| Vice President | Bruce Lee | |||
| Carthage Branch | Assistant Vice President | |||
| Darrel Bates | ||||
| Vice President | Mike Brooks | Starkville Branch | ||
| President | ||||
| Jean T. Fulton | Stan Acy | |||
| Vice President and Internal Auditor | Billy Cook | Vice-President | ||
| Vice President | ||||
| Gayle Sharp | Rhonda Edmondson | |||
| Vice President and Loan Operations Officer | Margaret Thompson | Assistant Cashier | ||
| Assistant Cashier | ||||
| Brad Copeland | Collinsville Branch | |||
| Vice President | Sue Fisher | |||
| Deposit Operation Officer | Mike Shelby | |||
| Mark Majure | Vice-President | |||
| Vice President | Sebastopol Branch | |||
| Meridian Mid-Town | ||||
| Vicki Brown | Linda Bennett | |||
| Vice President and BSA Officer | President | Neil Henry | ||
| Meridian City President | ||||
| Mark Taylor | Connie Comans | |||
| Vice-President and Human Resources | Assistant Cashier | Meridian Broadmoor | ||
| Bob Posey | Union Branch | Camp Keith | ||
| Vice President | Assistant Cashier | |||
| Robert C. Palmer, Jr. | ||||
| Sommer Vick | President | Hattiesburg Branch | ||
| Assistant Vice President | ||||
| Karen Foster | Todd Mixon | |||
| Carolyn K. McKee | Assistant Vice President | President, Hattiesburg Region | ||
| Student Loan Officer | ||||
| Marianne Strickland | Biloxi Loan Production Office | |||
| Beth Branning | Assistant Cashier | |||
| Assistant Vice President | Travis Moore | |||
| Kosciusko Branch | President, Gulf Coast Region | |||
| Tommy Jackson | ||||
| Assistant Vice President | Steve Potts | Mortgage Loan Department | ||
| Vice-President and Branch Manager | ||||
| Stacy Arnold | Linda Stribling | |||
| Assistant Vice-President and | David Blair | Mortgage Loan Officer | ||
| Compliance Officer | Vice President | |||
| Pat Stokes | ||||
| Assistant Cashier | ||||
87
BOARD OF DIRECTORS
| Don Fulton | Craig Dungan, MD | |
| Corporate PERT Coordinator | Physician | |
| W. G. Yates and Sons Construction Co. | Meridian Gastroenterology PLLC | |
| Donald L. Kilgore | Greg L. McKee | |
| Attorney General | President & Chief Executive Officer | |
| Mississippi Band of Choctaw Indians | Citizens Holding Company and | |
| The Citizens Bank | ||
| David A. King | ||
| Proprietor | David P. Webb | |
| Philadelphia Motor Company | Attorney | |
| Baker, Donelson, Bearman, Caldwell & | ||
| Herbert A. King | Berkowitz, PC | |
| Civil Engineer | ||
| King Engineering Associates, Inc. | A. T. Williams | |
| Certified Public Accountant | ||
| Adam Mars | A. T. Williams, CPA | |
| Business Manager | ||
| Mars, Mars, Mars & Chalmers | Terrell E. Winstead | |
| Chief Financial Officer | ||
| Molpus Woodlands Group |
CITIZENS HOLDING COMPANY OFFICERS
| Herbert A. King | ||
| Chairman |
||
| Greg L. McKee |
||
| President and Chief Executive Officer |
||
| Carolyn K. McKee |
||
| Secretary |
||
| Robert T. Smith |
||
| Treasurer and Chief Financial Officer |
||
88
BANKING LOCATIONS
| Philadelphia Main Office | Collinsville Branch | Decatur Branch | ||
| 521 Main Street |
9065 Collinsville Road | 15330 Hwy 15 South | ||
| Philadelphia, MS 39350 |
Collinsville, MS 39325 | Decatur, MS 39327 | ||
| 601.656.4692 |
601.626.7608 | 601.635.2321 | ||
| Westside Branch |
Madden Branch | Forest Branch | ||
| 912 West Beacon Street |
53 Dr Brantley Road | 247 Woodland Drive North | ||
| Philadelphia, MS 39350 |
Madden, MS 39109 | Forest, MS 39074 | ||
| 601.656.4978 |
601.267.7366 | 601.469.3424 | ||
| Northside Branch |
Sebastopol Branch | Louisville-Main Branch | ||
| 802 Pecan Avenue |
24 Pine Street | l00 East Main Street | ||
| Philadelphia, MS 39350 |
Sebastopol, MS 39359 | Louisville, MS 39339 | ||
| 601.656.4977 |
601.625.7447 | 662.773.6261 | ||
| Eastside Branch |
DeKalb Branch | Noxapater Branch | ||
| 599 East Main Street |
176 Main Avenue | 45 East Main Street | ||
| Philadelphia, MS 39350 |
DeKalb, MS 39328 | Noxapater, MS 39346 | ||
| 601.656.4976 |
601.743.2115 | 662.724.4261 | ||
| Pearl River Branch |
Kosciusko Branch | Louisville-Industrial Branch | ||
| 110 Choctaw Town Center |
775 North Jackson Street | 803 South Church Street | ||
| Philadelphia, MS 39350 |
Kosciusko, MS 39090 | Louisville, MS 39339 | ||
| 601.656.4971 |
662.289.4356 | 662.773.6261 | ||
| Union Branch |
Scooba Branch | Meridian Mid-Town | ||
| 502 Bank Street |
27597 Highway 16 East | 905 22nd Avenue | ||
| Union, MS 39365 |
Scooba, MS 39358 | Meridian, MS 39301 | ||
| 601.774.9231 |
662.476.8431 | 601.482.8858 | ||
| Carthage Main Office |
Meridian Eastgate | Meridian Broadmoor | ||
| 301 West Main Street |
1825 Hwy 39 North | 5015 Highway 493 | ||
| Carthage, MS 39051 |
Meridian, MS 39301 | Meridian. MS 39305 | ||
| 601.257.4525 |
601.693.8367 | 601.581.1541 | ||
| Starkville Branch |
Cedar Lake LPO | Hattiesburg Branch | ||
| 201 Highway 12 West |
1765 Popps Ferry Road | 15 Millbranch Road | ||
| Starkville, MS 39759 |
Biloxi, MS 39532 | Hattiesburg, MS 39402 | ||
| 662.323.1420 |
228.594.6913 | 601.264.4425 | ||
| Phone Teller | Internet Banking | |||
| 1.800.397.0344 | http://www.thecitizensbankphila.com | |||
89
FINANCIAL INFORMATION
CORPORATE HEADQUARTERS
521 Main Street
P.O. Box 209
Philadelphia, MS 39350
601.656.4692
ANNUAL STOCKHOLDER MEETING
The Annual Stockholder meeting of the Citizens Holding Company, Inc. will be held Tuesday, April 27, 2010, at 4:30 P.M. in the lobby of the main office of The Citizens Bank, 521 Main Street, Philadelphia, Mississippi.
STOCK REGISTRAR AND TRANSFER AGENT
American Stock Transfer & Trust Company
59 Maiden Lane
New York, NY 10038
FORM 10-K
The Corporation’s most recent Annual Report on Form 10-K, filed with the Securities and Exchange Commission, is available without charge to stockholder’s upon request to the Treasurer of the Citizens Holding Company.
FINANCIAL CONTACT
Robert T. Smith
Treasurer and Chief Financial Officer
P.O. 209
Philadelphia, Mississippi 39350
Additional information can be obtained from our corporate website at www.citizensholdingcompany.com
90