Attached files
| file | filename |
|---|---|
| EX-23.2 - CONSENT OF CROWE HORWATH LLP - BAYLAKE CORP | baylake101073_ex23-2.htm |
| EX-21.1 - LIST OF SUBSIDIARIES - BAYLAKE CORP | baylake101073_ex21-1.htm |
| EX-23.1 - CONSENT OF BAKER TILLY VIRCHOW KRAUSE - BAYLAKE CORP | baylake101073_ex23-1.htm |
| EX-31.1 - CERTIFICATION OF CEO PURSUANT TO SECTION 302 - BAYLAKE CORP | baylake101073_ex31-1.htm |
| EX-32.2 - CERTIFICAITON OF CFO PURSUANT TO SECTION 906 - BAYLAKE CORP | baylake101073_ex32-2.htm |
| EX-32.1 - CERTIFICATION OF CEO PURSUANT TO SECTION 906 - BAYLAKE CORP | baylake101073_ex32-1.htm |
| EX-31.2 - CERTIFICATION OF CFO PURSUANT TO SECTION 302 - BAYLAKE CORP | baylake101073_ex31-2.htm |
UNITED STATES
SECURITIES AND EXCHANGE COMMISSION
WASHINGTON, D.C. 20549
|
|
|
|
|
|
||
|
|
||
|
FORM 10-K |
||
|
|
||
|
|
||
|
|
|
(Mark One) |
|
x ANNUAL REPORT PURSUANT TO SECTION 13 OR 15(d) OF THE |
||
|
SECURITIES EXCHANGE ACT OF 1934 |
||
|
|
|
|
|
For the fiscal year ended December 31, 2009 |
||
|
or |
||
|
o TRANSITION REPORT PURSUANT TO SECTION 13 OR 15(d) OF THE |
||
|
SECURITIES EXCHANGE ACT OF 1934 |
||
For the transition period from _________________ to _________________
|
|
|
|
|
Wisconsin |
|
39-1268055 |
|
(State or other jurisdiction of |
|
(I.R.S. Employer |
|
incorporation or organization) |
|
Identification No.) |
|
|
|
|
|
217 North Fourth Avenue, Sturgeon Bay, WI |
|
54235 |
|
(Address of principal executive offices) |
|
(Zip Code) |
|
|
|
|
|
Registrant’s telephone number, including area code: (920)-743-5551 |
||
|
|
|
|
|
Securities registered pursuant to Section 12(b) of the Act: None |
||
Securities registered pursuant to Section 12(g) of the Act: Common Stock $5.00 Par Value Per Share
Indicate by check mark if the registrant is not required to file reports pursuant to Section 13 or Section 15(d) of the Act. Yes o No x
Indicate by check mark whether the registrant (1) has filed all reports required to be filed by Section 13 or 15(d) of the Securities Exchange Act of 1934 during the preceding 12 months (or for such shorter period that the registrant was required to file such reports), and (2) has been subject to such filing requirements for the past 90 days. Yes x No o
Indicate by check mark whether the registrant has submitted electronically and posted on its corporate Web site, if any, every Interactive Data File required to be submitted and posted pursuant to Rule 405 of Regulation S-T (§232.405 of this chapter) during the preceding 12 months (or for such charter period that the registrant was required to submit and post such files). Yes o No o
Indicate by check mark if disclosure of delinquent filers pursuant to Item 405 of Regulation S-K is not contained herein, and will not be contained, to the best of registrant’s knowledge, in definitive proxy or information statements incorporated by reference in Part III of this Form 10-K or any amendment to this Form 10-K o
Indicate by check mark whether the registrant is a large accelerated filer, an accelerated filer, a non-accelerated filer, or a smaller reporting company. See definitions of “large accelerated filer”, “accelerated filer” and “smaller reporting company” in Rule 12b-2 of the Exchange Act. (Check one):
|
|
|
|
|
|
Large accelerated filer o |
Accelerated filer o |
Non-accelerated filer o |
Smaller reporting company x |
|
(Do not check if a smaller reporting company) |
|||
1
Indicate by check mark whether the registrant is a shell company (as defined in Rule 12b-2 of the Exchange Act.) Yes o No x
As of June 30, 2009, (the last business day of the Registrant’s most recently completed second fiscal quarter), the aggregate market value of the Common Stock (based upon the $3.40 reported bid price on that date) held by non-affiliates (excludes a total of 600,043 shares reported as beneficially owned by directors and executive officers-does not constitute an admission as to affiliate status) was approximately $24,859,083. As of March 12, 2010, 7,911,538 shares of Common Stock were outstanding.
DOCUMENTS INCORPORATED BY REFERENCE
|
|
|
|
|
|
|
Part of Form 10-K Into Which |
|
Document |
|
Portions of Documents are Incorporated |
|
|
|
|
|
Definitive Proxy Statement for 2010 Annual Meeting of Shareholders to be filed within 120 days of the fiscal year ended December 31, 2009 |
|
Part III |
2
2009 FORM 10-K
TABLE OF CONTENTS
|
|
|
|
|
|
|
|
DESCRIPTION |
PAGE NO. |
|
|
|
|
|
|
|
|
||
|
|
4 |
||
|
|
8 |
||
|
|
14 |
||
|
|
14 |
||
|
|
14 |
||
|
|
14 |
||
|
|
|
|
|
|
|
|
||
|
|
15 |
||
|
|
17 |
||
|
|
Management’s Discussion and Analysis of Financial Condition and Results of Operation |
18 |
|
|
|
43 |
||
|
|
43 |
||
|
|
Changes in and Disagreements with Accountants on Accounting and Financial Disclosure |
79 |
|
|
|
79 |
||
|
|
79 |
||
|
|
|
|
|
|
|
|
||
|
|
79 |
||
|
|
79 |
||
|
|
Security Ownership of Certain Beneficial Owners and Management And Related Stockholder Matters |
79 |
|
|
|
Certain Relationships and Related Transactions, and Director independence |
80 |
|
|
|
80 |
||
|
|
|
|
|
|
|
|
||
|
|
81 |
||
|
|
|
|
|
|
|
81 |
3
General
Baylake Corp. is a Wisconsin corporation organized in 1976 and is registered as a bank holding company under the Bank Holding Company Act of 1956, as amended (the “BHCA”). Our primary activities consist of holding the stock of our wholly-owned subsidiary bank, Baylake Bank, and providing a wide range of banking and related business activities through our bank and our other subsidiaries. At December 31, 2009, we had total assets of approximately $1.0 billion. For additional financial information, see our Consolidated Financial Statements and Notes at Part II, Item 8 of this Form 10-K.
Baylake Bank
Baylake Bank is a Wisconsin state bank originally chartered in 1876. Our bank is an independent community bank offering a full range of financial services primarily to small businesses and individuals located in our market area. We conduct our community banking business through 28 full-service financial centers located throughout Northeast Wisconsin, in Brown, Door, Green Lake, Kewaunee, Manitowoc, Outagamie, Waupaca, and Waushara Counties. We have eight financial centers in Door County, which is known for its tourism-related services. We have eight financial centers in Brown County, which includes the city of Green Bay. We serve a broader range of service, manufacturing and retail job segments in the Brown County market. The rest of our financial centers are located in smaller cities and smaller communities. Other principal industries in our market area include industry and manufacturing, agriculture and food related products..
Non-Bank Subsidiaries
In addition to our banking operations, our bank owns three non-bank subsidiaries: Baylake Investments, Inc., located in Las Vegas, Nevada, which holds and manages an investment portfolio; Baylake City Center LLC, which owns 10.9% of a commercial building condominium in Green Bay; and Baylake Insurance Agency, Inc., which offers various types of insurance products to the general public as an independent agent. Our bank also owns a minority interest (49.8% of the outstanding common stock) in United Financial Services, Inc. (“UFS”), a data processing services company located in Grafton, Wisconsin, that provides data processing services to approximately 40 banks (including Baylake Bank) as well as electronic banking processing to four banks.
Corporate Governance Matters
We maintain a website at www.baylake.com. We make available through that website, free of charge, copies of our Annual Reports on Form 10-K, Quarterly Reports on Form 10-Q, Current Reports on Form 8-K and amendments to those reports, as soon as reasonably practicable after Baylake electronically files those materials with, or furnishes them to, the Securities and Exchange Commission (“SEC”). Our SEC reports can be accessed through the Baylake Corp. link on our website. The SEC also maintains a website at www.sec.gov that contains reports, proxy statements and other information regarding SEC registrants.
Lending
We offer short-term and long-term loans on a secured and unsecured basis for business and personal purposes. We make real estate, commercial/industrial, agricultural and consumer loans in accordance with the basic lending policies established by our board of directors. We focus lending activities on individuals and small businesses in our market area. Our lending activity has been historically concentrated primarily within the State of Wisconsin. We do not conduct any substantial business with foreign obligors. We serve a wide variety of industries including, on a limited basis, a concentration on businesses directly and indirectly related to the tourism/recreation related industries. Loans to customers in the tourism/recreation industry, including restaurants and lodging businesses, totaled approximately $120.8 million at December 31, 2009, or 18.5% of our aggregate loans outstanding at that date. Although competitive and economic pressures exist in this market segment, business remains relatively steady in the markets we serve. However, any deterioration in the economy of Northeastern Wisconsin (as a result, for example, of a decline in its manufacturing or tourism/recreation industries or otherwise) could have a material adverse effect on our business and operations. In particular, a decline in the Door County tourism business would not only affect our customers in the restaurant and lodging business, and therefore loans to them as described above, but could also affect loans and other business relationships with persons employed in that industry and real estate values (including collateral values) in the area.
4
Our expansion into other market areas has reduced our concentration level in tourism/recreation-related businesses over the last thirty-six months, but these types of businesses still remain an important element of the customer base that we serve.
Our total outstanding loans as of December 31, 2009 were approximately $651.9 million, consisting of 54.2% commercial real estate loans, 19.1% residential real estate loans, 9.6% construction and land development real estate loans, 12.8% commercial and industrial loans, 1.8% consumer and 2.5% tax exempt loans.
Investments
We maintain a portfolio of investments, primarily consisting of U.S. Treasury securities, U.S. Government sponsored agency securities, mortgage-backed securities, obligations of states and their political subdivisions, and private placement and corporate bonds. We attempt to balance our portfolio to manage interest rate risks, maximize tax advantages and meet liquidity needs while endeavoring to maximize investment income.
Deposits
We offer a broad range of depository products, including non-interest bearing demand deposits, interest-bearing demand deposits, various savings and money market accounts and certificates of deposit. Deposits are insured by the Deposit Insurance Fund of the Federal Deposit Insurance Corporation (“FDIC”) up to statutory limits. At December 31, 2009, our total deposits were approximately $831.6 million, including interest-bearing deposits of $750.3 million and non-interest bearing deposits of $81.3 million. Deposits of $41.7 million were covered under the FDIC’s Transaction Account Guarantee Program.
Other Customer Services and Products
Other services and products we offer include transfer agency, safe deposit box services, personal and corporate trust services, conference center facilities, insurance agency and brokerage services, cash management, private banking, financial planning and electronic banking services, including mobile banking, and ebanc, an Internet banking product for our customers.
Seasonality
The tourism/recreation industry, particularly in the Door County market, substantially affects our business with our customers, particularly those customers in the restaurant and lodging businesses. The tourist business of Door County is largely seasonal, with the vast majority of tourists vacationing beginning in early spring and continuing until late fall. Although businesses and customers involved in the delivery of tourism-related services have financial needs throughout the entire year, the seasonal nature of the tourist business tends to result in increased demands for loans shortly before and during the tourist season and causes reduced deposits shortly before and during the early part of the tourist season.
Competition
The financial services industry is highly competitive. We compete with other financial institutions and businesses in both attracting and retaining deposits and making loans in all of our principal markets. The primary factors in competing for deposits are interest rates, personalized services, the quality and range of financial services, convenience of office locations and office hours. Competition for deposit products comes primarily from other commercial banks, savings banks, credit unions and non-bank competitors, including insurance companies, money market and mutual funds, and other investment alternatives. The primary factors in competing for loans are interest rates, loan origination fees, the quality and range of lending services and personalized services. Competition for loans comes primarily from other commercial banks, savings banks, mortgage banking firms, credit unions, finance companies, leasing companies and other financial intermediaries. Some of our competitors are not subject to the same degree of regulation as that imposed on bank holding companies or federally insured state-chartered banks, and may be able to price loans and deposits more aggressively. We also face direct competition from other banks and bank holding companies that have greater assets and resources than ours.
5
Regulation and Supervision
Baylake Corp. As a bank holding company, we are subject to regulation by the Board of Governors of the Federal Reserve (“FRB”) and examination by the Federal Reserve Bank of Chicago (“Reserve Bank”) under the BHCA and are required to file reports of our operations and such additional information as the FRB may require. Under FRB policy, we are expected to act as a source of financial strength to our subsidiary bank and to commit resources to support the bank in circumstances where we might not deem it appropriate to do so, absent such policy.
With certain limited exceptions, the BHCA prohibits bank holding companies from acquiring direct or indirect ownership or control of voting shares or assets of any company other than a bank, unless the company involved is engaged solely in one or more activities which the FRB has determined to be financial in nature or incidental to such financial activity. In 1999, Congress enacted the Gramm-Leach-Bliley Act (“GLB Act”), which eliminated certain barriers to and restrictions on affiliations between banks and securities firms, insurance companies and other financial services organizations. Among other things, the GLB Act amended the BHCA to permit bank holding companies that qualify as “financial holding companies” to engage in a broad list of “financial activities,” and any non-financial activity that the FRB, in consultation with the Secretary of the Treasury, determines is “complementary” to a financial activity and poses no substantial risk to the safety and soundness of depository institutions or the financial system. The GLB Act treats various lending, insurance underwriting, insurance company, portfolio investment, financial advisory, securities underwriting, dealing and market-making, and merchant banking activities as financial in nature for this purpose.
Under the GLB Act, a bank holding company may become certified as a financial holding company by filing a notice with the FRB, together with a certification that the bank holding company meets certain criteria, including capital, management and Community Reinvestment Act requirements. We have not elected to be certified as a financial holding company.
The FRB uses capital adequacy guidelines in its regulation of bank holding companies. If capital falls below minimum guidelines, a bank holding company may, among other things, be denied approval to acquire or establish banks, non-bank businesses or other bank holding companies.
The FRB has issued a policy statement on the payment of cash dividends by bank holding companies, which expresses the FRB’s view that a bank holding company should pay cash dividends only to the extent that its net income for the past year is sufficient to cover both the cash dividend and a rate of retention consistent with its needs. The FRB policy statement also indicates that it would be inappropriate for a bank holding company experiencing serious financial problems to borrow money to pay dividends. In addition, compliance with capital adequacy guidelines at both a bank subsidiary and a bank holding company could affect such entity’s ability to pay dividends, if its capital levels were to decrease.
The Sarbanes-Oxley Act of 2002 (“SOX”) addresses, among other issues, director and officer responsibilities for proper corporate governance of publicly traded companies, including the establishment of audit committees, certification of financial statements, auditor independence and accounting standards, executive compensation, insider loans, whistleblower protection, and enhanced and timely disclosure of corporate information. In general, SOX is intended to allow stockholders to monitor more effectively the performance of publicly traded companies and their management. The SEC has enacted rules to implement various provisions of SOX, which affect us as a publicly-held entity. The federal banking regulators also have adopted generally similar requirements concerning the certification of financial statements. Among these requirements is the adoption of company-wide codes of conduct by banks. SOX also imposes additional corporate governance requirements on publicly-held companies, particularly relating to the functioning of audit committees. We are subject to the requirement of annual attestation and review of our internal control on financial reporting.
6
Baylake Bank. As a FRB member Wisconsin state-chartered bank, we are subject to supervision and regulation by the Wisconsin Department of Financial Institutions, Division of Banking (“WDFI”), the FRB and the FDIC. Federal law and regulations establish supervisory standards applicable to the lending activities of our bank, including internal controls, credit underwriting, loan documentation and loan-to-value ratios for loans secured by real property.
Our bank is subject to federal and state statutory and regulatory restrictions on any extension of credit to us or our subsidiaries, on investments in our stock or other securities of our subsidiaries, on the payment of dividends to us, and on the acceptance of the stock or other securities of our subsidiaries as collateral for loans to any person. Limitations and reporting requirements are also placed on extensions of credit by our bank to our directors and officers, to the directors and officers of our subsidiaries, to our principal shareholders, and to “related interests” of such directors, officers and principal shareholders.
In addition to general requirements that banks retain specified levels of capital and otherwise conduct their business in a safe and sound manner, Wisconsin law requires that dividends of Wisconsin banks be paid out of current earnings or, no more than once within the immediate preceding two years, out of undivided profits. Any other dividends require the prior written consent of the WDFI.
Under the Community Reinvestment Act (“CRA”) and the implementing regulations, our bank has a continuing and affirmative obligation to help meet the credit needs of our local community including low and moderate-income neighborhoods, consistent with the safe and sound operation of the institution. The CRA requires the boards of directors of financial institutions, such as our bank, to adopt a CRA statement for each assessment area that, among other things, describes its efforts to help meet community credit needs and the specific types of credit that the institution is willing to extend. Our bank’s service area is designated and comprises the eight counties within the geographic area of Central and Northeast Wisconsin. Our bank’s board of directors is required to review the appropriateness of this delineation at least annually.
Our bank’s business includes making a variety of types of loans to individuals. In making these loans, we are subject to state usury and regulatory laws and to various federal statutes, such as the Equal Credit Opportunity Act, the Fair Credit Reporting Act, the Truth in Lending Act, the Real Estate Settlement Procedures Act, the Home Mortgage Disclosure Act, and the regulations promulgated thereunder, which prohibit discrimination, specify disclosures to be made to borrowers regarding credit and settlement costs and regulate the mortgage loan servicing activities of our bank, including the maintenance and operation of escrow accounts and the transfer of mortgage loan servicing. In receiving deposits, we are subject to extensive regulation under state and federal law and regulations, including the Truth in Savings Act, the Expedited Funds Availability Act, the Bank Secrecy Act, the Electronic Funds Transfer Act and the Federal Deposit Insurance Act. Violation of these laws could result in the imposition of significant damages and fines upon us, our directors and officers.
Under the GLB Act, all financial institutions are required to adopt privacy policies, restrict the sharing of non public customer data with nonaffiliated parties at the customer’s request and establish procedures and practices to protect customer data from unauthorized access.
Under Title III of the Uniting and Strengthening America by Providing Appropriate Tools Required to Intercept and Obstruct Terrorism Act of 2001 (“PATRIOT Act”), also known as the International Money Laundering Abatement and Anti-Terrorism Financing Act of 2001, all financial institutions are required to take certain measures to identify customers, prevent money laundering, monitor certain customer transactions and report suspicious activity to U.S. law enforcement agencies, and to scrutinize or prohibit altogether certain transactions of special concern. Financial institutions are also required to respond to requests for information from federal banking regulatory agencies and law enforcement agencies concerning their customers and their transactions.
Federal law provides that adequately managed bank holding companies from any state may acquire banks and bank holding companies located in any other state, subject to certain conditions.
Financial institution regulatory agencies are given substantial powers to take corrective actions, which may include restrictions on methods of doing business and the prohibition of certain actions.
Employees
At December 31, 2009, we had 306 full-time equivalent employees company-wide. We consider our relationship with our employees to be good.
7
Forward-Looking Statements
This report contains statements that may constitute forward-looking statements within the meaning of the safe-harbor provisions for forward-looking statements contained in the Private Securities Litigation Reform Act of 1995, such as statements other than historical facts contained or incorporated by reference in this report. These forward-looking statements include statements with respect to our financial condition, results of operations, plans, objectives, future performance and business, including statements preceded by, followed by or that include the words “believes,” “expects,” or “anticipates,” references to estimates or similar expressions. Future filings by us with the Securities and Exchange Commission (“SEC”), and future statements other than historical facts contained in written material, press releases and oral statements issued by us, or on our behalf, may also constitute forward-looking statements.
Forward-looking statements are subject to significant risks and uncertainties, and our actual results may differ materially from the results discussed in such forward-looking statements. Factors that might cause actual results to differ from the results discussed above include, but are not limited to, the Risk Factors set forth below and any other risks identified in this report or in other filings we may make with the SEC. All forward-looking statements contained in this report or which may be contained in future statements made for or on our behalf are based upon information available at the time the statement is made and we assume no obligation to update any forward-looking statements.
Risk Factors
Our business may be adversely affected by conditions in the financial markets and economic conditions generally.
The United States economy has been in a downward cycle since the end of 2007, which has been marked by reduced business activity across a wide range of industries and regions. Many businesses are experiencing serious difficulties due to the lack of consumer spending and the lack of liquidity in the credit markets. In addition, unemployment has increased significantly and continues to grow.
The financial services industry and the securities markets generally have been materially and adversely affected by significant declines in the values of nearly all asset classes and by a serious lack of liquidity. This was initially triggered by declines in home prices and the resulting impact on sub-prime mortgages but has since spread to all mortgage and real estate asset classes, as well as equity securities.
The economic downturn has also resulted in the failure of a number of prominent financial institutions, resulting in further losses as a consequence of defaults on securities issued by them and defaults under contracts with such entities as counterparties. In addition, declining asset values, defaults on mortgages and consumer loans, the lack of market and investor confidence and other factors have all combined to cause rating agencies to lower credit ratings and to otherwise increase the cost and decrease the availability of liquidity. Some banks and other lenders have suffered significant losses and have become reluctant to lend, even on a secured basis, due to the increased risk of default, and the impact of declining collateral values and greater regulatory scrutiny. In 2008 and 2009, the U.S. government, the FRB and other regulators took numerous steps to increase liquidity and to restore investor confidence, including investing in the equity of other banking organizations through the Capital Purchase Program under the Troubled Asset Relief Program. In spite of this, asset values have continued to decline, and access to liquidity continues to be very limited. If these measures are unsuccessful or if the economic downturn continues, our earnings and, consequently, our financial condition could be depressed.
Our operations are geographically limited and are more at risk for downturns in those areas.
Our financial performance generally is highly dependent upon the business environment in Northeastern Wisconsin, particularly in Door and Brown Counties. As a result of this geographical concentration, we are more vulnerable to downturns or other factors that affect the local economy or decrease demand for our services than if our operations were conducted over a wider area. Other local factors, such as natural disasters and the local regulatory climate, could also significantly affect our results because of our lack of geographical diversity.
8
In our market area, especially in Door County, a significant percentage of our customer base is in the tourism industry, particularly lodging and restaurants. Many of our customers depend indirectly on the tourism industry. This concentration in a single industry could cause any downturn or other issues affecting local tourism to reduce the demand for our services, increase problem loans and thus disproportionately affect our results of operations.
The overall business environment during 2009 has been adverse for many households and businesses in Northeast Wisconsin. The business environment in the markets in which we operate has been adversely affected and continues to deteriorate, albeit at a moderating pace. It is possible that the business environment in Northeastern Wisconsin will continue to deteriorate for the foreseeable future. Such conditions could have a material adverse effect on the credit quality of our loans, and therefore, our financial condition and results of operations.
Weakness in the markets for residential or commercial real estate, including the secondary residential mortgage loan markets, could reduce our net income and profitability.
Since 2007, softening residential housing markets, increasing delinquency and default rates, and increasingly volatile and constrained secondary credit markets have been negatively impacting the mortgage industry. Our financial results have been adversely affected by changes in real estate values, primarily in Northeastern Wisconsin. Decreases in real estate values have adversely affected the value of property used as collateral for loans and investments in our portfolio. The poor economic condition experienced in 2007 through 2009 resulted in decreased demand for commercial real estate loans, and our net income and profits have suffered as a result.
The declines in home prices in many markets across the U.S., including Northeastern Wisconsin, along with the reduced availability of mortgage credit, also has resulted in increases in delinquencies and losses in our portfolio of loans related to residential real estate. Further declines in home prices within Northeastern Wisconsin coupled with the continued impact of the economic recession and high unemployment levels, could drive losses beyond the levels provided for in our allowance for loan losses. In that event, our future earnings would be adversely affected.
Significant ongoing disruption in the secondary market for residential mortgage loans has limited the market for and liquidity of most mortgage loans other than conforming Fannie Mae, Freddie Mac and Ginnie Mae loans. The effects of ongoing mortgage market challenges, combined with the ongoing correction in residential real estate market prices and reduced levels of home sales has resulted in price reductions in single family home values, adversely impacting the value securing mortgage loans held. Continued declines in real estate values and home sales volumes within Northeastern Wisconsin, and financial stress on borrowers as a result of job losses, or other factors, could have further adverse effects on borrowers that result in higher delinquencies and greater charge-offs in future periods, which would adversely affect our financial condition and results of operations.
We are subject to interest rate risk.
Our earnings and cash flows are largely dependent upon our net interest income, which is the difference between interest income on interest-earning assets such as loans and securities and interest expense paid on interest-bearing liabilities such as deposits and borrowed funds. There are many factors which influence interest rates that are beyond our control, including but not limited to general economic conditions and governmental policy, in particular, the policies of the FRB. Any changes in such policies, including changes in interest rates, could influence the amount of interest we receive on loans and securities and the amount of interest we pay on deposits and borrowings. Such changes could also affect (i) our ability to originate loans and obtain deposits, (ii) the value of our financial assets and liabilities, and (iii) the average maturity of our securities portfolio. In addition, an increase in the general level of interest rates may also adversely affect the ability of certain of our borrowers to repay their obligations. If the interest rates paid on deposits and other borrowings increase at a faster rate than the interest rates received on loans and other investments, our net interest income, and therefore our earnings, would be adversely affected. Earnings would also be adversely affected if the interest rates received on loans and other investments fall more quickly than the interest rates paid on deposits and other borrowings.
Management uses various methods to monitor interest rate risk and believes it has implemented effective asset and liability strategies to reduce the potential effects of changes in interest rates on our results of operations. Management also periodically adjusts our mix of assets and liabilities to manage interest rate risk. However, any substantial, unexpected, prolonged change in market interest rates could have a material adverse effect on our consolidated financial condition and results of operations.
9
We are subject to lending risk.
There are inherent risks associated with our lending activities. These risks include the impact of changes in interest rates and change in the economic conditions in the markets we serve, as well as those across the United States. An increase in interest rates and/or continuing weakening economic conditions could adversely impact the ability of our borrowers to repay outstanding loans, or could substantially weaken the value of the collateral securing those loans. Continuing economic weakness on real estate and related markets could further increase our lending risk as it relates to our commercial real estate loan portfolio and the value of the underlying collateral. Approximately 54.2% of our loans are concentrated in commercial real estate as well as 19.1% in residential real estate lending as of December 31 2009, compared to 52.4% and 19.4% as of December 31, 2008, respectively. Continued downward pressure on real estate values could increase the potential for problem loans and thus have a direct impact on our consolidated results of operations.
We are also subject to various laws and regulations that affect our lending activities. Failure to comply with applicable laws and regulations could subject us to regulatory enforcement action that could result in the assessment of significant civil monetary penalties against us.
Our allowance for loan losses may be insufficient.
To address risks inherent in our loan portfolio, we maintain an allowance for loan losses that represents management’s best estimate of probable losses that may occur within our existing loan portfolio. The level of the allowance reflects management’s continuing evaluation of various factors, including industry concentrations, specific credit risks, loan loss experience, current loan portfolio quality, present economic, political and regulatory conditions, and unidentified losses inherent in the current loan portfolio. Determining the appropriate level of the allowance for loan losses involves a high degree of subjectivity and requires us to make estimates of significant credit risks and future trends, all of which may undergo material changes. In evaluating our impaired loans, we assess repayment expectations and determine collateral values based on all information that is available to us. However, we must often make subjective decisions based on our assumptions about the creditworthiness of the borrowers and the value of the collateral.
Continuing deterioration in economic conditions affecting borrowers, new information regarding existing loans, identification of additional problem loans, and other factors, both within and outside of our control, may require an increase in our allowance for loan losses. In addition, bank regulatory agencies periodically examine our allowance for loan losses and may require an increase in the allowance or the recognition of further loan charge-offs, based on judgments different from those of management.
If charge-offs in future periods exceed our allowance for loan losses, we will need to take additional loan loss provisions to increase our allowance for loan losses. Any additional loan loss provisions will reduce our net income or increase our net loss, which would have a material adverse effect on our financial condition and results of operations.
Uncertainty in the financial markets could result in lower fair values for our investment securities, which fair values may not be realizable if we were to sell those securities today.
The upheaval in the financial markets over the past two years has adversely impacted investor demand for all classes of securities and has resulted in volatility in the fair values of our investment securities. Significant prolonged reduction in investor demand could result in lower fair values for these securities and may result in recognition of an other-than-temporary impairment charge, which would have a direct adverse impact on our consolidated results of operations.
We are subject to environmental liability risk associated with collateral securing our real estate lending.
Because a significant portion of our loan portfolio is secured by real property, from time to time we may find it necessary to foreclose on and take title to properties securing such loans. In doing so, there is a risk that hazardous or toxic substances could be found on those properties. If such substances are found, we may be liable for remediation costs, as well as for personal injury and property damage. We may also be required to incur substantial expenses that could materially reduce the affected property’s value or limit our ability to use or sell the affected property. In addition, future environmental laws or more stringent interpretations or enforcement policies with respect to existing laws may increase our exposure to environmental liability. Although we are careful to perform environmental reviews on properties prior to foreclosure, our reviews may not detect all environmental hazards.
We may be adversely affected by the soundness of other financial institutions.
Financial services institutions are interrelated as a result of trading, clearing, counterparty or other relationships. We routinely execute transactions with counterparties in the financial services industry, including commercial banks, brokers and dealers, investments banks, and other institutional clients. Many of these transactions expose us to credit risk in the event of default by a counterparty. In addition, our credit risk may be heightened when the collateral we hold cannot be realized upon liquidation or is liquidated at prices not sufficient to recover the full amount of the credit or derivative exposure due to us. Any such losses could have a material adverse effect on our consolidated financial condition and results of operations.
10
Competition may affect our results.
We face strong competition in originating loans, in seeking deposits and in offering our other services. We must compete with commercial banks, savings associations, trust companies, mortgage banking firms, credit unions, finance companies, mutual funds, insurance companies and brokerage and investment banking firms. Our market area is also served by several commercial banks and savings associations that are substantially larger than us in terms of deposits and loans and have greater human and financial resources.
This competitive climate can make it more difficult to establish and maintain relationships with new and existing customers and can lower the rate we are able to charge on loans, increase the rates we must offer on deposits, and affect our charges for other services. Those factors can, in turn, adversely affect our results of operations and profitability.
Maintaining or increasing our market share may depend on lowering prices and market acceptance of new products and services.
Our success depends, in part, on our ability to adapt our products and services to evolving industry standards. There is increasing pressure to provide products and services at lower prices. Lower prices can reduce our net interest margin and revenues from our fee-based products and services. In addition, the widespread adoption of new technologies, including internet services, could require us to make substantial expenditures to modify or adapt our existing products and services. Also, these and other capital investments in our business may not produce expected growth in earnings anticipated at the time of the expenditure. We may not be successful in introducing new products and services, achieving market acceptance of our products and services, or developing and maintaining loyal customers.
Acts or threats of terrorism and political or military actions by the United States or other governments could adversely affect general economic industry conditions.
Geopolitical conditions may affect our earnings. Acts or threats of terrorism and political actions taken by the United States or other governments in response to terrorism, or similar activity, could adversely affect general economic or industry conditions and, as a result, our consolidated financial condition and results of operations.
We operate in a highly regulated environment, which could increase our cost structure or have other negative impacts on our operations.
We are highly regulated by both federal and state regulatory authorities. Regulation includes, among other things, capital and reserve requirements, permissible investments and lines of business, dividend limitations, limitations on products and services offered, loan limits, geographical limits, consumer credit regulations, community reinvestment requirements and restrictions on transactions with affiliated parties. The system of supervision and regulation applicable to us establishes a comprehensive framework for our operations and is intended primarily for the protection of the Deposit Insurance Fund, our depositors and the public, rather than our stockholders. We are also subject to regulation by the SEC. Failure to comply with applicable laws, regulations or policies could result in sanction by regulatory agencies, civil monetary penalties, and/or damage to our reputation, which could have a material adverse effect on our business, consolidated financial condition and results of operations. In addition, any change in government regulation could have a material adverse effect on our business.
Recent legislative and regulatory actions taken to stabilize the United States banking system and additional actions being considered may not succeed or may disadvantage us.
In response to the recent financial crisis, the United States government, specifically the Department of Treasury, FRB and FDIC, working in cooperation with foreign governments and other central banks, has taken a variety of extraordinary measures designed to restore confidence in the financial markets and to strengthen financial institutions, including measures available under the Emergency Economic Stabilization Act (“EESA”). The EESA followed, and has been followed by, numerous actions by the FRB, United States Congress, Department of Treasury, FDIC, SEC and others to address the current liquidity and credit crisis. These measures included homeowner relief that encourages loan restructuring and modification; the establishment of significant liquidity and credit facilities for financial institutions and investment banks; the lowering of the federal funds rate; emergency action against short selling practices; a temporary guaranty program for money market funds; the establishment of a commercial paper funding facility to provide back-stop liquidity to commercial paper issuers; and coordinated international efforts to address illiquidity and other weaknesses in the financial sector. The purpose of these legislative and regulatory actions is to stabilize the U.S. banking system. However, there can be no assurance as to the actual impact the EESA will have on the financial markets, including the extreme levels of volatility and limited credit availability currently being experienced by some institutions, and they may not have the desired effects. If the volatility in the markets continues and economic conditions fail to improve or continue to worsen, our business and consolidated financial condition and results of operations could be materially adversely affected.
The Department of Treasury is currently developing additional programs to further alleviate the ongoing financial crisis. There can be no assurance that we will be able to participate in any such future programs. If we are unable to participate or choose not to participate, it may have a material adverse effect on our competitive position and consolidated financial condition and results of operations.
We are subject to increases in FDIC insurance premiums and special assessments by the FDIC.
During 2008 and continuing in 2009, higher levels of bank failures have dramatically increased resolution costs of the FDIC and depleted the deposit insurance fund. In addition, the FDIC instituted two temporary programs to further insure customer deposits at FDIC insured banks: deposit accounts now are insured up to $250,000 per customer (up from $100,000) and noninterest-bearing transactional accounts are currently fully insured (unlimited coverage). These programs have placed additional stress on the Deposit Insurance Fund. In order to maintain a strong funding position and restore reserve ratios of the Deposit Insurance Fund, the FDIC has increased assessment rates of the insured institutions. In addition, on November 12, 2009, the FDIC adopted a rule requiring banks to prepay three years’ worth of estimated deposit insurance premiums by December 31, 2009. We are generally unable to control the amount of premiums that we are required to pay for FDIC insurance. If there are additional bank or financial institution failures, or the cost of resolving prior failures exceeds expectations, we may be required to pay even higher FDIC premiums than the recently increased levels. These announced increases and any future increases or required prepayments of FDIC insurance premiums may adversely impact our earnings and financial condition.
11
Unauthorized disclosure of sensitive or confidential client or customer information, whether through a breach of our computer system or otherwise, could severely harm our business.
As part of our financial and data processing products and services, we collect, process and retain sensitive and confidential client and customer information. Despite the security measures we have in place, our facilities and systems, and those of third party service providers, may be vulnerable to security breaches, acts of vandalism, computer viruses, misplaced or lost data, programming and/or human error, or other similar events. Any security breach involving the misappropriation, loss or other unauthorized disclosure of confidential information, whether by us or our vendors, could severely damage our reputation, expose us to the risks of litigation and liability, disrupt our operations and harm our business.
Customers may decide not to use banks to complete their financial transactions, which could result in a loss of income to us.
Technology and other changes are allowing customers to complete financial transactions that historically have involved banks at one or both ends of the transaction. For example, customers can now pay bills and transfer funds directly without going through a bank. The process of eliminating banks as intermediaries, known as disintermediation, could result in the loss of fee income, as well as the loss of customer deposits.
Our controls and procedures may fail or be circumvented.
Management regularly reviews and updates our internal controls, disclosure controls and procedures, and corporate governance policies and procedures. Any system of controls, however well-designed and operated, is based in part on certain assumptions and can provide only reasonable assurances that the objectives of the system are met. Any failure or circumvention of our controls and procedures or failure to comply with regulations related to controls and procedures could have a material adverse effect on our business, consolidated financial condition and results of operations.
We rely on the accuracy and completeness of information about customers or counterparties, and inaccurate or incomplete information could negatively impact our consolidated financial condition and results of operations.
In deciding whether to extend credit or enter into other transactions with customers and counterparties, we may rely on information provided to us by such customers and counterparties, including financial statements and other financial information. We may also rely on representations of customers and counterparties as to the accuracy and completeness of that information and, with respect to financial statements, on reports of independent auditors. Our financial condition and results of operations could be negatively impacted to the extent we rely on financial statements that do not comply with generally accepted accounting principles or that are inaccurate or misleading.
We are subject to examinations and challenges by taxing authorities.
In the normal course of business, we are routinely subjected to examinations and challenges from federal and state taxing authorities regarding the amount of taxes due in connection with our investments and the businesses in which we engage. Federal and state taxing authorities have recently become increasingly aggressive in challenging tax positions taken by financial institutions. These tax positions may relate to tax compliance, sales and use, franchise, gross receipts, payroll, property or income tax issues, including tax base, apportionment and tax planning. The challenges made by taxing authorities may result in adjustments to the timing or amount of taxable income or deductions or the allocations of income among tax jurisdictions. If any such challenges are not resolved in our favor, they could have a material adverse impact on our consolidated financial condition and results of operations.
We could experience an unexpected inability to obtain needed liquidity.
Liquidity measures the ability to meet current and future cash flow needs as they become due. The liquidity of a financial institution reflects its ability to meet loan requests, to accommodate possible outflows in deposits, and to take advantage of interest rate market opportunities. The ability of a financial institution to meet its current financial obligations is a function of its balance sheet structure, its ability to liquidate assets and its access to alternative sources of funds. We seek to ensure our funding needs are met by maintaining an appropriate level of liquidity through asset/liability management. If we become unable to obtain funds when needed, it could have a material adverse effect on our business and, in turn, our consolidated financial condition and results of operations.
A decline in our stock price could require a write-down of some portion or all of our goodwill.
If our stock price were to decline, or remain below our tangible book value for an extended period of time, we could be required to write off all or a portion of our goodwill, which represents our value in excess of our tangible book value. Such write-off would reduce earnings in the period in which it is recorded. Our stock price is subject to market conditions that can be impacted by forces outside the control of management, such as a perceived weakness in financial institutions in general, and may not be a direct result of our performance. A write-off of goodwill could have a material adverse effect on our consolidated financial condition and results of operations.
12
Future growth or operating results may require us to raise additional capital but that capital may not be available.
We are required by federal and state regulatory authorities to maintain adequate levels of capital to support our operations. To the extent our future operating results erode capital or we elect to expand through loan growth or acquisition, we may be required to raise capital.
Our ability to raise capital will depend on conditions in the capital markets, which are outside of our control, and on our financial performance. Accordingly, we cannot be assured of our ability to raise capital when needed or on favorable terms. If we cannot raise additional capital when needed, we will be subject to increased regulatory supervision and the imposition of restrictions on our growth and business. These could negatively impact our ability to operate or further expand our operations and may result in increases in operating expenses and reductions in revenues that could have a material effect on our consolidated financial condition and results of operations.
The holders of our junior subordinated debentures have rights that are senior to those of our shareholders.
On March 31, 2006, we issued $16.1 million of floating rate junior subordinated debentures in connection with a $16.1 million trust preferred securities issuance by our subsidiary, Baylake Capital Trust II. The 2006 junior subordinated debentures mature in March of 2036. The purpose of the transaction was to raise additional capital in order for us to redeem our trust preferred securities issued by our subsidiary Baylake Capital Trust I.
Payments of the principal and interest on the trust preferred securities are conditionally guaranteed by us. The junior subordinated debentures are senior to our shares of common stock. As a result, we must make payments on the junior subordinated debentures (and the related trust preferred securities) before any dividends can be paid on our common stock and, in the event of our bankruptcy, dissolution or liquidation, the holders of the debentures must be satisfied before any distributions can be made to the holders of our common stock. We have the right to defer distributions on the junior subordinated debentures (and the related trust preferred securities) for up to five years, during which time no dividends may be paid to holders of our common stock.
To the extent that we issue additional junior subordinated debentures in connection with an additional trust preferred securities issuance, the additional junior subordinated debentures will rank pari passu with our existing 2006 junior subordinated debentures and senior to our shares of common stock.
The holders of our convertible notes will have rights that are senior to those of our shareholders.
During the third and fourth quarter of 2009, we issued $5.35 million of our 10% Convertible Notes due June 30, 2017 (the “Convertible Notes”). The Convertible Notes are senior to our junior subordinated debentures issued in connection with trust preferred securities, as well as shares of our common stock. In the event of our bankruptcy, dissolution or liquidation, the holders of our Convertible Notes must be satisfied before any distributions can be made to the holders of our common stock.
Our securities are not an insured deposit.
Securities issued by us are not a bank deposit and are not insured or guaranteed by the FDIC or any other government agency. Your investment in our securities are subject to investment risk, and you must be capable of affording the loss of your entire investment.
The holding company cannot rely on dividends from Baylake Bank.
Our holding company is a separate and distinct legal entity from its subsidiaries. Historically, it has received substantially all of its revenue from dividends from Baylake Bank. Federal and/or state laws and regulations limit the amount of dividends that the Bank may pay to the holding company. Also, a holding company’s right to participate in a distribution of assets upon a subsidiary’s liquidation or reorganization is subject to the prior claims of the subsidiary’s creditors. In the event Baylake Bank is unable to pay dividends to the holding company, when needed, the holding company may not be able to service debt or pay its obligations, including dividends on the Trust Preferred Stock and Convertible Promissory Notes. The inability to receive dividends from Baylake Bank could have a material adverse effect on our business, financial condition and results of operations. Our recent losses have had the consequence of not allowing Baylake Bank to pay dividends to the parent company without prior regulatory approval.
We may not be able to attract and retain skilled people.
Our success depends, in large part, on our ability to attract and retain key people. Competition for the best people in most activities engaged in by us can be intense and we may not be able to hire people or retain them. The unexpected loss of services of one or more of our key personnel could have a material adverse impact on our business because of their skills, knowledge of our local markets, years of industry experience and the difficulty of promptly finding qualified replacement personnel.
We continually encounter technological change.
The financial services industry is continually undergoing rapid technological change with frequent introductions of new technology driven by products and services. The effective use of technology increases efficiency and enables financial institutions to better serve customers and to reduce costs. Our future success depends, in part, upon our ability to address the needs of our customers by using technology to provide products and services that will satisfy customer demands, as well as to create additional efficiencies in our operations. Many of our competitors have substantially greater resources to invest in technological improvements. We may not be able to effectively implement new technology driven products and services or be successful in marketing these products and services to our customers. Failure to successfully keep pace with technological change affecting the financial services industry could have a material adverse impact on our business and, in turn, our financial condition and results of operations.
Possible restrictions on bank overdraft programs could significantly reduce our deposit service charge income.
On November 12, 2009, the Federal Reserve Board announced final rules that prohibit institutions from charging consumers fees for paying overdrafts on automated teller machine (ATM) and one-time debit card transactions. The new rules require consumers to consent, or opt in, to the overdraft service for these two types of transactions before fees can be charged. We anticipate these new rules could significantly impact our nonsufficient funds and overdraft income the last two quarters of 2010 because of the required implementation dates of July 1 for new accounts and August 15 for existing accounts. A team is currently in place ensuring our systems are ready to meet the new rules. In addition, this team is working on a communication plan for existing accounts, which will educate our customers on the various overdraft options. Beyond this regulatory change, a bill has been introduced to the House which could place further restrictions on overdraft charges. If this bill or one similar to it passed, our service charge income could be reduced even further.
13
ITEM 1B. UNRESOLVED STAFF COMMENTS
None.
Our bank owns its headquarters and twenty-six branches and leases one branch office from a third party. The main office is located in Sturgeon Bay, Wisconsin and the branches are distributed by county as follows: eight in Brown County, seven in Door County, one in Green Lake County, four in Kewaunee County, one in Manitowoc County, one in Outagamie County, four in Waupaca County and one in Waushara County.
The main office building located in Sturgeon Bay serves as our corporate headquarters and main banking office. The main office also accommodates our expanded business, primarily an insurance agency (Baylake Insurance Agency) and brokerage service. The twenty-seven branches owned or leased by our bank are in good condition and considered adequate for present and near term requirements. In addition, our bank owns other real property that we do not consider in the aggregate to be material to our consolidated financial position. All of such other real property is reserved for future expansion and is located in the following Wisconsin municipalities: Berlin, Appleton, Neenah, and Oshkosh.
We may be involved from time to time in various routine legal proceedings incidental to our business. Neither we nor any of our subsidiaries is currently engaged in any legal proceedings that are expected to have a material adverse effect on our consolidated financial statements.
14
ITEM 5. MARKET FOR REGISTRANT’S COMMON EQUITY, RELATED STOCKHOLDER MATTERS AND ISSUER PURCHASES OF EQUITY SECURITIES
Historically, trading in shares of our common stock has been limited. Since mid-1993, our common stock has been quoted on the OTC Bulletin Board (Trading symbol: BYLK.OB), an electronic interdealer quotation system providing real-time quotations on eligible securities.
The following table summarizes high and low bid prices and cash dividends declared for our common stock for the periods indicated. Bid prices are as reported from the OTC Bulletin Board. The reported high and low prices represent interdealer bid prices, without retail mark-up, mark-downs or commission, and may not necessarily represent actual transactions.
|
|
|
|
|
|
|
|
|
|
|
|
|
|
|
|
|
|
|
Calendar period |
|
High |
|
Low |
|
Cash dividends per |
|
|||||
|
2008 |
|
|
1st Quarter |
|
$ |
11.75 |
|
$ |
8.55 |
|
$ |
— |
|
|
|
|
|
|
2nd Quarter |
|
$ |
9.05 |
|
$ |
6.00 |
|
$ |
— |
|
|
|
|
|
|
3rd Quarter |
|
$ |
6.75 |
|
$ |
4.00 |
|
$ |
— |
|
|
|
|
|
|
4th Quarter |
|
$ |
6.75 |
|
$ |
3.50 |
|
$ |
— |
|
|
|
|
|
|
|
|
|
|
|
|
|
|
|
|
|
|
|
2009 |
|
|
1st Quarter |
|
$ |
5.05 |
|
$ |
1.55 |
|
$ |
— |
|
|
|
|
|
|
2nd Quarter |
|
$ |
4.95 |
|
$ |
1.85 |
|
$ |
— |
|
|
|
|
|
|
3rd Quarter |
|
$ |
4.20 |
|
$ |
2.99 |
|
$ |
— |
|
|
|
|
|
|
4th Quarter |
|
$ |
3.75 |
|
$ |
2.50 |
|
$ |
— |
|
|
We had approximately 1,746 shareholders of record at March 12, 2010. The number of shareholders does not separately reflect persons or entities that hold their stock in nominee or “street” name through various brokerage firms.
The holders of our common stock are entitled to receive such dividends when and as declared by our Board of Directors and approved by our regulators. In determining the payment of cash dividends, our Board of Directors considers the earnings, capital and debt servicing requirements, financial ratio guidelines issued by the FRB and other banking regulators, our financial condition, and other relevant factors.
Our ability to pay dividends is dependent upon our receipt of dividends from our subsidiary bank, which is subject to regulatory restrictions. Such restrictions, which govern state-chartered banks, generally limit the payment of dividends on bank stock to the bank’s undivided profits after all payments of all necessary expenses, provided that the bank’s surplus equals or exceeds its capital, as discussed further in Item 7, Management Discussion and Analysis of Financial Condition and Results of Operation-Capital Resources. In addition, under the terms of our junior subordinated debentures due 2036, we would be precluded from paying dividends on our common stock if we were in default under the Debentures, if we exercised our right to defer payments of interest on the Debentures, or if certain related defaults occurred.
Through 2007, cash dividends on our common stock had historically been paid on a quarterly basis in March, June, September and January. No cash dividends were declared during 2008 and 2009 versus total cash dividends of $0.64 per share declared during 2007. Beginning in February 2008, our Board of Directors, in consultation with our federal and state bank regulators, elected to forego the payment of cash dividends on our common stock. The payment of dividends in relationship to our financial position continues to be monitored on a quarterly basis and our intentions are to reinstate payment of dividends at the earliest appropriate opportunity. However, there is no assurance if or when we will be able to do so or if we do, in what amounts. In order to pay dividends, we will need to seek approval from the WDFI as well as the FRB.
In the event and at such time as we do resume payment of quarterly dividends, we maintain a dividend reinvestment plan enabling participating shareholders to elect to purchase shares of our common stock in lieu of receiving cash dividends. Such shares may be newly issued or acquired by us in the open market. New shares issued under this plan are limited to 1 million over the life of the plan.
15
On August 14, 2009 and September 30, 2009, we completed closings for a private placement of 10% Convertible Notes due June 30, 2017 (the “Convertible Notes”). Additional closings occurred on November 1, 2009 and December 31, 2009. The Convertible Notes were offered and sold primarily to “accredited investors” as defined in Securities Act of 1933 and up to 35 non-accredited investors in reliance on the exemption from registration under Section 4(2) of the Securities Act of 1933, as amended and Rule 506 promulgated thereunder. At the closings, we issued in aggregate $5.4 million of Convertible Notes. The proceeds of this financing will be contributed, in part, as additional capital to Baylake Bank and otherwise used for general corporate purposes.
The Convertible Notes accrue interest at a fixed rate of 10% per annum upon issuance and until maturity or earlier conversion or redemption. Interest is payable quarterly, in arrears, on January 1, April 1, July 1, and October 1, of each year, commencing October 1, 2009. The Convertible Notes are convertible into shares of our common stock at a conversion ratio of one share of common stock for each $5.00 in aggregate principal amount held on the record date of the conversion subject to certain adjustments as described in the Convertible Notes. Prior to October 1, 2014, each holder of the Convertible Notes may convert up to 100% (at the discretion of the holder) of the original principal amount into shares of our common stock at the conversion ratio. On October 1, 2014, one-half of the original principal amounts are mandatorily convertible at the conversion ratio if conversion has not occurred. The principal amount of any Convertible Note that has not been converted or redeemed will be payable at maturity on June 30, 2017. We are not obligated to register the common stock related to the conversion of the Convertible Notes.
We sold $1.15 million of the Convertible Notes without registration during the fourth quarter of 2009.
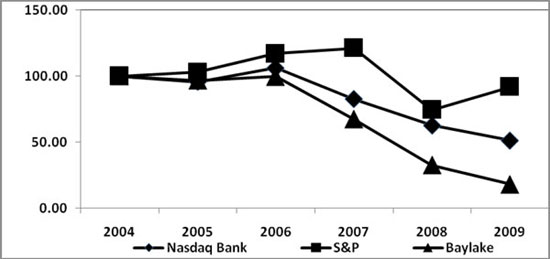
Performance Graph
The following graph shows the cumulative stockholder return on our common stock over the last five fiscal years compared to the returns of Standard & Poors 500 Stock Index and the NASDAQ Bank Index, prepared for NASDAQ by the Center for Research in Securities Prices at the University of Chicago.
Cumulative Total Return(1)
|
|
|
|
|
|
|
|
|
|
|
|
|
|
|
|
|
|
|
|
|
|
|
|
At December 31, |
|
||||||||||||||||
|
|
|
2004 |
|
2005 |
|
2006 |
|
2007 |
|
2008 |
|
2009 |
|
||||||
|
Baylake Corp. |
|
|
100.00 |
|
|
96.90 |
|
|
99.87 |
|
|
67.41 |
|
|
32.57 |
|
|
18.24 |
|
|
NASDAQ Bank Index |
|
|
100.00 |
|
|
95.67 |
|
|
106.20 |
|
|
82.76 |
|
|
62.96 |
|
|
51.31 |
|
|
S&P 500 |
|
|
100.00 |
|
|
103.00 |
|
|
117.03 |
|
|
121.16 |
|
|
74.53 |
|
|
92.01 |
|
|
|
|
|
|
|
|
|
|
|
|
|
|
|
|
|
|
|
|
|
|
|
|
|
|
(1) |
Assumes $100 invested on December 31, 2004 in each of Baylake Corp. common stock, the Standard & Poors 500 Stock Index and the NASDAQ Bank Index. Dividends are assumed to be reinvested. |
16
ITEM 6. SELECTED FINANCIAL DATA
BAYLAKE CORP.
FIVE YEAR SELECTED CONSOLIDATED FINANCIAL DATA
|
|
|
|
|
|
|
|
|
|
|
|
|
|
|
|
|
|
|
|
|
Year Ended December 31, |
|
|
|
|
|
|
|
|||||||
|
|
|
2009 |
|
2008 |
|
2007 |
|
2006 |
|
2005 |
|
|||||
|
|
|
(dollars in thousands, except per share data) |
|
|||||||||||||
|
|
||||||||||||||||
|
Results of operations: |
|
|
|
|
|
|
|
|
|
|
|
|
|
|
|
|
|
Interest and dividend income |
|
$ |
47,468 |
|
$ |
57,276 |
|
$ |
69,668 |
|
$ |
70,014 |
|
$ |
61,538 |
|
|
Interest expense |
|
|
18,259 |
|
|
28,227 |
|
|
38,753 |
|
|
36,378 |
|
|
26,660 |
|
|
Net interest income |
|
|
29,209 |
|
|
29,049 |
|
|
30,915 |
|
|
33,636 |
|
|
34,878 |
|
|
Provision for loan losses |
|
|
6,500 |
|
|
17,961 |
|
|
9,761 |
|
|
903 |
|
|
3,217 |
|
|
Net interest income after provision for loan losses |
|
|
22,709 |
|
|
11,088 |
|
|
21,154 |
|
|
32,733 |
|
|
31,661 |
|
|
Non-interest income |
|
|
12,485 |
|
|
9,257 |
|
|
9,174 |
|
|
9,737 |
|
|
11,597 |
|
|
Non-interest expense: |
|
|
29,978 |
|
|
38,022 |
|
|
32,578 |
|
|
32,329 |
|
|
30,519 |
|
|
Income (loss) before provision (benefit) for income taxes |
|
|
5,216 |
|
|
(17,677 |
) |
|
(2,250 |
) |
|
10,141 |
|
|
12,739 |
|
|
|
|
|
|
|
|
|
|
|
|
|
|
|
|
|
|
|
|
Income tax provision (benefit) |
|
|
887 |
|
|
(7,860 |
) |
|
(2,416 |
) |
|
2,765 |
|
|
3,836 |
|
|
|
|
|
|
|
|
|
|
|
|
|
|
|
|
|
|
|
|
Net income (loss) |
|
$ |
4,329 |
|
$ |
(9,817 |
) |
$ |
166 |
|
$ |
7,376 |
|
$ |
8,903 |
|
|
|
|
|
|
|
|
|
|
|
|
|
|
|
|
|
|
|
|
Per Share Data: (1) |
|
|
|
|
|
|
|
|
|
|
|
|
|
|
|
|
|
|
|
|
|
|
|
|
|
|
|
|
|
|
|
|
|
|
|
Net income (loss) per share (basic)(1) |
|
$ |
.55 |
|
$ |
(1.24 |
) |
$ |
0.02 |
|
$ |
0.95 |
|
$ |
1.15 |
|
|
Net income (loss) per share (diluted)(1) |
|
|
.55 |
|
|
(1.24 |
) |
|
0.02 |
|
|
0.94 |
|
|
1.14 |
|
|
Cash dividends per common share |
|
|
— |
|
|
— |
|
|
0.64 |
|
|
0.64 |
|
|
0.61 |
|
|
Book value per share at end of period |
|
|
9.43 |
|
|
8.72 |
|
|
10.18 |
|
|
10.50 |
|
|
10.09 |
|
|
|
|
|
|
|
|
|
|
|
|
|
|
|
|
|
|
|
|
Selected Financial Condition Data (at December 31): |
|
|
|
|
|
|
|
|
|
|
|
|
|
|
|
|
|
Total assets |
|
$ |
1,044,457 |
|
$ |
1,062,913 |
|
$ |
1,106,616 |
|
$ |
1,111,684 |
|
$ |
1,089,408 |
|
|
Securities |
|
|
204,834 |
|
|
225,417 |
|
|
222,475 |
|
|
188,315 |
|
|
171,638 |
|
|
Gross loans |
|
|
651,894 |
|
|
728,722 |
|
|
760,210 |
|
|
819,568 |
|
|
812,296 |
|
|
Total deposits |
|
|
831,629 |
|
|
849,758 |
|
|
884,185 |
|
|
878,911 |
|
|
856,711 |
|
|
|
|
|
|
|
|
|
|
|
|
|
|
|
|
|
|
|
|
Short-term borrowings (2) |
|
|
21,122 |
|
|
30,174 |
|
|
27,174 |
|
|
4,480 |
|
|
1,315 |
|
|
|
|
|
|
|
|
|
|
|
|
|
|
|
|
|
|
|
|
Other borrowings (3) |
|
|
85,000 |
|
|
85,095 |
|
|
85,172 |
|
|
115,179 |
|
|
125,185 |
|
|
|
|
|
|
|
|
|
|
|
|
|
|
|
|
|
|
|
|
Subordinated debentures |
|
|
16,100 |
|
|
16,100 |
|
|
16,100 |
|
|
16,100 |
|
|
16,100 |
|
|
|
|
|
|
|
|
|
|
|
|
|
|
|
|
|
|
|
|
Convertible promissory notes |
|
|
5,350 |
|
|
— |
|
|
— |
|
|
— |
|
|
— |
|
|
|
|
|
|
|
|
|
|
|
|
|
|
|
|
|
|
|
|
Total shareholders’ equity |
|
$ |
74,598 |
|
$ |
68,954 |
|
$ |
80,262 |
|
$ |
82,193 |
|
$ |
78,544 |
|
|
|
|
|
|
|
|
|
|
|
|
|
|
|
|
|
|
|
|
Performance Ratios: |
|
|
|
|
|
|
|
|
|
|
|
|
|
|
|
|
|
Return on average assets |
|
|
.41 |
% |
|
(0.91 |
%) |
|
0.02 |
% |
|
0.67 |
% |
|
0.82 |
% |
|
Return on average total shareholders’ equity |
|
|
6.01 |
% |
|
(12.35 |
%) |
|
0.21 |
% |
|
9.33 |
% |
|
11.51 |
% |
|
Dividend payout ratio |
|
|
— |
|
|
— |
|
|
3,030.48 |
% |
|
67.67 |
% |
|
52.99 |
% |
|
Net interest margin (4) |
|
|
3.18 |
% |
|
3.11 |
% |
|
3.21 |
% |
|
3.44 |
% |
|
3.60 |
% |
|
Net interest spread (4) |
|
|
3.04 |
% |
|
2.89 |
% |
|
2.80 |
% |
|
3.05 |
% |
|
3.27 |
% |
|
Non-interest income to average assets |
|
|
1.19 |
% |
|
0.86 |
% |
|
0.83 |
% |
|
0.89 |
% |
|
1.07 |
% |
|
Non-interest expense to average assets |
|
|
2.86 |
% |
|
3.53 |
% |
|
2.96 |
% |
|
2.94 |
% |
|
2.81 |
% |
|
Net overhead ratio (5) |
|
|
1.67 |
% |
|
2.67 |
% |
|
2.12 |
% |
|
2.06 |
% |
|
1.74 |
% |
|
Average loan-to-average deposit ratio |
|
|
83.34 |
% |
|
87.18 |
% |
|
91.24 |
% |
|
94.73 |
% |
|
94.16 |
% |
|
Average interest-earning assets to average interest-bearing liabilities |
|
|
107.07 |
% |
|
107.41 |
% |
|
110.58 |
% |
|
111.09 |
% |
|
112.73 |
% |
|
Efficiency ratio (6) |
|
|
77.46 |
% |
|
97.54 |
% |
|
78.93 |
% |
|
72.48 |
% |
|
63.88 |
% |
|
Asset Quality Ratios: (7) |
|
|
|
|
|
|
|
|
|
|
|
|
|
|
|
|
|
Non-performing loans to total loans |
|
|
4.38 |
% |
|
6.04 |
% |
|
4.94 |
% |
|
3.40 |
% |
|
0.85 |
% |
|
Allowance for loan losses to: |
|
|
|
|
|
|
|
|
|
|
|
|
|
|
|
|
|
Gross loans |
|
|
1.47 |
% |
|
1.86 |
% |
|
1.56 |
% |
|
0.98 |
% |
|
1.18 |
% |
|
Non-performing loans |
|
|
33.51 |
% |
|
30.78 |
% |
|
31.53 |
% |
|
29.46 |
% |
|
137.58 |
% |
|
Net charge-offs to average loans |
|
|
1.50 |
% |
|
2.18 |
% |
|
0.74 |
% |
|
0.29 |
% |
|
0.52 |
% |
|
Non-performing assets to total assets |
|
|
4.18 |
% |
|
4.82 |
% |
|
3.86 |
% |
|
3.02 |
% |
|
0.94 |
% |
|
|
|
|
|
|
|
|
|
|
|
|
|
|
|
|
|
|
|
Capital Ratios: (8) |
|
|
|
|
|
|
|
|
|
|
|
|
|
|
|
|
|
Shareholders’ equity to assets |
|
|
7.14 |
% |
|
6.49 |
% |
|
7.25 |
% |
|
7.39 |
% |
|
7.21 |
% |
|
Tier 1 risk-based capital |
|
|
10.22 |
% |
|
8.47 |
% |
|
10.07 |
% |
|
10.00 |
% |
|
9.70 |
% |
|
Total risk-based capital |
|
|
12.18 |
% |
|
9.72 |
% |
|
11.32 |
% |
|
10.87 |
% |
|
10.73 |
% |
|
Leverage ratio |
|
|
7.60 |
% |
|
6.68 |
% |
|
8.34 |
% |
|
8.53 |
% |
|
8.27 |
% |
17
|
|
|
|
(1) |
Earnings per share are based on the weighted average number of shares outstanding for the period. |
|
(2) |
Consists of federal funds purchased and repurchase agreements. |
|
(3) |
Consists of Federal Home Loan Bank term notes and borrowings from an unaffiliated correspondent bank. |
|
(4) |
Net interest margin represents net interest income as a percentage of average interest-earning assets, and net interest rate spread represents the difference between the weighted average yield on interest-earning assets and the weighted average cost of interest-bearing liabilities. |
|
(5) |
Net overhead ratio represents the difference between non-interest expense and non-interest income, divided by average assets. |
|
(6) |
Efficiency ratio represents non-interest expense, excluding gains/losses from sales of fixed assets, divided by the sum of tax equivalent interest income and non-interest income, excluding gains/losses from sales of securities. |
|
(7) |
Non-performing loans consist of non-accrual loans, guaranteed loans 90 days or more past due but still accruing interest and restructured loans. Non-performing assets include non-performing loans and foreclosed assets. |
|
(8) |
The capital ratios are presented on a consolidated basis. For information on our regulatory capital requirements, see Item 7. “Management’s Discussion and Analysis of Financial Condition and Results of Operations-Capital Resources” and Item 1. “Business-Regulation and Supervision”. |
ITEM 7. MANAGEMENT’S DISCUSSION AND ANALYSIS OF FINANCIAL CONDITION AND RESULTS OF OPERATION
General
The following sets forth management’s discussion and analysis of our consolidated financial condition and results of operations that should be read in conjunction with our consolidated financial statements, related notes, the selected financial data and the statistical information presented elsewhere in this report for a more complete understanding of the following discussion and analysis.
Critical Accounting Policies
In the course of our normal business activity, management must select and apply many accounting policies and methodologies that are the basis for the financial results presented in our consolidated financial statements. Some of these policies are more critical than others.
Allowance for Loan Losses (“ALL”): The ALL represents management’s estimate of probable and inherent credit losses in the loan portfolio. Estimating the amount of the ALL requires the exercise of significant judgment and the use of estimates related to the amount and timing of expected future cash flows on impaired loans, estimated losses on pools of homogeneous loans based on historical loss experience, and consideration of current economic trends and conditions, all of which may be susceptible to significant change. The loan portfolio also represents the largest asset on the consolidated balance sheet. Loan losses are charged off against the ALL while recoveries of amounts previously charged off are credited to the ALL. A provision for loan losses (“PFLL”) is charged to operations based on management’s periodic evaluation of the factors previously mentioned, as well as other pertinent factors.
The ALL consists of a specific component on certain loans and a general component for loans without specific reserves. The components of the ALL represent estimations pursuant to either ASC 450-10, Accounting for Contingencies, or ASC 310-10, Accounting by Creditors for Impairment of a Loan. The specific component of the ALL reflects estimated losses from analyses developed through specific credit allocations for individual loans and historical loss experience for each loan category. The specific credit allocations are based on regular analyses of all impaired non-homogenous loans. These analyses involve a high degree of judgment in estimating the amount of loss associated with specific loans, including estimating the amount and timing of future cash flows and collateral values. The general component is based on our historical loss experience which is updated quarterly. The general component of the ALL also includes consideration of concentrations, changes in portfolio mix and volume and other qualitative factors.
There are many factors affecting the ALL, some of which are quantitative, while others require qualitative judgment. The process for determining the ALL (which management believes adequately considers potential factors which might possibly result in credit losses) includes subjective elements and, therefore, may be susceptible to significant change. To the extent actual outcomes differ from management estimates, additional PFLL could be required that could adversely affect our earnings or financial position in future periods. Allocations of the ALL may be made for specific loans but the entire ALL is available for any loan that, in management’s judgment, should be charged-off or for which an actual loss is realized.
18
Foreclosed Properties: Foreclosed properties acquired through or in lieu of loan foreclosure are initially recorded at the lower of carrying cost or fair value, less estimated costs to sell, establishing a new cost basis. Fair value is determined using a variety of market information including but not limited to appraisals, professional market assessments and real estate tax assessment information. If fair value declines subsequent to foreclosure, a write-down is recorded through expense. Costs incurred after acquisition are expensed.
Provision for Impairment of Standby Letters of Credit: The provision for impairment of standby letters of credit represents management’s estimate of probable incurred losses on off-balance sheet standby letters of credit which are used to support our customers’ business arrangements with an unrelated third party. In the event of further impairment, a provision for impairment of standby letters of credit is charged to operations based on management’s periodic evaluation of the factors affecting the standby letters of credit. See the Non-Interest Expense discussion in this Management’s Discussion and Analysis of Financial Condition and Results of Operations section for further information.
Income Tax Accounting: The assessment of tax assets and liabilities involves the use of estimates, assumptions, interpretations, and judgments concerning certain accounting pronouncements and federal and state tax codes. There can be no assurance that future events, such as court decisions or positions of federal and state taxing authorities, will not differ from management’s current assessment, the impact of which could be significant to the consolidated results of our operations and reported earnings. We believe that the tax assets are recoverable, and liabilities are adequate and fairly stated in the consolidated financial statements. See Note 16-“Income Tax Expense” to our consolidated financial statements for further information.
Overview
We are a full-service financial services company, providing a wide variety of loan, deposit and other banking products and services to our business, individual or retail, and municipal customers, as well as a full range of trust, investment and cash management services. We are the bank holding company of Baylake Bank, chartered as a Wisconsin state-chartered bank and a member bank of the Federal Reserve Bank and Federal Home Loan Bank.
Our profitability, like most financial institutions, is dependent to a large extent upon net interest income. Results of operations are also affected by the PFLL, operating expenses, income taxes and non-interest income. Economic conditions, competition and the monetary and fiscal policies of the Federal government in general significantly affect financial institutions, including us. Lending activities are also influenced by regional and local economic factors, including specifically the demand for and supply of housing, competition among lenders, interest rate conditions and prevailing market rates on competing investments, customer preferences and levels of personal income and savings in our market area.
In the last several years, we have developed an internal customer relationship management system (“CRM”) to more effectively manage and market to our internal customer base. We continue to upgrade the system to enhance utilization of resources and the effectiveness of customer services within our market areas.
During the first quarter of 2009, our regulatory capital ratios and those of our bank were in excess of the levels established by regulatory agencies for “well capitalized” financial institutions. Prior to that, during the fourth quarter of 2008, our regulatory capital ratios and those of our bank fell below “well capitalized” levels, but remained in excess of levels established for “adequately capitalized” financial institutions. Significant emphasis was placed on returning to well-capitalized levels during the first quarter of 2009. Action taken, included realizing gains on the sale of securities, reallocating assets to lower risk-weighted levels, and significant reductions in non-interest expenses.
19
Performance Summary
The following is a brief summary of some of the factors that affected our operating results in 2009. See the remainder of this section for a more thorough discussion.
We reported net income of $4.3 million for the year ended December 31, 2009, an increase of $14.1 million over a loss of $9.8 million in 2008. Both basic and diluted income per share were $0.55 for 2009 compared to ($1.24) basic and diluted losses per share for 2008. Return on average assets for the year ended December 31, 2009 was 0.41% and (0.91)% for the year ended December 31, 2008. The return on average equity was 6.01% for 2009 and (12.35)% for 2008. No cash dividends were declared in 2009 or 2008.
Key factors behind these results were:
|
|
|
|
|
|
§ |
Net interest income and net interest margin improved in 2009 as the rates paid on interest bearing liabilities decreased at greater levels than the decrease in rates on our interest earning assets, thereby increasing interest rate spread. |
|
|
§ |
Tax-equivalent net interest income was $30.4 million for 2009, a decrease of $0.1 million or 0.3% from $30.5 million for 2008. Tax-equivalent interest income decreased $10.1 million, while interest expense decreased $10.0 million. The decrease in tax-equivalent net interest income was attributable to a reduction of $0.9 million in tax-exempt interest income resulting from a reduced allocation to tax-exempt securities in our securities portfolio. |
|
|
§ |
The net interest margin for 2009 was 3.18%, compared to 3.11% in 2008. The 7 basis point (bps) increase in net interest margin largely resulted from a 15 bps increase in interest rate spread caused by an 89 bps decrease in the return on interest-earning assets which was more than offset by a 104 bps decrease in the cost of interest-bearing liabilities. |
|
|
§ |
Total loans were $651.9 million at December 31, 2009, a decrease of $76.8 million, or 10.5%, from December 31, 2008. Commercial real estate loans decreased $28.7 million (7.5%) and represented 54.2% of total loans at December 31, 2009 compared to 52.4% at year-end 2008. Total deposits were $831.6 million at December 31, 2009, a decrease of $18.2 million, or 2.1%, from year-end 2008. |
|
|
§ |
Charge-offs decreased from a year ago. Net loan charge-offs were $10.5 million in 2009, a decrease of $5.7 million compared to $16.2 million for 2008. Net loan charge-offs for commercial loans represented $4.0 million of the $10.5 million total in 2009. Net loan charge-offs represented 1.50% of average loans in 2009 compared to 2.18% in 2008. The PFLL decreased to $6.5 million for 2009 compared to $18.0 million for 2008. |
|
|
§ |
Non-interest income was $12.5 million for 2009, an increase of $3.2 million or 34.4% from 2008. A $3.4 million increase in net gains from sales of securities, a $0.7 million increase in gains on sale of loans, and a $0.6 million increase in the cash surrender value of life insurance contributed to the increase. The increases were partially offset by a $0.5 million decrease in other fees to customers, a $0.5 million decrease in equity earnings in UFS, and a $0.6 million decrease in other income primarily related to a settlement favoring us in 2008. |
|
|
§ |
Non-interest expense was $30.0 million for 2009, a decrease of $8.0 million over 2008. This was primarily the result of a decrease in the provision on a standby letter of credit of $2.5 million, a decrease in the provision for other than temporary impairment of securities of $1.9 million, and decreases in the areas of operation of foreclosed properties and loan and collection expenses of $3.0 million and $0.5 million, respectively, and a decrease of $1.2 million in employee benefits, offset by an increase of $1.4 million in FDIC insurance expense. |
|
|
§ |
Provision for income taxes resulted in a tax expense of $0.9 million for 2009 versus a tax benefit of $7.9 million for 2008. |
20
STATEMENT OF OPERATIONS ANALYSIS
2009 compared to 2008
Net Interest Income
Net interest income represents the difference between the dollar amount of interest earned on interest-earning assets and the dollar amount of interest paid on interest-bearing liabilities. The interest income and interest expense of financial institutions are significantly affected by general economic conditions, competition, policies of regulatory authorities and other factors.
Interest rate spread and net interest margin are used to measure and explain changes in net interest income. Interest rate spread is the difference between the yield on earning assets and the rate paid for interest-bearing liabilities that fund those assets. Net interest margin is expressed as the percentage of net interest income to average earning assets. Net interest margin exceeds interest rate spread because non-interest bearing sources of funds (“net free funds”), principally demand deposits and stockholders’ equity, also support earning assets. To compare tax-exempt asset yields to taxable yields, the yield on tax-exempt loans and securities is computed on a tax-equivalent basis. The narrative below discusses net interest income, interest rate spread and net interest margin on a tax-equivalent basis.
Table 1 provides average balances of interest-earning assets and interest-bearing liabilities, interest income and expense, and the corresponding interest rates earned and paid, as well as net interest income, interest spread, and net interest margin on a tax-equivalent basis for the years ended December 31, 2009, 2008 and 2007.
Net interest income in the consolidated statements of operations (which excludes the tax-equivalent adjustment) was $29.2 million for 2009, compared to $29.0 million for 2008. Net interest income in both 2009 and 2008 was negatively impacted by the high level of non-performing loans for which interest income is not recognized. The tax equivalent adjustments (adjustments needed to bring tax-exempt interest to a level that would yield the same after-tax income had that income been subject to taxation using a 34% tax rate) of $1.2 million for 2009 and $1.5 million for 2008 resulted in a tax-equivalent net interest income of $30.4 million and $30.5 million, respectively. The net interest margin for 2009 was 3.18% compared to 3.11% in 2008. The 7 bps increase in net interest margin is attributable to a 15 bps increase in interest rate spread resulting from an 89 bps decline in return on interest-earning assets, which was more than offset by a 104 bps decrease in the cost of interest-bearing liabilities in 2009.
In 2009, we had positioned the balance sheet to be slightly liability sensitive (which means that liabilities will reprice faster than assets); thus, the rate decreases impacted net interest income positively. We expect that in a gradually increasing rate environment, our statement of operations would benefit from asset sensitivity over the long term, although changes in the portfolio or the pace of increases could affect that trend.
As shown in the rate/volume analysis in Table 2, volume changes resulted in a $3.0 million decrease to tax equivalent net interest income in 2009. The decrease in and changes in the composition of earning assets resulted in a $10.1 million decrease to tax equivalent interest income in 2009 offset by a $10.0 million decrease in interest expense due to the composition change in interest-bearing liabilities. Rate changes on earning assets decreased interest income by $6.2 million but were more than offset by rate changes on interest-bearing liabilities that decreased interest expense by $9.1 million, for a net impact of $2.9 million due to changes in interest rates.
For 2009, the yield on earning assets declined to 5.09%, which was the combined effect of a decrease of 69 bps in the loan yield, a 10 bps decline in the yield on tax-exempt securities, a 181 bps decrease in the yield on federal funds sold, a 232 bps decrease in the yield on money market instruments, and a 72 bps decline in yields on agency securities. The average loan yield was 5.58% in 2009 and 6.27% in 2008. Competitive pricing on new and refinanced loans, as well as tightened credit underwriting standards, reduced loan yields in 2009.
For 2009, the cost of interest-bearing liabilities decreased by 104 bps from 3.09% in 2008, to 2.05%, resulting, in part, from a continuing decrease in interest rates, generally, in 2009. The combined average cost of interest-bearing deposits was 2.00%, down 106 bps from 2008, primarily resulting from the continued low short-term interest rate environment during 2009. Also contributing to the decrease was the cost of wholesale funding, (comprising of federal funds purchased (down 2.29% to 0.69%); repurchase agreements (down 1.62% to 0.71%); FHLB advances (down 0.61% to 2.67%) and subordinated debentures (down 2.69% to 2.24%). All of these items were impacted favorably by the low interest rate environment for wholesale funding costs during the year. Partially offsetting the decrease were the issuance of Convertible Promissory Notes at a yield of 10.72%.
Average earning assets were $955.6 million in 2009, compared to $982.3 million in 2008. Average loans outstanding declined to $699.1 million in 2009 from $743.9 million in 2008, a decrease of 6.0%. Average loans to average total assets decreased to 66.6% in 2009 from 69.0% in 2008. For 2009, tax-equivalent interest income on loans decreased $7.6 million, of which $2.7 million related to the decline in average outstanding balances and $4.9 million decrease related to the lower yields on such loans. Balances of securities and short-term investments increased $18.1 million on average. Tax equivalent interest income on securities and short-term investments increased $1.2 million from volume changes, and $1.3 million from the impact of the rate environment, for a combined $2.5 million increase in tax equivalent interest income on securities in our investment portfolio.
Average interest-bearing liabilities decreased $22.0 million in 2009 from 2008 levels, while net free funds (the total of demand deposits, accrued expenses, other liabilities and stockholders’ equity less non-interest earning assets) decreased $4.7 million. The decrease in net free funds is primarily attributable to a decrease in stockholders’ equity. Average stockholders’ equity decreased by $7.4 million, or 9.2%. Average interest-bearing deposits declined $14.0 million, or 1.8%, to $766.5 million. This decline resulted from a decline in savings deposits and time deposits greater than $100,000 offset by increases in interest-bearing demand deposits and time deposits less than $100,000. Interest expense on interest-bearing deposits decreased $0.9 million from the volume and mix changes and $7.7 million from impact of the rate environment, resulting in an aggregate decrease of $8.6 million in interest expense on interest-earning deposits. Average wholesale-funding sources decreased by $8.0 million during 2009. For 2009, interest expense on wholesale funding sources decreased by $1.4 million from 2008 due to declining interest rates.
21
Table 1: Average Balances and Interest Rates (interest and rates on a tax-equivalent basis)
|
|
|
|
|
|
|
|
|
|
|
|
|
|
|
|
|
|
|
|
|
|
|
|
|
|
|
|
|
|
|
|
|
Year ended December 31, |
|
|||||||||||||||||||||||||
|
|
|
2009 |
|
2008 |
|
2007 |
|
|||||||||||||||||||||
|
|
|
Average |
|
Interest |
|
Average |
|
Average |
|
Interest |
|
Average |
|
Average |
|
Interest |
|
Average |
|
|||||||||
|
|
|
(dollars in thousands) |
|
|||||||||||||||||||||||||
|
ASSETS: |
|
|
|
|
|
|
|
|
|
|
|
|
|
|
|
|
|
|
|
|
|
|
|
|
|
|
|
|
|
Interest-Earning Assets |
|
|
|
|
|
|
|
|
|
|
|
|
|
|
|
|
|
|
|
|
|
|
|
|
|
|
|
|
|
Loans, net1,2 |
|
$ |
699,090 |
|
$ |
39,022 |
|
|
5.58 |
% |
$ |
743,930 |
|
$ |
46,640 |
|
|
6.27 |
% |
$ |
804,493 |
|
$ |
61,165 |
|
|
7.60 |
% |
|
U.S. Treasuries |
|
|
2,856 |
|
|
— |
|
|
— |
% |
|
— |
|
|
— |
|
|
— |
% |
|
— |
|
|
— |
|
|
— |
% |
|
US government sponsored agencies |
|
|
144,897 |
|
|
5,761 |
|
|
3.98 |
% |
|
151,622 |
|
|
7,122 |
|
|
4.70 |
% |
|
135,372 |
|
|
5,898 |
|
|
4.36 |
% |
|
State and municipal obligations1 |
|
|
41,821 |
|
|
2,506 |
|
|
5.99 |
% |
|
55,268 |
|
|
3,368 |
|
|
6.09 |
% |
|
52,330 |
|
|
3,225 |
|
|
6.16 |
% |
|
Other securities |
|
|
19,055 |
|
|
1,232 |
|
|
6.47 |
% |
|
21,488 |
|
|
1,400 |
|
|
6.52 |
% |
|
12,635 |
|
|
598 |
|
|
4.73 |
% |
|
Federal funds sold |
|
|
3,191 |
|
|
10 |
|
|
0.32 |
% |
|
7,003 |
|
|
149 |
|
|
2.13 |
% |
|
3,211 |
|
|
159 |
|
|
4.95 |
% |
|
Other money market instruments |
|
|
44,695 |
|
|
105 |
|
|
0.23 |
% |
|
2,988 |
|
|
76 |
|
|
2.55 |
% |
|
3,373 |
|
|
159 |
|
|
4.71 |
% |
|
Total earning assets |
|
|
955,605 |
|
|
48,636 |
|
|
5.09 |
% |
|
982,299 |
|
|
58,755 |
|
|
5.98 |
% |
|
1,011,414 |
|
|
71,204 |
|
|
7.04 |
% |
|
Non-interest earning assets |
|
|
94,042 |
|
|
|
|
|
|
|
|
96,137 |
|
|
|
|
|
|
|
|
90,376 |
|
|
|
|
|
|
|
|
Total assets |
|
$ |
1,049,647 |
|
|
|
|
|
$ |
1,078,436 |
|
|
|
|
|
$ |
1,101,790 |
|
|
|
|
|||||||
|
LIABILITIES AND STOCKHOLDERS’ EQUITY |
|
|
|
|
|
|
|
|
|
|
|
|
|
|
|
|
|
|
|
|
|
|
|
|
|
|
|
|
|
Interest-Bearing Liabilities |
|
|
|
|
|
|
|
|
|
|
|
|
|
|
|
|
|
|
|
|
|
|
|
|
|
|
|
|
|
NOW accounts |
|
$ |
135,430 |
|
|
554 |
|
|
0.41 |
% |
$ |
123,404 |
|
|
1,556 |
|
|
1.26 |
% |
$ |
110,322 |
|
|
2,798 |
|
|
2.54 |
% |
|
Savings accounts |
|
|
231,315 |
|
|
1,723 |
|
|
0.74 |
% |
|
232,495 |
|
|
4,312 |
|
|
1.85 |
% |
|
262,026 |
|
|
9,125 |
|
|
3.48 |
% |
|
Time deposits> $100M |
|
|
178,995 |
|
|
6,440 |
|
|
3.60 |
% |
|
211,476 |
|
|
9,322 |
|
|
4.41 |
% |
|
212,133 |
|
|
10,420 |
|
|
4.91 |
% |
|
Time deposits<$100M |
|
|
220,750 |
|
|
6,575 |
|
2.98 |
% |
|
213,147 |
|
|
8,671 |
|
|
4.07 |
% |
|
203,547 |
|
|
9,587 |
|
|
4.71 |
% |
|
|
Total interest-bearing deposits |
|
|
766,490 |
|
|
15,292 |
|
|
2.00 |
% |
|
780,522 |
|
|
23,861 |
|
|
3.06 |
% |
|
788,028 |
|
|
31,930 |
|
|
4.05 |
% |
|
Federal funds purchased |
|
|
322 |
|
|
2 |
|
|
0.69 |
% |
|
2,888 |
|
|
86 |
|
|
2.98 |
% |
|
9,067 |
|
|
497 |
|
|
5.48 |
% |
|
Repurchase agreements |
|
|
23,028 |
|
|
164 |
|
|
0.71 |
% |
|
29,861 |
|
|
695 |
|
|
2.33 |
% |
|
7,981 |
|
|
387 |
|
|
4.85 |
% |
|
FHLB advances |
|
|
85,029 |
|
|
2,272 |
|
|
2.67 |
% |
|
85,145 |
|
|
2,791 |
|
|
3.28 |
% |
|
93,504 |
|
|
4,850 |
|
|
5.19 |
% |
|
Subordinated debentures |
|
|
16,100 |
|
|
365 |
|
|
2.24 |
% |
|
16,100 |
|
|
794 |
|
|
4.93 |
% |
|
16,100 |
|
|
1,089 |
|
|
6.76 |
% |
|
Convertible promissory notes |
|
|
1,506 |
|
|
164 |
|
|
10.72 |
% |
|
— |
|
|
— |
|
|
— |
% |
|
— |
|
|
— |
|
|
— |
% |
|
Total interest-bearing liabilities |
|
|
892,475 |
|
|
18,259 |
|
|
2.05 |
% |
|
914,516 |
|
|
28,227 |
|
|
3.09 |
% |
|
914,680 |
|
|
38,753 |
|
|
4.24 |
% |
|
Demand deposits |
|
|
72,368 |
|
|
|
|
|
|
|
|
72,852 |
|
|
|
|
|
|
|
|
93,706 |
|
|
|
|
|
|
|
|
Accrued expenses and other liabilities |
|
|
12,724 |
|
|
|
|
|
|
|
|
11,546 |
|
|
|
|
|
|
|
|
12,587 |
|
|
|
|
|
|
|
|
Stockholders’ equity |
|
|
72,080 |
|
|
|
|
|
|
|
|
79,522 |
|
|
|
|
|
|
|
80,817 |
|
|
|
|
|
|||
|
Total liabilities and shareholders’ equity |
|
$ |
1,049,647 |
|
|
|
|
|
|
|
$ |
1,078,436 |
|
|
|
|
|
|
|
$ |
1,101,790 |
|
|
|
|
|
|
|
|
Net interest income and rate spread3 |
|
|
|
|
$ |
30,377 |
|
|
3.04 |
% |
|
|
|
$ |
30,528 |
|
|
2.89 |
% |
|
|
|
$ |
32,451 |
|
|
2.80 |
% |
|
Net interest margin4 |
|
|
|
|
|
|
|
|
3.18 |
% |
|
|
|
|
|
|
|
3.11 |
% |
|
|
|
|
|
|
|
3.21 |
% |
|
|
|
|
|
|
1 |
The interest income on tax exempt securities and loans is computed on a tax-equivalent basis using a tax rate of 34% for all periods presented. |
|
|
2 |
The average loan balances and rates include non-accrual loans. |
|
|
3 |
Interest rate spread is the difference between the annualized average yield earned on average interest-earning assets for the period and the annualized average rate of interest accrued on average interest-bearing liabilities for the period. |
|
|
4 |
Net interest margin is the annualized effect of net interest income for a period divided by average interest-earning assets for the period. |
22
Table 2: Rate/Volume Analysis (1)
|
|
|
|
|
|
|
|
|
|
|
|
|
|
|
|
|
|
|
|
|
|
|
|
2009 compared to 2008 |
|
2008 compared to 2007 |
|
||||||||||||||
|
|
|
Volume |
|
Rate |
|
Net |
|
Volume |
|
Rate |
|
Net |
|
||||||
|
|
|
(dollars in thousands) |
|
||||||||||||||||
|
Interest income: |
|
|
|
|
|
|
|
|
|
|
|
|
|
|
|
|
|
|
|
|
Loans (2) |
|
$ |
(2,707 |
) |
$ |
(4,911 |
) |
$ |
(7,618 |
) |
$ |
(3,306 |
) |
$ |
(11,219 |
) |
$ |
(14,525 |
) |
| U.S. Treasury Securities |
— |
— |
— |
— |
— |
— |
|||||||||||||
|
U.S. government sponsored agencies |
|
|
(305 |
) |
|
(1,056 |
) |
|
(1,361 |
) |
|
556 |
|
|
668 |
|
|
1,224 |
|
|
State and municipal obligations (2) |
|
|
(852 |
) |
|
(10 |
) |
|
(862 |
) |
|
135 |
|
|
8 |
|
|
143 |
|
|
Other securities |
|
|
(157 |
) |
|
(11 |
) |
|
(168 |
) |
|
391 |
|
|
411 |
|
|
802 |
|
|
Federal funds sold |
|
|
(54 |
) |
|
(85 |
) |
|
(139 |
) |
|
87 |
|
|
(97 |
) |
|
(10 |
) |
|
Other money market instruments |
|
|
158 |
|
|
(129 |
) |
|
29 |
|
|
(12 |
) |
|
(71 |
) |
|
(83 |
) |
|
Total interest-earning assets |
|
|
(3,917 |
) |
|
(6,202 |
) |
|
(10,119 |
) |
|
(2,149 |
) |
|
(10,300 |
) |
|
(12,449 |
) |
|
Interest expense: |
|
|
|
|
|
|
|
|
|
|
|
|
|
|
|
|
|
|
|
|
NOW accounts |
|
|
139 |
|
|
(1,141 |
) |
|
(1,002 |
) |
|
225 |
|
|
(1,467 |
) |
|
(1,242 |
) |
|
Savings accounts |
|
|
(22 |
) |
|
(2,567 |
) |
|
(2,589 |
) |
|
(701 |
) |
|
(4,112 |
) |
|
(4,813 |
) |
|
Time deposits |
|
|
(1,012 |
) |
|
(3,966 |
) |
|
(4,978 |
) |
|
303 |
|
|
(2,317 |
) |
|
(2,014 |
) |
|
Federal funds purchased |
|
|
(45 |
) |
|
(39 |
) |
|
(84 |
) |
|
(185 |
) |
|
(226 |
) |
|
(411 |
) |
|
Repurchase agreements |
|
|
(132 |
) |
|
(399 |
) |
|
(531 |
) |
|
448 |
|
|
(140 |
) |
|
308 |
|
|
FHLB advances |
|
|
(4 |
) |
|
(515 |
) |
|
(519 |
) |
|
(302 |
) |
|
(1,757 |
) |
|
(2,059 |
) |
|
Subordinated debentures |
|
|
— |
|
|
(429 |
) |
|
(429 |
) |
|
— |
|
|
(295 |
) |
|
(295 |
) |
|
Convertible promissory notes |
|
|
164 |
|
|
— |
|
|
164 |
|
|
— |
|
|
— |
|
|
— |
|
|
Total interest-bearing liabilities |
|
|
(912 |
) |
|
(9,056 |
) |
|
(9,968 |
) |
|
(212 |
) |
|
(10,314 |
) |
|
(10,526 |
) |
|
Net interest income |
|
$ |
(3,005 |
) |
$ |
2,854 |
|
$ |
(151 |
) |
$ |
(1,937 |
) |
$ |
14 |
|
$ |
(1,923 |
) |
|
|
|
|
|
|
(1) |
The change in interest due to both rate and volume has been allocated proportionally to the relationship to the dollar amounts of the change in each. |
|
|
(2) |
The yield on tax-exempt loans and securities is computed on a tax equivalent basis using a tax rate of 34% for all periods presented. |
23
Provision for Loan Losses
The PFLL is the cost of providing an allowance for probable and inherent losses in our loan portfolio. The ALL consists of specific and general components. Our internal risk system is used to identify loans that meet the criteria for being “impaired” under the definition of ASC 310-10. The specific component relates to loans that are individually classified as impaired. These loans identified for impairment are assigned a loss allocation based upon that analysis. The general component covers non-impaired loans and is based on historical loss experience adjusted for qualitative factors. These qualitative factors include: 1) changes in the nature, volume and terms of loans, 2) changes in lending personnel, 3) changes in the quality of the loan review function, 4) changes in nature and volume of past-due, non-accrual and/or classified loans, 5) changes in concentration of credit risk, 6) changes in economic and industry conditions, 7) changes in legal and regulatory requirements, 8) unemployment and inflation statistics, and 9) changes in underlying collateral values.
Net loan charge-offs for the year ended December 31, 2009 were $10.5 million compared to net charge-offs of $16.2 million for the same period in 2008. Net charge-offs to average loans were 1.50% for 2009 compared to 2.18% in 2008. For 2009, non-performing loans decreased by $15.4 million (34.9%), to $28.7 million, from $44.1 million at December 31, 2008. Refer to the “Financial Condition - Risk Management and the Allowance for Loan Losses” and “Financial Condition - Non-Performing Loans and Foreclosed Properties” sections below for more information related to non-performing loans.
PFLL for the year ended December 31, 2009 was $6.5 million compared to $18.0 million for the same period in 2008. Our management believes that the PFLL taken for the year ended December 31, 2009 is adequate in view of the present condition of the loan portfolio and the amount and quality of the collateral supporting non-performing loans. We are continually monitoring non-performing loan relationships and will make provisions, as necessary, if the facts and circumstances change. In addition, a decline in the quality of our loan portfolio as a result of general economic conditions, factors affecting particular borrowers or our market area, or otherwise, could affect the adequacy of the ALL. If there are significant charge-offs against the ALL or we otherwise determine that the ALL is inadequate, we will need to make additional PFLLs in the future. See “Financial Condition - Risk Management and the Allowance for Loan Losses” below for more information related to non-performing loans.
Non-Interest Income
Trust service fees, fees from loan servicing, gains from sales of loans, securities gains, income from our UFS subsidiary and service charges are the primary components of non-interest income. Total non-interest income for 2009 was $12.5 million, a $3.2 million or 34.4% increase from 2008. The non-interest income to average assets ratio was 1.19% for the year ended December 31, 2009 compared to 0.86% for the same period in 2008.
Gains from the sale of securities in our investment portfolio of $4.2 million were realized in 2009 compared to $0.8 million in 2008. These gains were taken to improve our earnings and capital ratios. In 2009, gains from sales of loans increased significantly due to the low interest rate environment which led to an attractive refinance market. Gains from sales of loans increased $0.7 million, or 204%, from 2008 to 2009. Fees for other services to customers decreased $0.5 million in 2009. This is primarily due to a decline of $0.3 million in overdraft charges due to a reduction in customer overdrafts and a decline of $0.3 million in income from brokerage services due to reduced customer activity in that area.
Non-Interest Expense
Non-interest expense in 2009 decreased to $30.0 million from $38.0 million in 2008, for a decrease of $8.0 million (21.1%), primarily as a result of a decrease in the provision for impairment of standby letters of credit, a decrease in other than temporary impairment of securities charge, a decrease in expenses related to the operation of foreclosed properties and costs related to loans and collections, offset by an increase in FDIC insurance expense.
Salaries and employee benefits expense is the largest component of non-interest expense, totaling $16.2 million in 2009, a decrease of $0.2 million or 1.2% from 2008, as a result of reduced head counts. The number of full-time equivalent employees decreased from 315 in 2008 to 306 in 2009, a decrease of 2.9%. In addition, due to our disappointing financial results in 2008 and our less than satisfactory performance in 2009, there were no management incentive bonuses earned in either year.
Also contributing to the change in salary and employee benefits were higher expenses related to our bank’s Supplemental Executive Retirement Plan (“Plan”), which is intended to provide deferred compensation in excess of that available under our other retirement programs to certain management and highly compensated employees who have contributed and are expected to continue to contribute to our success. Costs associated with the Plan amounted to $0.3 million for 2009, an increase of $0.1 million from 2008 due to an increase in the earnings on investment balances and not as a result of bank contributions. No contribution is planned in 2010 based on our 2009 financial performance.
Accrued benefit costs, principally for health insurance, pension costs and bonus expense, represent the remaining portion of personnel-related costs. An increase in health insurance costs is expected for 2010. Benefit expense is down $1.2 million from 2008 due, in part, to a decrease of $0.6 million in our 401K contribution. The employer 5% matching of 401K contributions was eliminated effective April 2009 and the 2% end-of-year employer contribution was also suspended effective January 2009. Other benefit costs related to group health insurance, education and training, other employee benefits, and bonus expense were down $0.6 million due to a reduction of $0.2 million in bonus expense, $0.1 million in health insurance costs, and $0.2 million reduction in employee benefit costs, including training.
24
Net occupancy expense for 2009 remained unchanged at $2.5 million.
Data processing and courier expense in 2009 reflected a decrease of $0.2 million, or 16.7%, compared to 2008. Effective January 2009, we received a monthly volume discount for our data processing services. This resulted in a $0.2 million reduction in expenses in 2009. Management estimates that data processing expense should show minimal increases in the future with adjustments related only to any volume-related increases that may occur.
Income from foreclosed properties is netted against foreclosed property expenses in the determination of net foreclosed property expense. Foreclosed property reflected a net expense from the operation of such real estate of $1.2 million in 2009 compared to $4.2 million in 2008. Provision for valuation reductions of foreclosed properties were charged to 2009 operations in the amount of $0.7 million, reflecting a decline in perceived market values of properties obtained by us in collection efforts. This compared to $3.5 million in 2008. A net gain of $0.1 million was recognized on the sale of foreclosed properties in 2009 compared to a net loss of $0.1 million in 2008.
The provision for impairment loss on letters of credit relates to a liability for our exposure on a specific standby letter of credit that supports secondary market financing on behalf of the borrower. We believe the collateral and cash flows will be sufficient to support the balance of this standby letter of credit at December 31, 2009. We continue to monitor the financial condition of the borrower on an ongoing basis and if it continues to deteriorate, we may need to provide additional reserves with respect to this off-balance sheet commitment. In January 2010, a $3.0 million payment was made to the bondholder to reduce our exposure on the letter of credit. A majority of this exposure had been incurred in years prior to 2009.
Non-interest expenses in 2009 decreased 21.1% to $30.0 million compared to $38.0 million in 2008. Included in such non-interest expenses are FDIC insurance premiums of $2.3 million for 2009 compared to $0.9 million for the same period a year ago. FDIC insurance premiums consist of two components, deposit insurance premiums and payments for servicing obligations of the Financing Corporation (“FICO”) that were issued in connection with the resolution of savings and loan associations. With the enactment in early 2006 of the Federal Deposit Insurance Reform Act of 2005, major changes were introduced in the calculation of FDIC deposit insurance premiums. Such changes were effective January 1, 2007 and included establishment by the FDIC of a target reserve ratio range for the Deposit Insurance Fund (“DIF”) of between 1.15% and 1.50%, as opposed to the prior fixed reserve ratio of 1.25%. The FDIC approved 1.25% as the target ratio. At the same time, the FDIC adopted a new risk-based system for assessment of deposit insurance premiums under which all such institutions are required to pay minimum annual premiums. The system categorizes institutions in one of four risk categories, depending on capitalization and supervisory rating criteria. Our bank’s assessment rate, like that of other financial institutions, is confidential and may not be directly disclosed, except to the extent required by law. To ease the transition to the new system, insured institutions that had paid deposit insurance prior to 1997 were eligible for a one-time assessment credit based on their respective share of the aggregate assessment base. Our FDIC assessment for the first quarter of 2008 and for all of 2007 received and recorded after first quarter 2007, was offset by a portion of our one-time assessment credit. The final portion of the credit was applied to our FDIC assessment in the second quarter of 2008. Payments for the FICO portion will continue as long as FICO obligations remain outstanding. In February 2009, the FDIC adopted a final rule modifying the risk-based assessment system and setting initial base assessment rates beginning April 1, 2009 at 45 bps from 12 bps. Our assessment for the second quarter of 2009 under the risk-based assessment system was $0.5 million. There was no assessment in the third or fourth quarter of 2009.
In addition, in response to losses incurred by the DIF in 2008 and early 2009, on May 22, 2009 the FDIC imposed a special assessment of 5 bps on each FDIC-insured depository institution’s total assets, minus Tier 1 capital, calculated as of June 30, 2009. The special assessment, however, may not exceed 10 bps of an institution’s domestic deposits. The special assessment to Baylake Bank was $0.5 million.
On November 12, 2009, the Board of Directors of the FDIC adopted a rule that required insured institutions to prepay their estimated quarterly risk-based assessments for the fourth quarter of 2009 and for all of 2010, 2011, and 2012. The FDIC Board also voted to adopt a uniform 3 bps increase in assessment rates effective on January 1, 2011. We were required to prepay approximately $6.7 million in premiums in December 2009, although such premiums will not be taken as a charge against our operations until the period for which they apply.
Loan and collection expenses were $0.5 million lower in 2009 than in 2008. This is primarily related to costs on loans that are in the collection process that have not been transferred to foreclosed properties and includes costs incurred for property management fees, real estate taxes, insurance and operating expenses. A majority of our legal services deemed appropriate in resolving nonperforming loans, which had been provided by our internal legal staff in prior years, were outsourced during 2009 and 2008. These external legal costs totaled $0.3 million in 2009 compared to $0.7 million in 2008. In 2010, loan and collection costs are expected to continue at a comparable level as 2009 unless and until the volume of nonperforming loans declines further.
Costs related to other outside services totaled $0.7 million in 2009, $0.3 million lower than in 2008. The primary reason for the decrease of $0.3 million was the discontinuance of the High Performance Checking program, including mailing, consulting fees and material costs in October of 2008. No further costs associated with the program are anticipated.
25
Off-Balance Sheet Arrangements
We do not use interest rate contracts (e.g. swaps), forward loan sales or other derivatives to manage interest rate risk and do not have any of these instruments outstanding. Our bank does have, through its normal operations, loan commitments and standby letters of credit outstanding as of December 31, 2009 and 2008 in the amount of $182.7 million and $193.8 million, respectively. These are further explained in Note 14 of the Notes to Consolidated Financial Statements.
Provision for Income Taxes
Income tax expense totaled $0.9 million in 2009, compared to income tax benefit of $7.9 million in 2008. The increased tax expense in 2009 reflected the increase in our income before income taxes in 2009 compared to a loss in 2008.
See Note 1, “ Nature of Business and Summary of Significant Accounting Policies” and Note 16, “Income Tax Expense” of the Notes to Consolidated Financial Statements for a further discussion of income tax accounting. Income tax expense recorded in the consolidated statements of operations involves interpretation and application of certain accounting pronouncements and federal and state tax codes and is, therefore, considered a critical accounting policy. We undergo examination by various taxing authorities. Such taxing authorities may require that changes in the amount of tax expense or valuation allowance be recognized when their interpretations differ from those of management, based on their judgments about information available to them at the time of their examinations.
2008 compared to 2007
Net Interest Income
Net interest income in the consolidated statements of operations (which excludes the tax equivalent adjustment) was $29.0 million for 2008 compared to $30.9 million for 2007. Net interest income in both 2008 and 2007 was negatively impacted by the high level of non-performing loans for which interest income is not recognized. In addition, the high level of non-performing loans further decreased net interest income. The tax equivalent adjustments (adjustments needed to bring tax-exempt interest to a level that would yield the same after-tax income had that income been subject to taxation using a 34% tax rate) of $1.5 million for both 2008 and for 2007 resulted in a tax-equivalent net interest income of $30.5 million and $32.5 million, respectively. The decrease in 2008 net interest income was also impacted by a reduced level of earning assets. The net interest margin for 2008 was 3.11% compared to 3.21% in 2007. The 10 bps decrease in net interest margin is attributable to a 9 bps increase in interest rate spread resulting from a 106 bps decline in return on interest-earning assets, offset by a 115 bps decrease in the cost of interest-bearing liabilities in 2008.
We had positioned the balance sheet in 2008 to be slightly asset sensitive (which means that assets reprice faster than liabilities); thus, the rate decreases impacted net interest income negatively. We expect that in a gradually increasing rate environment, our income statement would benefit from asset sensitivity over the long term, although changes in the portfolio or the pace of increases could affect that trend.
As shown in the rate/volume analysis in Table 2, volume changes resulted in a $1.9 million decrease to tax equivalent net interest income in 2008. The decrease and composition of earning assets resulted in a $12.4 million decrease to tax equivalent net interest income in 2008 offset by a $10.5 million decrease and composition change in interest-bearing liabilities. Rate changes on earning assets decreased interest income by $10.3 million but were offset by rate changes on interest-bearing liabilities that decreased interest expense by $10.3 million, for no net rate impact.
For 2008, the yield on earning assets declined to 5.98% from 7.04% for 2007 reflecting the combined effect of a decrease of 133 bps in the loan yield, a 7 bps decline in the yield on tax-exempt securities, a 282 bps decrease in the yield on federal funds sold and a 217 bps decrease in the yield on money market instruments. These decreases were offset by a 34 bps increase in the yield achieved on agency securities and a 179 bps increase in yield on other securities. The average loan yield was 6.27% in 2008 and 7.60% in 2007. Competitive pricing on new and refinanced loans, as well as tightened credit underwriting standards, dampened efforts for improvements in loan yields in 2008.
26
For 2008, the cost of interest-bearing liabilities decreased by 115 bps to 3.09% compared to 2007, resulting, in part, from a significant decrease in interest rates in 2008. The combined average cost of interest-bearing deposits was 3.06%, down 99 bps from 2007, primarily resulting from an average decrease in the short-term interest rate environment during 2008. Also contributing to the decrease was the cost of wholesale funding (comprising federal funds purchased; repurchase agreements; FHLB advances and subordinated debentures) which decreased by 213 bps to 3.26% for 2008, impacted favorably by a decreasing interest rate environment for wholesale funding costs during the year on reduced borrowings.
Average earning assets were $982.3 million in 2008, compared to $1.0 billion in 2007. Average loans outstanding declined to $743.9 million in 2008 from $804.5 million in 2007, a decrease of 7.5%. Average loans to average total assets decreased to 69.0% in 2008 from 73.0% in 2007. For 2008, tax-equivalent interest income on loans decreased $14.5 million, of which $3.3 million related to the decline in average outstanding balances and $11.2 million related to the lower yields on such loans. Balances of securities and short-term investments increased $31.4 million on average in 2008 versus 2007. Tax equivalent interest income on securities and short-term investments increased $1.2 million from volume changes, and $0.9 million from the impact of the rate environment, for a combined $2.1 million increase in tax equivalent interest income in 2008 versus 2007.
Average interest-bearing liabilities decreased $0.2 million in 2008, while net free funds (the total of demand deposits, accrued expenses, other liabilities and stockholders’ equity less non-interest earning assets) decreased $23.2 million. The decrease in net free funds was primarily attributable to a decrease in demand deposits. Average non-interest bearing demand deposits decreased by $20.9 million, or 22.3% in 2008 versus 2007. Average interest-bearing deposits declined $7.5 million, or 1.0%, to $780.5 million in 2008 versus $788.0 million in 2007. This decline resulted from a decline in savings deposits and time deposits greater than $100,000, offset by increases in interest-bearing demand deposits and time deposits under $100,000. Interest expense on interest-bearing deposits decreased $0.2 million from the volume and mix changes and $7.9 million from impact of the rate environment, resulting in an aggregate decrease of $8.1 million in interest expense on interest-bearing deposits in 2008 versus 2007. Average wholesale-funding sources decreased by $7.3 million during 2008. For 2008, interest expense on wholesale funding sources decreased by $2.5 million compared to 2007 from declining rates.
BALANCE SHEET ANALYSIS
Loans
Gross loans outstanding declined to $651.9 million at December 31, 2009, a 10.5% decrease from December 31, 2008. This follows a 4.1% decrease from the end of 2007.
Table 3 reflects composition (mix) of the loan portfolio at December 31 for the previous five fiscal years:
Table 3: Loan Composition
|
|
|
|
|
|
|
|
|
|
|
|
|
|
|
|
|
|
|
|
|
|
|
|
|
|
|
|
|
|
|
|
|
|
|
|
As of December 31, |
|
||||||||||||||||||||||||||||
|
|
|
2009 |
|
2008 |
|
2007 |
|
2006 |
|
2005 |
|
||||||||||||||||||||
|
|
|
Amount |
|
% of |
|
Amount |
|
% of |
|
Amount |
|
% of |
|
Amount |
|
% of |
|
Amount |
|
% of |
|
||||||||||
|
|
|
|
|
|
|
|
|
|
|
|
|
|
|
|
|
|
|
|
|
|
|
||||||||||
|
Amount of loans by type |
|
|
|
|
|
|
|
|
|
|
|
|
|
|
|
|
|
|
|
|
|
|
|
|
|
|
|
|
|
|
|
|
|
|
|
|
|
|
|
|
|
|
|
|
|
|
|
|
|
|
|
|
|
|
|
|
|
|
|
|
|
|
|
|
|
Real estate-mortgage |
|
|
|
|
|
|
|
|
|
|
|
|
|
|
|
|
|
|
|
|
|
|
|
|
|
|
|
|
|
|
|
|
Commercial |
|
$ |
353,110 |
|
|
54.2 |
% |
$ |
381,765 |
|
|
52.4 |
% |
$ |
386,981 |
|
|
50.9 |
% |
$ |
464,843 |
|
|
56.7 |
% |
$ |
467,956 |
|
|
57.6 |
% |
|
1-4 Family residential |
|
|
124,830 |
|
|
19.2 |
% |
|
134,436 |
|
|
18.4 |
% |
|
119,932 |
|
|
15.8 |
% |
|
143,873 |
|
|
17.6 |
% |
|
148,736 |
|
|
18.3 |
% |
|
Construction |
|
|
62,827 |
|
|
9.6 |
% |
|
69,838 |
|
|
9.6 |
% |
|
93,047 |
|
|
12.2 |
% |
|
94,082 |
|
|
11.5 |
% |
|
85,729 |
|
|
10.6 |
% |
|
Commercial, financial and agricultural |
|
|
83,674 |
|
|
12.8 |
% |
|
110,432 |
|
|
15.2 |
% |
|
127,549 |
|
|
16.8 |
% |
|
82,619 |
|
|
10.1 |
% |
|
80,260 |
|
|
9.9 |
% |
|
|
|||||||||||||||||||||||||||||||
|
Consumer installment |
|
|
11,804 |
|
|
1.8 |
% |
|
12,876 |
|
|
1.8 |
% |
|
14,388 |
|
|
1.9 |
% |
|
14,893 |
|
|
1.8 |
% |
|
14,263 |
|
|
1.8 |
% |
|
Municipal loans |
|
|
16,009 |
|
|
2.5 |
% |
|
19,858 |
|
|
2.7 |
% |
|
18,663 |
|
|
2.5 |
% |
|
19,633 |
|
|
2.4 |
% |
|
15,785 |
|
|
1.9 |
% |
|
Less: deferred fees, net of costs |
|
|
(360 |
) |
|
(0.1 |
)% |
|
(483 |
) |
|
(0.1 |
)% |
|
(350 |
) |
|
(0.1 |
)% |
|
(375 |
) |
|
(0.1 |
)% |
|
(433 |
) |
|
(0.1 |
)% |
|
Total loans (net of unearned income) |
|
$ |
651,894 |
|
|
100.0 |
% |
$ |
728,722 |
|
|
100.0 |
% |
$ |
760,210 |
|
|
100.0 |
% |
$ |
819,568 |
|
|
100.0 |
% |
$ |
812,296 |
|
|
100.0 |
% |
27
Commercial real estate loans secured by farmland, multifamily property, and nonfarm/non-residential real estate property totaled $353.1 million at year-end 2009 comprising 54.2% of the loan portfolio. Loans of this type are mainly for business property, multifamily property and community purpose property. The credit risk related to these types of loans is greatly influenced by general economic conditions, especially those applicable to the Northeast Wisconsin market area, and the resulting impact on our borrowers’ operations. Many times, we will take additional real estate collateral to further secure the overall lending relationship. A decline in the tourism industry, or other economic effects, such as increased interest rates affecting demand for real estate, could affect both our lending opportunities in this area as well as potentially affect the value of collateral held for these loans.
Commercial, financial and agricultural loans not secured by real estate totaled $83.7 million at year-end 2009, a decline of $26.7 million or 24.2% since year-end 2008. The commercial, financial and agricultural loan classification primarily consists of commercial loans to small businesses. Loans of this type are in a broad range of industries and include service, retail, wholesale and manufacturing concerns. Agricultural loans are made principally to farmers engaged in dairy, cherry and apple production. Borrowers are primarily concentrated in Door, Brown, Outagamie, Waupaca, Waushara and Kewaunee Counties, Wisconsin. The origination of new commercial and commercial real estate loans was primarily from our market area in Brown County. Growth in tourism-related business in Door County was slow again in 2009 compared to growth experienced in years prior to 2006. The credit risk related to these loans is largely influenced by general economic conditions, especially those applicable to the Northeast Wisconsin market area, and the resulting impact on a borrower’s operations.
Management uses an active credit risk management process for commercial loans to ensure that sound and consistent credit decisions are made. Management attempts to control credit risk by adhering to detailed underwriting procedures, performing comprehensive loan administration, and undertaking periodic review of borrowers’ outstanding loans and commitments. Borrower relationships are formally reviewed periodically during the life of the loan. Further analyses by customer, industry, and location are performed to monitor trends, financial performance and concentrations.
Real estate construction loans declined $7.0 million or 10.0% to $62.8 million at December 31, 2009 from $70.8 million December 31, 2008. Loans in this classification are primarily short-term interim loans that provide financing for the acquisition or development of commercial real estate, such as multifamily or other commercial development projects. Real estate construction loans are generally made to developers who are well known to us, have prior experience and are well capitalized. Construction projects undertaken by these developers are carefully reviewed by us to assess their economic feasibility. The credit risk related to real estate construction loans is generally limited to specific geographic areas, but it is also influenced by general economic conditions. We attempt to control the credit risk on these types of loans by making loans to developers in familiar markets, reviewing the merits of the individual project, controlling loan structure and monitoring project progress and advances of construction proceeds.
Our loan portfolio is diversified by types of borrowers and industry groups within the market areas that we serve. Significant loan concentrations are considered to exist for a financial entity when such amounts are loans to multiple borrowers engaged in similar activities that cause them to be similarly impacted by economic or other conditions. We have identified certain industry groups within our market area, including lodging, restaurants, retail shops, small manufacturing, real estate rental properties and real estate development. At December 31, 2009, one industry group concentration existed in our loans that exceeded 10% of total loans. Loans on non-residential real estate rental properties located throughout our market area totaled $105.2 million or 16.1% of total loans at December 31, 2009.
Although growth was slow in 2009 for the tourism business in the Door County market, management believes that business activity will remain adequate to enable our customers in general to service their debt and to make improvements to their operations.
At the end of 2009, residential real estate mortgage loans totaled $124.8 million and comprised 19.1% of the loan portfolio. These loans decreased $9.6 million or 7.1% during 2009. Given current trends, we do not anticipate growth in mortgage loans during 2010. Residential real estate loans consist of conventional home mortgages, adjustable indexed interest rate mortgage loans, home equity loans, and secondary home mortgages. Loans are primarily for properties within the market areas we serve. Residential real estate loans generally contain a limit for the maximum loan to collateral value of 75% to 80% of fair market value. Private mortgage insurance may be required when the loan-to-value ratio exceeds these limits.
28
We offer adjustable-rate mortgage loans based upon market demands. At year-end 2009, those loans totaled $27.3 million, a decrease of $1.6 million over 2008. Adjustable rate mortgage loans contain an interest rate adjustment provision tied to the weekly average yield on U.S. Treasury securities adjusted to a constant maturity of one year (the “index”), plus an additional spread of up to 2.75%. Interest rates on indexed mortgage loans are adjusted, up or down, on predetermined dates fixed by contract, in relation to and based on the index or market interest rates as of a predetermined time prior to the adjustment date.
Adjustable rate mortgage loans have an initial period, ranging from one to three years, during which the interest rate is fixed, with adjustments permitted thereafter, subject to annual and lifetime interest rate caps which vary with the product type. Annual limits on interest rate changes are 2% while aggregate lifetime interest rate increases over the term of the loan are currently at 6% above the original mortgage loan interest rate. At December 31, 2009, these loans represented $27.3 million of our portfolio. We do not originate sub-prime loans.
We also participate in a fixed rate mortgage program under the Federal Home Loan Mortgage Corporation (“FHLMC”) guidelines. These loans are sold in the secondary market and we retain servicing rights. At December 31, 2009, these loans totaled $66.7 million compared to $80.1 million at December 31, 2008. In 2009, we originated $13.2 million FHLMC mortgages.
In addition, we also offer fixed rate mortgages through participation in fixed rate mortgage programs with private investors. These loans also are sold in the secondary market with servicing rights released to the buyer. In 2009, we sold $66.0 million in mortgage loans through the secondary programs compared to $22.6 million in 2008.
Installment loans to individuals totaled $11.8 million, or 1.8%, of the total loan portfolio at December 31, 2009, compared to $12.9 million, or 1.8%, at December 31, 2008. Installment loans include short-term installment loans, direct and indirect automobile loans, recreational vehicle loans, credit card loans, and other personal loans. Individual borrowers may be required to provide collateral or a satisfactory endorsement or guaranty from another party, depending upon the specific type of loan and the creditworthiness of the borrower. Loans are made to individual borrowers located in the market areas we serve. Credit risks for loans of this type are generally influenced by general economic conditions (especially in the market areas served), the characteristics of individual borrowers and the nature of the loan collateral. Reviewing the creditworthiness of the borrowers, as well as taking the appropriate collateral and guaranty positions on such loans primarily, controls credit risk.
Municipal loans totaled $16.0 million at December 31, 2009 compared to $19.9 million at year-end 2008. Municipal loans are short or long term loans to municipalities for the funding of various projects. The proceeds of these loans are collateralized by the backing of the corresponding taxing authority and can be used for general or revenue producing projects.
Table 4 details expected maturities by loan purpose as of December 31, 2009. Those loans with expected maturities over one year are further scheduled by fixed rate or variable rate interest sensitivity.
Table 4: Loan Maturity and Interest Rate Sensitivity
|
|
|
|
|
|
|
|
|
|
|
|
|
|
|
|
|
|
Maturity |
|
||||||||||
|
December 31, 2009 |
|
Within 1 Year |
|
|
1-5 Years |
|
|
After 5 Years |
|
|
Total |
|
|
|
|
|
(dollars in thousands) |
|
||||||||||
|
Loans secured primarily by real estate: |
|
|
|
|
|
|
|
|
|
|
|
|
|
|
Secured by 1 to 4 family residential |
|
$ |
39,036 |
|
$ |
44,476 |
|
$ |
41,318 |
|
$ |
124,830 |
|
|
Construction |
|
|
41,369 |
|
|
17,767 |
|
|
3,691 |
|
|
62,827 |
|
|
Commercial real estate |
|
|
122,002 |
|
|
172,848 |
|
|
57,900 |
|
|
352,750 |
|
|
Commercial, financial and agricultural |
|
|
23,873 |
|
|
40,097 |
|
|
19,704 |
|
|
83,674 |
|
|
Tax-exempt |
|
|
5,246 |
|
|
3,151 |
|
|
7,612 |
|
|
16,009 |
|
|
Consumer |
|
|
7,296 |
|
|
4,315 |
|
|
193 |
|
|
11,804 |
|
|
Total |
|
$ |
238,822 |
|
$ |
282,654 |
|
$ |
130,418 |
|
$ |
651,894 |
|
|
|
|
|
|
|
|
|
|
|
|
|
|
|
|
|
|
|
Interest sensitivity |
|
||||||||||
|
|
|
|
|
|
Fixed rate |
|
Variable rate |
|
|
|
|
||
|
Due after one year |
|
|
|
|
$ |
239,987 |
|
$ |
173,085 |
|
|
|
|
Note that commercial real estate loans have been adjusted for deferred fees, net of costs, in this analysis.
Critical factors in the overall management of credit quality are sound loan underwriting and administration, systematic monitoring of existing loans and commitments, effective loan review on an ongoing basis, allowance to provide for anticipated loan losses, and non-accrual and charge-off policies.
29
Risk Management and the Allowance for Loan Losses
The loan portfolio is our primary asset subject to credit risk. To address this credit risk, we set aside an allowance for probable and inherent credit losses through periodic charges to our earnings. These charges are shown in our consolidated statements of operations as provision for loan losses. See “Provision For Loan Losses” in this Report. We attempt to control, monitor and minimize credit risk through the use of prudent lending standards, a thorough review of potential borrowers prior to lending, and ongoing and timely review of payment performance. Asset quality administration, including early identification of loans performing in a substandard manner as well as timely and active resolution of problems, further enhances management of credit risk and minimization of loan losses. Any losses that occur and are charged off against the ALL are periodically reviewed with specific efforts focused on achieving maximum recovery of both principal and interest.
In general, our loan policy establishes underwriting guidelines for each of our major loan categories. In addition to requiring financial statements, applications, credit histories and credit analyses for underwriting our loans, some of the more significant guidelines for specific types of loans are:
|
|
|
|
|
|
• |
For commercial real estate loans; maximum loan-to-value ratios range from 50% to 80% upon origination depending on the collateral securing the loan. Loan terms have a maximum amortization period of 20 years. Hazard insurance is required on collateral securitizing the loan and appropriate legal work is performed to verify our lien position. |
|
|
• |
For single and 2-4 family residential loans, maximum loan-to-value ratios do not exceed 80% upon origination, unless private mortgage insurance is purchased by the borrower. Loan terms have a maximum amortization period of 30 years. Hazard insurance is required on collateral securing the loan and appropriate legal work is performed to verify our lien position. |
|
|
• |
For commercial and industrial loans, loan-to-value ratios and loan terms will vary, reflecting varied collateral securitizing the loan. Documentation required for the loan transaction may include income tax returns, financial statements, profit and loss budgets and cash flow projections. Loans included in this type are short- term loans, lines of credit, term loans and floor plans. |
As part of the improvements and enhancements to our loan policies, among other things, we expanded prior existing protocols to require additional due diligence in investigating potential borrowers and additional detail in loan presentations. We addressed more in-depth and critical consideration of credit histories, borrower stability, management expertise, collateral and asset quality, loan term and loan-to-collateral ratios. All new credits and, depending on risk profile, existing credits seeking new money, are subject to these expanded procedures.
The Chief Credit Officer (“CCO”) was tasked with evaluating the loan portfolio with a view toward being proactive in removing or minimizing problem credits in the portfolio. As part of this philosophical shift toward a more proactive approach to credit risk management during 2007, we instructed the CCO to be much more critical in his review, identification and monitoring of problem loans and of potential problem loans, in particular those that may be marginal in terms of collateral adequacy.
Our philosophical shift did not affect the overall methodology by which we calculate our ALL, although we did become more proactive in our efforts to identify and remove or minimize problem credits in the portfolio. In particular, we enhanced the impairment analysis process by requiring and obtaining substantially more evidentiary support (including supplemental market data and routine site visits) for our conclusions as to future payment expectations and collateral values and, in general, are more conservative in our analysis. In conjunction with our ongoing analysis, the weakening economy in our lending markets, as well as national markets, and FRB’s reduction of market rates the performance of our loan portfolio has been negatively impacted for both 2009 and 2008, both in earnings and collateral-to-value ratios.
30
On a quarterly basis, management reviews the adequacy of the ALL. Based on an estimation computed pursuant to the requirements of ASC 450-10, “Accounting for Contingencies,” and ASC 310-10, “Accounting by Creditors for Impairment of a Loan,” the analysis of the ALL consists of three components: (i) specific credit allocation established for expected losses relating to specific individual loans for which the recorded investment in the loans exceeds its fair value; (ii) general portfolio allocation based on historical loan loss experience for significant loan categories; and (iii) general portfolio allocation based on economic conditions as well as specific factors in the markets in which we operate.
The specific credit allocation for the ALL is based on a regular analysis by the loan officers of all commercial credits. The loan officers grade commercial credits and the loan review function validates the grades assigned. In the event that the loan review function downgrades the loan, it is included in the ALL analysis process at the lower grade. This grading system is in compliance with regulatory classifications. At least quarterly, all commercial loans over a fixed dollar amount that have been deemed impaired are evaluated. In compliance with ASC 310-10, the fair value of the loan is determined based on either the present value of expected future cash flows discounted at the loan’s effective interest rate, the market price of the loan or, if the loan is collateral dependent, the fair value of the underlying collateral less the cost of sale. This evaluation may include obtaining supplemental market data and/or routine site visits to offer support to the evaluation process. A specific allowance is then allocated to the loans based on this assessment. Such allocations or impairments are reviewed by the CCO and management familiar with the credits.
During 2009, $6.5 million was added to the ALL and charged to operating expense, compared to $18.0 million in 2008.
Based upon information obtained subsequent to the close of our 2007 fiscal year, we completed an impairment evaluation of two loan relationships, which comprised approximately 27% of our non-performing loan balances outstanding at December 31, 2007. As a result of this evaluation, we recorded an additional impairment charge of $2.0 million relating specifically to these two loans in the fourth quarter of 2007. In addition to the $2.0 million impairment charge described above, a $1.3 million provision was taken in the fourth quarter of 2007 for unrelated loans. During 2008, an additional PFLL in the amount of $1.2 million was charged to earnings relating to the more significant of the two loan relationships. Prior to December 31, 2008, the collateral underlying this loan was sold resulting in a total charge-off of $3.1 million. The lesser relationship was charged off during 2008 in the amount of $0.3 million.
During the fourth quarter of 2008, two related credit relationships totaling $19.3 million experienced significant cash flow concerns. Prior to the fourth quarter, these relationships had been paying as agreed and in management’s opinion, did not represent increased credit risk. As a result of our evaluation of these relationships prior to December 31, 2008, a provision of $10.2 million was charged to earnings of which $5.9 million relating to one of the relationships was charged off against the ALL. In the second quarter of 2009, an additional charge-off of $2.7 million was recorded and in the fourth quarter of 2009, $0.7 million was charged off. Subsequent to year end, in February 2010, a payment of $6.2 million was received on this credit. Of the payment, $5.0 million was applied to the outstanding non-accrual loan, with the remaining $1.2 million applied as a charge-off recovery.
We have two other major components of the ALL that do not pertain to specific loans: “General Reserves – Historical” and “General Reserves – Other.” During 2007, we continued to use the same methodology of determining historical loss factors for the portfolio of loans to which there are no specific loss allocations. We determine General Reserves – Historical based on our historical recorded charge-offs of loans in particular categories, analyzed as a group. As it relates to the historical loss component, we reduced the historical loss lookback period from 16 quarters to an average of 8 and 12 quarters. This was primarily done to enable the model to provide a better reflection of the recent economic times. This resulted in increased allocations that we determined were appropriate. We determine General Reserves – Other by taking into account other factors, such as the concentration of loans in a particular industry or geographic area and adjustments for economic indicators. By nature, our general reserve changes with our fluid lending environment and the overall economic environment in which we lend. As such, we are continually attempting to enhance this portion of the allocation process to reflect anticipated losses in our portfolio driven by these changing factors. During 2007, management further enhanced the general component analysis to more specifically identify the inherent risks in the loan portfolio. Expanded economic statistics, specifically unemployment and inflation rates for national, state and local markets are monitored and factored into the allocation to address repayment risk. Further identification and management of portfolio concentration risks, both by loan category and by specific markets was enhanced and is reflected in the general allocation component. In the fourth quarter the model was further enhanced to include more specific qualitative factors, as mentioned previously, by loan type.
31
During 2009, we also contracted with a third party that provides an ALL methodology and an ALL model for determining necessary ALL levels. Although we do not use the model results for the basis of our ALL levels, the model provides a validation tool to our existing model.
All of the factors we take into account in determining PLL in the general categories are subject to change; thus, the allocations are not necessarily indicative of the loan categories in which future loan losses will occur. As loan balances and estimated losses in a particular loan type decrease or increase and as the factors and resulting allocations are monitored by management, changes in the risk profile of the various parts of the loan portfolio may be reflected in the allowance allocated.
Table 5: Quarterly Allowance for Loan Loss Components
|
|
|
|
|
|
|
|
|
|
|
|
|
|
|
|
|
|
|
|
|
12/31/08 |
|
03/31/09 |
|
As of |
|
09/30/09 |
|
12/31/09 |
|
|||||
|
|
|
(dollars in thousands) |
|
|||||||||||||
|
Component 1 – Specific credit allocation |
|
$ |
6,019 |
|
$ |
7,167 |
|
$ |
5,538 |
|
$ |
6,414 |
|
$ |
1,155 |
|
|
Component 2 – General reserves |
|
|
7,472 |
|
|
7,222 |
|
|
7,510 |
|
|
6,908 |
|
|
7,911 |
|
|
Unallocated |
|
|
70 |
|
|
291 |
|
|
(27 |
) |
|
650 |
|
|
534 |
|
|
Allowance for Loan Losses |
|
$ |
13,561 |
|
$ |
14,680 |
|
$ |
13,021 |
|
$ |
13,972 |
|
$ |
9,600 |
|
Management believes the ALL is at an appropriate level to absorb probable and inherent losses in the loan portfolio at December 31, 2009. Proactive efforts to collect on all non-performing loans, including use of the legal process when deemed appropriate to minimize the risk of further deterioration of such loans will be ongoing. In the event that the facts and circumstances relating to these non-performing loans change, additions to the ALL may become necessary. With respect to the remainder of the loan portfolio, while management uses available information to recognize losses on loans, future adjustments to the ALL may become necessary based on changes in economic conditions and the impact of such changes on our borrowers. Management remains watchful of credit quality issues and believes that issues within the portfolio are reflective of the challenging economic environment experienced over the past few years. Should the economic climate deteriorate further, the level of non-performing loans, charge-offs and delinquencies could rise, warranting an increase in the provision.
As an integral part of their examination process, various regulatory agencies review the ALL as well. Such agencies may require that changes in the ALL be recognized when their credit evaluations differ from those of management, based on their judgments regarding information available to them at the time of their examinations.
32
As Table 6 indicates, the ALL at December 31, 2009 was $9.6 million compared with $13.6 million at year-end 2008. Loans decreased 10.5% in 2009, while the allowance as a percent of gross loans decreased to 1.5% from 1.9% at year-end 2008. Net commercial mortgage loan charge-offs represented 34.6% of the total net charge-offs for 2009. Net commercial loan charge-offs represented 36.1% of the total net charge-offs in 2009 while residential real estate-mortgage loan net charge-offs represented 21.7% of the total net charge-offs for 2009. Net loan charge-offs decreased significantly in 2009. The ALL as a percent of total loans decreased as a result of net loan charge-offs exceeding the provision expense. Loans charged-off are subject to periodic review and specific efforts are taken to achieve maximum recovery of principal, accrued interest and related expenses.
Table 6: Loan Loss Experience
|
|
|
|
|
|
|
|
|
|
|
|
|
|
|
|
|
|
|
|
|
Years Ended December 31, |
|
|||||||||||||
|
|
|
2009 |
|
2008 |
|
2007 |
|
2006 |
|
2005 |
|
|||||
|
|
|
(dollars in thousands) |
|
|||||||||||||
|
|
|
|
|
|
|
|
|
|
|
|
|
|
|
|
|
|
|
Daily average amount of loans |
|
$ |
699,091 |
|
$ |
743,930 |
|
$ |
804,494 |
|
$ |
818,086 |
|
$ |
789,316 |
|
|
Loans, end of period |
|
$ |
651,894 |
|
$ |
728,722 |
|
$ |
760,210 |
|
$ |
819,568 |
|
$ |
812,296 |
|
|
|
|
|
|
|
|
|
|
|
|
|
|
|
|
|
|
|
|
ALL, at beginning of year |
|
$ |
13,561 |
|
$ |
11,840 |
|
$ |
8,058 |
|
$ |
9,551 |
|
$ |
10,445 |
|
|
Loans charged off: |
|
|
|
|
|
|
|
|
|
|
|
|
|
|
|
|
|
Real estate-mortgage |
|
|
2,297 |
|
|
587 |
|
|
437 |
|
|
204 |
|
|
537 |
|
|
Real estate-construction |
|
|
647 |
|
|
2,355 |
|
|
25 |
|
|
624 |
|
|
— |
|
|
Real estate-commercial |
|
|
3,766 |
|
|
11,289 |
|
|
2,154 |
|
|
1,341 |
|
|
3,363 |
|
|
Commercial/agricultural loans |
|
|
4,135 |
|
|
2,301 |
|
|
3,627 |
|
|
847 |
|
|
651 |
|
|
Consumer loans |
|
|
413 |
|
|
135 |
|
|
215 |
|
|
401 |
|
|
320 |
|
|
|
|
|
|
|
|
|
|
|
|
|
|
|
|
|
|
|
|
Total loans charged off |
|
|
11,258 |
|
|
16,667 |
|
|
6,458 |
|
|
3,417 |
|
|
4,871 |
|
|
|
|
|
|
|
|
|
|
|
|
|
|
|
|
|
|
|
|
Recoveries of loans previously charged off: |
|
|
|
|
|
|
|
|
|
|
|
|
|
|
|
|
|
Real estate-mortgage |
|
|
24 |
|
|
164 |
|
|
63 |
|
|
409 |
|
|
392 |
|
|
Real estate-construction |
|
|
238 |
|
|
— |
|
|
— |
|
|
— |
|
|
— |
|
|
Real estate-commercial |
|
|
149 |
|
|
78 |
|
|
113 |
|
|
127 |
|
|
91 |
|
|
Commercial/agricultural loans |
|
|
355 |
|
|
143 |
|
|
206 |
|
|
134 |
|
|
163 |
|
|
Consumer loans |
|
|
31 |
|
|
42 |
|
|
97 |
|
|
351 |
|
|
114 |
|
|
|
|
|
|
|
|
|
|
|
|
|
|
|
|
|
|
|
|
Total loans recovered |
|
|
797 |
|
|
427 |
|
|
479 |
|
|
1,021 |
|
|
760 |
|
|
Net loans charged off (“NCOs”) |
|
|
10,461 |
|
|
16,240 |
|
|
5,979 |
|
|
2,396 |
|
|
4,111 |
|
|
Additions to allowance for provision for loan losses charged to operations |
|
|
6,500 |
|
|
17,961 |
|
|
9,761 |
|
|
903 |
|
|
3,217 |
|
|
ALL, at end of year |
|
$ |
9,600 |
|
$ |
13,561 |
|
$ |
11,840 |
|
$ |
8,058 |
|
$ |
9,551 |
|
|
Ratio of NCOs during period to average loans outstanding |
|
|
1.50 |
% |
|
2.18 |
% |
|
0.74 |
% |
|
0.29 |
% |
|
0.52 |
% |
|
Ratio of ALL to NCOs |
|
|
0.9 |
|
|
0.8 |
|
|
2.0 |
|
|
3.4 |
|
|
2.3 |
|
|
Ratio of ALL to total loans end of period |
|
|
1.47 |
% |
|
1.86 |
% |
|
1.56 |
% |
|
0.98 |
% |
|
1.18 |
% |
The change in ALL is a function of a number of factors, including but not limited to changes in the loan portfolio, loan loss provision, net charge-offs, and non-performing loans.
Table 7 shows the amount of the ALL allocated on the dates indicated to each loan type as described. It also shows the percentage of balances for each loan type to total loans. In general, it would be expected that those types of loans which have historically more loss associated with them will have a proportionally larger amount of the allowance allocated to them than do loans that have less risk.
33
Table 7: Allocation of the Allowance for Loan Losses
|
|
|
|
|
|
|
|
|
|
|
|
|
|
|
|
|
|
|
|
|
|
|
|
|
|
|
|
|
|
|
|
|
|
|
|
As of December 31, |
|
||||||||||||||||||||||||||||
|
|
|
(dollars in thousands) |
|
||||||||||||||||||||||||||||
|
|
|
2009 |
|
2008 |
|
2007 |
|
2006 |
|
2005 |
|
||||||||||||||||||||
|
|
|
Amount |
|
% of total |
|
Amount |
|
% of total |
|
Amount |
|
% of total |
|
Amount |
|
% of total |
|
Amount |
|
% of total |
|
||||||||||
|
Commercial, financial & agricultural |
|
$ |
1,496 |
|
|
12.8 |
% |
$ |
6,375 |
|
|
15.2 |
% |
$ |
3,405 |
|
|
16.8 |
% |
$ |
2,082 |
|
|
10.1 |
% |
$ |
2,317 |
|
|
9.9 |
% |
|
Commercial real estate |
|
|
4,558 |
|
|
54.2 |
% |
|
4,726 |
|
|
52.3 |
% |
|
5,367 |
|
|
50.8 |
% |
|
4,280 |
|
|
56.6 |
% |
|
5,633 |
|
|
57.5 |
% |
|
Real estate |
|
|
|
|
|
|
|
|
|
|
|
|
|
|
|
|
|
|
|
|
|
|
|
|
|
|
|
|
|
|
|
|
Construction |
|
|
1,184 |
|
|
9.6 |
% |
|
806 |
|
|
9.6 |
% |
|
1,774 |
|
|
12.2 |
% |
|
597 |
|
|
11.5 |
% |
|
454 |
|
|
10.6 |
% |
|
Residential |
|
|
1,453 |
|
|
19.1 |
% |
|
1,308 |
|
|
18.4 |
% |
|
987 |
|
|
15.8 |
% |
|
755 |
|
|
17.6 |
% |
|
482 |
|
|
18.3 |
% |
|
Consumer installment loans |
|
|
375 |
|
|
1.8 |
% |
|
259 |
|
|
1.8 |
% |
|
306 |
|
|
1.9 |
% |
|
342 |
|
|
1.8 |
% |
|
243 |
|
|
1.8 |
% |
|
Tax exempt loans |
|
|
— |
|
|
2.5 |
% |
|
17 |
|
|
2.7 |
% |
|
— |
|
|
2.5 |
% |
|
— |
|
|
2.4 |
% |
|
— |
|
|
1.9 |
% |
|
Not specifically allocated |
|
|
534 |
|
|
|
|
|
70 |
|
|
|
|
|
1 |
|
|
|
|
|
2 |
|
|
|
|
|
422 |
|
|
|
|
|
Total allowance |
|
$ |
9,600 |
|
|
100.0 |
% |
$ |
13,561 |
|
|
100.0 |
% |
$ |
11,840 |
|
|
100.0 |
% |
$ |
8,058 |
|
|
100.0 |
% |
$ |
9,551 |
|
|
100.0 |
% |
Non-Performing Loans and Foreclosed Properties
Management encourages early identification of non-accrual and problem loans in order to minimize the risk of loss.
Non-performing loans are defined as non-accrual loans, loans 90 days or more past due but still accruing, and restructured loans. Additionally, whenever management becomes aware of facts or circumstances that may adversely impact the collection of principal or interest on loans, it is the practice of management to place such loans on non-accrual status immediately rather than waiting until the loans become 90 days past due. The accrual of interest income is discontinued when a loan becomes 90 days past due as to principal or interest. When interest accruals are discontinued, unpaid interest credited to income is reversed. If collection is in doubt, cash receipts on non-accrual loans are used to reduce principal rather than recorded as interest income.
Restructuring loans involves the granting of some concession to the borrower involving a loan modification, such as payment schedule or interest rate changes. A troubled debt restructuring (“TDR”) includes a loan modification where a borrower is experiencing financial difficulty and we grant a concession to that borrower that we could not otherwise consider except for the borrower’s financial difficulties. TDR loans on a non-accrual status will be identified as non-accrual loans and not as TDR’s.
Table 8: Nonperforming Loans and Foreclosed properties
|
|
|
|
|
|
|
|
|
|
|
|
|
|
|
|
|
|
|
|
|
December 31, |
|
|||||||||||||
|
|
|
2009 |
|
2008 |
|
2007 |
|
2006 |
|
2005 |
|
|||||
|
|
|
(dollars in thousands) |
|
|||||||||||||
|
|
|
|
|
|
|
|
|
|
|
|
|
|
|
|
|
|
|
Nonaccrual loans |
|
$ |
26,591 |
|
$ |
43,687 |
|
$ |
37,555 |
|
$ |
27,352 |
|
$ |
6,942 |
|
|
Accruing loans past due 90 days or more |
|
|
— |
|
|
— |
|
|
— |
|
|
— |
|
|
— |
|
|
Restructured loans |
|
|
2,061 |
|
|
367 |
|
|
— |
|
|
496 |
|
|
— |
|
|
Total non-performing loans (NPLs) |
|
|
28,652 |
|
|
44,054 |
|
|
37,555 |
|
|
27,848 |
|
|
6,942 |
|
|
Foreclosed properties |
|
|
14,995 |
|
|
7,143 |
|
|
5,167 |
|
|
5,760 |
|
|
3,333 |
|
|
Total non-performing assets (NPAs) |
|
$ |
43,647 |
|
$ |
51,197 |
|
$ |
42,722 |
|
$ |
33,608 |
|
$ |
10,275 |
|
|
|
|
|
|
|
|
|
|
|
|
|
|
|
|
|
|
|
|
Ratios: |
|
|
|
|
|
|
|
|
|
|
|
|
|
|
|
|
|
NPLs to total loans |
|
|
4.40 |
% |
|
6.04 |
% |
|
4.94 |
% |
|
3.40 |
% |
|
0.85 |
% |
|
NPAs to total assets |
|
|
6.70 |
% |
|
4.82 |
% |
|
3.86 |
% |
|
3.02 |
% |
|
0.94 |
% |
|
ALL to NPLs |
|
|
33.51 |
% |
|
30.78 |
% |
|
31.53 |
% |
|
28.94 |
% |
|
137.58 |
% |
Non-performing loans at December 31, 2009 were $28.7 million compared to $44.1 million at December 31, 2008. When comparing the previous quarter ended September 30, 2009, non-performing loans decreased $11.8 million, or 29.1%. The sale of non-accrual assets of $2.8 million accounted for a portion of the decline. In addition, $5.8 million of the reduction was attributed to properties being transferred to foreclosed properties and $7.5 million was the result of charge-offs. Offsetting the decline were new additions to non-accrual loans of $2.7 million and an increase in restructured loans of $2.1 million. Management believes collateral is currently sufficient to collect the net carrying value of those loans in the event of foreclosure or repossession and has aggressively charged off collateral deficiencies. Our assessment is based on recent appraisals, professional market valuations and/or sales agreements with respect to each of the properties. Management is continually monitoring these relationships and in the event facts and circumstances change, additional PFLLs may be necessary.
34
Table 9: Quarterly Nonaccrual and Restructured Loans
|
|
|
|
|
|
|
|
|
|
|
|
|
|
|
|
|
|
|
|
|
Quarters Ended |
|
|||||||||||||
|
|
|
12/31/09 |
|
09/30/09 |
|
06/30/09 |
|
03/31/09 |
|
12/31/08 |
|
|||||
|
|
|
(dollars in thousands) |
|
|||||||||||||
|
Nonaccrual Loans |
|
$ |
26,590 |
|
$ |
40,474 |
|
$ |
51,601 |
|
$ |
48,480 |
|
$ |
43,687 |
|
|
Loans restructured in a troubled debt restructuring |
|
|
2,061 |
|
|
11 |
|
|
12 |
|
|
428 |
|
|
367 |
|
|
Total Nonperforming Loans |
|
$ |
28,651 |
|
$ |
40,485 |
|
$ |
51,613 |
|
$ |
48,908 |
|
$ |
44,054 |
|
Table 10: 30-89 Days Past Due Loans
The following table presents an analysis of our past due loans excluding non-accrual loans:
PAST DUE LOANS (EXCLUDING NON-ACCRUALS)
30-89 DAYS PAST DUE
(Dollar amounts in thousands)
|
|
|
|
|
|
|
|
|
|
|
|
|
|
|
|
|
|
|
|
|
12/31/09 |
|
09/30/09 |
|
06/30/09 |
|
03/31/09 |
|
12/31/08 |
|
|||||
|
Total secured by real estate |
|
$ |
8,881 |
|
$ |
5,922 |
|
$ |
6,936 |
|
$ |
9,936 |
|
$ |
11,957 |
|
|
Commercial and industrial loans |
|
|
255 |
|
|
862 |
|
|
2,512 |
|
|
3,255 |
|
|
671 |
|
|
Loans to individuals |
|
|
370 |
|
|
204 |
|
|
104 |
|
|
131 |
|
|
145 |
|
|
All other loans |
|
|
1 |
|
|
139 |
|
|
143 |
|
|
5 |
|
|
2 |
|
|
Total |
|
$ |
9,507 |
|
$ |
7,127 |
|
$ |
9,695 |
|
$ |
13,327 |
|
$ |
12,775 |
|
|
Percent of total loans |
|
|
1.46 |
% |
|
1.06 |
% |
|
1.37 |
% |
|
1.85 |
% |
|
1.75 |
% |
As indicated above, loan balances 30 to 89 days past due have decreased by $3.3 million since December 31, 2008. As the loans continue through the collection process, we anticipate these past due levels continue to decline.
Table 11: Foregone Loan Interest
The following table shows, for those loans accounted for on a non-accrual basis for the years ended as indicated, the gross interest that would have been recorded if the loans had been current in accordance with their original terms and the amount of interest income that was included in interest income for the period.
|
|
|
|
|
|
|
|
|
|
|
|
|
|
|
Years ended December 31, |
|
|||||||
|
|
|
2009 |
|
2008 |
|
2007 |
|
|||
|
|
|
(dollars in thousands) |
|
|||||||
|
Interest income in accordance with original terms |
|
$ |
1,981 |
|
$ |
2,887 |
|
$ |
3,971 |
|
|
Interest income recognized |
|
|
(245 |
) |
|
(213 |
) |
|
(565 |
) |
|
Reduction in interest income |
|
$ |
1,736 |
|
$ |
2,674 |
|
$ |
3,406 |
|
Foreclosed properties, which represent properties that we acquired through foreclosure or in satisfaction of debt, totaled $15.0 million at end of year 2009. This compared to $7.1 million at year-end 2008. Management actively seeks to ensure that properties held are administered to minimize any risk of loss.
Activity for foreclosed properties for 2009, 2008 and 2007, including costs of operation are shown in Table 12:
Table 12: Foreclosed Properties Summary
|
|
|
|
|
|
|
|
|
|
|
|
|
|
|
Years ended December 31, |
|
|||||||
|
|
|
2009 |
|
2008 |
|
2007 |
|
|||
|
Income from operation of foreclosed properties |
|
$ |
118 |
|
$ |
153 |
|
$ |
64 |
|
|
Expense from operation of foreclosed properties |
|
|
(1,403 |
) |
|
(4,228 |
) |
|
(966 |
) |
|
Net gains (losses) from sale of foreclosed properties |
|
|
108 |
|
|
(119 |
) |
|
(232 |
) |
|
|
|
|
|
|
|
|
|
|
|
|
|
Cost of operation and sale of foreclosed properties |
|
$ |
(1,177 |
) |
$ |
(4,194 |
) |
$ |
(1,134 |
) |
35
Investment Portfolio
Our investment portfolio is intended to provide us with adequate liquidity, flexibility in asset/liability management and earning potential.
Table 13: Investment Portfolio
|
|
|
|
|
|
|
|
|
|
|
|
|
|
|
December 31, |
|
|||||||
|
|
|
2009 |
|
2008 |
|
2007 |
|
|||
|
|
|
(dollars in thousands) |
|
|||||||
|
Securities Available for Sale (AFS): |
|
|
|
|
|
|
|
|
|
|
|
U.S. Treasury and U.S. government sponsored agency securities |
|
$ |
30,000 |
|
$ |
4,489 |
|
$ |
29,222 |
|
|
Obligations of states and political subdivisions |
|
|
38,042 |
|
|
53,854 |
|
|
55,741 |
|
|
Mortgage-backed securities |
|
|
118,982 |
|
|
152,118 |
|
|
118,848 |
|
|
Private placement and corporate bonds |
|
|
15,137 |
|
|
15,130 |
|
|
15,141 |
|
|
Other equity securities |
|
|
3,330 |
|
|
2,679 |
|
|
3,419 |
|
|
Total amortized cost |
|
$ |
205,491 |
|
$ |
228,270 |
|
$ |
222,371 |
|
|
Total fair value and carrying value |
|
$ |
204,834 |
|
$ |
225,417 |
|
$ |
222,475 |
|
Securities classified as available for sale are those securities which we have determined might be sold to manage interest rates, reposition holdings to increase returns or modify durations, or in response to changes in interest rates or other economic factors. They may or may not be held until maturity. Securities available for sale are carried at market value. Such market values are monitored at least quarterly and more frequently as economic conditions warrant. As part of such monitoring, the credit quality of individual securities and their issuers are assessed. Adjustments to market value that are considered temporary at December 31, 2009 and 2008 are recorded as a separate component of equity, net of tax. If an impairment of a security is identified as other-than-temporary based on information available such as the decline in the credit worthiness of the issuer, external market ratings or the anticipated or realized elimination of associated dividends, such impairments are recorded in the consolidated statement of operations. Subsequent to December 31, 2008, a security held in the amount of $1.9 million was determined to be impaired on an other-than-temporary basis. The book value of the security was eliminated from the balance sheet and charged to earnings in the amount of $1.9 million. This expense is identified as such on the statement of operations for the year ended December 31, 2008.
In November 2007, our investment subsidiary sold agency securities with a total market value of $30.0 million. In 2008, the Bank sold US government sponsored agency securities with a total market value of $19.1 million and our investment subsidiary sold similar securities with a total market value of $10.8 million to reposition our investment portfolio and improve the yields we were receiving on these type of securities. Replacement agency securities were subsequently purchased that provided a higher yield and allowed us to take advantage of opportunities in the market.
36
During 2009, securities with a market value of $202.3 million were sold and $290.5 million of other securities were purchased. Gains of $4.2 million were realized on the sale of securities.
Table 14: Securities Portfolio Maturity Distribution (dollars in thousands, rates on a tax-equivalent basis)
|
|
|
|
|
|
|
|
|
|
|
|
|
|
|
|
|
|
|
|
|
|
|
|
|
|
|
|
|
|
|
|
|
|
|
|
Securities AFS – maturity distribution and weighted average yield |
|
||||||||||||||||||||||||||||
|
|
|
Within one year |
|
After one year but |
|
After five years but |
|
After ten years |
|
Total |
|
||||||||||||||||||||
|
|
|
Amount |
|
Yield |
|
Amount |
|
Yield |
|
Amount |
|
Yield |
|
Amount |
|
Yield |
|
Amount |
|
Yield |
|
||||||||||
|
U.S. Treasury securities |
|
$ |
30,000 |
|
|
0.00 |
% |
$ |
— |
|
|
— |
|
|
— |
|
|
— |
|
|
— |
|
|
— |
|
$ |
30,000 |
|
|
0.00 |
% |
|
Mortgage-backed securities |
|
|
1,472 |
|
|
2.58 |
% |
|
87,567 |
|
|
4.33 |
% |
|
22,969 |
|
|
4.21 |
% |
|
8,140 |
|
|
5.78 |
% |
|
120,148 |
|
|
4.38 |
% |
|
Obligations of states and political subdivisions |
|
|
— |
|
|
— |
|
|
2,987 |
|
|
4.32 |
% |
|
18,653 |
|
|
4.05 |
% |
|
17,180 |
|
|
3.95 |
% |
|
38,820 |
|
|
4.03 |
% |
|
Private placement and corporate bonds |
|
|
— |
|
|
— |
|
|
— |
|
|
— |
|
|
— |
|
|
— |
|
|
12,536 |
|
|
7.64 |
% |
|
12,536 |
|
|
7.64 |
% |
|
|
|
|
|
|
|
|
|
|
|
|
|
|
|
|
|
|
|
|
|
|
|
|
|
|
|
|
|
|
|
|
|
|
Other |
|
|
3,330 |
|
|
3.84 |
% |
|
— |
|
|
— |
|
|
— |
|
|
— |
|
|
— |
|
|
— |
|
|
3,330 |
|
|
3.84 |
% |
|
Total carrying value |
|
$ |
34,802 |
|
|
0.48 |
% |
$ |
90,554 |
|
|
4.33 |
% |
$ |
41,622 |
|
|
4.14 |
% |
$ |
37,856 |
|
|
5.57 |
% |
$ |
204,834 |
|
|
3.86 |
% |
Securities averaged $253.3 million in 2009 compared with $231.4 million in 2008. In 2009, taxable securities comprised approximately 66.0% of the total average investments compared to 76.1% in 2008. Tax-exempt securities for 2009 accounted for 16.3% of the total average investments compared to 23.9% in 2008.
Goodwill
Goodwill is not amortized but is subject to impairment tests on an annual basis or more frequently if deemed appropriate. For 2008, the market value of our stock was determined by using a three-year quarterly average multiple of market value to book value. Based on the results of this analysis, no impairment was identified at December 31, 2008.
For 2009, consideration was given to the market value of our stock. However, based on current market conditions, we hired a firm specialized in rendering valuation opinions for banks and bank holding companies nationwide. In rendering their opinion as to the fair value of our stock, they considered the nature and history of our Company, the competitive and economic outlook for the trade area and for the banking industry in general, the book value and financial condition of our Company, our future earnings and dividend paying capacity, the size of the block valued, and the prevailing market prices of bank stocks. The following valuation methodologies were considered: 1.) net asset value – defined as the net worth of the Company, 2.) market value – defined as the price at which knowledgeable buyers and sellers would agree, and 3.) investment value – defined as an estimate of the present value of the future benefits, usually earnings, cash flow, or dividends, that will accrue to our common stock. When consideration was given to the three valuation methodologies, as well as all other relevant valuation variables and factors, the fully-diluted cash fair value range of our common shares was deemed to be in excess of the book value and therefore, no impairment was recognized.
Deposits
Deposits are our largest source of funds. Average total deposits for 2009 were $838.9 million, a decrease of 1.7% from 2008. At December 31, 2009, deposits were $831.6 million, a decrease of $18.2 million (2.1%) from $849.8 million at December 31, 2008. Average brokered deposits decreased $45.2 million, (35.9%) between 2008 and 2009, total brokered deposits decreased $65.0 million to $48.9 million at year-end 2009 from $113.9 million at year-end 2008. The reduction in brokered certificates of deposit was a result of our strategic decision to allow those deposits to mature in order to reduce our reliance on such deposits. From a liquidity standpoint, those funds were not necessary as our cash position was sufficient to pay time desposits as they matured and otherwise provide us with liquidity for our operations. Management views these as a stable source of funds. If liquidity concerns arose, we believe (but cannot assure) that we have alternative sources of funds, such as lines with correspondent banks and borrowing arrangements with the FHLB should the need present itself. Typically, overall deposits for the first six months tend to decline slightly as a result of the seasonality of our customer base, as customers draw down deposits during the first half of the year in anticipation of the summer tourist season.
37
Table 15: Average Deposits Distribution
For the year ended
December 31,
|
|
|
|
|
|
|
|
|
|
|
|
|
|
|
|
|
|
|
|
|
|
|
|
|
|
|
|
|
|
|
|
|
2009 |
|
2008 |
|
2007 |
|
|||||||||||||||||||||
|
|
|
Amount |
|
% of Total |
|
Average |
|
Amount |
|
% of Total |
|
Average |
|
Amount |
|
% of Total |
|
Average |
|
|||||||||
|
|
|
(dollars in thousands) |
|
|||||||||||||||||||||||||
|
Noninterest-bearing demand deposits |
|
$ |
72,368 |
|
8.6 |
% |
|
|
0.0 |
% |
$ |
72,852 |
|
8.5 |
% |
|
|
0.0% |
|
$ |
93,706 |
|
10.6 |
% |
|
|
0.0% |
|
|
Interest-bearing demand deposits |
|
|
135,430 |
|
16.1 |
% |
|
|
0.4 |
% |
|
123,404 |
|
14.5 |
% |
|
|
1.3% |
|
|
110,322 |
|
12.5 |
% |
|
|
2.5% |
|
|
Savings deposits |
|
|
231,315 |
|
27.6 |
% |
|
|
0.7 |
% |
|
232,495 |
|
27.2 |
% |
|
|
1.9% |
|
|
262,026 |
|
29.7 |
% |
|
|
3.5% |
|
|
Other time deposits (excluding brokered deposits) |
|
|
210,165 |
|
25.1 |
% |
|
|
3.0 |
% |
|
194,648 |
|
22.8 |
% |
|
|
4.1% |
|
|
184,480 |
|
20.9 |
% |
|
|
4.7% |
|
|
Time deposits $100,000 and over (excluding brokered deposits) |
|
|
108,932 |
|
13.0 |
% |
|
|
3.2 |
% |
|
104,123 |
|
12.2 |
% |
|
|
4.6% |
|
|
115,021 |
|
13.0 |
% |
|
|
5.3% |
|
|
Brokered certificates of deposit |
|
|
80,648 |
|
9.6 |
% |
|
|
4.1 |
% |
|
125,852 |
|
14.7 |
% |
|
|
4.2% |
|
|
116,179 |
|
13.2 |
% |
|
|
4.6% |
|
|
Total deposits |
|
$ |
838,858 |
|
100.0 |
% |
|
|
|
|
$ |
853,374 |
|
100.0 |
% |
|
|
|
|
$ |
881,734 |
|
100.0 |
% |
|
|
|
|
Table 16: Maturity Distribution-Certificates of Deposit and Other Time Deposits of $100,000 or More
|
|
|
|
|
|
|
|
|
|
|
|
|
|
|
December 31, 2009 |
|
|||||||
|
|
|
Certificates of Deposit |
|
Other Time Deposits |
|
Total |
|
|||
|
|
|
(Dollars in thousands) |
|
|||||||
|
Three months or less |
|
$ |
40,786 |
|
$ |
2,332 |
|
$ |
43,118 |
|
|
Over three months through six months |
|
|
34,956 |
|
|
1,688 |
|
|
36,644 |
|
|
Over six months through twelve months |
|
|
37,984 |
|
|
1,188 |
|
|
39,172 |
|
|
Over twelve months |
|
|
37,053 |
|
|
3,777 |
|
|
40,830 |
|
|
Total |
|
$ |
150,779 |
|
$ |
8,985 |
|
$ |
159,764 |
|
As shown in Table 15, non-interest bearing demand deposits in 2009 averaged $72.4 million, down 0.7% from $72.9 million in 2008. This $0.5 million decrease reflects the shift from non-interest bearing to interest-bearing accounts. As of December 31, 2009, non-interest-bearing demand deposits totaled $81.3 million compared to $73.6 million at year-end 2008.
Interest-bearing deposits generally consist of interest-bearing checking, savings deposits, money market accounts, individual retirement accounts (“IRAs”) and certificates of deposit (“CDs”). In 2009, interest-bearing deposits averaged $766.5 million, a decrease of 1.8% from 2008. Average balances of NOW accounts, savings deposits and money market accounts increased $10.9 million (3.0%) as a result of customer preference to shorter terms in a down interest rate environment. During the same period, time deposits, including CDs and IRAs (other than brokered time deposits and time deposits over $100,000) increased average deposits by $20.1 million (10.3%), primarily in response to customer reaction to aggressive short-term rate declines in national markets. Average time deposits over $100,000, other than brokered time deposits, decreased by $0.2 million (0.2%). These deposits were priced within the framework of our rate structure and did not materially increase the average rates on deposit liabilities. Increased competition for consumer deposits and customer awareness of interest rates continue to limit our core deposit growth in these types of deposits. Despite this reduced growth, our average brokered deposits decreased $45.3 million, (36.0%) in 2009 compared to 2008.
Emphasis will be placed on generating additional core deposits in 2010 through competitive pricing of deposit products and through the branch delivery systems that have already been established. We will also attempt to attract and retain core deposit accounts through new product offerings and customer service. In the event that core deposit growth goals are not accomplished, we will continue to look at other wholesale sources of funds.
38
Other funding sources
Total other funding sources, including short-term borrowings, Federal Home Loan Bank (“FHLB”) advances, convertible promissory notes and subordinated debentures, were $127.6 million at December 31, 2009, a decrease of $3.8 million, (2.9%), from $131.4 million at December 31, 2008.
Table 17: Short-term Borrowings
|
|
|
|
|
|
|
|
|
|
|
|
|
|
|
December 31, |
|
|||||||
|
|
|
2009 |
|
2008 |
|
2007 |
|
|||
|
|
|
(Dollars in thousands) |
|
|||||||
|
Federal funds purchased and securities sold under agreements to repurchase: |
|
|
|
|
|
|
|
|
|
|
|
Balance end of year |
|
$ |
21,122 |
|
$ |
30,174 |
|
$ |
27,174 |
|
|
Average amounts outstanding during year |
|
$ |
23,330 |
|
$ |
32,750 |
|
$ |
17,048 |
|
|
Maximum month-end amounts outstanding |
|
$ |
33,757 |
|
$ |
45,659 |
|
$ |
41,107 |
|
|
Average interest rates on amounts outstanding at end of year |
|
|
0.50 |
% |
|
1.15 |
% |
|
4.73 |
% |
|
Average interest rates on amounts outstanding during year |
|
|
0.71 |
% |
|
2.38 |
% |
|
5.18 |
% |
Federal funds are purchased from money center banks and correspondent banks at prevailing overnight interest rates. Securities are sold to bank customers under repurchase agreements at prevailing market rates. Borrowings from the FHLB are secured by our portfolio of one to four family residential mortgages, home equity lines of credit and eligible investment securities allowing us to use FHLB borrowings for additional funding purposes. Substantially all of our FHLB advances are included as short-term borrowings.
Long-term Debt
In connection with the issuance of Trust Preferred Securities in 2001 (see “Capital Resources”), we issued long-term subordinated debentures to Baylake Capital Trust I, a Delaware Business Trust subsidiary. On March 31, 2006, we redeemed the debentures and funded the redemption through the issuance of $16.1 million of trust preferred securities and $498,000 of trust common securities under the name Baylake Capital Trust II. Subordinated debentures totaled $16.1 million at December 31, 2008, 2007 and 2006. For additional details, see Note 11, “Subordinated Debentures”, to the Consolidated Financial Statements.
During the third and fourth quarters of 2009, we completed three separate closings of a private placement of our 10% Convertible Notes due June 30, 2017 (the “Convertible Notes”). The Convertible Notes were offered and sold in reliance on the exemption from registration under Section 4(2) of the Securities Act of 1933 and Rule 506 promulgated there under. Through December 31, 2009, we issued $5.35 million principal amount of the Convertible Notes, at par, and received gross proceeds in the same amount.
The Convertible Notes accrue interest at a fixed rate of 10% per annum upon issuance and until maturity or earlier conversion or redemption. Interest is payable quarterly, in arrears, on January 1, April 1, July 1, and October 1, of each year. The Convertible Notes are convertible into shares of our common stock at a conversion ratio of one share of common stock for each $5.00 in aggregate principal amount held on the record date of the conversion subject to certain adjustments as described in the Convertible Notes. Prior to October 1, 2014, each holder of the Convertible Notes may convert up to 100% (at the discretion of the holder) of the original principal amount into shares of our common stock at the conversion ratio. On October 1, 2014, one-half of the original principal amounts are mandatorily convertible at the conversion ratio if conversion has not occurred. The principal amount of any Convertible Note that has not been converted or redeemed will be payable at maturity on June 30, 2017. We are not obligated to register the common stock related to the conversion of the Convertible Notes.
We incurred debt offering costs of $0.2 million. These costs are capitalized and amortized to interest expense using the effective interest method over the initial conversion term, which is October 1, 2014. The total amount of Convertible Notes offered is $15.0 million. We anticipate a fourth closing during the first quarter of 2010. The Convertible Notes offering expires on April 30, 2010.
Contractual Obligations
As of December 31, 2009, we were contractually obligated under long-term agreements as follows:
Table 18: Contractual Obligations
|
|
|
|
|
|
|
|
|
|
|
|
|
|
|
|
|
|
|
|
|
Payments due by period |
|
|||||||||||||
|
(dollars in thousands) |
|
Total |
|
Less than 1 year |
|
1 to 3 years |
|
3 to 5 years |
|
More than 5 years |
|
|||||
|
Certificates of deposit and other time deposit obligations |
|
$ |
373,063 |
|
$ |
273,189 |
|
$ |
88,591 |
|
$ |
11,283 |
|
$ |
— |
|
|
Subordinated debentures |
|
|
16,100 |
|
|
— |
|
|
— |
|
|
— |
|
|
16,100 |
|
|
Convertible promissory notes(1) |
|
|
5,350 |
|
|
— |
|
|
— |
|
|
5,350 |
|
|
— |
|
|
FHLB advances |
|
|
85,000 |
|
|
10,000 |
|
|
75,000 |
|
|
— |
|
|
— |
|
|
Operating leases |
|
|
22 |
|
|
22 |
|
|
— |
|
|
— |
|
|
— |
|
|
Totals |
|
$ |
479,535 |
|
$ |
283,211 |
|
$ |
163,591 |
|
$ |
16,633 |
|
$ |
16,100 |
|
(1) One-half of the Convertible Notes are mandatorily converted to shares of common stock by October 1, 2014. The principal amount of any Convertible Note that has not been converted or redeemed will be payable at maturity on June 30, 2017.
For a discussion of these contractual obligations, see Note 5, “Premises and Equipment,” Note 11, “Subordinated Debentures,” and Note 12, “Convertible Promissory Notes,” to Consolidated Financial Statements.
39
Liquidity
Liquidity management refers to our ability to ensure that cash is available in a timely manner to meet loan demand and depositors’ needs, and to service other liabilities as they become due, without undue cost or risk, or causing a disruption to normal operating activities. We and our subsidiary bank have different liquidity considerations.
Our primary sources of funds are dividends from our subsidiary bank, investment income, proceeds from the sale of securities, principal payments on our loans and investments, and net proceeds from borrowings and the offerings of subordinated debentures and convertible promissory notes. We generally manage our liquidity position in order to provide funds necessary to pay dividends to our shareholders. Dividends received from our bank totaled $2.3 million in 2007 and were our main source of liquidity in 2008. After consultation with our federal and state regulators, our Board of Directors elected to forego paying the dividend normally paid to our shareholders beginning in the first quarter of 2008. In order to begin paying dividends in the future, we will need to seek prior approval from the Wisconsin Department of Financial Institutions as well as the FRB.
Our bank meets its cash flow needs by having funding sources available to it to satisfy the credit needs of customers as well as having available funds to satisfy deposit withdrawal requests. Liquidity at our bank is derived from deposit growth, maturing loans, the maturity and marketability of our investment portfolio, access to other funding sources, marketability of certain of our assets, the ability to use our loan and investment portfolios as collateral for secured borrowings and strong capital positions.
Maturing investments and investment sales have been a primary source of liquidity at our bank. Principal payments on investments totaling $113.7 million were made in 2009 and $202.3 million of proceeds were received from investment sales. In addition, $290.5 million in investments were purchased in 2009. At December 31, 2009, the carrying value of investment securities maturing within one year was $31.6 million, or 15.4% of the total investment securities portfolio. This compares to 11.7% of our investment securities with one year or less maturities as of December 31, 2008. At the end of 2009, the investment portfolio contained $119.7 million of U.S. Treasury, U.S. government sponsored agency securities and mortgage backed securities representing 58.5% of the total investment portfolio. These securities tend to be highly marketable and had a fair value approximately $2.1 million above amortized cost at year-end 2009.
During 2009, we maintained large balances at the Federal Reserve Bank for liquidity purposes. On average, those balances were $40.4 million. At year-end, the balance was $65.7 million. We anticipate reducing those balances in 2010.
Deposit growth is another potential source of liquidity for our bank. However, as a financing activity reflected in the 2009 Consolidated Statements of Cash Flows, deposit reduction consumed $18.1 million in cash during 2009. Our bank’s overall average deposit base declined $14.5 million or 1.7% during 2009. Deposit growth is potentially the most stable source of liquidity for our bank, although brokered deposits are inherently less stable than locally generated core deposits. Affecting liquidity are core deposit growth levels, certificate of deposit maturity structure and retention, and characteristics and diversification of wholesale funding sources affecting the channels by which brokered deposits are acquired. Conversely, deposit outflow would require our bank to develop alternative sources of funds which may not be as liquid and may be potentially a more costly alternative.
Federal funds sold averaged $3.2 million in 2009 compared to $7.0 million in 2008. Funds provided from the maturity of these assets typically are used as funding sources for seasonal loan growth, which typically has higher yields. Short-term and liquid by nature, federal funds sold generally provide a yield lower than other earning assets. Our bank has a strategy of maintaining a sufficient level of liquidity to accommodate fluctuations in funding sources and will at times take advantage of specific opportunities to temporarily invest excess funds at narrower than normal rate spreads while still generating additional interest revenue. At December 31, 2009, our bank had $0.08 million in federal funds sold.
The scheduled maturity of loans can provide a source of additional liquidity. At December 31, 2009, our bank has $223.9 million of loans maturing within one year, or 34.4% of total loans. Factors affecting liquidity relative to loans are loan origination volumes, loan prepayment rates and the maturity structure of existing loans. Our bank’s liquidity position is influenced by changes in interest rates, economic conditions and competition. Conversely, loan demand as a need for liquidity will cause us to acquire other sources of funding which could be harder to find and, therefore, more costly to acquire.
Within the classification of short-term borrowings at year-end 2009 and 2008, federal funds purchased and securities sold under agreements to repurchase totaled $21.1 million. At December 31, 2009, our bank had no federal funds purchased. Federal funds are purchased from various upstream correspondent banks while securities sold under agreements to repurchase are obtained from a base of business customers. At December 31, 2009, our bank had $32.6 million available in the form of federal funds lines. Short-term and long-term FHLB advances are another source of funds, totaling $85.0 million at year-end 2009. At December 31, 2009, our bank had $17.7 million in the form of additional available FHLB advances.
40
Our bank’s liquidity resources were sufficient in 2009 to fund the deposit run-off, growth in investments and meet other cash needs when necessary.
Management expects that deposit growth will be the primary funding source of our bank’s liquidity on a long-term basis, along with a stable earnings base, the resulting cash generated by operating activities, and a strong capital position. Although federal funds purchased and borrowings from the FHLB provided funds in 2009, management expects deposit growth resulting from branch expansion efforts and marketing efforts to attract and retain core deposits, as well as brokered deposits, to be a reliable funding source in the future. Shorter-term liquidity needs will mainly be derived from growth in short-term borrowings, maturing federal funds sold and portfolio investments, loan maturities and access to other funding sources.
In assessing liquidity, historical information such as seasonality (loan demand’s effect on liquidity which starts before and during the tourist season and deposit draw down which affects liquidity shortly before and during the early part of the tourist season), local economic cycles and the economy in general are considered along with the current ratios, management goals and our resources available to meet anticipated liquidity needs. Management believes that, in the current economic environment, our liquidity position is adequate. To management’s knowledge, there are no known trends nor any known demands, commitments, events or uncertainties that will result or are reasonably likely to result in a material increase or decrease in our liquidity.
Capital Resources
Stockholders’ equity at December 31, 2009 increased $5.6 million or 8.1% to $74.6 million, compared to $69.0 million at the end of 2008. Accumulated other comprehensive loss decreased to $0.3 million at year-end 2009 versus accumulated other comprehensive loss of $1.6 million at year-end 2008. The ratio of stockholders’ equity to assets at December 31, 2009 was 7.1%, compared to 6.5% at year-end 2008.
On June 5, 2006, our Board of Directors authorized management, in its discretion, to repurchase up to 300,000 shares, representing approximately 3.8% of our common stock for a period not to exceed June 30, 2007. The program allowed us to repurchase our shares as opportunities arose at prevailing market prices in open market or privately negotiated transactions. Shares repurchased are held as treasury stock and accordingly, are accounted for as a reduction of stockholders’ equity. During 2007, the final 50,000 shares authorized were repurchased. In July 2007, our Board of Directors approved a reimplementation of this program, for the repurchase of an additional 300,000 shares through June 30, 2008. We repurchased 79,000 shares under this new program between July 1 and December 31, 2007. No shares were purchased in 2008 and the program expired June 30, 2008.
Under applicable regulatory guidelines, the Trust Preferred Securities qualify as Tier 1 capital up to a maximum of 25% of Tier 1 capital. Any additional portion of Trust Preferred Securities would qualify as Tier 2 capital. As of December 31, 2009, all $16.1 million of the Trust Preferred Securities qualify as Tier 1 capital. Our convertible promissory notes, which qualify as Tier 2 capital, totaled $5.35 million at the end of 2009.
No cash dividends were declared in 2009 and 2008.
The adequacy of our capital is regularly reviewed to ensure that sufficient capital is available for current and future needs and is in compliance with regulatory guidelines. The assessment of overall capital adequacy depends upon a variety of factors, including asset quality, liquidity, stability of earnings, changing competitive forces, economic conditions in markets served and strength of management.
The FRB has established capital adequacy rules which take into account risks attributable to balance sheet assets and off-balance sheet activities. All banks and bank holding companies must meet a minimum total risk-based capital ratio of 8%. Of the 8% required, at least half must consist of core capital elements defined as Tier 1 capital. The federal banking agencies also have adopted leverage capital guidelines which banking organizations must meet. Under these guidelines, the most highly rated banking organizations must meet a leverage ratio of at least 3% Tier 1 capital to assets, while lower rated banking organizations must maintain a ratio of at least 4% to 5%. Failure to meet minimum capital requirements can initiate certain mandatory and possible additional discretionary actions by regulators that, if undertaken, could have a direct material effect on the consolidated financial statements.
Through the first three quarters of 2008, our regulatory capital ratios and those of our bank were in excess of the levels established for “well capitalized” institutions. To be “well capitalized” under the regulatory framework, the Tier 1 capital ratio must meet or exceed 6%, the total capital ratio must meet or exceed 10% and the leverage ratio must meet or exceed 5%. During the fourth quarter of 2008, our regulatory capital ratios and those of our bank fell below “well capitalized” levels, but remained in excess of levels established for “adequately capitalized” financial institutions under the regulatory framework for prompt corrective action. As of March 31, 2009 and throughout the remainder of 2009, our regulatory capital ratios returned to “well capitalized.” As of December 31, 2009, our Tier 1 capital ratio was 10.22%, our total capital ratio was 12.18%, and our leverage ratio was 7.60%.
Management believes that a strong capital position is necessary to take advantage of opportunities for profitable expansion of product and market share and to provide depositor and investor confidence. Our capital level must be maintained at an appropriate level to provide the opportunity for an adequate return on the capital employed. Management actively reviews our capital strategies to ensure that capital levels are appropriate based on the perceived business risks, further growth opportunities, industry standards, and regulatory requirements.
41
Table 20: Selected Quarterly Financial Data
The following is selected financial data summarizing the results of operations for each quarter in the years ended December 31, 2009 and 2008:
|
|
|
|
|
|
|
|
|
|
|
|
|
|
|
|
|
|
2009 Quarter Ended |
|
||||||||||
|
|
|
March 31 |
|
June 30 |
|
September 30 |
|
December 31 |
|
||||
|
|
|
(In thousands, except per share data) |
|
||||||||||
|
Interest income |
|
$ |
12,513 |
|
$ |
11,580 |
|
$ |
11,829 |
|
$ |
11,547 |
|
|
Interest expense |
|
|
5,075 |
|
|
4,814 |
|
|
4,411 |
|
|
3,959 |
|
|
Net interest income |
|
|
7,438 |
|
|
6,766 |
|
|
7,418 |
|
|
7,588 |
|
|
Provision for loan losses |
|
|
1,200 |
|
|
1,200 |
|
|
1,200 |
|
|
2,900 |
|
|
Net interest income after PLL |
|
|
6,238 |
|
|
5,566 |
|
|
6,218 |
|
|
4,688 |
|
|
Non-interest income |
|
|
4,536 |
|
|
2,592 |
|
|
2,090 |
|
|
3,268 |
|
|
Non-interest expense |
|
|
7,427 |
|
|
7,815 |
|
|
7,429 |
|
|
7,310 |
|
|
Income before income tax expense |
|
|
3,347 |
|
|
344 |
|
|
879 |
|
|
646 |
|
|
Provision (benefit) for income tax |
|
|
1,065 |
|
|
(190 |
) |
|
44 |
|
|
(33 |
) |
|
Net income (loss) |
|
$ |
2,282 |
|
$ |
534 |
|
$ |
835 |
|
$ |
678 |
|
|
|
|
|
|
|
|
|
|
|
|
|
|
|
|
|
Basic earnings (loss) per share |
|
$ |
0.29 |
|
$ |
0.07 |
|
$ |
0.11 |
|
$ |
0.09 |
|
|
Diluted earnings (loss) per share |
|
$ |
0.29 |
|
$ |
0.07 |
|
$ |
0.11 |
|
$ |
0.09 |
|
|
|
|
|
|
|
|
|
|
|
|
|
|
|
|
|
|
|
2008 Quarter Ended |
|
||||||||||
|
|
|
March 31 |
|
June 30 |
|
September 30 |
|
December 31 |
|
||||
|
|
|
(In thousands, except per share data) |
|
||||||||||
|
Interest income |
|
$ |
15,607 |
|
$ |
14,302 |
|
$ |
13,947 |
|
$ |
13,420 |
|
|
Interest expense |
|
|
8,404 |
|
|
7,115 |
|
|
6,628 |
|
|
6,080 |
|
|
Net interest income |
|
|
7,203 |
|
|
7,187 |
|
|
7,319 |
|
|
7,340 |
|
|
Provision for loan losses |
|
|
300 |
|
|
861 |
|
|
3,200 |
|
|
13,600 |
|
|
Net interest income after PLL |
|
|
6,903 |
|
|
6,326 |
|
|
4,119 |
|
|
(6,260 |
) |
|
Non-interest income |
|
|
2,315 |
|
|
2,199 |
|
|
2,102 |
|
|
2,641 |
|
|
Non-interest expense |
|
|
7,842 |
|
|
9,014 |
|
|
8,712 |
|
|
12,454 |
|
|
Income before income tax expense |
|
|
1,376 |
|
|
(489 |
) |
|
(2,491 |
) |
|
(16,073 |
) |
|
Provision for income tax |
|
|
211 |
|
|
(584 |
) |
|
(1,317 |
) |
|
(6,170 |
) |
|
Net income |
|
$ |
1,165 |
|
$ |
95 |
|
$ |
(1,174 |
) |
$ |
(9,903 |
) |
|
|
|
|
|
|
|
|
|
|
|
|
|
|
|
|
Basic earnings per share |
|
$ |
0.15 |
|
$ |
0.01 |
|
$ |
(0.15 |
) |
$ |
(1.25 |
) |
|
Diluted earnings per share |
|
$ |
0.15 |
|
$ |
0.01 |
|
$ |
(0.15 |
) |
$ |
(1.25 |
) |
Recent Accounting Pronouncements
See Note 1 to the Notes to Consolidated Financial Statements titled “Effects of Newly Issued But Not Yet Effective Accounting Standards” for additional detail.
42
ITEM 7A. QUANTITATIVE AND QUALITATIVE DISCLOSURE ABOUT MARKET RISK.
Interest Rate Sensitivity Management
Our business and the composition of our consolidated balance sheet consist of investments in interest-earning assets (including loans and securities) which are primarily funded by interest-bearing liabilities (deposits and borrowings). We maintain all of our financial instruments for non-trading purposes. Such financial instruments have varying levels of sensitivity to changes in market rates of interest. Our operating income and net income depends, to a substantial extent, on “rate spread” (i.e., the differences between the income we receive from loans, securities, and other earning assets and the interest expense we pay to obtain deposits and other liabilities). These rates are highly sensitive to many factors that are beyond our control, including general economic conditions and the policies of various governmental and regulatory authorities.
We measure our overall interest rate sensitivity through a net interest income analysis. The net interest income analysis measures the changes in net interest income in the event of hypothetical changes in interest rates. This analysis assesses the risk of changes in net interest income in the event of an immediate and sustained 100 and 200 bps increases in market interest rates or a 100 and 200 bps decrease in market rates. The interest rates scenarios are used for analytical purposes and do not necessarily represent management’s view of future market movements. The tables below present our projected changes in net interest income for 2010 based on financial data at December 31, 2009, for the various rate shock levels indicated.
Table 19: Net Interest Income Sensitivity Analysis
|
|
|
|
|
|
|
|
|
|
|
|
|
|
|
Potential impact on 2010 consolidated net interest income |
|
Net Interest Income |
|
|||||||||
|
|
|
Amount |
|
Potential
Change in Net |
|
Potential
Change in Net |
|
|||||
|
|
|
(Dollars in thousands) |
|
|||||||||
|
+ 200 bps |
|
$ |
29,388 |
|
|
$ |
398 |
|
|
1.4 |
% |
|
|
+ 100 bps |
|
$ |
29,453 |
|
|
$ |
463 |
|
|
1.6 |
% |
|
|
Base |
|
$ |
28,990 |
|
|
|
— |
|
|
— |
|
|
|
- 100 bps |
|
$ |
29,132 |
|
|
$ |
142 |
|
|
0.5 |
% |
|
|
- 200 bps |
|
$ |
28,110 |
|
|
($ |
878 |
) |
|
(3.0 |
%) |
|
Note: The table above may not be indicative of future results.
In order to limit exposure to interest rate risk, we have developed strategies to manage our liquidity, shorten the effective maturities of certain interest-earning assets, and increase the effective maturities of certain interest-bearing liabilities. The origination of floating rate loans such as business, construction and other prime or LIBOR-based loans is emphasized. The majority of fixed rate loans have re-pricing periods less than five years. The mix of floating and fixed rate assets is designed to mitigate the impact of rate changes on our net interest income. Virtually all fixed rate residential mortgage loans with maturities greater than five years are sold into the secondary market.
There can be no assurance that the results of operations would be impacted as indicated in the above table if interest rates did move by the amounts discussed above. Management continually reviews its interest risk position through its Asset/Liability Management Committee. Management’s philosophy is to maintain relatively matched rate sensitive asset and liability positions within the range described above in order to provide earnings stability in the event of significant interest rate changes.
ITEM 8. FINANCIAL STATEMENTS AND SUPPLEMENTARY DATA
Our Consolidated Financial Statements and notes to related statements thereto are set forth on the following pages.
43
REPORT BY BAYLAKE CORP.’S MANAGEMENT
ON INTERNAL CONTROL OVER FINANCIAL REPORTING
Our management is responsible for establishing and maintaining an effective system of internal control over financial reporting, as such term is defined in Exchange Act 13a-15(f). The Company’s system of internal control over financial reporting is designed to provide reasonable assurance regarding the reliability of financial reporting and the preparation of financial statements for external purposes in accordance with generally accepted accounting principles. There are inherent limitations in the effectiveness of any system of internal control over financial reporting, including the possibility of human error and circumvention or overriding of controls. Accordingly, even an effective system of internal control over financial reporting can provide only reasonable assurance with respect to financial statement preparation. Projections of any evaluation of effectiveness to future periods are subject to the risks that controls may become inadequate because of changes in conditions or that the degree of compliance with the policies or procedures may deteriorate.
Management assessed the Company’s systems of internal control over financial reporting as of December 31, 2009. This assessment was based on criteria for effective internal control over financial reporting described in Internal Control – Integrated Framework issued by the Committee of Sponsoring Organizations of the Treadway Commission. Based on this assessment, management believes that as of December 31, 2009, the Company maintained effective internal control over financial reporting based on those criteria.
The Company’s independent registered public accountants have issued an audit report on the effectiveness of the Company’s internal control over financial reporting.
BAYLAKE CORP.
March 15, 2010
44
REPORT OF INDEPENDENT REGISTERED PUBLIC ACCOUNTING FIRM
Board of
Directors and Shareholders
Baylake Corp.
Sturgeon Bay, Wisconsin
We have audited the accompanying consolidated balance sheets of Baylake Corp. (the “Company”) as of December 31, 2009 and 2008, and the related consolidated statements of operations, changes in stockholders’ equity and cash flows for the years then ended. We also have audited the Company’s internal control over financial reporting as of December 31, 2009, based on criteria established in Internal Control - Integrated Framework issued by the Committee of Sponsoring Organizations of the Treadway Commission (COSO). The Company’s management is responsible for these consolidated financial statements, for maintaining effective internal control over financial reporting, and for its assessment of the effectiveness of internal control over financial reporting in the accompanying Report by Baylake Corp.’s Management on Internal Control Over Financial Reporting. Our responsibility is to express an opinion on these consolidated financial statements and an opinion on the Company’s internal control over financial reporting based on our audits.
We conducted our audits in accordance with the standards of the Public Company Accounting Oversight Board (United States). Those standards require that we plan and perform the audits to obtain reasonable assurance about whether the consolidated financial statements are free of material misstatement and whether effective internal control over financial reporting was maintained in all material respects. Our audit of the consolidated financial statements included examining, on a test basis, evidence supporting the amounts and disclosures in the consolidated financial statements, assessing the accounting principles used and significant estimates made by management, and evaluating the overall consolidated financial statement presentation. Our audit of internal control over financial reporting included obtaining an understanding of internal control over financial reporting, assessing the risk that a material weakness exists, and testing and evaluating the design and operating effectiveness of internal control based on the assessed risk. Our audits also included performing such other procedures as we considered necessary in the circumstances. We believe that our audits provide a reasonable basis for our opinions.
A company’s internal control over financial reporting is a process designed to provide reasonable assurance regarding the reliability of financial reporting and the preparation of financial statements for external purposes in accordance with generally accepted accounting principles. A company’s internal control over financial reporting includes those policies and procedures that (1) pertain to the maintenance of records that, in reasonable detail, accurately and fairly reflect the transactions and dispositions of the assets of the company; (2) provide reasonable assurance that transactions are recorded as necessary to permit preparation of financial statements in accordance with generally accepted accounting principles, and that receipts and expenditures of the company are being made only in accordance with authorizations of management and directors of the company; and (3) provide reasonable assurance regarding prevention or timely detection of unauthorized acquisition, use, or disposition of the company’s assets that could have a material effect on the financial statements.
Because of its inherent limitations, internal control over financial reporting may not prevent or detect misstatements. Also, projections of any evaluation of effectiveness to future periods are subject to the risk that controls may become inadequate because of changes in conditions, or that the degree of compliance with the policies or procedures may deteriorate.
In our opinion, the consolidated financial statements referred to above present fairly, in all material respects, the consolidated financial position of Baylake Corp. as of December 31, 2009 and 2008, and the results of its operations, changes in stockholders’ equity and its cash flows for the years then ended, in conformity with accounting principles generally accepted in the United States of America. Also in our opinion, the Company maintained, in all material respects, effective internal control over financial reporting as of December 31, 2009, based on criteria established in COSO.
/s/ Baker Tilly Virchow Krause, LLP
Baker Tilly Virchow Krause, LLP
Milwaukee, Wisconsin
March 15, 2010
45
REPORT OF INDEPENDENT REGISTERED PUBLIC ACCOUNTING FIRM
Board of Directors and Shareholders
Baylake Corp.
Sturgeon Bay, Wisconsin
We have audited the accompanying consolidated statement of operations, changes in stockholders’ equity and cash flows for the year ended December 31, 2007 of Baylake Corp. These financial statements are the responsibility of the Company’s management. Our responsibility is to express an opinion on these financial statements based on our audit.
We conducted our audit in accordance with the standards of the Public Company Accounting Oversight Board (United States). Those standards require that we plan and perform the audit to obtain reasonable assurance about whether the financial statements are free of material misstatement. An audit includes examining, on a test basis, evidence supporting the amounts and disclosures in the financial statements. An audit also includes assessing the accounting principles used and significant estimates made by management, as well as evaluating the overall financial statement presentation. We believe that our audit provides a reasonable basis for our opinion.
In our opinion, the consolidated financial statements referred to above present fairly, in all material respects, the results of its operations and cash flows for the year ended December 31, 2007, in conformity with accounting principles generally accepted in the United States of America.
As discussed in Note 1 to the consolidated financial statements, the Company adopted new accounting guidance for uncertainty in income taxes and mortgage servicing assets.
Crowe Horwath LLP
Oak Brook, Illinois
March 29, 2008
46
|
|
|
BAYLAKE CORP. |
|
CONSOLIDATED BALANCE SHEETS |
|
December 31, 2009 and 2008 |
|
(Dollar amounts in thousands, except per share data) |
|
|
|
|
|
|
|
|
|
|
|
|
|
|
2009 |
|
2008 |
|
||
|
ASSETS |
|
|
|
|
|
|
|
|
Cash and due from financial institutions |
|
$ |
86,442 |
|
$ |
23,085 |
|
|
Federal funds sold |
|
|
84 |
|
|
397 |
|
|
Securities available for sale |
|
|
204,834 |
|
|
225,417 |
|
|
Loans held for sale |
|
|
2,567 |
|
|
368 |
|
|
Loans, net of allowance of $9,600 and $13,561 |
|
|
642,294 |
|
|
715,161 |
|
|
Cash value of life insurance |
|
|
24,062 |
|
|
23,435 |
|
|
Premises and equipment, net |
|
|
23,523 |
|
|
24,451 |
|
|
Federal Home Loan Bank stock |
|
|
6,792 |
|
|
6,792 |
|
|
Foreclosed properties, net |
|
|
14,995 |
|
|
7,143 |
|
|
Goodwill |
|
|
6,108 |
|
|
6,108 |
|
|
Deferred income taxes |
|
|
8,856 |
|
|
13,501 |
|
|
Accrued interest receivable |
|
|
3,376 |
|
|
3,968 |
|
|
Other assets |
|
|
20,524 |
|
|
13,087 |
|
|
|
|
|
|
|
|
|
|
|
Total assets |
|
$ |
1,044,457 |
|
$ |
1,062,913 |
|
|
|
|
|
|
|
|
|
|
|
LIABILITIES AND STOCKHOLDERS’ EQUITY |
|
|
|
|
|
|
|
|
Deposits |
|
|
|
|
|
|
|
|
Non-interest-bearing |
|
$ |
81,336 |
|
$ |
73,537 |
|
|
Interest-bearing |
|
|
750,293 |
|
|
776,221 |
|
|
Total deposits |
|
|
831,629 |
|
|
849,758 |
|
|
|
|
|
|
|
|
|
|
|
Federal Home Loan Bank advances |
|
|
85,000 |
|
|
85,095 |
|
|
Federal funds purchased and repurchase agreements |
|
|
21,122 |
|
|
30,174 |
|
|
Subordinated debentures |
|
|
16,100 |
|
|
16,100 |
|
|
Convertible promissory notes |
|
|
5,350 |
|
|
— |
|
|
Accrued expenses and other liabilities |
|
|
10,658 |
|
|
12,832 |
|
|
Total liabilities |
|
|
969,859 |
|
|
993,959 |
|
|
|
|
|
|
|
|
|
|
|
Commitments and Contingencies (Note 15) |
|
|
|
|
|
|
|
|
Common stock, $5 par value, authorized 50,000,000; issued-8,132,552 shares in 2009 and 2008, outstanding-7,911,539 shares in 2009 and 2008. |
|
|
40,662 |
|
|
40,662 |
|
|
Additional paid-in capital |
|
|
11,979 |
|
|
11,977 |
|
|
Retained earnings |
|
|
25,828 |
|
|
21,499 |
|
|
Treasury stock (221,013 shares in 2009 and 2008) |
|
|
(3,549 |
) |
|
(3,549 |
) |
|
Accumulated other comprehensive loss |
|
|
(322 |
) |
|
(1,635 |
) |
|
Total stockholders’ equity |
|
|
74,598 |
|
|
68,954 |
|
|
|
|
|
|
|
|
|
|
|
Total liabilities and stockholders’ equity |
|
$ |
1,044,457 |
|
$ |
1,062,913 |
|
See accompanying notes to the consolidated financial statements.
47
|
|
|
BAYLAKE CORP. CONSOLIDATED STATEMENTS OF OPERATIONS |
|
Years ended December 31, 2009, 2008, and 2007 |
|
(Dollar amounts in thousands, except per share data) |
|
|
|
|
|
|
|
|
|
|
|
|
|
|
|
|
|
2009 |
|
2008 |
|
2007 |
|
|||
|
Interest and dividend income |
|
|
|
|
|
|
|
|
|
|
|
Loans, including fees |
|
$ |
38,698 |
|
$ |
46,304 |
|
$ |
60,727 |
|
|
Taxable securities |
|
|
7,020 |
|
|
8,523 |
|
|
6,495 |
|
|
Tax exempt securities |
|
|
1,635 |
|
|
2,223 |
|
|
2,128 |
|
|
Federal funds sold and other |
|
|
115 |
|
|
226 |
|
|
318 |
|
|
Total interest and dividend income |
|
|
47,468 |
|
|
57,276 |
|
|
69,668 |
|
|
Interest expense |
|
|
|
|
|
|
|
|
|
|
|
Deposits |
|
|
15,292 |
|
|
23,861 |
|
|
31,930 |
|
|
Federal funds purchased and repurchase agreements |
|
|
166 |
|
|
781 |
|
|
884 |
|
|
Federal Home Loan Bank advances and other debt |
|
|
2,272 |
|
|
2,791 |
|
|
4,850 |
|
|
Subordinated debentures |
|
|
365 |
|
|
794 |
|
|
1,089 |
|
|
Convertible promissory notes |
|
|
164 |
|
|
— |
|
|
— |
|
|
Total interest expense |
|
|
18,259 |
|
|
28,227 |
|
|
38,753 |
|
|
|
|
|
|
|
|
|
|
|
|
|
|
Net interest income |
|
|
29,209 |
|
|
29,049 |
|
|
30,915 |
|
|
|
|
|
|
|
|
|
|
|
|
|
|
Provision for loan losses |
|
|
6,500 |
|
|
17,961 |
|
|
9,761 |
|
|
|
|
|
|
|
|
|
|
|
|
|
|
Net interest income after provision for loan losses |
|
|
22,709 |
|
|
11,088 |
|
|
21,154 |
|
|
Non-interest income |
|
|
|
|
|
|
|
|
|
|
|
Fees from fiduciary activities |
|
|
634 |
|
|
756 |
|
|
956 |
|
|
Fees from loan servicing |
|
|
720 |
|
|
720 |
|
|
1,019 |
|
|
Deposits, fees, and charges |
|
|
5,171 |
|
|
5,673 |
|
|
5,253 |
|
|
Gains from sales of loans |
|
|
988 |
|
|
325 |
|
|
630 |
|
|
Net decrease in valuation of mortgage servicing rights |
|
|
(359 |
) |
|
(535 |
) |
|
(595 |
) |
|
Net gains from sale of securities |
|
|
4,163 |
|
|
765 |
|
|
352 |
|
|
Net gains (losses) from sale and disposal of premises and equipment |
|
|
2 |
|
|
39 |
|
|
(7 |
) |
|
Net change in cash surrender value of life insurance |
|
|
627 |
|
|
31 |
|
|
863 |
|
|
Income in equity of UFS subsidiary |
|
|
462 |
|
|
830 |
|
|
556 |
|
|
Other income |
|
|
77 |
|
|
653 |
|
|
147 |
|
|
Total non-interest income |
|
|
12,485 |
|
|
9,257 |
|
|
9,174 |
|
|
Non-interest expenses |
|
|
|
|
|
|
|
|
|
|
|
Salaries and employee benefits |
|
|
16,151 |
|
|
16,353 |
|
|
18,662 |
|
|
Occupancy expense |
|
|
2,452 |
|
|
2,471 |
|
|
2,456 |
|
|
Equipment expense |
|
|
1,396 |
|
|
1,372 |
|
|
1,517 |
|
|
Data processing and courier |
|
|
962 |
|
|
1,210 |
|
|
1,299 |
|
|
FDIC insurance expense |
|
|
2,334 |
|
|
902 |
|
|
504 |
|
|
Operation of other real estate |
|
|
1,177 |
|
|
4,194 |
|
|
1,134 |
|
|
Provision for impairment of standby letters of credit |
|
|
20 |
|
|
2,539 |
|
|
— |
|
|
Other than temporary impairment of securities |
|
|
— |
|
|
1,900 |
|
|
— |
|
|
Loan and collection expense |
|
|
659 |
|
|
1,185 |
|
|
1,006 |
|
|
Other outside services |
|
|
703 |
|
|
988 |
|
|
1,104 |
|
|
Other operating expenses |
|
|
4,124 |
|
|
5,810 |
|
|
5,400 |
|
|
Total non-interest expenses |
|
|
29,978 |
|
|
38,022 |
|
|
32,578 |
|
|
Income (loss) before provision for income taxes |
|
|
5,216 |
|
|
(17,677 |
) |
|
(2,250 |
) |
|
Provision for (benefit from) income taxes |
|
|
887 |
|
|
(7,860 |
) |
|
(2,416 |
) |
|
|
|
|
|
|
|
|
|
|
|
|
|
Net income (loss) |
|
$ |
4,329 |
|
$ |
(9,817 |
) |
$ |
166 |
|
|
|
|
|
|
|
|
|
|
|
|
|
|
Basic earnings (loss) per common share |
|
$ |
0.55 |
|
$ |
(1.24 |
) |
$ |
0.02 |
|
|
Diluted earnings (loss) per common share |
|
$ |
0.55 |
|
$ |
(1.24 |
) |
$ |
0.02 |
|
See accompanying notes to the consolidated financial statements.
48
|
|
|
BAYLAKE CORP. |
|
CONSOLIDATED STATEMENTS OF CHANGES IN STOCKHOLDERS’ EQUITY |
|
Years ended December 31, 2009, 2008, and 2007 |
|
(Dollar amounts in thousands, except per share data) |
|
|
|
|
|
|
|
|
|
|
|
|
|
|
|
|
|
|
|
|
|
|
|
|
|
|
|
|
|
|
|
|
|
|
|
|
|
Accumulated |
|
Total |
|
|||||||||
|
|
|
|
|
Additional |
|
Retained |
|
Treasury |
|
|
|
|||||||||||
|
|
|
Common Stock |
|
|
|
|
|
|
||||||||||||||
|
|
|
Shares |
|
Amount |
|
|
|
|
|
|
||||||||||||
|
|
|
|
|
|
|
|
|
|
|
|
|
|
|
|
|
|
|
|
|
|
|
|
|
Balance, January 1, 2007 |
|
|
7,830,141 |
|
$ |
39,611 |
|
$ |
10,403 |
|
$ |
35,134 |
|
$ |
(1,726 |
) |
$ |
(1,229 |
) |
$ |
82,193 |
|
|
|
|
|
|
|
|
|
|
|
|
|
|
|
|
|
|
|
|
|
|
|
|
|
|
Net income for the year |
|
|
— |
|
|
— |
|
|
— |
|
|
166 |
|
|
— |
|
|
— |
|
|
166 |
|
|
Net changes in unrealized gain on securities available for sale, net of ($723) deferred taxes |
|
|
— |
|
|
— |
|
|
— |
|
|
— |
|
|
— |
|
|
1,314 |
|
|
1,314 |
|
|
Total comprehensive income |
|
|
|
|
|
|
|
|
|
|
|
|
|
|
|
|
|
|
|
|
1,480 |
|
|
Stock compensation expense recognized, net of $8 deferred taxes |
|
|
— |
|
|
— |
|
|
21 |
|
|
— |
|
|
— |
|
|
— |
|
|
21 |
|
|
Stock options exercised |
|
|
110,005 |
|
|
551 |
|
|
634 |
|
|
— |
|
|
— |
|
|
— |
|
|
1,185 |
|
|
UFS stock options exercised |
|
|
— |
|
|
— |
|
|
— |
|
|
(50 |
) |
|
— |
|
|
— |
|
|
(50 |
) |
|
Common stock issued under dividend reinvestment plan |
|
|
78,814 |
|
|
373 |
|
|
723 |
|
|
— |
|
|
— |
|
|
— |
|
|
1,096 |
|
|
Treasury stock repurchases |
|
|
(129,000 |
) |
|
— |
|
|
— |
|
|
|
|
|
(1,823 |
) |
|
— |
|
|
(1,823 |
) |
|
|
|
|
|
|
|
|
|
|
|
|
|
|
|
|
|
|
|
|
|
|
|
|
|
Tax benefit from exercise of stock options |
|
|
— |
|
|
— |
|
|
94 |
|
|
— |
|
|
— |
|
|
— |
|
|
94 |
|
|
Cumulative effect adjustments |
|
|
|
|
|
|
|
|
|
|
|
|
|
|
|
|
|
|
|
|
|
|
|
|
|
|
|
|
|
|
|
|
|
|
|
|
|
|
|
|
|
|
|
|
|
|
|
Adjustment for adoption of new accounting guidance for uncertainty in income taxes |
|
|
— |
|
|
— |
|
|
— |
|
|
980 |
|
|
— |
|
|
— |
|
|
980 |
|
|
Adjustment for adoption of new accounting guidance for mortgage servicing assets, net of $74 tax |
|
|
|
|
|
|
|
|
|
|
|
117 |
|
|
|
|
|
|
|
|
117 |
|
|
Cash dividends declared ($.64 per share) |
|
|
— |
|
|
— |
|
|
— |
|
|
(5,031 |
) |
|
— |
|
|
— |
|
|
(5,031 |
) |
|
|
||||||||||||||||||||||
|
Balance, December 31, 2007 |
|
|
7,885,960 |
|
|
40,535 |
|
|
11,875 |
|
|
31,316 |
|
|
(3,549 |
) |
|
85 |
|
$ |
80,262 |
|
|
|
|
|
|
|
|
|
|
|
|
|
|
|
|
|
|
|
|
|
|
|
|
|
|
Net loss for the year |
|
|
— |
|
|
— |
|
|
— |
|
|
(9,817 |
) |
|
— |
|
|
— |
|
|
(9,817 |
) |
|
Net changes in unrealized gain on securities available for sale, net of ($1,237) deferred taxes |
|
|
— |
|
|
— |
|
|
— |
|
|
— |
|
|
— |
|
|
(4,092 |
) |
|
(4,092 |
) |
|
Reclassification adjustment for net gains realized in income |
|
|
|
|
|
|
|
|
|
|
|
|
|
|
|
|
|
(765 |
) |
|
(765 |
) |
|
Reclassification adjustment for other than temporary impairment realized in income |
|
|
|
|
|
|
|
|
|
|
|
|
|
|
|
|
|
1,900 |
|
|
1,900 |
|
|
Tax effect |
|
|
|
|
|
|
|
|
|
|
|
|
|
|
|
|
|
1,237 |
|
|
1,237 |
|
|
Total comprehensive loss |
|
|
|
|
|
|
|
|
|
|
|
|
|
|
|
|
|
|
|
|
(11,537 |
) |
|
Stock compensation expense recognized, net of $8 deferred taxes |
|
|
— |
|
|
— |
|
|
(36 |
) |
|
— |
|
|
— |
|
|
— |
|
|
(36 |
) |
|
Common stock issued under Dividend Reinvestment Plan |
|
|
25,579 |
|
|
127 |
|
|
138 |
|
|
— |
|
|
— |
|
|
— |
|
|
265 |
|
|
|
|
|
|
|
|
|
|
|
|
|
|
|
|
|
|
|
|
|
|
|
|
|
|
Balance, December 31, 2008 |
|
|
7,911,539 |
|
$ |
40,662 |
|
$ |
11,977 |
|
$ |
21,499 |
|
$ |
(3,549 |
) |
$ |
(1,635 |
) |
$ |
68,954 |
|
|
|
|
|
|
|
|
|
|
|
|
|
|
|
|
|
|
|
|
|
|
|
|
|
|
Net income for the year |
|
|
— |
|
|
— |
|
|
— |
|
|
4,329 |
|
|
— |
|
|
— |
|
|
4,329 |
|
|
Changes in unrealized loss on securities available for sale |
|
|
— |
|
|
— |
|
|
— |
|
|
— |
|
|
— |
|
|
6,359 |
|
|
6,359 |
|
|
Reclassification adjustment for net gains realized in income |
|
|
|
|
|
|
|
|
|
|
|
|
|
|
|
|
|
(4,163 |
) |
|
(4,163 |
) |
|
Tax effect |
|
|
|
|
|
|
|
|
|
|
|
|
|
|
|
|
|
(883 |
) |
|
(883 |
) |
|
|
||||||||||||||||||||||
|
Total comprehensive loss |
|
|
|
|
|
|
|
|
|
|
|
|
|
|
|
|
|
|
|
|
5,642 |
|
|
Stock compensation expense recognized, net of deferred tax |
|
|
— |
|
|
— |
|
|
2 |
|
|
— |
|
|
— |
|
|
— |
|
|
2 |
|
|
|
|
|
|
|
|
|
|
|
|
|
|
|
|
|
|
|
|
|
|
|
|
|
|
Balance, December 31, 2009 |
|
|
7,911,539 |
|
$ |
40,662 |
|
$ |
11,979 |
|
$ |
25,828 |
|
$ |
(3,549 |
) |
$ |
(322 |
) |
$ |
74,598 |
|
See accompanying notes to the consolidated financial statements.
49
|
|
|
CONSOLIDATED STATEMENTS OF CASH FLOWS |
|
Years ended December 31, 2009, 2008, and 2007 |
|
(Dollar amounts in thousands) |
|
|
|
|
|
|
|
|
|
|
|
|
|
|
|
|
|
2009 |
|
2008 |
|
2007 |
|
|||
|
Cash flows from operating activities: |
|
|
|
|
|
|
|
|
|
|
|
Reconciliation of net income (loss) to net cash provided by operating activities: |
|
|
|
|
|
|
|
|
|
|
|
Net income (loss) |
|
$ |
4,329 |
|
$ |
(9,817 |
) |
$ |
166 |
|
|
Adjustments to reconcile net income (loss) to net cash provided to operating activities: |
|
|
|
|
|
|
|
|
|
|
|
Depreciation and amortization |
|
|
1,391 |
|
|
1,394 |
|
|
1,534 |
|
|
Amortization of debt issuance costs |
|
|
12 |
|
|
— |
|
|
— |
|
|
Amortization of core deposit intangible |
|
|
52 |
|
|
52 |
|
|
52 |
|
|
Provision for losses on loans |
|
|
6,500 |
|
|
17,961 |
|
|
9,761 |
|
|
Provision for impairment of letters of credit |
|
|
20 |
|
|
2,539 |
|
|
— |
|
|
Other than temporary impairment of securities |
|
|
— |
|
|
1,900 |
|
|
— |
|
|
Net amortization of premium/discount on securities |
|
|
1,374 |
|
|
(124 |
) |
|
112 |
|
|
Net increase in cash surrender value of life insurance |
|
|
(627 |
) |
|
(31 |
) |
|
(863 |
) |
|
Net realized gain on sale of securities |
|
|
(4,163 |
) |
|
(765 |
) |
|
(352 |
) |
|
Net gain on sale of loans |
|
|
(988 |
) |
|
(325 |
) |
|
(630 |
) |
|
Proceeds from sale of loans held for sale |
|
|
84,188 |
|
|
24,737 |
|
|
42,976 |
|
|
Origination of loans held for sale |
|
|
(85,507 |
) |
|
(24,068 |
) |
|
(42,198 |
) |
|
Net decrease in valuation of mortgage servicing rights |
|
|
359 |
|
|
535 |
|
|
595 |
|
|
Provision for valuation allowance on foreclosed properties |
|
|
678 |
|
|
3,610 |
|
|
133 |
|
|
Net (gain) loss from sale and disposal of premises and equipment |
|
|
(2 |
) |
|
(39 |
) |
|
7 |
|
|
Net (gain) loss from disposal of foreclosed properties |
|
|
(108 |
) |
|
119 |
|
|
232 |
|
|
Provision (benefit) from deferred tax expense |
|
|
3,760 |
|
|
(5,926 |
) |
|
(2,205 |
) |
|
Stock option compensation expense recognized |
|
|
2 |
|
|
(44 |
) |
|
21 |
|
|
Income in equity of UFS subsidiary |
|
|
(462 |
) |
|
(830 |
) |
|
(556 |
) |
|
Tax benefit (expense) from exercise/forfeiture of stock options |
|
|
— |
|
|
8 |
|
|
(94 |
) |
|
Prepaid FDIC assessment |
|
|
(6,658 |
) |
|
— |
|
|
— |
|
|
Changes in assets and liabilities: |
|
|
|
|
|
|
|
|
|
|
|
Accrued interest receivable and other assets |
|
|
(615 |
) |
|
(1,199 |
) |
|
(454 |
) |
|
Accrued expenses and other liabilities |
|
|
(2,194 |
) |
|
(2,168 |
) |
|
(1,048 |
) |
|
Net cash provided by operating activities |
|
|
1,341 |
|
|
7,519 |
|
|
7,189 |
|
|
|
|
|
|
|
|
|
|
|
|
|
|
Cash flows from investing activities: |
|
|
|
|
|
|
|
|
|
|
|
Proceeds from sale of securities available-for-sale |
|
|
206,529 |
|
|
56,089 |
|
|
34,479 |
|
|
Principal payments on securities available-for-sale |
|
|
113,714 |
|
|
28,760 |
|
|
26,454 |
|
|
Purchase of securities available-for-sale |
|
|
(294,675 |
) |
|
(91,759 |
) |
|
(92,816 |
) |
|
Proceeds from sale of foreclosed properties |
|
|
3,775 |
|
|
2,623 |
|
|
6,160 |
|
|
Proceeds from sale of premises and equipment |
|
|
14 |
|
|
97 |
|
|
— |
|
|
Loan originations and payments, net |
|
|
54,171 |
|
|
6,920 |
|
|
47,447 |
|
|
Additions to premises and equipment |
|
|
(475 |
) |
|
(639 |
) |
|
(406 |
) |
|
Proceeds from life insurance death benefit |
|
|
|
|
|
— |
|
|
2,431 |
|
|
Net change in federal funds sold |
|
|
313 |
|
|
(397 |
) |
|
— |
|
|
Investment in bank-owned life insurance |
|
|
— |
|
|
— |
|
|
(732 |
) |
|
Dividend from UFS subsidiary |
|
|
750 |
|
|
— |
|
|
— |
|
|
Net cash provided by investing activities |
|
|
84,116 |
|
|
1,694 |
|
|
23,017 |
|
See accompanying notes to the consolidated financial statements.
50
|
|
|
BAYLAKE CORP. |
|
CONSOLIDATED STATEMENTS OF CASH FLOWS |
|
Years ended December 31, 2009, 2008, and 2007 |
|
(Dollar amounts in thousands) |
|
|
|
|
|
|
|
|
|
|
|
|
|
|
|
|
|
2009 |
|
2008 |
|
2007 |
|
|||
|
Cash flows from financing activities: |
|
|
|
|
|
|
|
|
|
|
|
Net change in deposits |
|
$ |
(18,129 |
) |
$ |
(34,427 |
) |
$ |
5,274 |
|
|
Net change in federal funds purchased and repurchase agreements |
|
|
(9,052 |
) |
|
3,000 |
|
|
22,694 |
|
|
Proceeds from Federal Home Loan Bank advances |
|
|
20,000 |
|
|
85,000 |
|
|
50,000 |
|
|
Repayments on Federal Home Loan Bank advances |
|
|
(20,095 |
) |
|
(85,077 |
) |
|
(80,007 |
) |
|
Proceeds from issuance of convertible promissory notes |
|
|
5,350 |
|
|
— |
|
|
— |
|
|
Debit issuance costs |
|
|
(174 |
) |
|
— |
|
|
— |
|
|
Proceeds from exercise of stock options |
|
|
— |
|
|
— |
|
|
1,184 |
|
|
Tax benefit (expense) from exercise/forfeiture of options |
|
|
— |
|
|
(8 |
) |
|
94 |
|
|
Treasury stock repurchases |
|
|
— |
|
|
— |
|
|
(1,823 |
) |
|
Dividend reinvestment plan |
|
|
— |
|
|
265 |
|
|
1,096 |
|
|
Cash dividends paid |
|
|
— |
|
|
(1,262 |
) |
|
(5,022 |
) |
|
Net cash provided by (used in) financing activities |
|
|
(22,100 |
) |
|
(32,509 |
) |
|
(6,510 |
) |
|
|
|
|
|
|
|
|
|
|
|
|
|
Net change in cash and cash equivalents |
|
|
63,357 |
|
|
(23,296 |
) |
|
23,696 |
|
|
|
|
|
|
|
|
|
|
|
|
|
|
Beginning cash and cash equivalents |
|
|
23,085 |
|
|
46,381 |
|
|
22,685 |
|
|
|
|
|
|
|
|
|
|
|
|
|
|
Ending cash and cash equivalents |
|
$ |
86,442 |
|
$ |
23,085 |
|
$ |
46,381 |
|
|
|
|
|
|
|
|
|
|
|
|
|
|
Supplemental cash flow information: |
|
|
|
|
|
|
|
|
|
|
|
Interest paid |
|
$ |
15,268 |
|
$ |
30,119 |
|
$ |
38,511 |
|
|
Income taxes paid |
|
|
— |
|
|
47 |
|
|
1,589 |
|
|
|
|
|
|
|
|
|
|
|
|
|
|
Supplemental noncash disclosures: |
|
|
|
|
|
|
|
|
|
|
|
Transfers from loans to foreclosed properties |
|
$ |
12,196 |
|
$ |
8,328 |
|
$ |
5,932 |
|
|
Mortgage servicing rights resulting from sale of loans |
|
|
108 |
|
|
29 |
|
|
116 |
|
|
Transfer of premises to premises held for sale |
|
|
— |
|
|
1,357 |
|
|
— |
|
See accompanying notes to the consolidated financial statements.
51
|
|
|
BAYLAKE CORP. |
|
NOTES TO CONSOLIDATED FINANCIAL STATEMENTS |
|
December 31, 2009, 2008 and 2007 |
|
(Dollar amounts in thousands) |
NOTE 1 - NATURE OF BUSINESS AND SUMMARY OF SIGNIFICANT ACCOUNTING POLICIES
The consolidated financial statements of Baylake Corp. (the Company) include the accounts of the Company, its wholly owned subsidiary Baylake Bank, (the Bank), and the Bank’s wholly owned subsidiaries: Baylake Investments, Inc., Baylake Insurance Agency, Inc., and Baylake City Center LLC. All significant intercompany items and transactions have been eliminated.
The Bank owns a 49.8% interest (500 shares) in United Financial Services, Inc., (UFS) a data processing service. In addition to the ownership interest, UFS and the Company have a common member on each respective Board of Directors. The investment in this entity is carried under the equity method of accounting and the pro rata share of its income is included in other income. On June 27, 2006, UFS amended an earlier agreement for employment with a key employee of UFS allowing that individual the option to purchase up to 20%, or 240 shares, of the authorized shares of UFS. The option price is $1,000 per share less dividends or distributions to owners, or $843 as of December 31, 2009. The current book value of UFS is approximately $8,168 per share as of December 31, 2009. During 2007, options for 120 shares were exercised by the key employee. The exercise of all or a portion of the remaining options will have the effect of reducing the Company’s share of the future earnings and will not be a material impact to the carrying value of the asset on Baylake Bank’s consolidated balance sheet. Income in equity of UFS recognized by the Company was $462, $830, and $556 for the years ended 2009, 2008, and 2007, respectively. Amounts paid to UFS for data processing services by Baylake Bank were $1,020, $1,196, and $1,210 in 2009, 2008, and 2007, respectively.
Baylake Bank makes commercial, mortgage, and installment loans to customers substantially all of whom are located in Door, Brown, Kewaunee, Manitowoc, Waushara, Outagamie, Green Lake, and Waupaca Counties of Wisconsin. Although Baylake Bank has a diversified portfolio, a substantial portion of its debtors’ ability to honor their contracts is dependent upon the economic condition of the local tourism/recreation businesses, as well as the industrial, commercial and agricultural industries.
Use of Estimates: To prepare financial statements in conformity with U.S. generally accepted accounting principles, management makes estimates and assumptions based on available information. These estimates and assumptions affect the amounts reported in the consolidated financial statements and the disclosures provided, and actual results could differ. The allowance for loan losses, provision for letter of credit impairment loss, foreclosed assets, other than temporary impairment of securities, income tax expense, and fair values of financial instruments are particularly subject to change.
Cash Flows: Cash and cash equivalents include cash and deposits with other financial institutions. Net cash flows are reported for customer loan and deposit transactions, and federal funds purchased and repurchase agreements.
Securities: Debt securities are classified as available for sale when they might be sold before maturity. Equity securities with readily determinable fair values are classified as available for sale. Securities available for sale are carried at fair value, with unrealized holding gains and losses and losses deemed other-than-temporarily impaired due to non-credit issues are reported in other comprehensive income, net of tax. Unrealized losses deemed other-than-temporarily impaired due to credit issues are reported in operations. Interest income includes amortization of purchase premium or accretion of purchase discount. Premiums and discounts on securities are amortized on the level-yield method without anticipating prepayments. Gains and losses on sales are recorded on the trade date and determined using the specific identification method.
|
|
|
|
|
52 |
|
|
|
BAYLAKE CORP. |
|
NOTES TO CONSOLIDATED FINANCIAL STATEMENTS |
|
December 31, 2009, 2008 and 2007 |
|
(Dollar amounts in thousands) |
NOTE 1 – NATURE OF BUSINESS AND SUMMARY OF SIGNIFICANT ACCOUNTING POLICIES (Continued)
Declines in the fair value of securities below their cost that are other than temporary due to credit issues are reflected as “Other than temporary impairment of securities” in the statement of operations. In estimating other-than-temporary losses, management considers: (1) the length of time and extent that fair value has been less than cost, (2) the financial condition and near-term prospects of the issuer, and (3) the Company’s ability and intent to hold the security for a period sufficient to allow for any anticipated recovery in fair value. The difference between the present values of the cash flows expected to be collected and the amortized cost basis is the credit loss. The credit loss is the portion of the other-than-temporary impairment that is recognized in earnings and is a reduction to the cost basis of the security. The portion of other-than-temporary impairment related to all other factors is included in other comprehensive income (loss).
Federal Home Loan Bank (FHLB) stock: The Bank is a member of the FHLB system. Members are required to own a certain amount of stock based on the level of borrowings and other factors, and may invest in additional amounts. FHLB stock is carried at cost, classified as a restricted security, and periodically evaluated for impairment based on ultimate recovery of par value. The determination of whether a decline affects the ultimate recovery is influenced by criteria such as: 1) the significance of the decline in net assets of the FHLB as compared to the capital stock amount and length of time a decline has persisted; 2) impact of legislative and regulatory changes on the FHLB and 3) the liquidity position of the FHLB. Both cash and stock dividends are reported as income.
The Corporation reviewed recent SEC filings for FHLB operating performance, including its SEC Form 10-Q as of September 30, 2009 (and as amended February 16, 2010), as well as its 8-K filed on February 22, 2010 relating to its expected 2009 operating results. Based on the results of the review, no impairment has been recorded on these securities.
Loans Held for Sale: Mortgage loans originated and intended for sale in the secondary market are carried at the lower of aggregate cost or market, as determined by outstanding commitments from investors. Net unrealized losses, if any, are recorded as a valuation allowance and charged to earnings.
Mortgage loans held for sale may be sold with servicing rights retained. The carrying value of mortgage loans sold is reduced by the amount allocated to the servicing right at the time of sale. Gains and losses on sales of mortgage loans are based on the difference between the selling price and the carrying value of the related loan sold.
Loans: Loans that management has the intent and ability to hold for the foreseeable future or until maturity or payoff are reported at the principal balance outstanding, net of unearned interest, deferred loan fees and costs, and an allowance for loan losses. Interest income is accrued on the unpaid principal balance. Loan origination fees, net of certain direct origination costs, are deferred and recognized in interest income using the level-yield method without anticipating prepayments.
Interest income on mortgage and commercial loans is discontinued at the time the loan is 90 days delinquent. Past due status is based on the contractual terms of the loan. In all cases, loans are placed on nonaccrual or charged off at an earlier date if collection of principal or interest is considered doubtful.
All interest accrued but not received for loans placed on non-accrual is reversed against interest income. Interest received on such loans is accounted for on the cash-basis or cost-recovery method until qualifying for return to accrual. Loans are returned to accrual status when all the principal and interest amounts contractually due are brought current and future payments are reasonably assured.
|
|
|
|
|
53 |
|
|
|
BAYLAKE CORP. |
|
NOTES TO CONSOLIDATED FINANCIAL STATEMENTS |
|
December 31, 2009, 2008 and 2007 |
|
(Dollar amounts in thousands) |
NOTE 1 – NATURE OF BUSINESS AND SUMMARY OF SIGNIFICANT ACCOUNTING POLICIES (Continued)
Allowance for Loan Losses: The allowance for loan losses is a valuation allowance for probable and inherent credit losses. Loan losses are charged against the allowance when management believes the non-collectability of a loan balance is confirmed. Subsequent recoveries, if any, are credited to the allowance. Management estimates the allowance balance required using past loan loss experience, the nature and volume of the portfolio, information about specific borrower situations and estimated collateral values, economic conditions, and other factors. The allowance consists of specific and general components. The specific component relates to loans that are individually classified as impaired. The general component covers non-impaired loans and is based on historical loss experience adjusted for certain qualitative factors. The entire allowance is available for any loan that, in management’s judgment, should be charged-off.
A loan is impaired when full payment under the loan terms is not expected. Commercial and commercial real estate loans are individually evaluated for impairment. If a loan is impaired, a specific allowance is established so that the loan is reported, net, at the present value of estimated future cash flows using the loan’s existing rate or at the fair value of collateral if repayment is expected solely from the collateral. Large groups of smaller balance homogeneous loans, such as consumer and residential real estate loans are collectively evaluated for impairment, and accordingly, they are not separately identified for impairment disclosures.
Mortgage Servicing Rights: Mortgage servicing rights are recognized separately when they are acquired through sales of loans with servicing retained. For sales of loans prior to January 1, 2007, a portion of the cost of the loan was allocated to the mortgage servicing right based on relative fair values. For sales of loans beginning in 2007, the Company adopted new accounting guidance whereby mortgage servicing rights are initially recorded at fair value with the offsetting effect recorded as a reduction to gain/loss on sale of loans.
Prior to January 1, 2007, all mortgage servicing assets were measured using the amortization method which required servicing rights to be amortized into non-interest income in proportion to, and over the period of, the estimated future net servicing income of the underlying loans. Additionally, prior to January 1, 2007, mortgage servicing assets were evaluated for impairment based upon the fair value of the rights as compared to carrying amount. Impairment was determined by stratifying the underlying loans being serviced into groupings based on predominant risk characteristics, such as interest rate, loan type and investor type. Impairment was recognized through a valuation allowance for an individual grouping, to the extent that fair value was less than the carrying amount. If the Company later determined that all or a portion of the impairment no longer existed for a particular grouping, a reduction of the allowance may have been recorded as an increase to income.
Upon adoption of new accounting guidance, the Company elected to measure all classes of mortgage servicing assets at fair value resulting in a cumulative-effect adjustment increasing retained earnings by $117 as of January 1, 2007. Under the fair value measurement method, the Company measures fair value based on market prices for comparable servicing contracts, when available, or alternatively, based on a valuation model that calculates the present value of estimated future net servicing income. The valuation model incorporates assumptions that market participants would use in estimating future net servicing income, such as the cost to service, the discount rate, prepayment speeds and default rates and losses. The Company compares the valuation model inputs and results to published industry data in order to validate the model results and assumptions. Changes in fair value are indicated as net change in valuation of servicing rights on the consolidated statement of operations in the period in which change occurs. The fair values of mortgage servicing rights is subject to significant fluctuations as a result of changes in estimated and actual prepayment speeds and default rates and losses.
Loan servicing fee income, which is reported on the consolidated statement of operations as fees from loan servicing, is recorded for fees earned for servicing loans. The fees are based on a contractual percentage of the outstanding principal; or a fixed amount per loan and are recorded as income when earned. Loan servicing fees totaled $720, $720 and $1,019 for the years ended December 31, 2009, 2008 and 2007, respectively. Late fees and ancillary fees related to loan servicing are not material.
Mortgage servicing rights are carried in other assets on the consolidated balance sheet and amount to $609 and $860 on loans serviced for others totaling $78,167 and $93,617 at December 31 2009 and 2008, respectively. Capitalized servicing rights totaled $108, $29, and $116 during 2009, 2008, and 2007, respectively. The decrease in fair value of servicing rights recognized in income in 2009, 2008, and 2007 was $359, $535, and $595 respectively.
Bank Owned Life Insurance: The Company has purchased life insurance policies on certain key executives. Bank owned life insurance is recorded at the amount that can be realized under the insurance contract at the balance sheet date, which is the net cash surrender value.
|
|
|
|
|
54 |
|
|
|
BAYLAKE CORP. |
|
NOTES TO CONSOLIDATED FINANCIAL STATEMENTS |
|
December 31, 2009, 2008 and 2007 |
|
(Dollar amounts in thousands) |
NOTE 1 – NATURE OF BUSINESS AND SUMMARY OF SIGNIFICANT ACCOUNTING POLICIES (Continued)
Transfers of Financial Assets: Transfers of financial assets are accounted for as sales when control over the assets has been surrendered. Control over transferred assets is deemed to be surrendered when (1) the assets have been isolated from the Company, (2) the transferee obtains the right (free of conditions that constrain it from taking advantage of that right) to pledge or exchange the transferred assets, and (3) the Company does not maintain effective control over the transferred assets through an agreement to repurchase them before their maturity.
Foreclosed Properties: Assets acquired through or instead of loan foreclosure are initially recorded at the lower of carrying cost or fair value, less estimated costs to sell, establishing a new cost basis. If fair value declines subsequent to foreclosure, a valuation allowance is recorded through expense. Costs incurred after acquisition are expensed.
Premises, held for sale: Premises held for sale consist of development property in the Green Bay area and vacant land. Property held for sale is carried at the lower of cost or fair value.
Premises and Equipment: Land is carried at cost. Premises and equipment are stated at cost less accumulated depreciation. Buildings and related components are depreciated using the straight-line method with useful lives ranging from 5 to 40 years. Furniture, fixtures, and equipment are depreciated using the straight-line (or accelerated) method with useful lives ranging from 3 to 12 years.
Goodwill and Other Intangible Assets: Goodwill results from business acquisitions and represents the excess of the purchase price over the fair value of acquired tangible assets.
During 2009, in light of the decline in the trading price of the Company’s common stock relative to the net book value per common share, the Company, with the assistance of a third party valuation firm, determined an estimated cash fair value of the Company’s common stock, consideration was given to the nature and history of the Company, the competitive and economic outlook for the trade area and for the banking industry in general, the book value and financial condition of the Company, the future earnings and dividend paying capacity, the size of the block valued, and the prevailing market prices of bank stocks. The following valuation methodologies were considered: 1.) net asset value - defined as the net worth of the Company, 2.) market value - defined as the price at which knowledgeable buyers and sellers would agree, and 3.) investment value - defined as an estimate of the present value of the future benefits, usually earnings, cash flow, or dividends, that will accrue to the Company’s common stock. When consideration was given to the three valuation methodologies, as well as all other relevant valuation variables and factors, the fully-diluted cash fair value range of the Company’s common shares was considered to be in excess of the book value and therefore, management concluded that goodwill was not impaired.
Other intangible assets consist of core deposit intangible assets arising from a branch acquisition. They are initially measured at fair value and then are amortized over their estimated useful lives, determined to be seven years. The balance of the core deposit intangible, which is included in other assets in the consolidated balance sheet, was $48 and $99 at December 31, 2009 and 2008, respectively. Scheduled amortization expense related to the core deposit intangible is $48 for 2010.
Long-Term Assets: Premises and equipment, goodwill, core deposit and other intangible assets, and other long-term assets are reviewed for impairment when events indicate that their carrying amount may not be recoverable from future undiscounted cash flows. If impaired, the assets are recorded at fair value. Management has determined that such assets have not been impaired as of December 31, 2009 and 2008.
Loan Commitments and Related Financial Instruments: Financial instruments include off-balance-sheet credit instruments, such as commitments to make loans and commercial letters of credit, issued to meet customer financing needs. The face amount for these items represents the exposure to loss, before considering customer collateral or ability to repay. Such financial instruments are recorded when they are funded. Instruments, such as standby letters of credit, that are considered financial guarantees in accordance with ASC 460-10 are recorded at fair value.
Trust Fee Income: The Company provides trust services to customers and in return charges fees using terms customary in its industry, including charging fees based on the agreed-upon percentages of assets managed or as otherwise specified in the underlying agreements. Income from trust services is recognized when the services are provided as fees from fiduciary activities in the consolidated statement of operations.
Advertising Expense: The Company expenses all advertising costs as they are incurred. Total advertising costs for the years ended December 31, 2009, 2008, and 2007 were $259, $288, and $291, respectively.
Earnings Per Common Share: Basic earnings per common share is net income or loss divided by the weighted average number of common shares outstanding during the period. Diluted earnings per common share includes the dilutive effect of additional potential common shares issuable under stock options and convertible promissory notes.
|
|
|
|
|
55 |
|
|
|
BAYLAKE CORP. |
|
NOTES TO CONSOLIDATED FINANCIAL STATEMENTS |
|
December 31, 2009, 2008 and 2007 |
|
(Dollar amounts in thousands) |
NOTE 1 – NATURE OF BUSINESS AND SUMMARY OF SIGNIFICANT ACCOUNTING POLICIES (Continued)
Loss Contingencies: Loss contingencies, including claims and legal actions arising in the ordinary course of business, are recorded as liabilities when the likelihood of loss is probable and an amount or range of loss can be reasonably estimated.
Restrictions on Cash: Cash on hand or on deposit with the Federal Reserve Bank of $1,568 and $1,704 was required to meet regulatory reserve and clearing requirements at December 31, 2009 and 2008. Effective October 1, 2008, these balances began earning interest.
Dividend Reinvestment Plan: The Company administers a dividend reinvestment plan (DRIP), whereby the Company allocates applicable dividends to acquire, on the participant’s behalf, shares of the Company’s common stock. Shares issued in 2009 and 2008 were 0 and 25,579, respectively.
Operating Segments: While the chief decision makers monitor the revenue streams of the various products and services, the identifiable segments are not material and operations are managed and financial performance is evaluated on a Company-wide basis. Accordingly, all of the financial service operations are considered by management to be aggregated in one reportable operating segment.
Subordinated Debentures: As of December 31, 2009, the Company sponsored one trust, of which 100% of the common equity is owned by the Company. The trust has issued trust preferred securities to third party investors and loaned the proceeds to the Company in the form of junior subordinated notes. The notes held by the trust are the sole assets of that trust. Distributions on the trust preferred securities of the trust are payable quarterly at a rate equal to the interest being earned by the trust on the notes held by the trust.
The trust preferred securities are subject to mandatory redemption upon repayment of the notes. The Company has entered into agreements which, taken collectively, fully and unconditionally guarantee the trust preferred securities subject to the terms of each of the guarantees. The securities are not subject to a sinking fund requirement. The Company has the right to defer dividend payments to the trust preferred security holders for up to five years.
The trust is a variable interest entity under U.S. GAAP and is not consolidated. The Company’s investment in the common stock of the trust is included in the other assets category in the Company’s consolidated balance sheet.
Convertible Promissory Notes (the “Convertible Notes”): During 2009, the Company issued $5.35 million through a private placement of 10% Convertible Notes. The Convertible Notes accrue interest at a fixed rate of 10% per annum upon issuance and until maturity or earlier conversion or redemption. Interest is payable quarterly, in arrears, on January 1, April 1, July 1, and October 1, of each year. The Convertible Notes are convertible into shares of the Company’s common stock at a conversion ratio of one share of common stock for each $5.00 in aggregate principal amount held on the record date of the conversion subject to certain adjustments as described in the Convertible Notes. Prior to October 1, 2014, each holder of the Convertible Notes may convert up to 100% (at the discretion of the holder) of the original principal amount into shares of our common stock at the conversion ratio. On October 1, 2014, one-half of the original principal amounts are mandatorily convertible at the conversion ratio if conversion has not occurred. The principal amount of any Convertible Note that has not been converted or redeemed will be payable at maturity on June 30, 2017.
|
|
|
|
|
56 |
|
|
|
BAYLAKE CORP. |
|
NOTES TO CONSOLIDATED FINANCIAL STATEMENTS |
|
December 31, 2009, 2008 and 2007 |
|
(Dollar amounts in thousands) |
NOTE 1 – NATURE OF BUSINESS AND SUMMARY OF SIGNIFICANT ACCOUNTING POLICIES (Continued)
Income Taxes: The Company accounts for income taxes in accordance with ASC Topic 740, “Income Taxes.” Under this guidance, deferred taxes are recognized for the future tax consequences attributable to differences between the financial statement carrying amounts of existing assets and liabilities and their respective tax bases. Deferred tax assets and liabilities are measured using enacted tax rates that will apply to taxable income in the years in which those temporary differences are expected to be recovered or settled. The effect on deferred tax assets and liabilities of a change in tax rates is recognized as income or expense in the period that includes the enactment date. See Note 16 for details on the Company’s income taxes.
The Company adopted new accounting guidance for uncertainty in income taxes as of January 1, 2007. A tax position is recognized as a benefit only if it is “more likely than not” that the tax position would be sustained in a tax examination, with a tax examination presumed to occur. The amount recognized is the largest amount of tax benefit that is greater than 50% likely being realized on examination. For tax positions not meeting the “more likely than not” test, no tax benefit is recorded.
The Company regularly reviews the carrying amount of its deferred tax assets to determine if the establishment of a valuation allowance is necessary. If based on the available evidence, it is more likely than not that all or a portion of the Company’s deferred tax assets will not be realized in future periods, a deferred tax valuation allowance would be established. Consideration is given to various positive and negative factors that could affect the realization of the deferred tax assets.
In 2002, the Company purchased Bank Owned Life Insurance (BOLI) in two separate instances. At the time of our purchases, there were uncertainties with respect to the tax treatment of these BOLI products in general that served as a basis for establishing a tax liability. The primary concern revolved around the taxability of the income derived from the separate account BOLI product due to issues surrounding the concept of investor control and other issues that arose in Corporate-Owned-Life Insurance. As of January 1, 2007, the Company conducted a review of that analysis and concluded that no tax liability was required. Consequently, the Company recorded a cumulative effect adjustment of $980 to increase retained earnings and reduce tax liabilities. This adjustment included interest but not penalties.
In evaluating this available evidence, management considers, among other things, historical financial performance, expectation of future earnings, the ability to carry back losses to recoup taxes previously paid, length of statutory carry forward periods, experience with operating loss and tax credit carry forwards not expiring unused, tax planning strategies and timing of reversals of temporary differences. Significant judgment is required in assessing future earning trends and the timing of reversals of temporary differences. The Company’s evaluation is based on current tax laws as well as management’s expectations of future performance.
The Company is subject to the income tax laws of the U.S., its states and municipalities. These tax laws are complex and subject to different interpretations by the taxpayer and the relevant Governmental taxing authorities. On January 1, 2008, the Company adopted accounting guidance related to uncertainty in income taxes. The guidance prescribes a comprehensive model for how companies should recognize, measure, present, and disclose in their financial statements uncertain tax positions taken or expected to be taken on a tax return. Under the guidance, tax positions shall initially be recognized in the financial statements when it is more likely than not the position will be sustained upon the examination by the tax authorities. Such tax positions shall initially and subsequently be measured as the largest amount of tax benefit that is greater than 50% likely of being realized upon ultimate settlement with the tax authority assuming full knowledge of the position and all relevant facts. The guidance also revises disclosure requirements to include an annual tabular roll forward of unrecognized tax benefits. In establishing a provision for income tax expense, the Company must make judgments and interpretations about the application of these inherently complex tax laws within the framework of existing U.S. GAAP.
Reclassifications: Certain items previously reported were reclassified to conform to the current presentation.
|
|
|
|
|
57 |
|
|
|
BAYLAKE CORP. |
|
NOTES TO CONSOLIDATED FINANCIAL STATEMENTS |
|
December 31, 2009, 2008 and 2007 |
|
(Dollar amounts in thousands) |
|
|
|
NOTE 1 – NATURE OF BUSINESS AND SUMMARY OF SIGNIFICANT ACCOUNTING POLICIES (Continued) |
|
|
|
In November 2007, the Financial Accounting Standards Board (“FASB”) Accounting Codification Statement (“ASC”) 810-10 Non-controlling Interest in Consolidated Financial Statements – an amendment to ASC 860-10 was issued. ASC 810-10 changes the way consolidated net earnings are presented. The new standard requires consolidated net earnings to be reported at amounts attributable to both the parent and the non-controlling interest and will require disclosure on the face of the consolidated statement of operations amounts attributable to the parent and the non-controlling interest. The adoption of this statement will result in more transparent reporting of the net earnings attributable to the non-controlling interest. The statement establishes a single method of accounting for changes in a parent’s ownership interest in a subsidiary that do not result in deconsolidation. We adopted ASC 810-10 effective January 1, 2009. The adoption of this statement had no effect on our consolidated financial condition, results of operations or liquidity. |
|
|
|
In February 2008, the FASB issued ASC 860-10 Accounting for Transfers of Financial Assets and Repurchase Financing Transactions. ASC 860-10 requires the initial transfer of a financial asset and a repurchase financing that was entered into contemporaneously with or in contemplation of the initial transfer, to be treated as a linked transaction under ASC 860-10, unless certain criteria are met, in which case the initial transfer and repurchase will not be evaluated as a linked transaction, but will be evaluated separately under ASC 860-10. ASC 860-10 was effective for fiscal years beginning after November 15, 2008, and interim periods within those fiscal years. The adoption of ASC 860-10 had no effect on our consolidated financial condition, results of operations or liquidity. |
|
|
|
In March 2008, the FASB issued ASC 815-10 Disclosures About Derivative Instruments and Hedging Activities – an amendment of ASC 815-10. ASC 815-10 requires entities to provide enhanced qualitative disclosures about objectives and strategies with respect to an entity’s derivative and hedging activities. ASC 815-10 was effective for fiscal years and interim periods beginning after November 15, 2008. The adoption of ASC 815-10 had no effect on our consolidated financial condition, results of operations or liquidity. |
|
|
|
In October 2008, the FASB issued ASC 820-10 Determining the Fair Value of a Financial Asset When the Market for That Asset Is Not Active. ASC 820-10 clarifies the application of ASC 820-10 in an inactive market and provides key considerations in determining the fair value of an asset where the market is not active. ASC 820-10 was effective immediately upon issuance. The adoption of ASC 820-10 did not have a material impact on our consolidated financial condition, results of operations or liquidity. |
|
|
|
In December 2008, the FASB issued ASC 860-10 Disclosures by Public Entities (Enterprises) about Transfers of Financial Assets and Interest in Variable Interest Entities. ASC 860-10 require enhanced disclosures about the transfers of financial assets and interests in variable interest entities. ASC 860-10 was effective for interim and annual reporting periods ending after December 15, 2008. The adoption of ASC 860-10 had no effect on our consolidated financial condition, results of operations or liquidity. |
|
|
|
In April 2009, the FASB issued ASC 320-10 Recognition and Presentation of Other-Than-Temporary Impairments. ASC 320-10 amended the other-than-temporary guidance to make the guidance more operational and to improve the presentation of other-than-temporary impairments in the financial statements. ASC 320-10 modifies the current indicator that, to avoid considering an impairment to be other-than-temporary, management must assert that it has both the intent and ability to hold an impaired security for a period of time sufficient to allow for any anticipated recovery in fair value. ASC 320-10 would require management to assert that (a) it does not have the intent to sell the security and (b) it is more likely than not that it will not have to sell the security before its recovery. ASC 320-10 changes the total amount recognized in earnings when there are factors other than credit losses associated with an impairment of a debt security. The impairment is separated into impairments related to credit losses and impairments related to all other factors with only the portion of impairment related to credit losses included in earnings in the current period. The adoption of ASC 320-10 had no effect on our consolidated financial condition, results of operations or liquidity. |
|
|
|
|
|
58 |
|
|
|
BAYLAKE CORP. |
|
NOTES TO CONSOLIDATED FINANCIAL STATEMENTS |
|
December 31, 2009, 2008 and 2007 |
|
(Dollar amounts in thousands) |
|
|
|
NOTE 1 – NATURE OF BUSINESS AND SUMMARY OF SIGNIFICANT ACCOUNTING POLICIES (Continued) |
|
|
|
In April 2009, FASB issued ASC 820-10, Determining Fair Value When the Volume and Level of Activity for the Asset or Liability Have Significantly Decreased and Identifying Transactions That Are Not Orderly. ASC 820-10 provides additional guidance on determining whether a market for a financial asset is not active and a transaction is not distressed for fair value measurements under ASC 820-10 Fair Value Measurements. ASC 820-10 was effective for our interim and annual periods ending after June 15, 2009. The adoption of ASC 820-10 had no effect on our consolidated financial condition, results of operations or liquidity. |
|
|
|
ASC 825-10 and ASC 270-10, Interim Disclosures about Fair Value of Financial Instruments, require disclosures about fair value of financial instruments in interim periods of publicly traded companies that were previously only required to be disclosed in annual financial statements. The provisions of ASC 825-10 and ASC 270-10 were effective for the initial interim period ending June 30, 2009. ASC 825-10 and ASC 270-10 amend only the disclosure requirements about fair value of financial instruments in interim periods. The new interim disclosures required by ASC 825-10 and ASC 270-10 are included in the consolidated financial statements. |
|
|
|
ASC 855-10 Subsequent Events, establishes general standards of accounting for and disclosure of events that occur after the balance sheet date but before financial statements are issued or available to be issued. ASC 855-10 defines (i) the period after the balance sheet date during which a reporting entity’s management should evaluate events or transactions that may occur for potential recognition or disclosure in the financial statements, (ii) the circumstances under which an entity should recognize events or transactions occurring after the balance sheet date in its financial statements, and (iii) the disclosures an entity should make about events or transactions that occurred after the balance sheet date. ASC 855-10 became effective for consolidated financial statements for periods ending after June 15, 2009. ASC 855-10 did not have a significant impact on our consolidated financial statements. |
|
|
|
In December 2009, The FASB issued ASC 860-10 Accounting for Transfers of Financial Assets, an Amendment of ASC 860-10 amends ASC 860-10, Accounting for Transfers and Servicing of Financial Assets and Extinguishments of Liabilities, to enhance reporting about transfers of financial assets, including securitizations, and where companies have continuing exposure to the risks related to transferred financial assets. ASC 860-10 eliminates the concept of a “qualifying special-purpose entity” and changes the requirements for derecognizing financial assets. ASC 860-10 also requires additional disclosures about all continuing involvements with transferred financial assets, including information about gains and losses resulting from transfers during the period. ASC 860-10 will become effective January 1, 2010 and is not expected to have a significant impact on our consolidated financial statements. |
|
|
|
In June, 2009, FASB issued ASC 810-10, Amendments to ASC 810-10, Consolidation of Variable Interest Entities, to change how a company determines when an entity that is insufficiently capitalized or is not controlled through voting (or similar rights) should be consolidated. The determination of whether a company is required to consolidate an entity is based on, among other things, an entity’s purpose and design and a company’s ability to direct the activities of the entity that most significantly impact the entity’s economic performance. ASC 810-10 requires additional disclosures about the reporting entity’s involvement with variable-interest entities and any significant changes in risk exposure due to that involvement as well as its affect on the entity’s financial statements. ASC 810-10 will become effective January 1, 2010 and is not expected to have a significant impact on our consolidated financial statements. |
|
|
|
In June 2009, the FASB issued ASC 105-10, The FASB Accounting Standards Codification and the Hierarchy of Generally Accepted Accounting Principles, ASC 105-10 establishes the FASB Accounting Standards Codification (the “Codification”) as the source of authoritative accounting principles recognized by the FASB to be applied by non-governmental entities in the preparation of financial statements in conformity with generally accepted accounting principles. Rules and interpretive releases of the SEC under authority of federal securities laws are also sources of authoritative guidance for SEC registrants. All guidance contained in the Codification carries an equal level of authority. All non-grandfathered, non-SEC accounting literature not included in the Codification is superseded and deemed non-authoritative. ASC 105-10 is effective for our financial statements for periods ending after September 15, 2009. ASC 105-10 did not have a significant impact on our consolidated financial statements. |
|
|
|
|
|
59 |
|
|
|
BAYLAKE CORP. |
|
NOTES TO CONSOLIDATED FINANCIAL STATEMENTS |
|
December 31, 2009, 2008 and 2007 |
|
(Dollar amounts in thousands) |
NOTE 2 – FAIR VALUE INFORMATION
Accounting guidance establishes a fair value hierarchy which requires an entity to maximize the use of observable inputs and minimize the use of unobservable inputs when measuring fair value. The guidance describes three levels of inputs that may be used to measure fair value:
|
|
|
|
|
|
Level 1: |
Quoted prices (unadjusted) for identical assets or liabilities in active markets that the entity has the ability to access as of the measurement date. |
|
|
Level 2: |
Significant other observable inputs other than Level 1 prices such as quoted prices for similar assets or liabilities; quoted prices in markets that are not active; or other inputs that are observable or can be corroborated by observable market data. |
|
|
Level 3: |
Significant unobservable inputs that reflect a reporting entity’s own assumptions about the assumptions that market participants would use in pricing an asset or liability. |
The fair value of securities available for sale is determined by obtaining quoted prices on nationally recognized securities exchanges (Level 1 inputs) or matrix pricing, which is a mathematical technique widely used in the industry to value debt securities without relying exclusively on quoted prices for the specific securities but rather by relying on the securities’ relationship to other benchmark quoted securities (Level 2 inputs). None of the Company’s securities available for sale at December 31, 2009 were measured using Level 1 inputs.
The fair value of mortgage servicing rights is based on a valuation model that calculates the present value of estimated net servicing income. The valuation model incorporates assumptions that market participants would use in estimating future net servicing income. The Company compares the valuation model inputs and results to widely available published industry data for reasonableness (Level 2 inputs).
The fair value of foreclosed properties is determined using a variety of market information including but not limited to appraisals, professional market assessments and real estate tax assessment information (Level 2 inputs).
The fair value of impaired loans is based on review of comparable collateral in the similar marketplaces and analysis of expected cash flows of the loan in relationship to the agreed terms of the loan. (Level 3 inputs).
Assets measured at fair value on a recurring basis are summarized below:
ASSETS MEASURED ON A RECURRING BASIS
($ in thousands)
|
|
|
December 31, |
|
Quoted Prices in |
|
Significant |
|
Significant |
| ||||
|
Assets: |
|
|
|
|
|
|
|
|
|
|
|
|
|
|
Securities available for sale: |
|
|
|
|
|
|
|
|
|
|
|
|
|
|
U.S. Treasury securities |
|
$ |
30,000 |
|
$ |
— |
|
$ |
30,000 |
|
$ |
— |
|
|
U.S government sponsored agency securities |
|
|
— |
|
|
— |
|
|
— |
|
|
— |
|
|
Mortgage backed securities |
|
|
120,148 |
|
|
— |
|
|
120,148 |
|
|
— |
|
|
Obligations of states and political subdivisions |
|
|
38,820 |
|
|
— |
|
|
38,820 |
|
|
— |
|
|
Private placement and corporate bonds |
|
|
12,536 |
|
|
— |
|
|
12,536 |
|
|
— |
|
|
Other Securities |
|
|
3,330 |
|
|
— |
|
|
3,330 |
|
|
— |
|
|
Total securities available for sale |
|
|
204,834 |
|
|
— |
|
|
204,834 |
|
|
— |
|
|
Mortgage servicing rights |
|
|
609 |
|
|
— |
|
|
609 |
|
|
— |
|
|
Forclosed properties |
|
|
14,995 |
|
|
— |
|
|
14,995 |
|
|
— |
|
|
Total |
|
$ |
220,438 |
|
$ |
— |
|
$ |
220,438 |
|
$ |
— |
|
|
|
|
December 31, |
|
Quoted Prices in |
|
Significant |
|
Significant |
| ||||
|
Assets: |
|
|
|
|
|
|
|
|
|
|
|
|
|
|
Securities available for sale: |
|
|
|
|
|
|
|
|
|
|
|
|
|
|
U.S. Treasury securities |
|
$ |
— |
|
$ |
— |
|
$ |
— |
|
$ |
— |
|
|
U.S government sponsored agency securities |
|
|
4,605 |
|
|
— |
|
|
4,605 |
|
|
— |
|
|
Mortgage backed securities |
|
|
155,133 |
|
|
— |
|
|
155,133 |
|
|
— |
|
|
Obligations of states and political subdivisions |
|
|
53,647 |
|
|
— |
|
|
53,647 |
|
|
— |
|
|
Private placement and corporate bonds |
|
|
9,353 |
|
|
— |
|
|
9,353 |
|
|
— |
|
|
Other Securities |
|
|
2,679 |
|
|
— |
|
|
2,679 |
|
|
— |
|
|
Total securities available for sale |
|
|
225,417 |
|
|
— |
|
|
225,417 |
|
|
— |
|
|
Mortgage servicing rights |
|
|
860 |
|
|
— |
|
|
860 |
|
|
— |
|
|
Forclosed properties |
|
|
7,143 |
|
|
— |
|
|
7,143 |
|
|
— |
|
|
Total |
|
$ |
233,420 |
|
$ |
— |
|
$ |
233,420 |
|
$ |
— |
|
|
|
|
60 |
|
|
|
BAYLAKE CORP. |
|
NOTES TO CONSOLIDATED FINANCIAL STATEMENTS |
|
December 31, 2009, 2008 and 2007 |
|
(Dollar amounts in thousands) |
NOTE 2 – FAIR VALUE INFORMATION (continued)
Assets measured at fair value on a non-recurring basis are summarized below:
ASSETS MEASURED ON A NON-RECURRING BASIS
($ in thousands)
|
|
|
|
|
|
|
|
|
|
|
|
|
|
|
|
|
|
December 31, |
|
Quoted Prices in |
|
Significant |
|
Significant |
|
||||
|
Assets: |
|
|
|
|
|
|
|
|
|
|
|
|
|
|
Impaired loans |
|
$ |
8,848 |
|
$ |
— |
|
$ |
— |
|
$ |
8,848 |
|
|
|
|
|
|
|
|
|
|
|
|
|
|
|
|
|
|
|
December 31, |
|
Quoted Prices in |
|
Significant |
|
Significant |
|
||||
|
Assets: |
|
|
|
|
|
|
|
|
|
|
|
|
|
|
Impaired loans |
|
$ |
20,280 |
|
$ |
— |
|
$ |
— |
|
$ |
20,280 |
|
The methods and assumptions used to estimate fair value are described as follows.
Carrying amount is the estimated fair value for cash and cash equivalents, accrued interest receivable and payable, demand deposits, short-term borrowings, and variable rate loans or deposits that reprice frequently and fully. Security fair values are based on market prices or dealer quotes and, if no such information is available, on the rate and term of the security and information about the issuer. For fixed rate loans and deposits and variable rate loans or deposits with infrequent repricing or repricing limits, fair value is based on discounted cash flows using current market rates applied to the estimated life and credit risk. Fair values for impaired loans are estimated using discounted cash flow analysis or underlying collateral values. Fair value of loans held for sale is based on market quotes. Fair value of subordinated debt and convertible promissory notes is based on current rates for similar financing. It is not practical to determine the fair value of Federal Home Loan Bank stock due to restrictions placed on its transferability. The fair value of off-balance sheet items is measured based on the present value of expected future cash flows for instruments where the Bank is obligated to fund such commitments.
The accounting guidance for financial instruments requires disclosures of estimated fair value of certain financial instruments and the methods and significant assumptions used to estimate their fair values. Certain financial instruments and all nonfinancial instruments are excluded from the scope of this guidance. Accordingly, the fair value disclosures required by this guidance are only indicative of the value of individual financial instruments as of the dates indicated and should not be considered an indication of the fair value of the Company.
|
|
|
|
|
|
|
|
|
|
|
|
|
|
|
|
|
|
December 31, |
|
||||||||||
|
|
|
2009 |
|
2008 |
|
||||||||
|
|
|
Carrying |
|
Fair |
|
Carrying |
|
Fair |
|
||||
|
Financial assets |
|
|
|
|
|
|
|
|
|
|
|
|
|
|
Cash and cash equivalents |
|
$ |
86,442 |
|
$ |
86,442 |
|
$ |
23,085 |
|
$ |
23,085 |
|
|
Federal funds sold |
|
|
84 |
|
|
84 |
|
|
397 |
|
|
397 |
|
|
Securities available for sale |
|
|
204,834 |
|
|
204,834 |
|
|
225,417 |
|
|
225,417 |
|
|
Loans held for sale |
|
|
2,567 |
|
|
2,599 |
|
|
368 |
|
|
373 |
|
|
Loans, net |
|
|
642,294 |
|
|
647,102 |
|
|
715,161 |
|
|
721,569 |
|
|
Federal Home Loan Bank stock |
|
|
6,792 |
|
|
6,792 |
|
|
6,792 |
|
|
n/a |
|
|
Accrued interest receivable |
|
|
3,376 |
|
|
3,376 |
|
|
3,968 |
|
|
3,968 |
|
|
|
|
|
|
|
|
|
|
|
|
|
|
|
|
|
Financial liabilities |
|
|
|
|
|
|
|
|
|
|
|
|
|
|
Deposits |
|
|
831,629 |
|
|
833,428 |
|
|
849,758 |
|
|
854,228 |
|
|
Federal funds purchased and repurchase agreements |
|
|
21,122 |
|
|
21,122 |
|
|
30,174 |
|
|
30,174 |
|
|
Federal Home Loan Bank advances |
|
|
85,000 |
|
|
86,303 |
|
|
85,095 |
|
|
86,228 |
|
|
|
|
|
|
|
|
|
|
|
|
|
|
|
|
|
Subordinated debentures |
|
|
16,100 |
|
|
16,100 |
|
|
16,100 |
|
|
16,100 |
|
|
Convertible promissory notes |
|
|
5,350 |
|
|
5,350 |
|
|
— |
|
|
— |
|
|
|
|
|
|
|
|
|
|
|
|
|
|
|
|
|
Accrued interest payable |
|
|
1,889 |
|
|
1,889 |
|
|
2,857 |
|
|
2,857 |
|
|
|
|
|
|
|
|
|
|
|
|
|
|
|
|
|
Off balance sheet credit related items Letter of credit |
|
|
2,978 |
|
|
2,978 |
|
|
2,957 |
|
|
2,957 |
|
|
|
|
61 |
|
|
|
BAYLAKE CORP. |
|
NOTES TO CONSOLIDATED FINANCIAL STATEMENTS |
|
December 31, 2009, 2008 and 2007 |
|
(Dollar amounts in thousands) |
NOTE 3 - SECURITIES
The fair value of securities available for sale and the related unrealized gains and losses as of December 31, 2009 and 2008 are as follows:
|
|
|
|
|
|
|
|
|
|
|
|
|
|
|
2009 |
|
|||||||
|
|
|
Fair |
|
Gross |
|
Gross |
|
|||
|
U.S. Treasury seurities |
|
$ |
30,000 |
|
$ |
— |
|
$ |
— |
|
|
U.S. government sponsored agency securities |
|
|
— |
|
|
— |
|
|
— |
|
|
Obligations of states and political subdivisions |
|
|
38,820 |
|
|
853 |
|
|
(75 |
) |
|
Mortgage-backed securities |
|
|
120,148 |
|
|
1,666 |
|
|
(500 |
) |
|
Private placement and corporate bonds |
|
|
12,536 |
|
|
— |
|
|
(2,601 |
) |
|
Other securities |
|
|
3,330 |
|
|
— |
|
|
— |
|
|
|
|
$ |
204,834 |
|
$ |
2,519 |
|
$ |
(3,176 |
) |
|
|
|
|
|
|
|
|
|
|
|
|
|
|
|
2008 |
|
|||||||
|
|
|
Fair |
|
Gross |
|
Gross |
|
|||
|
U.S. Treasury securities |
|
$ |
— |
|
$ |
— |
|
$ |
— |
|
|
U.S. government sponsored agency securities |
|
|
4,605 |
|
|
116 |
|
|
— |
|
|
Obligations of states and political subdivisions |
|
|
53,647 |
|
|
724 |
|
|
(931 |
) |
|
Mortgage-backed securities |
|
|
155,133 |
|
|
3,051 |
|
|
(36 |
) |
|
Private placement and corporate bonds |
|
|
9,353 |
|
|
— |
|
|
(5,777 |
) |
|
Other securities |
|
|
2,679 |
|
|
— |
|
|
— |
|
|
|
|
$ |
225,417 |
|
$ |
3,891 |
|
$ |
(6,744 |
) |
Other securities consist of short-term money market mutual funds and equity securities in the Federal Reserve Bank and other nonmarketable equity securities, which are carried at cost.
A summary of sales of securities available for sale during the year ended December 31 is as follows:
|
|
|
|
|
|
|
|
|
|
|
|
|
|
|
2009 |
|
2008 |
|
2007 |
|
|||
|
|
|
|
|
|
|
|
|
|
|
|
|
Proceeds |
|
$ |
202,347 |
|
$ |
56,089 |
|
$ |
34,479 |
|
|
Gross realized gains |
|
|
4,164 |
|
|
774 |
|
|
353 |
|
|
Gross realized losses |
|
|
1 |
|
|
9 |
|
|
1 |
|
The estimated fair value of securities at December 31, 2009, by contractual maturity, is shown below. Expected maturities will differ from contractual maturities on mortgage backed securities because borrowers may have the right to call or prepay obligations with or without call or prepayment penalties.
|
|
|
|
|
|
|
|
|
Estimated Fair |
|
|
|
Due in one year or less |
|
$ |
30,000 |
|
|
Due after one year through five years |
|
|
2,987 |
|
|
Due after five years through ten years |
|
|
18,653 |
|
|
Due after ten years |
|
|
29,716 |
|
|
|
|
|
81,356 |
|
|
Other equity securities |
|
|
3,330 |
|
|
Mortgage-backed securities |
|
|
120,148 |
|
|
|
|
$ |
204,834 |
|
Securities pledged to secure public deposits and borrowed funds had a carrying value of $129,517 and $134,029 at December 31, 2009 and 2008, respectively.
|
|
|
62 |
|
|
|
BAYLAKE CORP. |
|
NOTES TO CONSOLIDATED FINANCIAL STATEMENTS |
|
December 31, 2009, 2008 and 2007 |
|
(Dollar amounts in thousands) |
NOTE 3 - SECURITIES (continued)
Securities with unrealized losses at December 31, 2009 and 2008, aggregated by investment category and length of time that individual securities have been in a continuous unrealized loss position, are as follows:
|
|
|
|
|
|
|
|
|
|
|
|
|
|
|
|
|
|
|
|
|
|
|
|
Less than 12 Months |
|
12 Months or More |
|
Total |
|
||||||||||||
|
Description of Securities |
|
Fair |
|
Unrealized |
|
Fair |
|
Unrealized |
|
Fair |
|
Unrealized |
|
||||||
|
2009 |
|
|
|
|
|
|
|
|
|
|
|
|
|
|
|
|
|
|
|
|
U.S. Treasury securities |
|
$ |
30,000 |
|
$ |
— |
|
$ |
— |
|
$ |
— |
|
$ |
30,000 |
|
$ |
— |
|
|
U.S. government sponsored agency securities |
|
|
— |
|
|
— |
|
|
— |
|
|
— |
|
|
— |
|
|
— |
|
|
Obligations states and political subdivisions |
|
|
3,043 |
|
|
(47 |
) |
|
762 |
|
|
(28 |
) |
|
3,805 |
|
|
(75 |
) |
|
Mortgage-backed securities |
|
|
45,920 |
|
|
(468 |
) |
|
1,141 |
|
|
(32 |
) |
|
47,061 |
|
|
(500 |
) |
|
Private placement and corporate bonds |
|
|
— |
|
|
— |
|
|
12,536 |
|
|
(2,601 |
) |
|
12,536 |
|
|
(2,601 |
) |
|
Total temporarily impaired |
|
$ |
78,963 |
|
$ |
(515 |
) |
$ |
14,439 |
|
$ |
(2,661 |
) |
$ |
93,402 |
|
$ |
(3,176 |
) |
|
|
|
|
|
|
|
|
|
|
|
|
|
|
|
|
|
|
|
|
|
|
2008 |
|
|
|
|
|
|
|
|
|
|
|
|
|
|
|
|
|
|
|
|
U.S. Treasury securities |
|
$ |
— |
|
$ |
— |
|
$ |
— |
|
$ |
— |
|
$ |
— |
|
$ |
— |
|
|
U.S. government sponsored agency securities |
|
|
— |
|
|
— |
|
|
— |
|
|
— |
|
|
— |
|
|
— |
|
|
Obligations states and political subdivisions |
|
|
24,005 |
|
|
(931 |
) |
|
— |
|
|
— |
|
|
24,005 |
|
|
(931 |
) |
|
Mortgage-backed securities |
|
|
16,925 |
|
|
(33 |
) |
|
3,717 |
|
|
(3 |
) |
|
20,642 |
|
|
(36 |
) |
|
Private placement and corporate bonds |
|
|
7,901 |
|
|
(4,133 |
) |
|
1,452 |
|
|
(1,644 |
) |
|
9,353 |
|
|
(5,777 |
) |
|
Total temporarily impaired |
|
$ |
48,831 |
|
$ |
(5,097 |
) |
$ |
5,169 |
|
$ |
(1,647 |
) |
$ |
54,000 |
|
$ |
(6,744 |
) |
At December 31, 2009, the obligations of states and political subdivisions category with continuous unrealized losses for twelve months or more comprises two securities. The mortgage-backed securities category with continuous unrealized losses for twelve months or more comprises one security, and the private placement and corporate bond category with continuous unrealized losses for twelve months or more comprises four securities.
We evaluate securities for other-than-temporary impairment at least on a quarterly basis, and more frequently when economic or market concerns warrant such evaluation. As part of such monitoring, the credit quality of individual securities and their issuers are assessed. Adjustments to market value that are considered temporary are recorded as separate components of equity, net of tax. If an impairment of a security is identified as other than temporary based on information available, such as the decline in the credit worthiness of the issuer, external market ratings or the anticipated or realized elimination of associated dividends, such impairments are further analyzed to determine if a credit loss exists. If there is a credit loss, it will be recorded in the statement of operations. Losses other than credit will continue to be recognized in other comprehensive income. Unrealized losses reflected in the preceding tables have not been included in results of operations because the unrealized loss was not deemed other-than-temporary. Management has determined that more likely than not the Company will not be required to sell the debt security before its anticipated recovery and therefore, there is no other-than-temporary impairment. The losses on these securities are expected to dissipate as they approach their maturity dates and/or if interest rates decline.
At December 31, 2009 and 2008, there were no holdings of securities of any one issuer, other than the U.S. Government and its agencies, in an amount greater than 10% of the Company’s stockholders’ equity.
|
|
|
63 |
|
|
|
BAYLAKE CORP. |
|
NOTES TO CONSOLIDATED FINANCIAL STATEMENTS |
|
December 31, 2009, 2008 and 2007 |
|
(Dollar amounts in thousands) |
NOTE 4 - LOANS
Major classifications of loans as of December 31, 2009 and 2008 are as follows:
|
|
|
|
|
|
|
|
|
|
|
|
2009 |
|
2008 |
|
||
|
|
|
|
|
|
|
|
|
|
Commercial |
|
$ |
83,674 |
|
$ |
110,432 |
|
|
Real estate |
|
|
|
|
|
|
|
|
Residential |
|
|
124,830 |
|
|
134,436 |
|
|
Commercial |
|
|
353,110 |
|
|
381,765 |
|
|
Construction |
|
|
62,827 |
|
|
69,838 |
|
|
Consumer |
|
|
11,804 |
|
|
12,876 |
|
|
Municipal loans |
|
|
16,009 |
|
|
19,858 |
|
|
|
|
|
652,254 |
|
|
729,205 |
|
|
Less: |
|
|
|
|
|
|
|
|
Deferred loan origination fees, net of costs |
|
|
360 |
|
|
483 |
|
|
Allowance for loan losses |
|
|
9,600 |
|
|
13,561 |
|
|
|
|
|
|
|
|
|
|
|
Net loans |
|
$ |
642,294 |
|
$ |
715,161 |
|
Loans having a carrying value of $80,236 and $49,948 are pledged as collateral for borrowings from the Federal Home Loan Bank at December 31, 2009 and 2008, respectively.
Certain directors and officers of the Company and the Bank, including their immediate families, companies in which they are principal owners, and trusts in which they are involved, were loan customers of the Bank during 2009 and 2008.
A summary of the changes in those loans is as follows:
|
For the year ended |
|||||||
|
2009 |
2008 |
||||||
|
Balance at beginning of year |
|
$ |
5,523 |
|
$ |
4,544 |
|
|
New loans made |
2,247 |
5,185 |
|||||
|
Repayments received |
|
|
(2,180 |
) |
|
(4,028 |
) |
|
Reclassification for loans related to former officers and directors |
(64 |
) |
(178 |
) | |||
|
Balance at end of year |
|
$ |
5,526 |
$ |
5,523 |
| |
Changes in the allowance for loan losses were as follows:
|
|
|
|
|
|
|
|
|
|
|
|
|
|
|
For the year ended December 31, |
|
|||||||
|
|
|
2009 |
|
2008 |
|
2007 |
|
|||
|
Balance at beginning of year |
|
$ |
13,561 |
|
$ |
11,840 |
|
$ |
8,058 |
|
|
Provision charged to operations |
|
|
6,500 |
|
|
17,961 |
|
|
9,761 |
|
|
Recoveries |
|
|
797 |
|
|
427 |
|
|
479 |
|
|
Loans charged off |
|
|
(11,258 |
) |
|
(16,667 |
) |
|
(6,458 |
) |
|
Balance at end of year |
|
$ |
9,600 |
|
$ |
13,561 |
|
$ |
11,840 |
|
Information regarding impaired loans is as follows:
|
|
|
|
|
|
|
|
|
|
|
|
December 31, |
|
||||
|
|
|
2009 |
|
2008 |
|
||
|
|
|
|
|
|
|
|
|
|
Impaired loans with no allocated allowance for loan loss |
|
$ |
18,648 |
|
$ |
17,755 |
|
|
Impaired loans with allocated allowance for loan loss |
|
|
10,003 |
|
|
26,299 |
|
|
Allowance allocated to impaired loans |
|
|
1,155 |
|
|
6,019 |
|
|
|
|
|
|
|
|
|
|
|
|
|
|
|
|
For the year ended December 31, |
|
|||||||
|
|
|
|
|
|
|
|
|
|
|
|
|
|
|
2009 |
|
2008 |
|
2007 |
|
|||
|
|
|
|
|
|
|
|
|
|
|
|
|
Average impaired loans during the period |
|
$ |
42,955 |
|
$ |
39,492 |
|
$ |
34,231 |
|
|
Interest income recognized during impairment |
|
|
245 |
|
|
213 |
|
|
565 |
|
|
Cash-basis interest income recognized |
|
|
240 |
|
|
106 |
|
|
505 |
|
Nonperforming loans were as follows:
|
|
|
|
|
|
|
|
|
|
|
|
December 31, |
|
||||
|
|
|
2009 |
|
2008 |
|
||
|
Loans past due over 90 days still on accrual |
|
$ |
— |
|
$ |
— |
|
|
Loans restructured in a troubled debt restructuring |
|
|
2,061 |
|
|
367 |
|
|
Non-accrual loans |
|
|
26,590 |
|
|
43,687 |
|
|
Total nonperforming loans |
|
$ |
28,651 |
|
$ |
44,054 |
|
If these loans had been current throughout their terms, interest income for the non-accrual period would have approximated $1,981, $2,887 and $3,971 for the years ended December 31, 2009, 2008, and 2007 respectively.
|
|
|
64 |
|
|
|
BAYLAKE CORP. |
|
NOTES TO CONSOLIDATED FINANCIAL STATEMENTS |
|
December 31, 2009, 2008 and 2007 |
|
(Dollar amounts in thousands) |
NOTE 5 - PREMISES AND EQUIPMENT
|
|
|
|
|
|
|
|
|
|
|
|
December 31, |
|
||||
|
|
|
2009 |
|
2008 |
|
||
|
|
|
|
|
|
|
|
|
|
Land |
|
$ |
5,357 |
|
$ |
5,357 |
|
|
Buildings and improvements |
|
|
24,945 |
|
|
24,836 |
|
|
Equipment |
|
|
11,998 |
|
|
11,931 |
|
|
|
|
|
42,300 |
|
|
42,124 |
|
|
Less accumulated depreciation |
|
|
18,777 |
|
|
17,673 |
|
|
|
|
|
|
|
|
|
|
|
Premises and equipment |
|
$ |
23,523 |
|
$ |
24,451 |
|
Depreciation expense was $1,391, $1,394, and $1,534 for 2009, 2008, and 2007, respectively.
The Company has a three-year lease to rent space for a branch bank location in a mall in Howard, Wisconsin that was extended in 2007. The Company must also pay its proportional share of costs for common areas at the mall. Rent expense for these facilities for 2009, 2008, and 2007 was $39, $38, and $37, respectively. Future minimum lease payments under the remaining lease agreement that expires in August 2010 is $22.
During 2008 vacant property owned by the Company was sold with realized gains totaling $63. At December 31, 2009, approximately 12 acres of land were held for sale with a cost basis of $1,541.
At year-end 2009, there is still one unit of space under a condominium development arrangement held for sale with a cost basis of $465.
NOTE 6 – FORECLOSED PROPERTIES, NET
Foreclosed properties are summarized as follows:
|
|
|
|
|
|
|
|
|
|
|
|
|
|
|
For the year ended December 31, |
|
|||||||
|
|
|
2009 |
|
2008 |
|
2007 |
|
|||
|
Beginning balance |
|
$ |
7,143 |
|
$ |
5,167 |
|
$ |
5,760 |
|
|
Transfer of net realizable value to foreclosed properties |
|
|
12,196 |
|
|
8,328 |
|
|
5,932 |
|
|
Sale proceeds, net |
|
|
(3,774 |
) |
|
(2,623 |
) |
|
(6,160 |
) |
|
Net gain (loss) from sale of foreclosed properties |
|
|
108 |
|
|
(119 |
) |
|
(232 |
) |
|
Provision for foreclosed properties |
|
|
(678 |
) |
|
(3,610 |
) |
|
(133 |
) |
|
Total foreclosed properties |
|
$ |
14,995 |
|
$ |
7,143 |
|
$ |
5,167 |
|
|
|
|
|
|
|
|
|
|
|
|
|
|
Changes in the valuation allowance for losses on foreclosed properties were as follows: |
||||||||||
|
|
|
|
|
|
|
|
|
|
|
|
|
|
|
For the year ended December 31, |
|
|||||||
|
|
|
2009 |
|
2008 |
|
2007 |
|
|||
|
Beginning balance |
|
$ |
3,391 |
|
$ |
207 |
|
$ |
108 |
|
|
Provision charged to operations |
|
|
678 |
|
|
3,610 |
|
|
133 |
|
|
Amounts related to properties disposed |
|
|
(1,296 |
) |
|
(426 |
) |
|
(34 |
) |
|
|
|
|
|
|
|
|
|
|
|
|
|
Balance at end of year |
|
$ |
2,773 |
|
$ |
3,391 |
|
$ |
207 |
|
|
|
|
65 |
|
|
|
BAYLAKE CORP. |
|
NOTES TO CONSOLIDATED FINANCIAL STATEMENTS |
|
December 31, 2009, 2008 and 2007 |
|
(Dollar amounts in thousands) |
NOTE 7 – MORTGAGE SERVICING RIGHTS
|
|
|
|
|
We have obligations to service residential first mortgage loans and commercial loans that have been sold in the secondary market. New mortgage servicing rights (MSRs) are recorded when loans are sold in the secondary market. On a quarterly basis MSRs are valued based on available market information. We do not hedge the risk of changes in fair value. |
|
|
|
|
|
Changes in the carrying value of MSR’s are as followed: |
|
|
|
|
|
|
|
|
|
|
|
|
For the year ended December 31, |
|
||||
|
|
|
|
|
|
|
|
|
|
|
|
2009 |
|
2008 |
|
||
|
|
|
|
|
|
|
|
|
|
Balance at beginning of period |
|
$ |
860 |
|
$ |
1,366 |
|
|
Addition from loans sold with servicing retained |
|
|
108 |
|
|
29 |
|
|
|
|||||||
|
Changes in valuation |
|
|
(359 |
) |
|
(535 |
) |
|
Fair value of MSRs at end of period |
|
|
609 |
|
|
860 |
|
|
Balance of underlying loans being serviced at December 31 |
|
$ |
78,167 |
|
$ |
93,617 |
|
NOTE 8 - DEPOSITS
The following is a summary of deposits by type at December 31:
|
|
|
|
|
|
|
|
|
|
|
|
2009 |
|
2008 |
|
||
|
|
|
|
|
|
|
|
|
|
Non-interest-bearing demand deposits |
|
$ |
81,336 |
|
$ |
73,537 |
|
|
Interest-bearing demand deposits |
|
|
150,650 |
|
|
129,136 |
|
|
Savings deposits |
|
|
33,450 |
|
|
30,473 |
|
|
Money market deposits |
|
|
193,130 |
|
|
206,558 |
|
|
Time deposits $100,000 and greater |
|
|
159,764 |
|
|
193,928 |
|
|
Other time deposits |
|
|
213,299 |
|
|
216,126 |
|
|
Total deposits |
|
$ |
831,629 |
|
$ |
849,758 |
|
|
|
|
|
|
|
|
|
|
|
Brokered certificates of deposit included above: |
|
$ |
48,940 |
|
$ |
113,863 |
|
At December 31, 2009, the scheduled maturities of time deposits were as follows:
|
|
|
|
|
|
|
2010 |
|
$ |
273,161 |
|
|
2011 |
|
|
69,324 |
|
|
2012 |
|
|
19,274 |
|
|
2013 |
|
|
11,291 |
|
|
2014 |
|
|
13 |
|
|
|
|
$ |
373,063 |
|
Deposits from the Company’s directors and officers held by the Bank at December 31, 2009 and 2008 amounted to $3,666 and $4,559, respectively.
|
|
|
66 |
|
|
|
BAYLAKE CORP. |
|
NOTES TO CONSOLIDATED FINANCIAL STATEMENTS |
|
December 31, 2009, 2008 and 2007 |
|
(Dollar amounts in thousands) |
NOTE 9 - FEDERAL HOME LOAN BANK ADVANCES
A summary of Federal Home Loan Bank advances at December 31 is as follows:
|
|
|
|
|
|
|
|
|
|
|
|
|
|
|
|
|
Year of |
|
|
2009 |
|
Weighted |
|
2008 |
|
Weighted |
|
||||
|
|
|
|
|
|
|
|
|
|
|
|
|
|
|
|
|
2009 |
|
$ |
— |
|
|
— |
% |
$ |
20,000 |
|
|
1.62 |
% |
|
|
2010 |
|
|
5,000 |
|
|
1.86 |
|
|
— |
|
|
— |
|
|
|
2011 |
|
|
70,000 |
|
|
2.72 |
|
|
65,000 |
|
|
2.85 |
|
|
|
2012 |
|
|
10,000 |
|
|
2.81 |
|
|
— |
|
|
— |
|
|
|
Total fixed maturity |
|
|
85,000 |
|
|
2.68 |
% |
|
85,000 |
|
|
2.56 |
% |
|
|
Advances with amortizing principal |
|
|
— |
|
|
— |
|
|
95 |
|
|
3.64 |
||
|
|
|
|
|
|
|
|
|
|
|
|
|
|
|
|
|
Total |
|
$ |
85,000 |
|
|
2.68 |
% |
$ |
85,095 |
|
|
2.56 |
% |
|
Maximum month-end amounts outstanding were $85,095 and $85,171 at December 31, 2009 and 2008, respectively.
Each advance is payable at its maturity date, with a prepayment penalty for fixed rate advances. Federal Home Loan Bank advances are secured by $44,984 of real estate mortgages, $35,252 of home equity lines, and $78,080 of mortgage-backed and U.S. government sponsored agency securities. A $40 million advance with a rate of 2.055% maturing in 2011 and a $25 million advance maturing in 2011 are fixed rate. A $5 million advance maturing in 2011 is variable priced at three month LIBOR plus 28 basis points, capped at 2.45%. Those advances maturing in 2010 and 2012 are fixed rate.
NOTE 10 - FEDERAL FUNDS PURCHASED AND REPURCHASE AGREEMENTS
Short-term borrowings consisted of the following at December 31:
|
|
|
|
|
|
|
|
|
|
|
|
2009 |
|
2008 |
|
||
|
Federal funds purchased |
|
$ |
— |
|
$ |
— |
|
|
Securities sold under agreements to repurchase |
|
|
21,122 |
|
|
30,174 |
|
|
|
|
$ |
21,122 |
|
$ |
30,174 |
|
|
|
|
|
|
|
|
|
|
|
Average amounts outstanding during year |
|
$ |
23,350 |
|
$ |
32,750 |
|
|
Maximum month-end amounts outstanding |
|
|
33,757 |
|
|
45,659 |
|
|
Average interest rates on amounts outstanding at end of year |
|
|
0.50 |
% |
|
1.18 |
% |
|
Average interest rates on amounts outstanding during year |
|
|
0.71 |
% |
|
2.38 |
% |
|
|
|
67 |
|
|
|
BAYLAKE CORP. |
|
NOTES TO CONSOLIDATED FINANCIAL STATEMENTS |
|
December 31, 2009, 2008 and 2007 |
|
(Dollar amounts in thousands) |
NOTE 11 - SUBORDINATED DEBENTURES
In 2001, the Company formed Baylake Capital Trust I (the Trust) as a statutory business trust organized for the sole purpose of issuing $16,100 of 10% fixed rate cumulative trust-preferred securities and investing the proceeds thereof in junior subordinated debentures of the Company, the sole asset of the Trust.
On March 31, 2006, the Company redeemed its outstanding junior subordinated indentures and trust preferred securities for a total of $16.5 million which constitutes the $16.1 million stated principal values of those amounts plus $0.4 million in accrued interest.
The redemption of these securities were funded through the issuance of $16.1 million of trust preferred securities and $0.5 million of trust common securities issued under the name Baylake Capital Trust II (“Trust II”) that will adjust quarterly at a rate equal to 1.35% over the three month LIBOR (1.60% at December 31, 2009). Trust II’s ability to pay amounts due on the trust-preferred securities is solely dependent upon the Company making payment on the related subordinated debentures to the Trust. The Company’s obligations under the subordinated debentures include a conditional guarantee by the Company of the Trust’s obligations under the trust securities issued by the trust. In addition, under the terms of the Debentures, the Company would be precluded from paying dividends on the Company’s common stock if the Company was in default under the Debentures, if the Company exercised its right to defer payments of interest on the Debentures or if certain related defaults occurred. At December 31, 2009 the Company is current on its interest payments.
NOTE 12 – CONVERTIBLE PROMISSORY NOTES
During the third and fourth quarters of 2009, the Company completed three separate closings of a private placement of 10% Convertible Notes due June 30, 2017 (the “Convertible Notes”). The Convertible Notes were offered and sold in reliance on the exemption from registration under Section 4(2) of the Securities Act of 1933 and Rule 506 promulgated there under. The Company issued $5.35 million principal amount of the Notes, at par, and received gross proceeds in the same amount.
The Convertible Notes accrue interest at a fixed rate of 10% per annum upon issuance and until maturity or earlier conversion or redemption. Interest is payable quarterly, in arrears, on January 1, April 1, July 1, and October 1, of each year. The Convertible Notes are convertible into shares of the Company’s common stock at a conversion ratio of one share of common stock for each $5.00 in aggregate principal amount held on the record date of the conversion subject to certain adjustments as described in the Convertible Notes. Prior to October 1, 2014, each holder of the Convertible Notes may convert up to 100% (at the discretion of the holder) of the original principal amount into shares of our common stock at the conversion ratio. On October 1, 2014, one-half of the original principal amounts are mandatorily convertible into common stock at the conversion ratio if conversion has not occurred. The principal amount of any Convertible Note that has not been converted will be payable at maturity on June 30, 2017. The Company is not obligated to register the common stock issued on the conversion of the Convertible Notes.
The Company incurred debt issuance costs of $0.17 million. These costs are capitalized and amortized to interest expense using the effective interest method over the initial conversion term, which is October 1, 2014. The total amount of Convertible Notes offered is $15.0 million. We anticipate a fourth closing during the first quarter of 2010. Additionally, the offering expires on April 30, 2010.
|
|
|
68 |
|
|
|
BAYLAKE CORP. |
|
NOTES TO CONSOLIDATED FINANCIAL STATEMENTS |
|
December 31, 2009, 2008 and 2007 |
|
(Dollar amounts in thousands) |
NOTE 13 - CAPITAL MATTERS
Banks and bank holding companies are subject to regulatory capital requirements administered by federal banking agencies. Capital adequacy guidelines and, additionally for banks, prompt corrective action regulations involve quantitative measures of assets, liabilities, and certain off-balance-sheet items calculated under regulatory accounting practices. Capital amounts and classifications are also subject to qualitative judgments by regulators. Failure to meet capital requirements can initiate regulatory action.
Prompt corrective action regulations provide five classifications: well capitalized, adequately capitalized, undercapitalized, significantly undercapitalized, and critically undercapitalized, although these terms are not used to represent overall financial condition. If adequately capitalized, regulatory approval is required to accept brokered deposits. If undercapitalized, capital distributions are limited, as is asset growth and expansion, and capital restoration plans are required. At December 31, 2009, regulatory notifications categorized the Bank as well capitalized, under the regulatory framework for prompt corrective action. There are no conditions or events since that notification that management believes have changed the Bank’s category.
Regulatory restrictions, which govern all state chartered banks, preclude the payment of dividends without the prior written consent of the Wisconsin Department of Financial Institutions Division of Banking (“WDFI”) if dividends declared and paid by such bank in either of the two immediately preceding years exceeded that bank’s net income for those years. During 2009 and 2008, no dividends were declared. During 2007, $4.5 million in dividends were declared and $2.3 million in dividends were paid to the Company by the Bank, which was in excess of the Bank’s net income for the year. In order to pay dividends in the future, the Bank will need to seek prior approval from WDFI, as well as the Federal Reserve Board. Future dividends will be subject to improved earnings and the reduction of non-performing loans, among others.
The Company’s and the Bank’s risk-based capital and leverage ratios at December 31, 2009 and 2008 are presented below.
|
|
|
|
|
|
|
|
|
|
|
|
|
|
|
|
|
|
|
|
|
|
|
|
Actual |
|
For Capital |
|
To Be Well |
|
||||||||||||
|
|
|
Amount |
|
Ratio |
|
Amount |
|
Ratio |
|
Amount |
|
Ratio |
|
||||||
|
2009 |
|
|
|
|
|
|
|
|
|
|
|
|
|
|
|
|
|
|
|
|
Total Capital to risk-weighted assets |
|
|
|
|
|
|
|
|
|
|
|
|
|
|
|
|
|
|
|
|
Consolidated |
|
$ |
92,667 |
|
|
12.18 |
% |
$ |
60,882 |
|
|
8.00 |
% |
|
N/A |
|
|
N/A |
|
|
Bank |
|
|
90,321 |
|
|
11.86 |
% |
|
60,940 |
|
|
8.00 |
|
$ |
76,175 |
|
|
10.00 |
% |
|
Tier 1 (Core) Capital to risk-weighted assets |
|
|
|
|
|
|
|
|
|
|
|
|
|
|
|
|
|
|
|
|
Consolidated |
|
|
77,804 |
|
|
10.22 |
% |
|
30,441 |
|
|
4.00 |
|
|
N/A |
|
|
N/A |
|
|
Bank |
|
|
80,798 |
|
|
10.61 |
% |
|
30,470 |
|
|
4.00 |
|
|
45,705 |
|
|
6.00 |
|
|
Tier 1 (Core) Capital to average assets |
|
|
|
|
|
|
|
|
|
|
|
|
|
|
|
|
|
|
|
|
Consolidated |
|
|
77,804 |
|
|
7.60 |
% |
|
40,961 |
|
|
4.00 |
|
|
N/A |
|
|
N/A |
|
|
Bank |
|
|
80,798 |
|
|
7.89 |
% |
|
40,978 |
|
|
4.00 |
|
|
51,222 |
|
|
5.00 |
|
|
|
|
|
|
|
|
|
|
|
|
|
|
|
|
|
|
|
|
|
|
|
2008 |
|
|
|
|
|
|
|
|
|
|
|
|
|
|
|
|
|
|
|
|
Total Capital to risk-weighted assets |
|
|
|
|
|
|
|
|
|
|
|
|
|
|
|
|
|
|
|
|
Consolidated |
|
$ |
80,787 |
|
|
9.72 |
% |
$ |
66,471 |
|
|
8.00 |
% |
|
N/A |
|
|
N/A |
|
|
Bank |
|
|
79,566 |
|
|
9.56 |
% |
|
66,524 |
|
|
8.00 |
|
$ |
83,155 |
|
|
10.00 |
% |
|
Tier 1 (Core) Capital to risk-weighted assets |
|
|
|
|
|
|
|
|
|
|
|
|
|
|
|
|
|
|
|
|
Consolidated |
|
|
70,362 |
|
|
8.47 |
% |
|
33,235 |
|
|
4.00 |
|
|
N/A |
|
|
N/A |
|
|
Bank |
|
|
69,132 |
|
|
8.31 |
% |
|
33,262 |
|
|
4.00 |
|
|
49,893 |
|
|
6.00 |
|
|
Tier 1 (Core) Capital to average assets |
|
|
|
|
|
|
|
|
|
|
|
|
|
|
|
|
|
|
|
|
Consolidated |
|
|
70,362 |
|
|
6.68 |
% |
|
42,110 |
|
|
4.00 |
|
|
N/A |
|
|
N/A |
|
|
Bank |
|
|
69,132 |
|
|
6.56 |
% |
|
42,161 |
|
|
4.00 |
|
|
52,701 |
|
|
5.00 |
|
|
|
|
69 |
|
|
|
BAYLAKE CORP. |
|
NOTES TO CONSOLIDATED FINANCIAL STATEMENTS |
|
December 31, 2009, 2008 and 2007 |
|
(Dollar amounts in thousands) |
NOTE 14 – COMMITMENTS AND CONTINGENCIES
The Company is party to financial instruments with off-balance-sheet risk in the normal course of business to meet the financing needs of its customers. These financial instruments include off balance-sheet credit instruments, such as commitments to make loans and commercial letters of credit, issued to meet customer financing needs. The face amounts for these items represents the exposure to loss, before considering customer collateral or ability to repay. Such financial instruments are recorded when they are funded. Instruments, such as standby letters of credit, that are considered financial guarantees in accordance with ASC 460-10 are recorded at fair value. The Company does not use forward loan sale commitments.
The Company’s exposure to credit loss in the event of nonperformance by the other party to the financial instrument for commitments to extend credit and standby letters of credit is represented by the contract or notional amount of those instruments. The Company uses the same credit policies in making commitments and conditional obligations as it does for on-balance-sheet instruments.
|
|
|
|
|
|
|
|
|
|
|
|
Contract or |
|
||||
|
|
|
2009 |
|
2008 |
|
||
|
Financial instruments whose contract amounts represent credit risk: |
|
|
|
|
|
|
|
|
Commitments to extend credit |
|
$ |
168,195 |
|
$ |
177,487 |
|
|
Standby letters of credit |
|
|
14,550 |
|
|
16,325 |
|
Commitments to extend credit are agreements to lend to a customer as long as there is no violation of any condition established in the contract. Commitments generally have fixed expiration dates or other termination clauses and may require payment of a fee. Since many of the commitments are expected to expire without being drawn upon, the total commitment amounts do not necessarily represent future cash requirements. The Company evaluates each customers’ creditworthiness on a case-by-case basis. The amount of collateral obtained, if deemed necessary by the Company upon extension of credit, is based on management’s credit evaluation of the counter-party. Collateral held varies but may include accounts receivable; inventory; property, plant, and equipment; and income-producing commercial properties. Fixed rate commitments totaled $9,543 and $9,716 at December 31, 2009 and 2008, respectively, with rates ranging from 3.00% to 9.25% in 2009 and 3.33% to 9.25% in 2008.
Standby letters of credit are conditional commitments issued by the Company to guarantee the performance of customers to a third party. These are primarily issued to support private borrowing arrangements and expire in decreasing amounts through 2017, with a majority expiring by December 31, 2013. The credit risk involved in issuing letters of credit is essentially the same as that involved in extending loan facilities to customers. The Company does not require collateral as support for the commitments. Collateral is secured as commitments are funded.
In 2009, 2008 and 2007, impairment charges of $20, $2,539, and $0 were taken, respectively, on standby letters of credit which were issued by the Company on behalf of customers to accommodate their borrowings with third parties. The provision for impairment charges relates to the establishment of a liability for the Company’s expected losses on outstanding letters of credit. The Company continues to monitor the financial condition of the borrowers on an ongoing basis, and if they continue to deteriorate, may need to provide additional reserves with respect to the off-balance commitment. The balance of the letters of credit totaled $6,831 at December 31, 2009 and 2008. At December 31, 2009 and 2008, the carrying value recorded by the Company as a liability for those guarantees was $2,977 and $2,957, respectively.
Loss contingencies, including claims and legal actions arising in the ordinary course of business, are recorded as liabilities when the likelihood of loss is probable and an amount or range of loss can be reasonably estimated.
The Company does not use interest rate contracts (e.g. swaps) or other derivatives to manage interest rate risk and does not have any of these instruments outstanding as of and for the years ended December 31, 2009, 2008, and 2007.
|
|
|
70 |
|
|
|
BAYLAKE CORP. |
|
NOTES TO CONSOLIDATED FINANCIAL STATEMENTS |
|
December 31, 2009, 2008 and 2007 |
|
(Dollar amounts in thousands) |
NOTE 15 - RETIREMENT PLANS
The subsidiaries have 401(k) Profit Sharing Plans covering all employees who qualify as to age and length of service. The discretionary employer contributions paid and expensed under all plans totaled $504, $1,103, and $1,184 in 2009, 2008 and 2007, respectively. Certain officers and directors of the Company and its subsidiaries are covered by nonqualified deferred compensation plans. Payments to be made under these plans are accrued over the anticipated years of service of the individuals covered. Amounts charged to expense were $431 in 2009, $(512) in 2008, and $467 in 2007. The aggregate amount of deferred compensation included in other liabilities in the consolidated balance sheets is $3,385 and $3,100 in 2009 and 2008, respectively. The Company has established the Baylake Bank Supplemental Executive Retirement Plan (“Plan”) which is intended to provide certain management and highly compensated employees of the Company who have contributed and are expected to continue to contribute to the Company’s success, deferred compensation in addition to that available under the Company’s other retirement programs. Costs amounting to $305, $(640), and $246 are included in the amounts charged to expense for 2009, 2008, and 2007, respectively. The Company has ceased contributions to the Plan for the foreseeable future.
NOTE 16 - INCOME TAXES
Income tax expense (benefit) consists of the following:
|
|
|
|
|
|
|
|
|
|
|
|
|
|
|
For the year ended December 31, |
|
|||||||
|
|
|
2009 |
|
2008 |
|
2007 |
|
|||
|
Current income taxes |
|
|
|
|
|
|
|
|
|
|
|
Federal |
|
$ |
(2,927 |
) |
$ |
(1,792 |
) |
$ |
(215 |
) |
|
State |
|
|
54 |
|
|
(142 |
) |
|
4 |
|
|
|
|
|
(2,873 |
) |
|
(1,934 |
) |
|
(211 |
) |
|
Deferred income taxes |
|
|
|
|
|
|
|
|
|
|
|
Federal |
|
|
3,446 |
|
|
(4,254 |
) |
|
(1,636 |
) |
|
State |
|
|
314 |
|
|
(1,672 |
) |
|
(569 |
) |
|
|
|
|
3,760 |
|
|
(5,926 |
) |
|
(2,205 |
) |
|
Income tax expense (benefit) |
|
$ |
887 |
|
$ |
(7,860 |
) |
$ |
(2,416 |
) |
The provision for income taxes differs from the amount of income tax determined by applying the statutory federal income tax rate to pretax income as a result of the following differences:
|
|
|
|
|
|
|
|
|
|
|
|
|
|
|
For the year ended December 31, |
|
|||||||
|
|
|
2009 |
|
2008 |
|
2007 |
|
|||
|
Income tax expense (benefit) based on statutory rate (34%) |
|
$ |
1,773 |
|
$ |
(6,010 |
) |
$ |
(712 |
) |
|
State income tax expense (benefit) net of federal tax expense (benefit) |
|
|
243 |
|
|
(1,103 |
) |
|
(427 |
) |
|
Effect of tax-exempt interest income |
|
|
(744 |
) |
|
(935 |
) |
|
(833 |
) |
|
Life insurance death benefit and earnings |
|
|
(213 |
) |
|
(11 |
) |
|
(294 |
) |
|
Equity in income of UFS subsidiary |
|
|
(126 |
) |
|
(80 |
) |
|
(189 |
) |
|
Other |
|
|
(46 |
) |
|
279 |
|
|
39 |
|
|
|
|
|
|
|
|
|
|
|
|
|
|
Expense (benefit) based on effective tax rates |
|
$ |
887 |
|
$ |
(7,860 |
) |
$ |
(2,416 |
) |
|
|
|
71 |
|
|
|
BAYLAKE CORP. |
|
NOTES TO CONSOLIDATED FINANCIAL STATEMENTS |
|
December 31, 2009, 2008 and 2007 |
|
(Dollar amounts in thousands) |
NOTE 16 - INCOME TAXES (continued)
Deferred income taxes reflect the net tax effects of temporary differences between the carrying amounts of assets and liabilities for financial reporting purposes and the amounts used for income tax purposes.
The following is a summary of the significant components of the Company’s deferred tax assets and liabilities as of December 31, 2009 and 2008:
|
|
|
|
|
|
|
|
|
|
|
|
2009 |
|
2008 |
|
||
|
|
|
|
|
|
|
||
|
Deferred tax assets |
|
|
|
|
|
|
|
|
Allowance for loan losses |
|
$ |
3,764 |
|
$ |
5,318 |
|
|
Off-balance sheet credit losses |
|
|
— |
|
|
1,160 |
|
|
Deferred loan fees |
|
|
141 |
|
|
190 |
|
|
Deferred compensation |
|
|
1,653 |
|
|
1,600 |
|
|
Non accrual loans |
|
|
216 |
|
|
2,311 |
|
|
Accrued vacation pay |
|
|
367 |
|
|
362 |
|
|
OREO property valuation |
|
|
1,087 |
|
|
1,330 |
|
|
Net unrealized loss on securities available for sale |
|
|
333 |
|
|
1,218 |
|
|
Donations |
|
|
146 |
|
|
47 |
|
|
Deferred tax credits – AMT |
|
|
1,485 |
|
|
680 |
|
|
Federal net operating loss carryforwards (NOLs) |
|
|
1,603 |
|
|
1,100 |
|
|
State net operating loss carryforwards (NOLs) |
|
|
1,993 |
|
|
1,487 |
|
|
Other than temporary impairment of securities |
|
|
— |
|
|
745 |
|
|
Other |
|
|
83 |
|
|
65 |
|
|
Total deferred tax assets before valuation allowance |
|
|
12,871 |
|
|
17,613 |
|
|
Valuation allowance |
|
|
(658 |
) |
|
(659 |
) |
|
Net deferred tax assets after valuation allowance |
|
|
12,213 |
|
|
16,954 |
|
|
Deferred tax liabilities |
|
|
|
|
|
|
|
|
Depreciation |
|
|
1,914 |
|
|
1,927 |
|
|
FHLB stock dividends |
|
|
791 |
|
|
791 |
|
|
Mortgage loan servicing |
|
|
22 |
|
|
63 |
|
|
Net unrealized gain on securities available for sale |
|
|
— |
|
|
— |
|
|
Equity in UFS subsidiary |
|
|
489 |
|
|
524 |
|
|
Prepaid expenditures |
|
|
117 |
|
|
110 |
|
|
Other |
|
|
24 |
|
|
38 |
|
|
Total deferred tax liabilities |
|
|
3,357 |
|
|
3,453 |
|
|
Net deferred tax asset |
|
$ |
8,856 |
|
$ |
13,501 |
|
|
|
|
|
|
72 |
|
|
|
BAYLAKE CORP. |
|
NOTES TO CONSOLIDATED FINANCIAL STATEMENTS |
|
December 31, 2009, 2008 and 2007 |
|
(Dollar amounts in thousands) |
NOTE 16 - INCOME TAXES (continued)
The Company has federal net operating loss carryforwards of approximately $4.7 million and $3.2 million and state net operating loss carryforwards of $38.2 million and $28.5 million at December 31, 2009 and December 31, 2008, respectively. The federal net operating loss carryforwards will expire in varying amounts between 2028 and 2029. The state net operating losses expire annually through 2024.
The Company carries a valuation allowance to reduce deferred tax assets related to state net operating loss carryforwards to an amount which the Company believes the benefit will more likely than not be realized. The Company will continue to assess the amount of tax benefits it may realize.
During the fourth quarter of 2008, the Company changed its approach for treating UFS income as a temporary difference instead of a permanent difference. The effect of this change was not material to the Company’s consolidated financial condition and results of operations.
Income tax expense recorded in the consolidated statement of income involves the interpretation and application of certain accounting pronouncements and federal and state tax codes. The Company undergoes examination by various regulatory taxing agencies. Such agencies may require that changes in the amount of tax expense be recognized when their interpretations differ from those of management, based on their judgment about information available to them at the time of their examination. Management does not accrued any interest or penalties for unrecognized tax benefits.
A roll-forward of the activity in the Company’s remaining accrual for uncertain tax positions is as follows:
|
|
|
|
|
|
|
|
|
|
|
|
For the year ended December 31, |
|
||||
|
|
|
2009 |
|
2008 |
|
||
|
Gross tax liability, beginning of year |
|
$ |
354 |
|
$ |
639 |
|
|
Reduction in tax liability due to adoption of ASC 740-10 |
|
|
— |
|
|
— |
|
|
Adjusted tax liability, beginning of year |
|
|
354 |
|
|
639 |
|
|
Current period change in tax benefits |
|
|
— |
|
|
— |
|
|
Reduction in tax liability settlement |
|
|
— |
|
|
(108 |
) |
|
Settlement payment |
|
|
(177 |
) |
|
(177 |
) |
|
Gross tax liability, end of year |
|
$ |
177 |
|
$ |
354 |
|
The gross tax liability, at December 31, 2009, is related to income earned by our subsidiary located in the state of Nevada. Due to the State of Wisconsin Department of Revenue’s (WDOR) change in position on the taxability of income from Nevada subsidiaries, and based on the Company’s analysis of ASC 740-10, there was an accrued liability of $177 and $354 at December 31, 2009 and 2008, respectively. On November 10, 2008, the Company entered into a settlement agreement with the WDOR related to this issue. The Company anticipates that corresponding tax benefits will be decreased by approximately $177 during 2010 as a result of the WDOR settlement, thus reducing the gross tax liability to zero.
The Company and its subsidiaries are subject to U.S. federal and Wisconsin state income tax. In February 2009, the State of Wisconsin passed legislation that requires tax reporting on a consolidated basis (known as “combined reporting”) effective January 1, 2009. The Company and its subsidiaries file a consolidated federal income tax return, separate Company 2008 Wisconsin income tax returns, and a combined 2009 Wisconsin tax return as appropriate. They are no longer subject to examination by U.S. Federal taxing authorities for years before 2006 and for Wisconsin state income taxes through 2004. The Company does not expect the total amount of unrecognized tax benefits to significantly increase or decrease in the next twelve months.
The Company recognizes interest and/or penalties related to income tax matters in income tax expense. Included in the $177 referred to above is $52 of interest, net of federal tax benefit.
|
|
|
|
|
73 |
|
|
|
BAYLAKE CORP. |
|
NOTES TO CONSOLIDATED FINANCIAL STATEMENTS |
|
December 31, 2009, 2008 and 2007 |
|
(Dollar amounts in thousands except per share data) |
NOTE 17 - EARNINGS PER SHARE
Earnings (loss) per share is based on the weighted average number of shares outstanding for the year. A reconciliation of the basic and diluted earnings per share amounts is as follows:
|
|
|
|
|
|
|
|
|
|
|
|
|
|
|
For the year ended December 31, |
|
|||||||
|
|
|
2009 |
|
2008 |
|
2007 |
|
|||
|
Basic |
|
|
|
|
|
|
|
|
|
|
|
Net income (loss) |
|
$ |
4,329 |
|
$ |
(9,817 |
) |
$ |
166 |
|
|
Weighted average common shares outstanding |
|
|
7,911,539 |
|
|
7,911,469 |
|
|
7,851,508 |
|
|
|
|
|
|
|
|
|
|
|
|
|
|
Basic earnings (loss) per common share |
|
$ |
0.55 |
|
$ |
(1.24 |
) |
$ |
0.02 |
|
|
|
|
|
|
|
|
|
|
|
|
|
|
Diluted |
|
|
|
|
|
|
|
|
|
|
|
Net income (loss) |
|
$ |
4,329 |
|
$ |
(9,817 |
) |
$ |
166 |
|
|
Weighted average common shares outstanding for basic earnings per share |
|
|
7,911,539 |
|
|
7,911,469 |
|
|
7,851,508 |
|
|
Add: Dilutive effects of assumed exercises of stock options |
|
|
— |
|
|
— |
|
|
1,271 |
|
|
|
|
|
|
|
|
|
|
|
|
|
|
Add: Dilutive effects of convertible promissory notes |
|
|
— |
|
|
— |
|
|
— |
|
|
Average shares and dilutive potential common shares |
|
|
7,911,539 |
|
|
7,911,469 |
|
|
7,852,779 |
|
|
|
|
|
|
|
|
|
|
|
|
|
|
Diluted earnings (loss) per common share |
|
$ |
0.55 |
|
$ |
(1.24 |
) |
$ |
0.02 |
|
|
|
|
|
|
|
|
|
|
|
|
|
|
Additional common stock option shares that have not been included due to their antidilutive effect |
|
|
73,628 |
|
|
126,628 |
|
|
166,700 |
|
|
Additional common stock convertible debenture shares that have not been included due to their antidilutive effect |
|
|
1,070,000 |
|
|
— |
|
|
— |
|
NOTE 18 - STOCK OPTION PLAN
The Company has a non-qualified stock option plan (“the Plan”) under which certain officers and key salaried employees may purchase shares of the Company’s stock at an established exercise price. Unless earlier terminated, these options will expire ten years from the date of grant. The options vest over a five-year period, becoming exercisable 20% per year, commencing one year from date of grant. Total compensation cost (benefit), net of income tax, that has been charged against income for the plan was $2, $(36), and $21 for 2009, 2008, and 2007, respectively. The total income tax benefit was $0, $(8), and $8 for the respective periods.
There were no stock options granted in 2009, 2008 or 2007.
|
|
|
|
|
74 |
|
|
|
BAYLAKE CORP. |
|
NOTES TO CONSOLIDATED FINANCIAL STATEMENTS |
|
December 31, 2009, 2008 and 2007 |
|
(Dollar amounts in thousands except per share data) |
NOTE 18 - STOCK OPTION PLAN (continued)
Activity in the stock option plan during 2009 follows:
|
|
|
|
|
|
|
|
|
|
|
|
|
|
|
|
|
|
Shares |
|
Weighted |
|
Weighted |
|
Aggregate |
|
||||
|
|
|||||||||||||
|
Outstanding at beginning of year |
|
|
126,628 |
|
$ |
16.53 |
|
|
|
|
$ |
|
|
|
Granted |
|
|
— |
|
|
— |
|
|
— |
|
|
— |
|
|
Exercised |
|
|
— |
|
|
— |
|
|
|
|
|
|
|
|
Forfeited or expired |
|
|
(53,000 |
) |
|
15.25 |
|
— |
|
|
— |
|
|
|
Outstanding at end of year |
|
|
73,628 |
|
$ |
17.40 |
|
|
1.45 |
|
$ |
— |
|
|
|
|
|
|
|
|
|
|
|
|
|
|
|
|
|
Exercisable at end of year |
|
|
73,628 |
|
$ |
17.40 |
|
|
1.45 |
|
$ |
— |
|
|
|
|
|
|
|
|
|
|
|
|
|
|
|
|
|
Fully vested and expected to vest |
|
|
73,628 |
|
$ |
17.40 |
|
|
1.45 |
|
$ |
— |
|
Activity in the stock option plan during 2008 follows:
|
|
|
|
|
|
|
|
|
|
|
|
|
|
|
|
|
|
Shares |
|
Weighted |
|
Weighted |
|
Aggregate |
|
||||
|
Outstanding at beginning of year |
|
|
212,134 |
|
$ |
16.60 |
|
|
|
|
$ |
|
|
|
Granted |
|
|
— |
|
|
— |
|
|
— |
|
|
— |
|
|
Exercised |
|
|
— |
|
|
— |
|
|
— |
|
|
— |
|
|
Forfeited or expired |
|
|
(85,506 |
) |
|
16.75 |
|
|
|
|
|
|
|
|
Outstanding at end of year |
|
|
126,628 |
|
$ |
16.50 |
|
|
1.42 |
|
$ |
— |
|
|
|
|
|
|
|
|
|
|
|
|
|
|
|
|
|
Exercisable at end of year |
|
|
124,628 |
|
$ |
16.54 |
|
|
1.38 |
|
$ |
— |
|
|
|
|
|
|
|
|
|
|
|
|
|
|
|
|
|
Fully vested and expected to vest |
|
|
126,628 |
|
$ |
16.50 |
|
|
1.42 |
|
$ |
— |
|
Activity in the stock option plan during 2007 follows:
|
|
|
|
|
|
|
|
|
|
|
|
|
|
|
|
|
|
Shares |
|
Weighted |
|
Weighted |
|
Aggregate |
|
||||
|
Outstanding at beginning of year |
|
|
387,325 |
|
$ |
15.10 |
|
|
— |
|
$ |
— |
|
|
Granted |
|
|
— |
|
|
— |
|
|
— |
|
|
— |
|
|
Exercised |
|
|
(110,005 |
) |
|
10.78 |
|
|
— |
|
|
— |
|
|
Forfeited or expired |
|
|
(65,186 |
) |
|
17.48 |
|
|
— |
|
|
— |
|
|
Outstanding at end of year |
|
|
212,134 |
|
$ |
16.60 |
|
|
2.80 |
|
$ |
— |
|
|
|
|
|
|
|
|
|
|
|
|
|
|
|
|
|
Exercisable at end of year |
|
|
203,370 |
|
$ |
16.72 |
|
|
2.62 |
|
$ |
— |
|
|
|
|
|
|
|
|
|
|
|
|
|
|
|
|
|
Fully vested and expected to vest |
|
|
211,886 |
|
$ |
16.60 |
|
|
2.80 |
|
$ |
— |
|
Information related to the stock option plan during each year follows:
|
|
|
|
|
|
|
|
|
|
|
|
|
|
|
2009 |
|
2008 |
|
2007 |
|
|||
|
Intrinsic value of options exercised |
|
$ |
— |
|
$ |
— |
|
$ |
239 |
|
|
Cash received from option exercises |
|
|
— |
|
|
— |
|
|
1,184 |
|
|
Tax benefit realized from option exercises |
|
|
— |
|
|
— |
|
|
94 |
|
As of December 31, 2009, there was no unrecognized compensation cost related to nonvested stock options granted under the Plan.
|
|
|
|
|
75 |
|
|
|
BAYLAKE CORP. |
|
NOTES TO CONSOLIDATED FINANCIAL STATEMENTS |
|
December 31, 2009, 2008 and 2007 |
|
(Dollar amounts in thousands) |
NOTE 19 - CONDENSED FINANCIAL INFORMATION - PARENT COMPANY ONLY
CONDENSED BALANCE SHEETS
December 31
|
|
|
|
|
|
|
|
|
|
|
|
2009 |
|
2008 |
|
||
|
ASSETS |
|
|
|
|
|
|
|
|
Cash and cash equivalents |
|
$ |
2,112 |
|
$ |
1,208 |
|
|
Receivable from subsidiary |
|
|
19 |
|
|
28 |
|
|
Deferred income taxes |
|
|
16 |
|
|
15 |
|
|
Unamortized debt offering costs |
|
|
162 |
|
|
— |
|
|
|
|
|
|
|
|
|
|
|
Income tax receivable |
|
|
49 |
|
|
— |
|
|
Investment in subsidiaries |
|
|
93,692 |
|
|
83,826 |
|
|
|
|
|
|
|
|
|
|
|
Total assets |
|
$ |
96,050 |
|
$ |
85,077 |
|
|
|
|
|
|
|
|
|
|
|
LIABILITIES AND STOCKHOLDERS’ EQUITY |
|
|
|
|
|
|
|
|
Liabilities |
|
|
|
|
|
|
|
|
Other payables |
|
$ |
— |
|
$ |
20 |
|
|
Interest Payable |
|
|
2 |
|
|
3 |
|
|
Debentures |
|
|
16,100 |
|
|
16,100 |
|
|
Convertible promissory notes |
|
|
5,350 |
|
|
— |
|
|
Total liabilities |
|
|
21,452 |
|
|
16,121 |
|
|
|
|
|
|
|
|
|
|
|
Stockholders’ equity |
|
|
74,598 |
|
|
68,954 |
|
|
|
|
|
|
|
|
|
|
|
Total liabilities and stockholders’ equity |
|
$ |
96,050 |
|
$ |
85,077 |
|
|
|
|
|
|
76 |
|
|
|
BAYLAKE CORP. |
|
NOTES TO CONSOLIDATED FINANCIAL STATEMENTS |
|
December 31, 2009, 2008 and 2007 |
|
(Dollar amounts in thousands) |
NOTE 19 - CONDENSED FINANCIAL INFORMATION - PARENT COMPANY ONLY (continued)
CONDENSED STATEMENTS OF OPERATIONS
Years ended December 31
|
|
|
|
|
|
|
|
|
|
|
|
|
|
|
2009 |
|
2008 |
|
2007 |
|
|||
|
Income |
|
|
|
|
|
|
|
|
|
|
|
Dividends from subsidiaries |
|
$ |
— |
|
$ |
— |
|
$ |
4,500 |
|
|
Interest income |
|
|
18 |
|
|
37 |
|
|
87 |
|
|
Total income |
|
|
18 |
|
|
37 |
|
|
4,587 |
|
|
|
|
|
|
|
|
|
|
|
|
|
|
Expenses |
|
|
|
|
|
|
|
|
|
|
|
Interest |
|
|
529 |
|
|
794 |
|
|
1,089 |
|
|
Other |
|
|
107 |
|
|
116 |
|
|
70 |
|
|
Total expenses |
|
|
636 |
|
|
910 |
|
|
1,159 |
|
|
|
|
|
|
|
|
|
|
|
|
|
|
Income (loss) before equity in undistributed net income of subsidiaries |
|
|
(618 |
) |
|
(873 |
) |
|
3,428 |
|
|
|
|
|
|
|
|
|
|
|
|
|
|
Equity in undistributed net income (loss) of subsidiaries (dividends in excess of earnings) |
|
|
4,705 |
|
|
(9,241 |
) |
|
(3,627 |
) |
|
Income (loss) before income taxes |
|
|
4,087 |
|
|
(10,114 |
) |
|
(199 |
) |
|
Income tax benefit |
|
|
(242 |
) |
|
(297 |
) |
|
(365 |
) |
|
|
|
|
|
|
|
|
|
|
|
|
|
Net income (loss) |
|
$ |
4,329 |
|
$ |
(9,817 |
) |
$ |
166 |
|
|
|
|
|
|
77 |
|
|
|
BAYLAKE CORP. |
|
NOTES TO CONSOLIDATED FINANCIAL STATEMENTS |
|
December 31, 2009, 2008 and 2007 |
|
(Dollar amounts in thousands) |
NOTE 19 - CONDENSED FINANCIAL INFORMATION - PARENT COMPANY ONLY (continued)
CONDENSED STATEMENT OF CASH FLOWS
Years ended December 31
|
|
|
|
|
|
|
|
|
|
|
|
|
|
|
2009 |
|
2008 |
|
2007 |
|
|||
|
Cash flows from operating activities: |
|
|
|
|
|
|
|
|
|
|
|
Net income (loss) |
|
$ |
4,329 |
|
$ |
(9,817 |
) |
$ |
166 |
|
|
Adjustments to reconcile net income to net cash provided by operating activities: |
|
|
|
|
|
|
|
|
|
|
|
Undistributed (earnings) loss of subsidiary (dividends in excess of earnings) |
|
|
(4,705 |
) |
|
9,241 |
|
|
3,627 |
|
|
Stock Compensation Expense |
|
|
2 |
|
|
(44 |
) |
|
21 |
|
|
Amortization of debt issue costs |
|
|
12 |
|
|
— |
|
|
— |
|
|
Net amortization of securities |
|
|
— |
|
|
— |
|
|
(1 |
) |
|
Net change in intercompany receivable |
|
|
9 |
|
|
2,203 |
|
|
(2,205 |
) |
|
Tax benefit from exercise of stock options |
|
|
— |
|
|
8 |
|
|
(94 |
) |
|
Other changes, net |
|
|
(69 |
) |
|
34 |
|
|
92 |
|
|
Net cash provided by (used in) operating activities |
|
|
(422 |
) |
|
1,625 |
|
|
1,606 |
|
|
|
|
|
|
|
|
|
|
|
|
|
|
Cash flows from investing activities: |
|
|
|
|
|
|
|
|
|
|
|
Proceeds from sale of securities |
|
|
— |
|
|
— |
|
|
1,000 |
|
|
|
|
|
|
|
|
|
|
|
|
|
|
Cash flows from financing activities: |
|
|
|
|
|
|
|
|
|
|
|
Proceeds from issuance of convertible promissory notes |
|
|
5,350 |
|
|
— |
|
|
— |
|
|
Debt issuance costs |
|
|
(174 |
) |
|
— |
|
|
— |
|
|
Surplus contributed to Bank |
|
|
(3,850 |
) |
|
— |
|
|
— |
|
|
|
|
|
|
|
|
|
|
|
|
|
|
Proceeds from exercise of stock options |
|
|
— |
|
|
— |
|
|
1,184 |
|
|
Tax benefit (expense) from exercise of stock options |
|
|
— |
|
|
(8 |
) |
|
94 |
|
|
Treasury stock repurchases |
|
|
— |
|
|
— |
|
|
(1,823 |
) |
|
Dividend reinvestment plan |
|
|
— |
|
|
265 |
|
|
1,096 |
|
|
Dividends paid |
|
|
— |
|
|
(1,262 |
) |
|
(5,022 |
) |
|
Net cash used in financing activities |
|
|
1,326 |
|
|
(1,005 |
) |
|
(4,471 |
) |
|
|
|
|
|
|
|
|
|
|
|
|
|
Net change in cash and cash equivalents |
|
|
904 |
|
|
620 |
|
|
(1,865 |
) |
|
|
|
|
|
|
|
|
|
|
|
|
|
Beginning cash and cash equivalents |
|
|
1,208 |
|
|
588 |
|
|
2,453 |
|
|
|
|
|
|
|
|
|
|
|
|
|
|
Ending cash and cash equivalents |
|
$ |
2,112 |
|
$ |
1,208 |
|
$ |
588 |
|
|
|
|
|
|
78 |
ITEM 9. CHANGES IN AND DISAGREEMENTS WITH ACCOUNTANTS ON ACCOUNTING AND FINANCIAL DISCLOSURE
None.
ITEM 9A(T). CONTROLS AND PROCEDURES
Disclosures Controls and Procedures: Our management, with the participation of our Chief Executive Officer and Chief Financial Officer, has evaluated the effectiveness of our disclosure controls and procedures (as such term is defined in Rules 13a-15(e) and 15d-15(e) under the Securities Exchange Act of 1934, as amended (the “Exchange Act”)) as of December 31, 2009. Based on such evaluation, our Chief Executive Officer and Chief Financial Officer have concluded that, as of the end of such period, our disclosure controls and procedures are effective in recording, processing, summarizing and reporting, on a timely basis, information required to be disclosed by us in the reports that we file or submit under the Exchange Act.
There are inherent limitations in the effectiveness of any system of internal control over financial reporting, including the possibility of human error and circumvention or overriding of controls. Accordingly, even an effective system of internal control over financial reporting can provide only reasonable assurance with respect to financial statement preparation. Projections of any evaluation of effectiveness to future periods are subject to the risks that controls may become inadequate because of changes in conditions or that the degree of compliance with the policies or procedures may deteriorate.
Management’s Report on Internal Control over Financial Reporting: The report of our management on our internal control over financial reporting appears on page 47 of this Annual Report on Form 10-K.
Changes in Internal Control Over Financial Reporting: There have not been any changes in our internal control over financial reporting (as such term is defined in Rules 13a-15(f) and 15d-15(f) under the Exchange Act) that have occurred during the quarter ended December 31, 2008, that have materially affected or are reasonably likely to materially affect our internal control over financial reporting.
None.
ITEM 10. DIRECTORS, EXECUTIVE OFFICERS AND CORPORATE GOVERNANCE
The information set forth under the sections titled “Proposal No. 1, Election of Directors,” “Information on Executive Officers” and “Compliance with Section 16(a) of the Exchange Act” contained in the definitive proxy statement for our 2010 Annual Meeting of Stockholders is incorporated herein by reference.
ITEM 11. EXECUTIVE COMPENSATION
The information set forth under the sections titled “Director Fees and Benefits”, “Compensation Discussion and Analysis”, “Board of Directors Compensation Committee Report on Management Compensation”, and “Compensation Committee Interlocks and Insider Participation” contained in the definitive proxy statement for our 2010 Annual Meeting of Stockholders is incorporated herein by reference.
ITEM 12. SECURITY OWNERSHIP OF CERTAIN BENEFICIAL OWNERS AND MANAGEMENT AND RELATED STOCKHOLDER MATTERS
The information set forth under the section titled “Ownership of Baylake Common” contained in the definitive proxy statement for our 2010 Annual Meeting of Stockholders is incorporated herein by reference.
|
|
|
|
|
79 |
Equity compensation plan information:
The following table sets forth information regarding options and shares reserved for future issuance under the equity compensation plans as of December 31, 2009.
|
|
|
|
|
|
|
|
|
|
|
|
|
Plan Category |
|
Number of securities to |
|
Weighted-average |
|
Number of securities |
|
|||
|
Equity compensation plans approved by security holders |
|
|
63,628 |
|
$ |
17.91 |
|
|
— |
|
|
Equity compensation plans not approved by security holders ** |
|
|
10,000 |
|
|
14.15 |
|
|
— |
|
|
Total |
|
|
73,628 |
|
$ |
17.40 |
|
|
— |
|
** These options represent options granted with the same terms and conditions as those granted under the 1993 Stock Option Plan, as amended, but after expiration of that Plan. The total number of options granted was less than the total authorized under the Plan, which was adopted with shareholder approval. We previously announced that we do not intend to grant further stock options.
ITEM 13. CERTAIN RELATIONSHIPS AND RELATED TRANSACTIONS, AND DIRECTOR INDEPENDENCE
Information set forth in the section titled “Certain Transactions with Management” in the definitive proxy statement for our 2010 Annual Meeting of Stockholders is incorporated herein by reference.
ITEM 14. PRINCIPAL ACCOUNTANT FEES AND SERVICES
Information set forth in the section titled “Principal Accountant Fees and Services” in the definitive proxy statement for our 2010 Annual Meeting of Stockholders is incorporated herein by reference.
|
|
|
|
|
80 |
ITEM 15. EXHIBITS AND FINANCIAL STATEMENT SCHEDULES
(a) 1 and 2
The consolidated financial statements and supplementary data contained in Item 8 of this report are filed as part of this report. All schedules are omitted because of the absence of the conditions under which they are required or because the required information is included in the consolidated financial statements or related notes.
(a) 3
See Item 15(b) below
(b) Exhibits Required by Item 601 of Regulation S-K
(c) Financial Statement Schedules
All schedules have been omitted as the required information is either inapplicable or included in the Notes to Consolidated Financial Statements contained in Part II, Item 8 of this Form 10-K.
Reference is made to the Exhibit Index following the signatures for exhibits filed as part of this report.
Pursuant to the requirements of Section 13 or 15 (d) of the Securities Exchange Act of 1934, the registrant has duly caused this report to be signed on its behalf by the undersigned, thereunto duly authorized.
|
|
|
|
|
|
|
BAYLAKE CORP. |
|
|
|
|
By: |
/s/Robert J. Cera |
|
|
|
|
Robert J. Cera |
|
|
|
|
President and Chief Executive Officer and |
|
|
|
|
Director (Principal Executive Officer) |
|
|
|
|
|
|
|
|
By: |
/s/Kevin L. LaLuzerne |
|
|
|
|
Kevin L. LaLuzerne |
|
|
|
|
Chief Financial Officer and Treasurer |
|
|
|
|
(Principal Financial and Accounting Officer) |
|
Date: March 15, 2010
POWER OF ATTORNEY
KNOW ALL MEN BY THESE PRESENTS, that each individual whose signature appears below hereby designates and appoints Robert J. Cera and Kevin L. LaLuzerne, and each of them, any one of whom may act without the joinder of the other, as such person’s true and lawful attorney-in-fact and agents (the “Attorneys-in-Fact”) with full power of substitution and resubstitution, for such person and in such person’s name, place and stead, in any and all capacities, to sign any and all amendments to this report, and to file the same, with all exhibits thereto, and other documents in connection therewith, the Securities and Exchange Commission and any state securities commission, granting unto said Attorneys-in-Fact and agents, and each of them, full power and authority to do and perform each and every act and thing requisite and necessary to be done in and about the premises, as fully to all intents and purposes as he might or could do in person, hereby ratifying and conforming all that said Attorneys-in-Fact and agents or any of them, or their or his substitutes, may lawfully do or cause to be done by virtue hereof.
|
|
|
|
|
|
|
|
|
|
|
|
|
81 |
Pursuant to the requirements of the Securities Exchange Act of 1934 this report has been signed below by the following persons on behalf of the registrant and in the capacities and on the dates indicated.
|
|
|
|
|
|
/s/ Thomas L. Herlache |
|
/s/ Richard A. Braun |
|
|
Thomas L. Herlache, Director |
Richard A. Braun, Director |
||
|
Director |
|
Co-Chairman of the Board |
|
|
|
|
|
|
|
/s/ Kevin L. LaLuzerne |
|
/s/ Robert W. Agnew |
|
|
Kevin L. LaLuzerne, Chief Financial Officer |
Robert W. Agnew, Director |
||
|
and Treasurer (Principal Financial and |
Co-Chairman of the Board |
||
|
Accounting Officer) |
|
|
|
|
|
|
|
|
|
/s/ Dee Geurts-Bengtson |
|
/s/ Robert J. Cera |
|
|
Dee Geurts-Bengtson, Director |
Robert J. Cera, President and Chief Executive |
||
|
|
|
Officer and Director (Principal Executive |
|
|
|
|
Officer) |
|
|
|
|
|
|
|
/s/ George Delveaux, Jr. |
|
/s/ Roger G. Ferris |
|
|
George Delveaux, Jr., Director |
Roger G. Ferris, Director |
||
|
|
|
|
|
|
/s/ Joseph J. Morgan |
|
/s/ William Parsons |
|
|
Joseph J. Morgan, Director |
William Parsons, Director |
||
|
|
|
|
|
|
/s/ Terrence R. Fulwiler |
|
/s/ Paul Jay Sturm |
|
|
Terrence R. Fulwiler, Director |
Paul Jay Sturm, Director |
|
|
|
|
|
|
|
|
/s/ Louis J. “Rick” Jeanquart |
|
|
|
|
Louis J. “Rick” Jeanquart, Director |
|
|
|
* Each of the above signatures is affixed as of March 15, 2010.
|
|
|
|
|
82 |
|
|
|
|
|
|
Exhibit No. |
|
Description |
|
|
|
|||
|
3.1 |
|
Articles of Incorporation, as amended through July 3, 2001, incorporated by reference to Exhibit 4.1 from the Company’s Registration Statement on Form S-3 (File No. 333-118857) filed on September 8, 2004 |
|
|
|
|
|
|
|
3.2 |
|
Articles of Amendment to Articles of Incorporation, incorporated by reference to Exhibit 3.1 from the Company’s Quarterly Report on Form 10-Q for the quarter ended June 30, 2007 |
|
|
|
|
|
|
|
3.3 |
|
Composite Articles of Incorporation, incorporated by reference to Exhibit 3.2 from the Company’s Quarterly Report on Form 10-Q for the quarter ended June 30, 2007 |
|
|
|
|
|
|
|
3.4 |
|
Bylaws, as amended through February 21, 1996, incorporated by reference to Exhibit 4.2 from the Company’s Registration Statement on Form S-3 (File No. 333-118857) filed on September 8, 2004 |
|
|
|
|
|
|
|
4.1 |
|
Advances, Collateral Pledge, and Security Agreement dated as of August 8, 1997 between Baylake Bank and Federal Home Loan Bank of Chicago, incorporated by reference to Exhibit 4.1 from the Company’s Annual Report on Form 10-K for the fiscal year ended December 31, 2006 |
|
|
|
|
|
|
|
10.1 |
|
Baylake Bank’s Deferred Compensation Program with Thomas L. Herlache*, incorporated by reference to Exhibit 10.3 from the Company’s Annual Report on Form 10-K for the fiscal year ended December 31, 1993 |
|
|
|
|
|
|
|
10.2 |
|
Baylake Bank’s Deferred Compensation and Salary Continuation Agreement with Richard A. Braun*, incorporated by reference to Exhibit 10.5 from the Company’s Annual Report on Form 10-K for the fiscal year ended December 31, 1993 |
|
|
|
|
|
|
|
10.3 |
|
Deferred Compensation Plan for Selected Directors of Baylake Bank (Money Purchase Compensation Plan) dated December 19, 1995*, incorporated by reference to Exhibit 10.3 from the Company’s Annual Report on Form 10-K for the fiscal year ended December 31, 2006 |
|
|
|
|
|
|
|
10.4 |
|
Baylake Corp. Stock Purchase Plan*, incorporated by reference to Exhibit 4 from the Company’s Form S-8 filed on February 10, 1998 |
|
|
|
|
|
|
|
10.5 |
|
Baylake Corp. 1993 Stock Option Plan, as amended in 1998*, incorporated by reference to Exhibit 99.1 from the Company’s Form S-8 filed on September 21, 1998 |
|
|
|
|
|
|
|
10.6 |
|
Baylake Bank Supplemental Executive Retirement Plan*, incorporated by reference to Exhibit 10.8 from the Company’s Annual Report on Form 10-K for the fiscal year ended December 31, 2004 |
|
|
|
|
|
|
|
10.7 |
|
Employment Agreement dated as of June 30, 2006 between Baylake Bank and Robert J. Cera*, incorporated by reference to Exhibit 10.7 from the Company’s Annual Report on Form 10-K for the fiscal year ended December 31, 2006 |
|
|
|
|
|
|
|
10.8 |
|
Separation Agreement dated January 30, 2007 between Baylake Bank and Steven Jennerjohn*, incorporated by reference to Exhibit 10.1 from the Company’s Current Report on Form 8-K filed on February 15, 2007 |
|
|
|
|
|
|
83 |
|
|
|
|
|
10.9 |
|
Executive Employee Salary Continuation Agreement for Thomas L. Herlache dated October 1, 1999*, incorporated by reference to Exhibit 10.9 from the Company’s Annual Report on Form 10-K for the Fiscal year ended December 31, 2006 |
|
|
|
|
|
10.10 |
|
Preferred Compensation Agreement, incorporated by reference to Exhibit 10.1 from the Company’s Quarterly Report on Form 10-Q for the quarter ended March 31, 2007* |
|
|
|
|
|
10.11 |
|
Non-Qualified Retirement Trust incorporated by reference from the Company’s Quarterly Report on Form 10-Q for the quarter ended March 31, 2007* |
|
|
|
|
|
10.12 |
|
Amendments to Deferred Compensation Agreements with Thomas L. Herlache and Summary of Benefits for serving as Chairman, incorporated by reference from the Company’s Quarterly Report on Form 10-Q for the quarter ended June 30, 2007* |
|
|
|
|
|
10.13 |
|
Description of employment arrangement between the Company and Joseph L. Hoffmeyer, incorporated by reference to the Company’s Current Report on For 8-K dated December 5, 2008* |
|
|
|
|
|
16.1 |
|
Letter of Crowe Chizek and Company LLC regarding change in independent registered public accounting firm, incorporated by reference to Exhibit 16.1 of the Company’s Current Report on Form 8-K filed on May 5, 2008 |
|
|
|
|
|
21.1 |
|
List of Subsidiaries |
|
|
|
|
|
23.1 |
|
Consent of Baker Tilly Virchow Krause, LLP |
|
|
|
|
|
23.2 |
|
Consent of Crowe Horwath, LLP |
|
|
|
|
|
24.1 |
|
Power of Attorney (contained on the Signature Page) |
|
|
|
|
|
31.1 |
|
Certification of the Chief Executive Officer pursuant to Rule 13a-14(a) under the Securities Exchange Act of 1934, as amended |
|
|
|
|
|
31.2 |
|
Certification of the Chief Financial Officer pursuant to Rule 13a-14(a) under the Securities Exchange Act of 1934, as amended |
|
|
|
|
|
32.1 |
|
Certification of the Chief Executive Officer pursuant to Rule 13a-14(b) under the Securities Exchange Act of 1934, as amended and 18 U.S.C. Section 1350 |
|
|
|
|
|
32.2 |
|
Certification of the Chief Financial Officer pursuant to Rule 13a-14(b) under the Securities Exchange Act of 1934, as amended and 18 U.S.C. Section 1350 |
|
|
|
|
|
|
|
* Designates compensation plans or agreements |
|
|
|
|
|
84 |