Attached files
Table of Contents
UNITED STATES
SECURITIES AND EXCHANGE COMMISSION
Washington, D.C. 20549
FORM 10-K
| x | ANNUAL REPORT PURSUANT TO SECTION 13 OR 15(D) OF THE SECURITIES EXCHANGE ACT OF 1934 |
For the fiscal year ended December 31, 2009
| ¨ | TRANSITION REPORT PURSUANT TO SECTION 13 OR 15(d) OF THE SECURITIES EXCHANGE ACT OF 1934 |
For the transition period from to
Commission File Number: 0-22065
RADIANT SYSTEMS, INC.
(Exact name of registrant as specified in its charter)
| Georgia | 11-2749765 | |
| (State or other jurisdiction of incorporation or organization) |
(I.R.S. Employer Identification No.) |
| 3925 Brookside Parkway, Alpharetta, Georgia | 30022 | |
| (Address of principal executive offices) | (Zip Code) |
(770) 576-6000
(Registrant’s telephone number, including area code)
Securities registered pursuant to Section 12(b) of the Act: None
Securities registered pursuant to Section 12(g) of the Act: Common Stock, no par value
Indicate by check mark whether the registrant is a well-known seasoned issuer, as defined in Rule 405 of the Securities Act. Yes ¨ No x
Indicate by check mark if the registrant is not required to file reports pursuant to Section 13 or Section 15(d) of the Act. Yes ¨ No x
Indicate by check mark whether the registrant (1) has filed all reports required to be filed by Section 13 or 15(d) of the Securities Exchange Act of 1934 during the preceding 12 months (or for such shorter period that the registrant was required to file such reports), and (2) has been subject to such filing requirements for the past 90 days. Yes x No ¨
Indicate by check mark whether the registrant has submitted electronically and has posted on its corporate website, if any, every Interactive Data File required to be submitted and posted pursuant to Rule 405 of Regulation S-T (§ 232.405 of this chapter) during the preceding 12 months (or for such shorter period that the registrant was required to submit and post such files). Yes ¨ No ¨
Indicate by check mark if disclosure of delinquent filers pursuant to Item 405 of Regulation S-K (§ 229.405 of this chapter) is not contained herein, and will not be contained, to the best of registrant’s knowledge, in definitive proxy or information statements incorporated by reference in Part III of this Form 10-K or any amendment to this Form 10-K. x
Indicate by check mark whether the registrant is a large accelerated filer, an accelerated filer, a non-accelerated filer, or a smaller reporting company. See the definitions of “large accelerated filer,” “accelerated filer” and “smaller reporting company” in Rule 12b-2 of the Exchange Act. (Check one):
| Large accelerated filer | ¨ | Accelerated filer | x | |||
| Non-accelerated filer | ¨ (Do not check if a smaller reporting company) | Smaller reporting company | ¨ | |||
Indicate by check mark whether the registrant is a shell company (as defined in Rule 12b-2 of the Exchange Act). Yes ¨ No x
As of June 30, 2009, the aggregate market value of the registrant’s common stock held by non-affiliates of the registrant was approximately $201.7 million based on the closing sales price ($8.30) as reported on The NASDAQ Stock Market as of June 30, 2009. For the purpose of this response, officers, directors and holders of 10% or more of the registrant’s common stock are considered to be affiliates of the registrant at that date.
As of March 5, 2010, there were 33,390,214 outstanding shares of the registrant’s no par value common stock.
DOCUMENTS INCORPORATED BY REFERENCE
Portions of the Registrant’s definitive proxy statement to be delivered to shareholders in connection with the Registrant’s 2010 Annual Meeting of Shareholders are incorporated by reference in response to Part III of this report.
Table of Contents
Table of Contents
Caution Regarding Forward-Looking Statements
This Annual Report on Form 10-K of Radiant Systems, Inc. and its subsidiaries (“Radiant,” “Company,” “we,” “us,” or “our”) contains forward-looking statements. All statements in this Annual Report on Form 10-K, including those made by the management of Radiant, other than statements of historical fact, are forward-looking statements. Examples of forward-looking statements include statements regarding Radiant’s future financial results, operating results, business strategies, projected costs, products, competitive positions, management’s plans and objectives for future operations, and industry trends. These forward-looking statements are based on management’s estimates, projections and assumptions as of the date hereof and include the assumptions that underlie such statements. Forward-looking statements may contain words such as “may,” “will,” “should,” “could,” “would,” “expect,” “plan,” “anticipate,” “believe,” “estimate,” “predict,” “potential,” and “continue,” the negative of these terms, or other comparable terminology. Any expectations based on these forward-looking statements are subject to risks and uncertainties and other important factors, including those discussed in this report, including the sections titled “Risk Factors” and “Management’s Discussion and Analysis of Financial Condition and Results of Operations.” Other risks and uncertainties are disclosed in Radiant’s prior Securities and Exchange Commission (“SEC”) filings. These and many other factors could affect Radiant’s future financial condition and operating results and could cause actual results to differ materially from expectations based on forward-looking statements made in this document or elsewhere by Radiant or on its behalf. Radiant undertakes no obligation to revise or update any forward-looking statements.
The following information should be read in conjunction with the Consolidated Financial Statements and the accompanying Notes to Consolidated Financial Statements included in this Annual Report.
| ITEM 1. | BUSINESS |
General
Founded in 1985 and headquartered in Alpharetta, Georgia, we are a leading provider of innovative technology focused on the development, installation and delivery of solutions for managing site operations in the hospitality and retail industries. Our principal executive office is located at 3925 Brookside Parkway, Alpharetta, Georgia 30022 and our telephone number is (770) 576-6000.
We focus on delivering site systems, including point-of-sale, or POS, self-service kiosks, solution peripherals, mobile ordering and payment devices, back-office systems, site management technology and business services such as customer loyalty programs, electronic gift card management, comprehensive reporting systems management, electronic payment processing, centralized data management and ongoing maintenance and support services designed specifically for our two reportable segments: (i) Hospitality and (ii) Retail. For selected financial information about our business segments, see Note 14 to the consolidated financial statements contained elsewhere in this report. Our offerings include software products, site hardware, professional services and support services. Each product can be purchased independently or as a suite of integrated products to address the customer’s specific business needs. We believe these products and services enable our customers to drive top-line growth and improve bottom-line performance.
We offer best-of-breed solutions designed for ease of integration with operators’ existing infrastructures. Our technology enables hospitality and retail operators to improve customer service while reducing costs. Our solutions provide visibility and control at the site, field and headquarters levels. Additionally, we focus on addressing the unique requirements of the highly specialized environments in which our customers operate. These environments require a high degree of reliability, specialized functionality and peripheral compatibility. Using our point-of-sale, customer self-service, back-office technology and business services, our customers are able to improve customer service and loyalty, improve speed of service, increase revenue per transaction, and reduce fraud and shrink. Our full line of open, standards-based hardware allows operators to deploy advanced technology built specifically for the environment in which they operate.
We believe our current generation of point-of-sale, customer self-service and hand-held ordering and payment devices, which primarily utilize Windows Server, Windows 7, Windows Embedded, and Windows CE operating systems, represents an innovative platform based on an open, modular software and hardware architecture that offers increased functionality and stability compared to other systems in the marketplace.
Recent acquisitions, listed in order from most current to least current, are summarized below:
| • | In July 2008, we acquired Orderman GmbH (“Orderman”), one of the leading manufacturers of wireless handheld ordering and payment devices for the hospitality industry. Orderman has provided innovative mobile solutions since 1994, and distributes its solutions through a reseller network of partners that have deployed their handheld devices predominately in Europe. The results of these operations are reported under our Hospitality segment. |
| • | In May 2008, we acquired substantially all of the assets of Jadeon, Inc. (“Jadeon”), one of our resellers in California. Jadeon had been delivering and supporting our hospitality point-of-sale solutions since 2001 and offered a full range of technology systems and implementation and support services throughout the West coast. The results of these operations are reported under our Hospitality segment. |
| • | In April 2008, we acquired Hospitality EPoS Systems Ltd. (“Hospitality EPoS”), a technology supplier to the U.K. hospitality market. Hospitality EPoS provided capabilities for sales, implementation and support services and represented our Aloha suite of hospitality products. The results of these operations are reported under our Hospitality segment. |
| • | In January 2008, we acquired Quest Retail Technology Pty Ltd. (“Quest”), a global provider of point-of-sale and back office solutions to stadiums, arenas, convention centers, race courses, theme parks, restaurants, bars and clubs. The acquisition of Quest enables us to strengthen our presence in the stadium, park and arena marketplace, while expanding our installed terminal base both domestically and internationally. The results of these operations are reported under our Hospitality segment. |
To the extent that we believe acquisitions, joint ventures and business partnerships can better position us to serve our current segments, we will continue to pursue such opportunities in the future.
2
Table of Contents
Hospitality Segment
We provide integrated technology solutions that meet the needs of a wide variety of hospitality businesses throughout the world. Across the hospitality industry, we have multiple product lines that support the needs of restaurants, movie theatres and large entertainment venues. The majority of revenue in our Hospitality segment is derived from restaurants using our Aloha suite of products.
Food service operators of all sizes throughout the world face a highly competitive and challenging environment in which consumers demand convenience and great service while having an increasing number of dining options at their disposal. To meet these challenges, operators require new technology that enables them to improve their operations while reducing the total cost of ownership for their technology solution. We believe our technology precisely fills this need, providing the hospitality industry the most compelling and competitive solution offerings to date.
Our hospitality solutions are comprehensive, including store systems, corporate systems and supporting services. The store systems offering is comprised of innovative hardware, advanced point-of-sale software and related modules for automating store operations. These modules include applications for processing payments, serving takeout and delivery customers, improving kitchen production, enhancing guest management and enabling self-service kiosks and handheld ordering and payment devices. The corporate systems solution includes world-class data center hosting capabilities and software platforms. These provide enterprise-wide reporting and alerting, management of labor and inventory costs, loss prevention, store systems management, stored value and loyalty applications. When combined, the store systems and corporate systems solutions provide integrated functionality. The resulting capabilities allow operators of diverse sizes in both the U.S. and international markets to achieve what we believe to be superior operational performance, while delivering exceptional consumer experiences. In addition to being tightly integrated, the components of our hospitality solutions are also modular and open, allowing operators to purchase components in stages, incorporating them into existing systems. This maximizes both customer choice and our opportunities to engage new customers. We believe this approach allows us to win the business of more customers and increase our share of their technology spending over time.
Support services include custom software development, consulting, help desk support and field services. One or more of these services is utilized by many of our customers in the hospitality industry, promoting the development of long-term relationships with highly satisfied customers. We sell our hospitality solution directly to large multi-unit operations with sophisticated requirements for corporate support. Smaller operators are served by our network of resellers – valuable business partners who best understand and serve the needs of local entrepreneurs.
Our back-office solutions are known as some of the industry’s easiest systems for customers to use. The combination of our back-office applications and the Aloha suite of products, including Aloha Quick Service POS and Aloha Table Service POS, Aloha Insight, Aloha Stored Value and Aloha Loyalty, create an end-to-end solution designed to help operators minimize operational costs and maximize profits. We have enhanced our back-office offerings in recent years through the products obtained in the acquisitions of MenuLink and Quest.
Within our entertainment business, we believe we have a proven track record of delivering enhanced value for cinema operators, including offerings such as expanded concessions and foodservice, self-service ticketing and concessions, film management and gift card programs. With over 36,000 cinema screens at more than 6,100 sites in the United States, cinema operators are focused on implementing cost controls from headquarters. We believe that cinema operators can improve customer service and profitability by implementing integrated site and film management systems that enable them to speed customer transactions, reduce lines, manage inventory, and schedule labor to meet variations in traffic. Due to the lack of end user market growth and our high penetration in this market, we do not expect growth to occur in the cinema operator market over the near term, but believe this market has synergies with the stadium, park and arena marketplace.
We believe that the international hospitality market represents a continued growth opportunity in future years. To service this market, we have expanded our international presence through adding resellers and direct customers. For the fiscal years ended December 31, 2009, 2008 and 2007, approximately 15%, 10% and 6%, respectively, of our Hospitality segment revenues were from international customers.
Customers who have licensed or purchased our Hospitality products and services include Back Yard Burgers, Benihana, Bruegger’s Enterprises, Burger King Corporation, Cafe Rio Mexican Grill, California Pizza Kitchen, CEC Entertainment, Checker’s Drive-In Restaurants, Chick-fil-A, Chipotle Mexican Grill, Choice Hotels International, Church’s Chicken, Clearview Cinemas, Clubcorp Financial Management Company, Coors Field (home of the Colorado Rockies), Cosi, Cowboys Stadium, Del Taco, Denny’s, Diedrich Coffee, Dolphins Stadium, Don Pablo’s, Dunkin’ Brands, Fatburger Corporation, FedEx Field (home of the Washington Redskins), Focus Brands, Harkins Theatres, Hillstone Restaurant Group, Huddle House, Invesco Field (home of the Denver Broncos), Jamba Juice Company, Jason’s Deli, Joe’s Crab Shack Holdings, Johnny Rockets International, Krispy Kreme Doughnut Corporation, Landry’s Restaurants, Larry H Miller Megaplex Theatres, Live Nation, Morton’s of Chicago, New World Restaurant Group, Noodles & Company, Peet’s Coffee & Tea, P.F. Chang’s China Bistro, Reading International, Red Robin International, Rock Bottom Restaurants, Romano’s Macaroni Grill, Sbarro, Showcase Cinemas, Sizzler USA Restaurants, Smokey Bones, Staples Center (home of the Los Angeles Lakers and Los Angeles Clippers), Ted’s Montana Grill, Texas Roadhouse, The Krystal Company, The Marcus Corporation, United Center (home of the Chicago Bulls and Chicago Blackhawks), Wendy’s/Arby’s Group, Which Wich, Wrigley Field (home of the Chicago Cubs), Yankee Stadium and Yoshinoya America, and Zoe’s Kitchen.
3
Table of Contents
Retail Segment
Our Retail segment provides store and office-oriented technologies for the automation of retail businesses spanning from specialized retailers to multinational convenience store chains. Solutions provided include software, hardware and services, either as complete turn-key solutions or as point-solutions in a best-of-breed configuration. Our retail solutions encompass point-of-sale systems, integrated back-office systems, fuel-dispenser controllers, self-service kiosks, site management technology, payment processing, systems management, and centralized data management.
Our resellers in the specialty retail business deliver our hardware platforms in conjunction with our CounterPoint software, which has been adapted to over 20 different retail concepts ranging from home and garden warehouses to shoe stores. In addition to a full solution for the traditional management of retail sites, CounterPoint also includes a substantial recurring revenue business based on service fees for credit card processing as well as internet retailing. CPGateway provides retailers with advanced high-speed credit processing while CPOnline enables a retailer to quickly augment brick-and-mortar sales with online operations.
Our technology for petroleum and convenience retailers is built to enable fuel operations, merchandise sales, foodservice, electronic payments and customer loyalty programs. Our solutions are designed to enhance speed of service in an easy-to-use, reliable format. Self-service is an area of great interest for our customers, particularly touch-screen ordering stations in convenience stores with sophisticated food and coffee offerings. Our fourth generation fuel control technology is helping retailers deliver high performance and innovation for their customers. Our software uses industry standards to interface with leading third party back-office and headquarters solutions.
In response to gross margin pressure on traditional categories, including fuel and tobacco, and enhanced competition for the convenience dollar from non-traditional sources, convenience retailers are changing business models and pursuing new revenue channels, including made-to-order food, specialty coffee programs and expanded services offerings. These changes have resulted in new growth opportunities for us as implementation of these programs requires additional automation for effective management.
High-volume retailers such as grocery stores, mass-merchants, warehouse clubs and others continue to add fuel and made-to-order food to their offerings and represent additional growth opportunities for us. As a result of the changes in the retail market, we believe that there will continue to be demand for the foreseeable future for our technology solutions. Our management also believes that, based on the success of technology in recent years and the positive return on investment seen by our customers, demand for new technology will continue from both new and existing customers.
We believe that the international retail market represents an additional growth opportunity. For the fiscal years ended December 31, 2009, 2008, and 2007, approximately 22%, 25% and 25%, respectively, of our Retail segment revenues were derived from international customers.
Our Retail segment serves over 6,600 customers worldwide. Customers who have licensed or purchased our retail products and services include 7-Eleven Australia, Alimentation Couche-Tard, Archiver’s, Batteries Plus, Elvis Presley Enterprises, Exxon Mobil Corporation, Family Express, Harbor Freight Tools USA, Hess Corporation, High’s of Baltimore, Holiday Stationstores, Kroger Corporation, Mahoney’s Garden Center, Maverik Country Stores, Relax the Back Corporation, Repsol, Royal Dutch Shell, Rutter’s Farm Stores, Sheetz, Shell Canada, Speedway SuperAmerica, The Athlete’s Foot, The Field Museum and Wawa.
4
Table of Contents
Products and Services
We serve the global retail and hospitality industries with technology solutions that address their greatest automation needs. Managing businesses that range from a single store or restaurant, all the way to expansive global chains and the world’s largest sports stadiums, we provide software, hardware and services through a variety of channels and products. Our strategy is to provide targeted solutions for each market, with the common goal of assisting our customers’ efforts to increase revenue through more frequent consumer visits, greater revenues per visit, higher margins on each sale, faster transactions and more efficient site operations.
Point-of-Sale
Our point-of-sale systems increase speed and quality of service, minimize user training, and provide mission-critical reliability while delivering secure and personalized service to the consumer. The point-of-sale systems can be integrated with our back-office products or third party solutions. Our point-of-sale software runs on multiple open hardware platforms including IBM and NCR as well as our own hardware. Additionally, our point-of-sale hardware supports third-party point-of-sale software products that adhere to open standards. Our point-of-sale terminals offer an open architecture, retail-hardened design, comprehensive support and return-to-service programs, and run on Windows Server, Windows 7, Windows Embedded, and Windows CE. Quest Back Office is based on Microsoft SQL and operates on Windows Server products. However, the Quest POS terminals do not rely on commercial operating systems. This secure environment creates a simple, effective POS platform while reducing management and maintenance costs.
In the retail market, our point-of-sale solution has been adapted by resale partners for use in a wide variety of business formats, enabling a tighter fit to each retailer’s specific needs while expanding the possible market of buyers for our solution. In addition, this segment delivers value to retailers through an online store offering as well as a card payment processing service. Specifically for petroleum retail, our point-of-sale products are adapted to the needs of major oil companies, enabling them to deploy best practices in their multinational operations.
The hospitality market point-of-sale solutions for table service restaurants, quick service restaurants, stadiums, arenas, and cinema/entertainment venues each offer distinct value to our customers and resale partners. Speed and accuracy of orders are paramount in restaurant formats, as are labor and food production integration. Consumer preferences are driving automation for a broad range of service models, from drive-thru to curb-side pickup, counter service, and more. Consumer loyalty and gift cards are just two of the significant enhancements offered to our customers in recent years. In addition to foodservice requirements, the cinema segment has specialized needs related to theater systems, from management of internet ticket sales to reserved seating.
Customer Self-Service
Within many markets of the hospitality and retail industries, customer self-service has emerged as a preferred ordering and transaction method. Traditional capabilities such as online shopping and pay-at-pump are distinct value propositions delivered by our products. We have easy to use, consumer-activated touch screen systems that allow consumers to purchase tickets, place a food order, pay with a credit or debit card, redeem loyalty rewards, make product inquiries, and view promotions. Software development and consumer experience authoring tools integrate graphic media into a consumer-friendly application.
Our management believes consumer self-service kiosks allow hospitality and retail operators to accelerate speed of service, increase revenues through suggestive up-selling, increase order accuracy, capture consumer information at the point-of-sale, increase labor productivity, and respond quickly to changing consumer preferences. Our customer self-service products help operators create a uniform and repeatable approach to customer service while improving revenue.
Site-Management Systems
Operators in both of our segments have varying requirements for site-management systems, from the most basic site-based technology to the most advanced centralized back-office system. Our products are differentiated based on the needs of the different operating models of our customers and integrated into other components of the enterprise operation.
MenuLink and Quest Enterprise Manager back-office solutions help operators run a more profitable hospitality business through the delivery of tools and critical information needed to help reduce food and labor costs, and improve customer service and management efficiency. Our enterprise site-management products offer comprehensive back-office functionality that includes inventory and recipe management, purchasing, labor management, cash management and reporting.
In the retail segment, products such as Radiant Site Manager and CounterPoint SQL focus on specific retailer needs such as multi-site inventory management or fuel reconciliation, while leveraging open standards for integration to other components of the retailer enterprise.
5
Table of Contents
Software Services
The delivery of software as a subscribed service with a recurring fee has become a significant enhancement to our value proposition and business flexibility in support of our customers. This model allows customers to use our software without requiring them to use their own hardware system capacity or maintain the software application on their own servers and is available on a monthly fee basis. Our Hosted Solutions product suite is designed to give restaurant operators tools to capitalize on revenue opportunities and prevent unnecessary costs or losses. Hosted Solutions is comprised of the following products and services: Aloha Insight, Aloha Restaurant Guard, Aloha Command Center, Aloha Stored Value, Aloha Loyalty, Aloha Online Ordering, CPOnline and Radiant Payment Services, which are briefly described as follows:
| • | Our Hospitality segment has a large base of customers who subscribe to our proprietary gift card branding program, Aloha Stored Value. The integrated card-based loyalty solution, Aloha Loyalty, is also offered to customers in the Hospitality segment on a recurring fee basis. |
| • | Aloha Insight is an intelligent above-store application that offers multi-unit consolidated reporting for restaurants, including business alerts, drill-down capabilities, as well as accounting and payroll interfaces. It specifically increases visibility and control of a restaurant’s operations from anywhere at any time. |
| • | Building upon the intelligence of Aloha Insight, Aloha Restaurant Guard was created in 2009 as a unique application designed to deter employee theft. The product imports and analyzes a restaurant’s transaction data on a daily basis and identifies potential theft by finding known scam patterns and statistical variances. We believe Aloha Restaurant Guard greatly improves upon a restaurant’s operational intelligence and security. |
| • | Aloha Command Center is considered the backbone for many new Radiant products, as it provides real-time connection to all stores for support and deployment services. This powerful tool provides proactive alerts to solve many operational issues faster. It also allows businesses to deploy new software versions rapidly and automatically. |
| • | Aloha Online Ordering is a new integrated web ordering application for restaurants. Consumers can place restaurant orders remotely in real-time, ensuring convenience and security and ultimately improving guest satisfaction. |
| • | In the Retail segment, the CPOnline product enables a retailer to move from bricks-and-mortar to being a full-featured online retailer through a simple managed service. |
| • | Radiant Payment Services, or RPS, is a solution aimed at selling and servicing electronic payment processing in both our Hospitality and Retail segments. RPS enhances our current solutions by providing an integrated, turnkey payment processing solution for a wide variety of payment methods including credit, debit and gift card payments. The objective of RPS is to raise the level of customer service that is provided to business owners and operators by providing competitive and transparent pricing, increased accountability from a single vendor and the highest level of security for customer data and credit card transactions. |
Professional Services
Professional services are an essential component of our solution for direct customers and include such service offerings as consulting, custom development, training, installation and integration. Our professional services play a critical role in the successful design, implementation, application, installation and integration of our solutions.
The market for our professional services is competitive. We believe that we excel in the principal competitive factors including product quality, reliability, performance, price, vendor and product reputation, financial stability, features and functions, ease of use, quality of support, and degree of integration effort as compared with competitors’ systems.
Maintenance and Customer Support
We offer customer support on a 24-hour basis, a service that historically has been purchased by a majority of our customers and which also entitles the customer to product upgrades. We can remotely access customers’ systems in order to perform quick diagnostics and provide on-line assistance. Additionally, we offer customers hardware and software maintenance and unspecified software enhancements. In some cases, hardware support is provided by third parties. We focus on providing quality service and ensuring a first-time fix for any technical issue with our hardware. Our hardware maintenance program also provides flexible solutions and can be customized to meet specific customer needs. Our software maintenance program offers modifications and enhancements to our software products, including updates and corrections. We have historically had a high rate of renewal on these maintenance and support contracts.
6
Table of Contents
Sales and Marketing
We sell our products and services through two distinct channels: (1) direct and (2) indirect. To address the direct channel, our sales personnel focus on selling our technology solutions to large customers, typically those with more than 50 locations or sites with more than 50 POS terminals, both domestically and internationally. The indirect channel represents small to medium-sized customers and is addressed by third-party resellers, whom we also refer to as channel partners.
Through a focused and dedicated sales effort designed to address the requirements of both business segments, we believe our sales force is positioned to understand our customers’ businesses, trends in the marketplace, competitive products and opportunities for new product development. This allows us to take a consultative approach to working with customers.
Over the last several years, we have seen an increase in the portion of revenues derived from small businesses within both segments. This increase is due to our increased investments in developing relationships with third-party resellers to distribute our products to small to medium-sized operators. We accelerated the development of these relationships through acquisitions in both segments.
While serving and meeting the expectations of direct customers remains a top priority, we intend to serve the needs of all operators within our segments. To better serve the small to medium-sized customer, we will continue to develop the reseller channel and package solutions in a manner that is easy for operators to afford, implement and support. Our strategy is to deliver feature-rich products that are easy to implement and support, establish a strong presence within critical franchised brands, and support resellers with strong operational tools.
During the fiscal years ended December 31, 2009, 2008 and 2007, our international revenues accounted for approximately 16%, 14% and 13%, respectively, of total revenues. Our management believes that this percentage can be increased substantially in the coming years. The growing number of large, multi-national companies which are among our major North American customers, together with our successful record of implementing solutions with retailers in Western Europe, Eastern Europe and Asia, position us to make additional progress internationally in the future. Additionally, the majority of our current business outside the United States has been in the retail market. Our management believes there is opportunity for significant growth in the hospitality and retail markets outside the United States. Currently, we have a total of 227 employees in Europe, Asia and Australia. We have executed major projects in Aruba, Australia, Brazil, Canada, Cayman Islands, Chile, Colombia, the Czech Republic, El Salvador, Guatemala, Honduras, Hong Kong, Hungary, Jamaica, Japan, Macau, Malaysia, Mexico, Panama, Poland, Portugal, Puerto Rico, Slovakia, Spain, Sweden, Switzerland, Thailand, Trinidad and Tobago and the United Kingdom. We currently have offices in Australia, Austria, China, Czech Republic, Singapore, Spain and the United Kingdom. We have more than 600 international resellers who market and support one or more of our product lines in Africa, Asia, Australia, Europe, Latin America, the Middle East and South America.
To date, our primary marketing objectives have been to increase awareness of our technology solutions and generate sales leads. To this end, we attend industry trade shows, conduct direct marketing programs, and selectively advertise in industry publications. We intend to increase our sales and marketing activities both domestically and internationally. Additionally, we intend to continue expanding an independent distribution network to sell and service our products to certain segments of the domestic and international markets.
Our business is usually seasonal and cyclical in nature, based on the capital equipment investment patterns of our customers. These expenditure patterns are based on many factors, including customer capital expenditure budget constraints, the development of new technologies, global and regional economic conditions, changes in the pricing and promotion policies of us and our competitors, and domestic and international holidays.
During the fiscal years ended December 31, 2009, 2008 and 2007, no one customer made up 10% or more of our revenues. We are party to certain contracts with the U.S. Government, which contain standard termination for convenience clauses. We do not anticipate any material adverse financial impact if the U.S. Government elects to exercise its rights under these termination clauses.
Product Development
The products sold by us are subject to rapid and continual technological change. Products available from us, as well as from our competitors, have increasingly offered a wider range of features and capabilities. We believe that in order to compete effectively in our selected markets, we must provide compatible systems incorporating new technologies at competitive prices. In order to achieve this, we have made a substantial ongoing commitment to research and development. During the fiscal years ended December 31, 2009, 2008 and 2007, we incurred approximately $26.3 million, $28.9 million and $26.2 million, respectively, in product development costs, which includes software costs that were capitalizable in nature.
Our software architecture is based on open platforms and is modular, thereby allowing it to be phased into a customer’s operations. We have developed numerous applications running on Microsoft Windows-based platforms, including Windows Server, Windows 7, Windows Embedded, and Windows CE. The software architecture of many of our products incorporates Microsoft’s Component Object Model, providing an efficient environment for application development.
In order to remain competitive, we are currently designing, coding and testing a number of new products and developing expanded functionality of our current products. In addition, we strive to achieve compatibility between our products and products that are, or that we believe will become, popular and widely adopted.
Manufacturing, Raw Materials and Supplies
Our manufacturing activities consist primarily of assembling various commercial and proprietary components into finished systems in Georgia, Austria and Australia. Manufacturing requires some raw materials, including a wide variety of mechanical and electrical components, to be manufactured to our specifications. We use numerous companies to supply parts, components and subassemblies for the manufacture and support of our products. Although we strive to assure that parts are available from multiple qualified suppliers, this is not always possible. Accordingly, some key parts may be obtained only from a single supplier or a limited group of suppliers. We have sought, and will continue to seek, to minimize the risk of production and service interruptions and/or shortages of key parts by: (1) qualifying and selecting alternate suppliers for key parts; (2) monitoring the financial condition of key suppliers; (3) maintaining appropriate inventories of key parts; and (4) qualifying new parts on a timely basis.
7
Table of Contents
Market Background and Trends
Successful hospitality and retail operators increasingly require information systems that capture detailed consumer activity data at the point-of-sale, and store and transport that data in an easy-to-access fashion. Early technology innovators in the hospitality and retail industries deployed robust, integrated information systems at the point-of-sale and used the information to react quickly to changing consumer preferences, ultimately gaining market share in the process. In addition, integrated information systems helped these early innovators achieve operational efficiencies. Many large national hospitality and retail companies have followed suit by investing in proprietary information systems.
For many types of hospitality and retail operators, however, this type of information system does not make economic or business sense. In particular, merchants with a large number of relatively small sites, such as convenience stores, petroleum retail sites, restaurants and entertainment venues, generally have not been able to develop and deploy sophisticated, enterprise-wide information systems on a cost effective basis. Economic and standardization problems for these businesses are exacerbated by the fact that many sites operate as franchises, dealerships or under other decentralized ownership and control structures. Without an investment in technology, these operators continue to depend on labor and paper to process transactions. Our management believes that high labor costs, lack of centralized management control of distributed sites, and inadequate informational reporting, together with emerging technology trends, have caused many of these hospitality and retail businesses to reexamine how technology solutions can benefit their operations.
Typically, the existing information systems in these industries consist of stand-alone devices such as cash registers or other point-of-sale systems with little or no integration with either the back-office of the site or an enterprise-wide information system. Implementation of information systems providing this functionality typically involves multiple vendors and an independent systems integration firm. The resulting proprietary solutions are often difficult to support and have inherently high risks associated with implementation. Our management believes that technology solutions that are highly functional and scalable, and relatively inexpensive and easy to deploy, are critical for successful penetration in these markets.
In the absence of an integrated solution, operators in these markets typically rely on manual reporting to capture data on site activity and disseminate it to different levels of management. Basic information on consumers (i.e., who they are, when they visit and what they buy) is not captured in sufficient detail, at the right time, or in a manner that can be communicated easily to others in the organization. Similarly, information such as price changes does not flow from headquarters to individual sites in a timely manner. In addition, communications with vendors often remain manual, involving paperwork, delays and other process-related problems.
Recent trends in the hospitality and retail industries have accelerated the need for timely information and have heightened demand for feature-rich operational systems. Based in part upon industry association reports and other studies, as well as our experience in marketing our products, we believe consumer preferences have shifted away from brand loyalty toward value and convenience, creating a greater need for timely data concerning consumer buying patterns and preferences. We also believe that convenient consumer-activated ordering and payment systems, such as automated kiosks, ATMs, voice response units and “pay at the pump” systems have become important to retailers, food service providers, and cinema operators that wish to retain and build a customer base. Additionally, through the use of integrated systems, we believe hospitality and retail businesses can improve operational efficiencies through better management of inventory, purchasing, merchandising, pricing, promotions and shrinkage control. Our management believes that the ability to provide tight system integration to a variety of industry standard back-office solutions can enable customers to improve control and enforce best practices across operational sites. Furthermore, our management believes that the constant flow of information among the point-of-sale, back-office, headquarters and supply chain has become a key competitive advantage in the hospitality and retail industries, resulting in operators demanding more sophisticated and easily integrated solutions from their systems vendors. In a parallel development, technological advances have improved the capability of information systems that are available. With the price of computing power declining, technology investments have become economically feasible for many hospitality and retail businesses. Furthermore, computing power has become increasingly flexible and distributable, facilitating data capture and processing by applications located at the point-of-sale. Also, front-end graphical user interfaces have made systems easier to use, which reduces training time and transaction costs and facilitates more types of consumer-activated applications.
The demand drivers for our products and services include new store openings, change in store ownership and the upgrade of existing technology in existing locations. Changes in the economic climate have historically impacted these demand drivers. For instance, the current economic environment has resulted in fewer new store openings and therefore demand has declined in this area. In contrast, a greater emphasis on increasing performance of existing locations through revenue growth and cost management has led to demand for technology replacement and for add-on sales of solutions to existing customers. In addition to the above demand factors, the availability of financing has become an important factor for many potential customers. The tightened credit markets have made it more difficult for certain operators to invest in technology and could result in reduced demand until the credit markets recover.
Security has become a driving factor in our industry as our customers try to meet ever escalating governmental requirements directed toward the prevention of identity theft as well as operating safeguards imposed by the credit and debit card associations. In September 2006, these card associations established the PCI Security Standards Council to oversee and unify industry standards in the areas of credit card data security. We believe we are a leader in providing systems and software solutions that meet the payment application requirements and will continue to help the industry define new standards across the payment process, educate businesses on how to reduce theft by meeting the Payment Card Industry Data Security Standard (PCI DSS) requirement process, and build new technologies outside its point-of-sale software to combat theft.
8
Table of Contents
Competition
The markets in which we operate are intensely competitive. We believe the principal competitive factors include product quality, reliability, performance, price, vendor and product reputation, financial stability, features and functions, ease of use, quality of support and degree of integration effort required with competitor systems.
We believe we are uniquely positioned with our exclusive focus on providing site management systems for hospitality and retail businesses. Further, we believe our ability to commercialize our technology and continually improve our products, processes and services, as well as our ability to develop new products, enable us to meet continually evolving customer requirements. Our competitors include International Business Machines, Corp., NCR Corporation, Casio, Dell, VeriFone, Inc., Dresser, Inc., Retalix, Ltd., Pacer/CATS (owned by Clarity Commerce Solutions plc), Micros Systems, Inc., Par Technology Corporation, POSitouch, Panasonic, The Pinnacle Corporation, Agilysys, RetailPro, JDA Software, Epicore and others that provide point-of-sale and site management systems with varying degrees of functionality.
We could also be faced with new market entrants attempting to develop fully integrated systems targeting the retail industry. We believe the risk of this happening is small due to the significant amount of time and effort required to create point-of-sale and back-office headquarters-based management systems, and due to the detailed knowledge required of a retailer’s operations at local sites and headquarters in order to duplicate the functionality of these products.
In the market for consulting services, we compete with various companies. Many of our existing competitors, as well as a number of potential new competitors, have significantly greater financial, technical and marketing resources than us.
Proprietary Rights
Our success and ability to compete is dependent in part upon our proprietary technology, including our software source code. To protect our proprietary technology, we rely on a combination of trade secret, nondisclosure, copyright and patent law, which may afford only limited protection. In addition, effective copyright and trade secret protection may be unavailable or limited in certain foreign countries. Although we rely on the limited protection afforded by such intellectual property laws, we also believe that factors such as the technological and creative skills of our personnel, new product developments, frequent product enhancements, name recognition and reliable maintenance are essential to establishing and maintaining a technology leadership position. We presently have five patents and six patents pending. The source code for our various proprietary software products is protected both as a trade secret and as a copyrighted work. We generally enter into confidentiality or license agreements with our employees, consultants and customers, and generally control access to, and distribution of, our documentation and other proprietary information. Although we restrict customers’ use of our software and do not permit the unauthorized resale, sublicense or other transfer of such software, there can be no assurance that unauthorized use of our technology will not occur.
Despite the measures taken by us to protect our proprietary rights, unauthorized parties may attempt to reverse engineer or copy aspects of our products or to obtain and use information that we regard as proprietary. Policing unauthorized use of our products is difficult. In addition, litigation may be necessary in the future to enforce our intellectual property rights, such as our trade secrets, to determine the validity and scope of our or others’ proprietary rights, or to defend against claims of infringement or invalidity. Such litigation could result in substantial costs and diversion of resources and could have a material adverse effect on our business, operating results and financial condition.
Certain technology used in conjunction with our products is licensed from third parties, generally on a non-exclusive basis. These licenses usually require us to pay royalties and fulfill confidentiality obligations. We believe that there are alternative sources for each of the material components of technology licensed by us from third parties. However, the termination of any of these licenses, or the failure of the third-party licensors to adequately maintain or update their products, could result in a delay in our ability to ship certain of our products while we seek to implement technology offered by alternative sources. Any required alternative licenses could prove costly. Also, any such delay, to the extent it becomes extended or occurs at or near the end of a fiscal quarter, could result in a material adverse effect on our business, operating results and financial condition. While it may be necessary or desirable in the future to obtain other licenses relating to one or more of our products or relating to current or future technologies, there can be no assurance that we will be able to do so on commercially reasonable terms or at all.
There can be no assurance that we will not become the subject of infringement claims or legal proceedings by third parties with respect to our current or future products. Defending against any such claim could be time-consuming, result in costly litigation, cause product shipment delays or force us to enter into royalty or license agreements rather than dispute the merits of such claims. Moreover, an adverse outcome in litigation or similar adversarial proceeding could subject us to significant liabilities to third parties, require the expenditure of significant resources to develop non-infringing technology, require disputed rights to be licensed from others or require us to cease the marketing or use of certain products, any of which could have a material adverse effect on our business, operating results and financial condition. To the extent we desire or are required to obtain licenses to patents or proprietary rights of others, there can be no assurance that any such licenses will be made available on terms acceptable to us, if at all. As the number of technology products in the industries we serve increases and the functionality of these products further overlaps, we believe that technology providers may become increasingly subject to infringement claims. Any such claims against us, with or without merit, as well as claims initiated by us against third parties, could be time consuming and expensive to defend, prosecute or resolve.
9
Table of Contents
Employees
As of December 31, 2009, we employed 1,310 people. Other than our employees in Salzburg, Austria who are represented by a trade group, none of our employees are represented by a collective bargaining agreement nor have we experienced any work stoppages. We consider our relations with our employees to be good.
Foreign Operations
For information regarding sales and long-lived assets attributable to domestic and foreign operations, please refer to the information presented in Note 14 - Segment Reporting Data in the notes to our consolidated financial statements presented in Part II, Item 8 of this report.
Environmental Matters
We believe that we are in compliance in all material respects with all applicable environmental laws and presently do not anticipate that such compliance will have a material effect on our future capital expenditures, earnings or competitive position with respect to any of our operations.
Available Information
Radiant maintains a website at www.radiantsystems.com. Radiant makes available free of charge its annual reports on Form 10-K, quarterly reports on Form 10-Q and current reports on Form 8-K on its website as soon as practicable after such reports are filed with the SEC. These filings can be accessed through the ‘Investor Relations’ page on Radiant’s website at www.radiantsystems.com. Radiant’s common stock is traded on The NASDAQ Stock Market under the symbol “RADS.”
10
Table of Contents
| ITEM 1A. | RISK FACTORS |
In addition to the other information contained in this report, the following risks should be considered carefully in evaluating us and our business.
Risks Related to our Business
Global economic and market conditions could cause decreases in demand for our products and related services.
Our revenue and profitability depend on the overall demand for our products and related services. We are impacted both directly and indirectly by declining global economic conditions. The retail and hospitality industries are cautious of investments in information technology during difficult economic times, which often results in reduced budgets and spending. This impacts us through reduced revenues, elongated selling cycles, delays in product implementation and increased competitive margin pressure. The severe downturn in global economic and market conditions that began in the second half of 2008 resulted in decreases in demand for certain of our products and related services as the tightening of credit in financial markets adversely affects the ability of our customers to obtain financing for significant purchases and operations. We are unable to predict with certainty the future impact which the most recent global economic conditions will have on the demand for our products and related services.
Volatility and disruption of the capital and credit markets, and adverse changes in the global economy, could have a negative impact on our ability to access the credit markets in the future and/or obtain credit on favorable terms.
The capital and credit markets have become increasingly tight as a result of adverse economic conditions that have caused the failure and near failure of a number of large financial services companies. There can be no assurance that there will not be a further deterioration in the financial markets. If the capital and credit markets continue to experience crises and the availability of funds remains low, it is possible that our ability to access the capital and credit markets may be limited or available on less favorable terms at a time when we would like, or need, to do so, which could have an impact on our ability to refinance maturing debt, pursue acquisitions and/or react to changing economic and business conditions. In addition, if recessionary global economic conditions persist for an extended period of time or worsen substantially, our business may suffer in a manner which could cause us to fail to satisfy the financial and other restrictive covenants to which we are subject under our existing indebtedness.
Fluctuations in currency exchange rates may adversely impact our cash flows and earnings.
Due to our global operations, our cash flow and earnings are exposed to currency exchange rate fluctuations. Exchange rate fluctuations may also affect the cost of goods and services that we purchase. The recent volatility in the global capital and credit markets has increased the frequency and severity of exchange rate fluctuations. Changes from our expectations for currency exchange rates can have a material impact on our financial results. When appropriate, we may attempt to limit our exposure to exchange rate changes by entering into short-term currency exchange contracts. There is no assurance that we will hedge or will be able to hedge such foreign currency exchange risk or that our hedges will be successful.
Our currency exchange gains or losses (net of hedges) may materially and adversely impact our cash flows and earnings. Additionally, adverse movements in currency exchange rates could result in increases in our cost of goods sold or reduction in growth in international orders, materially impacting our cash flows and earnings.
An increase in customer bankruptcies, due to weak economic conditions, could harm our business.
During weak economic times, there is an increased risk that certain of our customers will file bankruptcy. If a customer files bankruptcy, we may be required to forego collection of pre-petition amounts owed and to repay amounts remitted to us during the 90-day preference period preceding the filing. The bankruptcy laws, as well as specific circumstances of each bankruptcy, may limit our ability to collect pre-petition amounts. We also face risk from international customers that file for bankruptcy protection in foreign jurisdictions, in that the application of foreign bankruptcy laws may be more difficult to predict. Although we believe that we have sufficient reserves to cover anticipated customer bankruptcies, we can provide no assurance that such reserves will be adequate, and if they are not adequate, our business, operating results and financial condition would be adversely affected.
Our revenues are significantly concentrated in the hospitality and retail markets and the demand for our products and services in these markets could be disproportionately affected by instability or a downturn in either market.
For the fiscal years ended December 31, 2009, 2008 and 2007, approximately 75%, 75% and 68%, respectively, of our total revenues were attributable to the hospitality segment and approximately 24%, 24% and 31%, respectively, were attributable to the retail segment. The hospitality and retail markets are affected by a variety of factors, including global and regional instability, governmental policy and regulation, political instability, natural disasters, environmental and health disasters, consumer buying habits, consolidation in the petroleum industry, war, terrorism and general economic conditions. Adverse developments in either market could materially and adversely affect our business, operating results and financial condition. In addition, we believe the purchase of our products is relatively discretionary and generally involves a significant commitment of capital, because purchases of our products are often accompanied by large scale hardware purchases. As a result, demand for our products and services could be disproportionately affected by instability or downturns in the hospitality and retail markets which may cause customers to exit the industry or delay, cancel or reduce planned-for information management systems and software products.
11
Table of Contents
We may be required to defer recognition of revenues on our software products, which may have a material adverse effect on our financial results.
We may be required to defer recognition of revenues for a significant period of time after entering into a license agreement for a variety of factors, including the following:
| • | transactions that include both currently deliverable software products and arrangements that include specified upgrades for which we have not established vendor-specific objective evidence (“VSOE”) of fair value; |
| • | transactions where the customer demands services that include significant modifications, customizations or complex interfaces that could delay product delivery or acceptance; and |
| • | transactions that involve acceptance criteria that may preclude revenue recognition or if there are identified product-related issues, such as performance issues. |
Because of the factors listed above and other specific requirements under generally accepted accounting principles, or GAAP, for software revenue recognition, we must have very precise terms in our license agreements in order to recognize revenue when we initially deliver software or perform services. Although we have a standard form of license agreement that meets the criteria under GAAP for current revenue recognition on delivered elements, we negotiate and revise these terms and conditions in some transactions. Negotiation of mutually acceptable terms and conditions can extend the sales cycle, and sometimes result in deferred revenue recognition well after the time of delivery or project completion.
Our revenues and results of operations are difficult to predict and may fluctuate substantially from quarter to quarter, which could adversely affect our business and the market price of our common stock.
Our revenues and results of operations are difficult to predict and may fluctuate substantially from quarter to quarter. These fluctuations can adversely affect our business and the market price of our common stock. License revenues in any quarter depend substantially upon our total contracting activity and our ability to recognize revenues in that quarter in accordance with our revenue recognition policies. Our contracting activity is difficult to forecast for a variety of reasons, including the following:
| • | our sales cycle is relatively long and varies as a result of us expanding our product line and broadening our software product applications to cover a customer’s overall business; |
| • | the size of license transactions can vary significantly; |
| • | economic downturns are often characterized by decreased product demand, price erosion, technological shifts, work slowdowns and layoffs, which can substantially reduce contracting activity; |
| • | customers may unexpectedly postpone or cancel anticipated system replacements or new system evaluations due to changes in their strategic priorities, project objectives, budgetary constraints or management; |
| • | customer evaluations and purchasing processes vary significantly from company to company, and a customer’s internal approval and expenditure authorization process can be difficult and time consuming, even after selection of a vendor; |
| • | changes in our pricing policies and discount plans may affect customer purchasing patterns; |
| • | the number, timing and significance of our and our competitors’ software product enhancements and new software product announcements may affect purchasing decisions; |
| • | the introduction of new research and development projects requires us to significantly increase our operating expenses to fund greater levels of product development and to develop and commercialize additional products and services; |
| • | certain expenses, including those over which we exercise little or no control, such as health costs, compliance with new legislation, and property and liability insurance, may be difficult to manage; and |
| • | fluctuations in the value of foreign currency exchange rates relative to the U.S. dollar or weakening of the U.S. dollar may adversely impact our ability to purchase materials at a competitive price. |
In addition, our expense levels, operating costs and hiring plans are based on projections of future revenues and are relatively fixed. If our actual revenues fall below expectations, our net income is likely to be disproportionately adversely affected.
Due to all of the foregoing factors, in some future quarters our operating results may fall below the expectations of securities analysts and investors. In such event, the market price of our common stock would likely decrease.
12
Table of Contents
Our gross margins may vary significantly or decline.
Since the gross margins on product revenues are significantly greater than the gross margins on services revenues, our combined gross margin has fluctuated from quarter to quarter and it may continue to fluctuate significantly based on revenue mix.
Our success will depend on our ability to develop new products and to adapt to rapid technological change.
The types of products sold by us are subject to rapid and continual technological change. Products available from us, as well as from our competitors, have increasingly offered a wider range of features and capabilities. We believe that in order to compete effectively in selected vertical markets, we must provide compatible systems incorporating new technologies at competitive prices. To the extent we determine that new software and hardware technologies are required to remain competitive or our customers demand more advanced offerings, the development, acquisition and implementation of these technologies are likely to require significant capital investments by us. To the extent that such expenses precede or are not subsequently followed by increased revenues, our business, operating results and financial condition may be materially and adversely affected.
We can provide no assurance that we will be able to continue funding research and development at levels sufficient to enhance our current product offerings or be able to develop and introduce on a timely basis new products that keep pace with technological developments and emerging industry standards and address the evolving needs of customers. There can also be no assurance that we will not experience difficulties that will result in delaying or preventing the successful development, introduction and marketing of new products in our existing markets or that our new products and product enhancements will adequately meet the requirements of the marketplace or achieve any significant degree of market acceptance. Likewise, there can be no assurance as to the acceptance of our products in new markets, nor can there be any assurance as to the success of our penetration of these markets, or to the revenue levels or profit margins with respect to these products. Our inability, for any reason, to develop and introduce new products and product enhancements in a timely manner in response to changing market conditions or customer requirements could materially adversely affect our business, operating results and financial condition.
In addition, we strive to achieve compatibility between our products and retail systems that we believe are or will become popular and widely adopted. We invest substantial resources in development efforts aimed at achieving such compatibility. Any failure by us to anticipate or respond adequately to technology or market developments could materially adversely affect our business, operating results and financial condition.
If the emerging platforms of Microsoft and others with which we integrate our products does not gain or retain broad market acceptance, or if we fail to develop new software compatible with such emerging technologies, we may not be able to compete effectively and our business, operating results and financial condition could suffer.
Our software architecture is modular and based on open platforms (other than our Quest products, which do not rely on commercial operating systems), allowing it to be phased into a customer’s operations. For example, we have developed numerous applications running on Microsoft Windows-based platforms, including Windows Server, Windows, Windows Embedded, and Windows CE operating systems. To date, the platforms we have chosen to integrate our products with have proven to be popular and gained broad industry acceptance. However, the market for our software is subject to ongoing rapid technological developments and quickly evolving industry standards, and there may be existing or future platforms that achieve industry status which are not compatible with our software. In addition, when new or updated versions of these platforms are introduced, it is often necessary for us to develop updated versions of our software so that it operates properly with these computing platforms. We can provide no assurance that we will be able accomplish these developments quickly or cost-effectively. In addition, these development efforts require substantial investment and the devotion of substantial employee resources. The inability of our software to operate with popular third party platforms may adversely effect our business, operating results and financial condition.
We may have difficulty implementing our products, which could damage our reputation and our ability to generate new business.
Implementation of our software products can be a lengthy process, and commitment of resources by our customers is subject to a number of significant risks over which we have little or no control. Delays in the implementations of any of our software products, whether by our business partners or us, may result in customer dissatisfaction, disputes with customers, or damage to our reputation. Significant problems implementing our software can cause delays or prevent us from collecting fees for our software and can damage our ability to generate new business.
Errors or defects in our software products could diminish demand for our products, injure our reputation and reduce our operating results.
Our software products are complex and may contain errors that could be detected at any point in the life of the product. We can provide no assurances that errors will not be found in new products or releases after shipment. Such errors could result in diminished demand for our products, delays in market acceptance and sales, diversion of development resources, injury to our reputation or increased service and warranty costs. If any of these were to occur, our operating results could be adversely affected.
Our failure to manage our growth effectively could have a material adverse effect on our business, operating results and financial condition.
The growth in the size and complexity of our business and the expansion of our product lines and customer base may place a significant strain on our management and operations. An increase in the demand for our products could strain our resources or result in delivery problems, delayed software releases, slow response time, or insufficient resources for assisting customers with implementation of our products and services, which could have a material adverse effect on our business, operating results and financial condition. We anticipate that continued growth, if any, will require us to recruit, hire and assimilate a substantial number of new employees, including consulting, product development, sales and marketing, and administrative personnel.
Our ability to compete effectively and to manage future growth, if any, will also depend on our ability to continue to implement and improve operational, financial and management information systems on a timely basis and to expand, train, motivate and manage our work force, particularly our direct sales force and consulting services organization. We can provide no assurance that we will be able to manage any future growth, and any failure to do so could have a material adverse effect on our business, operating results and financial condition.
13
Table of Contents
Our acquisition of existing businesses and our failure to successfully integrate these businesses could disrupt our business, dilute our common stock and harm our operating results and financial condition.
As part of our operating history and growth strategy, we have acquired other businesses. In the future, we may continue to seek acquisition candidates in selected markets and from time to time engage in exploratory discussions with suitable candidates. We can provide no assurance that we will be able to identify and acquire targeted businesses or obtain financing for such acquisitions on satisfactory terms. The process of integrating acquired businesses into our operations may result in unforeseen difficulties and may require a disproportionate amount of resources and management attention. In particular, the integration of acquired technologies with our existing products could cause delays in the introduction of new products. In connection with future acquisitions, we may incur significant charges to earnings as a result of, among other things, the write-off of purchased research and development.
Future acquisitions may be financed through the issuance of common stock, which may dilute the ownership of our shareholders, or through the incurrence of additional indebtedness. Furthermore, we can provide no assurance that competition for acquisition candidates will not escalate, thereby increasing the costs of making acquisitions or making suitable acquisitions unattainable. Acquisitions involve numerous risks, including the following:
| • | problems combining the acquired operations, technologies or products; |
| • | unanticipated costs or liabilities; |
| • | diversion of management’s attention; |
| • | adverse effects on existing business relationships with suppliers and customers; |
| • | risks associated with entering markets in which we have limited or no prior experience; and |
| • | potential loss of key employees, particularly those of the acquired organizations. |
For example, until we actually assume operating control of the business assets and operations, it is difficult to ascertain with precision the actual value or the potential liabilities of our acquisitions. We may not be able to integrate successfully any business, technologies or personnel that we have acquired or that we might acquire in the future, and this could harm our business, operating results and financial condition.
Damage to our manufacturing site and/or office space could limit our ability to operate our business.
We do not have redundant, multiple-site manufacturing capacity, nor do we have redundant capabilities for our office space and key operating systems. Therefore, damage to these sites from a natural disaster or other catastrophic event such as fire, flood, terrorist attack, power loss and other similar events could cause interruptions or delays in our manufacturing process or render us unable to accept and fulfill customer orders. We have not established a formal disaster recovery plan and our business interruption insurance may not be adequate to compensate us for any losses we may suffer.
Our inability to obtain key manufacturing parts from our suppliers could have a material adverse effect on our business, operating results and financial condition.
Our manufacturing activities consist primarily of assembling various commercial and proprietary components into finished systems. Manufacturing requires some raw materials, including a wide variety of mechanical and electrical components that are manufactured by third parties to our specifications. Although we make reasonable efforts to assure that parts are available from multiple qualified suppliers, this is not always possible. Accordingly, some key parts may be obtained only from a single supplier or a limited group of suppliers. Our inability to obtain key manufacturing parts from these limited suppliers or from others suppliers in a timely manner, or at all, could have a material adverse effect on our business, operating results and financial condition.
The loss of our key personnel could have a material adverse effect on us.
Our future success depends in part on the performance of our executive officers and key employees. We do not have employment agreements with any of our executive officers. The loss of the services of any of our executive officers or other key employees could have a material adverse effect on our business, operating results and financial condition.
Our inability to attract, hire or retain the necessary technical and managerial personnel could have a material adverse effect on our business, operating results and financial condition.
We are heavily dependent upon our ability to attract, retain and motivate skilled technical and managerial personnel, especially highly skilled engineers involved in ongoing product development and consulting personnel who assist in the development and implementation of our total business solutions. The market for such individuals is intensely competitive. Due to the critical role of our product development and consulting staffs, the inability to recruit successfully or the loss of a significant part of our product development or consulting staffs could have a material adverse effect on us. The software industry is characterized by a high level of employee mobility and aggressive recruiting of skilled personnel. We can provide no assurance that we will be able to retain our current personnel, or that we will be able to attract, assimilate or retain other highly qualified technical and managerial personnel in the future. The inability to attract, hire or retain the necessary technical and managerial personnel could have a material adverse effect upon our business, operating results and financial condition.
14
Table of Contents
Our success and ability to compete are dependent upon our ability to protect our proprietary technology.
Our success and ability to compete are dependent in part upon our ability to protect our proprietary technology. We rely on a combination of patent, copyright and trade secret laws and non-disclosure agreements to protect this proprietary technology. We enter into confidentiality and non-solicitation agreements with our employees and license agreements with our customers and potential customers, which limit access to and distribution of our software, documentation and other proprietary information. We can provide no assurance that the steps taken by us to protect our proprietary rights will be adequate to prevent misappropriation of our technology or that our competitors will not independently develop technologies that are substantially equivalent or superior to our technology. In addition, the laws of some foreign countries do not protect our proprietary rights to the same extent as do the laws of the United States.
Litigation may be necessary in the future to enforce our intellectual property rights, such as our trade secrets, to determine the validity and scope of our or others’ proprietary rights, or to defend against claims of infringement or invalidity. Such litigation could result in substantial costs and diversion of resources and could have a material adverse effect on our business, operating results and financial condition.
Certain technology used in conjunction with our products is licensed from third parties, generally on a non-exclusive basis. The termination of any of these licenses, or the failure of the third-party licensors to maintain or update their products adequately, could result in delay in our ability to ship certain of our products while we seek to implement technology offered by alternative sources, and any required replacement licenses could prove costly. While it may be necessary or desirable in the future to obtain other licenses relating to one or more of our products or relating to current or future technologies, we can provide no assurance that we will be able to do so on commercially reasonable terms or at all.
If we become subject to adverse claims alleging infringement of third-party proprietary rights, we may incur substantial unanticipated costs and our competitive position may suffer.
There has been a substantial amount of litigation in the software industry regarding intellectual property rights. It is possible that in the future third parties may claim that our current or potential future software solutions infringe on their intellectual property. We anticipate that software product developers will increasingly be subject to infringement claims as the number of products and competitors in our industry grows. We can provide no assurance that we will not be subject to such third-party claims, litigation or indemnity demands or that these claims will not be successful. If a claim or indemnity demand were to be brought against us, it could result in costly litigation or product shipment delays, or force us to stop selling or providing services or enter into costly royalty or license agreements.
We operate in a highly competitive market and can give no assurance that we will be able to compete successfully against our current or future competitors.
The market for retail information systems is intensely competitive. We believe the principal competitive factors are product quality, reliability, performance and price, vendor and product reputation, financial stability, features and functions, ease of use, quality of support, and degree of integration effort required with other systems. A number of companies offer competitive products addressing certain of our target markets. In addition, we believe that new market entrants may attempt to develop fully integrated systems targeting the retail industry. In the market for consulting services, we compete with various systems integrators. Many of our existing competitors, as well as a number of potential new competitors, have significantly greater financial, technical and marketing resources than we have. We can provide no assurance that we will be able to compete successfully against our current or future competitors or that competition will not have a material adverse effect on our business, operating results and financial condition.
Additionally, we compete with a variety of hardware and software vendors. Some of our competitors may have advantages over us due to their significant worldwide presence, longer operating and product development history, and substantially greater financial, technical and marketing resources. If competitors offer more favorable payment terms and/or more favorable contractual implementation terms or guarantees, we may need to lower prices or offer other favorable terms in order to compete successfully. Any such changes would likely reduce our margins.
Our increased investment in the international market could expose us to risks in addition to those experienced in the United States.
Our international revenues represented approximately $46.6 million, $42.5 million and $33.5 million, or 16%, 14% and 13%, respectively, of our total revenues for the fiscal years ended December 31, 2009, 2008 and 2007, respectively. We will continue to invest in expanding our international operations. The global reach of our business could cause us to be subject to unexpected, uncontrollable and rapidly changing events and circumstances in addition to those experienced in domestic locations. The following factors, among others, present risks that could have an adverse impact on our business, operating results and financial condition:
| • | weaker protection of intellectual property rights; |
| • | an inability to replicate previous international revenues; |
| • | currency controls and fluctuations in currency exchange rates and the potential inability to hedge the currency risk in some transactions because of uncertainty or the inability to reasonably estimate our foreign exchange exposure; |
| • | possible increased costs and development time to adapt our products to local markets; |
| • | potential lack of experience in a particular geographic market; |
| • | legal, regulatory, social, political, labor or economic conditions in a specific country or region, including loss or modification of exemptions for taxes and tariffs, and import and export license requirements which may have a negative impact on us; |
| • | higher operating costs in many foreign countries; |
| • | anti-American sentiment due to American policies that may be unpopular in certain regions; and |
| • | challenges of finding qualified personnel for our international operations. |
15
Table of Contents
Our products and services could be vulnerable to unauthorized access and hacking, and any security breach could have a significant effect on our business and could expose us to material liability.
Our systems are used by our customers to collect, store, process and transmit sensitive and confidential information, including credit card data and personally identifiable information. Credit card issuers have promulgated security guidelines as part of their ongoing effort to battle theft and credit card fraud. We continue to work with the credit card issuers to assure that our products and services comply with the credit card associations’ security regulations and best practices applicable to our products and services. While we believe that all of our current software complies with applicable industry security requirements and that we use appropriate security measures to reduce the possibility of a breach through our support and other systems, we can provide no assurance that our customers’ systems will not be breached or that all unauthorized access can be prevented. In addition, the confidential information processed by our systems may be compromised if our customers do not maintain appropriate security procedures and configurations. There can be no guarantee that our customers will implement all of the security features that we introduce or all of the protection and procedures required by the credit card issuers or applicable laws, or that our customers will establish and maintain appropriate levels of firewall protection and other security measures and configurations. The confidentiality of the information processed by our products and services is critical to the successful operation of our business and when there is unauthorized access to such information that results in financial loss, we could be exposed to litigation initiated by our customers or third parties, indemnity obligations and other material liability.
We may be subject to additional tax liabilities.
We are subject to income and sales taxes in the United States and all of the other countries in which we conduct business. Additionally, we may be subject to certain tariffs imposed by the World Trade Organization and other governing bodies designed to tax U.S. imports. Significant judgment is required in determining our worldwide provision for income taxes. This determination is highly complex and requires detailed analysis of the available information and applicable statutes and regulatory materials. In the ordinary course of our business, there are many transactions and calculations where the ultimate tax determination is uncertain. We are regularly under audit by tax authorities. Although we believe our tax estimates are reasonable, the final determination of tax audits and any related litigation could be materially different from our historical income tax provisions and accruals. If we receive an adverse ruling during an audit, or we unilaterally determine that we have misinterpreted provisions of the myriad tax regulations to which we are subject, there could be a material adverse effect on our income tax provision, net income or cash flows in the period or periods for which that determination is made.
We have recorded a large amount of goodwill and other acquired intangible assets on our balance sheet and, for the fiscal year ended December 31, 2009, we were required to record a non-cash charge to earnings.
Under U.S. GAAP, we review our intangible assets for impairment when events or changes in circumstances indicate the carrying value may not be recoverable. Goodwill is required to be tested for impairment at least annually. Factors that may be considered a change in circumstances indicating that the carrying value of our goodwill or intangible assets may not be recoverable, and therefore need to be reduced or written off altogether, include a decline in stock price and market capitalization, reduced future revenues, cash flows or growth estimates, failure to meet earnings forecasts and a reduction in use or discontinuation of purchased products.
In connection with our acquisitions we have goodwill and intangible assets on our balance sheet. On January 1, 2010, we determined that the carrying value of the goodwill and other certain intangible assets was in excess of their fair values. Therefore, we were required to record a non-cash charge to earnings in the amount of $20.9 million. This charge resulted in a net loss of $9.4 million, or $0.29 per share, for the fiscal year ended December 31, 2009. In future periods, if we determine that an impairment has occurred, we will similarly be required to record a charge to earnings in our financial statements during the period in which any impairment of our goodwill or amortizable intangible assets is determined. Any such charge will correspondingly reduce our results of operations, perhaps materially.
Our Enterprise Resource Planning (“ERP”) system upgrade could result in financial statement errors and/or impact our ability to meet deadlines for future SEC filings.
On January 1, 2010, we completed an upgrade of our ERP system. This is an integrated computer-based system used to manage internal and external resources including tangible assets, financial resources, materials, and human resources. The system facilitates the flow of information between all business functions within the Company and is ultimately our system of record for accounting and financial reporting. We have thoroughly tested the system to ensure it is working properly and as designed. However, we can provide no assurance that undetected errors will not occur, including errors that are individually immaterial but that become material over time when aggregated. Further, we can provide no assurance that errors that are detected will be corrected in a timely manner to enable the Company to meet its future SEC filing deadlines.
16
Table of Contents
Risks Related to an Investment in Our Common Stock
Investment in our common stock involves risk and we do not expect to pay dividends on our common stock in the foreseeable future.
The market price for our common stock has in the past experienced substantial price volatility and such volatility may occur in the future. Our quarterly operating results, the results of other companies participating in the computer-based products and services industry, changes in conditions in the economy or the financial markets of the computer products and services industries, natural disasters or other developments affecting us or our competitors, could cause the market price of our common stock to fluctuate substantially. In addition, the stock market has experienced extreme price and volume fluctuations that have affected the market price of many technology stocks and have often been unrelated or disproportionate to the operating performance of these companies. For the foreseeable future, it is expected that earnings, if any, generated from our operations will be used to finance the growth of our business, and that no dividends will be paid to holders of our common stock.
Our executive officers own a significant amount of our common stock and will be able to exercise significant influence on matters requiring shareholder approval.
Our executive officers collectively owned approximately 15% of our outstanding common stock as of December 31, 2009. Consequently, together they continue to be able to exert significant influence over the election of our directors, the outcome of most corporate actions requiring shareholder approval and our business.
Our articles of incorporation and bylaws contain anti-takeover provisions which could have the effect of making it more difficult for a third party to acquire control of us.
Our articles of incorporation authorize our board of directors to issue up to 5,000,000 shares of preferred stock and to fix the rights, preferences, privileges and restrictions, including voting rights, of the preferred stock without further vote or action by our shareholders. The rights of the holders of our common stock will be subject to, and may be adversely affected by, the rights of the holders of any preferred stock that may be issued in the future. The issuance of any shares of preferred stock, while providing desired flexibility in connection with possible acquisitions and other corporate actions, could have the effect of making it more difficult for a third party to acquire a majority of our outstanding voting stock. For example, an issuance of preferred stock could:
| • | adversely affect the voting power of the stockholders of our common stock; |
| • | make it more difficult for a third party to gain control of us; |
| • | discourage bids for our common stock at a premium; |
| • | limit or eliminate any payments that the stockholders of our common stock could expect to receive upon our liquidation; or |
| • | otherwise adversely affect the market price of our common stock. |
In addition, our articles of incorporation divide our board of directors into three classes of directors, with each class serving a staggered three-year term. Since the classification of the board of directors generally increases the difficulty of replacing a majority of the board of directors, it is likely to discourage a third party from making a tender offer or otherwise attempting to obtain control of us. Our articles of incorporation and bylaws also provide that the provisions of our articles of incorporation and bylaws can only be amended by a supermajority vote (at least 75%) of shareholders. In addition, our bylaws prohibit us from engaging in certain business combinations, unless the business combination is approved in a prescribed manner.
17
Table of Contents
| ITEM 1B. | UNRESOLVED STAFF COMMENTS |
There are no unresolved written comments that were received from the SEC staff 180 days or more before the end of our 2009 fiscal year relating to our periodic or current reports under the Exchange Act.
| ITEM 2. | PROPERTIES |
The Company currently conducts its operations from 17 locations and 18 different facilities. With the exception of one property, all of our facilities are leased. The facilities consist of assembly/warehouse and sales/administrative offices totaling approximately 398,000 square feet. In addition, the Company subleases approximately 124,000 square feet including two facilities in Alpharetta, Georgia and one facility in Aurora, Colorado. The long-term leases on the Company’s facilities expire at various dates through 2017. The Company also has two corporate apartment leases. Both apartments are located in Shanghai, China. The leases expire on various dates through July 2010. The Company believes its facilities are adequate for its current needs and does not anticipate any material difficulty in securing facilities for new space, should the need arise. See “Liquidity and Capital Resources” for a summary of the Company’s lease obligations. A summary of our principal leased and owned properties that are currently in use is as follows:
| Location |
Description |
Area (sq. feet) |
Lease Expiration | |||
| Alpharetta, Georgia |
Office space | 106,631 | January 2013 | |||
| Alpharetta, Georgia |
Assembly and warehouse | 101,570 | December 2017 | |||
| Alpharetta, Georgia (1) |
Office space | 75,759 | January 2013 | |||
| Fort Worth, Texas |
Office space | 66,882 | July 2016 | |||
| Alpharetta, Georgia (2) |
Office space | 43,715 | December 2010 | |||
| Salzburg, Austria |
Office and warehouse space | 25,210 | January 2017 | |||
| Memphis, Tennessee |
Office space | 22,678 | December 2010 | |||
| Irvine, California |
Office and warehouse space | 18,000 | July 2013 | |||
| Geelong, Australia (3) |
Office and warehouse space | 11,900 | October 2012 | |||
| Adelaide, Australia |
Office, assembly and warehouse space | 10,721 | March 2011 | |||
| Huntington Beach, California |
Office space | 9,706 | February 2015 | |||
| Alpharetta, Georgia |
Warehouse | 9,600 | April 2011 | |||
| Prague, Czech Republic |
Office space | 8,216 | January 2011 | |||
| Kent, United Kingdom |
Office space | 3,757 | Owned | |||
| Aurora, Colorado (4) |
Office space | 4,194 | June 2013 | |||
| Singapore |
Office space | 1,399 | April 2010 | |||
| Shanghai, China |
Office space | 1,251 | March 2010 |
| (1) | The Company is subleasing 100% of this facility. The sublease expires concurrent with the Company’s primary lease agreement in January 2013. | |
| (2) | The Company is subleasing 100% of this facility. The sublease expires concurrent with the Company’s primary lease agreement in December 2010. | |
| (3) | The Company has two leased facilities in Geelong, Australia. One of the leases expires in October 2012 and the other is a month-to-month lease. | |
| (4) | The Company is subleasing 100% of this facility. The sublease expires concurrent with the Company’s primary lease agreement in June 2013. |
| ITEM 3. | LEGAL PROCEEDINGS |
There are no material pending legal proceedings to which the Company is a party or of which any of its properties are the subject; nor are there material proceedings known to the Company to be contemplated by any governmental authority. There are no material proceedings known to the Company, pending or contemplated, in which any director, officer or affiliate or any principal security holder of the Company, or any associate of any of the foregoing, is a party or has an interest adverse to the Company.
| ITEM 4. | [REMOVED AND RESERVED] |
18
Table of Contents
| ITEM 5. | MARKET FOR REGISTRANT’S COMMON EQUITY, RELATED STOCKHOLDER MATTERS AND ISSUER PURCHASES OF EQUITY SECURITIES |
The Company’s common stock is traded on The NASDAQ Stock Market under the symbol “RADS.” The following table sets forth the high and low closing sales prices of our common stock for the periods indicated as reported by The NASDAQ Stock Market.
| Year ended December 31, 2009 | High | Low | ||||
| First Quarter |
$ | 5.17 | $ | 2.25 | ||
| Second Quarter |
8.30 | 4.66 | ||||
| Third Quarter |
11.29 | 8.61 | ||||
| Fourth Quarter |
11.11 | 9.32 | ||||
| Year ended December 31, 2008 | High | Low | ||||
| First Quarter |
$ | 17.31 | $ | 12.04 | ||
| Second Quarter |
14.31 | 10.73 | ||||
| Third Quarter |
12.27 | 8.33 | ||||
| Fourth Quarter |
8.36 | 3.05 | ||||
As of March 8, 2010, there were 125 holders of record of the Company’s common stock. The closing price for the stock on this date was $12.01. Management of the Company believes that there are in excess of 7,110 beneficial holders of its common stock.
Performance Graph
The following graph compares the performance of Radiant’s common stock with the performance of The NASDAQ Stock Market Index and The NASDAQ Computer and Data Processing Stock Index for a five year period by measuring the changes in common stock prices from December 31, 2004 to December 31, 2009.
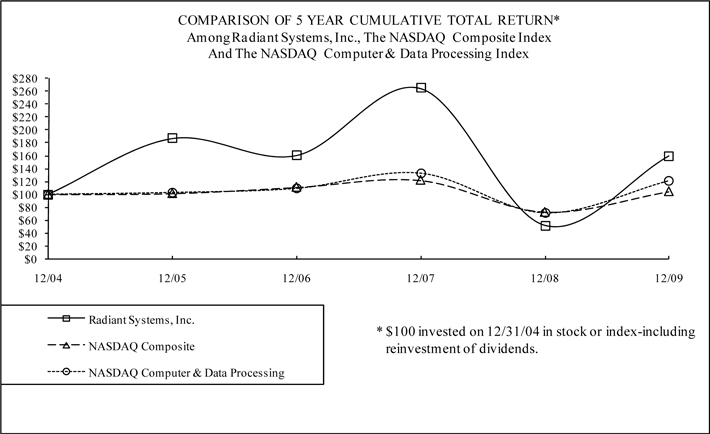
19
Table of Contents
Dividends
The Company currently anticipates that all of its earnings will be retained for development of the Company’s business and does not anticipate paying any cash dividends in the foreseeable future. Future cash dividends, if any, will be at the discretion of the Company’s Board of Directors and will depend upon, among other things, the Company’s future earnings, operations, capital requirements and surplus, general financial condition, contractual restrictions and such other factors as the Board of Directors may deem relevant.
The Company’s credit agreement with JP Morgan Chase Bank, N.A. contains limitations on the Company’s ability to declare and pay cash dividends. Further explanation of this agreement is presented in Note 7 of the consolidated financial statements.
Securities Authorized for Issuance Under Equity Compensation Plans
The following table provides information for all equity compensation plans as of the fiscal year ended December 31, 2009, under which the equity securities of the Company were authorized for issuance:
| (in thousands, except per share data) | Number of Securities to be Issued Upon Exercise of Outstanding Options, Warrants and Rights |
Weighted-Average Exercise Price of Outstanding Options, Warrants and Rights |
Number of Securities Remaining Available for Future Issuance Under Equity Compensation Plans | ||||
| Equity Compensation Plans |
|||||||
| Approved by Shareholders: |
|||||||
| 1995 Stock Option Plan |
2,923 | $ | 8.21 | — | |||
| 1997 Non-Management Directors Stock Option Plan |
235 | $ | 9.66 | — | |||
| 1998 Employee Stock Purchase Plan |
— | — | 932 | ||||
| 2005 Long-Term Incentive Plan |
2,717 | $ | 10.59 | 999 | |||
| Not approved by shareholders: |
— | — | — | ||||
| Total |
5,875 | $ | 9.37 | 1,931 | |||
Purchases of Common Stock
In the fourth quarter of 2007, the Board of Directors of the Company authorized a re-commencement of the Company’s stock repurchase program authorizing the repurchase of up to 1.0 million shares of its common stock at a price not to exceed $25.00 per share through November 2009. No such purchases were made during the fiscal years ended December 31, 2009, 2008 or 2007.
20
Table of Contents
| ITEM 6. | SELECTED FINANCIAL DATA |
The following table sets forth selected consolidated financial data of the Company for each of its five most recent fiscal years which have been derived from the consolidated financial statements of the Company. The financial data as of and for the year ended December 31, 2005 includes Radiant’s acquisition of MenuLink, which took place in October 2005. The financial data as of and for the year ended December 31, 2006 includes Radiant’s acquisition of Synchronics, which took place in January 2006. The financial data as of and for the year ended December 31, 2008 includes Radiant’s acquisitions of Quest, Hospitality EPoS, Jadeon and Orderman, which took place in January 2008, April 2008, May 2008 and July 2008, respectively. See Note 5 to the consolidated financial statements for further explanation regarding these acquisitions. This selected consolidated financial data should be read in conjunction with “Management’s Discussion and Analysis of Financial Condition and Results of Operations” and the consolidated financial statements of the Company and the notes thereto included elsewhere herein (in thousands, except per share data):
| Year Ended December 31, | ||||||||||||||||
| 2009 | 2008 | 2007 | 2006 | 2005 | ||||||||||||
| Statement of Operations Data: |
||||||||||||||||
| Revenues |
$ | 287,468 | $ | 301,576 | $ | 253,198 | $ | 222,310 | $ | 172,042 | ||||||
| Cost of revenues |
151,949 | 172,514 | 141,601 | 124,451 | 102,292 | |||||||||||
| Gross profit |
135,519 | 129,062 | 112,137 | 97,859 | 69,750 | |||||||||||
| Net (loss) income (1) |
(9,398 | ) | 11,028 | 11,843 | 18,357 | 5,562 | ||||||||||
| Net (loss) income per share: |
||||||||||||||||
| Basic (loss) income per share |
$ | (0.29 | ) | $ | 0.34 | $ | 0.38 | $ | 0.59 | $ | 0.19 | |||||
| Diluted (loss) income per share |
$ | (0.29 | ) | $ | 0.33 | $ | 0.36 | $ | 0.56 | $ | 0.18 | |||||
| December 31, | ||||||||||||||||
| 2009 | 2008 | 2007 | 2006 | 2005 | ||||||||||||
| Balance Sheet Data: |
||||||||||||||||
| Working capital |
$ | 28,790 | $ | 41,578 | $ | 51,720 | $ | 29,656 | $ | 22,822 | ||||||
| Total assets |
288,597 | 303,542 | 221,959 | 198,655 | 142,505 | |||||||||||
| Long-term debt, including current portion |
62,626 | 98,466 | 20,467 | 34,194 | 18,383 | |||||||||||
| Shareholders’ equity |
153,343 | 140,331 | 141,956 | 115,971 | 84,433 | |||||||||||
| (1) | Fiscal year ended December 31, 2009 includes a non-cash impairment charge of $20.9 million related to the goodwill and certain intangible assets associated with our Quest acquisition. See Note 6 to the consolidated financial statements and “Management’s Discussion and Analysis of Financial Condition and Results of Operations.” Fiscal year ended December 31, 2006 includes an income tax benefit of approximately $10.3 million. See Note 10 in the notes to the consolidated financial statements and “Management’s Discussion and Analysis of Financial Condition and Results of Operations.” |
21
Table of Contents
| ITEM 7. | MANAGEMENT’S DISCUSSION AND ANALYSIS OF FINANCIAL CONDITION AND RESULTS OF OPERATIONS |
Introduction
Management’s Discussion and Analysis (“MD&A”) is intended to facilitate an understanding of Radiant’s business and results of operations. This MD&A should be read in conjunction with Radiant’s consolidated financial statements and the accompanying notes to consolidated financial statements included elsewhere in this report. MD&A consists of the following sections:
| • | Overview: A summary of Radiant’s business, financial performance and opportunities |
| • | Recent Acquisitions and New Businesses: A summary of recent acquisitions and new businesses |
| • | Results of Operations: A discussion of operating results |
| • | Liquidity and Capital Resources: An analysis of cash flows, sources and uses of cash, contractual obligations and financial position |
| • | Critical Accounting Policies and Procedures: A discussion of critical accounting policies that require the exercise of judgments and estimates |
| • | Recent Accounting Pronouncements: A summary of recent accounting pronouncements and the effects on the Company |
Overview
We are a leading provider of technology focused on the development, installation and delivery of solutions for managing site operations of hospitality and retail businesses. Our point-of-sale and back-office technology is designed to enable businesses to deliver exceptional customer service while improving profitability. We offer a full range of products and services that are tailored to specific hospitality and retail market needs including hardware, software, professional services and electronic payment processing. The Company offers best-of-breed solutions designed for ease of integration in managing site operations, thus enabling operators to improve customer service while reducing costs. We believe our approach to site operations is unique in that our product solutions provide enterprise visibility and control at the site, field, and headquarters levels.
Our Company’s growth continues to be driven by the long-term industry shift toward a full system solution provider, the ability to have vertical solutions and non-payment applications residing at the point-of-sale, and new technology that enables operators to enhance their revenue drivers such as speed and consistency of service, customer loyalty programs, order accuracy and loss prevention and providing customers with greater value and a broader selection of products. Most recently, there have been well publicized breaches of point-of-sale and back-office systems that handle consumer card details, spurring widespread interest in more secure payment terminals and end-to-end encryption technology. We believe we are well positioned to meet the needs of our industry segments and the concerns around security with our suite of product offerings which consist of hardware and software for point-of-sale and operational applications, as well as our back-office application offerings which include inventory, labor, financial management, fraud management and other centrally hosted enterprise solutions.
Security has become a driving factor in our industry as our customers try to meet ever escalating governmental requirements directed toward the prevention of identity theft as well as operating safeguards imposed by the credit and debit card associations. In September 2006, these card associations established the PCI Security Standards Council to oversee and unify industry standards in the areas of credit card data security. We believe we are a leader in providing systems and software solutions that meet the payment application requirements and will continue to help the industry define new standards across the payment process, educate businesses on how to reduce theft by meeting the Payment Card Industry Data Security Standard (PCI DSS) requirement process, and build new technologies outside its point-of-sale software to combat theft.
We manage our business in two reportable segments: (i) Hospitality (which includes our food service and entertainment businesses and the recently acquired businesses of Orderman, Jadeon, Hospitality EPoS and Quest), and (ii) Retail (which is comprised of our petroleum and convenience retail and specialty retail businesses). Each segment focuses on delivering site management systems, including point-of-sale, self-service kiosk, and back-office systems, designed specifically for each of the core vertical markets. We believe our customers benefit from a number of competitive advantages gained through our 25-year history of success in our industry segments. These advantages include our globally trusted brand names, large installed base, customizable platforms and our investment in research and development of new products for our industry segments.
The point-of-sale hospitality and retail markets in which we operate are intensely competitive and highly dynamic, categorized by advances in technology, product introductions and the ability to respond to security standards. This competitive environment and the expectation in the marketplace that technology will continue to improve while becoming less expensive results in significant pricing pressures. Our ability to compete generally depends on how well we navigate within this environment. To compete successfully we must continue to commercialize our technology, develop new products that meet constantly evolving customer requirements, continually improve our existing products, processes and services faster than our competitors, and price our products competitively while reducing average unit costs.
Our 2009 financial results reflected significantly reduced demand for point-of-sale software and equipment due to extremely unfavorable global economic and industry conditions, with the most significant declines seen in the first half of 2009. Negative trends in consumer spending and pervasive economic uncertainty led to slowed new site openings and reduced capital spending from existing customers. Although we saw declines in our systems and professional services revenue during 2009, we continued to see increases in our recurring revenue sources such as hardware maintenance, software support and maintenance, hosted solution offerings and electronic payment processing. These higher margin sources of income, which resulted in a significant increase in our gross profit percentage over 2008, along with the fact that these revenues are recurring in nature, lead us to believe that although our revenues declined in 2009, the quality of our revenues has significantly improved.
In the second half of 2009, demand began to increase and was recognized through new customer wins, a growing pipeline of opportunities and the stabilization of our channel partners, which resulted in fourth quarter growth over 2008. We expect this trend to continue in 2010 due to the number of significant new contracts signed in the second half of 2009, the visibility of the pipeline available to us in 2010, our ability to work closely with our channel partners to help end customers realize the benefits of new technology in their sites, and the launching of several new products in hosted solutions, mobile ordering and a new point-of-sale terminal in Europe.
Expecting that our revenues would decline in 2009 as a result of the poor economic conditions, we took actions to realign our cost structure with these expectations. This resulted in headcount reductions across our business, including employees and temporary/contract workers, which was necessary in order to maintain profitability, generate strong operating cash flows and protect our capital. These proactive measures helped us generate record cash flows from operations and operating income profitability as compared to our performance in 2008, excluding charges associated with the non-cash write off of goodwill and certain intangible assets that occurred in the fourth quarter.
22
Table of Contents
Recent Acquisitions and New Businesses
The following is a brief summary of recent acquisitions, in order from most current to least current, followed by discussion of our electronic payment processing business. To the extent that we believe acquisitions, joint ventures or new businesses can position us to better to serve our current segments, we will continue to pursue such opportunities in the future.
| • | Acquisition of Orderman – On July 1, 2008, the Company acquired Orderman GmbH (“Orderman”), one of the leading manufacturers of wireless handheld ordering and payment devices for the hospitality industry. Headquartered in Salzburg, Austria, Orderman has provided innovative mobile solutions since 1994. Orderman distributes its solutions through a reseller network of partners that have deployed approximately 50,000 handheld devices, predominately in Europe. The acquisition enables Radiant to accelerate the adoption of mobile devices in the global hospitality sector. The total purchase price was approximately $33.0 million. The operations of the Orderman business have been included in our consolidated results of operations and financial position from the date of acquisition. The results of these operations are reported under the Hospitality segment. |
| • | Acquisition of Jadeon – On May 1, 2008, Radiant acquired substantially all of the assets of Jadeon, Inc. (“Jadeon”), one of the Company’s resellers in California. Headquartered in Irvine, just outside Los Angeles, Jadeon had been delivering and supporting Radiant’s hospitality point-of-sale solutions since 2001 and offered a full range of technology systems and implementation and support services throughout the West coast. The acquisition enables Radiant to strengthen its service capabilities and relationships with key accounts and serves as a platform for Radiant to strengthen its West coast market presence, specifically in the Los Angeles and San Francisco markets, allowing better penetration in the largest market in North America. The total purchase price was approximately $7.3 million. The operations of the Jadeon business have been included in our consolidated results of operations and financial position from the date of acquisition. The results of these operations are reported under the Hospitality segment. |
| • | Acquisition of Hospitality EPoS – On April 4, 2008, the Company acquired Hospitality EPoS Systems Ltd. (“Hospitality EPoS”), a technology supplier to the U.K. hospitality market since 1992. Headquartered in Kent, England, just outside London, Hospitality EPoS provided capabilities for sales, implementation and support services and represented our suite of Aloha products. The total purchase price was approximately $6.1 million. The operations of the Hospitality EPoS business have been included in our consolidated results of operations and financial position from the date of acquisition. The results of these operations are reported under the Hospitality segment. |
| • | Acquisition of Quest – On January 1, 2008, the Company acquired Quest Retail Technology (“Quest”), a privately held company based in Adelaide, Australia. Quest is a global provider of point-of-sale and back office solutions to stadiums, arenas, convention centers, race courses, theme parks and various other industries. The total purchase price was approximately $53.4 million. The operations of the Quest business have been included in our consolidated results of operations and financial position from the date of acquisition. The results of these operations are reported under the Hospitality segment. |
| • | Launch of Radiant Payment Services – Radiant expanded its business services in 2008 with the launch of Radiant Payment Services (“RPS”), a business aimed at selling and servicing electronic payment processing. RPS enhances Radiant’s current solutions by providing an integrated, turnkey payment processing solution for a wide variety of payment methods including credit, debit and gift card payments. The objective of RPS is to raise the level of customer service that is provided to business owners and operators by providing competitive and transparent pricing, increased accountability from a single vendor and the highest level of security for customer data and credit card transactions. |
23
Table of Contents
Results of Operations
The following table sets forth, for the periods indicated, the percentage relationship of certain statement of operations items to total revenues:
| Year ended December 31, | |||||||||
| 2009 | 2008 | 2007 | |||||||
| Revenues: |
|||||||||
| Systems |
41.9 | % | 51.6 | % | 57.1 | % | |||
| Maintenance, subscription and transaction services |
46.0 | 36.1 | 32.5 | ||||||
| Professional services |
12.1 | 12.3 | 10.4 | ||||||
| Total revenues |
100.0 | 100.0 | 100.0 | ||||||
| Cost of revenues: |
|||||||||
| Systems |
22.2 | 27.5 | 30.2 | ||||||
| Maintenance, subscription and transaction services |
22.7 | 20.8 | 17.5 | ||||||
| Professional services |
8.0 | 8.9 | 7.9 | ||||||
| Total cost of revenues |
52.9 | 57.2 | 55.6 | ||||||
| Gross profit |
47.1 | 42.8 | 44.3 | ||||||
| Operating expenses: |
|||||||||
| Product development |
7.8 | 8.2 | 9.3 | ||||||
| Sales and marketing |
14.7 | 12.1 | 11.4 | ||||||
| Depreciation of fixed assets |
1.7 | 1.6 | 1.6 | ||||||
| Amortization of intangible assets |
3.2 | 2.6 | 1.7 | ||||||
| General and administrative |
12.2 | 10.4 | 11.1 | ||||||
| Impairment of goodwill |
5.9 | — | — | ||||||
| Other charges and income, net |
1.8 | 0.5 | — | ||||||
| Total operating expenses |
47.3 | 35.4 | 35.1 | ||||||
| (Loss) income from operations |
(0.1 | ) | 7.4 | 9.2 | |||||
| Interest and other expense, net |
0.8 | 1.7 | 1.0 | ||||||
| (Loss) income from operations before income tax provision |
(0.9 | ) | 5.7 | 8.2 | |||||
| Income tax provision |
2.4 | 2.0 | 3.5 | ||||||
| Net (loss) income |
(3.3 | )% | 3.7 | % | 4.7 | % | |||
24
Table of Contents
Year ended December 31, 2009 compared to year ended December 31, 2008
The Company had a net loss of $9.4 million, or $0.29 per basic common share, in 2009, compared with net income of $11.0 million, or $0.33 per diluted common share, in 2008. The net loss was fully attributable to a $20.9 million non-cash charge relating to the impairment of goodwill and certain intangible assets of Quest as further described in Note 6 to the consolidated financial statements.
The Company’s revenues decreased during the year ended December 31, 2009 by $14.1 million, or 5%, compared to the year ended December 31, 2008. The decrease in revenue was primarily due to the global economic downturn that began in the latter portion of 2008. The decrease in revenues was partially offset by a full year of operations from our electronic payment processing business and the acquisitions of Orderman, Jadeon and Hospitality EPoS that were completed in the second and third quarters of 2008.
Systems – Systems revenue is derived from sales and licensing fees for our point-of-sale hardware and software, site management software solutions and peripherals. Systems revenue for 2009 was $120.5 million compared to $155.6 million in 2008, a decrease of $35.1 million, or 23%. The decrease in systems revenue was primarily due to the economic downturn noted above, which slowed new site openings and reduced capital spending from existing customers. The decrease was partially offset by having a full year of operations from Orderman, Jadeon and Hospitality EPoS.
Maintenance, subscription and transaction services – The Company derives revenues from maintenance, subscription and transaction services including hardware maintenance, software support and maintenance, hosted solutions and electronic payment processing services. The majority of these revenues are derived from support and maintenance, which is structured on a renewable basis and is directly attributable to the base of installed sites. A majority of all subscription, maintenance and support contracts are renewed annually.
Revenues from maintenance, subscription and transaction services increased by $23.3 million, or 21%, to $132.3 million in 2009 as compared to 2008. The increase was primarily due to the additional revenues generated in both software and hardware support and maintenance resulting from incremental systems sales in 2008 and 2009 (which added to our site base for recurring revenue), an increase in demand for our hosted solutions, and a full year of revenues resulting from our electronic payment processing business which we launched in the second half of 2008.
Professional services – The Company also derives revenues from professional services such as consulting, training, custom software development and system installations. Revenues from professional services decreased by $2.3 million, or 6%, to $34.7 million in 2009 as compared to 2008. The decrease is primarily due to lower installations revenue, which fell in direct correlation to the lower systems sales. The decrease was partially offset by increased revenue in consulting and custom software development projects.
Systems gross profit – Cost of systems consists primarily of hardware and peripherals for site-based systems and amortization of capitalized labor costs for internally developed software. All costs, other than capitalized software development costs, are expensed as products are shipped, while capitalized software development costs are amortized to expense on a straight-line basis over the estimated useful life of the software. Systems gross profit decreased during 2009 by $15.8 million, or 22%, to $56.8 million, while the gross margin percentage remained constant at 47% in 2009 compared to 2008.
Maintenance, subscription and transaction services gross profit – Cost of maintenance, subscription and transaction services consists primarily of personnel and other costs to provide support and maintenance services, hosted solutions and electronic payment processing services. The gross profit on maintenance, subscription and transaction services revenue increased during 2009 by $20.9 million, or 45%, to $67.1 million, while the gross margin percentage increased by eight points to 51% for 2009 compared to 2008. The increase in the gross margin percentage was primarily due to the launch of our electronic payment processing business and increased revenues from hosted solutions, both of which have higher margins. Margins were also improved in support and maintenance services through the combination of groups and streamlining of processes while maintaining a high level of service.
Professional services gross profit – Cost of professional services consists primarily of personnel costs for consulting, training, custom software development and installation services. The gross profit on professional services revenue increased during 2009 by $1.4 million, or 14%, to $11.5 million while the gross margin percentage increased by six points to 33% for 2009 compared to 2008. The increase in the gross margin percentage was primarily attributable to the removal of capacity in the Company through the headcount reductions made in the fourth quarter of 2008 and the first quarter of 2009, as well as a continued focus on improving margins within our professional services through better utilization of personnel, including temporary and contract employees.
Segment revenues – Total revenues in the Hospitality business segment were $215.7 million in 2009 compared to $225.0 million in 2008, a decrease of $9.3 million, or 4%. The decrease was primarily due to the decline in systems sales throughout the segment, but was partially offset by a full year of operations for Orderman, Jadeon and Hospitality EPoS and an increase in maintenance, subscription and transaction fees revenue.
Total revenues in the Retail business segment were $68.8 million in 2009 compared to $73.1 million in 2008, a decrease of $4.3 million, or 6%. The decrease was primarily attributable to economic factors that have resulted in a decrease in demand by convenience store operators. This decrease was partially offset by an increase in revenues within our specialty retail business.
Segment net income before allocation of central costs – The Company measures segment profit based on net income before the allocation of certain central costs. For the year ended December 31, 2009, total net income before allocation of central costs in the Hospitality business segment decreased by $20.0 million, or 54%, compared to the same period in 2008. The decrease was primarily due to the non-cash charge relating to the impairment of goodwill and certain intangible assets of Quest. This decrease was partially offset by improved operating margins attributable to a more efficient cost structure resulting from the headcount reductions previously mentioned.
For the year ended December 31, 2009, total net income before allocation of central costs in the Retail business segment increased by $4.6 million, or 44%, compared to the same period in 2008. The increase was primarily due to an increase in sales and profitability through our channel partners and a more efficient cost structure resulting from the headcount reductions previously mentioned.
25
Table of Contents
Total operating expenses – Total operating expenses for 2009 increased by $29.1 million, or 27%, as compared to 2008. Total operating expenses as a percentage of total revenues were 47% in 2009 and 35% in 2008. The components of operating expenses are discussed below:
| • | Product development expenses – Product development expenses consist primarily of wages and materials expended on product development efforts, excluding any development expenses related to associated revenues which are included in costs of customer support, maintenance and other services. Product development expenses decreased during 2009 by $2.4 million, or 10%, compared to 2008, primarily due to headcount reductions made in the fourth quarter of 2008 and the first quarter of 2009 to adjust our cost structure during the economic downturn. |
| • | Sales and marketing expenses – Sales and marketing expenses increased during 2009 by $6.0 million, or 16%, compared to 2008. This increase was primarily related to a full year of sales and marketing expenses resulting from the acquisitions of Orderman, Jadeon and Hospitality EPoS, higher bonus expense in 2009 as compared to 2008 due to the Company meeting its budgeted operating income and a full year of costs associated with our electronic payment processing business. Sales and marketing expenses as a percentage of total revenue were 15% and 12% in 2009 and 2008, respectively. |
| • | Depreciation of fixed assets and amortization of intangible assets – Depreciation and amortization expense increased by $1.5 million, or 12%, in 2009 as compared to 2008. The increase was directly related to a full year of amortization of certain intangible assets associated with Orderman, Jadeon and Hospitality EPoS. Depreciation and amortization expenses as a percentage of revenues were 5% and 4% during 2009 and 2008, respectively. |
| • | General and administrative expenses – General and administrative expenses increased during 2009 by $3.7 million, or 12%, as compared to 2008. The increase was primarily due to the additional overhead expenses resulting from the acquisitions completed in 2008 and additional bonus expense associated with the Company meeting its budgeted operating income for the year. General and administrative expenses as a percentage of total revenue were 12% and 10% in 2009 and 2008, respectively. |
| • | Impairment of goodwill – During the fourth quarter of 2009, the Company recorded a $17.0 million non-cash impairment charge to write off a portion of the goodwill associated with the acquisition of Quest. This charge was the result of our annual goodwill impairment analysis as further described in Note 6 to the consolidated financial statements. |
| • | Other charges and income, net – The amounts contained under this heading are unlikely to occur again in the normal course of business and, as such, it is not practical to compare amounts between the current period and previous periods. However, a description of the items which comprise these amounts follows. See Note 8 to the consolidated financial statements for further discussion of these items. |
| • | During the fourth quarter of 2009, the Company recorded a $3.9 million non-cash impairment charge to write off a portion of certain intangible assets associated with Quest. This charge was the result of an appraisal of Quest’s intangible assets performed in conjunction with the goodwill impairment analysis as further described in Note 6 to the consolidated financial statements. |
| • | During the first quarter of 2009, the Company determined that it would not use certain third-party software licenses and recorded a write-off charge of $0.5 million as a result. Also during the first quarter of 2009, the Company recorded a charge of $0.7 million related to severance costs and restructuring of the organization. This charge resulted from efforts to align the Company’s structure with its revenues in light of the severe economic downturn that began in the second half of 2008. Additionally, during the first quarter of 2009, the Company sold a building for cash proceeds of approximately $0.2 million. A net gain of approximately $0.1 million was recognized as a result of this transaction. |
| • | During the fourth quarter of 2008, the Company recorded an impairment charge of $1.0 million related to the write down of a capitalized software product and a charge of $0.4 million related to severance payments and the restructuring of the organization. These charges were offset by a gain of $1.4 million on the sale of land near its corporate headquarters. |
| • | During the third quarter of 2008, the Company recorded a restructuring charge of $2.1 million related to amending a sublease agreement on a facility in Alpharetta, Georgia. |
| • | During the second quarter of 2008, the Company recorded a gain of approximately $0.5 million as a result of entering into a forward exchange contract in preparation for the acquisition of Orderman. |
| • | During the first quarter of 2008, the Company recorded a gain of approximately $0.3 million as a result of entering into a forward exchange contract in preparation for the acquisition of Quest. This gain was offset by approximately $0.4 million in debt cost write-offs and penalties associated with early termination of a credit agreement as described in Note 7 to the consolidated financial statements. |
Interest expense, net – The Company’s interest expense includes interest expense incurred on its long-term debt and capital lease obligations. Interest expense decreased from $4.9 million in 2008 to $2.3 million in 2009. This decrease was the result of the Company’s continuing reduction of its debt, which decreased by approximately $35.8 million during 2009.
Provision for income taxes – The Company’s effective income tax rate was (264.6%) in 2009, 35.4% in 2008 and 42.7% in 2007. In the fourth quarter of 2009, the Company recorded non-cash charges related to the impairment of goodwill and certain intangible assets associated with Quest. As a result of these charges, the Company’s effective tax rate fluctuated significantly during the 2009 year as compared to 2008. During 2009, a valuation allowance of $6.6 million was recorded related to the amortization and impairment of goodwill and certain intangible assets associated with the acquisition of Quest. This compares to a $0.5 million valuation allowance related to the amortization of intangible assets associated with the acquisition of Quest recorded in 2008. The rate reconciliation table in Note 10 to the consolidated financial statements illustrates the rate impact of the individual items referenced in this table. Each of these items were calculated based on the tax impact each item had on the Company’s net income. The charges from the impairment of goodwill and certain intangible assets associated with the Quest acquisition resulted in a loss for U.S. GAAP purposes. However, these charges were not deductible for tax purposes, which contributed to a significant fluctuation from the rate noted in 2009 compared to 2008 for each item as referenced in the rate reconciliation table. Excluding the impairment charges, the Company’s effective tax rate would have been 37.2%. See Note 10 to the consolidated financial statements for additional discussion of income taxes.
26
Table of Contents
Year ended December 31, 2008 compared to year ended December 31, 2007
The Company earned net income of $0.33 per diluted common share in 2008, compared with $0.36 per diluted common share in 2007. In addition, the Company’s revenues increased during the year ended December 31, 2008 by $48.4 million, or 19%, compared to the year ended December 31, 2007. The increase in revenue was primarily due to the acquisitions completed in 2008 in addition to new contracts within our direct channel in our Hospitality segment and new contracts within our indirect channel in our Retail segment. In addition, continued market penetration of the products previously acquired through acquisitions and transaction fee revenue resulting from our new electronic payment processing business contributed to the increase.
Systems – Systems revenue is derived from sales and licensing fees for our point-of-sale hardware and software, site management software solutions and peripherals. Systems revenue for 2008 was $155.6 million compared to $144.6 million in 2007, an increase of $11.0 million, or 8%. The year over year increase was primarily due to the additional revenues resulting from the acquisitions of Orderman, Quest, Hospitality EPoS and Jadeon and the continued expansion of direct sales in the Hospitality segment. The increase from 2007 to 2008 was partially offset by a decrease in our Retail business segment.
Maintenance, subscription and transaction services – The Company derives revenues from maintenance, subscription and transaction services including hardware maintenance, software support and maintenance, hosted solutions and electronic payment processing services. The majority of these revenues are derived from support and maintenance, which is structured on a renewable basis and is directly attributable to the base of installed sites. A significant majority of all subscription, maintenance and support contracts are renewed annually.
Revenues from maintenance, subscription and transaction services increased by $26.7 million, or 33%, from 2007 to $108.9 million in 2008. The increase was primarily due to the additional revenues generated in both software and hardware support and maintenance resulting from increased systems sales in 2008, additional revenues resulting from our electronic payment processing business and additional revenues resulting from the acquisitions of Quest and Jadeon.
Professional services – The Company also derives revenues from professional services such as consulting, training, custom software development and system installations. Revenues from professional services increased by $10.6 million, or 40%, from 2007 to $37.0 million in 2008. The increase was primarily due to the additional revenues resulting from the acquisitions of Quest and Jadeon, the continued expansion of direct sales in the Hospitality segment and the continued growth of new site installations in our hospitality markets.
Systems gross profit – Cost of systems consists primarily of hardware and peripherals for site-based systems and amortization of capitalized labor costs for internally developed software. All costs, other than capitalized software development costs, are expensed as products are shipped, while capitalized software development costs are amortized to expense on a straight-line basis over the estimated useful life of the software. Systems gross profit increased during 2008 by $4.6 million, or 7%, to $72.7 million, while the gross margin percentage remained constant at 47% in 2008 compared to 2007.
Maintenance, subscription and transaction services gross profit – Cost of maintenance, subscription and transaction services consists primarily of personnel and other costs to provide support and maintenance services, hosted solutions and electronic payment processing services. The gross profit on maintenance, subscription and transaction services revenue increased during 2008 by $8.5 million, or 22%, to $46.3 million, while the gross margin percentage decreased by three points to 43% for 2008 compared to 2007. The decrease in the gross margin percentage was primarily the result of a decrease in our hardware maintenance margin. Specifically, the Jadeon business had a lower margin on hardware maintenance than Radiant, but we expect to be able to increase these margins as we continue our integration of Jadeon into our core business.
Professional services gross profit – Cost of professional services consists primarily of personnel costs for consulting, training, custom software development and installation services. The gross profit on professional services revenue increased during 2008 by $3.9 million, or 62%, to $10.1 million while the gross margin percentage increased by four points to 27% for 2008 compared to 2007. The increase in the gross margin percentage was the result of continued focus on improving margins within our consulting and custom development services through better utilization of personnel.
Segment revenues – Total revenues in the Hospitality business segment were $225.0 million in 2008 compared to $170.5 million in 2007, an increase of $54.5 million, or 32%. The increase was primarily due to the additional revenues resulting from the acquisitions of Orderman, Quest, Hospitality EPoS, and Jadeon, and an increase within our direct sales channel.
Total revenues in the Retail business segment were $73.1 million in 2008 compared to $80.5 million in 2007, a decrease of $7.5 million, or 9%. The decrease is primarily attributable to economic factors that resulted in a decrease in demand by convenience store operators. This decrease was partially offset by an increase in revenues within our indirect sales channel.
Segment net income before allocation of central costs – The Company measures segment profit based on net income before the allocation of certain central costs. For the year ended December 31, 2008, total net income before allocation of central costs in the Hospitality business segment increased by $1.2 million, or 3%, compared to the same period in 2007. The increase from 2007 was primarily due to the profitability driven by the acquisition of Quest and additional revenue and profits in our food service operating unit. This increase was partially offset by an expected decrease in our entertainment operating unit and a net loss in our Orderman business.
For the year ended December 31, 2008, total net income before allocation of central costs in the Retail business segment decreased by $6.5 million, or 38%, compared to the same period in 2007. The decrease from 2007 was primarily the result of a reduction in revenue from the Retail business segment (specifically our petroleum and convenience store operating unit) and a decrease in gross profit due to changes in product mix.
27
Table of Contents
Total operating expenses – Total operating expenses for 2008 increased by $17.9 million, or 20%, as compared to 2007. Total operating expenses as a percentage of total revenues were 35% in 2008 and 2007. The components of operating expenses are discussed below:
| • | Product development expenses – Product development expenses consist primarily of wages and materials expended on product development efforts, excluding any development expenses related to associated revenues which are included in costs of customer support, maintenance and other services. Product development expenses increased during 2008 by $1.4 million, or 6%, compared to 2007, primarily due to the additional expense structure assumed by the acquisitions made during the year. Product development expense as a percentage of total revenue was 8% and 9% in 2008 and 2007, respectively. |
| • | Sales and marketing expenses – Sales and marketing expenses increased by $7.5 million, or 26%, compared to 2007. This increase was primarily related to the incremental sales and marketing expenses resulting from the acquisitions of Orderman, Quest, Hospitality EPoS and Jadeon and the hiring of additional personnel to manage and support our sales growth. Sales and marketing expenses as a percentage of total revenue were 12% and 11% in 2008 and 2007, respectively. |
| • | Depreciation of fixed assets and amortization of intangible assets – Depreciation and amortization expense increased by $4.1 million, or 49%, in 2008 as compared to 2007. The increase from 2007 was directly related to the amortization of certain intangible assets related to the acquisitions of Orderman, Quest, Hospitality EPoS and Jadeon, as well as additional depreciation expense resulting from the growth in our fixed assets. Depreciation and amortization expenses as a percentage of revenues were 4% and 3% during 2008 and 2007, respectively. |
| • | General and administrative expenses – General and administrative expenses increased by $3.3 million, or 12%, as compared to 2007. The increase from 2007 was primarily due to the additional expense structure assumed by the acquisitions made during the year. General and administrative expenses as a percentage of total revenue were 10% and 11% in 2008 and 2007, respectively. |
| • | Other charges and income, net – The amounts contained under this heading are unlikely to occur again in the normal course of business and, as such, it is not practical to compare amounts between the current period and previous periods. However, a description of the items which comprise these amounts follows. See Note 8 to the consolidated financial statements for further discussion of these items. |
| • | During the fourth quarter of 2008, the Company recorded an impairment charge of $1.0 million related to the write down of a capitalized software product and a charge of $0.4 million related to severance payments and the restructuring of the organization. These charges were offset by a gain of $1.4 million on the sale of land near its corporate headquarters. |
| • | During the third quarter of 2008, the Company recorded a restructuring charge of $2.1 million related to amending a sublease agreement on a facility in Alpharetta, Georgia. |
| • | During the second quarter of 2008, the Company recorded a gain of approximately $0.5 million as a result of entering into a forward exchange contract in preparation for the acquisition of Orderman. |
| • | During the first quarter of 2008, the Company recorded a gain of approximately $0.3 million as a result of entering into a forward exchange contract in preparation for the acquisition of Quest. This gain was offset by approximately $0.4 million in debt cost write-offs and penalties associated with early termination of a credit agreement as described in Note 7 to the consolidated financial statements. |
| • | During 2007, the Company recorded a gain of $0.8 million as a result of entering into a forward exchange contract in preparation for the acquisition of Quest. In addition, the Company recorded a one-time expense of $1.2 million to write off accumulated transaction costs for multiple corporate development activities that we elected not to pursue. |
| • | During 2006, Radiant relocated its offices in Bedford, Texas to a facility in Fort Worth, Texas. The Company was contractually liable for the lease payments on the abandoned Bedford facility through September 2007 (lease expiration). In accordance with FASB ASC Topic 420, Exit or Disposal Cost Obligations (“ASC 420”), the Company recorded a lease restructuring charge based on the fair value of the remaining lease payments and estimated maintenance costs at the abandonment date. The restructuring charges were attributable to the Company’s Hospitality business segment. The abandonment of the Bedford facility resulted in a restructuring charge of $1.4 million in 2006, which consisted of the fair value of the remaining lease liability and ongoing maintenance costs. During 2007, the Company updated its restructuring reserve analysis and reduced the reserve by $0.1 million as the initial assumption regarding ongoing maintenance costs changed. |
| • | In 2005, Radiant decided to consolidate certain facilities located in Alpharetta, Georgia, in order to reduce future operating costs. This resulted in the abandonment of one facility, which formerly housed the Company’s customer support call center. The restructuring charges were not attributable to any of the Company’s reportable segments. In accordance with ASC 420, the Company recorded a lease restructuring charge based on the fair value of the remaining lease payments at the abandonment date less the estimated sublease rentals that could reasonably be obtained from the property. This consolidation resulted in a restructuring charge of $1.5 million in 2005, which consisted of $1.2 million for facility consolidations and $0.3 million of fixed asset write-offs associated with the facility consolidation. The Company updated its restructuring reserve analysis in 2007 and reduced the reserve by $0.2 million as the initial assumption regarding the ability to sublease the facility changed. As of December 31, 2008, the Company had accrued $1.6 million related to these lease commitments. |
Interest expense, net – The Company’s interest expense includes interest expense incurred on its long-term debt and capital lease obligations. Interest income is derived from the investment of our cash and cash equivalents. Net interest expense increased from $2.4 million in 2007 to $4.9 million in 2008. This increase was directly attributable to the debt assumed when the Company entered into the JPM Credit Agreement and additional borrowings were obtained on its revolving loan during 2008 to finance the acquisitions of Orderman, Quest, Hospitality EPoS and Jadeon, as further described in Notes 5 and 7 to the consolidated financial statements.
Provision for income taxes – The Company’s effective income tax rate was 35.4% in 2008, 42.7% in 2007 and (127.9%) in 2006. See Note 10 to the consolidated financial statements for additional discussion of income taxes.
28
Table of Contents
Liquidity and Capital Resources
Prior to January 2008, the Company had a senior secured credit facility with Wells Fargo Foothill, Inc. (the “WFF Credit Agreement”). The WFF Credit Agreement provided for extensions of credit, upon satisfaction of certain conditions, in the form of revolving loans in an aggregate principal amount of up to $15 million and a term loan facility in an aggregate principal amount of up to $31 million. The revolving loan amount available to the Company was derived from a monthly borrowing base calculation using the Company’s various accounts receivable balances. The amount derived from this borrowing base calculation was further reduced by the total amount of letters of credit outstanding. Loans under the WFF Credit Agreement bore interest, at Radiant’s option, at either the London Interbank Offering Rate (“LIBOR”) plus two and one half percent or at the prime rate of Wells Fargo Bank, N.A.
The WFF Credit Agreement was scheduled to expire on March 31, 2010; however, it was refinanced in January 2008 upon the execution of the credit agreement with JPMorgan Chase Bank, N.A., as arranger, and JPMorgan Chase Bank, N.A, SunTrust Bank, Bank of America, Guaranty Bank and Wachovia Bank, N. A., as lenders (the “JPM Credit Agreement”). The JPM Credit Agreement and subsequent amendments thereto provide for extensions of credit, upon satisfaction of certain conditions, in the form of revolving loans in an aggregate principal amount of up to $80 million and a term loan facility in an aggregate principal amount of up to $30 million. An amendment to the JPM Credit Agreement was signed in July 2008, whereby the Company has the right to increase its revolving credit commitment by up to $25 million, subject to the terms and conditions set forth in the JPM Credit Agreement. As of December 31, 2009, aggregate borrowings under this facility totaled $62.0 million, comprised of $42.0 million in revolving loans and $20.0 million in term loan facility borrowings. As of December 31, 2009, revolving loan borrowings available to the Company were equal to $38.0 million.
The JPM Credit Agreement is guaranteed by the Company and its subsidiaries and is secured by the assets of the Company and its subsidiaries. The maturity date of the JPM Credit Agreement is January 2, 2013. Interest accrues on amounts outstanding under the loan facility, at the Company’s option of either (1) LIBOR plus a margin ranging between 1.25% and 2.00% based upon the Company’s consolidated leverage ratio, as defined, or (2) the higher of the administrative agent’s prime rate or one-half of one percent over the federal funds effective rate plus a margin ranging between 0.25% and 1.00% based on the Company’s consolidated leverage ratio, as defined. The leverage ratio covenant limits the Company’s consolidated indebtedness to a multiple of three times its consolidated earnings before interest, taxes, depreciation and amortization (“EBITDA”) as determined on a pro forma basis over the prior four quarters. The fixed charge coverage ratio requires the Company to maintain the ratio of its consolidated EBITDA as determined on a pro forma basis less capital expenses to its fixed charges (which includes regularly scheduled principal payments, consolidated interest expense, taxes paid or payable in accordance with GAAP, and restricted payments) to at least 1.2 to 1 for periods ending in 2008, 1.3 to 1 for periods ending in 2009, and 1.35 to 1 thereafter. The JPM Credit Agreement contains certain customary representations and warranties from the Company. In addition, the JPM Credit Agreement contains certain financial and non-financial covenants, with which the Company was in compliance as of December 31, 2009. Further explanation of this agreement is presented in Note 7 to the consolidated financial statements.
The Company’s working capital decreased by approximately $12.8 million, or 31%, to $28.8 million at December 31, 2009 as compared to $41.6 million at December 31, 2008. This decrease was primarily attributable to the fact that approximately $30.0 million of working capital was utilized to reduce the outstanding balance on the Company’s revolving loan facility (which is included in long-term debt) during 2009. The Company has historically funded its business through cash generated by operations.
Cash provided by operating activities for 2009 was approximately $43.4 million. Cash from operations in 2009 was mainly generated through income from operations, adjusted to exclude the effect of non-cash charges including depreciation, amortization, impairment of goodwill, stock-based compensation and other income and charges. Changes in assets and liabilities increased operating cash flows during 2009, principally due to (i) our continued focus on collections which resulted in a reduction in accounts receivable, (ii) a focus on inventory management, which resulted in a decrease in inventories, and (iii) an increase in accounts payable, bonus accruals and accrued expenses (which have a positive impact on cash flow) that was due to normal year over year fluctuations and the timing of payments completed during the fourth quarter. If near-term demand for the Company’s products weakens or if significant anticipated sales in any quarter do not close when expected, the availability of funds from operations may be adversely affected.
Cash provided by operating activities for 2008 was approximately $17.2 million. Cash from operations in 2008 was mainly generated through income from operations, adjusted to exclude the effect of non-cash charges including depreciation, amortization, stock-based compensation and other income and charges. In addition, the Company received significant amounts of cash for calendar year support and maintenance, which has been deferred. The cash received from support and maintenance was offset by the fact that the Company did not purchase the related receivables of Quest in conjunction with the acquisition completed during the first quarter of 2008 (see Note 5 to the consolidated financial statements). The increase in accounts receivables and inventory balances of approximately $2.3 million during 2008 was due to normal year over year fluctuations and the growth of the business, both organic and acquisition related, as reflected in the year over year revenue increase. The decrease in accounts payable and accrued expenses was due to normal year over year fluctuations and the timing of payments completed during the fourth quarter to reduce various payables and accruals.
Cash provided by operating activities for 2007 was approximately $25.2 million. Cash from operations in 2007 was mainly generated through income from operations, adjusted to exclude the effect of non-cash charges including depreciation, amortization and stock-based compensation. These increases in cash were offset by an increase in accounts receivable and inventory balances. The increase in receivables was due to normal year over year fluctuations and the growth of the business, both organic and acquisition-related, as reflected in the year over year revenue increase. The increase in inventory was also due to normal year over year fluctuations and the increase in anticipated hardware shipments in future quarters. There was also an increase in accounts payable and accrued expenses that were a direct result of the increase in inventory and the fact that payments to our vendors that supplied the Company with inventory were not due at year end.
29
Table of Contents
Cash used in investing activities during 2009 was approximately $12.2 million. Approximately $6.3 million was used to invest in property and equipment and $2.0 million related to the completion of the purchase of a customer list related to our RPS business. The Company continued to increase its investment in future products by investing $4.0 million in internally developed capitalizable software during 2009. Lastly, the Company recognized cash proceeds of $0.2 million from the sale of a building located in Australia.
Cash used in investing activities during 2008 was approximately $108.9 million. Approximately $97.3 million was used in the acquisitions of Orderman, Quest, Hospitality EPoS and Jadeon, net of cash acquired (see Note 5 to the consolidated financial statements). In addition, the Company recognized cash proceeds during 2008 of approximately $5.5 million from the sale of an undeveloped parcel of land and the execution of forward exchange contracts in conjunction with the Orderman and Quest acquisitions. Approximately $11.0 million was used to invest in property and equipment, including $7.8 million was utilized to improve our infrastructure through the implementation of an upgraded ERP system that was placed in service in the first quarter of 2010. Lastly, the Company increased its investment in future products by investing $4.0 million in internally developed capitalizable software during 2008.
Cash used in investing activities during 2007 was approximately $6.8 million. Approximately $2.6 million of cash was invested in property and equipment, and $1.5 million was spent on the purchase of a license to use patented technology. In addition, the Company continued to increase its investment in future products by investing $2.7 million in internally developed capitalizable software.
Cash used in financing activities during 2009 was approximately $34.3 million as compared to cash provided by financing activities of $78.2 million in 2008. Financing activities included scheduled payments under the JPM Credit Agreement and payments against the revolving loan facility and research and development notes, scheduled payments against the Company’s capital lease obligations and the impact of tax benefits related to stock-based compensation expense. In addition, the Company received cash proceeds from a research and development note, the exercise of stock options by employees and the purchase of shares issued under the Employee Stock Purchase Plan.
Cash provided by financing activities during 2008 was $78.2 million. Financing activities during 2008 included cash received from borrowings under the JPM Credit Agreement equal to $116.2 million, net of financing costs. These borrowings were used to fund the acquisitions of Orderman, Quest, Hospitality EPoS and Jadeon (see Note 5 to the consolidated financial statements), complete scheduled term loan payments under the JPM Credit Agreement of $4.0 million, reduce the outstanding credit revolver balance under the JPM Credit Agreement by $14.9 million, repay the outstanding balance of the term loan under the WFF Credit Agreement equal to $18.2 million, and to pay various fees associated with the termination of the WFF Credit Agreement of $0.3 million. In addition, the Company received cash proceeds from employees for the exercise of stock options of $1.7 million, made scheduled payments under the promissory notes related to the MenuLink acquisition equal to $1.3 million, and repaid the entire balance of the promissory note with the previous shareholders of Aloha Technologies, Inc. equal to $1.0 million.
Cash used in financing activities during 2007 was approximately $4.2 million. In 2007, financing activities mainly consisted of $6.5 million in repayments under borrowings from the WFF Credit Agreement, repayment of $1.3 million of promissory notes related to the MenuLink acquisition, scheduled payments under the WFF Credit Agreement of $5.9 million, and $9.8 million related to cash proceeds and the related tax benefit received from employees for the exercise of stock options.
The Company believes that its cash and cash equivalents, funds generated from operations and borrowing capacity, will provide adequate liquidity to meet its normal operating requirements, as well as to fund the above obligations for at least the next twelve months.
The Company believes there are opportunities to grow its business through the acquisition of complementary and synergistic companies, products and technologies. We look for acquisitions that can be readily integrated and accretive to earnings, although we may pursue smaller non-accretive acquisitions that will shorten our time to market with new technologies. The Company expects the general size of cash acquisitions it would currently consider would be in the $5 million to $50 million range. Any material acquisition could result in a decrease in the Company’s working capital depending on the amount, timing and nature of the consideration to be paid. In addition, any material acquisitions of complementary or synergistic companies, products or technologies could require that we obtain additional debt or equity financing. There can be no assurance that such additional financing will be available to us or that, if available, such financing will be obtained on favorable terms and would not result in additional dilution to our stockholders.
30
Table of Contents
Contractual Obligations
The Company leases office space, equipment and certain vehicles under non-cancelable operating lease agreements expiring on various dates through 2017. Additionally, the Company leases computer equipment under various capital lease agreements which expire on various dates through June 2013. Contractual obligations as of December 31, 2009 are as follows (in thousands):
| Payments Due by Period | |||||||||||||||
| Total | Less than 1 Year |
1 - 3 Years |
3 - 5 Years |
More than 5 Years | |||||||||||
| Capital leases |
$ | 1,536 | $ | 925 | $ | 595 | $ | 16 | $ | — | |||||
| Operating leases (1) |
24,778 | 5,561 | 9,354 | 5,138 | 4,725 | ||||||||||
| Other obligations: |
|||||||||||||||
| Revolving credit facility (JPM Credit Agreement) |
42,000 | — | — | 42,000 | — | ||||||||||
| Term loan facility (JPM Credit Agreement) |
20,000 | 6,000 | 12,000 | 2,000 | — | ||||||||||
| Austrian research & development loan |
626 | — | — | 626 | — | ||||||||||
| Estimated interest payments on credit facility and term notes (2) |
6,422 | 2,421 | 3,992 | 9 | — | ||||||||||
| Purchase commitments (3) |
10,768 | 10,453 | 315 | — | — | ||||||||||
| Total contractual obligations |
$ | 106,130 | $ | 25,360 | $ | 26,256 | $ | 49,789 | $ | 4,725 | |||||
| (1) | This schedule includes the future minimum lease payments related to facilities that are being subleased. The total minimum rentals to be received in the future under subleases as of December 31, 2009 are approximately $1.9 million in less than one year, $3.0 million in one to three years, and $0.1 million in three to five years. |
| (2) | For purposes of this disclosure, we used the interest rates in effect as of December 31, 2009 to estimate future interest expense. See Note 7 to the consolidated financial statements for further discussion of our debt components and their interest rate terms. |
| (3) | The Company has entered into certain noncancelable purchase orders for manufacturing supplies to be used in its normal operations. The related supplies are to be delivered at various dates through September 2010. Further explanation of these commitments is presented in Note 11 to the consolidated financial statements. |
At December 31, 2009, the Company had a $2.8 million reserve for unrecognized tax benefits which is not reflected in the table above. Substantially all of this tax reserve is classified in other long-term liabilities and deferred income taxes on the accompanying consolidated balance sheet.
31
Table of Contents
Critical Accounting Policies and Procedures
General
The Company’s discussion and analysis of its financial condition and results of operations are based upon its consolidated financial statements, which have been prepared in accordance with accounting principles generally accepted in the United States. The preparation of these financial statements requires the Company’s management to make estimates and judgments that affect the reported amounts of assets, liabilities, revenues and expenses, and related disclosure of contingent assets and liabilities. On an ongoing basis, the Company evaluates its estimates, including those related to customer programs and incentives, product returns, bad debts, inventories, intangible assets, income taxes, and commitments and contingencies. The Company bases its estimates on historical experience and on various other assumptions that are believed to be reasonable under the circumstances, the results of which form the basis for making judgments about the carrying values of assets and liabilities that are not readily apparent from other sources. Actual results may differ from these estimates under different assumptions or conditions.
Management believes the following critical accounting policies affect its more significant judgments and estimates used in the preparation of our consolidated financial statements.
Revenue Recognition
The Company’s revenue is generated primarily through software and system sales, support and maintenance, and other services. The Company recognizes revenue using the guidance from FASB ASC Subtopic, Software – Revenue Recognition, (“ASC 985-605”), FASB ASC Subtopic 605-35, Revenue Recognition – Construction-Type and Production-Type Contracts, (“ASC 605-35”), and FASB ASC Subtopic 605-10, Revenue Recognition – Overall, (“ASC 605-10”). Under these guidelines, the Company recognizes revenue when the following criteria are met: (1) persuasive evidence of an agreement exists; (2) delivery of the product has occurred; (3) the fee is fixed or determinable; (4) collectibility is reasonably assured; and (5) remaining obligations under the agreement are insignificant. Under multiple element arrangements, where each element is separately stated, sold and priced, the Company recognizes revenues for the various elements based on vendor-specific objective evidence (“VSOE”) of fair value. The Company’s VSOE of fair value is determined based on the price charged when the same element is sold separately. If evidence of fair value does not exist for all elements in a multiple element arrangement, the Company recognizes revenue using the residual method. Under the residual method, a delivered element without VSOE of fair value is recognized as revenue if all undelivered elements have VSOE of fair value. Sales tax collected is recorded net, and is not recognized as revenue and is included in accrued expenses on the accompanying consolidated balance sheets. Revenue from the Company’s customers is generally attributable to individual countries based on the location of the related point of shipment.
The Company sells its products, which include both software licenses and hardware, to both resellers and directly to end-users. Revenue from software licenses and system sales is generally recognized as products are shipped, provided that no significant vendor obligations remain and that collection of the related receivable is probable. For those agreements that provide for significant services or custom development that are essential to the software’s functionality, the software license and contracted services are recognized under the percentage of completion method as prescribed by the provisions of ASC 605-35. Contracts accounted for on a percentage of completion basis under the provisions of ASC 605-35 are not considered complete until acceptance, as determined by the customer agreement, has been obtained. The Company offers its customers post-contract support in the form of maintenance, telephone support and unspecified software enhancements. Revenue from support and maintenance is recognized ratably over the term of the agreement. The Company also offers its customers a subscription based software model for use of its software, maintenance, telephone support and hosting services on a monthly basis. Revenue from subscription pricing is recognized ratably over the contract period.
The Company’s professional services revenue consists of fees generated from consulting, custom software development, installation and training. Revenue related to professional services performed by the Company is generally recognized on a time and materials basis as the services are performed. Under contracts where revenue is recognized using the percentage of completion method under the provisions of ASC 605-35, the Company measures its progress-to-completion by using input measures, primarily labor hours. The Company continually updates and revises estimates of its input measures. If those estimates indicate a loss will be incurred, the entire loss is recognized in that period. In addition, the Company offers its customers subscription pricing and hosting services for some of its products. Under these subscription based contracts, revenue is recognized ratably over the contract period commencing generally when the product has been installed.
Allowance for Doubtful Accounts
The Company maintains allowances for doubtful accounts for estimated losses resulting from the inability of customers to make required payments. Estimates are developed by using standard quantitative measures based on historical losses, adjusting for current economic conditions and, in some cases, evaluating specific customer accounts for risk of loss. The establishment of reserves requires the use of judgment and assumptions regarding the potential for losses on receivable balances. Though the Company considers these allowances adequate and proper, if the financial condition of its customers were to deteriorate, resulting in an impairment of their ability to make payments, additional allowances may be required.
32
Table of Contents
Stock-based Compensation Expense
On January 1, 2006, the Company implemented the provisions of FASB ASC Topic 718, Compensation—Stock Compensation (“ASC 718”), using the modified prospective transition method. ASC 718 requires companies to recognize the cost for employee services received in exchange for awards of equity instruments based upon the grant-date fair value of those awards. Using the modified prospective transition method of adopting ASC 718, the Company began recognizing compensation expense for equity-based awards granted after January 1, 2006, based on the grant date fair value estimated in accordance with the provisions of ASC 718, plus unvested awards granted prior to January 1, 2006, based on the grant date fair value estimated in accordance with the original provisions of ASC 718. Under this method of implementation, no restatement of prior periods has been made.
At December 31, 2009, the Company had approximately 1.4 million unvested options outstanding with a weighted-average grant-date fair value per share of $3.67. The unvested options and restricted stock awards have a total unrecognized compensation expense of approximately $4.0 million, net of estimated forfeitures, which will be recognized over the weighted average period of 0.9 years.
For the years ended December 31, 2009, 2008 and 2007, the Company recognized stock compensation expense of approximately $4.5 million, $4.6 million and $3.8 million, respectively. Prior to the adoption of ASC 718, the Company applied the intrinsic value method set forth in Accounting Principles Board Opinion No. 25, Accounting for Stock Issued to Employees, to calculate the compensation expense for stock-based awards. Historically, the Company’s general policy was to set the exercise price for its stock options equal to the market value on the grant date. As a result, the options had no intrinsic value on their grant dates, and the Company did not record any compensation expense unless the terms of the options were subsequently modified.
The Company uses the Black-Scholes-Merton model to estimate the fair value of options granted. The Black-Scholes-Merton model requires estimates of the expected term of the option, as well as future volatility and the risk-free interest rate.
For options issued during the year ended December 31, 2009, the Company estimated the weighted average grant-date fair value per share to be $1.80. The key assumptions used to calculate these values are provided below:
| Year ended December 31, 2009 |
|||
| Expected volatility |
69-70 | % | |
| Expected life (in years) |
3-4 | ||
| Expected dividend yield |
0.00 | % | |
| Risk-free interest rate |
1.6 - 2.2 | % |
The assumptions made represent management’s best estimate, but they are highly subjective and inherently uncertain. If management had made different assumptions, the calculation of the options’ fair value and the resulting stock-based compensation expense could differ, perhaps materially, from the amounts recognized in the Company’s financial statements.
In addition to the assumptions used to calculate the fair value of the Company’s stock options, the Company is required to estimate the expected forfeiture rate of all share-based awards and only recognize expense for those awards the Company expects to vest. The stock-based compensation expense recognized in the Company’s consolidated statement of operations for the years ended December 31, 2009, 2008 and 2007 has been reduced for estimated forfeitures. If management were to change the estimate of forfeiture rates, the amount of stock-based compensation expense could differ, perhaps materially, from the amount recognized in the Company’s financial statements.
Inventories
Inventories are stated at the lower of cost or market value. Cost is principally determined by the first-in, first-out method. The Company records adjustments to the value of inventory based upon its forecasted plans to sell its inventories. The physical condition (e.g., age and quality) of the inventories is also considered in establishing its valuation. These adjustments are estimates, which could vary significantly, either favorably or unfavorably, from actual requirements if future economic conditions, customer inventory levels or competitive conditions differ from expectations.
Capitalized Software Development Costs
In accordance with FASB ASC Subtopic 985-20, Software—Costs of Software to Be Sold, Leased, or Marketed, (“ASC 985-20”), the Company’s policy on capitalized software costs determines the timing of recognition of certain development costs. In addition, this policy determines whether the cost is classified as development expense or cost of license fees. Capitalization of such costs begins when a detail program has been produced as evidenced by the completion of design, planning, coding and testing, such that the product meets its design specifications and has thereby established technological feasibility. Capitalization of such costs ends when the resulting product is available for general release to the public. Amortization of capitalized software development costs is recorded on a straight-line basis over the estimated economic life of the software, which the Company has determined is not more than five years. Management is required to use its judgment in determining whether development costs meet the criteria for immediate expense or capitalization. Additionally, management is required to use its judgment in the valuation of the unamortized capitalized software costs in determining whether the recorded value is recoverable based on future product sales.
Long-Lived Assets
The Company evaluates the recoverability of long-lived assets and finite-lived identifiable intangibles not held for sale whenever events or changes in circumstances indicate that an asset’s carrying amount may not be recoverable. Such circumstances could include, but are not limited to (1) a significant decrease in the market value of an asset, (2) a significant adverse change in the extent or manner in which an asset is used or in its physical condition, or (3) an accumulation of costs significantly in excess of the amount originally expected for the acquisition or construction of an asset. The Company measures the carrying amount of the asset against the estimated undiscounted future cash flows associated with it. Should the sum of the expected future net cash flows be less than the carrying value of the asset being evaluated, an impairment loss would be recognized. The impairment loss would be calculated as the amount by which the carrying value of the asset exceeds the fair value of the asset. The fair value is measured based on quoted market prices, if available. If quoted market prices are not available, the estimate of fair value is based on various valuation techniques, including the discounted value of estimated future cash flows.
33
Table of Contents
Goodwill and Intangible Assets
The Company has significant intangible assets related to goodwill and other acquired intangibles. In assessing the recoverability of goodwill and other intangible assets, the Company must make assumptions regarding the estimated future cash flows and other factors to determine the fair value of these assets. If these estimates or their related assumptions change in the future, the Company may be required to record impairment charges against these assets in the reporting period in which the impairment is determined. For goodwill, the impairment evaluation includes a comparison of the carrying value of each reporting unit which houses goodwill to that reporting unit’s fair value. The fair values of the reporting units are based upon the net present value of future cash flows, including a terminal value calculation. The assumptions used to derive these values are based on risk-adjusted growth rates and discount factors accommodating conservative viewpoints that consider the full range of variability contemplated in the current economic situation. The Company also assesses market-based multiples of other market-participant companies to determine whether the Company’s fair value assumptions appropriately align with market-participant valuation multiples. If the fair value of any reporting unit is less than its carrying value, further analysis would be required to determine the amount of the impairment.
For intangible assets, this evaluation includes an analysis of estimated future undiscounted net cash flows expected to be generated by the assets over their estimated useful lives. If the estimated future undiscounted net cash flows are insufficient to recover the carrying value of the assets over their estimated useful lives, the Company will record an impairment charge in the amount by which the carrying value of the assets exceeds their fair value. If the Company determines that there is an impairment of intangible assets or goodwill, the Company may be required to record an impairment charge in the reporting period in which the impairment is determined, which could have a negative impact on earnings.
Income Taxes
The Company has significant amounts of deferred tax assets that are reviewed for recoverability and valued accordingly. These assets are evaluated by using estimates of future taxable income, the timing of reversals of temporary taxable differences and the impact of tax planning strategies. Valuation allowances related to net deferred tax assets could be impacted by changes to tax codes, changes in statutory tax rates and the Company’s future taxable income levels.
The Company follows the guidance issued by the FASB related to accounting for uncertainty in income taxes. This guidance, included in FASB ASC Topic 740, Income Taxes (“ASC 740”), addresses how tax benefits claimed or expected to be claimed on a tax return should be recorded in the financial statements. Under ASC 740, the Company must recognize the tax benefit from an uncertain tax position only if it is more likely than not that the tax position will be sustained on examination by the taxing authorities, based on the technical merits of the position. The tax benefits recognized in the financial statements from such a position are measured based on the largest benefit that has a greater than fifty percent likelihood of being realized upon ultimate resolution.
Accounting Pronouncements
Recently Issued Standards
In October 2009, the FASB issued Accounting Standards Update (“ASU”) No. 2009-14 (“ASU 2009-14”), Software (Topic 985): Certain Revenue Arrangements That Include Software Elements – a consensus of the FASB Emerging Issues Task Force. This ASU establishes that tangible products that contain software that works together with the nonsoftware components of the tangible product to deliver the tangible product’s essential functionality are no longer within the scope of software revenue guidance. These items should be accounted for under other appropriate revenue recognition guidance. We are required to adopt this ASU prospectively for new or materially modified agreements as of January 1, 2011 and concurrently with ASU 2009-13 which is described below. Full retrospective application is optional and early adoption is permitted at the beginning of a fiscal year. We are currently evaluating the impact of this ASU on our financial statements.
In October 2009, the FASB issued Accounting Standards Update No. 2009-13, (“ASU 2009-13”), Revenue Recognition (Topic 605): Multiple-Deliverable Revenue Arrangements – a consensus of the FASB Emerging Issues Task Force. This ASU amends the criteria for separating consideration in multiple-deliverable arrangements, which will, as a result, separate multiple-deliverable arrangements more often than under existing U.S. GAAP. Additionally, this ASU establishes a selling price hierarchy for determining the selling price of a deliverable. The ASU also eliminates the residual method of revenue allocation and requires that arrangement consideration be allocated at the inception of the arrangement to all deliverables using the relative selling price method. This guidance requires that management determine its best estimate of selling price in a manner consistent with that used to determine the price to sell the deliverable on a stand alone basis. This ASU significantly expands the disclosures required for multiple-deliverable revenue arrangements with the objective of disclosing judgments related to these arrangements and the effect that the use of the relative selling-price method and changes in those judgments have on the timing and amount of revenue recognition. We are required to adopt this ASU prospectively for new or materially modified agreements as of January 1, 2011 and concurrently with ASU 2009-14, which is described above. Full retrospective application is optional and early adoption is permitted at the beginning of a fiscal year. We are currently evaluating the impact of this ASU on our financial statements.
Recently Adopted Standards
In August 2009, the FASB issued Accounting Standards Update No. 2009-05 (“ASU 2009-05”), Fair Value Measurements and Disclosures (Topic 820): Measuring Liabilities at Fair Value. This ASU establishes that in circumstances in which a quoted market price in an active market for an identical liability is not available, an entity is required to measure fair value using the quoted price of an identical liability when traded as an asset or quoted prices for similar liabilities or similar liabilities when traded as assets, or another valuation technique consistent with the principles of Topic 820. We adopted the provisions of ASU 2009-05 as of September 30, 2009, which had no material impact on the Company’s financial position, cash flows or results of operations.
In June 2009, the FASB issued the FASB Accounting Standards Codification TM (“Codification” or “ASC”) which modifies the U.S. GAAP hierarchy by establishing the Codification as the single source of authoritative U.S. GAAP recognized by the FASB applied by nongovernmental entities. SEC rules and interpretive releases are also sources of authoritative U.S. GAAP for SEC registrants. The Codification became effective July 1, 2009. The Codification is not intended to change or alter existing U.S. GAAP and accordingly, it did not impact the Company’s financial position, cash flows or results of operations. However, historical U.S. GAAP references in this annual report and in our quarterly report for the period ending September 30, 2009 have been adjusted, and references in future filings will be adjusted to reflect authoritative guidance in the Codification.
34
Table of Contents
In September 2006, the FASB issued guidance included in ASC Topic 820, Fair Value Measurements and Disclosures (“ASC 820”), and in February 2008, the FASB amended this guidance. ASC 820 defines fair value, establishes a framework for measuring fair value and expands disclosure of fair value measurements. ASC 820 is applicable to other ASC topics that require or permit fair value measurements, except those relating to lease accounting, and accordingly does not require any new fair value measurements. The provisions of ASC 820 are effective for financial assets and liabilities in fiscal years beginning after November 15, 2007, and for non-financial assets and liabilities in fiscal years beginning after November 15, 2008, except for items that are recognized or disclosed at fair value in the financial statements on a recurring basis. Our adoption of the provisions of ASC 820 on January 1, 2008, with respect to financial assets and liabilities measured at fair value, has had no material impact on our fair value measurements or our financial statements. In October 2008, the FASB issued additional guidance included in ASC 820 that clarifies the application of fair value measurements in a market that is not active. These provisions of ASC 820 became effective immediately upon issuance, and their adoption did not have any effect on our financial statements. We determine the fair value of our long-lived assets, in accordance with ASC 820, when testing for impairment. ASC 820 was effective for fair value assessments as of January 1, 2009. In April 2009, the FASB issued further guidance included in ASC 820 that provides for estimating fair value when the volume and level of activity for the asset or liability have significantly decreased. These provisions also include guidance on identifying circumstances that indicate a transaction is not orderly. This additional guidance is effective for interim and annual reporting periods ending after June 15, 2009, and is applied prospectively. The Company concluded that the adoption of these provisions of ASC 820 as of April 1, 2009 had no impact on its financial position, cash flows or results of operations.
In November 2008, the Emerging Issues Task Force reached consensus on guidance about accounting for defensive intangible assets that is included in ASC Topic 350, Intangibles-Goodwill and Other (“ASC 350”). A defensive intangible asset is an acquired intangible asset where the acquirer has no intention of using, or intends to discontinue use of, the intangible asset, but holds it to prevent competitors from obtaining any benefit from it. The acquired defensive asset will be treated as a separate unit of accounting and the useful life assigned will be based on the period during which the asset would diminish in value. This guidance is effective for financial statements issued for fiscal years beginning after December 15, 2008, and may impact any intangible assets we acquire in future transactions.
In June 2008, the FASB issued guidance related to the computation of earnings per share amounts that is included in ASC Topic 260, Earnings Per Share (“ASC 260”). ASC 260 stipulates that unvested share-based payment awards that contain nonforfeitable rights to dividends or dividend equivalents (whether paid or unpaid) are participating securities and shall be included in the computation of earnings per share pursuant to the two class method. This guidance is effective for fiscal years beginning after December 31, 2008. The Company concluded that the adoption of these provisions ASC 260 did not have a material impact on its reported basic and diluted earnings per share amounts.
In April 2008, the FASB issued guidance related to determining the useful life of intangible assets that is included in ASC Topic 350, Intangibles-Goodwill and Other (“ASC 350”). This guidance amends the factors that should be considered in developing renewal or extension assumptions used to determine the useful life of a recognized intangible asset. More specifically, this guidance removes the requirement to consider whether an intangible asset can be renewed without substantial cost or material modifications to the existing terms and conditions and instead, requires an entity to consider its own historical experience in renewing similar arrangements. These provisions also require expanded disclosure related to the determination of intangible asset useful lives. These provisions are effective for financial statements issued for fiscal years beginning after December 15, 2008, and may impact any intangible assets we acquire in future transactions.
In March 2008, the FASB issued guidance included in ASC Topic 815, Derivatives and Hedging (“ASC 815”). This guidance requires qualitative disclosures about objectives and strategies for using derivatives, quantitative disclosures about fair value amounts and gains and losses on derivative instruments, and disclosures about credit risk-related contingent features in derivative agreements. These provisions are effective for fiscal years beginning after November 15, 2008. As of December 31, 2009, we have not entered into any derivative transactions.
In December 2007, the FASB issued guidance included in ASC Topic 810, Consolidation (“ASC 810”). This guidance requires (1) non-controlling (minority) interests be reported as a component of stockholders’ equity, (2) net income attributable to the parent and to the non-controlling interest be separately identified in the consolidated statement of operations, (3) changes in a parent’s ownership interest while the parent retains its controlling interest be accounted for as equity transactions, (4) any retained non-controlling equity investment upon the deconsolidation of a subsidiary be initially measured at fair value, and (5) sufficient disclosures be provided that clearly identify and distinguish between the interests of the parent and the interests of the non-controlling owners. These provisions of ASC 810 are effective for financial statements issued for fiscal years beginning after December 15, 2008, and interim periods within those fiscal years. The adoption of these provisions did not have any impact on the Company’s financial position, cash flows or results of operations as we have no minority interests.
In December 2007, the FASB issued guidance included in ASC Topic 805, Business Combinations (“ASC 805”). This guidance significantly changes the accounting for business combinations. ASC 805 requires an acquiring entity to recognize all assets acquired and liabilities assumed in a transaction at the acquisition-date fair value, with limited exceptions. This guidance changes the accounting treatment for certain specific acquisition-related items including: (1) expensing acquisition-related costs as incurred; (2) valuing non-controlling interests at fair value at the acquisition date of a controlling interest; and (3) expensing restructuring costs associated with an acquired business. The guidance also enumerated a substantial number of new disclosure requirements. These provisions of ASC 805 are to be applied prospectively to business combinations for which the acquisition date is on or after January 1, 2009. These provisions will have an impact on our accounting for any future business combinations.
In February 2007, the FASB issued guidance included in ASC Topic 825, Financial Instruments (“ASC 825”). This guidance permits entities to choose to measure many financial instruments and certain other items at fair value that are not currently required to be measured at fair value, and establishes presentation and disclosure requirements designed to facilitate comparisons between entities that choose different measurement attributes for similar types of assets and liabilities. These provisions of ASC 825 are effective for financial statements issued for fiscal years beginning after November 15, 2007. We adopted these provisions of ASC 825 on January 1, 2008.
Off-Balance Sheet Arrangements
The Company does not have any material off-balance sheet arrangements (as defined in the applicable regulations) that have or are reasonably likely to have a current or future effect on the Company’s financial condition, changes in financial condition, revenues or expenses, results of operations, liquidity, capital expenditures or capital resources.
35
Table of Contents
| ITEM 7A. | QUANTITATIVE AND QUALITATIVE DISCLOSURES ABOUT MARKET RISK |
Interest Rates
The Company’s financial instruments that are subject to market risks are its cash and cash equivalents and long-term debt. During 2009, the weighted average interest rate on the Company’s long-term debt was approximately 2.98%. A 10% increase in this rate would have increased interest expense by approximately $0.2 million during 2009.
Foreign Exchange
As more fully explained in Note 14 to the consolidated financial statements, the Company’s international revenues were approximately $46.6 million, $42.5 million and $33.5 million for the years ended December 31, 2009, 2008 and 2007, respectively. The Company’s international operations are subject to risks typical of an international business, including, but not limited to: differing economic conditions, changes in political climate, differing tax structures, other regulations and restrictions and foreign exchange rate volatility. Accordingly, the Company’s future results could be materially adversely impacted by changes in these or other factors. See Item 1A—“Risk Factors – Fluctuations in currency exchange rates may adversely impact our cash flows and earnings.”
Forward Exchange Contracts
The Company records derivatives, namely foreign exchange contracts, on the balance sheet at fair value. The gains or losses on foreign currency forward contracts are recorded in the accompanying consolidated statements of operations. The Company does not use derivative financial instruments for speculative or trading purposes, nor does it hold or issue leveraged derivative financial instruments. The Company recognized gains of approximately $0.8 million in each of the years ended December 31, 2008 and 2007 related to forward exchange contracts executed in conjunction with the acquisitions of Quest and Orderman. Further explanation of this is presented in Item 7 – “Management’s Discussion and Analysis of Financial Condition and Results of Operations.”
| ITEM 8. | FINANCIAL STATEMENTS AND SUPPLEMENTARY DATA |
The following consolidated financial statements are filed with this Report:
Report of Independent Registered Public Accounting Firm
Consolidated Balance Sheets at December 31, 2009 and 2008
Consolidated Statements of Operations for the years ended December 31, 2009, 2008 and 2007
Consolidated Statements of Shareholders’ Equity for the years ended December 31, 2009, 2008 and 2007
Consolidated Statements of Cash Flows for the years ended December 31, 2009, 2008 and 2007
Notes to Consolidated Financial Statements
36
Table of Contents
REPORT OF INDEPENDENT REGISTERED PUBLIC ACCOUNTING FIRM
To the Board of Directors and Shareholders of
Radiant Systems, Inc.
Alpharetta, Georgia
We have audited the accompanying consolidated balance sheets of Radiant Systems, Inc. and subsidiaries (the “Company”) as of December 31, 2009 and 2008, and the related consolidated statements of operations, shareholders’ equity, and cash flows for each of the three years in the period ended December 31, 2009. Our audits also included the financial statement schedule listed in the Index at Item 15. These financial statements and financial statement schedule are the responsibility of the Company’s management. Our responsibility is to express an opinion on the financial statements and financial statement schedule based on our audits.
We conducted our audits in accordance with the standards of the Public Company Accounting Oversight Board (United States). Those standards require that we plan and perform the audit to obtain reasonable assurance about whether the financial statements are free of material misstatement. An audit includes examining, on a test basis, evidence supporting the amounts and disclosures in the financial statements. An audit also includes assessing the accounting principles used and significant estimates made by management, as well as evaluating the overall financial statement presentation. We believe that our audits provide a reasonable basis for our opinion.
In our opinion, such consolidated financial statements present fairly, in all material respects, the financial position of Radiant Systems, Inc. and subsidiaries at December 31, 2009 and 2008, and the results of their operations and their cash flows for each of the three years in the period ended December 31, 2009, in conformity with accounting principles generally accepted in the United States of America. Also, in our opinion, such financial statement schedule, when considered in relation to the basic consolidated financial statements taken as a whole, presents fairly, in all material respects, the information set forth therein.
We have also audited, in accordance with the standards of the Public Company Accounting Oversight Board (United States), the Company’s internal control over financial reporting as of December 31, 2009, based on the criteria established in Internal Control—Integrated Framework issued by the Committee of Sponsoring Organizations of the Treadway Commission and our report dated March 11, 2010 expressed an unqualified opinion on the Company’s internal control over financial reporting.
| /s/ DELOITTE & TOUCHE LLP |
| Atlanta, Georgia |
| March 11, 2010 |
37
Table of Contents
RADIANT SYSTEMS, INC. AND SUBSIDIARIES
CONSOLIDATED BALANCE SHEETS
DECEMBER 31, 2009 AND 2008
(In thousands, except share data)
| December 31, 2009 |
December 31, 2008 |
|||||||
| ASSETS |
||||||||
| Current assets |
||||||||
| Cash and cash equivalents |
$ | 15,521 | $ | 16,450 | ||||
| Accounts receivable, net |
42,515 | 44,024 | ||||||
| Inventories |
29,662 | 31,838 | ||||||
| Deferred tax assets |
5,690 | 7,982 | ||||||
| Other current assets |
4,587 | 2,628 | ||||||
| Total current assets |
97,975 | 102,922 | ||||||
| Property and equipment, net |
24,923 | 23,031 | ||||||
| Software development costs, net |
11,810 | 9,278 | ||||||
| Deferred tax assets, non-current |
1,323 | — | ||||||
| Goodwill |
107,819 | 115,229 | ||||||
| Intangible assets, net |
42,428 | 51,628 | ||||||
| Other long-term assets |
2,319 | 1,454 | ||||||
| Total assets |
$ | 288,597 | $ | 303,542 | ||||
| LIABILITIES AND SHAREHOLDERS’ EQUITY |
||||||||
| Current liabilities |
||||||||
| Current portion of long-term debt |
6,000 | 6,081 | ||||||
| Accounts payable |
17,724 | 17,521 | ||||||
| Accrued liabilities |
23,462 | 17,203 | ||||||
| Customer deposits and unearned revenues |
21,157 | 19,714 | ||||||
| Current portion of capital lease payments |
842 | 825 | ||||||
| Total current liabilities |
69,185 | 61,344 | ||||||
| Capital lease payments, net of current portion |
576 | 1,287 | ||||||
| Long-term debt, net of current portion |
56,626 | 92,385 | ||||||
| Deferred tax liabilities, non-current |
4,265 | 3,066 | ||||||
| Other long-term liabilities |
4,602 | 5,129 | ||||||
| Total liabilities |
135,254 | 163,211 | ||||||
| Commitments and contingencies (see Note 11) |
||||||||
| Shareholders’ equity |
||||||||
| Preferred stock, no par value; 5,000,000 shares authorized, no shares issued |
— | — | ||||||
| Common stock, no par value; 100,000,000 shares authorized; 33,239,198 and 32,498,859 shares issued and outstanding at December 31, 2009 and 2008, respectively |
— | — | ||||||
| Additional paid-in capital |
164,769 | 157,930 | ||||||
| (Accumulated deficit) retained earnings |
(9,081 | ) | 317 | |||||
| Accumulated other comprehensive loss |
(2,345 | ) | (17,916 | ) | ||||
| Total shareholders’ equity |
153,343 | 140,331 | ||||||
| Total liabilities and shareholders’ equity |
$ | 288,597 | $ | 303,542 | ||||
The accompanying notes are an integral part of these consolidated financial statements.
38
Table of Contents
RADIANT SYSTEMS, INC. AND SUBSIDIARIES
CONSOLIDATED STATEMENTS OF OPERATIONS
FOR THE YEARS ENDED DECEMBER 31, 2009, 2008 AND 2007
(In thousands, except per share data)
| 2009 | 2008 | 2007 | |||||||||
| Revenues: |
|||||||||||
| Systems |
$ | 120,507 | $ | 155,647 | $ | 144,608 | |||||
| Maintenance, subscription and transaction services |
132,281 | 108,940 | 82,225 | ||||||||
| Professional services |
34,680 | 36,989 | 26,365 | ||||||||
| Total revenues |
287,468 | 301,576 | 253,198 | ||||||||
| Cost of revenues: |
|||||||||||
| Systems |
63,672 | 82,971 | 76,545 | ||||||||
| Maintenance, subscription and transaction services |
65,141 | 62,652 | 44,391 | ||||||||
| Professional services |
23,136 | 26,891 | 20,125 | ||||||||
| Total cost of revenues |
151,949 | 172,514 | 141,061 | ||||||||
| Gross profit |
135,519 | 129,062 | 112,137 | ||||||||
| Operating expenses: |
|||||||||||
| Product development |
22,345 | 24,794 | 23,437 | ||||||||
| Sales and marketing |
42,331 | 36,352 | 28,851 | ||||||||
| Depreciation of fixed assets |
4,789 | 4,664 | 4,147 | ||||||||
| Amortization of intangible assets |
9,265 | 7,902 | 4,301 | ||||||||
| General and administrative |
35,065 | 31,403 | 28,058 | ||||||||
| Impairment of goodwill (Note 6) |
17,008 | — | — | ||||||||
| Other charges and income, net (Note 8) |
5,044 | 1,633 | 67 | ||||||||
| Total operating expenses |
135,847 | 106,748 | 88,861 | ||||||||
| (Loss) income from operations |
(328 | ) | 22,314 | 23,276 | |||||||
| Interest income |
(66 | ) | (33 | ) | — | ||||||
| Interest expense |
2,410 | 4,887 | 2,393 | ||||||||
| Other (income) expense, net |
(94 | ) | 377 | 218 | |||||||
| (Loss) income from operations before income tax provision |
(2,578 | ) | 17,083 | 20,665 | |||||||
| Income tax provision |
6,820 | 6,055 | 8,822 | ||||||||
| Net (loss) income |
$ | (9,398 | ) | $ | 11,028 | $ | 11,843 | ||||
| Net (loss) income per share: |
|||||||||||
| Basic (loss) income per share |
$ | (0.29 | ) | $ | 0.34 | $ | 0.38 | ||||
| Diluted (loss) income per share |
$ | (0.29 | ) | $ | 0.33 | $ | 0.36 | ||||
| Weighted average shares outstanding: |
|||||||||||
| Basic |
32,916 | 32,293 | 31,373 | ||||||||
| Diluted |
32,916 | 33,398 | 33,160 | ||||||||
The accompanying notes are an integral part of these consolidated financial statements.
39
Table of Contents
RADIANT SYSTEMS, INC. AND SUBSIDIARIES
CONSOLIDATED STATEMENTS OF SHAREHOLDERS’ EQUITY
FOR THE YEARS ENDED DECEMBER 31, 2009, 2008 AND 2007
(In thousands)
| Common Stock | Additional Paid-in |
(Accumulated Deficit) Retained |
Accumulated Other Comprehensive Income (Loss) |
Total | |||||||||||||||
| Shares | Amount | Capital | Earnings | ||||||||||||||||
| BALANCE, January 1, 2007 |
30,924 | — | $ | 137,151 | $ | (21,667 | ) | $ | 487 | $ | 115,971 | ||||||||
| Components of comprehensive income: |
|||||||||||||||||||
| Net income |
— | — | — | 11,843 | — | 11,843 | |||||||||||||
| Foreign currency translation adjustment |
— | — | — | — | 1,256 | 1,256 | |||||||||||||
| Total comprehensive income |
— | — | — | 11,843 | 1,256 | 13,099 | |||||||||||||
| Exercise of employee stock options |
1,003 | — | 7,117 | — | — | 7,117 | |||||||||||||
| Stock issued under Employee Stock Purchase Plan |
8 | — | 121 | — | — | 121 | |||||||||||||
| Net tax benefits related to stock-based compensation |
— | — | 2,670 | — | — | 2,670 | |||||||||||||
| Stock-based compensation |
— | — | 3,865 | — | — | 3,865 | |||||||||||||
| Cumulative effect adjustment due to adoption of new income tax standard |
— | — | — | (887 | ) | — | (887 | ) | |||||||||||
| BALANCE, December 31, 2007 |
31,935 | — | $ | 150,924 | $ | (10,711 | ) | $ | 1,743 | $ | 141,956 | ||||||||
| Components of comprehensive income: |
|||||||||||||||||||
| Net income |
— | — | — | 11,028 | — | 11,028 | |||||||||||||
| Foreign currency translation adjustment |
— | — | — | — | (19,659 | ) | (19,659 | ) | |||||||||||
| Total comprehensive income (loss) |
— | — | — | 11,028 | (19,659 | ) | (8,631 | ) | |||||||||||
| Exercise of employee stock options |
232 | — | 1,657 | — | — | 1,657 | |||||||||||||
| Stock issued under Employee Stock Purchase Plan |
28 | — | 171 | — | — | 171 | |||||||||||||
| Net tax benefits related to stock-based compensation |
— | — | 543 | — | — | 543 | |||||||||||||
| Restricted stock awards |
304 | — | 1,042 | 1,042 | |||||||||||||||
| Stock-based compensation |
— | — | 3,593 | — | — | 3,593 | |||||||||||||
| BALANCE, December 31, 2008 |
32,499 | — | $ | 157,930 | $ | 317 | $ | (17,916 | ) | $ | 140,331 | ||||||||
| Components of comprehensive income: |
|||||||||||||||||||
| Net loss |
— | — | — | (9,398 | ) | — | (9,398 | ) | |||||||||||
| Foreign currency translation adjustment |
— | — | — | — | 15,571 | 15,571 | |||||||||||||
| Total comprehensive (loss) income |
— | — | — | (9,398 | ) | 15,571 | 6,173 | ||||||||||||
| Exercise of employee stock options |
267 | — | 1,332 | — | — | 1,332 | |||||||||||||
| Stock issued under Employee Stock Purchase Plan |
31 | — | 229 | — | — | 229 | |||||||||||||
| Net tax benefits related to stock-based compensation |
— | — | 807 | — | — | 807 | |||||||||||||
| Restricted stock awards |
442 | — | 1,660 | — | — | 1,660 | |||||||||||||
| Stock-based compensation |
— | — | 2,811 | — | — | 2,811 | |||||||||||||
| BALANCE, December 31, 2009 |
33,239 | — | $ | 164,769 | $ | (9,081 | ) | $ | (2,345 | ) | $ | 153,343 | |||||||
The accompanying notes are an integral part of these consolidated financial statements.
40
Table of Contents
RADIANT SYSTEMS, INC. AND SUBSIDIARIES
CONSOLIDATED STATEMENTS OF CASH FLOWS
FOR THE YEARS ENDED DECEMBER 31, 2009, 2008 AND 2007
(In thousands)
| 2009 | 2008 | 2007 | ||||||||||
| CASH FLOWS FROM OPERATING ACTIVITIES: |
||||||||||||
| Net (loss) income |
$ | (9,398 | ) | $ | 11,028 | $ | 11,843 | |||||
| Adjustments to reconcile net (loss) income to net cash provided by operating activities: |
||||||||||||
| Depreciation and amortization |
15,996 | 13,813 | 9,202 | |||||||||
| Provision for deferred income taxes |
2,100 | 1,265 | 4,986 | |||||||||
| Impairment of goodwill (see Note 6) |
17,008 | — | — | |||||||||
| Stock-based compensation expense (see Note 3) |
4,465 | 4,643 | 3,795 | |||||||||
| Other charges and income, net (see Note 8) |
3,201 | 1,633 | 67 | |||||||||
| Changes in assets and liabilities, net of the effects of acquisitions: |
||||||||||||
| Accounts receivable |
1,632 | 4,286 | (7,261 | ) | ||||||||
| Inventories |
2,643 | 2,767 | (3,861 | ) | ||||||||
| Other assets |
(2,590 | ) | 4,051 | (3,938 | ) | |||||||
| Accounts payable |
(700 | ) | (10,883 | ) | 5,374 | |||||||
| Accrued liabilities |
8,949 | (11,438 | ) | 575 | ||||||||
| Customer deposits and unearned revenue |
791 | 1,085 | 3,380 | |||||||||
| Other liabilities |
(677 | ) | (5,069 | ) | 1,039 | |||||||
| Net cash provided by operating activities |
43,420 | 17,181 | 25,201 | |||||||||
| CASH FLOWS FROM INVESTING ACTIVITIES: |
||||||||||||
| Purchases of property and equipment |
(6,328 | ) | (10,952 | ) | (2,645 | ) | ||||||
| Capitalized software development costs |
(3,998 | ) | (4,032 | ) | (2,667 | ) | ||||||
| Purchase of customer list |
(2,000 | ) | (2,000 | ) | — | |||||||
| Proceeds from sale of building |
216 | — | — | |||||||||
| Purchase price adjustment for Hospitality EPoS (see Note 5) |
(97 | ) | — | — | ||||||||
| Proceeds from sale of land |
— | 3,931 | — | |||||||||
| Acquisition of Hospitality EPoS, net of cash acquired (see Note 5) |
— | (5,953 | ) | — | ||||||||
| Acquisition of Quest, net of cash acquired (see Note 5) |
— | (52,497 | ) | — | ||||||||
| Acquisition of Jadeon, net of cash acquired (see Note 5) |
— | (6,990 | ) | — | ||||||||
| Acquisition of Orderman, net of cash acquired (see Note 5) |
— | (31,819 | ) | — | ||||||||
| Note receivable |
— | (250 | ) | — | ||||||||
| Execution of forward contract |
— | 1,664 | — | |||||||||
| Purchase of intangible assets |
— | — | (1,500 | ) | ||||||||
| Net cash used in investing activities |
(12,207 | ) | (108,898 | ) | (6,812 | ) | ||||||
| CASH FLOWS FROM FINANCING ACTIVITIES: |
||||||||||||
| Proceeds from exercise of employee stock options |
1,332 | 1,656 | 7,117 | |||||||||
| Proceeds from shares issued under Employee Stock Purchase Plan |
229 | 171 | 122 | |||||||||
| Tax benefits related to stock-based compensation |
809 | 483 | 2,672 | |||||||||
| Principal payments on capital lease obligations |
(848 | ) | (806 | ) | (353 | ) | ||||||
| Principal payments on term loan under the JPM Credit Agreement (see Note 7) |
(6,000 | ) | (4,000 | ) | — | |||||||
| Proceeds from term loan under the JPM Credit Agreement |
— | 30,000 | — | |||||||||
| Proceeds from revolving loan under the JPM Credit Agreement |
23,000 | 122,600 | — | |||||||||
| Repayments of revolving loan under the JPM Credit Agreement |
(53,000 | ) | (50,600 | ) | — | |||||||
| Proceeds from research and development notes payable |
239 | 466 | — | |||||||||
| Repayment of research and development notes payable |
(81 | ) | — | — | ||||||||
| Payment of financing costs related to the JPM Credit Agreement |
— | (664 | ) | — | ||||||||
| Principal payments on notes payable to shareholders |
— | (2,275 | ) | (1,333 | ) | |||||||
| Principal payments on notes payable to a bank |
— | (271 | ) | — | ||||||||
| Principal payments on WFF Credit Agreement (see Note 7) |
— | (18,192 | ) | (5,905 | ) | |||||||
| Payment of fees to terminate WFF Credit Agreement |
— | (341 | ) | — | ||||||||
| Proceeds from short-term debt facility (see Note 7) |
— | — | 9,100 | |||||||||
| Repayments of short-term debt facility |
— | — | (15,589 | ) | ||||||||
| Net cash (used in) provided by financing activities |
(34,320 | ) | 78,227 | (4,169 | ) | |||||||
| Effect of exchange rate changes on cash and cash equivalents |
2,178 | — | — | |||||||||
| (Decrease) increase in cash and cash equivalents |
(929 | ) | (13,490 | ) | 14,220 | |||||||
| Cash and cash equivalents at beginning of year |
16,450 | 29,940 | 15,720 | |||||||||
| Cash and cash equivalents at end of year |
$ | 15,521 | $ | 16,450 | $ | 29,940 | ||||||
The accompanying notes are an integral part of these consolidated financial statements.
41
Table of Contents
RADIANT SYSTEMS, INC. AND SUBSIDIARIES
CONSOLIDATED STATEMENTS OF CASH FLOWS
FOR THE YEARS ENDED DECEMBER 31, 2009, 2008 AND 2007
(In thousands)
| 2009 | 2008 | 2007 | ||||||||
| SUPPLEMENTAL DISCLOSURES OF CASH FLOW INFORMATION: |
||||||||||
| Cash paid for interest |
$ | 2,367 | $ | 5,002 | $ | 2,525 | ||||
| Cash paid for income taxes, net of refunds |
$ | 1,214 | $ | 6,622 | $ | 998 | ||||
| SCHEDULE OF NON-CASH TRANSACTIONS: |
||||||||||
| Assets acquired under capital leases |
$ | 155 | $ | 1,288 | $ | 1,195 | ||||
| Purchases of property and equipment |
$ | 360 | $ | — | $ | — | ||||
| Purchase of customer list, final payment completed in Q1 2009 |
$ | — | $ | 2,000 | $ | — | ||||
| Gain on forward exchange contract |
$ | — | $ | — | $ | 840 | ||||
| Non-cash transactions related to acquisitions (Note 5): |
||||||||||
| Purchase price adjustment related to Hospitality EPoS |
$ | (16 | ) | $ | — | $ | — | |||
| Purchase price adjustment related to Jadeon |
$ | (108 | ) | $ | 860 | $ | — | |||
| Purchase price adjustment related to Orderman |
$ | (191 | ) | $ | — | $ | — | |||
The accompanying notes are an integral part of these consolidated financial statements.
42
Table of Contents
RADIANT SYSTEMS, INC. AND SUBSIDIARIES
NOTES TO CONSOLIDATED FINANCIAL STATEMENTS
THREE YEARS ENDED DECEMBER 31, 2009
1. ORGANIZATION AND BACKGROUND
Headquartered in Alpharetta, Georgia, Radiant Systems, Inc. (the “Company” or “Radiant”) focuses on delivering site systems, including point-of-sale (POS), self-service kiosks, mobile ordering and payment devices, back-office systems, site management technology and business services such as customer loyalty programs, electronic gift card management, comprehensive reporting systems management, electronic payment processing and centralized data management designed specifically for the Company’s two reportable segments: (i) Hospitality and (ii) Retail. For selected financial information about our business segments, see Note 14 to the consolidated financial statements. Radiant’s offerings include hardware and software products, and services including maintenance and support, consulting, custom development, installations and electronic payment processing. Each offering can be purchased independently or as a suite of integrated products to address the customer’s specific business needs. These products and services enable our customers to drive top-line growth and improve bottom-line performance.
2. SUMMARY OF SIGNIFICANT ACCOUNTING POLICIES
Principles of Consolidation
The consolidated financial statements include the accounts of Radiant Systems, Inc. and its wholly owned subsidiaries. All intercompany transactions and balances have been eliminated in consolidation.
Use of Estimates and Assumptions
The preparation of financial statements in conformity with accounting principles generally accepted in the United States of America requires management to make estimates and assumptions that affect the reported amounts of assets, liabilities, revenues and expenses, and disclosure of contingent assets and liabilities. The estimates and assumptions used in the accompanying consolidated financial statements are based upon management’s evaluation of the relevant facts and circumstances as of the date of the financial statements. Actual results could differ from those estimates and assumptions.
Treasury Stock
The Company records treasury stock purchases at cost and allocates this value to additional paid-in capital.
Although the Company’s Board of Directors approved re-commencement of our share repurchase program for the period of November 2007 through November 2009, there were no repurchases of our stock during the years ended December 31, 2009, 2008 or 2007.
Foreign Currency Translation
The financial statements of the Company’s non-U.S. subsidiaries are translated into U.S. dollars for financial reporting purposes in accordance with FASB ASC Subtopic 830-20, Foreign Currency Matters—Foreign Currency Transactions, (“ASC 830-20”). The assets and liabilities of non-U.S. operations whose functional currencies are not in U.S. dollars are translated at the current rates of exchange at month-end, while revenues and expenses are translated at the average exchange rate for the month. The cumulative translation adjustments are reflected in shareholders’ equity.
43
Table of Contents
RADIANT SYSTEMS, INC. AND SUBSIDIARIES
NOTES TO CONSOLIDATED FINANCIAL STATEMENTS—(Continued)
Revenue Recognition
The Company’s revenue is generated primarily through software and system sales, support and maintenance, and other services. The Company recognizes revenue using the guidance from FASB ASC Subtopic, Software – Revenue Recognition, (“ASC 985-605”), FASB ASC Subtopic 605-35, Revenue Recognition – Construction-Type and Production-Type Contracts, (“ASC 605-35”), and FASB ASC Subtopic 605-10, Revenue Recognition – Overall, (“ASC 605-10”). Under these guidelines, the Company recognizes revenue when the following criteria are met: (1) persuasive evidence of an agreement exists; (2) delivery of the product has occurred; (3) the fee is fixed or determinable; (4) collectibility is reasonably assured; and (5) remaining obligations under the agreement are insignificant. Under multiple element arrangements, where each element is separately stated, sold and priced, the Company recognizes revenues for the various elements based on vendor-specific objective evidence (“VSOE”) of fair value. The Company’s VSOE of fair value is determined based on the price charged when the same element is sold separately. If evidence of fair value does not exist for all elements in a multiple element arrangement, the Company recognizes revenue using the residual method. Under the residual method, a delivered element without VSOE of fair value is recognized as revenue if all undelivered elements have VSOE of fair value. Sales tax collected is recorded net, and is not recognized as revenue and is included in accrued expenses on the accompanying consolidated balance sheets. Revenue from the Company’s customers is generally attributable to individual countries based on the location of the related point of shipment.
The Company sells its products, which include both software licenses and hardware, to both resellers and directly to end-users. Revenue from software licenses and system sales is generally recognized as products are shipped, provided that no significant vendor obligations remain and that collection of the related receivable is probable. For those agreements that provide for significant services or custom development that are essential to the software’s functionality, the software license and contracted services are recognized under the percentage of completion method as prescribed by the provisions of ASC 605-35. Contracts accounted for on a percentage of completion basis under the provisions of ASC 605-35 are not considered complete until acceptance, as determined by the customer agreement, has been obtained. The Company offers its customers post-contract support in the form of maintenance, telephone support and unspecified software enhancements. Revenue from support and maintenance is recognized ratably over the term of the agreement. The Company also offers its customers a subscription based software model for use of its software, maintenance, telephone support and hosting services on a monthly basis. Revenue from subscription pricing is recognized ratably over the contract period.
The Company’s professional services revenue consists of fees generated from consulting, custom software development, installation and training. Revenue related to professional services performed by the Company is generally recognized on a time and materials basis as the services are performed. Under contracts where revenue is recognized using the percentage of completion method under the provisions of ASC 605-35, the Company measures its progress-to-completion by using input measures, primarily labor hours. The Company continually updates and revises estimates of its input measures. If those estimates indicate a loss will be incurred, the entire loss is recognized in that period. In addition, the Company offers its customers subscription pricing and hosting services for some of its products. Under these subscription based contracts, revenue is recognized ratably over the contract period commencing generally when the product has been installed.
44
Table of Contents
RADIANT SYSTEMS, INC. AND SUBSIDIARIES
NOTES TO CONSOLIDATED FINANCIAL STATEMENTS—(Continued)
Unearned Revenue
Unearned revenue represents amounts collected prior to complete performance of professional services, customer support services, software enhancements, and significant obligations under license agreements.
Accounts Receivable and Allowance for Doubtful Accounts
A summary of the Company’s accounts receivable as of December 31, 2009 and 2008 is as follows (in thousands):
| 2009 | 2008 | |||||||
| Trade receivables billed |
$ | 43,220 | $ | 47,047 | ||||
| Trade receivables unbilled |
3,127 | 1,347 | ||||||
| 46,347 | 48,394 | |||||||
| Less allowance for doubtful accounts |
(3,832 | ) | (4,370 | ) | ||||
| $ | 42,515 | $ | 44,024 | |||||
The Company maintains allowances for doubtful accounts for estimated losses that may result from the inability of customers to make required payments. Estimates are developed by using standard quantitative measures based on customer payment practices and history, inquiries, credit reports from third parties and other financial information. If the financial condition of the Company’s customers were to deteriorate, resulting in impairment of their ability to make payments, additional allowances may be required. Bad debt expense totaled approximately $0.4 million and $1.6 million for the years ended December 31, 2009 and 2008, respectively. No bad debt expense was incurred during the year ended December 31, 2007.
Inventory
Inventory consists principally of computer hardware and related components, peripherals and software media and are stated at the lower of cost (first-in, first-out method) or market. A summary of the Company’s inventory as of December 31, 2009 and 2008 is as follows (in thousands):
| 2009 | 2008 | |||||
| Raw materials |
$ | 14,451 | $ | 17,454 | ||
| Work in process |
375 | 816 | ||||
| Finished goods |
14,836 | 13,568 | ||||
| $ | 29,662 | $ | 31,838 | |||
45
Table of Contents
RADIANT SYSTEMS, INC. AND SUBSIDIARIES
NOTES TO CONSOLIDATED FINANCIAL STATEMENTS—(Continued)
Property and Equipment
Property and equipment are recorded at cost less accumulated depreciation and amortization. Depreciation of property and equipment is recorded using the straight-line method over estimated useful lives of one to ten years. Leasehold improvements are amortized over the terms of the respective leases or useful lives of the improvements, whichever is shorter. Maintenance and repairs are charged to expense as incurred, and the costs of additions and improvements are capitalized. Any gain or loss from the retirement or sale of an asset is credited or charged to operations.
Property and equipment at December 31, 2009 and 2008 are summarized as follows (in thousands):
| 2009 | 2008 | |||||||
| Computers and equipment |
$ | 23,556 | $ | 20,978 | ||||
| Purchased software |
11,740 | 10,729 | ||||||
| ERP system (1) |
10,723 | 8,052 | ||||||
| Furniture and fixtures |
8,218 | 8,098 | ||||||
| Leasehold improvements |
8,170 | 7,920 | ||||||
| Building |
1,710 | 1,578 | ||||||
| Land |
175 | 235 | ||||||
| 64,292 | 57,590 | |||||||
| Less accumulated depreciation and amortization |
(39,369 | ) | (34,559 | ) | ||||
| $ | 24,923 | $ | 23,031 | |||||
| (1) | The Company implemented a new ERP system during 2008 and 2009. The costs incurred are associated with the related costs to purchase the software as well as various consulting and implementation costs. The Company launched this new system during the first quarter of 2010. |
Depreciation expense for the years ended December 31, 2009, 2008 and 2007 was approximately $5.2 million, $4.9 million and $4.4 million, respectively. Depreciation expense includes amortization of assets under capital leases in the amount of approximately $0.8 million, $0.6 million and $0.4 million for the years ended December 31, 2009, 2008 and 2007, respectively.
Capitalized leased assets are amortized over the shorter of the term of the lease, using the straight-line method, or in accordance with practices established for similar owned assets. Amortization of capitalized leased assets is included with depreciation expense in the accompanying financial statements. Included in property and equipment are the following capitalized leases (in thousands):
| 2009 | 2008 | |||||||
| Computers and equipment |
$ | 3,349 | $ | 3,194 | ||||
| Furniture and fixtures |
1,937 | 1,937 | ||||||
| 5,286 | 5,131 | |||||||
| Less accumulated depreciation and amortization |
(3,835 | ) | (3,015 | ) | ||||
| $ | 1,451 | $ | 2,116 | |||||
46
Table of Contents
RADIANT SYSTEMS, INC. AND SUBSIDIARIES
NOTES TO CONSOLIDATED FINANCIAL STATEMENTS—(Continued)
Goodwill and Intangible Assets
The Company applies the provisions of FASB ASC Topic 350, Intangibles—Goodwill and Other, (“ASC 350”). In accordance with ASC 350, the Company evaluates the carrying value of goodwill as of January 1st of each year and between annual evaluations if events occur or circumstances change that would more likely than not reduce the fair value of the reporting unit below its carrying amount. Such circumstances could include, but are not limited to, (1) a significant adverse change in legal factors or in business climate, (2) unanticipated competition, or (3) an adverse action or assessment by a regulator. When evaluating whether goodwill is impaired, the Company compares the fair value of the reporting unit to which the goodwill is assigned to its carrying amount, including goodwill. The fair values of the reporting units are based upon the net present value of future cash flows, including a terminal value calculation. The assumptions used to derive these values are based on risk-adjusted growth rates and discount factors accommodating conservative viewpoints that consider the full range of variability contemplated in the current economic situation. The Company also assesses market-based multiples of other market-participant companies to determine whether the Company’s fair value assumptions are appropriately aligned with market-participant valuation multiples. If each of the reporting units’ estimated fair values exceed the corresponding reporting units’ carrying values, no impairment of goodwill exists. If the carrying amount of a reporting unit exceeds its fair value, then the amount of the impairment loss must be measured. The impairment loss is calculated by comparing the implied fair value of the reporting unit’s goodwill to its carrying amount. In calculating the implied fair value of goodwill, the fair value of the reporting unit is allocated to all of the other assets and liabilities of that unit based on their fair values. The excess of the fair value of a reporting unit over the amount assigned to its other assets and liabilities is the implied fair value of goodwill. An impairment loss would be recognized when the carrying amount of goodwill exceeds its implied fair value. The Company’s annual evaluation of goodwill performed on January 1, 2010 in accordance with ASC 350, resulted in an estimated impairment loss associated with the Quest reporting unit. Based on the preliminary results of the second step of the impairment test, we estimated that goodwill associated with the Quest reporting unit was impaired. Therefore, we recorded a non-cash goodwill impairment charge of approximately $17.0 million for the year ended December 31, 2009. The estimated fair values of our other reporting units were sufficiently higher than their respective carrying values, thus indicating no impairment concerns. See Note 6 to the consolidated financial statements for additional information. The Company’s annual evaluation of goodwill performed on January 1, 2009 resulted in no impairment loss.
For indefinite-lived intangible assets, this annual evaluation includes an analysis of estimated future undiscounted net cash flows expected to be generated by the assets over their estimated useful lives. If the estimated future undiscounted net cash flows are insufficient to recover the carrying value of the assets over their estimated useful lives, an impairment charge in the amount by which the carrying value of the assets exceeds their fair value would be recorded. The analysis completed on January 1, 2010, resulted in an impairment loss on certain intangible assets associated with the Quest reporting unit. See Note 6 to the consolidated financial statements for additional information.
Long-Lived Assets
The Company evaluates the recoverability of long-lived assets and finite-lived identifiable intangibles not held for sale whenever events or changes in circumstances indicate that an asset’s carrying amount may not be recoverable. Such circumstances could include, but are not limited to, (1) a significant decrease in the market value of an asset, (2) a significant adverse change in the extent or manner in which an asset is used or in its physical condition, or (3) an accumulation of costs significantly in excess of the amount originally expected for the acquisition or construction of an asset. The Company measures the carrying amount of the asset against the estimated undiscounted future cash flows associated with it. Should the sum of the expected future net undiscounted cash flows be less than the carrying value of the asset being evaluated, an impairment loss would be recognized. The impairment loss would be calculated as the amount by which the carrying value of the asset exceeds the fair value of the asset. The fair value is measured based on quoted market prices, if available. If quoted market prices are not available, the estimate of fair value is based on various valuation techniques, including the discounted value of estimated future cash flows.
Capitalized Software Development Costs
Capitalized software development costs consist principally of salaries and certain other expenses directly related to the development and modification of software products. Capitalization of such costs begins when a detail program has been produced as evidenced by the completion of design, planning, coding and testing, such that the product meets its design specifications and has thereby established technological feasibility. Capitalization of such costs ends when the resulting product is available for general release to the public. Amortization of capitalized software development costs is recorded on a straight-line basis over the estimated economic life of the software, which the Company has determined is not more than five years. For the years ended December 31, 2009, 2008 and 2007, amortization of capitalized software development costs was approximately $1.5 million, $1.0 million and $0.5 million, respectively.
The Company evaluates the recoverability of capitalized software development costs on an annual basis or whenever events or changes in circumstances indicate that the carrying amount of the asset may be less than its net realizable value. The Company measures the carrying amount of the asset against the estimated undiscounted future cash flows associated with it. Should the sum of the expected future net cash flows be less than the carrying value of the asset being evaluated, an impairment loss would be recognized. The impairment loss would be calculated as the amount by which the carrying value of the asset exceeds the net realizable value of the asset. The Company’s annual evaluation of capitalized software development costs on January 1, 2010 resulted in no impairment. The Company’s annual evaluation of capitalized software development costs on January 1, 2009 resulted in an impairment charge of approximately $1.0 million. See Note 8 to the consolidated financial statements for further explanation regarding this impairment charge.
47
Table of Contents
RADIANT SYSTEMS, INC. AND SUBSIDIARIES
NOTES TO CONSOLIDATED FINANCIAL STATEMENTS—(Continued)
Internally Developed Software Costs
The Company applies the provisions of the FASB ASC Subtopic 350-40, Intangibles—Goodwill and Other—Internal-Use Software, (“ASC 350-40”). ASC 350-40 requires all costs related to the development of internal use software, other than those incurred during the application development stage, to be expensed as incurred. Costs incurred during the application development stage are required to be capitalized and amortized over the estimated useful life of the software. The Company capitalized costs that were incurred during the application development stage for the years ended December 31, 2009 and 2008 equal to $3.1 million and $7.8 million, respectively. No amortization expense was incurred during the years ended December 31, 2009 and 2008 related to these capitalized costs.
Capitalized Customer Contract Costs
Costs associated with obtaining the customer contracts related to our Radiant Payment Services business have been capitalized and are being amortized over the life of the related contract (in most cases three years). The Company’s capitalized costs for the years ended December 31, 2009 and 2008 were equal to approximately $3.2 million and $0.7 million, respectively. Amortization expense during the years ended December 31, 2009 and 2008 related to these capitalized costs was equal to approximately $1.2 million and $0.1 million, respectively.
Research, Development and Engineering Costs
Expenditures for research, development and engineering that are not capitalized are charged to operations as incurred. See Note 4 to the consolidated financial statements for additional information.
Financing Costs Related to Long-Term Debt
Costs associated with obtaining long-term debt are deferred and amortized over the term of the related debt. The Company incurred financing costs in 2005 related to the Wells Fargo Foothill, Inc. senior secured credit facility (the “WFF Credit Agreement”) and other long-term debt agreements. The costs were deferred and amortized over three years. Amortization of financing costs were approximately $0.1 million in 2007. The remaining financing costs were expensed in the first quarter of 2008 in conjunction with the termination of the WFF Credit Agreement.
The Company incurred financing costs in 2008 related to the credit agreement with JP Morgan Chase Bank, N.A. equal to approximately $1.2 million. The costs were deferred and are being amortized over five years. Amortization of financing costs was approximately $0.3 million in 2009 and $0.4 million in 2008.
Advertising Costs
Advertising costs are charged to expense as incurred. Advertising expenses for fiscal years 2009, 2008 and 2007 were $1.6 million, $1.4 million and $0.6 million, respectively.
Accounting for Stock-Based Compensation
The FASB issued guidance under FASB ASC Topic 718, Compensation—Stock Compensation, (“ASC 718”), that became effective January 1, 2006, and requires us to expense the fair value of grants made under our stock option plans over the vesting period of the option grants. Under the guidance of ASC 718, we adopted the “Modified Prospective Application” transition method, which does not result in the restatement of previously issued financial statements. Awards granted after January 1, 2006 are valued and non-cash share-based compensation expense is recognized in the consolidated statement of operations in accordance with ASC 718. In addition, non-vested awards that were granted before January 1, 2006 also result in recognition of non-cash share-based compensation expense.
The computation of the expected volatility assumption used in the Black-Scholes-Merton calculations for new grants is based on a combination of historical and implied volatilities. When establishing the expected life assumption, the Company reviews annual historical employee exercise behavior of option grants with similar vesting periods. The risk free interest rate is based on the U.S. Treasury yield curve at the grant date, using a remaining term equal to the expected life of the option. The total expenses to be recorded in future periods will depend on several variables, including the number of share-based awards that vest, pre-vesting cancellations and the fair value of those vested awards.
Income Taxes
Deferred tax assets and liabilities are recognized for the future tax consequences attributable to differences between the financial statement carrying amounts of existing assets and liabilities and their respective tax bases. Deferred tax assets and liabilities are measured using enacted tax rates expected to apply to taxable income in the years in which those temporary differences are expected to be recovered or settled. Income tax expense (benefit) is generally comprised of the tax payable (receivable) for the period and the change in deferred income tax assets and liabilities during the period. A valuation allowance is established for deferred tax assets when their realizability is not considered to be more likely than not.
The Company follows the guidance issued by the FASB related to accounting for uncertainty in income taxes. This guidance, included in ASC Topic 740, Income Taxes (“ASC 740”), prescribes a consistent recognition threshold and measurement attribute, as well as clear criteria for subsequently recognizing, derecognizing and measuring such tax positions, for financial statement purposes. This guidance also requires expanded disclosure with respect to the uncertainty in income taxes. The Company’s continuing practice is to recognize interest and/or penalties related to income tax matters in income tax expense.
48
Table of Contents
RADIANT SYSTEMS, INC. AND SUBSIDIARIES
NOTES TO CONSOLIDATED FINANCIAL STATEMENTS—(Continued)
Net Income (Loss) Per Share
Basic net income (loss) per common share is computed by dividing net income (loss) by the weighted-average number of shares outstanding. In the event of a net loss, dilutive loss per share is the same as basic loss per share. Diluted net income per share includes the dilutive effect of stock options. A reconciliation of the weighted average number of common shares outstanding assuming dilution is as follows (in thousands):
| 2009 | 2008 | 2007 | ||||
| Weighted average common shares outstanding |
32,916 | 32,293 | 31,373 | |||
| Dilutive effect of outstanding stock options |
— | 1,105 | 1,787 | |||
| Weighted average common shares outstanding assuming dilution |
32,916 | 33,398 | 33,160 | |||
For the years ended December 31, 2009, 2008 and 2007, options to purchase approximately 3.9 million, 3.2 million and 1.7 million shares of common stock, respectively, were excluded from the above reconciliation, as the options were anti-dilutive for the years then ended.
Fair Value of Financial Instruments
The Company follows the guidance of FASB ASC paragraph 825-10-50-10 (“ASC 825-10-50-10”) for disclosures about fair value of its financial instruments. The Company also follows the guidance of FASB ASC paragraph 820-10-35-37 (“ASC 820-10-35-37”) to measure the fair value of its financial instruments. ASC 820-10-35-37 establishes a framework for measuring fair value in accounting principles generally accepted in the United States of America (U.S. GAAP) and expands disclosures about fair value measurements. To increase consistency and comparability in fair value measurements and related disclosures, ASC 820-10-35-37 establishes a fair value hierarchy which prioritizes the inputs to valuation techniques used to measure fair value into three broad levels. The fair value hierarchy gives the highest priority to quoted prices (unadjusted) in active markets for identical assets or liabilities and the lowest priority to unobservable inputs. The three levels of fair value hierarchy defined by ASC 820-10-35-37 are described below:
| • | Level 1 – Quoted market prices available in active markets for identical assets or liabilities as of the reporting date. |
| • | Level 2 – Pricing inputs other than quoted prices in active markets included in Level 1, which are either directly or indirectly observable as of the reporting date. |
| • | Level 3 – Pricing inputs that are generally observable inputs and not corroborated by market data. |
The following methods and assumptions were used to estimate the fair value of each class of financial instruments:
| • | Cash and equivalents, accounts receivable, and accounts payable – The carrying amount of these items approximates fair value. |
| • | Long-term debt — Term loan – To estimate the fair value of our term loan, which is not quoted on an exchange, the Company used those interest rates that were currently available to it for issuance of debt with similar terms and remaining maturities. At December 31, 2009, the fair value of the $20.0 million principal amount of the term loan under the JPM Credit Agreement was approximately $19.5 million. |
| • | Long-term debt — Revolving credit loan – To estimate the fair value of our revolving credit facility, which is not quoted on an exchange, the Company used those interest rates currently available to it in conjunction with management’s estimate of the amounts and timing of the repayment of principal amounts and related interest. At December 31, 2009, the fair value of the $42.0 million principal amount of the revolving credit loan under the JPM Credit Agreement was approximately $40.4 million. |
Derivative Financial Instruments
The Company uses foreign exchange forward contracts to hedge certain existing and anticipated foreign currency denominated transactions. The terms of these foreign exchange contracts are generally consistent with the timing of the foreign currency transactions.
The Company records derivatives, namely foreign exchange contracts, on the balance sheet at fair value. The gains or losses on foreign currency forward contracts are recorded in the accompanying consolidated statements of operations. The Company does not use derivative financial instruments for speculative or trading purposes, nor does it hold or issue leveraged derivative financial instruments. The Company recognized gains of approximately $0.8 million in each of the years ended December 31, 2008 and 2007 related to forward exchange contracts executed in conjunction with the acquisitions of Quest and Orderman.
Cash Equivalents
The Company considers all highly liquid investments purchased with a maturity of three months or less to be cash equivalents. The Company maintains its cash accounts with several banks around the world. Cash balances are insured under various local deposit insurance programs similar to FDIC insurance in the United States. As of December 31, 2009 the Company has cash balances on deposit that exceeded the insured balances in the amount of approximately $6.6 million.
Concentration of Business and Credit Risk
Financial instruments, which potentially subject the Company to credit risk, consist principally of trade receivables and interest bearing investments. The Company performs on-going credit evaluations of its customers and generally does not require collateral. The Company estimates the losses for uncollectible accounts based on the aging of the accounts receivable and the evaluation of the likelihood of success in collecting the receivable. The Company believes it maintains adequate reserves for potential losses and such losses have been included in management’s estimates.
As of December 31, 2009 and 2008, approximately 16% of the Company’s accounts receivable were due from five customers.
During the years ended December 31, 2009, 2008 and 2007, approximately 14%, 16% and 19% respectively, of the Company’s revenues were derived from five customers. For the years ended December 31, 2009, 2008 and 2007, no individual customer accounted for more than 10% of the Company’s total revenues.
49
Table of Contents
RADIANT SYSTEMS, INC. AND SUBSIDIARIES
NOTES TO CONSOLIDATED FINANCIAL STATEMENTS—(Continued)
Comprehensive Income (Loss)
The Company follows the guidance of FASB ASC Topic 220, Comprehensive Income, (“ASC 220”). This guidance establishes the rules for the reporting of comprehensive income (loss) and its components. The Company’s comprehensive income (loss) includes net income (loss) and foreign currency translation adjustments. Total comprehensive income (loss) for the years ended December 31, 2009, 2008 and 2007 was approximately $6.2 million, ($8.6) million and $13.1 million, respectively.
New Accounting Standards
Recently Issued Standards
In October 2009, the FASB issued Accounting Standards Update (“ASU”) No. 2009-14 (“ASU 2009-14”), Software (Topic 985): Certain Revenue Arrangements That Include Software Elements—a consensus of the FASB Emerging Issues Task Force. This ASU establishes that tangible products that contain software that works together with the nonsoftware components of the tangible product to deliver the tangible product’s essential functionality are no longer within the scope of software revenue guidance. These items should be accounted for under other appropriate revenue recognition guidance. We are required to adopt this ASU prospectively for new or materially modified agreements as of January 1, 2011 and concurrently with ASU 2009-13 which is described below. Full retrospective application is optional and early adoption is permitted at the beginning of a fiscal year. We are currently evaluating the impact of this ASU on our financial statements.
In October 2009, the FASB issued Accounting Standards Update No. 2009-13, (“ASU 2009-13”), Revenue Recognition (Topic 605): Multiple-Deliverable Revenue Arrangements—a consensus of the FASB Emerging Issues Task Force. This ASU amends the criteria for separating consideration in multiple-deliverable arrangements, which will, as a result, separate multiple-deliverable arrangements more often than under existing U.S. GAAP. Additionally, this ASU establishes a selling price hierarchy for determining the selling price of a deliverable. The ASU also eliminates the residual method of revenue allocation and requires that arrangement consideration be allocated at the inception of the arrangement to all deliverables using the relative selling price method. This guidance requires that management determine its best estimate of selling price in a manner consistent with that used to determine the price to sell the deliverable on a standalone basis. This ASU significantly expands the disclosures required for multiple-deliverable revenue arrangements with the objective of disclosing judgments related to these arrangements and the effect that the use of the relative selling-price method and changes in those judgments have on the timing and amount of revenue recognition. We are required to adopt this ASU prospectively for new or materially modified agreements as of January 1, 2011 and concurrently with ASU 2009-14, which is described above. Full retrospective application is optional and early adoption is permitted at the beginning of a fiscal year. We are currently evaluating the impact of this ASU on our financial statements.
Recently Adopted Standards
In August 2009, the FASB issued Accounting Standards Update No. 2009-05 (“ASU 2009-05”), Fair Value Measurements and Disclosures (Topic 820): Measuring Liabilities at Fair Value. This ASU establishes that in circumstances in which a quoted market price in an active market for an identical liability is not available, an entity is required to measure fair value using the quoted price of an identical liability when traded as an asset or quoted prices for similar liabilities or similar liabilities when traded as assets, or another valuation technique consistent with the principles of Topic 820. We adopted the provisions of ASU 2009-05 as of September 30, 2009, which had no material impact on the Company’s financial position, cash flows or results of operations.
In June 2009, the FASB issued the FASB Accounting Standards Codification TM (“Codification” or “ASC”) which modifies the U.S. GAAP hierarchy by establishing the Codification as the single source of authoritative U.S. GAAP recognized by the FASB applied by nongovernmental entities. SEC rules and interpretive releases are also sources of authoritative U.S. GAAP for SEC registrants. The Codification became effective July 1, 2009. The Codification is not intended to change or alter existing U.S. GAAP and accordingly, it did not impact the Company’s financial position, cash flows or results of operations. However, historical U.S. GAAP references in this annual report and in our quarterly report for the period ending September 30, 2009 have been adjusted, and references in future filings will be adjusted to reflect authoritative guidance in the Codification.
In September 2006, the FASB issued guidance included in ASC Topic 820, Fair Value Measurements and Disclosures (“ASC 820”), and in February 2008, the FASB amended this guidance. ASC 820 defines fair value, establishes a framework for measuring fair value and expands disclosure of fair value measurements. ASC 820 is applicable to other ASC topics that require or permit fair value measurements, except those relating to lease accounting, and accordingly does not require any new fair value measurements. The provisions of ASC 820 are effective for financial assets and liabilities in fiscal years beginning after November 15, 2007, and for non-financial assets and liabilities in fiscal years beginning after November 15, 2008, except for items that are recognized or disclosed at fair value in the financial statements on a recurring basis. Our adoption of the provisions of ASC 820 on January 1, 2008, with respect to financial assets and liabilities measured at fair value, has had no material impact on our fair value measurements or our financial statements. In October 2008, the FASB issued additional guidance included in ASC 820 that clarifies the application of fair value measurements in a market that is not active. These provisions of ASC 820 became effective immediately upon issuance, and their adoption did not have any effect on our financial statements. We determine the fair value of our long-lived assets, in accordance with ASC 820, when testing for impairment. ASC 820 was effective for fair value assessments as of January 1, 2009. In April 2009, the FASB issued further guidance included in ASC 820 that provides for estimating fair value when the volume and level of activity for the asset or liability have significantly decreased. These provisions also include guidance on identifying circumstances that indicate a transaction is not orderly. This additional guidance is effective for interim and annual reporting periods ending after June 15, 2009, and is applied prospectively. The Company concluded that the adoption of these provisions of ASC 820 as of April 1, 2009 had no impact on its financial position, cash flows or results of operations.
50
Table of Contents
RADIANT SYSTEMS, INC. AND SUBSIDIARIES
NOTES TO CONSOLIDATED FINANCIAL STATEMENTS—(Continued)
In November 2008, the Emerging Issues Task Force reached consensus on guidance about accounting for defensive intangible assets that is included in ASC Topic 350, Intangibles-Goodwill and Other (“ASC 350”). A defensive intangible asset is an acquired intangible asset where the acquirer has no intention of using, or intends to discontinue use of, the intangible asset, but holds it to prevent competitors from obtaining any benefit from it. The acquired defensive asset will be treated as a separate unit of accounting and the useful life assigned will be based on the period during which the asset would diminish in value. This guidance is effective for financial statements issued for fiscal years beginning after December 15, 2008, and may impact any intangible assets we acquire in future transactions.
In June 2008, the FASB issued guidance related to the computation of earnings per share amounts that is included in ASC Topic 260, Earnings Per Share (“ASC 260”). ASC 260 stipulates that unvested share-based payment awards that contain nonforfeitable rights to dividends or dividend equivalents (whether paid or unpaid) are participating securities and shall be included in the computation of earnings per share pursuant to the two class method. This guidance is effective for fiscal years beginning after December 31, 2008. The Company concluded that the adoption of these provisions ASC 260 did not have a material impact on its reported basic and diluted earnings per share amounts.
In April 2008, the FASB issued guidance related to determining the useful life of intangible assets that is included in ASC Topic 350, Intangibles-Goodwill and Other (“ASC 350”). This guidance amends the factors that should be considered in developing renewal or extension assumptions used to determine the useful life of a recognized intangible asset. More specifically, this guidance removes the requirement to consider whether an intangible asset can be renewed without substantial cost or material modifications to the existing terms and conditions and instead, requires an entity to consider its own historical experience in renewing similar arrangements. These provisions also require expanded disclosure related to the determination of intangible asset useful lives. These provisions are effective for financial statements issued for fiscal years beginning after December 15, 2008, and may impact any intangible assets we acquire in future transactions.
In March 2008, the FASB issued guidance included in ASC Topic 815, Derivatives and Hedging (“ASC 815”). This guidance requires qualitative disclosures about objectives and strategies for using derivatives, quantitative disclosures about fair value amounts and gains and losses on derivative instruments, and disclosures about credit risk-related contingent features in derivative agreements. These provisions are effective for fiscal years beginning after November 15, 2008. As of December 31, 2009, we have not entered into any derivative transactions.
In December 2007, the FASB issued guidance included in ASC Topic 810, Consolidation (“ASC 810”). This guidance requires (1) non-controlling (minority) interests be reported as a component of stockholders’ equity, (2) net income attributable to the parent and to the non-controlling interest be separately identified in the consolidated statement of operations, (3) changes in a parent’s ownership interest while the parent retains its controlling interest be accounted for as equity transactions, (4) any retained non-controlling equity investment upon the deconsolidation of a subsidiary be initially measured at fair value, and (5) sufficient disclosures be provided that clearly identify and distinguish between the interests of the parent and the interests of the non-controlling owners. These provisions of ASC 810 are effective for financial statements issued for fiscal years beginning after December 15, 2008, and interim periods within those fiscal years. The adoption of these provisions did not have any impact on the Company’s financial position, cash flows or results of operations as we have no minority interests.
In December 2007, the FASB issued guidance included in ASC Topic 805, Business Combinations (“ASC 805”). This guidance significantly changes the accounting for business combinations. ASC 805 requires an acquiring entity to recognize all assets acquired and liabilities assumed in a transaction at the acquisition-date fair value, with limited exceptions. This guidance changes the accounting treatment for certain specific acquisition-related items including: (1) expensing acquisition-related costs as incurred; (2) valuing non-controlling interests at fair value at the acquisition date of a controlling interest; and (3) expensing restructuring costs associated with an acquired business. The guidance also enumerated a substantial number of new disclosure requirements. These provisions of ASC 805 are to be applied prospectively to business combinations for which the acquisition date is on or after January 1, 2009. These provisions will have an impact on our accounting for any future business combinations.
In February 2007, the FASB issued guidance included in ASC Topic 825, Financial Instruments (“ASC 825”). This guidance permits entities to choose to measure many financial instruments and certain other items at fair value that are not currently required to be measured at fair value, and establishes presentation and disclosure requirements designed to facilitate comparisons between entities that choose different measurement attributes for similar types of assets and liabilities. These provisions of ASC 825 are effective for financial statements issued for fiscal years beginning after November 15, 2007. We adopted these provisions of ASC 825 on January 1, 2008.
51
Table of Contents
RADIANT SYSTEMS, INC. AND SUBSIDIARIES
NOTES TO CONSOLIDATED FINANCIAL STATEMENTS—(Continued)
3. STOCK-BASED COMPENSATION
Radiant has adopted equity incentive plans that provide for the grant of incentive and non-qualified stock options and restricted stock awards to directors, officers and other employees pursuant to authorization by the Board of Directors. The exercise price of all options equals the market value on the date of the grant. In addition, Radiant provides employees stock purchase rights under its Employee Stock Purchase Plan (“ESPP”). The ESPP permits employees to purchase Radiant common stock at the end of each quarter at 95% of the market price on the last day of the quarter. Based on these terms, the ESPP will not result in any future stock compensation expense. The Company has authorized approximately 18.2 million shares for awards of stock options and restricted stock, of which approximately 1.0 million shares are available for future grants as of December 31, 2009.
The Company accounts for equity-based compensation in accordance with FASB ASC Topic 718, Compensation—Stock Compensation (“ASC 718”), which requires the Company to measure the cost of employee services received in exchange for all equity awards granted, including stock options and restricted stock awards, based on the fair market value of the award as of the grant date. The estimated fair value of the Company’s equity-based awards, less expected forfeitures, is amortized over the awards’ vesting period on a straight-line basis. The non-cash stock-based compensation expense from stock options and restricted stock awards was included in the condensed consolidated statements of operations as follows (in thousands):
| Year ended December 31, | ||||||||||||
| 2009 | 2008 | 2007 | ||||||||||
| Cost of revenues - systems |
$ | 131 | $ | 85 | $ | 163 | ||||||
| Cost of revenues - maintenance, subscription and transaction services |
80 | 71 | 64 | |||||||||
| Cost of revenues - professional services |
286 | 255 | 231 | |||||||||
| Product development |
235 | 370 | 550 | |||||||||
| Sales and marketing |
725 | 746 | 1,016 | |||||||||
| General and administrative |
3,008 | 3,119 | 1,771 | |||||||||
| Total non-cash stock-based compensation expense |
$ | 4,465 | $ | 4,646 | $ | 3,795 | ||||||
| Estimated income tax benefit |
(1,611 | ) | (1,707 | ) | (1,180 | ) | ||||||
| Total non-cash stock-based compensation expense, net of tax benefit |
$ | 2,854 | $ | 2,939 | $ | 2,615 | ||||||
| Impact on diluted net income (loss) per share |
$ | 0.09 | $ | 0.09 | $ | 0.08 | ||||||
The Company capitalized less than $0.1 million in stock-based compensation cost related to product development in each of the years ended December 31, 2009, 2008 and 2007.
Stock Options
The exercise price of each stock option equals the market price of Radiant’s stock on the date of grant. Most options are scheduled to vest equally over a three or four-year period or when certain stock performance requirements are met. These stock performance requirements include a provision that allows for early vesting if certain stock price targets are met. The Company recognizes stock-based compensation expense using the graded vesting attribution method. Outstanding options expire no later than ten years from the grant date. The fair value of each option grant is estimated on the date of grant using the Black-Scholes-Merton option pricing model. The weighted average assumptions used in the model for the years ended December 31, 2009, 2008 and 2007 are outlined in the following table:
| Year ended December 31, | |||||||||
| 2009 | 2008 | 2007 | |||||||
| Expected volatility |
69 - 70 | % | 50 - 61 | % | 47 - 49 | % | |||
| Expected life (in years) |
3-4 | 3-4 | 3-4 | ||||||
| Expected dividend yield |
0.00 | % | 0.00 | % | 0.00 | % | |||
| Risk-free interest rate |
1.6 - 2.2 | % | 1.3 - 3.3 | % | 3.3 - 5.0 | % | |||
52
Table of Contents
RADIANT SYSTEMS, INC. AND SUBSIDIARIES
NOTES TO CONSOLIDATED FINANCIAL STATEMENTS—(Continued)
The computation of the expected volatility assumption used in the Black-Scholes-Merton calculations for new grants is based on a combination of historical and implied volatilities. When establishing the expected life assumption, the Company reviews annual historical employee exercise behavior of option grants with similar vesting periods. The risk-free interest rate is based on the U.S. Treasury yield curve at the grant date, using a remaining term equal to the expected life of the option. The total expenses to be recorded in future periods will depend on several variables, including the number of stock-based awards that vest, pre-vesting cancellations and the fair value of those vested awards.
A summary of the changes in stock options outstanding under our stock-based compensation plans during the years ended December 31, 2009 and 2008 is presented below (in thousands, except per share data):
| Number of Shares |
Weighted- Average Exercise Price |
Weighted- Average Remaining Contractual Term (in years) |
Aggregate Intrinsic Value | ||||||||
| Outstanding at December 31, 2007 |
5,798 | $ | 10.34 | 4.01 | $ | 42,886 | |||||
| Granted |
927 | $ | 11.92 | ||||||||
| Exercised |
(232 | ) | $ | 7.13 | |||||||
| Forfeited or cancelled |
(134 | ) | $ | 11.68 | |||||||
| Outstanding at December 31, 2008 |
6,359 | $ | 10.66 | 3.25 | $ | — | |||||
| Granted |
538 | $ | 3.68 | ||||||||
| Exercised |
(267 | ) | $ | 4.98 | |||||||
| Forfeited or cancelled |
(755 | ) | $ | 17.78 | |||||||
| Outstanding at December 31, 2009 |
5,875 | $ | 9.37 | 3.30 | $ | 14,656 | |||||
| Vested or expected to vest at December 31, 2009 |
5,818 | $ | 9.39 | 3.28 | $ | 14,416 | |||||
| Exercisable at December 31, 2009 |
4,455 | $ | 9.51 | 2.98 | $ | 10,278 | |||||
| Exercisable at December 31, 2008 |
4,385 | $ | 10.58 | 3.11 | $ | — | |||||
The weighted average grant-date fair value of options granted during the years ended December 31, 2009, 2008 and 2007 was $1.80, $4.57 and $4.59, respectively. The total intrinsic value, the difference between the exercise price and the market price on the date of exercise, of options exercised was approximately $1.5 million during each of the years ended December 31, 2009 and 2008 and $7.5 million for the year ended December 31, 2007. The total fair value of options that vested during the years ended December 31, 2009 and 2008 was approximately $3.6 million and $2.8 million, respectively. At December 31, 2009, 2008 and 2007, the Company had approximately 1.4 million, 2.0 million and 1.8 million, respectively, unvested options outstanding with a weighted-average grant-date fair value of $3.67, $5.86 and $3.56, respectively. None of the 1.4 million options that were unvested at December 31, 2009 had a vesting period based on stock performance requirements, and of the 2.0 million options that were unvested at December 31, 2008, there were 0.1 million options that had a vesting period based on stock performance requirements. The unvested options have a total unrecognized compensation expense of approximately $1.5 million at December 31, 2009, net of estimated forfeitures, which will be recognized over the weighted average period of 0.9 years. The Company recognized stock-based compensation expense related to employee and director stock options equal to approximately $2.8 million, $3.6 million and $3.8 million for the years ended December 31, 2009, 2008 and 2007, respectively. Cash received from options exercised was approximately $1.3 million, $1.7 million and $7.1 million during the years ended December 31, 2009, 2008 and 2007, respectively.
Restricted Stock Awards
The Company awarded approximately 0.5 and 0.3 million shares of restricted stock to employees under the Amended and Restated 2005 Long-Term Incentive Plan for the years ended December 31, 2009 and 2008, respectively. These restricted stock awards vest at various terms over a three-year period from the date of grant. The weighted average grant-date fair value of restricted stock awards at December 31, 2009 and 2008 was $3.91 and $12.20 per share, respectively. The Company recognized stock-based compensation expense related to restricted stock awards equal to approximately $1.7 million and $1.0 million for the years ended December 31, 2009 and 2008, respectively. The unvested restricted stock awards had a total unrecognized compensation expense as of December 31, 2009 and 2008 equal to approximately $2.5 million and $2.6 million, respectively, which will be recognized over 1.7 and 1.9 years, respectively.
53
Table of Contents
RADIANT SYSTEMS, INC. AND SUBSIDIARIES
NOTES TO CONSOLIDATED FINANCIAL STATEMENTS—(Continued)
4. PRODUCT DEVELOPMENT EXPENDITURES
Product development expenditures for the years ended December 31, 2009, 2008 and 2007 are summarized as follows (in thousands):
| 2009 | 2008 | 2007 | |||||||||
| Total development expenditures |
$ | 26,347 | $ | 28,882 | $ | 26,173 | |||||
| Less amounts capitalized |
4,002 | 4,088 | 2,736 | ||||||||
| Product development expense |
$ | 22,345 | $ | 24,794 | $ | 23,437 | |||||
The activity in the capitalized software development account during the years ended December 31, 2009 and 2008 is summarized as follows (in thousands):
| 2009 | 2008 | |||||||
| Balance at beginning of period, net |
$ | 9,278 | $ | 7,231 | ||||
| Capitalized software development costs |
4,002 | 4,088 | ||||||
| Amortization expense |
(1,470 | ) | (1,021 | ) | ||||
| Impairment write-off |
— | (1,020 | ) | |||||
| Balance at end of period, net |
$ | 11,810 | $ | 9,278 | ||||
Amortization of capitalized software costs is included in system sales cost of revenues in the accompanying statements of operations.
54
Table of Contents
RADIANT SYSTEMS, INC. AND SUBSIDIARIES
NOTES TO CONSOLIDATED FINANCIAL STATEMENTS—(Continued)
5. ACQUISITIONS
Each of the acquisitions discussed below was accounted for using the purchase method of accounting as required by FASB ASC Topic 805, Business Combinations (“ASC 805”). Management concluded that the acquisitions of Orderman, Jadeon and Hospitality EPOS were not considered material acquisitions under the provisions of ASC 805.
Acquisition of Orderman
On July 1, 2008, the Company acquired Orderman GmbH (“Orderman”), one of the leading manufacturers of wireless handheld ordering and payment devices for the hospitality industry. Headquartered in Salzburg, Austria, Orderman has provided innovative mobile solutions since 1994. Orderman distributes its solutions through a reseller network of partners that have deployed their handheld devices, predominately in Europe. The total purchase price was approximately $33.0 million. The operations of the Orderman business have been included in the Company’s consolidated results of operations and financial position from the date of acquisition. The results of these operations are reported under the Hospitality segment.
The intangible assets acquired were valued by the Company utilizing customary valuation procedures and techniques. The following is a summary of the estimated fair values of the assets acquired and liabilities assumed as of the date of the Orderman acquisition (in thousands):
| Current assets |
$ | 7,797 | |
| Property, plant and equipment |
1,750 | ||
| Identifiable intangible assets |
19,147 | ||
| Goodwill |
14,763 | ||
| Other assets |
94 | ||
| Total assets acquired |
43,551 | ||
| Current liabilities |
5,742 | ||
| Long-term liabilities |
4,817 | ||
| Total liabilities assumed |
10,559 | ||
| Purchase price |
$ | 32,992 | |
As a result of the Orderman acquisition, goodwill of approximately $14.8 million was recorded and assigned to the Hospitality segment. This includes subsequent changes related to purchase price adjustments in which goodwill increased from the date of acquisition by approximately $1.6 million. The goodwill is deductible for tax purposes over a period of 15 years. The following is a summary of the intangible assets acquired and the weighted-average useful life over which they will be amortized (in thousands):
| Purchased Assets |
Weighted- Average Useful Life | ||||
| Core and developed technology |
$ | 10,171 | 4 years | ||
| Reseller network |
7,086 | 7 years | |||
| Trademark |
1,890 | Indefinite | |||
| Total intangible assets acquired |
$ | 19,147 | |||
55
Table of Contents
RADIANT SYSTEMS, INC. AND SUBSIDIARIES
NOTES TO CONSOLIDATED FINANCIAL STATEMENTS—(Continued)
Acquisition of Jadeon
On May 1, 2008, Radiant acquired substantially all of the assets of Jadeon, Inc. (“Jadeon”), a wholly-owned subsidiary of Innuity, Inc. and one of the Company’s resellers in California. Headquartered in Irvine, just outside Los Angeles, Jadeon had been delivering and supporting Radiant’s hospitality point-of-sale solutions since 2001. The total purchase price was approximately $7.3 million. The operations of the Jadeon business have been included in the Company’s consolidated results of operations and financial position from the date of acquisition. The results of these operations are reported under the Hospitality segment.
The intangible assets acquired were valued by the Company utilizing customary valuation procedures and techniques. The following is a summary of the estimated fair values of the assets acquired and liabilities assumed as of the date of the Jadeon acquisition (in thousands):
| Current assets |
$ | 1,368 | |
| Property, plant and equipment |
117 | ||
| Identifiable intangible assets |
1,795 | ||
| Goodwill |
7,766 | ||
| Other assets |
185 | ||
| Total assets acquired |
11,231 | ||
| Total liabilities assumed (all of which were considered current) |
3,967 | ||
| Purchase price |
$ | 7,264 | |
As a result of the Jadeon acquisition, goodwill of approximately $7.8 million was recorded and assigned to the Hospitality segment. This includes subsequent changes related to purchase price adjustments in which goodwill increased from the date of acquisition by approximately $0.8 million. The goodwill is deductible for tax purposes over a period of 15 years. The following is a summary of the intangible asset acquired and the weighted-average useful life over which it will be amortized (in thousands):
| Purchased Asset |
Weighted- Average Useful Life | ||||
| Customer relationships |
$ | 1,795 | 10 years | ||
| Total intangible asset acquired |
$ | 1,795 | |||
56
Table of Contents
RADIANT SYSTEMS, INC. AND SUBSIDIARIES
NOTES TO CONSOLIDATED FINANCIAL STATEMENTS—(Continued)
Acquisition of Hospitality EPoS
On April 4, 2008, the Company acquired Hospitality EPoS Systems Ltd. (“Hospitality EPoS”), a technology supplier to the U.K. hospitality market since 1992. Headquartered in Kent, England, just outside London, Hospitality EPoS provided capabilities for sales, implementation and support services and represented Radiant’s suite of Aloha products. The total purchase price was approximately $6.1 million. The operations of the Hospitality EPoS business have been included in the Company’s consolidated results of operations and financial position from the date of acquisition. The results of these operations are reported under the Hospitality segment.
The intangible assets acquired were valued by the Company utilizing customary valuation procedures and techniques. The following is a summary of the estimated fair values of the assets acquired and liabilities assumed as of the date of the Hospitality EPoS acquisition (in thousands):
| Current assets |
$ | 1,486 | |
| Property, plant and equipment |
1,672 | ||
| Identifiable intangible assets |
2,250 | ||
| Goodwill |
3,099 | ||
| Total assets acquired |
8,507 | ||
| Current liabilities |
1,564 | ||
| Long-term liabilities |
821 | ||
| Total liabilities assumed |
2,385 | ||
| Purchase price |
$ | 6,122 | |
As a result of the Hospitality EPoS acquisition, goodwill of approximately $3.1 million was recorded and assigned to the Hospitality segment. This includes subsequent changes related to purchase price adjustments in which goodwill increased from the date of acquisition by approximately $0.1 million. The following is a summary of the intangible asset acquired and the weighted-average useful life over which it will be amortized (in thousands):
| Purchased Asset |
Weighted- Average Useful Life | ||||
| Direct customers |
$ | 2,250 | 10 years | ||
| Total intangible asset acquired |
$ | 2,250 | |||
57
Table of Contents
RADIANT SYSTEMS, INC. AND SUBSIDIARIES
NOTES TO CONSOLIDATED FINANCIAL STATEMENTS—(Continued)
Acquisition of Quest
On January 1, 2008, the Company acquired Quest Retail Technology Pty Ltd (“Quest”), a privately held company based in Adelaide, Australia. Quest is a global provider of point-of-sale and back office solutions to stadiums, arenas, convention centers, race courses, theme parks and various other industries. The total purchase price was approximately $53.4 million. The operations of the Quest business have been included in the Company’s consolidated results of operations and financial position from the date of acquisition. The results of these operations are reported under the Hospitality segment.
The intangible assets acquired were valued by the Company utilizing customary valuation procedures and techniques. The following is a summary of the estimated fair values of the assets acquired and liabilities assumed from the Quest acquisition (in thousands):
| Current assets |
$ | 2,959 | |
| Property, plant and equipment |
448 | ||
| Identifiable intangible assets |
17,797 | ||
| Goodwill |
37,430 | ||
| Other assets |
285 | ||
| Total assets acquired |
58,919 | ||
| Current liabilities |
5,211 | ||
| Long-term liabilities |
317 | ||
| Total liabilities assumed |
5,528 | ||
| Purchase price |
$ | 53,391 | |
As a result of the Quest acquisition, goodwill of approximately $37.4 million was recorded and assigned to the Hospitality segment. This includes subsequent changes related to purchase price adjustments in which goodwill decreased from the date of acquisition by approximately $2.6 million. The following is a summary of the intangible assets acquired and the weighted-average useful lives over which they will be amortized (in thousands):
| Purchased Assets |
Weighted- Average Useful Lives | ||||
| Core and developed technology |
$ | 4,033 | 5 years | ||
| Reseller network |
4,208 | 15 years | |||
| Trademarks and tradenames |
4,997 | Indefinite | |||
| Customer list |
4,471 | 10 years | |||
| Backlog |
88 | 2 months | |||
| Total intangible assets acquired |
$ | 17,797 | |||
The two schedules and commentary above do not reflect the write down of goodwill and certain intangible assets associated with Quest, as further explained in Note 6 to the consolidated financial statements. During the year ended December 31, 2009, the Company recognized non-cash charges of approximately $17.0 million and $3.9 million related to the impairment of Quest’s goodwill and trademarks/tradenames, respectively. These charges are not reflected above since these schedules represent the purchase price allocation on the date of acquisition, reflecting only subsequent purchase accounting adjustments.
58
Table of Contents
RADIANT SYSTEMS, INC. AND SUBSIDIARIES
NOTES TO CONSOLIDATED FINANCIAL STATEMENTS—(Continued)
6. GOODWILL AND INTANGIBLE ASSETS
In accordance with FASB ASC Topic 350, Intangibles—Goodwill and Other (“ASC 350”), we classify purchased intangibles into three categories: (1) goodwill; (2) finite-lived intangible assets subject to amortization; and (3) indefinite-lived intangible assets. Goodwill and indefinite-lived intangible assets are not amortized. As required by ASC 350, these assets are reviewed for impairment on at least an annual basis as further described in Note 2 to the consolidated financial statements under the caption “Goodwill and Intangible Assets.”
Goodwill
Goodwill is recognized when the consideration paid for a business acquisition exceeds the fair value of the assets acquired, including tangible and intangible assets. The Company’s annual impairment analysis completed on January 1, 2010 indicated that the estimated fair value of our Quest reporting unit was less than the carrying amount at that time. The estimated fair values of the Company’s other reporting units were sufficiently higher than their respective carrying values, thus indicating no impairment concerns. We proceeded with the second step of the impairment analysis to estimate the hypothetical purchase price allocation of Quest’s assets and liabilities based on the estimated fair value. The carrying value of certain intangible assets were then adjusted down to reflect the estimated fair value per the hypothetical purchase price allocation.
The residual amount of goodwill that resulted from this hypothetical purchase price allocation was then compared to the carrying amount of goodwill to estimate the amount of the goodwill impairment. Based on the preliminary results of our analysis, we estimated the impairment to be approximately $17.0 million. However, this amount could change when the valuation analysis is completed. This non-cash charge has been reflected in the consolidated financial statements for the year ended December 31, 2009 and it does not affect our income taxes, cash flows, liquidity or compliance with our debt covenants.
The Company’s annual impairment analyses completed on January 1, 2009 and 2008 indicated no impairment and, accordingly, there were no goodwill impairment charges for the years ended December 31, 2008 and 2007.
Changes in the carrying amount of goodwill for the years ended December 31, 2009 and 2008 are as follows (in thousands):
| Hospitality | Retail | Total | ||||||||||
| Gross goodwill |
40,003 | 28,555 | 68,558 | |||||||||
| Accumulated impairment losses |
(2,252 | ) | (3,920 | ) | (6,172 | ) | ||||||
| BALANCE, December 31, 2007 |
$ | 37,751 | $ | 24,635 | $ | 62,386 | ||||||
| Goodwill resulting from acquisitions (see Note 5) |
62,993 | — | 62,993 | |||||||||
| Adjustment related to revaluation of intangible assets (see Note 5) |
2,981 | — | 2,981 | |||||||||
| Adjustments related to change in contingent liabilities (see Note 5) |
3,929 | — | 3,929 | |||||||||
| Adjustments related to change in deferred income tax liabilities of acquisitions (see Note 5) |
(5,283 | ) | — | (5,283 | ) | |||||||
| Currency translation adjustments related to acquisitions |
(10,849 | ) | (928 | ) | (11,777 | ) | ||||||
| Gross goodwill |
93,774 | 27,627 | 121,401 | |||||||||
| Accumulated impairment losses |
(2,252 | ) | (3,920 | ) | (6,172 | ) | ||||||
| BALANCE, December 31, 2008 |
$ | 91,522 | $ | 23,707 | $ | 115,229 | ||||||
| Impairment charge for Quest |
(17,008 | ) | — | (17,008 | ) | |||||||
| Purchase price adjustments related to Orderman, Hospitality EPoS and Jadeon (see Note 5) |
(217 | ) | — | (217 | ) | |||||||
| Currency translation adjustments related to acquisitions |
8,801 | 1,014 | 9,815 | |||||||||
| Gross goodwill |
102,358 | 28,641 | 130,999 | |||||||||
| Accumulated impairment losses |
(19,260 | ) | (3,920 | ) | (23,180 | ) | ||||||
| BALANCE, December 31, 2009 |
$ | 83,098 | $ | 24,721 | $ | 107,819 | ||||||
59
Table of Contents
RADIANT SYSTEMS, INC. AND SUBSIDIARIES
NOTES TO CONSOLIDATED FINANCIAL STATEMENTS—(Continued)
Intangible Assets
Intangible assets recorded in connection with business acquisitions are stated at their fair value, determined as of the date of acquisition, less accumulated amortization, if applicable. These assets consist of finite-lived and indefinite-lived intangibles, including core and developed technology, customer relationships, noncompete agreements and trademarks and tradenames. Amortization of finite-lived intangible assets is recognized on a straight-line basis over their estimated useful lives. As described within the “Goodwill” caption above, the carrying value of certain indefinite-lived intangible assets associated with our Quest reporting unit was in excess of the estimated fair value per the estimated hypothetical purchase price allocation. We therefore recorded an estimated impairment charge of approximately $3.9 million for the year ended December 31, 2009. This amount is subject to change when the valuation analysis is completed. The non-cash charge has been reflected in the consolidated financial statements and it does not affect our income taxes, cash flows, liquidity or compliance with our debt covenants. There were no impairment charges associated with the Company’s intangible assets during the years ended December 31, 2008 and 2007.
A summary of the Company’s intangible assets as of December 31, 2009 and 2008 is as follows (in thousands):
| Weighted Average Amortization Lives |
December 31, 2009 | December 31, 2008 | ||||||||||||||
| Gross Carrying Value |
Accumulated Amortization |
Gross Carrying Value |
Accumulated Amortization |
|||||||||||||
| Core and developed technology – Hospitality |
3.8 years | $ | 25,798 | (15,862 | ) | $ | 25,021 | $ | (13,691 | ) | ||||||
| Reseller network – Hospitality |
12.4 years | 19,866 | (5,553 | ) | 18,906 | (3,775 | ) | |||||||||
| Direct sales channel – Hospitality |
10 years | 3,600 | (2,145 | ) | 3,600 | (1,785 | ) | |||||||||
| Covenants not to compete – Hospitality |
3.8 years | 1,750 | (1,655 | ) | 1,750 | (1,600 | ) | |||||||||
| Trademarks and tradenames – Hospitality |
Indefinite | 4,220 | — | 6,928 | — | |||||||||||
| Trademarks and tradenames – Hospitality |
5 years | 300 | (254 | ) | 300 | (194 | ) | |||||||||
| Customer list and contracts – Hospitality |
7.6 years | 13,825 | (4,606 | ) | 12,782 | (2,274 | ) | |||||||||
| Backlog – Hospitality |
2 months | 92 | (92 | ) | 92 | (92 | ) | |||||||||
| Core and developed technology – Retail |
4 years | 3,800 | (3,800 | ) | 3,800 | (2,850 | ) | |||||||||
| Reseller network – Retail |
6 years | 5,200 | (3,467 | ) | 5,200 | (2,600 | ) | |||||||||
| Subscription sales – Retail |
4 years | 1,400 | (1,400 | ) | 1,400 | (1,050 | ) | |||||||||
| Trademarks and tradenames – Retail |
6 years | 700 | (467 | ) | 700 | (350 | ) | |||||||||
| Other |
7.8 years | 2,021 | (843 | ) | 2,021 | (611 | ) | |||||||||
| Total intangible assets |
$ | 82,572 | $ | (40,144 | ) | $ | 82,500 | $ | (30,872 | ) | ||||||
Amortization expense related to intangible assets was approximately $9.3 million, $7.9 million and $4.3 million for the years ended December 31, 2009, 2008, and 2007, respectively.
The table below summarizes the approximate amortization expense, assuming no future acquisitions, dispositions or impairments of intangible assets, for the following 12-month periods subsequent to December 31, 2009 (in thousands):
| 2010 |
$ | 8,915 | |
| 2011 |
7,619 | ||
| 2012 |
5,370 | ||
| 2013 |
4,414 | ||
| 2014 |
4,058 | ||
| Thereafter |
7,832 | ||
| $ | 38,208 | ||
60
Table of Contents
RADIANT SYSTEMS, INC. AND SUBSIDIARIES
NOTES TO CONSOLIDATED FINANCIAL STATEMENTS—(Continued)
7. DEBT
Prior to January 2008, the Company had a senior secured credit facility with Wells Fargo Foothill, Inc. (the “WFF Credit Agreement”). The WFF Credit Agreement provided for extensions of credit, upon satisfaction of certain conditions, in the form of revolving loans in an aggregate principal amount of up to $15 million and a term loan facility in an aggregate principal amount of up to $31 million. The revolving loan amount available to the Company was derived from a monthly borrowing base calculation using the Company’s various accounts receivable balances. The amount derived from this borrowing base calculation was further reduced by the total amount of letters of credit outstanding. Loans under the WFF Credit Agreement bore interest, at the Company’s option, at either the London Interbank Offering Rate (“LIBOR”) plus two and one half percent or the prime rate of Wells Fargo Bank, N.A.
The WFF Credit Agreement was scheduled to expire on March 31, 2010; however, it was refinanced on January 2, 2008 upon the execution of the credit agreement with JPMorgan Chase Bank, N.A., as arranger, and JPMorgan Chase Bank, N.A., SunTrust Bank, Bank of America, Guaranty Bank and Wachovia Bank, N.A., as lenders (the “JPM Credit Agreement”). The JPM Credit Agreement and subsequent amendments thereto provide for extensions of credit, upon satisfaction of certain conditions, in the form of revolving loans in an aggregate principal amount of up to $80 million and a term loan facility in an aggregate principal amount of up to $30 million. The Company has the right to increase the revolving credit commitment by up to $25 million, subject to the terms and conditions set forth in the JPM Credit Agreement. As of December 31, 2009, aggregate borrowings under this facility totaled $62.0 million, comprised of $42.0 million in revolving loans and $20.0 million in term loan facility borrowings. As of December 31, 2009, revolving loan borrowings available to the Company were equal to $38.0 million.
The JPM Credit Agreement is guaranteed by the Company and its subsidiaries and is secured by the assets of the Company and its subsidiaries. The maturity date of the JPM Credit Agreement is January 2, 2013. Interest accrues on amounts outstanding under the loan facility, at the Company’s option, at either (1) LIBOR plus a margin ranging between 1.25% and 2.00%, based upon the Company’s consolidated leverage ratio, as defined, or (2) the higher of the administrative agent’s prime rate or one-half of one percent over the federal funds effective rate plus a margin ranging between 0.25% and 1.00%, based on the Company’s consolidated leverage ratio, as defined. The JPM Credit Agreement contains certain customary representations and warranties from the Company. It also contains customary covenants, including: use of proceeds; limitations on liens; limitations on mergers, consolidations and sales of the Company’s assets; and limitations on related party transactions. In addition, the JPM Credit Agreement requires the Company to comply with various financial covenants, including maintaining leverage and fixed charge coverage ratios, as defined. The leverage ratio covenant limits the Company’s consolidated indebtedness to a multiple of three times its consolidated earnings before interest, taxes, depreciation and amortization (“EBITDA”) as determined on a pro forma basis over the prior four quarters. The fixed charge coverage ratio requires the Company to maintain the ratio of its consolidated EBITDA as determined on a pro forma basis less capital expenses to its fixed charges (which includes regularly scheduled principal payments, consolidated interest expense, taxes paid or payable in accordance with GAAP, and restricted payments) to at least 1.2 to 1 for periods ending in 2008, 1.3 to 1 for periods ending in 2009, and 1.35 to 1 thereafter. The JPM Credit Agreement also contains certain customary events of default, including defaults based on events of bankruptcy and insolvency, nonpayment of principal, interest or fees when due (subject to specified grace periods), breach of specified covenants, change in control and material inaccuracy of representations and warranties. The Company was in compliance with its financial and non-financial covenants as of December 31, 2009. Borrowings and repayments under the Company’s revolving credit facility for the years ended December 31, 2008 and 2007 previously presented erroneously on a net basis in the consolidated statements of cash flows have been corrected and are presented on a gross basis in the accompanying consolidated statements of cash flows in order to conform with ASC 230-10-45-9 (formerly FASB Statement No. 95, Statement of Cash Flows). The correction to present borrowings and repayments on our revolving credit facility on a gross basis was not material to our financial statements and had no impact on our previously reported net income, changes in shareholders’ equity, financial position or net cash flows from financing activities.
In the third quarter of 2008, the Company assumed research and development loans with the Austrian government in the amount of $0.1 million in conjunction with the acquisition of Orderman, bearing interest at approximately 2.50%, which were repaid in the third quarter of 2009. In the fourth quarter of 2008, the Company entered into an additional research and development loan with the Austrian government in the amount of $0.7 million, bearing interest at approximately 2.50%. As of December 31, 2009, $0.6 million had been drawn on this loan. This loan matures on March 31, 2013.
In the second quarter of 2008, the Company assumed approximately $0.3 million for two promissory notes in conjunction with the acquisition of Hospitality EPoS. The notes were held by the Bank of Scotland, and the interest was approximately 7.50%. The notes were paid in full during the fourth quarter of 2008.
In the fourth quarter of 2005, the Company issued approximately $4.1 million in notes payable related to the acquisition of MenuLink. The interest on the notes was calculated based on the prime rate, and payments for both principal and interest were made in equal installments over a 36-month period. The notes were paid in full during the fourth quarter of 2008.
In the second quarter of 2005, the Company entered into an amended and restated promissory note in the amount of $1.5 million with the previous shareholders of Aloha Technologies, Inc., acquired by the Company in January 2004. During the fourth quarter of 2005, the Company modified the amended promissory note by reducing the $1.5 million principal amount to approximately $1.0 million. The decrease was the result of agreed upon purchase price adjustments. The principal on this note was originally agreed to be paid over the course of the third and fourth quarters of 2008 and the first quarter of 2009, but was paid in full during the first quarter of 2008 in conjunction with the execution of the JPM Credit Agreement.
61
Table of Contents
RADIANT SYSTEMS, INC. AND SUBSIDIARIES
NOTES TO CONSOLIDATED FINANCIAL STATEMENTS—(Continued)
The following is a summary of long-term debt and the related balances as of December 31, 2009 and 2008 (in thousands):
| Description of Debt |
2009 | 2008 | ||||
| Revolving credit loan under the JPM Credit Agreement bearing interest at LIBOR/prime rate plus the applicable margin, as defined (1.81% as of December 31, 2009), maturing on January 2, 2013 |
$ | 42,000 | $ | 72,000 | ||
| Term loan under the JPM Credit Agreement bearing interest at LIBOR plus the applicable margin, as defined (1.81% as of December 31, 2009), maturing on January 2, 2013 |
20,000 | 26,000 | ||||
| Research and development loans from the Austrian government bearing interest at approximately 2.50%, maturing on various dates through December 31, 2013 |
626 | 466 | ||||
| Total |
62,626 | 98,466 | ||||
| Less: Current portion of long-term debt |
6,000 | 6,081 | ||||
| Long-term debt, net of current portion |
$ | 56,626 | $ | 92,385 | ||
Approximate annual maturities of notes payable that were outstanding at December 31, 2009 are as follows (in thousands):
| 2010 |
$ | 6,000 | |
| 2011 |
6,000 | ||
| 2012 |
6,000 | ||
| Thereafter |
44,626 | ||
| Balance, December 31, 2009 |
$ | 62,626 | |
62
Table of Contents
RADIANT SYSTEMS, INC. AND SUBSIDIARIES
NOTES TO CONSOLIDATED FINANCIAL STATEMENTS—(Continued)
8. OTHER CHARGES AND INCOME
Impairment Charge for Acquired Intangible Assets
During the fourth quarter of 2009, the Company recorded a non-cash impairment charge of $3.9 million to write off a portion of certain indefinite-lived intangible assets associated with the January 1, 2008 acquisition of Quest. Since the acquisition was completed, poor economic conditions have led to a decline in Quest’s revenues and future growth is now expected to be slower than originally anticipated. The write off amount is based on an estimate and could change when our valuation analysis is completed. The determination of the charge followed the Company’s annual review of its goodwill for impairment as described further in Note 6 to the consolidated financial statements.
Impairment Charge for Capitalized Software
The Company evaluates the recoverability of capitalized software development costs on an annual basis or whenever events or changes in circumstances indicate that the carrying amount of the asset may be less than its net realizable value. The Company’s annual evaluation of capitalized software development costs on January 1, 2009 resulted in an impairment charge of approximately $1.0 million during the fourth quarter of 2008.
Write-off of Third-Party Software Licenses
During the first quarter of 2009, the Company determined that it would not use certain third-party software licenses and recorded a write-off charge of $0.5 million as a result.
Severance and Restructuring Charge
During the first quarter of 2009, the Company recorded a charge of $0.7 million related to severance costs and restructuring of the organization. During the fourth quarter of 2008, the Company recorded a charge of $0.4 million related to severance and restructuring of the organization. These charges resulted from efforts to align the Company’s cost structure with its revenues in light of the severe economic downturn that began in the second half of 2008.
Sale of Land
During the fourth quarter of 2008, the Company sold an undeveloped parcel of land containing 16.7 acres for approximately $4.2 million. The sale resulted in cash proceeds equal to approximately $3.9 million and the recognition of a net gain of $1.4 million.
Sale of Building
During the first quarter of 2009, the Company sold a building for cash proceeds of approximately $0.2 million. A net gain of approximately $0.1 million was recognized as a result of this transaction.
Lease Restructuring Charges – Brookside II Building, Alpharetta, Georgia
During the third quarter of 2008, Radiant amended a sublease agreement for certain facilities located in Alpharetta, Georgia in order to reduce future operating costs. In accordance with FASB ASC Topic 420, Exit or Disposal Cost Obligations (“ASC 420”), the Company recorded a lease restructuring charge based on the fair value of the remaining lease payments at the amendment date less the estimated sublease rentals that could reasonably be obtained from the property. The restructuring charges were not attributable to any of the Company’s reportable segments.
This amendment resulted in a restructuring charge of approximately $2.1 million in the third quarter of 2008, which consisted of $1.3 million for construction allowance and $0.4 million of lease restructuring reserves, and $0.4 million of sub-lease commissions associated with the amendment to the sublease. As of December 31, 2009, approximately $0.4 million related to the lease commitments remained in the restructuring reserve to be paid. The Company anticipates the remaining payments will be made by the first quarter of 2013 (lease expiration). The table below summarizes the activity in the restructuring reserve (in thousands):
| Short-Term | Long-Term | Total | ||||||||||
| Balance, December 31, 2008 |
$ | 847 | $ | 401 | $ | 1,248 | ||||||
| Construction allowance payments |
(625 | ) | — | (625 | ) | |||||||
| Payments charged against restructuring reserve |
(39 | ) | (168 | ) | (207 | ) | ||||||
| Balance, December 31, 2009 |
$ | 183 | $ | 233 | $ | 416 | ||||||
63
Table of Contents
RADIANT SYSTEMS, INC. AND SUBSIDIARIES
NOTES TO CONSOLIDATED FINANCIAL STATEMENTS—(Continued)
Lease Restructuring Charges – Alexander Building, Alpharetta, Georgia
During the third quarter of 2005, the Company decided to consolidate certain facilities located in Alpharetta, Georgia in order to reduce future operating costs. This resulted in the abandonment of one facility, which formerly housed the Company’s customer support call center. The restructuring charges were not attributable to any of the Company’s reportable segments. In accordance with ASC 420, the Company recorded a lease restructuring charge based on the fair value of the remaining lease payments at the abandonment date less the estimated sublease rentals that could reasonably be obtained from the property.
This consolidation resulted in a restructuring charge of approximately $1.5 million in the third quarter of 2005, which consisted of $1.2 million for facility consolidations and $0.3 million of fixed asset write-offs associated with the facility consolidation. As of December 31, 2009, approximately $0.2 million related to the lease commitments remained in the restructuring reserve to be paid. The Company anticipates the remaining payments will be made by the fourth quarter of 2010 (lease expiration). The table below summarizes the activity in the restructuring reserve (in thousands):
| Short-Term | Long-Term | Total | ||||||||||
| Balance, December 31, 2008 |
$ | 182 | $ | 154 | $ | 336 | ||||||
| Payments charged against restructuring reserve |
(2 | ) | (154 | ) | (156 | ) | ||||||
| Balance, December 31, 2009 |
$ | 180 | $ | — | $ | 180 | ||||||
Financing Costs Related to Long-Term Debt
Costs associated with obtaining long-term debt are deferred and amortized over the term of the related debt. The Company incurred financing costs in 2005 related to the Wells Fargo Foothill, Inc. senior secured credit facility (the “WFF Credit Agreement”), and other long-term debt agreements. The costs were deferred and were being amortized over three years. In conjunction with the termination of the WFF Credit Agreement, as described in Note 7, a write-off of the remaining financing costs and early termination penalties resulted in a charge of approximately $0.4 million in the first quarter of 2008.
Forward Exchange Contracts
The Company records derivatives, namely foreign exchange contracts, on the balance sheet at fair value. The gains or losses on foreign currency forward contracts are recorded in the accompanying consolidated statements of operations. The Company does not use derivative financial instruments for speculative or trading purposes, nor does it hold or issue leveraged derivative financial instruments. The Company recognized a gain during the second quarter of 2008 of approximately $0.5 million related to a forward exchange contract in conjunction with the acquisition of Orderman. The Company recognized a gain during the first quarter of 2008 of approximately $0.3 million related to a foreign exchange contract in conjunction with the acquisition of Quest. The Company recognized a gain of approximately $0.8 million during the fourth quarter of 2007 related to a forward exchange contract in conjunction with the acquisition of Quest.
Due Diligence Costs
During the second quarter of 2007, the Company wrote off $1.2 million in accounting, tax and legal due diligence fees in connection with the termination of proposed acquisitions. The Company determined that such acquisitions would not take place.
9. ACCRUED LIABILITIES
The components of accrued liabilities at December 31, 2009 and 2008 are as follows (in thousands):
| 2009 | 2008 | |||||
| Accrued wages, benefits and related taxes |
$ | 2,748 | $ | 2,802 | ||
| Accrued professional services |
2,669 | 2,251 | ||||
| Bonus and external/internal commissions payable |
9,900 | 6,291 | ||||
| Other accrued liabilities |
8,145 | 5,859 | ||||
| $ | 23,462 | $ | 17,203 | |||
64
Table of Contents
RADIANT SYSTEMS, INC. AND SUBSIDIARIES
NOTES TO CONSOLIDATED FINANCIAL STATEMENTS—(Continued)
10. INCOME TAXES
The following summarizes the components of the income tax provision (in thousands):
| Year ended December 31, | ||||||||||
| 2009 | 2008 | 2007 | ||||||||
| Current taxes: |
||||||||||
| Federal |
$ | 3,132 | $ | 2,093 | $ | 3,17 | ||||
| State |
790 | 707 | 339 | |||||||
| Foreign |
798 | 1,990 | 480 | |||||||
| Deferred taxes |
2,100 | 1,265 | 4,986 | |||||||
| Income tax provision |
$ | 6,820 | $ | 6,055 | $ | 8,822 | ||||
Our domestic and foreign (loss) income from continuing operations before income taxes is as follows (in thousands):
| Year ended December 31, | |||||||||||
| 2009 | 2008 | 2007 | |||||||||
| U.S. |
$ | 24,357 | $ | 11,661 | $ | 19,093 | |||||
| Foreign |
(26,935 | ) | 5,422 | 1,572 | |||||||
| $ | (2,578 | ) | $ | 17,083 | $ | 20,665 | |||||
The total tax provision is different from the amount that would have been recorded by applying the U.S. statutory federal income tax rate to income from continuing operations before taxes. Reconciliation of these differences is as follows:
| Year ended December 31, | |||||||||
| 2009 | 2008 | 2007 | |||||||
| Statutory federal tax rate |
35 | % | 35 | % | 35 | % | |||
| State income taxes, net of federal tax benefit |
(20.3 | ) | 1.9 | 1.9 | |||||
| Foreign taxes |
(25.2 | ) | (4.3 | ) | 1.0 | ||||
| Meals and entertainment |
(5.1 | ) | 1.1 | 0.5 | |||||
| Valuation allowance on deferred tax assets |
(244.4 | ) | 2.3 | (0.2 | ) | ||||
| Rate change |
2.2 | 0.1 | (1.5 | ) | |||||
| Increase in tax contingencies |
2.2 | (0.1 | ) | 0.3 | |||||
| Goodwill impairment |
(28.1 | ) | 0.0 | 0.0 | |||||
| Research and development |
1.9 | 0.0 | 0.0 | ||||||
| Foreign expenses |
(6.1 | ) | 0.0 | 0.0 | |||||
| Manufacturing deduction |
12.2 | 0.0 | 0.0 | ||||||
| Prior period items |
8.0 | 0.0 | 0.0 | ||||||
| Incentive stock option compensation |
(0.9 | ) | 0.0 | 1.2 | |||||
| Other |
4.0 | (0.6 | ) | 4.5 | |||||
| (264.6 | )% | 35.4 | % | 42.7 | % | ||||
65
Table of Contents
RADIANT SYSTEMS, INC. AND SUBSIDIARIES
NOTES TO CONSOLIDATED FINANCIAL STATEMENTS—(Continued)
The components of the deferred income tax assets and (liabilities) as of December 31, 2009 and 2008 are as follows (in thousands):
| December 31, | ||||||||
| 2009 | 2008 | |||||||
| Deferred income tax assets: | ||||||||
| Inventory reserve |
$ | 1,995 | $ | 2,256 | ||||
| Allowance for doubtful accounts |
1,520 | 1,733 | ||||||
| Depreciation |
555 | 1,250 | ||||||
| ASC 718 expense – non qualified options |
4,447 | 3,050 | ||||||
| Accrued expenses |
1,431 | 852 | ||||||
| Deferred rent |
732 | 838 | ||||||
| Net operating loss carryforward |
1,901 | 938 | ||||||
| Research credit |
— | 972 | ||||||
| State credit |
374 | 391 | ||||||
| Foreign tax credit |
577 | 465 | ||||||
| Alternative minimum tax credit |
— | 281 | ||||||
| Quest goodwill and intangible asset impairment |
5,650 | — | ||||||
| Other |
2,244 | 3,270 | ||||||
| Gross deferred income tax assets |
21,426 | 16,296 | ||||||
| Valuation allowance |
(7,623 | ) | (1,022 | ) | ||||
| Total deferred income tax assets, net | $ | 13,803 | $ | 15,274 | ||||
| Deferred income tax liabilities: | ||||||||
| Goodwill and intangible assets |
(11,055 | ) | (10,358 | ) | ||||
| Net deferred income tax asset |
$ | 2,748 | $ | 4,916 | ||||
Our deferred income tax assets and liabilities at December 31, 2009 and 2008, are included in the accompanying consolidated balance sheets as follows (in thousands):
| December 31, | ||||||||
| 2009 | 2008 | |||||||
| Current deferred income tax assets |
$ | 5,690 | $ | 7,982 | ||||
| Deferred income tax assets, non-current |
1,323 | — | ||||||
| Deferred income tax liabilities, non-current |
(4,265 | ) | (3,066 | ) | ||||
| Net deferred income tax assets |
$ | 2,748 | $ | 4,916 | ||||
At December 31, 2009, the Company had state net operating loss carryforwards of approximately $8.2 million and foreign net operating loss carryforwards of approximately $6.3 million. At December 31, 2008, the Company had state net operating loss carryforwards of approximately $8.9 million and foreign net operating loss carryforwards of approximately $2.0 million. Certain tax loss carryforwards (if not utilized against taxable income) expire from 2013 to 2028. Certain other net operating losses carryforward indefinitely.
In addition, the Company has research and development, state, foreign, and alternative minimum tax credits available to offset future taxes payable. The amounts at December 31, 2009 totaled approximately $1.0 million, $0.4 million, $0.6 million and $0.5 million, respectively. The amounts at December 31, 2008 included research and development, state, foreign and alternative minimum tax credits totaling approximately $3.1 million, $0.4 million, $0.5 million and $0.5 million, respectively. The research and development tax credits expire between 2012 and 2014. The state tax credits and foreign tax credits expire between 2010 and 2011 and 2012 and 2013, respectively. The alternative minimum tax credits carryforward indefinitely.
The Company uses the “with-and-without” or “incremental” approach for ordering tax benefits derived from the share-based payment awards. Using the with-and-without approach, actual income taxes payable for the period are compared to the amount of tax payable that would have been incurred absent the deduction for employee share-based payments in excess of the amount of compensation cost recognized for financial reporting. As a result of this approach, tax net operating loss carryforwards and other deferred tax assets not generated from share-based payments in excess of cost recognized for financial reporting are considered utilized before the current period’s share-based deduction.
The Company has excess tax benefits related to current and prior year stock option exercises subsequent to the adoption of ASC 718, of approximately $14.7 million, of which approximately $4.6 million and $5.5 million have not been recorded as a deferred tax asset as of December 31, 2009 and 2008, respectively, as the amounts have not yet resulted in a reduction in current taxes payable. The benefit of these deductions will be recorded to additional paid-in-capital at the time the excess tax benefit results in a reduction of current taxes payable.
A valuation allowance is recorded when it is more likely than not that some portion or all of the deferred tax assets will not be realized. The ultimate realization of the deferred tax assets depends on the ability of the Company to generate sufficient taxable income of the appropriate character in the future and in the appropriate taxing jurisdictions. As of December 31, 2009 and 2008, the Company’s valuation allowance, established for the tax benefit that may not be realized, totaled approximately $7.6 million and $1.0 million, respectively. At December 31, 2009, the valuation allowance related to state and foreign tax credit carryforwards of approximately $0.4 million and $0.6 million, respectively, and $6.6 million of valuation allowance related to the amortization and impairment of Australian intangibles and goodwill. At December 31, 2008, the valuation allowance related to foreign tax credits and amortization of Australian intangibles of approximately $0.5 million each.
66
Table of Contents
RADIANT SYSTEMS, INC. AND SUBSIDIARIES
NOTES TO CONSOLIDATED FINANCIAL STATEMENTS—(Continued)
U.S. income and foreign withholding taxes have not been provided for cumulative undistributed earnings of foreign subsidiaries and equity investees. The Company intends to reinvest these earnings for the foreseeable future. If these amounts were distributed to the U.S., in the form of dividends or otherwise, or if the shares of the relevant foreign subsidiaries were sold or otherwise transferred, we would be subject to additional U.S. income taxes (subject to an adjustment for foreign tax credits) and foreign withholding taxes. Determination of the amount of unrecognized deferred income tax liability related to these earnings or investments is not practicable.
The Company adopted the alternative transition method provided in FASB ASC Subtopic 718-740, Compensation—Stock Compensation—Income Taxes (“ASC 718-740”), for calculating the tax effects of stock-based compensation. The alternative transition method includes simplified methods to establish the beginning balance of the additional paid-in capital pool (“APIC pool”) related to the tax effects of employee stock-based compensation, and to determine the subsequent APIC pool and consolidated statement of cash flows of the tax effects of employee stock-based compensation awards that were outstanding upon adoption of ASC 718-740. Using this methodology, we had no beginning balance in the APIC pool.
Including the cumulative effect increase, at the end of 2009, the Company had approximately $2.3 million of total gross unrecognized tax benefits. The Company does not expect that the amount of unrecognized tax benefits will change significantly within the next 12 months. The total amount of unrecognized tax benefit that, if recognized, would affect the effective tax rate is approximately $1.6 million, $1.4 million and $1.5 million, including interest and penalties, for the periods ended December 31, 2009, 2008 and 2007, respectively.
The following reconciliation summarizes the total gross unrecognized tax benefits (in thousands):
| Year ended December 31, | |||||||||||
| 2009 | 2008 | 2007 | |||||||||
| Beginning Balance |
$ | 2,424 | $ | 2,291 | $ | 2,291 | |||||
| Gross change tax positions of current period |
— | 198 | — | ||||||||
| Gross change for tax positions of prior year |
— | — | — | ||||||||
| Settlements with taxing authorities |
— | — | — | ||||||||
| Lapse of statute of limitations |
(80 | ) | (65 | ) | — | ||||||
| Ending balance |
$ | 2,344 | $ | 2,424 | $ | 2,291 | |||||
The Company and its subsidiaries are subject to U.S. federal income tax as well as income tax of multiple state and foreign jurisdictions. For U.S. federal and most state jurisdictions, tax years 1997 and after are open for examination primarily due to net operating losses and other tax attribute carryforwards. Foreign tax years are open for examination as follows: Austria – 2006 and after; Australia – 2005 and after; China – 2008; Luxembourg – 2008; and the United Kingdom – 2008. The Company is not currently under examination by any income taxing jurisdiction.
The Company’s continuing practice is to recognize interest and/or penalties related to income tax matters in income tax expense. The Company has accrued approximately $0.5 million and $0.4 million in interest associated with uncertain tax positions for the periods ended December 31, 2009 and 2008, respectively.
67
Table of Contents
RADIANT SYSTEMS, INC. AND SUBSIDIARIES
NOTES TO CONSOLIDATED FINANCIAL STATEMENTS—(Continued)
11. COMMITMENTS AND CONTINGENCIES
Leases
The Company leases office space, equipment and certain vehicles under noncancelable operating lease agreements expiring on various dates through 2017. Total rent expense under operating leases was approximately $5.1 million, $5.4 million and $4.8 million for the years ended December 31, 2009, 2008 and 2007, respectively. The Company leases various equipment under capital leases that expire on various dates through December 2012. Aggregate future minimum lease payments under the capital leases, noncancelable operating leases in effect as of December 31, 2009, and noncancelable operating leases which commenced subsequent to December 31, 2009, are as follows (in thousands):
| Capital | Operating | |||||
| 2010 |
$ | 925 | $ | 5,561 | ||
| 2011 |
449 | 4,640 | ||||
| 2012 |
146 | 4,714 | ||||
| 2013 |
16 | 2,721 | ||||
| 2014 |
— | 2,417 | ||||
| Thereafter |
— | 4,725 | ||||
| Total |
$ | 1,536 | $ | 24,778 | ||
| Less: Amount representing interest |
118 | |||||
| Net present value of minimum lease payments |
1,418 | |||||
| Less: Current portion of capital lease |
842 | |||||
| Long-term portion of capital lease obligation |
$ | 576 | ||||
The schedule above includes the future minimum lease payments related to facilities that are being subleased. The total minimum rentals to be received in the future under noncancelable subleases as of December 31, 2009 are approximately $1.9 million in 2010, $1.5 million in 2011, $1.5 million in 2012 and $0.1 million in 2013.
Employment Agreements
The Company has certain contractual obligations related to individuals who are employees of the Company and/or its subsidiaries. A summary of these obligations is as follows:
| • | All regular non-U.S. personnel are employed under written contracts as is customary in the countries where we have operations outside the U.S. |
| • | Five individuals in the U.S. have written employment agreements that expire at various dates through mid-2011. Termination prior to the expiration of such agreements may (depending on the reason for termination) require the Company to incur severance expenses related to the termination. |
| • | Four individuals outside the U.S. have non-standard employment agreements that expire in mid-2010. The special provisions of these agreements stipulate that neither the Company nor the employee will terminate employment prior to their expiration. |
Legal Matters
Radiant is and has been involved in legal proceedings arising in the normal course of business. Management is of the opinion, based upon presently available information and the advice of counsel concerning pertinent legal matters, that any resulting liability should not have a material adverse effect on the Company’s financial position, results of operations or cash flows.
Purchase Commitments
The Company has entered into certain noncancelable purchase orders for manufacturing supplies to be used in its normal operations. The aggregate anticipated payments related to these purchase orders are approximately $10.8 million in 2010.
68
Table of Contents
RADIANT SYSTEMS, INC. AND SUBSIDIARIES
NOTES TO CONSOLIDATED FINANCIAL STATEMENTS—(Continued)
12. SHAREHOLDERS’ EQUITY
Treasury Stock
Over the course of the history of the Company, the Board of Directors has authorized a stock repurchase program. This program has been renewed several times by the Board of Directors, and the Company has repurchased and subsequently retired approximately 4.1 million shares of its common stock, for total consideration of approximately $35.0 million under the repurchase program. In 2007, the Board of Directors of the Company authorized a re-commencement of the Company’s stock repurchase program, authorizing the repurchase of up to 1.0 million shares at a price not to exceed $25.00 per share through November 2009. The Company did not repurchase any shares under its repurchase program during the years ended December 31, 2009, 2008 or 2007.
Preferred Stock
In January 1997, the Company authorized 5,000,000 shares of preferred stock with no par value. The Company’s Board of Directors has the authority to issue these shares and to fix dividends, voting and conversion rights, redemption provisions, liquidation preferences and other rights and restrictions.
69
Table of Contents
RADIANT SYSTEMS, INC. AND SUBSIDIARIES
NOTES TO CONSOLIDATED FINANCIAL STATEMENTS—(Continued)
13. EMPLOYEE BENEFITS
Stock-Based Compensation Plans
Employee Stock Purchase Plan
During 1998, the Company’s Board of Directors adopted, with shareholder approval, the 1998 Employee Stock Purchase Plan (the “ESPP”). Under the ESPP, the Company is authorized to issue up to 2,500,000 shares of Radiant’s common stock to its qualified employees, who originally were eligible to purchase shares at 85% of the appropriate market price every six months. Originally, the purchase price of the stock was the lower of the market price in effect on the day the offering started or the day the offering terminated. The ESPP was suspended on December 31, 2005 in an effort to reduce future stock compensation expense. The Company reinstated the ESPP during 2006 on terms that permit employees to purchase Radiant common stock at the end of each quarter at 95% of the market price on the last day of the quarter. Based on these terms, the reinstated ESPP will not result in any future stock compensation expense.
In 2009, 2008 and 2007, the Company issued approximately 31,000 shares, 28,000 shares and 9,000 shares under the ESPP at an average price of $7.36, $6.16, and $14.15 per share, respectively. As of December 31, 2009, there were approximately 932,000 shares available for future issuance under the ESPP.
Directors Stock Option Plan
During 1997, the Company’s Board of Directors adopted, with shareholder approval, the Non-Management Directors’ Stock Option Plan (the “Directors’ Plan”) for non-management directors of the Company, under which the Company could grant options to purchase up to 150,000 shares of Radiant’s common stock to nonemployee directors of the Company. Options were granted at an exercise price, not less than fair value as referenced to quoted market prices. Initial grants to new directors were exercisable over three years, while annual grants were exercisable six months after the grant date. Options granted under the Directors’ Plan expire ten years from the date of grant. During 2002, the Directors’ Plan was amended to increase the number of options available for grant to 300,000 shares, as well as to increase the grant to a non-employee director upon initial appointment to 25,000 from 15,000 and the annual grant to 10,000 from 5,000. The Company has not granted any options under this plan during the last three years. As of December 31, 2009, the Company has granted approximately 335,000 options under the Directors’ Plan, of which 37,500 have been exercised and 62,500 have been cancelled. This plan was replaced with the Amended and Restated 2005 Long-Term Incentive Plan, described below.
1995 Stock Option Plan
The Company’s 1995 Stock Option Plan (the “1995 Plan”), as amended, was approved by shareholders and authorized the issuance of up to 13,000,000 incentive and nonqualified stock options to key employees. Options were granted at an exercise price not less than fair value as determined by the Board of Directors and became exercisable as determined by the Board of Directors, generally over a period of four to five years. Options granted under the 1995 Plan expire ten years from the date of grant. This plan was replaced with the Amended and Restated 2005 Long-Term Incentive Plan, described below.
Amended and Restated 2005 Long-Term Incentive Plan
Effective April 25, 2005, the Amended and Restated 2005 Long-Term Incentive Plan (“LTIP”) was adopted by the Company’s Board of Directors and subsequently approved by shareholders. The LTIP replaced both the 1995 Plan and the Directors’ Plan and became the only plan for providing stock-based incentive compensation to directors and employees of the Company, other than the ESPP, which remains in effect. Options previously granted under the 1995 Plan and the Directors’ Plan remain exercisable in accordance with the terms of the respective plans. The LTIP provides for the grant of incentive stock options, non-qualified stock options, stock appreciation rights, restricted stock, performance units and phantom stock. The LTIP previously authorized the issuance of up to 2,500,000 shares of the Company’s common stock and the maximum that may be granted in the form of stock options and stock appreciation rights to any one employee in any calendar year is 250,000. During 2008, the LTIP was amended to increase the number of shares available for issuance under the LTIP to 4,500,000 shares. No grants may be made under the LTIP subsequent to April 24, 2015. As of December 31, 2009, the Company has granted awards for the issuance of 3,750,881 shares under the LTIP, of which 44,251 have been exercised and 213,382 shares have been cancelled.
Employee Savings Plan
The Company has a 401(k) profit-sharing plan (the “401(k) Plan”) available to all employees of the Company who have attained age 21. The 401(k) Plan includes a salary deferral arrangement pursuant to which employees may contribute a minimum of 1% and a maximum of 80% of their salary on a pretax basis, up to $16,500 in 2009. If an employee is age 50 or older, they may be eligible for a catch-up contribution of up to $5,500 in 2009. The Company may make both matching and additional contributions at the discretion of the Company’s Board of Directors. The Company made contributions of approximately $0.1 million, $1.6 million and $1.4 million during 2009, 2008 and 2007, respectively. Effective January 1, 2009, the Company temporarily suspended its matching contributions to the 401(k) Plan in an effort to reduce operating costs.
70
Table of Contents
RADIANT SYSTEMS, INC. AND SUBSIDIARIES
NOTES TO CONSOLIDATED FINANCIAL STATEMENTS—(Continued)
The following table sets forth the range of exercise prices, number of shares, weighted average exercise price and remaining contractual lives by groups of similar price and grant date for stock options outstanding as of December 31, 2009 (in thousands, except weighted average price and remaining contractual life):
| Options Outstanding | Weighted Average Remaining Contractual Life (Years) |
Options Exercisable | ||||||||||
| Range of Exercise Price |
Number of Shares |
Weighted Average Exercise Price |
Number of Shares |
Weighted Average Exercise Price | ||||||||
| $3.25 - $4.66 |
1,553 | $ | 3.99 | 5.10 | 941 | $ | 4.44 | |||||
| $5.23 - $9.33 |
1,469 | 7.26 | 2.74 | 1,454 | 7.24 | |||||||
| $9.35 - $12.94 |
1,179 | 11.63 | 2.86 | 857 | 11.60 | |||||||
| $13.00 - $14.38 |
1,297 | 13.86 | 2.49 | 830 | 13.60 | |||||||
| $15.27 - $45.58 |
377 | 17.20 | 2.16 | 373 | 17.21 | |||||||
| Total |
5,875 | $ | 9.37 | 4,455 | $ | 9.51 | ||||||
Securities Authorized for Issuance Under Equity Compensation Plans
The following table provides information for all equity compensation plans as of the fiscal year ended December 31, 2009, under which the equity securities of the Company were authorized for issuance (in thousands, except weighted average price):
| Number of Securities to be Issued Upon Exercise of Outstanding Options |
Weighted-Average Exercise Price of Outstanding Options |
Number of Securities Remaining Available for Future Issuance Under Equity Compensation Plans | |||||
| Equity Compensation Plans |
|||||||
| Approved by Shareholders: |
|||||||
| 1995 Stock Option Plan |
2,923 | $ | 8.21 | — | |||
| 1997 Non-Management Directors Stock Option Plan |
235 | $ | 9.66 | — | |||
| 1998 Employee Stock Purchase Plan |
— | — | 932 | ||||
| 2005 Long-Term Incentive Plan |
2,717 | $ | 10.59 | 999 | |||
| Not approved by shareholders: |
— | — | — | ||||
| Total |
5,875 | $ | 9.37 | 1,931 | |||
71
Table of Contents
RADIANT SYSTEMS, INC. AND SUBSIDIARIES
NOTES TO CONSOLIDATED FINANCIAL STATEMENTS—(Continued)
14. SEGMENT REPORTING DATA
The Company’s reportable segments were identified based on the manner in which management reviews operating results and makes decisions regarding the allocation of the Company’s resources. Each segment focuses on delivering site management systems, including point-of-sale, self-service kiosk, and back-office systems, designed specifically for each of the core vertical markets. The Company’s segments derive revenues from the sale of products, including system software and hardware, and services, including customer support, maintenance, training, custom software development, hosting and implementation services.
The Company operates in two primary segments: (i) Hospitality and (ii) Retail. The Company’s chief executive officer makes operating decisions based on information for these two segments. The accounting policies of the segments are substantially the same as those described in the summary of significant accounting policies. Management evaluates the performance of the segments based on net income or loss before the allocation of certain central costs. A summary of the key measures for the Company’s reportable segments is as follows (in thousands):
| For the year ended December 31, 2009 | ||||||||||||
| Hospitality | Retail | All Other | Total | |||||||||
| Revenues |
$ | 215,716 | $ | 68,771 | $ | 2,981 | $ | 287,468 | ||||
| Amortization of intangible assets |
6,504 | 2,529 | 232 | 9,265 | ||||||||
| Product development |
14,647 | 3,825 | — | 18,472 | ||||||||
| Net income before allocation of central costs |
16,738 | 15,142 | 81 | 31,961 | ||||||||
| Goodwill |
83,098 | 24,721 | — | 107,819 | ||||||||
| Other identifiable assets |
116,990 | 19,948 | 1,296 | 138,234 | ||||||||
| For the year ended December 31, 2008 | ||||||||||||
| Hospitality | Retail | All Other | Total | |||||||||
| Revenues |
$ | 225,014 | $ | 73,053 | $ | 3,509 | $ | 301,576 | ||||
| Amortization of intangible assets |
5,350 | 2,317 | 235 | 7,902 | ||||||||
| Product development |
16,707 | 4,413 | — | 21,120 | ||||||||
| Net income before allocation of central costs |
36,762 | 10,549 | — | 47,311 | ||||||||
| Goodwill |
91,522 | 23,707 | — | 115,229 | ||||||||
| Other identifiable assets |
105,666 | 23,729 | 1,340 | 130,735 | ||||||||
| For the year ended December 31, 2007 | ||||||||||||
| Hospitality | Retail | All Other | Total | |||||||||
| Revenues |
$ | 170,512 | $ | 80,518 | $ | 2,168 | $ | 253,198 | ||||
| Amortization of intangible assets |
2,000 | 2,283 | 18 | 4,301 | ||||||||
| Product development |
13,632 | 4,410 | — | 18,042 | ||||||||
| Net income before allocation of central costs |
35,607 | 17,087 | — | 52,694 | ||||||||
| Goodwill |
37,751 | 24,635 | — | 62,386 | ||||||||
| Other identifiable assets |
58,190 | 36,817 | 1,169 | 96,176 | ||||||||
72
Table of Contents
RADIANT SYSTEMS, INC. AND SUBSIDIARIES
NOTES TO CONSOLIDATED FINANCIAL STATEMENTS—(Continued)
The reconciliation of product development expense allocated to reportable segments to total product development expense for the years ended December 31, 2009, 2008 and 2007, is as follows (in thousands):
| December 31, | ||||||||||||
| 2009 | 2008 | 2007 | ||||||||||
| Product development expense for reportable segments |
$ | 18,472 | $ | 21,120 | $ | 18,042 | ||||||
| Indirect product development expenses unallocated |
3,873 | 3,674 | 5,395 | |||||||||
| Product development expense |
$ | 22,345 | $ | 24,794 | $ | 23,437 | ||||||
| The reconciliation of net income before the allocation of central costs from reportable segments to net income (loss) for the years ended December 31, 2009, 2008 and 2007, is as follows (in thousands): | ||||||||||||
| December 31, | ||||||||||||
| 2009 | 2008 | 2007 | ||||||||||
| Net income for reportable segments |
$ | 31,961 | $ | 47,311 | $ | 52,694 | ||||||
| Central corporate expenses unallocated |
(41,359 | ) | (36,283 | ) | (40,851 | ) | ||||||
| Net (loss) income |
$ | (9,398 | ) | $ | 11,028 | $ | 11,843 | |||||
The reconciliation of other identifiable assets to total assets as of December 31, 2009 and 2008, is as follows (in thousands):
| December 31, | ||||||
| 2009 | 2008 | |||||
| Other identifiable assets for reportable segments |
$ | 138,234 | $ | 130,735 | ||
| Goodwill for reportable segments |
107,819 | 115,229 | ||||
| Central corporate assets unallocated |
42,544 | 57,578 | ||||
| Total assets |
$ | 288,597 | $ | 303,542 | ||
Revenues not associated with the Company’s Hospitality and Retail segments are comprised of revenues from hardware sales outside the Company’s segments.
The Company distributes its technology both within the United States of America and internationally. Revenues derived from within the United States of America were approximately $240.9 million, $259.1 million and $219.7 million for the years ended December 31, 2009, 2008 and 2007, respectively. The Company currently has international offices in Australia, Austria, China, Czech Republic, Singapore, Spain and the United Kingdom. We have more than 600 international resellers who market and support one or more of our product lines in Africa, Asia, Australia, Europe, Latin America, the Middle East and South America. Geographic revenue information is based on the location of the selling entity. Revenues derived from international sources were approximately $46.6 million, $42.5 million and $33.5 million for the years ended December 31, 2009, 2008 and 2007, respectively. At December 31, 2009 and 2008, the Company had international identifiable assets, including goodwill, of approximately $101.6 million and $107.7 million, respectively, of which approximately $72.3 million and $82.0 million, respectively, are long-lived assets.
The segment reporting data presented above may not reflect actual performance and actual asset balances had each segment been a stand-alone entity. Furthermore, the segment information may not be indicative of future performance.
73
Table of Contents
RADIANT SYSTEMS, INC. AND SUBSIDIARIES
NOTES TO CONSOLIDATED FINANCIAL STATEMENTS—(Continued)
15. RELATED PARTY TRANSACTIONS
As a result of the Synchronics acquisition which occurred in the first quarter of 2006, the Company entered into a five-year lease agreement for property located in Memphis, Tennessee, which was the headquarters of Synchronics, with Jeff Goldstein Investment Partnership. Mr. Goldstein was the previous owner of Synchronics and was employed by the Company. On April 30, 2007, the Company terminated Mr. Goldstein’s employment. This termination of employment was on a mutual basis. As a result, all subsequent transactions occurring between the Company and Mr. Goldstein are no longer considered related party transactions.
16. SUPPLEMENTARY QUARTERLY FINANCIAL INFORMATION (Unaudited)
The following tables set forth certain unaudited financial data for each of the Company’s last eight calendar quarters. The information has been derived from unaudited consolidated financial statements that, in the opinion of management, reflect all adjustments (consisting only of normal recurring adjustments) necessary for a fair presentation of such quarterly information. The operating results for any quarter are not necessarily indicative of the results to be expected for any future period. Net income (loss) per share is computed independently for each of the quarters presented. As such, the summation of the quarterly amounts may not equal the total net income (loss) per share reported for the year. Results for 2008 include the results of Quest, Hospitality EPoS, Jadeon and Orderman from the related dates of acquisition (in thousands, except per share data):
| Quarter ended | |||||||||||||
| Mar 31, 2009 |
June 30, 2009 |
Sep 30, 2009 |
Dec 31, 2009 (1) |
||||||||||
| Total revenues |
$ | 67,603 | $ | 71,132 | $ | 70,940 | $ | 77,793 | |||||
| Gross profit |
31,907 | 34,463 | 33,196 | 35,953 | |||||||||
| Net income (loss) |
1,029 | 3,179 | 3,421 | (17,027 | ) | ||||||||
| Net income (loss) per share: |
|||||||||||||
| Basic |
0.03 | 0.10 | 0.10 | (0.51 | ) | ||||||||
| Diluted |
0.03 | 0.09 | 0.10 | (0.51 | ) | ||||||||
| Quarter ended | |||||||||||||
| Mar 31, 2008 |
June 30, 2008 |
Sep 30, 2008 |
Dec 31, 2008 (2) |
||||||||||
| Total revenues |
$ | 70,159 | $ | 73,772 | $ | 82,354 | $ | 75,291 | |||||
| Gross profit |
30,608 | 32,132 | 34,937 | 31,385 | |||||||||
| Net income |
3,420 | 4,046 | 1,645 | 1,917 | |||||||||
| Net income per share: |
|||||||||||||
| Basic |
0.11 | 0.13 | 0.05 | 0.06 | |||||||||
| Diluted |
0.10 | 0.12 | 0.05 | 0.06 | |||||||||
| (1) | The Company recognized a non-cash impairment charge of approximately $20.9 million ($0.63 per basic common share) related to the goodwill and certain intangible assets associated with our Quest acquisition in the fourth quarter of 2009. |
| (2) | The Company recognized a gain on the sale of land of approximately $1.4 million ($0.04 per diluted common share) in the fourth quarter of 2008. This gain was offset by a charge of approximately $0.4 million ($0.01 per diluted common share) related to severance and restructuring of the organization and a charge of approximately $1.0 million ($0.03 per diluted common share) related to impairment of a capitalized software project. |
74
Table of Contents
| ITEM 9. | CHANGES IN AND DISAGREEMENTS WITH ACCOUNTANTS ON ACCOUNTING AND FINANCIAL DISCLOSURES |
Not applicable.
| ITEM 9A. | CONTROLS AND PROCEDURES |
Evaluation of Disclosure Controls and Procedures
The Company has established disclosure controls and procedures to ensure that material information relating to the Company, including its consolidated subsidiaries, is made known to the officers who certify its financial reports and to other members of senior management and the Company’s board of directors.
Based on their evaluation as of December 31, 2009, the principal executive officer and principal financial officer of the Company have concluded that the Company’s disclosure controls and procedures (as defined in Rules 13a-15(e) and 15d-15(e) under the Securities Exchange Act of 1934) are effective to ensure that the information required to be disclosed by the Company in the reports that it files or submits under the Securities Exchange Act of 1934 (the “Act”) is recorded, processed, summarized and reported within the time periods specified in SEC rules and forms. Disclosure controls and procedures include, without limitation, controls and procedures designed to ensure that information required to be disclosed by the Company in the reports that it files or submits under the Act is accumulated and communicated to the Company’s management, including its principal executive and principal financial officers, or persons performing similar functions, as appropriate to allow timely decisions regarding required disclosure.
Management’s Report on Internal Control over Financial Reporting
The Company’s management is responsible for establishing and maintaining adequate internal control over financial reporting, as such term is defined in Exchange Act Rule 13a-15(f). The Company’s management, including its principal executive officer and principal financial officer, conducted an evaluation of the effectiveness of its internal control over financial reporting based on the framework in “Internal Control—Integrated Framework” issued by the Committee of Sponsoring Organizations of the Treadway Commission. The scope of management’s assessment of the effectiveness of internal control over financial reporting includes all of our businesses. Based on its evaluation under the framework in “Internal Control—Integrated Framework,” the Company’s management concluded that the Company’s internal control over financial reporting was effective as of December 31, 2009.
The Company’s independent registered public accounting firm, Deloitte & Touche LLP, has issued its report on the effectiveness of the Company’s internal control over financial reporting.
During the year ended December 31, 2009, there were no changes in the Company’s internal control over financial reporting that have materially affected, or are reasonably likely to materially affect, the Company’s internal control over financial reporting.
75
Table of Contents
Report of Independent Registered Public Accounting Firm
To the Board of Directors and Shareholders of
Radiant Systems, Inc.
Alpharetta, Georgia
We have audited the internal control over financial reporting of Radiant Systems, Inc. and subsidiaries (the “Company”) as of December 31, 2009, based on criteria established in Internal Control — Integrated Framework issued by the Committee of Sponsoring Organizations of the Treadway Commission. The Company’s management is responsible for maintaining effective internal control over financial reporting and for its assessment of the effectiveness of internal control over financial reporting, included in the accompanying Management’s Report on Internal Control over Financial Reporting. Our responsibility is to express an opinion on the Company’s internal control over financial reporting based on our audit.
We conducted our audit in accordance with the standards of the Public Company Accounting Oversight Board (United States). Those standards require that we plan and perform the audit to obtain reasonable assurance about whether effective internal control over financial reporting was maintained in all material respects. Our audit included obtaining an understanding of internal control over financial reporting, assessing the risk that a material weakness exists, testing and evaluating the design and operating effectiveness of internal control based on the assessed risk, and performing such other procedures as we considered necessary in the circumstances. We believe that our audit provides a reasonable basis for our opinion.
A company’s internal control over financial reporting is a process designed by, or under the supervision of, the company’s principal executive and principal financial officers, or persons performing similar functions, and effected by the company’s board of directors, management, and other personnel to provide reasonable assurance regarding the reliability of financial reporting and the preparation of financial statements for external purposes in accordance with generally accepted accounting principles. A company’s internal control over financial reporting includes those policies and procedures that (1) pertain to the maintenance of records that, in reasonable detail, accurately and fairly reflect the transactions and dispositions of the assets of the company; (2) provide reasonable assurance that transactions are recorded as necessary to permit preparation of financial statements in accordance with generally accepted accounting principles, and that receipts and expenditures of the company are being made only in accordance with authorizations of management and directors of the company; and (3) provide reasonable assurance regarding prevention or timely detection of unauthorized acquisition, use, or disposition of the company’s assets that could have a material effect on the financial statements.
Because of the inherent limitations of internal control over financial reporting, including the possibility of collusion or improper management override of controls, material misstatements due to error or fraud may not be prevented or detected on a timely basis. Also, projections of any evaluation of the effectiveness of the internal control over financial reporting to future periods are subject to the risk that the controls may become inadequate because of changes in conditions, or that the degree of compliance with the policies or procedures may deteriorate.
In our opinion, the Company maintained, in all material respects, effective internal control over financial reporting as of December 31, 2009, based on the criteria established in Internal Control — Integrated Framework issued by the Committee of Sponsoring Organizations of the Treadway Commission.
We have also audited, in accordance with the standards of the Public Company Accounting Oversight Board (United States), the consolidated financial statements and financial statement schedule as of and for the year ended December 31, 2009 of the Company and our report dated March 11, 2010 expressed an unqualified opinion on those financial statements and financial statement schedule.
| /s/ DELOITTE & TOUCHE LLP |
| Atlanta, Georgia |
| March 11, 2010 |
76
Table of Contents
| ITEM 9B. | OTHER INFORMATION |
Not applicable.
| ITEM 10. | DIRECTORS, EXECUTIVE OFFICERS AND CORPORATE GOVERNANCE |
Information required by this item will be included in our proxy statement to be used in connection with the solicitation of proxies for our 2010 annual meeting of shareholders (the “2010 Proxy Statement”) to be filed with the SEC and is incorporated herein by reference.
| ITEM 11. | EXECUTIVE COMPENSATION |
Information required by this item will be included in our 2010 Proxy Statement and is incorporated herein by reference.
| ITEM 12. | SECURITY OWNERSHIP OF CERTAIN BENEFICIAL OWNERS AND MANAGEMENT AND RELATED STOCKHOLDER MATTERS |
Information required by this item will be included in our 2010 Proxy Statement and is incorporated herein by reference. See also “Equity Compensation Plan Information” set forth in Item 5 of this annual report.
| ITEM 13. | CERTAIN RELATIONSHIPS AND RELATED TRANSACTIONS, AND DIRECTOR INDEPENDENCE |
Information required by this item will be included in our 2010 Proxy Statement and is incorporated herein by reference.
| ITEM 14. | PRINCIPAL ACCOUNTING FEES AND SERVICES |
Information required by this item will be included in our 2010 Proxy Statement and is incorporated herein by reference.
77
Table of Contents
| ITEM 15. | EXHIBITS AND FINANCIAL STATEMENT SCHEDULE |
1. Financial Statements
The following consolidated financial statements, together with the applicable reports of the independent registered public accounting firm, have been filed as Item 8 in Part II of this Report:
Report of Independent Registered Public Accounting Firm
Consolidated Balance Sheets at December 31, 2009 and 2008
Consolidated Statements of Operations for the years ended December 31, 2009, 2008 and 2007
Consolidated Statements of Shareholders’ Equity for the years ended December 31, 2009, 2008 and 2007
Consolidated Statements of Cash Flows for the years ended December 31, 2009, 2008 and 2007
Notes to Consolidated Financial Statements
2. Financial Statement Schedule
SCHEDULE II: VALUATION AND QUALIFYING ACCOUNTS
All other schedules for which provision is made in the applicable accounting regulations of the Securities and Exchange Commission are not required under the related instructions, are inapplicable, or the required information is included elsewhere in the financial statements.
SCHEDULE II
RADIANT SYSTEMS, INC. AND SUBSIDIARIES
VALUATION AND QUALIFYING ACCOUNTS
| Allowance for doubtful accounts for the year ended (in thousands) |
Balance at Beginning of Period |
Additions Charged to Operations |
Deductions | Balance at End of Period | ||||||||
| December 31, 2007 |
$ | 3,510 | $ | — | $ | 63 | $ | 3,447 | ||||
| December 31, 2008 |
3,447 | 1,615 | 692 | 4,370 | ||||||||
| December 31, 2009 |
4,370 | 446 | 984 | 3,832 | ||||||||
78
Table of Contents
The following exhibits are filed with or incorporated by reference into this report. The exhibits which are denominated by an asterisk (*) were previously filed as a part of, and are hereby incorporated by reference from (i) a Registration Statement on Form S-1 for the Registrant, Registration No. 333-17723, as amended (“2/97 S-1”), (ii) a Registration Statement on Form S-1 for the Registrant, Registration No. 333-30289 (“6/97 S-1”), (iii) a Registration Statement on Form S-8 for the Registrant, Registration No. 333-41291 (“1997 S-8”), (iv) a Registration Statement on Form S-8 for the Registrant, Registration No. 333-62157 (“1998 S-8”), (v) the Registrant’s Annual Report on Form 10-K for the year ended December 31, 1998 (“1998 10-K”), (vi) the Registrant’s Form 8-K filed October 14, 2003 (the “October 14, 2003 8-K”), (vii) the Registrant’s Form 8-K filed February 17, 2004 (the “February 17, 2004 8-K”), (viii) the Registrant’s Form 8-K filed December 15, 2003 (“December 15, 2003 8-K”), (ix) Registration Statement on Form S-8, Registration No. 333-71892 (“2001 S-8”), (x) Exhibit 12(d)(5)(i) of the Schedule to Tender Offer Statement filed by the Registrant on December 2, 2004 (“2004 Schedule TO”), (xi) the Registrant’s Form 8-K filed January 9, 2006 (the “January 9, 2006 8-K”), (xii) the Registrant’s Quarterly Report on Form 10-Q for the quarter ended June 30, 2006 (the “June 2006 10-Q”), (xiii) the Registrant’s Form 8-K filed December 17, 2007 (the “December 17, 2007 8-K”), (xiv) the Registrant’s Form 8-K filed January 8, 2008 (the “January 8, 2008 8-K”), (xv) the Registrant’s Annual Report on Form 10-K for the year ended December 31, 2006 (“2006 10-K”), (xvi) the Registrant’s Quarterly Report on Form 10-Q for the quarter ended June 30, 2008 (the “June 2008 10-Q”), (xvii) the Registrant’s Form 8-K filed June 4, 2008 (the “June 4, 2008 8-K”), (xviii) the Registrant’s Form 8-K filed July 9, 2008 (the “July 9, 2008 8-K”), (xix) Appendix A of the Registrant’s Definitive Proxy Statement filed August 22, 2008 (the “August 2008 Proxy”), (xx) the Registrant’s Form 8-K filed August 5, 2008 (the “August 5, 2008 8-K”), (xxi) the Registrant’s Annual Report on Form 10-K for the year ended December 31, 2008 (the “2008 10-K”), (xxii) the Registrant’s Form 8-K filed March 9,2009 (the “March 9, 2009 8-K”), (xxiii) the Registrant’s Quarterly Report on Form 10-Q for the quarter ended March 31, 2009 (the “March 2009 10-Q”), (xxiv) the Registrant’s Quarterly Report on Form 10-Q for the quarter ended June 30, 2009 (the “June 2009 10-Q”) and (xxv) a Registration Statement on Form S-3 for the Registrant, Registration No. 333-162309 (the “2009 S-3”).
| Exhibit Number |
Description of Exhibit | |
| *2.1 | Asset Purchase Agreement, dated December 12, 2005, by and among Radiant Systems, Inc., Synchronics, Inc. and Jeff Goldstein (January 9, 2006 8-K) | |
| *2.1.1 | Amendment No. 1 to Asset Purchase Agreement, dated January 3, 2006 (June 2006 10-Q) | |
| *2.2 | Share Purchase Agreement, dated December 11, 2007, by and among Radiant Systems, Inc., Quest Retail Technology Pty Ltd, and David Brown (December 17, 2007 8-K) | |
| *2.2.1 | First Amendment to Share Purchase Agreement, dated as of January 4, 2008, by and among Radiant Systems, Inc., RADS Australia Holdings Pty Ltd, Quest Retail Technology Pty Ltd, and David Brown (January 8, 2008 8-K) | |
| *2.3 | Stock Purchase Agreement dated as of July 3, 2008, by and among Radiant Systems GmbH, Orderman GmbH, Alois Eisl, Franz Blatnik, Gottfried Kaiser, and Ing. Katamay (July 9, 2008 8-K) | |
| *3.1 | Amended and Restated Articles of Incorporation (2/97 S-1) | |
| *3.2 | Articles of Amendment to the Amended and Restated Articles of Incorporation (2009 S-3) | |
| *3.3 | Amended and Restated Bylaws (2/97 S-1) | |
| *4.1 | Specimen Certificate of Common Stock (2/97 S-1) | |
| *4.2 | Credit Agreement, dated as of January 2, 2008, by and among Radiant Systems, Inc., the Lenders party thereto, and JP Morgan Chase Bank, N.A. (January 8, 2008 8-K) | |
| *4.2.1 | Amendment No. 1 dated as of June 30, 2008 to the Credit Agreement dated as of January 2, 2008, by and among Radiant Systems, Inc., the Lenders party thereto, and JPMorgan Chase Bank, N.A., as administrative agent (June 2008 10-Q) | |
| *4.2.2 | Amendment No. 2 dated as of July 31, 2008 to the Credit Agreement dated as of January 2, 2008, by and among Radiant Systems, Inc., the Lenders party thereto, and JPMorgan Chase Bank, N.A., as administrative agent (August 5, 2008 8-K) | |
| *4.2.3 | Amendment No. 3 dated as of February 17, 2009 to the Credit Agreement dated as of January 2, 2008, by and among Radiant Systems, Inc., the Lenders party thereto, and JPMorgan Chase Bank, N.A., as administrative agent (June 2009 10-Q) | |
| *10.1 | Form of License, Support and Equipment Purchase Agreement (2/97 S-1) | |
| *10.2 | Amended and Restated 1995 Stock Option Plan (2/97 S-1) | |
| *10.2.1 | Amendment No. 1 to Amended and Restated 1995 Stock Option Plan (1997 S-8) | |
| *10.2.2 | Amendment No. 2 to Amended and Restated 1995 Stock Option Plan (1998 S-8) | |
| *10.2.3 | Amendment No. 3 to Amended and Restated 1995 Stock Option Plan (2001 S-8) | |
| *10.2.4 | Form of Option Agreement under 1995 Stock Option Plan (2004 Schedule TO) | |
| *10.3 | Lease Agreement dated October 7, 1997, by and between Weeks Realty, L.P. and the Registrant for lease of office space in Alpharetta, Georgia (Brookside Parkway) (1998 10-K) | |
| *10.3.1 | First Amendment to Lease Agreement dated April 3, 1998, by and between Weeks Realty, L.P. and the Registrant for lease of office space in Alpharetta, Georgia (Brookside Parkway) (1998 10-K) | |
79
Table of Contents
| Exhibit Number |
Description of Exhibit | |
| *10.3.2 | Second Amendment to Lease Agreement dated September 1998, by and between Weeks Realty, L.P. and the Registrant for lease of office space in Alpharetta, Georgia (Brookside Parkway) (1998 10-K) | |
| *10.4 | Lease Agreement dated November 11, 1997 by and between Meadows Industrial, LLC and the Registrant for lease of office space in Alpharetta, Georgia (Shiloh Road) (1998 10-K) | |
| *10.4.1 | First Amendment to Lease Agreement dated August 14, 1998 by and between Meadows Industrial, LLC and the Registrant for lease of office space in Alpharetta, Georgia (Shiloh Road) (1998 10-K) | |
| *10.5 | Amended and Restated 2005 Long-Term Incentive Plan (2008 10-K) | |
| *10.6 | Amendment to Amended and Restated 2005 Long-Term Incentive Plan (August 2008 Proxy) | |
| *10.7 | Office Lease Agreement, dated September 16, 2005, by and between Radiant Systems, Inc. and Centreport Trinity, Ltd. (2006 10-K) | |
| *10.8 | Radiant Lease Agreement for 1727 Kirby Parkway, dated January 3, 2006, by and between Radiant Systems, Inc. and Jeff Goldstein Investment Partnership (2006 10-K) | |
| *10.9 | Non-Management Directors’ Stock Option Plan (6/97 S-1) | |
| *10.10 | Registration Rights Agreement, dated January 13, 2004 (January 23, 2004 8-K) | |
| *10.11 | Reseller and Services Agreement, dated January 31, 2004, between Radiant Systems, Inc. and Wave Enterprise Systems, Inc. (February 17, 2004 8-K) | |
| *10.11 | Noncompetition Agreement, dated January 31, 2004, between Radiant Systems, Inc. and Erez Goren (February 17, 2004 8-K) | |
| *10.13 | Right of First Refusal and Purchase Option Agreement, dated January 31, 2004, between Radiant Systems, Inc. and Wave Enterprise Systems, Inc. (February 17, 2004 8-K) | |
| *10.14 | Sublease and Facilities Agreement, dated January 31, 2004, between Radiant Systems, Inc. and Wave Enterprise Systems, Inc. (February 17, 2004 8-K) | |
| *10.15 | Named Executive Officer Compensation Arrangements (March 9, 2009 8-K) (Management compensation plan or arrangement) | |
| *10.16 | 2009 Short-Term Incentive Plan of John H. Heyman (March 2009 10-Q) (Management compensation plan or arrangement) | |
| *10.17 | 2009 Short Term Incentive Plan of Alon Goren (March 2009 10-Q) (Management compensation plan or arrangement) | |
| *10.18 | 2009 Short Term Incentive Plan of Mark E. Haidet (March 2009 10-Q) (Management compensation plan or arrangement) | |
| *10.19 | 2009 Short Term Incentive Plan of Andrew S. Heyman (March 2009 10-Q) (Management compensation plan or arrangement) | |
| *10.20 | Senior Executive Change in Control Severance Plan (June 4, 2008 8-K) | |
| *10.21 | Director Compensation Arrangements (Management compensation plan or arrangement) (2008 10-K) | |
| *10.22 | 2009 Short Term Incentive Plan Policy (March 2009 10-Q) (Management compensation plan or arrangement) | |
| 21.1 | Subsidiaries of the Registrant | |
| 23.1 | Consent of Deloitte & Touche LLP | |
| 31.1 | Certification of John H. Heyman, Chief Executive Officer, pursuant to Section 302 of the Sarbanes-Oxley Act of 2002 | |
| 31.2 | Certification of Mark E. Haidet, Chief Financial Officer, pursuant to Section 302 of the Sarbanes-Oxley Act of 2002 | |
| 32.1 | Certifications pursuant to Section 906 of the Sarbanes-Oxley Act of 2002 | |
80
Table of Contents
In accordance with the requirements of Section 13 or Section 15(d) of the Securities Exchange Act of 1934, the Registrant has duly caused this Report to be signed on its behalf by the undersigned, in the City of Alpharetta, State of Georgia on March 11, 2010.
| RADIANT SYSTEMS, INC. | ||
| By: | /s/ JOHN H. HEYMAN | |
| John H. Heyman Chief Executive Officer | ||
Pursuant to the requirements of the Securities Exchange Act of 1934, this Report has been signed by the following persons on behalf of the Registrant in the capacities and on the dates indicated.
| Signature |
Title |
Date | ||
| /s/ ALON GOREN Alon Goren |
Chairman of the Board and Chief Technology Officer |
March 11, 2010 | ||
| /s/ JOHN H. HEYMAN John H. Heyman |
Chief Executive Officer and Director (principal executive officer) |
March 11, 2010 | ||
| /s/ MARK E. HAIDET Mark E. Haidet |
Chief Financial Officer (principal financial officer) |
March 11, 2010 | ||
| /s/ ROBERT R. ELLIS Robert R. Ellis |
Vice President of Accounting (principal accounting officer) |
March 11, 2010 | ||
| /s/ MICHAEL Z. KAY Michael Z. Kay |
Director | March 11, 2010 | ||
| /s/ JAMES S. BALLOUN James S. Balloun |
Director | March 11, 2010 | ||
| /s/ J. ALEXANDER M. DOUGLAS, JR. J. Alexander M. Douglas, Jr. |
Director | March 11, 2010 | ||
| /s/ DONNA A. LEE Donna A. Lee |
Director | March 11, 2010 | ||
| /s/ WILLIAM A. CLEMENT, JR. William A. Clement, Jr. |
Director | March 11, 2010 | ||
81