Attached files
Table of Contents
UNITED STATES SECURITIES AND EXCHANGE COMMISSION
Washington, D.C. 20549
Form 10-K
ANNUAL REPORT PURSUANT TO SECTION 13 OR 15(d)
OF THE SECURITIES EXCHANGE ACT OF 1934
For the fiscal year ended December 31, 2009
COMMISSION FILE NUMBER 0-11113

(Exact Name of Registrant as Specified in its Charter)
| California | 95-3673456 | |
| (State or other jurisdiction of incorporation or organization) |
(I.R.S. Employer Identification No.) | |
| 1021 Anacapa St. Santa Barbara, California |
93101 | |
| (Address of principal executive offices) | (Zip Code) | |
(805) 564-6405
(Registrant’s telephone number, including area code)
Securities registered pursuant to Section 12(b) of the Act:
| Title of Each Class |
Name of Each Exchange on Which Registered | |
| Common Stock, no par value | The NASDAQ Stock Market LLC |
Securities registered pursuant to Section 12(g) of the Act: None
Indicate by check mark if the registrant is a well-known seasoned issuer, as defined in Rule 405 of the Securities Act. Yes No X
Indicate by check mark if the registrant is not required to file reports pursuant to Section 13 or Section 15(d) of the Act. Yes No X
Indicate by check mark whether the registrant (1) has filed all reports required to be filed by Section 13 or 15(d) of the Securities Exchange Act of 1934 during the preceding 12 months (or for such shorter period that the registrant was required to file such reports), and (2) has been subject to such filing requirements for the past 90 days. Yes X No
Indicate by check mark whether the registrant has submitted electronically and posted on its corporate Web site, if any, every Interactive Data File required to be submitted and posted pursuant to Rule 405 of Regulation S-T (§232.405 of this chapter) during the preceding 12 months (or for such shorter period that the registrant was required to submit and post such files). Yes No
Indicate by check mark if disclosure of delinquent filers pursuant to Item 405 of Regulation S-K is not contained herein, and will not be contained, to the best of registrant’s knowledge, in definitive proxy or information statements incorporated by reference in Part III of this Form 10-K or any amendment to this Form 10-K. [X]
Indicate by check mark whether the registrant is a large accelerated filer, an accelerated filer, or a non-accelerated filer. See definition of “accelerated filer and large accelerated filer” in Rule 12b-2 of the Exchange Act. (Check one):
Large accelerated filer Accelerated filer X Non-accelerated filer Smaller reporting company
(Do not check if a smaller reporting company)
Indicate by check mark whether the registrant is a shell company (as defined in Rule 12b-2 of the Exchange Act).
Yes No X
The aggregate market value of the voting stock held by non-affiliates computed June 30, 2009, based on the sales prices on that date of $2.14 per share: Common Stock—$94,636,109. All directors and executive officers and the registrant’s Employee Stock Ownership Plan have been deemed, solely for the purpose of the foregoing calculation, to be “affiliates” of the registrant; however, this determination does not constitute an admission of affiliate status for any of these stockholders.
As of February 19, 2010, there were 46,759,587 shares of the issuer’s common stock outstanding.
DOCUMENTS INCORPORATED BY REFERENCE: Portions of registrant’s Proxy Statement for the Annual Meeting of Shareholders on April 29, 2010 are incorporated by reference into Part III.
Table of Contents
2
Table of Contents
PART I
This Annual Report on Form 10-K contains “forward-looking statements” within the meaning of Section 27A of the Securities Act of 1933, as amended, and Section 21E of the Securities Exchange Act of 1934, as amended. Pacific Capital Bancorp (the “Company” or “PCB”) intends such forward-looking statements to be covered by the safe harbor provisions for forward-looking statements in these provisions. All statements other than statements of historical fact are “forward-looking statements” for purposes of federal and state securities laws, including, but not limited to, statements about anticipated future operating and financial performance, financial position and liquidity, business prospects, strategic alternatives, business strategies, regulatory and competitive outlook, investment and expenditure plans, capital and financing needs and availability, acquisition and divestiture opportunities, plans and objectives of management for future operations, and other similar forecasts and statements of expectation and statements of assumptions underlying any of the foregoing. Words such as “will likely result,” “aims,” “anticipates,” “believes,” “could,” “estimates,” “expects,” “hopes,” “intends,” “may,” “plans,” “projects,” “seeks,” “should,” “will,” and variations of these words and similar expressions are intended to identify these forward-looking statements.
Forward-looking statements are based on the Company’s current expectations and assumptions regarding its business, the regulatory environment, the economy and other future conditions. Because forward-looking statements relate to the future, they are subject to inherent uncertainties, risks and changes in circumstances that are difficult to predict. The Company’s actual results may differ materially from those contemplated by the forward-looking statements. The Company cautions you therefore against relying on any of these forward-looking statements. They are neither statements of historical fact nor guarantees or assurances of future performance. Important factors that could cause actual results to differ materially from those in the forward-looking statements include, but are not limited to, the following:
| ¡ | inability to continue as a going concern; |
| ¡ | management’s ability to effectively execute the Company’s business plan; |
| ¡ | inability to raise additional capital on acceptable terms, or at all; |
| ¡ | inability to achieve the higher minimum capital ratios that Pacific Capital Bank, N.A. (the “Bank”) has agreed to maintain with the Office of the Comptroller of the Currency; |
| ¡ | inability to receive dividends from the Bank and to service debt and satisfy obligations as they become due; |
| ¡ | regulatory enforcement actions to which the Company and the Bank are currently, and may in the future be, subject; |
| ¡ | costs and effects of legal and regulatory developments, including the resolution of legal proceedings or regulatory or other governmental inquiries, and the results of regulatory examinations or reviews; |
| ¡ | changes in capital classification; |
| ¡ | the impact of current economic conditions and the Company’s results of operations on its ability to borrow additional funds to meet its liquidity needs; |
| ¡ | local, regional, national and international economic conditions and events and the impact they may have on the Company and its customers; |
| ¡ | changes in the economy affecting real estate values; |
3
Table of Contents
| ¡ | inability to attract and retain deposits; |
| ¡ | changes in the level of non-performing assets and charge-offs; |
| ¡ | changes in estimates of future reserve requirements based upon the periodic review thereof under relevant regulatory and accounting requirements; |
| ¡ | changes in the financial performance and/or condition of the Bank’s borrowers; |
| ¡ | effect of additional provision for loan losses; |
| ¡ | long-term negative trends in the Company’s market capitalization; |
| ¡ | continued listing of the Company’s common stock on The NASDAQ Global Select Market; |
| ¡ | effects of any changes in trade and monetary and fiscal policies and laws, including the interest rate policies of the Federal Reserve Board; |
| ¡ | inflation, interest rate, cost of funds, securities market and monetary fluctuations; |
| ¡ | political instability; |
| ¡ | acts of war or terrorism, natural disasters such as earthquakes or fires, or the effects of pandemic flu; |
| ¡ | the timely development and acceptance of new products and services and perceived overall value of these products and services by users; |
| ¡ | changes in consumer spending, borrowings and savings habits; |
| ¡ | technological changes; |
| ¡ | changes in the Company’s organization, management, compensation and benefit plans; |
| ¡ | competitive pressures from other financial institutions; |
| ¡ | continued consolidation in the financial services industry; |
| ¡ | inability to maintain or increase market share and control expenses; |
| ¡ | impact of reputational risk on such matters as business generation and retention, funding and liquidity; |
| ¡ | rating agency downgrades; |
| ¡ | continued volatility in the credit and equity markets and its effect on the general economy; |
| ¡ | effect of changes in laws and regulations (including laws concerning banking, taxes and securities) with which the Company and its subsidiaries must comply; |
| ¡ | effect of changes in accounting policies and practices, as may be adopted by the regulatory agencies, as well as the Public Company Accounting Oversight Board, the Financial Accounting Standards Board and other accounting standard setters; |
| ¡ | other factors that are described in “Risk Factors”; and |
| ¡ | the Company’s success at managing the risks involved in the foregoing items. |
Forward-looking statements speak only as of the date they are made, and the Company does not undertake to update forward-looking statements to reflect circumstances or events that occur after the date the forward-looking statements are made, whether as a result of new information, future developments or otherwise, except as may be required by law.
The assets, liabilities, and results of operations of the Company’s tax refund and transfer programs (“RAL and RT programs”) are reported in its periodic filings with the Securities and Exchange Commission (“SEC”) as a segment of its business. Because these are activities conducted by very few
4
Table of Contents
other financial institutions, users of the financial statements have indicated that they are interested in information for the Company exclusive of these programs so that they may compare the results of operations with financial institutions that do not have comparable programs. These amounts and ratios may generally be computed from the information provided in the note to its financial statements that discloses segment information, but are computed and included elsewhere in this Annual Report on Form 10-K for the convenience of the readers of this document.
Purpose and Definition of Terms
The following discussion is designed to provide insight into the assessment by executive management (“Management”) of the financial condition and results of operations of the Company and its subsidiaries. This discussion should be read in conjunction with the Company’s Consolidated Financial Statements and the notes to the Consolidated Financial Statements, herein referred to as “the Consolidated Financial Statements”. These Consolidated Financial Statements are presented on pages 94 through 179 of this Annual Report on Form 10-K, herein referred to as “Form 10-K”. Specific accounting and banking industry terms and acronyms used throughout this document are defined in the glossary on pages 181 through 184. The Company utilizes the term “Core Bank” throughout this Form 10-K. Core Bank is defined as the Company’s consolidated financial results less the financial results from the refund anticipation loan (“RAL”) and refund transfer (“RT”) Programs and is interchangeably referred to as “Excluding RAL and RT”.
5
Table of Contents
| ITEM 1. | BUSINESS |
Organizational Structure and Description of Services
The Company is a community bank holding company providing full service banking including all aspects of consumer and commercial lending, trust and investment advisory services and other consumer and business banking products through its subsidiaries’ retail branches, commercial and wealth management centers and other distribution channels to consumers and businesses primarily located in the central coast of California. The Company was one of three primary providers nationwide of RALs and RTs at December 31, 2009. On January 14, 2010, the Company sold all of the assets of the RAL and RT Programs segment.
The Company has six wholly-owned subsidiaries. Pacific Capital Bank, National Association (“the Bank” or “PCBNA”), a banking subsidiary, PCB Service Corporation, utilized as a trustee of deeds of trust in which PCBNA is the beneficiary and four unconsolidated subsidiaries used as business trusts in connection with issuance of trust-preferred securities as described in Note 14, “Long-term Debt and Other Borrowings” on page 144 of this Form 10-K.
PCBNA has three wholly-owned consolidated subsidiaries:
| ¡ | Morton Capital Management (“MCM”) and R.E. Wacker Associates, Inc. (“REWA”), two registered investment advisors that provide investment advisory services to individuals, foundations, retirement plans and select institutional clients. |
| ¡ | SBBT RAL Funding Corp. which was utilized as part of the financing of the RAL program as described in Note 7, “RAL and RT Programs”. |
In 2007, PCBNA made an investment in Veritas Wealth Advisors, LLC (“Veritas”), a registered investment advisor. PCBNA made an additional investment of $750,000 in January 2008, for a total investment of $1.0 million or a 20% interest in Veritas.
PCBNA also retains ownership in several low-income housing tax credit partnerships (“LIHTCP”) that are not consolidated into the Company’s Consolidated Financial Statements. For additional information regarding PCBNA’s investment in LIHTCP, refer to Note 1, “Summary of Significant Accounting Policies” of the Consolidated Financial Statements on page 103.
6
Table of Contents
At December 31, 2009, PCBNA conducted its banking services under five brand names at 50 locations. These brand names represent the former names of select acquired independent banks merged into PCBNA.
| Brand Name | Acronym | Counties Located in | Year Founded or Acquired |
Number of Locations | ||||
| Santa Barbara Bank & Trust |
“SBB&T” | Santa Barbara, Ventura and Los Angeles |
1960(1) | 34 | ||||
| First National Bank of Central California |
“FNB” | Monterey and Santa Cruz |
1998 | 7 | ||||
| South Valley National Bank |
“SVNB” | Southern Santa Clara | 1998 | 3 | ||||
| San Benito Bank |
“SBB” | San Benito | 1998 | 3 | ||||
| First Bank of San Luis Obispo |
“FBSLO” | San Luis Obispo | 2005 | 3 |
| (1) | PCBNA commenced operations in 1960 as Santa Barbara National Bank (“SBNB”). In 1979, SBNB switched from a national charter to a state charter and changed the name to SBB&T. In 2002, PCBNA was created returning the charter to a national bank by consolidating the two subsidiaries of SBB&T and FNB into PCBNA. In 2007, PCBNA locations which were part of Pacific Crest Capital Incorporated (“PCCI”) and acquired with it in 2004 were renamed to the SBB&T brand name. |
In addition to the retail and business deposits managed by the above banking offices, the Company makes use of brokered deposits and deposits received from the State of California, both of which are administered by the Company’s treasury department.
In early 2008, Management began an evaluation of all administrative and retail branch facilities in an effort to identify opportunities for greater efficiencies in its space utilization. As a result, throughout 2008 and 2009, and continuing into 2010, there are a number of location consolidations and closures related to this expense control initiative to ensure that all locations leased and owned are fully occupied. Additionally, the Company’s review will confirm that all retail branch locations meet its strategic initiatives and continue to meet the needs of the Bank’s customers.
In January 2010 and February 2010, the Commercial and Wealth Management Group’s (“CWMG”) San Jose and Calabasas locations were closed. Also, in February 2010 the Company announced plans to vacate its downtown Santa Barbara headquarters building in the first half of 2010 and is in the process of negotiating with the owners of the building to terminate the operating lease so that the executive and other staff currently occupying the building may move to other underutilized facilities. The Buellton and Vandenberg Village retail branch locations which operate under the SBB&T brand will consolidate into nearby locations in April 2010. There are also several locations that are being evaluated for possible sale, consolidation or closure during 2010.
Three-Year Strategic and Capital Plan
For the past two years, the Company has operated in an exceptionally difficult recessionary environment and has been significantly impacted by the resulting unprecedented credit and economic market turmoil. Deterioration in California’s commercial and residential real estate markets and the related declines in property values, and worsening unemployment, have had a significantly negative impact on the Company’s operating results. The Company also continues to operate under enhanced
7
Table of Contents
regulatory scrutiny. (See the “Regulation and Supervision—Current Regulatory Matters” Section of this Form 10-K.)
In an effort to strengthen the Company’s operations and capital position and enable it to better withstand these continued adverse market conditions, as required by the Office of the Comptroller of the Currency (the “OCC”), the Company has developed a detailed three-year strategic and capital plan (the “Capital Plan”).
Key components of the Capital Plan include:
| ¡ | A process to identify and evaluate a broad range of strategic alternatives to strengthen the Company’s capital base and enhance shareholder value. |
| ¡ | Building and maintaining a strong capital base. |
| ¡ | Improving asset quality through a combination of efforts to reduce the current concentration of classified assets, prudently managing credit risk exposures in the existing loan portfolio, and tightening credit underwriting standards. |
| ¡ | A comprehensive review of the Bank’s entire loan portfolio to identify loans that are good candidates for sale. During 2009, the Company sold approximately $383.5 million in real estate secured loans. |
| ¡ | Substantial curtailment of the Bank’s commercial real estate lending business pending a reduction in the Bank’s risk profile and significant improvement in market conditions. |
| ¡ | Severely limited asset growth, as the Company focuses on improving asset quality and implementing necessary efficiency and risk management initiatives in the Core Bank. |
| ¡ | Maintaining prudent levels of liquidity. |
| ¡ | Improving earnings. |
| ¡ | Strengthening Management and Board of Directors oversight. |
| ¡ | Compliance with applicable laws and regulations, including, to the maximum possible extent, regulatory capital requirements and the requirements of regulatory enforcement actions. |
| ¡ | Initiatives to improve the Company’s operating efficiency ratio through automation of key systems, process integration, and elimination of redundancies. |
| ¡ | Additional expense reduction actions that are targeted to eliminate $25 million in annual operating expenses in 2010 and another $25 million in annual operating expenses in 2011. The initiative will focus on enhancing efficiencies in all business units and reducing expenses in areas such as information technology and corporate real estate. |
The Company believes the successful completion of the Capital Plan would substantially improve its operations and capital position. However, no assurances can be made that the Company will be able to successfully complete all, or any portion of the Capital Plan, or that the Capital Plan will not be materially modified in the future. If the Company is not able to successfully complete a substantial portion of its Capital Plan, the Company expects that its business and the value of its securities will be materially and adversely affected, and it will be more difficult for the Company to meet the capital requirements requested by its primary banking regulators.
Segments
The Company had three reportable operating segments at December 31, 2009. These segments are determined based on product line and the types of customers serviced. These reportable operating segments are Community Banking, CWMG and RAL and RT Programs. The CWMG segment is the result of combining two segments that were reported separately in the 2008 Annual Report on Form 10-K. For purposes of the segment reporting in Note 24, “Segments” to the Consolidated Financial Statements, the two segments have been combined for the years ended December 31, 2008 and 2007 as if the segments had been combined as of January 1, 2007.
8
Table of Contents
The administrative and treasury operations of the Company are not considered part of operating activities and are reported within the All Other segment for financial reporting. The financial results for each segment are based on products and services provided within each operating segment with various Management assumptions to calculate the indirect credits and charges for funds which also includes an allocation of certain expenses from the All Other segment. These Management assumptions are explained in Note 24, “Segments” of the Consolidated Financial Statements beginning on page 171.
The Community Banking and CWMG segments represent the traditional banking operations of the Company and are referred to as the “Core Bank” by Management. The banking operations of the Core Bank are similar to the operations of other banks. The RAL and RT Programs segment is highly seasonal as a majority of the income is earned in the first quarter of each year. The RAL product generates interest income and the RT product generates non-interest income. The Company experienced significant growth in the RAL and RT Programs over the last several years but also had a high amount of credit, reputation and regulatory risk. In an effort to reduce the Company’s risk, the Company sold the RAL and RT Program segment on January 14, 2010. The financial impact of the RAL and RT Programs will be discussed throughout the Management Discussion and Analysis (“MD&A”) section of this document and in Note 7, “RAL and RT Programs” of the Consolidated Financial Statements.
The income generated by these two Core Bank reportable segments is driven by the lending and trust and investment advisory products offered to customers. The primary expenses are interest expense on deposits and funding costs and personnel. Deposit products are provided to the customers of the Community Banking and CWMG segments.
Community Banking
Business units in this segment provide residential real estate loans, home equity lines and loans, consumer loans, small business loans, deposit products, Small Business Administration (“SBA”) loans and lines, and demand deposit overdraft protection products.
Residential real estate loans consist of first and second mortgage loans secured by trust deeds on one to four unit single family homes. The Company has specific underwriting and pricing guidelines based on the credit worthiness of the borrower and the value of the collateral, including credit score, debt-to-income ratio of the borrower and loan-to-value ratio. In the third quarter of 2008, residential loans began to be originated for sale on a flow basis in addition to booking loans held on the balance sheet. In the second half of 2009, the Company made a strategic decision to only originate loans to be sold into the secondary market.
The Company extends credit based on the underwriting requirements that Freddie Mac and Fannie Mae require so, that the loans can be sold on the secondary market. Home equity lines of credit are generally secured by a second trust deed on a single one to four unit family home. The interest rate on home equity lines is a variable index rate while term residential mortgage loans can have either variable or fixed interest rates.
Consumer loans and lines of credit are extended with or without collateral to provide financing for purposes such as the acquisition of recreational vehicles, automobiles, or to provide liquidity. The Company has specific underwriting guidelines which consider the borrower’s credit history, debt-to-income ratio and loan-to-value ratio for secured loans. The consumer loans typically have fixed interest rates.
Small business loans and lines of credit offered through the Community Banking Segment are extended without collateral to small businesses based on historical credit performance of the business and with the principal owners of the business. The loans and lines of credit can have either variable or fixed interest rates and are extended to small businesses in amounts equal to or less than $100,000.
9
Table of Contents
SBA loans are extended to small businesses for a variety of purposes, including working capital, business acquisitions, acquisition of real estate, growth capital and equipment financing. The Company focuses on 7(a), 504, and Express loan programs. 7(a) loans provide longer term financing, which are guaranteed 75% to 85% by the SBA depending on term and loan size. SBA 504 loans are typically used for the acquisition or construction of large equipment or real property. These are financing packages comprised of a first and second trust deed loan structure where the debt does not exceed 90% combined loan-to-value. Express loans are unsecured lines of credit or term loans of $100,000 or less and are generally guaranteed by the SBA at 50%. Periodically, the Company sells selected SBA loans into the secondary market. The Company retains servicing rights on the sold guaranteed portion of SBA 7(a) loans.
Deposit products include checking, savings, money market accounts, Individual Retirement Accounts (“IRAs”), Certificates of Deposit (“CDs”) and debit cards.
Demand deposit overdraft protection products are offered to customers to provide additional protection against unforeseen deficit balances in a specific account and the fees associated with returned checks. The Company offers these products based on factors such as the customers credit score and history with the Company. These products have fixed interest rates.
The Community Banking segment serves customers through traditional banking branches, loan production centers, Automated Teller Machines (“ATM”), through the customer contact call center and online banking.
Commercial and Wealth Management Group
As discussed above, in January 2009 the Commercial Banking and Wealth Management segments were combined into one segment. The new CWMG segment provides the same products and services that were offered prior to being combined, but the combined segment is serving the same customers under one business model.
A majority of the customers served in this segment are middle market companies with business owners who are high net-worth individuals. Combining the segments allows the Bank to serve these customers with one relationship manager. This segment offers a complete line of commercial and industrial and commercial real estate secured loan products and services as well as trust and investment advisory services and private banking lending, deposit services and securities brokerages services through the Bank’s trust and investment management group and through MCM and REWA. The types of products offered in this segment include traditional commercial and industrial and commercial real estate and lines of credit, letters of credit, asset-based lending, foreign exchange services and treasury management. The loan products also include construction loans for commercial and residential development, land acquisition and development loans, secured and unsecured lines of credit and financing arrangements for completed structures.
Loan products are underwritten and customized to meet specific customer needs. The Company considers several factors in order to extend the loan including the borrower’s historical loan re-payment, company management, and current economic conditions, industry specific issues, capital structure, potential collateral and financial projections.
In making commercial real estate secured loan decisions, the Company considers the purpose of the requested loan and nature of the collateral. Due to the high level of charge-offs, impairments and non-accrual loans in the CWMG segment during 2008 and 2009, the lending policies were amended to increase loan approval oversight, reduce approval limits, reduce the risk on the Company’s balance sheet and reduce concentrations of commercial real estate loans. In addition, the origination of
10
Table of Contents
commercial real estate loans in 2009 was very limited and very closely monitored. The Company renewed commercial real estate loans during 2009, but the renewals utilized the new underwriting criteria amended during 2009. The maximum loan-to-value ratios for commercial real estate loans were reduced from 75% to 50% during 2009 and debt service ratios were increased to 1.50 from 1.25. Depending on the product, these loans have fixed or variable interest rates.
The trust and investment advisory services include investment review, analysis and customized portfolio management for separately managed accounts, full service brokerage, trust and fiduciary services, equity and fixed income management and real estate and specialty asset management. The CWMG segment’s underwriting guidelines consider tangible net worth, the nature of assets that make up this net worth, personal cash flow, past history with the Company, and general credit history. These loans may be either secured or unsecured, and may have either fixed or variable interest rates, with lines of credit generally having variable interest rates.
Deposit products include checking, savings, money market accounts, IRAs, CDs and debit cards. Overdraft protection is also offered to these customers.
The CWMG segment serves customers through traditional banking branches, loan production centers, ATMs, through the customer contact call center and online banking.
RAL and RT Programs
As disclosed above, on January 14, 2010, the Company sold all of the assets of the RAL and RT Programs segment. However, since the RAL and RT Programs activity continued through December 31, 2009, the products and results of operations of this segment will be discussed throughout this Form 10-K.
RALs are a seasonal credit product extended to consumers during the first four months of each calendar year. The purpose of a RAL is to provide consumers with liquidity at the time they file for their tax refund. The Company works with third party tax preparers who facilitate the origination of RALs through an application process. RAL underwriting is based on borrower information as well as certain criteria within the tax return. The source of repayment for the RAL is the Internal Revenue Service (“IRS”).
The Company subjects the RAL application to an automated credit review process utilizing specific predetermined criteria. If the application passes this review, the Company advances the amount of the refund due on the taxpayer’s return up to specified amounts based on certain criteria less the loan fee due to the Company, and if requested by the taxpayer, the fees due for preparation of the return. Each taxpayer signs an agreement permitting the IRS to send the taxpayer’s refund directly to the Company. When received from the IRS, the refund is used by the Company to pay off the RAL. Any amount due the taxpayer above the amount of the RAL is remitted to the taxpayer. The RAL income is recognized as interest income after the loan balance is collected from the IRS. The fee varies based on the amount of the RAL.
Generally, interest income earned on loans is a function of the outstanding balance multiplied by the rate specified in the loan agreement multiplied by the period of time the loan is outstanding. For RALs, the interest income is unrelated to the length of time the loan is outstanding and there is no explicit interest rate. The flat fee charged is recognized as income when the loan is collected from the IRS. No late fees are charged to customers whose loans are not paid within the expected time frame.
While the loan application form is completed by the taxpayer in the tax preparer’s office, the credit criteria are set by the Company and the underwriting decision is made by the Company. The Company
11
Table of Contents
reviews and evaluates all tax returns to determine the likelihood of IRS payment. If any attribute of the tax return appears to fall outside of predetermined parameters, the Company will reject the application and not make the loan.
The Company has entered into two separate contracts with Jackson Hewitt related to the RAL and RT Programs. One of the contracts with Jackson Hewitt is with Jackson Hewitt Inc. and the other is with Jackson Hewitt Technology Services, Inc. collectively referred to as “JH” throughout this Form 10-K.
The Company also has an electronic filing of tax return product called a Refund Transfer or RT. The RT product is also designed to provide taxpayers faster access to funds claimed by a taxpayer as a refund on their tax returns. An RT is in the form of a facilitated electronic transfer or check prepared by the taxpayer’s tax preparer.
For more information regarding RALs and RTs, refer to Note 7, “RAL and RT Programs” of the Consolidated Financial Statements beginning on page 133.
Changes to Segment Reporting in 2010
In January 2010, the Chief Executive Officer (“CEO”) announced further organizational change which changes the structure of the Community Banking and CWMG segments. This organizational change will significantly change the structure of how the Company defines its segments in 2010. Up until December 31, 2009 the segments were defined by the products offered to certain types of customers. This organizational change defines the segments by regional location as well as products offered but all serve the same type of client bases.
Employees
At December 31, 2009, the Company employed 1,164 employees. The Company’s employees are not represented by a union or covered by a collective bargaining agreement. Management believes that its employee relations are good.
Acquisitions
Recent mergers and acquisitions of the Company are disclosed in Note 2, “Acquisitions and Dispositions” in the Consolidated Financial Statements on page 118. In the last three years, the Company has had one acquisition, REWA. In January 2008, PCBNA acquired REWA, a California-based registered investment advisor for an initial cash payment of approximately $7.0 million. REWA is a wholly owned subsidiary of PCBNA which provides personal and financial investment advisory services to individuals, families and fiduciaries.
Market Area
The Company’s branches are located in eight California counties. These counties include Santa Barbara, Ventura, Monterey, Santa Cruz, Southern Santa Clara, San Benito, San Luis Obispo and Los Angeles. The Company uses separate brand names in various counties for community recognition only, all offices are legal branches of PCBNA, and all banking offices are administered under one management structure.
The RAL and RT Programs administrative offices were located in San Diego County, California with transactions conducted with taxpayers located throughout the United States.
Foreign Operations
The Company has no foreign operations. The Company does provide loans, letters of credit and other trade-related services to a number of commercial enterprises that conduct business outside the United States.
12
Table of Contents
Customer Concentration
The Company does not have any customer relationships that individually account for 10% or more of consolidated revenues.
Competition
The banking and financial services business is highly competitive. The increasingly competitive environment faced by banks is a result primarily of changes in laws and regulations (refer to pages 82 through 89 of this Form 10-K), changes in technology and product delivery systems, and the continued consolidation among financial services providers. The Company competes for loans, deposits, trust and investment advisory services and customers with other commercial banks, savings and loan associations, securities and brokerage companies, investment advisors, mortgage companies, insurance companies, finance companies, money market funds, credit unions, and other non-bank financial service providers. Many competitors are much larger in total assets and capitalization, have greater access to capital markets, including foreign markets, and/or offer a broader range of financial services.
Economic Conditions, Government Policies, Legislation, and Regulatory Initiatives
The Company’s profitability, like most financial institutions, is primarily dependent on interest rate differentials. The difference between the interest rates paid on interest-bearing liabilities, such as deposits and other borrowings, and the interest rates received on interest-earning assets, such as loans to customers and securities held in the investment portfolio, comprise the major portion of earnings. These rates are highly sensitive to many factors that are beyond the Company’s control and cannot be predicted, such as inflation, recession and unemployment, and the impact which future changes in domestic and foreign economic conditions might have on the Company cannot be predicted. A more detailed discussion of the Company’s interest rate risks and the mitigation of those risks begins on page 90.
The Company’s business is also influenced by the monetary and fiscal policies of the Federal government and the policies of regulatory agencies, particularly the Board of Governors of the Federal Reserve System (“FRB”). The FRB implements national monetary policies (with objectives such as curbing inflation and combating recession) through its open-market operations in U.S. Government securities, by adjusting the required level of reserves for depository institutions subject to its reserve requirements, and by varying the target Federal funds and discount rates applicable to borrowings by depository institutions. The actions of the FRB in these areas influence the growth of bank loans, investments, and deposits and also affect interest earned on interest-earning assets and interest paid on interest-bearing liabilities. The nature and impact of any future changes in monetary and fiscal policies on the Company cannot be predicted.
From time to time, Federal and State legislation is enacted which may have the effect of materially increasing the cost of doing business, limiting or expanding permissible activities, or affecting the competitive balance between banks and other financial services providers. In response to the recent economic downturn and financial industry instability, legislative and regulatory initiatives have been, and will likely continue to be, introduced and implemented, which could substantially intensify the regulation of the financial services industry. These include possible comprehensive overhaul of the financial institutions regulatory system, the creation of a new consumer financial protection agency, and enhanced supervisory attention and potential new restrictions on executive compensation arrangements. The Company cannot predict whether or when potential legislation or new regulations will be enacted, and if enacted, the effect that new legislation or any implementing regulations and supervisory policies would have on the Company’s financial condition or results of operations. Moreover, especially in the current economic environment, bank regulatory agencies have been very
13
Table of Contents
aggressive in responding to concerns and trends identified in examinations, and this has resulted in the increased issuance of enforcement actions to financial institutions requiring action to address credit quality, liquidity and risk management and capital adequacy, as well as other safety and soundness concerns.
Through its authority under the Emergency Economic Stabilization Act of 2008 (“EESA”), as amended by the American Recovery and Reinvestment Act of 2009 (“ARRA”), the United States Department of the Treasury (“U.S. Treasury”) implemented the Troubled Asset Relief Program Capital Purchase Program (“TARP CPP”), a program designed to bolster eligible healthy institutions by injecting capital into these institutions. The Company participated in the TARP CPP and sold to the U.S. Treasury on November 21, 2008 (i) 180,634 shares of the Company’s Series B Fixed Rate Cumulative Perpetual Preferred Stock, having a liquidation preference of $1,000 per share (the “Series B Preferred Stock”) and (ii) a warrant (the “Warrant”) to purchase up to 1,512,003 shares of the Company’s common stock, no par value. Under the terms of the TARP CPP, the Company is prohibited from increasing dividends on its common stock, and from making certain repurchases of equity securities, including its common stock, without the U.S. Treasury’s consent. Furthermore, as long as the preferred stock issued to the U.S. Treasury is outstanding, dividend payments and repurchases or redemptions relating to certain equity securities, including the Company’s common stock, are prohibited until all accrued and unpaid dividends are paid on such preferred stock, subject to certain limited exceptions. Restrictions related to the payment of dividends on common stock are disclosed in the “Regulation and Supervision” section of this Form 10-K and in Note 20, “Regulatory Capital Requirements” of the Consolidated Financial Statements.
In order to participate in the TARP CPP, financial institutions were required to adopt certain standards for executive compensation and corporate governance. These standards generally apply to the Chief Executive Officer, Chief Financial Officer (“CFO”) and the three next most highly-compensated officers (“Senior Executive Officers” or “SEOs”) and other highly-compensated employees. The standards include (1) ensuring that incentive compensation for the SEOs does not encourage unnecessary and excessive risks that threaten the value of the financial institution; (2) required clawback of any bonus or incentive compensation paid to the SEOs and the next 20 most highly-compensated employees based on statements of earnings, gains or other criteria that are later proven to be materially inaccurate; (3) prohibition on making golden parachute payments to the SEOs and the next five most highly-compensated employees; (4) prohibitions on bonuses, retention awards and other incentive compensation payable to the five most highly-compensated employees, other than restricted stock grants which do not fully vest during the TARP period up to one-third of an employee’s total annual compensation; and (5) agreement not to deduct for tax purposes executive compensation in excess of $500,000 for each SEO. The Company has complied with these requirements.
The EESA also increased Federal Deposit Insurance Corporation (“FDIC”) deposit insurance on most accounts from $100,000 to $250,000. This increase was originally scheduled to end in 2009; however, Congress extended the temporary increase until December 31, 2013. The increase is not covered by deposit insurance premiums paid by the banking industry. In addition, the FDIC has implemented two temporary programs under the Temporary Liquidity Guarantee Program (“TLGP”) to (i) provide deposit insurance for the full amount of most non-interest bearing transaction accounts (the “Transaction Account Guarantee”) through the end of 2009, and later extended through June 30, 2010, and (ii) guarantee certain unsecured debt of financial institutions and their holding companies through June 2012 under a temporary liquidity guarantee program (the “Debt Guarantee Program”). Financial institutions had until December 5, 2008 to opt out of these two programs. The Company and the Bank have elected to participate in these programs, but have not yet issued any debt under the Debt Guarantee Program.
14
Table of Contents
Regulation and Supervision
The Company and its subsidiaries are extensively regulated and supervised under both Federal and certain State laws. A summary description of the laws and regulations which relate to the Company’s operations are discussed on pages 82 through 89. This section and Note 20, “Regulatory Capital Requirements” of the Consolidated Financial Statements need to be reviewed in order to understand the regulatory developments affecting the Company in 2009.
Available Information
The Company maintains an Internet website at http://www.pcbancorp.com. The Company makes available its annual reports on Form 10-K, quarterly reports on Form 10-Q, current reports on Form 8-K and amendments to such reports filed or furnished pursuant to Section 13(a) or 15(d) of the Securities Exchange Act of 1934 (“Exchange Act”), as amended, and other information related to the Company free of charge, through the Company’s Investor Relations page of this site as soon as reasonably practicable after it electronically files those documents with, or otherwise furnishes them to, the SEC. The Company’s internet website and the information contained therein or connected thereto are not intended to be incorporated into this annual report on Form 10-K.
| ITEM 1A. | RISK FACTORS |
RISK MANAGEMENT
Investing in the Company’s common stock involves various risks which are specific to the Company, the Company’s industry and market area. Several risk factors regarding investing in the Company’s common stock are discussed below. This listing should not be considered as all-inclusive. If any of the following risks were to occur, Management may not be able to conduct the Company’s business as currently planned and the financial condition or operating results could be negatively impacted. The Company’s Chief Audit Executive, Chief Risk Officer and Chief Credit Officer in conjunction with other members of the Company’s Management under the direction and oversight of the Board of Directors lead the Company’s risk management process. In addition to common business risks such as disasters, theft, and loss of market share, the Company is subject to special types of risk due to the nature of its business.
Going Concern Uncertainty
The accompanying consolidated financial statements have been prepared on a going concern basis, which contemplates the realization of assets and the discharge of liabilities in the normal course of business. As a result, the accompanying consolidated financial statements do not include any adjustments that may result from the outcome of any extraordinary regulatory action or the Company’s inability to meet its existing debt obligations. The Company has recently incurred significant operating losses, experienced a significant deterioration in the quality of its assets and become subject to enhanced regulatory scrutiny. These factors, among others, were deemed to cast significant doubt on the Company’s ability to continue as a going concern. If the Company cannot continue to operate as a going concern, it is likely that shareholders will lose all or substantially all of their investment in the Company.
The Company is actively considering a broad range of strategic alternatives, including a capital infusion or a merger, in order to address any doubt related to the Company’s ability to continue as a going concern. There can be no assurance that the exploration of strategic alternatives will result in any transaction, or that any such transaction will allow the Company’s shareholders to avoid a loss of all or substantially all of their investment in the Company. The pursuit of strategic alternatives may also involve significant expenses and management time and attention.
15
Table of Contents
Additional Capital
The Company will need to raise additional capital to meet the higher minimum capital levels that PCBNA is obligated to maintain under its agreement with the OCC. In addition, should the Company’s current rate of operating losses continue or should the Company’s asset quality erode and require significant additional provision for credit losses, resulting in additional net operating losses, the Company’s capital levels will decline further and it will need to raise more capital to satisfy its regulatory capital requirements. The Company’s ability to raise additional capital depends on conditions in the capital markets, which are outside the Company’s control, and on the Company’s financial performance. Accordingly, the Company cannot be certain of its ability to raise additional capital on acceptable terms, or at all. If the Company cannot raise additional capital, its results of operations and financial condition could be materially and adversely affected, and it may be subject to further supervisory action. See “Regulatory Risk.” In addition, if the Company were to raise additional capital through the issuance of additional shares, its stock price could be adversely affected, depending on the terms of any shares it were to issue.
Regulatory Risk
During the second quarter of 2009, PCB entered into the Memorandum of understanding with the FRB (“FRB Memorandum”) and PCBNA entered into the Memorandum of understanding with the OCC (“OCC Memorandum”). See “Regulation and Supervision—Current Regulatory Matters” for the discussion of the terms of the FRB Memorandum and OCC Memorandum. If PCB fails to comply with the FRB Memorandum or PCBNA fails to comply with the OCC Memorandum, it may be subject to further supervisory enforcement action, which could have a material adverse effect on its results of operations, financial condition and business. In addition, PCBNA agreed during the second quarter of 2009 to maintain a minimum Tier 1 leverage ratio of 8.5% as of June 30, 2009 and 9.0% from and after September 30, 2009, and a minimum total risk based capital ratio of 11.0% as of June 30, 2009 and 12.0% from and after September 30, 2009. PCBNA had a Tier 1 leverage ratio of 5.5%, 5.6% and 5.7%, respectively, at December 31, 2009, September 30, 2009 and June 30, 2009, and a total risk based capital ratio of 10.7%, 10.8% and 11.2%, respectively, at December 31, 2009, September 30, 2009 and June 30, 2009. While these ratios exceed the minimum ratios required to be classified as “well capitalized” under generally applicable regulatory guidelines, the Tier 1 leverage ratio at December 31, 2009, September 30, 2009 and June 30, 2009 and the total risk based capital ratio at December 31, 2009 and September 30, 2009 were not sufficient to meet the higher levels that PCBNA is obligated to maintain under its agreement with the OCC. As a result, PCBNA may be subject to further supervisory action, which could have a material adverse effect on its results of operations, financial condition and business.
In addition, due to the ongoing economic downturn and the resultant deterioration in the California commercial real estate and commercial business markets and adverse impact on PCBNA’s loan portfolio and financial results, the Company and PCBNA may be the subject of additional regulatory actions in the future and face further limitations on its business. Bank regulatory authorities have the authority to bring enforcement actions against banks and bank holding companies for unsafe or unsound practices in the conduct of their businesses or for violations of any law, rule or regulation, any condition imposed in writing by the appropriate bank regulatory agency or any written agreement with the authority. Possible enforcement actions against the Company and PCBNA could include the issuance of a cease-and-desist order that could be judicially enforced, the imposition of civil monetary penalties, the issuance of directives to increase capital or enter into a strategic transaction, whether by merger or otherwise, with a third party, the appointment of a conservator or receiver for PCBNA, the termination of insurance of deposits, the issuance of removal and prohibition orders against institution- affiliated parties, and the enforcement of such actions through injunctions or restraining orders. The imposition of any such enforcement actions would likely have an adverse effect on the Company’s results of operations, financial condition and business.
16
Table of Contents
No Assurance of Profitability
The Company incurred a net loss of $431.3 million, or $9.24 per diluted common share, for the year ended December 31, 2009, primarily due to a $426.9 million provision for loan losses, a $128.7 million charge for goodwill impairment and the establishment of a $145.9 million net deferred tax asset valuation allowance. Although the Company has taken a significant number of steps to reduce its credit exposure, the Company likely will continue to incur significant credit costs throughout 2010, which Management anticipates will continue to adversely impact the Company’s overall financial performance and results of operations. There can be no assurance that the Company will achieve profitability in the future.
Change in Capital Classification
As of December 31, 2009, the Company and PCBNA each met the minimum ratios required to be classified as “well capitalized” under generally applicable regulatory guidelines. However, there is a substantial risk that the Company and PCBNA will fail to meet such requirements in future periods unless the Company is successful in executing on its three-year capital and strategic plan. If PCBNA’s regulatory capital position were to deteriorate such that it was classified as “adequately capitalized,” it might not be able to use brokered deposits as a source of funds. A “well capitalized” institution may accept brokered deposits without restriction. An “adequately capitalized” institution must obtain a waiver from the FDIC in order to accept, renew or roll over brokered deposits. In addition, certain interest-rate limits apply to the financial institution’s brokered and solicited deposits. Although an institution could seek permission from the FDIC to accept brokered deposits if it were no longer considered to be “well capitalized,” the FDIC may deny permission, or may permit the institution to accept fewer brokered deposits than the level considered desirable. If PCBNA’s level of deposits were to be reduced, either by the lack of a full brokered deposit waiver or by the interest rate limits on brokered or solicited deposits, Management anticipates that PCBNA would reduce its assets and, most likely, curtail its lending activities. Other possible consequences of classification as an “adequately capitalized” institution include the potential for increases in borrowing costs and terms from the Federal Home Loan Bank (“FHLB”) and other financial institutions and increases in FDIC insurance premiums. Such changes could have a material adverse effect on the Company’s results of operations, financial condition and business.
Dividends from the Bank
The principal source of funds from which PCB services its debt and pays its obligations and dividends is the receipt of dividends from PCBNA. The availability of dividends from PCBNA is limited by various statutes and regulations. It is also possible, depending upon the financial condition of PCBNA and other supervisory factors, that the OCC or FRB could restrict or prohibit PCBNA from paying dividends to PCB. In this regard, and as a result of the OCC Memorandum and FRB Memorandum, both OCC and FRB approval will now be required before PCBNA can pay dividends to PCB. In the event that PCBNA is unable to pay dividends to PCB, PCB in turn may not be able to service its debt, pay its obligations or pay dividends on its outstanding equity securities, which would adversely affect PCB’s business, financial condition, results of operations and prospects.
Deferral of Interest on Trust Preferred Securities and Suspension of Cash Dividends on Series B Preferred Stock
In the second quarter of 2009, the Company elected to defer regularly scheduled interest payments on its outstanding $69.4 million of junior subordinated notes relating to its trust preferred securities and to suspend cash dividend payments on its Series B Preferred Stock. During the deferral period, interest will continue to accrue on the junior subordinated notes at the stated coupon rate, including the deferred interest, and the Company may not, among other things and with limited exceptions, pay cash dividends on or repurchase its common stock or preferred stock nor make any payment on outstanding debt obligations that rank equally with or are junior to the junior subordinated notes. As a result of the
17
Table of Contents
Company’s deferral of interest on the junior subordinated notes, it is likely that the Company will not be able to raise funds through the offering of debt securities until the Company becomes current on those obligations or those obligations are restructured. This deferral may also adversely affect the Company’s ability to obtain debt financing on commercially reasonable terms, or at all. As a result, the Company will likely have greater difficulty in obtaining financing and, thus, will have fewer sources to enhance its capital and liquidity position. In addition, if the Company defers interest payments on the junior subordinated notes for more than 20 consecutive quarters, the Company would be in default under the governing agreements for such notes and the amount due under such agreements would be immediately due and payable.
Also during the deferral period, cash dividends on the Series B Preferred Stock will accrue and compound on each subsequent payment date, and the Company may not, among other things and with limited exceptions, pay cash dividends on or repurchase its common stock or preferred stock that ranks equally with or is junior to the Series B Preferred Stock. If the Company misses six quarterly dividend payments on the Series B Preferred Stock, whether or not consecutive, the U.S. Treasury will have the right to appoint two directors to the Company’s board of directors until all accrued but unpaid dividends have been paid.
Rating Agency Downgrades
The major credit agencies regularly evaluate the Company’s creditworthiness and assign credit ratings to the Company and the Bank. The agencies’ ratings are based on a number of factors, some of which are not within the Company’s control. In addition to factors specific to the financial strength and performance of the Company and the Bank, the agencies also consider conditions affecting the financial services industry generally. On July 31, 2009, Moody’s Investor Services (“Moody’s”) downgraded the credit rating for the financial strength of the Bank from D+ to E+ and the short-term debt of the Bank from Prime-3 to Not Prime with the long-term debt of the Bank remaining under review for a possible downgrade. On July 31, 2009, Dominion Bond Rating Service (“DBRS”) downgraded the ratings of the Company from BB (high) to B, the senior debt of the Company from BB (high) to B, and the deposits and senior debt of the Bank from BBB to BB, with all ratings remaining under review with negative implications. On December 24, 2009, Moody’s downgraded the credit ratings of the Company from Caa1 to C and the long term deposits of the Bank from B1 to B3 with the financial strength rating being under review for a possible downgrade. On December 24, 2009, DBRS downgraded their credit ratings for the Company from B to CCC and the deposits and senior debt of the Bank from BB to B with all ratings remaining under review with negative implications. On February 1, 2010, DBRS downgraded the credit ratings for the Company from CCC to CC and the senior debt of the Bank from B to CCC (high). These lower ratings, and any further ratings downgrades, could make it more difficult for the Company and the Bank to access the capital markets going forward, as the cost to borrow or raise debt or equity capital could become more expensive. Although the cost of the Bank’s primary funding sources (deposits and FHLB borrowings) is not influenced directly by the Bank’s credit ratings, no assurance can be given that the Company’s and the Bank’s credit ratings will not have any impact on the Bank’s access to deposits and FHLB borrowings. Long-term debt ratings also factor into the calculation of deposit insurance premiums, and a reduction in the Bank’s ratings would increase premiums and expense.
Continued Listing on The NASDAQ Global Select Market
The Company’s common stock is listed on The NASDAQ Global Select Market. The listing standards of The NASDAQ Global Select Market provide, among other things, that a company may be delisted if the bid price of its stock drops below $1.00 for a period of 30 consecutive business days. The closing price of the Company’s common stock was $1.20 per share on March 1, 2010. However, there were a number of days during the fourth quarter of 2009 that the stock price was below $1.00 per share. If the Company fails to comply with the listing standards applicable to issuers listed on The NASDAQ Global
18
Table of Contents
Select Market, the Company’s common stock may be delisted from The NASDAQ Global Select Market. The delisting of the Company’s common stock would significantly affect the ability of investors to trade the Company’s securities and would likely reduce the liquidity and market price of the Company’s common stock. In addition, the delisting of the Company’s common stock could also materially adversely affect the Company’s ability to raise capital on terms acceptable to the Company or at all. Delisting from The NASDAQ Global Select Market could also have other negative results, including the potential loss of confidence by customers and employees and the loss of institutional investor interest in the Company’s common stock.
Difficult Economic Conditions
The Company’s success depends, to a certain extent, upon economic and political conditions, local and national, as well as governmental monetary policies. Conditions such as inflation, recession, unemployment, changes in interest rates, money supply and other factors beyond the Company’s control may adversely affect the Company’s asset quality, deposit levels and loan demand and, therefore, earnings.
Dramatic declines in the housing market, with falling home prices and increasing delinquencies and foreclosures, have negatively impacted the credit performance of mortgage and construction loans and resulted in significant write-downs of asset values by the Company and many other financial institutions. General downward economic trends, reduced availability of commercial credit and increasing unemployment have negatively impacted the credit performance of commercial and consumer credit, resulting in additional write-downs. The resulting write-downs to assets of financial institutions have caused many financial institutions to seek additional capital, to merge with larger and stronger institutions and, in some cases, to seek government assistance or bankruptcy protection. Bank failures and liquidation or sales by the FDIC as receiver have also increased.
Many lenders and institutional investors have reduced and, in some cases, ceased to provide funding to borrowers, including to other financial institutions because of concern about the stability of the financial markets and the strength of counterparties. It is difficult to predict how long these economic conditions will exist, which of the Company’s markets, products or other businesses will ultimately be most affected, and whether Management’s actions will effectively mitigate these external factors. Accordingly, the decrease in funding sources and lack of available credit, lack of confidence in the financial sector, decreased consumer confidence, increased volatility in the financial markets and reduced business activity could materially and adversely affect the Company’s business, financial condition and results of operations.
As a result of the challenges presented by economic conditions, the Company may face the following risks in connection with these events:
| ¡ | Inability of the Company’s borrowers to make timely repayments of their loans, or decreases in value of real estate collateral securing the payment of such loans resulting in significant credit losses, which could result in increased delinquencies, foreclosures and customer bankruptcies, any of which could have a material adverse effect on the Company’s operating results. |
| ¡ | Increased regulation of the Company’s industry, including heightened legal standards and regulatory requirements or expectations imposed in connection with EESA and ARRA. Compliance with such regulation will likely increase the Company’s costs and may limit the Company’s ability to pursue business opportunities. |
| ¡ | Further disruptions in the capital markets or other events, including actions by rating agencies and deteriorating investor expectations, may result in an inability to borrow on favorable terms or at all from other financial institutions. |
19
Table of Contents
| ¡ | Increased competition among financial services companies due to the recent consolidation of certain competing financial institutions and the conversion of certain investment banks to bank holding companies, which may adversely affect the Company’s ability to market its products and services. |
| ¡ | Further increases in FDIC insurance premiums due to the market developments which have significantly depleted the Deposit Insurance Fund (“DIF”) of the FDIC and reduced the ratio of reserves to insured deposits. |
In view of the concentration of the Bank’s operations and the collateral securing the loan portfolio in California, as well as the concentration in commercial real estate loans, the Company may be particularly susceptible to the adverse economic conditions in the state of California and in the eight counties where the Company’s business is concentrated.
Legislative and Regulatory Initiatives to Address Market and Economic Conditions
EESA, which established TARP, was signed into law on October 3, 2008. As part of TARP, the U.S. Treasury established the TARP CPP to provide up to $700 billion of funding to eligible financial institutions through the purchase of capital stock and other financial instruments for the purpose of stabilizing and providing liquidity to the U.S. financial markets. Then, on February 17, 2009, the ARRA was signed into law as a sweeping economic recovery package intended to stimulate the economy and provide for broad infrastructure, energy, health, and education needs. There can be no assurance as to the actual impact that EESA or its programs, including the TARP CPP, and ARRA or its programs, will have on the national economy or financial markets. The failure of these significant legislative measures to help stabilize the financial markets and a continuation or worsening of current financial market conditions could materially and adversely affect the Company’s business, financial condition, results of operations, access to credit or the trading price of its common shares.
There have been numerous actions undertaken in connection with or following EESA and ARRA by the FRB, Congress, U.S. Treasury, the SEC and the Federal bank regulatory agencies in efforts to address the current liquidity and credit crisis in the financial industry. These measures include homeowner relief that encourages loan restructuring and modification; the temporary increase in FDIC deposit insurance from $100,000 to $250,000, the establishment of significant liquidity and credit facilities for financial institutions and investment banks; the lowering of the Federal funds rate; emergency action against short selling practices; a temporary guaranty program for money market funds; the establishment of a commercial paper funding facility to provide back-stop liquidity to commercial paper issuers; and coordinated international efforts to address illiquidity and other weaknesses in the banking sector. The purpose of these legislative and regulatory actions is to help stabilize the U.S. banking system. EESA, ARRA and the other regulatory initiatives described above may not have their desired effects. If the volatility in the markets continues and economic conditions fail to improve or worsen, the Company’s business, financial condition and results of operations could be materially and adversely affected.
Changes in Legislation and Regulation of Financial Institutions
The financial services industry is extensively regulated. PCBNA is subject to extensive regulation, supervision and examination by the OCC and the FDIC. As a holding company, the Company is subject to regulation and oversight by the FRB. The Company is now also subject to supervision, regulation and investigation by the U.S. Treasury and Office of the Special Inspector General for the Troubled Asset Relief Program (“SIGTARP”) under EESA by virtue of its participation in the TARP CPP. Federal and State regulation is designed primarily to protect the deposit insurance funds and consumers, and not to benefit the Company’s shareholders. Such regulations can at times impose significant limitations on the Company’s operations. Regulatory authorities have extensive discretion in
20
Table of Contents
connection with their supervisory and enforcement activities, including the imposition of restrictions on the operation of an institution, the classification of assets by the institution and assessment of the adequacy of an institution’s allowance for loan losses (“ALL”). Proposals to change the laws governing financial institutions are frequently raised in Congress and before bank regulatory authorities. Changes in applicable laws or policies could materially affect the Company’s business, and the likelihood of any major changes in the future and their effects are impossible to determine. Moreover, it is impossible to predict the ultimate form any proposed legislation might take or how it might affect the Company.
Strength and Stability of Other Financial Institutions
The actions and commercial soundness of other financial institutions could affect the Company’s ability to engage in routine funding transactions. Financial services to institutions are interrelated as a result of trading, clearing, counterparty or other relationships. The Company has exposure to different industries and counterparties, and executes transactions with various counterparties in the financial industry, including brokers and dealers, commercial banks, investment banks, mutual and hedge funds, and other institutional clients. Recent defaults by financial services institutions, and even rumors or questions about one or more financial services institutions or the financial services industry in general, have led to market-wide liquidity problems and could lead to losses or defaults by the Company or by other institutions. Many of these transactions expose the Company to credit risk in the event of default of its counterparty or client. In addition, the Company’s credit risk may increase when the collateral held by it cannot be realized upon or is liquidated at prices not sufficient to recover the full amount of the loan or derivative exposure due to the Company. Any such losses could materially and adversely affect the Company’s results of operations.
Unprecedented Market Volatility
The capital and credit markets have been experiencing volatility and disruption for more than two years. In some cases, the markets have produced downward pressure on stock prices and credit availability for certain issuers seemingly without regard to those issuers’ underlying financial strength. If current levels of market disruption and volatility continue or worsen, there can be no assurance that the Company will not experience an adverse effect, which may be material, on the Company’s ability to access capital and on the business, financial condition and results of operations.
The market price for the Company’s common stock has been volatile in the past, and several factors could cause the price to fluctuate substantially in the future, including:
| ¡ | announcements of developments related to the Company’s business; |
| ¡ | fluctuations in the Company’s results of operations; |
| ¡ | sales of substantial amounts of the Company’s securities into the marketplace; |
| ¡ | general conditions in the Company’s markets or the worldwide economy; |
| ¡ | a shortfall in revenues or earnings compared to securities analysts’ expectations; |
| ¡ | changes in analysts’ recommendations or projections and |
| ¡ | disclosure of adverse regulatory developments. |
Estimating the Allowance for Loan Losses
The allowance for loan losses may not be adequate to cover actual losses. A significant source of risk arises from the possibility that the Company could sustain losses because borrowers, guarantors, and related parties may fail to perform in accordance with the terms of their loans. The underwriting and credit monitoring policies and procedures that the Company has adopted to address this risk may not prevent unexpected losses. These losses could have a material adverse effect on the Company’s
21
Table of Contents
business, financial condition, results of operations and cash flows. Management maintains an allowance for loan and lease losses to provide for loan defaults and non-performance. The allowance is also appropriately increased for new loan growth. Management believes that the allowance for loan losses is adequate to cover current losses. Management expects, however, to make additional provisions for loan losses for the next several quarters, through 2010, and possibly beyond, due to the anticipated ongoing deterioration in the local and national real estate markets and economies. In addition, federal regulators periodically evaluate the adequacy of the Company’s allowance for loan losses and may require the Company to increase its provision for loan losses or recognize further loan charge-offs based on judgments different from those of Management.
Liquidity Risk
Liquidity is essential to the Company’s business. An inability to raise funds through deposits, borrowings, the sale of loans and other sources could have a material adverse effect on the Company’s liquidity. The Company’s access to funding sources in amounts adequate to finance the Company’s activities could be impaired by factors that affect us specifically or the financial services industry in general. Factors that could detrimentally impact the Company’s access to liquidity sources include a decrease in the level of the Company’s business activity due to a market downturn, adverse regulatory action against the Company or the Bank, a reduction in the Company’s credit ratings, an increase in costs of capital in financial capital markets, or a decrease in depositor or investor confidence in the Company. The Bank’s ability to acquire deposits or borrow could also be impaired by factors that are not specific to the Company, such as a severe disruption of the financial markets or negative views and expectations about the prospects for the financial services industry as a whole as the recent turmoil faced by financial institutions in the domestic and worldwide credit markets deteriorates.
Interest Rate Risk
The banking industry is subject to interest rate risk and variations in interest rates may negatively affect the Company’s financial performance. A substantial portion of the Bank’s income is derived from the differential or “spread” between the interest earned on loans, securities and other interest-earning assets, and interest paid on deposits, borrowings and other interest-bearing liabilities. Because of the inherent differences in the maturities and repricing characteristics of the Bank’s interest-earning assets and interest-bearing liabilities, changes in interest rates do not produce equivalent changes in interest income earned on interest-earning assets and interest paid on interest-bearing liabilities. Fluctuations in interest rates could adversely affect the Bank’s interest rate spread and, in turn, the Company’s profitability. In addition, loan origination volumes are affected by market interest rates. Rising interest rates, generally, are associated with a lower volume of loan originations while lower interest rates are usually associated with higher loan originations. Conversely, in rising interest rate environments, loan repayment rates may decline and in falling interest rate environments, loan repayment rates may increase. In addition, in a rising interest rate environment, Management may need to accelerate the pace of rate increases on the Bank’s deposit accounts as compared to the pace of future increases in short-term market rates. Accordingly, changes in levels of market interest rates could materially and adversely affect the Bank’s net interest spread, asset quality and loan origination volume.
Concentration of Commercial Real Estate Loans and Commercial Business Loans
At December 31, 2009, $1.93 billion, or 37.4% of the Bank’s loan portfolio consisted of commercial real estate loans. Commercial real estate loans constitute a greater percentage of the Bank’s loan portfolio than any other loan category, including residential real estate loans secured by one to four family units, which totaled $971.7 million, or 18.8% of the Bank’s total loan portfolio at December 31, 2009. In addition, at December 31, 2009, $977.4 million, or 18.9% of the Bank’s loan portfolio consisted of commercial loans. Commercial real estate loans and commercial loans generally expose a lender to
22
Table of Contents
greater risk of non-payment and loss than one to four family loans because repayment of the loans often depends on the successful operation of the property and/or the income stream of the borrower. Commercial loans expose the Company to additional risks since they are generally secured by business assets that may depreciate over time. Such loans typically involve larger loan balances to single borrowers or groups of related borrowers compared to one to four family loans. Also, many of the Bank’s commercial borrowers have more than one loan outstanding with the Company. Consequently, an adverse development with respect to one loan or one credit relationship can expose the Company to a significantly greater risk of loss compared to an adverse development with respect to a one to four family loan. Changes in economic conditions that are out of the control of the borrower and lender could impact the value of the security for the loan, the future cash flow of the affected property or borrower, or the marketability of a construction project with respect to loans originated for the acquisition and development of property. Additionally, any decline in real estate values may be more pronounced with respect to commercial real estate properties than residential real estate properties. While Management intends to reduce the concentration of such loans in the Bank’s loan portfolio, there can be no assurance that Management will be successful in doing so.
Non Performing Assets
At December 31, 2009, the Bank’s nonperforming loans (which consist of non-accrual loans) totaled $397.8 million, or 7.70% of the Bank’s loan portfolio. At December 31, 2009, the Bank’s non-performing assets (which include foreclosed real estate) were $437.0 million, or 5.79% of assets. In addition, the Bank had approximately $476.7 million in accruing loans that were 30-89 days delinquent at December 31, 2009. The Bank’s non-performing assets adversely affect the Company’s net income in various ways. Until economic and market conditions improve, the Bank expects to continue to incur additional losses relating to an increase in non-performing loans. The Bank does not record interest income on non-accrual loans or other real estate owned, thereby adversely affecting the Bank’s income, and increasing the Bank’s loan administration costs. When the Bank takes collateral in foreclosures and similar proceedings, Management is required to mark the related loan to the then fair market value of the collateral, which may result in a loss. These loans and other real estate owned also increase the Bank’s risk profile and the capital the regulators believe is appropriate in light of such risks. While the Bank has reduced its problem assets through loan sales, workouts, restructurings and otherwise, decreases in the value of these assets, or the underlying collateral, or in these borrowers’ performance or financial conditions, whether or not due to economic and market conditions beyond the Company’s control, could adversely affect the Company’s business, results of operations and financial condition. In addition, the resolution of nonperforming assets requires significant commitments of time from Management and the board of directors, which can be detrimental to the performance of their other responsibilities. There can be no assurance that the Bank will not experience further increases in nonperforming loans in the future, or that nonperforming assets will not result in further losses in the future.
Competition from Financial Service Companies
The Company faces increased strong competition from financial services companies and other companies that offer banking services. The Company conducts most of its operations in California. Increased competition in its markets may result in reduced loans and deposits. Ultimately, the Company may not be able to compete successfully against current and future competitors as many competitors offer some of the banking services that the Bank offers in service areas. These competitors include national banks, regional banks and other community banks. The Company also faces competition from many other types of financial institutions, including savings institutions, industrial banks, finance companies, brokerage firms, insurance companies, credit unions, mortgage banks and other financial intermediaries. In particular, the Bank’s competitors include major financial companies whose greater resources may afford them a marketplace advantage by enabling them to maintain numerous locations and mount extensive promotional and advertising campaigns. Areas of competition include interest rates for loans and deposits, efforts to obtain loan and deposit customers
23
Table of Contents
and a range in quality of products and services provided, including new technology-driven products and services. If the Bank is unable to attract and retain banking customers, it may be unable to continue loan growth and level of deposits.
FDIC Premiums
FDIC insurance premiums increased substantially in 2009, and the Bank expects to pay significantly higher FDIC premiums in the future. The FDIC has recently been considering different methodologies by which it may increase premium amounts, because the costs associated with bank resolutions or failures have substantially depleted the Deposit Insurance Fund. In November 2009, the FDIC voted to require insured depository institutions to prepay slightly over three years of estimated insurance assessments. While the Bank was able to obtain an exemption from this prepayment requirement due to its current financial condition, the increase in premiums significantly increased the Company’s non-interest expense in 2009, and may continue to do so for the foreseeable future.
Operational Risk
Operational risk represents the risk of loss resulting from the Company’s operations, including but not limited to, the risk of fraud by employees or persons outside the Company, the execution of unauthorized transactions, transaction processing errors by employees, and breaches of internal control system and compliance requirements. This risk of loss also includes the potential legal actions that could arise as a result of an operational deficiency or as a result of noncompliance with applicable regulatory standards, adverse business decisions or their implementation and customer attrition due to negative publicity.
Operational risk is inherent in all business activities and the management of this risk is important to the achievement of the Company’s objectives. In the event of a breakdown in the internal control system, improper operation of systems or improper employee actions, the Company could suffer financial loss, face regulatory action and suffer damage to its reputation. The Company manages operational risk through a risk management framework and its internal control processes. The Company believes that it has designed effective methods to minimize operational risks. Business disruption could occur in the event of a disaster and there is no absolute assurance that operational losses would not occur.
Reputation Risk
Reputation risk, or the risk to the Company’s earnings and capital from negative publicity or public opinion, is inherent in Company’s business. Negative publicity or public opinion could adversely affect the Bank’s ability to keep and attract customers and expose the Company to adverse legal and regulatory consequences. Negative public opinion could result from the Company’s actual or perceived conduct in any number of activities, including lending practices, corporate governance, regulatory compliance, mergers and acquisitions, and disclosure, sharing or inadequate protection of customer information, and from actions taken by government regulators and community organizations in response to that conduct.
Restrictions Resulting from Participation in the TARP CPP
Pursuant to the terms of the Securities Purchase Agreement, the Company’s ability to declare or pay dividends on any of the Company’s shares is limited. Specifically, the Company may not declare cash dividends on common shares, junior preferred shares or pari passu preferred shares when the Company is in arrears on the payment of dividends on the Series B Preferred Stock. Further, the Company is not permitted to increase dividends on its common shares above the amount of the last quarterly cash dividend per share declared prior to October 14, 2008 ($0.22 per share) without the U.S. Treasury’s approval until November 21, 2011, unless all of the Series B Preferred Stock has been redeemed or transferred by the U.S. Treasury to unaffiliated third parties. In addition, the Company’s
24
Table of Contents
ability to repurchase its shares is restricted. The consent of the U.S. Treasury generally is required for the Company to make any stock repurchase (other than in connection with the administration of any employee benefit plan in the ordinary course of business and consistent with past practice) until November 21, 2011, unless all of the Series B Preferred Stock has been redeemed or transferred by the U.S. Treasury to unaffiliated third parties. Further, common shares, junior preferred shares or pari passu preferred shares may not be repurchased when the Company is in arrears on the payment of Series B Preferred Stock dividends. The terms of the Securities Purchase Agreement allow the U.S. Treasury to impose additional restrictions, including those on dividends and including unilateral amendments required to comply with changes in applicable Federal law.
In addition, pursuant to the terms of the Securities Purchase Agreement, the Company adopted the U.S. Treasury’s current standards for executive compensation and corporate governance for the period during which the U.S. Treasury holds the equity securities issued pursuant to the Securities Purchase Agreement, including the common shares which may be issued upon exercise of the Warrant. These standards generally apply to the SEOs and other highly-compensated employees. The standards include (i) ensuring that incentive compensation plans and arrangements for SEOs do not encourage unnecessary and excessive risks that threaten the Company’s value; (ii) required clawback of any bonus or incentive compensation paid (or under a legally binding obligation to be paid) to the SEOs and next 20 most highly-compensated employees based on materially inaccurate financial statements or other materially inaccurate performance metric criteria; (iii) prohibition on making “golden parachute payments” to SEOs and five most highly-compensated employees; and (iv) agreement not to claim a deduction, for Federal income tax purposes, for compensation paid to any of the SEOs in excess of $500,000 per year. In particular, the change to the deductibility limit on executive compensation will likely increase the overall cost of the Company’s compensation programs in future periods.
The adoption of the ARRA on February 17, 2009 imposed certain new executive compensation and corporate expenditure limits on all current and future TARP recipients, including the Company, until the institution has repaid the U.S. Treasury, which is now permitted under the ARRA without penalty and without the need to raise new capital, subject to the U.S. Treasury’s consultation with the recipient’s appropriate regulatory agency. The executive compensation standards are more stringent than those currently in effect under the TARP CPP or those previously proposed by the U.S. Treasury. The new standards include (but are not limited to) (i) prohibitions on bonuses, retention awards and other incentive compensation payable to the five most highly-compensated employees, other than restricted stock grants which do not fully vest during the TARP period up to one-third of an employee’s total annual compensation, (ii) prohibitions on golden parachute payments payable to the SEOs and five most highly-compensated employees for departure from a company or upon a change in control, (iii) an expanded clawback of bonuses, retention awards, and incentive compensation if payment is based on materially inaccurate statements of earnings, revenues, gains or other criteria, (iv) prohibitions on compensation plans that encourage manipulation of reported earnings, (v) retroactive review of bonuses, retention awards and other compensation previously provided by TARP recipients if found by the Treasury to be inconsistent with the purposes of TARP or otherwise contrary to public interest, (vi) required establishment of a company-wide policy regarding “excessive or luxury expenditures,” and (vii) inclusion in a participant’s proxy statements for annual shareholder meetings of a nonbinding “Say on Pay” shareholder vote on the compensation of executives.
Future Sales of Securities
Under certain circumstances, the Company’s Board of Directors has the authority, without any vote of the Company’s shareholders, to issue shares of the Company’s authorized but unissued securities, including common shares authorized and unissued under the Company’s stock option plans or additional shares of preferred stock. In the future, the Company may issue additional securities, through public or private offerings, in order to raise additional capital. It is also possible that the
25
Table of Contents
Company’s regulators will require the Company to raise additional capital. Any such issuance would dilute the percentage of ownership interest of existing shareholders and may dilute the per share value of the common shares or any other then-outstanding class or series of the Company’s securities.
Increased Likelihood of Class Action Litigation and Additional Regulatory Enforcement
The market price of the Company’s common stock has declined substantially over the past year. This decline could result in shareholder class action lawsuits, such as the securities class actions described in Note 18, “Commitments and Contingencies” in the Consolidated Financial Statements in this Form 10-K, even if the activities subject to complaint are not unlawful, and even if the lawsuits are ultimately unsuccessful. Recent events in financial markets and negative publicity may result in more regulation and legislative scrutiny of the Company’s industry practices and may cause additional exposure to increased shareholder litigation and additional regulatory enforcement actions, which would adversely affect the Company’s business.
Reverse Stock Split
At the Company’s special meeting of shareholders held on September 29, 2009, the Company’s shareholders approved a proposal to effect a reverse stock split of the Company’s common stock by a ratio of not less than one-for-three and not more than one-for-ten, with the exact ratio to be set at a whole number within this range as determined by the Company’s Board of Directors in its sole discretion, and authorized the Board of Directors to effect the reverse stock split at any time prior to August 31, 2010 unless the Company’s Board of Directors elects to abandon the reverse stock split after a determination that it is no longer in the best interests of the Company and its shareholders. Reducing the number of outstanding shares of the Company’s common stock through the reverse stock split is intended, absent other factors, to increase the per share market price of the Company’s common stock. However, other factors, such as the Company’s financial results, market conditions and the market perception of the Company’s business, may adversely affect the market price of the Company’s common stock. As a result, there can be no assurance that the reverse stock split, if completed, will result in making the Company’s common stock more attractive to a broader range of institutional and other investors, that the per share market price of the Company’s common stock will increase following the reverse stock split or that the per share market price of the Company’s common stock will not decrease in the future. Additionally, Management cannot assure shareholders that the per share market price per share of the Company’s common stock after the reverse stock split, if completed, will increase in proportion to the reduction in the number of shares of the Company’s common stock outstanding before the reverse stock split. Accordingly, the total market capitalization of the Company’s common stock after the reverse stock split may be lower than the total market capitalization before the reverse stock split.
Anti-Takeover Provisions
Various provisions of the Company’s articles of incorporation and bylaws could delay or prevent a third-party from acquiring the Company even if doing so might be beneficial to the Company’s shareholders. The Bank Holding Company Act of 1956 (“BHCA”), as amended, and the Change in Bank Control Act of 1978, as amended, together with Federal regulations, require that, depending on the particular circumstances, either regulatory approval must be obtained or notice must be furnished to the appropriate regulatory agencies and not disapproved prior to any person or entity acquiring “control” of a national bank, such as PCBNA. These provisions may prevent a merger or acquisition that would be attractive to shareholders and could limit the price investors would be willing to pay in the future for the Company’s common stock.
Dependence on Personnel
Competition for qualified employees and personnel in the banking industry is intense and there are a limited number of qualified persons with knowledge of, and experience in, the California banking
26
Table of Contents
industry. The process of recruiting personnel with the combination of skills and attributes required to carry out the Company’s strategies is often lengthy. In addition, EESA, TARP CPP and the ARRA has imposed significant limitations on executive compensation for recipients of TARP funds, such as PCB, which may make it more difficult for the Company to retain and recruit key personnel. The Company’s financial success depends to a significant degree on the Company’s ability to attract and retain qualified management, loan origination, finance, administrative, marketing and technical personnel and upon the continued contributions of the Company’s management and personnel. In particular, the Company’s success has been and continues to be highly dependent upon the abilities of key executives, including the Company’s President, and certain other employees.
| ITEM 1B. | UNRESOLVED STAFF COMMENTS |
None.
| ITEM 2. | PROPERTIES |
The Company is currently reviewing all locations to ensure that the locations leased and owned are fully occupied and that the retail branch locations are consistent with the strategic initiatives of the Company and continue to meet the needs of the Bank’s customers.
The Company’s executive offices are located at 1021 Anacapa Street in Santa Barbara, California. Management is currently in the process of negotiating with the owners of the building for an early termination of the operating lease. In addition, the Company occupies six administrative offices for support department operations in Santa Barbara, Ventura, Monterey and Los Angeles counties. These offices include human resources, information technology, loan and deposit operations, finance and accounting, and other support functions. As of December 31, 2008, the Company had five administrative offices for support department operations. The increase in administrative offices in 2009 relates to a loan production office that is currently included as an administrative support office in Monterey County that no longer produces loans. As result, this office is now only used for administrative support and included above.
Of the Company’s 50 locations which collect deposits and provide banking services, 37 are leased and 13 are owned. These 50 locations are located in the Los Angeles, Monterey, San Benito, San Luis Obispo, Santa Barbara, South Santa Clara, Santa Cruz, and Ventura Counties.
As of December 31, 2008, the Company had 51 locations. The activity in 2009 included the closure of the North Lompoc and South Broadway branches and the opening of the retail branch location within a retirement community in Santa Barbara County. In addition, the master lease on a retail shopping center where one of its retail branches is located was assigned in July 2009 as disclosed in Note 14, “Long-Term Debt and Other Borrowings” of the Consolidated Financial Statements. As part of the strategic initiatives discussed above, two retail locations in Buellton and Vandenberg Village are being consolidated into nearby locations and are scheduled to close in April 2010 and two CWMG locations in San Jose and Calabasas were closed in January and February 2010, respectively.
The Company also occupies 13 loan production offices that include administrative support. Of the 13 locations, 11 are leased and two are owned. The offices are located in Santa Barbara, Monterey, San Benito, South Santa Clara, San Diego, San Luis Obispo, and Los Angeles Counties. These production offices originate various loan products including SBA, RALs, commercial real estate, residential real estate, commercial, consumer and private banking. Included in these 13 loan offices, are two leases for the offices for the RAL and RT Program operations which have subsequently been assumed by the purchaser as part of the sale of the RAL and RT Programs on January 14, 2010. For more information on the RAL and RT Program sale, refer to Note 26, “Subsequent Events” of the Consolidated Financial
27
Table of Contents
Statements. As of December 31, 2008, the Company had 17 loan production offices that include administrative support. The decrease during 2009 is result of the closing of three offices that were located in Monterey, Orange and Sacramento Counties. Also, as mentioned above, there was one office in Monterey that no longer offers loan products.
In addition, the Company has several locations that are leased and owned for storage, parking and administrative support offices that are vacant and are not included in the numbers disclosed above. The administrative offices consist of a building capital lease in Santa Barbara and a CWMG location in Ventura County, both of which are expected to be occupied in 2010.
| ITEM 3. | LEGAL PROCEEDINGS |
The Company has been named in lawsuits filed by customers and others. These lawsuits are described in Note 18, “Commitments and Contingencies” in the Consolidated Financial Statements beginning on page 156. The Company does not expect that these suits will have any material impact on its financial condition or operating results.
The Company is involved in various other litigation of a routine nature that is being handled and defended in the ordinary course of the Company’s business. In the opinion of Management, based in part on consultation with legal counsel, the resolution of these litigation matters will not have a material impact on the Company’s financial condition or operating results.
| ITEM 4. | RESERVED |
28
Table of Contents
PART II
| ITEM 5. | MARKET FOR THE REGISTRANT’S COMMON EQUITY, RELATED STOCKHOLDER MATTERS AND ISSUER PURCHASES OF EQUITY SECURITIES |
Market Information
The Company’s common stock trades on the NASDAQ Global Select Market under the symbol “PCBC”. The following table presents the high and low sales prices of the Company’s common stock for each quarterly period for the last two years as reported by the NASDAQ Global Select Market:
| 2009 Quarters | 2008 Quarters | |||||||||||||||||||||||
| Fourth | Third | Second | First | Fourth | Third | Second | First | |||||||||||||||||
| Range of stock prices: |
||||||||||||||||||||||||
| High |
$ | 1.93 | $ | 3.37 | $ | 8.86 | $ | 17.47 | $ | 21.42 | $ | 27.99 | $ | 24.15 | $ | 23.50 | ||||||||
| Low |
0.61 | 1.44 | 2.05 | 5.80 | 11.25 | 9.88 | 13.76 | 16.08 | ||||||||||||||||
Dividends
The Company has historically declared cash dividends to its shareholders each quarter. In the second quarter of 2009, the Company’s Board of Directors elected to suspend the payment of cash dividends on its common stock to preserve capital.
The Company’s Board of Directors has the responsibility for oversight and approval for the declaration of dividends and in January 2009, they adopted a new dividend policy to enhance sound capital management and to take into consideration the guidelines required under the TARP CPP. The new policy gives the CFO the responsibility for recommending dividend payments that meet the Company’s and Bank’s capital objectives within the regulatory and statutory limitations. When quarterly dividends are recommended by the CFO, the following items are taken into consideration: the Company’s near and long-term earnings capacity, current and future capital position, the dividend payout ratio, and dividend yield. The new policy also changes the declaration and payment dates for all prospective dividends to be paid on the last business day of each quarter.
The following table presents cash dividends declared per share for the last two years:
| 2009 Quarters | 2008 Quarters | |||||||||||||||||||||||
| Fourth | Third | Second | First | Fourth | Third | Second | First | |||||||||||||||||
| Cash dividends declared: |
$ | — | $ | — | $ | — | $ | 0.11 | $ | 0.22 | $ | 0.22 | $ | 0.22 | $ | 0.22 | ||||||||
The Company funds the dividends paid to shareholders primarily from dividends received from PCBNA. For discussion on restrictions on the declaration and payment of dividends refer to the Capital Resources section of the MD&A on page 71, Regulation and Supervision discussion of “Dividends and Other Transfer of Funds” on page 82 and on page 161, Note 20, “Regulatory Capital Requirements” of the Consolidated Financial Statements.
Holders
There were approximately 13,358 shareholders of record at December 31, 2009. This number includes an estimate of the number of shareholders whose shares are held in the name of brokerage firms or other financial institutions. The Company is not provided with the exact number or identities of these shareholders, but has estimated the number of such shareholders from the number of shareholder documents requested by these firms for distribution to their customers.
Based on filings with the SEC by institutional investors, approximately 29.7% of the Company’s shares are owned by these institutions. These institutions may be investing for their own accounts or acting as investment managers for other investors.
29
Table of Contents
Stock Performance
The following graph shows a five year comparison of cumulative total returns for the Company’s common stock, the Standard & Poor’s 500 stock Index and the NASDAQ Bank Index, each of which assumes an initial value of $100 and reinvestment of dividends.
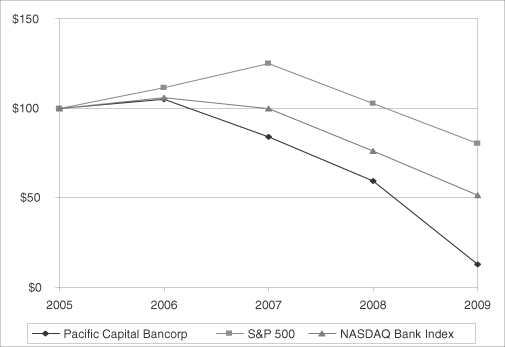
Securities Authorized for Issuance Under Equity Compensation Plans
The following table provides information at December 31, 2009 with respect to shares of Company common stock that may be issued under the Company’s existing equity compensation plans.
| December 31, 2009 | |||||||
| Plan category |
Number of securities to be issued upon exercise of outstanding options, warrants and rights (a) |
Weighted-average exercise price of outstanding options, warrants and rights (b) |
Number of securities remaining available for future issuance under equity compensation plans (excluding securities reflected in column (a)) (c) | ||||
| Equity compensation plans approved by security holders |
1,589,168 | $ | 24.12 | 2,259,663 | |||
| Equity compensation plans not approved by security holders |
— | — | — | ||||
| Total |
1,589,168 | $ | 24.12 | 2,259,663 | |||
| (a) | Included in column (a) are unexercised stock options granted to directors and employees through current and expired option plans. This amount includes shares of unvested restricted stock. |
| (b) | This is the weighted-average exercise price of all stock options and restricted stock that is outstanding at December 31, 2009. |
| (c) | Securities remaining available for future issuance are for the 2008 Equity Incentive Plan. |
30
Table of Contents
| ITEM 6. | SELECTED FINANCIAL DATA |
The following table compares selected financial data for 2009 with the same data for the four prior years. The Company’s Consolidated Financial Statements and the accompanying notes are presented in Item 8 and MD&A in Item 7 beginning on the next page explain reasons for the year-to-year changes. The following data has been derived from the Consolidated Financial Statements of the Company and should be read in conjunction with those statements and the notes thereto, which are included in this report.
| Year Ended December 31, | ||||||||||||||||||||
| 2009 | 2008 | 2007 | 2006 | 2005 | ||||||||||||||||
| (dollars and share amounts in thousands, except per share amounts) | ||||||||||||||||||||
| RESULTS OF OPERATIONS: |
||||||||||||||||||||
| Interest income |
$ | 505,516 | $ | 519,333 | $ | 583,609 | $ | 564,526 | $ | 426,157 | ||||||||||
| Interest expense |
(165,252 | ) | (178,819 | ) | (222,411 | ) | (190,767 | ) | (111,505 | ) | ||||||||||
| Net interest income |
340,264 | 340,514 | 361,198 | 373,759 | 314,652 | |||||||||||||||
| Provision for loan losses |
(426,936 | ) | (218,335 | ) | (113,272 | ) | (64,693 | ) | (53,873 | ) | ||||||||||
| Non-interest income |
135,124 | 175,946 | 184,507 | 153,327 | 111,898 | |||||||||||||||
| Non-interest expense |
(462,876 | ) | (339,445 | ) | (275,360 | ) | (314,983 | ) | (214,380 | ) | ||||||||||
| (Loss)/income before taxes |
(414,424 | ) | (41,320 | ) | 157,073 | 147,410 | 158,297 | |||||||||||||
| Provision/(benefit) for income taxes |
6,837 | (18,570 | ) | 56,185 | 52,870 | 59,012 | ||||||||||||||
| Net (loss)/income |
(421,261 | ) | (22,750 | ) | 100,888 | 94,540 | 99,285 | |||||||||||||
| Dividends and accretion of preferred stock |
9,996 | 1,094 | — | — | — | |||||||||||||||
| Net (loss)/income applicable to common shareholders |
$ | (431,257 | ) | $ | (23,844 | ) | $ | 100,888 | $ | 94,540 | $ | 99,285 | ||||||||
| PER SHARE DATA: |
||||||||||||||||||||
| Average number of common shares - basic |
46,693 | 46,273 | 46,816 | 46,770 | 45,964 | |||||||||||||||
| Average number of common shares - diluted |
47,197 | 46,644 | 47,082 | 47,099 | 46,358 | |||||||||||||||
| (Loss)/ income applicable per common share - diluted (1) |
$ | (9.24 | ) | $ | (0.52 | ) | $ | 2.14 | $ | 2.01 | $ | 2.14 | ||||||||
| Book value per common share |
$ | 4.02 | $ | 13.14 | $ | 14.49 | $ | 13.17 | $ | 11.69 | ||||||||||
| BALANCE SHEET: |
||||||||||||||||||||
| Total loans |
$ | 5,166,431 | $ | 5,764,856 | $ | 5,359,155 | $ | 5,720,847 | $ | 4,898,381 | ||||||||||
| Total assets |
$ | 7,542,255 | $ | 9,573,020 | $ | 7,374,115 | $ | 7,490,435 | $ | 6,871,445 | ||||||||||
| Total deposits |
$ | 5,446,194 | $ | 6,588,702 | $ | 4,963,581 | $ | 5,045,847 | $ | 5,016,915 | ||||||||||
| Long-term debt (2) |
$ | 1,311,828 | $ | 1,740,240 | $ | 1,405,602 | $ | 1,401,172 | $ | 803,212 | ||||||||||
| Total shareholders’ equity |
$ | 364,603 | $ | 788,437 | $ | 668,356 | $ | 617,376 | $ | 545,256 | ||||||||||
| OPERATING AND CAPITAL RATIOS: |
||||||||||||||||||||
| Leverage ratio |
7.0 | % | 9.2 | % | 8.8 | % | 8.3 | % | 8.1 | % | ||||||||||
| Return on average total assets |
n/a | n/a | 1.4 | % | 1.3 | % | 1.6 | % | ||||||||||||
| Return on average total shareholder’s equity |
n/a | n/a | 15.3 | % | 16.0 | % | 19.2 | % | ||||||||||||
| Tier 1 capital to Average Tangible Assets ratio |
5.3 | % | 8.8 | % | 8.0 | % | 7.5 | % | 6.6 | % | ||||||||||
| Tier 1 capital to Risk Weighted Assets ratio |
7.8 | % | 11.8 | % | 9.7 | % | 8.8 | % | 8.0 | % | ||||||||||
| Total Tier 1 & Tier 2 Capital to Risk Weighted Assets ratio |
10.4 | % | 14.6 | % | 12.3 | % | 11.7 | % | 11.3 | % | ||||||||||
| Dividend payout ratio |
n/a | n/a | 41.1 | % | 43.8 | % | 36.4 | % | ||||||||||||
| (1) | (Loss)/income per diluted common share for the years ended December 31, 2009 and 2008 is calculated using basic weighted average shares outstanding. |
| (2) | Includes obligations under capital lease. |
31
Table of Contents
| ITEM 7. | MANAGEMENT’S DISCUSSION AND ANALYSIS OF FINANCIAL CONDITION AND RESULTS OF OPERATIONS |
FINANCIAL OVERVIEW AND HIGHLIGHTS
The following discussion should be read in conjunction with the Company’s financial statements and the related notes provided under “Item 8—Consolidated Financial Statements and Supplementary Data.”
FINANCIAL RESULTS OF 2009
Net loss for the Company was $421.3 million or $431.3 million of net loss applicable to common shareholders for 2009 compared to a net loss of $22.8 million or $23.8 million of net loss applicable to common shareholders for 2008. The loss for 2009 was $9.24 per diluted common share compared to $0.52 per diluted common share for 2008. Net loss applicable to common shareholders increased by $407.4 million for the year ended December 31, 2009 compared to 2008.
The significant factors impacting the net loss for the Company during 2009 were:
| ¡ | The continued deterioration of the economy caused a decline in asset quality, evidenced by increased net charge-offs of $293.4 million and an increase in non-performing loans of $163.4 million; this decline required an increase in the allowance for loan losses to 5.26% of total loans at December 31, 2009 to adequately provide for Management’s estimate of losses inherent in the loan portfolios; |
| ¡ | Increased losses and funding costs for the 2009 RAL season; |
| ¡ | A goodwill impairment charge of $128.7 million was recognized in the second quarter of 2009; and |
| ¡ | Established a valuation allowance of $145.9 million against the Company’s deferred tax assets. |
The impact to the Company from these items, and others of both a positive and negative nature, will be discussed in more detail as they pertain to the Company’s overall comparative performance for the year ended December 31, 2009 throughout the analysis sections of this report.
FINANCIAL RESULTS OF 2008
Net loss for the Company was $22.8 million or $23.8 million of net loss applicable to common shareholders compared to net income of $100.9 million for 2007. The net loss for 2008 was $0.52 per diluted common share compared to net income of $2.14 per diluted common share for 2007. Net income decreased $123.6 million for fiscal year 2008 compared to 2007.
The significant factors impacting the net loss for the Company during 2008 were:
| ¡ | Provision for loan losses of $218.3 million due to the downturn in the economy, which served to i) increase allowance to total loans from 83 basis points to 244 basis points during the year, and ii) cover approximately $121 million in loan net charge-offs or write downs during the year; |
| ¡ | A 400 basis point decrease in the Federal Open Market Committee of the Federal Reserve System (“FOMC”)’s Federal funds interest rate decreasing from 4.25% at December 31, 2007 to 0.25% at December 31, 2008, which contributed to a decline in the net interest margin from 5.24% at December 31, 2007 to 4.81% at December 31, 2008; |
32
Table of Contents
| ¡ | Increased volumes in the RAL and RT Programs products which increased profitability in this segment from $47.1 million of income before tax for the year ended December 31, 2007 to $118.0 million before tax for the year ended December 31, 2008; and |
| ¡ | A goodwill impairment charge of $22.1 million was recognized in the third quarter of 2008. |
FINANCIAL RESULTS OF 2007
The significant factors impacting earnings of the Company during 2007 were:
| ¡ | During 2007 the Company implemented strategic balance sheet initiatives which included the sale of its $254.0 million leasing loan portfolio, $221.8 million of its indirect auto loan portfolio and a conversion of $284.5 million of residential real estate loans to securities. Despite these transactions, interest income from loans increased $23.9 million, or 4.7% for 2007 compared to 2006. This increase was primarily due to strong loan growth. |
| ¡ | Increased cost of funds which resulted in a $31.6 million increase in interest expense for 2007 compared to 2006. |
| ¡ | A $55.3 million increase in net loan losses related to the RAL program for 2007 compared to 2006 due to increased tax fraud. |
| ¡ | A 100 basis point decrease in the FOMC’s target Federal funds rate from 5.25% to 4.25%, the combination of a flattening, and even inverted, yield curve and intense competition for both loans and deposits continued to compress interest margins, which resulted in a decline in net interest margin to 5.24% from 5.76%. |
| ¡ | Company wide efforts to control expenses while striving to improve service levels to customers, which resulted in improvement in the Company’s efficiency ratio to 49.91% for 2007 from 58.13% for the year ended December 31, 2006. |
33
Table of Contents
INTEREST INCOME
The Company’s primary source of income is interest income. The following tables present a summary of interest income and the increases and decreases within the interest income line items for the three years ended December 31, 2009, 2008 and 2007:
| Year Ended December 31, | |||||||||
| 2009 | 2008 | 2007 | |||||||
| (in thousands) | |||||||||
| Interest income: |
|||||||||
| Loans: |
|||||||||
| Commercial loans |
$ | 49,778 | $ | 73,604 | $ | 91,849 | |||
| Consumer loans |
31,923 | 39,804 | 59,253 | ||||||
| Tax refund loans (“RALs”) |
151,611 | 108,762 | 117,749 | ||||||
| Leasing loans |
— | — | 12,642 | ||||||
| Real estate loans - commercial |
158,558 | 167,951 | 172,336 | ||||||
| Real estate loans - residential |
62,723 | 67,904 | 78,127 | ||||||
| Other loans |
75 | 175 | 233 | ||||||
| Total |
454,668 | 458,200 | 532,189 | ||||||
| Investment securities - trading |
5,131 | 6,833 | — | ||||||
| Investment securities - available for sale: |
|||||||||
| U.S. treasury securities |
530 | 1,142 | 1,863 | ||||||
| U.S. agencies |
16,362 | 20,168 | 17,825 | ||||||
| Asset-backed securities |
139 | 141 | 162 | ||||||
| Commercial mortgage obligations (“CMO”) and mortgage backed securities (“MBS”) |
10,937 | 16,448 | 17,520 | ||||||
| State and municipal securities |
14,791 | 13,276 | 11,197 | ||||||
| Total |
42,759 | 51,175 | 48,567 | ||||||
| Commercial paper |
— | 622 | — | ||||||
| Interest on deposits in other banks |
2,957 | 702 | — | ||||||
| Federal funds sold and securities purchased under agreements to resell |
1 | 1,801 | 2,853 | ||||||
| Total interest income |
$ | 505,516 | $ | 519,333 | $ | 583,609 | |||
34
Table of Contents
| Change 2009 with 2008 | Change 2008 with 2007 | |||||||||||||
| $ | % | $ | % | |||||||||||
| (dollars in thousands) | ||||||||||||||
| Loans: |
||||||||||||||
| Commercial loans |
$ | (23,826 | ) | (32.4 | )% | $ | (18,245 | ) | (19.9 | )% | ||||
| Consumer loans |
(7,881 | ) | (19.8 | )% | (19,449 | ) | (32.8 | )% | ||||||
| Tax refund loans (“RALs”) |
42,849 | 39.4 | % | (8,987 | ) | (7.6 | )% | |||||||
| Leasing loans |
— | — | (12,642 | ) | (100.0 | )% | ||||||||
| Real estate loans - commercial |
(9,393 | ) | (5.6 | )% | (4,385 | ) | (2.5 | )% | ||||||
| Real estate loans - residential |
(5,181 | ) | (7.6 | )% | (10,223 | ) | (13.1 | )% | ||||||
| Other loans |
(100 | ) | (57.1 | )% | (58 | ) | (24.9 | )% | ||||||
| Total |
(3,532 | ) | (0.8 | )% | (73,989 | ) | (13.9 | )% | ||||||
| Investment securities - trading: |
(1,702 | ) | (24.9 | )% | 6,833 | — | ||||||||
| Investment securities - available for sale: |
||||||||||||||
| U.S. treasury securities |
(612 | ) | (53.6 | )% | (721 | ) | (38.7 | )% | ||||||
| U.S. agencies |
(3,806 | ) | (18.9 | )% | 2,343 | 13.1 | % | |||||||
| Asset-backed securities |
(2 | ) | (1.4 | )% | (21 | ) | (13.0 | )% | ||||||
| CMO’s and MBS |
(5,511 | ) | (33.5 | )% | (1,072 | ) | (6.1 | )% | ||||||
| State and municipal securities |
1,515 | 11.4 | % | 2,079 | 18.6 | % | ||||||||
| Total |
(8,416 | ) | (16.4 | )% | 2,608 | 5.4 | % | |||||||
| Commercial paper |
(622 | ) | (100.0 | )% | 622 | — | ||||||||
| Interest on deposits in other banks |
2,255 | 321.2 | % | 702 | — | |||||||||
| Federal funds sold and securities purchased under agreements to resell |
(1,800 | ) | (99.9 | )% | (1,052 | ) | (36.9 | )% | ||||||
| Total interest income |
$ | (13,817 | ) | (2.7 | )% | $ | (64,276 | ) | (11.0 | )% | ||||
Interest income for the year ended December 31, 2009 was $505.5 million, a decrease of $13.8 million or 2.7% when comparing interest income for the year-ended December 31, 2009 to 2008. The very large increase in interest income from RALs is due to the lack of a securitization funding vehicle in 2009. Rather than recognizing a large gain from the sale of RALs to the securitization participants as in 2008 and 2007, the Bank kept all of the RALs on its balance sheet and all income was recognized as interest income. This large increase in interest income for RALs offset most of a $46.4 million decline in interest income from all other loans compared to 2008. The decrease in interest income from non-RAL loans (also termed “Core Bank” loans) is due to an increase in net charge-offs of $119.1 million, an increase in non-performing loans of $163.4 million and the sale of $401.3 million of loans from the held for investment loan portfolio during 2009. A majority of the non-performing loans are on non-accrual status which means interest income is not getting accrued or paid on those loans. The increase in non-performing loans is mostly in the commercial and commercial real estate secured portfolios which had an increase of $146.0 million for the comparable year to date periods ended December 31, 2009 to 2008. In addition, many of the commercial and commercial real estate loans have adjustable rates which decreased to historically low levels during most of 2009. For additional detailed information on loan sales refer to Note 6, “Loans Sales and Transactions” of the Consolidated Financial Statements. In addition, many of the Bank’s loans have adjustable interest rates and since interest rates remained low throughout 2009, this also impacted interest income in 2009.
Some of the decrease in interest income was also attributable to a decrease in interest income on investment securities. This decrease was mostly due to lower market interest rates on purchased investment securities as Management invested in lower risk and more liquid securities.
35
Table of Contents
Interest income by operating segment for the year-ended 2009 compared to 2008 decreased for all operating segments except the RAL and RT Programs. The largest decrease in interest income was in the CWMG segment with a decrease of $27.0 million while the Community Banking segment decreased by $19.4 million. This decrease was primarily caused by increases in non-performing loans and net charge-offs as well as loan sales throughout 2009 as discussed above. As discussed above the increase in interest income from RALs is attributed to funding all RALs on balance sheet and, not utilizing the securitization facility for the funding of RALs in 2009.
Interest income for the year ended December 31, 2008 was $519.3 million, a decrease of $64.3 million or 11.0% when comparing interest income for the year-ended December 31, 2008 to 2007. This decrease was mostly attributable to the FOMC reducing the Federal funds rate by 400 basis points since December 31, 2007 which impacted most the loan portfolio, except RALs. The increase in non-accrual loans also contributed to the decrease of interest income for loans. Commercial and consumer loans accounted for $37.7 million of the decrease in interest income due to the large number of those loans having adjustable interest rates. In addition, in 2007, the Company sold the indirect auto and leasing loan portfolios. The Company also discontinued the Holiday Loan product, which contributed $22.9 million of interest income in 2007 and $49.7 million of interest income in 2006.
Interest income by operating segment for the year ended 2008 compared to 2007, decreased for all operating segments. The largest decrease in interest income was in the Community Banking segment with a decrease of $44.4 million. This decrease was primarily caused by the sale of the indirect auto and leasing loan portfolios in 2007 and the discontinuation of the Holiday Loan product in 2007.
INTEREST EXPENSE
Interest expense is incurred from interest paid on deposits and borrowings. The following tables present a summary of interest expense and the increases and decreases within the interest expense line items for the three years ended December 31, 2009, 2008 and 2007:
| Year Ended December 31, | |||||||||
| 2009 | 2008 | 2007 | |||||||
| (in thousands) | |||||||||
| Interest expense: |
|||||||||
| Deposits: |
|||||||||
| Negotiable Order of Withdrawal (“NOW”) accounts |
$ | 6,015 | $ | 10,267 | $ | 24,577 | |||
| Money market deposit accounts |
4,931 | 11,824 | 26,525 | ||||||
| Savings deposits |
2,842 | 1,885 | 3,300 | ||||||
| Time certificates of deposits |
81,237 | 67,446 | 75,326 | ||||||
| Total |
95,025 | 91,422 | 129,728 | ||||||
| Securities sold under agreements to repurchase and federal funds purchased |
10,135 | 13,076 | 17,997 | ||||||
| Long-term debt and other borrowings: |
|||||||||
| FHLB advances |
58,885 | 73,740 | 74,119 | ||||||
| Other borrowings |
1,207 | 581 | 567 | ||||||
| Total |
60,092 | 74,321 | 74,686 | ||||||
| Total interest expense |
$ | 165,252 | $ | 178,819 | $ | 222,411 | |||
36
Table of Contents
| Change 2009 with 2008 | Change 2008 with 2007 | |||||||||||||
| $ | % | $ | % | |||||||||||
| (dollars in thousands) | ||||||||||||||
| Deposits: |
||||||||||||||
| NOW accounts |
$ | (4,252 | ) | (41.4 | )% | $ | (14,310 | ) | (58.2 | )% | ||||
| Money market deposit accounts |
(6,893 | ) | (58.3 | )% | (14,701 | ) | (55.4 | )% | ||||||
| Savings deposits |
957 | 50.8 | % | (1,415 | ) | (42.9 | )% | |||||||
| Time certificates of deposits |
13,791 | 20.4 | % | (7,880 | ) | (10.5 | )% | |||||||
| Total |
3,603 | 3.9 | % | (38,306 | ) | (29.5 | )% | |||||||
| Securities sold under agreements to repurchase and federal funds purchased |
(2,941 | ) | (22.5 | )% | (4,921 | ) | (27.3 | )% | ||||||
| Long-term debt and other borrowings: |
||||||||||||||
| FHLB advances |
(14,855 | ) | (20.1 | )% | (379 | ) | (0.5 | )% | ||||||
| Other borrowings |
626 | 107.7 | % | 14 | 2.5 | % | ||||||||
| Total |
(14,229 | ) | (19.1 | )% | (365 | ) | (0.5 | )% | ||||||
| Total interest expense |
$ | (13,567 | ) | (7.6 | )% | $ | (43,592 | ) | (19.6 | )% | ||||
Interest expense in 2009 was $165.3 million, a decrease of $13.6 million or 7.6% when compared to 2008. This decrease is mostly attributable to the FOMC keeping interest rates low throughout 2009. The decrease in interest expense on long-term debt and other borrowings was also impacted by the prepayment of many high interest rate FHLB advances during 2009. Interest paid on deposits increased by $3.6 million. While the Bank was able to retain and grow transactional types of deposit accounts during 2009, most of the increase in deposit interest expense was due to the growth in brokered certificate of deposits (“brokered CDs”) which were used to fund RALs in the first quarter of 2009 and, then, in the latter part of 2009, used again to build liquidity for the Company.
Interest expense in 2008 was $178.8 million a decrease of $43.6 million or 19.6% when compared to 2007. This decrease is mostly attributable to the FOMC decreasing interest rates by 400 basis points between year-end 2007 and year-end 2008. This decrease mainly impacted the interest rates paid on deposits. While the Bank was successful in growing deposits during 2008, the interest paid on deposits decreased by 110 basis points when compared to the year ending December 31, 2008 to 2007.
37
Table of Contents
NET INTEREST MARGIN
The following tables set forth the average balances and interest income and interest expense for the previous three years.
| For the Twelve-Months Ended December 31, | ||||||||||||||||||
| 2009 | 2008 | |||||||||||||||||
| Average Balance |
Income | Rate | Average Balance |
Income | Rate | |||||||||||||
| (dollars in thousands) | ||||||||||||||||||
| Assets: |
||||||||||||||||||
| Commercial Paper |
$ | — | $ | — | — | $ | 22,807 | $ | 622 | 2.73 | % | |||||||
| Interest-bearing demand deposits in other financial institutions |
1,076,398 | 2,957 | 0.27 | % | 152,625 | 707 | 0.46 | % | ||||||||||
| Federal funds sold |
329 | 1 | 0.30 | % | 71,652 | 1,796 | 2.51 | % | ||||||||||
| Total money market instruments |
1,076,727 | 2,958 | 0.27 | % | 247,084 | 3,125 | 1.26 | % | ||||||||||
| Securities: (1) |
||||||||||||||||||
| Taxable |
941,122 | 33,099 | 3.52 | % | 947,490 | 44,732 | 4.72 | % | ||||||||||
| Non-taxable (3) |
293,018 | 14,791 | 5.05 | % | 257,959 | 13,276 | 5.15 | % | ||||||||||
| Total securities |
1,234,140 | 47,890 | 3.88 | % | 1,205,449 | 58,008 | 4.81 | % | ||||||||||
| Loans: (2) |
||||||||||||||||||
| Commercial |
1,088,847 | 49,778 | 4.57 | % | 1,188,286 | 73,604 | 6.19 | % | ||||||||||
| Real estate - multi family & commercial |
2,785,416 | 158,558 | 5.69 | % | 2,710,110 | 167,951 | 6.20 | % | ||||||||||
| Real estate - residential 1 - 4 family |
1,077,126 | 62,723 | 5.82 | % | 1,137,321 | 67,904 | 5.97 | % | ||||||||||
| Consumer |
706,219 | 183,534 | 25.99 | % | 714,497 | 148,566 | 20.79 | % | ||||||||||
| Other |
9,842 | 75 | 0.76 | % | 11,427 | 175 | 1.53 | % | ||||||||||
| Total loans, net |
5,667,450 | 454,668 | 8.02 | % | 5,761,641 | 458,200 | 7.95 | % | ||||||||||
| Total interest-earning assets |
7,978,317 | 505,516 | 6.33 | % | 7,214,174 | 519,333 | 7.20 | % | ||||||||||
| Market value adjustment |
33,035 | 20,131 | ||||||||||||||||
| Non-interest-earning assets |
599,313 | 636,499 | ||||||||||||||||
| Total assets |
$ | 8,610,665 | $ | 7,870,804 | ||||||||||||||
| Liabilities and shareholders’ equity: |
||||||||||||||||||
| Interest-bearing deposits: |
||||||||||||||||||
| Savings and interest-bearing transaction accounts |
$ | 1,849,044 | 13,788 | 0.75 | % | $ | 1,981,853 | 23,976 | 1.21 | % | ||||||||
| Time certificates of deposit |
2,988,218 | 81,237 | 2.72 | % | 2,045,676 | 67,446 | 3.30 | % | ||||||||||
| Total interest-bearing deposits |
4,837,262 | 95,025 | 1.97 | % | 4,027,529 | 91,422 | 2.27 | % | ||||||||||
| Borrowed funds: |
||||||||||||||||||
| Securities sold under agreements to repurchase and Federal funds purchased |
336,982 | 10,135 | 3.01 | % | 394,410 | 13,076 | 3.32 | % | ||||||||||
| Other borrowings |
1,487,715 | 60,092 | 4.04 | % | 1,523,802 | 74,321 | 4.88 | % | ||||||||||
| Total borrowed funds |
1,824,697 | 70,227 | 3.85 | % | 1,918,212 | 87,397 | 4.56 | % | ||||||||||
| Total interest-bearing liabilities |
6,661,959 | 165,252 | 2.48 | % | 5,945,741 | 178,819 | 3.01 | % | ||||||||||
| Non-interest-bearing demand deposits |
1,233,281 | 1,094,126 | ||||||||||||||||
| Other liabilities |
115,427 | 103,639 | ||||||||||||||||
| Shareholders’ equity |
599,998 | 727,298 | ||||||||||||||||
| Total liabilities and shareholders’ equity |
$ | 8,610,665 | $ | 7,870,804 | ||||||||||||||
| Net interest income/margin |
$ | 340,264 | 4.26 | % | $ | 340,514 | 4.72 | % | ||||||||||
| Loans, Core Bank |
$ | 5,592,735 | $ | 303,057 | 5.42 | % | $ | 5,658,974 | $ | 349,438 | 6.17 | % | ||||||
| Consumer loans, Core Bank |
$ | 632,350 | $ | 31,923 | 5.05 | % | $ | 611,830 | $ | 39,804 | 6.51 | % | ||||||
| (1) | Average securities balances are based on amortized historical cost. The adjustments for the fair values are reported as “Market value adjustment.” |
| (2) | Non-accrual loans are included in loan balances. Interest income includes related fee income. |
| (3) | Because of the Company’s tax position, the yield on tax exempt investments is not reported on a tax equivalent basis. |
38
Table of Contents
| For the Twelve-Months Ended December 31, | |||||||||
| 2007 | |||||||||
| Average Balance |
Income | Rate | |||||||
| (dollars in thousands) | |||||||||
| Assets: |
|||||||||
| Commercial Paper |
$ | — | $ | — | — | ||||
| Interest-bearing demand deposits in other financial institutions |
1,480 | — | — | ||||||
| Federal funds sold |
52,876 | 2,853 | 5.40 | % | |||||
| Total money market instruments |
54,356 | 2,853 | 5.25 | % | |||||
| Securities: (1) |
|||||||||
| Taxable |
801,248 | 37,370 | 4.66 | % | |||||
| Non-taxable (3) |
208,193 | 11,197 | 5.38 | % | |||||
| Total securities |
1,009,441 | 48,567 | 4.81 | % | |||||
| Loans: (2) |
|||||||||
| Commercial |
1,205,689 | 104,491 | 8.67 | % | |||||
| Real estate - multi family & commercial |
2,366,331 | 172,336 | 7.28 | % | |||||
| Real estate - residential 1 - 4 family |
1,329,433 | 78,127 | 5.88 | % | |||||
| Consumer |
1,005,943 | 177,002 | 17.60 | % | |||||
| Other |
13,316 | 233 | 1.75 | % | |||||
| Total loans, net |
5,920,712 | 532,189 | 8.99 | % | |||||
| Total interest-earning assets |
6,984,509 | 583,609 | 8.36 | % | |||||
| Market value adjustment |
19,418 | ||||||||
| Non-interest-earning assets |
488,019 | ||||||||
| Total assets |
$ | 7,491,946 | |||||||
| Liabilities and shareholders’ equity: |
|||||||||
| Interest-bearing deposits: |
|||||||||
| Savings and interest-bearing transaction accounts |
$ | 2,149,706 | 54,402 | 2.53 | % | ||||
| Time certificates of deposit |
1,702,288 | 75,326 | 4.42 | % | |||||
| Total interest-bearing deposits |
3,851,994 | 129,728 | 3.37 | % | |||||
| Borrowed funds: |
|||||||||
| Securities sold under agreements to repurchase and Federal funds purchased |
360,622 | 17,997 | 4.99 | % | |||||
| Other borrowings |
1,409,452 | 74,686 | 5.30 | % | |||||
| Total borrowed funds |
1,770,074 | 92,683 | 5.24 | % | |||||
| Total interest-bearing liabilities |
5,622,068 | 222,411 | 3.96 | % | |||||
| Non-interest-bearing demand deposits |
1,115,302 | ||||||||
| Other liabilities |
96,909 | ||||||||
| Shareholders’ equity |
657,667 | ||||||||
| Total liabilities and shareholders’ equity |
$ | 7,491,946 | |||||||
| Net interest income/margin |
$ | 361,198 | 5.17 | % | |||||
| Loans, Core Bank |
$ | 5,592,968 | $ | 414,440 | 7.41 | % | |||
| Consumer loans, Core Bank |
$ | 678,199 | $ | 59,253 | 8.74 | % | |||
| (1) | Average securities balances are based on amortized historical cost. The adjustments for the fair values are reported as “Market value adjustment.” |
| (2) | Non-accrual loans are included in loan balances. Interest income includes related fee income. |
| (3) | Because of the Company’s tax position, the yield on tax exempt investments is not reported on a tax equivalent basis. |
39
Table of Contents
The following table set forth the change in average balances and interest income and interest expense for the last three years.
| Year Ended December 31, | ||||||||||||||||||||||||
| 2009 versus 2008 | 2008 versus 2007 | |||||||||||||||||||||||
| (in thousands) | ||||||||||||||||||||||||
| Change due to | Total Change |
Change due to | Total Change |
|||||||||||||||||||||
| Rate | Volume | Rate | Volume | |||||||||||||||||||||
| Assets: |
||||||||||||||||||||||||
| Commercial Paper |
$ | (311 | ) | $ | (311 | ) | $ | (622 | ) | $ | — | $ | 622 | $ | 622 | |||||||||
| Interest-bearing demand deposits in other financial institutions |
(399 | ) | 2,649 | 2,250 | 7 | 700 | 707 | |||||||||||||||||
| Federal funds sold |
(843 | ) | (952 | ) | (1,795 | ) | (1,854 | ) | 797 | (1,057 | ) | |||||||||||||
| Securities: |
||||||||||||||||||||||||
| Taxable |
(11,333 | ) | (300 | ) | (11,633 | ) | 485 | 6,877 | 7,362 | |||||||||||||||
| Non-taxable |
(262 | ) | 1,777 | 1,515 | (497 | ) | 2,576 | 2,079 | ||||||||||||||||
| Total securities |
(11,595 | ) | 1,477 | (10,118 | ) | (12 | ) | 9,453 | 9,441 | |||||||||||||||
| Loans: |
||||||||||||||||||||||||
| Commercial |
(18,054 | ) | (5,772 | ) | (23,826 | ) | (29,403 | ) | (1,484 | ) | (30,887 | ) | ||||||||||||
| Real estate - multi family & commercial |
(14,001 | ) | 4,608 | (9,393 | ) | (27,504 | ) | 23,119 | (4,385 | ) | ||||||||||||||
| Real estate - residential 1 - 4 family |
(1,668 | ) | (3,513 | ) | (5,181 | ) | 1,184 | (11,407 | ) | (10,223 | ) | |||||||||||||
| Consumer |
36,710 | (1,742 | ) | 34,968 | 28,538 | (56,974 | ) | (28,436 | ) | |||||||||||||||
| Other |
(79 | ) | (21 | ) | (100 | ) | (27 | ) | (31 | ) | (58 | ) | ||||||||||||
| Total loans |
2,908 | (6,440 | ) | (3,532 | ) | (27,212 | ) | (46,777 | ) | (73,989 | ) | |||||||||||||
| Total interest-earning assets |
$ | (10,240 | ) | $ | (3,577 | ) | $ | (13,817 | ) | $ | (29,071 | ) | $ | (35,205 | ) | $ | (64,276 | ) | ||||||
| Liabilities: |
||||||||||||||||||||||||
| Interest-bearing deposits: |
||||||||||||||||||||||||
| Savings and interest-bearing transaction accounts |
(8,661 | ) | (1,527 | ) | (10,188 | ) | (26,465 | ) | (3,961 | ) | (30,426 | ) | ||||||||||||
| Time certificates of deposit |
(13,369 | ) | 27,160 | 13,791 | (21,289 | ) | 13,409 | (7,880 | ) | |||||||||||||||
| (22,030 | ) | 25,633 | 3,603 | (47,754 | ) | 9,448 | (38,306 | ) | ||||||||||||||||
| Borrowed funds: |
||||||||||||||||||||||||
| Securities sold under agreements to repurchase and Federal funds purchased |
(1,149 | ) | (1,792 | ) | (2,941 | ) | (6,479 | ) | 1,558 | (4,921 | ) | |||||||||||||
| Other borrowings |
(12,508 | ) | (1,721 | ) | (14,229 | ) | (6,170 | ) | 5,805 | (365 | ) | |||||||||||||
| Total borrowed funds |
(13,657 | ) | (3,513 | ) | (17,170 | ) | (12,649 | ) | 7,363 | (5,286 | ) | |||||||||||||
| Total interest bearing liabilities |
(35,687 | ) | 22,120 | (13,567 | ) | (60,403 | ) | 16,811 | (43,592 | ) | ||||||||||||||
| Net interest income |
$ | 25,447 | $ | (25,697 | ) | $ | (250 | ) | $ | 31,332 | $ | (52,016 | ) | $ | (20,684 | ) | ||||||||
| Consumer loans, Core Bank |
$ | (42,307 | ) | $ | (4,074 | ) | $ | (46,381 | ) | $ | (69,857 | ) | $ | 4,855 | $ | (65,002 | ) | |||||||
| Loans, Core Bank |
$ | (9,180 | ) | $ | 1,299 | $ | (7,881 | ) | $ | (14,057 | ) | $ | (5,392 | ) | $ | (19,449 | ) | |||||||
The net interest margin decreased to 4.26% for the year ended December 31, 2009 from 4.72% for the year ended December 31, 2008. This decrease was driven by several factors. The first is a continued decrease in interest rates from 2008. The FOMC’s average interest rate in 2009 was at a range of 0% – .25% compared to an average interest rate of 2.09% during 2008. The interest rate on interest bearing assets decreased by 87 basis points when comparing the average interest rate in 2009 to 2008 which was mostly due to a decrease in interest rates from investment securities which decreased 93 basis points. This decrease would have been larger had the Company been able to utilize a securitization vehicle for funding RALs, because much of the RAL interest income would instead have been recognized as a gain on sale. As discussed in the interest income section above, the decrease in net interest margin was also impacted by the increase in non-performing loans which decreased interest income while the average balance for the non-performing balance remained on the balance sheet. Interest rates on Core Bank loans decreased by 75 basis points for the comparable twelve
40
Table of Contents
month periods ended December 31, 2009 and 2008. This decrease was due to the large number of loans that have an adjustable interest rate that is tied to the prime rate which decreased when the FOMC decreased interest rates or when other adjustable rate loans reset with their index during 2009. The decrease in interest rates also benefited the Company from an interest bearing liability perspective. Interest rates paid on interest bearing liabilities decreased by 53 basis points. Interest rates on borrowings decreased by 71 basis points which significantly reduced the borrowing expenses for the year ended December 31, 2009.
The net interest margin decreased to 4.72% for the year ended December 31, 2008 from 5.17% for the year ended December 31, 2007. This decrease was driven by the FOMC’s 400 basis point decrease in the Federal funds rate during 2008. The FOMC rate decrease primarily impacted the interest-bearing liabilities which decreased by 95 basis points and Core Bank loans which decreased by 124 basis points.
PROVISION FOR LOAN LOSSES
Quarterly, the Company determines the amount of allowance for loan losses (“ALL”) that is adequate to provide for losses inherent in the Company’s loan portfolios. The provision for loan losses is determined by the net change in the ALL from one period to another. For a detailed discussion of the Company’s ALL, refer to the allowance for loan loss section of this document which starts on page 58 and the “Critical Accounting Policies” section starting on page 77 of this MD&A section of this Form 10-K and within the Consolidated Financial Statements of this Form 10-K in Note 1, “Summary of Significant Accounting Policies” and in Note 8, “Allowance for Loan Losses”.
A summary of the provision for loan losses for the comparable years ended December 31, 2009 and 2008 are as follows:
| Year Ended December 31, | ||||||||||||
| 2009 | 2008 | Change | ||||||||||
| $ | % | |||||||||||
| (dollars in thousands) | ||||||||||||
| Provision for loan losses: |
||||||||||||
| Core Bank |
$ | 352,398 | $ | 196,567 | $ | 155,831 | 79.3 | % | ||||
| RAL |
74,538 | 21,768 | 52,770 | 242.4 | % | |||||||
| Total |
$ | 426,936 | $ | 218,335 | $ | 208,601 | 95.5 | % | ||||
Provision for loan losses was $426.9 million for the year ended December 31, 2009 compared to $218.3 million for the year ended December 31, 2008, an increase of $208.6 million. This 95.5% increase in provision for loan losses is mostly attributable to the Core Bank which increased $155.8 million while the RAL provision for loan losses increased by $52.8 million.
The provision for loan losses for the Core Bank’s loan portfolio was $352.4 million for the twelve-month period ended December 31, 2009, an increase of $155.8 million compared to the same period in 2008. This increase was attributed to increased charge-offs, non-performing loans, and an unstable economic environment throughout 2009 which reduced collateral values and caused an increase in unemployment and thereby impacted borrowers’ ability to make payments on their loans. The Core Bank had net loan charge-offs of $218.8 million during 2009 compared to $99.7 million during 2008, an increase of $119.1 million. The Core Bank’s non-performing loans have increased to $397.8 million, an increase of $163.4 million since December 31, 2008.
41
Table of Contents
As with most financial institutions, one of the factors used by the Bank in determining the adequacy of the ALL for large pools of similar loans is to estimate future loss rates based on historical loss rates for the various portfolios. In 2008 and 2007, the Bank had used a “look-back” of seven years. Credit losses had been sufficiently low in the preceding years that the Management thought it prudent to use that long a period so as to include some years when loss rates were higher than they had been in recent years. In the second quarter of 2009, Management shortened the period to six quarters so as to give more emphasis or weighting to the higher losses recently incurred, including the elevated charge-offs of the first two quarters of 2009, and eliminate those earlier years with lower credit losses. This resulted in a substantial increase in the allowance and the provision for loan losses. Of the $352.4 million of provision expense for the Core Bank, $276.7 million were from the CWMG segment and, $75.7 million were from the Community Banking segment.
In addition, the 2009 RAL Program experienced higher than anticipated loan losses which required an increased provision for RALs of $74.5 million for the twelve-month period ended December 31, 2009, an increase of $52.8 million from the comparable period ended December 31, 2008. The increase in RAL provision for loan losses is attributed to the first few weeks of the RAL season due to an expanded number of tax refunds under review by the IRS for further documentation. RAL management detected the changes in the IRS payment patterns and adjusted the RAL underwriting criteria to reflect the IRS change in payment. The held back tax returns resulted in more charged-off RALs as many of these RALs were outstanding for more than 60 days, and were required by Company policy to be charged-off. The RAL provision was also impacted by the inability to set-up a securitization facility which had accounted for $14.9 million of provision for loan losses as an offset within the gain on sale of RAL calculation in the first quarter of 2008. The activity for RALs is reported in the RAL and RT Programs segment.
A summary of the provision for loan losses for the comparable years ended December 31, 2008 and 2007 are as follows:
| Year Ended December 31, | |||||||||||||
| 2008 | 2007 | Change | |||||||||||
| $ | % | ||||||||||||
| (dollars in thousands) | |||||||||||||
| Provision for loan losses: |
|||||||||||||
| Core Bank |
$ | 196,567 | $ | 21,314 | $ | 175,253 | 822.2 | % | |||||
| RAL |
21,768 | 91,958 | (70,190 | ) | (76.3 | )% | |||||||
| Total |
$ | 218,335 | $ | 113,272 | $ | 105,063 | 92.8 | % | |||||
Provision for loan losses was $218.3 million for the year ended December 31, 2008 compared to $113.3 million for the year ended December 31, 2007, an increase of $105.1 million. The increase in provision for losses for the Core Bank was driven by net charge-offs of $99.7 million during 2008 and an increase in non-accrual loans of $148.2 million since December 31, 2007. A majority of the increase in net charge-offs and non-accrual loans were from the construction loan portfolio. During 2008, the Bank also modified its ALL policy to enhance its use of qualitative factors in determining required allowance levels. These changes were made in large part due to the deteriorating conditions in the economy, which drove a significant portion of the increase in provision.
During 2008, the Bank had net RAL charge-offs of $21.8 million compared to $92.0 million of net charge-offs in 2007, a reduction of $70.2 million which is reported in the RAL and RT Program segment. The CWMG segment’s provision for loan losses was $144.0 million, an increase of $134.8 million when comparing the year ended December 31, 2008 to 2007. The CWMG segment holds a majority of the construction loan portfolio causing this increase.
42
Table of Contents
NON-INTEREST INCOME
Non-interest income primarily consists of fee income received from the operations of the Bank. Fee income is generated by servicing deposit relationships, trust and investment advisory fees, RT fees earned from processing tax refunds and fees and commissions earned on certain transactions from Bank operations. The treasury department of the Bank manages the investment securities portfolio. All unrealized gains and losses on the trading portfolio, impairment of available-for-sale (“AFS”) mortgage backed securities and realized gains and losses on sold and called securities are reported as gains and losses on securities. The gains and losses on loan sales are included within the “Other” line item in the table below.
The following tables present a summary of non-interest income and the related changes between the periods presented:
| Year Ended December 31, | |||||||||||
| 2009 | 2008 | 2007 | |||||||||
| (in thousands) | |||||||||||
| Non-interest income: |
|||||||||||
| Refund transfer fees |
$ | 68,315 | $ | 68,731 | $ | 45,984 | |||||
| Gain on sale of RALs, net |
— | 44,580 | 41,822 | ||||||||
| Service charges |
15,270 | 17,607 | 17,686 | ||||||||
| Other service charges, commissions and fees |
16,845 | 17,227 | 24,957 | ||||||||
| Trust and investment advisory fees |
21,247 | 25,175 | 23,852 | ||||||||
| Gain on leasing portfolio sale, net |
— | — | 24,344 | ||||||||
| Gain/(loss) on securities, net |
10,970 | (3,346 | ) | (1,106 | ) | ||||||
| Other |
2,477 | 5,972 | 6,968 | ||||||||
| Total non-interest income |
$ | 135,124 | $ | 175,946 | $ | 184,507 | |||||
| Change 2009 with 2008 | Change 2008 with 2007 | |||||||||||||
| $ | % | $ | % | |||||||||||
| (dollars in thousands) | ||||||||||||||
| Refund transfer fees |
$ | (416 | ) | (0.6 | )% | $ | 22,747 | 49.5 | % | |||||
| Gain on sale of RALs, net |
(44,580 | ) | (100.0 | )% | 2,758 | 6.6 | % | |||||||
| Service charges |
(2,337 | ) | (13.3 | )% | (79 | ) | (0.4 | )% | ||||||
| Other service charges, commissions and fees |
(382 | ) | (2.2 | )% | (7,730 | ) | (31.0 | )% | ||||||
| Trust and investment advisory fees |
(3,928 | ) | (15.6 | )% | 1,323 | 5.5 | % | |||||||
| Gain on leasing portfolio sale, net |
— | — | (24,344 | ) | (100.0 | )% | ||||||||
| Gain/(loss) on securities, net |
14,316 | (427.9 | )% | (2,240 | ) | 202.5 | % | |||||||
| Other |
(3,495 | ) | (58.5 | )% | (996 | ) | (14.3 | )% | ||||||
| Total non-interest income |
$ | (40,822 | ) | (23.2 | )% | $ | (8,561 | ) | (4.6 | )% | ||||
Total non-interest income was $135.1 million for the year ended December 31, 2009 compared to $175.9 million for the same period in 2008, a decrease of $40.8 million or 23.2%. This decrease was primarily due to the inability to set-up the securitization facility for the selling of RALs in 2009 which generated a gain on sale of $44.6 million in 2008. As explained in the section above on Interest Income, this change in the funding arrangements resulted in much more of the RAL-related income being recognized as interest income in 2009. Excluding the impact of the different reporting for the gain on sale of RALs, non-interest income increased $3.8 million. This increase is mostly attributed to the gain on sale of securities of $11.0 million.
43
Table of Contents
Total non-interest income was $175.9 million for the year ended December 31, 2008 compared to $184.5 million for the same period in 2007, a decrease of $8.6 million or 4.6%. Excluding the prior year gain on sale of the leasing portfolio in June 2007 of $24.3 million, the non-interest income for the comparable periods increased by $15.8 million for 2008 compared to 2007. This increase was primarily due to increased RT fees of $22.7 million.
A summary of the significant activity within non-interest income by line item is presented below.
Refund transfer fees
RT fees totaled $68.3 million for the year ended December 31, 2009 compared to $68.7 million in 2008 and $46.0 million in 2007. The number of RT transactions in 2009 increased by 185,000 or 2.9% when comparing the activity for 2009 to 2008, but the fee collected per a transaction decreased, causing the slight decrease in RT fees in 2009. The number of RT transactions increased by 1.5 million, or 30.8% when comparing the year ended December 31, 2008 to December 31, 2007 causing the significant increase in RT fees in 2008. The increase in RT fees occurred primarily due to increased volume of RTs in 2008 as a result of the increased fraud screening of RALs. When a RAL is not approved for processing, an RT is offered to the taxpayer. The Company sold the RAL and RT Programs on January 14, 2010 as disclosed in Note 26, “Subsequent Events” of the Consolidated Financial Statements.
Net gain on sale of RALs
The following table presents a summary of the gain on sale of RALs for the three years ended December 31, 2009, 2008 and 2007:
| Year Ended December 31, | |||||||||||
| 2009 | 2008 | 2007 | |||||||||
| (in thousands) | |||||||||||
| Securitized loan fees |
$ | — | $ | 64,123 | $ | 59,969 | |||||
| Investor securitization costs |
— | (2,309 | ) | (2,383 | ) | ||||||
| Commitment fees |
— | (2,320 | ) | (1,575 | ) | ||||||
| Credit losses, net |
— | (14,914 | ) | (14,189 | ) | ||||||
| Net gain on sale |
$ | — | $ | 44,580 | $ | 41,822 | |||||
The Company recorded a net gain on sale of tax refund loans of $44.6 million and $41.8 million for the years ended December 31, 2008 and 2007, respectively. These gains relate to the sale of RALs through a securitization and are discussed in Note 7, “RAL and RT Programs” of these Consolidated Financial Statements and below.
Management was not able to set-up a securitization facility for the 2009 RAL season due to the economic conditions and credit crisis. The securitization used in prior years removed securitized RALs from the Bank’s balance sheet which helped maintain capital ratios at an adequately capitalized level. In preparation for the 2009 RAL season and to replace the unavailability of a securitization facility, the Bank raised $1.28 billion through wholesale funding sources, brokered CDs and entered into a syndicated funding line of $524 million which was drawn upon as needed throughout the RAL season.
The securitization capacity was $1.60 billion in 2008 compared to $1.50 billion in 2007. The capacity had increased over the last few years to accommodate the annual increase in RAL balances each year. All loans sold into the securitization were either fully repaid or repurchased by the Bank at the termination of the securitization in mid-February of each calendar year, consistent with the terms of the Securitization Agreement. At March 31, these repurchased loans were reported in the balance sheet
44
Table of Contents
as RAL loans and become subject to the same charge-off criteria as RALs retained on the balance sheet since origination. Charge-offs and recoveries are recorded through the allowance for loan losses subsequent to the end of the first quarter of each calendar year.
As noted above, the Company sold the RAL and RT Programs on January 14, 2010 as disclosed in Note 26, “Subsequent Events” of the Consolidated Financial Statements.
Net gain on sale of leasing portfolio
In June 2007, the Company sold the leasing loan portfolio for a gain on sale of $24.3 million. The gain is disclosed as a separate line item of non-interest income. The details related to this sale are described in Note 6, “Loan Sales and Transactions” of the Consolidated Financial Statements.
Gain/(loss) on securities, net
Gain on securities, net consists of realized gains on securities sold or called net of losses on securities sold or called plus any impairment charge for investments other than temporarily impaired. For the year ended December 31, 2009, there was a net gain of $11.0 million compared to a net loss on securities of $3.3 million for the year ended December 31, 2008. The increase in the gain on securities was attributed to the gain on sale of $3.9 million of U.S. Agency securities and $6.9 million of municipal bonds during the fourth quarter of 2009. These securities were sold due to the large gains that were available due to the market conditions at the time the decision to sell these securities were made. The decision to sell was primarily taken to generate income to offset the credit losses expected to be taken so as to maintain capital levels.
The net loss on securities for the year ended December 31, 2008 was $3.3 million, an increase of $2.2 million compared to 2007. The increase in the loss on securities of $2.2 million was attributed to increased other than temporary impairment of MBS held in the AFS portfolio of $2.8 million and realized losses of $4.9 million on the future positions held resulting from declining interest rates as described in Note 22, “Derivative Instruments” of the Consolidated Financial Statements. These losses were offset by an increase in the market value of trading securities of $5.1 million and realized gain on sale of trading securities of $2.4 million which were caused by the decrease in interest rates during 2008.
Additional discussion regarding the impairments taken on securities and the activity in the securities portfolio is disclosed in the “Investment Securities” section of the MD&A and in Note 4, “Securities” of the Consolidated Financial Statements.
Gain/(loss) on sale of loans
Discussion regarding the sale and transfer of loans during 2009, 2008 and 2007 are in Note 6, “Loan Sales and Transactions” of the Consolidated Financial Statements.
45
Table of Contents
NON-INTEREST EXPENSES
The following tables present a summary of non-interest expense and the related changes between the periods presented:
| Year Ended December 31, | |||||||||
| 2009 | 2008 | 2007 | |||||||
| (in thousands) | |||||||||
| Non-interest expense: |
|||||||||
| Goodwill impairment |
$ | 128,710 | $ | 22,068 | $ | — | |||
| Salaries and benefits |
116,814 | 125,474 | 122,044 | ||||||
| Refund program fees |
47,428 | 58,378 | 50,919 | ||||||
| Occupancy expense, net |
27,681 | 26,715 | 22,875 | ||||||
| Furniture, fixtures and equipment, net |
7,928 | 8,853 | 9,551 | ||||||
| Other |
134,315 | 97,957 | 69,971 | ||||||
| Total non-interest expense |
$ | 462,876 | $ | 339,445 | $ | 275,360 | |||
| Change 2009 with 2008 | Change 2008 with 2007 | |||||||||||||
| $ | % | $ | % | |||||||||||
| (dollars in thousands) | ||||||||||||||
| Goodwill impairment |
$ | 106,642 | 483.2 | % | $ | 22,068 | — | |||||||
| Salaries and benefits |
(8,660 | ) | (6.9 | )% | 3,430 | 2.8 | % | |||||||
| Refund program fees |
(10,950 | ) | (18.8 | )% | 7,459 | 14.6 | % | |||||||
| Occupancy expense, net |
966 | 3.6 | % | 3,840 | 16.8 | % | ||||||||
| Furniture, fixtures and equipment, net |
(925 | ) | (10.4 | )% | (698 | ) | (7.3 | )% | ||||||
| Other |
36,358 | 37.1 | % | 27,986 | 40.0 | % | ||||||||
| Total non-interest expense |
$ | 123,431 | 36.4 | % | $ | 64,085 | 23.3 | % | ||||||
Non-interest expense was $462.9 million for the twelve month period ended December 31, 2009, an increase of $123.4 million compared to the same period in 2008. This increase is due to the impairment of goodwill of $128.7 million, an increase in regulatory assessments of $14.7 million, an impairment charge of $8.9 million on the LIHTCPs, and increases in loan expense and consulting and professional fees of $9.1 million and $5.1 million, respectively. These increases were offset by decreases in salaries and benefits ($8.7 million), refund program fees ($11.0 million), and software expense ($2.6 million). The following paragraphs explain the major increases and decreases attributed to the increased non-interest expenses over the last three years.
Goodwill Impairment
Goodwill normally was tested for impairment during the third quarter of each year or if Management determined there was a triggering event which may indicate a need to review goodwill for impairment. Given the economic downturn experienced in 2008 and the uncertainty surrounding the banking industry, in the third quarter of 2008 Management concluded that goodwill was impaired and recorded $22.1 million impairment and also deemed it prudent to assess goodwill for impairment on a quarterly basis rather than annual. The year-end goodwill analysis for 2008 did not result in any additional goodwill impairment.
In the second quarter of 2009, Management concluded that the entire balance of goodwill at all reporting units was impaired and recorded a $128.7 million impairment charge. This was due to the increasingly uncertain economic environment, significant continued decline in the Company’s market capitalization, and continued elevated credit losses. The analysis was performed in accordance with
46
Table of Contents
the requirements of accounting principles generally accepted in the United States (“GAAP”), for testing the impairment of intangibles and goodwill. Additional information regarding the determination to impair the Company’s goodwill is in Note 10, “Goodwill and Intangible Assets” of the Consolidated Financial Statements starting on page 140.
Salaries and benefits
The following table summarizes the components of salaries and benefits expense for the years ended December 31, 2009, 2008 and 2007.
| Year Ended December 31, | ||||||||||
| 2009 | 2008 | 2007 | ||||||||
| (in thousands) | ||||||||||
| Salaries |
$ | 87,138 | $ | 88,674 | $ | 85,132 | ||||
| Benefits |
17,396 | 14,007 | 14,774 | |||||||
| Bonuses |
7,242 | 10,812 | 8,945 | |||||||
| Payroll taxes |
6,409 | 6,973 | 6,756 | |||||||
| Commissions |
3,141 | 5,008 | 6,437 | |||||||
| Gain on benefit curtailment |
(4,512 | ) | — | — | ||||||
| Total |
$ | 116,814 | $ | 125,474 | $ | 122,044 | ||||
Salaries and benefits were $116.8 million for the year ended December 31, 2009 compared to $125.5 million for the same period in 2008. The decrease of $8.7 million is mostly due to the gain on benefit curtailment and a decrease in commission expense. The gain on benefit curtailment of $4.5 million is due to a reduction in postretirement benefits provided to employees. A detailed explanation discussing the gain on benefit curtailment is in Note 15, “Postretirement Benefits” of the Consolidated Financial Statements starting on page 147. The decrease in commission expense was due to the lower volume of loans originated during 2009 and reduced commissions for trust and investment advisory services.
Salary and benefits expense increased by $3.4 million to $125.5 million for the year-ended December 31, 2008 compared to the same period in 2007. This increase was mostly due to an increase in salary expense of $3.5 million. The increase in salary expense was mostly due to an increase in personnel due to the purchase of REWA, the addition of commercial and wealth personal bankers to expand the number of locations with the new banking platform to grow the commercial and wealth management segment and the addition of two new retail branch locations opened for operations during 2008.
Refund program fees
The refund program and marketing technology fees paid to JH was $47.4 million, $58.4 million and $50.9 million for the years ended December 31, 2009, 2008 and 2007, respectively. The refund program fees are marketing and technology fees associated with JH originated activity in the RAL and RT Programs which are reported in the RAL and RT Programs segment. Pursuant to the terms of the Program Agreement, PCBNA pays a fixed annual program fee to JH in exchange for marketing rights. JH designates the number of offices that will process RALs and RTs for PCBNA. The designated group of offices represents the market available to PCBNA in a given year. As the market share may change each year, the program fee is correspondingly adjusted to reflect the value of the market share. The fee is calculated based on forecasted RAL and RT volumes. To the extent volumes are significantly different than forecast, the fees paid under the Program Agreement are adjusted accordingly. PCBNA paid a Program Agreement fee of $25.2 million, $23.9 million and $24.0 million for approximately 75%, 68% and 60% of JH volume in 2009, 2008 and 2007, respectively.
Pursuant to the terms of the Technology Agreement, PCBNA paid a fixed technology fee to JH for processing services. In the event the actual annual business volume acquired by PCBNA is different
47
Table of Contents
than the predictive factors used to derive the technology payment, PCBNA has a contractual right to adjust the fees paid under the Technology Agreement. PCBNA paid a fixed technology fee of $22.3 million, $21.2 million and $20.5 million in 2009, 2008 and 2007, respectively.
The Company sold the RAL and RT Programs on January 14, 2010 as disclosed in Note 26, “Subsequent Events” of the Consolidated Financial Statements. As part of the sale, the program and technology agreements with JH were assumed by the purchaser and, therefore the Company will no longer be incurring the refund programs fee expenses in future periods.
Net Occupancy Expense
Net occupancy expense was $27.7 million in 2009 compared to $26.7 million in 2008, an increase of $966,000. The increase in net occupancy expense was mostly attributed to the consolidation of locations which required depreciation expense to be accelerated on the leasehold improvements for one administration office and two retail branch locations that were vacated during 2009.
Net occupancy expense increased in 2008 by $3.8 million when comparing the year-to-date expense in 2008 to 2007. The increase in 2008 is due to the opening of two new retail branches in Simi Valley and in a Santa Barbara area retirement community; a new commercial and wealth management banking center in Torrance; the addition of REWA office space; and a new office in San Diego for the RAL and RT Program operations.
The Company is reviewing all of the locations currently occupied to ensure that the locations leased and owned are fully occupied and, that the retail branch locations meet the strategic initiatives of the Company and continue to meet the needs of the Bank’s customers. Currently, the Company is in the process of negotiating out of the lease on its executive offices in downtown Santa Barbara. Two retail locations, Buellton and Vandenberg Village, are scheduled in April 2010 to be consolidated with nearby larger branches and two CWMG locations in San Jose and Calabasas were closed in January 2010 and February 2010, respectively. There are several administrative office locations that are being considered for closure and additional retail branch and CWMG locations are being considered for sale, consolidation, or closure. The Company anticipates net occupancy expense to decrease in future periods due to these actions that are currently in process.
Other expense
The table below summarizes the significant items included in other expense.
| Year Ended December 31, | ||||||||||
| 2009 | 2008 | 2007 | ||||||||
| (in thousands) | ||||||||||
| Other Expense: |
||||||||||
| Regulatory assessments |
$ | 18,988 | $ | 4,282 | $ | 1,470 | ||||
| Software expense |
15,699 | 18,332 | 15,270 | |||||||
| Loan expenses, net |
14,675 | 5,541 | 3,885 | |||||||
| Consulting and professional services |
13,905 | 8,822 | 9,740 | |||||||
| Customer deposit service and support |
9,500 | 7,775 | 6,491 | |||||||
| LIHTCP impairment |
8,876 | — | — | |||||||
| Reserve for off balance sheet commitments |
8,245 | 6,907 | (341 | ) | ||||||
| Print forms and supplies |
7,379 | 7,474 | 6,539 | |||||||
| Legal, accounting, and audit |
7,305 | 5,981 | 4,342 | |||||||
| Telephone and data |
6,341 | 6,570 | 6,337 | |||||||
| Other expense |
23,402 | 26,273 | 16,238 | |||||||
| Total |
$ | 134,315 | $ | 97,957 | $ | 69,971 | ||||
48
Table of Contents
Other Expense was $134.3 million for the year ended December 31, 2009 compared to $98.0 million for the year ended December 31, 2008, an increase of $36.4 million. The significant items comprising of this increase are described below.
The increase in regulatory assessments is due to higher assessments for deposit insurance assessed by the FDIC. Due to the increased number of bank failures these assessments have increased for all banks and in addition, there was an additional a $3.5 million one-time assessment paid in 2009. An other-than-temporary impairment of $8.9 million was recorded related to the LIHTCP as discussed in Note 24, “Fair Value of Financial Instruments” of the Consolidated Financial Statements on page 166. The net loan expenses have increased to $14.7 million compared to $5.5 million for the years ended December 31, 2009 and 2008, respectively due to the increase in other real estate owned (“OREO”), which results from foreclosed loans. The largest component of the OREO expenses are the expenses incurred to maintain the properties and valuation adjustments made throughout the year due to decreases in the value of the various properties. During 2009, $4.8 million of valuation adjustments were made for OREO properties. The additional consulting and professional services expenses incurred were primarily due to various strategic initiatives and assistance to address the regulatory matters discussed in “Regulation and Supervision—Current Regulatory Matters” and disclosed in Note 20, “Regulatory Capital Requirements” in the Consolidated Financial Statements on page 161.
Other expense was $98.0 million for the year ended December 31, 2008, an increase of $28.0 million or 40.0% compared to the year-ended December 31, 2007. This increase was mostly attributable to increases in other expenses of $10.0 million. The increase in the other expense line item as disclosed above was primarily from the following items: $4.0 million accrued expense related to payments to MCM, an increase in litigation settlements of $3.0 million which is mostly related to the lawsuit that was disclosed in Note 18, “Commitments and Contingencies” of the Consolidated Financial Statements of the 2008 Form 10-K as the Canieva Hood and Congress of California Seniors v. Santa Barbara Bank & Trust, Pacific Capital Bank, N.A., and Jackson-Hewitt, Inc. lawsuit which was settled in 2009, an increase in regulatory assessment payments paid to the OCC and FDIC of $2.8 million and an increase of $1.2 million for printed forms and supplies.
The Company recorded additional expense of $7.2 million during 2008 to increase the off-balance sheet reserve. This increase is due to the downturn of the economy which increased the reserve for unfunded loan commitments and letters of credit. The increase in software expense of $3.1 million is mostly attributed to additional depreciation expense associated with capitalized software.
PROVISION FOR INCOME TAXES
For the year-ended December 31, 2009, 2008 and 2007, provision for income taxes (benefit) was $6.8 million, ($18.6) million and $56.2 million.
Although the Company had a pre-tax net loss of $414.4 million for the year-ended December 31, 2009, the Company did not record a tax benefit for the majority of the losses incurred during 2009. The Company is permitted to recognize net deferred tax assets (“DTA”) only to the extent that they are expected to be used to reduce amounts that have been paid or will be paid to tax authorities. Management considers all available evidence in determining whether a DTA valuation allowance is needed. Due to deteriorating market conditions and net losses experienced during 2008 and 2009, the Company determined at June 30, 2009 that it was more likely than not that the Company would not generate sufficient taxable income in the foreseeable future to realize all of its DTAs. Based on this determination, the Company recorded a non-cash charge of $145.9 million in 2009, resulting in a remaining net DTA of $2.0 million at December 31, 2009.
49
Table of Contents
The $6.8 million tax expense for the year ended December 31, 2009 is the net result of; 1) a tax benefit of $139.1 million related to the pre-tax loss of $414.4 million offset by a full valuation allowance, 2) the creation of a valuation allowance of $10.8 million relating to existing deferred balances and 3) a tax benefit of $4.1 million for amended tax returns filed for tax years 2005 through 2007. This $6.8 million expense resulted in an effective tax rate of (1.6%).
Management continues to assess the impact of Company performance and the economic climate on the realizability of its DTA on a quarterly basis. The amount of DTAs considered realizable is subject to adjustment in future periods. Management will continue to monitor all available evidence related to the Company’s ability to utilize its DTAs. The income tax expense or benefit in future periods will be reduced or increased to the extent of offsetting decreases or increases to the DTA valuation allowance.
Provision for income taxes for the year ended December 31, 2008 was a tax benefit of $18.6 million compared to tax expense of $56.2 million for the year ended December 31, 2007. The decrease in tax expense (or increase in tax benefit) of $74.8 million for the comparable periods was primarily the result of lower pretax income. Pretax loss for the year ended December 31, 2008 was $41.3 million compared to pretax income of $157.1 million for the year ended December 31, 2007. This decrease in pretax income for the comparable periods was primarily due to an increased provision for loan losses and to $22.1 million of goodwill impairment in 2008. The decrease in pretax income, combined with an increase in low income housing partnership tax credits, increased the effective tax rate to 44.9% compared with 35.8% for the year ended December 31, 2007.
For additional information related to the Company’s provision for income taxes for the years ended December 31, 2009, 2008 and 2007, refer to Note 16, “Income Taxes” of the Consolidated Financial Statements and the discussion of income taxes and DTAs in the “Critical Accounting Policies” section of this Form 10-K.
Total assets were $7.54 billion at December 31, 2009, a decrease of $2.03 billion or 21.2% since December 31, 2008. In conjunction with this decrease, total liabilities decreased by $1.61 billion. This decrease in total assets was mostly attributed to the preparation for funding the 2009 RAL season on balance sheet during the fourth quarter of 2008. To fund the 2009 RAL season, the Company issued brokered CDs of $1.28 billion which would mature during the second and third quarter of 2009 after the tax season had ended. This caused unusually large balances of both interest-bearing deposits at other banks and interest-bearing deposits at the Bank at December 31, 2008. There were also sales and charge-offs of loans throughout 2009. Shareholders’ equity decreased by $423.8 million during 2009. This decrease in shareholders’ equity is primarily due to the year to date net loss applicable to common shareholders of $431.3 million for the twelve month period ended December 31, 2009. The major components causing these changes within the balance sheets are described in the following sections.
CASH AND CASH EQUIVALENTS
The Company’s cash and cash equivalents decreased by $943.0 million or 48.6% since December 31, 2008 to $995.5 million at December 31, 2009. As explained above, this decrease was due to the Company retaining more than the usual amount of cash at December 31, 2008 to fund the 2009 RAL season. Once the peak of the 2009 RAL season ended, excess cash was used to pay-off debt and, repay maturing brokered CDs purchased to fund the 2009 RAL season. During the latter part of 2009, the Bank again started issuing brokered CDs to increase its liquidity.
50
Table of Contents
SECURITIES
The Company’s security portfolio is utilized as collateral for borrowings, required collateral for public agencies and trust customers deposits, Community Reinvestment Act (“CRA”) support, and to manage liquidity, capital and interest rate risk.
At December 31, 2009, 2008 and 2007 the Company held the following investment securities.
| December 31, | |||||||||
| 2009 | 2008 | 2007 | |||||||
| (in thousands) | |||||||||
| Trading: |
|||||||||
| Mortgage-backed securities |
$ | 5,403 | $ | 213,939 | $ | 146,862 | |||
| Total trading securities |
5,403 | 213,939 | 146,862 | ||||||
| Available for Sale: |
|||||||||
| U.S. Treasury obligations |
11,432 | 37,475 | 39,997 | ||||||
| U.S. Agency obligations |
607,930 | 600,130 | 479,490 | ||||||
| Collateralized mortgage obligations |
113,934 | 17,092 | 23,861 | ||||||
| Mortgage-backed securities |
169,058 | 212,256 | 382,943 | ||||||
| Asset-backed securities |
1,271 | 1,034 | 2,198 | ||||||
| State and municipal securities |
250,062 | 310,756 | 248,398 | ||||||
| Total available-for-sale securities |
1,153,687 | 1,178,743 | 1,176,887 | ||||||
| Total securities |
$ | 1,159,090 | $ | 1,392,682 | $ | 1,323,749 | |||
Trading securities
Trading securities were $5.4 million at December 31, 2009, a decrease of $208.5 million since December 31, 2008. This decrease is mostly attributable to the sale of $180.1 million of MBS at a gain on sale of $7.5 million. These securities were sold to reduce the volatility in the income statement since changes in market value for the trading portfolio impact the income statement and, due to the historically low interest rates, the Company could take advantage of the increased market value of these securities.
At December 31, 2008 and 2007, the Company held $213.9 million and $146.9 million, respectively of securities classified as trading. In January 2008 and October 2008, the Company recharacterized residential real estate loans held in the Company’s loans held for investment portfolio of $67.6 million and $13.9 million, respectively into MBS increasing the balance in this portfolio. The Company placed these securities into the trading portfolio to provide Management the ability to sell these securities should the Bank require additional liquidity. In December 2007, the Company converted $285.1 million of fixed rate mortgage loans held for investment to $285.1 million of MBS. The Company designated $146.9 million of the securities received as trading which were subsequently sold in January 2008.
Available for sale securities
The balance of available for sale securities has remained fairly consistent over the last three years. However, the composition has changed since December 31, 2008 with MBS and municipal securities decreasing and CMO securities increasing. Management has allowed the MBS securities balance to decrease with regularly scheduled principal payments while the sale of municipal securities occurred during 2009 to generate additional liquidity. Due to the historically low interest rates, the Company could take advantage of the increased market value of these securities and, in the case of the municipal securities, with the current net tax loss position, the Company was not able to realize the benefit of their tax-exempt character. The increase in CMO securities was due to the purchase of
51
Table of Contents
$102.1 million of obligations of Government Sponsored Enterprises which guarantee the collection of principal and interest payments which were issued by Government National Mortgage Association (“GNMA”).
The Company sold $127.6 million, $123.6 million and $317.6 million of investment securities from the AFS portfolio during the years ended December 31, 2009, 2008 and 2007 respectively. During 2009, 2008, and 2007, investment securities which have matured or called prior to contractual maturity were $1.12 billion, $515.0 million and $234.6 million respectively. For the years ended December 31, 2009 and 2008, and 2007, net gains (losses) on the sales and calls of securities were $7.9 million, ($127,000) and $1.9 million, respectively.
As disclosed in Note 1, “Summary of Significant Accounting Policies” of the Consolidated Financial Statements on page 103 the Company adopted the new accounting standard on April 1, 2009 for determining whether or not an AFS is other-than-temporarily impaired (“OTTI”). At adoption of this new standard, a cumulative-effect transition adjustment was required. The after-tax impact of recognizing the noncredit portion resulted in the recognition of a cumulative-effect adjustment that increased retained earnings by $2.9 million, with a corresponding adjustment that decreased Other Comprehensive Income (“OCI”). For additional information on impairment of investment securities, credit ratings of investment securities and, the Company’s investment in the stock issued by the FHLB of San Francisco refer to Note 4, “Securities” of the Consolidated Financial Statements.
Included in the gain (loss) on securities transactions at December 31, 2009, 2008 and 2007 are MBS impairment losses of $4,000, $5.8 million and $3.0 million, respectively. The impairment loss recognized in previous periods were the result of Management’s change in intent to no longer necessarily hold MBS investment securities classified as AFS in a temporary loss position until full recovery or maturity. This change in intent was to provide more flexibility to manage the Company’s liquidity, capital and interest rate risk. Since the adoption of the OTTI accounting standard, the Company is no longer recognizing permanent impairment related to the MBS securities unless any impairment that is other-than-temporary relates to credit.
The securities portfolios are managed by the Bank’s Treasury Department to maximize funding and liquidity needs. The interest income on investment securities is allocated to the operating segments from the “All Other” segment reported in Note 24, “Segments” of the Consolidated Financial Statements.
52
Table of Contents
The table below summarizes the maturity distribution of the securities portfolio at December 31, 2009.
| December 31, 2009 | ||||||||||||||||||||
| One year or less |
After one year to five years |
After five years to ten years |
After ten years |
Total | ||||||||||||||||
| (dollars in thousands) | ||||||||||||||||||||
| Maturity distribution: |
||||||||||||||||||||
| Trading: |
||||||||||||||||||||
| Mortgage-backed securities |
$ | 868 | $ | — | $ | — | $ | 4,535 | $ | 5,403 | ||||||||||
| Total trading |
868 | — | — | 4,535 | 5,403 | |||||||||||||||
| Available-for-sale: |
||||||||||||||||||||
| U.S. Treasury obligations |
11,432 | — | — | — | 11,432 | |||||||||||||||
| U.S. Agency obligations |
140,162 | 419,745 | 45,346 | 2,677 | 607,930 | |||||||||||||||
| Mortgage-backed securities and Collateralized mortgage obligations |
1,502 | 220,878 | 43,611 | 17,001 | 282,992 | |||||||||||||||
| Asset-backed securities |
— | 1,271 | — | — | 1,271 | |||||||||||||||
| State and municipal securities |
5,042 | 30,490 | 57,221 | 157,309 | 250,062 | |||||||||||||||
| Total available-for-sale |
158,138 | 672,384 | 146,178 | 176,987 | 1,153,687 | |||||||||||||||
| Total |
$ | 159,006 | $ | 672,384 | $ | 146,178 | $ | 181,522 | $ | 1,159,090 | ||||||||||
| Tax equivalent weighted average yield: |
||||||||||||||||||||
| Trading: |
||||||||||||||||||||
| Mortgage-backed securities |
6.80 | % | — | — | 5.04 | % | 5.32 | % | ||||||||||||
| Available-for-sale: |
||||||||||||||||||||
| U.S. Treasury obligations |
2.91 | % | — | — | — | 2.91 | % | |||||||||||||
| U.S. Agency obligations |
0.41 | % | 2.12 | % | 4.63 | % | 5.38 | % | 1.93 | % | ||||||||||
| Mortgage-backed securities and Collateralized mortgage obligations |
3.09 | % | 4.99 | % | 3.91 | % | 4.49 | % | 4.78 | % | ||||||||||
| Asset-backed securities |
— | 7.03 | % | — | — | 7.03 | % | |||||||||||||
| State and municipal securities |
10.12 | % | 8.07 | % | 8.41 | % | 8.80 | % | 8.65 | % | ||||||||||
| Total available-for-sale |
0.93 | % | 3.31 | % | 5.85 | % | 8.36 | % | 4.08 | % | ||||||||||
| Overall weighted average |
0.96 | % | 3.31 | % | 5.85 | % | 8.25 | % | 4.09 | % | ||||||||||
The timing of the payments for MBS and CMO securities in the above table is estimated based on the contractual terms of the underlying loans adjusted for estimated prepayments. Issuers of certain investment securities have retained the right to call these securities before contractual maturity.
53
Table of Contents
LOAN PORTFOLIO
Through the Company’s banking subsidiary, PCBNA, a full range of lending products and banking services are offered to households, professionals, and businesses. The Company offers its lending products through its three operating business segments: Community Banking, CWMG and RAL and RT Programs. The products offered by these segments include commercial, consumer, RALs, commercial and residential real estate loans and SBA guaranteed loans.
The table below summarizes the distribution of the Company’s loans held for investment at the year end indicated.
| December 31, | ||||||||||||||||||||
| 2009 | 2008 | 2007 | 2006 | 2005 | ||||||||||||||||
| (dollars in thousands) | ||||||||||||||||||||
| Real estate: |
||||||||||||||||||||
| Residential - 1 to 4 family |
$ | 971,725 | $ | 1,098,592 | $ | 1,075,663 | $ | 1,199,719 | $ | 1,128,318 | ||||||||||
| Multi-family residential |
275,069 | 273,644 | 278,935 | 287,626 | 256,857 | |||||||||||||||
| Commercial |
1,933,533 | 2,024,533 | 1,564,961 | 1,406,343 | 1,150,071 | |||||||||||||||
| Construction |
397,281 | 553,307 | 651,307 | 536,443 | 373,128 | |||||||||||||||
| Commercial loans |
977,401 | 1,159,843 | 1,187,232 | 1,071,440 | 934,207 | |||||||||||||||
| Home equity loans |
448,026 | 448,650 | 394,331 | 372,637 | 318,735 | |||||||||||||||
| Consumer loans |
161,698 | 196,482 | 200,094 | 533,511 | 437,323 | |||||||||||||||
| Leases |
— | — | — | 293,686 | 283,741 | |||||||||||||||
| Other |
1,698 | 9,805 | 6,632 | 19,442 | 16,001 | |||||||||||||||
| Total |
$ | 5,166,431 | $ | 5,764,856 | $ | 5,359,155 | $ | 5,720,847 | $ | 4,898,381 | ||||||||||
| Percent of loans to total loans |
||||||||||||||||||||
| Real estate: |
||||||||||||||||||||
| Residential - 1 to 4 family |
18.8 | % | 19.1 | % | 20.1 | % | 21.0 | % | 23.0 | % | ||||||||||
| Multi-family residential |
5.3 | % | 4.7 | % | 5.2 | % | 5.0 | % | 5.2 | % | ||||||||||
| Commercial |
37.5 | % | 35.1 | % | 29.1 | % | 24.7 | % | 23.6 | % | ||||||||||
| Construction |
7.7 | % | 9.6 | % | 12.2 | % | 9.4 | % | 7.6 | % | ||||||||||
| Commercial loans |
18.9 | % | 20.1 | % | 22.2 | % | 18.7 | % | 19.1 | % | ||||||||||
| Home equity loans |
8.7 | % | 7.8 | % | 7.4 | % | 6.5 | % | 6.5 | % | ||||||||||
| Consumer loans |
3.1 | % | 3.4 | % | 3.7 | % | 9.3 | % | 8.9 | % | ||||||||||
| Leases |
— | % | — | % | — | % | 5.1 | % | 5.8 | % | ||||||||||
| Other |
— | % | 0.2 | % | 0.1 | % | 0.3 | % | 0.3 | % | ||||||||||
| Total |
100.0 | % | 100.0 | % | 100.0 | % | 100.0 | % | 100.0 | % | ||||||||||
The loan balances in the above table include net deferred loan origination fees, extension, commitment fees and deferred loan origination costs. These deferred amounts are amortized over the estimated term of the loans. Because all RALs are charged-off prior to each year-end, there are no RALs included within consumer loans in the above table.
Net Changes in the Loan Portfolio Balances
The loan portfolio at December 31, 2009 was $5.17 billion compared to $5.76 billion at December 31, 2008, a decrease of $598.4 million. This decrease was mostly due to sales of loans from the held for investment portfolio of $170.6 million and charge-offs of $228.3 million from the Core Bank loan portfolio. The loan sales were comprised of $77.3 million of residential loans, $87.2 of commercial real estate loans and, $6.1 million of commercial loans. A more detailed analysis of the loans sold is in Note 6, “Loan Sales and Transfers” of the Consolidated Financial Statements. The Bank sold loans during
54
Table of Contents
2009 to reduce the balance sheet and, to a lesser extent, to reduce the concentration of commercial real estate loans. A detailed discussion of the amounts and reasons for charge-offs may be found in the section below on page 63 titled “Loan Losses.”
The loan portfolio at December 31, 2008 was $5.76 billion, an increase of $405.7 million from December 31, 2007. This increase occurred in the commercial real estate loan portfolio which increased $459.6 million during 2008. This increase was offset with a decrease in the construction portfolio of $98.0 million. The commercial real estate loan portfolio is part of the CWMG segment as are a majority of the construction and land loans. Due to the high concentration of commercial real estate loans, the Company began to reduce its concentrations in commercial real estate loans. During 2008, the Company sold SBA loans for a gain on sale of $1.2 million, residential real estate loans for a gain on sale of $774,000 and various other types of loans in conjunction with the sale of two branches in October 2008. A more detailed discussion regarding these sales is in Note 6, “Loan Sales and Transactions” of the Consolidated Financial Statements.
The Company’s total loan portfolio decreased by $361.7 million or 6.3% from $5.72 billion at December 31, 2006 to $5.36 billion at December 31, 2007. The majority of this decrease was due to strategic loan sales mostly offset by overall loan growth in the remaining portfolio.
During 2007, the Company completed three significant loan portfolio transactions totaling $761.0 million. All of the loan transactions were from the Community Banking segment. A summary of the loan carrying value at the time of transaction is as follows:
| ¡ | $221.8 million of indirect auto loans sold in May 2007 |
| ¡ | $254.7 million sale of all leasing loans in June 2007 |
| ¡ | $284.5 million of fixed rate residential real estate loans recharacterized to MBS Securities in December 2007 |
The indirect auto loans were sold in May 2007 at a net loss of $850,000. The leasing loan portfolio was sold in June 2007 for a net gain of $24.3 million. The sale of the indirect auto and leasing loan portfolios were part of the Company’s strategic balance sheet management in 2007 as well as these products were offered outside the Company’s market footprint and relied on third parties for origination of these loans. The residential real estate loans were recharacterized into MBS in December 2007. A detailed discussion of these loan transactions is included within Note 6, “Loan Sales and Transactions” of the Consolidated Financial Statements.
The growth in loans from 2005 to 2006 was primarily from commercial real estate and construction loans which increased $256.3 million and $163.3 million. With real estate values increasing at rapid rates on the central coast of California during this time period, loans secured by real estate had significant growth during those periods.
Loans by Segments and Category
The Company’s segment financial statements are in Note 24, “Segments” of the Consolidated Financial Statements which begins on page 171 of this Form 10-K. A description of the segments is in the Consolidated Financial Statements and in Item 1, Business of this Form 10-K.
Community Banking
Business units in this segment provide residential real estate loans, home equity lines and loans, consumer loans, small business loans and lines, SBA loans and lines, deposit products and demand deposit overdraft protection products.
55
Table of Contents
The Community Banking segment’s assets were $2.72 billion at December 31, 2009, a decrease of $647.4 million when comparing the total assets at December 31, 2008. This decrease is mostly due to $310.4 million of loan sales from the Community Banking segment and, charge-offs of approximately $49.7 million which were from the residential real estate, home equity and consumer loan portfolios.
The Community Banking segment’s assets were $3.37 billion at December 31, 2008, an increase of $194.3 million compared to December 31, 2007. This increase was related to the increase in home equity loans of $54.3 million and residential real estate loans of $22.9 million.
Commercial and Wealth Management Group
This segment offers a complete line of commercial and industrial and commercial real estate secured loan products and services as well as trust and investment advisory services and private banking lending, deposit services and securities brokerages services through the Bank’s trust and investment management group and through MCM and REWA. The types of products offered in this segment include traditional commercial and industrial and commercial real estate and lines of credit, letters of credit, asset-based lending, foreign exchange services and treasury management. The loan products also include construction loans for commercial and residential development, land acquisition and development loans, secured and unsecured lines of credit and financing arrangements for completed structures.
The CWMG segment’s assets were $3.46 billion at December 31, 2009 compared to $4.19 billion at December 31, 2008, a decrease of $727.4 million. This decrease is attributable to not renewing many commercial or commercial real estate loans during 2009, the sale of $93.3 million of commercial real estate and commercial loans during 2009 and the charge-off of construction, commercial and commercial real estate loans of $175.6 million.
The CWMG segment’s assets grew by $381.4 million, or 10.0% in 2008 compared to 2007. This growth is mostly attributable to the growth in commercial real estate loans during 2008. The loan growth in 2007 was across all commercial loan categories with commercial real estate loans leading the loan growth of $158.6 million in 2007.
RAL and RT Programs
No RALs were outstanding at December 31 of any year. All RALs are repaid or charged-off at December 31 of each year. RALs are a seasonal credit product extended to consumers during the first four months of any calendar year.
On January 14, 2010, the Company sold the RAL and RT Program segment. Additional information regarding the sale of this segment is in Note 26, “Subsequent Events” of the Consolidated Financial Statements.
56
Table of Contents
The following table summarizes maturities and interest rates types for each loan category.
| December 31, 2009 | |||||||||
| Due in one year or less |
Due after one year to five years |
Due after five years | |||||||
| (in thousands) | |||||||||
| Residential real estate- 1 to 4 family |
|||||||||
| Floating rate |
$ | 575 | $ | 27 | $ | 416,808 | |||
| Fixed rate |
1,926 | 2,978 | 549,411 | ||||||
| Commercial real estate (1) |
|||||||||
| Floating rate |
43,007 | 254,970 | 1,411,043 | ||||||
| Fixed rate |
41,370 | 231,113 | 227,099 | ||||||
| Construction |
|||||||||
| Floating rate |
236,051 | 34,336 | 60,059 | ||||||
| Fixed rate |
27,635 | 35,641 | 3,559 | ||||||
| Commercial loans |
|||||||||
| Floating rate |
408,497 | 207,700 | 192,031 | ||||||
| Fixed rate |
45,019 | 88,705 | 35,449 | ||||||
| Home equity loans |
|||||||||
| Floating rate |
3,612 | 67,050 | 271,565 | ||||||
| Fixed rate |
18 | 483 | 105,298 | ||||||
| Consumer loans |
|||||||||
| Floating rate |
60,625 | 8,036 | 39,553 | ||||||
| Fixed rate |
4,120 | 16,436 | 32,928 | ||||||
| Other |
|||||||||
| Floating rate |
— | — | — | ||||||
| Fixed rate |
1,698 | — | — | ||||||
| Total |
$ | 874,153 | $ | 947,475 | $ | 3,344,803 | |||
| (1) | Commercial real estate includes multi-family residential real estate loans. |
Of all loans shown in the above table, 48% have some variability in their interest rates. They may reset immediately with a short-term index like LIBOR or Prime or they may be fixed for some period after origination and then reset periodically until maturity.
57
Table of Contents
ALLOWANCE FOR LOAN LOSSES
The Company establishes an estimated allowance for inherent loan losses and records the change in this estimate through charges to current period earnings.
The table below summarizes the estimated allowance for loan loss by loan type:
| Year Ended December 31, | ||||||||||||||||||||
| 2009 | 2008 | 2007 | 2006 | 2005 | ||||||||||||||||
| (dollars in thousands) | ||||||||||||||||||||
| Real estate: |
||||||||||||||||||||
| Residential 1-4 family |
$ | 23,523 | $ | 16,294 | $ | 3,180 | $ | 3,194 | $ | 2,458 | ||||||||||
| Multi-family residential |
5,867 | 3,184 | 890 | 932 | 868 | |||||||||||||||
| Commercial |
44,672 | 22,472 | 5,368 | 4,939 | 6,271 | |||||||||||||||
| Construction |
61,506 | 34,050 | 3,391 | 2,004 | 1,465 | |||||||||||||||
| Commercial loans |
95,546 | 40,494 | 22,567 | 19,538 | 16,842 | |||||||||||||||
| Home equity loans |
22,885 | 11,111 | 2,365 | 1,657 | 1,280 | |||||||||||||||
| Consumer |
18,853 | 13,303 | 7,082 | 17,724 | 14,640 | |||||||||||||||
| Leases |
— | — | — | 14,683 | 11,774 | |||||||||||||||
| Total allowance |
$ | 272,852 | $ | 140,908 | $ | 44,843 | $ | 64,671 | $ | 55,598 | ||||||||||
| Percent of loans to total loans: |
||||||||||||||||||||
| Real estate: |
||||||||||||||||||||
| Residential 1-4 family |
18.8 | % | 19.1 | % | 20.1 | % | 21.0 | % | 23.0 | % | ||||||||||
| Multi-family residential |
5.3 | % | 4.7 | % | 5.2 | % | 5.0 | % | 5.2 | % | ||||||||||
| Commercial |
37.5 | % | 35.1 | % | 29.1 | % | 24.7 | % | 23.6 | % | ||||||||||
| Construction |
7.7 | % | 9.6 | % | 12.2 | % | 9.4 | % | 7.6 | % | ||||||||||
| Commercial loans |
18.9 | % | 20.1 | % | 22.2 | % | 18.7 | % | 19.1 | % | ||||||||||
| Home equity loans |
8.7 | % | 7.8 | % | 7.4 | % | 6.5 | % | 6.5 | % | ||||||||||
| Consumer |
3.1 | % | 3.4 | % | 3.7 | % | 9.3 | % | 8.9 | % | ||||||||||
| Leases |
— | % | — | % | — | % | 5.1 | % | 5.8 | % | ||||||||||
| Other |
— | % | 0.2 | % | 0.1 | % | 0.3 | % | 0.3 | % | ||||||||||
| Total allowance |
100.0 | % | 100.0 | % | 100.0 | % | 100.0 | % | 100.0 | % | ||||||||||
Total allowance for loan losses was $272.9 million at December 31, 2009 compared to $140.9 million at December 31, 2008, an increase of $131.9 million. This increase is intended to cover the increase in the estimated losses that are inherent in the loan portfolio, but not yet identified. Management made several changes to its methodology for estimating these losses during 2009 to better reflect the continued deterioration of the economic conditions in the Company’s market areas, observed, in part, through elevated charge-offs during the first two quarters of 2009. The increase in ALL was also impacted by the high level of net charge-offs and escalating non-performing loans during 2009. The increase in the provision for loan loss is discussed within the MD&A of this Form 10-K starting on page 41 and, the net-charge-off discussion is on the following pages. The calculation of the ALL includes estimated loss contingencies in accordance with the Accounting Standards Codification (“ASC”) accounting topic, Loss Contingencies (i.e., allowance for non-impaired loans calculated on a loan pool basis).
The increase in the ALL of $96.1 million at December 31, 2008 compared to 2007 was also primarily attributable to the deteriorating economic environment as the country entered recession in late 2007 and early 2008. The decrease in allowance for loan losses of $19.8 million, or 30.7% at December 31, 2007 compared to 2006 was primarily attributable to the loan portfolio sales during 2007. The loan portfolios sold consisted of higher risk loans and contributed a decrease of $20.6 million to the required ALL at the time of sale.
58
Table of Contents
ALL Model Methodology
A change in the ALL methodology occurred in the second quarter of 2009 when Management shortened the timeframe utilized for estimating historical loss rates from the last seven years to the most recent six quarters in its ALL calculation. The intent in changing the methodology of the ALL calculation was to better capture current risk conditions which had precipitously deteriorated since early 2008 through the first six months of 2009. The shorter time frame, now coupled with less reliance on qualitative factors, was judged to be more responsive to the increasing risk seen in economic conditions and rapidly deteriorating real estate collateral values. This change in methodology in the second quarter of 2009 caused a one-time increase of $113.7 million to the ALL. The shortened timeframe placed more weight in the estimation process on the recent quarters in which the Bank has experienced the highest historical losses in its history. As economic conditions change, the Bank may need to again revise the number of quarters of historical losses included in its ALL model for estimating the amount of loss currently in the portfolio.
In addition to changing the “look-back” period, the Bank has also increased the ALL in conjunction with increases in impaired loans and delinquent loans. The increase in impaired loans was due to decreases in collateral values which required the balances of individual impaired loans to be charged-off to the fair value of the collateral. This increased the historical loss rates, in turn impacting the estimate of losses not yet identified. At December 31, 2009, 2008 and 2007, the Bank had $277.2 million, $157.4 million and $54.2 million of impaired loans, respectively. These impaired loans had specific ALL reserves of $17.5 million, $17.8 million and $3.9 million at December 2009, 2008 and 2007, respectively. For more information regarding impaired loans, refer to page 125 in Note 5, “Loans,” of the Consolidated Financial Statements.
The valuation for real estate-secured loans is based on appraisal by an independent third party appraiser. The Bank’s process of determining when to obtain reappraisals for collateral is as follows:
| 1. | Collateral value deterioration is determined by the monitoring of market conditions based on third party data and data derived from appraisal operations. Management utilizes a quarterly report to determine when a reappraisal of the collateral is necessary during the loan review process. The appraisals for collateral in a deteriorating market are examined for existing validity to determine if revaluation is necessary. Trend monitoring is provided, analyzed and reported by the Bank’s Real Estate Advisory Services department to the Board of Director’s Loan Committee. |
| 2. | Portfolio reappraisal screening is based on identifying collateral that represents an elevated risk and performing reappraisals of those properties en masse. A phased approach is undertaken to minimize the impact to Bank operations, but still provide updated information for better risk management practices centered on the transactions representing the greatest risk. Further, as subsequent transactions occur for existing loans, a methodology is employed that covers not only the target property, but other surrounding properties that are collateral for other loans and that may be exposed to similar risk characteristics. |
In 2009, the Bank centralized the appraisal process and updated and expanded the appraisal policy. This update put more focus on market deterioration screening and portfolio reappraisal screening, establishing enhanced, risk oriented, appraisal engagement and review practices.
An appraisal management system was developed and deployed that tracks and monitors appraisals, appraisal reviews and other valuations. Information from these sources provides the data for risk management analysis purposes.
Quality control enhancements were made to the residential appraisal process focusing on the acquisition of secondary appraisals of a representative sample of all residential appraisals received. In keeping with best practices, these secondary appraisals are used to validate the conclusions of appraisals relied upon by the Bank.
59
Table of Contents
For the allowance calculation, the ALL model also takes into consideration the following qualitative factors: concentrations, loan growth, control environment, delinquency and classified loan trends, Management and staffing experience and turnover, economic conditions, results of independent loan review, underlying collateral values, competition, regulatory, legal issues, structured finance and syndicated national credits, and other factors. These qualitative factors are applied as adjustments to the historical loss rates when Management believes they are necessary to better reflect current conditions. However, with the 2009 change to a shorter loss horizon that more effectively captures current conditions than the previous methodology the adjustments did not need to be as significant. As a consequence, the portion of the ALL estimated by these qualitative factors decreased by $36.3 million since December 31, 2008. The one exception is the Commercial Real Estate portfolio where Management believes the potential losses have not been fully realized in the historical loss rates, and continues to bolster this portfolio’s allowance with qualitative factors.
Concentration of Credit Risk in Loan Portfolio
All changes in the risk profile of the various components of the loan portfolio are reflected in the allowance assignment. Management groups loans into 14 different loan pools which are determined by loan types when assessing the loans for allowance requirements. Management has been working on reducing concentration risk and been working towards specific percentages of total portfolio balance to total equity to assist with mitigating concentration risk. A summary of each loan portfolio which Management has concentration and credit risk associated with it is summarized by loan portfolio below.
At December 31, 2009, the highest concentration of loans for the Bank was commercial real estate loans. Commercial real estate loans were $1.93 billion or 37.5% of the Bank’s total loan portfolio. Total non-performing commercial real estate loans were 27.1% of total non-performing loans at December 31, 2009. Net charge-offs for the year ended December 31, 2009 was $12.1 million or 0.4% of average commercial real estate loans. The current allowance is 2.3% of the total commercial real estate loan balance. This portfolio has performed relatively well through the economic downturn to date; however non-performing and past due loans have increased three-fold since December 31, 2008, while net loan losses remain limited. However, industry-wide concern suggests 2010 may be the year when commercial real estate loans will suffer material losses. The concentrations plan calls for this portfolio to achieve a 315.0% equity ratio (417.7% at December 31, 2009). Due to these concerns for rising losses and high concentration levels, the Bank added additional allowance through qualitative adjustment factors to supplement its lower historical loss rates. As a consequence, the Bank’s allowance for this loan portfolio has quadrupled over the last four quarters.
At December 31, 2009, commercial loans were $977.4 million or 18.9% of the Bank’s total loan portfolio. Total non-performing commercial loans were 23.6% of total non-performing loans at December 31, 2009, and net charge-offs were approximately 6.1% of average commercial loans for the year ended December 31, 2009. The current allowance for commercial loans is $95.5 million or 9.8% of total commercial loans. Over the past two years, this portfolio has largely suffered from losses on business loans to building contractors. Net charge-offs for commercial loans have increased to $66.6 million for the year ended December 31, 2009 from $29.2 million for the same period in 2008. The concentration plan limits commercial loans to 171.0% of equity. The ratio was 129.8% at December 31, 2009.
The residential real estate loans secured by one to four family units at December 31, 2009 consisted of $971.7 million or 18.8% of the Bank’s total loan portfolio. Total non-performing residential real estate loans were 12.0% of total non-performing loans at December 31, 2009 and net charge-offs were 1.0% of average residential real estate loans for the year ended December 31, 2009. The current allowance for residential real estate is 2.4% of residential real estate total loans. Management does not consider the residential real estate loan portfolio a high risk portfolio, given the relatively low average loan to
60
Table of Contents
value ratio of 65% for the portfolio. This portfolio does not have any option adjustable rate mortgage loans (“option ARMs”) and has only 10 ARMs with negative amortization. The ARMs with negative amortization total $1.2 million or 0.1% of the total residential real estate portfolio. At December 31, 2009, all ten loans were paying as according to the agreed upon terms.
In July 2008, the Bank discontinued offering residential real estate loans originated by brokers because these loans had approximately double the loss rate of loans originated by Bank staff. Additionally, all “stated income” applications were discontinued in September 2008. Concentration limits were established for residential real estate loans in 2009 that have since resulted in reduction of $126.9 million or 11.5% in this portfolio since December 31, 2008. It is expected to continue to contract in 2010. The Bank’s concentration plan calls for this portfolio to be no more than 150.0% of equity ratio. At December 31, 2009 the ratio was 178.3%. Reductions have been achieved through loan sales, with virtually all new loan generation sold at or shortly after origination.
Home equity loans consist of junior lien mortgages which are mostly second trust deeds and some third trust deeds. At December 31, 2009 there were $448.0 million or 8.7% of home equity loans compared to the total loan portfolio. Total non-performing home equity loans were 1.7% of total non-performing loans at December 31, 2009 and net charge-offs were 3.7% of the average home equity loan balance for the year ended December 31, 2009. The allowance for home equity loans was $22.9 million or 5.1% of total home equity loans at December 31, 2009 compared to $11.1 million or 2.5% of total home equity loans at December 31, 2008. Brokered and stated income home equity loans were discontinued in early 2009. The concentration plan calls for this portfolio to achieve a 70.0% of equity ratio. At December 31, 2009, the ratio was 82.3%.
Construction loans include land and land development loans. At December 31, 2009, the construction loan portfolio consisted of $397.3 million or 7.7% of the Bank’s total loan portfolio. Total non-performing construction loans were $123.7 million, $129.4 million and $37.3 million at December 31, 2009, 2008 and 2007, respectively. The percentage of non-performing construction loans to total non-performing loans were 31.1%, 55.2% and 50.9% at December 31, 2009, 2008 and 2007, respectively. Net charge-offs of construction loans were 19.0%, 7.5% and 0.0%, to average construction loans for the years ended December 31, 2009, 2008 and 2007, respectively. This trend is improving for construction loans as the construction loan portfolio experienced the highest level of net charge-offs in the latter part of 2008 and early part of 2009. The allowance for construction loans was $61.5 million or 15.5% of total construction loans at December 31, 2009. This entire portfolio is considered high risk. In the first quarter of 2008, Management began a plan to reduce its concentration of construction loans. Since December 31, 2008 and 2007, construction loans have decreased by $156.0 and $98.0 million or 28.2% and 15.0%, respectively. The concentration plan calls for this portfolio to be no more than 45.0% of equity. The ratio was 79.3% at December 31, 2009).
The ratio of ALL to total loans for the last five years was 5.3%, 2.4%, 0.8%, 1.1% and 1.1% at December 31, 2009, 2008, 2007, 2006 and 2005, respectively.
Allowance for Loan Losses—RALs
There is no assignment of allowance to RALs at December 31, 2009 as all unpaid RALs were charged-off prior to year-end.
A RAL is charged-off when Management determines that payment from the IRS is unlikely. The Company does not receive formal notification from the IRS regarding the denial of any tax refund claims. As a result, Management relies on prior years experience with IRS payment patterns to determine expected collection time frames. Prior years’ experience has indicated that payment from the IRS becomes unlikely after tax refund payments are 4-6 weeks past due from the expected
61
Table of Contents
payment date. The IRS payment patterns have varied from year to year, so the Company has utilized the most recent period payment patterns to predict current year payments. As a result of the Company’s collection experience in conjunction with regulatory requirements, all RALs are charged off prior to December 31 each year.
Recoveries on RALs occur due to unexpected payments from the IRS, the taxpayer directly, or during a subsequent RAL season. Recoveries on prior year charge-offs occur when the taxpayer returns to a tax preparer that offers RALs or RTs through the Company. If the Company accepts the application for a RAL on the new refund claim or for an RT, the amount of the prior year’s charged-off loan will be deducted from the proceeds of the current year RAL or RT.
Reserve for Off-Balance Sheet Commitments
The table below summarizes the loss contingency related to loan commitments.
| Year Ended December 31, | |||||||||||||||||
| 2009 | 2008 | 2007 | 2006 | 2005 | |||||||||||||
| (in thousands) | |||||||||||||||||
| Beginning balance |
$ | 8,014 | $ | 1,107 | $ | 1,448 | $ | 1,685 | $ | 1,232 | |||||||
| Additions (reductions), net |
8,245 | 6,907 | (341 | ) | (237 | ) | 453 | ||||||||||
| Balance |
$ | 16,259 | $ | 8,014 | $ | 1,107 | $ | 1,448 | $ | 1,685 | |||||||
The Company recorded additional expense of $8.2 million and $6.9 million for the years ended December 31, 2009 and 2008, respectively, to increase the off-balance sheet reserve due to the continued downturn of the economy and the same change in the methodology for estimating the amount of the off-balance sheet reserve as was described above for the ALL. The reserve for off balance sheet commitments uses the same model as the ALL.
The Company has exposure to credit losses from extending loan commitments and letters of credit as well as from unfunded loans. Because the available funds have not yet been disbursed on these commitments and letters of credit, the face amount is not included in the outstanding balance reported for loans and leases. Consequently, any amount provided for credit losses related to these instruments is not included in the ALL reported in the table above, but is instead accounted for as a loss contingency estimate. The changes to this liability have been recorded in other non-interest expense.
62
Table of Contents
LOAN LOSSES
The table below summarizes the beginning and ending balances of the allowance for loan losses and charge-offs and recoveries by loan category and credit loss ratios for the years presented:
| Year Ended December 31, | ||||||||||||||||||
| 2009 | 2008 | 2007 | 2006 | 2005 | ||||||||||||||
| (in thousands) | ||||||||||||||||||
| Balance, beginning of year |
$ | 140,908 | $ | 44,843 | $ | 64,671 | $ | 55,598 | $ | 53,977 | ||||||||
| Charge-offs: |
||||||||||||||||||
| Real estate: |
||||||||||||||||||
| Residential - 1 -4 family |
12,644 | 7,263 | — | 4 | 107 | |||||||||||||
| Multi-family residential |
1,566 | 740 | — | — | — | |||||||||||||
| Commercial |
13,573 | 1,467 | — | — | — | |||||||||||||
| Construction |
94,042 | 49,155 | 25 | 91 | — | |||||||||||||
| Commercial loans |
67,952 | 32,282 | 5,433 | 5,286 | 4,435 | |||||||||||||
| Agricultural loans |
1,445 | 391 | — | 216 | 489 | |||||||||||||
| Leases |
— | — | 6,276 | 10,242 | 7,559 | |||||||||||||
| Home equity loans |
17,269 | 7,659 | 787 | — | 55 | |||||||||||||
| RALs |
99,433 | 53,752 | 116,726 | 60,092 | 48,955 | |||||||||||||
| Other |
19,769 | 8,416 | 15,169 | 11,011 | 9,791 | |||||||||||||
| Total charge-offs |
327,694 | 161,125 | 144,416 | 86,942 | 71,391 | |||||||||||||
| Recoveries: |
||||||||||||||||||
| Real estate: |
||||||||||||||||||
| Residential - 1 - 4 family |
1,800 | 961 | — | — | 7 | |||||||||||||
| Multi-family residential |
324 | — | — | — | — | |||||||||||||
| Commercial |
1,451 | — | — | — | — | |||||||||||||
| Construction |
809 | 59 | — | — | — | |||||||||||||
| Commercial loans |
1,314 | 3,035 | 1,175 | 2,119 | 1,862 | |||||||||||||
| Agricultural loans |
— | — | 529 | 43 | — | |||||||||||||
| Leases |
— | — | 1,199 | 1,992 | 1,318 | |||||||||||||
| Home equity loans |
304 | 237 | 5 | — | 19 | |||||||||||||
| RALs |
24,895 | 31,984 | 24,766 | 23,432 | 10,745 | |||||||||||||
| Other |
3,436 | 3,399 | 4,265 | 3,736 | 3,505 | |||||||||||||
| Total recoveries |
34,332 | 39,675 | 31,939 | 31,322 | 17,456 | |||||||||||||
| Net charge-offs |
293,362 | 121,450 | 112,477 | 55,620 | 53,935 | |||||||||||||
| Adjustments from loan sales and acquisitions |
(1,630 | ) | (820 | ) | (20,623 | ) | — | 1,683 | ||||||||||
| Provision for loan losses RALs |
74,538 | 21,768 | 91,958 | 36,663 | 38,210 | |||||||||||||
| Provision for loan and lease losses core bank loans |
352,398 | 196,567 | 21,314 | 28,030 | 15,663 | |||||||||||||
| Balance, end of year |
$ | 272,852 | $ | 140,908 | $ | 44,843 | $ | 64,671 | $ | 55,598 | ||||||||
63
Table of Contents
The following table presents statistical data on net charge-offs and the ALL:
| Year Ended December 31, | ||||||||||||||||||||
| 2009 | 2008 | 2007 | 2006 | 2005 | ||||||||||||||||
| (dollars in thousands) | ||||||||||||||||||||
| Ratio of net charge-offs to average loans outstanding |
5.18 | % | 2.11 | % | 1.90 | % | 1.04 | % | 1.21 | % | ||||||||||
| Ratio of net charge-offs to average loans outstanding (core bank) |
3.92 | % | 1.76 | % | 0.37 | % | 0.36 | % | 0.36 | % | ||||||||||
| Peer ratio of net charge-offs to average loans outstanding |
2.31 | % | 0.85 | % | 0.38 | % | 0.24 | % | 0.34 | % | ||||||||||
| Average RALs |
$ | 74,715 | $ | 102,667 | $ | 327,744 | $ | 86,407 | $ | 57,669 | ||||||||||
| Average loans, core bank |
5,583,948 | 5,657,521 | 5,592,781 | 5,240,384 | 4,390,948 | |||||||||||||||
| Average total loans |
$ | 5,658,663 | $ | 5,760,188 | $ | 5,920,525 | $ | 5,326,791 | $ | 4,448,617 | ||||||||||
| Recoveries to charged-off, RALs |
25.04 | % | 59.50 | % | 21.22 | % | 38.99 | % | 21.95 | % | ||||||||||
| Recoveries to charged-off, core bank loans |
4.13 | % | 7.16 | % | 25.90 | % | 29.39 | % | 29.91 | % | ||||||||||
| Recoveries to charged-off, total loans |
10.48 | % | 24.62 | % | 22.12 | % | 36.03 | % | 24.45 | % | ||||||||||
| Allowance for loan loss as a percentage of year-end loans |
5.28 | % | 2.44 | % | 0.84 | % | 1.13 | % | 1.14 | % | ||||||||||
Net charge-offs increased to $293.4 million for the year-ended December 31, 2009, an increase of $171.9 million compared to the year-ended December 31, 2008. The increase in net charge-offs were driven by the downturn in economy in 2009. This economic downturn further reduced collateral values and caused businesses to reduce their workforce or close, causing unemployment to increase and making it difficult for many customers to make their payments on their loans with the Bank. The declining collateral values also resulted in further impairment of loans which increased the charge-offs during 2009. Excluding the net charge-offs on RALs of $74.5 million, the net charge-offs for the Core Bank were $218.8 million for the year-ended December 31, 2009 compared to $99.7 million for the year-ended December 31, 2008, an increase of $119.1 million. Most of this increase in net charge-offs occurred with the construction, commercial and consumer loan portfolios and account for $176.8 million of the Core Bank net charge-offs during 2009.
In addition, the 2009 RAL Program experienced higher than anticipated loan losses of $74.5 million for the twelve-month period ended December 31, 2009, an increase of $52.8 million from the comparable period ended December 31, 2008. The increase in RAL provision for loan losses is attributed to the first few weeks of the RAL season due to an expanded number of tax refunds under review by the IRS for further documentation. The additional RAL net charge-offs for the 2009 RAL season is further explained in the MD&A “Provision for Loan Loss” discussion on page 41.
Total charge-offs increased $16.7 million, or 11.6% for 2008 compared to 2007. The increased charge-offs were driven by the slowing economy which caused the Core Bank’s loan portfolio to experience higher than anticipated loan losses partially offset by decreased charge-offs for RALs due to enhanced credit screening procedures put in place for the 2008 RAL season. The majority of the Core Bank charge-offs occurred in the construction loan and commercial and industrial loan portfolios.
Total charge-offs increased by $57.5 million, or 66.1% in 2007 compared to 2006 due to an increase in RAL charge-offs of $56.6 million. The increase in RAL charge-offs was the result of increased losses in
64
Table of Contents
a special RAL product extended before the filing of the taxpayer’s return and losses related to incidences of tax related fraud affecting RAL loans. Due to the higher loss rates on the RAL pre-file product and holiday loans, the Company discontinued these products. The increased loss rates experienced in the 2007 RAL program also caused Management to modify and enhance its underwriting criteria and fraud identification processes.
The Company is one of three major banks in the country that have national RAL Programs. Therefore, for comparability, charge-offs amounts and ratios for the Company are shown for both total loans and core bank which exclude RALs. In order to compare the ratio of net charge-offs to average loans to the Bank’s peers, it is best to compare the ratio of net charge-offs to average loans excluding RALs. The RAL and RT Program segment was sold on January 14, 2010. Additional information regarding the sale of this segment is in Note 26, “Subsequent Events” of the Consolidated Financial Statements.
NON-ACCRUAL, PAST DUE, AND RESTRUCTURED LOANS
The table below summarizes the Company’s non-accrual and past due loans for the last five years.
| December 31, | |||||||||||||||
| 2009 | 2008 | 2007 | 2006 | 2005 | |||||||||||
| (dollars in thousands) | |||||||||||||||
| Non-accrual loans |
|||||||||||||||
| Real estate: |
|||||||||||||||
| Residential -1 to 4 family |
$ | 30,964 | $ | 18,374 | $ | 3,789 | $ | 875 | $ | 304 | |||||
| Commercial (1) |
71,401 | 21,179 | 2,386 | 662 | — | ||||||||||
| Construction |
104,719 | 101,186 | 37,318 | 3,367 | — | ||||||||||
| Commercial loans |
77,548 | 40,894 | 25,527 | 7,055 | 4,324 | ||||||||||
| Home equity loans |
6,082 | 4,261 | 2,311 | 1,780 | 801 | ||||||||||
| Consumer loans (2) |
401 | 716 | 855 | 1,956 | 1,277 | ||||||||||
| Leases |
— | — | — | 1,354 | 1,558 | ||||||||||
| Total non-accrual loans |
291,115 | 186,610 | 72,186 | 17,049 | 8,264 | ||||||||||
| Loans past due 90 days or more on accrual status |
17,532 | 14,045 | 1,131 | 264 | 1,227 | ||||||||||
| Troubled debt restructured (“TDR”) loans |
|||||||||||||||
| Real estate: |
|||||||||||||||
| Residential - 1 to 4 family |
16,588 | 1,376 | — | — | — | ||||||||||
| Commercial (1) |
36,476 | — | — | — | — | ||||||||||
| Construction |
19,024 | 28,250 | — | — | — | ||||||||||
| Commercial loans |
16,231 | 4,111 | — | — | 8,326 | ||||||||||
| Home equity loans |
604 | — | — | — | — | ||||||||||
| Consumer loans (2) |
206 | — | — | — | — | ||||||||||
| Total TDR loans |
89,129 | 33,737 | — | — | 8,326 | ||||||||||
| Total non-performing loans |
397,776 | 234,392 | 73,317 | 17,313 | 17,817 | ||||||||||
65
Table of Contents
| December 31, | ||||||||||||||||||||
| 2009 | 2008 | 2007 | 2006 | 2005 | ||||||||||||||||
| (dollars in thousands) | ||||||||||||||||||||
| Foreclosed collateral (OREO) |
||||||||||||||||||||
| Real estate: |
||||||||||||||||||||
| Residential - 1 to 4 family |
$ | 6,438 | $ | — | $ | 447 | $ | — | $ | — | ||||||||||
| Commercial (1) |
13,280 | 3,217 | 2,910 | 2,910 | 2,910 | |||||||||||||||
| Construction |
18,375 | 2,929 | — | — | — | |||||||||||||||
| Commercial loans |
1,047 | 542 | — | — | — | |||||||||||||||
| Home equity loans |
123 | 412 | — | — | — | |||||||||||||||
| Total OREO |
39,263 | 7,100 | 3,357 | 2,910 | 2,910 | |||||||||||||||
| Total non-performing assets |
$ | 437,039 | $ | 241,492 | $ | 76,674 | $ | 20,223 | $ | 20,727 | ||||||||||
| Impaired loans with specific valuation allowance |
$ | 84,616 | $ | 79,939 | $ | 51,998 | $ | — | $ | 1,960 | ||||||||||
| Valuation allowance related to impaired loans |
$ | 17,544 | $ | 17,768 | $ | 3,944 | $ | — | $ | 308 | ||||||||||
| Non-performing loans as a percentage of total loans held for investment |
7.70 | % | 4.07 | % | 1.37 | % | 0.30 | % | 0.36 | % | ||||||||||
| Non-performing assets as a percentage of total assets |
5.79 | % | 2.52 | % | 1.04 | % | 0.27 | % | 0.30 | % | ||||||||||
| Allowance for loan losses as a percentage of non-performing loans |
69 | % | 60 | % | 61 | % | 374 | % | 312 | % | ||||||||||
| Valuation allowance related to impaired loans as a percentage of impaired loans with a specific valuation allowance |
20.7 | % | 22.2 | % | 7.6 | % | — | 15.7 | % | |||||||||||
| (1) | Commercial real estate loans includes multi-family residential real estate loans |
| (2) | Consumer loans include other loans |
Non-accrual Loans
When a borrower discontinues making payments as contractually required by the note, the Company must determine whether it is appropriate to continue to accrue interest. Generally, the Company places loans in a non-accrual status and ceases recognizing interest income when the loan has become delinquent by more than 90 days and/or when Management determines that the repayment of principal and collection of interest is unlikely. The Company may decide that it is appropriate to continue to accrue interest on certain loans more than 90 days delinquent if they are well secured by collateral and collection is in process.
When a loan is placed in a non-accrual status, any accrued but uncollected interest for the loan is reversed out of interest income in the period in which the status is changed. Subsequent payments received from the customer are applied to principal and no further interest income is recognized until the principal has been paid in full or until circumstances have changed such that payments are again consistently received as contractually required. In the case of commercial customers, the pattern of payment must also be accompanied by a positive change in the financial condition of the borrower.
At December 31, 2009, there were $291.1 million of non-accrual loans, an increase in non-accrual loans of $104.5 million since December 31, 2008. This increase is a result of the continued downturn of the economy as discussed in the ALL section above. The increase in non-accrual loans is mostly from the commercial real estate of $50.2 million, commercial of $36.7 million and residential real estate of $12.6 million loans since December 31, 2008.
66
Table of Contents
The increase in non-accrual loans of $114.4 million when comparing the balance from December 31, 2007 to December 31, 2008 is mostly attributed to the economic downturn that started during the latter part of 2008. A majority of this increase is associated with the construction loan portfolio which increased by $63.9 million since December 31, 2007, followed by commercial real estate loans which increased $18.8 million and residential real estate loans which increased $14.6 million since December 31, 2007.
The increase in non-accrual loans of $55.1 million at December 31, 2007 compared to 2006 was mostly attributable to $45.1 million related to two large commercial relationships. At the end of 2008 the balance of these relationships was $24.8 million.
Troubled Debt Restructured Loans
A loan may be restructured when the Bank determines that a borrower’s financial condition has deteriorated, but still has the ability to repay the loan. A loan is considered to be TDR when the original terms have been modified in favor of the borrower such that either principal or interest has been forgiven, contractual payments are deferred, or the interest rate is reduced. Once a loan has been restructured for a customer, the Bank considers the loan to be non-accrual for a minimum of six months. Once the borrower has made their payments as contractually required for six months, the loan is reviewed and interest may again be accrued.
The Company had TDRs of $89.1 million at December 31, 2009 compared to $33.7 million at December 31, 2008. The economic downturn has also contributed to the increase in TDRs. At December 31, 2009, there were TDRs in all of the loan portfolios as the Bank worked with its customers to modify their loan or loan terms so that they could be current with their loan payments. At December 31, 2009, the largest increase in TDRs were in the commercial real estate loan portfolio which increased by $36.5 million since December 31, 2008. The was also an increase in TDRs in the commercial and residential real estate loan portfolios which was offset by a decrease in TDRs in the construction loan portfolio due to charge-offs. At December 31, 2008, the construction loan portfolio accounted for $28.3 million of the TDRs which was a majority of the total TDRs.
The Company did not have any covered loans through a loss sharing agreement with the FDIC nor did the Company actively participate in the U.S. Treasury Mortgage Modification Program. However, the Company did restructure loans with terms and conditions similar to those contemplated in the U.S. Treasury Mortgage Modification Program.
Foregone Interest for Non-Accrual Loans
The table below sets forth the amounts of foregone interest income from non-accrual loans for the last five years.
| Year Ended December 31, | |||||||||||||||
| 2009 | 2008 | 2007 | 2006 | 2005 | |||||||||||
| (in thousands) | |||||||||||||||
| Contractual interest |
$ | 25,135 | 17,013 | $ | 3,679 | $ | 1,567 | $ | 1,449 | ||||||
| Interest collected |
7,657 | 6,413 | 1,728 | 564 | 864 | ||||||||||
| Foregone interest |
$ | 17,478 | $ | 10,600 | $ | 1,951 | $ | 1,003 | $ | 585 | |||||
67
Table of Contents
Foreclosed Collateral
Real estate acquired through foreclosure on a loan or by surrender of the real estate in lieu of foreclosure is called Other Real Estate Owned. OREO is originally recorded in the Company’s financial records at the fair value of the property, less estimated costs to sell. If the outstanding balance of the loan is greater than the fair value of the OREO at the time of foreclosure, the difference is charged against the allowance for loan losses.
Once the collateral is foreclosed on and the property becomes an OREO, Management periodically obtains valuations to determine if further valuation adjustments are required. OREOs are carried at the lower of its carrying value or fair value less the estimated costs to sell. If there is a decrease in the fair value of the property on the valuation date, the decrease in value is charged to non-interest expense as a valuation adjustment. During the time the property is held, all related operating and maintenance costs are expensed as incurred. All income produced from OREOs reduce the operating and maintenance expenses incurred.
The following table summarizes the activity in OREO properties over the last five years.
| Year Ended December 31, | |||||||||||||||||||
| 2009 | 2008 | 2007 | 2006 | 2005 | |||||||||||||||
| (in thousands) | |||||||||||||||||||
| Beginning Balance |
$ | 7,100 | $ | 3,357 | $ | 2,910 | $ | 2,910 | $ | 2,910 | |||||||||
| Additions |
53,245 | 4,190 | 504 | — | 247 | ||||||||||||||
| Sales |
(16,281 | ) | (447 | ) | (57 | ) | — | (247 | ) | ||||||||||
| Valuation Allowance |
(4,801 | ) | — | — | — | — | |||||||||||||
| 32,163 | 3,743 | 447 | — | — | |||||||||||||||
| Ending Balance |
$ | 39,263 | $ | 7,100 | $ | 3,357 | $ | 2,910 | $ | 2,910 | |||||||||
OREO was $39.3 million at December 31, 2009, an increase of $32.2 million. The summary of OREO by loan type over the last five years is in the table above. The increase in OREO in 2009 occurred primarily in the construction and commercial real estate loan portfolios. During 2009, the Bank sold $16.3 million of OREO loans at a loss of $1.1 million. Of the $1.1 million of losses, one commercial property had a loss of $596,000 while the remaining gains and losses arose on the sale of the other 29 OREO. The net loss on sale of OREOs is recorded in non-interest income within the other income line item of the financial statements. Valuation adjustments made to OREO properties prior to sale are recorded in non-interest expense within other expenses – net loan expenses. All valuation adjustments include a reduction for the estimated selling costs of 10% of the valuation or listing price.
The increase in OREO at December 31, 2008 compared to December 31, 2007 occurred primarily from foreclosure of land and commercial buildings. These properties represented $6.1 million of the $7.1 million balance at December 31, 2008.
IMPAIRED LOANS
A loan is identified as impaired when it is probable that interest and principal will not be collected according to the contractual terms of the loan agreement. Most impaired loans are classified as non-accrual. However, there are some loans that are termed impaired because of doubt regarding collectibility of interest and principal according to the contractual terms, but are both fully secured by collateral and are current in their interest and principal payments. These impaired loans are not classified as non-accrual. After Management determines a loan is impaired, it obtains the fair value of the loan. A valuation allowance is established for an impaired loan when the fair value of the loan is less than the recorded investment. For additional information in obtaining the fair value of a loan, refer to Note 23, “Fair Value of Financial Instruments,” on page 164 of the Consolidated Financial Statements.
68
Table of Contents
At December 31, 2009, 2008 and 2007, the Bank had $277.2 million, $157.4 million and $54.2 million of impaired loans, respectively. For additional disclosure and information regarding impaired loans refer to Note 5, “Loans” of the Consolidated Financial Statements on page 125.
DEPOSITS
The average balance of deposits by category and the average effective interest rates paid on deposits is summarized for the years ended December 31, 2009, 2008 and 2007 in the table below.
| Year Ended December 31, | ||||||||||||||||||
| 2009 | 2008 | 2007 | ||||||||||||||||
| (dollars in thousands) | ||||||||||||||||||
| Average | Average | Average | ||||||||||||||||
| Balance | Yield | Balance | Yield | Balance | Yield | |||||||||||||
| NOW accounts |
$ | 1,036,354 | 0.58 | % | $ | 1,069,908 | 0.96 | % | $ | 1,154,287 | 2.13 | % | ||||||
| Money market deposit accounts |
446,690 | 1.10 | % | 654,529 | 1.81 | % | 721,550 | 3.68 | % | |||||||||
| Savings accounts |
366,000 | 0.78 | % | 257,416 | 0.73 | % | 273,869 | 1.20 | % | |||||||||
| Time certificates of deposit for $100,000 or more |
1,582,469 | 2.64 | % | 1,214,797 | 3.54 | % | 1,004,376 | 4.96 | % | |||||||||
| Time certificates of deposit for less than $100,000 |
1,405,749 | 2.81 | % | 831,267 | 2.93 | % | 698,245 | 3.66 | % | |||||||||
| Interest-bearing deposits |
4,837,262 | 1.96 | % | 4,027,917 | 2.27 | % | 3,852,327 | 3.37 | % | |||||||||
| Demand deposits |
1,233,281 | 1,094,126 | 1,118,460 | |||||||||||||||
| Total Deposits |
$ | 6,070,543 | $ | 5,122,043 | $ | 4,970,787 | ||||||||||||
The decrease in deposits is primarily due to the build-up of brokered CDs in the latter part of 2008 to fund the 2009 RAL season. Brokered CDs had been used in past years for the funding of RAL but not to the degree they were used in 2009. Due to the Company’s inability to set-up a securitization facility into which the Company could sell RALs as had been done in prior years, in the third and fourth quarters of 2008, Management issued $1.28 billion of brokered CDs and the Bank offered CD promotions to fund the 2009 RAL season. Brokered CDs at December 31, 2009 and 2007 totaled $775.3 million and $258.9 million. The brokered CDs are reported in the table above in time certificates less than $100,000. “Time deposits” and “CDs” are used interchangeably. The promotional CDs were offered at higher market rates to build deposits and assist with funding RALs. At the same time, the FOMC dropped interest rates throughout 2008 and left the short term borrowing rate at 0 – 0.25% for the entire 2009 year which dropped interest rates paid on deposits, causing the decrease in cost for deposits across all deposit products.
Total deposits increased to $6.59 billion at December 31, 2008 from $4.96 billion at December 31, 2007, an increase of $1.63 billion or 32.7%. Most of this increase was due to the growth in CDs explained in the preceding paragraph. In addition, in the fourth quarter of 2008, the Bank became a member of Certificate of Deposit Account Registry Service (“CDARS”) which provides FDIC insurance for large deposits which has also increased deposits in 2008. As disclosed in the table above, the interest rates paid on deposits decreased significantly over 2008 due to the decrease in interest rates by the FOMC.
Included in the sale of the Santa Paula and Harvard branches in October 2008 were $54.4 million in deposits of all types. The Company recorded a $3.1 million gain on sale related to this transaction.
69
Table of Contents
Certificates of Deposit of $100,000 or More
The table below discloses the distribution of maturities of CDs or time deposits of $100,000 or more at December 31, 2009, 2008 and 2007:
| December 31, | |||||||||
| 2009 | 2008 | 2007 | |||||||
| (in thousands) | |||||||||
| Three months or less |
$ | 316,414 | $ | 617,622 | $ | 573,588 | |||
| Over three months through six months |
252,144 | 420,485 | 198,849 | ||||||
| Over six months through one year |
774,805 | 316,235 | 230,916 | ||||||
| Over one year |
150,840 | 328,632 | 59,918 | ||||||
| $ | 1,494,203 | $ | 1,682,974 | $ | 1,063,271 | ||||
LONG TERM DEBT AND OTHER BORROWINGS
Long-term debt and other borrowings were $1.31 billion at December 31, 2009 compared to $1.74 billion at December 31, 2008. This decrease is due to the repayment of long-term FHLB advances of $732.3 million of which $265.0 million were repaid before their contractual due dates and $3.8 million of prepayment penalties were paid for the year ended December 31, 2009. The prepayment penalties were incurred due to the repayment of high interest advances which will improve the Company’s net interest margin in future periods. In addition, the use of short term FHLB advances decreased by $210.0 million since December 31, 2008.
Long-term debt and other borrowings increased $334.6 million or 23.8% from December 31, 2008 compared to December 31, 2007. This increase was caused by the Bank’s strong loan growth during 2008. Included in this increase are short-term FHLB advances of $230.0 million which are due to be repaid in one year or less.
70
Table of Contents
CONTRACTUAL OBLIGATIONS AND OFF-BALANCE SHEET ARRANGEMENTS
The Company has entered into a number of transactions, agreements, or other contractual arrangements whereby it has obligations that must be settled by cash or contingent obligations that must be settled by cash in the event certain specified conditions occur. The table below lists the Company’s contractual obligations.
| December 31, 2009 | |||||||||||||||
| Total | Less than one year |
One to three years |
Three to five years |
More than five years | |||||||||||
| (in thousands) | |||||||||||||||
| Deposits |
$ | 5,446,194 | $ | 4,895,129 | $ | 473,804 | $ | 76,184 | $ | 1,077 | |||||
| Operating lease obligations |
86,904 | 12,187 | 21,536 | 15,929 | 37,252 | ||||||||||
| Capital lease obligations (1) |
43,311 | 748 | 1,592 | 1,891 | 39,080 | ||||||||||
| Long-term debt and other borrowings: |
|||||||||||||||
| Federal Home Loan Bank advances |
1,099,493 | 372,000 | 357,267 | 166,357 | 203,869 | ||||||||||
| Treasury Tax & Loan amounts due to Federal Reserve Bank |
6,484 | 6,484 | — | — | — | ||||||||||
| Subordinated debt issued by the Bank |
121,000 | — | 36,000 | 85,000 | — | ||||||||||
| Subordinated debt issued by the Company |
69,426 | — | — | — | 69,426 | ||||||||||
| Purchase obligations for service providers |
3,200 | 1,180 | 2,020 | — | — | ||||||||||
| LIHTCP unfunded commitments |
8,526 | 8,526 | — | — | — | ||||||||||
| Total contractual obligations |
$ | 6,884,538 | $ | 5,296,254 | $ | 892,219 | $ | 345,361 | $ | 350,704 | |||||
| (1) | As of December 31, 2009, the Company’s liability associated with the capital leases were $15.4 million, as reported in Note 14, “Long-term Debt and Other Borrowings of the Consolidated Financial Statements. In the table above, the future capital lease obligation is reported. |
Other commitments and obligations: In addition to the contractual obligations above, as a financial service provider, the Bank routinely enters into commitments to extend credit to customers. The same credit practices are used in extending these commitments as in extending loans to the Bank’s customers. These commitments are described in Note 5, “Loans” of the Company’s Consolidated Financial Statements. The Company also provides postretirement benefit plans to eligible retirees as described in Note 15, “Postretirement Benefits” of the Consolidated Financial Statements and there are obligations and commitments associated with those plans.
Off-balance Sheet Reserve: As explained in Note 1, “Significant Accounting Policies” and Note 5, “Loans” of the Consolidated Financial Statements the Company must establish a reserve for off-balance sheet commitments for known or estimated losses relating to letters of credit or other unfunded loan commitments.
The Company has derivative instruments as disclosed in Note 22, “Derivative Instruments” of the Consolidated Financial Statements.
Capital Adequacy Standards
The Company and PCBNA are subject to various regulatory capital requirements administered by the Federal banking agencies. Failure to meet minimum capital requirements as specified by the regulatory framework for prompt corrective action could cause the regulators to initiate certain mandatory or
71
Table of Contents
discretionary actions that, if undertaken, could have a direct material effect on the Company’s financial statements. For additional information regarding the Company’s capital refer to Note 19, “Shareholders’ Equity” and Note 20, “Regulatory Capital Requirements” of the Consolidated Financial Statements.
The Company’s and PCBNA’s capital ratios as of December 31, 2009 and 2008 were as follows:
| Total Capital |
Tier 1 Capital |
Risk- Weighted Assets |
Tangible Average Assets |
Total Capital Ratio |
Tier 1 Capital Ratio |
Tier 1 Leverage Ratio |
|||||||||||||||
| (dollars in thousands) | |||||||||||||||||||||
| December 31, 2009 |
|||||||||||||||||||||
| PCB (consolidated) |
$ | 549,363 | $ | 412,372 | $ | 5,282,952 | $ | 7,716,187 | 10.4 | % | 7.8 | % | 5.3 | % | |||||||
| PCBNA |
561,674 | 425,032 | 5,254,687 | 7,720,560 | 10.7 | % | 8.1 | % | 5.5 | % | |||||||||||
| December 31, 2008 |
|||||||||||||||||||||
| PCB (consolidated) |
$ | 880,523 | $ | 712,003 | $ | 6,016,764 | $ | 8,107,248 | 14.6 | % | 11.8 | % | 8.8 | % | |||||||
| PCBNA |
863,613 | 695,237 | 6,005,146 | 8,098,895 | 14.4 | % | 11.6 | % | 8.6 | % | |||||||||||
| Minimum Capital Ratios required by the OCC |
12.0 | % | N/A | 9.0 | % | ||||||||||||||||
| Well-capitalized ratios |
10.0 | % | 6.0 | % | 5.0 | % | |||||||||||||||
| Adequately capitalized ratios |
8.0 | % | 4.0 | % | 4.0 | % | |||||||||||||||
The minimum capital ratios required to be considered “well capitalized” and “adequately capitalized” under generally applicable regulatory guidelines are included in the table above. While the Company and PCBNA each met the minimum capital ratios required to be considered “well capitalized” under generally applicable regulatory guidelines as of December 31, 2009, unless the Company is successful in executing on its three-year capital and strategic plan, there is a substantial risk that the Company and PCBNA will fail to meet or exceed such minimum capital ratios in future periods. In addition to the minimum capital ratios noted above, PCBNA has agreed to maintain a minimum Tier 1 leverage ratio of 9.0% from and after September 30, 2009, and a minimum total risk based capital ratio of 12.0% from and after September 30, 2009. As noted in the table above, PCBNA had a Tier 1 leverage ratio of 5.5% and a total risk based capital ratio of 10.7% as of December 31, 2009, which were not sufficient to meet the higher levels that PCBNA agreed to maintain under its agreement with the OCC. In addition, PCBNA’s Tier 1 leverage ratio at September 30, 2009 and June 30, 2009 and total risk based capital ratio at September 30, 2009 were not sufficient to meet the higher levels that PCBNA agreed to maintain under its agreement with the OCC. As a result, PCBNA may be subject to further supervisory action, which could have a material adverse effect on its results of operations, financial condition and business.
Risk-weighted assets are computed by applying a weighting factor from 0% to 100% to the carrying amount of the assets as reported in the balance sheet and to a portion of off-balance sheet items such as loan commitments and letters of credit. The definitions and weighting factors are all contained in the regulations. However, the capital amounts and classifications are also subject to qualitative judgments by the regulators about components, risk weightings, and other factors.
Additional Capital
The Company will need to raise additional capital to meet the higher minimum capital levels that PCBNA is obligated to maintain under its agreement with the OCC. In addition, should the Company’s current rate of operating losses continue or should the Company’s asset quality erode and require significant additional provision for credit losses, resulting in additional net operating losses, the Company’s capital levels will decline further and it will need to raise more capital to satisfy its
72
Table of Contents
regulatory capital requirements. The Company’s ability to raise additional capital depends on conditions in the capital markets, which are outside the Company’s control, and on the Company’s financial performance. Accordingly, the Company cannot be certain of its ability to raise additional capital on acceptable terms, or at all. If the Company cannot raise additional capital, its results of operations and financial condition could be materially and adversely affected, and it may be subject to further supervisory action. See “Risk Factors—Regulatory Risk.” In addition, if the Company were to raise additional capital through the issuance of additional shares, its stock price could be adversely affected, depending on the terms of any shares it were to issue.
Availability of Capital
As a result of recent market disruptions, the availability of capital (particularly to financial services companies) has become significantly restricted. While some companies have been successful in raising additional capital, the cost of the capital has been substantially higher than the prevailing market rates prior to the market volatility. Management cannot predict when or if the markets will return to more favorable conditions.
On September 29, 2009, the Company received approval from its shareholders to increase the number of shares authorized to be issued from 100,000,000 to 500,000,000. Depending upon market conditions, the Company may be able to utilize these additional shares to raise additional capital.
Three-Year Strategic and Capital Plan
The Company continues to operate under enhanced regulatory scrutiny and in an effort to strengthen the Company’s operations and capital position going forward to enable it to better withstand and respond to adverse market conditions, the Company has developed a Capital Plan. This Capital Plan is discussed in Item 1, “Business—Three-Year Strategic and Capital Plan” on page 7 and in “Regulation and Supervision—Current Regulatory Matters” on page 82 in this Form 10-K.
Dividends from the Bank
The principal source of funds from which the Company services its debt and pays its obligations and dividends is the receipt of dividends from the Bank. The availability of dividends from the Bank is limited by various statutes and regulations. It is also possible, depending upon the financial condition of the Bank and other supervisory factors, that the OCC or FRB could restrict or prohibit the Bank from paying dividends to the Company. In this regard, and as a result of the OCC Memorandum and FRB Memorandum, both OCC and FRB approval will now be required before the Bank can pay dividends to the Company. In the event that the Bank is unable to pay dividends to the Company, the Company in turn may not be able to service its debt, pay its obligations or pay dividends on its outstanding equity securities, which would adversely affect its business, financial condition, results of operations and prospects. The Company has requested approval by the FRB to allow the Bank to reimburse the Company for all management fees and expenses, and has received such approval from the FRB.
Deferral of Interest on Trust Preferred Securities and Suspension of Cash Dividends on Series B Preferred Stock
In the second quarter of 2009, the Company elected to defer regularly scheduled interest payments on its outstanding $69.4 million of junior subordinated notes relating to its trust preferred securities and to suspend cash dividend payments on its Series B Preferred Stock. During the deferral period, interest will continue to accrue on the junior subordinated notes at the stated coupon rate, including the deferred interest, and the Company may not, among other things and with limited exceptions, pay cash dividends on or repurchase its common stock or preferred stock nor make any payment on outstanding debt obligations that rank equally with or are junior to the junior subordinated notes. At December 31, 2009, the Company has accrued but not paid $1.6 million of interest expense for the junior
73
Table of Contents
subordinated notes. As a result of the Company’s deferral of interest on the junior subordinated notes, it is likely that the Company will not be able to raise funds through the offering of debt securities until the Company becomes current on those obligations or those obligations are restructured. This deferral may also adversely affect the Company’s ability to obtain debt financing on commercially reasonable terms, or at all. As a result, the Company will likely have greater difficulty in obtaining financing and, thus, will have fewer sources to enhance its capital and liquidity position. In addition, if the Company defers interest payments on the junior subordinated notes for more than 20 consecutive quarters, the Company would be in default under the governing agreements for such notes and the amount due under such agreements would be immediately due and payable.
Also during the deferral period, cash dividends on the Series B Preferred Stock will accrue and compound on each subsequent payment date, and the Company may not, among other things and with limited exceptions, pay cash dividends on or repurchase its common stock or preferred stock that ranks equally with or is junior to the Series B Preferred Stock. At December 31, 2009, the Company has accrued and unpaid preferred stock dividends of $8.1 million. If the Company misses six quarterly dividend payments on the Series B Preferred Stock, whether or not consecutive, the U.S. Treasury will have the right to appoint two directors to the Company’s board of directors until all accrued but unpaid dividends have been paid.
Dividends on Common Stock
In the second quarter of 2009, the Board of Directors elected to suspend the payment of cash dividends on its common stock to preserve capital and liquidity. The suspension of the common stock dividends preserves $20.6 million per year of both capital and liquidity compared to the level of dividend payments last made in the first quarter of 2009.
Impact of RAL and RT Programs on Capital Adequacy
Due to the sale of the RAL and RT Programs on January 14, 2010, these programs no longer negatively impact the Company’s capital ratios from the large amount of loans added to the balance sheet during each tax season. However, in prior years these programs generated a large proportion of the Company’s net income and, consequently, capital. The Company must rely more in 2010 and future years on its core banking products and services to generate earnings and capital.
In Note 7, “RAL and RT Programs” in the Consolidated Financial Statements describes these programs and their financial impacts as well as the securitization facility that the Company utilized as one of its sources for funding RALs in 2008 and 2007.
Liquidity is the ability to effectively raise funds on a timely basis to meet cash needs of the Bank’s customers and the Company, whether it be to handle fluctuations in deposits, to provide for customers’ credit needs, or to take advantage of investment opportunities as they are presented in the market place.
The Company’s objective, managed through the Company’s Asset and Liability Committee (“ALCO”), is to ensure adequate liquidity at all times by maintaining adequate liquid assets, the ability to raise deposits and liabilities, and having access to additional funds via the capital markets.
Throughout 2009, maintaining liquidity was a major focus of the Bank as traditional sources of liquidity were no longer available or significantly changed. As a risk management measure to compensate for this and other potential funding and liquidity changes in the future, Management developed and expanded its use of a twelve month rolling cash position analysis so that changes in liquidity sources and related needs could be identified and addressed well in advance of any issues or shortfalls. At this
74
Table of Contents
time, no shortfalls have been identified for the foreseeable future, though results could change depending on industry conditions related to the credit markets and the Company’s own financial condition.
Liquidity Management
The Company manages the adequacy of its liquidity by monitoring and managing its immediate liquidity, intermediate liquidity, and long term liquidity. ALCO monitors and sets policy and related targets to ensure the Company maintains adequate liquidity. The monitoring of liquidity is done over the various time horizons, to avoid over dependence on volatile sources of funding and to provide a diversified set of funding sources. These targets are modified during certain periods to accommodate any liquidity risks the Company may encounter.
Short-term liquidity is the ability to raise funds on an overnight basis. Sources of short-term liquidity include, but are not limited to, Federal funds, FHLB short-term advances, the Federal Reserve Bank Discount Window and repurchase agreements.
Intermediate liquidity is the ability to raise funds during the next few months to meet cash obligations over those next few months. Sources of intermediate liquidity include maturities or sales of securities, term repurchase agreements, brokered CDs and term advances from the FHLB.
Long-term liquidity is the ability to raise funds over the entire planning horizon to meet cash needs anticipated due to strategic balance sheet changes. Long-term liquidity sources include: initiating special programs to increase core deposits in expanded market areas; reducing the size of securities portfolios; taking long-term advances with the FHLB; securitizing or selling loans; and accessing capital markets for the issuance of debt or equity.
Federal funds purchased and overnight repos are used to balance short-term mismatches between cash inflows from deposits, loan repayments, and maturing securities and cash outflows to fund loans, purchase securities and deposit withdrawals.
In previous years, RALs presented the Company with some special funding and liquidity needs. Additional funds were needed for RAL lending only for the very short period of time that RALs are outstanding. The season began in January and continued into April, but even within that time frame, RAL originations were highly concentrated in the last week of January and first two weeks of February. Due to the sale of the RAL Program on January 14, 2010, Management was not required to plan for the liquidity and additional borrowing capacity to fund the RAL Program. For additional information about the RAL Program refer to Note 7, “RAL and RT Programs” of the Consolidated Financial Statements.
At December 31, 2009, the Bank had available borrowing capacity of $1.27 billion at the FHLB and $525.5 million of borrowing capacity with the FRB. This borrowing capacity is utilized to fund loans when loan growth outpaces deposit growth.
At December 31, 2009, the Bank had a total of $390.3 million of brokered CDs. Management has taken additional steps to strengthen the Bank’s liquidity position by purchasing additional brokered CDs and, borrowing additional cash through the lines of credit at the FHLB and FRB discount window. These steps have provided additional cash to meet the requirements of the Bank’s customers, to continue to fund loans and, have additional cash on hand for future use. However, if the Bank’s regulatory capital position were to deteriorate such that it was classified as “adequately capitalized,” the Bank may not be able to use brokered CDs as a source of funds. A “well-capitalized” institution may accept brokered deposits without restriction. An “adequately capitalized” institution must obtain a waiver from the FDIC in order to accept, renew or roll over brokered deposits. In addition, certain interest-rate limits apply to the financial institution’s brokered and solicited deposits. Although an institution could seek permission from the FDIC to accept brokered deposits if it were no longer considered to be “well capitalized,” the
75
Table of Contents
FDIC may deny permission, or may permit the institution to accept fewer brokered deposits than the level considered desirable. If the Bank’s level of deposits were to be reduced, either by the lack of a full brokered deposit waiver or by the interest rate limits on brokered or solicited deposits, Management anticipates that the Bank would reduce its assets and, most likely, curtail its lending activities.
Liquidity Ratio
As of December 31, 2009, the Company’s liquidity ratio, which is the ratio of liquid assets of cash and cash equivalents, unpledged investment securities from the trading and AFS portfolios, federal funds sold and loans held for sale divided by short-term liabilities of demand deposits, repurchase agreements and federal funds purchased was 47.7%, compared to 67.0% at December 31, 2008. The Company’s liquidity ratio decreased at December 31, 2009 compared to December 31, 2008. Mostly, this is a result of a decrease of time deposits which include the brokered CDs issued in late 2008 for funding the 2009 RAL Program. The Company issued brokered CDs in late 2009 to build its liquidity, but in an amount less than the amount issued in 2008. The total available liquidity at December 31, 2009 was $1.45 billion.
Deferral of Interest on Trust Preferred Securities and Suspension of Cash Dividends on Common Stock and Series B Preferred Stock
In order to preserve liquidity in the current difficult economic environment, the Company has elected to defer regularly scheduled interest payments on its outstanding $69.4 million of junior subordinated notes relating to its trust preferred securities and to suspend cash dividend payments on its outstanding common stock and preferred stock. The Company expects that its deferral of interest on the junior subordinated notes and its suspension of cash dividends on its common stock and preferred stock will preserve approximately $8 million per quarter compared with the continuing level of interest and dividend payments in the first quarter of 2009.
The terms of the junior subordinated notes and the trust documents allow the Company to defer payments of interest for up to 20 consecutive quarterly periods without default or penalty. During the deferral period, the respective trusts will likewise suspend the declaration and payment of dividends on the trust preferred securities. The deferral election began with respect to regularly scheduled quarterly interest payments that would otherwise have been made in June and July of 2009. The Company has the ability under the junior subordinated notes to continue to defer interest payments through ongoing, appropriate notices to each of the trustees, and will make a decision each quarter as to whether to continue the deferral of interest. During the deferral period, interest will continue to accrue on the junior subordinated notes at the stated coupon rate, including the deferred interest, and the Company will continue to record the interest expense associated with the junior subordinated debentures. At December 31, 2009, the Company has accrued but not paid $1.6 million of interest expense for the junior subordinated notes. As a result of the Company’s deferral of interest on the junior subordinated notes, it is likely that the Company will not be able to raise funds through the offering of debt securities until the Company becomes current on those obligations or those obligations are restructured. This deferral may also adversely affect the Company’s ability to obtain debt financing on commercially reasonable terms, or at all. As a result, the Company will likely have greater difficulty in obtaining financing and, thus, will have fewer sources to enhance its capital and liquidity position.
Also during the deferral period, cash dividends on the Series B Preferred Stock will accrue and compound on each subsequent payment date, and the Company may not, among other things and with limited exceptions, pay cash dividends on or repurchase its common stock or preferred stock that ranks equally with or is junior to the Series B Preferred Stock. At December 31, 2009, the Company has accrued and unpaid preferred stock dividends of $8.1 million. If the Company misses six quarterly dividend payments on the Series B Preferred Stock, whether or not consecutive, the U.S. Treasury will have the right to appoint two directors to the Company’s board of directors until all accrued but unpaid dividends have been paid.
76
Table of Contents
Credit Ratings
The Company’s liquidity is also impacted by the credit ratings assigned to the Company and the Bank by third party rating agencies. On July 31, 2009, Moody’s downgraded the credit rating for the financial strength of the Bank from D+ to E+ and the short-term debt of the Bank from Prime-3 to Not Prime with the long-term debt of the Bank remaining under review for a possible downgrade. On July 31, 2009, DBRS downgraded the ratings of the Company from BB (high) to B, the senior debt of the Company from BB (high) to B, and the deposits and senior debt of the Bank from BBB to BB, with all ratings remaining under review with negative implications. On December 24, 2009, Moody’s downgraded the credit ratings of the Company from Caa1 to C and the long term deposits of the Bank from B1 to B3 with the financial strength rating being under review for a possible downgrade. On December 24, 2009, DBRS downgraded their credit ratings for the Company from B to CCC and the deposits and senior debt of the Bank from BB to B with all ratings remaining under review with negative implications. On February 1, 2010, DBRS downgraded the credit ratings for the Company from CCC to CC and the senior debt of the Bank from B to CCC (high).
These lower credit ratings, and any further ratings downgrades, could make it more difficult for the Company to access the capital markets going forward, as the cost to borrow or raise debt or equity capital could become more expensive. The impact of these downgrades puts further pressure on the Company’s stock price, access to capital, and impedes its access to various liquidity sources. Although the cost of PCBNA’s primary funding sources (deposits and FHLB borrowings) is not influenced directly by PCB and PCBNA credit ratings, no assurance can be given that PCBNA’s credit rating will not have any impact on its access to deposits and FHLB borrowings. Long-term debt ratings also factor into the calculation of deposit insurance premiums, and a reduction in PCBNA’s ratings would increase premiums and expense.
Regulatory Restrictions
PCB is the parent company and sole owner of the Bank, and dividends from the Bank constitute the principal source of income to PCB. However, there are various statutory and regulatory limitations and restrictions on the amount of dividends, if any, that may be paid by the Bank to PCB. For a general discussion on such limitations and restrictions, refer to “Regulation and Supervision, Dividends and Other Transfer of Funds” on page 85 of this 2009 10-K. As a result of the OCC Memorandum, the Bank is required to provide notice and obtain the non-objection of the OCC prior to declaring dividends to PCB. In addition, as a result of the FRB Memorandum, PCB is required to provide notice and obtain the prior approval of the FRB prior to receiving dividends from the Bank. Any objection by the OCC or FRB to the payment of a proposed dividend from the Bank to PCB could adversely affect PCB’s liquidity. In addition, as a result of the FRB Memorandum, PCB is required to provide notice and obtain the prior approval of the FRB prior to incurring, renewing, increasing or guaranteeing any debt, and prior to making any payments on its outstanding $69.4 million of junior subordinated notes relating to its trust preferred securities. If PCB is unable to make payments on any junior subordinated notes for more than 20 consecutive quarters, PCB would be in default under the governing agreements for such notes and the amounts due under such agreements would be immediately due and payable.
A number of critical accounting policies are used in the preparation of the Company’s Consolidated Financial Statements. The Company’s accounting policies for significant balance sheet and statement of operation accounts are disclosed in Note 1, “Summary of Significant Accounting Policies” of the Consolidated Financial Statements beginning on page 103. Management believes that a number of these are critical to the understanding of the Company’s financial condition and results of operation because they involve estimates, judgment, or are otherwise less subject to precise measurement and because the quality of the estimates materially impact those results. This section is intended (1) to identify those critical accounting policies used in the preparation of the Company’s Consolidated
77
Table of Contents
Financial Statements; (2) to clarify the methodology used in determining these estimates; (3) to identify assumptions used in determining these estimates; and (4) to provide insight to the potential impact those estimates have on the presentation of the Company’s financial condition, changes in financial condition and results of operations.
The preparation of Consolidated Financial Statements in accordance with GAAP requires Management to make certain estimates and assumptions that affect the amounts of reported assets and liabilities as well as contingent assets and liabilities as of the date of these financial statements. Some of these critical estimates concern past events that are uncertain or otherwise not subject to direct measurement. Others involve predictions regarding future events. As events occur and these estimates and assumptions are confirmed or are shown to require adjustment, they affect the reported amounts of revenues and expenses during the reporting period(s). Although Management believes these estimates and assumptions to be reasonably accurate, actual results may differ.
These critical accounting policies include:
| ¡ | Allowance for loan losses |
| ¡ | Accounting for income taxes |
| ¡ | Goodwill |
| ¡ | RAL and RT Programs |
Allowance for loan losses
Credit risk is inherent in the business of extending loans and leases to borrowers. The Company establishes an estimated reserve for these inherent loan losses and records the change in this estimate through charges to current period earnings. These charges are recorded as provision for loan losses. All specifically identifiable and quantifiable losses are charged off against the allowance when realized. The allowance for loan losses is Management’s estimate of loan losses inherent but not identified within the loan portfolio at each balance sheet date.
The Company formally determines the adequacy of the allowance on a quarterly basis. This determination is based on the periodic assessment of the credit quality or “grading” of loans. Loans are initially graded when originated. Loans are re-graded at renewal, when identified facts demonstrate change in risk of nonpayment, or if the loan becomes delinquent. Re-grading of larger problem loans occurs at least quarterly.
After reviewing the grades in the loan portfolio, the second step is to assign or allocate a portion of the allowance to groups of loans and to individual loans to cover Management’s estimate of the loss that may be present in these loans. The estimation of probable losses takes into consideration the loan grade and other factors such as:
| ¡ | loan balances |
| ¡ | loan pool segmentation |
| ¡ | historical loss analysis |
| ¡ | identification, review, and valuation of impaired loans |
| ¡ | changes in the economy impacting lending activities |
| ¡ | changes in the concentrations of various loan types |
| ¡ | changes in the growth rate or volume of lending activities |
| ¡ | changes in the trends for delinquent and problem loans |
| ¡ | changes in the control environment or procedures |
| ¡ | changes in the management and staffing effectiveness |
78
Table of Contents
| ¡ | changes in the loan review effectiveness |
| ¡ | changes in the underlying collateral values of loans |
| ¡ | changes in the competition/regulatory/legal issues |
| ¡ | unanticipated events |
| ¡ | changes and additional valuation for structured financing and syndicated national credits |
GAAP, banking regulations, and sound banking practices require that the Company record this estimate of inherent losses in the form of an allowance for loan losses. When loans are determined to be uncollectible, losses are recognized by charging them off against this allowance. When the Company recovers an amount on a loan previously charged-off, the recovery increases the amount of allowance for loan losses. Secured consumer loans, including residential real estate loans, that are 120 days past due are written down to the fair value of the collateral. Unsecured consumer loans are charged-off once the loan is 120 days past due. Commercial and industrial loans and loans secured by commercial real estate may first be classified as non-accrual when deterioration of the borrower’s credit quality has been identified. The loan will likely meet the definition of impaired and a valuation allowance established as discussed above.
Allowance for loan loss for RALs: Prior to the sale of the RAL Program in January 2010, RALs were originated in the first and second quarters of the year. The ALL related to RALs was applied on an aggregate level. Specifically, the Company used loss rates from prior years to estimate the inherent losses. However, because of the uncertainty of repayment after more than three months from origination, RALs that were unpaid at year-end were charged-off. Therefore, the Company does not have an ALL for unpaid RALs at the end of any year.
Accounting for Income Taxes
The Company is subject to the income tax laws of the U.S. and those states and municipalities in which it has business operations. These tax laws are complex and subject to different interpretations by the taxpayer and the relevant governmental taxing authorities. The Company must make judgments and interpretations about the application of these inherently complex tax laws when determining the provision for income taxes. Disputes over interpretations of the tax laws may be settled with the taxing authorities upon examination or audit.
The Company uses the asset and liability method, which recognizes a liability or asset representing the tax effects of future deductible or taxable amounts attributable to events that have been recognized in these Consolidated Financial Statements. Due to tax regulations, several items of income and expense are recognized in different periods for tax return purposes than for financial reporting purposes. These items represent “temporary differences.” The Company is required to provide in its financial statements for the eventual liability or deduction in its tax return for these temporary differences until the item of income or expense has been recognized for both financial reporting and for taxes. The provision is recorded in the form of deferred tax expense or benefit as the temporary differences arise, with the accumulated amount recognized as a deferred tax liability or asset.
Deferred tax assets represent future deductions in the Company’s income tax return, while deferred tax liabilities represent future payments to tax authorities. When realization of the benefit of a DTA is uncertain, the Company is required to recognize a valuation allowance against it. The Company recognizes deferred tax assets and liabilities for the future tax consequences related to differences between the financial statement carrying amounts of existing assets and liabilities and their respective tax bases and tax credits. Management evaluates the Company’s deferred tax assets for recoverability using a consistent approach that considers the relative impact of negative and positive evidence, including the Company’s historical profitability and projections of future taxable income.
79
Table of Contents
If Management determines, based on available evidence at the time, that it is more likely than not that some portion or all of the deferred tax assets will not be realized, then a valuation allowance against the deferred tax asset must be established. In evaluating the likelihood of realizing the benefit of the deferred tax asset, Management estimates future taxable income based on Management’s business plans and ongoing tax planning strategies against which the deferred tax asset may be applied. This process involves significant judgment about assumptions that are subject to revision from period to period based on changes in tax laws or variances between the Company’s projected operating performance and the Company’s actual results and other factors. A valuation allowance for deferred tax assets is established through an expense recorded in the statement of operations or through a charge to the Other Comprehensive Income.
For the three years ended December 31, 2009, 2008 and 2007, the Company is in a cumulative pretax loss position. For purposes of establishing a deferred tax valuation allowance, this cumulative pretax loss position is considered significant, objective evidence that the Company may not be able to realize the Company’s deferred tax assets in the future. The cumulative pretax loss position was caused primarily by the large amount of provision expense taken each year.
The amount of deferred tax assets considered realizable is subject to adjustment in future periods. Management will need to continue to monitor all available evidence related to the Company’s ability to utilize its net deferred tax assets. The Company’s income tax expense in future periods will be increased or reduced to the extent of offsetting increases or decreases to the Company’s net deferred tax asset valuation allowance.
The Company adopted the accounting guidance for Accounting for Uncertainty in Income Taxes on January 1, 2007. This guidance provides the accounting and disclosure for uncertainty in tax provisions and for the recognition and measurement related to the accounting for income taxes. At December 31, 2009, 2008 and 2007, Management concluded that there were no significant uncertain tax positions requiring recognition in the Company’s Consolidated Financial Statements. As a result, the Company did not recognize any adjustment in the liability for unrecognized tax benefits that impacted the beginning retained earnings.
This information should be read in conjunction with Note 16, “Income Taxes” of the Consolidated Financial Statements for additional information relating to the Company’s recorded provision (benefit) for income taxes and deferred tax assets and liabilities.
Goodwill
Excess of consideration paid to acquire a business over the fair value of the net assets is recorded as goodwill.
The goodwill impairment calculation is an estimate subject to ongoing review as certain circumstances may cause additional impairment to be assessed in the future. The assessment of goodwill involves reviewing the capitalized earnings of each reporting unit, the outlook of the current economic environment, the transaction multiples of publicly traded financial institutions adjusted for a change in control, estimating cash flows for future periods and estimating the fair value of the reporting unit to which the goodwill is allocated. When the fair value of a reporting unit is less than its carrying value, the Company is required to utilize a two-step valuation approach in accordance with ASC topic, Intangibles—Goodwill and Other.
The two-step valuation approach compares the carrying value to the fair values of the underlying tangible and intangible assets and liabilities for purposes of calculating the fair value of goodwill. This process is the same as when the Company purchases another Company in accordance with ASC topic, Intangibles—Goodwill and Other which provides guidance for allocating the purchase price to assets and liabilities and identifying and qualifying intangible assets.
80
Table of Contents
During the fourth quarter of 2008 and continuing into 2009, the Company’s stock price, along with the stock prices of other public regional banking institutions, declined significantly and resulted in a decrease in the Company’s market capitalization subsequent to the annual goodwill impairment testing date. Management believes this decline is primarily attributable to the general adverse conditions in the U.S. and international financial markets, unprecedented lack of liquidity, uncertainty regarding future economic policy and banking regulation changes, negative market sentiment towards the banking industry in general, and negative reaction to the net losses the Company recognized over the last five quarters.
At a minimum, Management is required to assess goodwill and other intangible assets annually for impairment and the Company has historically tested goodwill for impairment during the third quarter of each year. Due to the current economic climate, Management has been reviewing goodwill for impairment, quarterly over the last year. In the second quarter of 2009, Management concluded that the entire balance of goodwill at all reporting units was impaired and recorded a $128.7 million impairment charge. This was due to the increasingly uncertain economic environment, significant continued decline in market capitalization, and continued elevated credit losses. Accordingly, Management will no longer be assessing goodwill for impairment in future periods since the Company no longer has any goodwill to assess for impairment, as once written-off, it is not written back up despite improving conditions.
A discussion of the Company’s goodwill is discussed within the MD&A section of non-interest expenses, goodwill impairment on page 46 and in Note 10, “Goodwill and Other Intangible Assets” of the Consolidated Financial Statements.
RAL and RT Programs
On January 14, 2010, the Company sold the RAL and RT Programs segment. Therefore the following information pertains to the past operations and activities of the RAL and RT Programs which are included in the Consolidated Financial Statements presented within this Form 10-K.
RAL Interest Income
RAL interest income varies based on the amount of the loan and not the time the loan is outstanding. The larger the loan, the larger the amount at risk from nonpayment and therefore the fee varies by the amount of funds advanced due to the increased credit risk rather than the length of time that the loan is outstanding. Nonetheless, because the customer signs a loan application and note, the Company reports the fees as interest income.
RT Fees
When customers do not choose or do not qualify for a RAL, they may still benefit from an expedited payment of their income tax refund. An RT is an electronic transfer of an income tax refund directly to the taxpayer. The Company acts as a conduit from the IRS to the taxpayer enabling an expedited delivery of the taxpayer’s income tax refund. There is no credit risk or borrowing cost for the Company because RTs are only delivered to the taxpayer upon receipt of the refund directly from the IRS. Payment of an RT is made in one of two ways. The Company either authorizes the tax preparer to provide a check directly to the taxpayer or the Company deposits the refund into a taxpayer’s account. Fees earned on RTs are recognized as fee income within non-interest income.
Refund Anticipation Loan Securitization
The securitization facility was not utilized in 2009, but was used in 2008 and 2007. A detailed discussion regarding the accounting for the RAL securitization is disclosed in the Consolidated Financial Statements within Note 7, “RAL and RT Programs.”
81
Table of Contents
General
The Company and its subsidiaries are extensively regulated and supervised under both Federal and certain State laws. Regulation and supervision by Federal or State banking agencies is intended primarily for the protection of depositors and the DIF administered by the FDIC, and secondarily for the stability of the U.S. banking system. It is not intended for the benefit of Company shareholders. Set forth below is a summary description of key laws and regulations which affect the operations of the Company and its subsidiaries; it is not intended to be a complete listing or description of all laws and regulations that apply to the Company and its subsidiaries and is qualified in its entirety by reference to the applicable laws and regulations. The Federal and State agencies regulating the financial services industry also frequently adopt changes to their regulations and implemented policies.
Current Regulatory Matters
The Company and PCBNA each entered into a memorandum of understanding (“MOU”) with its respective principal banking regulators during the second quarter of 2009. An MOU is characterized by regulatory authorities as an informal action that is not published or publicly available and that is used when circumstances warrant a milder form of action than a formal supervisory action, such as a formal written agreement or order.
PCBNA entered into an MOU with the OCC on April 16, 2009. Under the OCC Memorandum, PCBNA agreed to develop and implement an updated three-year strategic plan with goals and plans to maintain adequate capital and ensure sustained earnings, and enhance written programs designed to (i) manage the risk in its commercial real estate and residential real estate loan portfolios, (ii) reduce its classified assets, (iii) strengthen its collection efforts relating to delinquent residential real estate loans, (iv) ensure that it recognizes loss relating to delinquent residential real estate loans in a timely manner, and (v) ensure that the risk associated with its commercial loan portfolio is properly reflected and accounted for in its books and records. PCBNA agreed to provide notice and obtain the non-objection of the OCC prior to declaring dividends to PCB and prior to making certain changes to its directors or senior executive officers. In addition, PCBNA agreed to maintain a minimum Tier 1 leverage ratio of 8.5% as of June 30, 2009 and 9.0% from and after September 30, 2009, and a minimum total risk based capital ratio of 11.0% as of June 30, 2009 and 12.0% from and after September 30, 2009. The Board of Directors of PCBNA has established a compliance committee comprised entirely of non-management directors and has retained a consulting firm to assist with PCBNA’s compliance with the provisions of the OCC Memorandum.
PCBNA had a Tier 1 leverage ratio of 5.5%, 5.6% and 5.7%, respectively, at December 31, 2009, September 30, 2009 and June 30, 2009, and a total risk based capital ratio of 10.7%, 10.8% and 11.2%, respectively, at December 31, 2009, September 30, 2009 and June 30, 2009. While these ratios exceed the minimum ratios required to be classified as “well capitalized” under generally applicable regulatory guidelines, the Tier 1 leverage ratio at December 31, 2009, September 30, 2009 and June 30, 2009 and the total risk based capital ratio at December 31, 2009 and September 30, 2009 were not sufficient to meet the higher levels that PCBNA is obligated to maintain under its agreement with the OCC. As a result, PCBNA may be subject to further supervisory action, which could have a material adverse effect on its results of operations, financial condition and business.
The Company entered into an MOU with the FRB on May 18, 2009. Under the FRB Memorandum, the Company agreed to develop and implement written plans designed to strengthen board oversight of the management and operations of PCBNA, maintain sufficient capital at the Company and PCBNA and service the Company’s obligations without incurring additional debt. The Company also agreed to
82
Table of Contents
provide notice and obtain the prior approval of the FRB prior to (i) receiving dividends from PCBNA, (ii) declaring or paying any dividends to its shareholders, (iii) incurring, renewing, increasing or guaranteeing any debt or purchasing, redeeming or otherwise acquiring any of its capital stock, (iv) making any payments on its trust preferred securities, and (v) making certain changes to its directors or senior executive officers.
Due to the ongoing economic downturn and the resultant deterioration in the California commercial real estate and commercial business markets and adverse impact on PCBNA’s loan portfolio and financial results, the Company and PCBNA may be the subject of additional regulatory actions in the future and face further limitations on its business. Possible enforcement actions against the Company and PCBNA could include the issuance of a cease-and-desist order that could be judicially enforced, the imposition of civil monetary penalties, the issuance of directives to increase capital or enter into a strategic transaction, whether by merger or otherwise, with a third party, the appointment of a conservator or receiver for PCBNA, the termination of insurance of deposits, the issuance of removal and prohibition orders against institution-affiliated parties, and the enforcement of such actions through injunctions or restraining orders. The imposition of any such enforcement actions would likely have an adverse effect on the Company’s results of operations, financial condition and business.
The Company
As a bank holding company, the Company is subject to regulation and examination by the FRB under the Bank Holding Company Act of 1956, as amended, (“BHCA”). The Company is required to file with the FRB periodic reports and such additional information as the FRB may require.
Restrictions on Activities
Subject to prior notice or FRB approval, bank holding companies may generally engage in, or acquire shares of companies engaged in, activities determined by the FRB to be so closely related to banking or managing or controlling banks as to be a proper incident thereto. Bank holding companies which elect and retain “financial holding company” status pursuant to the Gramm-Leach-Bliley Act of 1999 (“GLBA”), may engage in these nonbanking activities and broader securities, insurance, merchant banking and other activities that are determined to be “financial in nature” or are incidental or complementary to activities that are financial in nature without prior FRB approval. In order to elect and retain financial holding company status, all depository institution subsidiaries of a bank holding company must be well capitalized, well managed, and, except in limited circumstances, be in satisfactory compliance with the CRA. Failure to sustain compliance with these requirements or correct any non-compliance within a fixed time period could lead to divestiture of subsidiary banks or require all activities to conform to those permissible for a bank holding company. The Company has not elected financial holding company status and has not engaged in any activities determined by the FRB to be “financial in nature” or incidental or complementary to activities that are financial in nature.
Supervision and Enforcement Authority
Under the BHCA, the Company is subject to the FRB’s regulations and its authority to:
| ¡ | require periodic reports and such additional information as the FRB may require; |
| ¡ | require bank holding companies to maintain increased levels of capital (See “Capital Requirements” below); |
| ¡ | require that bank holding companies serve as a source of financial strength to subsidiary banks and commit resources as necessary to support each subsidiary bank; |
| ¡ | restrict the ability of bank holding companies to obtain dividends on other distributions from their subsidiary banks; |
83
Table of Contents
| ¡ | terminate an activity or terminate control of or liquidate or divest certain subsidiaries, affiliates or investments if the FRB believes the activity or the control of the subsidiary or affiliate constitutes a significant risk to the financial safety, soundness or stability of any bank subsidiary; |
| ¡ | require the prior approval of senior executive officer or director changes; |
| ¡ | regulate provisions of certain bank holding company debt, including the authority to impose interest ceilings and reserve requirements on such debt and require prior approval to purchase or redeem the Company’s securities in certain situations; and |
| ¡ | approve acquisitions and mergers with banks and consider certain competitive, management, financial and other factors in granting these approvals in addition to other state banking agency approvals which may also be required. |
The FRB’s view is that in serving as a source of strength to its subsidiary banks, a bank holding company should stand ready to use available resources to provide adequate capital funds to its subsidiary banks during periods of financial stress or adversity and should maintain financial flexibility and capital-raising capacity to obtain additional resources for assisting its subsidiary banks. A bank holding company’s failure to meet its source-of-strength obligations may constitute an unsafe and unsound practice or a violation of the FRB’s regulations, or both. The source-of-strength doctrine most directly affects bank holding companies where a bank holding company’s subsidiary bank fails to maintain adequate capital levels. In such a situation, the subsidiary bank will be required by the bank’s federal regulator to take “prompt corrective action.” See “Prompt Corrective Action” below.
Securities Registration and Listing
The Company’s securities are registered with the SEC under the Securities Exchange Act of 1934, as amended, and listing on The NASDAQ Global Select Market. As such, the Company is subject to the information, proxy solicitation, insider trading, corporate governance, and other requirements and restrictions of the Exchange Act, as well as the Marketplace Rules and others requirements promulgated by The NASDAQ Stock Market, LLC.
The Sarbanes-Oxley Act
The Company is subject to the accounting oversight and corporate governance requirements of the Sarbanes-Oxley Act of 2002 (“SOX”), including:
| ¡ | required executive certification of financial presentations; |
| ¡ | increased requirements for board audit committees and their members; |
| ¡ | enhanced disclosure of controls and procedures and internal control over financial reporting; |
| ¡ | enhanced controls on, and reporting of, insider trading; and |
| ¡ | increased penalties for financial crimes and forfeiture of executive bonuses in certain circumstances. |
The Bank
The Bank, as a nationally chartered bank, is subject to primary supervision, periodic examination, and regulation by the OCC. To a lesser extent, the Bank is also subject to certain regulations promulgated by the FRB and the FDIC, as administrator of the DIF. Various requirements and restrictions under the laws of the State of California and Federal banking laws and regulations affect the operations of the Bank. State and Federal statues and regulations relate to many aspects of the Bank’s operations, including reserves against deposits, ownership of deposit accounts, interest rates payable on deposits, loans, investments, mergers and acquisitions, borrowings, dividends, locations of branches and other offices and capital requirements.
84
Table of Contents
Supervision and Enforcement Authority
The federal bank regulatory agencies have extensive discretion in connection with their supervisory and enforcement activities and examination policies, including policies with respect to the classification of assets and the establishment of adequate loan loss reserves for regulatory purposes. The regulatory agencies have adopted guidelines to assist in identifying and addressing potential safety and soundness concerns before an institution’s capital becomes impaired. The guidelines establish operational and managerial standards generally relating to: (1) internal controls, information systems, and internal audit systems; (2) loan documentation; (3) credit underwriting; (4) interest rate exposure; (5) asset growth and asset quality; and (6) compensation, fees, and benefits. Further, the regulatory agencies have adopted safety and soundness guidelines for asset quality and for evaluating and monitoring earnings to ensure that earnings are sufficient for the maintenance of adequate capital and reserves. If, as a result of an examination, the OCC should determine that the financial condition, capital resources, asset quality, earnings prospects, management, liquidity, or other aspects of the Bank’s operations are unsatisfactory or that the Bank or its management is violating or has violated any law or regulation, the OCC, and separately the FDIC as insurer of the Bank’s deposits, have residual authority to:
| ¡ | require affirmative action to correct any conditions resulting from any violation or practice; |
| ¡ | direct an increase in capital and the maintenance of higher specific minimum capital ratios, which may preclude the Bank from being deemed well capitalized and restrict its ability to accept certain brokered deposits; |
| ¡ | restrict the Bank’s growth geographically, by products and services, or by mergers and acquisitions; |
| ¡ | enter into informal or formal enforcement orders, including memoranda of understanding, written agreements and consent or cease and desist orders or prompt corrective action orders to take corrective action and cease unsafe and unsound practices; |
| ¡ | require prior approval of senior executive officer or director changes |
| ¡ | remove officers and directors and assess civil monetary penalties; and |
| ¡ | take possession of and close and liquidate the Bank. |
Dividends and Other Transfer of Funds
Dividends from the Bank constitute the principal source of income to the Company. The Bank is subject to various statutory and regulatory restrictions on its ability to pay dividends. The Bank is subject first to corporate restrictions on its ability to pay dividends. In addition, the banking agencies have the authority under their safety and soundness guidelines and prompt correct action regulations to require their prior approval or to prohibit the Bank from paying dividends, depending upon the Bank’s financial condition, if such payment is deemed to constitute an unsafe or unsound practice. As discussed above in “Current Regulatory Matters,” as a result of the FRB Memorandum and OCC Memorandum, both OCC and FRB approval will now be required before the Bank may declare or pay any dividends to the Company.
The Company is a legal entity separate and distinct from the Bank. The Company’s ability to pay cash dividends is limited by California law and by the Company and Bank’s regulators as disclosed above. Under California law, the Company’s shareholders may receive dividends when and as declared by the Board of Directors out of funds legally available for such purpose. With certain exceptions, a California corporation may not pay a dividend to its shareholders unless (i) its retained earnings equal at least the amount of the proposed dividend, or (ii) after giving effect to the dividend, the corporation’s assets would equal at least 1.25 times its liabilities and for corporations with classified balance sheets, the current assets of the corporation would be at least equal to its current liabilities or, if the average of the
85
Table of Contents
earnings of the corporation before taxes on income and before interest expense for the two preceding fiscal years was less than the average of the interest expense of the corporation for those fiscal years, at least equal to 1.25 times its current liabilities.
Additionally, it is FRB policy that bank holding companies should generally pay dividends on common stock only out of income available over the past year, and only if prospective earnings retention is consistent with the organization’s expected future needs and financial condition. It is also FRB policy that bank holding companies should not maintain dividend levels that undermine the company’s ability to be a source of strength to its banking subsidiaries. In consideration of the current financial and economic environment, the FRB has indicated that bank holding companies should carefully review their dividend policy and has discouraged payment ratios that are at maximum allowable levels unless both asset quality and capital are very strong. As discussed above in “Current Regulatory Matters,” as a result of the FRB Memorandum, FRB approval will now be required before the Company may declare or pay any dividends to its shareholders.
Under the terms of the TARP CPP, for so long as any Series B Preferred Stock remains outstanding, the Company is permitted to declare and pay dividends on its common stock only if all accrued and unpaid dividends for all past dividend periods on the Series B Preferred Stock are fully paid. Until the third anniversary of the sale of the Series B Preferred Stock, unless such shares have been transferred by the U.S. Treasury or redeemed in whole, any increase in dividends on the Company’s common stock above the amount of the last quarterly cash dividend per share declared prior to October 14, 2008 ($0.22 per share) will require prior approval of the U.S. Treasury. The terms of the Company’s agreement with the U.S. Treasury allow for additional restrictions, including those on dividends, to be imposed by the U.S. Treasury, including unilateral amendments required to comply with legislative changes. As discussed above in the “Capital Resources” section of the MD&A of this Form 10-K, the Company suspended the payment of cash dividends on the Series B Preferred Stock during the second quarter of 2009, and therefore may not declare or pay dividends to its shareholders until all such accrued but unpaid dividends are fully paid.
Capital Requirements
At December 31, 2009, the Company and the Bank’s capital ratios exceeded the minimum percentage requirements for “well capitalized” institutions however as disclosed above the Company and the Bank were requested to meet elevated capital ratios which were not met. Additional information regarding these requirements are in the MD&A, Capital Resources section and in Note 20, “Regulatory Capital Requirements” of the Consolidated Financial Statements for further information regarding the regulatory capital guidelines as well as the Company’s and the Bank’s actual capitalization as of December 31, 2009.
The Federal banking agencies have adopted risk-based minimum capital guidelines for bank holding companies and banks which are intended to provide a measure of capital that reflects the degree of risk associated with a banking organization’s operations for both transactions reported on the balance sheet as assets and transactions which are recorded as off-balance sheet items, such as commitments, letters of credit and recourse arrangements. Under these capital guidelines, banking organizations are required to maintain certain minimum capital ratios, which are obtained by dividing its qualifying capital by its total risk-adjusted assets and off-balance sheet items. In general, the dollar amounts of assets and certain off-balance sheet items are “risk adjusted” and assigned to various risk categories. Qualifying capital is classified depending on the type of capital:
| ¡ | “Tier 1 capital” consists of common equity, retained earnings, qualifying non-cumulative perpetual preferred stock, a limited amount of qualifying cumulative perpetual preferred stock and minority interests in the equity accounts of consolidated subsidiaries (including trust-preferred securities), less goodwill and certain other intangible assets. Qualifying Tier 1 capital may consist of trust-preferred securities, subject to certain criteria and quantitative limits for inclusion of restricted core capital elements in Tier 1 capital. |
86
Table of Contents
| ¡ | “Tier 2 capital” includes, among other things, hybrid capital instruments, perpetual debt, mandatory convertible debt securities, qualifying term subordinated debt, preferred stock that does not qualify as Tier 1 capital, a limited amount of allowance for loan and lease losses. |
| ¡ | “Tier 3 capital” consists of qualifying unsecured subordinated debt. |
Under the capital guidelines, there are three fundamental capital ratios: a total risk-based capital ratio, a Tier 1 risk-based capital ratio and a Tier 1 leverage ratio. To be deemed “well capitalized,” a bank must have a total risk-based capital ratio, a Tier 1 risk-based capital ratio and a Tier 1 leverage ratio of at least ten percent, six percent and five percent, respectively. There is currently no Tier 1 leverage requirement for a holding company to be deemed well-capitalized. At December 31, 2009, the respective capital ratios of the Company and the Bank exceeded the minimum percentage requirements to be deemed “well-capitalized.” However, as discussed in “Current Regulatory Matters,” the Bank’s Tier 1 leverage ratio at December 31, 2009, September 30, 2009 and June 30, 2009 and the Bank’s total risk based capital ratio at December 31, 2009 and September 30, 2009 were not sufficient to meet the higher levels that it is obligated to maintain under its agreement with the OCC. As a result, PCBNA may be subject to further supervisory action, which could have a material adverse effect on its results of operations, financial condition and business.
The federal banking agencies may change existing capital guidelines or adopt new capital guidelines in the future and have required many banks and bank holding companies subject to enforcement actions to maintain capital ratios in excess of the minimum ratios otherwise required to be deemed well capitalized. As discussed in “Current Regulatory Matters,” during the second quarter of 2009, the Bank agreed to maintain a minimum Tier 1 leverage ratio of 8.5% as of June 30, 2009 and 9.0% from and after September 30, 2009, and a minimum total risk based capital ratio of 11.0% as of June 30, 2009 and 12.0% from and after September 30, 2009.
Basel and Basel II Accords
The current risk-based capital guidelines which apply to the Company and the Bank are based upon the 1988 capital accord of the International Basel Committee on Banking Supervision, a committee of central banks and bank supervisors and regulators from the major industrialized countries that develops broad policy guidelines for use by each country’s supervisors in determining the supervisory policies they apply. A new international accord, referred to as Basel II, became mandatory for large or “core” international banks outside the U.S. in 2008 (total assets of $250 billion or more or consolidated foreign exposures of $10 billion or more) and emphasizes internal assessment of credit, market and operational risk, as well as supervisory assessment and market discipline in determining minimum capital requirements. It is optional for other banks. The Basel Committee is currently reconsidering regulatory-capital standards, supervisory and risk-management requirements and additional disclosures to further strengthen the Basel II framework in response to recent worldwide economic developments. It is expected the Basel Committee may reinstitute a minimum leverage ratio requirement. The U.S. banking agencies have indicated separately that they will retain the minimum leverage requirement for all U.S. banks. It also is possible that a new tangible common equity ratio standard will be added.
Prompt Correction Action Authority
The federal banking agencies have issued regulations pursuant to the Federal Deposit Insurance Act (“FDI ACT”) defining five categories in which an insured depository institution will be placed, based on the level of its capital ratios: well-capitalized, adequately capitalized, undercapitalized, significantly undercapitalized, and critically undercapitalized. A bank that may otherwise meet the minimum requirements to be classified as well-capitalized, adequately capitalized, or undercapitalized may be treated instead as though it were in the next lower capital category if the appropriate federal banking
87
Table of Contents
agency, after notice and opportunity for hearing, determines that an unsafe or unsound condition, or unsafe or unsound practices, warrants such treatment. At each successive lower-capital category, an insured bank may be subject at the agencies’ discretion to more restrictions under the agencies’ prompt corrective action regulations, including restrictions on the bank’s activities, operational practices or the ability to pay dividends.
FDIC Deposit Insurance
The FDIC is an independent federal agency that insures deposits, up to prescribed statutory limits, of federally insured banks and savings institutions and safeguards the safety and soundness of the banking and savings industries. The FDIC insures the Bank’s customer deposits through the DIF up to prescribed limits for each depositor. Pursuant to the EESA, the maximum deposit insurance amount has been increased from $100,000 to $250,000 through December 31. 2013. The amount of FDIC assessments paid by each DIF member institution is based on its relative risk of default as measured by regulatory capital ratios and other supervisory factors. Pursuant to the Federal Deposit Insurance Reform Act of 2005, the FDIC is authorized to set the reserve ratio for the DIF annually at between 1.15% and 1.50% of estimated insured deposits. The FDIC may increase or decrease the assessment rate schedule on a semi-annual basis. In an effort to restore capitalization levels and to ensure the DIF will adequately cover projected losses from future bank failures, the FDIC, in October 2008, proposed a rule to alter the way in which it differentiates for risk in the risk-based assessment system and to revise deposit insurance assessment rates, including base assessment rates. FDIC assessments for the Bank for the year-ended December 31, 2009 were $13.4 million, excluding the special assessment, compared to $4.0 million for the same period in 2008. As of December 31, 2009, the FDIC required financial institutions to prepay 3 years of their FDIC deposit insurance. The Bank was able to obtain an exemption from this requirement due to its current financial condition.
On February 27, 2009, the FDIC approved an interim rule to institute a one-time special emergency assessment of 20 cents per $100 in domestic deposits on June 30, 2009, to be collected by September 30, 2009, to restore the DIF reserves depleted by recent bank failures. The special assessment for the Bank was $3.4 million. Changes to the assessment system include higher rates for institutions that rely significantly on secured liabilities, which may increase the FDIC’s loss in the event of failure without providing additional assessment revenue. Assessments will also be higher for institutions that rely significantly on brokered deposits but, for well-managed and well-capitalized institutions, only when accompanied by rapid asset growth.
Additionally, by participating in the FDIC’s Temporary Liquidity Guarantee Program, banks temporarily become subject to an additional assessment on deposits in excess of $250,000 in certain transaction accounts and additionally for assessments from 50 basis points to 100 basis points per annum depending on the initial maturity of the debt. Further, all FDIC-insured institutions are required to pay assessments to the FDIC to fund interest payments on bonds issued by the Financing Corporation (“FICO”), an agency of the Federal government established to recapitalize the predecessor to the DIF. The FICO assessment rates, which are determined quarterly, averaged 0.0104% of insured deposits in fiscal 2009. These assessments will continue until the FICO bonds mature in 2017.
The FDIC may terminate a depository institution’s deposit insurance upon a finding that the institution’s financial condition is unsafe or unsound or that the institution has engaged in unsafe or unsound practices that pose a risk to the DIF or that may prejudice the interest of the bank’s depositors. The termination of deposit insurance for the Bank would also result in the revocation of the Bank’s charter by the OCC.
88
Table of Contents
Operations and Consumer Compliance Laws
The Bank must comply with numerous federal anti-money laundering and consumer protection statutes and implementing regulations, including the USA PATRIOT Act of 2001, the Bank Secrecy Act, the Community Reinvestment Act, the Equal Credit Opportunity Act, the Truth in Lending Act, the National Flood Insurance Act and various federal and state privacy protection laws. Noncompliance with these laws could subject the Bank to lawsuits and could also result in administrative penalties, including, fines and reimbursements. The Bank and the Company are also subject to federal and state laws prohibiting unfair or fraudulent business practices, untrue or misleading advertising and unfair competition.
These laws and regulations mandate certain disclosure requirements and regulate the manner in which financial institutions must deal with customers when taking deposits, making loans, collecting loans, and providing other services. Failure to comply with these laws and regulations can subject the Bank to various penalties, including but not limited to enforcement actions, injunctions, fines or criminal penalties, punitive damages to consumers, and the loss of certain contractual rights.
Regulation of Non-bank Subsidiaries
Non-bank subsidiaries may be subject to additional or separate regulation and supervision by other state, federal and self-regulatory bodies.
MCM and REWA, operating subsidiaries of PCBNA, are registered investment advisors subject to regulation and supervision by the SEC. Further, the banking agencies expect banking organizations in their oversight role over functionally regulated subsidiaries, such as registered investment advisors, to assure appropriate controls are maintained that include:
| ¡ | establishing alternative sources of emergency support from the parent holding company, non-bank affiliates or external third parties prior to seeking support from the bank |
| ¡ | instituting effective policies and procedures for identifying potential circumstances triggering the need for financial support and the process for obtaining such support |
| ¡ | implementing effective controls, including stress testing and compliance reviews |
| ¡ | implementing policies and procedures to ensure compliance with disclosure and advertising requirements to clearly differentiate the investments in advised funds from obligations of the bank or insured deposits |
| ¡ | ensuring proper management, regulatory and financial reporting of contingent liabilities arising out of its investment advisory activities. |
The Company and the Bank have taken appropriate action to implement and audit compliance with these requirements.
89
Table of Contents
| ITEM 7A. | QUANTITATIVE AND QUALITATIVE DISCLOSURES ABOUT MARKET RISK |
The Company cannot operate risk-free and make a profit. Instead, the process of risk definition and assessment allows the Company to select the appropriate level of risk for the anticipated level of reward and then decide on the steps necessary to manage this risk. The key risk factors affecting the Company’s business are addressed in Item 1A, Risk Factors starting on page 15 of this Form 10-K.
Global capital markets continue to be adversely affected by different economic conditions and the resulting disruption has been particularly acute in the financial sector. Although the Company remains well capitalized and has not suffered any significant liquidity issues as a result of these recent events, the cost and availability of funds may be adversely affected by illiquid credit markets and the demand for the Company’s products and services may decline as the Company’s borrowers and customers experience the continued impact of an economic slowdown and recession. In addition, the severity and duration of these adverse conditions is unknown and may exacerbate the Company’s exposure to credit risk and adversely affect the ability of even more borrowers to perform under the terms of their lending arrangements with the Company. Accordingly the U.S. and international markets and economy may adversely affect the Company’s liquidity, financial condition, results of operations and profitability.
Changes in interest rates can potentially have a significant impact on earnings for a financial institution. The following section of this document will discuss how changes in interest rates impact the Company’s earnings as well as the impact interest rates have on interest income and the value of the Company’s equity.
INTEREST RATE RISK
With such a large proportion of the Company’s income derived from net interest income, it is important to understand how the Company is subject to interest rate risk. The value of many of the Company’s assets and liabilities change with changes in interest rates even though the interest rate applicable to the specific asset or liability is fixed.
| ¡ | In general, for a given change in interest rates, the amount of the change in value up or down is larger for instruments with longer remaining maturities. The shape of the yield curve may affect new loan yields and funding costs differently. |
| ¡ | The remaining maturity of various assets or liabilities may shorten or lengthen as interest rates change. For example, if long-term mortgage interest rates decline sharply, higher fixed-rate mortgages may prepay, or pay down faster than anticipated, thus reducing future cash flows and interest income. |
| ¡ | Repricing frequencies and maturity profiles for assets and liabilities may occur at different times. For example, in a falling rate environment, if assets reprice faster than liabilities, there will be an initial decline in earnings. Moreover, if assets and liabilities reprice at the same time, they may not be by the same increment. For instance, if the Federal funds rate increased 50 basis points (“bps”), demand deposits may rise by 10 bps, whereas prime based loans will instantly rise 50 bps. |
Monthly evaluations, monitoring and management of interest rate risk (including market risk, mismatch risk and basis risk) compare the Company’s most likely rate scenario, base case, with various earnings simulations using many interest rate scenarios. These scenarios differ in the direction of interest rate changes, the degree of change over time, the speed of change and the projected shape of the yield curve. These results are prepared by the Company’s Treasury Department and presented to the ALCO each month for further consideration.
Financial instruments do not respond in a parallel fashion to rising or falling interest rates. This causes asymmetry in the magnitude of changes in net interest income and net economic value resulting from
90
Table of Contents
the hypothetical increases and decreases in interest rates. It is therefore mandatory to monitor interest rate risk and adjust the Company’s funding strategies to mitigate adverse effects of interest rate shifts on the Company’s balance sheet. While derivative instruments are effective hedging tools, the Company generally has been successful at maintaining its interest rate risk profile within policy limits strictly from pro-active deposit pricing and funding strategies. In the future, however, other strategies may be implemented to manage interest rate risk. These strategies may include, and have included in the past but may not be limited to, utilizing interest rate derivatives, buying or selling loans or securities, utilizing structured repurchase agreements and entering into other interest rate risk management instruments and techniques. The Company does not have a significant amount of derivative instruments.
RATE SENSITIVITY
Net Interest Income and Economic Value of Equity Simulations
The results of the asset liability model indicate how much of the Company’s net interest income and net economic value are “at risk” (deviation from the base case) from 2% shocks. This exercise is valuable in identifying risk exposures and in comparing the Company’s interest rate risk profile relative to other financial intermediaries.
The economic value of equity (“EVE”) interest rate shock report for December 31, 2009 and 2008 is as follows:
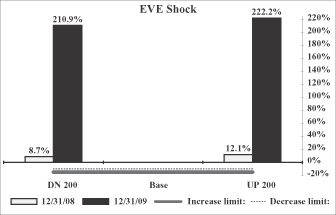
| |||||||||||||
| EVE Shock Summary Report | |||||||||||||
| (in millions) | |||||||||||||
| DN 200 | Base | UP 200 | |||||||||||
| Total Assets: |
$ | 7,435 | $ | 7,233 | $ | 6,934 | |||||||
| Total Liabilities: |
7,371 | 7,212 | 6,868 | ||||||||||
| Net Asset Value: |
$ | 64 | $ | 21 | $ | 66 | |||||||
| Dec. 31, 2009 |
210.9 | % | 222.2 | % | |||||||||
| Dec. 31, 2008 |
8.8 | % | 12.0 | % | |||||||||
| Policy limit for rate increase: |
-15.0 | % | -15.0 | % | |||||||||
| Policy limit for rate decrease: |
-10.0 | % | -10.0 | % | |||||||||
| Within Limit: |
Yes | Yes | |||||||||||
EVE Summary
Assuming the entire yield curve was to instantaneously increase 200 basis points, the Company’s projected EVE at December 31, 2009 would increase by approximately 222.2% from the base. At December 31, 2008 in the up 200 basis point scenario, the Company’s EVE was projected to increase by approximately 12.0% from the base projection. In the interest rate down 200 basis point scenario, an assumption that the yield curve instantaneously decreases 200 basis points where appropriate. When the yield curve is less than 2 percent, the yield curve is assigned a floor of zero. Using this methodology and assuming the entire yield curve shifts down 200 basis points, the projected EVE at December 31, 2009 is forecasted to increase by approximately 210.9% from the base. December 31, 2008, in the down 200 basis point scenario, the Company’s EVE was projected to increase by approximately 8.8% from the base projection.
91
Table of Contents
The net interest income (“NII”) interest rate shock report for the nine month periods ended December 31, 2009 and 2008 is as follows:
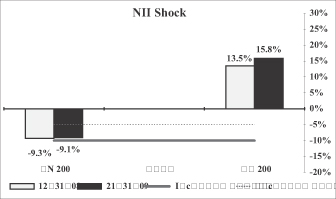
| |||||||||||||
| NII Shock Summary Report | |||||||||||||
| (in millions) | |||||||||||||
| DN 200 | Base | UP 200 | |||||||||||
| Interest Income |
$ | 274.2 | $ | 295.1 | $ | 336.3 | |||||||
| Interest Expense |
$ | 97.0 | 100.2 | 110.5 | |||||||||
| Net Interest Income: |
$ | 177.2 | $ | 194.9 | $ | 225.8 | |||||||
| Dec. 31, 2009 |
-9.1 | % | 15.8 | % | |||||||||
| Dec. 31, 2008 |
-9.3 | % | 13.5 | % | |||||||||
| Policy limit for rate increase: |
-10.0 | % | -10.0 | % | |||||||||
| Policy limit for rate decrease: |
-5.0 | % | -5.0 | % | |||||||||
| Within Limit: |
Yes | Yes | |||||||||||
NII Summary
Assuming the entire yield curve was to instantaneously increase 200 basis points, the projected net interest income for the next twelve periods beginning January 1, 2010 would increase by approximately 15.8% from the base projection. At December 31, 2008 in the up 200 basis point scenario, the Company’s projected net interest income for the twelve month period beginning January 1, 2009 would have increased by approximately 13.5% from the base projection. The rates down 200 basis points scenario assumes the yield curve instantaneously decreases 200 basis points where appropriate. When the yield curve is less than 2 percent, the yield curve is assigned a floor of zero. Using this methodology and assuming the entire yield curve shifts down 200 basis points, the Company’s projected net interest income for the twelve month period beginning January 1, 2010 would decrease by approximately 9.1%. At December 31, 2008, in the down 200 basis point scenario, the Company’s projected net interest income for the twelve month period beginning January 1, 2009 was projected to decrease by approximately 9.3% from the base projection.
The following have contributed to the improved EVE figures:
| ¡ | Elimination of Goodwill; |
| ¡ | increase in allowance for loan loss; |
| ¡ | assumptions for calculation of base market value of non-accrual loans to reflect the portion of principal that is expected to be recovered; |
| ¡ | credit risk premium embedded in effective discount rates. |
The first three items increase the responsiveness of the EVE to changes in interest rates because they eliminate or offset to a larger degree a portion of the Company’s assets that are unresponsive to changes in interest rates.
Revised assumptions in 2009 significantly impacted the base market value of net assets. The increase in EVE results is mostly due to the reduction of the denominator (equity) in the EVE calculation as opposed to net asset value change from base.
92
Table of Contents
Among the assumptions that have been included in the model are those that address optionality.
| ¡ | The option customers have to prepay their loans or the decay rate of non-maturing deposits; |
| ¡ | the option issuers of some of the securities held by the Company have to prepay or call their debt; |
| ¡ | the option of the Company to prepay or call certain types of its debt; |
| ¡ | the option of the Company to reprice its administered deposits; and |
| ¡ | improved incorporation of loan features, including imbedded caps and floors, reset features and other aspects of loan terms and conditions. |
Simulation estimates depend on, and will change with, the size and mix of the actual and projected balance sheet at the time of each simulation. Management is unaware of any material limitations such that results would not reflect the net interest risk exposures of the Company. Various shortcomings are inherent in both the EVE and NII sensitivity analyses. Certain assumptions may not reflect the manner in which actual yields and costs respond to market changes. Similarly, prepayment estimates and similar assumptions are subjective in nature, involve uncertainties and, therefore, cannot be determined with precision. Changes in interest rates may also affect the Company’s operating environment and operating strategies as well as those of the Company’s competitors. In addition, certain adjustable rate assets have limitations on the magnitude of rate changes over specified periods of time. Accordingly, although the Company’s NII sensitivity analyses may provide an indication of the Company’s interest rate risk exposure, such analyses are not intended to and do not provide a precise forecast of the effect of changes in market interest rates on the Company’s net interest income and the Company’s actual results will differ. There are no material positions, instruments or transactions that are not included in the modeling or included instruments that have special features that are not included.
93
Table of Contents
| ITEM 8. | CONSOLIDATED FINANCIAL STATEMENTS AND SUPPLEMENTARY DATA |
Audited consolidated financial statements and related documents required by this item are included in this Annual Report on Form 10-K on the pages indicated:
| Reports of Independent Registered Public Accounting Firm—Ernst & Young LLP |
95 | |
| Consolidated Balance Sheets as of December 31, 2009 and 2008 |
97 | |
| Consolidated Statements of Operations for the years ended December 31, 2009, 2008, and 2007 |
98 | |
| 99 | ||
| 100 | ||
| Consolidated Statements of Cash Flows for the years ended December 31, 2009, 2008, and 2007 |
101 | |
| 103 | ||
| The following unaudited supplementary data is included in this Annual Report on Form 10-K on the page indicated: |
||
| 178 | ||
94
Table of Contents
REPORT OF INDEPENDENT REGISTERED PUBLIC ACCOUNTING FIRM
The Board of Directors and Shareholders of Pacific Capital Bancorp
We have audited the accompanying consolidated balance sheets of Pacific Capital Bancorp and subsidiaries (the Company) as of December 31, 2009 and 2008, and the related consolidated statements of operations, comprehensive income (loss), changes in shareholders’ equity, and cash flows for each of the three years in the period ended December 31, 2009. These financial statements are the responsibility of the Company’s management. Our responsibility is to express an opinion on these financial statements based on our audits.
We conducted our audits in accordance with the standards of the Public Company Accounting Oversight Board (United States). Those standards require that we plan and perform the audit to obtain reasonable assurance about whether the financial statements are free of material misstatement. An audit includes examining, on a test basis, evidence supporting the amounts and disclosures in the financial statements. An audit also includes assessing the accounting principles used and significant estimates made by management, as well as evaluating the overall financial statement presentation. We believe that our audits provide a reasonable basis for our opinion.
In our opinion, the financial statements referred to above present fairly, in all material respects, the consolidated financial position of Pacific Capital Bancorp and subsidiaries at December 31, 2009 and 2008, and the consolidated results of their operations and their cash flows for each of the three years in the period ended December 31, 2009, in conformity with U.S. generally accepted accounting principles.
The accompanying consolidated financial statements have been prepared assuming that the Company will continue as a going concern. The Company has experienced recurring losses from operations. As discussed in Notes 1 and 20 to the consolidated financial statements, the Company is operating under informal agreements with its principal banking regulators, which require management to take a number of actions, including, among other things, restoring and maintaining its capital levels at amounts that are in excess of the Company’s current capital levels. These matters raise substantial doubt about the Company’s ability to continue as a going concern. Management’s plans to address these matters are described in Note 1. The 2009 consolidated financial statements do not include any adjustments that might result from the outcome of this uncertainty.
We also have audited, in accordance with the standards of the Public Company Accounting Oversight Board (United States), Pacific Capital Bancorp’s internal control over financial reporting as of December 31, 2009, based on criteria established in Internal Control-Integrated Framework issued by the Committee of Sponsoring Organizations of the Treadway Commission and our report dated March 12, 2010 expressed an unqualified opinion thereon.
/s/ Ernst & Young LLP
Los Angeles, California
March 12, 2010
95
Table of Contents
REPORT OF INDEPENDENT REGISTERED PUBLIC ACCOUNTING FIRM
The Board of Directors and Shareholders of Pacific Capital Bancorp
We have audited Pacific Capital Bancorp’s (the Company) internal control over financial reporting as of December 31, 2009, based on criteria established in Internal Control—Integrated Framework issued by the Committee of Sponsoring Organizations of the Treadway Commission (the COSO criteria). The Company’s management is responsible for maintaining effective internal control over financial reporting, and for its assessment of the effectiveness of internal control over financial reporting included in the accompanying Management’s Report of Internal Controls Over Financial Reporting. Our responsibility is to express an opinion on the Company’s internal control over financial reporting based on our audit.
We conducted our audit in accordance with the standards of the Public Company Accounting Oversight Board (United States). Those standards require that we plan and perform the audit to obtain reasonable assurance about whether effective internal control over financial reporting was maintained in all material respects. Our audit included obtaining an understanding of internal control over financial reporting, assessing the risk that a material weakness exists, testing and evaluating the design and operating effectiveness of internal control based on the assessed risk, and performing such other procedures as we considered necessary in the circumstances. We believe that our audit provides a reasonable basis for our opinion.
A company’s internal control over financial reporting is a process designed to provide reasonable assurance regarding the reliability of financial reporting and the preparation of financial statements for external purposes in accordance with generally accepted accounting principles. A company’s internal control over financial reporting includes those policies and procedures that (1) pertain to the maintenance of records that, in reasonable detail, accurately and fairly reflect the transactions and dispositions of the assets of the company; (2) provide reasonable assurance that transactions are recorded as necessary to permit preparation of financial statements in accordance with generally accepted accounting principles, and that receipts and expenditures of the company are being made only in accordance with authorizations of management and directors of the company; and (3) provide reasonable assurance regarding prevention or timely detection of unauthorized acquisition, use or disposition of the company’s assets that could have a material effect on the financial statements.
Because of its inherent limitations, internal control over financial reporting may not prevent or detect misstatements. Also, projections of any evaluation of effectiveness to future periods are subject to the risk that controls may become inadequate because of changes in conditions, or that the degree of compliance with the policies or procedures may deteriorate.
In our opinion, Pacific Capital Bancorp maintained, in all material respects, effective internal control over financial reporting as of December 31, 2009, based on the COSO criteria.
We also have audited, in accordance with the standards of the Public Company Accounting Oversight Board (United States), the consolidated balance sheets of Pacific Capital Bancorp as of December 31, 2009 and 2008 and the related consolidated statements of operations, comprehensive income, shareholders’ equity, and cash flows for each of the three years in the period ended December 31, 2009 and our report dated March 12, 2010 expressed an unqualified opinion thereon that included an explanatory paragraph regarding Pacific Capital Bancorp’s ability to continue as a going concern.
/s/ Ernst & Young LLP
Los Angeles, California
March 12, 2010
96
Table of Contents
Pacific Capital Bancorp and Subsidiaries
CONSOLIDATED BALANCE SHEETS
| December 31, | ||||||
| 2009 | 2008 | |||||
| (in thousands, except per share amounts) | ||||||
| Assets: |
||||||
| Cash and due from banks |
$ | 45,593 | $ | 79,367 | ||
| Interest-bearing demand deposits in other financial institutions |
949,929 | 1,859,154 | ||||
| Cash and cash equivalents |
995,522 | 1,938,521 | ||||
| Investment securities - trading, at fair value |
5,403 | 213,939 | ||||
| Investment securities - available-for-sale, at fair value; amortized cost of $1,135,456 at December 31, 2009 and $1,152,060 at December 31, 2008 |
1,153,687 | 1,178,743 | ||||
| Loans: |
||||||
| Held for sale, at lower of cost or fair value |
19,211 | 11,137 | ||||
| Held for investment, net of allowance for loan loss of $272,852 at December 31, 2009 and $140,908 at December 31, 2008 |
4,893,579 | 5,623,948 | ||||
| Total loans |
4,912,790 | 5,635,085 | ||||
| Premises and equipment, net |
74,011 | 78,608 | ||||
| Goodwill and other intangible assets |
9,289 | 138,372 | ||||
| Other Assets |
391,553 | 389,752 | ||||
| Total Assets |
$ | 7,542,255 | $ | 9,573,020 | ||
| Liabilities: |
||||||
| Deposits: |
||||||
| Non-interest bearing |
$ | 1,149,291 | $ | 981,944 | ||
| Interest-bearing |
4,296,903 | 5,606,758 | ||||
| Total deposits |
5,446,194 | 6,588,702 | ||||
| Securities sold under agreements to repurchase and Federal funds Purchased |
322,131 | 342,157 | ||||
| Long-term debt and other borrowings |
1,311,828 | 1,740,240 | ||||
| Other liabilities |
97,499 | 113,484 | ||||
| Total liabilities |
7,177,652 | 8,784,583 | ||||
| Commitments and contingencies (Note 18) |
||||||
| Shareholders’ equity: |
||||||
| Preferred stock - no par value; $1,000 per share stated value; 1,000 authorized, 181 issued and outstanding |
176,742 | 175,907 | ||||
| Common stock - no par value; $0.25 per share stated value; 500,000 authorized; 46,741 shares issued and outstanding at December 31, 2009 and 46,617 at December 31, 2008 |
11,689 | 11,659 | ||||
| Surplus |
123,886 | 120,137 | ||||
| Retained Earnings |
37,934 | 471,531 | ||||
| Accumulated other comprehensive income |
14,352 | 9,203 | ||||
| Total shareholders’ equity |
364,603 | 788,437 | ||||
| Total liabilities and shareholders’ equity |
$ | 7,542,255 | $ | 9,573,020 | ||
See the accompanying notes.
97
Table of Contents
Pacific Capital Bancorp and Subsidiaries
CONSOLIDATED STATEMENTS OF OPERATIONS
| Year Ended December 31, | ||||||||||||
| 2009 | 2008 | 2007 | ||||||||||
| (in thousands, except per share amounts) |
||||||||||||
| Interest income: |
||||||||||||
| Loans |
$ | 454,668 | $ | 458,200 | $ | 532,189 | ||||||
| Investment securities - trading |
5,131 | 6,833 | — | |||||||||
| Investment securities - available-for-sale |
42,759 | 51,175 | 48,567 | |||||||||
| Other |
2,958 | 3,125 | 2,853 | |||||||||
| Total interest income |
505,516 | 519,333 | 583,609 | |||||||||
| Interest expense: |
||||||||||||
| Deposits |
95,025 | 91,422 | 129,728 | |||||||||
| Securities sold under agreements to repurchase and Federal funds purchased |
10,135 | 13,076 | 17,997 | |||||||||
| Long-term debt and other borrowings |
60,092 | 74,321 | 74,686 | |||||||||
| Total interest expense |
165,252 | 178,819 | 222,411 | |||||||||
| Net interest income |
340,264 | 340,514 | 361,198 | |||||||||
| Provision for loan losses |
426,936 | 218,335 | 113,272 | |||||||||
| Net interest (loss)/income after provision for loan losses |
(86,672 | ) | 122,179 | 247,926 | ||||||||
| Non-interest income: |
||||||||||||
| Refund transfer fees |
68,315 | 68,731 | 45,984 | |||||||||
| Service charges and fees |
27,473 | 29,157 | 35,058 | |||||||||
| Trust and investment advisory fees |
21,247 | 25,175 | 23,852 | |||||||||
| Gain/(loss) on securities, net |
10,970 | (3,346 | ) | (1,106 | ) | |||||||
| Gain on sale of RALs, net |
— | 44,580 | 41,822 | |||||||||
| Gain on leasing portfolio sale, net |
— | — | 24,344 | |||||||||
| Other |
7,119 | 11,649 | 14,553 | |||||||||
| Total non-interest income |
135,124 | 175,946 | 184,507 | |||||||||
| Non-interest expense: |
||||||||||||
| Goodwill impairment |
128,710 | 22,068 | — | |||||||||
| Salaries and employee benefits |
116,814 | 125,474 | 122,044 | |||||||||
| Refund program fees |
47,428 | 58,378 | 50,919 | |||||||||
| Occupancy expense, net |
27,681 | 26,715 | 22,875 | |||||||||
| Other |
142,243 | 106,810 | 79,522 | |||||||||
| Total non-interest expense |
462,876 | 339,445 | 275,360 | |||||||||
| (Loss)/income before provision for income taxes |
(414,424 | ) | (41,320 | ) | 157,073 | |||||||
| Provision/(benefit) for income taxes |
6,837 | (18,570 | ) | 56,185 | ||||||||
| Net (loss)/income |
(421,261 | ) | (22,750 | ) | 100,888 | |||||||
| Dividends and accretion on preferred stock |
9,996 | 1,094 | — | |||||||||
| Net (loss)/income applicable to common shareholders |
$ | (431,257 | ) | $ | (23,844 | ) | $ | 100,888 | ||||
| (Loss)/income per common share - basic |
$ | (9.24 | ) | $ | (0.52 | ) | $ | 2.15 | ||||
| (Loss)/income per common share - diluted (Note 3) |
$ | (9.24 | ) | $ | (0.52 | ) | $ | 2.14 | ||||
| Average number of common shares - basic |
46,693 | 46,273 | 46,816 | |||||||||
| Average number of common shares - diluted (Note 3) |
47,197 | 46,644 | 47,082 | |||||||||
| Dividends declared per common share |
$ | 0.11 | $ | 0.88 | $ | 0.88 | ||||||
See the accompanying notes.
98
Table of Contents
Pacific Capital Bancorp and Subsidiaries
CONSOLIDATED STATEMENTS OF COMPREHENSIVE INCOME (LOSS)
| Year Ended December 31, | ||||||||||||
| 2009 | 2008 | 2007 | ||||||||||
| (in thousands) | ||||||||||||
| Net (loss)/ income |
$ | (421,261 | ) | $ | (22,750 | ) | $ | 100,888 | ||||
| Other comprehensive (loss)/ income, net: |
||||||||||||
| Unrealized (loss)/gain on securities available-for-sale (“AFS”), net |
(342 | ) | (4,785 | ) | 3,435 | |||||||
| Impairment loss on securities included in earnings, net |
2 | 3,333 | 1,732 | |||||||||
| Realized (gain)/loss on sale and calls of AFS securities included in earnings, net |
(4,557 | ) | 72 | (1,110 | ) | |||||||
| Postretirement benefit obligation arising during period, net |
(293 | ) | (5,218 | ) | 1,566 | |||||||
| Postretirement curtailment gain, net |
(2,615 | ) | — | — | ||||||||
| Postretirement plan amendment, net |
15,804 | — | — | |||||||||
| Transition adjustment to initially apply FASB ASC 320-10-65-1, net |
(2,850 | ) | — | — | ||||||||
| Total other comprehensive income/(loss) |
5,149 | (6,598 | ) | 5,623 | ||||||||
| Comprehensive (loss)/income |
$ | (416,112 | ) | $ | (29,348 | ) | $ | 106,511 | ||||
The amount of gains from the sale of AFS securities reclassified out of accumulated other comprehensive income into earnings for 2009 was $7.9 million. The income tax expense related to this gain was $3.3 million. The amount of losses reclassified out of accumulated other comprehensive income into earnings for the year-ended December 31, 2008 was $5.9 million and $1.1 million for the year-ended December 31, 2007. The income tax benefits related to these losses were $2.5 million and $451,000 in 2008 and 2007, respectively.
As disclosed in Note 15, “Postretirement Benefits” of these Consolidated Financial Statements, the obligation for postretirement benefits was reduced significantly due to a reduction in benefits provided through the Company’s postretirement benefit plan in December 2009. The reduction in postretirement benefits increased other comprehensive income by $27.3 million. Of the $27.3 million, $4.5 million was reclassified out of other comprehensive income into current earnings at December 31, 2009. The after tax amounts related to the amendment to the postretirement benefit plan was $15.8 million and $2.6 million, respectively.
FASB ASC 320-10-65-1 is a new accounting standard as discussed on page 106 within Note 1, “Summary of Significant Accounting Policies” of these Consolidated Financial Statements.
See the accompanying notes.
99
Table of Contents
Pacific Capital Bancorp and Subsidiaries
CONSOLIDATED STATEMENTS OF CHANGES IN SHAREHOLDERS’ EQUITY
|
Preferred Stock |
Common Stock |
Accumu- lated Other Compre- hensive Income |
Retained Earnings |
Total Share- holder’s Equity |
||||||||||||||||||||||||
| Shares | Amount | Shares | Amount | Surplus | ||||||||||||||||||||||||
| (in thousands) | ||||||||||||||||||||||||||||
| Balance, December 31, 2006 |
— | $ | — | 46,880 | $ | 11,725 | $ | 117,631 | $ | 10,178 | $ | 477,842 | $ | 617,376 | ||||||||||||||
| Net income |
— | — | — | — | — | — | 100,888 | 100,888 | ||||||||||||||||||||
| Repurchased shares, net |
— | — | (1,091 | ) | (273 | ) | (24,671 | ) | — | — | (24,944 | ) | ||||||||||||||||
| Exercise of stock options |
— | — | 291 | 73 | 5,058 | — | — | 5,131 | ||||||||||||||||||||
| Stock-based compensation |
— | — | — | — | 1,877 | — | — | 1,877 | ||||||||||||||||||||
| Restricted stock grants** |
— | — | 47 | 12 | 4,058 | — | — | 4,070 | ||||||||||||||||||||
| Cash dividends declared at $0.88 per share |
— | — | — | — | — | — | (41,665 | ) | (41,665 | ) | ||||||||||||||||||
| Other comprehensive income, net |
— | — | — | — | — | 5,623 | — | 5,623 | ||||||||||||||||||||
| Balance, December 31, 2007 |
— | — | 46,127 | 11,537 | 103,953 | 15,801 | 537,065 | 668,356 | ||||||||||||||||||||
| Net loss |
— | — | — | — | — | — | (22,750 | ) | (22,750 | ) | ||||||||||||||||||
| Issuance of preferred stock and common stock warrants |
181 | 175,907 | — | — | 4,709 | — | (1,094 | ) | 179,522 | |||||||||||||||||||
| Issuance of common stock |
— | — | 407 | 102 | 7,080 | — | — | 7,182 | ||||||||||||||||||||
| Exercise of stock options |
— | — | 19 | 4 | 283 | — | — | 287 | ||||||||||||||||||||
| Stock-based compensation |
— | — | — | — | 1,330 | — | — | 1,330 | ||||||||||||||||||||
| Restricted stock grants ** |
— | — | 64 | 16 | 2,782 | — | — | 2,798 | ||||||||||||||||||||
| Cash dividends declared at $0.88 per share |
— | — | — | — | — | — | (41,114 | ) | (41,114 | ) | ||||||||||||||||||
| Adoption of EITF 06-4 Split Dollar Life Insurance |
— | — | — | — | — | — | (576 | ) | (576 | ) | ||||||||||||||||||
| Other comprehensive income, net |
— | — | — | — | — | (6,598 | ) | — | (6,598 | ) | ||||||||||||||||||
| Balance, December 31, 2008 |
181 | 175,907 | 46,617 | 11,659 | 120,137 | 9,203 | 471,531 | 788,437 | ||||||||||||||||||||
| Net loss |
— | — | — | — | — | — | (421,261 | ) | (421,261 | ) | ||||||||||||||||||
| Accretion of preferred stock discount |
— | 835 | — | — | — | — | (835 | ) | — | |||||||||||||||||||
| Preferred stock dividends |
— | — | — | — | — | — | (9,162 | ) | (9,162 | ) | ||||||||||||||||||
| Stock-based compensation |
— | — | — | — | 867 | — | — | 867 | ||||||||||||||||||||
| Restricted stock grants ** |
— | — | 124 | 30 | 2,882 | — | — | 2,912 | ||||||||||||||||||||
| Cash dividends declared at $0.11 per share |
— | — | — | — | — | — | (5,189 | ) | (5,189 | ) | ||||||||||||||||||
| Transition adjustment to initially apply FASB ASC 320-10-65-1, net |
— | — | — | — | — | (2,850 | ) | 2,850 | — | |||||||||||||||||||
| Other comprehensive income, net |
— | — | — | — | — | 7,999 | — | 7,999 | ||||||||||||||||||||
| Balance, December 31, 2009 |
181 | $ | 176,742 | 46,741 | $ | 11,689 | $ | 123,886 | $ | 14,352 | $ | 37,934 | $ | 364,603 | ||||||||||||||
| ** | The amount recognized as compensation expense related to restricted stock awards was $3.0 million, $2.9 million and $4.1 million in 2009, 2008 and 2007, respectively. |
FASB ASC 320-10-65-1 is a new accounting standard as discussed on page 106 within Note 1, “Summary of Significant Accounting Policies” of these Consolidated Financial Statements.
See the accompanying notes.
100
Table of Contents
Pacific Capital Bancorp and Subsidiaries
CONSOLIDATED STATEMENTS OF CASH FLOWS
| Year Ended December 31, | ||||||||||||
| 2009 | 2008 | 2007 | ||||||||||
| (in thousands) | ||||||||||||
| Cash flows from operating activities: |
||||||||||||
| Net (loss)/income |
$ | (421,261 | ) | $ | (22,750 | ) | $ | 100,888 | ||||
| Adjustments to reconcile net (loss)/income to net cash provided by operating activities: |
||||||||||||
| Provision for loan losses |
426,936 | 218,335 | 113,272 | |||||||||
| Depreciation and amortization |
20,474 | 24,552 | 19,976 | |||||||||
| Stock-based compensation |
3,853 | 4,205 | 6,034 | |||||||||
| Excess tax benefit of stock-based compensation |
— | (51 | ) | (821 | ) | |||||||
| Deferred income taxes |
62,907 | (50,218 | ) | 8,835 | ||||||||
| Net amortization of discounts and premiums for investment securities |
(5,418 | ) | (9,087 | ) | (11,487 | ) | ||||||
| Goodwill impairment |
128,710 | 22,068 | — | |||||||||
| LIHTCP impairment |
8,876 | — | — | |||||||||
| (Gains)/losses on: |
||||||||||||
| Benefit curtailment, net |
(4,511 | ) | — | — | ||||||||
| Sale of loans, net |
(2,612 | ) | (46,571 | ) | (67,750 | ) | ||||||
| Securities, AFS |
(7,861 | ) | 5,877 | 1,076 | ||||||||
| Futures |
(402 | ) | 4,937 | — | ||||||||
| Loss on sale of other real estate owned |
1,139 | 3 | 21 | |||||||||
| Sale of branches, net |
— | (3,099 | ) | — | ||||||||
| Loans originated for sale and principal collections, net |
19,211 | 11,137 | 345 | |||||||||
| Changes in: |
||||||||||||
| Other assets |
(84,995 | ) | (55,354 | ) | (29,337 | ) | ||||||
| Other liabilities |
103 | 54,268 | 8,584 | |||||||||
| Trading securities, net |
208,536 | (67,077 | ) | (146,864 | ) | |||||||
| Servicing rights, net |
(811 | ) | 572 | (2,433 | ) | |||||||
| Net cash provided by operating activities |
352,874 | 91,747 | 339 | |||||||||
| Cash flows from investing activities: |
||||||||||||
| Proceeds from loan sales |
168,276 | 2,246,519 | 2,111,798 | |||||||||
| Loan originations and principal collections, net |
110,484 | (2,681,547 | ) | (2,169,224 | ) | |||||||
| Proceeds from sale of AFS securities |
127,601 | 123,565 | 317,647 | |||||||||
| Principal pay downs, calls and maturities of AFS securities |
1,172,610 | 567,801 | 301,703 | |||||||||
| Purchase of AFS securities |
(1,270,328 | ) | (692,392 | ) | (326,603 | ) | ||||||
| Investment in LIHTCP |
(5,742 | ) | (10,488 | ) | (12,875 | ) | ||||||
| Purchase of Federal Home Loan Bank stock |
(705 | ) | (11,901 | ) | (4,621 | ) | ||||||
| Purchase of premises and equipment, net |
(9,197 | ) | (14,163 | ) | (10,079 | ) | ||||||
| Proceeds from sale of other real estate owned, net |
14,940 | 420 | 36 | |||||||||
| Net cash provided/(used) by investing activities |
307,939 | (472,186 | ) | 207,782 | ||||||||
101
Table of Contents
Pacific Capital Bancorp and Subsidiaries
CONSOLIDATED STATEMENTS OF CASH FLOWS
(continued)
| Year Ended December 31, | ||||||||||||
| 2009 | 2008 | 2007 | ||||||||||
| (in thousands) | ||||||||||||
| Cash flows from financing activities: |
||||||||||||
| Net (decrease)/increase in deposits |
(1,142,508 | ) | 1,628,661 | (82,266 | ) | |||||||
| Net (decrease)/increase in short-term borrowings |
(226,462 | ) | 296,157 | (132,169 | ) | |||||||
| Proceeds from long-term debt and other borrowings |
275,000 | 455,000 | 330,001 | |||||||||
| Re-payment of long-term debt and other borrowings |
(502,472 | ) | (347,272 | ) | (277,304 | ) | ||||||
| Proceeds from stock transactions |
27 | 7,485 | 4,446 | |||||||||
| Payments to repurchase common stock |
— | — | (24,944 | ) | ||||||||
| Cash dividends paid on common stock |
(5,189 | ) | (41,114 | ) | (41,665 | ) | ||||||
| Cash dividends paid on preferred stock |
(2,107 | ) | — | — | ||||||||
| Excess tax benefit of stock-based compensation |
— | 51 | 821 | |||||||||
| Proceeds from issuance of preferred stock and common stock warrants, net |
— | 179,522 | — | |||||||||
| Others, net |
(101 | ) | (93 | ) | 598 | |||||||
| Net cash (used)/provided by financing activities |
(1,603,812 | ) | 2,178,397 | (222,482 | ) | |||||||
| Net (decrease)/increase in cash and cash equivalents |
(942,999 | ) | 1,797,958 | (14,361 | ) | |||||||
| Cash and cash equivalents at beginning of year |
1,938,521 | 140,563 | 154,924 | |||||||||
| Cash and cash equivalents at end of year |
$ | 995,522 | $ | 1,938,521 | $ | 140,563 | ||||||
| Supplemental disclosure: |
||||||||||||
| Cash paid during the period for: |
||||||||||||
| Interest |
$ | 167,962 | $ | 171,879 | $ | 229,894 | ||||||
| Income taxes |
20 | 45,501 | 45,975 | |||||||||
| Non-cash investing activity: |
||||||||||||
| Net transfers from loans held for investment to loans held for sale |
$ | 172,212 | $ | 153,311 | $ | 68,343 | ||||||
| Recharacterization of loans held for sale to securities available for sale |
2,660 | 82,106 | 285,080 | |||||||||
| Investment tax credit commitments |
328 | 8,817 | 25,346 | |||||||||
| Transfers to other real estate owned, net |
48,242 | 4,166 | 503 | |||||||||
| Non-cash financing activity: |
||||||||||||
| Preferred stock dividends declared, not paid |
$ | 8,057 | $ | — | $ | — | ||||||
See the accompanying notes.
102
Table of Contents
Pacific Capital Bancorp and Subsidiaries
NOTES TO CONSOLIDATED FINANCIAL STATEMENTS
| 1. | SUMMARY OF SIGNIFICANT ACCOUNTING POLICIES |
Nature of Operations
Pacific Capital Bancorp (“the Company” or “PCB”) is a bank holding company organized under the laws of the state of California. PCB provides a full range of commercial and consumer banking services to households, professionals, and businesses through its wholly-owned subsidiary Pacific Capital Bank, National Association (“the Bank” or “PCBNA”). These banking services include depository, lending and wealth management services. PCBNA’s lending products include commercial and industrial, consumer, commercial and residential real estate loans and Small Business Administration (“SBA”) loans. Depository services include checking, interest-bearing checking (“NOW”), money market (“MMDA”), savings, and Certificate of Deposit (“CD”) accounts, as well as safe deposit boxes, travelers’ checks, money orders, foreign exchange services, and cashiers checks. PCBNA offers a wide range of wealth management services through the Commercial and Wealth Management Group (“CWMG”) segment which, in addition to a full-service trust operation, includes two registered investment advisors that are wholly-owned subsidiaries, Morton Capital Management (“MCM”) and R.E. Wacker Associates (“REWA”), and a 20% interest in Veritas Wealth Management Advisors, LLC (“Veritas”). The CWMG segment offers a wide range of trust and investment advisory services as well as the same loan and deposit products offered through the Community Banking segment. PCBNA was one of the largest nationwide providers of financial services related to the electronic filing of income tax returns including the Refund Anticipation Loan (“RAL”) and Refund Transfer (“RT”) business products until January 14, 2010, when the Company sold the RAL and RT Program segment.
PCBNA conducts its banking services under five brand names: Santa Barbara Bank & Trust (“SBB&T”), First National Bank of Central California (“FNB”), South Valley National Bank (“SVNB”), San Benito Bank (“SBB”), and First Bank of San Luis Obispo (“FBSLO”). The SBB&T offices are located in Santa Barbara, Ventura and Los Angeles counties. Banking offices are located in eight counties in the central coast of California from Los Angeles to Santa Clara.
The Company incurred a net loss applicable to common shareholders of $431.3 million and $23.8 million for the years ended December 31, 2009 and 2008, respectively. As described in Note 25, “Credit Ratings” of these Consolidated Financial Statements, the Company’s ratings were downgraded by the major rating agencies. Also, as further described in the Note 20, “Regulatory Capital Requirements” of these Consolidated Financial Statements as of December 31, 2009, the Bank failed to meet the higher minimum capital levels that it is obligated to maintain under its agreement with the Office of the Comptroller of the Currency (the “OCC”), and accordingly, may be subject to further adverse regulatory action. The accompanying financial statements do not reflect the impact, if any, of these conditions, including potential regulatory actions. If the Company’s current rate of operating losses continue, the Company’s existing capital resources will not satisfy its capital requirements for the foreseeable future and will not be sufficient to offset any additional problem assets. Additionally, if the regulatory capital position were to deteriorate such that the Bank is classified as “Adequately Capitalized” it might not be able to use brokered deposits as a source of funds as well as other adverse consequences.
As further described in Note 5, “Loans” and Note 8, “Allowance for Loan Losses” of these Consolidated Financial Statements as of December 31, 2009, the Company’s loan portfolio includes significant levels of non-performing commercial and construction loans, primarily concentrated in California, resulting in elevated levels of charge-offs. While Management believes the Company has provided an allowance
103
Table of Contents
for loan losses sufficient to cover losses inherent in the portfolio as of December 31, 2009, uncertain conditions in the real estate markets in which the Company lends could impact earnings and capital as a result of additional charge-offs, loss provisions and reserves.
Additionally, as further described in Note 14, “Long-Term Debt and Other Borrowings” the Company has elected to defer regularly scheduled interest payments on the junior subordinated debt related to the trust preferred securities.
The above factors, and, in particular, the Bank’s ability to meet the higher minimum capital levels that it is obligated to maintain under its agreement with the OCC, raise substantial doubt about the Company’s ability to continue as a going concern.
The accompanying Consolidated Financial Statements do not reflect the impact, if any, of these conditions, including potential regulatory actions.
Management is addressing the going concern matters in conjunction with the OCC Memorandum by implementing a three-year strategic and capital plan. This Plan was designed to strengthen PCBNA’s operations and capital position going forward. Key components of this plan include the following:
| ¡ | A process to identify and evaluate a broad range of strategic alternatives to strengthen the Company’s capital base and enhance shareholder value. |
| ¡ | Building and maintaining a strong capital base. |
| ¡ | Improving asset quality through a combination of efforts to reduce the current concentration of classified assets, prudently managing credit risk exposures in the existing loan portfolio, and tightening credit underwriting standards. |
| ¡ | A comprehensive review of the Bank’s entire loan portfolio to identify loans that are good candidates for sale. During 2009, the Company sold approximately $383.5 million in real estate secured loans. |
| ¡ | Substantial curtailment of the Bank’s commercial real estate lending business pending a reduction in the Bank’s risk profile and significant improvement in market conditions. |
| ¡ | Severely limited asset growth, as the Company focuses on improving asset quality and implementing necessary efficiency and risk management initiatives in the Core Bank. |
| ¡ | Maintaining prudent levels of liquidity. |
| ¡ | Improving earnings. |
| ¡ | Strengthening Management and Board of Directors oversight. |
| ¡ | Full compliance with applicable laws and regulations, including, to the maximum possible extent, regulatory capital requirements and the requirements of regulatory enforcement actions. |
| ¡ | Initiatives to improve the operating efficiency ratio through automation of key systems, process integration, and elimination of redundancies. |
| ¡ | Additional expense reduction actions that are targeted to eliminate $25 million in annual operating expenses in 2010 and another $25 million in annual operating expenses in 2011. |
Management is also evaluating various strategic options and continues to act upon both tactical and strategic alternatives to raise capital and restructure the Company’s balance sheet. While considerable
104
Table of Contents
risks to the Company’s future financial performance exist, Management believes the Company can effectively respond to these risks and carry on operations, while it implements this strategic plan and evaluates opportunities with respect to capital resources.
The Consolidated Financial Statements refer to “Management” within the disclosures. The Company’s definition of Management is the executive management team of the Company and its subsidiaries.
Basis of Presentation
The accounting and reporting policies of the Company are in accordance with accounting principles generally accepted in the United States (“GAAP”) and conform to practices within the financial services industry. The accounts of the Company and its consolidated subsidiaries are included in these Consolidated Financial Statements. All significant intercompany balances and transactions have been eliminated.
In June 2009, the Financial Accounting Standards Board (“FASB”) established the FASB Accounting Standards Codification (“FASB ASC”), as the source of authoritative GAAP recognized by the FASB to be applied by nongovernmental entities in the preparation of financial statements. Rules and interpretive releases of the U.S. Securities and Exchange Commission (“SEC”) under authority of federal securities laws are also sources of authoritative GAAP for SEC registrants. The FASB ASC became effective for the Company on September 30, 2009, and supersedes all then-existing non-SEC accounting and reporting standards. All other non-grandfathered non-SEC accounting literature not included in the FASB ASC became non-authoritative. The FASB ASC does not change or alter existing GAAP and, therefore, the adoption of the FASB ASC did not impact the Company’s Consolidated Financial Statements.
The accompanying unaudited financial information in Note 28, “Consolidated Quarterly Financial Data” of these Consolidated Financial Statements has been prepared in accordance with GAAP. The preparation of financial statements in conformity with GAAP requires management to make estimates and assumptions that affect the amount of assets and liabilities as well as disclosures of contingent assets and liabilities at the date of the financial statements. Although Management believes these estimates to be reasonably accurate, actual amounts may differ. In the opinion of Management, all adjustments considered necessary have been reflected in the financial statements during their preparation.
Certain amounts in the 2008 and 2007 financial statements have been reclassified to be comparable with classifications used in the 2009 financial statements.
Consolidation of Subsidiaries and Variable Interest Entities
PCB has six wholly-owned subsidiaries. PCBNA, a banking subsidiary, PCB Service Corporation, utilized as a trustee of deeds of trust in which PCBNA is the beneficiary and four unconsolidated subsidiaries used as business trusts in connection with issuance of trust-preferred securities as described in Note 14, “Long-term Debt and Other Borrowings” of these Consolidated Financials Statements.
PCBNA has three wholly-owned consolidated subsidiaries:
| ¡ | MCM and REWA, two registered investment advisors that provide investment advisory services to individuals, foundations, retirement plans and select institutional clients. |
| ¡ | SBBT RAL Funding Corp. which was utilized for the securitization of RALs to assist with the financing of the RAL program as described in Note 7, “RAL and RT Programs”. |
105
Table of Contents
PCBNA also retains ownership in several low-income housing tax credit partnerships (“LIHTCP”) that generate tax credits. These partnerships are not consolidated into these Consolidated Financial Statements. These investments historically have played a significant role in meeting the Bank’s Community Reinvestment Act (“CRA”) requirements as well as providing tax credits to reduce the Company’s taxable income. As further described in Note 23, “Fair Value of Financial Instruments,” Management determined there was an other-than-temporary impairment of these investments during the year ended December 31, 2009.
Veritas is a registered investment advisor organized in late 2007, in which PCBNA made an initial investment of $250,000. An additional investment of $750,000 was made in late January 2008 for a total investment of $1.0 million or a 20% interest in Veritas. Veritas commenced operations in the second quarter of 2008. For the twelve months ended December 31, 2009 and 2008, PCBNA’s ownership in Veritas had a gain of $84,000 and a loss of $80,000, respectively. PCBNA’s share of Veritas’ income is included in the Company’s Consolidated Financial Statements using the equity method.
The Company does not have any other entities that should be considered for consolidation.
Cash Reserve Requirement
All depository institutions are required by law to maintain reserves against their transaction deposits. The reserves must be held in cash or with the Federal Reserve Bank (“FRB”) for their area. The amount of the reserve may vary each day as banks are permitted to meet this requirement by maintaining the specified amount as an average balance over a two-week period. The average daily cash reserve balances required to be maintained by PCBNA totaled approximately $29.3 million in 2009 and $7.9 million in 2008. In addition, PCBNA must maintain sufficient balances to cover the checks written by bank customers that are clearing through the FRB because they have been deposited at other banks.
Securities
Classification: All investments reported by the Company as securities are debt securities. Securities may be classified as held-to-maturity, AFS or trading. The appropriate classification is decided at the time of purchase. All securities currently held by the Company are classified as either AFS or trading. At December 31, 2009 and 2008, the Company did not hold any of its securities in a held-to-maturity portfolio.
Carrying amount: Securities classified as AFS and trading are reported as an asset on the Consolidated Balance Sheets at their estimated fair value. When the fair value of the security portfolio increases, the security balance increases and when the fair value declines, the security balance decreases. Except for impaired securities, as the fair value of AFS securities changes, the changes are reported net of the appropriate income tax as an element of other comprehensive Income (“OCI”). When AFS securities are sold, the unrealized gain or loss is reclassified from other comprehensive income (loss) (“OCI”) to non-interest income. The changes in the fair value of the trading securities are reported in non-interest income as they occur.
Impaired securities: When the estimated fair value of a security is lower than the book value, a security is considered to be impaired. In Note 4, “Securities” of these Consolidated Financial Statements, the Company is required to disclose whether the impairment is temporary or other than temporary for all securities held in the AFS portfolio. Quarterly, the Company reviews impaired securities to determine whether the impairment is other than temporary.
On April 1, 2009, the Company adopted the new accounting standard for other-than-temporarily impaired (“OTTI”) securities. At adoption, a cumulative-effect transition adjustment was required.
106
Table of Contents
Management determined the amount of the transition adjustment by identifying all securities which impairment had been recognized and that were still held by the Company. Management identified 64 securities which had $6.0 million of impairment recognized from prior periods. Of the $6.0 million, Management determined that $4.9 million of this amount related to market or noncredit factors and $1.1 million related to the credit quality. The after-tax impact of recognizing the noncredit portion resulted in the recognition of a cumulative-effect adjustment that increased retained earnings by $2.9 million, with a corresponding adjustment that decreased OCI. The credit quality component versus the noncredit component were determined by comparing the present value of future cash flows to the expected cash flows to be received on an amortized cost basis including interest.
In accordance with the new accounting standard for OTTI securities, if there is not an intent to sell and it is more likely than not that the Company will not be required to sell any securities in a loss position, no impairment is recognized. If a security is in a loss position, Management is required to determine if there is an intent to sell or if the Company will be required to sell or if the Company will not recover the entire cost basis of the security. If any of these requirements are met, an impairment is recognized. The amount of OTTI resulting from credit loss is recognized in earnings and OTTI related to all other factors is recognized in OCI.
Interest income is recognized based on the coupon rate and increased by the accretion of discounts earned or decreased by the amortization of premiums paid over the contractual life of the security using the effective interest method.
PCBNA is a member of both the FRB and the Federal Home Loan Bank (“FHLB”), and as a condition of membership in both organizations, it is required to purchase stock. In the case of the FRB, the amount of stock that is required to be held is based on PCBNA’s capital. The required ownership of FHLB stock is based on the borrowing capacity used by PCBNA. These investments are considered equity securities with no actively traded market. Therefore, the shares are considered restricted investment securities and reported in other assets in the Consolidated Balance Sheets. Such investments are carried at cost, which is equal to the value at which they may be redeemed. The dividend income received from the stock is reported in other income.
Loans, Interest and Fees from Loans
Interest income on loans is accrued daily. Loan fees collected for the origination of loans less direct loan origination costs (net deferred loan fees) are amortized over the contractual life of the loan through interest income. If a loan has scheduled payments, the amortization of the net deferred loan fee is calculated using the effective interest method over the contractual life of the loan. If the loan does not have scheduled payments, such as a line of credit, the net deferred loan fee is recognized as interest income on a straight-line basis over the contractual life of the loan commitment. Loan fees received for loan commitments are recognized as interest income over the term of the commitment. When loans are repaid, any remaining unamortized balances of unearned fees, deferred fees and costs, and premiums and discounts paid on purchased loans are immediately recognized through interest income.
The Company generally holds loans for investment and has the intent and ability to hold loans until their maturity. Therefore, most loans are reported at the outstanding principal amount adjusted for any unamortized net deferred loan fees or expenses. Periodically, the Company identifies loans it expects to sell prior to maturity. When loans are identified to be sold, they are reclassified as held for sale and reported at the lower of cost or fair value in the Consolidated Balance Sheets. Included in a loan’s cost are unearned deferred fees and costs and credit discounts specifically relating to the loans held for sale. At December 31, 2009 and 2008, the Company had $19.2 million and $11.1 million, respectively of loans classified as held for sale. Additional information regarding loans classified as held for sale is disclosed in Note 5, “Loans” of these Consolidated Financial Statements.
107
Table of Contents
Since September 2008, almost all single family mortgage loans have been originated for sale. When a mortgage loan is originated for sale, the loan is segregated from the mortgage loans originated for investment. The loans are segregated due to the short period of time they are held and therefore no allowance for loan loss is provided and deferred fees or expenses are not amortized while loans are classified as held for sale. The loans are generally held for less than thirty days. If a loan has been reported as held for sale for more than 60 days, the loan is reclassified as a loan held for investment.
Some of the loans which the Bank plans to sell also have interest rate lock commitments for approximately 30 days with potential borrowers. The mortgage rate lock agreements with borrowers qualify as derivatives under GAAP. The value of these derivatives is nominal as rate lock commitments are entered into at current market rates. The Bank does not collect a fee for these interest rate locks. These mortgage rate lock commitments are not material to the Company’s Consolidated Financial Statements and therefore are not recorded. The Company had $8.5 million and $18.7 million, respectively, of mortgage loans with interest rate lock commitments.
Non-accrual Loans: When a borrower discontinues making payments as contractually required by the note, the Company must determine whether it is appropriate to continue to accrue interest. Generally, the Company places loans in a non-accrual status and ceases recognizing interest income when the loan has become delinquent by more than 90 days and/or when Management determines that the repayment of principal and collection of interest is unlikely. The Company may decide that it is appropriate to continue to accrue interest on certain loans more than 90 days delinquent if they are well secured by collateral and collection is in process. At December 31, 2009, there were $291.1 million of non-accrual loans.
When a loan is placed in a non-accrual status, any accrued but uncollected interest for the loan is reversed out of interest income in the period in which the status is changed. Subsequent payments received from the customer are applied to principal and no further interest income is recognized until the principal has been paid in full or until circumstances have changed such that payments are again consistently received as contractually required. In the case of commercial customers, the pattern of payment must also be accompanied by a positive change in the financial condition of the borrower.
Impaired Loans: A loan is identified as impaired when it is probable that interest and principal will not be collected according to the contractual terms of the loan agreement. Most impaired loans are classified as non-accrual. However, there are some loans that are termed impaired because of doubt regarding collectibility of interest and principal according to the contractual terms, but are both fully secured by collateral and are current in their interest and principal payments. These impaired loans are not classified as non-accrual. After Management determines a loan is impaired, it obtains the fair value of the loan. A valuation allowance is established for an impaired loan when the fair value of the loan is less than the recorded investment. For additional information in obtaining the fair value of a loan, refer to Note 23, “Fair Value of Financial Instruments,” on page 164 of these Consolidated Financial Statements.
Troubled Debt Restructured Loans: A loan may be restructured when the Bank determines that a borrower’s financial condition has deteriorated, but still has the ability to repay the loan. A loan is considered to be a troubled debt restructured loan when the original terms have been modified in favor of the borrower such that either principal or interest has been forgiven, contractual payments are deferred, or the interest rate is reduced.
Prepayments: Borrowers may prepay their loans before their contractual maturity. When interest rates are declining, the Company expects the rate of prepayments to increase. Changes in the rate of prepayments impact the amortization of deferred origination fees and costs. The Company recognizes the remaining unamortized amounts into interest income when a loan prepays before the contractual maturity.
108
Table of Contents
RAL and RT Programs
While the RAL and RT Programs were sold in January 2010, the following paragraphs describe the accounting for these products in 2009, 2008 and 2007.
RALs
RALs are short-term consumer loans offered to taxpayers, secured by their anticipated tax refund and subject to an underwriting process prior to approval. At the request of the taxpayer, the refund claim is paid by the Internal Revenue Service (“IRS”) to the Bank once the tax return has been processed. This constitutes the source of repayment of the RAL. Funds received from the IRS above the sum of the RAL less associated contractual fees are remitted to the taxpayer by the Bank.
The RAL funds advanced by the Bank are generally repaid by the IRS within several weeks. Therefore, the processing costs and provision for loan loss represent the major costs of these loans. This cost structure is different than for other loans since usually the cost of funds is the major cost for the Company in making a loan. Because of the short duration of RALs, the Bank cannot recover the processing costs through interest calculated over the term of the loan. Consequently, the Bank has structured the fees to have a fixed component to cover processing costs and a variable component based on the size of the loan to cover loan losses and the cost of funds.
RAL interest income varies based on the amount of the loan and not the term of the loan. The larger the loan, the greater the amount at risk from nonpayment. Therefore, the fee varies to correspond to the increased credit risk rather than the length of time the loan is outstanding.
RTs
An RT is an electronic transfer of an income tax refund directly to the taxpayer. The Company acts as a conduit from the IRS and State tax authorities to the taxpayer enabling an expedited delivery of the taxpayer’s income tax refund. There is no credit risk or borrowing cost for the Company because the funds are only delivered to the taxpayer after receipt by the Bank of the refund directly from the IRS. Payment of an RT is made in one of two ways. The Company either authorizes the tax preparer to provide a check directly to the taxpayer or the Company pays the refund into a taxpayer’s bank account through direct deposit.
Fees Earned on RALs and RTs
Income from the RAL and RT Programs consists of the fees earned on these products. Fees earned on RALs are reported in interest income because the customer has signed a promissory note while fees earned on RTs are reported in non-interest income. The Company originates these products through three channels: Jackson Hewitt, other professional tax preparers and self filers. Regardless of the program a basic fee per product is charged. The fees charged for the products differ by source due to varying contractual terms. A description of the different fee structures is provided as follows:
Jackson Hewitt (“JH”): Fees charged on RALs offered through JH include an account handling fee and a finance charge equaling a percentage of the loan amount subject to a maximum and minimum. The RT fee is a fixed amount.
Other Professional Tax Preparers: Fees charged on RALs offered through other professional tax preparers include an account handling fee and a flat fee based on certain tiered loan amounts. The RT fee is a fixed amount.
Self Filers: Fees charged on RALs offered through websites used by self filers include a flat fee for certain tiered loan amounts. The RT fee is a fixed amount. The fees charged for RALs varied as each website used by self filers had a different fee structure.
109
Table of Contents
Refund Anticipation Loan Securitization
In 2008 and 2007, as in prior years, the Company sold some of its RALs through a securitization during the months of January and February. The securitizing of RALs was utilized as a funding source for RALs. For the 2009 RAL season, the securitization was not utilized.
To qualify as a sale, a transfer of assets must meet the criteria of a “true sale”. To be accounted for as a “true sale” the accounting guidance required that (1) assets transferred be isolated from the transferor—put presumptively beyond the reach of the transferor and its creditors, even in bankruptcy or other receivership; (2) each transferee has the right to pledge or exchange the assets it received; and (3) the transferor does not maintain control over the transferred assets through either (i) an agreement that both entitles and obligates the transferor to repurchase or redeem them before their maturity or (ii) the ability to unilaterally cause the holder to return specific assets, other than through a cleanup call.
The first requirement to qualify as a “true sale” was satisfied through the sale of the RALs from the Company to a wholly-owned subsidiary of the Bank, SBBT RAL Funding Corp. This special purpose entity then sold the loans to other banks. By the structure of the purchase agreements between the Bank and this special purpose entity, the ability of the Company or its creditors to reach the assets was judged to be remote.
The second requirement to qualify as a “true sale” was satisfied because the purchase agreements with SBBT RAL Funding Corp. and the other banks gave such other banks the right to pledge or exchange the RALs.
The third requirement to qualify as a “true sale” was satisfied because there is no requirement that the SBBT RAL Funding Corp. repurchase RALs other than those that did not meet the underwriting criteria in the purchase agreements and were therefore inadvertently included among the sold loans. SBBT RAL Funding Corp. was permitted to repurchase loans in a “clean-up call” when the remaining unpaid loans had reached a minimal amount.
The purchase agreements specifically state that it was the intention of all of the parties that the transaction between SBBT RAL Funding Corp. and the participating banks and their conduits be treated as a sale for all purposes, other than for federal and state income tax purposes, and the Company has obtained a legal opinion each year supporting the true sale and legal isolation of the transferred assets from the Company.
The Company concluded that the securitization of the RALs satisfied the criteria required for sale treatment under the GAAP guidance at the time the securitizations occurred.
The securitization was active only during the first quarter and terminated prior to the end of the first quarter of each year. There are no balances, retained interests, or servicing assets to be accounted for or disclosed by March 31 of each year. Any RALs outstanding at the end of each quarter are considered as loans held for investment. In February of each year, the Company closed the securitization facility and once the facility was closed the Company did not re-open the securitization facility until the following year. There are no balances related to RALs, securitized or otherwise, recorded on the balance sheet at December 31 of each year.
Allowance for loan losses
Credit risk is inherent in the business of extending loans and leases to borrowers. The Company establishes an estimated reserve for these inherent loan losses and records the change in this estimate through charges to current period earnings. These charges are recorded as provision for loan
110
Table of Contents
losses. All specifically identifiable and quantifiable losses are charged off against the allowance when realized. The allowance for loan losses is Management’s estimate of loan losses inherent but not identified within the loan portfolio at each balance sheet date.
The Company formally determines the adequacy of the allowance on a quarterly basis. This determination is based on the periodic assessment of the credit quality or “grading” of loans. Loans are initially graded when originated. Loans are re-graded at renewal, when identified facts demonstrate change in risk of nonpayment, or if the loan becomes delinquent. Re-grading of larger problem loans occurs at least quarterly.
After reviewing the grades in the loan portfolio, the second step is to assign or allocate a portion of the allowance to groups of loans and to individual loans to cover Management’s estimate of the loss that may be present in these loans. The estimation of probable losses takes into consideration the loan grade and other factors such as:
| ¡ | loan balances |
| ¡ | loan pool segmentation |
| ¡ | historical loss analysis |
| ¡ | identification, review, and valuation of impaired loans |
| ¡ | changes in the economy impacting lending activities |
| ¡ | changes in the concentrations of various loan types |
| ¡ | changes in the growth rate or volume of lending activities |
| ¡ | changes in the trends for delinquent and problem loans |
| ¡ | changes in the control environment or procedures |
| ¡ | changes in the management and staffing effectiveness |
| ¡ | changes in the loan review effectiveness |
| ¡ | changes in the underlying collateral values of loans |
| ¡ | changes in the competition/regulatory/legal issues |
| ¡ | unanticipated events |
| ¡ | changes and additional valuation for structured financing and syndicated national credits |
GAAP, banking regulations, and sound banking practices require that the Company record this estimate of inherent losses in the form of an allowance for loan losses. When loans are determined to be uncollectible, losses are recognized by charging them off against this allowance. When the Company recovers an amount on a loan previously charged-off, the recovery increases the amount of allowance for loan losses. Secured consumer loans, including residential real estate loans, that are 120 days past due are written down to the fair value of the collateral. Unsecured consumer loans are charged-off once the loan is 120 days past due. Commercial and industrial loans and loans secured by commercial real estate may first be classified as non-accrual when deterioration of the borrower’s credit quality has been identified. The loan will likely meet the definition of impaired and a valuation allowance established as discussed above.
Allowance for loan loss for RALs: RALs are originated in the first and second quarters of the year. The allowance for loan losses related to RALs is applied on an aggregate level. Specifically, the Company uses loss rates from prior years to estimate the inherent losses. However, because of the uncertainty
111
Table of Contents
of repayment after more than three months from origination, all RALs unpaid at year-end are charged-off. Therefore, the Company does not have an allowance for loan loss for unpaid RALs at the end of any year.
Reserve for Off-Balance Sheet Commitments
In addition to the exposure to credit loss from outstanding loans, the Company is also exposed to credit loss from certain off-balance sheet commitments such as unused loan commitments and letters of credit. Losses are experienced when the Company is contractually obligated to make a payment under these instruments and must seek repayment from a party that may not be as financially sound in the current period as it was when the commitment was originally made.
As with its outstanding loans, the Company applies the same historical loss rates and qualitative factors to its off-balance sheet obligations in determining an estimate of losses inherent in these contractual obligations. The estimate for loan losses on off-balance sheet instruments is included within other liabilities and the charge to income that establishes this liability is reported within other non-interest expense. Additional disclosure regarding Company’s reserve for off-balance sheet commitments is located in Note 5, “Loans” on page 125 of these Consolidated Financial Statements.
Income Taxes
The Company uses the asset and liability method, which recognizes a liability or asset representing the tax effects of future deductible or taxable amounts attributable to events that have been recognized in these Consolidated Financial Statements. Due to tax regulations, several items of income and expense are recognized in different periods for tax return purposes than for financial reporting purposes. These items represent “temporary differences.” The Company is required to provide in its financial statements for the eventual liability or deduction in its tax return for these temporary differences until the item of income or expense has been recognized for both financial reporting and for taxes. The provision is recorded in the form of deferred tax expense or benefit as the temporary differences arise, with the accumulated amount recognized as a deferred tax liability or asset. Deferred tax assets represent future deductions in the Company’s income tax return, while deferred tax liabilities represent future payments to tax authorities. When realization of the benefit of a deferred tax asset is uncertain, the Company is required to recognize a valuation allowance against it.
Premises and Equipment
Premises and equipment are reported at cost less accumulated depreciation. Depreciation is expensed over the estimated useful lives of the assets. The Company depreciates assets utilizing a combination of accelerated methods of depreciation and straight-line depreciation. The estimated useful lives of premises and equipment are as follows:
| Buildings |
40 years | |
| Building improvements |
3 – 40 years | |
| Furniture and equipment |
5 – 7 years | |
| Electronic equipment and software |
3 – 10 years |
Leasehold improvements are amortized over the terms of the leases or the estimated useful lives of the improvements, whichever is shorter.
Management annually reviews Premises and Equipment in order to determine if facts and circumstances suggest that the value of an asset is not recoverable.
112
Table of Contents
Leases
The Company leases a majority of its branches and support offices. Leases are accounted for as capital leases or operating leases based on the requirements of GAAP. When the terms of the lease indicate that the Company is leasing the building for most of its useful economic life or the present value of the sum of lease payments represents most of the fair value of the building, the transaction is accounted for as a capital lease. In a capital lease, the building is recognized as an asset of the Company and the net present value of the contracted lease payments is recognized as a long-term liability. The amortization charge relating to assets recorded under capital leases is included with depreciable expense.
A majority of the Company’s leases have cost-of-living adjustments based on the consumer price index. Some of the leases have fixed increases provided for in the terms or increases based on the index but have a minimum increase irrespective of the change in index. In these cases, the total fixed or minimum lease expense is recognized on a straight-line basis over the term of the lease.
Loan Servicing Rights
Included in other assets are loan servicing rights associated with the sale of loans for which the servicing of the loan is retained. The Company receives a fee for servicing these loans. The right to receive this fee for performing servicing is of value to the Company and could be sold should the Company choose to do so. Companies engaged in selling loans and retaining servicing rights for a fee are required to recognize servicing rights as an asset or liability. The rights are recorded at the net present value of the fees that will be collected, less estimated servicing costs, which approximates the fair value.
Loan servicing rights are amortized in proportion to, and over the period of, estimated future net servicing income. In addition, quarterly Management evaluates servicing rights for impairment. Loan servicing rights are evaluated for impairment based upon the fair value of the rights as compared to amortized cost. The servicing rights are amortized to non-interest income over the expected lives of the loans. Estimates of the lives of the loans are based on several industry standard sources.
Because the rate at which consumers prepay their loans are impacted by changes in interest rates—prepayments increase as interest rates fall, and decrease as interest rates rise—the value of the servicing right changes with changes in interest rates. When prepayments increase, the Company will collect less servicing fees, so the value of the servicing rights decline. A valuation of the servicing assets are performed at each reporting period and reductions to the servicing assets’ carrying value are made when the carrying balance is higher than the fair value of the servicing asset utilizing the lower of cost or market valuation methodology.
Repurchase Agreements
The Company occasionally enters into repurchase agreements whereby it purchases securities or loans from another institution and agrees to resell them at a later date for an amount in excess of the purchase price. While in form these are agreements to purchase and resell, in substance they are short-term secured investments in which the excess of the sale proceeds over the purchase price represents interest income. This income is accrued over the term of the investment. For security or collateral, the Company receives assets with a higher fair value than the amount invested. The Company had none of these investments at December 31, 2009 or 2008, but there were some held during 2007.
The Company also enters into repurchase agreements whereby it sells securities or loans to another institution and agrees to repurchase them at a later date for an amount in excess of the sale price. While in form these are agreements to sell and repurchase, in substance they are secured borrowings
113
Table of Contents
in which the excess of the repurchase price over the sale price represents interest expense. This expense is accrued over the term of the borrowing. For security or collateral, the Company must pledge assets with a higher fair value than the amount borrowed. Information about the amounts held and the interest rates may be found in Note 13, “Securities Sold Under Agreements to Repurchase and Federal Funds Purchased” of these Consolidated Financial Statements.
Trust Assets and Investment and Advisory Fees
The Company has a trust department, two wealth management subsidiaries, MCM and REWA, and a 20% interest in a wealth management partnership, Veritas, each of which have fiduciary responsibility for the assets that they manage on behalf of customers. These assets are not owned by the Company and are not reflected in the accompanying Consolidated Balance Sheets. Fees for most trust services are based on the market value of customer assets, and the fees are accrued monthly.
Earnings Per Share
The computation of basic earnings per share for all periods presented in the Consolidated Statements of Income is based on the weighted average number of shares outstanding during each year retroactively restated for stock dividends and stock splits.
Diluted earnings per share include the effect of common stock equivalents for the Company, which consist of shares issuable on the exercise of outstanding options and restricted stock awards and common stock warrants. The number of options assumed to be exercised is computed using the “treasury stock method.” This method assumes that all options with an exercise price lower than the average stock price for the period have been exercised at the average market price for the period and that the proceeds from the assumed exercise have been used for market repurchases of shares at the average market price. The Company receives a tax benefit for the difference between the market price and the exercise price of non-qualified options when options are exercised. The treasury stock method also assumes that the tax benefit from the assumed exercise of options is used to retire shares. Options that have an exercise price higher than the average market price are excluded from the computation because they are anti-dilutive. When the Company’s net income available to common stockholders is in a loss position, the diluted earnings per share calculation utilizes average shares outstanding.
Once stock options or restricted stock vest, the shares are included in the weighted average shares outstanding.
Statement of Cash Flows
For purposes of reporting cash flows, “cash” includes cash and due from banks, Federal funds sold, and securities purchased under agreements to resell. Federal funds sold and securities purchased under agreements to resell are one-day transactions, with the Company’s funds being returned to it the next business day.
Postretirement Health Benefits
From 1992 through 2009, the Company has provided eligible retirees with postretirement health care and dental benefit coverage. In December 2009, the Company’s Compensation Committee of the Board of Directors approved the reduction in the Company’s contributions towards retiree health insurance benefits effective March 1, 2010. Specifically, the Company will discontinue the Company’s contributions for retirees eligible for health insurance through Medicare, will eliminate its contribution for the retiree health insurance for future retirees, and will limit its contribution to 50% of the cost of health insurance premiums for retirees not yet eligible for Medicare. These decisions combined with a reduction of the number of current employees reduced the net present value of the Company’s obligation for future benefits by $27.3 million at December 31, 2009, leaving $3.2 million of remaining
114
Table of Contents
obligation for future benefits. Further information regarding the Company’s Postretirement Health Benefits is disclosed in Note 15, “Postretirement Benefits” of these Consolidated Financial Statements.
The following information describes the accounting for these benefits as provided to all retirees until March 1, 2010 and that will continue to be provided to the limited number of retirees not yet eligible for Medicare after that date.
These benefits are also provided to the spouses of retirees on a shared cost basis. Benefits for retirees and spouses are subject to deductibles, co-payment provisions, and other limitations. The expected cost of such benefits is charged to expense during the years that the employees render service to the Company and thereby earn their eligibility for benefits.
Each year the Company recognizes a portion of the change in the net present value of its obligation for future benefits or accumulated postretirement benefit obligation (“APBO”) as an expense. This portion is called the net periodic postretirement benefit cost (the “NPPBC”). The NPPBC, is made up of several components:
| ¡ Service cost |
With each year of service, the amount of the eventual benefit is increased. This component is the net present value of that portion. | |
| ¡ Interest cost |
Each year the benefit obligation for each employee is one year closer to being paid and therefore the net present value increases in amount approaching the eventual benefit payment amount. This component represents that increase resulting from the passage of another year. | |
| ¡ Return on assets |
Income is earned on any investments that have been set aside to fund the eventual benefit payments. This component is an offset to the first two components. | |
| ¡ Amortization cost |
Significant estimates and assumptions about interest rates, trends in health care costs, plan changes, employee turnover, and earnings on assets are used in measuring the APBO each year. | |
| Actual experience may differ from the estimates and assumptions may change. Differences will result in what are termed experience gains and losses. These may cause increases or decreases in the APBO or in the value of plan assets. This component recognizes a portion of the experience gains and losses. | ||
| ¡ Prior service cost |
At the adoption of the Plan, the Company fully recognized the net present value of the benefits credited to employees for service provided prior to the adoption of the plan. Had the Company not recognized this amount, a portion of it would be included as a fifth component. | |
The Accumulated Postretirement Benefit Obligation
Prior to the reduction of the Retiree Health Plan and the Key Employee’s Retiree Health Plan, (“the Plans”), the commitment the Company has made to provide these benefits results in an obligation that must be recognized in the financial statements. This obligation, termed the APBO, is the actuarial net present value of the obligation for retired employees’ expected postretirement benefits; and the expected postretirement benefit obligation earned to date by current employees. The net present value is that amount which, if compounded at an assumed interest rate, would equal the amount expected to be paid in the future.
115
Table of Contents
As long as the Plans are in effect, this obligation must be re-measured each year due to changes in each of the following factors: (1) the number of employees working for the Company; (2) the average age of the employees working for the Company as this impacts how soon it would be expected that the Company will begin making payments; (3) increases in expected health care costs; and (4) prevailing interest rates. In addition, because the obligation is measured on a net present value basis, the passage of each year brings the eventual payment of benefits closer, and therefore, like the compounding of interest, increases the obligation.
Other Real Estate Owned (“OREO”)
Real estate acquired through foreclosure on a loan or by surrender of the real estate in lieu of foreclosure is called OREO. OREO is originally recorded in the Company’s financial records at the fair value of the OREO, less estimated costs to sell. If the outstanding balance of the loan is greater than the fair value of the OREO at the time of foreclosure, the difference is charged against the allowance for loan losses.
Once the collateral is foreclosed on and the property becomes an OREO, Management periodically obtains valuations to determine if further valuation adjustments are required or when the listing price to sell an OREO is lower than the carrying value. OREOs are carried at the lower of its carrying value or fair value less the estimated costs to sell. If there is a decrease in the fair value of the property on the valuation date, the decrease in value is charged to non-interest expense. During the time the property is held, all related operating and maintenance costs are expensed as incurred. All income produced from OREOs reduce the operating and maintenance expenses incurred.
At December 31, 2009 and 2008, the Company held OREO that had a recorded value, less estimated costs to sell, of $39.3 million and $7.1 million, respectively, which were less than the Company’s estimate of the fair value of the property.
Derivative Financial Instruments
GAAP requires that all derivatives be recorded at their current fair value on the balance sheet. Certain derivative transactions that meet specified criteria, qualify for hedge accounting under GAAP. The Company does not hold any derivatives that meet the criteria for hedge accounting. If a derivative does not meet the specific criteria, gains or losses associated with changes in its fair value are immediately recognized in non-interest income.
Goodwill and Intangible Assets
In connection with its acquisitions, the Company recorded as goodwill the excess of the purchase price over the estimated fair value of the assets received and liabilities assumed. Historically, Management had reviewed goodwill for impairment in the third quarter of each year or if there was a triggering event which may indicate a need to review goodwill for impairment. Given the economic downturn experienced in 2008, Management deemed it prudent to assess Goodwill for impairment on a quarterly basis beginning in the third quarter of 2008.
Based on the Company’s annual assessment for goodwill, an impairment charge of $22.1 million was recorded in non-interest expense in the third quarter of 2008. In the second quarter of 2009, Management determined that the remaining balance of goodwill was fully impaired and an impairment of $128.7 million was recorded. Additional information regarding the impairment of goodwill is disclosed in Note 10, “Goodwill and Intangible Assets” of these Consolidated Financial Statements.
Intangible assets are generally acquired in an acquisition. If the benefit of the intangible asset is obtained through contractual or other legal rights, or if the intangible asset can be sold, transferred,
116
Table of Contents
licensed, rented, or exchanged, regardless of the acquirer’s intent to do so, the acquired intangible asset will be a separately recognized asset. Such intangible assets are subject to amortization over their useful lives. Among these intangible assets are core deposit intangibles and customer relationship intangibles. The Company amortizes core deposit intangibles and core relationship intangibles over their estimated useful lives.
Segments
GAAP requires that the Company disclose certain information related to the performance of various segments of its business. Segments are defined based on how the Chief Executive Officer (“CEO”) of the Company views the Company’s operations. Management has determined that the Company has three reportable operating segments: Community Banking, Commercial & Wealth Management Group and RAL and RT Programs. The All Other segment consists of the administrative support units and PCB. The factors used in determining these reportable segments are explained in Note 24, “Segments” of these Consolidated Financial Statements.
Stock-Based Compensation
The Company grants non-qualified stock options and restricted stock to directors and employees. All stock-based compensation is accounted for in accordance with GAAP which requires compensation expense for the issuance of stock-based compensation be recognized over the vesting period of the share-based award. The amount of compensation expense to be recognized is based on the “fair value” of the options at the time of the grant utilizing a binomial option-pricing model. The option-pricing model computes fair value for the options based on the length of their term, the volatility of the stock price in past periods, and other factors. Details regarding the accounting for stock-based compensation expense are disclosed in Note 19 “Shareholders’ Equity” of these Consolidated Financial Statements.
The Company also grants restricted stock as a form of employee and director compensation. Restricted stock is expensed over the vesting period. A valuation model is not used for pricing restricted stock since the value is based on the closing price of the Company’s stock on the grant date. The amount of expense is based on the shares granted multiplied by the stock price on the date of the grant. When the restricted stock vests, the employee receives the stock.
Recent Accounting Pronouncements
On April 9, 2009, the FASB finalized three amendments regarding the accounting treatment for investments. These amendments changed the method for determining if an other-than-temporary impairment exists and the amount of other-than-temporary impairment to be recorded through an entity’s income statement. The changes brought about by these new accounting guidance provide greater clarity and reflect a more accurate representation of the credit and noncredit components of an other-than-temporary impairment event. A summary of the new accounting guidance are as follows:
| 1. | “Determining Fair Value When the Volume and Level of Activity for the Assets or Liability have Significantly Decreased and Identifying Transactions That Are Not Orderly” provides additional guidelines for estimating fair value in accordance with the principles presented in FASB ASC 820, Fair Value Measurements and Disclosures when the volume and level of activity for the asset or liability have significantly decreased and identification of circumstances that indicate a transaction is not orderly. |
| 2. | Recognition and Presentation of other-than-temporary impairments amends OTTI guidance in GAAP for debt securities to make the guidance more operational and improves the presentation and disclosure of OTTI on debt and equity securities in financial statements. The transition adjustment required to adopt this standard was $2.9 million, after tax which was reclassified from retained earnings to OCI at June 30, 2009. |
117
Table of Contents
| 3. | Interim Disclosures about Fair Value of Financial Instruments enhances consistency in financial reporting by increasing the frequency of fair value disclosures to interim and annual financial reports of publicly traded companies. |
These amendments are effective for financial statements issued for periods ending after June 15, 2009, with early adoption permissible for the first quarter of 2009. The Company elected not to early adopt any of the above amendments. Management has adopted these new accounting standards and there was not a material impact on the results of operations and financial position for the Company.
In May 2009, FASB issued additional guidance relating to subsequent events. The objective was to establish general standards for the accounting and disclosure of events that occur after the balance sheet date but before financial statements are issued or are available to be issued. This new standard sets forth: (i) the period after the balance sheet date during which management of a reporting entity should evaluate events or transactions that may occur for potential recognition or disclosure in the financial statements; (ii) the circumstances under which an entity should recognize events or transactions occurring after the balance sheet date in its financial statements; and (iii) the disclosures that an entity should make about events or transactions that occurred after the balance sheet date. This new standard was effective for interim and annual financial reports for periods ending after June 15, 2009. The Company adopted this standard on June 30, 2009. The Company has completed an evaluation of subsequent events through March 12, 2010, the date of this filing. At the date of this filing, there was a subsequent event which is disclosed in these Consolidated Financial Statements in Note 26, “Subsequent Events” of these Consolidated Financial Statements.
In June 2009, FASB issued a new standard for the Accounting for Transfers of Financial Assets—an amendment of FASB Statement No. 140. The objective of this new standard is to improve the relevance, representational faithfulness, and comparability of the information that a reporting entity provides in its financial statements about a transfer of financial assets; the effects of a transfer on its financial position, financial performance, and cash flows; and a transferor’s continuing involvement in transferred financial assets. This new standard is effective as of the beginning of each reporting entity’s first annual reporting period that begins after November 15, 2009, for interim periods within that first annual reporting period, and for interim and annual reporting periods thereafter. Management has completed its evaluation of the financial impact of this new accounting standard and has determined that there will not be a material impact on the results or operations and financial position for the Company.
In June 2009, FASB issued amendments to an existing FASB Interpretation for the consolidating of financial information for variable interest entities. The objective of this new standard is to amend certain requirements of FASB Interpretation No. 46 (revised December 2003), Consolidation of Variable Interest Entities, to improve financial reporting by enterprises involved with variable interest entities and to provide more relevant and reliable information to users of financial statements. This new standard is effective as of the beginning of each reporting entity’s first annual reporting period that begins after November 15, 2009, for interim periods within that first annual reporting period, and for interim and annual reporting periods thereafter. Earlier application is prohibited. Management has completed its evaluation of the financial impact of this new accounting standard and has determined that there will not be a material impact on the results or operations and financial position for the Company.
| 2. | ACQUISITIONS AND DISPOSITIONS |
On January 4, 2008, PCBNA acquired the assets of REWA, a San Luis Obispo, California-based registered investment advisor which provides personal and financial investment advisory services to individuals, families and fiduciaries. On the date of purchase, REWA managed assets of $464.1 million. PCBNA initially paid approximately $7.0 million for substantially all of the assets and liabilities
118
Table of Contents
of REWA (with an additional contingent payment due five years after the purchase date) and formed a new wholly-owned subsidiary of PCBNA by the same name. As a result of the acquisition of REWA, the Company recorded $4.2 million of goodwill and $2.8 million of other intangible assets. The other intangible assets are amortized over their individual expected lives and analyzed quarterly for impairment. The clients of REWA continue to be served by the same principal and support staff.
The Company did not disclose pro forma financial information about combined operations, as this acquisition was not material to the Company as a whole.
In October 2008, the Company sold $54.4 million of deposits and associated buildings and equipment from the Santa Paula and Harvard branches and $30.4 million of various types of real estate secured, small business loans and lines of credit and consumer loans to Ojai Community Bank. For a more detailed discussion on the loans sold, refer to Note 6, “Loan Sales and Transactions” of these Consolidated Financial Statements. The Company recorded a $3.1 million gain on sale related to this transaction.
| 3. | EARNINGS PER SHARE |
The following table presents a reconciliation of basic earnings per share and diluted earnings per share. The denominator of the diluted earnings per share ratio includes the effect of dilutive securities. The securities outstanding that are potentially dilutive are employee stock options, restricted stock and common stock warrants.
| Year Ended December 31, | |||||||||||
| 2009 | 2008 | 2007 | |||||||||
| (in thousands, except per share amounts) | |||||||||||
| Net (loss)/ income |
$ | (421,261 | ) | $ | (22,750 | ) | $ | 100,888 | |||
| Less: Dividends and accretion on preferred stock |
9,996 | 1,094 | — | ||||||||
| Net (loss)/ income applicable to common shareholders |
$ | (431,257 | ) | $ | (23,844 | ) | $ | 100,888 | |||
| Basic weighted average shares outstanding |
46,693 | 46,273 | 46,816 | ||||||||
| Dilutive effect of stock options |
504 | 368 | 266 | ||||||||
| Dilutive effect of common stock warrants |
— | 3 | — | ||||||||
| Diluted weighted average shares outstanding |
47,197 | 46,644 | 47,082 | ||||||||
| (Loss)/ income per common share - basic |
$ | (9.24 | ) | $ | (0.52 | ) | $ | 2.15 | |||
| (Loss)/ income per common share - diluted |
$ | (9.24 | )(1) | $ | (0.52 | )(1) | $ | 2.14 | |||
| (1) | (Loss)/income per diluted common share for the years ended December 31, 2009 and 2008 are calculated using basic weighted average shares outstanding. |
For the years ended December 31, 2009, 2008 and 2007, the average outstanding unexercised stock options of 1,306,000, 1,265,000 and 980,000 shares, respectively were not included in the computation of earnings per share because they were anti-dilutive. For the years ended December 31, 2009 and 2008, 1,512,000 and 1,509,000 of common stock warrants, respectively, were not included in the computation of earnings per share because they were anti-dilutive. The common stock warrants were issued in conjunction with the preferred stock issued to the U.S. Treasury in November 2008. For more information related to the common stock warrants, refer to Note 19, “Shareholders’ Equity” of these Consolidated Financial Statements. For the year ended December 31, 2007, the Company did not have common stock warrants.
119
Table of Contents
| 4. | SECURITIES |
A summary of securities held by the Company at December 31, 2009 and 2008 is as follows:
| December 31, 2009 | |||||||||||||
| Amortized Cost |
Gross Unrealized Gains |
Gross Unrealized Losses |
Fair Value | ||||||||||
| (in thousands) | |||||||||||||
| Trading Securities: |
|||||||||||||
| Mortgage-backed securities (3) |
$ | 5,403 | $ | — | $ | — | $ | 5,403 | |||||
| Total trading securities |
5,403 | — | — | 5,403 | |||||||||
| Available-for-Sale: |
|||||||||||||
| U.S. Treasury obligations (1) |
11,212 | 220 | — | 11,432 | |||||||||
| U.S. Agency obligations (2) |
605,010 | 4,009 | (1,089 | ) | 607,930 | ||||||||
| Collateralized mortgage obligations (4) |
114,508 | 1,217 | (1,791 | ) | 113,934 | ||||||||
| Mortgage-backed securities (3) |
156,686 | 12,372 | — | 169,058 | |||||||||
| Asset-backed securities |
1,963 | — | (692 | ) | 1,271 | ||||||||
| State and municipal securities |
246,077 | 8,828 | (4,843 | ) | 250,062 | ||||||||
| Total available-for-sale securities |
1,135,456 | 26,646 | (8,415 | ) | 1,153,687 | ||||||||
| Total Securities |
$ | 1,140,859 | $ | 26,646 | $ | (8,415 | ) | $ | 1,159,090 | ||||
| December 31, 2008 | |||||||||||||
| Amortized Cost |
Gross Unrealized Gains |
Gross Unrealized Losses |
Fair Value | ||||||||||
| (in thousands) | |||||||||||||
| Trading Securities: |
|||||||||||||
| Mortgage-backed securities (3) |
$ | 213,939 | $ | — | $ | — | $ | 213,939 | |||||
| Total trading securities |
213,939 | — | — | 213,939 | |||||||||
| Available-for-Sale |
|||||||||||||
| U.S. Treasury obligations (1) |
36,826 | 649 | — | 37,475 | |||||||||
| U.S. Agency obligations (2) |
590,471 | 9,767 | (108 | ) | 600,130 | ||||||||
| Collateralized mortgage obligations (4) |
20,731 | 142 | (3,781 | ) | 17,092 | ||||||||
| Mortgage-backed securities (3) |
203,141 | 9,115 | — | 212,256 | |||||||||
| Asset-backed securities |
1,962 | — | (928 | ) | 1,034 | ||||||||
| State and municipal securities |
298,929 | 17,042 | (5,215 | ) | 310,756 | ||||||||
| Total available-for-sale securities |
1,152,060 | 36,715 | (10,032 | ) | 1,178,743 | ||||||||
| Total Securities |
$ | 1,365,999 | $ | 36,715 | $ | (10,032 | ) | $ | 1,392,682 | ||||
| (1) | U.S. Treasury obligations are securities that are backed by the full faith and credit of the United States government. |
| (2) | U.S. Agency obligations are general obligations that are not backed by the full faith and credit of the United States government. They consist of obligations of Government Sponsored Enterprises issued by the Federal Farm Credit Banks, Federal Home Loan Banks, and Tennessee Valley Authority. |
| (3) | Mortgage-backed securities are securitized mortgage loans that consist of obligations of Government Sponsored Enterprises which guarantee the collection of principal and interest payments. The securities primarily consist of securities issued by Federal Home Loan Mortgage Corporation (“FHLMC”) and Federal National Mortgage Association (“FNMA”). |
120
Table of Contents
| (4) | Collateralized mortgage obligations (“CMOs”) are securities which pool together mortgages and separate them into short, medium, or long term positions called tranches. The CMOs in the table above primarily consist of securities issued by Government National Mortgage Association (“GNMA”)’s, and to a lessor extent, FNMA, FHLMC, and private label. |
Trading Securities
At December 31, 2009 and 2008, the Company held $5.4 million and $213.9 million, respectively of securities classified as trading. During 2009, a majority of the securities held in the trading portfolio were sold to reduce the volatility in the income statement associated with the changes in the fair value of trading securities. In January 2008 and October 2008, the Company recharacterized certain residential real estate loans into a guaranteed mortgage securitization, increasing the balance in this portfolio.
Available-for-Sale Securities
At December 31, 2009 and 2008, the Company held $1.15 billion and $1.18 billion, respectively, of securities in its AFS portfolio. Generally, unrealized gains or losses relating to AFS securities are accounted for by adjusting the carrying amount of the securities. An offsetting entry after the adjustment for taxes at the Company’s corporate effective tax rate of 42.05% is recognized in OCI.
As discussed in Note 1, “Summary of Significant Accounting Policies” of these Consolidated Financial Statements on April 1, 2009, the Company adopted the new accounting standard for OTTI securities. The adoption resulted in a cumulative-effect adjustment for the portion of this impairment that did not relate to credit loss, increasing retained earnings and decreasing accumulated other comprehensive income by $2.9 million.
In December 2007, Management changed its intent with regard to holding its AFS Mortgage Backed Securities (“MBS”) to maturity or ultimate recovery. As a result, the Company recognized a $5.8 million and $3.0 million of impairment loss at December 31, 2008 and 2007, respectively, because without the intent to hold until recovery, the securities could no longer be regarded as temporarily impaired. This decision was made during the fourth quarter of 2007, for strategic balance sheet and interest rate risk management purposes, as well as to provide additional liquidity for the Company.
Fair values are obtained from independent sources based on current market prices for the specific security held by the Company or for a security with similar characteristics. If a security is in an unrealized loss position for more than twelve months, Management is required to determine whether or not the security is temporarily or permanently impaired.
121
Table of Contents
The following table shows all AFS securities that are in an unrealized loss position and temporarily impaired as of December 31, 2009 and 2008.
| December 31, 2009 | |||||||||||||||||||||
| Less than 12 months | 12 months or more | Total | |||||||||||||||||||
| Fair Value |
Unrealized Loss |
Fair Value |
Unrealized Loss |
Fair Value |
Unrealized Loss |
||||||||||||||||
| (in thousands) | |||||||||||||||||||||
| U.S. Treasury/U.S. Agencies |
$ | 141,013 | $ | (1,089 | ) | $ | — | $ | — | $ | 141,013 | $ | (1,089 | ) | |||||||
| Municipal bonds |
55,457 | (2,418 | ) | 11,167 | (2,425 | ) | 66,624 | (4,843 | ) | ||||||||||||
| Collateralized mortgage obligations |
30,116 | (136 | ) | 10,313 | (1,655 | ) | 40,429 | (1,791 | ) | ||||||||||||
| Asset-backed securities |
— | — | 1,271 | (692 | ) | 1,271 | (692 | ) | |||||||||||||
| Total |
$ | 226,586 | $ | (3,643 | ) | $ | 22,751 | $ | (4,772 | ) | $ | 249,337 | $ | (8,415 | ) | ||||||
| December 31, 2008 | |||||||||||||||||||||
| Less than 12 months | 12 months or more | Total | |||||||||||||||||||
| Fair Value |
Unrealized Loss |
Fair Value |
Unrealized Loss |
Fair Value |
Unrealized Loss |
||||||||||||||||
| (in thousands) | |||||||||||||||||||||
| U.S. Treasury/U.S. Agencies |
$ | 116,348 | $ | (108 | ) | $ | — | $ | — | $ | 116,348 | $ | (108 | ) | |||||||
| Municipal bonds |
78,816 | (4,057 | ) | 7,351 | (1,158 | ) | 86,167 | (5,215 | ) | ||||||||||||
| Collateralized mortgage obligations |
8,352 | (2,986 | ) | 3,075 | (795 | ) | 11,427 | (3,781 | ) | ||||||||||||
| Asset-backed securities |
1,034 | (928 | ) | — | — | 1,034 | (928 | ) | |||||||||||||
| Total |
$ | 204,550 | $ | (8,079 | ) | $ | 10,426 | $ | (1,953 | ) | $ | 214,976 | $ | (10,032 | ) | ||||||
The $8.4 million and $10.0 million of unrealized losses for the AFS portfolio as of December 31, 2009 and December 31, 2008, respectively, are a result of market interest rate fluctuations. The fair value is based on current market prices obtained from independent sources for each security held. The issuers of these securities have not, to the Company’s knowledge, established any cause for default on these securities and the most recent ratings on all securities are investment grade.
Management has determined that there is not a credit loss component associated with any of the securities that are currently in a loss position. Management does not intend to sell any of the securities in a loss position nor are there any conditions present at December 31, 2009 that would require Management to sell them. As such, Management does not believe that there are any securities that are other-than-temporarily impaired as of December 31, 2009.
122
Table of Contents
Contractual Maturities for Securities Portfolio
The amortized cost and estimated fair value of debt securities at December 31, 2009 and 2008, by contractual maturity, are shown in the table below.
| December 31, | ||||||||||||
| 2009 | 2008 | |||||||||||
| Amortized Cost |
Estimated Fair Value |
Amortized Cost |
Estimated Fair Value | |||||||||
| (in thousands) | ||||||||||||
| Trading Securities: |
||||||||||||
| In one year or less |
$ | 868 | $ | 868 | $ | — | $ | — | ||||
| After one year through five years |
— | — | 73,241 | 73,241 | ||||||||
| After five years through ten years |
— | — | 93,401 | 93,401 | ||||||||
| After ten years |
4,535 | 4,535 | 47,297 | 47,297 | ||||||||
| Total trading securities |
5,403 | 5,403 | 213,939 | 213,939 | ||||||||
| Available-for-sale: |
||||||||||||
| In one year or less |
159,001 | 158,138 | 296,268 | 296,802 | ||||||||
| After one year through five years |
657,564 | 672,384 | 307,369 | 313,809 | ||||||||
| After five years through ten years |
141,421 | 146,178 | 340,919 | 357,732 | ||||||||
| After ten years |
177,470 | 176,987 | 207,504 | 210,400 | ||||||||
| Total available-for-sale securities |
1,135,456 | 1,153,687 | 1,152,060 | 1,178,743 | ||||||||
| Total Securities |
$ | 1,140,859 | $ | 1,159,090 | $ | 1,365,999 | $ | 1,392,682 | ||||
Expected maturities will differ from contractual maturities because issuers may have the right to call or prepay obligations with or without call or prepayment penalties. With interest rates on a number of the Company’s securities with coupon rates higher than the current market rates, Management expects that issuers that have the right to call the securities will exercise these rights and pay the bonds off earlier than the contractual term.
123
Table of Contents
Sales and Calls of Securities
The following table summarizes the securities sold and called for the last three years.
| December 31, 2009 | ||||||||||
| Proceeds | Gross Gains |
Gross Losses |
||||||||
| (in thousands) | ||||||||||
| Trading: |
||||||||||
| Sales |
$ | 180,086 | $ | 7,517 | $ | — | ||||
| Available-for-sale: |
||||||||||
| Sales |
$ | 127,601 | $ | 10,944 | $ | — | ||||
| Calls |
$ | 573,955 | $ | 94 | $ | (3,174 | ) | |||
| December 31, 2008 | ||||||||||
| Proceeds | Gross Gains |
Gross Losses |
||||||||
| (in thousands) | ||||||||||
| Trading: |
||||||||||
| Sales |
$ | 149,003 | $ | 2,348 | $ | — | ||||
| Available-for-sale: |
||||||||||
| Sales |
$ | 123,565 | $ | 152 | $ | (302 | ) | |||
| Calls |
$ | 292,357 | $ | 199 | $ | (176 | ) | |||
| December 31, 2007 | ||||||||||
| Proceeds | Gross Gains |
Gross Losses |
||||||||
| (in thousands) | ||||||||||
| Trading: |
||||||||||
| Sales |
$ | 993 | $ | — | $ | (2 | ) | |||
| Calls |
$ | — | $ | — | $ | — | ||||
| Available-for-sale: |
||||||||||
| Sales |
$ | 317,647 | $ | 1,647 | $ | (118 | ) | |||
| Calls |
$ | 83,521 | $ | 390 | $ | (4 | ) | |||
Interest Income
Interest income for trading and AFS securities was $47.9 million, $58.0 million and $48.6 million for the twelve month periods ended December 31, 2009, 2008 and 2007, respectively. Interest income from securities classified as taxable for the twelve month periods ended December 31, 2009, 2008 and 2007 was $33.1 million, $44.7 million and $37.4 million, respectively. Interest income from securities classified as non-taxable was $14.8 million, $13.3 million and $11.2 million, respectively.
Securities Pledged
Securities with a carrying value of approximately $719.1 million and $1.01 billion at December 31, 2009 and 2008, respectively, were pledged to secure public funds, trust deposits, repurchase agreements and other borrowings as required or permitted by law.
Investment in FHLB and FRB Stock
The Company’s investment in stock of the FHLB amounted to $72.9 million and $72.2 million at December 31, 2009 and 2008, respectively. The Company’s investment in stock of the FRB amounted to $10.6 million and $5.1 million at December 31, 2009 and 2008, respectively. The investment of FHLB and FRB stock is included in other assets of the Company’s Consolidated Balance Sheets.
124
Table of Contents
FHLB did not pay dividends in three of the last five quarters and will not repurchase excess capital stock as a means to preserve and build their capital until a future period. FHLB, in their press-release dated February 23, 2010, reported capital ratios in excess of the required regulatory minimums and that they will be paying dividends in March 2010. Management will continue to monitor the affairs of the FHLB and evaluate the investment in its stock. The FHLB is rated AAA by Moody’s Investor Services (“Moody’s”) and Standard and Poor’s (“S&P”) as of December 31, 2009. No impairment has been recognized for this investment.
| 5. | LOANS |
Loans held for sale
At December 31, 2009 and 2008, the Company held $19.2 million and $11.1 million, respectively as loans held for sale. Loans held for sale are reported at the lower of cost or market. Loans held for sale at December 31, 2009 consisted of $13.4 million of residential real estate, $4.3 million of SBA and $1.5 million of commercial real estate loans. Loans held for sale at December 31, 2008 consisted of $1.1 million of residential real estate and $10.0 million of SBA loans which were originated for sale. Of the residential and commercial real estate loans classified as held for sale at December 31, 2009 and 2008, $8.0 million and $570,000 were sold by the end of January 2010 and 2009, respectively.
Loans held for investment
The composition of the Company’s gross loans held for investment portfolio is as follows:
| December 31, | ||||||
| 2009 | 2008 | |||||
| (in thousands) | ||||||
| Real estate: |
||||||
| Residential - 1 to 4 family |
$ | 971,725 | $ | 1,098,592 | ||
| Multi-family residential |
275,069 | 273,644 | ||||
| Commercial |
1,933,533 | 2,024,533 | ||||
| Construction |
397,281 | 553,307 | ||||
| Commercial loans |
977,401 | 1,159,843 | ||||
| Home equity loans |
448,026 | 448,650 | ||||
| Consumer loans |
161,698 | 196,482 | ||||
| Other |
1,698 | 9,805 | ||||
| Total |
$ | 5,166,431 | $ | 5,764,856 | ||
The loan balances above are net of net deferred loan origination fees, commitment, extension fees and origination costs of $5.6 million for 2009 and $6.5 million for 2008.
Impaired Loans
The table below summarizes the impaired loan information reported within the loans held for investment.
| December 31, | ||||||||
| 2009 | 2008 | |||||||
| (in thousands) | ||||||||
| Impaired loans with specific valuation allowance |
$ | 84,616 | $ | 79,939 | ||||
| Valuation allowance related to impaired loans |
(17,544 | ) | (17,768 | ) | ||||
| Impaired loans without specific valuation allowance |
210,115 | 95,273 | ||||||
| Impaired loans, net |
$ | 277,187 | $ | 157,444 | ||||
125
Table of Contents
The table below summarizes interest income received and recognized for impaired loans.
| Year Ended December 31, | |||||||||
| 2009 | 2008 | 2007 | |||||||
| (in thousands) | |||||||||
| Average investment in impaired loans for the period |
$ | 223,633 | $ | 129,922 | $ | 18,362 | |||
| Interest recognized during the period for impaired loans |
$ | 18,024 | $ | 17,585 | $ | 5,518 | |||
| Interest received in cash during the period for loans |
|||||||||
| impaired at year-end |
$ | 7,944 | $ | 8,170 | $ | 4,751 | |||
The valuation allowance amounts disclosed above are included in the allowance for loan losses reported in the balance sheets of these Consolidated Financial Statements. The increase in impaired loans in 2008 and 2009 is mostly attributed to the prolonged economic downturn which has impacted the Bank’s borrowers’ ability to pay their contractual payments and caused a decline in collateral values. In 2009, the increase in net impaired loans was mostly attributed to the increase in commercial real estate loans which were $17.9 million at December 31, 2008 compared to $99.1 million at December 31, 2009, an increase of $81.2 million. Commercial real estate loans account for 33.6% of the total impaired loans and construction loans account for 40.4% of total impaired loans at December 31, 2009. At December 31, 2008, the net impaired loans were primarily impacted by the Bank’s construction loan portfolio. At December 31, 2008, the construction loan portfolio had net impaired loans of $126.1 million or 72.0% of the total net impaired loans. Construction loans which were considered impaired decreased by $7.0 million between December 31, 2009 to 2008 which is mostly due to a $19.6 million construction loan being foreclosed on during 2009 which was sold in May 2009. A majority of the impaired loans are in a non-accrual status at December 31, 2009 and 2008, also increasing the non-accrual loans disclosed in the table below.
Non-performing Assets
The table below summarizes loans and other assets classified as non-performing:
| December 31, | ||||||
| 2009 | 2008 | |||||
| (dollars in thousands) | ||||||
| Non-accrual loans: |
||||||
| Real estate: |
||||||
| Residential - 1 to 4 family |
$ | 30,964 | $ | 18,374 | ||
| Commercial (1) |
71,401 | 21,179 | ||||
| Construction |
104,719 | 101,186 | ||||
| Commercial loans |
77,548 | 40,894 | ||||
| Home equity loans |
6,082 | 4,261 | ||||
| Consumer loans (2) |
401 | 716 | ||||
| Total non-accrual loans |
291,115 | 186,610 | ||||
| Loans past due 90 days or more on accrual status |
17,532 | 14,045 | ||||
| Troubled debt restructured loans: |
||||||
| Real estate: |
||||||
| Residential - 1 to 4 family |
16,588 | 1,376 | ||||
| Commercial (1) |
36,476 | — | ||||
| Construction |
19,024 | 28,250 | ||||
| Commercial loans |
16,231 | 4,111 | ||||
| Home equity loans |
604 | — | ||||
| Consumer loans (2) |
206 | — | ||||
| Total Troubled debt restructured loans |
89,129 | 33,737 | ||||
| Total non-performing loans |
397,776 | 234,392 | ||||
126
Table of Contents
| December 31, | ||||||||
| 2009 | 2008 | |||||||
| (dollars in thousands) | ||||||||
| OREO: |
||||||||
| Real estate: |
||||||||
| Residential - 1 to 4 family |
6,438 | — | ||||||
| Commercial (1) |
13,280 | 3,217 | ||||||
| Construction |
18,375 | 2,929 | ||||||
| Commercial loans |
1,047 | 542 | ||||||
| Home equity loans |
123 | 412 | ||||||
| Total OREO |
39,263 | 7,100 | ||||||
| Total non-performing assets |
$ | 437,039 | $ | 241,492 | ||||
| Contractual interest on impaired loans |
$ | 25,135 | $ | 17,013 | ||||
| Interest collected |
7,657 | 6,413 | ||||||
| Foregone interest |
$ | 17,478 | $ | 10,600 | ||||
| Non-performing loans as a percentage of total loans held for investment |
7.70 | % | 4.07 | % | ||||
| Total non-performing assets to total assets |
5.79 | % | 2.52 | % | ||||
| Allowance for loan losses as a percentage of non-performing loans |
69 | % | 60 | % | ||||
| (1) | Commercial real estate loans includes multi-family residential real estate loans |
| (2) | Consumer loans include other loans |
Non-performing Loans
Non-performing loans include non-accrual loans and trouble debt restructured loans. Total non-accrual loans were $291.1 million at December 31, 2009 compared to $186.6 million at December 31, 2008, an increase of $104.5 million. This increase is mostly attributable to the commercial real estate, commercial and residential real estate loans for which non-performing loans increased by $50.2 million, $36.7 million and $12.6 million, respectively.
Due to the economic conditions, the Bank’s troubled debt restructured loans (“TDRs”) increased significantly in 2009 as many loans were modified to better mitigate risk and loss to the Bank. The total amount of TDRs at December 31, 2009 was $89.1 million, an increase of $55.4 million since December 31, 2008. A majority of the growth in TDRs were in commercial real estate, residential real estate and commercial loans of $36.5 million, $15.2 million and $12.1 million, respectively. TDRs from the construction portfolio decreased by $9.2 million since December 31, 2008 as many construction loans were either repaid, partially charged-off or foreclosed on during 2009.
127
Table of Contents
Other Real Estate Owned (“OREO”)
The Company had OREO of $39.3 million and $7.1 million as of December 31, 2009 and 2008, respectively. The increase in OREO is mostly from the construction, commercial and residential real estate loan portfolios. Below is a summary of the OREO activity over the last three years.
| Year Ended December 31, | ||||||||||||
| 2009 | 2008 | 2007 | ||||||||||
| (in thousands) | ||||||||||||
| Beginning Balance |
$ | 7,100 | $ | 3,357 | $ | 2,910 | ||||||
| Additions |
53,245 | 4,190 | 504 | |||||||||
| Sales |
(16,281 | ) | (447 | ) | (57 | ) | ||||||
| Valuation Allowance |
(4,801 | ) | — | — | ||||||||
| 32,163 | 3,743 | 447 | ||||||||||
| Ending Balance |
$ | 39,263 | $ | 7,100 | $ | 3,357 | ||||||
Prior to reclassifying a loan from a non-performing loan to an OREO, a valuation of the collateral for the loan is obtained. If the carrying balance is higher than the value of the collateral, the carrying balance is reduced by charging-off the loan’s carrying value which exceeds the value of the collateral prior to reclassifying the loan to an OREO.
Refund Anticipation Loans
For the discussion of the RALs and the securitization of RALs see Note 7, “RAL and RT Programs” of these Consolidated Financial Statements.
Pledged Loans
At December 31, 2009, loans secured by residential and commercial real estate with principal balances totaling $2.48 billion were pledged to FHLB and $891.3 million were pledged to the FRB as collateral for borrowings.
These amounts pledged do not represent the amount of outstanding borrowings that are required to be supported by collateral. The Company maintains an excess of collateral at these institutions so that it may borrow without having to first transfer collateral to them.
Loan Sales and Transactions
During 2009, 2008 and 2007, the Company sold or recharacterized residential real estate, commercial real estate, SBA loans and a few other types of loans. A more detailed discussion regarding these transactions are in Note 6, “Loan Sales and Transactions” of these Consolidated Financial Statements.
The largest component of the gain on sale of loans in prior years was the gain on sale of RALs which was $44.6 million and $41.8 million for the years ended December 31, 2008 and 2007, respectively. In 2009, the Company did not utilize a securitization facility, and therefore there was no gain on sale of RALs. A more detailed explanation of the gain on sale of RALs is included in Note 7, “RAL and RT Programs” of these Consolidated Financial Statements.
128
Table of Contents
Unfunded Loan Commitments and Letters of Credit
As of December 31, 2009, the contractual commitments for unfunded commitments and letters of credit are as follows:
| December 31, 2009 | |||||||||||||||
| Total | Less than one year |
One to three years |
Three to five years |
More than five years | |||||||||||
| (in thousands) | |||||||||||||||
| Unfunded Commitments |
$ | 998,543 | $ | 391,024 | $ | 147,623 | $ | 109,496 | $ | 350,400 | |||||
| Standby letters of credit and financial guarantees |
100,521 | 39,082 | 39,078 | 12,151 | 10,210 | ||||||||||
| Total |
$ | 1,099,064 | $ | 430,106 | $ | 186,701 | $ | 121,647 | $ | 360,610 | |||||
Included in unfunded loan commitments are secured and unsecured lines of credit and loans. Letters and lines of credit are commitments to extend credit and standby letters of credit for the Bank’s customers. These commitments meet the financing needs of the Bank’s customers in the normal course of business and are commitments with “off-balance sheet” risk since the Bank has committed to issuing funds to or on behalf of customers, but there is no current loan outstanding.
Lines of credit are obligations to lend money to a borrower. Credit risk arises when the borrowers’ current financial condition may indicate less ability to pay than when the commitment was originally made. In the case of standby letters of credit, the risk arises from the possibility of the failure of the customer to perform according to the terms of a contract. In such a situation, the third party might draw on the standby letter of credit to pay for completion of the contract and the Company would have to look to its customer to repay these funds to the Company with interest. To minimize the risk, the Company uses the same credit policies in making commitments and conditional obligations as it would for a loan to that customer.
Standby letters of credit and financial guarantees are conditional commitments issued by the Company to guarantee the performance of a customer to a third party in borrowing arrangements. At December 31, 2009, the maximum undiscounted future payments that the Company could be required to make were $100.5 million. Approximately 38.9% of these arrangements mature within one year. The Company generally has recourse to recover from the customer any amounts paid under these guarantees. Most of the guarantees are fully collateralized by the same types of assets used as loan collateral, however several are unsecured. The Company has recorded a $295,000 liability associated with the unearned portion of the letter of credit fees for these guarantees as of December 31, 2009.
The Company anticipates that a majority of the above commitments will not be fully drawn on by customers. Consumers do not tend to borrow the maximum amounts available under their home equity lines and businesses typically arrange for credit lines in excess of their expected needs to handle contingencies. A majority of the lines of credit are adjustable rate commitments that are tied to prime or a base-lending rate. If a rate is fixed on a line of credit, the commitments are not usually for more than three months.
The maximum non-discounted exposure to credit risk is represented by the contractual amount of those instruments. The majority of these commitments are for one year or less. Lines of credit and letters of credit may be withdrawn by the Company subject to applicable legal requirements.
The Company has exposure to loan losses from unfunded loan commitments and letters of credit. Since the funds have not been disbursed on these commitments, they are not reported as loans outstanding. Loan losses related to these commitments are not included in the allowance for loan
129
Table of Contents
losses reported in Note 8, “Allowance for Loan Losses” of these Consolidated Financial Statements instead, they are accounted for as a separate loss contingency or reserve as a liability within other liabilities on the Company’s Balance Sheets. The reserve for the unfunded loan commitments and letters of credit was $16.3 million at December 31, 2009 compared to $8.0 million at December 31, 2008. The increase in the reserve for off balance sheet commitments is due to an increase in loan losses. The methodology used for calculating the off balance sheet commitment reserve is the same as that used for calculating the allowance for loan losses taking into account the same qualitative factors, historical loss rates, risk rating categories and lending activity pools. However, the methodology is applied to the expected funding levels on the unfunded commitments and letter of credits. The increase in the off balance sheet commitment reserves was also significantly impacted by the decrease in the time horizon utilized for the historical loss rates. At the end of 2009, the Company used a six quarter horizon compared to the seven-year horizon used at the end of 2008. This change meant that a much heavier weighting was given at the end of 2009 to the credit losses recognized in the last few quarters than would have been the case with the longer time horizon. Changes to this liability are adjusted through other non-interest expense.
The table below summarizes the loss contingency related to loan commitments.
| Year Ended December 31, | ||||||||||
| 2009 | 2008 | 2007 | ||||||||
| (in thousands) | ||||||||||
| Beginning balance |
$ | 8,014 | $ | 1,107 | $ | 1,448 | ||||
| Additions (reductions), net |
8,245 | 6,907 | (341 | ) | ||||||
| Balance |
$ | 16,259 | $ | 8,014 | $ | 1,107 | ||||
Concentration of Lending Activities
The Company monitors concentrations within four broad categories: industry, geography, product, and collateral.
The Company’s lending activities are primarily conducted in the market areas where the Company has branch offices in the State of California with exception of the RAL Program and therefore has a concentration of loans in the central coast of California. There are some commercial real estate loans and construction loans on properties in other states. The RAL and RT Program segment offers RALs to consumers throughout the United States.
With respect to collateral, there is also a concentration of loans collateralized by real estate, but there is some diversity in the type of real estate collateral. Collateral for real estate secured loans include 1-4 units of single family residential, multifamily residential, and commercial buildings of various types. At December 31, 2009, commercial real estate, commercial and industrial, residential real estate and home equity loans comprised 83.8% of the Company’s loan portfolio but, consisted of diverse borrowers. The Company has considered this concentration in evaluating the adequacy of the allowance for loan loss and as part of the qualitative component has specifically provided a supplemental amount of allowance for loan loss for concentration risk.
The Company has a diversity of products it provides to customers, The Community Banking segment serves consumers and small businesses by offering lines of credit, equity lines and loans, automobile loans, residential mortgage loans and debit card processing. The CWMG segment serves larger business customers with traditional commercial lending products such as commercial and commercial real estate loans, lines of credit, letters of credit, asset-based lending, foreign exchange services and treasury management. It is only with RALs that there is a product concentration when over $3 billion in this one product type have been outstanding at the high-point of the season.
130
Table of Contents
Additional information on concentration of lending activities is in the Management Discussion and Analysis (“MD&A”) section of this Form 10-K, allowance for loan loss discussion starting on page 54.
Related Parties
In the ordinary course of business, the Company has extended credit to directors and executive officers of the Company. These related party loans totaled $37.3 million and $35.9 million at December 31, 2009 and 2008, respectively. At December 31, 2009, the maturities of the related party loans ranged from approximately 10 months to 30 years. Such loans are subject to ratification by the Board of Directors, exclusive of the borrowing director. Federal banking regulations require that any such extensions of credit not be offered on terms more favorable than would be offered to non-related party borrowers of similar credit worthiness.
Below is a table summarizing the activity of loans granted to related parties during 2009.
| Year Ended December 31, 2009 |
||||
| (in thousands) | ||||
| Balance, beginning of period |
$ | 35,931 | ||
| New loans |
4,254 | |||
| Repayments |
(2,870 | ) | ||
| Balance, end of period |
$ | 37,315 | ||
| 6. | LOAN SALES AND TRANSACTIONS |
During 2009, 2008, and 2007, the Company sold or recharacterized residential real estate, commercial real estate and SBA loans and various other types of loans. The Company also sold RALs during the first quarter of 2008 and 2007. The total gain on sale of loans for the years ended December 31, 2009, 2008 and 2007 was $2.6 million, $46.9 million and $68.0 million, respectively. At the end of each month, Management makes inquiries to the loan division personnel to ensure all loans identified to be sold are reclassified to loans held for sale. When loans are transferred to loans held for sale they are assessed to determine if the loans transferred to held for sale are carried at a higher carrying value than the fair value. If the carrying value is higher than the fair value, a loss on sale is recognized at the time the loans are moved to held for sale. A summary of the activities by loan portfolio is summarized below.
Residential Real Estate Loans
Residential real estate loans that have been sold have come from both loans originated for sale and from loans that were originally held for investment but later identified and transferred to loans held for sale. In addition, loans from the held for investment portfolio have been recharacterized or converted into MBS held in the Company’s trading or AFS investment portfolio. Loans originated for sale are generally sold within 30 days of origination. All of the activity in the residential real estate loan portfolio is within the Community Banking segment.
For the twelve months ended December 31, 2009 and 2008, the Company sold $296.3 million and $113.5 million for a net gain on sale of $3.5 million and $774,000, respectively. Of the residential loans sold during the twelve months ended December 31, 2009, and 2008, $156.0 million, and $95.6 million were sold with servicing retained and a servicing right of $1.7 million and $966,000, respectively, was recorded. The $296.3 million of residential loans sold during 2009 includes $77.3 million of residential real estate loans that were from the held for investment portfolio.
131
Table of Contents
In September 2009, the Company recharacterized $2.6 million of residential real estate loans from the Community Banking segment to MBS held in the Company’s AFS portfolio with a discounted par amount of $2.6 million. The Company retained the servicing on the loans sold at a service fee rate of 25 basis points and recognized a net servicing right of $33,000. Any resulting gain or loss for this transaction will be realized by the Company when or if the securities received in the recharacterization are sold.
In January and October 2008, the Company recharacterized $68.2 million and $13.9 million, respectively of residential real estate loans into a guaranteed mortgage securitization which were from the loans held for investment portfolio. The Company retained the servicing on the loans and recognized a servicing asset of $402,000 and $113,000 in January and October of 2008, respectively. The MBS were placed into the Company’s trading portfolio with no gain or loss recognized until the MBS are sold.
In October 2008, the Company identified a group of $81.7 million residential real estate loans in the loans held for investment portfolio and immediately sold them recognizing a $640,000 gain on sale. The Company retained servicing on the loans sold and recognized a servicing asset of $855,000. Since these loans were sold from the loans held for investment loan portfolio, there was $475,000 of allowance for loan losses and net deferred origination fees and expenses of negative $353,000 which were reclassified as part of the gain on sale calculation.
SBA Loans
The Company occasionally sells the guaranteed portion of selected SBA 7(a) loans into the secondary market, on a servicing retained basis. The Company retains the unguaranteed portion of these loans and services the loans as required under the SBA programs to specified yield amounts. The SBA program stipulates that the Company retain a minimum of 5% of the unguaranteed loan balance. The percentage of each unguaranteed loan in excess of 5% may be sold into the secondary market, typically for a cash premium. During 2009, the Company sold $14.2 million of SBA loans. During 2008, the Company sold $38.5 million of SBA loans.
The Company also occasionally sells certain SBA 504 loans into the secondary market, on a servicing released basis, typically for a cash premium.
For the year ended December 31, 2009, 2008 and 2007, the Company recognized a gain on sale of SBA loans of $563,000, $1.2 million and $2.4 million, respectively. For information associated with the servicing rights see Note 11, “Loan Servicing Rights” of these Consolidated Financial Statements.
Commercial Real Estate Loans
During 2009, the Company sold some of its commercial real estate loans from the loans held for investment portfolio to reduce the concentration of loans secured by commercial real estate. During 2009, the Company sold $87.2 million of commercial real estate loans and recognized a loss on sale of $1.4 million. All of the commercial real estate loans sold were sold with servicing released and were from the CWMG segment.
Commercial Loans
During 2009, the Company sold $6.1 million of commercial loans for a net gain of less than $1,000.
RALs
The Company did not utilize a securitization facility for RALs in 2009. The Company sold $2.21 billion and $1.69 billion of RALs into a securitization facility through SBBT RAL Funding Corp during the first quarter of 2008 and 2007, respectively. The net gains on sale of RALs for the years ended
132
Table of Contents
December 31, 2008 and 2007 were $44.6 million and $41.8 million, respectively. A detailed discussion of RALs sold through the securitization is included in Note 7, “RAL and RT Programs” of these Consolidated Financial Statements.
Loans sold as part of Branch Sale
In October 2008, the Company sold two retail banking branches located in Santa Paula, California as disclosed in Note 2, “Acquisitions and Dispositions” of these Consolidated Financial Statements. In conjunction with the sale of these branches, the Company also sold $30.4 million of loans. This total consisted of residential real estate loans of $17.6 million, commercial real estate loans of $ 7.9 million, home equity loans and lines of credit of $3.4 million, lines of credit of $1.3 million and small business term loans of $183,000.
Of the $30.4 million of loans sold, $29.1 million were sold with servicing retained, and an immaterial servicing right was recognized as part of the gain on sale of the two branches.
Leases
In the second quarter of 2007, the Bank sold its leasing loan portfolio of $254.7 million of loans for a net gain on sale of $24.3 million. Servicing was not retained and no servicing assets were recognized by the Company in connection with the sale. This loan portfolio was reported in the Community Banking segment prior to sale.
Indirect Auto Loans
In the second quarter of 2007, the Bank sold $221.8 million of the indirect auto loan portfolio and realized a net loss on the loan portfolio sale of $850,000. The indirect auto portfolio was reported in the Community Banking segment.
| 7. | RAL AND RT PROGRAMS |
RAL and RT Programs
The Company sells two products related to the electronic filing of tax returns. The products are designed to provide taxpayers with faster access to funds claimed by them as a refund on their tax returns. This access may be in the form of a loan from the Company secured by the refund claim, a RAL, or in the form of a facilitated electronic transfer or check prepared by their tax preparer, a RT. The RAL and RT Programs are highly seasonal. Approximately 90% of the activity occurs in the first quarter of each year.
Refund Anticipation Loans
RALs are short-term consumer loans offered to taxpayers, secured by their anticipated tax refund and subject to an underwriting process prior to approval. At the request of the taxpayer, the refund claim is paid by the IRS to the Bank once the tax return has been processed. This constitutes the source of repayment of the RAL. Funds received from the IRS above the sum of the RAL less associated contractual fees are remitted to the taxpayer by the Bank.
The RAL funds advanced by the Bank are generally repaid by the IRS within several weeks. Therefore, the processing costs and provision for loan loss represent the major costs of these loans. This cost structure is different than for other loans since usually the cost of funds is the major cost for the Company in making a loan. Because of RALs short duration, the Bank cannot recover the processing costs through interest calculated over the term of the loan. Consequently, the Bank has structured the fees to have a fixed component to cover processing costs and a variable component to cover loan losses and the cost of funds. The customer signs a promissory note. This means that the Company reports fees received for RALs as interest income.
133
Table of Contents
Net interest income for RALs was $139.1 million, $100.0 million and $105.5 million, respectively for the years ended December 31, 2009, 2008 and 2007.
The following table represents RAL originations and net charge-offs for the years indicated:
| Year Ended December 31, | ||||||||||||
| 2009 | 2008 | 2007 | ||||||||||
| (in thousands) | ||||||||||||
| Originations: |
||||||||||||
| RAL loans retained |
$ | 6,060,932 | $ | 4,572,058 | $ | 4,150,305 | ||||||
| RAL loans securitized, net |
— | 2,205,130 | 1,694,489 | |||||||||
| Total |
$ | 6,060,932 | $ | 6,777,188 | $ | 5,844,794 | ||||||
| Credit losses: |
||||||||||||
| Charge-offs of retained RALs, net |
$ | (74,538 | ) | $ | (21,768 | ) | $ | (91,960 | ) | |||
| Charge-offs of securitized RALs, net |
— | (14,914 | ) | (14,189 | ) | |||||||
| Total RAL losses, net |
$ | (74,538 | ) | $ | (36,682 | ) | $ | (106,149 | ) | |||
Unpaid RALs outstanding at the end of the year were charged off. Therefore, no RALs are reported as of December 31 of each year. As shown in the tables in Note 5, “Loans” and Note 8, “Allowance for Loan Losses,” there are no RALs or allowance for RAL losses at December 31 of each year.
Refund Anticipation Loan Securitizations
One source of external funds the Company used to extend RALs to customers is a securitization facility. During the tax season, the Company is challenged both by the need to obtain the necessary short-term funds to lend and by the need to maintain its capital ratios at an adequate level. Both of these may be met by selling the RALs. Individual RALs are each a relatively small amount (average approximate RAL amount of $3,300 per RAL for the 2008 season), so a securitization was the most efficient method to accomplish the sale of RALs.
Management was not able to set-up a securitization facility for the 2009 RAL season due to the virtual disappearance of the market for securitizations during the fourth quarter of 2008. In preparation for the 2009 RAL season and to replace the unavailability of funds from a securitization facility, the Bank raised $1.28 billion through brokered certificates of deposit (“brokered CDs”) and used a syndicated funding line of $524 million which was drawn upon during the peak of the 2009 RAL season.
Securitization Facilities used in 2008 and 2007: The securitization facilities were opened for sale of RALs in late January of each year. By the end of February, the balance of RALs was low enough so that RAL sales through the securitization were not necessary. The 2008 and 2007, securitization facility was terminated on February 22 and February 23, respectively. Consequently, there is not a balance of securitized loans at March 31 or any other quarter end including December 31 of either year.
The maximum amount of the securitization was set at $1.60 billion for the 2008 RAL season compared to $1.50 billion in the 2007 RAL season. The capacity had increased over the last few years to accommodate the increase in RAL balances each year.
Securitization Operations: As described in Note 5 Loan Sales, the Bank first sold the RALs to SBBT RAL Funding Corp., a subsidiary of the Bank, and then SBBT RAL Funding Corp sold them to the final purchasers. The securitization was managed by a primary bank, termed the “agent bank”, and several other participating banks. Each of the banks, agent and participating, were allocated a certain
134
Table of Contents
proportion of the RALs sold by the Bank through SBBT RAL Funding Corp. The agent and participating banks either purchased their allocated loans directly for their own portfolio or they had their allocation purchased by subsidiary entities called conduits. In addition to RALs purchased from the Bank, these conduits purchased other assets from a number of financial institutions. The conduits funded their asset purchases through the issuance of commercial paper and are referred to as multi-seller commercial paper funding conduits.
With each sale of RALs from the Company to SBBT RAL Funding Corp., an investment request was submitted to the agent bank. If approved, undivided ownership interests in the RALs were purchased by agent and participating banks or their multi-seller commercial paper funding conduits, without recourse.
Each purchase was made at 95% of the amount of the RALs net of the deferred fees so that a 5% over-collateralization existed for the benefit of the investors. The Bank was required to remit to the investors in the securitization cash received from the IRS up to the 95% amount. Payments received in excess of the 95% figure were retained by the Bank.
Fees paid by the Bank associated with the securitization facility included an administrative agent fee payable to the lead bank, an upfront fee, a commitment fee and a usage fee applied against the average balance of advances. There were no retained interests or servicing assets at March 31 of any year, or during any subsequent reporting period.
Repurchase of Securitized Loans: While there was no requirement that SBBT RAL Funding Corp. repurchase RALs other than those that did not meet the underwriting criteria in the purchase agreement, the seller could repurchase a minimal amount of loans as part of a “clean-up call” to close the transaction. In practice, all loans sold into the securitization were either fully repaid or repurchased by SBBT RAL Funding Corp. at the termination of the securitization in mid-February of each calendar year consistent with the terms of the Securitization Agreement. At the close of the securitization, the Company repurchased $20.9 million and $31.8 million of RALs in February 2008 and 2007, respectively, at fair value.
A majority of the RALs repurchased from the securitization were collected or charged-off before the end of the first quarter. In 2008, all repurchased RALs that remained uncollected at March 31, 2008 were deemed uncollectible and charged-off in the amount of $14.9 million as a reduction to the gain on sale of RALs.
In prior years, repurchased RALs outstanding at the end of the first quarter that were evaluated as collectible were reported on the balance sheet as RALs. Recoveries on repurchased RALs above the estimate at March 31, 2007 were accounted for as recoveries through the allowance for loan losses. Charge-offs of these RALs over the amount estimated, taken in subsequent quarters, were accounted for as losses taken against the allowance for loan losses.
Calculation of the Gain on Sale of Tax Refund Loans:
The gain on sale from the RAL securitization is calculated by reference to the securitization-related cash flows received and paid. Because the securitization was active only within the first quarter of each year, there is no present value discounting of the cash flows. The cash flows involved in the securitization are as follows:
| (1) | Cash is received from the investors for the principal amount of the loans less the discount for the credit enhancement; |
| (2) | Cash is received from the IRS for the amount of the refund and paid to the investors; |
135
Table of Contents
| (3) | Cash is paid to the investors for the commitment and funding fees; |
| (4) | Cash is paid to the investors to repurchase outstanding loans at the termination of the securitization as a “cleanup call”; and |
| (5) | Cash received from the IRS subsequent to the termination of the securitization representing collections on the repurchased loans. |
During the term of the securitization, more cash is received from the IRS for customer refunds than is paid to the investors. The difference is the amount of the discount for the credit enhancement that includes the finance charge or fee paid by the RAL customer for the loan. This fee is not sold into the securitization. In the table below, this excess is reported as securitized loan fees. In the calculation of the net gain on sale of RALs, the RAL fees received on securitized loans are reduced by the direct costs of the securitization (fees paid to investor, commitment fees paid and other fees paid) and loan losses as summarized in the table below.
| Year Ended December 31, | |||||||||||
| 2009 | 2008 | 2007 | |||||||||
| (in thousands) | |||||||||||
| Securitized loan fees |
$ | — | $ | 64,123 | $ | 59,969 | |||||
| Investor securitization costs |
— | (2,309 | ) | (2,383 | ) | ||||||
| Commitment fees |
— | (2,320 | ) | (1,575 | ) | ||||||
| Credit losses, net |
— | (14,914 | ) | (14,189 | ) | ||||||
| Net gain on sale |
$ | — | $ | 44,580 | $ | 41,822 | |||||
RAL Allowance and Provision for Loan Losses
The Company follows the same policies for charging-off RALs regardless of whether the RALs had been securitized or not. Some of the repurchased and some of the non-securitized loans are charged-off at the end of each quarter, with all remaining outstanding RALs charged-off at December 31 of each year. Due to the high volume of RALs made each year, the determination of collectibility is statistically based on historical payment patterns adjusted for information received from the IRS on current year payment processing.
RAL provision for loan losses was $74.5 million, $21.8 million and $92.0 million for the years ended December 31, 2009, 2008 and 2007, respectively. The increased provision for loan losses on RALs for 2009 compared to previous periods is due to the IRS remitting funds differently than in past years and holding-up more tax returns for review pending additional taxpayer information to be provided before processing. Losses associated with RALs result from the IRS not remitting funds associated with a particular tax return. This occurs for a number of reasons, including errors in the tax return and tax return fraud. In addition, $14.9 million of credit losses were included as an offset in the 2008 gain on sale of RALs. RAL credit losses were high in 2007 mostly due to the RAL pre-file product. The RAL pre-file product is a RAL that was offered in advance of the taxpayer’s filing of their tax return, primarily in the month of January, for a portion of the anticipated refund amount. A RAL pre-file loan is repaid once a RAL or RT is funded by the IRS. After the increased losses experienced in 2007, the Company decided to no longer offer this product.
136
Table of Contents
Fees Earned on RALs and RTs
The following table summarizes RAL and RT fees and the proportion each represents of the total fees from this business line presented for the years indicated:
| Year Ended December 31, | ||||||||||||
| 2009 | 2008 | 2007 | ||||||||||
| (dollars in thousands) | ||||||||||||
| Total RAL Fees |
$ | 151,611 | $ | 108,762 | $ | 117,835 | ||||||
| % of Total Fees |
69 | % | 61 | % | 72 | % | ||||||
| RT Fees: |
||||||||||||
| Total RT Fees |
$ | 68,315 | $ | 68,731 | $ | 45,898 | ||||||
| % of Total Fees |
31 | % | 39 | % | 28 | % | ||||||
| Total Fees |
$ | 219,926 | $ | 177,493 | $ | 163,733 | ||||||
Total RAL fees increased by $42.8 million or 39.4% to $151.6 million for the year ended December 31, 2009 compared to $108.8 million for the year ended December 31, 2008. This increase was due to the Bank not securitizing and selling RALs in 2009. Instead of being included as a component of the gain on sale of RALs as shown above for 2008 ($64.1 million) and 2007 ($60.0 million), the fees were recognized as fee income. RAL volume decreased by 16% for the comparable twelve month periods in 2009 and 2008 which contributed to the decline in fees by approximately $26.7 million including those recognized as a component of the securitization. Total RT fees decreased by $416,000 due to an increase in volume offset by a decrease in average fee collected of approximately one dollar per transaction. Total RT transactions increased by 185,000 or 2.9% from 6.3 million for the year ended December 31, 2008 compared to 6.5 million for the year ended December 31, 2009. Fees earned on RTs are recognized in non-interest income as a separate line item, “Refund transfer fees”.
Total RT transactions increased by 1.5 million or 30.8% from 4.8 million for the year ended December 31, 2007 to 6.3 million for the year ended December 31, 2008. Implementation of new credit risk management controls resulted in an increased number of RAL customer applications that were declined which then converted to an RT, resulting in the $22.8 million increase in RT fees for the year ending December 31, 2008 compared to December 31, 2007.
The following table represents changes in RAL fee income for the three years presented:
| Year Ended December 31, | ||||||||||||
| 2009 | 2008 | 2007 | ||||||||||
| (dollars in thousands) | ||||||||||||
| Total RAL Fees |
$ | 151,611 | $ | 108,762 | $ | 117,835 | ||||||
| Net change from prior year |
39.40 | % | -7.70 | % | 0.27 | % | ||||||
137
Table of Contents
| 8. | ALLOWANCE FOR LOAN LOSSES |
The following table summarizes the allowance for loan losses for the Core Bank and RALs. The Company utilizes the term “Core Bank” to define consolidated financial results excluding the financial results of the RAL and RT Programs.
| Year Ended December 31, | ||||||||||||
| 2009 | 2008 | 2007 | ||||||||||
| (in thousands) | ||||||||||||
| Balance, beginning of period |
$ | 140,908 | $ | 44,843 | $ | 64,671 | ||||||
| Loans charged off: |
||||||||||||
| RALs |
(99,433 | ) | (53,752 | ) | (116,726 | ) | ||||||
| Core Bank Loans |
(228,261 | ) | (107,373 | ) | (27,690 | ) | ||||||
| Total loans charged-off |
(327,694 | ) | (161,125 | ) | (144,416 | ) | ||||||
| Recoveries on loans previously charged-off: |
||||||||||||
| RALs |
24,895 | 31,984 | 24,766 | |||||||||
| Core Bank Loans |
9,437 | 7,691 | 7,173 | |||||||||
| Total recoveries on loans previously charged-off |
34,332 | 39,675 | 31,939 | |||||||||
| Net charge-offs |
(293,362 | ) | (121,450 | ) | (112,477 | ) | ||||||
| Provision for loan losses: |
||||||||||||
| RALs |
74,538 | 21,768 | 91,958 | |||||||||
| Core Bank Loans |
352,398 | 196,567 | 21,314 | |||||||||
| Total provision for loan losses |
426,936 | 218,335 | 113,272 | |||||||||
| Adjustments from loan sales |
(1,630 | ) | (820 | ) | (20,623 | ) | ||||||
| Balance, end of period |
$ | 272,852 | $ | 140,908 | $ | 44,843 | ||||||
The allowance for loan losses was $272.9 million at December 31, 2009, an increase of $131.9 million when comparing the balance at December 31, 2008. The increase to the allowance for loan losses was directionally consistent with the recent elevated credit losses and net charge-offs experienced by the Company. Further, in recognition of these recent credit losses and the continued deterioration of the general economic environment, in the second quarter of 2009, the Company shortened the timeframe utilized for estimating historical loss rates in its calculations of the estimated loss contingencies in accordance with the accounting topic from the ASC, Loss Contingencies component of the allowance (i.e., reserve for non-impaired loans calculated on a loan pool basis). The shortened timeframe placed more weight on the recent history of increased losses during 2009, which resulted in a substantial increase in the allowance during 2009. While all loans identified in accordance with the accounting topic of the ASC, Subsequent Measurement for Loan Impairment, have been written down to net realizable value, this has also caused a significant increase in the ALL and represents management’s estimate of inherent losses within the Company’s remaining loans in each portfolio. In addition, the 2009 RAL season experienced a higher loss rate of RALs which is discussed in Note 6, “RAL and RT Programs”.
For additional discussion and analysis regarding the Bank’s allowance for loan loss is within the MD&A section of this form 10-K starting on page 58.
138
Table of Contents
| 9. | PREMISES AND EQUIPMENT |
The following table summarizes the premises and equipment at December 31, 2009 and 2008.
| December 31, | ||||||||
| 2009 | 2008 | |||||||
| (in thousands) | ||||||||
| Land |
$ | 5,492 | $ | 5,718 | ||||
| Buildings and improvements |
37,806 | 34,205 | ||||||
| Leasehold improvements |
40,485 | 49,319 | ||||||
| Furniture, fixtures and equipment |
38,479 | 127,183 | ||||||
| Developed software |
34,620 | 46,668 | ||||||
| Total cost |
156,882 | 263,093 | ||||||
| Less: accumulated depreciation and amortization |
(82,871 | ) | (184,485 | ) | ||||
| Premises and equipment, net |
$ | 74,011 | $ | 78,608 | ||||
Software purchased by the Company is included above in furniture, fixtures and equipment. Included in developed software is capitalized interest. The Company’s capitalized interest expense was $40,000 for the year ended December 31, 2007. There was no capitalized interest expense for the years ended December 31, 2008 and 2009. Developed software represents the accumulated balance of developed or modified software and primarily relates to the Company’s core accounting and retail delivery systems. Developed software costs net of accumulated depreciation was $3.8 million and $8.8 million for the years ended December 31, 2009 and 2008.
Depreciation expense for premises and equipment was $18.9 million, $21.7 million and $18.6 million for the twelve month periods ended December 31, 2009, 2008 and 2007, respectively. Developed software depreciation expense was $5.0 million, $8.3 million and $4.3 million for the twelve months ended December 31, 2009, 2008 and 2007, respectively.
Lease Obligations
The following table shows the contractual lease obligations of the Company at December 31, 2009:
| December 31, 2009 | December 31, 2008 | |||||||||||||||||
| Less than one year |
One to three years |
Three to five years |
More than five years |
Total | ||||||||||||||
| (in thousands) | ||||||||||||||||||
| Non-cancelable leases |
$ | 11,501 | $ | 20,067 | $ | 14,284 | $ | 23,773 | $ | 69,625 | $ | 89,983 | ||||||
| Capital leases |
748 | 1,592 | 1,891 | 39,080 | 43,311 | 25,621 | ||||||||||||
| Total |
$ | 12,249 | $ | 21,659 | $ | 16,175 | $ | 62,853 | $ | 112,936 | $ | 115,604 | ||||||
The Company leases most of its office locations and substantially all of these office leases contain multiple five-year renewal options and provisions for increased rents, principally for property taxes and maintenance. At December 31, 2009, the minimum commitment under non-cancelable leases for the next five years and thereafter are shown in the above table. The amounts in the table for minimum rentals are not reported net of the contractual obligations of sub-tenants. Sub-tenants leasing space from the Company under these operating leases are contractually obligated to the Company for approximately $1.7 million. Approximately 74% of these payments are due to the Company over the next three years. Total rental expense, net of sublease income, for premises included in non-interest expenses are $12.3 million in 2009, $13.1 million in 2008 and $10.8 million in 2007.
139
Table of Contents
Additional disclosure regarding capital leases is in Note 14, “Long-Term Debt and Other Borrowings” of these Consolidated Financial Statements.
| 10. | GOODWILL AND INTANGIBLE ASSETS |
Goodwill
Historically, the Company tested goodwill for impairment during the third quarter of each year and when management determined there was a triggering event which may indicate a need to review goodwill for impairment. Given the economic downturn and the ongoing events within the banking industry, Management has deemed it prudent to begin assessing goodwill for impairment on a quarterly basis after a $22.1 million goodwill impairment was recorded in the third quarter of 2008.
In the second quarter of 2009, Management concluded that the entire balance of goodwill at all reporting units was impaired and recorded a $128.7 million impairment charge. This was due to the increasingly uncertain economic environment, significant continued decline in market capitalization, and continued elevated credit losses. This analysis was performed in accordance with the accounting guidance for the testing of goodwill for impairment.
Testing goodwill for impairment consists of a two-part test to determine the fair value of goodwill. In Step 1 the fair value of the reporting unit is determined and compared to its carrying value. If the fair value of the reporting unit is less than its carrying value, the company must proceed with Step 2, which requires allocating the reporting unit’s fair value to its financial and intangible assets and liabilities. The implied fair value of goodwill is the excess value after allocation to all financial and intangible assets and liabilities.
All of the Company’s reporting units failed Step 1 of the goodwill impairment analysis in the second quarter of 2009. This required the Company to proceed with the Step 2 analysis for each reporting unit. As a result of the Step 1 and Step 2 analysis to determine the implied fair value of goodwill combined with Management’s assessment of goodwill, a determination was made to take a $128.7 million full impairment of goodwill. The impairment of goodwill by reporting unit was:
| (in thousands) | |||
| Commercial and Wealth Management Group: |
$ | 78,145 | |
| Community Banking: |
40,371 | ||
| Morton Capital Management: |
5,589 | ||
| R.E. Wacker & Associates: |
4,605 | ||
| Total |
$ | 128,710 | |
The calculation of goodwill impairment requires significant estimates by Management for each reporting unit, such as which peer companies to use, the application of market multiples of publicly traded peer companies and, a determination of the appropriate control premium, if any, the forecasting of future income, a calculation of discounted cash flows and, other methodologies used to obtain the fair value of the underlying financial and intangible assets and liabilities. While the guidance under FASB ASC 350-20-35 to calculate goodwill impairment is largely substantively driven, Management also considered certain qualitative factors in concluding to fully impair the Company’s goodwill. These factors included: i) current economic conditions in the Company’s markets, ii) the prolonged deterioration that has occurred throughout the banking and financial services industry and related valuations of such companies, including the Company’s, from a capital markets perspective, iii) the deteriorated condition of the Company as evidenced by continued current quarterly losses, and iv) requirements under the Bank’s memorandum of understanding with the OCC for increased capital levels which, to date, the Bank has not been able to achieve. The goodwill impairment testing is performed by Management with the assistance and input of a third party.
140
Table of Contents
Intangible Assets
The Company has three types of identifiable intangible assets; customer deposit intangibles, customer relationship intangibles and loan servicing rights. All intangible assets are amortized over their estimated lives. Customer deposit and relationship intangibles are created when a company acquires another company. The customer deposit intangibles were created when FBSLO and Pacific Crest Capital, Inc. (“PCCI”) were acquired in 2005 and 2004, respectively and the Company purchased their deposits. Customer relationship intangibles were created when the Company acquired MCM and REWA in 2006 and 2008, respectively. The customer deposit and relationship intangibles are discussed below and, the loan servicing rights are discussed in the next note to these Consolidated Financial Statements.
The tables below summarize the change in the customer deposit intangible by acquisition.
| December 31, | ||||||||||||||||||
| 2009 | 2008 | |||||||||||||||||
| (in thousands) | ||||||||||||||||||
| San Juan Bautista |
PCCI | FBSLO | San Juan Bautista |
PCCI | FBSLO | |||||||||||||
| Core deposit intangibles: |
||||||||||||||||||
| Balance, beginning of year |
$ | 8 | $ | 109 | $ | 2,055 | $ | 17 | $ | 271 | $ | 3,234 | ||||||
| Amortization |
8 | 109 | 555 | 9 | 162 | 1,179 | ||||||||||||
| Balance, end of year |
$ | — | $ | — | $ | 1,500 | $ | 8 | $ | 109 | $ | 2,055 | ||||||
| December 31, | |||||||||
| 2007 | |||||||||
| (in thousands) | |||||||||
| San Juan Bautista |
PCCI | FBSLO | |||||||
| Core deposit intangibles: |
|||||||||
| Balance, beginning of year |
$ | 24 | $ | 507 | $ | 4,121 | |||
| Amortization |
7 | 236 | 887 | ||||||
| Balance, end of year |
$ | 17 | $ | 271 | $ | 3,234 | |||
A separate intangible asset was recorded for the customer relationship intangibles acquired with the acquisitions of REWA and MCM. The table below summarizes the activity in the customer relationship intangible.
| December 31, | ||||||||||||||||||
| 2009 | 2008 | 2007 | ||||||||||||||||
| (in thousands) | ||||||||||||||||||
| MCM | REWA | MCM | REWA | MCM | REWA | |||||||||||||
| Customer relationship intangible: |
||||||||||||||||||
| Balance, beginning of year |
$ | 1,731 | $ | 1,848 | $ | 2,221 | $ | — | $ | 2,285 | $ | — | ||||||
| Additions |
— | — | — | 2,560 | — | — | ||||||||||||
| Amortization |
261 | 219 | 490 | 712 | 64 | — | ||||||||||||
| Balance, end of year |
$ | 1,470 | $ | 1,629 | $ | 1,731 | $ | 1,848 | $ | 2,221 | $ | — | ||||||
141
Table of Contents
The customer relationship intangibles are amortized based on estimated undiscounted cash flows over fifteen years.
With the purchase of REWA in January 2008, there was also a separate intangible for the non-compete agreements of $220,000 with amortization of $32,000 and $31,000 for the years ended December 31, 2009 and 2008, respectively.
Amortization expense for the customer deposit and relationship intangibles was $1.2 million, $2.6 million and $1.2 million for the years ended December 31, 2009, 2008 and 2007, respectively. The customer deposit and relationship intangibles have an estimated weighted average life of 7.4 years and 16.8 years, respectively.
Below is a summary of estimated amortization expense over the next five years and thereafter:
| Year |
(in thousands) | |
| 2010 |
$ 931 | |
| 2011 |
931 | |
| 2012 |
759 | |
| 2013 |
358 | |
| 2014 |
347 | |
| Thereafter |
1,430 |
| 11. | LOAN SERVICING RIGHTS |
The table below summarizes the activity of the Company’s servicing rights.
| Year Ended December 31, | ||||||||||||
| 2009 | 2008 | 2007 | ||||||||||
| (in thousands) | ||||||||||||
| Balance beginning of year |
$ | 3,722 | $ | 4,294 | $ | 1,861 | ||||||
| Additions, through mortgage loan sales |
1,715 | 1,519 | 2,657 | |||||||||
| Additions, through SBA loan sales |
223 | 584 | 577 | |||||||||
| Mortgage servicing rights amortized |
(593 | ) | (716 | ) | (90 | ) | ||||||
| SBA servicing rights amortized |
(245 | ) | (464 | ) | (633 | ) | ||||||
| Valuation adjustment |
(289 | ) | (1,495 | ) | (78 | ) | ||||||
| Balance end of year |
$ | 4,533 | $ | 3,722 | $ | 4,294 | ||||||
During 2009, 2008 and in December 2007, the Company sold $296.1 million, $177.7 million and $285.1 million of residential real estate loans and retained the servicing rights. Upon the sale of these loans, servicing rights of $1.7 million, $1.5 million and $2.7 million were recognized during 2009, 2008 and 2007, respectively. Throughout 2009, 2008, and 2007 the Company sold SBA loans as described in Note 6, “Loan Sales and Transactions” of these Consolidated Financial Statements and retained servicing rights. The servicing rights obtained through the sale of SBA loans were $223,000, $584,000 and $557,000 for the years ending December 31, 2009, 2008 and 2007, respectively.
During the third quarter of 2007, the Company sold $4.6 million of the unguaranteed portion of SBA 7(a) loans. The Company established a servicing liability of $67,000. This servicing liability will be amortized over 25 years which is the estimated life of the loans sold.
As of December 31, 2009 and 2008, the Company serviced for others $494.5 million and $500.5 million, respectively, of mortgage loans and $91.3 million and $112.8 million, respectively of SBA loans. In October 2008, the Company sold two branches and included $30.4 million of loans as
142
Table of Contents
part of the sale as disclosed in Note 6, “Loan Sales and Transactions” of these Consolidated Financial Statements. The servicing rights associated with the servicing of these loans are included in mortgage loan sales in the table above. A majority of the loans sold with the branch sale were serviced for up to one year after the date of the sale.
As disclosed in Note 1, “Summary of Significant Accounting Policies” of these Consolidated Financial Statements, Management has elected to carry servicing rights at the lower of amortized cost or fair value. The fair value of the mortgage servicing rights at December 31, 2009 and 2008 was $3.9 million and $2.3 million, respectively. The fair value was determined using discount rate of 10.0% and 10.3% and estimated prepayment rates of 19.1% and 36.8%, and estimated default rates of 0% as of December 31, 2009 and 2008, respectively. The fair value of SBA servicing rights was $1.3 million and $1.5 million at December 31, 2009 and 2008, respectively. The fair value was determined using discount rate of 11.3% and 15.2%, estimated prepayment rates of 14.4% and 17.8%, and estimated default rates of 0% as of December 31, 2009 and 2008, respectively.
Additional information regarding the sale of loans is described in Note 6, “Loan Sales and Transactions” of these Consolidated Financial Statements.
| 12. | DEPOSITS |
The table below summarizes deposits by type.
| December 31, | ||||||
| 2009 | 2008 | |||||
| (in thousands) | ||||||
| Non-interest-bearing deposits |
$ | 1,149,291 | $ | 981,944 | ||
| Interest-bearing deposits: |
||||||
| NOW accounts |
938,336 | 1,044,301 | ||||
| Money market deposit accounts |
287,271 | 612,710 | ||||
| Other savings deposits |
353,712 | 320,842 | ||||
| Time certificates of $100,000 or more |
1,494,203 | 1,682,974 | ||||
| Other time deposits |
1,223,381 | 1,945,931 | ||||
| Total deposits |
$ | 5,446,194 | $ | 6,588,702 | ||
Certificates of deposit are the only deposits which have a specified maturity. The balances of other deposit accounts are primarily assigned to the less than one-year time range. Of the total deposits at December 31, 2009, $4.90 billion may be either immediately withdrawn or matures within 1 year; $473.8 million matures within 1 to 3 years, $76.2 million matures within 3 to 5 years, and $1.1 million matures in more than 5 years.
As of December 31, 2009, the Company had $229.2 million of securities pledged as collateral for the Bank’s Local Agency deposits.
| 13. | SECURITIES SOLD UNDER AGREEMENTS TO REPURCHASE AND FEDERAL FUNDS PURCHASED |
Securities sold under agreements to repurchase (“repos”) are borrowings by the Company collateralized by pledged investment securities. The Company enters into repos for various terms: overnight, several weeks and multi-year periods. Federal funds purchased consist of unsecured overnight borrowings from other financial institutions.
143
Table of Contents
Throughout the year, repos with terms of several weeks to several months are offered to customers that wish to place funds with the Company in excess of the $250,000 Federal Deposit Insurance Corp (“FDIC”) limit on deposit insurance.
The following table summarizes repurchase agreements and federal funds purchased.
| Repurchase Agreements Year Ended December 31, |
Federal Funds Purchased Year Ended December 31, |
|||||||||||||||||||||||
| 2009 | 2008 | 2007 | 2009 | 2008 | 2007 | |||||||||||||||||||
| (dollars in thousands) | ||||||||||||||||||||||||
| Weighted average interest rate at year-end |
3.54 | % | 3.31 | % | 4.48 | % | 0.13 | % | 0.00 | % | 4.00 | % | ||||||||||||
| Weighted average interest rate for the year |
3.06 | % | 3.39 | % | 4.37 | % | 0.24 | % | 2.79 | % | 6.27 | % | ||||||||||||
| Average outstanding balance |
$ | 330,274 | $ | 343,509 | $ | 242,897 | $ | 6,708 | $ | 50,901 | $ | 117,725 | ||||||||||||
| Total balance at year-end |
$ | 314,231 | $ | 342,157 | $ | 265,873 | $ | 7,900 | $ | — | $ | 6,800 | ||||||||||||
| Maximum outstanding at any month-end |
$ | 338,327 | $ | 381,590 | $ | 265,873 | $ | 11,500 | $ | 561,500 | $ | 734,700 | ||||||||||||
| 14. | LONG-TERM DEBT AND OTHER BORROWINGS |
The following table summarizes long-term debt and other borrowings:
| December 31, | ||||||
| 2009 | 2008 | |||||
| (in thousands) | ||||||
| Other short-term borrowings: |
||||||
| Amounts due to the Federal Reserve Bank |
$ | 6,484 | $ | 2,920 | ||
| Federal Home Loan Bank advances |
20,000 | 230,000 | ||||
| Total short-term borrowings |
26,484 | 232,920 | ||||
| Long-term debt: |
||||||
| Federal Home Loan Bank advances |
1,079,493 | 1,306,965 | ||||
| Subordinated debt issued by the Bank |
121,000 | 121,000 | ||||
| Subordinated debt issued by the Company |
69,426 | 69,426 | ||||
| Total long-term debt |
1,269,919 | 1,497,391 | ||||
| Total long-term debt and other short-term borrowings |
1,296,403 | 1,730,311 | ||||
| Obligation under capital lease |
15,425 | 9,929 | ||||
| Total long-term debt and other borrowings |
$ | 1,311,828 | $ | 1,740,240 | ||
Other Short-Term Borrowings
Other short-term borrowings include short term advances with FHLB and treasury tax and loans (“TT&Ls”) deposits collected from customers which are held at the Bank until the funds are requested by the FRB.
At December 31, 2009 and 2008, the weighted average interest rate paid for short-term borrowings were 0.39% and 2.37%, respectively. For the years ending December 31, 2009, 2008 and 2007, total interest expense for short-term borrowings were $413,000, $2.8 million and $8.6 million, respectively.
144
Table of Contents
Federal Home Loan Bank Advances
As a member of FHLB the Company has established a credit line. The borrowing capacity is determined based on the amount of collateral pledged to the FHLB. As of December 31, 2009 and 2008, total advances with the FHLB were $1.10 billion and $1.54 billion, respectively. At December 31, 2009, there were $372.0 million in advances with scheduled maturities of 1 year or less, $357.3 million maturing in 1 to 3 years, and $370.2 million maturing in more than 3 years with a total weighted average rate of 3.51% and maturity dates ranging from 2010 to 2031.
Subordinated Debt
Subordinated debt issued by the Bank qualifies as Tier 2 capital for the Bank and the Company which impacts the computation of capital ratios as discussed in Note 20, “Regulatory Capital Requirements” of these Consolidated Financial Statements. However, the amount of subordinated debt qualifying as Tier 2 capital is reduced in each of the last five years of the term of the debt in accordance with the regulatory guidance for the computation of capital ratios. Of the $121.0 million in subordinated debt shown in the table below, $68.2 million qualified as Tier 2 capital for regulatory purposes. The Bank is current on all payments related to the subordinated debt as of December 31, 2009.
The table below summarizes the subordinated debt issued by the Bank.
| Amount Owed |
Fixed Rate |
Maturity | Par Call Date | |||||
| (dollars in thousands) | ||||||||
| $ | 36,000 | 9.220% | 2011 | none | ||||
| 35,000 | (1) | Variable | 2013 | Quarterly | ||||
| 50,000 | (2) | Variable | 2014 | Anytime | ||||
| $ | 121,000 | |||||||
| (1) | The $35.0 million of subordinated debt above has a variable interest rate which reprices every three months based on the 90-day London Inter-Bank Offered Rate (“LIBOR”) rate plus 2.60%. |
| (2) | The $50.0 million of subordinated debt above became a variable interest rate debt in December 2009 which reprices every three months based on the 90-day LIBOR rate plus 1.75%. |
The subordinated debt issued through business trusts which issued trust preferred securities in conjunction with issuing the debt to the Company is summarized in the table below:
| Owed to |
Amount Owed | Initial Fixed Rate |
Maturity | Call Date | Spread over LIBOR if not called |
||||||||
| (dollars in thousands) | |||||||||||||
| PCC Trust I |
$ | 13,750 | 6.335 | % | 2033 | Quarterly | 3.25 | % | |||||
| PCC Trust II |
6,190 | 6.580 | % | 2033 | Quarterly | 3.15 | % | ||||||
| PCC Trust III |
10,310 | 6.800 | % | 2033 | Quarterly | 3.10 | % | ||||||
| PCB Trust I |
39,176 | 7.189 | % | 2036 | 2011 | 1.70 | % | ||||||
| $ | 69,426 | ||||||||||||
145
Table of Contents
The first three subordinated debt instruments above were issued by PCCI prior to its acquisition by PCB. The fourth instrument was issued by PCB. This subordinated debt qualifies as Tier 1 capital for PCB and because in each case the proceeds from the debt were contributed to the respective subsidiary bank as additional paid-in capital, the debt also qualifies as Tier 1 capital for the Bank. The Company has elected to defer regularly scheduled interest payments on the junior subordinated debt related to the trust preferred securities. The respective trusts will likewise suspend the declaration and payment on dividends on the trust preferred securities. During the deferral period the Company may not make any payment on outstanding debt obligations that rank equally with or are junior to the junior subordinated notes relating to these trust preferred securities.
Capital Lease
At December 31, 2009, the Company had two capital leases for a total obligation under the capital leases of $15.4 million. In the first quarter of 2009, the Company entered into a new capital lease for the Company’s Wealth Management Group. The new capital lease obligation at December 31, 2009 was $5.3 million and requires the Company to pay monthly payments through 2038. The implied interest rate for this capital lease is 8.9%. The amortization of the leased building is included with depreciation expense. The lease provides for specific increases during its term. The total lease payments for 2009 were $629,000. As of December 31, 2009, the total minimum sublease rent to be received under non-cancelable subleases was $1.7 million.
In July 2009, the Company assigned one of its outstanding capital leases to a third party; however, the Company retained an obligation to ensure the capital lease payments are made to the lessor over the remaining lease term of 29 years. Due to this obligation, the Company continues to record this capital lease on its consolidated balance sheet. The Company deferred the lease assignment gain of $900,000 and will amortize it into earnings over the remaining lease term. At December 31, 2009, the accumulated amortization of the capital lease was $1.7 million; the implied interest rate was 5.89%; and the capital lease obligation was $10.1 million. Total lease payments were $984,000 for the year ended December 31, 2009.
Both of the above capital leases contain no significant restrictive covenants or triggering events as to the issuance of other debt or require payment in full prior to the scheduled maturity.
Issuance of Preferred Securities and Common Stock Warrants
In November 2008, the U.S. Treasury purchased $180.6 million of the Company’s preferred stock through the Troubled Asset Relief Program Capital Purchase Program (“TARP CPP”) and, in connection with this purchase, it also received common stock warrants. SEC Deputy Chief Accountant and the FASB’s Technical Director determined that all preferred stock issuance and associated common stock warrants related to this program were to be accounted for as equity, and therefore the disclosure of this transaction is discussed in Note 19, “Shareholders’ Equity” of these Consolidated Financial Statements.
146
Table of Contents
| 15. | POSTRETIREMENT BENEFITS |
In December 2009, the Company’s Compensation Committee of the Board of Directors approved the reduction in the Company’s contributions towards retiree health insurance benefits effective March 1, 2010. Specifically, the Company will discontinue the Company’s contributions for retirees eligible for health insurance through Medicare, will eliminate its contribution for the retiree health insurance for future retirees, and will limit its contribution to 50% of the cost of health insurance premiums for retirees not yet eligible for Medicare. These decisions combined with a reduction of the number of current employees reduced the net present value of the Company’s ABPO for future benefits by $24.9 million due to the Plan amendment and $2.4 million due to the Plan curtailment at December 31, 2009, leaving a $3.2 million APBO at December 31, 2009. Due to this decision, a curtailment gain of $4.5 million was recognized as a reduction to benefit expense at December 31, 2009 to account for the reduction in postretirement benefits with the remaining reduction of $21.5 million of the ABPO to be initially included in OCI and then recognized in income over the next five years.
From 1992 through 2009, the Company provided eligible retirees with postretirement health care and dental benefit coverage. Pursuant to the Retiree Health Plan and the Key Employee’s Retiree Health Plan, (the “Plans”), the board could change the plans to reduce levels or eliminate benefits entirely at any time. All eligible retirees were able to obtain health insurance coverage through the Company’s Retiree Health Plan (“the Plan”). The coverage is provided through the basic coverage plan provided for current employees.
The APBO or the Plan’s obligation is based on a calculation involving all current employees’ estimated date of retirement, age at retirement, years of service prior to retirement and that the Company pay for a portion of the health insurance premium for the retiree. Prior to the Company reducing the Plan benefits, the Company paid 60% to 100% of the insurance premium for eligible retirees. The range of premium paid on behalf of the retiree was dependent on the retiree’s number of years of service and age at retirement. Though the premiums for a retiree’s health coverage are not paid until after the employee retires, the Company is required to recognize the cost of those benefits as they are earned rather than when paid. The following tables provide the activity associated with building of the APBO over the last three years and, includes the reduction of the APBO due to the reduction in benefits and, the future discontinuation of the Plan.
147
Table of Contents
The following tables disclose the reconciliation of the beginning and ending balances of the APBO; the reconciliation of beginning and ending balances of the fair value of the plan assets; and the funding status of the Plan:
| Year Ended December 31, | ||||||||||||
| 2009 | 2008 | 2007 | ||||||||||
| (in thousands) | ||||||||||||
| Benefit obligation, beginning of year |
$ | 24,365 | $ | 20,379 | $ | 19,802 | ||||||
| Service cost |
1,408 | 1,175 | 1,385 | |||||||||
| Interest cost |
1,432 | 1,197 | 1,119 | |||||||||
| Amendments |
(24,901 | ) | — | — | ||||||||
| Curtailment gain |
(2,370 | ) | — | — | ||||||||
| Actuarial losses (gains) |
4,391 | 2,119 | (1,516 | ) | ||||||||
| Benefits paid |
(1,099 | ) | (505 | ) | (411 | ) | ||||||
| Benefit obligation, end of year |
3,226 | 24,365 | 20,379 | |||||||||
| Fair value of Plan assets, beginning of year |
10,115 | 14,238 | 12,032 | |||||||||
| Actual return on Plan assets |
3,802 | (5,600 | ) | 2,206 | ||||||||
| Employer contribution |
1,510 | 1,982 | 411 | |||||||||
| Benefits paid |
(1,099 | ) | (505 | ) | (411 | ) | ||||||
| Fair value of Plan assets, end of year |
14,328 | 10,115 | 14,238 | |||||||||
| Funded status end of year |
11,102 | (14,250 | ) | (6,141 | ) | |||||||
| Non-current liability |
— | 14,250 | 6,141 | |||||||||
| Non-current asset |
$ | 11,102 | $ | — | $ | — | ||||||
A summary of the activity in OCI in accordance with the accounting guidance for postretirement benefits is as follows:
| Year Ended December 31, | ||||||||||||
| 2009 | 2008 | 2007 | ||||||||||
| (in thousands) | ||||||||||||
| Net gain or (loss) |
$ | (13,448 | ) | $ | (15,789 | ) | $ | (7,670 | ) | |||
| Prior service cost |
24,901 | 5,156 | 5,801 | |||||||||
| Accumulated other comprehensive Income |
$ | 11,453 | $ | (10,633 | ) | $ | (1,869 | ) | ||||
Due to the Plan amendment and curtailment of postretirement benefits the Company reduced the APBO by $27.3 million which eliminated the postretirement benefit liability and created a postretirement benefit asset of $11.1 million and OCI associated with the postretirement benefit of $11.5 million. This adjustment to OCI was also adjusted for the Plan amendment and curtailment and was reduced for deferred tax of $9.3 million.
The Components of the Net Periodic Postretirement Benefit Cost
Each year the Company recognizes a portion of the change in the APBO as an expense. This portion is called the NPPBC. The NPPBC is made up of several components which include the curtailment gain of $4.5 million due to the Plan amendment and curtailment of benefits.
148
Table of Contents
The following table includes the amounts for each of the components of the NPPBC.
| Year Ended December 31, | ||||||||||||
| 2009 | 2008 | 2007 | ||||||||||
| (in thousands) | ||||||||||||
| Service cost |
$ | 1,408 | $ | 1,175 | $ | 1,385 | ||||||
| Interest cost |
1,432 | 1,196 | 1,119 | |||||||||
| Return on assets |
(668 | ) | (905 | ) | (765 | ) | ||||||
| Amortization, net |
584 | (139 | ) | 42 | ||||||||
| Curtailment gain |
(4,512 | ) | — | — | ||||||||
| Net periodic postretirement (benefit) cost |
$ | (1,756 | ) | $ | 1,327 | $ | 1,781 | |||||
The net actuarial loss and prior service credit for the defined benefit pension plans that will be amortized from accumulated OCI into NPPBC over the next fiscal year are $2.3 million and $4.9 million, respectively.
The Use of Estimates and the Amortization of Experience Gains and Losses
The following table discloses the assumed rates that have been used for the factors impacting the APBO.
| Year Ended December 31, | |||||||||
| 2009 | 2008 | 2007 | |||||||
| Discount rate |
4.25 | % | 6.00 | % | 6.00 | % | |||
| Expected return on plan assets |
6.50 | % | 6.50 | % | 6.50 | % | |||
The discount rate is used to compute the present value of the APBO. It is selected each year by reference to the current rates of investment grade corporate bonds. Higher discount rates result in a lower APBO at the end of the year and the NPPBC to be recognized for the following year, while lower rates raise both.
The Company used 6.50% as its estimate of the long-term rate of return on plan assets. The APBO is a long-term liability of 30 years or more. The 6.50% rate is the assumed average earning rate over an equally long investment horizon. If the rate of return in any year is greater than this estimate, the Company will have an experience gain and an experience loss if the rate of return is less. In 2009, the Company had an experience gain while in 2008 the Company had an experience loss. The earnings/(loss) of the plan’s assets were 37.59%, (37.40%) and 18.30% for the years ended December 31, 2009, 2008, and 2007, respectively.
Increases in health insurance costs impact the portion of the APBO because such increases result in higher health insurance premiums paid by the Company. If costs rise at a higher rate than assumed by the Company, there will be an experience loss. If they rise at a lesser rate, there will be an experience gain.
The Company has used various rates year to year for the health care inflation rate for current employees. For 2010, 2011, 2012, 2013, 2014, 2015, 2016 and thereafter, the Company has assumed the following rates 12.0%, 11.0%, 10.0%, 9.0%, 8.0%, 7.0%, 6.0% and 5.0%, respectively.
149
Table of Contents
Assumed health care cost trend rates have a significant effect on the amounts reported for the health care plans. A one-percentage-point change in assumed health care cost trend rates would have the following effects:
| One Percentage- Point Increase effect |
One Percentage- Point Decrease effect |
||||||
| (in thousands) | |||||||
| Effect on total of service and interest cost components |
$ | 524 | $ | (420 | ) | ||
| Effect on postretirement benefit obligation |
$ | 120 | $ | (112 | ) | ||
Rather than recognizing the whole amount of the experience gains or losses in the year after they arise, under GAAP they are recognized through amortization over the average remaining service lives of the employees. Amortization over time is used because many of these changes may be partially or fully reversed in subsequent years as further changes in experience and/or assumptions occur. The unamortized experience gains or losses make up a substantial portion of the unfunded liability recognized. The experience gains or losses are initially recorded as an adjustment to OCI and then amortized into expense through the NPPBC.
The table below summarizes the total recognized in NPPBC and OCI:
| Year Ended December 31, | |||||||||||
| 2009 | 2008 | 2007 | |||||||||
| (in thousands) | |||||||||||
| Net (gain) or loss |
$ | (2,342 | ) | $ | 8,119 | $ | (3,232 | ) | |||
| Prior service cost |
(20,389 | ) | — | — | |||||||
| Amortization of prior service cost |
645 | 645 | 645 | ||||||||
| Amortization of transition (asset) or obligation |
(22,086 | ) | 8,764 | (2,587 | ) | ||||||
| Total recognized in NPPBC and OCI |
$ | (23,842 | ) | $ | 10,090 | $ | (807 | ) | |||
Plan Assets
The Company established a Voluntary Employees Benefit Association (“VEBA”) to hold the assets that will be used to pay the benefits for participants of the plan other than key executive officers. The majority of the plan assets have been invested in insurance policies on the lives of current and former employees of the Company. In turn, the premiums paid on these policies in excess of the mortality costs of the insurance and the administrative costs are invested in mutual funds. This investment practice is followed in order to accumulate assets that earn a nontaxable return because the mutual funds are “wrapped” in the insurance policies. The Internal Revenue Code (“IRC”) prohibits funding of the obligation related to key employees.
The VEBA assets are comprised of three sets of life insurance policies which are invested in mutual funds. At December 31, 2009, the life insurance policies were with Pacific Life, Nationwide Life, and Great West insurance. Premiums paid in excess of the mortality cost of each life insurance policy is invested by the Company’s trustee in various mutual funds. The mutual funds are held as underlying investment assets of the Pacific Life, Nationwide Life, and Great West insurance policy contracts. The Plan does not invest in the mutual funds directly, and therefore, the fair values of the underlying mutual funds are not presented in these consolidated financial statements and are used only as part of the underlying basis for the current value of the contracts.
150
Table of Contents
The following table summarizes the VEBA plan assets within the fair value hierarchy in accordance with the fair value disclosure requirements as disclosed in Note 23, “Fair Value of Financial Instruments” of these Consolidated Financial Statements.
| As of December 31, 2009 |
Quoted prices in active markets for identical assets (Level 1) |
Active markets for similar assets (Level 2) |
Unobservable inputs (Level 3) |
% of Total |
|||||||||||
| (in thousands) | |||||||||||||||
| Equity securities - mutual funds |
$ | 14,328 | $ | — | $ | 14,328 | $ | — | 100 | % | |||||
| Money market funds |
— | — | — | — | 0 | % | |||||||||
| Total VEBA assets at fair value |
$ | 14,328 | $ | — | $ | 14,328 | $ | — | 100 | % | |||||
| As of December 31, 2008 |
Quoted prices in active markets for identical assets (Level 1) |
Active markets for similar assets (Level 2) |
Unobservable inputs (Level 3) |
% of Total |
|||||||||||
| (in thousands) | |||||||||||||||
| Equity securities mutual funds |
$ | 9,611 | $ | — | $ | 9,611 | $ | — | 95 | % | |||||
| Money market funds |
504 | 504 | — | — | 5 | % | |||||||||
| Total VEBA assets at fair value |
$ | 10,115 | $ | 504 | $ | 9,611 | $ | — | 100 | % | |||||
| As of December 31, 2007 |
Quoted prices in active markets for identical assets (Level 1) |
Active markets for similar assets (Level 2) |
Unobservable inputs (Level 3) |
% of Total |
|||||||||||
| (in thousands) | |||||||||||||||
| Equity securities mutual funds |
$ | 14,128 | $ | — | $ | 14,128 | $ | — | 99 | % | |||||
| Money market funds |
110 | 110 | — | — | 1 | % | |||||||||
| Total VEBA assets at fair value |
$ | 14,238 | $ | 110 | $ | 14,128 | $ | — | 100 | % | |||||
The equity securities in mutual funds are valued using observable market prices for similar assets, also referred to as Level 2 within the fair value hierarchy. The money market funds are valued using observable quoted prices or Level 1 within the fair value hierarchy. The target allocation percentage of the plan assets for 2009 was 100% in mutual funds.
Funded Status
The funded status of the plan is shown in the first table in this note as the amount by which the plan assets are more or less than the APBO. At December 31, 2009 the total overfunded asset was $11.1 million.
151
Table of Contents
Employers are allowed discretion as to whether and how they set aside funds to meet the funding obligation. Because the VEBA may not be used to pay retiree benefits to key employees, the portion of the APBO related to them is always unfunded. With respect to non-key employees, if the assets of the VEBA are more than the APBO related to employees of the Company not defined as key employees, the VEBA is overfunded. If the assets of the VEBA are less than the APBO related to employees of the Company not defined as key employees, the VEBA is underfunded.
While GAAP requires that an estimate of increases in the rate of future health care costs to be used in computing the amount of APBO and this impacts the funded status of such plans, the IRC does not permit the Company to deduct for taxes the portion of the NPPBC for non-key employees that relates to assumed increases in the rate of future health care costs. Therefore, as long as future health care costs are projected to increase, the Company may deduct only a portion of the contribution necessary to fully fund the non-key employee obligation and consequently elected to contribute not more than the portion that is deductible.
Cash Flows
In 2009 and past years, the Company also contributed assets to pay the costs of the life insurance premiums and to provide additional earning assets for the VEBA to reduce any underfunded condition. Generally, these additional contributions did not exceed the amount that could be deducted in the Company’s current income tax return. Proceeds from the life insurance policy payoffs were expected to fund benefits and premiums in the future. Such proceeds are included in the assumed 6.50% rate of return on the assets of the plan. During 2009, 2008 and 2007 contributions of $1.5 million, $2.0 million and $411,000, respectively were made. If the Company’s Retirement Committee has made a formal decision on the contribution to be made for the year prior to year-end, the contribution would also be recognized as a receivable in the plan assets of the VEBA.
The estimated future health benefits are as follows:
| Health Benefits | |||
| (in thousands) | |||
| 2010 |
$ | 543 | |
| 2011 |
527 | ||
| 2012 |
515 | ||
| 2013 |
452 | ||
| 2014 |
402 | ||
| Years 2015-2019 |
1,025 | ||
152
Table of Contents
| 16. | INCOME TAXES |
The components of income tax expense (benefit) for the years ended December 2009, 2008 and 2007 were as follows:
| Year Ended December 31, | ||||||||||||
| 2009 | 2008 | 2007 | ||||||||||
| (in thousands) | ||||||||||||
| Federal: |
||||||||||||
| Current |
$ | (53,556 | ) | $ | 21,625 | $ | 33,472 | |||||
| Deferred |
44,671 | (37,076 | ) | 6,834 | ||||||||
| Total Federal |
(8,885 | ) | (15,451 | ) | 40,306 | |||||||
| State: |
||||||||||||
| Current |
(2,514 | ) | 10,023 | 13,878 | ||||||||
| Deferred |
18,236 | (13,142 | ) | 2,001 | ||||||||
| Total State |
15,722 | (3,119 | ) | 15,879 | ||||||||
| Total tax provision/(benefit) |
$ | 6,837 | $ | (18,570 | ) | $ | 56,185 | |||||
| Reduction in taxes payable associated with exercises of stock options |
$ | — | $ | (52 | ) | $ | (1,837 | ) | ||||
| Tax credits included in the computation of the tax provision |
$ | (6,014 | ) | $ | (6,200 | ) | $ | (3,294 | ) | |||
The reconciliation of the federal statutory income tax rate to the Company’s effective income tax rate for the years ended December 31, 2009, 2008 and 2007 was as follows:
| Year Ended December 31, | |||||||||
| 2009 | 2008 | 2007 | |||||||
| Federal income tax at statutory rate |
35.0 | % | 35.0 | % | 35.0 | % | |||
| Valuation allowance |
(35.2 | ) | — | — | |||||
| Goodwill impairment |
(10.0 | ) | (18.7 | ) | — | ||||
| Tax-exempt income |
1.3 | 11.7 | (2.4 | ) | |||||
| State taxes, net |
5.1 | 5.1 | 6.7 | ||||||
| Tax credits |
1.5 | 14.6 | (2.1 | ) | |||||
| Other, net |
0.7 | (2.8 | ) | (1.4 | ) | ||||
| Effective tax rate |
(1.6 | )% | 44.9 | % | 35.8 | % | |||
153
Table of Contents
Significant components of the Company’s net deferred tax asset and liability at December 31, 2009 and 2008 are presented in the following table.
| December 31, | ||||||||
| 2009 | 2008 | |||||||
| (in thousands) | ||||||||
| Deferred tax assets: |
||||||||
| Allowance for loan losses |
$ | 124,348 | $ | 68,266 | ||||
| State net operating loss carryforward |
15,603 | — | ||||||
| Low income housing partnership credits |
10,835 | — | ||||||
| Non-accrual loan interest |
7,756 | 5,627 | ||||||
| Goodwill and intangible amortization |
6,247 | 1,370 | ||||||
| Restricted stock compensation |
4,250 | 4,239 | ||||||
| Alternative minimum tax (“AMT”) credits |
3,573 | — | ||||||
| Other |
25,345 | 19,339 | ||||||
| Total deferred tax assets |
197,957 | 98,841 | ||||||
| Deferred tax liabilities: |
||||||||
| FHLB stock |
6,946 | 6,946 | ||||||
| Loan costs |
4,338 | 4,301 | ||||||
| State taxes |
18,186 | 2,572 | ||||||
| Other |
8,123 | 7,639 | ||||||
| Total deferred tax liabilities |
37,593 | 21,458 | ||||||
| Net deferred tax asset before unrealized gains on securities, postretirement obligation & valuation allowance |
160,364 | 77,383 | ||||||
| Postretirement obligation |
(4,816 | ) | 4,471 | |||||
| Unrealized gains on AFS securities |
(7,666 | ) | (11,220 | ) | ||||
| Net deferred tax asset before valuation allowance |
147,882 | 70,634 | ||||||
| Valuation allowance |
(145,888 | ) | — | |||||
| Net deferred tax asset |
$ | 1,994 | $ | 70,634 | ||||
The Company recognizes deferred tax assets and liabilities for the future tax consequences related to differences between the financial statement carrying amounts of existing assets and liabilities and their respective tax bases, and for tax credits. The deferred tax assets, net of valuation allowance, totaled $2.0 million and $70.6 million as of December 31, 2009 and 2008, respectively. Management evaluates the Company’s deferred tax assets for recoverability using a consistent approach which considers the relative impact of negative and positive evidence, including the Company’s historical profitability and projections of future taxable income. The Company is required to establish a valuation allowance for deferred tax assets and record a charge to income if Management determines, based on available evidence at the time the determination is made, that it is more likely than not that some portion or all of the deferred tax assets will not be realized.
For the three year period ended December 31, 2009, the Company is in a cumulative pretax loss position. For purposes of establishing a deferred tax valuation allowance, this cumulative pretax loss position is considered significant, objective evidence that the Company may not be able to realize some portion of the deferred tax assets in the future. The Company’s cumulative pretax loss position was caused by the negative impact resulting from the weak housing and credit market conditions, which deteriorated dramatically during 2009.
154
Table of Contents
During the second quarter of 2009, Management concluded that it was more likely than not that the Company would not generate sufficient future taxable income in the foreseeable future to realize all of the Company’s deferred tax assets. Management’s conclusion was based on the consideration of the relative weight of the available evidence, including the rapid deterioration of market conditions discussed above and the uncertainty of future market conditions on the Company’s results of operations. As a result, the Company has recorded a $145.9 million valuation allowance to the deferred tax asset for the portion of the future tax benefit that more likely than not will not be utilized in the future. The remaining deferred tax asset of $2.0 million represents the future tax benefit that is recoverable based on the Company’s ability to carry back its Federal taxable losses to the prior two tax years. Management continues to assess the impact of Company performance and the economic climate on the realizability of its net deferred tax asset on a quarterly basis.
As of December 31, 2009, the Company had $143.9 million of California net operating loss carryforwards that expire in 2029, $10.8 million of federal and California partnership tax credit carryforwards that expire in various years through 2029, and $3.6 million of alternative minimum tax credit carryforwards that have an indefinite carryforward period.
The Company adopted the accounting guidance for Accounting for Uncertainty in Income Taxes on January 1, 2007. This guidance provides the accounting and disclosure for uncertainty in tax provisions and for the recognition and measurement related to the accounting for income taxes. At December 31, 2009, 2008 and 2007, Management concluded that there were no significant uncertain tax positions requiring recognition in the Company’s Consolidated Financial Statements. As a result, the Company did not recognize any adjustment in the liability for unrecognized tax benefits that impacted the beginning retained earnings.
The Company files income tax returns in the U.S. Federal jurisdiction and various state jurisdictions. In February 2009, the IRS completed an audit of the Company’s 2006 Federal tax return. The audit resulted in no change to the Company’s 2006 Federal tax liability. In 2008, the California Franchise Tax Board (“FTB”) commenced a limited audit of amended returns filed by the Company for the 2003 and 2004 tax years. The amended returns were filed to claim a deduction for enterprise zone loan interest not claimed on the original returns and the audit pertains only to the enterprise zone loan interest deductions. In addition, the FTB is auditing the enterprise zone loan interest deductions claimed on the Company’s original 2005 and 2006 California tax returns.
The Company does not believe that the FTB audit will result in changes to its California tax liability for the years under audit or that there will be any material changes in its unrecognized tax positions over the next 12 months. The Company remains open to audit by the IRS for the 2005, 2007 and 2008 tax years and by various state taxing authorities for 2005 – 2008 tax years.
The Company may from time to time be assessed interest or penalties by major tax jurisdictions, although any such assessments historically have been minimal and immaterial to financial results. In the event the Company has an assessment from a taxing authority, any resulting interest and penalties are recognized as a component of income tax expense.
The Company allocates tax expense between the parent company and its subsidiaries based on Federal banking law and regulation. The parent only statement of operations is presented in Note 27, “Pacific Capital Bancorp (Parent Company Only Financials),” of these Consolidated Financial Statements.
155
Table of Contents
| 17. | EMPLOYEE 401K AND STOCK OWNERSHIP PLANS |
The Company’s profit-sharing plan has two components. The Salary Savings Plan component is authorized under Section 401(k) of the Internal Revenue Code. An employee may defer up to 80% of pre-tax salary in the plan up to a maximum dollar amount set each year by the Internal Revenue Service. The Company matches 100% of the first 3% of the employee’s compensation that the employee elects to defer and 50% of the next 3%, but not more than 4.5% of the employee’s total compensation. In 2009, 2008, and 2007, the employer’s matching contributions were $2.5 million, $2.7 million and $2.5 million, respectively. The other component is the Incentive & Investment Plan (“I&I Plan”), which permits contributions by the Company to be invested in various mutual funds chosen by the employees. The Company made no contributions to this plan during 2009, 2008 and 2007.
In January 2010, the Company announced the suspension of the 401(k) match described above beginning on March 1, 2010.
The Company’s Employee Stock Ownership Plan (“ESOP”) was initiated in January 1985. The ESOP is a plan whereby the Company may make annual, discretionary contributions for the benefit of eligible employees. Substantially all of the contributions are invested in the Company’s common stock. Total contributions by the Company to the ESOP plan were $2,000, $197,000 and $0 for the years ended December 31, 2009, 2008 and 2007, respectively. As of December 31, 2009, the ESOP held 1,176,480 shares with an ending value of $1.3 million and vested amount of $1.2 million.
Total contributions made by the Company to the Retiree Health Plan as discussed in Note 15, “Postretirement Benefits,” of these Consolidated Financial Statements were $1.5 million, $2.0 million and $411,000 for 2009, 2008, and 2007, respectively.
The administrative expenses of these plans are paid by the Company.
| 18. | COMMITMENTS AND CONTINGENCIES |
Contractual Lease Obligations
The contractual obligations for leases are disclosed in Note 9, “Premises and Equipment” of these Consolidated Financial Statements.
Contractual Commitments for Unfunded Loans and Letter of Credits
For a summary and more information on the contractual commitments for unfunded loan commitments and letters of credit as of December 31, 2009, refer to Note 5, “Loans” of these financial statements.
Legal
| 1. | On September 4, 2009, an alleged shareholder of the Company filed a purported shareholder action in federal district court in Los Angeles, against the Company and all of its directors, captioned Laurence Paskowitz SEP IRA v. Pacific Capital Bancorp, et al. (United States District Court, Central District of California, Case No. CV 09-6449-ODW). The complaint alleged that the Company’s August 31, 2009 Proxy Statement, with respect to the proposal for shareholder authorization of a reverse stock split, contained certain allegedly false and misleading statements and omissions regarding certain alleged risks of the reverse stock split. The complaint asserted claims for injunctive and declaratory relief based on alleged proxy violations under the federal securities laws (Section 14(a) of the Securities Exchange Act and Rule 14a-9 there under) and under unspecified California law. The complaint also asserted a purported class action claim, on behalf of a putative class of shareholders of the Company, for monetary damages based on alleged breach of an alleged fiduciary duty of full disclosure under California law. |
156
Table of Contents
On September 9, 2009, plaintiff filed an ex parte application seeking a temporary restraining order, as well as an expedited hearing on a preliminary injunction motion, to prevent the Company from conducting the planned shareholder vote on the reverse stock split proposal set for September 29, 2009. On September 11, 2009, the defendants filed an opposition to the ex parte application. On September 14, 2009 the Court denied plaintiff’s application in its entirety. The scheduled shareholder vote took place on September 29, 2009, and the reverse stock split proposal was approved.
On October 8, 2009, the defendants filed a motion to dismiss the complaint in its entirety with prejudice and without leave to amend. On October 19, 2009, plaintiff filed opposition papers, and on October 26, 2009, defendants filed reply papers. On November 6, 2009, the Court granted the Company’s motion to dismiss with leave to amend. The plaintiff declined to amend the complaint. On December 6, 2009, the Court ordered Judgment be entered dismissing the complaint with prejudice. On December 31, 2009, plaintiff filed a Notice of Appeal. The Company believes that the complaint and the claims asserted therein are without merit, and is vigorously defending itself in this matter.
| 2. | On September 8, 2009, the Company along with two of its officers were sued in a purported securities class action entitled William Jurkowitz v. Pacific Capital Bancorp, George Leis, David Porter, Sandler O’Neill & Partners LP and Sandler O’Neill Asset Management LLC, CV 09-06501 RGK (PLAx) in the United States District Court for the Central District of California. The complaint alleges violations of Sections 10(b) and 20(a) of the 1934 Exchange Act, as well as Rule 10b-5 promulgated thereunder, for a purported class period running from April 30, 2009 when the Company announced results for the first quarter of 2009, to July 30, 2009 when the Company announced results for the second quarter of 2009. The complaint alleges that the Company and the officer defendants made knowingly false statements of confidence regarding the adequacy of loan loss reserves taken in the first quarter of 2009, which plaintiffs contend were proven to be false when the Company announced second quarter results, which included an additional $117 million reserve. On October 30, 2009, the Company filed a motion to dismiss the Jurkowitz complaint. On January 28, 2010, the Court granted the Company’s motion to dismiss and denied the Plaintiff’s Motion for Appointment as Lead Counsel as moot. |
| 3. | The same plaintiff firms suing the Company and its officers in the Jurkowitz action subsequently filed a virtually identical lawsuit entitled Shotke v. Pacific Capital Bancorp, George Leis, David Porter, & Sandler O’Neill Partners LP, CV 09-7400 (MAN) in the same U.S. District court. On December 18, 2009, the Company filed a motion to dismiss on the same grounds as its motion to dismiss in the Jurkowitz case. On February 22, 2010, the Court granted the Company’s motion to dismiss. |
| 4. | On October 29, 2009, a shareholder derivative suit was file by James Clem on behalf of Pacific Capital Bancorp against CEO George Leis, Chief Financial Officer (“CFO”) Stephen Masterson, Chief Credit Officer (“CCO”) David Porter, all members of the Board of Directors of the Company and Sandler O’Neill Partners L.P. and against the Company as a nominal defendant. The lawsuit is entitled James Clem v. George S. Leis, et al. The complaint was filed in the Superior Court in Santa Barbara, Case No. CIVRS1340306. The complaint alleges breach of fiduciary duty, waste of corporate assets and unjust enrichment by the defendants. It includes allegations regarding misrepresentations concerning loan losses and allowance which are identical to those in the Jurkowitz case. The alleged damages are the costs which the Company will incur in settling or paying an adverse judgment in Jurkowitz. Essentially, for the plaintiff to prevail, the Company must have an adverse result in Jurkowitz/Shotke. |
On November 30, Marianne Monty filed a similar shareholder derivative suit against the same defendants except CCO David Porter who was not included. The lawsuit is entitled Marianne Monty v. George S. Leis, et al. This complaint was also filed in the Superior Court in Santa Barbara, Case No. CIVRS1340825. On January 5, 2010, the Court entered an order consolidating
157
Table of Contents
this case and the Clem case. On January 28, 2010, the Company filed a Motion to Stay the proceedings pending a final determination in the underlying federal court actions (Jurkowitz and Shotke). Pursuant to a stipulation of the parties, the Motion to Stay was taken off calendar by order of the Court pending the Court’s ruling on motions for lead plaintiffs’ counsel and lead plaintiff.
| 5. | The Company is involved in various lawsuits of a routine nature that are being handled and defended in the ordinary course of the Company’s business. Expenses are being incurred in connection with defending the Company, but in the opinion of Management, based in part on consultation with legal counsel, the resolution of these lawsuits will not have a material impact on the Company’s financial position, results of operations, or cash flows. |
| 19. | SHAREHOLDERS’ EQUITY |
Authorized Shares
On September 29, 2009, the Company held a special meeting of the shareholders at which the shareholders approved an amendment to the Company’s Articles of Incorporation to increase the number of authorized shares of common stock from 100,000,000 to 500,000,000.
Stock Issuance
In November 2008, the Company issued 180,634 shares of Series B preferred stock with no par value and per share stated value of $1,000 for total gross proceeds of $180.6 million. The Series B preferred stock was issued in conjunction with the TARP CPP. The Series B preferred stock has a cumulative dividend of 5% for the first five years and a 9% cumulative dividend, thereafter. The dividends are paid out of earnings and reduce the income available to common stockholders. Due to PCB’s agreement with the FRB, payments of the dividends for the preferred stock has been deferred as disclosed in Note 20, “Regulatory Capital Requirements” of these Consolidated Financial Statements. The Series B preferred stock is callable after February 15, 2012, qualifies as Tier 1 Capital and has no voting rights. The Series B preferred stock may not be redeemed by the Company prior to February 15, 2012 except with proceeds from the sale and issuance for cash of perpetual preferred stock, common stock or any combination of such securities that in each case, qualify as and may be included as Tier 1 Capital of the Company. On or after February 15, 2012, the Company may, at its option, redeem, in whole or in part from time to time. Any redemption of the Series B preferred stock will be at a redemption price equal to the liquidation preference per share plus any accrued dividends.
The Company also issued 1,512,003 of common stock warrants in conjunction with the Series B preferred stock issuance in November 2008. The warrants permit the U.S. Treasury to purchase the common stock at price of $17.92 a share at any time with certain restrictions over a ten year period. The common stock warrants were allocated a fair value of $4.7 million which is equal to 15.0% of the senior preferred shares value and recorded in shareholders’ equity as surplus. The fair value was determined using the binomial option pricing model by a third party. This amount is being accreted to the preferred stock over five years reducing retained earnings.
In 2005, the Company established a Dividend Reinvestment and Direct Stock Purchase Plan. The dividend reinvestment portion allows shareholders to have the Company’s transfer agent purchase new shares of stock on the open market with their dividends. The Company has not issued a dividend since March 31, 2009. Shareholders can, however, continue to participate in the direct stock purchase portion of this plan. The direct stock purchase plan allows the Company to sell shares directly to shareholders and others, as it deems advisable. Dividend reinvestment was minimal in 2009, 2008, and 2007. In October 2008, the Company issued 407,313 shares of common stock and received gross proceeds of $7.2 million. The shares issued in October 2008 were issued from the Direct Stock Purchase Plan to raise additional capital. There were no shares issued in 2009 and 2007 under the Direct Stock Purchase Plan.
158
Table of Contents
Stock Repurchases
During 2007, the Company commenced and completed the share repurchase program of $25.0 million authorized by the Company’s Board of Directors. There were 1,090,966 shares repurchased at an average share price of $22.86 per share. No shares were repurchased in 2009 or 2008.
The Company occasionally repurchases shares of its common stock to offset the increased number of shares issued as a result of the exercise of employee stock options and as part of its dividend reinvestment program. Share repurchases are generally conducted as open-market transactions. As part of its agreement with the FRB noted above, the Company is prohibited from repurchasing any shares of common stock.
Stock Plans
During 2008, the Company’s shareholders adopted the 2008 Equity Incentive Plan, which authorized 2,500,000 shares to be issued for stock compensation. The purpose of the plan is to attract, motivate, and retain employees, consultants, and directors of the Company, and to encourage stock ownership. This plan permits the granting of non-qualified stock options, incentive stock options, stock appreciation rights (“SARs”), restricted stock, and performance units. As of December 31, 2009, only non-qualified stock options, and restricted stock have been granted. Under this plan, non-qualified option grants vest and are exercisable in cumulative 20% installments on each annual anniversary date. Restricted stock awards granted in 2009 under this plan vest over a four year period in 25% annual increments on the grant anniversary date. As a result of the Company’s participation in the TARP CPP, the Company is subject to restrictions on vesting schedules that apply to restricted stock grants made after February 11, 2009, to the five most highly compensated executives. The restricted stock awards that are subject to the TARP CPP restrictions require a minimum of a two year holding period prior to any vesting of shares. Thus, these restricted stock awards may vest 50% in 2011, 25% in 2012, and 25% in 2013. The restricted stock granted to outside directors vest 100% on the first grant date anniversary. Upon adoption of this 2008 Equity Incentive Plan, 605,000 shares from the 2002 Stock Plan and 122,000 shares from the 2005 Directors Stock Plan were carried over into the 2008 Equity Incentive Plan. Of the original authorized shares, 2,259,663 remain for future awards as of December 31, 2009.
No further grants will be made under the 2002 Stock Plan or the 2005 Directors Stock Plan, but shares may continue to be issued under such plans as option holders exercise pursuant to grants previously made. Effective October 22, 2007, all non-qualified stock options that were granted under the 2002 stock plan vest and are exercisable in cumulative 20% installments on each annual anniversary date. Prior to October 22, 2007, non-qualified stock options vest in cumulative 20% installments within the six months after the grant date and then 20% on each grant date anniversary thereafter. In April 2005, the Company began issuing restricted stock under the 2002 Stock Plan. For the period of April 2005 to October 21, 2007, restricted stock granted to employees vests in annual increments of 5%, 10%, 15%, 30% and 40%. Beginning October 22, 2007, restricted stock grants to employees’ vests in equal annual increments over three years. Under the 2005 Directors Stock Plan, the restricted stock granted to outside directors vests at the end of one year.
All awards granted under these plans were granted with an exercise price set at 100% of the market value of the Company’s common stock on the date of the grant.
159
Table of Contents
Non-Qualified Stock Options
The table below summarizes the assumptions used in calculating the fair value of the non-qualified stock options granted over the last three years.
| For the Year Ended December 31, | |||||||||
| 2009 | 2008 | 2007 | |||||||
| Expected volatility |
52%-70 | % | 35 | % | 30 | % | |||
| Weighted-average volatility |
59 | % | 35 | % | 30 | % | |||
| Expected dividend yield |
0.0% - 5.0 | % | 3.4% - 4.8 | % | 2.8% - 3.3 | % | |||
| Expected term (in years) |
6.8 | 6.7 | 5.7 | ||||||
| Risk-free rate |
2.2% -3.3 | % | 2.1% -3.8 | % | 3.7% -5.1 | % | |||
The fair values of the Company’s employee stock options are estimated at the date of grant using a binomial option-pricing model. This model requires the input of highly subjective assumptions, changes to which can materially affect the fair value estimate. Additionally, there may be other factors, which would otherwise have a significant effect on the fair value of employee stock options granted, but may not be considered by the model. Accordingly, while Management believes that this option-pricing model provides a reasonable estimate of fair value, this model may not necessarily provide the best single measure of fair value for the Company’s employee stock options. Expected volatilities are based on historical volatility of the Company’s stock and other factors. The Company uses historical data to estimate option exercise and employee termination within the valuation model. The expected term of options granted is derived from the output of the option valuation model and represents the period of time that options granted are expected to be outstanding.
A summary of non-qualified stock option activity for the year ended December 31, 2009 is presented below:
| Options | Weighted Average Exercise Price |
Weighted Average Remaining Contractual Term |
Aggregate Intrinsic Value | ||||||||
| (in years) | (in thousands) | ||||||||||
| Outstanding shares at January 1, 2009 |
1,415,470 | $ | 25.32 | ||||||||
| Granted |
24,750 | $ | 6.07 | ||||||||
| Exercised |
— | $ | — | ||||||||
| Cancelled and expired |
(271,396 | ) | $ | 25.72 | |||||||
| Outstanding shares at December 31, 2009 |
1,168,824 | $ | 24.82 | 5.3 | $ | — | |||||
| Vested or expected to vest at December 31, 2009 |
1,164,618 | $ | 24.72 | 5.2 | $ | — | |||||
| Exercisable at December 31, 2009 |
836,136 | $ | 25.89 | 4.3 | $ | — | |||||
Non-qualified stock option compensation expense is recognized over the vesting period in accordance with ASC topic for Share Based Payments. For the year ending December 31, 2009, 2008 and 2007 non-qualified stock option expense was $867,000, $1.3 million and $1.9 million, respectively.
Total tax benefit recognized from stock option expense was $559,000 and $789,000 for the years ending December 31, 2008 and 2007, respectively. During 2009, there was not any tax benefit from stock option expense. At December 31, 2009, there was $1.5 million of total unrecognized compensation cost related to non-vested stock options. That cost is expected to be recognized over a weighted-average period of 1.4 years.
160
Table of Contents
The weighted-average grant-date fair value of options granted during the years 2009, 2008, and 2007 was $2.73, $5.88 and $7.48, respectively. The total intrinsic value of options exercised during the years ended December 31, 2008 and 2007 was $123,000 and $4.4 million, respectively. During 2009, there were no stock options exercised.
Cash received from option exercises under all plans for the years ended December 31, 2008 and 2007 was $283,000 and $4.4 million, respectively. The tax benefit realized from option exercises totaled $52,000 and $1.8 million, respectively, for the years ended December 31, 2008 and 2007, respectively. During 2009, there was no cash received from option exercises and, therefore there was not any tax benefit realized from the exercising of options.
Restricted Stock Awards
Compensation expense for restricted stock is measured based on the closing price of the stock on the day of the grant. The compensation expense is recognized over the vesting period. The weighted-average grant-date fair value of restricted stock granted during the years of 2009, 2008, and 2007 was $7.84, $21.25 and $31.54, respectively. The total value of shares vested during the year ended December 31, 2009, 2008 and 2007 was $3.7 million, $2.0 million and $1.7 million, respectively.
A summary of the activity of restricted stock for the year ended December 31, 2009 is presented below:
| Shares | Weighted Average Grant Date Fair Value | |||||
| Nonvested shares at January 1, 2008 |
423,505 | $ | 30.35 | |||
| Granted |
190,016 | $ | 7.84 | |||
| Vested |
(136,133 | ) | $ | 27.16 | ||
| Forfeited |
(57,044 | ) | $ | 23.17 | ||
| Nonvested shares at December 31, 2009 |
420,344 | $ | 22.18 | |||
The compensation expense recognized for restricted stock awards was $3.0 million, $2.9 million and $4.2 million for the years ending December 2009, 2008, and 2007, respectively. The total tax benefit recognized for restricted stock awards was $1.2 million and $1.7 million for the years ending December 31, 2008 and 2007, respectively. During 2009, there was not any tax benefit recognized for restricted stock awards. At December 31, 2009, there was $4.0 million of unrecognized compensation expense for unvested restricted stock with an expected weighted-average period of 1.0 years to be recognized.
| 20. | REGULATORY CAPITAL REQUIREMENTS |
PCB and PCBNA each entered into a memorandum of understanding (“MOU”) with its respective principal banking regulators during the second quarter of 2009. A memorandum of understanding is characterized by regulatory authorities as an informal action that is not published or publicly available and that is used when circumstances warrant a milder form of action than a formal supervisory action, such as a formal written agreement or order.
In the memorandum entered into with the OCC on April 16, 2009 (the “OCC Memorandum”) PCBNA agreed to develop and implement an updated three-year strategic plan with goals and plans to maintain adequate capital and ensure sustained earnings, and enhance written programs designed to (i) manage the risk in its commercial real estate and residential real estate loan portfolios, (ii) reduce its classified assets, (iii) strengthen its collection efforts relating to delinquent residential real estate loans,
161
Table of Contents
(iv) ensure that it recognizes loss relating to delinquent residential real estate loans in a timely manner, and (v) ensure that the risk associated with its commercial loan portfolio is properly reflected and accounted for in its books and records. PCBNA agreed to provide notice and obtain the non-objection of the OCC prior to declaring dividends to PCB and prior to making certain changes to its directors or senior executive officers. In addition, PCBNA agreed to maintain a minimum Tier 1 leverage ratio of 9.0% and a minimum total risk based capital ratio of 12.0%. The Board of Directors of PCBNA has established a compliance committee comprised entirely of non-management directors and retained a consulting firm to assist with PCBNA’s compliance with the provisions of the OCC Memorandum. As of December 31, 2009, PCBNA was not permitted to pay dividends to PCB. This limitation is due to the OCC Memorandum and legal limitations on the amount of dividends which may be paid by PCBNA to PCB that are determined based on the Bank’s capital and earnings.
At December 31, 2009, PCBNA had a Tier 1 leverage ratio of 5.5% and total risk based capital ratio of 10.7%. While these ratios exceed the minimum ratios required to be classified as “well capitalized” under generally applicable regulatory guidelines, they were not sufficient to meet the higher level that PCBNA agreed to maintain under its agreement with the OCC. As a result, PCBNA may be subject to further supervisory action, which could have a material adverse effect on its results of operations, financial condition and business.
PCB entered into a memorandum of understanding with the FRB on May 18, 2009 (the “FRB Memorandum”). Under the FRB Memorandum, PCB agreed to develop and implement written plans designed to strengthen board oversight of the management and operations of PCBNA, maintain sufficient capital at PCB and PCBNA and service PCB’s obligations without incurring additional debt. PCB also agreed to provide notice and obtain the prior approval of the FRB prior to (i) receiving dividends from PCBNA, (ii) declaring or paying any dividends to its shareholders, (iii) incurring, renewing, increasing or guaranteeing any debt or purchasing, redeeming or otherwise acquiring any of its capital stock, (iv) making any payments on its trust preferred securities, and (v) making certain changes to its directors or senior executive officers. Since entering in the FRB Memorandum, PCB has not made any interest payments on its trust preferred securities or dividend payments on either its preferred stock or its common stock. However, it has been accruing for the interest payments and for the dividends for the preferred stock. At December 31, 2009, PCB has accrued but not paid $1.6 million of interest expense for the trust preferred securities and $8.1 million of preferred stock dividends.
The Company’s and PCBNA capital ratios as of December 31, 2009 and 2008 were as follows:
| Total Capital |
Tier 1 Capital |
Risk- Weighted Assets |
Tangible Average Assets |
Total Capital Ratio |
Tier 1 Capital Ratio |
Tier 1 Leverage Ratio |
|||||||||||||||
| (dollars in thousands) | |||||||||||||||||||||
| December 31, 2009 |
|||||||||||||||||||||
| PCB (consolidated) |
$ | 549,363 | $ | 412,372 | $ | 5,282,952 | $ | 7,716,187 | 10.4 | % | 7.8 | % | 5.3 | % | |||||||
| PCBNA |
561,674 | 425,032 | 5,254,687 | 7,720,560 | 10.7 | % | 8.1 | % | 5.5 | % | |||||||||||
| December 31, 2008 |
|||||||||||||||||||||
| PCB (consolidated) |
$ | 880,523 | $ | 712,003 | $ | 6,016,764 | $ | 8,107,248 | 14.6 | % | 11.8 | % | 8.8 | % | |||||||
| PCBNA |
863,613 | 695,237 | 6,005,146 | 8,098,895 | 14.4 | % | 11.6 | % | 8.6 | % | |||||||||||
| Minimum Capital Ratios required by the OCC |
12.0 | % | N/A | 9.0 | % | ||||||||||||||||
| Well-capitalized ratios |
10.0 | % | 6.0 | % | 5.0 | % | |||||||||||||||
| Adequately capitalized ratios |
8.0 | % | 4.0 | % | 4.0 | % | |||||||||||||||
162
Table of Contents
Risk-weighted assets are computed by applying a weighting factor from 0% to 100% to the carrying amount of the assets as reported in the balance sheet and to a portion of off-balance sheet items such as loan commitments and letters of credit. The definitions and weighting factors are all contained in the regulations. However, the capital amounts and classifications are also subject to qualitative judgments by the regulators about components, risk weightings, and other factors.
The minimum ratios that must be maintained under the regulatory requirements to meet the standard of “adequately capitalized” and the minimum ratios required to meet the regulatory standards of “well capitalized” are presented above. Although PCB and PCBNA met the minimum capital ratios required to be “well capitalized”, PCBNA did not meet the elevated capital requirements agreed to in the OCC Memorandum discussed above at December 31, 2009.
The Company must raise additional capital to meet the higher minimum capital levels that PCBNA is obligated to maintain under its agreement with the OCC. In addition, should the Company’s current rate of operating losses continue or should the Company’s asset quality erode and require significant additional provision for credit losses, resulting in additional net operating losses, the Company’s capital levels will decline further and it will need to raise more capital to satisfy its regulatory capital requirements. The Company’s ability to raise additional capital depends on conditions in the capital markets, which are outside the Company’s control, and on the Company’s financial performance. Accordingly, the Company cannot be certain of its ability to raise additional capital on acceptable terms, or at all. If the Company cannot raise additional capital, its results of operations and financial condition could be materially and adversely affected, and it may be subject to further supervisory action. In addition, if the Company were to raise additional capital through the issuance of additional shares, its stock price could be adversely affected, depending on the terms of any shares it were to issue.
| 21. | NON-INTEREST EXPENSE |
Other expense
The table below discloses the largest items included in other non-interest expense.
| Year Ended December 31, | ||||||||||
| 2009 | 2008 | 2007 | ||||||||
| (in thousands) | ||||||||||
| Other Expense: |
||||||||||
| Regulatory assessments |
$ | 18,988 | $ | 4,282 | $ | 1,470 | ||||
| Software expense |
15,699 | 18,332 | 15,270 | |||||||
| Loan expenses, net |
14,675 | 5,541 | 3,885 | |||||||
| Consulting and professional services |
13,905 | 8,822 | 9,740 | |||||||
| Customer deposit service and support |
9,500 | 7,775 | 6,491 | |||||||
| LIHTCP impairment |
8,876 | — | — | |||||||
| Reserve for off balance sheet commitments |
8,245 | 6,907 | (341 | ) | ||||||
| Furniture, fixtures, and equipment, net |
7,928 | 8,853 | 9,551 | |||||||
| Print forms and supplies |
7,379 | 7,474 | 6,539 | |||||||
| Legal, accounting, and audit |
7,305 | 5,981 | 4,342 | |||||||
| Telephone and data |
6,341 | 6,570 | 6,337 | |||||||
| Other expense |
23,402 | 26,273 | 16,238 | |||||||
| Total |
$ | 142,243 | $ | 106,810 | $ | 79,522 | ||||
163
Table of Contents
For an explanation for the changes in non-interest expense for the year ended December 31, 2009 compared to prior years, refer to the non-interest expense section on page 46 of the MD&A of this form 10-K.
| 22. | DERIVATIVE INSTRUMENTS |
The Company has entered into interest rate swap agreements with customers to assist them in mitigating their interest rate risk exposure associated with the loans they have with the Company. At the same time, the Company entered into offsetting interest rate swap agreements with other financial institutions to mitigate the Company’s interest rate risk exposure associated with the swap agreements with its customers. At December 31, 2009, the Company had swaps with matched terms with an aggregate notional amount of $180.1 million and a fair value of $10.8 million. The fair values of these swaps are recorded as other assets and other liabilities in the Company’s balance sheet. Changes in the fair value of these swaps are recorded in the Company’s statement of operations. For the year ended December 31, 2009 and 2008, the Company recorded a credit risk adjustment of $1.3 million and $92,000, respectively in non-interest expense in its statement of operations. Swap agreements with customers are secured by the collateral arrangements for the underlying loans these customers have with the Company. During the second quarter of 2008, a customer defaulted on their monthly swap payments to the Company. This caused the Company to have a swap agreement with another financial institution with a notional amount of $6.9 million that was no longer matched with a corresponding swap with the customer. This unmatched swap agreement with the other institution was terminated in June 2009 at an expense of $1.1 million. At December 31, 2009, all swaps reported were matched.
During the third quarter of 2008, the Company entered into $50.0 million of U.S. Treasury futures contracts in order to economically hedge the exposure to changes in value of the MBS held in the AFS portfolio which were considered impaired until April 2009. Once the MBS AFS securities were no longer considered impaired, the future contracts were not renewed when they matured on March 20, 2009. The futures contracts required daily settlement based on their fair value. The Company accounted for these futures as trading assets or liabilities with all changes in fair value recorded in net gains (losses) on securities in the statement of operations. For the year ended December 31, 2009 and 2008, the Company recognized $402,000 and $4.9 million, respectively in losses associated with the futures contracts.
| 23. | FAIR VALUE OF FINANCIAL INSTRUMENTS |
The Company uses fair value measurements to record fair value adjustments to certain assets and liabilities. AFS and trading securities are recorded at fair value on a recurring basis. Additionally, the Company may be required to record other assets and liabilities at fair value on a non-recurring basis. These non-recurring fair value adjustments involve the lower of cost or market accounting and write downs resulting from impairment of assets. For these purposes, fair value is defined as the amount at which an asset (or liability) could be bought (or incurred) or sold (or settled) in a current transaction between willing parties, that is, other than in a forced or liquidation sale.
164
Table of Contents
The Company has adopted the fair value measurement and disclosure requirements as required by GAAP effective January 1, 2008. This accounting standard defines fair value, establishes a framework for measuring fair value, establishes a three-level valuation hierarchy for disclosure of fair value measurement and enhances disclosure requirements for fair value measurements. The valuation hierarchy is based upon the transparency of inputs to the valuation of an asset or liability as of the measurement date. The three levels are defined as follows:
| Level 1: |
Observable quoted prices in active markets for identical assets and liabilities. | |
| Level 2: |
Observable quoted prices for similar assets and liabilities in active markets, quoted prices for identical or similar instruments in markets that are not active, and model-based valuation techniques for which all significant assumptions are observable in the market. | |
| Level 3: |
Model-based techniques that use at least one significant assumption not observable in the market. These unobservable assumptions reflect estimates of assumptions that market participants would use in pricing the asset or liability. Valuation techniques include use of option pricing models, discounted cash flow models and similar techniques. | |
The following methods and assumptions were used to estimate the fair value of each class of financial instruments and servicing rights that are recognized at fair value on a recurring and non-recurring basis:
Securities
AFS and trading securities are recorded at fair value on a recurring basis. Where quoted prices are available in an active market for identical assets, securities are classified within level 1 of the valuation hierarchy. Such quoted prices are available for the Company’s U.S. Treasury securities. Most of the remainder of the Company’s securities are quoted using observable market information for similar assets which requires the Company to report and use level 2 pricing for them. When observable market information is not available for securities where there is limited activity or less transparency around inputs, such securities would be classified within level 3 of the valuation hierarchy. The Company does not have any securities within the level 3 hierarchy.
Impaired Loans
Impaired loans consist of loans which are secured by collateral and unsecured loans. Collateralized loans are further segregated into impaired loans with current market valuations and other valuation techniques which are excluded by the GAAP fair value measurement and disclosure requirements. The impaired loans in the tables below are loans that are collateralized and that have current market valuations, such as current appraisals.
The Company records certain loans at fair value on a non-recurring basis. When a loan is considered impaired, an allowance for a loan loss is established. The fair value measurement and disclosure requirement applies to loans measured for impairment using the practical expedients method permitted by accounting guidance for impaired loans. Impaired loans are measured at an observable market price, if available or at the fair value of the loans collateral, if the loan is collateral dependent. The fair value of the loan’s collateral is determined by appraisals or independent valuation which is then adjusted for the cost related to liquidation of the collateral. When the fair value of the loan’s collateral is based on an observable market price or current appraised value, given the current real estate markets, the appraisals may contain a wide range of values and accordingly, the Company classifies the fair value of the impaired loans as a non-recurring valuation within level 2 of the valuation hierarchy. When the Company measures impairment using anything but an observable market price or a current appraised value, the fair value measurement is not in the scope of the fair value measurement and disclosure requirements and is not included in the tables below.
165
Table of Contents
Goodwill
Excess of consideration paid to acquire a business over the fair value of the net assets is recorded as goodwill. The Company historically tested goodwill for impairment during the third quarter of each year. During the third quarter of 2008, Management concluded that the Company’s Commercial Banking segment’s fair value of the reporting unit was less than the fair value of the underlying tangible and intangible assets and liabilities resulting in an impairment charge of $22.1 million. The goodwill impairment testing was performed by an independent third party.
Due to the economic climate during 2009, Management began reviewing goodwill for impairment each quarter over the last year. In the second quarter of 2009, Management concluded that the entire balance of goodwill at all reporting units was impaired and recorded a $128.7 million impairment charge, as discussed in Note 10, “Goodwill and Intangibles” of these Consolidated Financial Statements. This was due to the increasingly uncertain economic environment, significant continued decline in market capitalization, and continued elevated credit losses. The goodwill impairment calculation is an estimate using unobservable assumptions to measure the fair value. As such the Company uses primarily level 3 inputs in its fair value of goodwill.
Intangible Assets
The Company recorded intangible assets for identified customer deposit and relationship intangibles and other intangibles that were acquired with the acquisitions of PCCI, FBSLO, MCM and REWA. The value and estimated run-off of the intangibles are determined at the time of purchase based on a valuation prepared by a third party. Monthly amortization of intangibles are accounted for based on forecasted run-off of the customer deposit and relationship intangible using a discounted cash flow approach which is prepared at the time the intangibles are identified as of the date of purchase. These assets are analyzed quarterly to compare the amortization to the actual deposit and customer relationship run-off. If the actual run-off is more than the scheduled amortization a write-down of the intangible asset is recognized. As such, the Company records these assets at fair value and the adjustments are classified as non-recurring valuations within level 3 of the valuation hierarchy.
Servicing Rights
Servicing rights are carried at the lower of aggregate cost or estimated fair value. Servicing rights are subject to quarterly impairment testing. When the fair value of the servicing rights are lower than their carrying value, an impairment is recorded by establishing or increasing the amount of a valuation allowance so that the net carrying amount is equal to the fair value. The Company uses independent third parties to value the servicing rights. The valuation model takes into consideration discounted cash flows using current interest rates, and prepayment speeds for each type of the underlying asset being serviced. The Company classifies these servicing rights as non-recurring level 3 in the valuation hierarchy.
Derivatives
The Company’s swap derivatives are not listed on an exchange and are instead executed over the counter (“OTC”). As no quoted market prices exist for such instruments, the Company values these OTC derivatives primarily based on the broker pricing indications and in consideration of the risk of counterparty nonperformance. OTC interest rate swap key valuation inputs are observable interest rate and/or yield curves and do not require significant judgment, and accordingly, the swap values are classified within Level 2 of the fair value hierarchy.
Low Income Housing Tax Credit Partnerships
At December 31, 2009 and 2008, the Company had investments in LIHTCP of $43.7 million and $55.9 million, respectively. Given the increased uncertainty of the Company’s future taxable income and the
166
Table of Contents
Company’s ability to utilize the tax credits from the investments in LIHTCP, during the year ended December 31, 2009, Management evaluated the recoverability of these investments by obtaining fair value indications through LIHTCP asset managers at September 30, 2009 and December 31, 2009. At September 30, 2009, the carrying value had exceeded the fair value, and Management determined that these investments were other-than-temporarily impaired and recognized an impairment of $8.9 million. At December 31, 2009, no further impairment of these investments was recognized. The Company classifies the valuation of these investments in LIHTCP as a non-recurring level 2 in the fair value hierarchy.
Assets and liabilities measured at fair value on a recurring basis at December 31, 2009 and 2008 are summarized in the following table:
| As of December 31, 2009 |
Recurring Fair Value Measurements at Reporting | |||||||||||
| Quoted prices in active markets for identical assets (Level 1) |
Active markets for similar assets (Level 2) |
Unobservable inputs (Level 3) | ||||||||||
| (in thousands) | ||||||||||||
| Assets: |
||||||||||||
| Trading Securities: |
||||||||||||
| Mortgage-backed securities |
$ | 5,403 | $ | — | $ | 5,403 | $ | — | ||||
| Total trading securities |
5,403 | — | 5,403 | — | ||||||||
| Available-for-Sale: |
||||||||||||
| U.S. Treasury obligations |
11,432 | 11,432 | — | — | ||||||||
| U.S. Agency obligations |
607,930 | — | 607,930 | — | ||||||||
| Collateralized mortgage obligations |
113,934 | — | 113,934 | — | ||||||||
| Mortgage-backed securities |
169,058 | — | 169,058 | — | ||||||||
| Asset-backed securities |
1,271 | — | 1,271 | — | ||||||||
| State and municipal securities |
250,062 | — | 250,062 | — | ||||||||
| Total available for sale securities |
1,153,687 | 11,432 | 1,142,255 | — | ||||||||
| Fair value swap asset |
10,808 | — | 10,808 | — | ||||||||
| Fair value of futures contracts |
— | — | — | — | ||||||||
| Total assets at fair value |
$ | 1,169,898 | $ | 11,432 | $ | 1,158,466 | $ | — | ||||
| Liabilities: |
||||||||||||
| Fair value swap liability |
$ | 12,204 | $ | — | $ | 12,204 | $ | — | ||||
| Total liabilities at fair value |
$ | 12,204 | $ | — | $ | 12,204 | $ | — | ||||
167
Table of Contents
| As of December 31, 2008 |
Recurring Fair Value Measurements at Reporting | |||||||||||
| Quoted prices in active markets for identical assets (Level 1) |
Active markets for similar assets (Level 2) |
Unobservable inputs (Level 3) | ||||||||||
| (in thousands) | ||||||||||||
| Assets: |
||||||||||||
| Trading Securities: |
||||||||||||
| Mortgage-backed securities |
$ | 213,939 | $ | — | $ | 213,939 | $ | — | ||||
| Total trading securities |
213,939 | — | 213,939 | — | ||||||||
| Available-for-Sale: |
||||||||||||
| U.S. Treasury obligations |
37,475 | 37,475 | — | — | ||||||||
| U.S. Agency obligations |
600,130 | — | 600,130 | — | ||||||||
| Collateralized mortgage obligations |
17,092 | — | 17,092 | — | ||||||||
| Mortgage-backed securities |
212,256 | — | 212,256 | — | ||||||||
| Asset-backed securities |
1,034 | — | 1,034 | — | ||||||||
| State and municipal securities |
310,756 | — | 310,756 | — | ||||||||
| Total available for sale securities |
1,178,743 | 37,475 | 1,141,268 | — | ||||||||
| Fair value swap asset |
17,908 | — | 17,908 | — | ||||||||
| Fair value of futures contracts |
279 | 279 | — | — | ||||||||
| Total assets at fair value |
$ | 1,410,869 | $ | 37,754 | $ | 1,373,115 | $ | — | ||||
| Liabilities: |
||||||||||||
| Fair value swap liability |
$ | 19,693 | $ | — | $ | 19,693 | $ | — | ||||
| Total liabilities at fair value |
$ | 19,693 | $ | — | $ | 19,693 | $ | — | ||||
The Company may be required to measure certain assets and liabilities at fair value on a non-recurring basis in accordance with GAAP. These include assets and liabilities that are measured at the lower of cost or market that were recognized at fair value below cost at the end of the period.
Assets and liabilities measured at fair value on a non-recurring basis at December 31, 2009 and 2008 are summarized in the table below:
| Non-recurring Fair Value Measurements at Reporting | ||||||||||||
| As of December 31, 2009 |
Quoted prices in active markets for identical assets (Level 1) |
Active markets for similar assets (Level 2) |
Unobservable inputs (Level 3) | |||||||||
| (in thousands) | ||||||||||||
| Impaired loans |
$ | 92,551 | $ | — | $ | 92,551 | $ | — | ||||
| Investments in LIHTCP |
43,678 | — | 43,678 | — | ||||||||
| Intangible assets |
4,756 | — | — | 4,756 | ||||||||
| Servicing rights |
4,533 | — | — | 4,533 | ||||||||
| Total assets at fair value |
$ | 145,518 | $ | — | $ | 136,229 | $ | 9,289 | ||||
168
Table of Contents
| Non-recurring Fair Value Measurements at Reporting | ||||||||||||
| As of December 31, 2008 |
Quoted prices in active markets for identical assets (Level 1) |
Active markets for similar assets (Level 2) |
Unobservable inputs (Level 3) | |||||||||
| (in thousands) | ||||||||||||
| Goodwill |
$ | 128,710 | $ | — | $ | — | $ | 128,710 | ||||
| Impaired loans |
41,091 | — | 41,091 | — | ||||||||
| Intangible assets |
5,940 | — | — | 5,940 | ||||||||
| Servicing rights |
3,722 | — | — | 3,722 | ||||||||
| Total assets at fair value |
$ | 179,463 | $ | — | $ | 41,091 | $ | 138,372 | ||||
There were no liabilities measured at fair value on a non-recurring basis at December 31, 2009 and 2008. In addition, there were no transfers in or out of the Company’s level 3 financial assets and liabilities for the twelve month periods ended December 31, 2009 and 2008.
The financial instruments disclosed in this note include such items as securities, loans, deposits, debt, and other instruments. Disclosure of fair values is not required for certain items such as obligations for pension and other postretirement benefits, premises and equipment, other real estate owned, prepaid expenses, and income tax assets and liabilities. Accordingly, the aggregate fair value of amounts presented in this note does not purport to represent, and should not be considered representative of, the underlying “market” or franchise value of the Company. Further, due to a variety of alternative valuation techniques and approaches permitted by the fair value measurement accounting standards as well as significant assumptions that are required to be made in the process of valuation, actual results could and do differ between various market participants. A direct comparison of the Company’s fair value information with that of other financial institutions may not be appropriate.
The disclosure below provides the carrying value and fair value of the financial instruments which are not carried on the Company’s Consolidated Financial Statements at fair value or are carried at the lower of cost or market and not disclosed in the recurring or non-recurring fair value measurements in the tables above.
| December 31, 2009 | December 31, 2008 | |||||||||||
| Carrying Amount |
Fair Value | Carrying Amount |
Fair Value | |||||||||
| (in thousands) | ||||||||||||
| Assets: |
||||||||||||
| Cash and due from banks |
$ | 45,593 | $ | 45,593 | $ | 79,367 | $ | 79,367 | ||||
| Interest-bearing demand deposits in other financial institutions |
949,929 | 949,929 | 1,859,154 | 1,859,154 | ||||||||
| Loans held for sale |
19,211 | 19,822 | 11,137 | 11,576 | ||||||||
| Loans held for investment |
5,166,431 | 4,851,474 | 5,623,948 | 5,244,422 | ||||||||
| Liabilities: |
||||||||||||
| Deposits |
5,446,194 | 5,469,660 | 6,588,702 | 6,631,486 | ||||||||
| Long-term debt and other borrowings |
1,311,828 | 1,307,709 | 1,740,240 | 1,861,740 | ||||||||
| Repurchase agreements and federal funds purchased |
322,131 | 321,971 | 342,157 | 351,804 | ||||||||
169
Table of Contents
The following methods and assumptions were used to estimate the fair value of each class of financial instruments.
Cash and Due from Banks
The carrying values of cash and interest-bearing demand deposits in other financial institutions are the fair value.
Loans Held for Sale
Loans held for sale are carried at the lower of cost or market. The fair value of loans held for sale is based on what secondary markets are currently offering for portfolios with similar characteristics or based on the agreed upon sale price. As such, the Company classifies the fair value of loans held for sale as a non-recurring valuation within level 2 of the fair value hierarchy. At December 31, 2009 and December 31, 2008, the Company had loans held for sale with an aggregate carrying value of $19.2 million and $11.1 million, respectively.
Net Loans Held for Investment, net
The current pricing of the held for investment loans reflects a discount to their carrying value. The loans held for investment were adversely affected by a significant reduction in or lack of liquidity as well as unprecedented disruptions in the financial markets at December 2008. In the latter part of 2009, there has been a slight improvement in the financial markets’ liquidity and the fair values have improved. As a result, the fair values for these loans as disclosed is substantially less than what the Company believes is indicated by their performance and Management’s view of the expected cash flows.
Deposits
The fair value of demand deposits, money market accounts, and savings accounts is the amount payable on demand as of December 31 of each year. The fair value of fixed-maturity certificates of deposit is estimated by discounting the interest and principal payments using the rates currently offered for deposits of similar remaining maturities.
Long-term Debt and Other Borrowings
For FHLB advances, the fair value is estimated using rates currently quoted by the FHLB for advances of similar remaining maturities. For subordinated debt and trust preferred stock issued, the fair value is estimated by discounting the interest and principal payments using current market rates for comparable securities. For treasury tax and loan obligations, the carrying amount is a reasonable estimate of fair value.
Repurchase Agreements and Federal Funds Purchased
For Federal funds purchased the carrying amount is a reasonable estimate of their fair value. The fair value of repurchase agreements is determined by reference to rates in the wholesale repurchase market. The rates paid to the Company’s customers are slightly lower than rates in the wholesale market and, consequently, the fair value will generally be less than the carrying amount. The fair value of the long-term repurchase agreements is determined in the same manner as the long-term debt and other borrowings, above.
170
Table of Contents
| 24. | SEGMENTS |
In January 2009, the CEO presented his strategic vision for the Company to the Board of Directors and determined that the Commercial Banking and Wealth Management segments should be combined into one segment. The newly combined segment is called the CWMG. The new combined CWMG segment no longer offers SBA loans as these products are provided to small businesses and are offered through the Community Banking segment. The segment tables below are presented as if theses changes were in effect for the year ended December 31, 2009, 2008 and 2007 so, that the information presented is comparable.
With the above change, the Company has three operating lines of business for segment reporting purposes including Community Banking, Commercial and Wealth Management Group and RAL and RT Programs. The reported financial results for each respective business are based on Management assumptions, which allocate balance sheet and income statement items to each segment based on the type of customer and the types of products and services offered. If the Management structure and or allocation process changes, then allocations, transfers and assignments may change. A detailed description of each segment and the products, services, and customers from which revenues are derived are disclosed below the tables.
The following tables present information for each specific operating segment regarding assets, profit or loss, and specific items of revenue and expense that are included in the measure of segment profit or loss reviewed by the CEO. Included in the table is an “All Other” segment which includes the administrative support units, company (“Bancorp”), and balancing of the funding uses and sources activity that are not allocated to the three operating segments.
| Year Ended December 31, 2009 | ||||||||||||||||||||
| Operating Segments | All Other | Total | ||||||||||||||||||
| Community Banking |
Commercial and Wealth Management Group |
RAL and RT Programs |
||||||||||||||||||
| (in thousands) | ||||||||||||||||||||
| Interest income |
$ | 106,075 | $ | 196,980 | $ | 153,407 | $ | 49,054 | $ | 505,516 | ||||||||||
| Interest expense |
46,182 | 26,109 | 14,280 | 78,681 | 165,252 | |||||||||||||||
| Net interest income/ (loss) |
59,893 | 170,871 | 139,127 | (29,627 | ) | 340,264 | ||||||||||||||
| Provision for loan losses |
75,748 | 276,650 | 74,538 | — | 426,936 | |||||||||||||||
| Non-interest income |
24,871 | 27,182 | 70,904 | 12,167 | 135,124 | |||||||||||||||
| Non-interest expense |
85,743 | 143,293 | 76,665 | 157,175 | 462,876 | |||||||||||||||
| Direct (loss)/ income before tax |
(76,727 | ) | (221,890 | ) | 58,828 | (174,635 | ) | (414,424 | ) | |||||||||||
| Indirect (charge)/ credit for funds |
64,110 | (86,910 | ) | 4,103 | 18,697 | — | ||||||||||||||
| Non-interest expense allocation |
(56,426 | ) | (56,583 | ) | (21,376 | ) | 134,385 | — | ||||||||||||
| Net (loss)/ income before tax |
$ | (69,043 | ) | $ | (365,383 | ) | $ | 41,555 | $ | (21,553 | ) | $ | (414,424 | ) | ||||||
| Total assets |
$ | 2,720,573 | $ | 3,464,186 | $ | 360,382 | $ | 997,114 | $ | 7,542,255 | ||||||||||
171
Table of Contents
| Year Ended December 31, 2008 | ||||||||||||||||||||
| Operating Segments | All Other | Total | ||||||||||||||||||
| Community Banking |
Commercial and Wealth Management Group |
RAL and RT Programs |
||||||||||||||||||
| (in thousands) | ||||||||||||||||||||
| Interest income |
$ | 125,490 | $ | 223,936 | $ | 110,465 | $ | 59,442 | $ | 519,333 | ||||||||||
| Interest expense |
44,440 | 27,162 | 10,467 | 96,750 | 178,819 | |||||||||||||||
| Net interest income/ (loss) |
81,050 | 196,774 | 99,998 | (37,308 | ) | 340,514 | ||||||||||||||
| Provision for loan losses |
52,555 | 144,012 | 21,768 | — | 218,335 | |||||||||||||||
| Non-interest income |
24,142 | 33,080 | 116,407 | 2,317 | 175,946 | |||||||||||||||
| Non-interest expense |
46,050 | 68,049 | 85,310 | 140,036 | 339,445 | |||||||||||||||
| Direct (loss)/ income before tax |
6,587 | 17,793 | 109,327 | (175,027 | ) | (41,320 | ) | |||||||||||||
| Indirect (charge)/ credit for funds |
47,251 | (90,416 | ) | 8,702 | 34,463 | — | ||||||||||||||
| Non-interest expense allocation |
(43,271 | ) | (54,894 | ) | (24,646 | ) | 122,811 | — | ||||||||||||
| Net (loss)/ income before tax |
$ | 10,567 | $ | (127,517 | ) | $ | 93,383 | $ | (17,753 | ) | $ | (41,320 | ) | |||||||
| Total assets |
$ | 3,368,022 | $ | 4,191,590 | $ | 1,736,337 | $ | 277,071 | $ | 9,573,020 | ||||||||||
| Year Ended December 31, 2007 | ||||||||||||||||||||
| Operating Segments | All Other | Total | ||||||||||||||||||
| Community Banking |
Commercial and Wealth Management Group |
RAL and RT Programs |
||||||||||||||||||
| (in thousands) | ||||||||||||||||||||
| Interest income |
$ | 169,909 | $ | 243,460 | $ | 117,749 | $ | 52,491 | $ | 583,609 | ||||||||||
| Interest expense |
63,418 | 40,939 | 13,042 | 105,012 | 222,411 | |||||||||||||||
| Net interest income/ (loss) |
106,491 | 202,521 | 104,707 | (52,521 | ) | 361,198 | ||||||||||||||
| Provision for loan losses |
12,066 | 9,248 | 91,958 | — | 113,272 | |||||||||||||||
| Non-interest income |
51,448 | 33,106 | 94,607 | 5,346 | 184,507 | |||||||||||||||
| Non-interest expense |
46,557 | 34,733 | 70,025 | 124,045 | 275,360 | |||||||||||||||
| Direct (loss)/ income before tax |
99,316 | 191,646 | 37,331 | (171,220 | ) | 157,073 | ||||||||||||||
| Indirect (charge)/ credit for funds |
43,279 | (71,366 | ) | 8,909 | 19,178 | — | ||||||||||||||
| Non-interest expense allocation |
(38,330 | ) | (48,626 | ) | (21,832 | ) | 108,788 | — | ||||||||||||
| Net (loss)/ income before tax |
$ | 104,265 | $ | 71,654 | $ | 24,408 | $ | (43,254 | ) | $ | 157,073 | |||||||||
| Total assets |
$ | 3,173,749 | $ | 3,810,208 | $ | 197,584 | $ | 192,573 | $ | 7,374,114 | ||||||||||
Community Banking
This segment offers a complete line of banking and diversified financial products and services to consumers and small businesses. Loan products include lines of credit, equity lines and loans, automobile loans, residential mortgage origination, small business lending, SBA origination and debit card processing. In the third quarter of 2008, residential loans began to be originated for sale on a flow basis. In the second quarter of 2007, the Company sold the leasing loan portfolio and a majority of the indirect auto loans were sold as described in Note 6, “Loan Sales and Transactions” of these Consolidated Financial Statements. These portfolios were part of the Community Banking segment and the sale of these loan portfolios has impacted the Community Banking segments interest income.
172
Table of Contents
Deposit products include checking, savings, money market accounts, Individual Retirement Accounts (“IRAs”), time deposits/CDs and debit cards. Community Banking serves customers through traditional banking branches, loan production centers, Automatic Teller Machines (“ATMs”), through the customer contact call center and online banking.
Commercial and Wealth Management Group
As discussed above, in January 2009, the Commercial Banking and Wealth Management segments were combined into one segment. The new CWMG segment provides the same products and services that were offered by the two segments prior to being combined, but the combined segment is serving the same customers under one business model. A majority of the customers served in this segment are middle market companies with business owners that are high net-worth individuals under one platform and one manager. This segment offers a complete line of commercial and industrial and commercial real estate secured loan products and services as well as trust and investment advisory services and private banking lending, deposit services and securities brokerages services. The types of products offered in this segment include traditional commercial and industrial and commercial real estate loans and lines of credit, letters of credit, asset-based lending, foreign exchange services and treasury management. The loan products also include construction loans for commercial and residential development, land acquisition and development loans, secured and unsecured lines of credit and financing arrangements for completed structures.
RAL and RT Programs
The products provided in this segment are described in Note 7, “RAL and RT Programs” of these Consolidated Financial Statements on page 133. This business segment relates to the filing of income tax returns and consequently is highly seasonal. Approximately 90% of the activity occurs in the first quarter of each year.
All Other
This segment consists of administrative support areas of the Company and the Bancorp does not consider “All Other” an operating segment of the Company. The All Other segment is presented in the segment tables above to reflect unallocated operating segments to the consolidated totals of the Company’s Consolidated Financial Statements. The administrative support units include the Company’s executive administration, risk management, information technology operations, marketing, credit administration, human resources, corporate real estate, legal, treasury, finance and accounting areas of the Company. The income generated by the All Other segment is from PCBNA’s securities portfolio which is managed by the treasury department and allocated to the operating segments as part of the allocation process in preparing segment balance sheets.
During the process of re-allocating goodwill in 2007, as discussed below, several of the assets and liabilities which had been reported in the All Other segment were allocated to the appropriate operating segment based on usage by the operating segments. In addition, all of the assets and liabilities in all of the operating segments were reviewed and re-allocated to the appropriate segments to create segment balance sheets. The process of allocating the assets and liabilities to create the segment balance sheets creates the “indirect credit (charge) for funds” within the tables above. Included in the “indirect credit (charge) for funds” are the associated interest income, interest expense, non-interest income and non-interest expense with the transfers of the assets and liabilities to the operating segments to create the segment balance sheets.
Indirect Credit (Charge) for Funds
Included in indirect credit (charge) for funds is an allocation of non-interest expense from the All Other segment for the services provided by the administrative support units include the Company’s executive administration, risk management, information technology operations, marketing, credit administration,
173
Table of Contents
human resources, corporate real estate, legal, treasury, finance and accounting areas to the operating segments based on the estimated use of each department services utilized.
The Company has no operations in foreign countries to require disclosure by geographical area. The Company has no single customer generating 10% or more of total revenues.
| 25. | CREDIT RATINGS |
The Company’s liquidity is also impacted by the credit ratings assigned to the Company and the Bank by third party rating agencies. On July 31, 2009, Moody’s downgraded the credit rating for the financial strength of the Bank from D+ to E+ and the short-term debt of the Bank from Prime-3 to Not Prime with the long-term debt of the Bank remaining under review for a possible downgrade. On July 31, 2009, Dominion Bond Rating Service (“DBRS”) downgraded the ratings of the Company from BB (high) to B, the senior debt of the Company from BB (high) to B, and the deposits and senior debt of the Bank from BBB to BB, with all ratings remaining under review with negative implications. On December 24, 2009, Moody’s downgraded the credit ratings of the Company from Caa1 to C and the long term deposits of the Bank from B1 to B3 with the financial strength rating being under review for a possible downgrade. On December 24, 2009, DBRS downgraded their credit ratings for the Company from B to CCC and the deposits and senior debt of the Bank from BB to B with all ratings remaining under review with negative implications. On February 1, 2010, DBRS downgraded the credit ratings for the Company from CCC to CC and the senior debt of the Bank from B to CCC (high).
These lower credit ratings, and any further ratings downgrades, could make it more difficult for the Company to access the capital markets going forward, as the cost to borrow or raise debt or equity capital could become more expensive. The impact of these downgrades puts further pressure on the Company’s stock price, access to capital, and impedes its access to various liquidity sources. Although the cost of PCBNA’s primary funding sources (deposits and FHLB borrowings) is not influenced directly by PCB and PCBNA credit ratings, no assurance can be given that PCBNA’s credit rating will not have any impact on its access to deposits and FHLB borrowings. Long-term debt ratings also factor into the calculation of deposit insurance premiums, and a reduction in PCBNA’s ratings would increase premiums and expense.
| 26. | SUBSEQUENT EVENTS |
On January 14, 2010, the Company and the Bank entered into a Purchase and Sale Agreement (the “Purchase and Sale Agreement”) with Santa Barbara Tax Products Group, LLC (“SBTPG”), pursuant to which SBTPG agreed to purchase the assets of the RAL and RT Programs segment, including the fixed assets, uncollected loans, contracts with tax preparers, and customer lists. As consideration, SBTPG agreed to assume certain liabilities associated exclusively with the RAL and RT Programs, to pay $5.0 million in cash at closing and an additional $5.0 million in cash on March 15, 2010 provided that the Bank has performed certain transition support services through that date. It was further agreed that SBTPG would make a further cash payments based on the number of refund anticipation loans processed by SBTPG between January 1, 2010 and April 30, 2010. While Management expects to provide the required transition services through March 15, 2010, and will therefore receive the second sale installment payment of $5.0 million, it believes that it is highly unlikely that any cash payment will be made based on the number of refund anticipation loans currently expected to be processed by SBTPG during the 2010 tax season.
At March 31, 2010 and for all future comparable periods, the Company will report the RAL and RT Programs segment as discontinued operations. Management expects to report a gain on the sale of the RAL and RT Programs for the three months ended March 31, 2010. Due to the second $5.0 million cash payment not being received prior to filing this Form 10-K, the gain on sale amount is not finalized.
174
Table of Contents
| 27. | PACIFIC CAPITAL BANCORP (PARENT COMPANY ONLY FINANCIALS) |
The condensed financial statements of the Bancorp are presented on the following pages.
PACIFIC CAPITAL BANCORP
Balance Sheets
| December 31, | ||||||
| 2009 | 2008 | |||||
| (in thousands, except per share amounts) | ||||||
| Assets: |
||||||
| Cash and due from banks |
$ | 13,599 | $ | 23,895 | ||
| Premises and equipment, net |
590 | 775 | ||||
| Investment in subsidiary |
412,644 | 832,533 | ||||
| Other assets |
17,875 | 14,305 | ||||
| Total assets |
$ | 444,708 | $ | 871,508 | ||
| Liabilities: |
||||||
| Long-term debt and other borrowings |
69,426 | 69,426 | ||||
| Other liabilities |
10,679 | 13,645 | ||||
| Total liabilities |
80,105 | 83,071 | ||||
| Shareholders’ equity: |
||||||
| Preferred stock - no par value; $1,000 per share stated value; 1,000 authorized, 181 issued and outstanding |
$ | 176,742 | $ | 175,907 | ||
| Common stock - no par value; $0.25 per share stated value; 500,000 authorized ; 46,741 shares issued and outstanding at December 31, 2009 and 46,617 at December 31, 2008 |
11,689 | 11,659 | ||||
| Surplus |
123,886 | 120,137 | ||||
| Retained earnings |
37,934 | 471,531 | ||||
| Accumulated other comprehensive income |
14,352 | 9,203 | ||||
| Total shareholders’ equity |
364,603 | 788,437 | ||||
| Total liabilities and shareholders’ equity |
$ | 444,708 | $ | 871,508 | ||
175
Table of Contents
PACIFIC CAPITAL BANCORP
Statement of Operations
| Year Ended December 31, | ||||||||||||
| 2009 | 2008 | 2007 | ||||||||||
| (in thousands) | ||||||||||||
| Equity in earnings of subsidiaries: |
||||||||||||
| Undistributed |
$ | (405,047 | ) | $ | (54,266 | ) | $ | 30,600 | ||||
| Dividends |
— | 35,560 | 79,800 | |||||||||
| Interest expense |
(2,212 | ) | (3,855 | ) | (5,181 | ) | ||||||
| Other income |
(70 | ) | 120 | 161 | ||||||||
| Non-interest expense |
(2,714 | ) | (3,610 | ) | (9,789 | ) | ||||||
| (Loss)/income before income taxes |
(410,043 | ) | (26,051 | ) | 95,591 | |||||||
| Income tax provision/(benefit) |
11,218 | (3,301 | ) | 5,297 | ||||||||
| Net (loss)/income |
(421,261 | ) | (22,750 | ) | 100,888 | |||||||
| Dividends and accretion available to common shareholders |
9,996 | 1,094 | — | |||||||||
| Net (loss)/income applicable to common shareholders |
$ | (431,257 | ) | $ | (23,844 | ) | $ | 100,888 | ||||
176
Table of Contents
PACIFIC CAPITAL BANCORP
Statements of Cash Flows
| Year Ended December 31, | ||||||||||||
| 2009 | 2008 | 2007 | ||||||||||
| (in thousands) | ||||||||||||
| Cash flows from operating activities: |
||||||||||||
| Net (loss)/income |
$ | (421,261 | ) | $ | (22,750 | ) | $ | 100,888 | ||||
| Adjustments to reconcile net (loss)/ income to net cash used in operating activities: |
||||||||||||
| Equity in subsidiaries’ earnings, net of dividends |
405,047 | 18,706 | (110,400 | ) | ||||||||
| Depreciation |
176 | 9 | 12 | |||||||||
| Stock-based compensation |
3,853 | 4,205 | 6,034 | |||||||||
| Net change in other assets |
7,979 | 36,080 | (9,233 | ) | ||||||||
| Net change in other liabilities |
1,271 | (14,884 | ) | (1,196 | ) | |||||||
| Net cash (used)/ provided by operating activities |
(2,935 | ) | 21,366 | (13,895 | ) | |||||||
| Cash flows from investing activities: |
||||||||||||
| Net dividends from subsidiaries |
— | 35,560 | 79,800 | |||||||||
| Capital dispositions |
9 | 93 | 109 | |||||||||
| Advances and investment in subsidiaries |
— | (180,634 | ) | — | ||||||||
| Net cash provided/(used) by investing activities |
9 | (144,981 | ) | 79,909 | ||||||||
| Cash flows from financing activities: |
||||||||||||
| Proceeds from issuance of common stock options |
27 | 7,485 | 4,446 | |||||||||
| Payments to repurchase common stock |
— | — | (24,944 | ) | ||||||||
| Cash dividends paid on preferred stock |
(2,107 | ) | — | — | ||||||||
| Cash dividends paid on common stock |
(5,189 | ) | (41,114 | ) | (41,665 | ) | ||||||
| Proceeds from issuance of preferred stock and common stock warrants, net |
— | 179,522 | — | |||||||||
| Net repayment from other borrowings |
— | (112 | ) | (8,472 | ) | |||||||
| Other, net |
(101 | ) | (93 | ) | 598 | |||||||
| Net cash (used)/provided by financing activities |
(7,370 | ) | 145,688 | (70,037 | ) | |||||||
| Net (decrease)/increase in cash and due from banks |
(10,296 | ) | 22,073 | (4,023 | ) | |||||||
| Cash and due from banks, at beginning of period |
23,895 | 1,822 | 5,845 | |||||||||
| Cash and due from banks, at end of period |
$ | 13,599 | $ | 23,895 | $ | 1,822 | ||||||
177
Table of Contents
| 28. | CONSOLIDATED QUARTERLY FINANCIAL DATA (UNAUDITED) |
| Year Ended December 31, 2009 | ||||||||||||||||||||
| Q4 | Q3 | Q2 | Q1 | Total | ||||||||||||||||
| (dollars in thousands except per share amounts) | ||||||||||||||||||||
| Interest income |
$ | 81,528 | $ | 86,516 | $ | 96,089 | $ | 241,383 | $ | 505,516 | ||||||||||
| Interest expense |
33,468 | 35,862 | 42,651 | 53,271 | 165,252 | |||||||||||||||
| Net interest income |
48,060 | 50,654 | 53,438 | 188,112 | 340,264 | |||||||||||||||
| Provision for loan losses |
36,368 | 42,363 | 192,481 | 155,724 | 426,936 | |||||||||||||||
| Net interest (loss)/income after provision for loan losses |
11,692 | 8,291 | (139,043 | ) | 32,388 | (86,672 | ) | |||||||||||||
| Securities gains/(losses) |
10,729 | (23 | ) | (1,765 | ) | 2,029 | 10,970 | |||||||||||||
| Non-interest income * |
14,661 | 12,770 | 22,682 | 74,041 | 124,154 | |||||||||||||||
| Non-interest expense |
60,941 | 62,386 | 216,311 | 123,238 | 462,876 | |||||||||||||||
| Loss before income taxes |
(23,859 | ) | (41,348 | ) | (334,437 | ) | (14,780 | ) | (414,424 | ) | ||||||||||
| (Benefit)/provision for income taxes |
(6,401 | ) | (3,111 | ) | 25,617 | (9,268 | ) | 6,837 | ||||||||||||
| Net loss |
(17,458 | ) | (38,237 | ) | (360,054 | ) | (5,512 | ) | (421,261 | ) | ||||||||||
| Dividend and accretion on preferred stock |
2,543 | 2,511 | 2,530 | 2,412 | 9,996 | |||||||||||||||
| Net loss applicable to common shareholders |
$ | (20,001 | ) | $ | (40,748 | ) | $ | (362,584 | ) | $ | (7,924 | ) | $ | (431,257 | ) | |||||
| Loss per common share: ** |
||||||||||||||||||||
| Basic |
$ | (0.43 | ) | $ | (0.87 | ) | $ | (7.77 | ) | $ | (0.17 | ) | $ | (9.24 | ) | |||||
| Diluted *** |
(0.43 | ) | (0.87 | ) | (7.77 | ) | (0.17 | ) | $ | (9.24 | ) | |||||||||
| Cash dividends declared |
— | — | — | 0.11 | 0.11 | |||||||||||||||
| Weighted average common shares: |
||||||||||||||||||||
| Basic |
46,733 | 46,723 | 46,686 | 46,620 | 46,693 | |||||||||||||||
| Diluted |
47,223 | 47,234 | 47,215 | 47,108 | 47,197 | |||||||||||||||
178
Table of Contents
| Year Ended December 31, 2008 | |||||||||||||||||||
| Q4 | Q3 | Q2 | Q1 | Total | |||||||||||||||
| (dollars in thousands except per share amounts) | |||||||||||||||||||
| Interest income |
$ | 102,205 | $ | 102,733 | $ | 103,375 | $ | 211,020 | $ | 519,333 | |||||||||
| Interest expense |
48,066 | 41,911 | 39,007 | 49,835 | 178,819 | ||||||||||||||
| Net interest income |
54,139 | 60,822 | 64,368 | 161,185 | 340,514 | ||||||||||||||
| Provision for loan losses |
68,812 | 63,962 | 37,167 | 48,394 | 218,335 | ||||||||||||||
| Net interest income after provision for loan losses |
(14,673 | ) | (3,140 | ) | 27,201 | 112,791 | 122,179 | ||||||||||||
| Securities (losses)/gains |
(2,925 | ) | (487 | ) | (2,773 | ) | 2,839 | (3,346 | ) | ||||||||||
| Non-interest income * |
14,697 | 17,188 | 24,947 | 122,460 | 179,292 | ||||||||||||||
| Non-interest expense |
70,817 | 82,132 | 64,657 | 121,839 | 339,445 | ||||||||||||||
| Income before income taxes |
(73,718 | ) | (68,571 | ) | (15,282 | ) | 116,251 | (41,320 | ) | ||||||||||
| (Benefit)/provision for income taxes |
(31,880 | ) | (21,070 | ) | (9,389 | ) | 43,769 | (18,570 | ) | ||||||||||
| Net (loss)/income |
(41,838 | ) | (47,501 | ) | (5,893 | ) | 72,482 | (22,750 | ) | ||||||||||
| Dividend and accretion on preferred stock |
1,094 | — | — | — | 1,094 | ||||||||||||||
| Net (loss)/income applicable to common shareholders |
$ | (42,932 | ) | $ | (47,501 | ) | $ | (5,893 | ) | $ | 72,482 | $ | (23,844 | ) | |||||
| (Loss)/earnings per common share: ** |
|||||||||||||||||||
| Basic |
$ | (0.92 | ) | $ | (1.03 | ) | $ | (0.13 | ) | $ | 1.57 | $ | (0.52 | ) | |||||
| Diluted *** |
(0.92 | ) | (1.03 | ) | (0.13 | ) | 1.56 | (0.52 | ) | ||||||||||
| Cash dividends declared |
0.22 | 0.22 | 0.22 | 0.22 | 0.88 | ||||||||||||||
| Weighted average common shares: |
|||||||||||||||||||
| Basic |
46,583 | 46,197 | 46,172 | 46,139 | 46,273 | ||||||||||||||
| Diluted |
47,002 | 46,624 | 46,518 | 46,471 | 46,644 | ||||||||||||||
| * | Non-interest income is net of securities gains/(losses). |
| ** | (Loss)/earnings per share summation difference is due to rounding. |
| *** | When the company is in a loss position, diluted earnings per common share is calculated using basic weighted average shares outstanding. |
179
Table of Contents
| ITEM 9. | CHANGES IN AND DISAGREEMENTS WITH ACCOUNTANTS ON ACCOUNTING AND FINANCIAL DISCLOSURES |
None.
| ITEM 9A. | CONTROLS AND PROCEDURES |
Under the supervision and with the participation of our Management, including our Chief Executive Officer and Interim Chief Financial Officer, we conducted an evaluation of our disclosure controls and procedures, as such term is defined under Rules 13a-15(e) and 15d-15(e) under the Exchange Act. Based on this evaluation, our Chief Executive Officer and Interim Chief Financial Officer concluded that our disclosure controls and procedures were effective as of December 31, 2009.
MANAGEMENT’S REPORT ON INTERNAL CONTROL OVER FINANCIAL REPORTING
Management is responsible for establishing and maintaining adequate internal control over financial reporting at the Company. Our internal control over financial reporting is a process designed under the supervision of the Chief Executive Officer and Interim Chief Financial Officer to provide reasonable assurance regarding the reliability of financial reporting and the preparation of the Company’s financial statements for external reporting purposes in accordance with accounting principles generally accepted in the United States of America. A company’s internal control over financial reporting includes policies and procedures that (1) pertain to the maintenance of records that accurately and fairly reflect, in reasonable detail, transactions and dispositions of the company’s assets, (2) provide reasonable assurance that transactions are recorded as necessary to permit preparation of financial statements in accordance with accounting principles generally accepted in the United States of America and that receipts and expenditures are being made only in accordance with authorizations of Management and the directors of the company; and (3) provide reasonable assurance regarding prevention or timely detection of unauthorized acquisition, use, or disposition of the company’s assets that could have a material effect on the company’s financial statements.
Because of its inherent limitations, internal control over financial reporting may not prevent or detect misstatements. Also, projections of any evaluation of effectiveness to future periods are subject to the risk that controls may become inadequate because of changes in conditions, or that the degree of compliance with the policies or procedures may deteriorate.
As of December 31, 2009, the Company carried out an evaluation, under the supervision and with the participation of the Company’s Management, including the Company’s Chief Executive Officer and Interim Chief Financial Officer, of the effectiveness of the Company’s internal control over financial reporting pursuant to Rule 13a-15(c), as adopted by the SEC under the Exchange Act. In evaluating the effectiveness of the Company’s internal control over financial reporting, Management used the framework established in “Internal Control—Integrated Framework,” issued by the Committee of Sponsoring Organizations of the Treadway Commission (“COSO”).
Based on this evaluation, Management concluded that as of December 31, 2009, the Company’s internal control over financial reporting was effective.
| ITEM 9B. | OTHER INFORMATION |
None.
180
Table of Contents
181
Table of Contents
182
Table of Contents
183
Table of Contents
184
Table of Contents
PART III
| ITEM 10. | DIRECTORS, EXECUTIVE OFFICERS AND CORPORATE GOVERNANCE |
The information required by this item is incorporated by reference from the Company’s Definitive Proxy Statement for the 2010 Annual Meeting of Shareholders to be held on April 29, 2010.
| ITEM 11. | EXECUTIVE COMPENSATION |
The information required by this item is incorporated by reference from the Company’s Definitive Proxy Statement for the 2010 Annual Meeting of Shareholders to be held on April 29, 2010.
| ITEM 12. | SECURITY OWNERSHIP OF CERTAIN BENEFICIAL OWNERS AND MANAGEMENT AND RELATED STOCKHOLDER MATTERS |
The information required by this item is incorporated by reference from the Company’s Definitive Proxy Statement for the 2010 Annual Meeting of Shareholders to be held on April 29, 2010.
| ITEM 13. | CERTAIN RELATIONSHIPS AND RELATED TRANSACTIONS, AND DIRECTOR INDEPENDENCE |
The information required by this item is incorporated by reference from the Company’s Definitive Proxy Statement for the 2010 Annual Meeting of Shareholders to be held on April 29 2010.
| ITEM 14. | PRINCIPAL ACCOUNTANT FEES AND SERVICES |
The information required by this item is incorporated by reference from the Company’s Definitive Proxy Statement for the 2010 Annual Meeting of Shareholders to be held on April 29, 2010.
185
Table of Contents
PART IV
| ITEM 15. | EXHIBITS AND FINANCIAL STATEMENT SCHEDULES |
| (a) | 1. FINANCIAL STATEMENTS |
The listing of financial statements required by this item is set forth in the index under Item 8 of this Annual Report on Form 10-K.
| 2. | FINANCIAL STATEMENT SCHEDULES |
The listing of supplementary financial statement schedules required by this item is set forth in the index under Item 8 of this Annual Report on Form 10-K.
| 3. | EXHIBITS |
The listing of exhibits required by this item is set forth in the Exhibit Index beginning on page 188 of this Annual Report on Form 10-K, which Exhibit Index indicates each exhibit that is a management contract or compensatory plan or arrangement.
| (b) | EXHIBITS |
See exhibits listed in “Exhibit Index” on page 188 of this report.
| (c) | FINANCIAL STATEMENT SCHEDULES |
There are no financial statement schedules required by Regulation S-X that have been excluded from the annual report to shareholders.
186
Table of Contents
Pursuant to the requirements of Section 13 or 15(d) of the Securities Exchange Act of 1934, the Company has duly caused this report to be signed by the undersigned, thereunto duly authorized.
| Pacific Capital Bancorp | ||||||
| By /s/ George S. Leis George S. Leis |
March 12, 2010 Date |
|||||
| President and Chief Executive Officer | ||||||
Pursuant to the requirements of the Securities Exchange Act of 1934, this report has been signed below by the following persons on behalf of the Company and in the capacities and on the dates indicated.
| /s/ Edward E. Birch Edward E. Birch Chairman of the Board |
March 12, 2010 Date |
/s/ George S. Leis George S. Leis President and Chief Executive Officer (Principal Executive Officer) Director |
March 12, 2010 Date | |||
| /s/ Donald Lafler Donald Lafler Interim Chief Financial Officer |
March 12, 2010 Date |
/s/ Richard S. Hambleton, Jr Richard S. Hambleton, Jr. Director |
March 12, 2010 Date | |||
| /s/ D. Vernon Horton D. Vernon Horton Vice Chairman Director |
March 12, 2010 Date |
/s/ Roger C. Knopf Roger C. Knopf Director |
March 12, 2010 Date | |||
| /s/ Robert W. Kummer, Jr. Robert W. Kummer, Jr. Director |
March 12, 2010 Date |
/s/ Clayton C. Larson Clayton C. Larson Vice Chairman Director |
March 12, 2010 Date | |||
| /s/ John R. Mackall John Mackall Director |
March 12, 2010 Date |
/s/ Richard A. Nightingale Richard A. Nightingale Director |
March 12, 2010 Date | |||
| /s/ Kathy J. Odell Kathy J. Odell Director |
March 12, 2010 Date |
|||||
187
Table of Contents
EXHIBIT INDEX TO PACIFIC CAPITAL BANCORP FORM 10-K FOR THE FISCAL YEAR ENDED DECEMBER 31, 2009
| Exhibit |
Description* | |
| 3.1 | Certificate of Restatement of Articles of Incorporation of Pacific Capital Bancorp filed with the Secretary of State of California on June 10, 2005. (1) | |
| 3.2 | Certificate of Amendment of Articles of Incorporation of Pacific Capital Bancorp filed with the Secretary of State of California on August 8, 2005. (2) | |
| 3.3 | Certificate of Amendment of Articles of Incorporation of Pacific Capital Bancorp filed with the Secretary of State of California on October 5, 2009. ** | |
| 3.4 | Certificate of Determination of Preferences of Series B Fixed Rate Cumulative Perpetual Preferred Stock of Pacific Capital Bancorp filed with the Secretary of State of California on November 20, 2008. (3) | |
| 3.5 | Amended and Restated Bylaws of Pacific Capital Bancorp effective November 20, 2008. (4) | |
| 4.1 | Amended and Restated Stockholders Rights Agreements, dated as of April 22, 2003, between Pacific Capital Bancorp and Mellon Investor Services LLC, as Rights Agent. (5) | |
| Note: No long-term debt instruments issued by the Company or any of its consolidated subsidiaries exceeds 10% of the consolidated total assets of the Company and its subsidiaries. In accordance with paragraph (b)(4)(iii) of Item 601 of Regulation S-K, the Company will furnish to the Commission upon request copies of long-term debt instruments and related agreements. | ||
| 4.2 | Warrant to Purchase Common Stock. (6) | |
| 10.1 | Pacific Capital Bancorp 2002 Stock Plan, as amended and restated as of December 12, 2006. ** x | |
| 10.1.1 Form of Restricted Stock Agreement for Employees for the Pacific Capital Bancorp 2002 Stock Plan (7) x | ||
| 10.1.2 Form of Stock Option Agreement for Employees for the Pacific Capital Bancorp 2002 Stock Plan. (8) x | ||
| 10.1.3 Form of Restricted Reload Stock Option Agreement for Employees for the Pacific Capital Bancorp 2002 Stock Plan. ** x | ||
| 10.2 | Pacific Capital Bancorp Directors Stock Option Plan. (9) x | |
| 10.3 | Pacific Capital Bancorp Amended and Restated Incentive and Investment and Salary Savings Plan, effective as of January 1, 2001. (10) x | |
| 10.3.1 First Amendment to Pacific Capital Bancorp Amended and Restated Incentive and Investment and Salary Savings Plan, effective as of January 1, 2002. (11) x | ||
| 10.3.2 Second Amendment to Pacific Capital Bancorp Amended and Restated Incentive and Investment and Salary Savings Plan, effective as of May 1, 2003. ** x | ||
| 10.3.3 Third Amendment to Pacific Capital Bancorp Amended and Restated Incentive and Investment and Salary Savings Plan, effective as of January 1, 2004. (12) x | ||
| 10.3.4 Addendum Incorporating EGTRRA Compliance Amendment to Pacific Capital Bancorp Amended and Restated Incentive and Investment and Salary Savings Plan, effective as of January 1, 2002. (13) x | ||
| 10.3.5 Amendment to Pacific Capital Bancorp Amended and Restated Incentive and Investment and Salary Savings Plan, effective as of January 1, 2007. (14) x | ||
188
Table of Contents
| 10.3.6 Amendment to Pacific Capital Bancorp Amended and Restated Incentive and Investment and Salary Savings Plan, effective as of January 1, 2009. (15) x | ||
| 10.4 | Pacific Capital Bancorp Employee Stock Ownership Plan and Trust, as amended and restated effective as of January 1, 2001. (16) x | |
| 10.4.1 First Amendment to Pacific Capital Bancorp Amended and Restated Employee Stock Ownership Plan and Trust, effective as of January 1, 2005. (17) x | ||
| 10.4.2 Addendum Incorporating EGTRRA Compliance Amendment to Pacific Capital Bancorp Employee Stock Ownership Plan and Trust, effective as of January 1, 2002. (18) x | ||
| 10.4.3 Amendment to Pacific Capital Bancorp Employee Stock Ownership Plan and Trust, effective as of January 1, 2008. (19) x | ||
| 10.5 | Pacific Capital Bancorp 1998 Amended and Restated Key Employee Retiree Health Plan dated December 30, 1998. (20) x | |
| 10.6 | Pacific Capital Bancorp 1998 Amended and Restated Retiree Health Plan (Non-Key Employees) dated December 30, 1998, as amended and restated May 25, 2006. (21) x | |
| 10.7 | Trust Agreement of Santa Barbara Bank & Trust Voluntary Employees’ Beneficiary Association, effective as of December 29, 1992. (22) | |
| 10.7.1 First Amendment to Trust Agreement of Santa Barbara Bank & Trust Voluntary Beneficiary Association, effective as of December 29, 1992. (23) x | ||
| 10.8 | Pacific Capital Bancorp Amended and Restated 1996 Directors Stock Plan, as amended July 21, 2004. (24) x | |
| 10.8.1 Form of Directors Stock Option Agreement for the Pacific Capital Bancorp Amended and Restated 1996 Directors Stock Plan. ** x | ||
| 10.8.2 Form of Directors Reload Stock Option Agreement for the Pacific Capital Bancorp Amended and Restated 1996 Directors Stock Plan. (25) x | ||
| 10.9 | Pacific Capital Bancorp Management Retention Plan effective February 13, 2008. (26) x | |
| 10.10 | Pacific Capital Bancorp First Amended and Restated Deferred Compensation Plan dated October 1, 2000. (27) x | |
| 10.10.1 First Amended and Restated Trust Agreement under Pacific Capital Bancorp Deferred Compensation Plan, dated October 1, 2000. (28) x | ||
| 10.11 | Pacific Capital Bancorp Summary of Non-Employee Director Compensation, effective July 1, 2007. (29) x | |
| 10.12 | Pacific Capital Bancorp Deferred Compensation Plan, effective January 1, 2005. (30) x | |
| 10.13 | Amended and Restated Executive Salary Continuation Benefits Agreement dated as of September 23, 1997, by and between Clayton C. Larson and Pacific Capital Bancorp. (31) x | |
| 10.14 | Pacific Capital Bancorp 2005 Directors Stock Plan. (32) x | |
| 10.14.1 Form of Directors’ Stock Option Agreement for the Pacific Capital Bancorp 2005 Directors Stock Plan. (33) x | ||
| 10.14.2 Form of Directors’ Restricted Stock Agreement for the Pacific Capital Bancorp 2005 Directors Stock Plan. (34) x | ||
189
Table of Contents
| 10.15 | Employment Agreement dated March 29, 2007, by and among Pacific Capital Bancorp, Pacific Capital Bank, N.A. and George S. Leis. (35) x | |
| 10.15.1 First Amendment to Employment Agreement dated February 13, 2008, by and among Pacific Capital Bancorp, Pacific Capital Bank, N.A. and George S. Leis. (36) x | ||
| 10.16 | Performance-Based Annual Incentive Compensation Plan dated August 2007, as amended and restated as of July 2009. ** x | |
| 10.17 | Pacific Capital Bancorp 2008 Equity Incentive Plan. (37) x | |
| 10.17.1 Form of Notice of Grant and Restricted Stock Agreement for Non-employee Directors for the Pacific Capital Bancorp 2008 Equity Incentive Plan. (38) x | ||
| 10.17.2 Form of Notice of Grant and Restricted Stock Agreement for the Pacific Capital Bancorp 2008 Equity Incentive Plan. (39) x | ||
| 10.18 | Letter Agreement dated as of November 21, 2008, including the Securities Purchase Agreement—Standard Terms incorporated by reference therein, by and between the United States Department of the Treasury and Pacific Capital Bancorp. (40) | |
| 10.19 | Additional Letter Agreement dated as of November 21, 2008, by and between the United States Department of the Treasury and Pacific Capital Bancorp. (41) | |
| 10.20 | Form of Consent, dated as of November 21, 2008, executed by each of Messrs. George S. Leis, Stephen V. Masterson, Frederick W. Clough, Clayton C. Larson, Donald Toussaint, and Bradley S. Cowie. (42) x | |
| 10.21 | Form of Waiver, dated as of November 21, 2008, executed by each of Messrs. George S. Leis, Stephen V. Masterson, Frederick W. Clough, Clayton C. Larson, Donald Toussaint, and Bradley S. Cowie. (43) | |
| 10.22 | Form of Consent, dated as of February 27, 2009, executed by each of Messrs. George S. Leis, Stephen V. Masterson, Frederick W. Clough, Clayton C. Larson, Donald Toussaint, and Bradley S. Cowie. (44) x | |
| 21. | Subsidiaries of the registrant. ** | |
| 23.1 | Consent of Ernst & Young LLP with respect to financial statements of the Registrant. ** | |
| 31. | Certifications pursuant to Section 302 of the Sarbanes-Oxley Act of 2002. ** | |
| 31.1 Certification of George S. Leis. ** | ||
| 31.2 Certification of Donald Lafler. ** | ||
| 32. | Certification pursuant to Section 906 of the Sarbanes-Oxley Act of 2002. ** | |
| 32.1 Certification of George S. Leis and Donald Lafler. ** | ||
190
Table of Contents
Shareholders may obtain a copy of any exhibit by writing to:
Carol Zepke, Corporate Secretary
Pacific Capital Bancorp
P.O. Box 60839
Santa Barbara, CA 93160
| * | Effective December 30, 1998, Santa Barbara Bancorp and Pacific Capital Bancorp merged and contemporaneously with effectiveness of the merger, Santa Barbara Bancorp, the surviving entity, changed its corporate name to Pacific Capital Bancorp. Documents identified as filed by Santa Barbara Bancorp prior to December 30, 1998 were filed by Santa Barbara Bancorp (File 0-11113). Documents identified as filed by Pacific Capital Bancorp prior to December 30, 1998 were filed by Pacific Capital Bancorp as it existed prior to the merger (File No. 0-13528). |
| ** | Filed herewith. |
| x | Indicates management contract or compensatory plan or arrangement |
The Exhibits listed below are incorporated by reference from the specified filing.
| (1) | Filed as Exhibit 3(i)(b) to the Current Report on Form 8-K of Pacific Capital Bancorp (File No. 0-11113) filed June 17, 2005. |
| (2) | Filed as Exhibit 3(i)(b) to the Quarterly Report on Form 10-Q of Pacific Capital Bancorp (File No. 0-11113) for the fiscal quarter ended September 30, 2005. |
| (3) | Filed as Exhibit 3.1 to the Current Report on Form 8-K of Pacific Capital Bancorp (File No. 0-11113) filed on November 26, 2008. |
| (4) | Filed as Exhibit 3.2 to the Current Report on Form 8-K of Pacific Capital Bancorp (File No. 0-11113) filed on November 26, 2008. |
| (5) | Filed as Exhibit 4.1 to the Quarterly Report on Form 10-Q of Pacific Capital Bancorp (File No. 0-11113) for the fiscal quarter ended March 31, 2003. |
| (6) | Filed as Exhibit 4.2 to the Current Report on Form 8-K of Pacific Capital Bancorp (File No. 0-11113) filed on November 26, 2008. |
| (7) | Filed as Exhibit 10.2 to the Quarterly Report on Form 10-Q of Pacific Capital Bancorp (File No. 0-01113) for the fiscal quarter ended June 30, 2008. |
| (8) | Filed as Exhibit 10.3 to the Quarterly Report on Form 10-Q of Pacific Capital Bancorp (File No. 0-01113) for the fiscal quarter ended June 30, 2008. |
| (9) | Filed as Exhibit 4.2 to the Registration Statement on Form S-8 of Santa Barbara Bancorp (Registration No. 33-48724) filed on June 22, 1992. |
| (10) | Filed as Exhibit 10.1.3 to the Annual Report on Form 10-K of Pacific Capital Bancorp (File No. 0-01113) for the fiscal year ended December 31, 2004. |
| (11) | Filed as Exhibit 10.1.3.1 to the Annual Report on Form 10-K of Pacific Capital Bancorp (File No. 0-01113) for the fiscal year ended December 31, 2004. |
| (12) | Filed as Exhibit 10.1.3.3 to the Annual Report on Form 10-K of Pacific Capital Bancorp (File No. 0-01113) for the fiscal year ended December 31, 2004. |
| (13) | Filed as Exhibit 10.1.3.4 to the Annual Report on Form 10-K of Pacific Capital Bancorp (File No. 0-01113) for the fiscal year ended December 31, 2004. |
| (14) | Filed as Exhibit 10.3.5 to the Annual Report on Form 10-K of Pacific Capital Bancorp (File No. 0-11113) for the fiscal year ended December 31, 2008. |
| (15) | Filed as Exhibit 10.3.6 to the Annual Report on Form 10-K of Pacific Capital Bancorp (File No. 0-11113) for the fiscal year ended December 31, 2008. |
| (16) | Filed as Exhibit 10.1.4 to the Annual Report on Form 10-K of Pacific Capital Bancorp (File No. 0-01113) for the fiscal year ended December 31, 2004. |
| (17) | Filed as Exhibit 10.4.1 to the Annual Report on Form 10-K of Pacific Capital Bancorp (File No. 0-01113) for the fiscal year ended December 31, 2008. |
| (18) | Filed as Exhibit 10.1.4.2 to the Annual Report on Form 10-K of Pacific Capital Bancorp (File No. 0-01113) for the fiscal year ended December 31, 2004. |
191
Table of Contents
| (19) | Filed as Exhibit 10.4.3 to the Annual Report on Form 10-K of Pacific Capital Bancorp (File No. 0-11113) for the fiscal year ended December 31, 2008. |
| (20) | Filed as Exhibit 10.1.5 to the Annual Report on Form 10-K of Pacific Capital Bancorp (File No. 0-01113) for the fiscal year ended December 31, 2004. |
| (21) | Filed as Exhibit 10.6.1 to the Annual Report on Form 10-K of Pacific Capital Bancorp (File No. 0-01113) for the fiscal year ended December 31, 2006. |
| (22) | Filed as Exhibit 10.1.8 to the Annual Report on Form 10-K of Santa Barbara Bancorp (File No. 0-11113) for the fiscal year ended December 31, 1997. |
| (23) | Filed as Exhibit 10.1.13 to the Annual Report on Form 10-K of Santa Barbara Bancorp (File No. 0-11113) for fiscal year ended December 31, 1995. |
| (24) | Filed as Exhibit 10.1.8 to the Annual Report on Form 10-K of Pacific Capital Bancorp (File No. 0-01113) for the fiscal year ended December 31, 2004. |
| (25) | Filed as Exhibit 10.1.8.2 to the Annual Report on Form 10-K of Pacific Capital Bancorp (File No. 0-01113) for the fiscal year ended December 31, 2004. |
| (26) | Filed as Exhibit 10.1 to the Current Report on Form 8-K of Pacific Capital Bancorp (File No. 0-11113) filed February 20, 2008. |
| (27) | Filed as Exhibit 10.1.13 to the Annual Report on Form 10-K of Pacific Capital Bancorp (File No. 0-01113) for the fiscal year ended December 31, 2004. |
| (28) | Filed as Exhibit 10.1.13.1 to the Annual Report on Form 10-K of Pacific Capital Bancorp (File No. 0-01113) for the fiscal year ended December 31, 2004. |
| (29) | Filed as Exhibit 99.1 to the Current Report on Form 8-K of Pacific Capital Bancorp (File No. 0-11113) filed September 25, 2007. |
| (30) | Filed as Exhibit 10.1.15 to the Annual Report on Form 10-K of Pacific Capital Bancorp (File No. 0-11113) for the fiscal year ended December 31, 2005. |
| (31) | Filed as Exhibit 10.14 to the Annual Report on Form 10-K of Pacific Capital Bancorp (File No. 0-11113) for the fiscal year ended December 31, 2006. |
| (32) | Filed as Addendum B to the Definitive Proxy Statement on Schedule 14A of Pacific Capital Bancorp (File No. 0-11113) filed April 21, 2005. |
| (33) | Filed as Exhibit 4.2 to the Registration Statement on Form S-8 of Pacific Capital Bancorp (Registration No. 333-127982) filed on August 31, 2005. |
| (34) | Filed as Exhibit 4.3 to the Registration Statement on Form S-8 of Pacific Capital Bancorp (Registration No. 333-127982) filed on August 31, 2005. |
| (35) | Filed as Exhibit 10.1 to the Current Report on Form 8-K of Pacific Capital Bancorp (File No. 0-11113) filed March 30, 2007. |
| (36) | Filed as Exhibit 10.2 to the Current Report on Form 8-K of Pacific Capital Bancorp (File No. 0-11113) filed February 20, 2008. |
| (37) | Filed as Exhibit A to the Definitive Proxy Statement on Schedule 14A of Pacific Capital Bancorp (File No. 0-11113) filed March 19, 2008. |
| (38) | Filed as Exhibit 10.1 to the Quarterly Report on Form 10-Q of Pacific Capital Bancorp (File No. 0-01113) for the fiscal quarter ended June 30, 2008. |
| (39) | Filed as Exhibit 10.24.2 to Annual Report on Form 10-K of Pacific Capital Bancorp (File No. 0-11113) for the fiscal year ended December 31, 2008. |
| (40) | Filed as Exhibit 10.1 to the Current Report on Form 8-K of Pacific Capital Bancorp (File No. 0-11113) filed November 26, 2008. |
| (41) | Filed as Exhibit 10.2 to the Current Report on Form 8-K of Pacific Capital Bancorp (File No. 0-11113) filed November 26, 2008. |
| (42) | Filed as Exhibit 10.3 to the Current Report on Form 8-K of Pacific Capital Bancorp (File No. 0-11113) filed November 26, 2008. |
| (43) | Filed as Exhibit 10.4 to the Current Report on Form 8-K of Pacific Capital Bancorp (File No. 0-11113) filed November 26, 2008. |
| (44) | Filed as Exhibit 10.29 to the Annual Report on Form 10-K of Pacific Capital Bancorp (File No. 0-11113) for the fiscal year ended December 31, 2008. |
192