Attached files
| file | filename |
|---|---|
| 10-K - FORM 10-K - FIRSTBANK CORP | first10k_123109.htm |
| EX-3 - AMENDED ARTICLES OF INCORPORATION - FIRSTBANK CORP | first10k_123109ex3a.htm |
| EX-12 - RATIO OF EARNINGS TO FIXED CHARGES - FIRSTBANK CORP | first10k_123109ex12.htm |
| EX-21 - SUBSIDIARIES - FIRSTBANK CORP | first10k_123109ex21.htm |
| EX-10 - RESTRICTED STOCK AGREEMENT - FIRSTBANK CORP | first10k_123109ex10k.htm |
| EX-99 - TARP CERTIFICATION OF CFO - FIRSTBANK CORP | first10k_123109ex99p3.htm |
| EX-31 - CERTIFICATION OF THOMAS SULLIVAN - FIRSTBANK CORP | first10k_123109ex31p1.htm |
| EX-32 - CERTIFICATION OF SULLIVAN AND STONE - FIRSTBANK CORP | first10k_123109ex32p1.htm |
| EX-31 - CERTIFICATION OF SAMUAL STONE - FIRSTBANK CORP | first10k_123109ex31p2.htm |
| EX-14 - CODE OF ETHICS - FIRSTBANK CORP | first10k_123109ex14.htm |
| EX-23 - CONSENT OF INDEPENDENT ACCOUNTING FIRM - FIRSTBANK CORP | first10k_123109ex23p1.htm |
| EX-99 - PERFORMANCE TABLE - FIRSTBANK CORP | first10k_123109ex99p1.htm |
| EX-99 - TARP CERTIFICATION OF CEO - FIRSTBANK CORP | first10k_123109ex99p2.htm |
PRESIDENT’S MESSAGE
To Our Shareholders:
We believe that the real test of a community banking company – its philosophy, its model, its culture, and its people – comes not when times are good, but rather when difficult and demanding times test our strength and commitment. While we are disappointed with our earnings performance last year, those earnings come in the face of a challenging banking environment. We have persevered through these challenges and are taking the right steps to assure that we are positioned for success as economic and market conditions improve.
In 2009, Firstbank Corporation earned a profit of $2.7 million, or 15 cents per share. Net interest income increased 4.1% to $48.7 million. Average earning assets increased 2.8%. Average deposits increased 3.9%. Gains from the sale of mortgage loans increased more than $5 million, as we helped our customers take advantage of the low interest rate environment to lock-in safe, low rate, long-term financing for their homes.
These 2009 highlights are remarkable because our talented team achieved them during the sharpest, most volatile, and most painful economic downturn that our state and country has experienced since the Great Depression. Michigan’s unemployment rate rose throughout the year, peaking at over 15%. Two of the three major auto companies headquartered in our state went bankrupt, impacting employees, suppliers, dealers, bondholders, and shareholders, along with current owners and potential buyers of those companies’ vehicles. Real estate values, for both commercial and residential properties, are continuing to fall and prices have not yet stabilized.
We addressed these issues head on. First, by taking several actions during the year to strengthen our balance sheet, so that we are prepared in the event this economic recession is longer than expected. Loan loss provision expense in 2009 of $14.7 million exceeded net loan losses by more than $4.5 million, building the allowance for loan losses to 1.70% of loans, a substantial improvement from year-end 2008 when the allowance represented 1.26% of loans. The $33 million investment by the U. S. Treasury in Firstbank Corporation preferred stock in the first quarter 2009 supplemented our capital, providing substantial stability during this unprecedented turbulence. This gave us greater confidence to make more loans to credit-worthy customers within our communities. We also took the difficult step of significantly reducing the cash dividend in order to retain more capital within the company until earnings improve. Many of these decisions have been both difficult and complicated. We have had to balance our desire for current earnings with the realization that our situation in Michigan has most likely not reached bottom. Long term, our ability to sustain normal deposit gathering and lending activities throughout our markets is contingent on maintaining a strong capital position.
In addition to the significant achievements noted above, we also continued to build and invest for future growth and success in 2009.
v Our operations and technology groups implemented new image capture capability for the entire corporate branch network, rolling out that technology to our high balance commercial customers. This improves efficiency while extending our deposit gathering reach.
v “E-statements” were introduced to our retail account holders, with over 8,800 accounts converting to that new delivery format – saving paper, printing, postage and prep time for over 100,000 statements annually.
v We originated or refinanced over 3,000 residential mortgages representing $348 million of volume during 2009. We now directly service more than 7,200 mortgages representing more than $606 million of home loans.
v We organized a small and efficient training and support group focusing on management and communications with front-line staff, and improved coordination among operations and branch personnel. The goal is to strengthen customer service and sales as well as to prepare our banks operationally for an enhanced marketing effort.
v We selected a new marketing and advertising agency that will work with us to launch a new marketing campaign to take advantage of market conditions to grow our deposits and our customer base.
v Our ongoing efforts to build low cost core deposits to replace higher cost wholesale funding were successful. Core deposits increased $110 million, or 10.9%, during 2009 – while wholesale funding including FHLB advances, brokered and internet CD’s, and securities sold under agreements to repurchase declined $83 million or 33%.
v We selected a new advisor for our investment portfolio with a focus on high quality liquid investments.
v We joined the CDARS program – a deposit product for high balance customers that provides virtually unlimited FDIC insurance while keeping these large deposits in our banks and supporting our local communities
1
v We continued to service our borrowers’ needs, increasing commercial and commercial real estate loans 2.5%, and ending the year with a portfolio of over $590 million in those two categories. This growth helped to offset the sale of residential mortgages out of our portfolio into the secondary market (a by-product of the mortgage re-finance activity) and to limit the decline in total loans to only $36 million.
v To help our customers who are experiencing stress in their ability to service their loan obligations, we are participating in the Home Affordable Modification Program for residential borrowers. We are working with customers who remain committed to repaying their debts by giving them the opportunity to restructure their loans in a manner that protects the bank while assisting the borrower with a lower payment, lower rate, or some other type of temporary assistance.
We emerged from 2009 stronger than we were in 2008, primarily because we adhered to the same principles that have proven successful for our company for many years. As we look forward to 2010 and beyond, we believe that our continued focus on community and customer will lead us to improved profitability; our practice of aggressively addressing credit issues as they arise will enable us to maintain asset quality superior to most of our peers; our dedication to developing our branch network’s core deposit gathering capability will build our net interest margin and liquidity; and our commitment to maintaining a strong level of capital, will all position us for future success.
During the year our Firstbank team worked under the most difficult circumstances in the banking industry that any of us have ever faced. Their dedication, commitment, professionalism and continued hard work have served our customers, our communities, and our company exceptionally well. We are fortunate to have great people in our company – from the frontlines in our branches, to our operational support areas, and in our boardrooms. I thank each and every one of them for all of their efforts on behalf of Firstbank Corporation.
I would like to acknowledge the contributions of a long time member of the Firstbank leadership team who retired at the end of 2009. Dale Peters joined our company in 1987, when we acquired a little bank in West Branch, with $11 million of total assets. Under Dale’s leadership, Firstbank – West Branch grew to over $250 million of assets in 2009, achieved a number one position with market share of over 45% of the deposits in Ogemaw County, and the West Branch bank has historically been one of the most profitable banks not only in our company but throughout the state of Michigan. Dale’s contributions to our company, and to the West Branch community, have been too numerous to list, but all are sincerely appreciated. On behalf of the shareholders, directors, officers, and staff members of Firstbank Corporation I want to express our gratitude to Dale for his 22 years of service, and to wish both Dale and Helen a long, happy and healthy retirement.
Finally, I would like to thank our customers and our communities for entrusting us with their business and for allowing us to serve them. We stand strong and ready to serve their future needs. And I want to thank you, our owners, for your confidence and investment in Firstbank Corporation. Your support and encouragement are sincerely appreciated.
Sincerely,
Thomas R. Sullivan
President & Chief Executive Officer
2

2009
Annual Report
This 2009 Annual Report contains audited financial statements and a detailed financial review. This is Firstbank Corporation’s 2009 Annual Report to Shareholders.
The report presents information concerning the business and financial results of Firstbank Corporation in a format and level of detail that we believe shareholders will find useful and informative. Shareholders who would like to receive even more detailed information than that contained in this 2009 Annual Report are invited to request our Annual Report on Form 10‑K.
Firstbank Corporation’s Form 10‑K Annual Report filed with the Securities and Exchange Commission will be provided to any shareholder, without charge, upon written request. Requests should be addressed to Samuel G. Stone, Chief Financial Officer, Firstbank Corporation, 311 Woodworth Avenue, P.O. Box 1029, Alma, Michigan 48801‑6029. Firstbank Corporation's Form 10-K Annual Report may also be accessed through our website www.firstbankmi.com
3
|
FINANCIAL HIGHLIGHTS Firstbank Corporation | |||||
|
|
|
|
|
| |
|
(In Thousands of Dollars, Except per Share Data) |
|
|
|
| |
|
For the year: |
2009 |
2008 |
2007 |
2006 |
2005 |
|
Interest income |
$ 74,686 |
$ 82,191 |
$ 80,862 |
$ 70,786 |
$ 53,130 |
|
Net interest income |
48,747 |
46,838 |
42,645 |
40,065 |
35,316 |
|
Provision for loan losses |
14,671 |
8,256 |
2,014 |
767 |
295 |
|
Non-interest income |
15,409 |
3,990 |
9,720 |
10,133 |
9,732 |
|
Non-interest expense |
45,750 |
42,915 |
39,074 |
34,821 |
29,940 |
|
Net income |
2,691 |
719 |
8,386 |
10,208 |
10,110 |
|
Net income available to common |
1,178 |
719 |
8,386 |
10,208 |
10,110 |
|
|
|
|
|
|
|
|
At year end: |
|
|
|
|
|
|
Total assets |
1,482,356 |
1,425,340 |
1,365,739 |
1,095,092 |
1,061,118 |
|
Total earning assets |
1,342,530 |
1,292,647 |
1,229,564 |
1,008,545 |
976,332 |
|
Loans |
1,122,185 |
1,159,632 |
1,123,654 |
910,640 |
878,917 |
|
Deposits |
1,149,063 |
1,046,914 |
1,011,392 |
835,426 |
811,105 |
|
Other borrowings |
175,756 |
251,275 |
217,910 |
149,976 |
144,255 |
|
Common shareholders’ equity |
114,173 |
114,983 |
118,611 |
96,073 |
93,577 |
|
Total shareholders’ equity |
146,880 |
114,983 |
118,611 |
96,073 |
93,577 |
|
|
|
|
|
|
|
|
Average balances: |
|
|
|
|
|
|
Total assets |
1,433,555 |
1,396,357 |
1,223,470 |
1,070,759 |
878,075 |
|
Total earning assets |
1,300,354 |
1,264,425 |
1,118,569 |
987,232 |
816,108 |
|
Loans |
1,135,868 |
1,145,849 |
1,010,863 |
904,196 |
728,508 |
|
Deposits |
1,064,567 |
1,024,305 |
915,077 |
808,897 |
664,596 |
|
Other borrowings |
207,614 |
236,095 |
182,740 |
152,409 |
122,348 |
|
Common shareholders’ equity |
114,424 |
118,494 |
107,537 |
95,227 |
79,165 |
|
Total shareholders’ equity |
144,583 |
118,494 |
107,537 |
95,227 |
79,165 |
|
|
|
|
|
|
|
|
Per common share: (1) |
|
|
|
|
|
|
Basic earnings |
$0.15 |
$0.10 |
$1.21 |
$ 1.56 |
$ 1.67 |
|
Diluted earnings |
$0.15 |
$0.10 |
$1.21 |
$ 1.55 |
$ 1.64 |
|
Cash dividends |
$0.40 |
$0.90 |
$0.90 |
$ 0.85 |
$ 0.79 |
|
Common shareholders’ equity |
$14.77 |
$15.44 |
$16.01 |
$ 14.82 |
$ 14.20 |
|
|
|
|
|
|
|
|
Financial ratios: |
|
|
|
|
|
|
Return on average assets |
0.19% |
0.05% |
0.69% |
0.95% |
1.15% |
|
Return on average common equity |
1.86% |
0.61% |
7.80% |
10.72% |
12.77% |
|
Average equity to average assets |
10.09% |
8.38% |
8.79% |
8.89% |
9.02% |
|
Average common equity |
|
|
|
|
|
|
to average assets |
7.98% |
8.38% |
8.79% |
8.89% |
9.02% |
|
Dividend payout ratio |
|
|
|
|
|
|
on common stock |
113.80% |
935.73% |
74.49% |
54.72% |
47.35% |
(1) All per share amounts are adjusted for stock dividends.
The Company’s Form 10-K Annual Report filed with the Securities and Exchange Commission will be provided to any shareholder, without charge, upon written request. Requests should be addressed to: Samuel G. Stone, Chief Financial Officer, Firstbank Corporation, 311 Woodworth Avenue, P.O. Box 1029, Alma, Michigan 48801-6029 The Company’s Form 10-K may also be viewed through our web site at www.firstbankmi.com.
4
MANAGEMENT’S DISCUSSION AND ANALYSIS OF
FINANCIAL CONDITION AND RESULTS OF OPERATIONS
The purpose of this section of the annual report is to provide a narrative discussion about Firstbank Corporation’s financial condition and results of operations. Please refer to the consolidated financial statements and the selected financial data presented in this report in addition to the following discussion and analysis. We also encourage you to read our Annual Report on Form 10-K filed with the U.S. Securities and Exchange Commission.
RESULTS OF OPERATIONS
Highlights
Firstbank Corporation (“the Company”) had net income of $2,690,000 for 2009 compared with $719,000 in 2008, an increase of $1,971,000, or 274%. After payment of dividends on preferred stock, net income available to common shareholders was $1,178,000 for 2009 compared with $719,000 in 2008, an increase of $459,000 or 64%. Core banking activities continued to provide a solid basis for earnings; however, a Michigan economy that has the highest unemployment in the nation and a troubled housing market created many challenges during the year. Our loan loss provision was increased to $14,671,000 in 2009, compared with $8,256,000 provided in 2008. The higher provision was necessary as we encountered increasing delinquencies and non performing loans throughout the year.
Mortgage gains increased year over year for the third year in a row. Mortgage rates remained at historically low levels throughout the year allowing us the opportunity to re-finance many customers into more favorable loans, while also recording $7.551 million in gains on the sale of loans compared to the $2.513 million reported in 2008.
We posted a return on average assets of 0.19%, 0.05%, and 0.69% for 2009, 2008, and 2007, respectively. Total average assets increased $37 million in 2009, $173 million in 2008, and $153 million in 2007. Diluted earnings per share were $0.15, $0.10, and $1.21 for the same time periods. Return on equity was 1.86% in 2008, 0.61% in 2008, and 7.80% in 2007. While these profitability measures do not meet our expectations, the industry as a whole and the Michigan banking industry in particular are experiencing similar and even more substantial impacts on their performance.
Net Interest Income
Our core business is earning interest on loans and securities while paying interest on deposits and borrowings. In response to economic recession in the United States, the Federal Reserve maintained overnight interest rates at historically low levels of 0.00% to 0.25% throughout the year. While these low short term rates allowed us to lower the rates we pay on certain deposit products, it also reduced the rates we earn on variable rate loan products and renewing fixed rate loans. The net interest spread, the difference between the interest rates charged on earning assets and the rate paid on interest bearing liabilities, grew steadily in the first three quarters of the year before leveling off in the fourth quarter. As a result, our net interest margin increased in the first three quarters before flattening out in the fourth quarter. The net interest margin for the year was 3.82% compared with 3.80% in 2008, and 3.90% in 2007. During 2009, our average loan to average deposit ratio was 107%, lower than the 112% in 2008 and 110% in 2007. We maintain capital and funding capacity and a desire to expand lending; however, demand for quality loans is in our local economies is very low at this time.
Net interest income increased in 2009 by $1.9 million as a combination of the higher net interest margin and a higher level of average earning assets improved earnings. Average interest earning assets increased $36 million from 2008 levels. The increase in interest earnings assets was largely a result of higher balances in the investment portfolio. A critical task of management is to price assets and liabilities so that the spread between the interest earned on assets and the interest paid on liabilities is maximized while maintaining acceptable levels of risk. While interest rates on earning assets and interest bearing liabilities are subject to market forces, in general and in the short run, we can exert more control over deposit rates than earning asset rates. However, competitive forces and the need to maintain and grow deposits as a funding source place limitations on the degree of control over deposit rates.
5
The following table presents a summary of net interest income for 2009, 2008, and 2007.
Summary of Consolidated Net Interest Income
|
|
Year Ended December 31, 2009 |
Year Ended December 31, 2008 |
Year Ended December 31, 2007 |
| ||||||||
|
|
| |||||||||||
|
(In Thousands of Dollars) |
Average Balance |
Interest |
Average Rate |
Average Balance |
Interest |
Average Rate |
Average Balance |
Interest |
Average Rate | |||
|
| ||||||||||||
|
Average Assets |
|
|
|
|
|
|
|
|
|
| ||
|
Interest Earning Assets: |
|
|
|
|
|
|
|
|
|
| ||
|
Taxable securities |
$98,413 |
$ 2,743 |
2.79% |
$ 82,858 |
$ 4,055 |
4.90% |
$ 61,077 |
$ 3,323 |
5.44% |
| ||
|
Tax exempt securities(1) |
31,700 |
2,010 |
6.34% |
33,904 |
2,167 |
6.40% |
30,883 |
1,915 |
6.20% |
| ||
|
Total Securities |
130,113 |
4,753 |
3.66% |
116,762 |
6,222 |
5.33% |
91,960 |
5,238 |
5.70% |
| ||
|
|
|
|
|
|
|
|
|
|
|
| ||
|
Loans(1) (2) |
1,112,810 |
70,696 |
6.35% |
1,130,188 |
76,793 |
6.80% |
1,004,973 |
75,510 |
7.51% |
| ||
|
Federal funds sold |
134 |
0 |
0.25% |
11,998 |
240 |
2.00% |
17,782 |
911 |
5.12% |
| ||
|
Interest bearing deposits |
57,297 |
136 |
0.24% |
5,477 |
60 |
1.10% |
3,854 |
171 |
4.44% |
| ||
|
Total Earning Assets |
1,300,354 |
75,585 |
5.82% |
1,264,425 |
83,315 |
6.59% |
1,118,569 |
81,830 |
7.32% |
| ||
|
|
|
|
|
|
|
|
|
|
|
| ||
|
Nonaccrual loans |
23,057 |
|
|
15,661 |
|
|
5,890 |
|
|
| ||
|
Less allowance for loan |
|
|
|
|
|
|
|
|
|
| ||
|
Loss |
(15,481) |
|
|
(12,262) |
|
|
(10,725) |
|
|
| ||
|
Cash and due from banks |
25,060 |
|
|
31,846 |
|
|
30,013 |
|
|
| ||
|
Other non-earning assets |
100,565 |
|
|
96,687 |
|
|
79,723 |
|
|
| ||
|
Total Assets |
$ 1,433,555
|
|
|
$ 1,396,357
|
|
|
$ 1,223,470 |
|
|
| ||
|
|
|
|
|
|
|
|
|
|
|
| ||
|
Average Liabilities |
|
|
|
|
|
|
|
|
|
| ||
|
Interest Bearing Liabilities: |
|
|
|
|
|
|
|
|
|
| ||
|
Demand |
$ 236,087 |
1,660 |
0.71% |
$ 221,732 |
$ 2,982 |
1.35% |
$ 189,989 |
$ 4,301 |
2.26% |
| ||
|
Savings |
163,249 |
974 |
0.60% |
156,326 |
1,801 |
1.16% |
142,996 |
2,642 |
1.85% |
| ||
|
Time |
511,269 |
16,208 |
3.17% |
498,443 |
20,685 |
4.15% |
446,136 |
21,706 |
4.87% |
| ||
|
Total Deposits |
910,605 |
18,842 |
2.07% |
876,501 |
25,468 |
2.91% |
779,121 |
28,649 |
3.68% |
| ||
|
|
|
|
|
|
|
|
|
|
|
| ||
|
Federal funds purchased |
|
|
|
|
|
|
|
|
|
| ||
|
and repurchase agreements |
45,070 |
136 |
0.31% |
48,227 |
919 |
1.91% |
41,706 |
1,701 |
4.08% |
| ||
|
FHLB advances and |
|
|
|
|
|
|
|
|
|
| ||
|
notes payable |
126,460 |
5,350 |
4.23% |
151,784 |
6,811 |
4.49% |
113,887 |
6,047 |
5.31% |
| ||
|
Subordinated debentures |
36,084 |
1,611 |
4.47% |
36,084 |
2,075 |
5.75% |
27,147 |
1,827 |
6.73% |
| ||
|
Total Interest Bearing |
|
|
|
|
|
|
|
|
|
| ||
|
Liabilities |
1,118,219 |
25,939 |
2.32% |
1,112,596 |
35,273 |
3.17% |
961,861 |
38,224 |
3.97% |
| ||
|
|
|
|
|
|
|
|
|
|
|
| ||
|
Demand Deposits |
153,962 |
|
|
147,804 |
|
|
135,956 |
|
|
| ||
|
Total Funds |
1,272,181 |
|
|
1,260,400 |
|
|
1,097,817 |
|
|
| ||
|
|
|
|
|
|
|
|
|
|
|
| ||
|
Other Non-Interest Bearing |
|
|
|
|
|
|
|
|
|
| ||
|
Liabilities |
16,791 |
|
|
17,463 |
|
|
18,116 |
|
|
| ||
|
Total Liabilities |
1,288,972 |
|
|
1,277,863 |
|
|
1,115,933 |
|
|
| ||
|
|
|
|
|
|
|
|
|
|
|
| ||
|
Average Shareholders’ Equity |
144,583 |
|
|
118,494 |
|
|
107,537 |
|
|
| ||
|
Total Liabilities and |
|
|
|
|
|
|
|
|
|
| ||
|
Shareholders’ Equity |
$ 1,433,555 |
|
|
$ 1,396,357 |
|
|
$ 1,223,470 |
|
|
| ||
|
|
|
|
|
|
|
|
|
|
|
| ||
|
Net Interest Income(1) |
|
$ 49,646 |
|
|
$48,042 |
|
|
$43,606 |
|
| ||
|
|
|
|
|
|
|
|
|
|
|
| ||
|
Rate Spread(1) |
|
|
3.50% |
|
|
3.42% |
|
|
3.35% |
| ||
|
|
|
|
|
|
|
|
|
|
|
| ||
|
Net Interest Margin (percent of |
|
|
|
|
|
|
|
|
|
| ||
|
Average earning assets) (1) |
|
|
3.82% |
|
|
3.80% |
|
|
3.90% |
| ||
(1) Presented on a fully taxable equivalent basis using a federal income tax rate of 35% for all periods presented.
(2) Interest income includes amortization of loan fees of $1,809,000, $1,974,000, and $1,756,000 for 2009, 2008, and 2007, respectively. Uncollected interest on nonaccrual loans is not included.
6
The table below provides an analysis of the changes in interest income and interest expense due to volume and rate:
|
|
2008/2009 |
2007/2008 |
| |||||||
|
|
|
|
|
|
| |||||
|
|
Change in Interest Due to: (1) |
Change in Interest Due to: (1) |
| |||||||
|
|
|
|
|
|
|
| ||||
|
|
Average Volume |
Average Rate |
Net Change |
Average Volume |
Average Rate |
Net Change | ||||
|
|
(In Thousands of Dollars) |
| ||||||||
|
|
|
|
|
|
|
| ||||
|
Interest Income: |
|
|
|
|
|
| ||||
|
Securities |
|
|
|
|
|
| ||||
|
Taxable Securities(2) |
$ 661 |
$ (2,003) |
$ (1,342) |
$ 1,092 |
$ (360) |
$ 732 | ||||
|
Tax-exempt Securities |
(133) |
(728) |
(861) |
192 |
60 |
252 | ||||
|
Total Securities |
528 |
(2,731) |
(2,203) |
1,284 |
(300) |
984 | ||||
|
|
|
|
|
|
|
| ||||
|
Loans(2) |
(1,166) |
(5,097) |
(6,263) |
8,899 |
(7,616) |
1,283 | ||||
|
Federal Funds Sold |
(127) |
(113) |
(240) |
(233) |
(438) |
(671) | ||||
|
Interest Bearing Deposits |
157 |
(81) |
76 |
53 |
(164) |
(111) | ||||
|
|
|
|
|
|
|
| ||||
|
Total Interest Income on Earning Assets |
(608) |
(8,022) |
(8,630) |
10,003 |
(8,518) |
1,485 | ||||
|
|
|
|
|
|
|
| ||||
|
|
|
|
|
|
|
| ||||
|
|
|
|
|
|
|
| ||||
|
Interest Expense: |
|
|
|
|
|
| ||||
|
Deposits |
|
|
|
|
|
| ||||
|
Interest Paying Demand |
182 |
(1,504) |
(1,322) |
634 |
(1,953) |
(1,319) | ||||
|
Savings |
77 |
(904) |
(827) |
228 |
(1,069) |
(841) | ||||
|
Time |
2,720 |
(7,197) |
(4,477) |
2,379 |
(3,399) |
(1,020) | ||||
|
Total Deposits |
2,979 |
(9,605) |
(6,626) |
3,241 |
(6,421) |
(3,180) | ||||
|
|
|
|
|
|
|
| ||||
|
|
|
|
|
|
|
| ||||
|
Federal Funds Purchased and Securities |
|
|
|
|
|
| ||||
|
Sold under Agreements to Repurchase |
(57) |
(726) |
(783) |
234 |
(1,016) |
(782) | ||||
|
FHLB and Other Notes Payable |
(1,088) |
(373) |
(1,461) |
1,800 |
(1,036) |
764 | ||||
|
Subordinated Debentures |
0 |
(464) |
(464) |
541 |
( 293) |
248 | ||||
|
|
|
|
|
|
|
| ||||
|
Total Interest Expense on Liabilities |
1,834 |
(11,168) |
(9,334) |
5,816 |
(8,766) |
(2,950) | ||||
|
|
|
|
|
|
|
| ||||
|
Net Interest Income |
$ (2,442) |
$ 3,146 |
$ 704 |
$ 4,187 |
$ 248 |
$ 4,435 | ||||
(1) Changes in volume/rate have been allocated between the volume and rate variances on the basis of the ratio that the volume and rate variances bear to each other.
(2) Interest is presented on a fully taxable equivalent basis using a federal income tax rate of 35%.
In 2009, the average rate realized on earning assets was 5.75%, a decrease of 84 basis points from the 2008 results of 6.59%, and 157 basis points lower than the 7.32% realized in 2007. During 2007 the Federal Reserve began decreasing rates late in the third quarter with a 50 basis point decrease in September, followed by two 25 basis point reductions in October and December. The result of these changes left the prime rate at 7.25% at year end 2007. In 2008, in reaction to a weakening economy and a credit crisis in the financial markets, the Federal Reserve aggressively lowered rates by 2.25% between January and April bringing the prime rate down to 5.00%. After a six month pause in the rate reduction strategy, the Federal Reserve then lowered rates by another 1.75% in the fourth quarter with the prime rate settling in at 3.25% at year end 2008, where it remained for all of 2009.
Average loans outstanding decreased $10 million in 2009 when compared with 2008. As of December 31, 2009, approximately 24% of the loan portfolio was comprised of variable rate instruments, the same mix as the end of 2008. The remaining 76% of the loan portfolio is made up of fixed rate loans that do not re-price until maturity. Of the fixed rate loans approximately $266 million, or 31% of the fixed rate loan portfolio, matures within twelve months and are subject to rate adjustments at maturity. During the year, as re-pricing opportunities occurred, we put interest rate floors in place to protect our margin from falling. At year end 2009, 71% of our variable rate commercial loan portfolio was protected by a floor compared with only 34% at the end of 2008.
7
As short term interest rates decreased in 2008 and 2009, maturing securities in the investment portfolio were replaced with securities of comparable quality bearing generally lower yields. As a result, maturing securities ran off from the investment portfolio at higher rates than comparable current offerings, decreasing the overall investment portfolio yield from 5.70% in 2007 to 5.33% in 2008 and 3.09% in 2009.
Average total interest bearing deposits for the year increased $34 million. The average rate paid on interest bearing liabilities was 2.32% in 2009, compared to 3.17% in 2008, and 3.97% in 2007. Deposit rates decreased during 2008 and 2009 with the faltering economy after increasing in 2007 primarily due to a migration to time deposits. The average rates paid on time deposits decreased 98 basis points in 2009 compared with 2008 and 170 basis points compared with 2007, as new and renewing deposits re-priced to lower rates. Rates on checking and savings deposits also decreased in 2009, falling 64 basis points and 56 basis points, respectively. These same rates were 91 basis points and 69 basis points lower in 2008 than they had been in 2007.
Brokered CDs carry an interest rate that is generally higher than the rate offered in local markets and have been issued with original maturities ranging from three months to two years. The average balance of brokered CDs in 2009 was $19 million, compared with $30 million in 2008 and $31 million in 2007. These CDs carried an average interest rate of 2.18% in 2009 compared with 4.36% in 2008, and 5.28% in 2007.
We fund a portion of our loan growth with borrowings from the Federal Home Loan Bank (FHLB) and notes payable. During 2009, the average outstanding balance of FHLB advances and notes payable decreased $25 million and the year-end balance decreased $56 million when compared with 2008 balances. While FHLB borrowings are one method of funding loans when core deposits are not available, the cost is typically higher than our core deposit costs. The average rate paid for Federal Home Loan Bank advances and notes payable decreased 26 basis points in 2009, to 4.23%, when compared with the 2008 rate of 4.49%. Borrowings from the Federal Home Loan Bank carry significant prepayment penalties that act as a deterrent to early payment.
In July of 2007, we issued $15.5 million in subordinated debentures to fund a portion of the ICNB acquisition. That issuance was split evenly between debentures that carry a fixed rate of 6.566% for five years, at which time they will convert to a variable interest rate of 90 day LIBOR plus 1.35%, and variable rate debentures that carry a rate of 90 day LIBOR plus 1.35%. The variable rate debentures re-price quarterly. In January of 2006, we issued $10.3 million in subordinated debentures that carry a fixed rate of 6.049% for five years, at which time they will convert to a variable interest rate of 90 day LIBOR plus 1.27%. In October of 2004, we issued $10.3 million in subordinated debentures, at a variable interest rate of 90 day LIBOR plus 1.99% which re-price on a quarterly basis. The average rate paid on all subordinated debentures during 2009 was 4.47% compared with 5.75% and 6.73% in 2008 and 2007, respectively.
We utilize short term borrowing, made up of Federal Funds Purchased and Repurchase Agreements as a source of liquidity and to balance our daily cash needs. Average short term borrowed funds decreased by $3 million when 2009 is compared with 2008. We also maintained a variable rate line of credit, which we used from time to time to provide temporary funding. There was $5.6 million outstanding at the end of 2008, which was paid off in January 2009. There were no balances outstanding on the line of credit at the end of 2009 and the line was terminated as we determined it no longer was necessary.
The 2009 rate spread of 3.43% is one basis point higher than the 2008 spread of 3.42%, and eight basis points higher than the 2007 spread of 3.35%. Tax equivalent net interest income increased $704,000 in 2009 as an increase in total average earning assets of $36 million and a two basis point improvement in the net interest margin drove higher interest. The net interest margin of 3.82% for 2009 was two basis points above 2008, but eight basis points lower than in 2007. The increase in the rate spread in 2009 was the result of rates on average earning assets decreasing 84 basis points while the average cost of interest bearing liabilities decreased 85 basis points. The two basis point increase in the net interest margin was a result of a lower percentage of earning assets being funded by non interest bearing liabilities and equity as well as the management of rates on both loans and deposits during the year. Average earning assets represented 91% of total average assets in all three years 2007 through 2009.
Provision for Loan Losses
In accordance with accounting standards, we allocate a portion of the allowance for loans that we determine to be impaired. We also analyze other loans for specific allocations in order to arrive at the appropriate allowance for loan losses. If a loan for which allocations had been established pays off, or the risk of loss is otherwise reduced, we reverse those specific allocations. The methodology described above resulted in a provision for loan losses in 2009 of $14.7 million, compared with $8.3 million in 2008, and $2.0 million in 2007. The higher provision charges in 2008 and 2009 were incurred as the struggling Michigan economy resulted in new loan problems which were either charged off, or allocated reserves for probable losses were established during the year.
8
During 2009, we had recoveries of previously charged off loans totaling $1.0 million, and favorable outcomes on certain previously identified problem loans, reducing the amount of provision expense needed, while deterioration of certain loans to problem status and charge offs of $11.2 million increased the amount of provision expense needed. In 2008, we had recoveries of previously charged off loans totaling $676,000 and favorable outcomes on certain previously identified problem loans, reducing the amount of provision expense needed, while deterioration of certain loans to problem status and charge offs of $5.1 million increased the amount of provision expense needed. Charged off loans, for which allowance had been established in a previous year totaled $1 million reducing the amount we needed to provide in 2007 to maintain the allowance for loan losses at an adequate level.
At December 31, 2009, the allowance for loan losses as a percent of total loans was 1.70% compared to 1.26% and 1.02% at December 31, 2008, and December 31, 2007, respectively. Total nonperforming loans were 3.65% of ending loans at December 31, 2009, compared to 2.14% and 1.81% at the two previous year ends. The increase in nonperforming in 2009 was due to an increase in nonaccrual loans of $11.1 million, an increase in restructured loans of $6.8 million, net of a reduction in 90 day past due loans of $1.8 million. The increase in nonperforming loans in 2008 reflects an increase in 90 day past due loans of $1.8 million and an increase in nonaccrual loans of $9.1 million.
Net charged off loans totaled $10.2 million in 2009 compared to $5.1 million in 2008, and $2.8 million in 2007. Net charged off loans as a percent of average loans were 0.90% in 2009, 0.45% in 2008, and 0.28% in 2007. Charge offs of $2.9 million in 2009 had specific reserves established in a prior year, while in 2008 and 2007, $929,000 and $102,000 of specific allowance allocations had been set aside at the end of the prior year. Provision expense did not need to be increased to cover those previously identified losses.
Non-interest Income
Non-interest income increased $11.4 million as gains on the sale of mortgage loans increased $5.0 million and we recorded $1.3 million of securities related gains compared with $5.9 million of losses in the previous year.
The losses on securities in 2008 were due to impairments on money market preferred securities.
Revenue from non bank subsidiaries increased $174,000 as we saw higher revenue from our title insurance company due to activity in mortgage banking during the year. We recorded $150,000 of other than temporary impairment associated with valuation of two trust preferred securities this year compared with $5.4 million relating to money market preferred auction rate securities in 2008. In addition, we sold most of the auction rate securities holding from the prior year, after the market recovered, netting $1.8 million in gains on these securities. We recognized $213,000 of losses on valuation changes in our trading account securities portfolio during 2009, $454,000 in losses in 2008, and $628,000 in losses in 2007 as market values of those stocks continued to decline.
Gains on the sale of mortgage loans increased $5.0 million during 2009 after increasing $837,000, or 50% in 2008. A low rate environment spurred a mortgage re-finance boom that lasted most of the year, generating the higher gains, while allowing customers to reduce their monthly mortgage payments. Service charges on deposit accounts decreased $316,000 in 2009 after increasing $349,000 in 2008. The improvement in both gains on the sale of loans and service charges on deposit accounts during 2008 was aided by the full year effect of additional revenue from the ICNB acquisition compared with the prior year, adding $160,000 and $301,000, respectively.
When a mortgage is refinanced or pre-paid, capitalized mortgage servicing rights relating to that mortgage are written off. Refinance activity in 2009 was significantly higher due to low interest rates, resulting in more mortgage loans prepayments, and therefore $756,000 higher amortization cost of serving rights, which caused mortgage servicing income to be lower by $730,000. In 2009, mortgage servicing income (servicing income net of amortization of capitalized serving rights) was a negative $471,000 compared with income of $258,000 in 2008 and $555,000 in 2007.
9
Deposit account service charges were $4,509,000, a decrease of 7% in 2009 when compared with $4,825,000 in 2008, and were just $34,000 higher than 2007 which included only six months of income from the ICNB acquisition. Courier and cash delivery services income decreased 13% to $751,000 in 2009 after having decreased 6% in 2008. This revenue is from the operations of 1st Armored Incorporated, which operates an armored car and courier business, and does not include income from servicing Firstbank affiliates. The revenue from this unit has been declining for several years as pricing pressure from competition and a migration toward electronic transfer of bank transactions has reduced their volume of business.
Gains and losses from securities activities resulted in a pre-tax gain of $1.3 million in 2009 compared with a loss of $5.9 million in 2008. Trading account securities losses caused a loss of $213,000 this year compared with $454,000 in 2008 and a $628,000 loss in 2007. The available for sale portfolio had a gain of $1.5 million in 2009 compared with a loss of $5.5 million in 2008. Market conditions resulted in our decision to record other than temporary impairment charges of $5.4 million during 2008. The original value of the money market preferred portfolio was $9.4 million and was written down to a value of $4.0 million. The securities in this portfolio have made all quarterly dividend payments as required, with the exception of those secured by the preferred stock of the Federal Home Mortgage Association (FHMA). The value of the FHMA securities was written down from an original value of $1.7 million to a year end value of $34,000 in 2008. At year end 2009, all of the money market preferred securities mentioned above were sold, except for the 34,000 shares of FHMA and 64,000 shares of Goldman Sachs Preferred Series D.
We exited our real estate sales business in the third quarter of 2007. The Michigan real estate market continues to be soft and it was determined that the business was not contributing to our goals. As a result of this action, we reported no revenue from this unit in 2008 or 2009 compared with $492,000 in 2007. The unit’s contribution to operating income in the prior years had been negligible.
We also reduced our stake in the title insurance business, through a reorganization of our 100% owned 1st Title Insurance Agency, whereby we now have ownership of 49% in the business. As a result of the reduction to below 50% we no longer consolidate the results of this business into our financial statements beginning in November 2009. Title insurance sales increased $291,000 compared with last year after declining modestly in 2008.
Other non-interest income was $1,122,000, compared with $1,108,000 in 2008 and $2,005,000 in 2007. The decline in this line item from 2007 levels was largely due to a negative impact of earnings on our deferred compensation plan, which was a negative $133,000 in 2009, a negative $424,000 in 2008 and positive earnings of $328,000 in 2007. Accounting rules require us to report the earnings of the plan through non-interest income, and an offsetting entry to non-interest expense for the same amount. Also affecting the comparison were losses on the sale of Other Real Estate Owned of $336,000 in 2009, $184,000 in 2008, compared with negligible gains in 2007.
Non-interest Expense
Salary and employee benefits expenses increased $60,000, or 0.3%, when 2009 is compared with 2008. Salary and employee benefits increased $1.6 million in 2008 compared with 2007 primarily as a result of the ICNB acquisition mid-year 2007. The ICNB acquisition added $1.5 million more to our 2008 expense, compared with 2007. Absent the full year effects of the ICNB acquisition, salary and employee benefits would have increased just $73,000 from 2007 to 2008. We employed 466 full time equivalent employees at the end of 2009 compared with 483 at the end of 2008, and 492 at year end 2007.
Occupancy and equipment costs decreased $683,000 in 2009 compared with 2008 as several large assets reached full depreciation late in 2008 and early 2009 and we sold one branch in April 2009. In 2008 occupancy and equipment costs increased $967,000 when compared with 2007. The full year effect of the ICNB acquisition caused $637,000 of the increase in 2008 as we incurred a full year of costs compared with a half year in 2007.
FDIC expense increased to $2.4 million, compared with $562,000 in 2008 and $269,000 in 2007. The large increase in 2009 was due to a special assessment in the second quarter of $642,000 and higher assessment fees as the FDIC rebuilds its fund after being depleted from bank failures. Costs going forward are expected to remain elevated as we prepaid $6.5 million for the next three years fees at the end of 2009.
10
Amortization of intangibles was $934,000 in 2009, compared with $1.1 million in 2008, a reduction of $137,000. Amortization expense in 2007 was $1.1 million, $64,000 higher than 2008. The 2007 results included a $275,000 impairment charge associated with the sale of our CA Hanes, Realty, Inc. subsidiary. Absent this charge, 2008 cost would have been $311,000 higher than 2007 due to the additional amortization resulting from the mid-year 2007 acquisition of ICNB.
Expenses for outside professional services increased $89,000 compared with 2008. This same item was $62,000 lower in 2008 when compared with 2007. Advertising and special promotion expense was $1.6 million, up $196,000, or 14%, in 2009 following an increase in 2008 of $151,000 as we increased our marketing efforts. The ICNB acquisition added $236,000 to advertising and marketing in 2008 and $170,000 in 2007.
Other real estate costs increased $1.2 million to $2.4 million in 2009 as the cost of carrying more properties for longer time frames and write downs due to decreasing property values drove the cost up. Other real estate costs were $1.2 million in 2008 and $387,000 in 2007.
Other non-interest expense increased to $8.9 million from $8.7 in 2008, an increase of $279,000, or 3%, and $8.6 million in 2007. The ICNB acquisition added $1.8 million to our expense in 2008 compared with the half year costs in 2007 of $908,000.
Federal Income Tax
In 2009 we had a federal tax expense of $1,044,000 based on pre-tax earnings of $3,735,000, resulting in an effective tax rate of 28%. At year end we determined that we were unlikely to be able to claim certain deferred tax benefits associated with capital losses on securities recorded in 2008. As a result, we recorded a non-cash charge of $659,000 to our federal income tax expense and established a valuation allowance against our deferred tax assets. Absent this charge, our effective tax rate for 2009 would have been 10%. In 2008 we had a federal tax benefit of $1,062,000 based on a pre-tax loss of $343,000. The tax benefit was larger than our pre-tax income due to tax exempt earnings during the year. Our effective federal income tax rate was 26% for 2007. The 2008 tax rate was affected by the low level of earnings before taxes in relation to non-taxable earnings for the year. Each year we evaluate our contingent tax liability and make adjustments as deemed necessary. In 2007, we lowered our contingent liability by approximately $100,000 due to certain positions that we now believe would not be challenged by the IRS.
FINANCIAL CONDITION
Total assets at December 31, 2009 were $1.482 billion, exceeding December 31, 2008 total assets of $1.425 billion by $57 million, or 4.0%. Total portfolio loans decreased 3.1% at December 31, 2009 compared with the balance at the previous year end. Commercial loans increased $7.6 million, or 4.1%. Residential mortgage loans decreased $27 million, or 6.7%, while commercial real estate loans increased $6.3 million, or 1.6%. Construction loans were $18 million lower at December 31, 2009, decreasing 17.4%, from the previous year end. Mortgages serviced for others grew by $88 million, or 17.0%.
|
(In Thousands of Dollars) |
| |||
|
|
2009 |
2008 |
Change |
% Change |
|
Commercial |
$ 192,096 |
$ 184,455 |
$ 7,641 |
4.1% |
|
Commercial real estate |
397,863 |
391,572 |
6,291 |
1.6% |
|
Residential real estate |
376,683 |
403,695 |
(27,012) |
(6.7%) |
|
Construction |
85,229 |
103,206 |
(17,977) |
(17.4%) |
|
Consumer |
69,736 |
75,296 |
(5,560) |
(7.4%) |
|
Total |
$1,121,607 |
$ 1,158,224 |
$ (36,064) |
(3.1%) |
|
|
|
|
|
|
|
Mortgages serviced for others |
$ 605,800 |
$ 518,000 |
$ 87,800 |
17.0% |
Total securities available for sale increased $47 million, or 41%. The increase was mainly due to investment of our available funds at better rates for the short term. Securities available for sale were 10.6% of total assets at year end 2009, compared with 7.9% at the end of 2008.
Premises and equipment decreased by $1.5 million after recognized depreciation of $2.7 million. The decrease in premise and equipment resulted from depreciation expense exceeding expenditures on new facilities and equipment during the year.
11
Total deposits increased at the end of 2009 to $1.149 billion, an increase of 9.8%, compared to $1.046 billion at year end 2008. Non-interest bearing demand deposit balances increased from the end of 2008, by $15 million to $164 million at year end 2009, an increase of 10.1%. Interest bearing demand deposits increased by $32 million, or 14.3%, and savings account balances increased $20 million, or 13.1%.
At the end of 2009, we had $23 million of wholesale CDs on the balance sheet, compared with $31 million at the end of 2008. Wholesale CDs, which contain both brokered CDs and internet CDs, generally carry a higher interest rate than locally generated CDs of similar duration but are available in large dollar pools which results in lower operational cost than smaller dollar local deposits. Including wholesale CDs, total time deposits increased $35 million, or 6.7% compared with the end of 2008. Excluding the wholesale CDs, time deposits would have increased from $489 million in 2008 to $532 million in 2009, an increase of 8.8%.
Securities sold under agreements to repurchase and federal funds purchased decreased by $14 million. Federal Home Loan Bank advances decreased by $56 million at December 31, 2009 compared with December 31, 2008. Notes payable decreased by $6 million, as we repaid our borrowing on our line of credit. The decrease in Federal Home Loan Bank advances was possible due to core deposit growth exceeding loan demand.
Asset Quality
The Michigan and national economies continued to struggle throughout 2009, as Michigan reported the worst unemployment rate in the nation for most of the year. Many banks in our state have shown significant losses associated with bad loans. We were not immune from the impact that the economy had on businesses and consumers. Our net charged off loans increased in 2009 after having increased in 2008, as customers that had been able to sustain their payments in better times succumbed to the economic conditions. Our nonaccrual loans also increased substantially from prior year end. We remain vigilant at monitoring these loan relationships and working through issues with our customers.
Loans are carried at an amount which management believes will be collected. A balance considered not collectible is charged against (reduction of) the allowance for loan losses. In 2009, net charged off loans were $10.2 million double the $5.1 million in 2008. Net charged off loans as a percentage of average loans were 0.90% and 0.45% in 2009 and 2008. Charge offs continued to be a problem at our newest affiliate bank, which result in $6.0 million of the charge offs, however, charged off loans increased in all six of our banks. Charged off loans in 2008 were largely the result of writing off problem loans that emerged in our newest affiliate bank, which recorded $3.1 million in net charge offs during 2008.
Nonperforming loans are defined as nonaccrual loans, loans 90 days past due and any loans where the terms have been renegotiated to below market terms. Total nonperforming loans were $41.0 million and $24.8 million at December 31, 2009 and 2008, respectively. Total nonaccrual loans were $30.7 million at December 31, 2009, compared to $19.6 million at the end of 2008. The increase in nonaccrual loans was largely due to economic stresses being felt in Michigan and across the nation. Borrowers which had previously been able to meet their loan obligations during better times have become unable to do so in the current environment. Loans past due 90 days or more decreased to $3.2 million at year end 2008 compared with $5.0 million at the end of 2008, in part because we were more aggressive about moving these loans to nonaccrual during the year. Impaired loans are commercial loans for which we believe it is probable that we will be unable to collect all amounts due according to the contractual terms of the loan agreement. The average investment in impaired loans was $29.0 million during 2009 compared to $23.4 million during 2008. At year end, impaired loans were $37.8 million compared with $19.6 million at December 31, 2008. In the current environment, we have deemed it necessary to work with some customers to restructure loans to reduce the probability of loss to the bank. At the end of the year, we had $7.1 million of restructured loans where the borrower was in compliance with the terms of agreement, or delinquent less than 90 days.
The allowance for loan losses was $4.5 million, or 31%, higher at year end 2009 compared with 2008. This increase was a result of provision expense of $14.7 million exceeding charged off loans of $11.2 million during the year, and recoveries of prior charged off loans of $1.0 million. Through our analysis process, we determined that it was necessary to provide more for future losses than our net charge offs this year as a result of several factors. We record provision for loan loss expense when loans for which losses are likely, are identified. For loans which carry an allocated allowance, no expense is recognized at the time of charge off because it has been previously provided for. See the discussion of loan loss provision expense previously presented for additional information. The allowance for loan losses represents 1.70% of outstanding loans at the end of 2009, compared with 1.26% at December 31, 2008.
12
We maintain the allowance at a level which we believe adequately provides for losses inherent in the loan portfolio. Such losses are estimated by a variety of factors, including specific examination of certain borrowing relationships and consideration of historical losses incurred on certain types of credits. We focus on early identification of problem credits through ongoing reviews by management, loan personnel and an outside loan review specialist. Please refer to Note 6 of the Notes to Consolidated Financial Statements for more information on impaired loans.
LIQUIDITY AND INTEREST RATE SENSITIVITY
Asset liability management aids us in achieving reasonable and predictable earnings and liquidity while maintaining a balance between interest earning assets and interest bearing liabilities. We maintain a complex interest rate risk modeling system which assists management in understanding the impact of changes in rates, both in the past, and forecasted. This information allows management to make adjustment as to its view toward certain products with regard to rate and term in order to minimize our interest rate risk in a changing rate environment.
Liquidity management involves the ability to meet the cash flow requirements of our customers. These customers may be either borrowers needing to meet their credit requirements or depositors wanting to withdraw funds. Management of interest rate sensitivity attempts to manage the level of varying net interest margins and to achieve consistent net interest income through periods of changing interest rates. The net interest margin was 3.82% in 2009 compared to 3.80% in 2008. The yield on the securities portfolio fell 224 basis points, from 5.33% in 2008 to 3.09% in 2009. Loan yields decreased 46 basis points, from 6.34% in 2009, to 6.80% in 2008. Deposit costs decreased 84 basis points from 2.91% in 2008 to 2.07% in 2009. Loan demand was muted through the year as customers were cautious about the economy, resulting in a decrease of $17 million in average. Average total earning assets increased $36 million as average securities investments increased $13 million and average interest bearing deposits with banks increased $52 million. The interest bearing deposit balances at banks is primarily due to excess balances held at the Federal Reserve.
Full year average balances in time deposits increased $13 million compared with the prior year, while average demand and savings balances increased $21 million. The use of Federal Home Loan Bank advances continued to be a significant source of longer term funding; however, average advances decreased from the prior year by $25 million as we utilized increased core deposits to reduce these borrowings.
A decision to decrease deposit rates immediately affects most rates paid, other than time deposits, and has an immediate positive impact on net interest margin. With the exception of variable rate loans, an increase in loan rates does not affect the yield until a new loan is made or an existing loan is renewed. Likewise, an increase in deposit rates raises our cost of funds, and a decrease in loan rates only effects variable rate loans, until such time as a new fixed rate loan is generated, or re-finances. The prime rate is used to price virtually our entire variable rate loan portfolio. Therefore, reductions in the prime rate immediately have a negative effect on earnings, while an increase in prime rate has a positive effect on earnings.
The prime rate, was held constant at 3.25% throughout all of 2009 as the Federal Reserve maintained its target fed funds rate at a range of 0 to 0.25% for the year in an effort to get the economy growing again. Prime rate began 2008 at 7.25%, was reduced seven times during the year, beginning with two decreases in January that cumulatively were 1.25%. That was followed by two more reductions in March and April of three quarters of a percent and one quarter of a percent, respectively. With the prime rate at 5.00%, the Federal Reserve went on hold until October. With the economy faltering and a financial credit crunch in process, the Federal Reserve lowered rates by one half a percent twice in October and by three quarters of a percent in December causing the prime rate to fall to its year-end level of 3.25%.
The principal sources of liquidity for us are maturing securities, federal funds purchased or sold, loan payments by borrowers, investment securities, loans held for sale, deposit or deposit equivalent growth and Federal Home Loan Bank advances. Securities maturing or re-pricing within one year at December 31, 2009 were $23 million, compared to $72 million at December 31, 2008. Total investments available for sale were $157 million at year end 2009, an increase of $44 million from the prior year end.
13
The table below shows the interest sensitivity gaps for five different intervals as of December 31, 2009. Deposits that do not have a fixed maturity date are shown as immediately re-pricing according to reporting conventions.
|
|
Maturity or Re-Pricing Frequency | ||||
|
|
|
(In Millions of Dollars) |
| ||
|
|
1 Day |
2 Days through 3 Months |
4 Months through 12 Months |
13 Months through 5 Years |
More than 5 Years |
|
| |||||
|
| |||||
|
Interest Earning Assets: |
|
|
|
|
|
|
Loans |
$ 277.6 |
$ 76.4 |
$ 182.0 |
$ 522.0 |
$ 64.7 |
|
Securities |
0 |
28.7 |
61.3 |
44.9 |
20.9 |
|
Other earning assets |
80.1 |
0 |
0 |
0 |
13.0 |
|
Total |
357.7 |
105.1 |
243.3 |
566.9 |
98.6 |
|
|
|
|
|
|
|
|
Interest Bearing Liabilities: |
|
|
|
|
|
|
Deposits |
429.8 |
89.0 |
268.4 |
197.5 |
0.0 |
|
Other interest bearing liabilities |
39.4 |
95.0 |
3 .1 |
33.4 |
4.8 |
|
Total |
$ 469.2 |
$ 184.0 |
$ 271.5 |
$ 230.9 |
$ 4.8 |
|
|
|
|
|
|
|
|
Interest Sensitivity Gap |
$ (111.5) |
$ (78.9) |
$ (28.2) |
$ 336.0 |
$ 93.8 |
|
|
|
|
|
|
|
|
Cumulative Gap |
$ (111.5) |
$ (190.4) |
$ (218.6) |
$ 117.4 |
$ 211.2 |
For the one day interval, maturities of interest bearing liabilities exceed those of interest earning assets by $112 million. Included in the one day maturity classification are $430 million in savings and checking accounts which are contractually available to our customers immediately, but in practice, function as core deposits with considerably longer maturities. In the two day through the five year time frame, interest sensitive assets exceed interest sensitive liabilities by $229 million, resulting in a cumulative position of interest sensitive assets exceeding interest sensitive liabilities by $117 million through five years. For the time period greater than five years, the analysis shows an asset sensitive position, such that cumulatively, interest sensitive assets exceed interest sensitive liabilities by $211 million.
Showing a negative cumulative gap through the twelve month period does not necessarily result in a corresponding increase in net interest income during a falling rate environment. In practice, deposit rates do not change as rapidly as would be indicated by the contractual availability of deposit balances to customers. Also, changes in the steepness of the yield curve can cause differing effects on different products. Some of the benefit associated with lower deposit rates is mitigated by rate decreases on variable rate loans, renewals of fixed rate loans to lower rates, and customer prepayments. Conversely, showing a positive cumulative gap through the twelve month period does not necessarily result in a corresponding increase in net interest income during a rising rate environment for similar reasons.
Interest rate sensitivity varies with different types of interest earning assets and interest bearing liabilities. Overnight investments, on which rates change daily, and loans tied to the prime rate differ considerably from long term investment securities and fixed rate loans. Time deposits over $100,000 and money market accounts are more interest sensitive than regular savings accounts. Comparison of the re-pricing intervals of interest earning assets to interest bearing liabilities is a measure of the interest sensitivity gap, not interest rate risk. Balancing interest rate sensitivity is a continual challenge in a changing rate environment. We use a sophisticated computer program to perform analysis of interest rate risk, assist with our asset and liability management, and measure the expected impact of interest rate changes and our sensitivity to those changes.
CONTRACTUAL OBLIGATIONS, COMMITMENTS, CONTINGENT LIABLILITES, AND OFF-BALANCE SHEET ARRANGEMENTS
We have various financial obligations, including contractual obligations and commitments that may require future cash payments.
14
The following table presents, as of December 31, 2009, significant fixed and determinable contractual obligations to third parties by payment date.
|
(In Thousands of Dollars) |
|
| ||||||||
|
Contractual Obligation |
|
One Year or less |
1 - 3 Years |
3 - 5 Years |
More than 5 Years |
Total | ||||
|
|
|
|
|
|
|
|
|
|
|
|
|
Time Deposits |
|
$ 360,319 |
|
$ 169,272 |
|
$ 22,013 |
|
$ 3,598 |
|
$ 555,202 |
|
Federal Funds Borrowed and |
|
|
|
|
|
|
|
|
|
|
|
Repurchase Agreements |
|
39,409 |
|
0 |
|
0 |
|
0 |
|
39,409 |
|
Long Term Debt |
|
66,419 |
|
24,826 |
|
1,500 |
|
7,518 |
|
100,263 |
|
Subordinated Debt |
|
0 |
|
0 |
|
0 |
|
36,084 |
|
36,084 |
|
Operating Leases |
|
583 |
|
1,021 |
|
551 |
|
0 |
|
2,155 |
Further discussion of the nature of each obligation is included in Notes 7, 10, 11, 12, and 13 to the consolidated financial statements.
Our operating lease obligations represent short and long-term lease and rental payments, primarily for facilities, and to a lesser degree for certain software and data processing equipment.
The following table details the amounts and expected maturities of significant commitments as of December 31, 2009.
|
(In Thousands of Dollars) |
|
|
| ||
|
|
One Year |
One to |
Three to |
Over |
|
|
|
Or Less |
Three Years |
Five Years |
Five Years |
Total |
|
Credit: |
|
|
|
|
|
|
Commercial real estate |
$ 6,944 |
$ 1,335 |
$ 1,124 |
$ 1,017 |
$ 10,420 |
|
Residential real estate |
4,726 |
10 |
22 |
0 |
4,758 |
|
Construction loans |
4,635 |
148 |
419 |
134 |
5,336 |
|
Revolving home equity and credit card lines |
4,057 |
10,781 |
19,433 |
3,571 |
37,842 |
|
Other |
60,122 |
3,907 |
1,890 |
11,210 |
77,129 |
|
Commercial standby letters of credit |
21,684 |
736 |
0 |
3,000 |
25,420 |
Commitments to extend credit, including loan commitments, standby letters of credit and commercial letters of credit, do not necessarily represent future cash requirements in that these commitments often expire without being drawn upon. Further discussion of these commitments is included in Note 18 to the consolidated financial statements.
CRITICAL ACCOUNTING POLICIES
Certain of our accounting policies are important to the portrayal of our financial condition since they require management to make difficult, complex or subjective judgments, some of which may relate to matters that are inherently uncertain. Estimates associated with these policies are susceptible to material changes as a result of changes in facts and circumstances. Facts and circumstances which could affect these judgments include, without limitation, changes in interest rates, in local and national economic conditions or the financial condition of borrowers. Our significant accounting policies are discussed in detail in Note 1 of the Notes to the Consolidated Financial Statements.
We view critical accounting policies to be those which are highly dependent on subjective or complex judgments, estimates and assumptions, and where changes in those estimates and assumptions could have a significant impact on the financial statements. We believe that our critical accounting policies include determining the allowance for loan losses, determining the fair value of securities and other financial instruments, including possible impairment of goodwill and other assets, the valuation of mortgage servicing rights, determination of purchase accounting adjustments, and estimating state and federal tax liabilities.
Allowance for Loan Losses The allowance for loan losses is a valuation allowance for probable incurred credit losses. We use a quantitative and qualitative methodology for analyzing factors which impact the allowance for loan losses consistently across our six banking subsidiaries. The process applies risk factors for historical charge-offs and delinquency experience, portfolio segment weightings and industry and regional factors and trends as they affect the banks’ portfolios. The consideration of exposures to industries potentially most affected by current risks in the economic and political environment, and the review of potential risks in certain credits that either are, or are not, considered part of the non-performing loan category contributed to the establishment of the allowance levels at each bank. Loan losses are charged off against the allowance when management believes the uncollectibility of a loan balance is confirmed.
Loans are reviewed on an ongoing basis for impairment. A loan is impaired when it is probable that we will be unable to collect all amounts due substantially in accordance with the contractual terms of the loan agreement. Impaired loans are measured based on the present value of expected cash flows discounted at the loan’s effective interest rate or, as a practical expedient, the fair value of collateral if the loan is collateral dependent. Loans considered to be impaired are reduced to the present value of expected future cash flow or to the fair value of collateral by allocating a portion of the allowance for loan losses to such loans. If these allocations cause an increase in the calculated allowance for loan losses, such increase is reported as provision for loan loss expense. Increases or decreases in carrying value due to changes in estimates of future payments or the passage of time are reported as reductions or increases in the provision for loan losses.
Smaller balance homogeneous loans such as residential first mortgage loans secured by one to four family residences, residential construction, automobile, home equity and second mortgage loans, are collectively evaluated for impairment. Commercial loans and first mortgage loans secured by other properties are evaluated individually for impairment. When credit analysis of the borrower’s operating results and financial condition indicates the underlying ability of the borrower’s business activity is not sufficient to generate adequate cash flow to service the business’ cash needs, including our loans to the borrower, the loan is evaluated for impairment. Often this is associated with a delay or shortfall in payments of 90 days or less. Commercial loans are rated on a scale of 1 to 9, with grades 1 to 4 being satisfactory grades, 5 and 6 special attention or watch, 7 substandard, 8 doubtful, and 9 loss. Loans graded 6 through 9 are considered for impairment. Loans are generally moved to nonaccrual status when 90 days or more past due. These loans are often considered impaired. Impaired loans, or portions thereof, are charged off when deemed uncollectible.
Fair Value of Securities and Other Financial Instruments Securities available for sale consist of bonds and notes which might be sold prior to maturity due to changes in interest rate, prepayment risks, yield and availability of alternative investments, liquidity needs or other factors. Securities classified as available for sale are reported at their fair value. Declines in the fair value of securities below their cost that are other than temporary are reflected as realized losses. In estimating other-than-temporary losses, management considers: (1) the length of time and extent that fair value has been less than carrying value; (2) the financial condition and near term prospects of the issuer; and (3) our ability and intent to hold the security for a period of time sufficient to allow for any anticipated recovery in fair value.
Market values for securities available for sale are obtained from outside sources and applied to individual securities within the portfolio. The difference between the amortized cost and the current market value of securities is recorded as a valuation adjustment and reported in other comprehensive income.
Valuation of Mortgage Servicing Rights Mortgage servicing rights are recognized as assets for the allocated value of retained servicing rights on loans sold. Servicing rights are expensed in proportion to, and over the period of, estimated net servicing revenues.
We utilize a discounted cash flow model to determine the value of our servicing rights. The valuation model utilizes mortgage prepayment speeds, the remaining life of the mortgage pool, delinquency rates, our cost to service loans, and other factors to determine the cash flow that we will receive from serving each grouping of loans. These cash flows are then discounted based on current interest rate assumptions to arrive at the fair value of the right to service those loans. Impairment is evaluated based on the fair value of the rights, using groupings of the underlying loans classified by interest rates. Any impairment of a grouping is reported as a valuation allowance.
Acquisition Intangibles Generally accepted accounting principles require us to determine the fair value of all of the assets and liabilities of an acquired entity, and record their fair value on the date of acquisition. We employ a variety of means in determination of the fair value, including the use of discounted cash flow analysis, market comparisons, and projected future revenue streams. For certain items that we believe we have the appropriate expertise to determine the fair value, we may choose to use our own calculation of the value. In other cases, where the value is not easily determined, we consult with outside parties to determine the fair value of the asset or liability. Once valuations have been adjusted, the net difference between the price paid for the acquired company and the value of its balance sheet is recorded as goodwill. Due to the unique market conditions this year and our lower level of earnings, we contracted to have a goodwill impairment analysis completed in the third quarter. The results of that analysis indicated that no impairment existed at that time. See Note 8 to the financial statements for further information on the valuation results.
16
Uncertain Tax Liabilities Uncertain tax liabilities, primarily Michigan business tax liabilities, are estimated based on our exposures to interpretation of the applicable tax codes. We estimate our contingent tax liabilities by determining the amount of income that may be at risk of an adverse interpretation by taxing authorities on specific issues, multiplied by our effective tax rate, to determine our gross exposure. Once this exposure is determined, an estimate of the probability of an adverse adjustment being required is determined and applied to the gross liability to determine the contingent tax reserve.
Recent Accounting Pronouncements
The FASB issued new guidance in 2009 on the accounting for transfers of financial assets. The new guidance eliminates the concept of a qualifying special-purpose entity. Other changes from current accounting standards include new de-recognition criteria for a transfer to be accounted for as a sale, and a changes to the amount of recognized gain/loss on transfers accounted for as a sale when beneficial interests are received by the transferor. This new standard will be applied prospectively to new transfers of financial assets and will be effective for the first annual period beginning after November 15, 2009 and interim periods within that first annual period. Early application is prohibited. We have determined that the adoption of this new standard will not have a material effect on our financial statements.
QUANTITATIVE AND QUALITATIVE DISCLOSURE ABOUT MARKET RISK
We face market risk to the extent that both earnings and the fair market values of our financial instruments are affected by changes in interest rates and liquidity of markets. We manage this risk with static GAP analysis and simulation modeling. During 2008 the prime rate was decreasing at an accelerated pace. Our models indicate that we have maintained an overall liability sensitive position, whereby we should benefit as rates decline. These models do not fully incorporate customer preferences and changes in their behavior. As such, we believe we are somewhat less liability sensitive in a downward rate environment than the analysis indicates. In the short run, we believe it will be difficult to maintain our net interest margin as our assets re-price downward in larger steps than our liabilities. In the longer run as time deposits re-price to lower rates, we believe we will recover that lost margin and can maintain our overall profitability. As of the date of this annual report we do not know of nor expect there to be any material change in the general nature of our primary market risk exposure in the near term.
Our market risk exposure is mainly comprised of our vulnerability to interest rate risk. We do not accept significant interest rate risk in our mortgage banking operations. To manage our interest rate risk in mortgage banking we generally lock in our sale price to the secondary market at the same time we make a rate commitment to the borrower. Prevailing interest rates and interest rate relationships in the future will be primarily determined by market factors which are outside of our control. All information provided in response to this item consists of forward looking statements. Reference is made to the section captioned “Forward Looking Statements” in this annual report for a discussion of the limitations on our responsibility for such statements.
The following tables provide information about our financial instruments that are sensitive to changes in interest rates as of December 31, 2009 and 2008. They show expected maturity date values for loans and securities which were calculated without adjusting the instruments’ contractual maturity dates for expected prepayments. Maturity date values for interest bearing core deposits were not based on estimates of the period over which the deposits would be outstanding, but rather, the opportunity for re-pricing. We believes that re-pricing dates, as opposed to expected maturity dates, may be more relevant in analyzing the value of such instruments and are reported as such in the following tables. Fair value is computed as the present value of expected cash flows at rates in effect at the date indicated.
17
|
Principal/Notional Amounts Maturing or Re-pricing in: |
(In Thousands of Dollars) |
| |||||||||
|
|
|
|
|
|
|
|
|
| |||
|
As of December 31, 2009 |
2010 |
2011 |
2012 |
2013 |
2014 |
Thereafter |
Total |
Fair Value 12/31/09 | |||
|
Rate Sensitive Assets: |
|
|
|
|
|
|
|
| |||
|
Fixed interest rate loans |
$ 192,558 |
$ 125,167 |
$ 136,509 |
$ 138,548 |
$ 104,048 |
$ 135,919 |
$ 832,769 |
$ 835,121 | |||
|
Average interest rate |
6.73% |
6.97% |
7.09% |
6.68% |
6.61% |
7.37% |
|
| |||
|
Variable interest rate loans |
162,936 |
25,478 |
16,357 |
31,141 |
27,686 |
25,818 |
289,416 |
285,969 | |||
|
Average interest rate |
4.47% |
4.54% |
4.39% |
3.82% |
5.08% |
4.91% |
|
| |||
|
Fixed interest rate securities |
22,959 |
43,356 |
36,482 |
14,360 |
8,356 |
33,927 |
159,440 |
159,440 | |||
|
Average interest rate |
2.02% |
2.08% |
2.02% |
2.74% |
3.66% |
3.68% |
|
| |||
|
Variable interest rate |
|
|
|
|
|
|
|
| |||
|
Securities |
|
|
|
|
|
318 |
318 |
318 | |||
|
Average interest rate |
|
|
|
|
|
4.16% |
|
| |||
|
Other interest bearing assets |
80,111 |
|
|
|
|
9,084 |
89,195 |
89,195 | |||
|
Average interest rate |
0.24% |
|
|
|
|
|
|
| |||
|
Rate Sensitive Liabilities: |
|
|
|
|
|
|
|
| |||
|
Savings and interest bearing |
|
|
|
|
|
|
|
| |||
|
checking |
429,528 |
|
|
|
|
|
429,528 |
429,535 | |||
|
Average interest rate |
0.66% |
|
|
|
|
|
|
| |||
|
Time deposits |
360,318 |
151,253 |
18,019 |
13,521 |
8,492 |
3,598 |
555,202 |
560,505 | |||
|
Average interest rate |
3.89% |
3.02% |
3.98% |
4.49% |
3.50% |
2.86% |
|
| |||
|
Fixed interest rate |
|
|
|
|
|
|
|
| |||
|
borrowings |
59,419 |
20,000 |
3,826 |
1,500 |
|
25,560 |
110,305 |
116,386 | |||
|
Average interest rate |
5.28% |
2.87% |
3.16% |
2.74% |
|
6.09% |
|
| |||
|
Variable interest rate |
|
|
|
|
|
|
|
| |||
|
borrowings |
8,000 |
|
|
|
|
18,042 |
26,042 |
26,083 | |||
|
Average interest rate |
0.40% |
|
|
|
|
2.00% |
|
| |||
|
Repurchase agreements |
39,409 |
|
|
|
|
|
39,409 |
39,409 | |||
|
Average interest rate |
0.30% |
|
|
|
|
|
|
| |||
|
|
|
| |||||||||
|
As of December 31, 2008 |
(In Thousands of Dollars) |
Fair Value 12/31/08 | |||||||||
|
|
2009 |
2010 |
2011 |
2012 |
2013 |
Thereafter |
Total | ||||
|
Rate Sensitive Assets: |
|
|
|
|
|
|
|
| |||
|
Fixed interest rate loans |
$ 173,327 |
$ 143,620 |
$ 122,935 |
$117,009 |
$ 146,289 |
$ 154,811 |
$857,991 |
$ 870,427 | |||
|
Average interest rate |
7.04% |
6.90% |
7.08% |
7.22% |
6.66% |
7.13% |
|
| |||
|
Variable interest rate loans |
156,810 |
50,077 |
17,949 |
14,399 |
33,856 |
28,550 |
301,641 |
294,701 | |||
|
Average interest rate |
4.23% |
4.12% |
4.42% |
4.60% |
4.12% |
5.40% |
|
| |||
|
Fixed interest rate securities |
28,564 |
20,985 |
20,625 |
13,995 |
2,828 |
25,418 |
112,415 |
112,415 | |||
|
Average interest rate |
3.32% |
4.05% |
3.85% |
4.90% |
4.20% |
4.80% |
|
| |||
|
Variable interest rate |
|
|
|
|
|
|
|
| |||
|
Securities |
|
|
|
|
|
458 |
458 |
458 | |||
|
Average interest rate |
|
|
|
|
|
4.67% |
|
| |||
|
Other interest bearing assets |
5,472 |
|
|
|
|
9,084 |
14,555 |
14,555 | |||
|
Average interest rate |
0.30% |
|
|
|
|
|
|
| |||
|
Rate Sensitive Liabilities: |
|
|
|
|
|
|
|
| |||
|
Savings and interest bearing |
|
|
|
|
|
|
|
| |||
|
checking |
377,541 |
|
|
|
|
|
377,541 |
377,476 | |||
|
Average interest rate |
0.76% |
|
|
|
|
|
|
| |||
|
Time deposits |
342,411 |
125,285 |
28,345 |
13,150 |
10,772 |
232 |
520,195 |
530,759 | |||
|
Average interest rate |
3.74% |
4.23% |
5.38% |
4.57% |
4.55% |
4.16% |
|
| |||
|
Fixed interest rate |
|
|
|
|
|
|
|
| |||
|
borrowings |
40,083 |
56,498 |
17,002 |
923 |
1,500 |
25,710 |
141,716 |
156,408 | |||
|
Average interest rate |
4.45% |
5.49% |
3.11% |
6.94% |
2.74% |
6.10% |
|
| |||
|
Variable interest rate |
|
|
|
|
|
|
|
| |||
|
borrowings |
38,600 |
|
|
|
|
18,042 |
56,642 |
52,719 | |||
|
Average interest rate |
0.71% |
|
|
|
|
5.77% |
|
| |||
|
Repurchase agreements |
52,917 |
|
|
|
|
|
52,917 |
52,917 | |||
|
Average interest rate |
1.78% |
|
|
|
|
|
|
| |||
18
CAPITAL RESOURCES
We obtain funds for our operating expenses and dividends to shareholders through dividends from our subsidiary banks. In general, the subsidiary banks pay only those amounts required to meet holding company cash requirements, while maintaining appropriate capital at the banks. Capital is maintained at the subsidiary banks to support their current operations and projected future growth.
Bank regulators have established risk based capital guidelines for banks and bank holding companies. Minimum capital levels are established under these guidelines and each asset category is assigned a perceived risk weighting. Off balance sheet items, such as loan commitments and standby letters of credit, also require capital allocations.
As of December 31, 2009, our total capital to risk weighted assets exceeded the minimum requirement for capital adequacy purposes of 8% by $69 million. Tier 1 capital to risk weighted assets exceeded the minimum of 4% by $99 million, and Tier 1 capital to average assets exceeded the minimum of 4% by $86 million. In the current economic environment, regulatory agencies are encouraging banks to maintain capital well above this minimum requirement. At year end 2009, our total capital to risk weighted assets exceeded the well capitalized minimum requirement for capital adequacy purposes of 10% by $46 million. Tier 1 capital to risk weighted assets exceeded the well capitalized minimum of 6% by $77 million, and Tier 1 capital to average assets exceeded the well capitalized minimum of 5% by $72 million.
For a more complete discussion of capital requirements please refer to Note 22 of the Notes to Consolidated Financial Statements. The Federal Deposit Insurance Corporation insures specified customer deposits and assesses premium rates based on defined criteria. Insurance assessment rates may vary from bank to bank based on the factors that measure the perceived risk of a financial institution. One condition for maintaining the lowest risk assessment, and therefore, the lowest insurance rate, is the maintenance of capital at the “well capitalized” level. Each of our affiliate banks has exceeded the regulatory criteria for a “well capitalized” financial institution and each bank pays the lowest assessment rate assigned by the FDIC.
A certain level of capital growth is desirable to maintain an appropriate ratio of equity to total assets. The compound annual growth rate for total average assets for the past five years was 12.7%. The compound annual growth rate for average equity over the same period was 12.8%.
We have established an internal goal of maintaining our dividend payout ratio in the range of 40 – 60% of earnings, to generate internal capital growth to support growth in the balance sheet. In 2008 we maintained our dividend payment rate at higher levels and distributed more capital to our shareholders than was generated, resulting in a negative earnings retention percentage. As a result of our earnings in 2008 and the need to preserve capital, the Board of Directors’ reduced the dividend in 2009 to better align with these objectives. Earnings continued under pressure in 2009 and dividends exceeded earnings, once again causing a negative retention rate, and resulting in the Board of Directors’ decision to further reduce the dividend in the first quarter of 2010. In 2007 we retained 25.5% of our earnings. To achieve the goal of acceptable internal capital growth, we intend to continue our efforts to return to higher earnings levels, and will adjust our dividend payout rate as appropriate.
As an additional enhancement to capital growth we offer a dividend reinvestment program. The Firstbank Corporation Dividend Reinvestment Plan was first offered in 1988. At December 31, 1988, 123 owners holding 209,856 shares participated in the Plan. By the end of 2009, 1,073 owners holding 2,381,317 shares were participating in the Plan.
To further strengthen our capital position, we elected to participate in the United States Treasury’s Capital Purchase Plan, whereby we issued $33 million of preferred stock and warrants to purchase up to 578,947 shares of our common stock at a price of $8.55, to the United States Treasury on January 30, 2009. The preferred stock issued in this transaction requires a 5% dividend for five years and then converts to a 9% dividend rate.
We are not aware of any recommendations by regulatory authorities at December 31, 2009, which are likely to have a material effect on our liquidity, capital resources or operations.
19
FORWARD LOOKING STATEMENTS
This annual report including, without limitation, management’s discussion and analysis of financial condition and results of operations, and other sections of our Annual Report to Shareholders, contain forward-looking statements that are based on management’s beliefs, assumptions, current expectations, estimates and projections about the financial services industry, the economy, and about the Company itself. Words such as “anticipate”, “believe”, “determine”, “estimate”, “expect”, “forecast”, “intend”, “is likely”, “plan”, “project”, “opinion”, “should”, variations of such terms, and similar expressions are intended to identify such forward-looking statements. These statements are not guarantees of future performance and involve certain risks, uncertainties and assumptions that are difficult to predict with regard to timing, extent, likelihood, and degree of occurrence. Therefore, actual results and outcomes may materially differ from what may be expressed or forecasted in such forward looking statements. Internal and external factors that may cause such a difference include changes in interest rates and interest rate relationships; demand for products and services; the degree of competition by traditional and non-traditional competitors; changes in banking regulations; changes in tax laws; changes in prices, levies, and assessments; the impact of technological advances; governmental and regulatory policy changes; the outcomes of pending and future litigation and contingencies; trends in customer behavior and customer ability to repay loans; software failure, errors or miscalculations; the ability of the Company to locate and correct all data sensitive computer codes; and the vicissitudes of the national economy. The Company undertakes no obligation to update, amend or clarify forward-looking statements, whether as a result of new information, future events, or otherwise.
COMMON STOCK DATA
Firstbank Corporation Common Stock was held by 1,856 shareholders of record as of December 31, 2009. Total shareholders number approximately 3,400, including those whose shares are held in nominee name through brokerage firms. Our shares are listed on the NASDAQ Global Select Market under the symbol FBMI and are traded by several brokers. The range of high and low sales prices for shares of common stock for each quarterly period during the past two years is as follows:
|
|
|
| |
|
Quarter |
High |
Low | |
|
4th 2009 |
|
$ 8.75 |
$ 5.44 |
|
3rd 2009 |
|
$ 8.39 |
$ 5.50 |
|
2nd 2009 |
|
$ 7.46 |
$ 5.01 |
|
1st 2009 |
|
$ 9.16 |
$ 4.38 |
|
4th 2008 |
|
$ 10.50 |
$ 7.21 |
|
3rd 2008 |
|
$ 12.30 |
$ 8.10 |
|
2nd 2008 |
|
$ 13.99 |
$ 8.98 |
|
1st 2008 |
|
$ 14.61 |
$ 12.88 |
The prices quoted above were obtained from www.NASDAQ.com. Prices have been adjusted to reflect stock dividends.
The following table summarizes cash dividends paid per share (adjusted for stock dividends) of common stock during 2009 and 2008.
|
|
2009 |
2008 |
|
First Quarter |
$ 0.10 |
$ 0.225 |
|
Second Quarter |
0.10 |
0.225 |
|
Third Quarter |
0.10 |
0.225 |
|
Fourth Quarter |
0.10 |
0.225 |
|
Total |
$ 0.40 |
$ 0.900 |
Our principal sources of funds to pay cash dividends are the earnings of, and dividends paid by, our subsidiary banks. Under current regulations the subsidiary banks are restricted in their ability to transfer funds in the form of cash dividends, loans, and advances to the holding company (See Note 20 of the Notes to Consolidated Financial Statements). As of January 1, 2010, approximately $21.8 million of the subsidiaries’ retained earnings were available for transfer in the form of dividends to the holding company without prior regulatory approval. In addition, the subsidiaries’ 2010 earnings are expected to be available for distributions as dividends to the holding company. As a condition of our issuance of preferred stock in early 2009, we are prohibited from increasing our dividend above the $0.90 per year paid in 2008 for three years without approval from the United States Treasury Department.
20
STOCK PERFORMANCE
The following graph compares the cumulative total shareholder return on the common stock of the Corporation to the Standard & Poor’s 500 Stock Index and the NASDAQ Bank Index, assuming a $100 investment at the end of 2004. The Standard & Poor’s 500 Stock Index is a broad equity market index. The NASDAQ Bank Index is composed of 468 banks and savings institutions as well as companies performing functions closely related to banking, such as check cashing agencies, currency exchanges, safe deposit companies and corporations for banking abroad. Cumulative total return is measured by dividing (i) the sum of (A) the cumulative amount of dividends for the measurement period, assuming dividend reinvestment, and (B) the difference between the share price at the end and the beginning of the measurement period; by (ii) the share price at the beginning of the measurement period.
COMPARISON OF 5 YEAR CUMULATIVE TOTAL RETURN*
Among Firstbank Corporation, The S&P 500 Index
And The NASDAQ Bank Index
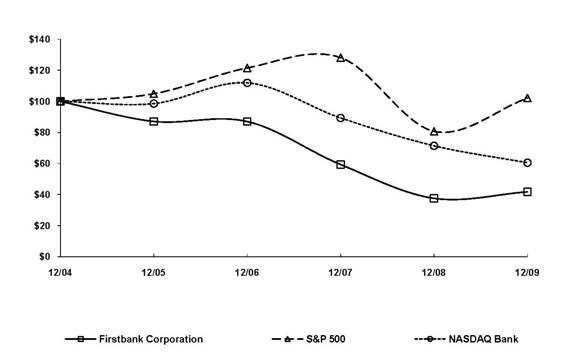
$100 invested on 12/31/04 in stock or index, including reinvestment of dividends.
Fiscal year ending December 31.
Copyright© 2010 S&P, a division of the McGraw-Hill Companies, Inc. All rights reserved.
The table below shows dollar values for cumulative total shareholder return plotted in the graph above.
|
|
2004 |
2005 |
2006 |
2007 |
2008 |
2009 |
|
Firstbank Corporation |
$ 100.00 |
$ 87.11 |
$ 87.03 |
$ 59.33 |
$ 37.56 |
$41.74 |
|
S & P 500 |
$ 100.00 |
$ 104.91 |
$ 121.48 |
$ 128.16 |
$ 80.74 |
$ 102.11 |
|
NASDAQ Bank |
$ 100.00 |
$ 98.57 |
$ 111.92 |
$ 89.33 |
$ 71.39 |
$ 60.47 |
|
|
|
|
|
|
|
|
MANAGEMENT’S RESPONSIBILITY FOR FINANCIAL REPORTING
The management of Firstbank Corporation has the responsibility for preparing the accompanying consolidated financial statements and for their integrity and objectivity. The statements were prepared in accordance with accounting principles generally accepted in the United States of America. The consolidated financial statements include amounts that are based on management's best estimates and judgments. Management also prepared other information in the annual report and is responsible for its accuracy and consistency with the financial statements.
The Company's 2009 consolidated financial statements have been audited by Plante & Moran PLLC independent registered public accounting firm. Management has made available to Plante & Moran all financial records and related data, as well as the minutes of Boards of Directors' meetings. Management believes that all representations made to Plante & Moran during the audit were valid and appropriate.
MANAGEMENT’S REPORT ON INTERNAL CONTROL OVER FINANCIAL REPORTING
The management of Firstbank Corporation is responsible for establishing and maintaining adequate internal control over financial reporting. The Company's internal control system is designed to provide reasonable assurance to the Company's management and Board of Directors regarding the reliability of financial reporting and the presentation of published financial statements. The system of internal control provides for division of responsibility and is documented by written policies and procedures that are communicated to employees with significant roles in the financial reporting process and updated as necessary. Management monitors the system of internal control for compliance.
The Company maintains an internal auditing program that independently assesses the effectiveness of the internal controls and recommends possible improvements thereto. However, all internal control systems, no matter how well designed, have inherent limitations.
The Company's management assessed the effectiveness of the Company's internal control over financial reporting as of December 31, 2009. In making this assessment, it used the criteria for effective internal control over financial reporting set forth by the Committee of Sponsoring Organizations of the Treadway Commission (COSO) in "Internal Control-Integrated Framework". Based on our assessment management concludes that, as of December 31, 2009, the Company's internal control over financial reporting is effective based on those criteria.
The Company’s independent public accountant, Plante & Moran PLLC, has issued an audit report on the Company’s internal control over financial reporting which appears on the following page.
FIRSTBANK CORPORATION
/s/ Thomas R. Sullivan
Thomas R. Sullivan
President & Chief Executive Officer
(Principal Executive Officer)
/s/ Samuel G. Stone
Samuel G. Stone
Executive Vice President & Chief Financial Officer
(Principal Financial and Accounting Officer)
Dated: March 9, 2010
22

REPORT OF INDEPENDENT REGISTERED PUBLIC ACCOUNTING FIRM
Board of Directors and Shareholders
Firstbank Corporation
We have audited the accompanying consolidated balance sheet of Firstbank Corporation as of December 31, 2009 and 2008, and the related consolidated statements of income and comprehensive income, changes in shareholders' equity, and cash flows for each of the three years ended December 31, 2009. We also have audited the Company's internal control over financial reporting as of December 31, 2009, based on criteria established in Internal Control – Integrated Framework issued by the Committee of Sponsoring Organizations of the Treadway Commission (COSO). Management is responsible for these financial statements, for maintaining effective internal control over financial reporting, and for its assessment of the effectiveness of internal control over financial reporting, included in the accompanying financial statements. Our responsibility is to express an opinion on these financial statements and an opinion on the company's internal control over financial reporting based on our audits.
We conducted our audits in accordance with the standards of the Public Company Accounting Oversight Board (United States). Those standards require that we plan and perform the audit to obtain reasonable assurance about whether the financial statements are free of material misstatement and whether effective internal control over financial reporting was maintained in all material respects. Our audit of the financial statements included examining, on a test basis, evidence supporting the amounts and disclosures in the financial statements, assessing the accounting principles used and significant estimates made by management, and evaluating the overall financial statement presentation. Our audit of internal control over financial reporting included obtaining an understanding of internal control over financial reporting, assessing the risk that a material weakness exists, and testing and evaluating the design and operating effectiveness of internal control based on the assessed risk. Our audit also included performing such other procedures as we considered necessary in the circumstances. We believe that our audits provide a reasonable basis for our opinion.
A company's internal control over financial reporting is a process designed to provide reasonable assurance regarding the reliability of financial reporting and the preparation of financial statements for external purposes in accordance with generally accepted accounting principles. A company's internal control over financial reporting includes those policies and procedures that (1) pertain to the maintenance of records that, in reasonable detail, accurately and fairly reflect the transactions and dispositions of the assets of the company; (2) provide reasonable assurance that transactions are recorded as necessary to permit preparation of financial statements in accordance with generally accepted accounting principles, and that receipts and expenditures of the company are being made only in accordance with authorizations of management and directors of the company; and (3) provide reasonable assurance regarding prevention or timely detection of unauthorized acquisition, use, or disposition of the company's assets that could have a material effect on the financial statements.
Because of its inherent limitations, internal control over financial reporting may not prevent or detect misstatements. Also, projections of any evaluation of effectiveness to future periods are subject to the risk that controls may become inadequate because of changes in conditions, or that the degree of compliance with the policies or procedures may deteriorate.
In our opinion, the financial statements referred to above present fairly, in all material respects, the financial position of Firstbank Corporation as of December 31, 2009 and 2008, and the results of its operations and its cash flows for each of the years in the three year period ended December 31, 2009 in conformity with accounting principles generally accepted in the United States of America. Also in our opinion, Firstbank Corporation maintained, in all material respects, effective internal control over financial reporting as of December 31, 2009, based on criteria established in Internal Control – Integrated Framework issued by the Committee of Sponsoring Organizations of the Treadway Commission (COSO).
Grand Rapids, Michigan /s/ Plante & Moran, PLLC
March 9, 2010
23
|
FIRSTBANK CORPORATION | ||
|
CONSOLIDATED BALANCE SHEETS | ||
|
(In Thousands of Dollars, Except for Share Data) | ||
|
|
December 31, | |
|
ASSETS |
2009 |
2008 |
|
|
|
|
|
Cash and due from banks |
$ 27,254 |
$ 33,050 |
|
Short term investments |
80,111 |
30,662 |
|
Total cash and cash equivalents |
107,365 |
63,712 |
|
Trading Account Securities |
2,828 |
222 |
|
Securities available for sale |
156,930 |
112,873 |
|
Federal Home Loan Bank stock |
9,084 |
9,084 |
|
Loans held for sale |
578 |
1,408 |
|
Loans, net of allowance for loan losses of $19,114 in 2009 and |
|
|
|
$14,594 in 2008 |
1,102,493 |
1,143,630 |
|
Premises and equipment, net |
25,437 |
26,941 |
|
Goodwill |
35,513 |
35,603 |
|
Core deposits and other intangibles |
2,940 |
3,881 |
|
Other real estate owned |
7,425 |
5,382 |
|
Accrued interest receivable and other assets |
31,763 |
22,604 |
|
|
|
|
|
TOTAL ASSETS |
$ 1,482,356 |
$ 1,425,340 |
|
|
|
|
|
LIABILITIES AND SHAREHOLDERS’ EQUITY |
|
|
|
|
|
|
|
LIABILITIES |
|
|
|
Deposits: |
|
|
|
Non-interest bearing demand accounts |
$ 164,333 |
$ 149,179 |
|
Interest bearing accounts: |
|
|
|
Demand |
255,414 |
223,526 |
|
Savings |
174,114 |
154,015 |
|
Time |
555,202 |
520,194 |
|
Total Deposits |
1,149,063 |
1,046,914 |
|
|
|
|
|
Securities sold under agreements to repurchase and overnight borrowings |
39,409 |
52,917 |
|
Federal Home Loan Bank advances |
100,263 |
155,921 |
|
Notes payable |
0 |
6,353 |
|
Subordinated Debentures |
36,084 |
36,084 |
|
Accrued interest payable and other liabilities |
10,657 |
12,168 |
|
Total Liabilities |
1,335,476 |
1,310,357 |
|
|
|
|
|
SHAREHOLDERS’ EQUITY |
|
|
|
Preferred stock; no par value, 300,000 shares authorized, 33,000 issued |
32.734 |
0 |
|
Common stock, no par value, 20,000,000 shares authorized; |
|
|
|
7,730,241 and 7,580,298 shares issued and outstanding in 2009 and 2008 |
114.773 |
113,411 |
|
Retained earnings |
(1,225) |
686 |
|
Accumulated other comprehensive income |
598 |
886 |
|
Total Shareholders’ Equity |
146,880 |
114,983 |
|
|
|
|
|
TOTAL LIABILITIES AND SHAREHOLDERS’ EQUITY |
$ 1,482,356 |
$ 1,425,340 |
See notes to consolidated financial statements.
24
|
FIRSTBANK CORPORATION | |||
|
CONSOLIDATED STATEMENTS OF INCOME AND COMPREHENSIVE INCOME | |||
|
(In Thousands of Dollars, Except for Per Share Data) | |||
|
|
|
|
|
|
|
Year Ended December 31, | ||
|
|
2009 |
2008 |
2007 |
|
Interest Income: |
|
|
|
|
Loans, including fees |
$ 70,531 |
$ 76,604 |
$ 75,364 |
|
Securities: |
|
|
|
|
Taxable |
2,712 |
3,878 |
3,160 |
|
Exempt from federal income tax |
1,306 |
1,408 |
1,256 |
|
Short term investments |
137 |
301 |
1,082 |
|
Total Interest Income |
74,686 |
82,191 |
80,862 |
|
|
|
|
|
|
Interest Expense: |
|
|
|
|
Deposits |
18,841 |
25,468 |
28,649 |
|
FHLB Advances, notes payable and subordinated debentures |
5,350 |
6,892 |
6,044 |
|
Subordinated debentures |
1,612 |
2,075 |
1,827 |
|
Other |
136 |
918 |
1,697 |
|
Total Interest Expense |
25,939 |
35,353 |
38,217 |
|
Net Interest Income |
48,747 |
46,838 |
42,645 |
|
|
|
|
|
|
Provision for loan losses |
14,671 |
8,256 |
2,014 |
|
Net Interest Income after Provision for Loan Losses |
34,076 |
38,582 |
40,631 |
|
|
|
|
|
|
Non-Interest Income: |
|
|
|
|
Service charges on deposit accounts |
4,509 |
4,825 |
4,475 |
|
Gain on sale of mortgage loans |
7,551 |
2,513 |
1,676 |
|
Mortgage servicing, net of amortization |
(471) |
258 |
555 |
|
Gain/(loss) on trading account securities |
(213) |
(454) |
(628) |
|
Gain/(loss) on securities transactions |
1,534 |
(5,463) |
(123) |
|
Courier and cash delivery services |
751 |
868 |
921 |
|
Commissions on real estate sales |
0 |
0 |
492 |
|
Title insurance fees |
626 |
335 |
347 |
|
Other |
1,122 |
1,108 |
2,005 |
|
Total Non-Interest Income |
15,409 |
3,990 |
9,720 |
|
|
|
|
|
|
Non-Interest Expense: |
|
|
|
|
Salaries and employee benefits |
22,291 |
22,231 |
20,620 |
|
Occupancy and equipment |
6,248 |
6,931 |
5,964 |
|
FDIC Insurance Premium |
2,430 |
562 |
269 |
|
Amortization of intangibles |
934 |
1,071 |
1,135 |
|
Outside professional services |
934 |
845 |
907 |
|
Advertising and promotions |
1,588 |
1,392 |
1,241 |
|
OREO costs |
2,391 |
1,228 |
387 |
|
Other |
8,934 |
8,655 |
8,551 |
|
Total Non-Interest Expense |
45,750 |
42,915 |
39,074 |
|
Income Before Federal Income Taxes |
3,735 |
(343) |
11,277 |
|
Federal Income Taxes |
1,044 |
(1,062) |
2,891 |
|
NET INCOME |
$ 2,691 |
$ 719 |
$ 8,386 |
|
|
|
|
|
|
Preferred Stock Dividends and Accretion of Discount on Preferred Stock |
1,540 |
0 |
0 |
|
NET INCOME AVAILABLE TO COMMON SHAREHOLDERS |
$ 1,151 |
$ 719 |
$ 8,386 |
|
|
|
|
|
|
COMPREHENSIVE INCOME |
|
|
|
|
Net Income |
$2,691 |
$ 719 |
$ 8,386 |
|
Change in unrealized gain on securities, net of tax |
|
|
|
|
and reclassification effects |
(288) |
403 |
614 |
|
TOTAL COMPREHENSIVE INCOME |
$ 2,403 |
$ 1,122 |
$ 9,000 |
|
|
|
|
|
|
Basic earnings per common share |
$ 0.15 |
$ 0.10 |
$ 1.21 |
|
|
|
|
|
|
Diluted earnings per common share |
$ 0.15 |
$ 0.10 |
$ 1.21 |
See notes to consolidated financial statements.
25
|
|
FIRSTBANK CORPORATION | ||||||||
|
|
CONSOLIDATED STATEMENTS OF CHANGES IN SHAREHOLDERS’ EQUITY | ||||||||
|
|
FOR THE YEARS ENDED DECEMBER 31, 2009, 2008, AND 2007 | ||||||||
|
|
(In Thousands of Dollars, Except for Share and per Share Data) | ||||||||
|
|
|
|
|
|
| ||||
|
|
|
|
|
Accumulated Other Comprehensive Income (Loss) |
| ||||
|
|
|
|
|
| |||||
|
|
Common Stock |
Preferred |
Retained Earnings |
| |||||
|
|
Stock |
Total | |||||||
|
Balances at January 1, 2007 |
$ 91,652 |
|
|
$ 4,552 |
|
$(131 |
) |
$ 96,073 | |
|
Net income for 2007 |
|
|
|
8,386 |
|
|
8,386 | ||
|
Cash dividends - $0.90 per share |
|
|
|
(6,246 |
) |
|
(6,246) | ||
|
Issuance of 45,158 shares of common stock |
|
|
|
|
|
|
| ||
|
through exercise of stock options (including |
|
|
|
|
|
| |||
|
$80 of tax benefit) |
704 |
|
|
|
|
704 | |||
|
Issuance of 77,244 shares of common stock |
|
|
|
|
|
| |||
|
through the dividend reinvestment plan |
1,362 |
|
|
|
|
1,362 | |||
|
Issuance of 4,750 shares of common stock |
|
|
|
|
|
| |||
|
from supplemental shareholder investments |
90 |
|
|
|
|
90 | |||
|
Purchase of 103,100 shares of stock |
(1,801 |
) |
|
|
|
(5,254) | |||
|
Issuance of 23,996 shares of common stock |
448 |
|
|
|
|
448 | |||
|
Stock option and restricted stock expense |
261 |
|
|
|
|
261 | |||
|
Issuance of 874,949 shares for acquisition |
18,720 |
|
|
|
|
18,720 | |||
|
Net change in unrealized gain/(loss) on |
|
|
|
|
|
| |||
|
securities available for sale, net of tax of $316 |
|
|
|
|
614 |
|
614 | ||
|
BALANCES AT DECEMBER 31, 2007 |
$ 111,436 |
|
|
$ 6,692 |
|
$ 483 |
73 |
$ 118,611 | |
|
|
|
|
|
|
|
| |||
|
Net income for 2008 |
|
|
|
719 |
|
|
719 | ||
|
Cash dividends - $0.90 per share |
|
|
|
(6,725 |
) |
|
(6,725) | ||
|
Issuance of 122,469 shares of common stock |
|
|
|
|
|
| |||
|
through the dividend reinvestment plan |
1,284 |
|
|
|
|
1,284 | |||
|
Issuance of 8,422 shares of common stock |
|
|
|
|
|
| |||
|
from supplemental shareholder investments |
103 |
|
|
|
|
103 | |||
|
Issuance of 42,209 shares of common stock |
379 |
|
|
|
|
379 | |||
|
Stock option and restricted stock expense |
209 |
|
|
|
|
209 | |||
|
Net change in unrealized gain/(loss) on |
|
|
|
|
|
| |||
|
securities available for sale, net of tax of $157 |
|
|
|
|
403 |
|
403 | ||
|
BALANCES AT DECEMBER 31, 2008 |
$ 113,411 |
|
|
$ 686 |
|
$ 886 |
|
$ 114,983 | |
|
|
|
|
|
|
|
|
|
| |
|
Net income for 2009 |
|
|
|
2,691 |
|
|
|
2,691 | |
|
Cash dividends on common stock - $0.40 |
|
|
|
|
|
|
|
| |
|
per share |
|
|
|
(3,062 |
) |
|
|
(3,062) | |
|
Accrued dividends on preferred stock and |
|
|
|
|
· |
|
|
| |
|
accretion of discount on preferred stock |
|
|
27 |
(1,540 |
) |
|
|
(1,513) | |
|
Issuance of 33,000 shares of preferred stock |
|
|
|
|
|
|
|
| |
|
and 578,948 warrants through the Treasury’s |
|
|
|
|
|
|
|
| |
|
Capital Purchase Program |
293 |
|
$ 32,707 |
|
|
|
|
33,000 | |
|
Issuance of 93,730 shares of common stock |
|
|
|
|
|
|
|
| |
|
through the dividend reinvestment plan |
591 |
|
|
|
|
|
|
591 | |
|
Issuance of 7,375 shares of common stock |
|
|
|
|
|
|
|
| |
|
from supplemental shareholder investments |
49 |
|
|
|
|
|
|
49 | |
|
Issuance of 49,337 shares of common stock |
269 |
|
|
|
|
|
|
269 | |
|
Stock option and restricted stock expense |
160 |
|
|
|
|
|
|
160 | |
|
Net change in unrealized gain/(loss) on |
|
|
|
|
|
|
|
| |
|
securities available for sale, net of tax of $148 |
|
|
|
___ |
|
(288) |
|
(288) | |
|
BALANCES AT DECEMBER 31, 2009 |
$ 114,773 |
|
$ 32,734 |
$ (1,225 |
) |
$ 598 |
|
$ 146,880 | |
See notes to consolidated financial statements.
26
|
FIRSTBANK CORPORATION | |||
|
CONSOLIDATED STATEMENTS OF CASHFLOWS | |||
|
(In Thousands of Dollars) | |||
|
|
Year Ended December 31, | ||
|
|
2009 |
2008 |
2007 |
|
|
|
|
|
|
OPERATING ACTIVITIES |
|
|
|
|
Net income |
$ 2,691 |
$ 719 |
$ 8,386 |
|
Adjustments to reconcile net income to net cash from |
|
|
|
|
operating activities: |
|
|
|
|
Provision for loan losses |
14,671 |
8,256 |
2,014 |
|
Depreciation of premises and equipment |
2,675 |
3,174 |
2,959 |
|
Net amortization (accretion) of security premiums/discounts |
897 |
60 |
(311) |
|
Loss on trading account securities |
213 |
454 |
628 |
|
(Gain)/Loss on securities transactions |
(1,534) |
5,463 |
123 |
|
Amortization and impairment of intangibles |
934 |
1,071 |
1,135 |
|
Stock option and restricted stock grant compensation expense |
160 |
209 |
261 |
|
Gain on sale of mortgage loans |
(7,551) |
(2,513) |
(1,676) |
|
Proceeds from sales of mortgage loans |
332,576 |
112,733 |
68,315 |
|
Loans originated for sale |
(324,195) |
(109,904) |
(67,244) |
|
Deferred federal income tax expense/(benefit) |
241 |
(3,513) |
331 |
|
Decrease (increase) in accrued interest receivable and other assets |
566 |
7,532 |
6,565 |
|
Increase in accrued interest payable and other liabilities |
(1,511) |
(5,659) |
(2,502) |
|
NET CASH FROM OPERATING ACTIVITIES |
20,833 |
18,082 |
18,984 |
|
|
|
|
|
|
INVESTING ACTIVITIES |
|
|
|
|
Bank acquisition, net of cash assumed |
0 |
0 |
(15,170) |
|
Purchase of trading account securities |
(2,819) |
0 |
0 |
|
Proceeds from sales of securities available for sale |
10,222 |
6,435 |
13,901 |
|
Proceeds from maturities and calls of securities available for sale |
90,896 |
124,109 |
56,429 |
|
Purchase of securities available for sale |
(144,975) |
(143,925) |
(79,105) |
|
Sale (Purchase) of Federal Home Loan Bank stock, net |
0 |
(1,077) |
(520) |
|
Net (increase) decrease in portfolio loans |
14,703 |
(46,811) |
(36,829) |
|
Net purchases of premises and equipment |
(1,171) |
(2,559) |
(2,998) |
|
NET CASH USED IN INVESTING ACTIVITIES |
(33,144) |
(63,828) |
(64,292) |
|
|
|
|
|
|
FINANCING ACTIVITIES |
|
|
|
|
Net increase in deposits |
102,149 |
35,523 |
3,967 |
|
Net increase (decrease) in securities sold under agreements to |
|
|
|
|
repurchase and overnight borrowings |
(13,508) |
10,126 |
3,302 |
|
Repayment of notes payable and other borrowings |
(6,353) |
(189) |
(19,728) |
|
Repayment of Federal Home Loan Bank borrowings |
(129,658) |
(82,248) |
(12,847) |
|
Proceeds from Federal Home Loan Bank borrowings |
74,000 |
100,000 |
29,500 |
|
Proceeds from subordinated debentures and other borrowings |
0 |
5,676 |
35,149 |
|
Cash proceeds from issuance of Preferred Stock and Warrants |
33,000 |
0 |
0 |
|
Cash proceeds from issuance of Common Stock |
909 |
1,766 |
2,604 |
|
Repurchase of the Company’s Common Stock |
0 |
0 |
(1,801) |
|
Cash dividends on Preferred Stock |
(1,513) |
0 |
0 |
|
Cash dividends on Common Stock |
(3,062) |
(6,725) |
(6,246) |
|
NET CASH FROM FINANCING ACTIVITIES |
55,964 |
63,929 |
33,900 |
|
|
|
|
|
|
INCREASE (DECREASE) IN CASH AND CASH EQUIVALENTS |
43,653 |
18,183 |
(11,408) |
|
Cash and cash equivalents at beginning of year |
63,712 |
45,529 |
56,937 |
|
|
|
|
|
|
CASH AND CASH EQUIVALENTS AT END OF YEAR |
$ 107,365 |
$ 63,712 |
$ 45,529 |
|
Supplemental disclosure of cash flow information: |
|
|
|
|
Cash paid during the year for: |
|
|
|
|
Interest |
$ 26,750 |
$ 33,477 |
$ 38,163 |
|
Income taxes |
$ 1,415 |
$ 2,567 |
$ 2,685 |
|
Non cash transfer of loans to other real estate owned |
$ 11,211 |
$ 5,373 |
$ 2,373 |
See notes to consolidated financial statements.
27
CONSOLIDATED STATEMENTS OF CASHFLOWS (continued)
|
Bank acquisitions: (In Thousands of Dollars) |
2009 |
2008 |
2007 |
|
|
|
|
|
|
Securities acquired (including FHLB stock) |
0 |
0 |
28,252 |
|
Loans acquired, net of allowance for loan losses |
0 |
0 |
178,456 |
|
Bank premises and equipment |
0 |
0 |
7,283 |
|
Acquisition intangibles recorded |
0 |
0 |
18,983 |
|
Other assets assumed |
0 |
0 |
12,152 |
|
Deposits assumed |
0 |
0 |
(171,999) |
|
Borrowings assumed |
0 |
0 |
(32,558) |
|
Other liabilities assumed |
0 |
0 |
(6,679) |
NOTES TO CONSOLIDATED FINANCIAL STATEMENTS
NOTE 1 – SIGNIFICANT ACCOUNTING POLICIES
Nature of Operations: Firstbank Corporation (the “Company”) is a bank holding company. Each of our subsidiary banks is a full service community bank. The subsidiary banks offer all customary banking services, including the acceptance of checking, savings and time deposits, and the making of commercial, agricultural, real estate, personal, home improvement, automobile and other installment and consumer loans. Our consolidated assets were, $1.482 billion as of December 31, 2009, and primarily represent commercial and retail banking activity. Mortgage loans serviced for others of $602 million, as of December 31, 2009, are not included in the consolidated balance sheet.
Principles of Consolidation: The consolidated financial statements include the accounts of the Company and its subsidiaries, Firstbank – Alma; Firstbank (Mt. Pleasant); Firstbank – West Branch; Firstbank – St. Johns; Keystone Community Bank and Firstbank – West Michigan (the “Banks”); 1st Armored, Incorporated; 1st Title, Incorporated; 1st Investors Title, LLC; C.A. Hanes Realty, Incorporated (sold September 30, 2007), Austin Mortgage Company; and FBMI Risk Management Services, Inc., after elimination of inter-company accounts and transactions. These subsidiaries are wholly owned, except C.A. Hanes Realty, which had a 45% minority interest through September 30, 2007 and 1st Investors Title, LLC, which had a 48% minority interest through September 30, 2009 at which time we sold 3% of the company. We now have a 49% ownership in 1st Investors Title, LLC and do not consolidate their results into the results of the Company as required by generally accepted accounting principles. Firstbank – Lakeview was merged into Firstbank (Mt. Pleasant) in 2008. Each of our six banks operates its own Mortgage Company. Keystone Community Bank also owns Keystone Premium Finance, LLC, which has been in the business of financing large dollar insurance premiums and was closed during 2008. The operating results of these companies are consolidated into each Bank’s financial statements. During 2004 we formed a special purpose trust, Firstbank Capital Trust I, in 2006 we formed Firstbank Capital Trust II, and in 2007 we formed Firstbank Capital Trust III and Firstbank Capital Trust IV, for the sole purpose of issuing trust preferred securities. Under generally accepted accounting principles, these trusts are not consolidated into our financial statements.
Use of Estimates: The preparation of financial statements in conformity with accounting principles generally accepted in the United States of America requires management to make estimates and assumptions that affect the reported amounts of assets and liabilities and disclosure of contingent assets and liabilities at the date of the financial statements and the reported amounts of revenues and expenses during the reported period. Actual results could differ from those estimates.
Certain Significant Estimates: The primary estimates incorporated into our financial statements, which are susceptible to change in the near term, include the allowance for loan losses, the determination of the fair value of certain financial instruments, determination of state and federal tax liabilities, goodwill, purchase accounting and core deposit intangible valuations, valuation of other real estate owned, and the valuation of mortgage servicing rights.
Current Vulnerability Due to Certain Concentrations: Our business is concentrated in the mid-central and southwestern sections of the lower peninsula of Michigan. While the loan portfolio is diversified, the customers’ ability to honor their debts is partially dependent on the local economies. Our service area is primarily dependent on manufacturing (automotive and other), agricultural and recreational industries. Most commercial and agricultural loans are secured by business assets, including commercial and agricultural real estate and federal farm agency guarantees. Generally, consumer loans are secured by various items of personal property and mortgage loans are secured by residential real estate. Our funding sources include time deposits and other deposit products which bear interest. Periods of rising interest rates result in an increase in our cost of funds and an increase in the yields on certain assets. Conversely, periods of falling interest rates result in a decrease in yields on certain assets and costs of certain funds.
28
Cash and Cash Equivalents: Cash and cash equivalents include cash on hand, amounts due from banks and short term investments, which include interest bearing deposits with banks and the Federal Reserve, federal funds sold, and overnight money market fund investments. Generally, federal funds and overnight money market funds are purchased for a one day period. We report customer loan transactions, deposit transactions and repurchase agreements and overnight borrowings on a net basis within our cash flow statement.
Trading Account Securities: From time to time, we invest in the common stock of other companies. During 2007 we determined that we should reclassify those investments from available for sale to trading account securities. Trading account securities are adjusted to fair value through the income statement, with increases in value reflected as non-interest income and decreases in value reflected as a decrease to non-interest income.
Securities Available for Sale: Securities available for sale consist of bonds and notes which might be sold prior to maturity due to changes in interest rate, prepayment risks, yield and availability of alternative investments, liquidity needs or other factors. Securities classified as available for sale are reported at their fair value and the related unrealized holding gain or loss (the difference between the fair value and amortized cost of the securities so classified) is reported in other comprehensive income. Other securities such as Federal Home Loan Bank stock are carried at cost. Interest income includes amortization of purchase premium or discount. Premiums and discounts on securities are amortized on the level-yield method.
Declines in the fair value of securities below their cost that are other than temporary are reflected as realized losses. In estimating other-than-temporary losses, management considers: (1) the length of time and extent that fair value has been less than carrying value; (2) the financial condition and near term prospects of the issuer; and (3) the Company’s ability and intent to hold the security for a period of time sufficient to allow for any anticipated recovery in fair value.
Mortgage Banking Activities: Servicing rights are recognized as assets based on the allocated value of retained servicing rights on loans sold. Servicing rights are expensed in proportion to, and over the period of, estimated net servicing revenues. Impairment is evaluated based on the fair value of the rights, using groupings of the underlying loans as to interest rates. Any impairment of a grouping is reported as a valuation allowance.
Servicing fee income is recorded for fees earned for servicing loans. The fees are based on a contractual percentage of the outstanding principal or a fixed amount per loan and are recorded as income when earned. Amortization of mortgage serving rights is netted against loan servicing fee income.
Mortgage Derivatives: From time to time, we enter into mortgage banking derivatives such as forward contracts and rate lock commitments in the ordinary course of business. The derivatives are not designated as hedges and are carried at fair value. The net gain or loss on mortgage banking derivatives is included in gain on sale of loans.
Loans Held for Sale: Mortgage loans originated and intended for sale in the secondary market are carried at the lower of aggregate cost or market, as determined by outstanding commitments from investors. Net unrealized losses, if any, are recorded as a valuation allowance and charged to earnings.
Mortgage loans held for sale are generally sold with servicing rights retained. Gains and losses on sales of mortgage loans are based on the difference between the selling price and the carrying value of the related loan sold, which is reduced by the cost allocated to the servicing right. We generally lock in the sale price to the purchaser of the loan at the same time we make a rate commitment to the borrower.
Loans: Loans receivable, for which management has the intent and ability to hold for the foreseeable future or payoff are reported at their outstanding unpaid principal balances, net of any deferred fees or costs on originated loans, unamortized premiums or discounts. Loan origination fees and certain origination costs are capitalized and recognized as an adjustment to yield of the related loan. Interest income is reported on the interest method and includes amortization of net deferred loan fees and costs over the loan term without anticipating prepayments. Interest income on mortgage and commercial loans is discontinued at the time the loan becomes 90 days delinquent unless the credit is well secured and in process of collection. Consumer and unsecured consumer line of credit loans are typically charged off no later than 120 days past due. In all cases loans are placed on nonaccrual or charged off at an earlier date if collection of principal or interest is considered doubtful.
29
All interest accrued, but not received, for loans placed on nonaccrual status, is reversed against interest income. Interest received on such loans is accounted for on the cash-basis or cost-recovery method until qualifying for return to accrual. Loans are returned to accrual status when all of the principal and interest amounts contractually due are brought current and future payments are reasonably assured.
Allowance for Loan Losses: The allowance for loan losses is a valuation allowance for probable incurred credit losses. Management uses a quantitative and qualitative methodology for analyzing factors which impact the allowance for loan losses consistently across its six banking subsidiaries. The process applies risk factors for historical charge-offs and delinquency experience, portfolio segment weightings and industry and regional factors and trends as they affect the banks’ portfolios. Consideration of exposures to industries potentially most affected by risks in the current economic and political environment, and the review of potential risks in certain credits that are considered part of the non-performing loan category contributed to the establishment of the allowance levels at each bank. Loan losses are charged off against the allowance when management believes the uncollectibility of a loan balance is confirmed.
Loans are reviewed on an ongoing basis for impairment. A loan is impaired when it is probable that we will be unable to collect all amounts due according to the contractual terms of the loan agreement. Impaired loans are measured based on the present value of expected cash flows discounted at the loan’s effective interest rate or, as a practical expedient, the fair value of collateral, if the loan is collateral dependent. Loans considered to be impaired are reduced to the present value of expected future cash flows or to the fair value of collateral by allocating a portion of the allowance for loan losses to such loans. If these allocations cause an increase in the allowance for loan losses such increase is reported as provision for loan loss. Increases or decreases in carrying value due to changes in estimates of future payments or the passage of time are reported as reductions or increases in the provision for loan losses.
Smaller balance homogeneous loans such as residential first mortgage loans secured by one to four family residences, residential construction, automobile, home equity and second mortgage loans, are collectively evaluated for impairment. Commercial loans and first mortgage loans secured by other properties are evaluated individually for impairment. When credit analysis of the borrower’s operating results and financial condition indicates the underlying ability of the borrower’s business activity is not sufficient to generate adequate cash flow to service the business’ cash needs, including our loans to the borrower, the loan is evaluated for impairment. Often this is associated with a delay or shortfall in payments of 90 days or less. Commercial loans are rated on a scale of 1 to 9, with grades 1 to 4 being pass grades, 5 and 6 being special attention or watch, 7 substandard, 8 doubtful, and 9 loss. Loans graded 6, 7, and 8 are considered for impairment. Loans are generally moved to nonaccrual status when 90 days or more past due. These loans are often considered impaired. Impaired loans, or portions thereof, are charged off when deemed uncollectible.
Premises and Equipment: Premises and equipment are stated on the basis of cost less accumulated depreciation. Depreciation is computed over the estimated useful lives of the assets, primarily by accelerated methods for income tax purposes and by the straight line method for financial reporting purposes. Buildings and related components are assigned useful lives ranging from 5 to 33 years. Furniture, fixtures and equipment are assigned useful lives ranging from 3 to 10 years.
Other Real Estate: Other real estate (included as a component of other assets) includes properties acquired through either a foreclosure proceeding or acceptance of a deed in lieu of foreclosure and is initially recorded at the fair value less cost to sell when acquired, establishing a new cost basis. These properties are evaluated periodically and if fair value declines subsequent to foreclosure, a valuation allowance is recorded through expense. Costs incurred for the property after foreclosure are expensed. Other real estate owned totaled $7.4 million and $5.4 million at December 31, 2009 and 2008. Gains and losses on the sale of other real estate owned are recorded on the income statement as other income.
30
The following table summarizes the activity associated with other real estate owned.
|
(In Thousands of Dollars) |
2009 |
2008 |
|
Balance at beginning of year |
$ 5,382 |
$ 3,153 |
|
Properties transferred into OREO |
11,211 |
5,377 |
|
Valuation impairments recorded |
(1,271) |
(688) |
|
Proceeds from sale of properties |
(7,561) |
(2,273) |
|
Gain or (loss) on sale of properties |
(336) |
(187) |
|
Balance at end of year |
$7,425 |
$5,382 |
Goodwill and Other Intangible Assets: Goodwill results from business acquisitions and represents the excess of the purchase price over the fair value of acquired tangible assets and liabilities and identifiable intangible assets. Goodwill is assessed at least annually for impairment and any such impairment is recognized in the period identified. We use a market valuation model, which compares the inherent value of our company to valuations of recent transactions in the market place to determine if the our goodwill has been impaired.
Other intangible assets consist of core deposit, acquired customer relationship intangible assets arising from whole bank and branch acquisitions, and non-compete agreements. They are initially measured at fair value and then are amortized on an accelerated method over their estimated useful lives.
Long Term Assets: Premises and equipment, core deposit and other intangible assets, and other long-term assets are reviewed for impairment when events indicate their carrying amount may not be recoverable from future undiscounted cash flows. If impaired, a charge is taken to earnings, and the assets are written down to fair value.
Loan Commitments and Related Financial Instruments: Financial instruments include off-balance sheet credit instruments, such as commitments to make loans and commercial letters of credit, issued to meet customer financing needs. The face amount for these items represents the exposure to loss, before considering customer collateral or ability to repay. Such financial instruments are recorded when they are funded.
Income Taxes: We record income tax expense based on the amount of taxes due on our tax return plus the change in deferred taxes, computed based on the future tax consequences of temporary differences between the carrying amounts and tax bases of assets and liabilities using enacted tax rates. A valuation allowance, if needed, reduces deferred tax assets to the amount expected to be realized.
Earnings Per Share: Basic earnings per share is calculated by dividing net income available for common shareholders (net income less preferred stock dividends and accretion of the preferred stock discount) by the weighted average number of common shares outstanding. Diluted earnings per share is calculated by dividing net income available for common shareholders by the weighted average common shares outstanding including the dilutive effect of additional common shares that may be issued under outstanding stock options and warrants.
Comprehensive Income: Comprehensive income consists of net income and changes in unrealized gains and losses on securities available for sale, net of tax, which is recognized as a separate component of equity. Accumulated other comprehensive income consists of unrealized gains and losses on securities available for sale, net of tax.
Effect of Newly Issued Accounting Standards: The FASB issued new guidance in 2009 on the accounting for transfers of financial assets. The new guidance eliminates the concept of a qualifying special-purpose entity. Other changes from current accounting standards include new de-recognition criteria for a transfer to be accounted for as a sale, and a changes to the amount of recognized gain/loss on transfers accounted for as a sale when beneficial interests are received by the transferor. This new standard will be applied prospectively to new transfers of financial assets and will be effective for the first annual period beginning after November 15, 2009 and interim periods within that first annual period. Early application is prohibited. We have determined that the adoption of this new standard will not have a material effect on our financial statements.
Loss Contingencies: Loss contingencies, including claims and legal actions arising in the ordinary course of business, are recorded as liabilities when the likelihood of loss is probable and an amount or range of loss can be reasonably estimated. Management does not believe there are such matters that will have a material effect on the financial statements as of December 31, 2009.
31
Fair Value of Financial Instruments: Fair values of financial instruments are estimated using relevant market information and other assumptions, as more fully disclosed in a separate note. Fair value estimates involve uncertainties and matters of significant judgment regarding interest rates, credit risk, prepayments, and other factors, especially in the absence of broad markets for particular items. Changes in assumptions or in market conditions could significantly affect the estimates.
Reclassification: Certain 2007 and 2008 amounts may have been reclassified to conform to the 2009 presentation.
Operating Segments: While the chief decision-makers monitor the revenue streams of the various products and services, operations are managed and financial performance is evaluated on a company wide basis. Operating segments are aggregated into one as operating results for all segments are similar. Accordingly, all of the financial service operations are considered by management to be aggregated in one reportable operating segment.
NOTE 2 – ACQUISITIONS AND DIVESTITURES
On July 1, 2007 we acquired ICNB Financial Corporation (ICNB). ICNB was the holding company for The Ionia County National Bank of Ionia, based in Ionia, Michigan. Ionia County National Bank subsequently changed its name to Firstbank – West Michigan. The purpose of the acquisition was to increase market share in the Michigan banking market and to achieve increased operating efficiencies by leveraging our central support functions. As of June 30, 2007, ICNB had total assets of $231 million, total deposits of $172 million, and total loans, net of allowance, of $178 million. The merger was accounted for using the purchase accounting method of accounting, and accordingly the purchase price was allocated to assets acquired and the liabilities assumed based upon the estimated fair value as of the merger date.
Firstbank Corporation paid an aggregate value of $38.4 million to acquire the shares of ICNB common stock outstanding. The purchase price was determined using the Firstbank’s market price on February 1, 2007, the date of the merger agreement. We issued 874,749 shares of Firstbank common stock, and paid $19,584,000 in cash for the acquisition. The acquisition resulted in the creation of $19.0 million of intangible assets, of which $14.9 million was designated as goodwill and $3.7 million as core deposit intangible. The goodwill created in this merger is not tax deductible.
ICNB’s financial information is incorporated into the financial statements contained within this report from July 1, 2007 forward, the date of the merger.
On September 30, 2007, we sold our 55% majority ownership in C.A. Hanes Realty, Inc. at a loss after taxes of $104,000. Historical earnings from C.A. Hanes Realty, Inc., net of the 45% minority interest, are included in the financial presented in this report. Financial results subsequent to September 30, 2007 are excluded for C.A. Hanes, Realty, Inc. as the sale transaction was completed on that date.
NOTE 3 – RESTRICTIONS ON CASH AND DUE FROM BANKS
Our subsidiary banks are required to maintain average reserve balances in the form of cash and non-interest bearing balances due from the Federal Reserve Bank. The average reserve balances required to be maintained during 2009 and 2008 were $8,189,000 and $6,190,000, respectively. These balances do not earn interest.
32
NOTE 4 – SECURITIES
The fair value of securities available for sale was as follows:
|
|
Fair Value |
Gross Unrealized Gains |
Gross Unrealized Losses | |||
|
| ||||||
|
(In Thousands of Dollars) | ||||||
|
Securities Available for Sale: |
|
|
|
| ||
|
December 31, 2009: |
|
|
|
| ||
|
U.S. governmental agency |
$ 99,185 |
$ 435 |
$ (200) |
| ||
|
States and political subdivisions |
33,818 |
510 |
(217) |
| ||
|
Collateralized Mortgage Obligations |
10,339 |
338 |
(2) |
| ||
|
Equity |
3,338 |
172 |
(130) |
| ||
|
Total |
$ 156,930 |
$ 1,455 |
$ (549) |
| ||
|
|
|
|
|
| ||
|
December 31, 2008: |
|
|
|
| ||
|
U.S. governmental agency |
$ 64,102 |
$ 805 |
$ (64) |
| ||
|
States and political subdivisions |
33,278 |
442 |
(101) |
| ||
|
Collateralized Mortgage Obligations |
9,446 |
272 |
(6) |
| ||
|
Equity |
6,047 |
0 |
(6) |
| ||
|
Total |
$ 112,873 |
$ 1,519 |
$ (177) |
| ||
Securities with unrealized losses at year end 2009 and 2008 not recognized in income are as follows:
|
(In Thousands of Dollars) |
Less than 12 Months |
12 Months or More |
Total | |||
|
Description of Securities |
Fair Value |
Unrealized Loss |
Fair Value |
Unrealized Loss |
Fair Value |
Unrealized Loss |
|
December 31, 2009 |
|
|
|
|
|
|
|
US Government Agencies |
$ 29,394 |
$ (200) |
$ 0 |
$ 0 |
$ 29,394 |
$ (200) |
|
States and Political Subdivisions |
4,855 |
(182) |
2,618 |
(35) |
7,473 |
(217) |
|
Collateralized Mortgage Obligations |
1,410 |
(2) |
0 |
0 |
1,410 |
(2) |
|
Equity |
94 |
(56) |
126 |
(74) |
220 |
(130) |
|
Total Temporarily Impaired |
$ 35,753 |
$ (440) |
$ 2,744 |
$ (109) |
$ 38,497 |
$ (549) |
|
|
|
|
|
|
|
|
|
December 31, 2008 |
|
|
|
|
|
|
|
US Government Agencies |
$ 14,694 |
$ (64) |
$ 0 |
$ 0 |
$ 14,236 |
$ (64) |
|
States and Political Subdivisions |
3,527 |
(29) |
2,039 |
(72) |
5,567 |
(101) |
|
Collateralized Mortgage Obligations |
458 |
(6) |
0 |
0 |
458 |
(6) |
|
Equity |
0 |
0 |
250 |
(6) |
250 |
(6) |
|
Total Temporarily Impaired |
$ 18,679 |
$ (99) |
$ 2,289 |
$ (78) |
$ 20,511 |
$ (177) |
Unrealized losses on securities shown in the previous tables have not been recognized into income because management has the intent and ability to hold these securities for the foreseeable future. The decline in market value is due to changes in interest rates for debt securities and considered normal market fluctuations for equity securities. Management has also reviewed the issuers’ bond ratings, noting they are of high credit quality.
Trading account securities are marked to market with the change in value reported on the income statement. Gains and losses on available for sale securities are recognized if the security is either deemed to be other than temporarily impaired, or the security is sold. During 2008 as the credit markets seized up and the market for auction rate securities became illiquid, the value of those securities fell substantially. We determined that due to the uncertainty surrounding the recoverability of the value of these securities, an other than temporary impairment charge was appropriate. During 2009 we had two securities which were written down for other than temporary impairment by a total of $150,000. These securities were trust preferred securities of Michigan banks that had a combined original book value of $500,000 and were written down to $350,000. The following table shows gross gains and losses on investment securities for the three year period:
|
|
| ||
|
(In Thousands of Dollars) |
2009 |
2008 |
2007 |
|
Trading Account Securities Losses |
$ (213) |
$ (454) |
$ (628) |
|
|
|
|
|
|
Available for Sale Securities |
|
|
|
|
Other than temporary impairment losses |
$ (150) |
$ (5,443) |
$ 0 |
|
Gross realized gains |
1,814 |
$ 139 |
$ 8 |
|
Gross realized losses |
(130) |
(159) |
(131) |
|
Net realized gains (losses) |
$ 1,534 |
$ (5,463) |
$ (123) |
33
The fair value of securities at December 31, 2009, by stated maturity, is shown below. Actual maturities may differ from stated maturities because issuers may have the right to call or prepay obligations with or without call or prepayment penalties.
|
|
|
|
(In Thousands of Dollars) |
Fair Value |
|
Due in one year or less |
$ 22,960 |
|
Due after one year through five years |
102,555 |
|
Due after five years through ten years |
20,439 |
|
Due after ten years |
7,638 |
|
Total |
153,592 |
|
|
|
|
Equity securities |
3,338 |
|
Total securities |
$ 156,930 |
At December 31, 2009 and 2008, securities with carrying values approximating $101,187,000 and $70,027,000 were pledged to secure public trust deposits, securities sold under agreements to repurchase, and for such other purposes as required or permitted by law.
Federal Home Loan Bank stock is carried at cost, which approximates fair value.
NOTE 5 – LOAN SERVICING
Loans held for sale at year end are as follows:
|
(In Thousands of Dollars) |
| |
|
|
2009 |
2008 |
|
Loans held for sale |
$ 578 |
$ 1,408 |
|
Less: Allowance to adjust to lower of cost or market |
0 |
0 |
|
Loans held for sale, net |
$ 578 |
$ 1,408 |
|
|
|
|
Mortgage loans serviced for others are not reported as assets. The principal balances of these loans at year end are as follows:
|
(In Thousands of Dollars) |
| |
|
|
2009 |
2008 |
|
Mortgage loan portfolios serviced for: |
|
|
|
Federal Home Loan Mortgage Association |
$ 599,624 |
$ 508,874 |
|
Federal National Mortgage Association |
$ 2,535 |
$ 3,751 |
|
Federal Home Loan Bank |
$3,617 |
$ 5,375 |
Custodial escrow balances maintained in connection with serviced loans were $1,158,000 and $951,800 at year end 2009 and 2008.
Activity for capitalized mortgage servicing rights, included in other assets on the Consolidated Balance Sheet, was as follows:
|
(In Thousands of Dollars) |
| ||
|
|
2009 |
2008 |
2007 |
|
Servicing rights: |
|
|
|
|
Beginning of year |
$ 2,370 |
$ 2,284 |
$ 1,856 |
|
Acquired in acquisitions |
0 |
0 |
369 |
|
Additions |
3,056 |
1,038 |
580 |
|
Amortized to expense |
(1,721) |
(954) |
(521) |
|
Valuation (Impairment)/Recovery |
0 |
2 |
0 |
|
End of year |
$ 3,705 |
$ 2,370 |
$ 2,284 |
Management has determined that no valuation allowance was necessary at December 31, 2009 or 2008. A valuation allowance of $2 thousand was required at December 31, 2007 and was recovered in 2008.
The fair value of mortgage servicing rights was $5,422,000 and $4,542,000 at year end 2009 and 2008. Fair value was determined using a discount rate of 8.41%, prepayment speeds ranging from 170% to 270%, depending on the stratification of the specific right, and a weighted average delinquency rate of 1.53%.
The weighted average amortization period is 4.2 years. Estimated amortization expense for each of the next five years is:
|
(In Thousands of Dollars) | |
|
2010 |
$ 730 |
|
2011 |
$ 605 |
|
2012 |
$ 506 |
|
2013 |
$ 430 |
|
2014 |
$ 357 |
NOTE 6 – LOANS
|
Loans at year end were as follows:
|
| |
|
(In Thousands of Dollars) |
2009 |
2008 |
|
Commercial |
$ 192,096 |
$ 184,455 |
|
Mortgage Loans on Real Estate: |
|
|
|
Residential |
376,683 |
403,695 |
|
Commercial |
397,863 |
391,572 |
|
Construction |
85,229 |
103,206 |
|
Consumer |
63,403 |
69,328 |
|
Credit Card |
6,333 |
5,968 |
|
Subtotal |
1,121,607 |
1,158,224 |
|
Less: |
|
|
|
Allowance for loan losses |
19,114 |
14,594 |
|
Loans, net |
$ 1,102,493 |
$ 1,143,630 |
Activity in the allowance for loan losses was as follows:
|
(In Thousands of Dollars) | |||
|
|
2009 |
2008 |
2007 |
|
Beginning balance |
$ 14,594 |
$ 11,477 |
$ 9,966 |
|
Allowance of acquired bank |
0 |
0 |
2,345 |
|
Provision for loan losses |
14,671 |
8,256 |
2,014 |
|
Loans charged off |
(11,185) |
(5,815) |
(3,423) |
|
Recoveries |
1,034 |
676 |
575 |
|
Ending balance |
$19,114 |
$14,594 |
$ 11,477 |
Impaired loans were as follows:
|
(In Thousands of Dollars) |
| ||
|
|
2009 |
2008 |
2007 |
|
Year end loans with no allocated allowance for loan losses |
$ 19,223 |
$ 12,282 |
$ 11,392 |
|
Year end loans with allocated allowance for loan losses |
11,454 |
7,300 |
3,598 |
|
Total |
$ 30,677 |
$ 19,582 |
$ 14,990 |
|
|
|
|
|
|
Amount of the allowance for loan losses allocated |
$ 3,427 |
$ 2,885 |
$ 769 |
|
|
| ||
|
(In Thousands of Dollars) |
2009 |
2008 |
2007 |
|
Nonaccrual loans at year end |
$ 30,677 |
$ 19,582 |
$ 10,454 |
|
Restructured Loans |
7,106 |
275 |
543 |
|
Loans past due over 90 days still on accrual at year end |
3,221 |
4,982 |
3,161 |
|
Average of impaired loans during the year |
29,047 |
23,402 |
11,864 |
|
Interest income recognized during impairment |
718 |
454 |
463 |
|
Cash-basis interest income recognized |
58 |
52 |
30 |
Approximately $25,809,000 and $30,081,000 of commercial loans were pledged to the Federal Reserve Bank of Chicago discount window at December 31, 2009 and 2008 to secure potential overnight borrowings.
NOTE 7 – PREMISES AND EQUIPMENT
|
Year end premises and equipment were as follows: |
| |
|
(In Thousands of Dollars) |
2009 |
2008 |
|
Land |
$ 5,692 |
$ 5,294 |
|
Buildings |
31,937 |
31,937 |
|
Furniture, fixtures and equipment |
19,472 |
19,504 |
|
Total |
57,101 |
56,735 |
|
Less: |
|
|
|
Accumulated depreciation |
(31,664) |
(29,794) |
|
Total |
$ 25,437 |
$ 26,941 |
Depreciation expense was $2,675,000, $3,174,000, and $2,959,000 for 2009, 2008, and 2007. Rent expense was $356,000 in 2009 compared with $410,000 for 2008, and $406,000 for 2007. Rental commitments for the next five years under non-cancelable operating leases were as follows (before considering renewal options that generally are present):
|
(In Thousands of Dollars) | |
|
2010 |
$ 583 |
|
2011 |
568 |
|
2012 |
453 |
|
2013 |
373 |
|
2014 |
178 |
|
Total |
$ 2,155 |
NOTE 8 – GOODWILL AND INTANGIBLE ASSETS
Goodwill
During the third quarter of 2009 we commissioned a third party to complete an impairment analysis of our goodwill. The results of that test showed that no impairment existed at that time based on the assumptions used to value the company. We determined that the appropriate reporting level to evaluate the company was the total company. The standard for the valuation used was fair value defined as the price that would be received to sell the company as a whole in an orderly transaction between market participants at the measurement date. In addition, we assumed that synergies and other cost reductions of 15% would occur from a change of control in determination of the fair value.
The analysis included two approaches to determine the fair value; the income approach, where value was determined using a discounted cash flow of projected earnings capacity including synergies was determined using a 12% discount rate; and the market approach, where value was determined using price-to-earnings, price-to-tangible book value and core deposit premiums of similar sized transactions. These measures were compiled and a composite value determined. This composite value was compared to the carrying value of common equity to determine if impairment existed. Since the calculated fair value exceeded the carrying value of equity by 3.3% no impairment was recorded. As of the date the testing was completed, management concurred with the result provided by the third party used for the analysis.
Assumptions for future earnings and synergies are inherently uncertain and actual results could differ from these assumptions. If future earnings do not achieve the estimates used in the modeling, or future valuations for transactions in the market change, the results of future testing could be different, possibly resulting in impairment of our goodwill at a future date.
The change in the carrying amount of goodwill for the year is as follows:
|
(In Thousands of Dollars) |
| |
|
|
2009 |
2008 |
|
Balance at January 1 |
$ 35,603 |
$ 34,421 |
|
Goodwill from acquisitions/(divestitures) |
(90) |
302 |
|
Reclassification of other intangibles to goodwill |
0 |
880 |
|
Balance at December 31 |
$ 35,513 |
$ 35,603 |
The $302,000 of goodwill from acquisitions in 2008 relates to the purchase of ICNB. The $880,000 reclassification in 2008 resulted from a re-characterization of an intangible relating to an earlier acquisition.
Acquired Intangible Assets
Acquired intangible assets at year end were as follows:
|
|
| |||
|
(In Thousands of Dollars) |
Gross Amount |
Accumulated Amortization |
Net Carrying Amount | |
|
| ||||
|
2009 | ||||
|
Amortized intangible assets: |
|
|
|
|
|
Core deposit premium resulting from |
|
|
|
|
|
bank and branch acquisitions |
$ 7,930 |
$ 4,990 |
$ 2,940 |
|
|
Other customer relationship intangibles |
271 |
271 |
0 |
|
|
Total |
$ 8,201 |
$ 5,261 |
$ 2,940 |
|
|
|
|
|
|
|
|
2008 |
|
|
|
|
|
Amortized intangible assets: |
|
|
|
|
|
Core deposit premium resulting from |
|
|
|
|
|
bank and branch acquisitions |
$ 8,029 |
$ 4,148 |
$ 3,881 |
|
|
Other customer relationship intangibles |
271 |
271 |
0 |
|
|
Total |
$ 8,300 |
$ 4,419 |
$ 3,881 |
|
|
|
|
|
|
|
Aggregate amortization expense was $934,000, $1,071,000, and $954,000 for 2009, 2008, and 2007, respectively. The amount shown as core deposit premium at December 31, 2009 is net of a write off from sale of our Auburn branch in the second quarter of 2009 which had a gross amount of $99,000 and accumulated amortization of $92,000. Our estimated amortization expense for each of the next five years:
|
(In Thousands of Dollars) |
|
Year |
Amount |
|
2010 |
$ 796 |
|
2011 |
$ 697 |
|
2012 |
$ 482 |
|
2013 |
$ 370 |
|
2014 |
$ 278 |
NOTE 9 – FEDERAL INCOME TAXES
Federal income taxes consist of the following:
|
|
| ||
|
(In Thousands of Dollars) |
2009 |
2008 |
2007 |
|
Current expense |
$ 144 |
$ 2,451 |
$ 2,560 |
|
Deferred expense (benefit) |
241 |
(3,513) |
331 |
|
Change in deferred tax valuation allowance |
659 |
0 |
0 |
|
Total |
$ 1,044 |
$ (1,062) |
$ 2,891 |
A reconciliation of the difference between federal income tax expense and the amount computed by applying the federal statutory tax rate of 35% in 2009, 2008 and 2007 is as follows:
|
|
| ||
|
(In Thousands of Dollars) |
2009 |
2008 |
2007 |
|
Tax at statutory rate |
$ 1,307 |
$ (120) |
$ 3,947 |
|
Adjustment of federal tax uncertain liabilities |
0 |
0 |
(124) |
|
Effect of tax-exempt interest |
(554) |
(604) |
(535) |
|
Deferred tax valuation allowance |
659 |
0 |
0 |
|
Other |
(368) |
(338) |
(397) |
|
Federal income taxes |
$ 1,044 |
$ (1,062) |
$ 2,891 |
|
|
|
|
|
|
Effective tax rate |
28% |
322% |
26% |
37
The components of deferred tax assets and liabilities consist of the following at December 31st year end:
|
(In Thousands of Dollars) |
| |
|
|
2009 |
2008 |
|
Deferred tax assets: |
|
|
|
Allowance for loan losses |
$ 5,850 |
$ 4,709 |
|
Deferred compensation |
1,318 |
1,966 |
|
Losses on capital investments |
1,836 |
2,309 |
|
Other |
745 |
1,140 |
|
Total deferred tax assets |
9,749 |
10,124 |
|
Deferred tax liabilities: |
|
|
|
Fixed assets |
(1,852) |
(2,023) |
|
Mortgage servicing rights |
(1,019) |
(679) |
|
Purchase accounting adjustment |
(785) |
(920) |
|
Unrealized gain on securities available for sale |
(308) |
(457) |
|
Other |
(726) |
(894) |
|
Total deferred tax liabilities |
(4,690) |
(4,973) |
|
Net deferred tax assets |
$ 5,059 |
$ 5,151 |
|
Deferred tax valuation allowance |
(659) |
0 |
|
Net deferred tax assets |
$ 4,400 |
$ 5,151 |
A valuation allowance related to deferred tax assets is required when it is considered more likely than not that all or part of the benefits related to such assets will not be realized. In reviewing the company’s position relative to deferred tax assets associated with certain incurred capital losses, management determined that a valuation adjustment of $659,000 was necessary at year end 2009. Based on this determination, a non-cash charge was made to record the valuation adjustment, reducing the deferred tax asset, and increasing current year income tax expense. The establishment of a valuation allowance does not relinquish our rights to utilize the deferred asset, but rather recognizes that at the current time management does not believe the deferred asset will be able to be utilized prior to its expiration. The deferred assets for which the valuation allowance was established were related to capital losses for which we do not believe we will have capital gains to offset. These assets are; $70,000 to expire in 2012, and $589,000 to expire in 2015.
At year end 2008, management determined that no such allowance was required. Losses on capital investments have a three year carry back and five year carry forward time period for offset. The timeframe begins with the sale of the investment. Certain tax planning strategies have been established, including the possible sale and leaseback of certain of our facilities that management believes could be executed if necessary to retain the benefits listed above.
Net deferred tax assets at December 31, 2009 and 2008 are included in other assets in the accompanying consolidated balance sheets.
NOTE 10 – DEPOSITS
Time deposits of $100,000 or more were $243 million and $225 million at year end 2009 and 2008. There were $19.6 million and $27.0 million of brokered CDs included in time deposits of $100,000 or more in 2009 and 2008 respectively.
Scheduled maturities of time deposits at December 31, 2009 were as follows:
|
(In Thousands of Dollars) | |
|
Year |
Amount |
|
2010 |
$ 357,244 |
|
2011 |
152,619 |
|
2012 |
18,786 |
|
2013 |
14,142 |
|
2014 |
12,398 |
|
2015 and after |
10 |
|
Total |
$ 555,202 |
NOTE 11 – BORROWINGS
Information relating to securities sold under agreements to repurchase is as follows:
|
(In Thousands of Dollars) | ||
|
|
2009 |
2008 |
|
At December 31: |
|
|
|
Outstanding Balance |
$ 39,409 |
$ 52,917 |
|
Average Interest Rate |
.29% |
.34% |
|
|
|
|
|
Daily Average for the Year: |
|
|
|
Outstanding Balance |
$ 44,933 |
$ 42,111 |
|
Average Interest Rate |
.30% |
1.78% |
|
|
|
|
|
Maximum Outstanding at any Month End |
$ 50,148 |
$ 54,151 |
Securities sold under agreements to repurchase (repurchase agreements) generally have original maturities of less than one year. Repurchase agreements are treated as financings and the obligations to repurchase securities sold are reflected as liabilities. Securities involved with the agreements are recorded as assets of the Company and are primarily held in safekeeping by correspondent banks. Repurchase agreements are offered principally to certain large deposit customers as deposit equivalent investments.
We had no unsecured overnight borrowings, in the form of federal funds purchased at December 31, 2009. There were no overnight borrowings at December 31, 2008.
We renewed a line of credit agreement with Comerica Bank, on June 30, 2008 at a variable interest rate chosen by us of either Comerica Bank’s prime commercial borrowing rate, or 1.55% over Comerica Bank’s Eurodollar-based Rate. This agreement allowed for a revolving line of credit up to an aggregate principal amount of $30,000,000. In 2008 we accessed the line to provide working capital and had an outstanding balance of $5,600,000 at year end. On January 30, 2009, we repaid the balance and cancelled the line. A new line of credit of $6.0 million was established with the PrivateBank in early 2009. The line was never utilized and the Company chose to cancel the line prior to year-end.
Firstbank – Alma had a 6.00% fixed rate note payable with a balance of $27,000 at December 31, 2008. The note matured on January 1, 2009 and was paid off.
Firstbank – West Michigan had a 6.25% fixed rate note payable with a balance of $82,000 at December 31, 2008. The note was paid off on June 4, 2009.
Austin Mortgage Company, LLC had a prime rate minus 0.50% variable rate line of credit with a balance of $644,000 at December 31, 2008. The Company chose not to renew the line and it was paid off on January 30, 2009.
NOTE 12 – FEDERAL HOME LOAN BANK ADVANCES
Long term borrowings have been secured from the Federal Home Loan Bank. At year end, advances from the Federal Home Loan Bank were as follows:
|
(In Thousands of Dollars) |
| ||
|
|
2009 |
2008 |
|
|
Maturities January 2010 through March 2026 at fixed rates ranging from 0.40% to 7.30%, averaging 4.65% |
$ 92,263 |
$ 122,921 |
|
|
|
|
|
|
|
Maturities January 2010 through March 2010 with a variable rate of interest at year end of 0.46% |
$ 8,000 |
$ 33,000 |
|
Each Federal Home Loan Bank advance is payable at its maturity date without penalty, however, substantial penalties do exist if an advance is paid before its contractual maturity. Such penalties vary from advance to advance and are based on the size, interest rate, and remaining term of each specific advance. Advances of $68,900,000 may be converted from fixed to variable rate by the FHLB, but may be repaid, without penalty, if that option is exercised. The advances were collateralized by $270,638,000 and $282,731,000 of first mortgage loans under a blanket lien arrangement and pledges of specific mortgages at year end 2009 and 2008. As of December 31, 2009, the Company had $63,570,000 of additional borrowing capacity with the Federal Home Loan Bank.
39
Maturities of FHLB advances are as follows:
|
(In Thousands of Dollars) | |
|
2010 |
$ 66,419 |
|
2011 |
20,000 |
|
2012 |
4,826 |
|
2013 |
1,500 |
|
2014 |
0 |
|
2015 and after |
7,518 |
|
Total |
$ 100,263 |
NOTE 13 – SUBORDINATED DEBENTURES
On October 18, 2004, a trust formed by us issued $10,310,000 of LIBOR plus 1.99% variable rate trust preferred securities as part of a pooled offering of such securities. We issued subordinated debentures to the trust in exchange for the proceeds of the offering; the debentures represent the sole assets of the trust. We may redeem the subordinated debentures, in whole or in part, any time on or after October 18, 2009 at 100% of the principal amount of the securities. The debentures are required to be paid in full on October 18, 2034.
On January 20, 2006, a trust formed by us issued $10,310,000 of trust preferred securities as part of a pooled offering of such securities. The securities carry an interest rate of 6.049% for five years, and then convert to a variable rate of LIBOR plus 1.27% for the remainder of their term. We issued subordinated debentures to the trust in exchange for the proceeds of the offering; the debentures represent the sole assets of the trust. We may redeem the subordinated debentures, in whole or in part, any time on or after April 7, 2011 at 100% of the principal amount of the securities. The debentures are required to be paid in full on April 7, 2036.
On July 30, 2007, two trusts, formed by us, issued $15,464,000 of trust preferred securities as part of a pooled offering of such securities. One of the trusts issued $7,732,000 of variable rate securities at 90 day LIBOR plus 1.35% (6.71% on the date of issuance). The other trust issued $7,732,000 of fixed rate securities that carry an interest rate of 6.566% for five years, and then convert to a variable rate of 90 day LIBOR plus 1.35% for the remainder of their term. Firstbank then issued subordinated debentures to the trust in exchange for the proceeds of the offering; the debentures represent the sole assets of each of the trusts. We may redeem the subordinated debentures, in whole or in part, any time on or after July 30, 2012 at 100% of the principal amount of the securities. The debentures are required to be paid in full on July 30, 2037.
The trusts are not consolidated with the company’s financial statements, but rather the subordinated debentures are shown as a liability. Our investment in the stock of the trust was $1,084,000 and is included in equity securities available for sale. These investments are restricted from sale and are carried at historical cost, which approximates fair value.
NOTE 14 – SHAREHOLDERS’ EQUITY
We are subject to various regulatory policies and requirements relating to the payment of dividends, including requirements to maintain adequate capital above regulatory minimums.
On January 30, 2009 we issued 33,000 shares of Series A, no par value $1,000 liquidation preference, fixed rate cumulative perpetual preferred stock (Preferred Stock) and warrants to purchase 578,947 shares of our common stock at an exercise price of $8.55 per share (Warrants), to the U.S. Department of Treasury in return for $33 million under the Capital Purchase Program (CPP). Of the proceeds, $32.7 million was allocated to the Preferred Stock and $0.3 million was allocated to the Warrants based on the relative fair value of each. The $0.3 million discount on the Preferred Stock is being accreted using an effective yield method over five years. The Preferred Stock and Warrants qualify as Tier 1 capital.
The Preferred Stock pays cumulative quarterly cash dividends at a rate of 5% per year on the $1,000 liquidation preference through February 15, 2014 and at a rate of 9% per year thereafter. We accrue dividends based on the rates, liquidation preference and time since last quarterly dividend payment. Under the CPP, the consent of the U.S. Treasury is required for any quarterly common stock dividend of more than $0.225 per share (subject to adjustment for stock splits, stock dividends and certain other transactions) and for any common share repurchases (other than common share repurchases in connection with any benefit plan in the ordinary course of business) in each case until January 30, 2012, unless the Preferred Stock has been fully redeemed or the U.S. Treasury has transferred all the Preferred Stock to third parties prior to that date. In addition, all accrued and unpaid dividends on the Preferred Stock must be declared and the payment set aside for the benefit of the holders of Preferred Stock before any dividend may be declared on our common stock and before any shares of our common stock may be repurchased, subject to certain limited exceptions.
40
Holders of shares of the Preferred Stock have no right to exchange or convert such shares into any other security of Firstbank Corporation and have no right to require the redemption or repurchase of the Preferred Stock. The Preferred Stock does not have any sinking fund. The Preferred Stock is non-voting, other than class voting rights on certain matters that could adversely affect the Preferred Stock.
After January 30, 2012, we may redeem the Preferred Stock for the liquidation preference plus accrued and unpaid dividends. Any such redemption is subject to U.S. Treasury’s prior consultation with the Federal Reserve Board.
The Warrants are immediately exercisable for 578,947 shares of our common stock at an initial exercise price of $8.55 per common share. The Warrants are transferrable and may be exercised at any time on or before January 30, 2019.
NOTE 15 – BENEFIT PLANS
The Firstbank Corporation 401(k) plan, a defined contribution plan, is an IRS qualified 401(k) salary deferral plan, under which Firstbank Corporation stock is one of the investment options. The Board of Directors approved changing the plan to a Safe Harbor 401(k) plan for the 2008 plan year. A Safe Harbor plan relieves administrative testing in exchange for immediate vesting of the employee’s matching contributions. Both employee and employer contributions may be made to the plan. The Company’s 2009, 2008 and 2007 matching 401(k) contributions charged to expense were $557,000, $572,000 and $425,000 respectively. The increase in match represents additional employees from the ICNB acquisition. The percent of the Company’s matching contribution to the 401(k), and the determination to offer a Safe Harbor plan, is determined annually by the Board of Directors.
The ICNB Financial Corporation Incentive Savings Plan was an IRS approved 401(k) plan that allowed both employee and employer contributions. Firstbank – West Michigan’s 2007 matching contributions charged to expense after acquisition was $21,000. The ICNB Savings Plan was terminated in the first quarter of 2008 and Firstbank – West Michigan’s employees were eligible to participate in the Firstbank Corporation 401(k) Plan on January 1, 2008. Firstbank – West Michigan also had a deferred compensation plan for its directors and executive officers. The plan was frozen before the ICNB acquisition and has a balance at the end of 2009 of $2.3 million.
The Board of Directors had established the Firstbank Corporation Affiliate Deferred Compensation Plan (“Plan”). The American Jobs Creation Act of 2004, had significant impact on the design and operation of non-qualified deferred compensation plans. As a result of those changes, future deferrals into the Plan were suspended effective December 31, 2004. This nonqualified plan, as defined by the Internal Revenue Code, allowed Directors to defer their director fees and key management to defer a portion of their salaries into the Plan. The Plan was terminated in 2009 and the assets are being distributed according to the Plan document. The distribution does not materially enhance an existing benefit or right, nor does it create a new benefit or right.
NOTE 16 – STOCK BASED COMPENSATION
The Company has stock based compensation plans as described below. Total compensation cost that has been charged against income for those plans was $112,000, $181,000, and $247,000 for 2009, 2008 and 2007. The total income tax benefit was $38,000, $62,000 and $84,000, respectively.
The Firstbank Corporation Stock Compensation Plans of 1993, 1997 and 2006 (“Plans”), as amended, which were shareholder approved, provide for the grant of 395,986, 593,798 and 315,000 shares of stock, respectively, in either restricted form or under option. Options may be either incentive stock options or nonqualified stock options. As of December 31, 2009 only nonqualified stock options and restricted stock shares have been issued under the plans. The Plan of 1993 terminated April 26, 2003. The 1997 Plan terminated April 28, 2007. The 2006 Plan will terminate February 27, 2016. The Board, at its discretion, may terminate any or all of the Plans prior to the Plans’ scheduled termination dates. At year end 2009, there were 128,665 shares available for grand under the 2006 Plan.
41
Stock Option
Each option granted under the Plans may be exercised in whole or in part during such period as is specified in the option agreement governing that option. Options may only be issued with exercise prices equal to, or greater than, the stock’s market value on the date of issuance. The length of time available for a stock option to be exercised is governed by each option agreement, but has not been more than ten years from the issuance date.
All companies are required to record compensation cost for stock options provided to employees in return for employee service. The cost is measured at the fair value of the options when granted. This cost is expensed over the employee service period, which is normally the vesting period of the options.
The fair value of each option award is estimated on the date of grant using a closed form option valuation (Black-Scholes) model that uses the assumptions noted in the table below. Expected volatilities are based on historical volatilities of our common stock. We use historical data to estimate option exercise and post-vesting termination behavior. The expected term of options granted is based on historical data and represents the period of time that options granted are expected to be outstanding, which takes into account that the options are not transferable. The risk-free interest rate for the expected term of the option is based on the U.S. Treasury yield curve in effect at the time of the grant. The weighted average fair value of options granted was $2.18, $0.39 and $2.80 in 2009, 2008, and 2007, respectively.
|
|
2009 |
2008 |
2007 |
|
|
|
|
|
|
Risk-free interest rate |
2.80% |
2.71% |
3.53% |
|
Expected option life |
7 years |
7 years |
7 years |
|
Expected stock price volatility |
38.6% |
30.2% |
30.1% |
|
Dividend yield |
4.7% |
12.4% |
5.6% |
Activity under the plans:
|
|
Twelve months ended December 31, 2009 Total options outstanding | |||
|
|
Shares |
Weighted Average Exercise Price |
Weighted Average Remaining Contractual Life (years) |
Aggregate Intrinsic Value (000) |
|
Options outstanding, beginning of period |
485,140 |
$ 18.19 |
|
|
|
Granted |
42,950 |
$ 8.60 |
|
|
|
Exercised |
0 |
- |
|
|
|
Forfeited |
(9,242) |
$ 19.54 |
|
|
|
Expired |
(22,417) |
$ 15.40 |
|
|
|
Options outstanding, end of period |
496,431 |
$ 17.46 |
5.8 |
$ 40 |
|
Options exercisable, end of period |
334,937 |
$ 19.85 |
4.4 |
$ 8 |
Proceeds, related tax benefits realized from options exercised and intrinsic value of options exercised were as follows:
|
|
Twelve months ended December 31, | ||
|
(In Thousands of Dollars) |
|
|
|
|
|
2009 |
2008 |
2007 |
|
Proceeds of options exercised |
$ 0 |
$ 0 |
$ 624 |
|
Related tax benefit recognized |
$ 0 |
$ 0 |
$80 |
|
Intrinsic value of options exercised |
$ 0 |
$ 0 |
$ 227 |
As of December 31, 2009, there was $156,000 of total unrecognized compensation cost related to non-vested stock options granted under the Plans. The cost is expected to be recognized over a weighted-average period of 2.2 years.
42
Options outstanding at December 31, 2009 were as follows:
|
|
Options outstanding |
|
Exercisable | |||
|
Range of exercise prices |
Shares |
Weighted Average Exercise Price |
Weighted Average Contractual Life (years) |
|
Shares |
Weighted Average Exercise Price |
|
$ 7.80 - $12.00 |
107,700 |
$ 8.12 |
9.3 |
|
12,950 |
$ 7.80 |
|
$12.01 - $16.00 |
140,254 |
$ 14.85 |
4.3 |
|
102,304 |
$ 14.42 |
|
$16.01 - $ 20.00 |
41,213 |
$ 19.20 |
2.9 |
|
41,213 |
$ 19.20 |
|
$20.01 - $ 26.18 |
207,764 |
$ 23.75 |
5.4 |
|
178,469 |
$ 23.98 |
|
Total |
496,431 |
$ 17.46 |
5.8 |
|
334,937 |
$ 19.85 |
Restricted Stock
Restricted shares may be issued under the Plans as described above. Compensation expense is recognized over the vesting period of the shares based on the market value of the shares on the issue date.
A summary of changes in the Company’s non-vested shares for 2009 follows:
|
Non-vested Shares |
Shares |
|
Weighted-Average Grant-Date Fair Value |
|
Non-vested at January 1, 2009 |
10,015 |
|
$ 15.38 |
|
Granted |
8,500 |
|
$ 7.68 |
|
Vested |
(1,787) |
|
$ 12.79 |
|
Non-vested at December 31, 2009 |
16,228 |
|
$ 11.87 |
As of December 31, 2009, there was $115,000 of total unrecognized compensation cost related to non-vested shares granted under the Restricted Stock Plan. The cost is expected to be recognized over a weighted-average period of 1.8 years. The total fair value of shares vested during the years ended December 31, 2009, 2008 and 2007 was $22,900, $31,700, and $0. Expense of $48,000 was recorded for restricted stock in 2009 compared with $28,000 in 2008 and $14,000 in 2007.
NOTE 17 – RELATED PARTY TRANSACTIONS
Loans to principal officers, directors, and their affiliates were as follows:
|
(In Thousands of Dollars) |
2009 |
2008 |
|
Beginning balance |
$ 57,230 |
$ 51,569 |
|
New loans |
38,930 |
76,603 |
|
Repayments |
47,442 |
(67,572) |
|
Addition/(Deletion) of Directors |
(2,883) |
(3,370) |
|
Ending balance |
$ 45,835 |
$ 57,230 |
Deposits from principal officers, directors, and their affiliates at year end 2009 and 2008 were $23.2 million and $23.2 million respectively.
NOTE 18 – FINANCIAL INSTRUMENTS WITH OFF-BALANCE SHEET RISK
Some financial instruments, such as loan commitments, credit lines, letters of credit and overdraft protection are issued to meet customer financing needs. These are agreements to provide credit or to support the credit of others, as long as conditions established in the contract are met and usually have expiration dates. Commitments may expire without being used. Off-balance sheet risk to credit loss exists up to the face amount of these instruments although material losses are not anticipated. The same credit policies are used to make such commitments as are used for loans, including obtaining collateral at exercise of the commitment.
43
Financial instruments with off-balance sheet risk were as follows at year end:
|
|
(In Thousands of Dollars) | |||
|
|
2009 |
2008 | ||
|
|
Fixed Rate |
Variable Rate |
Fixed Rate |
Variable Rate |
|
Commitments to make loans |
$ 40,897 |
$8,016 |
$ 58,751 |
$ 10,807 |
|
(at market rates) |
|
|
|
|
|
Unused lines of credit and letters |
|
|
|
|
|
of Credit |
$ 22,452 |
$113,034 |
$ 22,547 |
$ 119,444 |
|
Standby Letters of Credit |
$ 6,541 |
$18,879 |
$ 8,491 |
$ 11,042 |
Commitments to make loans are generally made for periods of 60 days or less. The fixed rate loan commitments have interest rates ranging from 6.0% to 7.75% and maturities ranging from 1 year to 30 years.
NOTE 19 – CONTINGENCIES
From time to time certain claims are made against the Company and its banking subsidiaries in the normal course of business. There were no outstanding claims considered by management to be material at December 31, 2009.
NOTE 20 – DIVIDEND LIMITATION OF SUBSIDIARIES
Capital guidelines adopted by Federal and State regulatory agencies and restrictions imposed by law limit the amount of cash dividends the banks can pay to the Company. At December 31, 2009, using the most restrictive of these conditions for each bank, the aggregate cash dividends that the banks can pay the Company without prior approval was $21,848,000. It is not the intent of management to have dividends paid in amounts which would reduce the capital of the banks to levels below those which are considered prudent by management and in accordance with guidelines of regulatory authorities.
NOTE 21 – STOCK REPURCHASE PROGRAM
On July 23, 2007 the board of directors approved a plan to re-establish the authorization to repurchase shares of Firstbank Corporation common stock in an aggregate amount of up to $5 million from that date forward.
During 2007, we repurchased 103,100 shares of our common stock for an average cost per share of $17.47. We did not repurchase any shares during 2008 or 2009.
As of June 30, 2009 we had authority to repurchase $3.2 million of our common stock under the July 2007 plan. On August 24, 2009, the Board of Directors unanimously approved rescinding the remaining authority to repurchase common shares.
NOTE 22 – CAPITAL ADEQUACY
Banks and bank holding companies are subject to regulatory capital requirements administered by federal banking agencies. Capital adequacy guidelines and, additionally for banks, prompt corrective action regulations involve quantitative measures of assets, liabilities, and certain off-balance sheet items calculated under regulatory accounting practices. Capital amounts and classifications are also subject to qualitative judgments by regulators. Failure to meet capital requirements can initiate regulatory action.
Prompt corrective action regulations provide five classifications: well capitalized, adequately capitalized, undercapitalized, significantly undercapitalized and critically undercapitalized, although these terms are not used to represent overall financial condition. If adequately capitalized, regulatory approval is required to accept brokered deposits. If undercapitalized, capital distributions are limited; as are asset growth and expansion, and capital restoration plans are required.
At year end 2009 and 2008, the most recent regulatory notifications categorize us as well capitalized under the regulatory framework for prompt corrective action. There are no conditions or events since that notification that management believes have changed that classification.
44
Actual and required capital amounts at year end and ratios are presented below:
|
|
Actual |
Minimum Required For Capital Adequacy Purposes |
To Be Well Capitalized Under Prompt Corrective Action Provisions | |||
|
| ||||||
|
| ||||||
|
(In thousands of dollars) | ||||||
|
|
Amount |
Ratio |
Amount |
Ratio |
Amount |
Ratio |
|
2009 |
|
|
|
|
|
|
|
Total Capital to Risk Weighted Assets |
|
|
|
|
|
|
|
Consolidated |
$ 156,898 |
14.21% |
$ 88,355 |
8.00% |
$ 110,443 |
10.00% |
|
Firstbank – Alma |
21,728 |
12.66% |
13,727 |
8.00% |
17,159 |
10.00% |
|
Firstbank – Mt. Pleasant |
36,680 |
12.01% |
24,431 |
8.00% |
30,538 |
10.00% |
|
Firstbank – West Branch |
22,366 |
11.75% |
15,233 |
8.00% |
19,041 |
10.00% |
|
Firstbank – St. Johns |
8,823 |
12.22% |
5,777 |
8.00% |
7,221 |
10.00% |
|
Keystone Community Bank |
26,320 |
11.89% |
17,706 |
8.00% |
22,133 |
10.00% |
|
Firstbank – West Michigan |
17,308 |
13.22% |
10,473 |
8.00% |
13,091 |
10.00% |
|
|
|
|
|
|
|
|
|
Tier 1 (Core) Capital to Risk Weighted Assets |
|
|
|
|
|
|
|
Consolidated |
$ 143,538 |
13.00% |
$ 44,177 |
4.00% |
$ 66,266 |
6.00% |
|
Firstbank – Alma |
19,576 |
11.41% |
6,864 |
4.00% |
10,295 |
6.00% |
|
Firstbank – Mt. Pleasant |
32,861 |
10.76% |
12,215 |
4.00% |
18,323 |
6.00% |
|
Firstbank – West Branch |
20,372 |
10.70% |
7,616 |
4.00% |
11,425 |
6.00% |
|
Firstbank – St. Johns |
7,915 |
10.96% |
2,888 |
4.00% |
4,332 |
6.00% |
|
Keystone Community Bank |
23,542 |
10.64% |
8,853 |
4.00% |
13,280 |
6.00% |
|
Firstbank – West Michigan |
15,627 |
11.94% |
5,236 |
4.00% |
7,855 |
6.00% |
|
|
|
|
|
|
|
|
|
Tier 1 (Core) Capital to Average Assets |
|
|
|
|
|
|
|
Consolidated |
$ 143,538 |
10.05% |
$ 57,153 |
4.00% |
$ 71,441 |
5.00% |
|
Firstbank – Alma |
19,576 |
7.27% |
10,764 |
4.00% |
13,455 |
5.00% |
|
Firstbank – Mt. Pleasant |
32,861 |
9.07% |
14,499 |
4.00% |
18,124 |
5.00% |
|
Firstbank – West Branch |
20,372 |
8.15% |
9,995 |
4.00% |
12,493 |
5.00% |
|
Firstbank – St. Johns |
7,915 |
8.64% |
3,666 |
4.00% |
4,583 |
5.00% |
|
Keystone Community Bank |
23,542 |
9.97% |
9,446 |
4.00% |
11,808 |
5.00% |
|
Firstbank – West Michigan |
15,627 |
8.05% |
7,769 |
4.00% |
9,711 |
5.00% |
|
|
Actual |
Minimum Required For Capital Adequacy Purposes |
To Be Well Capitalized Under Prompt Corrective Action Provisions | |||
|
| ||||||
|
| ||||||
|
(In thousands of dollars) | ||||||
|
|
Amount |
Ratio |
Amount |
Ratio |
Amount |
Ratio |
|
2008 |
|
|
|
|
|
|
|
Total Capital to Risk Weighted Assets |
|
|
|
|
|
|
|
Consolidated |
$ 123,200 |
11.06% |
$ 89,122 |
8.00% |
$ 111,403 |
10.00% |
|
Firstbank – Alma |
18,744 |
10.36% |
14,469 |
8.00% |
18,086 |
10.00% |
|
Firstbank – Mt. Pleasant |
31,875 |
10.60% |
24,060 |
8.00% |
30,075 |
10.00% |
|
Firstbank – West Branch |
19,357 |
10.60% |
14,613 |
8.00% |
18,266 |
10.00% |
|
Firstbank – St. Johns |
22,557 |
10.27% |
17,571 |
8.00% |
21,964 |
10.00% |
|
Keystone Community Bank |
18,270 |
12.37% |
11,820 |
8.00% |
14,775 |
10.00% |
|
Firstbank – West Michigan |
|
|
|
|
|
|
|
|
|
|
|
|
|
|
|
Tier 1 (Core) Capital to Risk Weighted Assets |
$ 111,396 |
10.00% |
$ 44,561 |
4.00% |
$ 66,842 |
6.00% |
|
Consolidated |
16,480 |
9.11% |
7,234 |
4.00% |
10,852 |
6.00% |
|
Firstbank – Alma |
28,924 |
9.62% |
12,030 |
4.00% |
18,045 |
6.00% |
|
Firstbank – Mt. Pleasant |
17,364 |
9.51% |
7,307 |
4.00% |
10,960 |
6.00% |
|
Firstbank – West Branch |
6,566 |
9.28% |
2,829 |
4.00% |
4,244 |
6.00% |
|
Firstbank – St. Johns |
16,392 |
11.09% |
5,910 |
4.00% |
8,865 |
6.00% |
|
Keystone Community Bank |
|
|
|
|
|
|
|
Firstbank – West Michigan |
|
|
|
|
|
|
|
|
$ 111,396 |
8.08% |
$ 55,118 |
4.00% |
$ 68,897 |
5.00% |
|
Tier 1 (Core) Capital to Average Assets |
16,480 |
6.56% |
10,045 |
4.00% |
12,557 |
5.00% |
|
Consolidated |
28,924 |
8.48% |
13,649 |
4.00% |
17,062 |
5.00% |
|
Firstbank – Alma |
17,364 |
6.86% |
10,125 |
4.00% |
12,656 |
5.00% |
|
Firstbank – Mt. Pleasant |
6,566 |
7.80% |
3,367 |
4.00% |
4,209 |
5.00% |
|
Firstbank – West Branch |
20,676 |
8.95% |
9,243 |
4.00% |
11,554 |
5.00% |
|
Firstbank – St. Johns |
$ 123,200 |
11.06% |
$ 89,122 |
8.00% |
$ 111,403 |
10.00% |
|
Keystone Community Bank |
18,744 |
10.36% |
14,469 |
8.00% |
18,086 |
10.00% |
|
Firstbank – West Michigan |
31,875 |
10.60% |
24,060 |
8.00% |
30,075 |
10.00% |
NOTE 23 – FAIR VALUE OF FINANCIAL INSTRUMENTS
Carrying amount and estimated fair values of financial instruments were as follows at year end:
|
(In Thousands of Dollars) |
| |||
|
|
2009 |
2008 | ||
|
|
Carrying |
Fair |
Carrying |
Fair |
|
|
Amount |
Value |
Amount |
Value |
|
Financial Assets: |
|
|
|
|
|
Cash and cash equivalents |
$ 107,365 |
$ 107,365 |
$ 63,712 |
$ 63,712 |
|
Trading Account Securities |
2,828 |
2,828 |
222 |
222 |
|
Securities available for sale |
156,930 |
156,930 |
112,873 |
112,873 |
|
Federal Home Loan Bank stock |
9,084 |
9,084 |
9,084 |
9,084 |
|
Loans held for sale |
578 |
578 |
1,408 |
1,461 |
|
Loans, net |
1,102,493 |
1,101,500 |
1,143,630 |
1,149,175 |
|
Accrued interest receivable |
4,421 |
4,421 |
5,255 |
5,255 |
|
Financial Liabilities: |
|
|
|
|
|
Deposits |
(1,149,063) |
(1,135,093) |
(1,046,914) |
(1,048,661) |
|
Securities sold under agreements to |
|
|
|
|
|
repurchase and overnight borrowings |
(39,409) |
(39,409) |
(52,917) |
(52,917) |
|
Federal Home Loan Bank advances |
(100,263) |
(104,356) |
(155,921) |
(162,801) |
|
Notes payable |
0 |
0 |
(6,353) |
(6,355) |
|
Accrued interest payable |
(2,195) |
(2,195) |
(2,755) |
(2,755) |
|
Subordinated Debentures |
(36,084) |
(38,114) |
(36,084) |
(39,971) |
The methods and assumptions used to estimate fair value are described as follows: The carrying amount is the estimated fair value for cash and cash equivalents, short term borrowings, Federal Home Loan Bank stock, accrued interest receivable and payable, demand deposits, short term debt, and variable rate loans or deposits that re-price frequently and fully. Security fair values are based on market prices or dealer quotes, and if no such information is available, on the rate and term of the security and information about the issuer. For fixed rate loans or deposits and for variable rate loans or deposits with infrequent re-pricing or re-pricing limits, fair value is based on discounted cash flows using current market rates applied to the estimated life and credit risk. Fair values for impaired loans are estimated using discounted cash flow analysis or underlying collateral values. Fair value of loans held for sale is based on market quotes. Fair value of debt is based on current rates for similar financing. The fair value of off-balance sheet items is based on the current fees or cost that would be charged to enter into or terminate such arrangements. The fair value of off-balance sheet items was not material to the consolidated financial statements at December 31, 2009 and 2008.
The following tables present information about our assets measured at fair value on a recurring basis at December 31, 2009, and valuation techniques used by us to determine those fair values.
In general, fair values determined by Level 1 inputs use quoted prices in active markets for identical assets that we have the ability to access.
Fair values determined by Level 2 inputs use other inputs that are observable, either directly or indirectly. These Level 2 inputs include quoted prices for similar assets in active markets, and other inputs such as interest rates and yield curves that are observable at commonly quoted intervals. In 2008, our Level 2 securities consisted of auction rate securities secured by preferred stock, and preferred stock. We recorded other than temporary impairment on these securities to write them down to the valuation derived from the factors noted above as of December 31, 2009.
Level 3 inputs are unobservable inputs, including inputs that are available in situations where there is little, if any, market activity for the related asset or liability.
Assets Measured at Fair Value on a Recurring Basis
|
(In Thousands of Dollars) |
Quoted Prices in Active Markets for Identical Assets (Level 1) |
Significant Other Observable Inputs (Level 2) |
Significant Unobservable Inputs (Level 3) |
Balance at December 31 |
|
2009 |
|
|
|
|
|
Securities available for sale |
$ 149,371 |
$ 0 |
$ 7,559 |
$ 156,930 |
|
Trading securities |
$ 2,828 |
$ 0 |
$ 0 |
$ 2,828 |
|
|
|
|
|
|
|
2008 |
|
|
|
|
|
Securities available for sale |
$ 101,030 |
$ 3,963 |
$ 7,880 |
$ 112,873 |
|
Trading securities |
$ 222 |
$ 0 |
$ 0 |
$ 222 |
Changes in Level 3 Assets Measured at Fair Value on a Recurring Basis
|
(Dollars in Thousands) |
2009 |
2008 |
|
Balance at beginning of year |
$ 7,880 |
$ 13,160 |
|
Total realized and unrealized gains/(losses) included in income |
(100) |
(1,666) |
|
Total unrealized gains/(losses) included in other comprehensive income |
(56) |
0 |
|
Net purchases, sales, calls and maturities |
85 |
2,755 |
|
Net transfers in/out of Level 3 |
(250) |
(6,369) |
|
Balance at end of year |
$ 7,559 |
$ 7,880 |
The Level 3 assets that were held at each year end are carried at historical cost unless which approximates fair value. During 2009, $905,000 of these securities were sold, or paid down, and $990,000 of new securities were acquired. During 2008, $533,000 of these securities were sold, or paid down and $3.3 million of new securities were acquired. The $250,000 of net transfers out of Level 3 related to a security which is now priced in the open market.
Both observable and unobservable inputs may be used to determine the fair value of positions classified as Level 3 assets. As a result, the unrealized gains and losses for these assets presented in the tables above may include changes in fair value that were attributable to both observable and unobservable inputs.
Available for sale investments securities categorized as Level 3 assets primarily consist of bonds issued by local municipalities, and other like assets. We carry local municipal securities at cost, which approximates fair value, unless economic conditions for the municipalities changes to a degree requiring a valuation adjustment.
We also have assets that under certain conditions are subject to measurement at fair value on a non-recurring basis. These assets consist of impaired loans and other real estate owned. We have estimated the fair value of impaired loans using Level 3 inputs, specifically valuation of loans based on either a discounted cash flow projection, or a discount to the appraised value of the collateral underlying the loan. We use appraised values or broker’s price opinions to determine the fair value other real estate owned.
Assets Measured at Fair Value on a Nonrecurring Basis
|
(Dollars in Thousands) |
Balance at December 31, 2009 |
Quoted Prices in Active Markets for Identical Assets (Level 1) |
Significant Other Observable Inputs (Level 2) |
Significant Unobservable Inputs (Level 3) |
Total Losses for the period ended December 31, 2009 |
|
Impaired loans |
$ 37,783 |
$ 0 |
$ 0 |
$ 37,783 |
$ 6,866 |
|
Other real estate owned |
$ 7,425 |
$ 0 |
$ 0 |
$ 7,425 |
$ 924 |
Impaired loans categorized as Level 3 assets consist of non-homogeneous loans that are considered impaired. We estimate the fair value of the loans based on the present value of expected future cash flows using management’s best estimate of key assumptions. These assumptions include future payment ability, timing of payment streams, and estimated realizable values of available collateral (typically based on outside appraisals). The $6.9 million in losses indicated in the table above were charged to the allowance for loan losses.
NOTE 24 – BASIC AND DILUTED EARNINGS PER SHARE
|
(In Thousands, Except per Share Data) |
Year Ended December 31 | ||
|
|
2009 |
2008 |
2007 |
|
Basic earnings per common share |
|
|
|
|
Net income available to common shareholders |
$ 1,151 |
$ 719 |
$8,386 |
|
Weighted average common shares outstanding |
7,657 |
7,477 |
6,954 |
|
|
|
|
|
|
Basic earnings per common share |
$ 0.15 |
$ 0.10 |
$ 1.21 |
|
|
|
|
|
|
Diluted Earnings per Share |
|
|
|
|
Net income available to common shareholders |
$ 1,151 |
$ 719 |
$8,386 |
|
|
|
|
|
|
Weighted average common shares outstanding |
7,657 |
7,477 |
6,954 |
|
Add dilutive effects of assumed exercises of options |
2 |
1 |
3 |
|
Weighted average common and dilutive potential |
|
|
|
|
Common shares outstanding |
7,659 |
7,478 |
6,957 |
|
|
|
|
|
|
Diluted earnings per common share |
$ 0.15 |
$ 0.10 |
$ 1.21 |
S tock options and warrants for 1,065,629, 419,290, and 314,036 shares of common stock were not considered in computing diluted earnings per share for 2009, 2008, and 2007 because they were anti-dilutive.
NOTE 25 – FIRSTBANK CORPORATION (PARENT COMPANY ONLY)
CONDENSED FINANCIAL INFORMATION
|
CONDENSED BALANCE SHEETS |
| |
|
|
Year Ended December 31, | |
|
(In Thousands of Dollars) |
2009 |
2008 |
|
ASSETS |
|
|
|
Cash and cash equivalents |
$ 10,152 |
$ 600 |
|
Commercial loans |
214 |
242 |
|
Investment in and advances to banking subsidiaries |
163,071 |
149,319 |
|
Securities |
3,912 |
1,306 |
|
Other assets |
8,467 |
9,671 |
|
Total Assets |
$ 185,816 |
$ 161,139 |
|
LIABILITIES AND EQUITY |
|
|
|
Accrued expenses and other liabilities |
$ 2,852 |
$ 4,471 |
|
Other Borrowed Funds |
0 |
5,600 |
|
Subordinated Debentures |
36,084 |
36,084 |
|
Shareholders’ equity |
146,880 |
114,983 |
|
Total Liabilities and Shareholders’ Equity |
$ 185,816 |
$ 161,139 |
|
CONDENSED STATEMENTS OF INCOME AND COMPREHENSIVE INCOME | |||
|
|
|
|
|
|
Years Ended December 31st |
2009 |
2008 |
2007 |
|
Dividends from banking subsidiaries (net of capital infusions) |
$ 7,246 |
$ 8,773 |
$ 13,574 |
|
Other income |
5,542 |
3,713 |
4,163 |
|
Other expense |
(8,800) |
(8,086) |
(8,353) |
|
Income before income tax and undistributed subsidiary income |
3,988 |
4,400 |
9,384 |
|
Income tax benefit |
1,022 |
1,522 |
1,446 |
|
Equity in undistributed subsidiary income |
(2,319) |
(5,203) |
(2,444) |
|
Net income |
2,691 |
719 |
8,386 |
|
Change in unrealized gain (loss) on securities, net of tax and |
|
|
|
|
classification effects |
(288) |
403 |
614 |
|
Comprehensive income |
$ 2,403 |
$ 1,122 |
$ 9,000 |
|
CONDENSED STATEMENTS OF CASH FLOWS |
|
|
|
|
|
Year Ended December 31, | ||
|
|
2009 |
2008 |
2007 |
|
Cash flows from operating activities |
|
|
|
|
Net income |
$ 2,691 |
$ 719 |
$ 8,386 |
|
Adjustments: |
|
|
|
|
Unrealized loss on trading account securities |
213 |
454 |
628 |
|
Equity in undistributed subsidiary income |
2,322 |
4,065 |
2,444 |
|
Stock Option and Restricted Stock Grant Compensation Expense |
158 |
209 |
261 |
|
Change in other assets |
1,204 |
3,764 |
973 |
|
Change in other liabilities |
(1,619) |
(582) |
754 |
|
Net cash from operating activities |
4,969 |
8,629 |
13,446 |
|
|
|
|
|
|
Cash flows from investing activities |
|
|
|
|
Sale/(Purchase) of Securities AFS |
(2,819) |
0 |
164 |
|
Net decrease in commercial loans |
28 |
32 |
51 |
|
Payments for Investments in Subsidiaries |
(16,360) |
(12,838) |
(39,120) |
|
Net cash from investing activities |
(19,151) |
(12,806) |
(38,905) |
|
|
|
|
|
|
Cash flows from financing activities |
|
|
|
|
Proceeds from issuance of long-term debt and notes payable |
0 |
6,100 |
35,064 |
|
Payments of long-term debt |
(5,600) |
(500) |
(19,600) |
|
Proceeds from issuance of preferred stock and common stock warrants |
33,000 |
0 |
0 |
|
Proceeds from issuance of common stock |
909 |
1,766 |
21,324 |
|
Repurchase of common stock |
0 |
0 |
(1,801) |
|
Dividends on preferred stock |
(1,513) |
0 |
0 |
|
Dividends on common stock |
(3,062) |
(6,725) |
(6,246) |
|
Net cash from financing activities |
23,734 |
642 |
28,741 |
|
Net change in cash and cash equivalents |
9,552 |
(3,535) |
3,282 |
|
Beginning cash and cash equivalents |
600 |
4,135 |
853 |
|
Ending cash and cash equivalents |
$ 10,152 |
$ 600 |
$ 4,135 |
49
NOTE 26 – OTHER COMPREHENSIVE INCOME
Other comprehensive income components and related taxes were as follows:
|
(In Thousands of Dollars) |
2009 |
2008 |
2007 |
|
Change in unrealized holding gains and losses on available for sale securities |
$ (1,098) |
$ 540 |
$ 858 |
|
Less reclassification adjustments for gains and losses later recognized in income |
1,534 |
(20) |
(123) |
|
Net unrealized gains and (losses) |
(436) |
560 |
981 |
|
Tax effect |
148 |
157 |
367 |
|
|
|
|
|
|
Other comprehensive income (loss) |
$ (288) |
$ 403 |
$ 614 |
NOTE 27 – QUARTERLY FINANCIAL DATA (UNAUDITED)
|
(In Thousands of Dollars, Except per Share Data) |
2009 |
| |||
|
|
1st Quarter |
2nd Quarter |
3rd Quarter |
4th Quarter |
Year |
|
| |||||
|
Interest income |
$ 18,732 |
$ 18,496 |
$ 18,763 |
$ 18,695 |
$ 74,686 |
|
Net interest income |
11,601 |
11,856 |
12,596 |
12,694 |
48,747 |
|
Income before federal income taxes |
1,983 |
(232) |
1,520 |
464 |
3,735 |
|
Net income |
1,513 |
62 |
1,217 |
(101) |
2,691 |
|
Preferred stock dividends |
274 |
413 |
413 |
413 |
1,513 |
|
Net income available to common shareholders |
1,239 |
(351) |
804 |
(514) |
1,178 |
|
Basic earnings per common share |
0.16 |
(0.04) |
0.10 |
(0.07) |
0.15 |
|
Diluted earnings per common share |
0.16 |
(0.04) |
0.10 |
(0.07) |
0.15 |
|
|
|
|
|
|
|
|
|
|
2008 |
| ||
|
|
1st Quarter |
2nd Quarter |
3rd Quarter |
4th Quarter |
Year |
|
Interest income |
$ 21,238 |
$ 20,411 |
$ 20,502 |
$ 20,040 |
$ 82,191 |
|
Net interest income |
11,464 |
11,517 |
11,895 |
11,962 |
46,838 |
|
Income before federal income taxes |
2,871 |
80 |
782 |
(4,076) |
(343) |
|
Net income |
2,150 |
292 |
737 |
(2,460) |
719 |
|
Basic earnings per common share |
0.29 |
0.04 |
0.10 |
(0.33) |
0.10 |
|
Diluted earnings per common share |
0.29 |
0.04 |
0.10 |
(0.33) |
0.10 |
All per share amounts have been adjusted for stock dividends and stock splits.
FIRSTBANK CORPORATION
BOARD OF DIRECTORS OFFICERS
William E. Goggin, Chairman Thomas R. Sullivan
Chairman, Firstbank – Alma President & Chief Executive Officer
Attorney, Goggin Law Offices
Samuel G. Stone
Thomas D. Dickinson, CPA Executive Vice President, Chief Financial
Certified Public Accountant Officer, Secretary & Treasurer
Biggs, Hausserman, Thompson & Dickinson P.C.
William L. Benear
David W. Fultz Vice President
Owner, Fultz Insurance Agency &,
Kirtland Insurance Agency Dan Grenier (effective January 1, 2010)
Vice President
Jeff A. Gardner
Certified Property Manager & David L. Miller
Owner, Gardner Group Vice President
Edward B. Grant, Ph.D., CPA Douglas J. Ouellette
Chairman, Firstbank (Mt. Pleasant) Vice President
General Manager, Public Broadcasting,
Central Michigan University Dale A. Peters (retired January 1, 2010)
Vice President
David D. Roslund, CPA
Administrator, Warwick Living Center Richard D. Rice
Small Business Investor and Manager Vice President of Accounting & Operations
Samuel A. Smith Thomas O. Schlueter
Owner, Smith Family Funeral Homes Vice President
Thomas R. Sullivan James E. Wheeler, II
President & Chief Executive Officer, Firstbank Corporation Vice President
Paul C. Williams
Controller
NON-BANK SUBSIDIARY
Austin Mortgage Company, LLC
FIRSTBANK CORPORATION FIRSTBANK CORPORATION
311 Woodworth Avenue OPERATIONS CENTER
P. O. Box 1029 308 Woodworth Avenue
Alma, Michigan 48801 Alma, Michigan 48801
(989) 463-3131
51
FIRSTBANK – ALMA
BOARD OF DIRECTORS OFFICERS
William E. Goggin, Chairman James E. Wheeler, II
Chairman, Firstbank Corporation President & Chief Executive Officer
Attorney, Goggin Law Offices
Richard A. Barratt
Martha A. Bamfield, D.D.S. Executive Vice President
Dentist, Nester & Bamfield, DDS, PC
Laura A. Crocker
Cindy M. Bosley Vice President
Chief Administrative Officer, Masonic Pathways
Gregory A. Daniels
Paul C. Lux Vice President
Owner, Lux Funeral Homes, Inc.
Tammy L. Halfmann
Donald L. Pavlik Vice President
Superintendent, Alma Public Schools
Marita A. Harkness
David D. Roslund, CPA Vice President
Administrator, Warwick Living Center
Small Business Investor and Manager Timothy M. Lowe
Vice President
Thomas R. Sullivan
President & Chief Executive Officer, Firstbank Corporation Joan S. Welke
Vice President
Saundra J. Tracy, Ph.D.
President, Alma College Pamela K. Winters
Vice President
James E. Wheeler, II
President & Chief Executive Officer, Firstbank – Alma
Vice President, Firstbank Corporation
SUBSIDIARY
Firstbank – Alma Mortgage Company
OFFICE LOCATIONS
Alma Ashley Ithaca Merrill
7455 N. Alger Road 114 S. Sterling St. 219 E. Center St. 125 W. Saginaw St.
(989) 463-3134 (989) 847-2394 (989) 875-4107 (989) 643-7253
230 Woodworth Ave. St. Charles St. Louis
(989) 463-3137 102 Pine St. 135 W. Washington Ave.
(989) 865-9918 (989) 681-5758
311 Woodworth Ave.
(989) 463-3131 Vestaburg
9002 W. Howard City-Edmore Rd.
(989) 268-5445
52
FIRSTBANK (MT. PLEASANT)
BOARD OF DIRECTORS OFFICERS
Edward B. Grant, Ph.D., CPA, Chairman Douglas J. Ouellette
General Manager, Public Broadcasting, Central Michigan University President & Chief Executive Officer
Steven K. Anderson Peter Stalker
President & CEO, Cadillac Tire Center, Cadillac Community Bank President-Cadillac
President & CEO, Upper Lakes Tire, Gaylord
Daniel J. Timmins
Ralph M. Berry Community Bank President-Clare
Owner, Berry Funeral Homes
Kim D. vonKronenberger
Glen D. Blystone, CPA Community Bank President - Lakeview
Blystone & Bailey, CPA’s PC
Mark B. Perry
Kenneth C. Bovee Senior Vice President
President & Chief Executive Officer, Keystone Management Group
Robert L. Wheeler
Robert E. List, CPA Senior Vice President
Shareholder, Weinlander Fitzhugh, CPA’s
Manager, Clare and Gladwin Offices Cheryl L. Gaudard
Vice President
William M. McClintic
Attorney, W.M. McClintic, PC Barbara J. Kain
Vice President
Keith D. Merchant
President, B&P Manufacturing Karen L. McKenzie
Vice President
J. Regan O’Neill
President and Co-Founder, Network Reporting Corporation Teresa L. Rupert
President and Co-Founder, NetMed Transcription Services, LLC Vice President
Douglas J. Ouellette Tracey L. Sallee
President & Chief Executive Officer, Firstbank (Mt. Pleasant) Vice President
Vice President, Firstbank Corporation
Dianne Stilson
E. Lynn Pohl, CPA Vice President
Partner, Boge, Wybenga & Bradley, PC
Kenneth A. Rader SUBSIDIARY
Owner, Ken Rader Farms Firstbank – Mt. Pleasant Mortgage Company
Phillip R. Seybert
President, P.S. Equities, Inc.
Thomas R. Sullivan
President & Chief Executive Officer, Firstbank Corporation
OFFICE LOCATIONS
Mt. Pleasant Cadillac Howard City Remus
102 S. Main St. 114 W. Pine St. 830 W. Shaw St. 201 W Whetland Ave.
(989) 773-2600 (231) 775-9000 (231) 937-4383 (989) 967-3602
4699 Pickard St. Clare Lakeview Shepherd
(989) 773-2335 806 N. McEwan Ave. 506 Lincoln Ave. 258 W. Wright Ave.
(989) 386-7313 (989) 352-7271 (989) 828-6625
2013 S. Mission St.
(989) 773-3959 Canadian Lakes 9531 N. Greenville Rd. Winn
10049 Buchanan Rd. (989) 352-8180 2783 Blanchard Rd.
1925 E. Remus Rd. Stanwood, MI (989) 866-2210
(989) 775-8528 (231) 972-4200 Morley
101 E. 4th St.
(231) 856-7652
53
FIRSTBANK – WEST BRANCH
BOARD OF DIRECTORS OFFICERS
Joseph M. Clark, Chairman Dale A. Peters
Owner, Morse Clark Furniture President & Chief Executive Officer
(retired January 1, 2010)
Bryon A. Bernard
CEO, Bernard Building Center Daniel H. Grenier
President & Chief Executive Officer
Robert Carpenter, CPA (effective January 1, 2010)
Vice President, Robertson & Carpenter CPA’s
Lorri B. Burzlaff
David W. Fultz Vice President
Owner, Fultz Insurance Agency &
Kirtland Insurance Agency Pamela J. Crainer
Vice President
Daniel H. Grenier
President & Chief Executive Officer, Firstbank – West Branch Danny J. Gallagher
Vice President, Firstbank Corporation Vice President
(effective January 1, 2010)
James L. Kloostra
Robert T. Griffin, Jr. Vice President
Owner and President, Griffin Beverage Company,
Northern Beverage Co. and West Branch Tank & Trailer Eileen S. McGregor
Vice President
Christine R. Juarez
Attorney, Juarez and Juarez, PLLC Mark D. Wait
Vice President
Norman J. Miller
Owner, Miller Farms and Miller Dairy Equipment and Feed Marie A. Wilkins
Vice President
Dale A. Peters (retired January 1, 2010)
President & Chief Executive Officer, Firstbank – West Branch
Vice President, Firstbank Corporation
Jeffrey C. Schubert, D.D.S.
Dentist
Thomas R. Sullivan
President & Chief Executive Officer, Firstbank Corporation
Mark D. Weber, MD Subsidiaries
Orthopedic Surgeon 1st Armored, Incorporated
Firstbank – West Branch Mortgage Company
Kimberly Zygiel
Accountant, Stephenson, Gracik & Company, PC
OFFICE LOCATIONS
West Branch Fairview Hale Higgins Lake
502 W. Houghton Ave. 1979 Miller Rd. 3281 M-65 4522 W. Higgins Lake Dr.
(989) 345-7900 (989) 848-2243 (989) 728-7566 (989) 821-9231
601 W. Houghton Ave. Prescott Rose City St. Helen
(989) 345-7900 311 Harrison St. 505 S. Bennett St. 1990 N. St. Helen Rd.
(989) 873-6201 (989) 685-3909 (989) 389-1311
2087 S. M-76
(989) 345-5050
2375 M-30
(989) 345-6210
54
FIRSTBANK – ST. JOHNS
BOARD OF DIRECTORS OFFICERS
Dr. Ann M. Flermoen, D.D.S., Chairman Thomas R. Sullivan
Dentist, Ann M. Flermoen, DDS Chief Executive Officer
Todd Deitrich Craig A. Bishop
President, Olympian Tool, Inc. President
Frank G. Pauli Janette Havlik
President, Pauli Ford-Mercury, Inc. Vice President
Sara Clark-Pierson Daniel Redman
Attorney, Certified Public Accountant, Clark Family Enterprises Vice President
Donald A. Rademacher
Owner, RSI Home Improvement, Inc.
Samuel A. Smith
Owner, Smith Family Funeral Homes
.
Thomas R. Sullivan
President & Chief Executive Officer, Firstbank Corporation
SUBSIDIARY
Firstbank – St. Johns Mortgage Company
OFFICE LOCATIONS
St. Johns DeWitt
201 N. Clinton Ave. 13070 US - 27
(989) 227-8383 (517) 668-8000
1065 Superior Dr.
(989)227-6995
55
KEYSTONE COMMUNITY BANK
BOARD OF DIRECTORS OFFICERS
Kenneth V. Miller, Chairman Thomas O. Schlueter
Partner, Havirco President & Chief Executive Officer
Owner, Millennium Restaurant Group
Diana K. Greene
Michelle L. Eldridge Senior Vice President
Principal, LVM Capital Management, LTD.
John E. Laman
Samuel T. Field Senior Vice President
Attorney, Field & Field, P.C
Cynthia J. Carter
Jeff A. Gardner Vice President
Certified Property Manager &
Owner, Gardner Group Sara S. Dana
Vice President
John E. Hopkins
Retired, former President & Chief Executive Officer, Rodney S. Dragicevich
Kalamazoo Community Foundation Vice President
Ronald A. Molitor Kimberly A. Labadie
President, Mol-Son, Inc. Vice President
John M. Novak Cynthia L. Mount
Principal, Miller Canfield Attorneys & Counselors Vice President
Thomas O. Schlueter
President & Chief Executive Officer, Keystone Community Bank
Vice President, Firstbank Corporation
Thomas R. Sullivan
President & Chief Executive Officer, Firstbank Corporation
John R. Trittschuh, M.D.
President, EyeCare Physicians and Surgeons, P.C.
SUBSIDIARY
Keystone Mortgage Services, LLC
OFFICE LOCATIONS
Kalamazoo Portage Paw Paw
107 West Michigan Ave. 6405 South Westnedge Ave. 900 East Michigan Avenue
(269) 553-9100 (269) 321-9100 (269) 655-1000
235 North Drake Road 3910 West Centre Street
(269) 544-9100 (269) 323-9100
2925 Oakland Drive
(269) 488-9200
5073 Gull Road (269)488-4800 FIRSTBANK - WEST MICHIGAN
56
BOARD OF DIRECTORS OFFICERS
Jerome I. Gregory, Chairman William L. Benear
Chief Executive Officer, Carr Agency, Inc. President & Chief Executive Officer
William L. Benear Clare R. Colwell
President & Chief Executive Officer, Firstbank – West Michigan Executive Vice President
Vice President, Firstbank Corporation
Larry A. D’Haem
Janice K. DeYoung Vice President
President, Michigan Chief Sales, Inc.
Debrann Hauserman
Thomas D. Dickinson, CPA Vice President
Certified Public Accountant
Biggs, Hausserman, Thompson & Dickinson P.C. Blaine A. Kemme
Vice President
David M. Laux
President, Industrial Engineering Services, Inc. Kevin M. Meade
Vice President
Dr. James E. Reagan, D.D.S.
Dentist, James E. Reagan, DDS Daniel P. Mitchell
Vice President
Thomas R. Sullivan
President & Chief Executive Office, Firstbank Corporation Jackeline Salerno Thebo
Vice President
Subsidiary
ICNB Mortgage Company
First Investment Center
OFFICE LOCATIONS
Ionia Belding Lowell Woodland
302 W. Main St. 105 S. Pearl St. 2601 W. Main St. 115 S. Main St.
(616) 527-0220 (616) 794-1195 (616) 897-6171 (269) 367-4911
202 N. Dexter St. 9344 W. Belding Rd. Sunfield
(616) 527-1550 (616) 794-0890 145 Main St.
(517) 566-8025
2600 S. State Rd. Hastings
(616) 527-9250 1500 W. M-43 Hwy.
(269) 948-2905
57
BUSINESS OF THE COMPANY
Firstbank Corporation is a bank holding company. As of December 31, 2009, our subsidiaries are Firstbank – Alma; Firstbank (Mt. Pleasant); Firstbank – West Branch and it’s wholly owned subsidiary 1st Armored, Incorporated; Firstbank – St. Johns; Keystone Community Bank; Firstbank – West Michigan; FBMI Risk Management Services, Inc.; and Austin Mortgage Company, LLC. As of December 31, 2009, Firstbank Corporation and its subsidiaries employed 466 people on a full-time equivalent basis.
We are in the business of banking. Each of our subsidiary banks is a full service community bank. The subsidiary banks offer all customary banking services, including the acceptance of checking, savings and time deposits and the making of commercial, agricultural, real estate, personal, home improvement, automobile and other installment and consumer loans. Trust services are offered to customers through Citizens Bank Wealth Management in the Firstbank – Alma main office and Primevest in the Firstbank – West Michigan main office. Deposits of each of the banks are insured by the Federal Deposit Insurance Corporation.
The banks obtain most of their deposits and loans from residents and businesses in Barry, Bay, Clare, Gratiot, Kalamazoo, Ionia, Iosco, Isabella, Mecosta, Midland, Montcalm, Ogemaw, Oscoda, Roscommon, Saginaw, and parts of Clinton, Eaton, Kent and Wexford counties. Firstbank – Alma has its main office and one branch in Alma, Michigan, and one branch located in each of the following areas: Ashley, Ithaca, Merrill, Pine River Township (near Alma), St. Charles, St. Louis, and Vestaburg, Michigan. Firstbank (Mt. Pleasant) has its main office and one branch located in Mt. Pleasant, Michigan, two branches located in Union Township (near Mt. Pleasant), two branches in Lakeview, and one branch located in each of the following areas: Cadillac, Canadian Lakes, Clare, Howard City, Morley, Remus, Shepherd, and Winn, Michigan. Firstbank – West Branch has its main office in West Branch, Michigan, and one branch located in each of the following areas: Fairview, Hale, Higgins Lake, Rose City, St. Helen, Prescott, and West Branch Township (near West Branch), Michigan. Firstbank – St. Johns has its main office and one branch located in St. Johns, Michigan and a third branch in DeWitt. Keystone Community bank has its main office and three branches located in Kalamazoo, Michigan, two additional branches in Portage, Michigan, and one branch in Paw Paw, Michigan. Firstbank – West Michigan has its main office and two additional branches in Ionia, Michigan, two branches in Belding, Michigan, and one branch each in Hastings, Lowell, Sunfield and Woodland, Michigan. The banks have no material foreign assets or income.
Our principal sources of revenues are interest and fees on loans and non-interest revenue resulting from banking and non-bank subsidiary activity. On a consolidated basis, interest and fees on loans accounted for approximately 78% of total revenues in 2009, 89% in 2008, and 83% in 2007. Non-interest revenue accounted for approximately 17% of total revenue in 2009, 5% in 2008, and 11% in 2007. Interest on securities accounted for approximately 5% of total revenue in 2009, 6% in 2008, and 6% in 2007.
Annual Meeting
The annual meeting of shareholders will be held on Monday, April 26, 2010 at 4:30 p.m., Heritage Center, Alma College, Alma, Michigan.
Independent Auditors General Counsel
Plante & Moran, PLLC Varnum LLP
Grand Rapids, Michigan Grand Rapids, Michigan
Stock Information
Firstbank Corporation common stock is traded on the NASDAQ National Market System under the symbol FBMI. For research information and/or investment recommendations, contact:
Howe Barnes, Hoefer & Arnett - or - FIG Partners, LLC
800-800-4693 800-677-9654
Transfer Agent Information
Registrar and Transfer Company is Firstbank Corporation’s Transfer Agent. You may contact the Investor Relations Department at 800-368-5948.
58