Attached files
| file | filename |
|---|---|
| EX-31.2 - EX-31.2 - ENTERPRISE BANCORP INC /MA/ | a09-35842_1ex31d2.htm |
| EX-23.0 - EX-23.0 - ENTERPRISE BANCORP INC /MA/ | a09-35842_1ex23d0.htm |
| EX-21.0 - EX-21.0 - ENTERPRISE BANCORP INC /MA/ | a09-35842_1ex21d0.htm |
| EX-32.0 - EX-32.0 - ENTERPRISE BANCORP INC /MA/ | a09-35842_1ex32d0.htm |
| EX-31.1 - EX-31.1 - ENTERPRISE BANCORP INC /MA/ | a09-35842_1ex31d1.htm |
UNITED STATES
SECURITIES AND EXCHANGE COMMISSION
Washington, D.C. 20549
Form 10-K
x ANNUAL REPORT PURSUANT TO SECTION 13 OR 15(d) OF THE SECURITIES EXCHANGE ACT OF 1934
For the fiscal year ended December 31, 2009
OR
o TRANSITION REPORT PURSUANT TO SECTION 13 OR 15(d) OF THE SECURITIES EXCHANGE ACT OF 1934
For the transition period from to
Commission file number 001-33912
Enterprise Bancorp, Inc.
(Exact name of registrant as specified in its charter)
|
Massachusetts |
|
04-3308902 |
|
(State or other jurisdiction of |
|
(IRS Employer Identification No.) |
|
incorporation or organization) |
|
|
|
|
|
|
|
222 Merrimack Street, Lowell, Massachusetts |
|
01852 |
|
(Address of principal executive offices) |
|
(Zip code) |
Registrant’s telephone number, including area code
(978) 459-9000
Securities registered pursuant to Section 12(b) of the Exchange Act:
|
Common Stock, $0.01 par value per share |
|
NASDAQ Global Market |
|
(Title of each class) |
|
(Name of exchange on which registered) |
Securities registered pursuant to Section 12(g) of the Exchange Act:
NONE
(Title of Class)
Indicate by check mark if the registrant is a well-known seasoned issuer, as defined in Rule 405 of the Securities Act. o Yes x No
Indicate by check mark if the registrant is not required to file pursuant to Section 13 or Section 15(d) of the Act. o Yes x No
Indicate by check mark whether the registrant (1) has filed all reports required to be filed by Section 13 or 15(d) of the Securities Exchange Act of 1934 during the preceding 12 months (or for such shorter period that the registrant was required to file such reports), and (2) has been subject to such filing requirements for the past 90 days. x Yes o No
Indicate by check mark whether the registrant has submitted electronically and posted on its corporate Web site, if any, every Interactive Data File required to be submitted and posted pursuant to Rule 405 of Regulation S-T (§232.405 of this chapter) during the preceding 12 months (or for such shorter period that the registrant was required to submit and post such files) o Yes o No
Indicate by check mark if disclosure of delinquent filers pursuant to Item 405 of Regulation S-K is not contained herein, and will not be contained, to the best of the registrant’s knowledge, in definitive proxy or information statements incorporated by reference in Part III of this Form 10-K or any amendment to this Form 10-K. o
Indicate by check mark whether the registrant is a large accelerated filer, an accelerated filer, a non-accelerated filer or a smaller reporting company. See definition of “accelerated filer and large accelerated filer” in Rule 12b-2 of the Exchange Act (Check one):
|
Large accelerated filer o |
|
Accelerated filer x |
|
|
|
|
|
Non-accelerated filer o |
|
Smaller reporting company o |
|
(Do not check if smaller reporting company) |
|
|
Indicate by check mark whether the registrant is a shell company (as defined in Rule 12b-2 of the Exchange Act) o Yes x No
State the aggregate market value of the voting and non-voting common equity held by non-affiliates computed by reference to the price at which the common equity was last sold, or the average bid price and asked price of such common equity, as of the last business day of the registrant’s most recently completed second fiscal quarter. $68,113,636 as of June 30, 2009
Indicate the number of shares outstanding of each of the issuer’s classes of common stock, as of the latest practicable date: March 8, 2010, Common Stock - Par Value $01: 9,132,063 shares outstanding
DOCUMENTS INCORPORATED BY REFERENCE
Portions of the issuer’s proxy statement for its annual meeting of stockholders to be held on May 5, 2010 are incorporated by reference in Part III of this Form 10-K.
ENTERPRISE BANCORP, INC.
|
|
|
Page Number |
|
|
PART I |
|
|
|
|
|
|
3 |
||
|
|
|
|
|
16 |
||
|
|
|
|
|
23 |
||
|
|
|
|
|
24 |
||
|
|
|
|
|
25 |
||
|
|
|
|
|
25 |
||
|
|
|
|
|
|
|
|
|
|
|
|
|
25 |
||
|
|
|
|
|
28 |
||
|
|
|
|
|
Management’s Discussion and Analysis of Financial Condition and Results of Operations |
29 |
|
|
|
|
|
|
60 |
||
|
|
|
|
|
62 |
||
|
|
|
|
|
Changes In and Disagreements with Accountants on Accounting and Financial Disclosure |
109 |
|
|
|
|
|
|
109 |
||
|
|
|
|
|
109 |
||
|
|
|
|
|
|
|
|
|
|
|
|
|
110 |
||
|
|
|
|
|
111 |
||
|
|
|
|
|
Security Ownership of Certain Beneficial Owners and Management and Related Stockholder Matters |
111 |
|
|
|
|
|
|
Certain Relationships and Related Transactions, and Director Independence |
111 |
|
|
|
|
|
|
111 |
||
|
|
|
|
|
|
|
|
|
|
|
|
|
112 |
||
|
|
|
|
|
|
117 |
PART I
Organization
Enterprise Bancorp, Inc. (the “Company” or “Enterprise”) is a Massachusetts corporation organized in 1996, which operates as the parent holding company of Enterprise Bank and Trust Company referred to as Enterprise Bank (the “Bank”). Substantially all of the Company’s operations are conducted through the Bank. The Bank, a Massachusetts trust company which commenced banking operations in 1989, has five wholly owned subsidiaries which are included in the Company’s consolidated financial statements:
· Enterprise Insurance Services, LLC, organized in 2000 for the purposes of engaging in insurance sales activities;
· Enterprise Investment Services, LLC, organized in 2000 for the purpose of offering non-deposit investment products and services, and;
· Three Massachusetts security corporations, Enterprise Security Corporation (2005), Enterprise Security Corporation II (2007) and Enterprise Security Corporation III (2007), which hold various types of qualifying securities. The security corporations are limited to conducting securities investment activities that the Bank itself would be allowed to conduct under applicable laws.
Enterprise’s headquarters are located at 222 Merrimack Street in Lowell, Massachusetts.
The services offered through the Bank and its subsidiaries are managed as one strategic unit and represent the Company’s only reportable operating segment.
All material intercompany balances and transactions have been eliminated in consolidation.
Market Area
The Company’s primary market area is the Merrimack Valley and North Central region of Massachusetts and South Central New Hampshire. Enterprise has seventeen full service branch banking offices located in the Massachusetts cities and towns of Acton, Andover, Billerica, Chelmsford, Dracut, Fitchburg, Leominster, Lowell, Methuen, Tewksbury, and Westford; and in the New Hampshire towns of Derry and Salem, which serve those cities and towns as well as the surrounding communities.
Management believes that the Company has established a strong reputation within its market area and has differentiated itself based upon service level, a targeted focus on growing and established local businesses, professionals, non-profits and high net worth individuals, and active community involvement, which has lead to a strong network with business and community leaders. Management actively seeks to strengthen its position, by capitalizing on market opportunities, and the continued pursuit of strategic growth within existing and into neighboring geographic markets.
Products and Services
Management continually examines new products and technologies in order to maintain a highly competitive mix of offerings and to target product lines to customer needs. The Bank and its subsidiaries offer a range of commercial and consumer loan products, deposit products, cash management and electronic banking services, investment advisory and management, trust and insurance services. These products and services are outlined below.
Lending Products
· General
The Company specializes in lending to business entities, non-profit organizations, professionals and individuals. The Company’s primary lending focus is on the development of high quality commercial relationships achieved through active business development efforts, strong community involvement and focused marketing strategies. Loans made to
businesses include commercial mortgage loans, construction and land development loans, secured and unsecured commercial loans and lines of credit, and standby letters of credit. The Company also originates equipment lease financing for businesses. Loans made to individuals include conventional residential mortgage loans, home equity loans, residential construction loans on primary residences, secured and unsecured personal loans and lines of credit. The Company does not have a “sub-prime” mortgage program. The Company seeks to manage its loan portfolio to avoid concentration by industry or loan size to minimize its credit risk exposure.
Enterprise employs a seasoned commercial lending staff, with commercial lenders supporting each branch location. An internal loan review function assesses the compliance of loan originations with the Company’s internal policies and underwriting guidelines and monitors the ongoing quality of the loan portfolio. The Company also contracts with an external loan review company to review loans in the loan portfolio on a pre-determined schedule, based on the type, size, rating, and overall risk of the loan.
A management loan review committee, consisting of senior lending officers and loan review personnel, is responsible for setting loan policy and procedures, as well as reviewing loans on the internal “watched asset list” and classified loan report. An internal credit review committee, consisting of senior lending officers and loan review personnel, generally meets three times per month, or on an as needed basis, to review loan requests related to borrowing relationships of certain dollar levels, as well as other borrower relationships recommended for discussion by committee members.
The Executive Committee of the Company’s Board of Directors, consists of five outside members of the Board and three executive officers who are also members of the Board, with several directors who are not on the committee rotating in on a regular basis. The Executive Committee approves loan relationships exceeding certain prescribed dollar limits. A Loan Committee, consisting of five outside members of the Board, and two executive officers who are also members of the Board, reviews current portfolio statistics, problem credits, construction loan reviews, watched assets, loan delinquencies, and the allowance for loan losses, as well as current market conditions and issues relating to the construction and real estate development industry and the report from the outside loan review company. The Board’s Loan Committee is also responsible for approval of charge-offs recommended by management. Approved charge-offs are forwarded to the full Board for ratification.
At December 31, 2009, the Bank’s statutory lending limit, based on 20% of capital (capital stock plus surplus and undivided profits, but excluding other comprehensive income), to any individual borrower and related entities was approximately $23.2 million, subject to certain exceptions provided under applicable law.
See also “Risk Factors” contained in Item 1A, for further discussion on a variety of risks and uncertainties that may affect the Company’s loan portfolio.
· Commercial Real Estate, Commercial and Industrial, and Construction Loans
Commercial real estate loans include loans secured by both owner-use and non-owner occupied real estate. These loans are typically secured by a variety of commercial and industrial property types including apartment buildings, office or mixed-use facilities, strip shopping malls, or other commercial property and are generally guaranteed by the principals of the borrower. Commercial real estate loans generally have repayment periods of approximately fifteen to twenty-five years. Variable interest rate loans have a variety of adjustment terms and indices, and are generally fixed for the first one to five years before periodic rate adjustments begin.
Commercial and industrial loans include seasonal revolving lines of credit, working capital loans, equipment financing (including equipment leases), and term loans. Also included in commercial and industrial loans are loans partially guaranteed by the Small Business Administration (SBA), loans under various programs issued in conjunction with the Massachusetts Development Finance Agency and other agencies. Commercial and industrial credits may be unsecured loans and lines to financially strong borrowers, secured in whole or in part by real estate unrelated to the principal purpose of the loan or secured by inventories, equipment, or receivables, and are generally guaranteed by the principals of the borrower. Variable rate loans and lines in this portfolio have interest rates that
are periodically adjusted, with loans generally having fixed initial periods of one to three years. Commercial and industrial loans have average repayment periods of one to seven years.
Commercial construction loans include the development of residential housing and condominium projects, the development of commercial and industrial use property and loans for the purchase and improvement of raw land. These loans are secured in whole or in part by the underlying real estate collateral and are generally guaranteed by the principals of the borrowers. Construction lenders work to cultivate long-term relationships with established developers. The Company limits the amount of financing provided to any single developer for the construction of properties built on a speculative basis. Funds for construction projects are disbursed as pre-specified stages of construction are completed. Regular site inspections are performed, either by experienced construction lenders on staff or by independent outside inspection companies, at each construction phase, prior to advancing additional funds. Commercial construction loans generally have terms of one to three years.
From time to time, Enterprise participates with other banks in the financing of certain commercial projects. In some cases, the Company may act as the lead lender, originating and servicing the loans, but participating out a portion of the funding to other banks. In other cases, the Company may participate in loans originated by other institutions. In each case, the participating bank funds a percentage of the loan commitment and takes on the related risk. The balances participated out to other institutions are not carried as assets on the Company’s financial statements. Loans originated by other banks in which the Company is the participating institution are carried in the loan portfolio at the Company’s pro rata share of ownership. The Company performs an independent credit analysis of each commitment and a review of the participation institution prior to participation in the loan.
Standby letters of credit are conditional commitments issued by the Company to guarantee the performance by a customer to a third party. The credit risk involved in issuing letters of credit is essentially the same as that involved in extending loan facilities to customers. If the letter of credit is drawn upon a loan is created for the customer, generally a commercial loan, with the same criteria associated with similar commercial loans.
· Residential Loans
Enterprise originates conventional mortgage loans on one-to-four family residential properties. These properties may serve as the borrower’s primary residence, vacation homes or investment properties. Loan to value limits vary generally from 80% for adjustable rate and multi-family owner occupied properties, up to 97% for fixed rate loans on single family owner occupied properties, with mortgage insurance coverage required for loan-to-value ratios greater than 80% based on program parameters. In addition, financing is provided for the construction of owner occupied primary residences. Residential mortgage loans may have terms of up to 30 years at either fixed or adjustable rates of interest. Fixed and adjustable rate residential mortgage loans are generally originated using secondary market underwriting and documentation standards.
Depending on the current interest rate environment, management projections of future interest rates and the overall asset-liability management program of the Company, management may elect to sell those fixed and adjustable rate residential mortgage loans which are eligible for sale in the secondary market, or hold some or all of this residential loan production for the Company’s portfolio. Mortgage loans are generally not pooled for sale, but instead sold on an individual basis. Enterprise may retain or sell the servicing when selling the loans. All loans sold are currently sold without recourse, subject to an early payment default period covering the first four payments for certain loan sales.
· Home Equity Loans and Lines of Credit
Home equity loans are originated for one-to-four family residential properties with maximum original loan to values ratios generally up to 80% of the assessed or appraised value of the property securing the loan. Home equity loan payments consist of monthly
principal and interest based on amortization ranging from three to fifteen years. The rates may also be fixed for three to fifteen years.
The Company originates home equity lines for one-to-four family residential properties with maximum original loan to value ratios generally up to 80% of the assessed or appraised value of the property securing the loan. Home equity lines generally have interest rates that adjust monthly based on changes in the Prime Rate as published in the Wall Street Journal, although minimum rates may be applicable. Some home equity line rates may be fixed for a period of time and then adjusted monthly thereafter. The payment schedule for home equity lines for the first ten years of the loans are interest only payments. Generally at the end of ten years, the line is frozen to future advances, and principal plus interest payments are collected over a fifteen-year amortization schedule.
· Consumer Loans
Consumer loans primarily consist of secured or unsecured personal loans and overdraft protection lines on checking accounts extended to individual customers.
· Credit Risk and Allowance for Loan Losses
Information regarding the Company’s credit risk and allowance for loan losses is contained in Item 7, “Management’s Discussion and Analysis of Financial Condition and Results of Operations”, under the headings “Credit Risk/Asset Quality” and “Allowance for Loan Losses”, contained in the section “Financial Condition”, and under the heading “Allowance for Loan Losses” which is contained in the “Critical Accounting Estimates” section of Item 7.
Deposit Products
Deposits have traditionally been the principal source of the Company’s funds. Enterprise offers commercial checking, business and municipal savings accounts, money market and business sweep accounts, and escrow management accounts, as well as checking and Simplified Employee Pension (“SEP”) accounts to employees of our business customers. A broad selection of deposit products are also offered to the general public, including personal interest checking accounts (“PIC”), savings accounts, money market accounts, individual retirement accounts (“IRA”) and certificates of deposit (“CDs”).
In addition to on-balance sheet sweep products, third party money market mutual funds are also offered for commercial sweep accounts. Management believes that commercial customers benefit from this product flexibility, while retaining a conservative investment option of the highest quality and safety. The balances transferred into mutual funds do not represent obligations of the Company and are not insured by the Federal Deposit Insurance Corporation (the “FDIC”).
Terms on CDs typically range from one week to thirty months. In addition to traditional in-house CDs, CDs are also originated through the Certificate of Deposit Account Registry Service (“CDARS”) nationwide network. This allows the Company to offer full FDIC insurance coverage on larger CD balances by placing the “excess” funds in FDIC insured CD’s issued by other banks in the network. In exchange, the other CDARS institutions place dollar-for-dollar matching funds with the Company. Essentially, the equivalent of the original deposit comes back to the Company in increments that are covered by FDIC insurance and is available to fund local loan growth. The Company’s first CDAR’s CD was placed with the network in January 2009.
Enterprise also utilizes brokered certificates of deposit (“brokered CD’s”), from a number of available sources, as an alternative to borrowed funds to support asset growth in excess of internally generated deposits. Brokered CD terms generally range from one to twelve months.
Management determines the interest rates offered on deposit accounts based on current and expected economic conditions, competition, liquidity needs, the volatility of existing deposits, the asset-liability position of the Company and the overall objectives of the Company regarding the growth and retention of relationships.
Investment Services
The Company provides a range of investment advisory and management services to individuals, family groups, businesses, trusts, foundations, non-profit organizations, endowments and retirement plans under the label “Enterprise Investment Advisors.” Investment services are delivered via two channels, brokerage services and investment management. Brokerage services are offered through a third party arrangement with Commonwealth Financial Network, a licensed securities brokerage firm, with products designed primarily for the individual investor. Investment management includes customized management and trust services offered to high net worth individuals, institutions and businesses.
The Company utilizes an open-architecture, “manager of managers” approach to client investment management. The philosophy is to identify and hire high performing independent investment management firms on behalf of our clients. Since 2008, the Company has partnered with Fortigent, LLC, an investment research and diligence firm, with over $20 billion in advisory assets under management, to strengthen strategic development, improve manager access and selection and provide performance monitoring capabilities. Fortigent performs detailed research and due diligence reviews and provides an objective analysis of each independent management firm based on historic returns, management, longevity, investment style, risk profile, and other criteria, and maintains ongoing oversight and monitoring of their performance. This due diligence is intended to enable the Company to customize investment portfolios to meet each customer’s financial objectives and deliver superior long-term performance.
Complementing our open-architecture “manager of managers” approach, Enterprise Investment Advisors also offer the flexibility of an individually managed portfolio, for clients who prefer customized asset management, which includes our Large Cap Core Equity Strategy, a proprietary blend of value and growth stocks.
Insurance Services
Enterprise Insurance Services, LLC, engages in insurance sales activities through a third party arrangement with HUB International New England, LLC (“HUB”), which is a full service insurance agency, with offices in Massachusetts and New Hampshire, and is part of HUB International Limited, which operates throughout the United States and Canada. Enterprise Insurance Services provides, through HUB, a full array of insurance products including property and casualty, employee benefits and risk-management solutions tailored to serve the specific insurance needs of businesses in a range of industries operating in the Company’s market area.
On-line Banking and Treasury Management Services
Major on-line banking capabilities include the following: internal transfers; loan payments; bill payments; placement of stop payments; balance inquiry; access to images of checks paid; and access to prior period account statements. In addition, business banking customers may take advantage of online cash management services, such as remote deposit capture service and the ability to initiate on-line electronic funds transfers, including ACH originations, electronic federal and state tax payments and wire transfers. Retail customers have the additional ability to open personal deposit and CD accounts.
Investment Activities
The investment portfolio activity is an integral part of the overall asset-liability management program of the Company. The investment function provides readily available funds to support loan growth as well as to meet withdrawals and maturities of deposits and attempts to provide maximum return consistent with liquidity constraints and general prudence, including diversification and safety of investments.
The securities in which the Company may invest are limited by regulation. In addition, an internal investment policy restricts fixed income investments to high quality securities within the following categories: U.S. treasury securities, federal agency obligations
(obligations issued by government sponsored enterprises that are not backed by the full faith and credit of the United States government), mortgage-backed securities (“MBS’s”), including collateralized mortgage obligations (“CMO’s”), and municipal securities (“Municipals”). The Company has not purchased sub-prime mortgage-backed securities or capital stock of FNMA or FHLMC. The Company is required to purchase Federal Home Loan Bank of Boston (“FHLB”) stock in association with the Bank’s outstanding advances from the FHLB; this stock is classified as a restricted investment and carried at cost. The Company may also invest in certificates of deposit and, within prescribed regulatory limits, in both publicly traded and unlisted equity securities, registered mutual funds and unregistered funds, including private hedge funds, venture capital and private equity funds and “funds of funds” that may in turn invest in any of the foregoing. The investment policy also limits the categories within the investment portfolio and sets target sector ranges as a percentage of the total portfolio. The effect of changes in interest rates, principal payments and market values are considered when purchasing securities.
The short-term investments classified as cash equivalents may be comprised of short-term U.S. Agency Discount Notes, money market mutual funds and overnight or short-term federal funds sold. Short-term investments not carried as cash equivalents are classified as “other short-term investments.”
As of the balance sheet dates reflected in this annual report all of the investment securities within the portfolio (with the exception of restricted FHLB stock) were classified as available for sale and carried at fair value. Management regularly reviews the portfolio for securities with unrealized losses that are other than temporarily impaired (“OTTI”). This assessment includes: evaluating the level and duration of the loss on individual securities; evaluating the credit quality of fixed income issuers; determining if any individual securities or mutual or other funds exhibit fundamental deterioration; and estimating whether it is unlikely that the individual security or fund will completely recover its unrealized loss within a reasonable period of time, or in the case of fixed income securities prior to maturity. If a decline in the market value of an equity security is considered other than temporary, the cost basis of the individual security is written down to market value with a charge to earnings. In the case of fixed income securities which the Company does not intend to sell and it is more likely than not that the Company will not be required to sell prior to a market price recovery or maturity, the noncredit portion of the impairment may be recognized in accumulated other comprehensive income with only the credit portion of the impairment charged to earnings.
Investment transaction summaries, portfolio allocations and projected cash flows are prepared quarterly and presented to the Asset-Liability Committee of the Company’s Board of Directors (“ALCO”) on a periodic basis. ALCO is comprised of six outside directors and three executive officers who are also directors of the Company, with various management liaisons. In addition, several directors who are not on the committee rotate in to the committee on a regular basis. ALCO regularly reviews the composition and key risk characteristics of the Company’s investment portfolio, including effective duration, cash flow, market value at risk and asset class concentration. Credit risk inherent in the portfolio is closely monitored by management and presented at least annually to ALCO. ALCO also approves the Company’s ongoing investment strategy and management updates the committee at each meeting.
See also “Risk Factors” contained in Item 1A, for further discussion on a variety of risks and uncertainties that may affect the Company’s investment portfolio.
Other Sources of Funds
As discussed above deposit gathering has been the principal source of funds. Asset growth in excess of deposits may be funded through the investment portfolio cash flow, or the following sources.
Borrowed Funds
Total borrowing capacity includes borrowing arrangements at the FHLB and the Federal Reserve Bank of Boston (“FRB”) discount window, through federal funds purchase arrangements with correspondent banks and repurchase agreements with customers.
Membership in the FHLB provides borrowing capacity based on qualifying collateral balances pre-pledged to the FHLB, including certain residential loans, home equity lines, commercial loans and U.S. Government and Agency securities. Borrowings from the FHLB have to date been utilized to fund short-term liquidity needs. This facility is an integral component of the Company’s asset-liability management program.
In order to provide additional contingent liquidity and a competitive funding source, short-term borrowing capacity has also been established with the FRB Discount Window based on the pledge of qualifying collateral balances to the FRB. At December 31, 2009, the collateral pledged for this FRB facility was comprised primarily of certain municipal securities from the investment portfolio. Additional types of collateral are available to increase borrowing capacity with the FRB if necessary.
The Company also borrows funds from customers (generally commercial and municipal customers) by entering into agreements to sell and repurchase investment securities from the Company’s portfolio, with terms that may range from one week to six months. These repurchase agreements represent a cost competitive funding source. Interest rates paid on these repurchase agreements are based on market conditions and the Company’s need for additional funds at the time of the transaction.
Pre-established federal funds purchase arrangements with large regional correspondent banks provide additional overnight and short-term borrowing capacity for the Company.
See also “Risk Factors” contained in Item 1A, for further discussion on a variety of risks and uncertainties that may affect the Company’s ability to obtain funding and sustain liquidity.
Junior Subordinated Debentures
In March 2000 the Company organized Enterprise (MA) Capital Trust I (the “Trust”), a statutory business trust created under the laws of Delaware, in order to issue $10.5 million of 10.875% trust preferred securities that mature in 2030 and are callable beginning in 2010, at a premium if called between 2010 and 2020. The proceeds from the sale of the trust preferred securities were used by the Trust, along with the Company’s $325 thousand capital contribution, to acquire $10.8 million in aggregate principal amount of the Company’s 10.875% Junior Subordinated Debentures that mature in 2030 and are callable beginning in 2010. The Company contributed $10.3 million of proceeds from the sale of these securities to the Bank in 2000.
Pursuant to the Accounting Standards Codification (“ASC”) Topic 810 “Consolidation of Variable Interest Entities”, issued by the Financial Accounting Standards Board (originally issued as Financial Interpretation No. 46R) in December 2003, the Company carries the $10.8 million of Junior Subordinated Debentures on the Company’s financial statements as a liability, with related interest expense, and the $10.5 million of trust preferred securities issued by the Trust, and the related non-interest expense, are excluded from the Company’s financial statements.
Capital Resources
Capital planning by the Company and the Bank considers current needs and anticipated future growth. The primary sources of capital have been the original capitalization of the Bank of $15.5 million from the sale of common stock in 1988 and 1989, the issuance of $10.5 million of trust preferred securities in 2000 by the Trust, net proceeds of $8.8 million from the 2009 offering discussed below, retention of earnings less dividends paid since the Bank commenced operations, proceeds from the exercise of employee stock options and proceeds from purchases of shares pursuant to the Company’s dividend reinvestment plan.
On September 10, 2009, the Company filed a shelf registration of rights and common stock with the Securities and Exchange Commission for the flexibility to raise, over a three year period, up to $25 million in capital, in order to increase capital to ensure the Company is positioned to take advantage of growth and market share opportunities. In the fourth quarter of 2009, the Company successfully completed a combined Shareholder
Subscription Rights Offering and Supplemental Community Offering under the shelf registration, raising $8.9 million in new capital ($8.8 million net of offering expenses). The Company contributed the net proceeds from these offerings to the Bank.
Management believes that current capital is adequate to support ongoing operations and that the Company and the Bank meet all capital adequacy requirements to which they are subject. As of December 31, 2009 and 2008, both the Company and the Bank qualified as “well capitalized” under applicable Federal Reserve Board and FDIC regulations.
See “Capital Requirements” below under the heading “Supervision and Regulation” for information regarding the Company’s and the Bank’s regulatory capital requirements.
Patents, Trademarks, etc.
The Company holds a number of registered service marks related to product names and corporate branding. The Company holds no patents, registered trademarks, licenses (other than licenses required to be obtained from appropriate banking regulatory agencies), franchises or concessions which are material to its business.
Employees
At December 31, 2009, the Company employed 321 full-time equivalent employees, including 136 officers. None of the employees are presently represented by a union or covered by a collective bargaining agreement. Management believes its employee relations to be excellent.
Company Website
Enterprise Bank currently uses outside vendors to design, support and host its internet website. The underlying structure of the site allows for the ongoing maintenance of the information to be performed by Company personnel. The site provides information on the Company and its products and services. Users have the ability to open various accounts (checking, saving, CD) as well as the ability to submit mortgage loan applications online. The site also provides the access point to a variety of specified banking services and to various financial management tools. In addition, the site includes the following major capabilities: career opportunities; an ATM/Branch Locator/Map; and investor and corporate information, which includes a corporate governance page. The corporate governance page includes the corporate governance guidelines, code of business conduct and ethics, and whistleblower protection policy, as well as the charters of the Board of Directors’, Audit, Compensation and Personnel, and Corporate Governance/Nominating committees.
In the Investor Relations section of the site, under the SEC Filings tab, the Company makes available copies of the Company’s annual report on Form 10-K, quarterly reports on Form 10-Q and current reports on Form 8-K. Additionally, the site includes all registration statements that the Company has been required to file in connection with the issuance of its shares. The Company similarly makes available all insider stock ownership and transaction reports filed with the SEC by executive officers, directors and any 10% stockholders under Section 16 of the Securities Exchange Act of 1934 (Forms 3, 4 and 5). Access to all of these reports is made available free of charge and is essentially simultaneous with the SEC’s posting of these reports on its EDGAR system through the SEC website (www.SEC.gov). The Company’s internet web address is: EnterpriseBanking.com.
Competition
Enterprise faces strong competition to generate loans and to attract deposits and investment advisory assets. National and larger regional banks have a local presence in the Company’s market area. Larger banks have certain competitive advantages, including the ability to make larger loans to a single borrower than is possible for the Company. The greater financial resources of larger banks also allow them to offer a broad range of automated banking services, to maintain numerous branch offices and to mount extensive advertising and promotional campaigns. Numerous local savings banks, commercial banks,
cooperative banks and credit unions have one or more offices in the Company’s market area. In addition, the non-taxable status of credit unions allows them certain advantages as compared to taxable institutions. Competition for loans, investment advisory assets and deposits also comes from other businesses that provide financial services, including consumer finance companies, mortgage brokers, private lenders, insurance companies, securities brokerage firms, institutional mutual funds, registered investment advisors and internet based banks. Management actively seeks to strengthen its competitive position by capitalizing on the market opportunities and the continued pursuit of strategic growth within existing and neighboring geographic markets.
Management continually examines the Company’s product lines and technologies in order to maintain a highly competitive mix of offerings and to target products to customer needs. Advances in, and the increased use of, technology, such as internet and mobile banking, electronic transaction processing and information security, are expected to have a significant impact on the future competitive landscape confronting financial institutions.
See also “Supervision and Regulation” below, and Item 1A, “Risk Factors”, and “Opportunities and Risks” included in the section entitled “Overview”, which is contained in Item 7, “Management’s Discussion and Analysis of Financial Condition and Results of Operations” for further discussion on how new laws and regulations and other factors may affect the Company’s competitive position, growth and/or profitability.
Supervision and Regulation
General
To the extent that the information in this report under the heading “Supervision and Regulation” describes statutory or regulatory provisions, it is qualified in its entirety by reference to the particular statutory or regulatory provision so described. Any changes in applicable laws or regulations may have a material effect on the business and prospects of the Company.
Bank holding companies and banks are subject to extensive government regulation through federal and state statutes and related regulations, which are subject to changes that can significantly affect the way in which financial service organizations conduct business.
Regulation of the banking and financial services industries has undergone significant developments over the past several years, some of which have eased legal and regulatory restrictions while others have increased regulatory requirements. Such developments on the federal level have included the following: increasing anti-money laundering and customer identification requirements; enhancing internal controls over financial reporting, corporate accountability and improving the quality of investor information; imposing requirements as to fraud and identity theft prevention, vendor management data breach response programs; providing consumers with greater access to and control over personal credit data; providing more comprehensive residential mortgage loan disclosures and automating the nation’s check-processing system, among other legal and regulatory developments.
Legislative initiatives at the state level in Massachusetts have also further addressed data security requirements for protecting consumer financial information and residential mortgage lending and foreclosure requirements.
The recent economic crisis has also resulted in significant new federal legislation and administrative initiatives intended to stabilize the U.S. banking system and residential real estate market and stimulate the economy. Federal legislation has included the Emergency Economic Stabilization Act of 2008 (“EESA”), under which the U.S. Treasury has injected capital directly into U.S. banks through its Troubled Asset Recovery Program (“TARP”), and the American Recovery and Reinvestment Act of 2009 (“ARRA”), under which Congress has approved various spending and tax measures, while also imposing significant new executive compensation restrictions and corporate governance standards on institutions that have either received TARP funding or receive such funding in the future. Administrative initiatives have included President Obama’s Financial Stability Plan, which is comprised of several components, including additional capital assistance to banks, a potential public-private vehicle for purchasing “toxic assets” from financial institutions, various consumer, business and community lending initiatives, and affordable
housing support and foreclosure prevention plans. The U.S. Congress also continues to consider further significant financial regulatory reform. In December 2009, the House of Representatives passed its version of the Wall Street Reform and Consumer Protection Act, which among other provisions would create a regulatory and resolution regime for systemically significant financial companies, would create a new Consumer Financial Protection Agency, and would impose restrictions on mortgage lending practices and limitations on executive compensation. The Senate continues to consider its own version of the bill, which has not yet advanced out of the Senate Banking Committee. Some or all of these recently adopted or currently proposed measures may result in increased regulation of the U.S. banking and financial services industries and additional restrictions on banking and other financial activities.
Any future increase in the extent of regulation imposed upon the banking or financial services industries generally could result in the Company incurring additional operating and compliance costs, which in turn could impede profitability.
Regulation of the Holding Company
The Company is a registered bank holding company under the federal Bank Holding Company Act of 1956, as amended (the “Bank Holding Company Act”). The business and operations of the Company are subject to the supervision and examination of the Board of Governors of the Federal Reserve System (the “Federal Reserve Board”). Under applicable state laws, the Company, through the Bank, is also subject to the supervisory jurisdiction of the Massachusetts Commissioner of Banks (the “Commissioner”) and, with respect to its New Hampshire branch operations, the New Hampshire Banking Department.
The Bank Holding Company Act requires prior approval by the Federal Reserve Board of the acquisition by the Company of substantially all the assets or more than five percent of the voting stock of any bank. The Bank Holding Company Act also authorizes the Federal Reserve Board to determine (by order or by regulation) what activities are so closely related to banking as to be a proper incident of banking, and thus, whether the Company, either directly or indirectly through non-bank subsidiaries, can engage in such activities. The Bank Holding Company Act prohibits the Company and the Bank from engaging in certain tie-in arrangements in connection with any extension of credit, sale of property or furnishing of services. There are also restrictions on extensions of credit and other transactions between the Bank, on the one hand, and the Company, or other affiliates of the Bank, on the other hand.
A bank holding company may also elect to become a “financial holding company”, by which a qualified parent company of a banking institution may engage, directly or through its non-bank subsidiaries, in any activity that is financial in nature or incidental to such financial activity or in any other activity that is complimentary to a financial activity and does not pose a substantial risk to the safety and soundness of depository institutions or the financial system generally. A bank holding company will be able to successfully elect to be regulated as a financial holding company if all of its depository institution subsidiaries meet certain prescribed standards pertaining to management, capital adequacy and compliance with the Federal Community Reinvestment Act. Financial holding companies remain subject to regulation and oversight by the Federal Reserve Board. The Company believes that the Bank, which is the Company’s sole depository institution subsidiary, presently satisfies all of the requirements that must be met to enable the Company to successfully elect to become a financial holding company. However, the Company has no current intention of seeking to become a financial holding company. Such a course of action may become necessary or appropriate at some time in the future depending upon the Company’s strategic plan.
· Capital Requirements of the Company
The Federal Reserve Board has adopted capital adequacy guidelines that generally require bank holding companies to maintain minimum total capital equal to 8% of total risk-weighted assets, with at least one-half of that amount (or 4% of total risk-weighted assets) consisting of core or Tier 1 capital. Total capital for the Company consists of Tier 1 capital and supplementary or Tier 2 capital. Tier 1 capital for the Company begins with common stockholders’ equity and is reduced by certain intangible assets. In addition, trust preferred securities may compose up to 25% of the Company’s Tier 1 capital
(subject to certain limitations and with any excess allocable to Tier 2, or supplementary capital). Supplementary capital for the Company is primarily comprised of a portion of the allowance for loan losses. Assets are adjusted under the risk-based capital guidelines to take into account different levels of credit risk; for example, cash and government securities are placed in a 0% risk category (requiring no additional capital), most home mortgage loans are placed in a 50% risk category, and the bulk of assets that, by their nature in the ordinary course of business, pose a direct credit risk to a bank holding company, including commercial real estate loans, commercial business loans and consumer loans, are placed in a 100% risk category.
In addition to the risk-based capital requirements, the Federal Reserve Board requires bank holding companies to maintain a minimum “leverage” ratio of Tier 1 capital to quarterly average total assets of 4% (3% percent if given the highest regulatory rating and not experiencing significant growth).
· Dividends
Under Massachusetts law, the Company’s Board of Directors is generally empowered to pay dividends on the Company’s capital stock out of its net profits and only to the extent that such payments will not impair the Bank’s capital stock.
See also “Dividends” contained in Item 5 “Market for Registrant’s Common Equity, Related Stockholder Matters and Issuer Purchases of Equity Securities” below, for further discussion on restrictions that may effect the Company’s and/or the Bank’s ability to pay dividends.
Regulation of the Bank
As a trust company organized under Chapter 172 of the Massachusetts General Laws, the Bank is subject to regulation, supervision and examination by the Commissioner and the FDIC. The Bank is also subject to certain regulatory requirements of the Federal Reserve Board and, with respect to its New Hampshire branch operations, the New Hampshire Banking Department.
The regulations of these agencies govern many aspects of the Bank’s business, including permitted investments, the opening and closing of branches, the amount of loans which can be made to a single borrower, mergers, appointment and conduct of officers and directors, capital levels and terms of deposits. The Federal Reserve Board also requires the Bank to maintain minimum reserves on its deposits. Federal and state regulators can impose sanctions on the Bank and its management if the Bank engages in unsafe or unsound practices or otherwise fails to comply with regulatory standards. Various other federal and state laws and regulations, such as truth-in-lending and truth-in-savings statutes, the Equal Credit Opportunity Act, the Bank Secrecy Act, the Real Estate Settlement Procedures Act, the Community Reinvestment Act, “Check 21” and the “FACT” Act, also govern the Bank’s activities and operations.
The Bank may also form, subject to the approvals of the Commissioner and the FDIC, “financial subsidiaries” to engage in any activity that is financial in nature or incidental to a financial activity. In order to qualify for the authority to form a financial subsidiary, the Bank would be required to satisfy certain conditions, some of which are substantially similar to those that the Company would be required to satisfy in order to elect to become a financial holding company. The Company believes that the Bank would be able to satisfy all of the conditions that would be required to form a financial subsidiary, although the Company has no current intention of doing so. Such a course of action may become necessary or appropriate at some time in the future depending upon the Company’s strategic plan.
· Capital Requirements of The Bank
The Bank is subject to separate capital adequacy requirements of the FDIC, which are substantially similar to the requirements of the Federal Reserve Board applicable to the Company. However, trust preferred proceeds contributed to the Bank from the Company are included in Tier 1 capital of the Bank without limitation.
Depository institutions, such as the Bank, are also subject to the prompt corrective action framework for capital adequacy established by the Federal Deposit Insurance Corporation Improvement Act of 1991 (“FDICIA”). Under FDICIA, the federal banking regulators are required to take prompt supervisory and regulatory actions against undercapitalized depository institutions. FDICIA establishes five capital categories: “well capitalized”, “adequately capitalized”, “undercapitalized”, “significantly undercapitalized”, and “critically undercapitalized.” A “well capitalized” institution has a total capital to total risk-weighted assets ratio of at least 10%, a Tier 1 capital to total risk-weighted assets ratio of at least 6%, a leverage ratio of at least 5% and is not subject to any written order, agreement or directive; an “adequately capitalized” institution has a total capital to total risk-weighted assets ratio of at least 8%, a Tier 1 capital to total risk-weighted assets ratio of at least 4%, and a leverage ratio of at least 4% (3% percent if given the highest regulatory rating and not experiencing significant growth), but does not qualify as “well capitalized.” An “undercapitalized” institution fails to meet one of the three minimum capital requirements. A “significantly undercapitalized” institution has a total capital to total risk-weighted assets ratio of less than 6%, or a Tier 1 capital to total risk-weighted assets ratio of less than 3%, or a leverage ratio of less than 3%. A “critically undercapitalized” institution has a ratio of tangible equity to assets of 2%, or less.
Under certain circumstances, a “well capitalized”, “adequately capitalized” or “undercapitalized” institution may be required to comply with supervisory actions as if the institution were in the next lowest category.
Failure to meet applicable minimum capital requirements, including a depository institution being classified as less than “adequately capitalized” within FDICIA’s prompt corrective action framework, may subject a bank holding company or its subsidiary depository institution(s) to various enforcement actions, including substantial restrictions on operations and activities, dividend limitations, issuance of a directive to increase capital and, for a depository institution, termination of deposit insurance and the appointment of a conservator or receiver.
FDIC Deposit Insurance Assessment
The Company’s deposit accounts are insured by the FDIC’s Deposit Insurance Fund (the “DIF”) up to the maximum amount provided by law. The Company’s deposit insurance expenses amounted to $2.2 million, $720 thousand, and $104 thousand in 2009, 2008 and 2007, respectively.
As a result of a dramatic increase nationwide in bank failures in 2008 and 2009, the DIF reserve ratio (DIF reserves as a percent of estimated insured deposits) declined substantially, and beginning in late 2008 the FDIC took several steps to restore their reserves, as required by law. The FDIC increased its annual assessment rate uniformly by 7 basis points for all insured institutions for the first quarter of 2009 only. In addition, the FDIC modified the risk-based assessment system beginning April 1, 2009 to require riskier institutions to pay a larger share of premiums. The modified system also increased the annual base assessment rates for all insured institutions by approximately 2 to 35 basis points uniformly, depending on risk category and several possible adjustments that could increase or decrease the institution’s base rate.
As an additional measure to restore the DIF’s reserve ratio, the FDIC imposed an emergency 20 basis point special assessment on all insured depository institutions as of June 30, 2009. The FDIC subsequently required all insured institutions to make an additional prepayment, on December 30, 2009, of estimated insurance assessments for 2010, 2011 and 2012, under an FDIC prescribed estimation formula, which included an annual deposit growth rate of 5% and an additional uniform three-basis point increase in the assessment rate schedule effective January 1, 2011. If the prepaid assessment is exhausted prior to the fourth quarter of 2012, institutions would be required to make additional quarterly payments to cover actual assessments. Any prepaid assessment not exhausted will be returned to the institution.
Under the Deposit Insurance Reform Act of 2005, eligible insured depository institutions, such as the Bank, shared in a one-time FDIC assessment credit pool of approximately $4.7 billion. This one-time credit was applied against the institutions’ 2007 deposit
insurance assessment. In the case of the Company, the one-time credit of approximately $333 thousand offset approximately 94% of the Bank’s deposit insurance assessment for 2007.
In addition to general increases in the FDIC’s assessment rates, the Company’s insurance costs increased in 2009 due to its participation in the FDIC’s Transaction Account Guarantee Program (the “TAGP”) as described further below.
The FDIC retains the ability to impose additional special assessments or implement future changes to the assessment rate or payment schedules.
Participation in Temporary Liquidity Guarantee Program and Transaction Account Guarantee Program
On October 14, 2008, the U.S. Treasury and the FDIC jointly announced two new temporary programs (which were subsequently renewed and extended in 2009) to strengthen confidence and encourage liquidity in the nation’s banking system. The Company began participating in these two temporary programs on November 13, 2008.
Under the Temporary Liquidity Guarantee Program (the “TLGP”) that concluded on October 31, 2009, certain newly issued senior unsecured debt of banks, thrifts and certain holding companies could be issued with the protection of an FDIC guarantee for a fee paid by the issuer. In October 2009, the FDIC, established a limited six month emergency guarantee program under which those institutions can seek approval from the FDIC to issue FDIC guaranteed debt (issued between October 31, 2009 through April 30, 2010), with a minimum fee of 300 basis points. As of December 31, 2009, the Company had not issued, and does not anticipate issuing, any debt guaranteed under the TLGP.
In addition, under the TAGP the FDIC provides depository institutions that have opted to participate with full insurance coverage for non-interest bearing deposit transaction accounts, regardless of the dollar amount, through June 30, 2010. The FDIC has made exceptions for certain interest bearing transaction accounts and funds swept into non-interest bearing savings accounts to also be covered under the TAGP. Participating institutions are charged a surcharge of 10 — 25 basis points on those non-interest bearing account balances over the existing insurance limit of $250 thousand. The cost of participating in this program is included in the “deposit insurance premiums” line on the Company’s condensed consolidated statement of income.
The Treasury’s Capital Purchase Program and Capital Assistance Program
In October 2008, the U.S. Treasury implemented a Capital Purchase Program (“CPP”) under the TARP provisions contained in EESA, which made capital available directly to qualifying publicly held banking institutions. The Capital Assistance Program (“CAP”) component of President Obama’s 2009 Financial Stability Plan provides an opportunity for additional capital to banks, whether or not they participated in the CPP, on terms revised from those included in the original CPP. After careful consideration, the Board of Directors concluded that it would not be in the best interests of the Company and its shareholders to obtain government capital funding under either of these programs.
Proposed Small Business Lending Fund
Most recently, in February 2010, President Obama has proposed a small business lending program, in which $30.0 billion in funds previously allocated to TARP would be made available to banks with less than $10.0 billion in assets for the purpose of facilitating increased lending to small businesses. Under the proposed program, qualifying banks would be eligible to receive up to 3.0% or 5.0% of their risk-weighted assets (3.0% for banks between $1.0 and $10.0 billion in assets and 5.0% for banks with less than $1.0 billion in assets). The dividend rate on the capital received would start at 5.0% and reduce to as low as 1.0% depending upon the recipient institution’s ability to demonstrate increased levels of small business lending. The new program would not be associated with TARP and, consequently, would not have the executive compensation limits and other restrictions associated with the previous TARP capital programs. The Company will review this proposal
if and when Congress acts to implement it to determine whether the Company’s participation in the program would be appropriate.
An investment in the Company’s common stock is subject to a variety of risks and uncertainties. The material risks and uncertainties that management believes affect the Company are described below. These risks and uncertainties are not listed in any particular order of priority and are not necessarily the only ones facing the Company. Additional risks and uncertainties that management is not aware of or focused on or that management currently deems immaterial may also impair the Company’s business and results of operations.
This report is qualified in its entirety by these risk factors. If any of the following risks actually occur, the Company’s financial condition and results of operations could be materially and adversely affected. If this were to happen, the value of the Company’s common stock could decline significantly, and shareholders could lose some or all of their investment.
The Company’s Profitability Depends Significantly on Economic Conditions in the Company’s Primary Market Areas
The Company’s success depends principally on the general economic conditions of the primary market areas in which the Company operates. The local economic conditions in these areas have a significant impact on the demand for the Company’s products and services as well as the ability of the Company’s customers to repay loans, the value of the collateral securing loans and the stability of the Company’s deposit funding sources.
The global economic crisis showed signs of stabilizing beginning in the second half of 2009, with partial recovery in many national financial markets; however the country is still experiencing high levels of unemployment, weakened residential and commercial real estate markets, and historically low interest rates. Although the current U.S. recession has not impacted the New England region as severely as many regions of the country, and the effect on the local economy has lagged the rest of the country, any long-term continuation of these national and global trends, or deterioration of the recovery progress, as well as any possible subsequent effects of these trends, could further weaken the regional economy and have long-term adverse consequences on local industries, employment levels, foreclosure rates and commercial real estate values which could negatively impact the Company’s financial condition, capital position, liquidity, and performance in a variety of ways. Potential adverse effects on the Company could include: continued downward pressure on its net interest margin; deterioration in its asset quality; a decline in the underlying values of commercial real estate collateral; an increased level of loan delinquencies; an increase in the level of its allowance for loan losses; a decline in the value of its investment portfolio; unanticipated charges against capital; funding sources may become restricted thereby impacting the Company’s ability to meet cash needs; and a decline in the market price of the Company’s common stock.
In addition to the consequences of the current economic recession, any significant and sustained decline in general economic conditions caused by acts of terrorism, an outbreak of hostilities or other international or domestic occurrences, market interest rate changes, or other factors, could also impact local economic conditions and, in turn, have a material adverse effect on the Company’s financial condition and results of operations.
The Company is Subject to Lending Risk
There are inherent risks associated with the Company’s lending activities. These risks include, among other things, the impact of changes in the economic conditions in the market areas in which the Company operates and changes in interest rates. Weakening of economic conditions within the Company’s market area or increases in interest rates could adversely impact the ability of borrowers to repay outstanding loans or the value of the collateral securing these loans.
The Company’s loan portfolio consists primarily of commercial real estate, commercial and industrial and construction loans. These types of loans are generally viewed as having more risk of default than owner-occupied residential real estate loans or consumer loans, and are also of typically larger balances. The underlying commercial real estate values, the actual costs necessary to complete a construction project, or customer cash flow and payment expectations on such loans can be more easily influenced by adverse conditions in the related industries, the real estate market or in the economy in general. Any significant deterioration in the credit quality of the commercial loan portfolio or underlying collateral values could have a material adverse effect on the Company’s financial condition and results of operations.
See the discussions contained in Item 7, “Management’s Discussion and Analysis of Financial Condition and Results of Operations”, under the headings “Loans” and “Credit Risk/Asset Quality” included in the section entitled “Financial Condition”, for further information regarding the Company’s commercial loan portfolio and credit risk.
The Company May Need to Increase the Allowance for Loan Losses
The Company maintains an allowance for loan losses, which is established through a provision for loan losses charged to earnings that represents management’s estimate of probable losses inherent within the existing portfolio of loans. The determination of the appropriate level of the allowance for loan losses inherently involves a high degree of subjectivity and requires the Company to make significant estimates of current credit risks and future trends, all of which may undergo material changes. In addition, bank regulatory agencies periodically review the Company’s allowance for loan losses and may require an increase in the provision for loan losses or the recognition of further loan charge-offs, based on judgments that differ from those of the Company’s management. Any increases in the allowance for loan losses will result in a decrease in net income and, depending upon the magnitude of the changes, could have a material adverse effect on the Company’s financial condition and results of operations.
See the discussions contained in Item 7, “Management’s Discussion and Analysis of Financial Condition and Results of Operations”, under the heading “Allowance for Loan Losses”, which is contained in the “Critical Accounting Estimates” section and under the headings “Credit Risk/Asset Quality” and “Allowance for Loan Losses”, included in the section entitled “Financial Condition”, for further information regarding the process by which the Company determines the appropriate level of its allowance for loan losses.
The Company’s Investment Portfolio Could Incur Losses
There are inherent risks associated with the Company’s investment activities. These risks include the impact of changes in interest rates, weakness in the real estate or other industries, adverse changes in regional or national economic conditions, and general turbulence in domestic and foreign financial markets, among other things. These conditions could adversely impact the fair market value and the ultimate collectability of the Company’s investments.
Management regularly reviews the portfolio for securities with unrealized losses that are other than temporarily impaired. In addition to fair market value impairment, carrying values may be adversely impacted due to a fundamental deterioration of the individual municipality or government agency whose debt obligations the Company owns or of the individual company or fund in which the Company has invested. At December 31, 2009, approximately 91% of the Company’s investment portfolio, or $126 million, was invested in obligations issued by federal government agencies, including Fannie Mae and Freddie Mac, or municipal government entities, while 7%, or $9.7 million, was invested in equity securities, including $4.7 million in FHLB stock.
If an investment’s value is deemed other than temporarily impaired, then the Company is required to write down the carrying value of the investment which may involve a charge to earnings. The determination of the level of other-than-temporary impairment involves a high degree of judgment and requires the Company to make significant estimates of current market risks and future trends, all of which may undergo material changes. Any OTTI
charges, depending upon the magnitude of the charges, could have a material adverse effect on the Company’s financial condition and results of operations.
As a member of the FHLB, the Company is required to purchase certain levels of FHLB capital stock in association with the Bank’s borrowing relationship from the FHLB. The FHLB is currently operating with retained earnings below its target level. The FHLB has instituted a plan to increase retained earnings which includes suspending its quarterly dividend and a moratorium on the repurchase of excess capital stock from member banks, among other programs. At December 31, 2009, the Company’s investment in FHLB capital stock amounted to $4.7 million. If further deterioration in the FHLB financial condition or capital levels occurs, the FHLB capital stock may become other than temporarily impaired to some degree. Additionally, if as a result of deterioration in its financial condition the FHLB restricts its lending activities, the Company may need to seek alternative funding sources to meet its liquidity needs. See also the discussion contained in this Item 1A under the heading “Sources of External Funding May Become Restricted and Impact the Company’s Liquidity.”
See the discussions contained in Item 7, “Management’s Discussion and Analysis of Financial Condition and Results of Operations”, under the heading “Impairment Review of Securities”, which is contained in the “Critical Accounting Estimates” section, and under the heading “Investment Securities”, included in the section entitled “Financial Condition”, for further information regarding the process by which the Company determines the level of other-than-temporary impairment.
The Company is Subject to Interest Rate Risk
The Company’s earnings and cash flows are largely dependent upon its net interest income, meaning the difference between interest income earned on interest-earning assets and interest expense paid on interest-bearing liabilities. Interest rates are highly sensitive to many factors that are beyond the Company’s control, including monetary policy of the federal government, inflation and deflation, volatility of financial and credit markets, and competition. If the interest rates paid on interest-bearing liabilities increase at a faster rate than the interest rates received on loans and other investments, the Company’s net interest income, and therefore earnings, could be adversely affected. Earnings could also be adversely affected if the interest rates received on loans and other investments fall more quickly than the interest rates paid on interest-bearing liabilities.
See Item 7A, “Quantitative and Qualitative Disclosures about Market Risk”, for further discussions related to the Company’s management of interest rate risk.
Sources of External Funding Could Become Restricted and Impact the Company’s Liquidity
The Company’s external funding sources include borrowing capacity in the brokered CD market, at the FHLB and FRB, and through federal fund purchase arrangements with correspondent banks, as well as accessing the public equity market through an offering of the Company’s stock. The Company has in the past also issued junior subordinated debentures through a “pooled” trust preferred offering, which was a common means of raising capital used by many community banks prior to the “freeze up” of the public capital markets that preceded the recent global economic crisis. If, as a result of general economic conditions or other events, these sources of external funding withdraw (as occurred in the case of the pooled trust preferred market) or limit the Company’s external funding capacity, the Company may not be able to raise adequate funds or may incur substantially higher cost or operating restrictions in order to raise necessary funds elsewhere. Any such increase in funding cost or restrictions could have a negative impact on the Company’s net interest income and, consequently, on its results of operations and financial condition.
Table of Contents
Increased Reliance on Borrowings and Brokered CD’s as Sources of Funds Could Adversely Affect the Company’s Profitability
The Company has traditionally funded asset growth principally through deposits and borrowings. As a general matter, deposits are typically a lower cost source of funds than external wholesale funding (brokered CD’s or borrowings), because interest rates paid for deposits are typically less than interest rates charged for wholesale funding (notwithstanding the recent declines in overnight borrowing rates). If, as a result of competitive pressures, market interest rates, general economic conditions or other events, the balance of the Company’s deposits decreases relative to the Company’s overall banking operations, the Company may have to rely more heavily on wholesale funding in the future. Any such increased reliance on wholesale funding could have a negative impact on the Company’s net interest income and, consequently, on its results of operations and financial condition.
The Use of Independent Investment Research Firms Expose the Company to Additional Risk
The Company relies on outside investment research and due diligence information, that is provided by several professional independent investment research firms, in selecting both independent management firms and individual securities for the Company’s investment advisory clients. These firms are subject to a variety of risk and uncertainties, including significant exposures to changes in financial market conditions and poor investment decisions, turnover in key personnel, internal and external securities fraud, information security or data breach, and financial losses, among others, any of which could in turn expose the Company itself to various risks. The risks to the Company include but are not limited to, the loss of customer business, damage to the Company’s reputation, exposure of the Company to civil litigation and possible financial liability, and a reduction in fee income, any of which could have a material adverse effect on the Company’s financial condition and results of operations.
The Company’s Capital Levels Could Fall Below Regulatory Minimums
The Company and the Bank are both subject to the capital adequacy guidelines of the FRB and FDIC, respectively. Failure to meet applicable minimum capital ratio requirements may subject the Company and/or the Bank to various enforcement actions. If the Company experiences rapid asset growth, or if capital levels decline due to: possible future net operating losses; impairment charges against tangible or intangible assets; adjustments to retained earnings due to changes in accounting rules; among other things, and if the Company is unable to raise additional capital to offset theses charges, capital ratios may fall below regulatory capital adequacy levels.
See the section entitled “Capital Resources” contained in Item 1, “Business”, for additional information regarding regulatory capital requirement for the Company and the Bank.
The Company is Subject to Extensive Government Regulation and Supervision
The Company is subject to extensive federal and state regulation and supervision. Banking regulations are primarily intended to protect depositors’ funds, federal deposit insurance funds and the banking system as a whole, not the interests of shareholders. These regulations affect the Company’s lending practices, capital structure, investment practices, dividend policy and growth, among other things. Federal and state statutes and related regulations, including tax policy and corporate governance rules, can significantly affect the way in which bank holding companies, and public companies in general, conduct business. Changes to federal or state statutes, regulations or regulatory and tax policies, including changes in interpretation or implementation of existing statutes, regulations or policies, or new laws or regulation aimed at addressing the perceived causes of the recent financial crisis could affect the Company in substantial and unpredictable ways, including subjecting the Company to additional operating, governance and compliance costs, increasing the Company’s deposit insurance premiums, limiting the types of financial services and products the Company may offer and/or increasing competition from other non-bank providers of financial services.
See the section entitled “Supervision and Regulation” contained in Item 1, “Business”, for additional information regarding the supervisory and regulatory issues facing the Company.
The Company Operates in a Competitive Industry and Market Area
The Company faces substantial competition in all areas of its operations from a variety of different competitors, several of which are larger and have more financial resources than the Company. Competitors within the Company’s market area include not only national, regional, and other community banks, but also various types of other non-bank financial institutions, including credit unions, consumer finance companies, mortgage brokers, private lenders, insurance companies, securities brokerage firms, institutional mutual funds, registered investment advisors, internet based banks and other financial intermediaries.
See the section entitled “Competition” contained in Item 1, “Business”, for additional information regarding the competitive issues facing the Company.
Failure to Keep Pace With Technological Change Could Affect the Company’s Profitability
The banking industry is continually undergoing rapid technological change with frequent introductions of new technology-driven products and services. The effective use of technology increases efficiency and enables financial institutions to better serve customers and to reduce costs. Many of the Company’s competitors have substantially greater resources to invest in technological improvements. Failure to successfully keep pace with technological change affecting the banking industry could have a material adverse effect on the Company’s business and, in turn, the Company’s financial condition and results of operations.
The Company’s Information Systems Could Experience an Interruption or Breach in Security
The Company relies heavily on communications and information systems to conduct its business. The occurrence of any failures, interruptions or security breaches of the Company’s information systems could disrupt the Company’s ability to conduct business and process transactions, result in a loss of customer business, expose customers’ personal information to unauthorized parties, damage the Company’s reputation, subject the Company to additional regulatory scrutiny, and expose the Company to civil litigation and possible financial liability, any of which could have a material adverse effect on the Company’s financial condition and results of operations.
See the discussion under the heading “Opportunities and Risks” included in the section entitled “Overview”, which is contained in Item 7, “Management’s Discussion and Analysis of Financial Condition and Results of Operations”, for further information regarding the Company’s information security and technology practices.
Interruption of Service or Breach in Security at Independent Service Providers Could Adversely Affect the Company’s Business
The Company relies on independent firms to provide key services necessary to conducting its business. These services include, but are not limited to: electronic funds delivery networks; check clearing houses; electronic banking services; investment advisory, management and custodial services; correspondent banking services; information security assessments; and loan underwriting and review services. The occurrence of any failures, interruptions or security breaches of the independent firms’ systems or in their delivery of services, could result in a loss of customer business, expose customers’ personal information to unauthorized parties, damage the Company’s reputation and expose the Company to civil litigation and possible financial liability, any of which could have a material adverse effect on the Company’s financial condition and results of operations.
The Company’s Controls and Procedures Could Fail or Be Circumvented
Management regularly reviews and updates the Company’s internal controls over financial reporting, disclosure controls and procedures, corporate governance policies and procedures and security controls to prevent and detect theft and fraud. Any system of controls, however well designed and operated, is based in part on certain assumptions and can provide only reasonable, not absolute, assurances that the objectives of the system are met. Any failure or circumvention of the Company’s controls and procedures or failure to comply with regulations related to controls and procedures could result regulatory actions against the Company, financial loss, damage the Company’s reputation, cause a loss of customer business, and expose the Company to civil litigation and possible financial liability, any of which could have a material adverse effect on the Company’s business, results of operations and financial condition.
The Company’s May Experience a Prolonged Interruption in Ability to Conduct Business
The Company relies heavily on its personnel, facilities and information systems to conduct its business. A material loss of people, core operating facilities or access to information systems could result in an interruption in customer services and ability to conduct transactions, loss of customer business and damage the reputation of the Company, any of which may have a material adverse effect on the Company’s financial condition and results of operations.
See the discussion under the heading “Opportunities and Risks” included in the section entitled “Overview”, which is contained in Item 7, “Management’s Discussion and Analysis of Financial Condition and Results of Operations”, for further information regarding the Company’s Business Continuity Plan.
The Company May Not be Able to Attract and Retain Key Personnel
The Company’s success depends, in large part, on its ability to attract and retain key personnel. Competition for the best people in most activities engaged in by the Company can be intense and the Company may not be able to hire or retain the key personnel that it depends upon for success. The unexpected loss of key personnel could have a material adverse impact on the Company’s business because of their skills, knowledge of the Company’s market, years of industry experience and the difficulty of promptly finding qualified replacement personnel.
Slower than Expected Growth in New Branches Could Adversely Affect the Company’s Profitability
The Company has placed a strategic emphasis on expanding the Bank’s branch network. Executing this strategy carries risks of slower than anticipated growth in new branches or new geographic market areas. New branches and new products and services require a significant investment of both financial and personnel resources. Lower than expected loan and deposit growth in new branches and/or lower than expected fee or other income generated from new branches could decrease anticipated revenues and net income generated by such investments. In addition, new branches require the approval of various regulatory agencies, which may or may not approve the Company’s application for a branch. Opening new branches in existing markets or new market areas could also divert resources from current core operations and thereby further adversely affect the Company’s growth and profitability.
Growth Strategies Involving Acquisitions Could Adversely Affect the Company’s Profitability
The Company may in the future explore growth opportunities through acquisition of other banks, financial services companies or lines of business. Any future acquisition could adversely affect the Company’s profitability based on management’s ability to successfully complete the acquisition and integration of the acquired business.
The Trading Volume in the Company’s Common Stock is Less Than That of Larger Companies
Although the Company’s common stock is listed for trading on the NASDAQ Global Market, the trading volume in the Company’s common stock is substantially less than that of larger companies. Given the lower trading volume of the Company’s common stock, significant purchases or sales of the Company’s common stock, or the expectation of such purchases or sales, could cause significant swings up or down in the Company’s stock price.
The Market Price of the Company’s Common Stock Could be Affected by General Industry Issues
The banking industry may be more affected than other industries by certain economic, credit, regulatory or information security issues. Although the Company itself may or may not be directly impacted by such issues, the Company’s stock price may swing up or down due to the influence, both real and perceived, of these issues, among others, on the banking industry in general.
The Carrying Value of the Company’s Goodwill Could Become Impaired
In accordance with generally accepted accounting principles, the Company does not amortize goodwill and instead, at least annually, evaluates whether the carrying value of goodwill has become impaired. Impairment of the goodwill may occur when the estimated fair value of the Company is less than its recorded book value (i.e., the net book value of its recorded assets and liabilities). A determination that goodwill has become impaired results in an immediate write-down of goodwill to its determined value with a resulting charge to operations. If the estimated fair value of the Company declines due to changes in the assumptions and input used in management’s estimate of the fair value, the carrying value of the Company’s goodwill may become impaired. Any write down of goodwill will result in a decrease in net income and, depending upon the magnitude of the charge, could have a material adverse effect on the Company’s financial condition and results of operations.
See the discussions contained in Item 7, “Management’s Discussion and Analysis of Financial Condition and Results of Operations”, under the heading “Impairment Review of Goodwill and Other Intangible Assets”, which is contained in the “Critical Accounting Estimates” section, for further information regarding the process by which the Company determines whether an impairment of goodwill has occurred.
Shareholder Dilution Could Occur if Additional Stock is Issued in the Future
If the Company’s Board of Directors should determine in the future that there is a need to obtain additional capital through the issuance of additional shares of the Company’s common stock or securities convertible into shares of common stock, such issuances could result in dilution to existing shareholders’ ownership interest. Similarly, if the Board of Directors decides to grant additional restricted stock shares or options for the purchase of shares of common stock, the issuance of such additional restricted stock shares and/or the issuance of additional shares upon the exercise of such options may expose shareholders to dilution.
The Company’s Articles Of Organization, By-Laws and Shareholders Rights Plan as Well as Certain Banking and Corporate Laws Could Have an Anti-Takeover Effect
Provisions of the Company’s articles of organization and by-laws, its shareholders rights plan and certain federal and state banking laws and state corporate laws, including regulatory approval requirements for any acquisition of control of the Company, could make it more difficult for a third party to acquire the Company, even if doing so would be perceived to be beneficial to the Company’s shareholders. The combination of these provisions effectively inhibits a non-negotiated merger or other business combination involving an acquisition of the Company, which, in turn, could adversely affect the market price of the Company’s common stock.
Directors and Executive Officers Own a Significant Portion of Common Stock
The Company’s directors and executive officers as a group beneficially own approximately 29% of the Company’s outstanding common stock as of December 31, 2009. As a result of this combined ownership interest, the directors and executive officers have the ability, if they vote their shares in a like manner, to significantly influence the outcome of all matters submitted to shareholders for approval, including the election of directors.
The Company Relies on Dividends from the Bank for Substantially All of its Revenue
The Company is a separate and distinct legal entity from the Bank. It receives substantially all of its revenue from dividends paid by the Bank. These dividends are the principal source of funds used to pay dividends on the Company’s common stock and interest and principal on the Company’s subordinated debt. Various federal and state laws and regulations limit the amount of dividends that the Bank may pay to the Company. If the Bank is unable to pay dividends to the Company, then the Company will be unable to service debt, pay obligations or pay dividends on the Company’s common stock. The Bank’s inability to pay dividends could have a material adverse effect on the Company’s business, financial condition and results of operations.
See the discussion under the heading “Dividends” which is contained in Item 5, “Market for Registrant’s Common Equity, Related Stockholder Matters and Issuer Purchases of Equity Securities” below.
Additional Factors Described Elsewhere in This Report
In addition to the factors listed above in this section, additional important factors that could adversely affect the results of the Company’s future operations are described below under the heading “Special Note Regarding Forward-Looking Statements” contained in Item 7, “Management’s Discussion and Analysis of Financial Condition and Results of Operations.”
Item 1B. Unresolved Staff Comments
None.
The Company conducts its business from its main office and operational support and lending offices in Lowell, Massachusetts. The Company currently has seventeen full service branch banking offices serving the Merrimack Valley and North Central regions of Massachusetts and South Central New Hampshire. The Company is obligated under various non-cancelable operating leases, most of which provide for periodic adjustments. Several leases provide the Company the right of first refusal should the property be offered for sale. The Company believes that all its facilities are well maintained and suitable for the purpose for which they are used.
The following table sets forth general information related to facilities owned or used by the Company as of December 31, 2009. All locations are in Massachusetts unless otherwise noted.
|
|
|
OWNED OR |
|
BRANCH LOCATION |
|
LEASED |
|
Acton |
|
|
|
340 Great Road |
|
Leased |
|
Andover |
|
|
|
8 High Street |
|
Leased |
|
Billerica |
|
|
|
674 Boston Road |
|
Owned |
|
Chelmsford |
|
|
|
20 Drum Hill Road |
|
Owned |
|
185 Littleton Road |
|
Owned |
|
Derry, NH |
|
|
|
60 Crystal Avenue(1) (temporary location) |
|
Leased |
|
Dracut |
|
|
|
1168 Lakeview Avenue |
|
Leased |
|
Fitchburg |
|
|
|
420 John Fitch Highway |
|
Leased |
|
Leominster |
|
|
|
4 Central Street (2) |
|
Leased |
|
Lowell |
|
|
|
430 Gorham Street |
|
Leased |
|
222 Merrimack Street (Main Office) |
|
Leased |
|
Methuen |
|
|
|
255 Broadway Street |
|
Owned |
|
North Billerica |
|
|
|
223 Boston Road |
|
Owned |
|
Salem, NH |
|
|
|
130 Main Street |
|
Leased |
|
Tewksbury |
|
|
|
910 Andover Street |
|
Leased |
|
1120 Main Street |
|
Leased |
|
Westford |
|
|
|
237 Littleton Road |
|
Owned |
|
OPERATION/LENDING OFFICES |
|
|
|
Lowell |
|
|
|
170 Merrimack/19 Palmer Street |
|
Owned |
|
FUTURE BRANCH LOCATION |
|
|
|
Derry, NH |
|
|
|
47 Crystal Avenue(1) (future permanent location) |
|
Leased |
(1) The Company anticipates relocating the temporary Derry, NH office to a permanent location, across the street from the existing temporary location, which is currently under construction, by late spring of 2010.
(2) The Company has the option to purchase this facility at any time during any extended term at the price of $550 thousand as adjusted for increases in the producer’s price index. The Company’s last five-year extended-term option ends in September 2020.
See note 4, “Premises and Equipment” and note 12, “Related Party Transactions” to the consolidated financial statements in Item 8 below, for further information regarding the Company’s lease obligations listed above.
The Company is involved in various legal proceedings incidental to its business. Management does not believe resolution of any present litigation will have a material adverse effect on the financial condition of the Company.
Item 5. Market for Registrant’s Common Equity, Related Stockholder Matters and Issuer Purchases of Equity Securities
Market for Common Stock
The Company’s shares trade on the NASDAQ Global Market under the trading symbol “EBTC”.
The following table sets forth sales volume and price information, to the best of management’s knowledge, for the common stock of the Company for the periods indicated.
|
Fiscal Year |
|
Trading |
|
Share Price |
|
Share Price |
|
||
|
2009: |
|
|
|
|
|
|
|
||
|
4th Quarter |
|
618,965 |
|
$ |
13.26 |
|
$ |
9.95 |
|
|
3rd Quarter |
|
534,960 |
|
14.93 |
|
10.98 |
|
||
|
2nd Quarter |
|
901,155 |
|
14.64 |
|
8.55 |
|
||
|
1st Quarter |
|
534,910 |
|
11.30 |
|
8.48 |
|
||
|
|
|
|
|
|
|
|
|
||
|
2008: |
|
|
|
|
|
|
|
||
|
4th Quarter |
|
215,940 |
|
$ |
12.88 |
|
$ |
9.50 |
|
|
3rd Quarter |
|
138,779 |
|
13.25 |
|
10.50 |
|
||
|
2nd Quarter |
|
47,629 |
|
14.00 |
|
11.42 |
|
||
|
1st Quarter |
|
141,956 |
|
14.05 |
|
12.45 |
|
||
As of March 8, 2010, there were 850 registered shareholders of the Company’s common stock and 9,132,063 shares of the Company’s common stock outstanding.
Dividends
In 2009, quarterly dividends of $0.095 per share were paid in March, June, September and December. Total 2009 dividends of $0.38 per share represented an increase of 5.6% compared to total dividends of $0.36 also paid on a quarterly basis in 2008.
The Company maintains a dividend reinvestment plan (the “DRP”). The DRP enables stockholders, at their discretion, to elect to reinvest dividends paid on their shares of the Company’s common stock by purchasing additional shares of common stock from the Company at a purchase price equal to fair market value. Shareholders utilized the DRP to reinvest $1.1 million, of the $3.1 million dividends paid by the Company in 2009, into 96,116 shares of the Company’s common stock.
On January 19, 2010, the Company announced a quarterly dividend of $0.10 per share, paid on March 1, 2010 to shareholders of record as of February 8, 2010. On an annualized basis, this quarterly dividend represents a 5.3% increase over the 2009 dividend rate.
As the principal asset of the Company, the Bank currently provides the only source of cash for the payment of dividends by the Company. Under Massachusetts law, trust companies such as the Bank may pay dividends only out of “net profits” and only to the extent that such payments will not impair the Bank’s capital stock. Any dividend payment that would
exceed the total of the Bank’s net profits for the current year plus its retained net profits of the preceding two years would require the Commissioner’s approval. FDICIA also prohibits a bank from paying any dividends on its capital stock if the bank is in default on the payment of any assessment to the FDIC or if the payment of dividends would otherwise cause the bank to become undercapitalized. These restrictions on the ability of the Bank to pay dividends to the Company may restrict the ability of the Company to pay dividends to the holders of its common stock.
The statutory term “net profits” essentially equates with the accounting term “net income” and is defined under the Massachusetts banking statutes to mean the remainder of all earnings from current operations plus actual recoveries on loans and investments and other assets after deducting from such total all current operating expenses, actual losses, accrued dividends on any preferred stock and all federal and state taxes.
Securities Authorized for Issuance under Equity Compensation Plans
The following table provides information as of December 31, 2009 with respect to the Company’s Amended and Restated 1998 Stock Incentive Plan (the “1998 Plan”), 2003 Stock Incentive Plan, as amended, and 2009 Stock Incentive Plan which together constitute all of the Company’s existing equity compensation plans that have been previously approved by the Company’s stockholders. The 1998 Plan is closed to future grants, although several awards previously granted under this plan remain outstanding and may be exercised in the future. The Company does not have any existing equity compensation plans, including any existing individual equity compensation arrangements, which have not been previously approved by the Company’s stockholders.
|
Plan Category |
|
Number of Securities |
|
Weighted-average |
|
Number of Securities |
|
|
|
Equity compensation plans approved by security holders |
|
687,705 |
|
$ |
14.31 |
|
455,305 |
|
|
|
|
|
|
|
|
|
|
|
|
Equity compensation plans not approved by security holders |
|
— |
|
— |
|
— |
|
|
|
TOTAL |
|
687,705 |
|
$ |
14.31 |
|
455,305 |
|
Performance Graph
The following graph compares the cumulative total return (which assumes the reinvestment of all dividends) on the Company’s common stock with the cumulative total return reflected by a broad based equity market index and an appropriate published industry index. This graph shows the changes over the five-year period ended on December 31, 2009 in the value of $100 invested in (i) the Company’s common stock, (ii) the Standard & Poors 500 Index, (iii) the NASDAQ Bank Index, and (iv) the SNL Bank $1B to $5B index. Effective this year, the Company is adopting the SNL Bank $1 billion to $5 billion index as a replacement for the NASDAQ Bank Index. The Company believes the SNL Bank $1 billion to $5 billion index provides a more appropriate comparison for assessing its relative performance. The NASDAQ Bank Index includes solely financial institutions listed on the NASDAQ stock market of all asset sizes, which diminishes its appropriateness as a comparison index. Comparatively, the SNL Bank $1 billion to $5 billion index includes all major exchange (NYSE, NYSE Amex & NASDAQ) banks with $1 billion to $5 billion in assets which is more comparable to the Company.
Prior to February 14, 2005 (when the Company’s shares began trading on the NASDAQ National Market, now NASDAQ Global Market), there was no active trading market for the Company’s common stock, although shares were traded periodically on a privately negotiated basis. For purposes of the graph, the value of the stock at December 31, 2004 is based upon the annual valuation analysis of the Company’s common stock that was formerly undertaken in the years prior to the Company’s listing on the NASDAQ National Market pursuant to the Company’s administration of its dividend reinvestment plan.
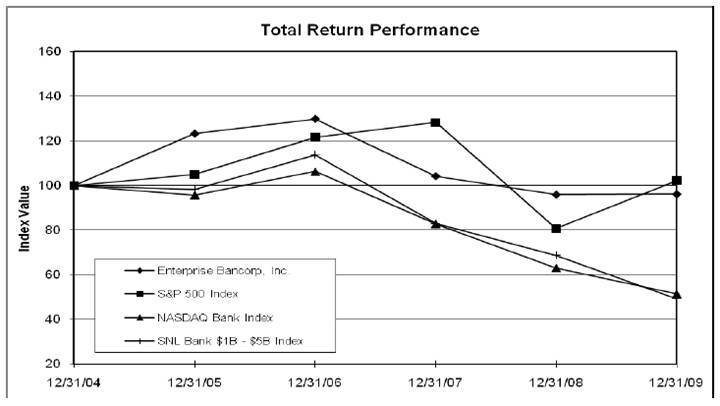
|
|
|
Period Ending |
|
||||||||||
|
Index |
|
12/31/04 |
|
12/31/05 |
|
12/31/06 |
|
12/31/07 |
|
12/31/08 |
|
12/31/09 |
|
|
Enterprise Bancorp, Inc. |
|
100.00 |
|
123.26 |
|
129.83 |
|
104.18 |
|
95.88 |
|
96.08 |
|
|
S&P 500 Index |
|
100.00 |
|
104.91 |
|
121.48 |
|
128.16 |
|
80.74 |
|
102.11 |
|
|
NASDAQ Bank Index |
|
100.00 |
|
95.67 |
|
106.20 |
|
82.76 |
|
62.96 |
|
51.31 |
|
|
SNL Bank $1B - $5B Index |
|
100.00 |
|
98.29 |
|
113.74 |
|
82.85 |
|
68.72 |
|
49.26 |
|
Sales of Unregistered Securities and Repurchases of Shares
The Company has not sold any equity securities that were not registered under the Securities Act of 1933, as amended, during the year ended December 31, 2009. Neither the Company nor any “affiliated purchaser” (as defined in the SEC’s Rule 10b-18(a)(3)) has repurchased any of the Company’s outstanding shares, nor caused any such shares to be repurchased on its behalf, during the fiscal quarter ended December 31, 2009.
Item 6. Selected Financial Data
|
|
|
Year Ended December 31, |
|
|||||||||||||
|
(Dollars in thousands, except per share data) |
|
2009 |
|
2008 |
|
2007 |
|
2006 |
|
2005 |
|
|||||
|
EARNINGS DATA |
|
|
|
|
|
|
|
|
|
|
|
|||||
|
Net interest income |
|
$ |
48,446 |
|
$ |
42,195 |
|
$ |
40,679 |
|
$ |
41,560 |
|
$ |
38,102 |
|
|
Provision for loan losses |
|
4,846 |
|
2,505 |
|
1,000 |
|
1,259 |
|
1,135 |
|
|||||
|
Net interest income after provision for loan losses |
|
43,600 |
|
39,690 |
|
39,679 |
|
40,301 |
|
36,967 |
|
|||||
|
Non-interest income |
|
9,582 |
|
9,488 |
|
8,453 |
|
7,020 |
|
6,244 |
|
|||||
|
Other than temporary impairment on investment securities |
|
(797 |
) |
(3,702 |
) |
— |
|
— |
|
— |
|
|||||
|
Net gains (losses) on sales of investment securities |
|
1,487 |
|
305 |
|
1,655 |
|
(204 |
) |
191 |
|
|||||
|
Non-interest expense |
|
42,708 |
|
37,884 |
|
34,844 |
|
32,540 |
|
30,235 |
|
|||||
|
Income before income taxes |
|
11,164 |
|
7,897 |
|
14,943 |
|
14,577 |
|
13,167 |
|
|||||
|
Provision for income taxes |
|
3,218 |
|
2,349 |
|
5,045 |
|
5,343 |
|
4,753 |
|
|||||
|
Net income |
|
$ |
7,946 |
|
$ |
5,548 |
|
$ |
9,898 |
|
$ |
9,234 |
|
$ |
8,414 |
|
|
|
|
|
|
|
|
|
|
|
|
|
|
|||||
|
COMMON SHARE DATA |
|
|
|
|
|
|
|
|
|
|
|
|||||
|
Basic earnings per share |
|
$ |
0.96 |
|
$ |
0.70 |
|
$ |
1.27 |
|
$ |
1.21 |
|
$ |
1.13 |
|
|
Diluted earnings per share |
|
0.96 |
|
0.69 |
|
1.25 |
|
1.18 |
|
1.09 |
|
|||||
|
Book value per share at year end |
|
11.84 |
|
11.35 |
|
11.00 |
|
9.98 |
|
8.93 |
|
|||||
|
Dividends paid per share |
|
$ |
0.38 |
|
$ |
0.36 |
|
$ |
0.32 |
|
$ |
0.28 |
|
$ |
0.24 |
|
|
Basic weighted average shares outstanding |
|
8,268,502 |
|
7,973,527 |
|
7,819,160 |
|
7,661,178 |
|
7,468,498 |
|
|||||
|
Diluted weighted average shares outstanding |
|
8,279,126 |
|
8,005,535 |
|
7,913,006 |
|
7,821,297 |
|
7,690,526 |
|
|||||
|
|
|
|
|
|
|
|
|
|
|
|
|
|||||
|
YEAR END BALANCE SHEET AND OTHER DATA |
|
|
|
|
|
|
|
|
|
|
|
|||||
|
Total assets |
|
$ |
1,304,001 |
|
$ |
1,180,477 |
|
$ |
1,057,666 |
|
$ |
979,259 |
|
$ |
918,477 |
|
|
Loans serviced for others |
|
53,659 |
|
28,341 |
|
20,826 |
|
21,659 |
|
22,938 |
|
|||||
|
Investment assets under management |
|
433,043 |
|
439,711 |
|
573,608 |
|
502,059 |
|
424,953 |
|
|||||
|
Total assets under management |
|
$ |
1,790,703 |
|
$ |
1,648,529 |
|
$ |
1,652,100 |
|
$ |
1,502,977 |
|
$ |
1,366,368 |
|
|
|
|
|
|
|
|
|
|
|
|
|
|
|||||
|
Total loans |
|
$ |
1,082,830 |
|
$ |
948,641 |
|
$ |
833,819 |
|
$ |
761,113 |
|
$ |
699,726 |
|
|
Allowance for loan losses |
|
18,218 |
|
15,269 |
|
13,545 |
|
12,940 |
|
12,050 |
|
|||||
|
Investment securities |
|
139,109 |
|
159,373 |
|
145,517 |
|
131,540 |
|
156,521 |
|
|||||
|
Total short-term investments |
|
6,759 |
|
3,797 |
|
7,788 |
|
15,304 |
|
5,431 |
|
|||||
|
Deposits |
|
1,144,948 |
|
947,903 |
|
868,786 |
|
867,522 |
|
775,387 |
|
|||||
|
Borrowed funds |
|
24,876 |
|
121,250 |
|
81,429 |
|
15,105 |
|
58,639 |
|
|||||
|
Junior subordinated debentures |
|
10,825 |
|
10,825 |
|
10,825 |
|
10,825 |
|
10,825 |
|
|||||
|
Total stockholders’ equity |
|
107,664 |
|
91,104 |
|
87,012 |
|
77,043 |
|
67,830 |
|
|||||
|
|
|
|
|
|
|
|
|
|
|
|
|
|||||
|
RATIOS |
|
|
|
|
|
|
|
|
|
|
|
|||||
|
Return on average total assets |
|
0.64 |
% |
0.51 |
% |
0.99 |
% |
0.98 |
% |
0.97 |
% |
|||||
|
Return on average stockholders’ equity |
|
8.31 |
% |
6.26 |
% |
12.11 |
% |
12.89 |
% |
13.10 |
% |
|||||
|
Allowance for loan losses to total loans |
|
1.68 |
% |
1.61 |
% |
1.62 |
% |
1.70 |
% |
1.72 |
% |
|||||
|
Stockholders’ equity to total assets |
|
8.26 |
% |
7.72 |
% |
8.23 |
% |
7.87 |
% |
7.39 |
% |
|||||
|
Dividend payout ratio |
|
39.58 |
% |
51.43 |
% |
25.20 |
% |
23.14 |
% |
21.24 |
% |
|||||
On June 30, 2006, the Company issued 3,842,015 shares in a two-for-one stock split paid in the form of a stock dividend. All share and per share amounts have been retroactively adjusted to reflect the stock dividend for all periods presented.
Item 7. Management’s Discussion and Analysis of Financial Condition and Results of Operations
Management’s discussion and analysis should be read in conjunction with the Company’s consolidated financial statements and notes thereto, contained in Item 8, the information contained in the description of the Company’s business in Item 1 and other financial and statistical information contained in this annual report.
Special Note Regarding Forward-Looking Statements
This report contains certain “forward-looking statements” within the meaning of the Private Securities Litigation Reform Act of 1995, including statements concerning plans, objectives, future events or performance and assumptions and other statements that are other than statements of historical fact. Forward-looking statements may be identified by reference to a future period or periods or by use of forward-looking terminology such as “anticipates”, “believes”, “expects”, “intends”, “may”, “plans”, “pursue”, “views” and similar terms or expressions. Various statements contained in Item 1 — “Business”, Item 7 — “Management’s Discussion and Analysis of Financial Condition and Results of Operations” and Item 7A — “Quantitative and Qualitative Disclosures About Market Risk,” including, but not limited to, statements related to management’s views on the banking environment and the economy, competition and market expansion opportunities, the interest rate environment, credit risk and the level of future non-performing assets and charge-offs, potential asset and deposit growth, future non-interest expenditures and non-interest income growth, and borrowing capacity are forward-looking statements. The Company wishes to caution readers that such forward-looking statements reflect numerous assumptions and involve a number of risks and uncertainties that may adversely affect the Company’s future results. The following important factors, among others, could cause the Company’s results for subsequent periods to differ materially from those expressed in any forward-looking statement made herein: (i) changes in interest rates could negatively impact net interest income; (ii) changes in the business cycle and downturns in the local, regional or national economies, including deterioration in the local real estate market, could negatively impact credit and/or asset quality and result in credit losses and increases in the Company’s reserve for loan losses; (iii) changes in consumer spending could negatively impact the Company’s credit quality and financial results; (iv) increasing competition from larger regional and out-of-state banking organizations as well as non-bank providers of various financial services could adversely affect the Company’s competitive position within its market area and reduce demand for the Company’s products and services; (v) deterioration of securities markets could adversely affect the value or credit quality of the Company’s assets and the availability of funding sources necessary to meet the Company’s liquidity needs; (vi) changes in technology could adversely impact the Company’s operations and increase technology-related expenditures; (vii) increases in employee compensation and benefit expenses could adversely affect the Company’s financial results; (viii) changes in laws and regulations that apply to the Company’s business and operations could increase the Company’s regulatory compliance costs and adversely affect the Company’s business environment, operations and financial results; (ix) changes in accounting standards, policies and practices, as may be adopted or established by the regulatory agencies, the Financial Accounting Standards Board or the Public Company Accounting Oversight Board could negatively impact the Company’s financial results; and (x) some or all of the risks and uncertainties described above in Item 1A could be realized, which could have a material adverse effect on the Company’s business, financial condition and results of operation. Therefore, the Company cautions readers not to place undue reliance on any such forward-looking information and statements.
Critical Accounting Estimates
The Company’s significant accounting policies are described in note 1, “Summary of Significant Accounting Policies”, to the consolidated financial statements contained in Item 8. In applying these accounting policies, management is required to exercise judgment in determining many of the methodologies, assumptions and estimates to be utilized. Certain of the critical accounting estimates are more dependent on such judgment and in some cases may contribute to volatility in the Company’s reported financial performance should the assumptions and estimates used change over time due to
changes in circumstances. The three most significant areas in which management applies critical assumptions and estimates include the areas described further below.
Allowance for Loan Losses
The allowance for loan losses is an estimate of credit risk inherent in the loan portfolio as of the specified balance sheet dates. The allowance for loan losses is established through a provision for loan losses, a direct charge to earnings. Loan losses are charged against the allowance when management believes that the collectability of the loan principal is unlikely. Recoveries on loans previously charged off are credited to the allowance. The Company maintains the allowance at a level that it deems adequate to absorb all reasonably anticipated losses from specifically known and other credit risks associated with the portfolio. Arriving at an appropriate level of allowance for loan losses involves a high degree of management judgment.
The Company uses a systematic methodology to measure the amount of estimated loan loss exposure inherent in the portfolio for purposes of establishing a sufficient allowance for loan losses. The methodology makes use of specific reserves for loans individually evaluated and deemed impaired and general reserves for larger groups of homogeneous loans which rely on a combination of qualitative and quantitative factors that could have an impact on the credit quality of the portfolio.
Management believes that the allowance for loan losses is adequate to absorb probable losses from specifically known and other credit risks associated with the loan portfolio as of the balance sheet dates reflected in this annual report. While management uses available information to recognize losses on loans, future additions to the allowance may be necessary. In addition, various regulatory agencies, as an integral part of their examination process, periodically review the Company’s allowance for loan losses. Such agencies may require the Company to recognize additions to the allowance based on judgments different from those of management.
Management’s assessment of the adequacy of the allowance for loan losses is contained under the headings “Credit Risk/Asset Quality” and “Allowance for Loan Losses”, which are contained in the “Financial Condition” section of this Item 7.
Impairment Review of Investment Securities
There are inherent risks associated with the Company’s investment activities which could adversely impact the fair market value and the ultimate collectability of the Company’s investments. The determination of other-than-temporary impairment involves a high degree of judgment and requires management to make significant estimates of current market risks and future trends. Management’s assessment includes: evaluating the level and duration of the loss on individual securities; evaluating the credit quality of fixed income issuers; determining if any individual security or mutual or other fund exhibits fundamental deterioration; and estimating whether it is unlikely that the individual security or fund will completely recover its unrealized loss within a reasonable period of time, or in the case of fixed income securities prior to maturity. While management uses available information to measure other-than-temporary impairment at the balance sheet date, future write-downs may be necessary based on extended duration of current unrealized losses, changing market conditions, or circumstances surrounding individual issuers and funds.
Should an investment be deemed “other than temporarily impaired”, the Company is required to write-down the carrying value of the investment. Such write-down(s) may have a material adverse effect on the Company’s financial condition and results of operations. Other than temporary impairment on equity securities are recognized through a charge to earnings. Other than temporary impairment on fixed income securities are assessed in order to determine the impairment attributed to underlying credit quality of the issuer and the portion of noncredit impairment. When there are credit losses on a fixed income security that management does not intend to sell and it is more likely than not that the Company will not be required to sell prior to a marketplace recovery or maturity, the portion of the total impairment that is attributable to the credit loss would be recognized in earnings, and the remaining difference between the security’s amortized cost basis and its fair value would be included in other comprehensive income. Once written-down a security may not be written-up in excess of its new cost basis to reflect future increases in fair value.
Based on ongoing impairment reviews of the investment portfolio, management recorded OTTI charges to earnings on certain equity securities amounting to $797 thousand and $3.7 million in 2009 and 2008, respectively. Management determined that the remaining unrealized losses in the Company’s investment portfolio (consisting of unrealized losses of $421 thousand on the fixed income portfolio) were not other than temporary in nature at December 31, 2009. The Company’s equity portfolio, which incurred the OTTI charges in 2009 and 2008, had unrealized appreciation of $1.5 million at December 31, 2009.
Management’s assessment of impairment of the unrealized losses in the investment portfolio is contained under the heading “Investment Securities”, which is contained in the “Financial Condition” section of this Item 7.
Impairment Review of Goodwill and Core Deposit Intangible Assets
In accordance with generally accepted accounting principles, the Company does not amortize goodwill and instead, at least annually, evaluates whether the carrying value of goodwill has become impaired. Impairment of the goodwill may occur when the estimated fair value of the Company is less than its recorded book value. A determination that goodwill has become impaired results in an immediate write-down of goodwill to its determined value with a resulting charge to operations.
The annual impairment test is a two-step process used to identify potential goodwill impairment and measure the amount of goodwill impairment loss to be recognized, if any. The assessment is performed at the operating unit level. In the case of the Company, the services offered through the Bank and subsidiaries are managed as one strategic unit and represent the Company’s only reportable operating segment. The first step of the goodwill impairment test, used to identify potential impairment, compares the estimated fair value of the reporting unit with its carrying amount, or the book value of the reporting unit, including goodwill. If the estimated fair value of the reporting unit equals or exceeds its book value, goodwill is considered not impaired, and the second step of the impairment test is unnecessary. Management’s assessment of the fair value of the Company takes into consideration the Company’s market capitalization, stock trading volume, price-multiples valuations of comparable companies and control premiums in transactions involving comparable companies. The value of a control premium to use in the marketplace will depend on a number of factors including the target bank stock’s liquidity, where the stock is currently trading, the perceived attractiveness of the entity and economic conditions. Management evaluates each of these factors as they relate to the Company and subjectively determines a comparable assumed control premium.
The second step, if necessary, measures the amount of goodwill impairment loss to be recognized. The reporting unit must determine fair values for all assets and liabilities, excluding goodwill. The net of the assigned fair value of assets and liabilities is then compared to the book value of the reporting unit, and any excess book value becomes the implied fair value of goodwill. If the carrying amount of the goodwill exceeds the newly calculated implied fair value of that goodwill, an impairment loss is recognized in the amount required to write down the goodwill to the implied fair value.
The Company’s consolidated financial statements also include core deposit intangible assets, which are amortized to expense over their estimated useful life of ten years and reviewed for impairment on an ongoing basis or whenever events or changes in business circumstances warrant a review of the carrying value. If impairment is determined to exist, the related write-down of the intangible asset’s carrying value is charged to operations.
Based on these impairment reviews management determined that the Company’s goodwill and core deposit intangible assets were not impaired at December 31, 2009.
Overview
Management believes that the current banking environment provides community banks like Enterprise Bank strong market and growth opportunity, as customers migrate from larger, national banks to local community banks, choosing to do business with local banking professionals.
Loans outstanding increased $134.2 million, or 14%, since December 31, 2008 and totaled $1.08 billion at December 31, 2009. Deposits, excluding brokered deposits, increased $244.5 million, or 28%, since December 31, 2008 and totaled $1.12 billion at December 31, 2009. Net income was $7.9 million for the year ended December 31, 2009, an increase of 43% compared to the prior year.
Composition of Earnings
Net income amounted to $7.9 million, or $0.96 on a diluted earnings per share basis, for the year ended December 31, 2009, compared to $5.5 million, or $0.69, respectively, for the year ended December 31, 2008. The 43% increase in net income for the year ended December 31, 2009, when compared to 2008, was due primarily to an increase in net interest income and non-interest income, partially offset by increases in FDIC insurance premiums and other non-interest expenses, as well as an increase in the provision for loan losses.
Enterprise’s earnings are largely dependent on its net interest income, which is the difference between interest earned on loans and investments and the cost of funding (primarily deposits and borrowings). Tax equivalent net interest income expressed as a percentage of average interest earning assets is referred to as net interest margin (“margin”).
For the year ended December 31, 2009, net interest income amounted to $48.4 million, compared to $42.2 million for 2008, an increase of $6.3 million, or 15%. Net interest income for the quarter ended December 31, 2009 amounted to $13.1 million, compared to $11.2 million in the December 2008 quarter, an increase of $1.9 million, or 17%. The increases in net interest income over the comparable prior-year periods were due primarily to strong loan growth. Average loan balances for the year-over-year and quarter-over-quarter periods increased $135.9 million and $142.5 million, respectively, compared to the same periods in 2008.
Net interest margin was 4.28% for the year ended December 31, 2009, compared to 4.23% for the year ended December 31, 2008. Quarterly net interest margin was 4.42% for the three months ended December 31, 2009, compared to 4.32% the quarter ended September 30, 2009, 4.19% for the quarter ended June 30, 2009 and 4.24% for the December 31, 2008 quarter. Due to the lower market interest rates compared to 2008, earning assets and funding sources continued to reprice downward during 2009, reducing both the yield on earning assets and the Company’s cost of funding. However, during the second half of 2009 the pace of asset repricing (primarily loans) slowed, while funding costs continued to decline at a faster rate due to an easing of competitive deposit rate pressure, contributing to the increase in margin in the third and fourth quarters.
The provision for loan losses for the year ended December 31, 2009 amounted to $4.8 million compared to $2.5 million in 2008. The increase over the prior year was due to increases in net charge-offs and the level of non-performing loans, as well as loan growth. For the year ended December 31, 2009, the Company recorded net charge-offs of $1.9 million, compared to net charge-offs of $781 thousand for the year ended December 31, 2008. Net charge-offs for the year amounted to 0.19% of average total loans, while the ratio of non-performing assets to total assets was 1.66% at December 31, 2009. The level of charge-offs and non-performing assets for 2009, which reflect more normalized levels compared to the historic lows of recent years, are a function of the current economic environment and remain favorable compared to peer levels. Total loans increased $134.2 million, or 14%, since December 31, 2008. The allowance for loan losses to total loans ratio was 1.68% at December 31, 2009, compared to 1.61% at December 31, 2008.
Non-interest income for the year ended December 31, 2009, amounted to $10.3 million compared to $6.1 million in the prior year. This increase primarily resulted from the level of other than temporary impairment charges which decreased $2.9 million in 2009 compared to 2008, and net gains on sales of investment securities which increased $1.2 million in the twelve months of 2009 compared to 2008. Excluding these investment items, non-interest income for the year end December 31, 2009 increased $94 thousand compared to the prior year. This increase was due to gains realized on the sales of loans, which increased $479 thousand, due to the increase in volume of residential loan production, partially offset by a decrease in investment advisory income of $356 thousand, which was
due to the decline in the average values of assets under management resulting primarily from the general decline in the stock market in 2008 and the first quarter of 2009.
Non-interest expense for the year ended December 31, 2009, amounted to $42.7 million, an increase of 13%, compared to $37.9 million for the year ended December 31, 2008. The increase in non-interest expense was related primarily to strategic growth including new branches opened, and increases in FDIC deposit insurance assessments. Strategic growth initiatives resulted in increases in the areas of compensation-related costs, occupancy and equipment, technology and telecommunications, and other expenses. For the year ended December 31, 2009, deposit insurance premiums increased $1.4 million compared to the same period in 2008, due to changes, which applied to all insured banks, in the FDIC insurance assessment rates and a special June 30, 2009 assessment intended to replenish the FDIC’s deposit insurance reserves.
Sources and Uses of Funds
The Company’s primary sources of funds are deposits, brokered CD’s, FHLB borrowings, current earnings and proceeds from the sales, maturities and paydowns on loans and investment securities. Additionally, in the fourth quarter of 2009 the Company raised $8.9 million ($8.8 million, net of costs)through a combined shareholder subscription rights and supplemental community stock offering. These funds are used to originate loans, purchase investment securities, conduct operations, expand the branch network, and pay dividends to shareholders.
Total assets amounted to $1.30 billion at December 31, 2009, an increase of 10% since December 31, 2008. The core asset strategy is to grow loans, primarily high quality commercial loans. Total loans increased 14% since December 31, 2008 and amounted to $1.08 billion, or 83% of total assets. Commercial loans amounted to $924.4 million, or 85% of gross loans at December 31, 2009. Management closely monitors the credit quality of individual delinquent and non-performing credit relationships, portfolio mix and industry concentrations, the local and regional real estate markets and current economic conditions. Non-performing statistics have increased from 2008, as would be expected during the current economic recession. Management does not consider the increase to be indicative of significant deterioration in the overall credit quality of the general loan portfolio at December 31, 2009.
The investment portfolio is the other key component of earning assets and is primarily used to invest excess funds, provide liquidity and to manage the Company’s asset-liability position. The carrying value of total investments amounted to $139.1 million at December 31, 2009, or 11% of total assets. The carrying value of the portfolio has decreased 13% since December 31, 2008 due primarily to principal paydowns, calls, maturities and sales, partially offset by purchase activity during the period.
Management’s preferred strategy for funding asset growth is to grow low cost deposits (comprised of demand deposit accounts, interest and business checking accounts and traditional savings accounts). Asset growth in excess of low cost deposits is typically funded through higher cost deposits (comprised of money market accounts, commercial tiered rate or “investment savings” accounts and certificates of deposit), customer repurchase agreements, wholesale funding (brokered CDs and FHLB borrowings), and investment portfolio cash flow.
At December 31, 2009, total deposits, excluding brokered CDs, amounted to $1.12 billion, representing $244.5 million, or 28%, growth over December 31, 2008 balances. The growth was in all deposit categories; with low cost deposit balances increasing 15% and higher cost transactional deposit balances increasing 78%, while non-brokered CDs increased 6% since December 31, 2008. The deposit growth, which primarily occurred in the first six months of 2009, is attributed to expansion and sales efforts to attract relationship customers seeking a competitive, but secure, alternative to the larger regional and national banks and mutual funds, as well as the migration of off-balance sheet sweep accounts to on-balance sheet accounts. Total deposits, including brokered CDs, amounted to $1.14 billion at December 31, 2009, representing an increase of $197 million, or 21% since December 31, 2008.
Wholesale funding amounted to $51.4 million at December 31, 2009, compared to $195.2 million at December 31, 2008. At December 31, 2009, wholesale funding included $27.9
million in brokered CDs, a decrease of $47.5 million, or 63%, since December 31, 2008, and FHLB borrowings amounting to $23.5 million, a decrease of $96.4 million, or 80%, since December 31, 2008. The declines in wholesale funding were achieved due to the strong deposit growth during the period.
Opportunities and Risks
The Company’s market area will continue to be marked by competition from multiple sources, including the expanded commercial lending capabilities of credit unions, the shift to commercial lending by traditional savings banks, the continuing presence of large regional and national commercial banks, the products offered by non-bank financial services competitors and increased competition for investment advisory assets and deposit resources within this market area. While the current economic environment presents significant challenges for all companies, management also believes that it has created opportunity for growth and customer acquisition, as customers seek out local, stable community banks with which to do their banking business.
Management views the current market activity as providing an opportunistic time to grow deposits. The Company seeks to position itself to increase market share with continual review of deposit product offerings and focused marketing strategies, and with carefully planned expansion into neighboring markets and new branch development. Over the past twenty months the Company has opened two new full service branch facilities in Massachusetts, in addition to the temporary Derry, New Hampshire office, with construction of the permanent Derry facility underway, and expected to be completed by late spring 2010.
Management also believes that Enterprise is well positioned to capitalize on this market opportunity and grow both the commercial and residential loan portfolios, by utilizing the disciplined and consistent lending, conservative credit review practices, and strong customer service standards that have served to provide quality asset growth over varying economic cycles during the Company’s twenty-one year history.
Notwithstanding the market opportunities that management believes the current economic environment has created, any long-term continuation of the nationwide or regional recession or possible lagging effects could further weaken the local New England economy, and have long-term adverse consequences on local industries leading to increased unemployment and foreclosures, further deterioration of local commercial real estate values, or other unforeseen complications, which could have a severe negative impact on the Company’s financial condition, capital position, liquidity, and performance. In addition, the loan portfolio consists primarily of commercial real estate, commercial and industrial and construction loans. These types of loans are typically larger and are generally viewed as having more risk of default than owner occupied residential real estate loans or consumer loans. The underlying commercial real estate values, customer cash flow and payment expectations and, in the case of commercial construction loans, the actual costs necessary to complete a construction project, can be more easily influenced by adverse conditions in the local or national economy, the real estate market, or the related industries. Any significant deterioration in the commercial loan portfolio or underlying collateral values due to a continuation or worsening of the current economic environment could have a material adverse effect on the Company’s financial condition and results of operations.
The value of the investment portfolio as a whole, or individual securities held, including bonds issued by government agencies or municipalities and restricted FHLB capital stock could be negatively impacted by any continued volatility in the financial markets, tightening of credit markets, and any possible subsequent effects of the current economic recession, which could possibly result in the recognition of additional other-than-temporary-impairment (“OTTI”) charges in the future.
Any further changes in government regulation or oversight, including responses to the recent financial crisis, could affect the Company in substantial and unpredictable ways, including, but not limited to, subjecting the Company to additional operating and compliance costs. As discussed above, changes in the FDIC’s deposit insurance rates applicable to all insured banks and the Company’s participation in the FDIC’s TAGP have already increased the Company’s ongoing FDIC-related costs, and the FDIC’s ability to
impose additional future special assessments to restore the DIF could further increase these costs.
In addition to investments in growth and branch expansion, management continues to undertake many significant strategic initiatives, including investments in employee training and development, marketing and public relations, technology, facilities improvement and ongoing updates and renovations of existing branches. While management recognizes that such investments increase expenses in the short-term, it believes that such initiatives are an investment in the long-term growth and earnings of the Company and are reflective of the opportunities in the current marketplace for community banks such as Enterprise.
Management believes that Enterprise is well positioned, both financially and strategically, to capitalize on opportunities created by the current challenging banking landscape. The Company will continue to face significant risks in seeking to achieve its long-term growth and market share objectives, which will depend upon the Company’s continued success in differentiating itself from competitors, developing strong relationships with business and community leaders, and providing a full range of diversified financial products and services delivered through consistent, responsive and superior personalized customer service. Management believes the Enterprise business model, strong service and technology cultures, active community involvement, its focus on relationship-banking, experienced banking professionals, in-depth knowledge of our markets and trusted reputation within the community, creates opportunities for the Company to be the leading provider of banking and investment management services in its growing market area.
Additional significant challenges facing the Company continue to be the effective management of interest rate and credit risk, liquidity management, capital adequacy and operational risk.
The re-pricing frequency of interest earning assets and liabilities are not identical, and therefore subject the Company to the risk of adverse changes in interest rates. This is often referred to as “interest rate risk” and is reviewed in more detail under Item 7A, “Quantitative and Qualitative Disclosures About Market Risk.”
The risk of loss due to customers’ non-payment of loans or lines of credit is called “credit risk.” Credit risk management is reviewed below in this Item 7 under the headings “Credit Risk/Asset Quality” and “Allowance for Loan Losses.”
Liquidity management is the coordination of activities so that cash needs are anticipated and met, readily and efficiently. Liquidity management is reviewed under this Item 7 under the heading “Liquidity.”
Federal banking agencies require the Company and the Bank to meet minimum capital requirements. At December 31, 2009, the Company was categorized as “well capitalized”; however future unanticipated charges against capital could impact that regulatory capital designation.
For additional information regarding the capital levels and capital requirements applicable to the Company and the Bank and their respective capital levels at December 31, 2009, see the sections entitled “Capital Resources” and “Capital Requirements” contained in Item 1 “Business” and note 8, “Stockholders’ Equity”, to the consolidated financial statements contained in Item 8.
Operational risk is defined as the risk of loss resulting from inadequate or failed internal processes, people or systems, or from external events. Operational risk management is also a key component of the Company’s risk management process, particularly as it relates to technology administration, information security, and business continuity.
Management utilizes a combination of third party information security assessments, key technologies and ongoing internal evaluations in order to protect non-public customer information and continually monitor and safeguard information on its operating systems and those of third party service providers. The Company contracts with outside parties to perform a broad scope of both internal and external information security assessments on the Company’s systems on a regular basis. These third parties test the network
configuration and security controls, and assess internal practices aimed at protecting the Company’s operating systems. In addition, an outside service provider monitors usage patterns and identifies unusual activity on bank issued debit/ATM cards. The Company also utilizes firewall technology and a combination of software and third-party monitoring to detect intrusion, protect against unauthorized access and continuously scan for computer viruses on the Company’s information systems.
The Business Continuity Plan consists of the information and procedures required to enable rapid recovery from an occurrence that would disable the Company for an extended period. The plan addresses issues and concerns regarding the loss of personnel, loss of information and/or loss of access to information under various scenarios including: the inability of staff or customers to travel to bank offices; and the physical destruction or damage of facilities, infrastructure or systems. The plan, which is reviewed annually, establishes responsibility for assessing a disruption of business, contains alternative strategies for the continuance of critical business functions during an emergency situation, assigns responsibility for restoring services, and sets priorities by which critical services will be restored. Any contingency plan, however well designed and operated, is based in part on certain assumptions and can provide only reasonable, not absolute, assurances that the objectives of the plan are met as the assumption used change over time or due to changes in circumstances and events.
In addition to the risks discussed above numerous other factors that could adversely affect the Company’s future results of operations and financial condition are addressed in Item 1A, “Risk Factors.” This Opportunities and Risk discussion should be read in conjunction with Item 1A.
Financial Condition
Total assets increased $123.5 million, or 10%, over the prior year, amounting to $1.30 billion at December 31, 2009. The increase was primarily attributable to an increase in total loans.
Loans
Total loans increased $134.2 million, or 14%, and amounted to 83% of total assets at December 31, 2009, compared with 80% of total assets, at December 31, 2008. The Company attributes the increase to its seasoned lending team, its sales and service culture and geographic market expansion. In addition, many of the larger regional and national banks, and other non-bank financial service companies with a presence in the Company’s market area, have broadly restricted lending activities due to the economic recession. This has resulted in additional opportunities for the Company to selectively develop relationships with strong, credit-worthy customers who may otherwise have sought out larger lending institutions. The mix of loans within the portfolio remained relatively unchanged with commercial loans amounting to approximately 85% of gross loans, reflecting a continued focus on commercial loan development.
The following table sets forth the loan balances by certain loan categories at the dates indicated and the percentage of each category to gross loans.
|
|
|
December 31, |
|
|||||||||||||||||||||||
|
|
|
2009 |
|
2008 |
|
2007 |
|
2006 |
|
2005 |
|
|||||||||||||||
|
(Dollars in thousands) |
|
Amount |
|
% of |
|
Amount |
|
% of |
|
Amount |
|
% of |
|
Amount |
|
% of |
|
Amount |
|
% of |
|
|||||
|
|
|
|
|
|
|
|
|
|
|
|
|
|
|
|
|
|
|
|
|
|
|
|||||
|
Comm’l real estate |
|
$ |
553,768 |
|
51.1 |
% |
$ |
472,279 |
|
49.7 |
% |
$ |
406,410 |
|
48.7 |
% |
$ |
368,621 |
|
48.3 |
% |
$ |
326,963 |
|
46.6 |
% |
|
Comm’l & industrial |
|
263,151 |
|
24.3 |
% |
231,815 |
|
24.4 |
% |
188,866 |
|
22.6 |
% |
164,865 |
|
21.6 |
% |
165,982 |
|
23.7 |
% |
|||||
|
Comm’l construction |
|
107,467 |
|
9.9 |
% |
98,365 |
|
10.4 |
% |
112,671 |
|
13.5 |
% |
114,078 |
|
15.0 |
% |
108,048 |
|
15.4 |
% |
|||||
|
Total Commercial |
|
924,386 |
|
85.3 |
% |
802,459 |
|
84.5 |
% |
707,947 |
|
84.8 |
% |
647,564 |
|
84.9 |
% |
600,993 |
|
85.7 |
% |
|||||
|
Residential mortgages |
|
90,468 |
|
8.3 |
% |
84,609 |
|
8.9 |
% |
73,933 |
|
8.9 |
% |
61,854 |
|
8.1 |
% |
47,207 |
|
6.7 |
% |
|||||
|
Resid construction |
|
6,260 |
|
0.6 |
% |
6,375 |
|
0.7 |
% |
4,120 |
|
0.5 |
% |
3,981 |
|
0.5 |
% |
4,154 |
|
0.6 |
% |
|||||
|
Home equity |
|
58,732 |
|
5.4 |
% |
49,773 |
|
5.2 |
% |
44,292 |
|
5.3 |
% |
44,038 |
|
5.8 |
% |
44,444 |
|
6.4 |
% |
|||||
|
Consumer |
|
3,824 |
|
0.4 |
% |
4,857 |
|
0.5 |
% |
4,493 |
|
0.5 |
% |
4,307 |
|
0.6 |
% |
3,986 |
|
0.6 |
% |
|||||
|
Loans held for sale |
|
378 |
|
0.0 |
% |
1,596 |
|
0.2 |
% |
268 |
|
0.0 |
% |
549 |
|
0.1 |
% |
267 |
|
0.0 |
% |
|||||
|
Gross loans |
|
1,084,048 |
|
100.0 |
% |
949,669 |
|
100.0 |
% |
835,053 |
|
100.0 |
% |
762,293 |
|
100.0 |
% |
701,051 |
|
100.0 |
% |
|||||
|
Deferred fees, net |
|
(1,218 |
) |
|
|
(1,028 |
) |
|
|
(1,234 |
) |
|
|
(1,180 |
) |
|
|
(1,325 |
) |
|
|
|||||
|
Total loans |
|
1,082,830 |
|
|
|
948,641 |
|
|
|
833,819 |
|
|
|
761,113 |
|
|
|
699,726 |
|
|
|
|||||
|
Allowance for loan losses |
|
(18,218 |
) |
|
|
(15,269 |
) |
|
|
(13,545 |
) |
|
|
(12,940 |
) |
|
|
(12,050 |
) |
|
|
|||||
|
Net loans |
|
$ |
1,064,612 |
|
|
|
$ |
933,372 |
|
|
|
$ |
820,274 |
|
|
|
$ |
748,173 |
|
|
|
$ |
687,676 |
|
|
|
During 2009, commercial real estate loans increased $81.5 million, or 17%. Commercial real estate loans are typically secured by apartment buildings, office or mixed-use facilities, strip shopping malls or other commercial or industrial property.
Commercial and industrial loans increased by $31.3 million, or 14%, since December 31, 2008. These loans include seasonal revolving lines of credit, working capital loans, equipment financing (including equipment leases), and term loans. Also included in commercial and industrial loans are loans under various U.S. Small Business Administration programs.
Commercial construction loans increased by $9.1 million, or 9%, compared to December 31, 2008. Commercial construction loans include the development of residential housing and condominium projects, the development of commercial and industrial use property and loans for the purchase and improvement of raw land.
At December 31, 2009, twenty-one commercial construction loans with outstanding balances of $19.2 million carried reserves of $2.3 million for the payment of future interest. These reserves may be funded by the borrower through proceeds from unit sales or through loan proceeds at origination. The Company closely monitors the impact of the interest reserve, the financial condition of the project and the borrower on the credit classification of the loan.
Residential mortgages, residential construction and home equity mortgages combined, increased by $14.7 million, or 10%, while consumer loans decreased $1.0 million or 21% since December 31, 2008.
During 2009, the Company originated $56.5 million in residential loans designated for sale, compared to $16.0 million for the prior year. The increase in volume of residential loan production was due to favorable market rates in 2009. Loans sold generated gains on sales of $612 thousand and $133 thousand for 2009 and 2008, respectively.
At December 31, 2009, commercial loan balances participated out to various banks amounted to $34.7 million, compared to $19.2 million at December 31, 2008. These balances participated out to other institutions are not carried as assets on the Company’s financial statements. Loans originated by other banks in which the Company is the participating institution are carried at the prorata share of ownership and amounted to $31.5 million and $24.9 million at December 31, 2009 and 2008, respectively.
The following table sets forth the scheduled maturities of commercial real estate, commercial & industrial and commercial construction loans in the Company’s portfolio at December 31, 2009. The table also sets forth the dollar amount of loans which are scheduled to mature after one year which have fixed or adjustable rates.
|
(Dollars in thousands) |
|
Commercial |
|
Commercial & |
|
Commercial |
|
|||
|
Amounts due (1): |
|
|
|
|
|
|
|
|||
|
One year or less |
|
$ |
18,858 |
|
$ |
133,098 |
|
$ |
82,172 |
|
|
After one year through five years |
|
41,084 |
|
65,987 |
|
8,998 |
|
|||
|
Beyond five years |
|
493,826 |
|
64,066 |
|
16,297 |
|
|||
|
|
|
$ |
553,768 |
|
$ |
263,151 |
|
$ |
107,467 |
|
|
|
|
|
|
|
|
|
|
|||
|
Interest rate terms on amounts due after one year: |
|
|
|
|
|
|
|
|||
|
Fixed |
|
$ |
37,410 |
|
$ |
56,156 |
|
$ |
1,384 |
|
|
Adjustable |
|
$ |
497,500 |
|
$ |
73,897 |
|
$ |
23,911 |
|
(1) Scheduled contractual maturities may not reflect the actual maturities of loans. The average maturity of loans may be shorter than their contractual terms principally due to prepayments.
Credit Risk/Asset Quality
The Company manages its loan portfolio to avoid concentration by industry or loan size to minimize its credit risk exposure. In addition, the Company does not have a “sub-prime” mortgage program. However, inherent in the lending process is the risk of loss due to customer non-payment, or “credit risk.” The Company’s commercial lending focus may entail significant additional risks compared to long term financing on existing owner occupied residential real estate. These types of loans are typically larger and are generally viewed as having more risk of default than owner occupied residential real estate loans or consumer loans. The underlying commercial real estate values, customer cash flow and payment expectations and, in the case of commercial construction loans, the actual costs necessary to complete a construction project, can be more easily influenced by adverse conditions in the local or national economy, the real estate market, or the related industries. As such, an extended downturn in the national or local economy or real estate markets, among other factors, could have a material impact on the borrowers’ ability to repay outstanding loans and on the value of the collateral securing these loans. While the Company endeavors to minimize this risk through the risk management function, management recognizes that loan losses will occur and that the amount of these losses will fluctuate depending on the risk characteristics of the loan portfolio and economic conditions.
The credit risk management function focuses on a wide variety of factors, including, among others, current and expected economic conditions, the real estate market, the financial condition of borrowers, the ability of borrowers to adapt to changing conditions or circumstances affecting their business and the continuity of borrowers’ management teams. Early detection of credit issues is critical to minimize credit losses. Accordingly, management regularly monitors these factors, among others, through ongoing credit reviews by the Credit Department, an external loan review service, reviews by members of senior management and the Loan Committee of the Board of Directors.
The Company’s loan risk rating system classifies loans depending on risk of loss characteristics. The classifications range from “substantially risk free” for the highest quality loans and loans that are secured by cash collateral, to the most severe adverse classifications of “substandard”, “doubtful” and “loss” based on criteria established under banking regulations. Loans classified as substandard include those characterized by the distinct possibility that the Company will sustain some loss if the deficiencies are not corrected. Loans classified as doubtful have all the weaknesses inherent in a substandard rated loan with the added characteristic that the weaknesses make collection or liquidation in full, on the basis of currently existing facts, conditions, and values, highly questionable and improbable. Loans classified as loss are generally considered uncollectible at present, although long term recovery of part or all of loan proceeds may be possible. These “loss” loans would require a specific loss reserve or charge-off. Adversely classified loans may be accruing or in non-accrual status and may be additionally designated as impaired or restructured, or some combination thereof. Loans which are evaluated to be of weaker credit quality are reviewed on a more regular basis by management.
Impaired loans are individually significant loans for which management considers it probable that not all amounts due in accordance with original contractual terms will be collected. The majority of impaired loans are included within the non-accrual balances; however, not every loan in non-accrual status has been designated as impaired. Management does not set any minimum delay of payments as a factor in reviewing for impaired classification. Management considers the payment status, net worth and earnings potential of the borrower, and the value and cash flow of the collateral as factors to determine if a loan will be paid in accordance with its contractual terms.
When a loan is deemed to be impaired, management estimates the credit loss by comparing the loan’s carrying value against either 1) the present value of the expected future cash flows discounted at the loan’s effective interest rate; 2) the loan’s observable market price; or 3) the expected realizable fair value of the collateral, in the case of collateral dependent loans. A specific allowance is assigned to the impaired loan for the amount of estimated credit loss. Impaired loans are charged off, in whole or in part, when management believes that the recorded investment in the loan is uncollectible.
Impaired loans exclude large groups of smaller-balance homogeneous loans, such as residential mortgage loans and consumer loans, which are collectively evaluated for impairment, loans that are measured at fair value and leases, unless the loan is amended in a troubled debt restructure.
Loans on which the accrual of interest has been discontinued are designated as non-accrual loans. Accrual of interest on loans is generally discontinued when a loan becomes contractually past due, with respect to interest or principal, by ninety days, or when reasonable doubt exists as to the full and timely collection of interest or principal. When a loan is placed on non-accrual status, all interest previously accrued but not collected is reversed against current period interest income. Interest accruals are resumed on such loans only when payments are brought current and have remained current for a period of ninety days or when, in the judgment of management, the collectability of both principal and interest is reasonably assured. Interest payments received on loans in a non-accrual status are generally applied to principal.
Loans are designated as a troubled debt restructure (or “TDR”) when a concession is made on a credit as a result of financial difficulties of the borrower. Typically, such concessions consist of a reduction in interest rate to a below market rate, taking into account the credit quality of the note, or a deferment of payments, principal or interest, which materially alters the Bank’s position or significantly extends the note’s maturity date, such that the present value of cash flows to be received is materially less than those contractually established at the loan’s origination. Restructured loans are included in the impaired loan category.
Real estate acquired by the Company through foreclosure proceedings or the acceptance of a deed in lieu of foreclosure is classified as Other Real Estate Owned (“OREO”). When property is acquired, it is generally recorded at the lesser of the loan’s remaining principal balance, net of any unamortized deferred fees, or the estimated fair value of the property acquired, less estimated costs to sell. Any loan balance in excess of the estimated realizable fair value on the date of transfer is charged to the allowance for loan losses on that date. All costs incurred thereafter in maintaining the property, as well as subsequent declines in fair value are charged to non-interest expense.
Non-performing assets are comprised of non-accrual loans, deposit account overdrafts that are more than 90 days past due and OREO. The designation of a loan or other asset as non-performing does not necessarily indicate that loan principal and interest will ultimately be uncollectible. However, management recognizes the greater risk characteristics of these assets and therefore considers the potential risk of loss on assets included in this category in evaluating the adequacy of the allowance for loan losses. Despite prudent loan underwriting, adverse changes within the Company’s market area, or deterioration in local, regional or national economic conditions, could negatively impact the Company’s level of non-performing assets in the future.
The following table sets forth information regarding non-performing assets, restructured loans and delinquent loans 60-89 days past due as to interest or principal, held by the Company at the dates indicated:
|
|
|
December 31, |
|
|||||||||||||
|
(Dollars in thousands) |
|
2009 |
|
2008 |
|
2007 |
|
2006 |
|
2005 |
|
|||||
|
|
|
|
|
|
|
|
|
|
|
|
|
|||||
|
Commercial real estate |
|
$ |
11,789 |
|
$ |
3,691 |
|
$ |
2,161 |
|
$ |
707 |
|
$ |
360 |
|
|
Commercial and industrial |
|
2,748 |
|
1,713 |
|
1,124 |
|
980 |
|
1,112 |
|
|||||
|
Commercial construction |
|
4,662 |
|
1,400 |
|
372 |
|
— |
|
— |
|
|||||
|
Residential |
|
1,379 |
|
1,019 |
|
220 |
|
— |
|
— |
|
|||||
|
Home Equity |
|
18 |
|
149 |
|
74 |
|
75 |
|
— |
|
|||||
|
Consumer |
|
8 |
|
39 |
|
5 |
|
23 |
|
3 |
|
|||||
|
Total Non-accrual loans |
|
20,604 |
|
8,011 |
|
3,956 |
|
1,785 |
|
1,475 |
|
|||||
|
Overdrafts > 90 days past due |
|
5 |
|
256 |
|
— |
|
7 |
|
1 |
|
|||||
|
Total non-performing loans |
|
20,609 |
|
8,267 |
|
3,956 |
|
1,792 |
|
1,476 |
|
|||||
|
Other real estate owned |
|
1,086 |
|
318 |
|
200 |
|
— |
|
— |
|
|||||
|
Total non-performing assets |
|
$ |
21,695 |
|
$ |
8,585 |
|
$ |
4,156 |
|
$ |
1,792 |
|
$ |
1,476 |
|
|
|
|
|
|
|
|
|
|
|
|
|
|
|||||
|
Total Loans |
|
$ |
1,082,830 |
|
$ |
948,641 |
|
$ |
833,819 |
|
$ |
761,113 |
|
$ |
699,726 |
|
|
Accruing restructured loans not included above |
|
$ |
20,125 |
|
$ |
3,697 |
|
$ |
76 |
|
$ |
128 |
|
$ |
82 |
|
|
Delinquent loans 60-89 days past due |
|
$ |
2,104 |
|
$ |
2,689 |
|
$ |
275 |
|
$ |
964 |
|
$ |
59 |
|
|
|
|
|
|
|
|
|
|
|
|
|
|
|||||
|
Non-performing loans to total loans |
|
1.90 |
% |
0.87 |
% |
0.47 |
% |
0.24 |
% |
0.21 |
% |
|||||
|
Non-performing assets to total assets |
|
1.66 |
% |
0.73 |
% |
0.39 |
% |
0.18 |
% |
0.16 |
% |
|||||
|
Loans 60-89 days past due to total loans |
|
0.19 |
% |
0.28 |
% |
0.03 |
% |
0.13 |
% |
0.01 |
% |
|||||
|
Adversely Classified loans to total loans |
|
2.38 |
% |
1.46 |
% |
0.76 |
% |
0.88 |
% |
0.77 |
% |
|||||
Non-performing statistics have trended upward in 2008 and 2009, as would be expected given the historically low level of these statistics in recent years, and are consistent with the regional economic environment and its impact on the local commercial markets. Management believes that the current levels of non-performing statistics are reflective of normalized commercial credit statistics compared to the historic lows seen in recent years. Management does not consider the increase since 2008 to be indicative of significant deterioration in the credit quality of the general loan portfolio at December 31, 2009, as indicated by the following factors: the reasonable ratio of non-performing loans given the size and mix of the Company’s loan portfolio; the minimal level of OREO; the low levels of loans 60-89 days delinquent; and management’s assessment that the majority of impaired loans at December 31, 2009 will ultimately be collected.
The $12.3 million net increase in total non-performing loans, and the resulting increase in the ratio of non-performing loans as a percentage of total loans outstanding, was due to net additions within the commercial real estate ($8.1 million), commercial construction ($3.3 million), and the commercial and industrial portfolios ($1.0 million). In addition, one overdraft deposit account of $256 thousand outstanding at December 31, 2008, was subsequently funded in January 2009. The majority of the non-accrual loans were also carried as impaired loans during the periods, and are discussed further below.
Total impaired commercial loans amounted to $39.7 million and $10.4 million at December 31, 2009 and December 31, 2008, respectively. Total accruing impaired loans amounted to $20.2 million and $3.7 million at December 31, 2009 and December 31, 2008, respectively, while, non—accrual impaired commercial loans amounted to $19.5 million and $6.7 million as of December 31, 2009 and December 31, 2008, respectively. There were ten larger commercial relationships added to impaired status during 2009 amounting to $29.1 million at December 31, 2009. Four of these ten relationships, amounting to $17.1 million, remained on accrual status during the period, while the remaining six relationships amounting to $12.0 million were in non-accrual status. In management’s opinion the majority of impaired loan balances at December 31, 2009 were adequately supported by expected future cash flows or the net realizable value of the underlying collateral and management expects that the majority of these principal advances will ultimately be collected. Based on management’s assessment at December 31, 2009, impaired loans totaling $29.6 million required no specific reserves and impaired loans totaling $10.1 million required specific reserve allocations of $2.1 million. At December 31, 2008, impaired loans totaling $5.2
million required no specific reserves and impaired loans totaling $5.2 million required specific reserve allocations of $478 thousand. Management closely monitors these relationships for collateral or credit deterioration.
Total TDR commercial loans, included in the impaired loan figures above as of December 31, 2009 and December 31, 2008 were $28.3 million and $4.7 million, respectively. The increase was due primarily to several of the newly impaired relationships referred to above. TDR loans on accrual status amounted to $20.1 million and $3.7 million at December 31, 2009 and December 31, 2008, respectively. Restructured loans included in non-performing loans amounted to $8.2 million and $1.0 million at December 31, 2009 and December 31, 2008, respectively. The Company continues to work with commercial relationships and enters into loan modifications to the extent deemed to be necessary or appropriate to ensure the best mutual outcome given the current economic environment.
At December 31, 2009, the Company had adversely classified loans (loans carrying “substandard”, “doubtful” or “loss” classifications) amounting to $25.8 million, compared to $13.9 million at December 31, 2008. The increase was primarily due to the increase in non-performing/impaired loans discussed above. There was $13 thousand classified as “Loss” at December 31, 2009 and no loans classified as “Loss” at December 31, 2008. Adversely classified loans which were performing but possessed potential weaknesses and, as a result, could ultimately become non-performing loans amounted to $7.0 million and $6.5 million, at December 31, 2009 and December 31, 2008, respectively. The remaining balances of adversely classified loans were non-accrual loans, amounting to $18.8 million and $7.4 million at December 31, 2009 and December 31, 2008, respectively. Non-accrual loans which were not adversely classified amounted to $1.8 million and $584 thousand at December 31, 2009 and December 31, 2008, respectively, and primarily represented the guaranteed portions of non-performing Small Business Administration loans.
The carrying value of OREO at December 31, 2009 was $1.1 million and consisted of five properties. During 2009 four properties were added to OREO, one of which was sold during the period; one additional property that had been held since 2008 was also sold during the period. There were no gains realized on the sale of OREO in 2009 and $27 thousand of gains on OREO sales in 2008. The carrying value of OREO at December 31, 2008 was $318 thousand and consisted of three properties.
Allowance for Loan Losses
On a quarterly basis, management prepares an estimate of the allowance necessary to cover estimated credit losses. The allowance for loan losses is an estimate of probable credit risk inherent in the loan portfolio as of the specified balance sheet dates. The Company maintains the allowance at a level that it deems adequate to absorb all reasonably anticipated losses from specifically known and other credit risks associated with the portfolio.
In making its assessment on the adequacy of the allowance, management considers several quantitative and qualitative factors that could have an effect on the credit quality of the portfolio including individual assessment of larger and high risk credits, delinquency trends and the level of non-performing loans, net charge-offs, the growth and composition of the loan portfolio, expansion in geographic market area, the strength of the local and national economy, and comparison to industry peers, among other factors. Except for loans specifically identified as impaired, as discussed above, the estimate is a two-tiered approach that allocates loan loss reserves to “adversely classified” loans by credit rating and to non-classified loans by credit type. The general loss allocations take into account the historic loss experience as well as the quantitative and qualitative factors identified above. The allowance for loan losses is established through a provision for loan losses, a direct charge to earnings. Loan losses are charged against the allowance when management believes that the collectability of the loan principal is unlikely. Recoveries on loans previously charged off are credited to the allowance.
Management closely monitors the credit quality of individual delinquent and non-performing relationships, industry concentrations, the local and regional real estate market and current economic conditions. The level of delinquent and non-performing assets is largely a function of economic conditions and the overall banking environment. Despite prudent loan underwriting, adverse changes within the Company’s market area or further deterioration in the local, regional or national economic conditions could negatively impact the Company’s level of non-performing assets in the future.
The allowance for loan losses to total loans ratio was 1.68% at December 31, 2009 compared to 1.61% at December 31, 2008. Based on the foregoing, as well as management’s judgment as to the existing credit risks inherent in the loan portfolio, the Company’s allowance for loan losses is deemed adequate to absorb probable losses from specifically known and other credit risks associated with the portfolio as of December 31, 2009.
The following table summarizes the activity in the allowance for loan losses for the periods indicated:
|
|
|
Years Ended December 31, |
|
|||||||||||||
|
(Dollars in thousands) |
|
2009 |
|
2008 |
|
2007 |
|
2006 |
|
2005 |
|
|||||
|
|
|
|
|
|
|
|
|
|
|
|
|
|||||
|
Balance at beginning of year |
|
$ |
15,269 |
|
$ |
13,545 |
|
$ |
12,940 |
|
$ |
12,050 |
|
$ |
10,923 |
|
|
|
|
|
|
|
|
|
|
|
|
|
|
|||||
|
Charged-off loans: |
|
|
|
|
|
|
|
|
|
|
|
|||||
|
Commercial real estate |
|
911 |
|
360 |
|
27 |
|
200 |
|
— |
|
|||||
|
Commercial and industrial |
|
1,321 |
|
943 |
|
422 |
|
241 |
|
70 |
|
|||||
|
Construction |
|
— |
|
— |
|
100 |
|
— |
|
— |
|
|||||
|
Residential mortgage |
|
76 |
|
— |
|
— |
|
— |
|
— |
|
|||||
|
Home equity |
|
140 |
|
50 |
|
77 |
|
68 |
|
— |
|
|||||
|
Consumer |
|
87 |
|
25 |
|
25 |
|
70 |
|
57 |
|
|||||
|
Total charged-off |
|
2,535 |
|
1,378 |
|
651 |
|
579 |
|
127 |
|
|||||
|
|
|
|
|
|
|
|
|
|
|
|
|
|||||
|
Recovereries on charged-off loans: |
|
|
|
|
|
|
|
|
|
|
|
|||||
|
Commercial real estate |
|
210 |
|
2 |
|
82 |
|
— |
|
— |
|
|||||
|
Commercial and industrial |
|
130 |
|
427 |
|
152 |
|
182 |
|
102 |
|
|||||
|
Construction |
|
3 |
|
96 |
|
— |
|
— |
|
— |
|
|||||
|
Residential mortgage |
|
1 |
|
— |
|
— |
|
— |
|
— |
|
|||||
|
Home equity |
|
7 |
|
61 |
|
— |
|
— |
|
— |
|
|||||
|
Consumer |
|
287 |
|
11 |
|
22 |
|
28 |
|
17 |
|
|||||
|
Total recoveries |
|
638 |
|
597 |
|
256 |
|
210 |
|
119 |
|
|||||
|
|
|
|
|
|
|
|
|
|
|
|
|
|||||
|
Net loans charged-off |
|
1,897 |
|
781 |
|
395 |
|
369 |
|
8 |
|
|||||
|
Provision charged to operations |
|
4,846 |
|
2,505 |
|
1,000 |
|
1,259 |
|
1,135 |
|
|||||
|
|
|
|
|
|
|
|
|
|
|
|
|
|||||
|
Balance at December 31 |
|
$ |
18,218 |
|
$ |
15,269 |
|
$ |
13,545 |
|
$ |
12,940 |
|
$ |
12,050 |
|
|
|
|
|
|
|
|
|
|
|
|
|
|
|||||
|
Allowance to non-performing loans |
|
88.40 |
% |
184.70 |
% |
342.39 |
% |
722.10 |
% |
816.40 |
% |
|||||
|
|
|
|
|
|
|
|
|
|
|
|
|
|||||
|
Recoveries to charge-offs |
|
25.17 |
% |
43.32 |
% |
39.32 |
% |
36.27 |
% |
93.70 |
% |
|||||
|
Net loans charged-off to allowance |
|
10.41 |
% |
5.11 |
% |
2.92 |
% |
2.85 |
% |
0.07 |
% |
|||||
|
|
|
|
|
|
|
|
|
|
|
|
|
|||||
|
Average loans outstanding |
|
$ |
1,016,107 |
|
$ |
880,228 |
|
$ |
793,395 |
|
$ |
732,813 |
|
$ |
625,403 |
|
|
Increase in avg loans over prior year |
|
15 |
% |
11 |
% |
8 |
% |
17 |
% |
18 |
% |
|||||
|
Net loans charged-off to average loans |
|
0.19 |
% |
0.09 |
% |
0.05 |
% |
0.05 |
% |
0.00 |
% |
|||||
|
|
|
|
|
|
|
|
|
|
|
|
|
|||||
|
Allowance to total loans outstanding |
|
1.68 |
% |
1.61 |
% |
1.62 |
% |
1.70 |
% |
1.72 |
% |
|||||
The following table sets forth the allocation of the Company’s allowance for loan losses amongst the categories of loans and the percentage of loans in each category to gross loans for the periods ending on the respective dates indicated:
|
|
|
December 31, |
|
|||||||||||||||||||||||
|
|
|
2009 |
|
2008 |
|
2007 |
|
2006 |
|
2005 |
|
|||||||||||||||
|
(Dollars in thousands) |
|
Allowance
|
|
Loan |
|
Allowance
|
|
Loan |
|
Allowance
|
|
Loan |
|
Allowance
|
|
Loan |
|
Allowance
|
|
Loan |
|
|||||
|
|
|
|
|
|
|
|
|
|
|
|
|
|
|
|
|
|
|
|
|
|
|
|||||
|
Comm’l real estate |
|
9,630 |
|
51.1 |
% |
$ |
7,953 |
|
49.7 |
% |
$ |
6,908 |
|
48.7 |
% |
$ |
6,551 |
|
48.3 |
% |
$ |
5,753 |
|
46.6 |
% |
|
|
Comm’l industrial |
|
4,614 |
|
24.3 |
% |
3,817 |
|
24.4 |
% |
3,196 |
|
22.6 |
% |
2,929 |
|
21.6 |
% |
2,979 |
|
23.7 |
% |
|||||
|
Comm’l constr. |
|
2,475 |
|
9.9 |
% |
2,094 |
|
10.4 |
% |
2,341 |
|
13.5 |
% |
2,423 |
|
15.0 |
% |
2,373 |
|
15.4 |
% |
|||||
|
Resid: mortg, cnstr and HELOC’s |
|
1,402 |
|
14.3 |
% |
1,268 |
|
15.0 |
% |
988 |
|
14.7 |
% |
925 |
|
14.5 |
% |
840 |
|
13.7 |
% |
|||||
|
Consumer |
|
97 |
|
0.4 |
% |
137 |
|
0.5 |
% |
112 |
|
0.5 |
% |
112 |
|
0.6 |
% |
105 |
|
0.6 |
% |
|||||
|
Total |
|
$ |
18,218 |
|
100.0 |
% |
$ |
15,269 |
|
100.0 |
% |
$ |
13,545 |
|
100.0 |
% |
$ |
12,940 |
|
100.0 |
% |
$ |
12,050 |
|
100.0 |
% |
The allocation of the allowance for loan losses above reflects management’s judgment of the relative risks of the various categories of the Company’s loan portfolio. This allocation should not be considered an indication of the future amounts or types of possible loan charge-offs.
Short-Term Investments
As of December 31, 2009, short-term investments amounted to 0.5% of total assets, compared to 0.3% of total assets, at December 31, 2008. Short-term investments carried as cash equivalents at December 31, 2009 and 2008 consisted of overnight and term federal funds sold and money market mutual funds. The Company had no “other short-term investments” at December 31, 2009 or 2008.
Investment Securities
As of December 31, 2009, the carrying amount of the investment portfolio decreased $20.3 million, or 13%, compared to December 31, 2008. The decrease was due primarily to calls, principal paydowns and maturities, as well as securities’ sales during the year, partially offset by purchases during the period. At December 31, 2009 and 2008, all investment securities (other than FHLB stock) were classified as available for sale and were carried at fair market value.
The investment portfolio represented 11% and 14% of total assets at December 31, 2009 and 2008, respectively. Fixed income securities comprised the majority of the carrying value of the portfolio and represented 93% of total investments both at December 31, 2009 and 2008 respectively.
The following table summarizes investments at the dates indicated:
|
|
|
December 31, |
|
|||||||
|
(Dollars in thousands) |
|
2009 |
|
2008 |
|
2007 |
|
|||
|
|
|
|
|
|
|
|
|
|||
|
Federal agency obligations(1) |
|
$ |
25,631 |
|
$ |
— |
|
$ |
12,543 |
|
|
Federal agency Mortgage backed securities (MBS)(1) |
|
39,737 |
|
82,936 |
|
57,156 |
|
|||
|
Non-agency MBS |
|
3,445 |
|
4,316 |
|
5,062 |
|
|||
|
Municipal securities |
|
60,592 |
|
61,386 |
|
60,049 |
|
|||
|
Fixed income securities |
|
129,405 |
|
148,638 |
|
134,810 |
|
|||
|
|
|
|
|
|
|
|
|
|||
|
Equity investments |
|
4,964 |
|
5,995 |
|
6,812 |
|
|||
|
Total available for sale securities at fair value |
|
134,369 |
|
154,633 |
|
141,622 |
|
|||
|
Federal Home Loan Bank Stock, at cost(2) |
|
4,740 |
|
4,740 |
|
3,895 |
|
|||
|
Total investments securities |
|
$ |
139,109 |
|
$ |
159,373 |
|
$ |
145,517 |
|
(1) Investments issued or guaranteed by government sponsored enterprises such as Fannie Mae (FNMA), Freddie Mac (FHLMC), Ginnie Mae (GNMA) or one of several Federal Home Loan Banks (FHLB). All agency MBS investments by the Company are backed by residential mortgages.
(2) This stock is classified as a restricted investment and carried at cost, which management believes approximates fair value.
During 2009 the Company recognized net gains amounting to $1.5 million, on the sales of $39.5 million of securities, and impairment charges, primarily in the first quarter, on certain equity investments of $797 thousand. Principal paydowns, calls and maturities on fixed income securities totaled $52.8 million during 2009. These proceeds along with additional funds were utilized to purchase $71.5 million of securities during 2009.
As of December 31, 2009, the net unrealized gains in the investment portfolio were $3.2 million compared to the net unrealized gains of $1.7 million at December 31, 2008. The unrealized gains at December 31, 2009 consisted of net unrealized gains on fixed income securities of $1.7 million (comprised of gains of $2.1 million and losses of $421 thousand losses) and unrealized gains on equity securities of $1.5 million.
Unrealized gains or losses will only be recognized in the statements of income if the securities are sold. However, should an investment be deemed “other than temporarily impaired”, the Company is required to write-down the carrying value of the investment. See “Impairment Review of Securities” under the heading “Critical Accounting Estimates” above in this Item 7 for additional information regarding the accounting for other than temporary impairment.
The net unrealized gain or loss in the Company’s fixed income portfolio fluctuates as market interest rates rise and fall. Due to the fixed rate nature of this portfolio, as market rates fall the value of the portfolio rises, and as market rates rise, the value of the portfolio declines. The unrealized gains or loss on fixed income investments will also decline as the securities approach maturity.
As of December 31, 2009, unrealized losses on the federal agency obligations and federal agency MBS investments of $235 thousand were limited to nine individual securities and were attributed to market volatility. The contractual cash flows of these investments are guaranteed by an agency of the U.S. Government, and the agencies that issued these securities are sponsored by the U.S. Government. Accordingly, it is expected that the securities would not be settled at a price less than the par value of the Company’s investment. The Company does not consider these investments to be other-than-temporarily impaired at December 31, 2009, because the decline in market value is attributable to interest rate volatility and not credit quality, and because the Company does not intend to, and it is more likely than not that it will not be required to, sell these investments prior to a market price recovery or maturity.
As of December 31, 2009, the non-agency MBS portfolio consisted of one residential mortgage backed security. The $34 thousand unrealized losses on this MBS was due to market conditions which have resulted generally in lower prices for most non-agency MBS in relation to government issued and agency securities. The Company does not consider this investment to be other-than-temporarily impaired at December 31, 2009 due to the AAA rating of the security and the high credit quality of the underlying loans. In addition, the Company does not intend to, and it is more likely than not that it will not be required to, sell this investment prior to a market price recovery or maturity.
As of December 31, 2009, the $152 thousand of unrealized losses on the Company’s municipal securities were related to eighteen obligations and attributed to market volatility and not a fundamental deterioration in the issuers. The Company does not consider these investments to be other-than-temporarily impaired at December 31, 2009 due to the securities being classified as “investment grade” and also because of the lower risk nature of municipal investments. In addition, the Company does not intend to, and it is more likely than not that it will not be required to, sell these investments prior to a market price recovery or maturity.
At December 31, 2009, the equity portfolio consisted primarily of investments in a diversified group of mutual funds, with a small portion of the portfolio (approximately 9%) invested in funds or individual common stock of entities in the financial services industry. The net unrealized gain or loss on equity securities will fluctuate based on changes in the market value of the individual securities and mutual and other funds in the portfolio. Management regularly reviews the portfolio for securities with unrealized losses that are other than temporarily impaired. Management’s assessment includes evaluating if any equity security or fund exhibits fundamental deterioration and whether it is unlikely that the security or fund will completely recover its unrealized loss within a reasonable time period. In determining the amount of the other than temporary impairment charge, management considers the severity of the declines and the uncertainty of recovery in the short-term for these equities.
During 2009, primarily in the first quarter, the Company recorded fair market value impairment charges on certain investments contained in its equity portfolio, to reflect the impact of declines in the equity markets during the period. The pretax impairment charge of $797 thousand represented a $526 thousand after tax charge against earnings. During 2009, the Company sold $2.0 million of previously impaired equity funds and recognized additional losses of $299 thousand and gains of $515 thousand. The Company’s equity portfolio had no unrealized losses and had unrealized appreciation of $1.5 million at December 31, 2009.
As a member of the FHLB, the Company is required to purchase FHLB capital stock in association with the Bank’s outstanding advances from the FHLB; this stock is classified as a restricted investment and carried at cost. The FHLB is currently operating with retained earnings below its target level. The FHLB has instituted a plan to increase retained earnings which includes suspending its quarterly dividend and a moratorium on the repurchase of excess capital stock from member banks, among other programs. If further deterioration in the FHLB financial condition or capital levels occurs, the FHLB capital stock may become other than temporarily impaired to some degree and its carry value correspondingly reduced.
The contractual maturity distribution at amortized cost, as of December 31, 2009, of the fixed income securities above with the weighted average yield for each category is set forth below:
|
|
|
Under 1 Year |
|
>1 – 3 Years |
|
>3 – 5 Years |
|
>5 – 10 Years |
|
Over 10 Years |
|
|||||||||||||||
|
(Dollars in thousands) |
|
Balance |
|
Yield |
|
Balance |
|
Yield |
|
Balance |
|
Yield |
|
Balance |
|
Yield |
|
Balance |
|
Yield |
|
|||||
|
|
|
|
|
|
|
|
|
|
|
|
|
|
|
|
|
|
|
|
|
|
|
|||||
|
Federal Agency Obligations |
|
$ |
8,083 |
|
0.66 |
% |
$ |
13,591 |
|
1.39 |
% |
$ |
2,000 |
|
3.00 |
% |
$ |
1,979 |
|
3.41 |
% |
$ |
— |
|
— |
|
|
MBS |
|
— |
|
— |
|
— |
|
— |
|
— |
|
— |
|
11,109 |
|
3.81 |
% |
31,669 |
|
4.18 |
% |
|||||
|
Municipals(1) |
|
4,616 |
|
3.97 |
% |
11,575 |
|
4.42 |
% |
4,728 |
|
4.25 |
% |
15,938 |
|
5.49 |
% |
22,421 |
|
5.85 |
% |
|||||
|
|
|
$ |
12,699 |
|
1.86 |
% |
$ |
25,166 |
|
2.78 |
% |
$ |
6,728 |
|
3.88 |
% |
$ |
29,026 |
|
4.71 |
% |
$ |
54,090 |
|
4.87 |
% |
(1) Municipal security yields and total yields are shown on a tax equivalent basis.
Scheduled contractual maturities may not reflect the actual maturities of the investments. MBS are shown at their final maturity. However, due to prepayments and amortization the actual MBS cash flows may be faster than presented above. Similarly, included in the municipal and federal agency obligations categories were $50.1 million in securities which can be “called” before maturity. Actual maturity of these callable securities could be shorter if market interest rates decline further. Management considers these factors when evaluating the net interest margin in the Company’s asset-liability management program.
Bank Owned Life Insurance (“BOLI”)
The Company has purchased BOLI as an investment vehicle, utilizing the earnings on BOLI to offset the cost of the Company’s benefit plans. There were no BOLI purchases in 2009 or 2008. The cash surrender value of BOLI was $13.8 million and $13.3 million at December 31, 2009 and 2008, respectively. The Company recorded income from the BOLI policies, net of related expenses, of $545 thousand, $554 thousand, and $548 thousand for 2009, 2008 and 2007, respectively.
Further information regarding the Company’s retirement benefit plans is contained in note 10, “Employee Benefit Plans”, to the consolidated financial statements contained in Item 8 below, under the heading “Supplemental Retirement Plan.”
Deposits
Total deposits increased $197.0 million, or 21%, as of December 31, 2009 compared to December 31, 2008. Deposits, excluding brokered deposits, increased $244.5 million, or 28%, compared to the prior year. Total deposits as a percentage of total assets were 88% at December 31, 2009 compared to 80% at December 31, 2008. The increase in 2009 deposit balances is attributed to a combination of consumers seeking competitive secure product options as alternatives to investing funds in uncertain financial markets, as well as customers seeking alternatives to larger regional and national banks, which resulted in a very active deposit marketplace for local community banks. The Company has capitalized on this market environment through carefully planned branch expansion, focused sales and marketing efforts, and a redesign of commercial deposit product offerings.
The following table sets forth deposit balances by certain categories at the dates indicated and the percentage of each deposit category to total deposits.
|
|
|
December 31, 2009 |
|
December 31, 2008 |
|
December 31, 2007 |
|
|||||||||
|
(Dollars in thousands) |
|
Amount |
|
% of |
|
Amount |
|
% of |
|
Amount |
|
% of |
|
|||
|
|
|
|
|
|
|
|
|
|
|
|
|
|
|
|||
|
Non-interest demand deposits |
|
$ |
192,515 |
|
16.8 |
% |
$ |
166,430 |
|
17.5 |
% |
$ |
167,039 |
|
19.2 |
% |
|
Interest bearing checking |
|
185,693 |
|
16.2 |
% |
158,005 |
|
16.7 |
% |
160,668 |
|
18.5 |
% |
|||
|
Total checking |
|
378,208 |
|
33.0 |
% |
324,435 |
|
34.2 |
% |
327,707 |
|
37.7 |
% |
|||
|
|
|
|
|
|
|
|
|
|
|
|
|
|
|
|||
|
Retail savings/money markets |
|
203,544 |
|
17.8 |
% |
152,021 |
|
16.0 |
% |
145,959 |
|
16.8 |
% |
|||
|
Commercial savings/money markets |
|
266,164 |
|
23.3 |
% |
141,997 |
|
15.0 |
% |
120,768 |
|
13.9 |
% |
|||
|
Total savings/money markets |
|
469,708 |
|
41.1 |
% |
294,018 |
|
31.0 |
% |
266,727 |
|
30.7 |
% |
|||
|
|
|
|
|
|
|
|
|
|
|
|
|
|
|
|||
|
Certificates of deposit |
|
269,120 |
|
23.5 |
% |
254,086 |
|
26.8 |
% |
203,657 |
|
23.5 |
% |
|||
|
Total non-brokered deposits |
|
1,117,036 |
|
97.6 |
% |
872,539 |
|
92.0 |
% |
798,091 |
|
91.9 |
% |
|||
|
|
|
|
|
|
|
|
|
|
|
|
|
|
|
|||
|
Brokered certificates of deposit |
|
27,912 |
|
2.4 |
% |
75,364 |
|
8.0 |
% |
70,695 |
|
8.1 |
% |
|||
|
Total deposits |
|
$ |
1,144,948 |
|
100.0 |
% |
$ |
947,903 |
|
100.0 |
% |
$ |
868,786 |
|
100.0 |
% |
Checking deposits, a strong source of low-cost funding for the Company, increased $53.8 million, or 17%, through December 31, 2009 compared to December 31, 2008.
Savings and money market accounts increased by $175.7 million, or 60%, at December 31, 2009 compared to December 31, 2008. The increase reflects the deposit market activity noted above, and the shift in funds by rate sensitive depositors to higher yielding products as interest rates decreased over the period.
Year-end balances of certificates of deposit increased by $15.0 million, or 6%. The increase reflects the market activity noted above and the trend of depositors shifting excess funds to higher yielding term products. Brokered CD’s decreased $47.5 million, or 63%, as of December 31, 2009 compared to December 31, 2008. Management utilizes both brokered CDs and FHLB borrowings (as discussed below) as alternative funding sources as necessary to support continued loan growth.
The majority of the December 31, 2009 combined CD balances were scheduled to mature within one year, with approximately 45% due to mature within three months and 44% due in over three through twelve months, with the remaining 11% scheduled to mature within 3 years.
The table below sets forth a comparison of the Company’s average deposits and average rates paid for the periods indicated, as well as the percentage of each deposit category to total average deposits. The annualized average rate on total deposits reflects both interest bearing and non-interest bearing deposits.
|
|
|
Year ended December 31, |
|
|||||||||||||||||||
|
|
|
2009 |
|
2008 |
|
2007 |
|
|||||||||||||||
|
(Dollars in thousands) |
|
Average |
|
Avg |
|
% of |
|
Average |
|
Avg |
|
% of |
|
Average |
|
Avg |
|
% of |
|
|||
|
|
|
|
|
|
|
|
|
|
|
|
|
|
|
|
|
|
|
|
|
|||
|
Non-interest demand |
|
$ |
172,192 |
|
— |
|
16.3 |
% |
$ |
168,140 |
|
— |
|
18.5 |
% |
$ |
165,653 |
|
— |
|
18.9 |
% |
|
|
|
|
|
|
|
|
|
|
|
|
|
|
|
|
|
|
|
|
|
|||
|
Interest checking |
|
165,389 |
|
0.28 |
% |
15.7 |
% |
151,971 |
|
0.52 |
% |
16.7 |
% |
151,835 |
|
1.13 |
% |
17.3 |
% |
|||
|
Savings |
|
153,199 |
|
0.88 |
% |
14.5 |
% |
148,595 |
|
1.81 |
% |
16.3 |
% |
151,480 |
|
2.15 |
% |
17.2 |
% |
|||
|
Money market |
|
232,700 |
|
1.26 |
% |
22.0 |
% |
139,852 |
|
2.36 |
% |
15.4 |
% |
123,652 |
|
2.94 |
% |
14.1 |
% |
|||
|
Total interest bearing non-term deposits |
|
551,288 |
|
0.86 |
% |
52.2 |
% |
440,418 |
|
1.54 |
% |
48.4 |
% |
426,967 |
|
2.02 |
% |
48.6 |
% |
|||
|
|
|
|
|
|
|
|
|
|
|
|
|
|
|
|
|
|
|
|
|
|||
|
Certificates of Deposit |
|
263,722 |
|
2.56 |
% |
25.0 |
% |
241,124 |
|
3.77 |
% |
26.5 |
% |
195,565 |
|
4.45 |
% |
22.3 |
% |
|||
|
Total non-brokered deposits |
|
987,202 |
|
1.17 |
% |
93.5 |
% |
849,682 |
|
1.87 |
% |
93.4 |
% |
788,185 |
|
2.20 |
% |
89.8 |
% |
|||
|
|
|
|
|
|
|
|
|
|
|
|
|
|
|
|
|
|
|
|
|
|||
|
Brokered CDs |
|
69,064 |
|
1.40 |
% |
6.5 |
% |
59,929 |
|
4.13 |
% |
6.6 |
% |
89,506 |
|
5.34 |
% |
10.2 |
% |
|||
|
|
|
|
|
|
|
|
|
|
|
|
|
|
|
|
|
|
|
|
|
|||
|
Total |
|
$ |
1,056,266 |
|
1.18 |
% |
100.0 |
% |
$ |
909,611 |
|
2.02 |
% |
100.0 |
% |
$ |
877,691 |
|
2.52 |
% |
100.0 |
% |
The decrease in the average rate paid on total deposit accounts for 2009 is attributable to decreases in market interest rates.
Borrowed Funds
Total borrowed funds, consisting of FHLB borrowings and securities sold to customers under agreements to repurchase (repurchase agreements) decreased $96.4 million from December 31, 2008. The decrease resulted primarily from the increase in core deposit balances as noted above.
The following table sets forth borrowed funds by categories at the dates indicated and the percentage of each category to total borrowed funds.
|
|
|
December 31, 2009 |
|
December 31, 2008 |
|
December 31, 2007 |
|
|||||||||
|
(Dollars in thousands) |
|
Amount |
|
% |
|
Amount |
|
% |
|
Amount |
|
% |
|
|||
|
|
|
|
|
|
|
|
|
|
|
|
|
|
|
|||
|
FHLB Borrowings |
|
$ |
23,460 |
|
94.3 |
% |
$ |
119,832 |
|
98.8 |
% |
$ |
73,162 |
|
89.8 |
% |
|
Repurchase agreements |
|
1,416 |
|
5.7 |
% |
1,418 |
|
1.2 |
% |
8,267 |
|
10.2 |
% |
|||
|
Total borrowed funds |
|
$ |
24,876 |
|
100.0 |
% |
$ |
121,250 |
|
100.0 |
% |
$ |
81,429 |
|
100.0 |
% |
The contractual maturity distribution as of December 31, 2009, of borrowed funds with the weighted average cost for each category is set forth below:
|
|
|
Overnight |
|
Under 1 month |
|
>1 – 3 months |
|
>3 – 12 months |
|
Over 12 months |
|
|||||||||||||||
|
(Dollars in thousands) |
|
Balance |
|
Rate |
|
Balance |
|
Rate |
|
Balance |
|
Rate |
|
Balance |
|
Rate |
|
Balance |
|
Rate |
|
|||||
|
|
|
|
|
|
|
|
|
|
|
|
|
|
|
|
|
|
|
|
|
|
|
|||||
|
FHLB Borrowings |
|
$ |
2,705 |
|
0.43 |
% |
$ |
— |
|
— |
|
$ |
285 |
|
0.44 |
% |
$ |
20,000 |
|
0.41 |
% |
$ |
470 |
|
5.94 |
% |
|
Repurchase agreements |
|
— |
|
— |
|
17 |
|
0.50 |
% |
1,399 |
|
0.56 |
% |
— |
|
— |
|
— |
|
— |
|
|||||
|
Total borrowed funds |
|
$ |
2,705 |
|
0.43 |
% |
$ |
17 |
|
0.50 |
% |
$ |
1,684 |
|
0.54 |
% |
$ |
20,000 |
|
0.41 |
% |
$ |
470 |
|
5.94 |
% |
Maximum FHLB advances outstanding at any month end during 2009, 2008, and 2007 were $112.8 million, $119.8 million and $73.2 million respectively. Maximum amounts outstanding under repurchase agreements at any month end during 2009, 2008, and 2007 were $1.4 million, $8.3 million, and $8.3 million, respectively.
The table below shows the comparison of the Company’s average borrowed funds and average rates paid for the periods indicated.
|
|
|
Year ended December 31, |
|
|||||||||||||
|
|
|
2009 |
|
2008 |
|
2007 |
|
|||||||||
|
(Dollars in thousands) |
|
Average |
|
Average |
|
Average |
|
Average |
|
Average |
|
Average |
|
|||
|
|
|
|
|
|
|
|
|
|
|
|
|
|
|
|||
|
FHLB advances |
|
$ |
65,325 |
|
0.34 |
% |
$ |
75,516 |
|
2.33 |
% |
$ |
18,547 |
|
5.02 |
% |
|
Repurchase agreements |
|
1,415 |
|
1.10 |
% |
3,425 |
|
3.72 |
% |
3,464 |
|
4.54 |
% |
|||
|
Other borrowed funds |
|
58 |
|
0.46 |
% |
131 |
|
2.19 |
% |
— |
|
— |
|
|||
|
Total borrowed funds |
|
$ |
66,798 |
|
0.36 |
% |
$ |
79,072 |
|
2.39 |
% |
$ |
22,011 |
|
4.94 |
% |
The decrease in the average rate on borrowed funds for the year ended December 31, 2009 compared to the prior year was due to the decrease in market interest rates since the period. The average balance of “other borrowed funds” above represents overnight advances from the FRB or federal funds purchased from correspondent banks made during those years to test arrangements. The Company had no outstanding balances due to the FRB or correspondent banks at December 31, 2009.
At December 31, 2009, the Bank had the ability to borrow additional funds from the FHLB of up to $182.9 million and capacity with the FRB of $52.4 million.
Liquidity
Liquidity is the ability to meet cash needs arising from, among other things, fluctuations in loans, investments, deposits and borrowings. Liquidity management is the coordination of activities so that cash needs are anticipated and met, readily and efficiently. Liquidity policies are set and monitored by the Company’s Asset-Liability Committee of the Board of Directors. The Company’s liquidity is maintained by projecting cash needs, balancing maturing assets with maturing liabilities, monitoring various liquidity ratios, monitoring deposit flows, maintaining cash flow within the investment portfolio and maintaining wholesale funding resources. The Company’s wholesale funding sources include borrowing capacity in the brokered CD market, at the FHLB, through the FRB Discount Window, and through fed fund purchase arrangements with correspondent banks.
The Company’s asset-liability management objectives are to engage in sound balance sheet management strategies, maintain liquidity, provide and enhance access to a diverse and stable source of funds, provide competitively priced and attractive products to customers and conduct funding at a low cost relative to current market conditions. Funds gathered are used to support current commitments, to fund earning asset growth, and to take advantage of selected leverage opportunities. The Company currently funds earning assets primarily with deposits, brokered CDs, repurchase agreements, FHLB borrowings and earnings. The Company has in the past also issued junior subordinated debentures and offered shares of the Company’s common stock for sale to the general public, as with the December 2009 offerings. Management believes that the Company has adequate liquidity to meet its obligations.
Capital Adequacy
The Company is subject to various regulatory capital requirements administered by the federal banking agencies. Failure to meet minimum capital requirements can result in certain mandatory and possible additional discretionary, supervisory actions by regulators, which, if undertaken, could have a material adverse effect on the Company’s consolidated financial condition. At December 31, 2009 the capital levels of both the Company and the Bank complied with all applicable minimum capital requirements of the Federal Reserve Board and the FDIC, respectively, and both qualified as “well-capitalized” under applicable regulation of the Federal Reserve Board and FDIC.
For additional information regarding the capital requirements applicable to the Company and the Bank and their respective capital levels at December 31, 2009, see the section entitled “Capital Resources” contained in Item 1 “Business” and note 8, “Stockholders’ Equity”, to the consolidated financial statements contained in Item 8.
Contractual Obligations and Commitments
The Company is required to make future cash payments under various contractual obligations. These obligations include the repayment of short and long-term borrowings and long-term subordinated debentures, payment of fixed-cash supplemental retirement benefits, payments under non-cancelable operating leases for various premises, and payments due under agreements to purchase goods and future services from a variety of vendors.
The Company is also party to financial instruments with off-balance sheet risk in the normal course of business to meet the financing needs of its customers. These financial instruments include commitments to originate loans, commitments to sell loans, standby letters of credit and unadvanced loans and lines of credit. The instruments involve, to varying degrees, elements of credit risk in excess of the amount recognized in the balance sheets. The contract amounts of these instruments reflect the extent of involvement the Company has in the particular classes of financial instruments.
The following table summarizes the contractual cash obligations and commitments at December 31, 2009.
|
|
|
|
|
Payments Due By Period |
|
|||||||||||
|
(Dollars in thousands) |
|
Total |
|
With-in |
|
>1 – 3 |
|
>3 – 5 |
|
After 5 |
|
|||||
|
Contractual Cash Obligations: |
|
|
|
|
|
|
|
|
|
|
|
|||||
|
FHLB borrowings |
|
$ |
23,460 |
|
$ |
22,990 |
|
$ |
— |
|
$ |
470 |
|
$ |
— |
|
|
Junior subordinated debentures |
|
10,825 |
|
— |
|
— |
|
— |
|
10,825 |
|
|||||
|
Supplemental retirement plans |
|
5,225 |
|
244 |
|
551 |
|
552 |
|
3,878 |
|
|||||
|
Operating lease obligations |
|
6,671 |
|
954 |
|
1,409 |
|
1,085 |
|
3,223 |
|
|||||
|
Vendor contracts |
|
3,021 |
|
2,131 |
|
793 |
|
97 |
|
— |
|
|||||
|
Repurchase agreements |
|
1,416 |
|
1,416 |
|
— |
|
— |
|
— |
|
|||||
|
Total contractual obligations |
|
$ |
50,618 |
|
$ |
27,735 |
|
$ |
2,753 |
|
$ |
2,204 |
|
$ |
17,926 |
|
|
|
|
|
|
Commitment Expiration – By Period |
|
|||||||||||
|
|
|
Total |
|
With-in |
|
>1 – 3 |
|
>3 – 5 |
|
After 5 |
|
|||||
|
Other Commitments: |
|
|
|
|
|
|
|
|
|
|
|
|||||
|
Unadvanced loans and lines |
|
$ |
316,140 |
|
$ |
221,910 |
|
$ |
36,350 |
|
$ |
15,657 |
|
$ |
42,223 |
|
|
Commitments to originate loans |
|
31,612 |
|
31,612 |
|
— |
|
— |
|
— |
|
|||||
|
Standby letters of credit |
|
21,019 |
|
11,610 |
|
9,316 |
|
— |
|
93 |
|
|||||
|
Commitments to originate loans for sale |
|
2,875 |
|
2,875 |
|
— |
|
— |
|
— |
|
|||||
|
Commitments to sell loans |
|
3,255 |
|
3,255 |
|
— |
|
— |
|
— |
|
|||||
|
Total commitments |
|
$ |
374,901 |
|
$ |
271,262 |
|
$ |
45,666 |
|
$ |
15,657 |
|
$ |
42,316 |
|
Investment Assets Under Management
The Company provides a wide range of investment advisory and management services. These services include brokerage services and management of equity, fixed income, balanced and strategic cash management portfolios provided through an independent third party securities brokerage firm and independent investment advisors. The market value of each of these components is affected by fluctuations in the financial markets.
Also included in the investment assets under management total are commercial sweep accounts that are invested in third party money market mutual funds.
The following table sets forth the fair market value of investment assets under management by certain categories at the dates indicated.
|
|
|
December 31, |
|
|||||||
|
(Dollars in thousands) |
|
2009 |
|
2008 |
|
2007 |
|
|||
|
Investment advisory assets |
|
$ |
421,466 |
|
$ |
345,400 |
|
$ |
443,712 |
|
|
Commercial sweep accounts |
|
11,577 |
|
94,311 |
|
129,896 |
|
|||
|
Investment assets under management |
|
$ |
433,043 |
|
$ |
439,711 |
|
$ |
573,608 |
|
Investment assets under management decreased by $6.7 million, or 2%, from December 31, 2008 to December 31, 2009. The decrease was due to declines in commercial sweep accounts of $82.7 million, partially offset by increases in investment advisory assets of $76.1 million due to market value increases in investment advisory assets, primarily in the second half of 2009, and new client acquisitions. Market values of investment advisory assets will fluctuate with the volatility in the financial markets. The commercial sweep account balance declined $82.7 million as customers migrated to more conservative investment options including our on balance sheet sweep accounts.
Results of Operations
COMPARISON OF YEARS ENDED DECEMBER 31, 2009 AND 2008
Unless otherwise indicated, the reported results are for the year ended December 31, 2009 with the “comparable year” or “prior year” being the year ended December 31, 2008.
Net Income
The Company earned net income in 2009 of $7.9 million compared to $5.5 million for 2008, an increase of 43%. Earnings per share for 2009 were $0.96 on both a basic and diluted basis, compared to $0.70 and $0.69 in the prior year, increases of 37% and 39%, respectively.
The increase in net income for the year ended December 31, 2009, when compared to the same period in 2008, was primarily due to an increase in net interest income and non-interest income, partially offset by increases in FDIC insurance premium expense and other non-interest expenses, as well as an increase in the provision for loan losses.
Net Interest Margin
Tax equivalent net interest margin increased by 5 basis points, to 4.28% for the year ended December 31, 2009, compared to 4.23% for the prior year. This increase resulted primarily from the cost of funds declining, due to an easing of competitive deposit rate pressure, at a faster rate than asset yields, especially in the latter half of the year. Interest earning asset yields declined 83 basis points, while the cost of funding declined by 91 basis points over the same period compared to the prior year.
Quarterly net interest margin was 4.42% for the three months ended December 31, 2009, compared to 4.32% and 4.24% for the quarters ended September 30, 2009 and December 31, 2008, respectively.
Rate/Volume Analysis
The following table sets forth the extent to which changes in interest rates and changes in the average balances of interest-earning assets and interest-bearing liabilities have affected interest income and expense during the years ended December 31, 2009 and 2008. For each category of interest-earning assets and interest-bearing liabilities, information is provided on changes attributable to (1) volume (change in average portfolio balance multiplied by prior year average rate); (2) interest rate (change in average interest rate multiplied by prior year average balance); and (3) rate and volume (the remaining difference).
|
|
|
December 31, |
|
||||||||||||||||||||||
|
|
|
2009 vs. 2008 |
|
2008 vs. 2007 |
|
||||||||||||||||||||
|
|
|
|
|
Increase (Decrease) due to |
|
|
|
Increase (Decrease) due to |
|
||||||||||||||||
|
(Dollars in thousands) |
|
Net |
|
Volume |
|
Rate |
|
Rate/ |
|
Net |
|
Volume |
|
Rate |
|
Rate/ |
|
||||||||
|
|
|
|
|
|
|
|
|
|
|
|
|
|
|
|
|
|
|
||||||||
|
Interest Income |
|
|
|
|
|
|
|
|
|
|
|
|
|
|
|
|
|
||||||||
|
Loans |
|
$ |
6 |
|
$ |
8,832 |
|
$ |
(7,466 |
) |
$ |
(1,360 |
) |
$ |
(1,678 |
) |
$ |
6,435 |
|
$ |
(7,370 |
) |
$ |
(743 |
) |
|
Investments (1) |
|
(1,269 |
) |
(21 |
) |
(1,261 |
) |
13 |
|
246 |
|
418 |
|
(43 |
) |
(129 |
) |
||||||||
|
Total interest earning assets |
|
(1,263 |
) |
8,811 |
|
(8,727 |
) |
(1,347 |
) |
(1,432 |
) |
6,853 |
|
(7,413 |
) |
(872 |
) |
||||||||
|
|
|
|
|
|
|
|
|
|
|
|
|
|
|
|
|
|
|
||||||||
|
Interest Expense |
|
|
|
|
|
|
|
|
|
|
|
|
|
|
|
|
|
||||||||
|
Int. chkg, savings, and money market |
|
(2,027 |
) |
1,707 |
|
(2,995 |
) |
(739 |
) |
(1,820 |
) |
272 |
|
(2,050 |
) |
(42 |
) |
||||||||
|
|
|
|
|
|
|
|
|
|
|
|
|
|
|
|
|
|
|
||||||||
|
COD’s |
|
(2,324 |
) |
852 |
|
(2,918 |
) |
(258 |
) |
371 |
|
2,027 |
|
(1,330 |
) |
(326 |
) |
||||||||
|
Brokered COD’s |
|
(1,511 |
) |
377 |
|
(1,636 |
) |
(252 |
) |
(2,302 |
) |
(1,579 |
) |
(1,083 |
) |
360 |
|
||||||||
|
Total Certificates of deposit |
|
(3,835 |
) |
1,229 |
|
(4,554 |
) |
(510 |
) |
(1,931 |
) |
448 |
|
(2,413 |
) |
34 |
|
||||||||
|
Borrowed funds |
|
(1,652 |
) |
(314 |
) |
(1,595 |
) |
257 |
|
803 |
|
2,865 |
|
(527 |
) |
(1,535 |
) |
||||||||
|
Total interest-bearing funding |
|
(7,514 |
) |
2,622 |
|
(9,144 |
) |
(992 |
) |
(2,948 |
) |
3,585 |
|
(4,990 |
) |
(1,543 |
) |
||||||||
|
|
|
|
|
|
|
|
|
|
|
|
|
|
|
|
|
|
|
||||||||
|
Change in net interest income |
|
$ |
6,251 |
|
$ |
6,189 |
|
$ |
417 |
|
$ |
(355 |
) |
$ |
1,516 |
|
$ |
3,268 |
|
$ |
(2,423 |
) |
$ |
671 |
|
(1) Investments include investment securities and short-term investments.
The table on the following page presents the Company’s average balance sheet, net interest income and average rates for the years ended December 31, 2009, 2008 and 2007.
Average Balances, Interest and Average Yields
|
|
|
Year ended December 31, 2009 |
|
Year ended December 31, 2008 |
|
Year ended December 31, 2007 |
|
||||||||||||||||||
|
(Dollars in thousands) |
|
Average |
|
Interest |
|
Average |
|
Average |
|
Interest |
|
Average |
|
Average |
|
Interest |
|
Average |
|
||||||
|
|
|
|
|
|
|
|
|
|
|
|
|
|
|
|
|
|
|
|
|
||||||
|
Assets: |
|
|
|
|
|
|
|
|
|
|
|
|
|
|
|
|
|
|
|
||||||
|
|
|
|
|
|
|
|
|
|
|
|
|
|
|
|
|
|
|
|
|
||||||
|
Loans (2) |
|
$ |
1,016,107 |
|
$ |
57,393 |
|
5.69% |
|
$ |
880,228 |
|
$ |
57,387 |
|
6.55% |
|
$ |
793,395 |
|
$ |
59,065 |
|
7.47% |
|
|
Investments(3) |
|
151,441 |
|
4,949 |
|
4.03% |
|
151,868 |
|
6,218 |
|
4.86% |
|
143,325 |
|
5,972 |
|
4.89% |
|
||||||
|
Total interest earnings assets |
|
1,167,548 |
|
62,342 |
|
5.47% |
|
1,032,096 |
|
63,605 |
|
6.30% |
|
936,720 |
|
65,037 |
|
7.08% |
|
||||||
|
|
|
|
|
|
|
|
|
|
|
|
|
|
|
|
|
|
|
|
|
||||||
|
Other assets |
|
72,981 |
|
|
|
|
|
66,431 |
|
|
|
|
|
64,285 |
|
|
|
|
|
||||||
|
|
|
|
|
|
|
|
|
|
|
|
|
|
|
|
|
|
|
|
|
||||||
|
Total assets |
|
$ |
1,240,529 |
|
|
|
|
|
$ |
1,098,527 |
|
|
|
|
|
$ |
1,001,005 |
|
|
|
|
|
|||
|
|
|
|
|
|
|
|
|
|
|
|
|
|
|
|
|
|
|
|
|
||||||
|
Liabilities and stockholders’ equity: |
|
|
|
|
|
|
|
|
|
|
|
|
|
|
|
|
|
|
|
||||||
|
|
|
|
|
|
|
|
|
|
|
|
|
|
|
|
|
|
|
|
|
||||||
|
Int chkg, savings and money market |
|
$ |
551,288 |
|
4,758 |
|
0.86 |
% |
$ |
440,418 |
|
6,785 |
|
1.54 |
% |
$ |
426,967 |
|
8,605 |
|
2.02 |
% |
|||
|
Certificates of deposit |
|
263,722 |
|
6,756 |
|
2.56 |
% |
241,124 |
|
9,080 |
|
3.77 |
% |
195,565 |
|
8,689 |
|
4.45 |
% |
||||||
|
Brokered Certificates of Deposit |
|
69,064 |
|
966 |
|
1.40 |
% |
59,929 |
|
2,477 |
|
4.13 |
% |
89,506 |
|
4,799 |
|
5.34 |
% |
||||||
|
Borrowed funds |
|
66,798 |
|
239 |
|
0.36 |
% |
79,072 |
|
1,891 |
|
2.39 |
% |
22,011 |
|
1,088 |
|
4.94 |
% |
||||||
|
Junior subordinated debentures |
|
10,825 |
|
1,177 |
|
10.88 |
% |
10,825 |
|
1,177 |
|
10.88 |
% |
10,825 |
|
1,177 |
|
10.88 |
% |
||||||
|
Total interest-bearing funding |
|
961,697 |
|
13,896 |
|
1.45 |
% |
831,368 |
|
21,410 |
|
2.58 |
% |
744,874 |
|
24,358 |
|
3.27 |
% |
||||||
|
|
|
|
|
|
|
|
|
|
|
|
|
|
|
|
|
|
|
|
|
||||||
|
Net interest rate spread (2) |
|
|
|
|
|
4.02 |
% |
|
|
|
|
3.72 |
% |
|
|
|
|
3.81 |
% |
||||||
|
|
|
|
|
|
|
|
|
|
|
|
|
|
|
|
|
|
|
|
|
||||||
|
Demand deposits |
|
172,192 |
|
— |
|
— |
|
168,140 |
|
— |
|
— |
|
165,653 |
|
— |
|
— |
|
||||||
|
Total deposits, borrowed funds and debentures |
|
1,133,889 |
|
13,896 |
|
1.23 |
% |
999,508 |
|
21,410 |
|
2.14 |
% |
910,527 |
|
24,358 |
|
2.68 |
% |
||||||
|
|
|
|
|
|
|
|
|
|
|
|
|
|
|
|
|
|
|
|
|
||||||
|
Other liabilities |
|
11,027 |
|
|
|
|
|
10,363 |
|
|
|
|
|
8,732 |
|
|
|
|
|
||||||
|
Total liabilities |
|
1,144,916 |
|
|
|
|
|
1,009,871 |
|
|
|
|
|
919,259 |
|
|
|
|
|
||||||
|
|
|
|
|
|
|
|
|
|
|
|
|
|
|
|
|
|
|
|
|
||||||
|
Stockholders’ equity |
|
95,613 |
|
|
|
|
|
88,656 |
|
|
|
|
|
81,746 |
|
|
|
|
|
||||||
|
|
|
|
|
|
|
|
|
|
|
|
|
|
|
|
|
|
|
|
|
||||||
|
Total liabilities and stockholders’ equity |
|
$ |
1,240,529 |
|
|
|
|
|
$ |
1,098,527 |
|
|
|
|
|
$ |
1,001,005 |
|
|
|
|
|
|||
|
|
|
|
|
|
|
|
|
|
|
|
|
|
|
|
|
|
|
|
|
||||||
|
Net interest income |
|
|
|
$ |
48,446 |
|
|
|
|
|
$ |
42,195 |
|
|
|
|
|
$ |
40,679 |
|
|
|
|||
|
|
|
|
|
|
|
|
|
|
|
|
|
|
|
|
|
|
|
|
|
||||||
|
Net interest margin (tax equivalent) (2) |
|
|
|
|
|
4.28 |
% |
|
|
|
|
4.23 |
% |
|
|
|
|
4.48 |
% |
||||||
(1) Average yields are presented on a tax equivalent basis. The tax equivalent effect associated with loans and investments, which was not included in the interest amount above, was $1.5 million, $1.4 million, and $1.3 million for the years ended Dec. 31, 2009, 2008 and 2007, respectively.
(2) Average loans include non-accrual loans and are net of average deferred loan fees.
(3) Average investments are presented at amortized cost and include investment securities and short-term investments.
Net Interest Income
The Company’s net interest income was $48.4 million for the year ended December 31, 2009, an increase of $6.3 million, or 15%, over the prior year. The increase was primarily due to strong loan growth.
Interest Income
Total interest income for the year ended December 31, 2009 was $62.3 million, a decrease of $1.3 million, or 2%, from the prior year. The decrease resulted primarily from the impact of an 83 basis points decrease in the average tax equivalent yield on interest earning assets, resulting primarily from decreases in The Federal Reserve’s target rates that began in September 2007, with the last decrease in the target rate in December of 2008. The majority of the decrease was offset by growth in the average balance of interest earning assets of $135.5 million, or 13% for the year ended December 31, 2009.
Interest income on loans, which accounts for the majority of interest income, was relatively flat compared to the prior period. Average loan balances increased $135.9 million, or 15%, compared to the prior year, and amounted to $1.02 billion, while the average yield on loans declined 86 basis points compared to the prior period and amounted to 5.69% for the year ended December 31, 2009.
Total investment income, which represents the remainder of interest income, amounted to $4.9 million for the year ended December 31, 2009 a decrease of $1.3 million, or 20%, compared to the prior period. The decrease resulted primarily from the impact of the 83 basis point decrease in the average yield on investments as a result of lower market interest rates. At the same time, the average balance of investments was relatively flat at $151.4 million for the year ended December 31, 2009.
Interest Expense
Total interest expense amounted to $13.9 million, a decrease of $7.5 million compared to the prior year. The decrease resulted primarily from the impact of a 91 basis point decrease in the average cost of deposits, borrowed funds and debentures, due to reductions in market rates, partially offset by the expense associated with a $134.4 million, or 13%, increase in the average balance of these funding sources.
Interest expense on interest checking, savings and money market accounts decreased $2.0 million over the comparable year. This decrease resulted from a 68 basis point decrease in the average cost of these accounts to 0.86%, partially offset by an increase in the average balance of these accounts of $110.9 million, or 25%, over the prior year. Average balance increases were due in part to commercial customers transitioning from off-balance sheet sweep products to on balance sheet sweep accounts, as well as expansion and sales efforts and consumers seeking competitive secure deposit products as alternative investment options.
Interest expense on total CDs (brokered and non-brokered) decreased $3.8 million over the prior year.
· Non-brokered CDs:
Interest expense on non-brokered CDs amounted to $6.8 million, a decrease of $2.3 million, or 26%, over the comparable period. The average cost of non-brokered CDs decreased 121 basis points, to 2.56%, for the year ended December 31, 2009 while the average balances of non-brokered CDs increased $22.6 million, or 9%, compared to the prior period.
· Brokered CDs:
Interest expense on brokered CDs amounted to $966 thousand, a decrease of $1.5 million, or 61%, compared to the same period in 2008. The average cost of brokered CDs decreased 273 basis points, to 1.40% for the year ended December 31, 2009, while average brokered CD balances increased by $9.1 million, or 15%, compared to the prior period.
Interest expense on borrowed funds, consisting primarily of FHLB borrowings and term repurchase agreements, decreased by $1.7 million over the prior year. The decrease was primarily attributed to decreases in the average cost of borrowed funds, particularly on
FHLB advances. The average balance of borrowed funds decreased by $12.3 million, as a result of deposit growth and use of brokered CDs over the period as an alternative funding source. The average cost of borrowed funds decreased 203 basis points, to 0.36%, for the year ended December 31, 2009.
The interest expense and average rate on junior subordinated debentures was $1.2 million and 10.88%, respectively, for both years ended December 31, 2009 and 2008.
The average balance of non-interest bearing demand deposits remained relatively consistent at $172.2 million and $168.1 million, and represented 16% and 18% of total average deposits for the years ended December 31, 2009 and 2008, respectively. Non-interest bearing demand deposits are an important component of the Bank’s core funding strategy.
Provision for Loan Losses
The provision for loan losses was $4.8 million and $2.5 million for the years ended December 31, 2009 and 2008, respectively. The increase over the prior year was due primarily to increases in net charge-offs and the level of non-performing loans, as well as loan growth. The provision reflects management’s estimate of the loan loss allowance necessary to support the level of credit risk inherent in the portfolio during the period.
See “Credit Risk/Asset Quality” and “Allowance for Loan Losses” under the heading, “Financial Condition”, in this Item 7 above, for further information regarding the provision for loan losses.
Non-Interest Income
Non-interest income for the year ended December 31, 2009 increased $4.2 million compared to 2008. The primary components of the increase were the other than temporary impairment charge which decreased $2.9 million in 2009 compared to 2008, and net gains on sales of investment securities, which increased $1.2 million. Non-interest income, excluding the OTTI charge and net gains on investment securities, increased $94 thousand, or 1%.
The following table sets forth the components of non-interest income and the related changes for the periods indicated.
|
|
|
Year Ended December 31, |
|
|||||||||
|
(Dollars in thousands) |
|
2009 |
|
2008 |
|
Change |
|
% Change |
|
|||
|
Deposit service fees |
|
$ |
3,881 |
|
$ |
3,805 |
|
$ |
76 |
|
2 |
% |
|
Investment advisory fees |
|
2,825 |
|
3,181 |
|
(356 |
) |
(11 |
)% |
|||
|
Net gains on sales of investment securities |
|
1,487 |
|
305 |
|
1,182 |
|
388 |
% |
|||
|
Other than temporary impairment on investment securities |
|
(797 |
) |
(3,702 |
) |
2,905 |
|
78 |
% |
|||
|
Bank-owned life insurance income |
|
630 |
|
620 |
|
10 |
|
2 |
% |
|||
|
Gains on sales of loans |
|
612 |
|
133 |
|
479 |
|
360 |
% |
|||
|
Other income |
|
1,634 |
|
1,749 |
|
(115 |
) |
7 |
% |
|||
|
|
|
|
|
|
|
|
|
|
|
|||
|
Total non-interest income |
|
$ |
10,272 |
|
$ |
6,091 |
|
$ |
4,181 |
|
69 |
% |
Declines in investment advisory fees were due to the decline in the average balances of assets under management resulting primarily from the general decline in the stock market in 2008 through the first quarter of 2009.
The $1.5 million net gains on sales of investment securities in 2009 resulted from sales of $39.5 million in investments. The net gains on sales of investment securities in 2008 primarily resulted from the $4.6 million sale of a small number of municipal securities.
The $797 thousand OTTI charge on investment securities recorded in 2009 represented a charge to earnings on certain equity investments in the investment portfolio resulting in the book value of these investments being written down to market value, primarily in the first quarter of 2009. This charge reflects the downturn in the equity markets, beginning in the fourth quarter of 2008, which also resulted in an OTTI charge in the fourth quarter of 2008 totaling $3.7 million.
Increases in net gains on sales of loans were due to the increase in volume of residential loan production due to favorable market rates in 2009.
Included in the decrease in other income were modest decreases in correspondent earnings ($223 thousand), tax credit income received in 2008 ($42 thousand) and servicing fee income ($35 thousand). These decreases were partially offset by a recovery from life insurance in December 2009 ($220 thousand).
Non-Interest Expense
Non-interest expense for the year ended December 31, 2009, increased $4.8 million, or 13%, compared to 2008. The primary components of the increase were salaries and benefits, deposit insurance premiums and occupancy and equipment expenses.
The following table sets forth the components of non-interest expense and the related changes for the periods indicated.
|
|
|
Year Ended December 31, |
|
|||||||||
|
(Dollars in thousands) |
|
2009 |
|
2008 |
|
Change |
|
% Change |
|
|||
|
Salaries and employee benefits |
|
$ |
24,418 |
|
$ |
22,454 |
|
$ |
1,964 |
|
9 |
% |
|
Occupancy and equipment expenses |
|
5,221 |
|
4,425 |
|
796 |
|
18 |
% |
|||
|
Technology and telecommunications expenses |
|
3,133 |
|
2,878 |
|
255 |
|
9 |
% |
|||
|
Audit, legal and other professional fees |
|
1,227 |
|
1,333 |
|
(106 |
) |
(8 |
)% |
|||
|
Advertising and public relations expenses |
|
1,941 |
|
1,963 |
|
(22 |
) |
(1 |
)% |
|||
|
Deposit Insurance Premiums |
|
2,161 |
|
720 |
|
1,441 |
|
200 |
% |
|||
|
Supplies and postage expenses |
|
814 |
|
858 |
|
(44 |
) |
(5 |
)% |
|||
|
Investment advisory and custodial expenses |
|
402 |
|
359 |
|
43 |
|
12 |
% |
|||
|
Other operating expenses |
|
3,391 |
|
2,894 |
|
497 |
|
17 |
% |
|||
|
|
|
|
|
|
|
|
|
|
|
|||
|
Total non-interest expense |
|
$ |
42,708 |
|
$ |
37,884 |
|
$ |
4,824 |
|
13 |
% |
The increase in salaries and benefits expense was primarily due to the personnel costs necessary to support the Company’s strategic growth initiatives, including three new branches, as well as salary adjustments since the prior period and increased expenses for performance-based incentive compensation.
Both occupancy and equipment expenses, and technology and telecommunications expenses increased due primarily to growth and expansion costs to support the Company’s strategic initiatives.
Audit, legal and other professional decreased primarily as a result of a consulting project that was completed in 2008.
Deposit insurance premiums increased due to changes in the FDIC insurance assessment rates, which applied to all insured banks. See the discussion under the heading “Deposit Insurance Assessment” contained in Item 1 Business, and under the heading “Supervision and Regulation” for further information regarding the Company’s deposit insurance assessment.
Other operating expenses increased due primarily to modest increases in security, robbery and check/card losses ($157 thousand), OREO and loan workout expense ($136 thousand), and outsourced services ($98 thousand), partially offset by a decrease in participation in external executive training ($89 thousand).
Income Tax Expense
Income tax expense for the year ended December 31, 2009 and December 31, 2008 was $3.2 million and $2.3 million, respectively. The effective tax rate for the year ended December 31, 2009 and December 31, 2008 was 28.8%, and 29.7%, respectively. The decrease in the effective tax rate was primarily due the a decrease in state tax due to the level of earnings relative to the Bank versus subsidiary security corporations, which are taxed at a lower state rate, and the impact, on the prior year rate, of a tax charge of approximately $130 thousand that was recorded in 2008, related to legislative changes
enacted in that year on future tax rates applicable to Massachusetts financial institutions.
COMPARISON OF YEARS ENDED DECEMBER 31, 2008 AND 2007
Unless otherwise indicated, the reported results are for the year ended December 31, 2008 with the “comparable year” or “prior year” being the year ended December 31, 2007.
Net Income
The Company had net income in 2008 of $5.5 million compared to $9.9 million for 2007, a decrease of 44%. Earnings per share for 2008 were $0.70 and $0.69 on a basic and diluted basis, compared to $1.27 and $1.25 in the prior year, decreases of 45% and 45%, respectively.
Net Interest Margin
Tax equivalent net interest margin decreased by 25 basis points, to 4.23% for the year ended December 31, 2008, compared to 4.48% for the prior year. Net interest margin was affected primarily by a 78 basis point decrease in the yield on interest earning assets. This resulted from the market-rate reductions that occurred since late 2007, as the Federal Reserve’s target rates declined by 500 basis points, of which 175 basis points occurred during the last quarter of 2008.
Although the decline in market rates caused asset yields to reprice downward, the Company’s strong loan growth throughout 2008 funded primarily through non-brokered deposits and lower cost FHLB borrowings, along with a 54 basis point reduction in funding costs during the year, partially offset the reduction in asset yields. The decline in funding costs, particularly in the cost of FHLB borrowings and brokered CDs, accelerated during the second half of 2008.
Net Interest Income
The Company’s net interest income was $42.2 million for the year ended December 31, 2008, an increase of $1.5 million, or 4%, over the prior year. The increase was primarily due to strong loan growth, as evidenced by an increase in average loan balances, partially offset by the margin compression discussed above. Total interest and dividend income for the 2008 period decreased by $1.4 million, while total interest expense decreased by $2.9 million over the prior year. These changes are discussed below.
Interest Income
Total interest income for the year ended December 31, 2008 was $63.6 million, a decrease of $1.4 million, or 2%, from the prior year, comprised of a decrease of $1.7 million in loan income and an increase of $246 thousand in investment income. The decrease resulted primarily from the impact of a 78 basis points decrease in the average tax equivalent yield on interest earning assets. The majority of the decrease was offset by growth in the average balance of interest earning assets of $95.4 million, or 10.2% for the year ended December 31, 2008.
Average loan balances increased $86.8 million, or 11%, compared to the prior year, and amounted to $880.2 million, and the average balance of investments increased by $8.5 million, or 6%, to $151.9 million for the year ended December 31, 2008.
The average tax equivalent yield on interest earning assets amounted to 6.30%, with tax equivalent loan yields decreasing 92 basis points to 6.55% resulting primarily from prime rate decreases that began in September 2007. The tax equivalent yield realized on investments was relatively flat decreasing only 3 basis points to 4.86%.
Interest Expense
Total interest expense amounted to $21.4 million, a decrease of $2.9 million compared to the prior year. The decrease resulted primarily from the impact of a 54 basis point decrease in the average cost of deposits, borrowed funds and debentures, in particular brokered CDs and FHLB borrowings, partially offset by an $89.0 million, or 10%, increase in the average balance of these funding sources, particularly FHLB borrowings.
Interest expense on interest checking, savings and money market accounts decreased $1.8 million over the comparable year. This decrease resulted from a 48 basis point decrease in the average cost of these accounts to 1.54%, due to lower market interest rates, partially mitigated by an increase in the average balance of these accounts by 3% over the prior year.
Interest expense on total CDs (brokered and non-brokered) decreased $1.9 million over the prior year primarily due to a decrease in market interest rates.
· Non-brokered CDs:
Interest expense on non-brokered CDs increased $372 thousand, or 4%, over the comparable year. This increase was primarily due to an increase in the average balances of $45.6 million, or 23%, partially offset by a decrease of 68 basis points in the average costs of non-brokered CDs as compared to the prior year.
· Brokered CDs:
Interest expense on brokered CDs decreased $2.3 million, or 48%, over the prior year. These average balances decreased by $29.6 million due to growth in non-brokered balances, while the average cost of brokered CDs decreased 121 basis points compared to 2007.
Interest expense on borrowed funds, consisting primarily of FHLB borrowings and term repurchase agreements, increased by $803 thousand, or 74% over the prior year. The increase was primarily attributed to the increases in average balances, partially offset by the reduction in the average cost of these borrowed funds. The average balance of borrowed funds increased by $57.1 million, as the Company continued to utilize FHLB advances as a cost effective funding alternative over the period. The average cost of borrowed funds decreased 255 basis points, to 2.39%, for the year ended December 31, 2008, due to lower market interest rates over the prior year.
The interest expense and average rate on junior subordinated debentures was $1.2 million and 10.88%, respectively, for both years ended December 31, 2008 and 2007.
The average balance of non-interest bearing demand deposits remained relatively consistent at $168.1 million and $165.7 million, and represented 18% and 19% of total average deposits for the years ended December 31, 2008 and 2007, respectively. Non-interest bearing demand deposits are an important component of the Bank’s core funding strategy.
Provision for Loan Losses
The provision for loan losses was $2.5 million and $1.0 million for the years ended December 31, 2008 and 2007, respectively. The increase in the provision was due primarily to loan growth and an increase in net charge-offs. The provision reflects management’s estimate of the loan loss allowance necessary to support the level of credit risk inherent in the portfolio during the period.
See “Credit Risk/Asset Quality” and “Allowance for Loan Losses” under the heading, “Financial Condition”, in this Item 7 above, for further information regarding the provision for loan losses.
Non-Interest Income
Non-interest income for the year ended December 31, 2008 decreased $4.0 million compared to 2007. The primary components of the decrease were the OTTI charge related to certain equity investments and lower levels of net gains on sales of investment securities in 2008 compared to 2007. Non-interest income, excluding the OTTI charge and net gains on investment securities, increased $1.0 million, or 12%, over the prior year, primarily as a result of increased deposit service fees.
The following table sets forth the components of non-interest income and the related changes for the periods indicated.
|
|
|
Year Ended December 31, |
|
|||||||||
|
(Dollars in thousands) |
|
2008 |
|
2007 |
|
Change |
|
% Change |
|
|||
|
Investment advisory fees |
|
$ |
3,181 |
|
$ |
3,177 |
|
$ |
4 |
|
0.13 |
% |
|
Deposit service fees |
|
3,805 |
|
2,848 |
|
957 |
|
34 |
% |
|||
|
Bank-owned life insurance income |
|
620 |
|
602 |
|
18 |
|
3 |
% |
|||
|
OTTI on investment securities |
|
(3,702 |
) |
— |
|
(3,702 |
) |
(100 |
)% |
|||
|
Net gains on sales of investment securities |
|
305 |
|
1,655 |
|
(1,350 |
) |
(82 |
)% |
|||
|
Gains on sales of loans |
|
133 |
|
201 |
|
(68 |
) |
(34 |
)% |
|||
|
Other income |
|
1,749 |
|
1,625 |
|
124 |
|
8 |
% |
|||
|
|
|
|
|
|
|
|
|
|
|
|||
|
Total non-interest income |
|
$ |
6,091 |
|
$ |
10,108 |
|
$ |
(4,017 |
) |
(40 |
)% |
The increase in deposit-service fees resulted primarily from increased service charge income on commercial deposit accounts attributed to lower earnings credit rates paid during 2008 and increased overdraft fees earned. The earnings credit rate (based on market rates) allows customers to accrue credits on monthly deposit balances. The credits are then applied to offset service charges.
The OTTI charge on investment securities recorded in 2008 represented a charge to earnings on certain equity investments in the investment portfolio. This charge reflected the fourth quarter downturn in the equity markets resulting in the book value of these investments being written down to market value as of December 31, 2008.
The net gains on sales of investment securities in 2008 primarily resulted from the $4.6 million sale of a small number of municipal securities. The net gains on sales of investment securities in 2007 resulted from sales of $9.9 million, primarily in the equities portfolio.
Included in the increase in other income were modest increases in loan fee income, insurance commissions, and rental income. These increases were partially offset by a reduction in the earning credits received on balances related to official check sales and a reduction in tax credit income.
Non-Interest Expense
Non-interest expense for the year ended December 31, 2008, increased $3.0 million, or 9%, compared to 2007. The primary components of the increase were salaries and benefits, deposit insurance premiums and advertising and public relations.
The following table sets forth the components of non-interest expense and the related changes for the periods indicated.
|
|
|
Year Ended December 31, |
|
|||||||||
|
(Dollars in thousands) |
|
2008 |
|
2007 |
|
Change |
|
% Change |
|
|||
|
Salaries and employee benefits |
|
$ |
22,454 |
|
$ |
21,044 |
|
$ |
1,410 |
|
7 |
% |
|
Occupancy and equipment expenses |
|
4,425 |
|
4,267 |
|
158 |
|
4 |
% |
|||
|
Technology and telecommunications expenses |
|
2,878 |
|
2,790 |
|
88 |
|
3 |
% |
|||
|
Audit, legal and other professional fees |
|
1,333 |
|
1,415 |
|
(82 |
) |
(6 |
)% |
|||
|
Advertising and public relations expenses |
|
1,963 |
|
1,389 |
|
574 |
|
41 |
% |
|||
|
Deposit Insurance Premiums |
|
720 |
|
104 |
|
616 |
|
592 |
% |
|||
|
Supplies and postage expenses |
|
858 |
|
832 |
|
26 |
|
3 |
% |
|||
|
Investment advisory and custodial expenses |
|
359 |
|
498 |
|
(139 |
) |
(28 |
)% |
|||
|
Other operating expenses |
|
2,894 |
|
2,505 |
|
389 |
|
16 |
% |
|||
|
|
|
|
|
|
|
|
|
|
|
|||
|
Total non-interest expense |
|
$ |
37,884 |
|
$ |
34,844 |
|
$ |
3,040 |
|
9 |
% |
The increase in salaries and benefits expense primarily resulted from staffing increases necessary to support the Company’s strategic growth initiatives, salary adjustments and
corresponding increases in benefit costs and taxes, partially offset by a reduction in performance-based incentive compensation.
Occupancy and equipment expenses increased primarily due to ongoing increases in maintenance and service costs, utilities and facility expansion necessary to support the Company’s growth and strategic initiatives, partially offset by a reduction in rent due to the purchase of the Bank’s operations/lending center in 2007.
The increase in advertising and public relations primarily resulting from expenses for the Company’s First Annual Celebration of Excellence which recognized local entrepreneurs, businesses and community leaders, a special contribution to a local charity in preparation of the Bank’s 20th anniversary, and increased advertising costs to support the Company’s expansion and business development efforts.
Deposit insurance premiums increased due to changes in the FDIC insurance assessment rates, related to 2005 legislation which applied to all insured banks. See the discussion under the heading “Deposit Insurance Assessment” contained in Item 1 Business, under the heading “Supervision and Regulation” for further information regarding the Company’s deposit insurance assessment.
Investment advisory and custodial expenses decreased due primarily to a reduction in third party manager fees and reductions in market values of assets under management.
Other operating expenses increased due primarily to modest increases in correspondent bank charges, loan workout expense and employee training and development costs.
Income Tax Expense
Income tax expense for the year ended December 31, 2008 and December 31, 2007 was $2.3 million and $5.0 million, respectively. The effective tax rate for the year ended December 31, 2008 and December 31, 2007 was 29.7%, and 33.8%, respectively. The decrease in the effective tax rate was primarily due to lower earnings, the increased impact of non-taxable income from certain tax-exempt assets and a reduction in state income taxes as a result of the Company’s two security corporations that were formed in the fourth quarter of 2007. During the third quarter, a tax charge of approximately $130 thousand was recorded related to legislative changes in future tax rates applicable to Massachusetts financial institutions.
Recent Accounting Pronouncements
In June 2009, the FASB amended the consolidation guidance applicable to variable interest entities (VIEs) in FASB Accounting Standards Codification (“ASC”) Topic 810 “Consolidation” by eliminating exceptions to consolidating qualifying special-purpose entities, changing the approach to determining a VIE’s primary beneficiary, and requiring a company to more frequently reassess whether VIEs must be consolidated. This amended guidance is effective as of the beginning for the first annual periods that begin after November 15, 2009 (that is January 1, 2010 for the Company) and for subsequent interim and annual periods thereafter. The implementation of this guidance is not expected to have a material impact on the Company’s financial position or results of operations.
In June 2009, the FASB amended ASC Topic 860 “Accounting for Transfers and Servicing of Financial Assets and Extinguishments of Liabilities” to address certain practices that have developed that the FASB determined are not consistent with the original intent and key requirement of the prior guidance, and to address concerns that financial assets that have been derecognized should continue to be reported in the financial statements of the transferors. The new guidance is intended to improve the information that a reporting entity provides in its financial reports about the transfer of financial assets; the effects of a transfer on its financial position, financial performance, and cash flows. The appropriateness of derecognition is evaluated based on whether or not the transferor has surrendered control of the transferred assets. The evaluation must consider any continuing involvement by the transferor in the financial assets. New disclosure requirements must be applied to transfers that occurred both before and after the effective date of this new guidance, which is effective for the first interim and annual periods that begin after November 15, 2009 and for interim and annual periods thereafter.
Earlier application is prohibited. The implementation of this guidance is not expected to have a material impact on the Company’s financial position or results of operations.
In May 2009, the FASB issued ASC Subtopic 855-10 “Subsequent Events” to provide new guidance on management’s assessment of subsequent events, clarifying that management must evaluate, as of each reporting period, events or transactions that occur after the balance sheet date through the date that the financial statements are issued or are available to be issued. This guidance was effective for the Company beginning in the second quarter of 2009. The adoption of this guidance did not have any impact on the Company’s consolidated financial statements.
Impact of Inflation and Changing Prices
The Company’s asset and liability structure is substantially different from that of an industrial company in that virtually all assets and liabilities of the Company are monetary in nature. Management believes the impact of inflation on financial results depends upon the Company’s ability to react to changes in interest rates and by such reaction, reduce the inflationary impact on performance. Interest rates do not necessarily move in the same direction, or at the same magnitude, as the prices of other goods and services. As discussed previously, management seeks to manage the relationship between interest-sensitive assets and liabilities in order to protect against wide net interest income fluctuations, including those resulting from inflation.
Various information shown elsewhere in this annual report will assist in the understanding of how well the Company is positioned to react to changing interest rates and inflationary trends. In particular additional information related to the net interest margin sensitivity analysis is contained in Item 7A and other maturity and repricing information of the Company’s investment securities, certificates of deposits and borrowed funds is contained in Item 7, “Management’s Discussion and Analysis of Financial Condition and Results of Operations” under the heading “Financial Condition” in this report.
Item 7A. Quantitative and Qualitative Disclosures About Market Risk
Interest Margin Sensitivity Analysis
The Company’s primary market risk is interest rate risk and interest rate risk management is centered on the Company’s Asset-Liability Committee (“the committee”). The committee is comprised of six outside directors of the Company and three executive officers of the Company, who are also members of the Board of Directors. In addition, several directors who are not on the committee rotate in on a regular basis. Annually, the committee approves the Company’s asset-liability management policy, which provides management with guidelines for controlling interest rate risk, as measured through net interest income sensitivity to changes in interest rates, within certain tolerance levels. The committee also establishes and monitors guidelines for the Company’s liquidity and capital ratios.
The asset-liability management strategies are reviewed on a periodic basis by management and presented and discussed with the committee on at least a quarterly basis. The asset-liability management strategies and guidelines are revised based on changes in interest rate levels, general economic conditions, competition in the marketplace, the current interest rate risk position of the Company, anticipated growth and other factors.
One of the principal factors in maintaining planned levels of net interest income is the ability to design effective strategies to manage the impact of interest rate changes on future net interest income. Quarterly, management completes a net interest income sensitivity analysis, which is presented to the committee. This analysis includes a simulation of the Company’s net interest income under various interest rate scenarios. Variations in the interest rate environment affect numerous factors, including prepayment speeds, reinvestment rates, maturities of investments (due to call provisions), and interest rates on various asset and liability accounts.
The Company can be subject to margin compression depending on the economic environment and the shape of the yield curve. Under the Company’s current balance sheet position, the
Company’s net interest margin generally performs slightly better over time in a rising rate environment and a parallel yield curve shift, while it generally decreases when the yield curve is flattening, inverting or declining.
Under a flattening yield curve scenario, margin compression occurs as the spread between the cost of funding and the yield on interest earning assets narrows. Under this scenario the degree of margin compression is highly dependent on the Company’s ability to fund asset growth through lower cost deposits. However, if the curve is flattening, while short-term rates are rising, the adverse impact on margin may be somewhat delayed, as increases in the prime rate will initially result in the Company’s asset yields re-pricing more quickly than funding costs.
Under an inverted yield curve situation, shorter-term rates exceed longer-term rates, and the impact on margin is similar but more adverse than the flat curve scenario. Again, however, the extent of the impact on margin is highly dependent on the Company’s balance sheet mix.
Under a declining yield curve scenario, margin compression will eventually occur as the yield on interest earning assets decreases more rapidly than decreases in funding costs. The primary causes would be the impact of interest rate decreases (including decreases in the prime rate) on adjustable rate loans and the fact that decreases in deposit rates may be limited or lag decreases in the prime rate.
During the first quarter of 2009, the Company continued to experience the effects of a declining yield curve scenario as the Federal Reserve Board reduced its Fed Funds Target rate late in the fourth quarter of 2008 to a range of 0.0% to 0.25% due to the economic environment. This resulted in margin compression during the first quarter as rates on earning assets repriced downward, while rates on borrowings and deposits declined at a slower pace due to market conditions. The net interest margin stabilized during the second quarter of 2009 and improved during the second half of 2009.
At December 31, 2009, management continues to consider the Company’s primary interest rate risk exposure to be margin compression that may result from changes in interest rates and/or changes in the mix of the Company’s balance sheet components. Specifically, these components include fixed versus variable rate loans and investments on the asset side, and higher cost deposits and borrowings versus lower cost deposits on the liability side.
The following table summarizes the projected cumulative net interest income for a 24-month period as of December 31, 2009, assuming a parallel yield curve shift and gradual interest rate changes applied over the first twelve months.
|
|
|
December 31, 2009 |
|
||||
|
(Dollars in thousands) |
|
Rates |
|
Rates Rise |
|
||
|
Interest Earning Assets: |
|
|
|
|
|
||
|
Loans |
|
$ |
117,995 |
|
$ |
129,157 |
|
|
Collateralized mortgage obligations and other mortgage backed securities |
|
2,743 |
|
2,936 |
|
||
|
Other investments |
|
5,235 |
|
5,947 |
|
||
|
Total interest income |
|
125,973 |
|
138,040 |
|
||
|
|
|
|
|
|
|
||
|
Interest Earning Liabilities: |
|
|
|
|
|
||
|
Certificates of deposit |
|
9,141 |
|
14,125 |
|
||
|
Interest bearing checking, money market, savings |
|
8,552 |
|
13,547 |
|
||
|
Borrowed funds |
|
187 |
|
877 |
|
||
|
Junior subordinated debentures |
|
2,356 |
|
2,356 |
|
||
|
Total interest expense |
|
20,236 |
|
30,905 |
|
||
|
|
|
|
|
|
|
||
|
Net interest income |
|
$ |
105,737 |
|
$ |
107,135 |
|
Item 8. Financial Statements and Supplementary Data
Index to Consolidated Financial Statements
ENTERPRISE BANCORP, INC.
|
|
|
December 31, |
|
December 31, |
|
||
|
(Dollars in thousands) |
|
2009 |
|
2008 |
|
||
|
Assets |
|
|
|
|
|
||
|
Cash and cash equivalents: |
|
|
|
|
|
||
|
Cash and due from banks |
|
$ |
25,851 |
|
$ |
21,479 |
|
|
Short-term investments |
|
6,759 |
|
3,797 |
|
||
|
Total cash and cash equivalents |
|
32,610 |
|
25,276 |
|
||
|
|
|
|
|
|
|
||
|
Investment securities |
|
139,109 |
|
159,373 |
|
||
|
Loans, less allowance for loan losses of $18,218 and $15,269 at December 31, 2009 and 2008, respectively |
|
1,064,612 |
|
933,372 |
|
||
|
Premises and equipment |
|
22,924 |
|
21,651 |
|
||
|
Accrued interest receivable |
|
5,368 |
|
5,357 |
|
||
|
Deferred income taxes, net |
|
10,345 |
|
9,349 |
|
||
|
Bank-owned life insurance |
|
13,835 |
|
13,290 |
|
||
|
Prepaid income taxes |
|
— |
|
1,034 |
|
||
|
Prepaid expenses and other assets |
|
9,466 |
|
5,910 |
|
||
|
Core deposit intangible, net of amortization |
|
76 |
|
209 |
|
||
|
Goodwill |
|
5,656 |
|
5,656 |
|
||
|
|
|
|
|
|
|
||
|
Total assets |
|
$ |
1,304,001 |
|
$ |
1,180,477 |
|
|
|
|
|
|
|
|
||
|
Liabilities and Stockholders’ Equity |
|
|
|
|
|
||
|
|
|
|
|
|
|
||
|
Liabilities |
|
|
|
|
|
||
|
Deposits |
|
$ |
1,144,948 |
|
$ |
947,903 |
|
|
Borrowed funds |
|
24,876 |
|
121,250 |
|
||
|
Junior subordinated debentures |
|
10,825 |
|
10,825 |
|
||
|
Accrued expenses and other liabilities |
|
14,270 |
|
7,546 |
|
||
|
Income taxes payable |
|
98 |
|
— |
|
||
|
Accrued interest payable |
|
1,320 |
|
1,849 |
|
||
|
|
|
|
|
|
|
||
|
Total liabilities |
|
1,196,337 |
|
1,089,373 |
|
||
|
|
|
|
|
|
|
||
|
Commitments and Contingencies |
|
|
|
|
|
||
|
|
|
|
|
|
|
||
|
Stockholders’ Equity |
|
|
|
|
|
||
|
Preferred stock, $0.01 par value per share; 1,000,000 shares authorized; no shares issued |
|
— |
|
— |
|
||
|
Common stock $0.01 par value per share; 20,000,000 shares authorized; 9,090,518 and, 8,025,239 shares issued and outstanding at December 31, 2009 and December 31, 2008, respectively |
|
91 |
|
80 |
|
||
|
Additional paid-in capital |
|
40,453 |
|
29,698 |
|
||
|
Retained earnings |
|
65,042 |
|
60,200 |
|
||
|
Accumulated other comprehensive income |
|
2,078 |
|
1,126 |
|
||
|
|
|
|
|
|
|
||
|
Total stockholders’ equity |
|
107,664 |
|
91,104 |
|
||
|
|
|
|
|
|
|
||
|
Total liabilities and stockholders’ equity |
|
$ |
1,304,001 |
|
$ |
1,180,477 |
|
See accompanying notes to consolidated financial statements.
ENTERPRISE BANCORP, INC.
Consolidated Statements of Income
Years Ended December 31,
|
(Dollars in thousands, except per share data) |
|
2009 |
|
2008 |
|
2007 |
|
|||
|
Interest and dividend income: |
|
|
|
|
|
|
|
|||
|
Loans |
|
$ |
57,393 |
|
$ |
57,387 |
|
$ |
59,065 |
|
|
Investment securities |
|
4,853 |
|
6,022 |
|
5,671 |
|
|||
|
Total short-term investments |
|
96 |
|
196 |
|
301 |
|
|||
|
Total interest and dividend income |
|
62,342 |
|
63,605 |
|
65,037 |
|
|||
|
|
|
|
|
|
|
|
|
|||
|
Interest expense: |
|
|
|
|
|
|
|
|||
|
Deposits |
|
12,480 |
|
18,342 |
|
22,093 |
|
|||
|
Borrowed funds |
|
239 |
|
1,891 |
|
1,088 |
|
|||
|
Junior subordinated debentures |
|
1,177 |
|
1,177 |
|
1,177 |
|
|||
|
Total interest expense |
|
13,896 |
|
21,410 |
|
24,358 |
|
|||
|
|
|
|
|
|
|
|
|
|||
|
Net interest income |
|
48,446 |
|
42,195 |
|
40,679 |
|
|||
|
|
|
|
|
|
|
|
|
|||
|
Provision for loan losses |
|
4,846 |
|
2,505 |
|
1,000 |
|
|||
|
Net interest income after provision for loan losses |
|
43,600 |
|
39,690 |
|
39,679 |
|
|||
|
|
|
|
|
|
|
|
|
|||
|
Non-interest income: |
|
|
|
|
|
|
|
|||
|
Investment advisory fees |
|
2,825 |
|
3,181 |
|
3,177 |
|
|||
|
Deposit service fees |
|
3,881 |
|
3,805 |
|
2,848 |
|
|||
|
Income on bank-owned life insurance |
|
630 |
|
620 |
|
602 |
|
|||
|
Other-than-temporary impairment on investment securities |
|
(797 |
) |
(3,702 |
) |
— |
|
|||
|
Net gains on sales of investment securities |
|
1,487 |
|
305 |
|
1,655 |
|
|||
|
Gains on sales of loans |
|
612 |
|
133 |
|
201 |
|
|||
|
Other income |
|
1,634 |
|
1,749 |
|
1,625 |
|
|||
|
Total non-interest income |
|
10,272 |
|
6,091 |
|
10,108 |
|
|||
|
|
|
|
|
|
|
|
|
|||
|
Non-interest expense: |
|
|
|
|
|
|
|
|||
|
Salaries and employee benefits |
|
24,418 |
|
22,454 |
|
21,044 |
|
|||
|
Occupancy and equipment expenses |
|
5,221 |
|
4,425 |
|
4,267 |
|
|||
|
Technology and telecommunications expenses |
|
3,133 |
|
2,878 |
|
2,790 |
|
|||
|
Audit, legal and other professional fees |
|
1,227 |
|
1,333 |
|
1,415 |
|
|||
|
Advertising and public relations expenses |
|
1,941 |
|
1,963 |
|
1,389 |
|
|||
|
Deposit insurance premiums |
|
2,161 |
|
720 |
|
104 |
|
|||
|
Supplies and postage expenses |
|
814 |
|
858 |
|
832 |
|
|||
|
Investment advisory and custodial expenses |
|
402 |
|
359 |
|
498 |
|
|||
|
Other operating expenses |
|
3,391 |
|
2,894 |
|
2,505 |
|
|||
|
Total non-interest expense |
|
42,708 |
|
37,884 |
|
34,844 |
|
|||
|
|
|
|
|
|
|
|
|
|||
|
Income before income taxes |
|
11,164 |
|
7,897 |
|
14,943 |
|
|||
|
Provision for income taxes |
|
3,218 |
|
2,349 |
|
5,045 |
|
|||
|
|
|
|
|
|
|
|
|
|||
|
Net income |
|
$ |
7,946 |
|
$ |
5,548 |
|
$ |
9,898 |
|
|
|
|
|
|
|
|
|
|
|||
|
Basic earnings per share |
|
$ |
0.96 |
|
$ |
0.70 |
|
$ |
1.27 |
|
|
|
|
|
|
|
|
|
|
|||
|
Diluted earnings per share |
|
$ |
0.96 |
|
$ |
0.69 |
|
$ |
1.25 |
|
|
|
|
|
|
|
|
|
|
|||
|
Basic weighted average common shares outstanding |
|
8,268,502 |
|
7,973,527 |
|
7,819,160 |
|
|||
|
|
|
|
|
|
|
|
|
|||
|
Diluted weighted average common shares outstanding |
|
8,279,126 |
|
8,005,535 |
|
7,913,006 |
|
|||
See accompanying notes to consolidated financial statements.
ENTERPRISE BANCORP, INC.
Consolidated Statements of Changes in Stockholders’ Equity
Years Ended December 31, 2009, 2008 and 2007
|
|
|
Common Stock |
|
Additional |
|
Retained |
|
Comprehensive |
|
Accumulated |
|
Total |
|
||||||||
|
(Dollars in thousands) |
|
Shares |
|
Amount |
|
Capital |
|
Earnings |
|
Income/(Loss) |
|
Income/(Loss) |
|
Equity |
|
||||||
|
Balance at December 31, 2006 |
|
7,722,288 |
|
$ |
77 |
|
$ |
25,806 |
|
$ |
51,127 |
|
|
|
$ |
33 |
|
$ |
77,043 |
|
|
|
Comprehensive income |
|
|
|
|
|
|
|
|
|
|
|
|
|
|
|
||||||
|
Net Income |
|
|
|
|
|
|
|
9,898 |
|
$ |
9,898 |
|
|
|
9,898 |
|
|||||
|
Other comprehensive income, net |
|
|
|
|
|
|
|
|
|
322 |
|
322 |
|
322 |
|
||||||
|
Total comprehensive income |
|
|
|
|
|
|
|
|
|
$ |
10,220 |
|
|
|
|
|
|||||
|
Tax benefit from exercise of stock options |
|
|
|
|
|
16 |
|
|
|
|
|
|
|
16 |
|
||||||
|
Common stock dividend paid ($0.32 per share) |
|
|
|
|
|
|
|
(2,498 |
) |
|
|
|
|
(2,498 |
) |
||||||
|
Common stock issued under dividend reinvestment plan |
|
70,675 |
|
1 |
|
1,057 |
|
|
|
|
|
|
|
1,058 |
|
||||||
|
Stock-based compensation |
|
10,575 |
|
— |
|
575 |
|
|
|
|
|
|
|
575 |
|
||||||
|
Stock options exercised |
|
109,177 |
|
1 |
|
597 |
|
|
|
|
|
|
|
598 |
|
||||||
|
Balance at December 31, 2007 |
|
7,912,715 |
|
$ |
79 |
|
$ |
28,051 |
|
$ |
58,527 |
|
|
|
$ |
355 |
|
$ |
87,012 |
|
|
|
Cumulative-effect adjustment for adoption of new accounting principle (post retirement obligation) |
|
|
|
|
|
|
|
(1,010 |
) |
|
|
|
|
(1,010 |
) |
||||||
|
Comprehensive income |
|
|
|
|
|
|
|
|
|
|
|
|
|
|
|
||||||
|
Net Income |
|
|
|
|
|
|
|
5,548 |
|
$ |
5,548 |
|
|
|
5,548 |
|
|||||
|
Other comprehensive income, net |
|
|
|
|
|
|
|
|
|
771 |
|
771 |
|
771 |
|
||||||
|
Total comprehensive income |
|
|
|
|
|
|
|
|
|
$ |
6,319 |
|
|
|
|
|
|||||
|
Tax benefit from exercise of stock options |
|
|
|
|
|
4 |
|
|
|
|
|
|
|
4 |
|
||||||
|
Common stock dividend paid ($0.36 per share) |
|
|
|
|
|
|
|
(2,865 |
) |
|
|
|
|
(2,865 |
) |
||||||
|
Common stock issued under dividend reinvestment plan |
|
85,586 |
|
1 |
|
1,008 |
|
|
|
|
|
|
|
1,009 |
|
||||||
|
Stock-based compensation |
|
10,739 |
|
— |
|
516 |
|
|
|
|
|
|
|
516 |
|
||||||
|
Stock options exercised |
|
16,199 |
|
— |
|
119 |
|
|
|
|
|
|
|
119 |
|
||||||
|
Balance at December 31, 2008 |
|
8,025,239 |
|
$ |
80 |
|
$ |
29,698 |
|
$ |
60,200 |
|
|
|
$ |
1,126 |
|
$ |
91,104 |
|
|
|
|
|
|
|
|
|
|
|
|
|
|
|
|
|
|
|
||||||
|
Comprehensive income |
|
|
|
|
|
|
|
|
|
|
|
|
|
|
|
||||||
|
Net Income |
|
|
|
|
|
|
|
7,946 |
|
$ |
7,946 |
|
|
|
7,946 |
|
|||||
|
Other comprehensive income, net |
|
|
|
|
|
|
|
|
|
952 |
|
952 |
|
952 |
|
||||||
|
Total comprehensive income |
|
|
|
|
|
|
|
|
|
$ |
8,898 |
|
|
|
|
|
|||||
|
Tax benefit from exercise of stock options |
|
|
|
|
|
13 |
|
|
|
|
|
|
|
13 |
|
||||||
|
Common stock dividend paid ($0.36 per share) |
|
|
|
|
|
|
|
(3,104 |
) |
|
|
|
|
(3,104 |
) |
||||||
|
Common stock issued |
|
920,116 |
|
10 |
|
9,837 |
|
|
|
|
|
|
|
9,847 |
|
||||||
|
Stock-based compensation |
|
96,063 |
|
1 |
|
683 |
|
|
|
|
|
|
|
684 |
|
||||||
|
Stock options exercised |
|
49,100 |
|
— |
|
222 |
|
|
|
|
|
|
|
222 |
|
||||||
|
Balance at December 31, 2009 |
|
9,090,518 |
|
$ |
91 |
|
$ |
40,453 |
|
$ |
65,042 |
|
|
|
$ |
2,078 |
|
$ |
107,664 |
|
|
See accompanying notes to consolidated financial statements.
ENTERPRISE BANCORP, INC.
Consolidated Statements of Cash Flows
Years Ended December 31, 2009, 2008 and 2007
|
(Dollars in thousands) |
|
2009 |
|
2008 |
|
2007 |
|
||||
|
Cash flows from operating activities: |
|
|
|
|
|
|
|
||||
|
Net income |
|
$ |
7,946 |
|
$ |
5,548 |
|
$ |
9,898 |
|
|
|
Adjustments to reconcile net income to net cash provided by operating activities: |
|
|
|
|
|
|
|
||||
|
Provision for loan losses |
|
4,846 |
|
2,505 |
|
1,000 |
|
||||
|
Depreciation and amortization |
|
3,249 |
|
2,504 |
|
2,490 |
|
||||
|
Amortization of intangible assets |
|
133 |
|
133 |
|
133 |
|
||||
|
Stock-based compensation expense |
|
707 |
|
519 |
|
573 |
|
||||
|
Mortgage loans originated for sale |
|
(56,501 |
) |
(15,985 |
) |
(20,496 |
) |
||||
|
Proceeds from mortgage loans sold |
|
58,331 |
|
14,790 |
|
20,978 |
|
||||
|
Gains on sales of loans |
|
(612 |
) |
(133 |
) |
(201 |
) |
||||
|
Gains on sales of REO |
|
— |
|
(27 |
) |
— |
|
||||
|
Net gains on sales of investments |
|
(1,487 |
) |
(305 |
) |
(1,655 |
) |
||||
|
Other-than-temporary-impairment of investment securities |
|
797 |
|
3,702 |
|
— |
|
||||
|
Income on bank-owned life insurance, net of costs |
|
(545 |
) |
(554 |
) |
(548 |
) |
||||
|
(Increase) decrease in: |
|
|
|
|
|
|
|
||||
|
Accrued interest receivable |
|
(11 |
) |
420 |
|
(313 |
) |
||||
|
Prepaid expenses and other assets |
|
(1,754 |
) |
802 |
|
(3,528 |
) |
||||
|
Deferred income taxes |
|
(1,536 |
) |
(2,122 |
) |
(1,084 |
) |
||||
|
Increase (decrease) in: |
|
|
|
|
|
|
|
||||
|
Accrued expenses and other liabilities |
|
6,799 |
|
330 |
|
(362 |
) |
||||
|
Accrued interest payable |
|
(529 |
) |
(1,520 |
) |
1,264 |
|
||||
|
Net cash provided by operating activities |
|
19,833 |
|
10,607 |
|
8,149 |
|
||||
|
Cash flows from investing activities: |
|
|
|
|
|
|
|
||||
|
Proceeds from sales of investment securities |
|
40,989 |
|
4,913 |
|
11,562 |
|
||||
|
Proceeds from maturities, calls and pay-downs of investment securities |
|
52,825 |
|
31,768 |
|
15,872 |
|
||||
|
Purchase of investment securities |
|
(71,463 |
) |
(52,509 |
) |
(39,235 |
) |
||||
|
Purchase of tax credits |
|
— |
|
— |
|
(1,735 |
) |
||||
|
Net increase in loans |
|
(138,364 |
) |
(114,730 |
) |
(73,648 |
) |
||||
|
Additions to premises and equipment, net |
|
(4,427 |
) |
(5,060 |
) |
(5,920 |
) |
||||
|
Proceeds from REO sales and payments |
|
632 |
|
364 |
|
— |
|
||||
|
Purchase of REO |
|
(340 |
) |
|
|
|
|
||||
|
Net withdrawals/(purchases) of bank-owned life insurance |
|
— |
|
— |
|
24 |
|
||||
|
Net cash used in investing activities |
|
(120,148 |
) |
(135,254 |
) |
(93,080 |
) |
||||
|
Cash flows from financing activities: |
|
|
|
|
|
|
|
||||
|
Net increase in deposits |
|
197,045 |
|
79,117 |
|
1,264 |
|
||||
|
Net increase (decrease) in borrowed funds |
|
(96,374 |
) |
39,821 |
|
66,324 |
|
||||
|
Cash dividends paid |
|
(3,104 |
) |
(2,865 |
) |
(2,498 |
) |
||||
|
Proceeds from issuance of common stock |
|
9,847 |
|
1,009 |
|
1,058 |
|
||||
|
Proceeds from exercise of stock options |
|
222 |
|
119 |
|
598 |
|
||||
|
Tax benefit from exercise of stock options |
|
13 |
|
4 |
|
16 |
|
||||
|
Net cash provided by financing activities |
|
107,649 |
|
117,205 |
|
66,762 |
|
||||
|
|
|
|
|
|
|
|
|
||||
|
Net increase (decrease) in cash and cash equivalents |
|
7,334 |
|
(7,442 |
) |
(18,169 |
) |
||||
|
Cash and cash equivalents at beginning of year |
|
25,276 |
|
32,718 |
|
50,887 |
|
||||
|
|
|
|
|
|
|
|
|
||||
|
Cash and cash equivalents at end of year |
|
$ |
32,610 |
|
$ |
25,276 |
|
$ |
32,718 |
|
|
|
|
|
|
|
|
|
|
|
||||
|
Supplemental financial data: |
|
|
|
|
|
|
|
||||
|
Cash Paid For: |
Interest |
|
$ |
14,425 |
|
$ |
22,930 |
|
$ |
23,094 |
|
|
|
Income taxes |
|
4,019 |
|
4,830 |
|
5,013 |
|
|||
|
Supplemental schedule of non-cash investing activity: |
|
|
|
|
|
|
|
||||
|
Transfer from loans to other real estate owned |
|
1,060 |
|
455 |
|
266 |
|
||||
See accompanying notes to consolidated financial statements.
ENTERPRISE BANCORP, INC.
Notes to Consolidated Financial Statements
(1) Summary of Significant Accounting Policies
(a) Basis of Presentation
The consolidated financial statements of Enterprise Bancorp, Inc. (the “Company” or “Enterprise”) include the accounts of the Company and its wholly owned subsidiary Enterprise Bank and Trust Company (the “Bank”). The Bank is a Massachusetts trust company organized in 1989. Substantially all of the Company’s operations are conducted through the Bank.
The Bank has five wholly owned subsidiaries. The Bank’s subsidiaries include Enterprise Insurance Services, LLC and Enterprise Investment Services, LLC, organized for the purposes of engaging in insurance sales activities and offering non-deposit investment products and services, respectively. In addition, the Bank has three subsidiary security corporations (Enterprise Security Corporation, Enterprise Security Corporation II, and Enterprise Security Corporation III), which hold various types of qualifying securities. The security corporations are limited to conducting securities investment activities that the Bank itself would be allowed to conduct under applicable laws.
Through the Bank and its subsidiaries, the Company offers a range of commercial and consumer loan products, deposit and cash management products, investment advisory and management, trust and insurance services. The services offered through the Bank and subsidiaries are managed as one strategic unit and represent the Company’s only reportable operating segment.
The Federal Deposit Insurance Corporation (“FDIC’) and the Massachusetts Commissioner of Banks (the “Commissioner”) have regulatory authority over the Bank. The Bank is also subject to certain regulatory requirements of the Board of Governors of the Federal Reserve System (the “Federal Reserve Board”) and, with respect to its New Hampshire branch operations, the New Hampshire Banking Department.
The business and operations of the Company are subject to the regulatory oversight of the Federal Reserve Board. The Commissioner also retains supervisory jurisdiction over the Company.
In preparing the financial statements in conformity with U.S. generally accepted accounting principles, management is required to exercise judgment in determining many of the methodologies, estimates and assumptions to be utilized. These estimates and assumptions affect the reported values of assets and liabilities at the balance sheet date and income and expenses for the years then ended. As future events and their effects cannot be determined with precision, actual results could differ significantly from these estimates. Changes in those estimates resulting from continuing change in the economic environment and other factors will be reflected in the financial statements and results of operations in future periods. The three most significant areas in which management applies critical assumptions and estimates regard the estimate of the allowance for loan losses, impairment review of investment securities and the impairment review of goodwill and intangible assets.
All significant intercompany balances and transactions have been eliminated in the accompanying consolidated financial statements.
(b) Reclassification
Certain amounts in previous years’ financial statements have been reclassified to conform to the current year’s presentation, particularly under the subtitle “Non-interest expense” on the Consolidated Statements of Income, where changes were made, primarily to identify technology and telecommunications expense separately, in order to provide a more useful presentation.
ENTERPRISE BANCORP, INC.
Notes to Consolidated Financial Statements
(c) Short-term Investment Securities
The Company utilizes short-term investments to earn returns on short-term excess liquidity. The Company’s short-term investments may consist of investments carried as both cash equivalents and non-cash equivalents. Cash equivalents are defined as short-term highly liquid investments that are both readily convertible to known amounts of cash and are so near their maturity date that they present insignificant risk of changes in value due to changes in interest rates. The Company’s cash equivalent short-term investments may be comprised of overnight and term federal funds sold, money market mutual funds and discount U.S. agency notes with original maturities of less than ninety days. Short-term investments not carried as cash equivalents would be classified as “other short-term investments.” The Company had no “other short-term investments” at December 31, 2009 or 2008.
(d) Investment Securities
Investment securities that are intended to be held for indefinite periods of time but which may not be held to maturity or on a long-term basis are considered to be “available for sale” and are carried at fair value. Net unrealized appreciation and depreciation on investments available for sale, net of applicable income taxes, are reflected as a component of accumulated other comprehensive income. Included as available for sale are securities that are purchased in connection with the Company’s asset-liability risk management strategy and that may be sold in response to changes in interest rates, resultant prepayment risk and other related factors. In instances where the Company has the positive intent to hold to maturity, investment securities will be classified as held to maturity and carried at amortized cost. The Bank is required to purchase Federal Home Loan Bank of Boston (“FHLB”) stock in association with outstanding advances from the FHLB; this stock is classified as a restricted investment and carried at cost. As of the balance sheet dates all of the Company’s investment securities (with the exception of restricted FHLB stock) were classified as available for sale and carried at fair value.
There are inherent risks associated with the Company’s investment activities which could adversely impact the fair market value and the ultimate collectability of the Company’s investments. Management regularly reviews the portfolio for securities with unrealized losses that are other than temporarily impaired. The determination of other-than-temporary impairment involves a high degree of judgment and requires management to make significant estimates of current market risks and future trends. Management assessment includes: evaluating the level and duration of the loss on individual securities; evaluating the credit quality of fixed income issuers; determining if any individual security or mutual fund or other fund exhibits fundamental deterioration; and estimating whether it is unlikely that the individual security or fund will completely recover its unrealized loss within a reasonable period of time, or in the case of fixed income securities prior to maturity. While management uses available information to measure other-than-temporary impairment at the balance sheet date, future write-downs may be necessary based on extended duration of current unrealized losses, changing market conditions, or circumstances surrounding individual issuers and funds.
Should an investment be deemed “other than temporarily impaired”, the Company is required to write-down the carrying value of the investment. Such write-down(s) may have a material adverse effect on the Company’s financial condition and results of operations. Other than temporary impairment on equity securities are recognized through a charge to earnings. Other than temporary impairment on fixed income securities are assessed in order to determine the impairment attributed to underlying credit quality of the issuer and the portion of noncredit impairment. When there are credit losses on a fixed income security that management does not intend to sell and it is more likely than not that the Company will not be required to sell prior to a marketplace recovery or maturity, the portion of the total impairment that is attributable to the credit loss would be recognized in earnings, and the remaining
ENTERPRISE BANCORP, INC.
Notes to Consolidated Financial Statements
difference between the security’s amortized cost basis and its fair value would be included in other comprehensive income. Once written-down a security may not be written-up in excess of its new cost basis to reflect future increases in market prices. Any OTTI charges, depending upon the magnitude of the charges, could have a material adverse effect on the Company’s financial condition and results of operations.
Investment securities’ discounts are accreted and premiums are amortized over the period of estimated principal repayment using methods that approximate the interest method.
Gains or losses on the sale of investment securities are recognized on the trade date on a specific identification basis.
(e) Loans
Loans made by the Company to businesses include commercial mortgage loans, construction and land development loans, secured and unsecured commercial loans and lines of credit, and standby letters of credit. The Company also originates equipment lease financing for businesses. Loans made to individuals include conventional residential mortgage loans, home equity loans, residential construction loans on primary residences, secured and unsecured personal loans and lines of credit. Most loans granted by the Company are collateralized by real estate or equipment and/or are guaranteed by the principals of the borrower. The ability and willingness of the single family residential and consumer borrowers to honor their repayment commitments is generally dependent on the level of overall economic activity and real estate values within the borrowers’ geographic areas. The ability and willingness of commercial real estate, commercial and construction loan borrowers to honor their repayment commitments is generally dependent on the health of the real estate sector in the borrowers’ geographic areas and the general economy, among other factors.
Loans are reported at the principal amount outstanding, net of deferred origination fees and costs. Loan origination fees received, offset by direct loan origination costs, are deferred and amortized using the straight line method over three to five years for lines of credit and demand notes or over the life of the related loans using the level-yield method for all other types of loans. When loans are paid off, the unamortized fees and costs are recognized as an adjustment to interest income.
Loans held for sale are carried at the lower of aggregate amortized cost or market value. All loans sold are currently sold without recourse, subject to an early payment default period covering the first four payments for certain loan sales. When loans are sold, a gain or loss is recognized to the extent that the sales proceeds plus unamortized fees and costs exceed, or are less than, the carrying value of the loans. Gains and losses are determined using the specific identification method.
· Non-accrual Loans
Loans on which the accrual of interest has been discontinued are designated as non-accrual loans. Accrual of interest on loans is generally discontinued when a loan becomes contractually past due, with respect to interest or principal, by ninety days or when reasonable doubt exists as to the full and timely collection of interest or principal. When a loan is placed on non-accrual status, all interest previously accrued but not collected is reversed against current period interest income. Interest accruals are resumed on such loans only when payments are brought current and have remained current for a period of ninety days or when, in the judgment of management, the collectability of both principal and interest is reasonably assured. Interest payments received on loans in a non-accrual status are generally applied to principal.
ENTERPRISE BANCORP, INC.
Notes to Consolidated Financial Statements
· Impaired Loans
Impaired loans are individually significant loans for which management considers it probable that not all amounts due in accordance with original contractual terms will be collected. The majority of impaired loans are included within the non-accrual balances; however, not every loan in non-accrual status has been designated as impaired. Management does not set any minimum delay of payments as a factor in reviewing for impaired classification. Management considers the payment status, net worth and earnings potential of the borrower, and the value and cash flow of the collateral as factors to determine if a loan will be paid in accordance with its contractual terms.
When a loan is deemed to be impaired, management estimates the credit loss by comparing the loan’s carrying value against either 1) the present value of the expected future cash flows discounted at the loan’s effective interest rate; 2) the loan’s observable market price; or 3) the expected realizable fair value of the collateral, in the case of collateral dependent loans. A specific allowance is assigned to the impaired loan for the amount of estimated credit loss. Impaired loans are charged off, in whole or in part, when management believes that the recorded investment in the loan is uncollectible.
Impaired loans exclude large groups of smaller-balance homogeneous loans, such as residential mortgage loans and consumer loans, that are collectively evaluated for impairment, loans that are measured at fair value and leases, unless the loan is amended in a troubled debt restructure.
· Restructured Loans
Loans are designated as “troubled debt restructures” (“TDRs”) when a concession is made on a credit as a result of financial difficulties of the borrower. Typically, such concessions consist of a reduction in interest rate to a below market rate, taking into account the credit quality of the note, or a deferment of payments, principal or interest, which materially alters the Bank’s position or significantly extends the note’s maturity date, such that the present value of cash flows to be received is materially less than those contractually established at the loan’s origination. Restructured loans are included in the impaired loan category.
(f) Allowance for Loan Losses
The allowance for loan losses is an estimate of credit risk inherent in the loan portfolio as of the specified balance sheet dates. The allowance for loan losses is established through a provision for loan losses, a direct charge to earnings. Loan losses are charged against the allowance when management believes that the collectability of the loan principal is unlikely. Recoveries on loans previously charged off are credited to the allowance. The Company maintains the allowance at a level that it deems adequate to absorb all reasonably anticipated losses from specifically known and other credit risks associated with the portfolio. Arriving at an appropriate level of allowance for loan losses involves a high degree of management judgment.
The Company’s credit risk management function focuses on a wide variety of factors, including, among others, current and expected economic conditions, the real estate market, the financial condition of borrowers, the ability of borrowers to adapt to changing conditions or circumstances affecting their business and the continuity of borrowers’ management teams. Early detection of credit issues is critical to minimize credit losses. Accordingly, management regularly monitors these factors, among others, through ongoing credit reviews by the credit department, an external loan review service, reviews by members of senior management and the Loan Committee of the Board of Directors. Loans which are evaluated to be of weaker credit quality are considered “classified” and are reviewed on a more regular basis by management.
ENTERPRISE BANCORP, INC.
Notes to Consolidated Financial Statements
The Company uses a systematic methodology to measure the amount of estimated loan loss exposure inherent in the portfolio for purposes of establishing a sufficient allowance for loan losses. The methodology uses a two-tiered approach that makes use of specific reserves for loans individually evaluated and deemed impaired and general reserves for larger groups of homogeneous loans. Individual commercial loans deemed to be impaired are analyzed for loss exposure using one of the acceptable methods as described above, while portfolios of more homogenous populations of loans, are analyzed at a group level, by credit rating or by credit type.
In determining general reserves on these groups of homogenous loans, management relies on a combination of qualitative and quantitative factors that could have an impact on the credit quality of these groups, including historical charge-off and recovery experience, the growth, composition and size of the loan portfolio, trends in delinquencies and non-performing loans, the strength of the local and national economy, interest rates and other changes in the portfolio.
On a quarterly basis, the Company prepares an estimate of the reserves necessary to cover estimated credit risk inherent in the portfolio as of the specified balance sheet dates. The adequacy of the allowance for loan losses is reviewed and evaluated on a regular basis by an internal management committee, a sub-committee of the Board of Directors and the full Board itself.
Management believes that the allowance for loan losses is adequate to absorb probable losses from specifically known and other credit risks associated with the loan portfolio as of the balance sheet dates. Arriving at an appropriate level of allowance for loan losses involves a high degree of management judgment. While management uses available information to recognize losses on loans, future additions to the allowance may be necessary. In addition, various regulatory agencies, as an integral part of their examination process, periodically review the Company’s allowance for loan losses. Such agencies may require the Company to recognize additions to the allowance based on judgments different from those of management.
(g) Other Real Estate Owned
Real estate acquired by the Company through foreclosure proceedings or the acceptance of a deed in lieu of foreclosure is classified as Other Real Estate Owned (“OREO”). When property is acquired, it is generally recorded at the lesser of the loan’s remaining principal balance, net of unamortized deferred fees, or the estimated fair value of the property acquired, less estimated costs to sell. Any loan balance in excess of the estimated realizable fair value on the date of transfer is charged to the allowance for loan losses on that date. All costs incurred thereafter in maintaining the property, as well as subsequent declines in fair value are charged to non-interest expense.
(h) Premises and Equipment
Land is carried at cost. Premises and equipment are stated at cost less accumulated depreciation and amortization. Depreciation or amortization is computed on a straight-line basis over the lesser of the estimated useful lives of the asset or the respective lease term (with reasonably assured renewal options) for leasehold improvements as follows:
|
Buildings, renovations and leasehold improvements |
|
10 to 39 years |
|
|
Computer software and equipment |
|
3 to 5 years |
|
|
Furniture, fixtures and equipment |
|
3 to 10 years |
|
(i) Impairment of Long-Lived Assets Other than Goodwill
The Company reviews long-lived assets, including premises and equipment, for impairment on an ongoing basis or whenever events or changes in business
ENTERPRISE BANCORP, INC.
Notes to Consolidated Financial Statements
circumstances indicate that the remaining useful life may warrant revision or that the carrying amount of the long-lived asset may not be fully recoverable. If impairment is determined to exist, any related impairment loss is recognized through a charge to earnings. Impairment losses on assets disposed of, if any, are based on the estimated proceeds to be received, less cost of disposal.
(j) Goodwill and Core Deposit Intangible Assets
Goodwill and core deposit intangibles carried on the Company’s consolidated financial statements were $5.7 million and $76 thousand, respectively, at December 31, 2009 and $5.7 million and $209 thousand, respectively, at December 31, 2008. Both of these assets are related to the Company’s acquisition of two branch offices in July 2000.
In accordance with generally accepted accounting principles, the Company does not amortize goodwill and instead, at least annually, evaluates whether the carrying value of goodwill has become impaired. Impairment of the goodwill may occur when the estimated fair value of the Company is less than its recorded value. A determination that goodwill has become impaired results in an immediate write-down of goodwill to its determined value with a resulting charge to operations.
The annual impairment test is a two-step process used to identify potential goodwill impairment and measure the amount of goodwill impairment loss to be recognized, if any. The assessment is performed at the operating unit level. In the case of the Company, the services offered through the Bank and subsidiaries are managed as one strategic unit and represent the Company’s only reportable operating segment. The first step of the goodwill impairment test, used to identify potential impairment, compares the estimated fair value of the reporting unit with its carrying amount, or the book value of the reporting unit, including goodwill. If the estimated fair value of the reporting unit equals or exceeds its book value, goodwill is considered not impaired, and the second step of the impairment test is unnecessary. Management’s assessment of the fair value of the Company takes into consideration the Company’s market capitalization, stock trading volume, price-multiples valuations of comparable companies and control premiums in transactions involving comparable companies. The value of a control premium to use in the marketplace will depend on a number of factors including the target bank stock’s liquidity, where the stock is currently trading, the perceived attractiveness of the entity and economic conditions. Management evaluates each of these factors as they relate to the Company and subjectively determines a reasonably comparable assumed control premium.
The second step, if necessary, measures the amount of goodwill impairment loss to be recognized. The reporting unit must determine fair values for all assets and liabilities, excluding goodwill. The net of the assigned fair value of assets and liabilities is then compared to the book value of the reporting unit, and any excess book value becomes the implied fair value of goodwill. If the carrying amount of the goodwill exceeds the newly calculated implied fair value of that goodwill, an impairment loss is recognized in the amount required to write down the goodwill to the implied fair value.
The Company’s consolidated financial statements also include intangible assets (core deposit intangibles), which are amortized to expense over their estimated useful life of ten years and reviewed for impairment on an ongoing basis or whenever events or changes in business circumstances warrant a review of the carrying value. If impairment is determined to exist, the related write-down of the intangible asset’s carrying value is charged to operations. Accumulated amortization expense related to core deposit intangible assets was $1.3 million at December 31, 2009. Amortization expense is expected to amount to $76 thousand for the year ended December 31, 2010, the final year of amortization.
Based on these impairment reviews the Company determined that goodwill and core deposit intangible assets were not impaired at December 31, 2009.
ENTERPRISE BANCORP, INC.
Notes to Consolidated Financial Statements
(k) Investment Assets Under Management
Securities and other property held in a fiduciary or agency capacity are not included in the consolidated balance sheets because they are not assets of the Company. Investment assets under management, consisting of assets managed through Enterprise Investment Advisors and the commercial sweep product, totaled $433.0 million and $439.7 million at December 31, 2009 and 2008, respectively. Fee income is reported on an accrual basis.
(l) Derivatives
The Company recognizes all derivatives as either assets or liabilities in its balance sheet and measures those instruments at fair market value. Interest rate lock commitments related to the origination of mortgage loans that will be sold are considered derivative instruments. The commitments to sell loans are also considered derivative instruments. These commitments represent the Company’s only derivative instruments. Depending on the current interest rate environment, management projections of future interest rates and the overall asset-liability management program of the Company, management may elect to sell those fixed and adjustable rate residential mortgage loans which are eligible for sale in the secondary market, or hold this residential loan production for the Company’s portfolio. The Company generally does not pool mortgage loans for sale but instead sells the loans on an individual basis. The Company may retain or sell the servicing when selling these loans. The Company estimates the fair value of these derivatives using the difference between the guaranteed interest rate in the commitment and the current market interest rate. To reduce the net interest rate exposure arising from its loan sale activity, the Company enters into the commitment to sell these loans at essentially the same time that the interest rate lock commitment is quoted on the origination of the loan. The estimated fair values of these derivative instruments are based on changes in current market rates.
At December 31, 2009, the estimated fair value of the Company’s derivative instruments were considered to be immaterial.
(m) FDIC Deposit Insurance Assessment
The Company’s deposit accounts are insured by the FDIC’s Deposit Insurance Fund (the “DIF”) up to the maximum amount provided by law. The Company’s deposit insurance expenses amounted to $2.2 million, $720 thousand, and $104 thousand in 2009, 2008 and 2007, respectively.
As a result of nationwide bank failures in 2008 and 2009, the DIF reserve ratio (DIF reserves as a percent of estimated insured deposits) declined substantially, and beginning in late 2008 the FDIC took several steps to restore their reserves, as required by law. The FDIC increased its annual assessment rate uniformly by 7 basis points for all insured institutions for the first quarter of 2009 only. In addition, the FDIC modified the risk-based assessment system beginning April 1, 2009 to require riskier institutions to pay a larger share of premiums. The modified system also increased the annual base assessment rates for all insured institutions by approximately 2 to 35 basis points uniformly, depending on risk category and several possible adjustments that could increase or decrease the institution’s base rate.
As an additional measure to restore the DIF’s reserve ratio, the FDIC imposed an emergency 20 basis point special assessment on all insured depository institutions as of June 30, 2009. The FDIC subsequently required all insured institutions to make an additional prepayment, on December 30, 2009, of estimated insurance assessments for 2010, 2011 and 2012, under an FDIC prescribed estimation formula, which included an annual deposit growth rate of 5% and an additional uniform three-basis point increase in the assessment rate schedule effective January 1, 2011. If the prepaid assessment
ENTERPRISE BANCORP, INC.
Notes to Consolidated Financial Statements
is exhausted prior than the fourth quarter of 2012, due to deposit growth or other unanticipated factors, institutions would be required to make additional quarterly payments to cover actual assessments. Any prepaid assessment not exhausted will be returned to the institution.
Under the Deposit Insurance Reform Act of 2005, eligible insured depository institutions, such as the Bank, shared in a one-time FDIC assessment credit pool of approximately $4.7 billion. This one-time credit was applied against the institutions’ 2007 deposit insurance assessment. In the case of the Company, the one-time credit of approximately $333 thousand offset approximately 94% of the Bank’s deposit insurance assessment for 2007.
In addition to general increases in the FDIC’s assessment rates, the Company’s insurance costs increased in 2009 due to its participation in the FDIC’s Transaction Account Guarantee Program (the “TAGP”) as described further below.
The FDIC retains the ability to impose additional special assessments or implement future changes to the assessment rate or payment schedules.
(n) Stock Based Compensation
The Company’s financial statements include stock-based compensation expense for the portion of stock option awards, net of estimated forfeitures, and restricted stock awards for which the requisite service has been rendered during the period. The compensation expense has been estimated based on the estimated grant-date fair value of the awards, or in the case of restricted stock awards, the market value of the common stock on the date of grant. The Company will recognize the remaining estimated compensation expense for the portion of outstanding awards and compensation expense for any future awards, net of estimated forfeitures, as the requisite service is rendered (i.e., on a straight-line basis over the remaining vesting period of each award). Stock awards that do not require future service (“vested awards”) will be expensed immediately.
(o) Income Taxes
The Company uses the asset and liability method of accounting for income taxes. Under this method, deferred tax assets and liabilities are recognized for the future tax attributable to differences between the financial statement carrying amounts and the tax basis of assets and liabilities. The deferred tax assets and liabilities are reflected at currently enacted income tax rates applicable to the period in which the deferred tax assets or liabilities are expected to be realized or settled. As changes in tax laws or rates are enacted, deferred tax assets and liabilities will be adjusted accordingly through the provision for income taxes.
The Company’s policy is to classify interest resulting from underpayment of income taxes as income tax expense in the first period the interest would begin accruing according to the provisions of the relevant tax law. The Company classifies penalties resulting from underpayment of income taxes as income tax expense in the period for which the Company claims or expects to claim an uncertain tax position or in the period in which the Company’s judgment changes regarding an uncertain tax position.
The Company did not have any unrecognized tax benefits accrued as income tax liabilities or receivables or as deferred tax items at December 31, 2009 or December 31, 2008. The Company’s tax years beginning after December 31, 2006 are open to federal and state income tax examinations.
ENTERPRISE BANCORP, INC.
Notes to Consolidated Financial Statements
(p) Earnings Per Share
Basic earnings per share are calculated by dividing net income by the weighted average number of common shares outstanding during the year. Diluted earnings per share reflects the effect on weighted average shares outstanding of the number of additional shares outstanding if dilutive stock options were converted into common stock using the treasury stock method.
The table below presents the increase in average shares outstanding, using the treasury stock method, for the diluted earnings per share calculation for the years ended December 31st and the effect of those shares on earnings:
|
|
|
2009 |
|
2008 |
|
2007 |
|
|||
|
Basic weighted average common shares outstanding |
|
8,268,502 |
|
7,973,527 |
|
7,819,160 |
|
|||
|
Dilutive shares |
|
10,624 |
|
32,008 |
|
93,846 |
|
|||
|
Diluted weighted average common shares outstanding |
|
8,279,126 |
|
8,005,535 |
|
7,913,006 |
|
|||
|
|
|
|
|
|
|
|
|
|||
|
Basic Earnings per share |
|
$ |
0.96 |
|
$ |
0.70 |
|
$ |
1.27 |
|
|
Effect of dilutive shares |
|
— |
|
(0.01 |
) |
(0.02 |
) |
|||
|
Diluted Earnings per share |
|
$ |
0.96 |
|
$ |
0.69 |
|
$ |
1.25 |
|
At December 31, 2009 and 2008 there were 640,160 and 624,382 average outstanding stock options, respectively, which were excluded from the calculations of diluted earnings per share above, due to the exercise price exceeding the average market price of the Company’s common stock. These options, which were not dilutive at that date, may potentially dilute earnings per share in the future.
(q) Reporting Comprehensive Income
Comprehensive income is defined as all changes to equity except investments by and distributions to stockholders. Net income is one component of comprehensive income, with other components referred to in the aggregate as other comprehensive income. The Company’s only other comprehensive income component is the net unrealized holding gains or losses on investments available for sale, net of deferred income taxes.
The following table summarized the components of other comprehensive income for the periods indicated:
|
|
|
2009 |
|
2008 |
|
2007 |
|
|||
|
Disclosure of other comprehensive income (loss): |
|
|
|
|
|
|
|
|||
|
Gross unrealized holding gains (losses) arising during the period |
|
$ |
2,201 |
|
$ |
(2,089 |
) |
$ |
2,200 |
|
|
Income tax benefit (expense) |
|
(806 |
) |
614 |
|
(800 |
) |
|||
|
Net unrealized holding gains (losses), net of tax |
|
1,395 |
|
(1,475 |
) |
1,400 |
|
|||
|
|
|
|
|
|
|
|
|
|||
|
Less: Reclassification adjustment for impairment included in net income: |
|
|
|
|
|
|
|
|||
|
Other than temporary impairment loss arising during the period |
|
(797 |
) |
(3,702 |
) |
— |
|
|||
|
Income tax benefit |
|
271 |
|
1,259 |
|
— |
|
|||
|
Reclassification adjustment for impairment realized, net of tax |
|
(526 |
) |
(2,443 |
) |
— |
|
|||
|
|
|
|
|
|
|
|
|
|||
|
Less: Reclassification adjustment for net gains included in net income: |
|
|
|
|
|
|
|
|||
|
Net realized gains on sales of securities during the period |
|
1,487 |
|
305 |
|
1,655 |
|
|||
|
Income tax expense |
|
(518 |
) |
(108 |
) |
(577 |
) |
|||
|
Reclassification adjustment for gains realized, net of tax |
|
969 |
|
197 |
|
1,078 |
|
|||
|
|
|
|
|
|
|
|
|
|||
|
Other comprehensive income, net of reclassifications |
|
$ |
952 |
|
$ |
771 |
|
$ |
322 |
|
ENTERPRISE BANCORP, INC.
Notes to Consolidated Financial Statements
(r) Recent Accounting Pronouncements
In June 2009, the FASB amended the consolidation guidance applicable to variable interest entities (VIEs) in FASB Accounting Standards Codification (“ASC”) Topic 810 “Consolidation” by eliminating exceptions to consolidating qualifying special-purpose entities, changing the approach to determining a VIE’s primary beneficiary, and requiring a company to more frequently reassess whether VIEs must be consolidated. This amended guidance is effective as of the beginning for the first annual periods that begin after November 15, 2009 (that is January 1, 2010 for the Company) and for subsequent interim and annual periods thereafter. The implementation of this guidance is not expected to have a material impact on the Company’s financial position or results of operations.
In June 2009, the FASB amended ASC Topic 860 “Accounting for Transfers and Servicing of Financial Assets and Extinguishments of Liabilities” to address certain practices that have developed that the FASB determined are not consistent with the original intent and key requirement of the prior guidance, and to address concerns that financial assets that have been derecognized should continue to be reported in the financial statements of the transferors. The new guidance is intended to improve the information that a reporting entity provides in its financial reports about the transfer of financial assets; the effects of a transfer on its financial position, financial performance, and cash flows. The appropriateness of derecognition is evaluated based on whether or not the transferor has surrendered control of the transferred assets. The evaluation must consider any continuing involvement by the transferor in the financial assets. New disclosure requirements must be applied to transfers that occurred both before and after the effective date of this new guidance, which is effective for the first interim and annual periods that begin after November 15, 2009 and for interim and annual periods thereafter. Earlier application is prohibited. The implementation of this guidance is not expected to have a material impact on the Company’s financial position or results of operations.
In May 2009, the FASB issued ASC Subtopic 855-10 “Subsequent Events” to provide new guidance on management’s assessment of subsequent events, clarifying that management must evaluate, as of each reporting period, events or transactions that occur after the balance sheet date through the date that the financial statements are issued or are available to be issued. This guidance was effective for the Company beginning in the second quarter of 2009. The adoption of this guidance did not have any impact on the Company’s consolidated financial statements.
ENTERPRISE BANCORP, INC.
Notes to Consolidated Financial Statements
(2) Investment Securities
The amortized cost and carrying values of investment securities at December 31 2009 and 2008 are summarized as follows:
|
|
|
2009 |
|
||||||||||
|
(Dollars in thousands) |
|
Amortized |
|
Unrealized |
|
Unrealized |
|
Carrying |
|
||||
|
Federal Agency Obligations(1) |
|
$ |
25,653 |
|
$ |
45 |
|
$ |
67 |
|
$ |
25,631 |
|
|
Federal Agency mortgage backed securities (MBS)(1) |
|
39,299 |
|
606 |
|
168 |
|
39,737 |
|
||||
|
Non-agency MBS |
|
3,479 |
|
— |
|
34 |
|
3,445 |
|
||||
|
Municipal securities |
|
59,278 |
|
1,466 |
|
152 |
|
60,592 |
|
||||
|
Total fixed income securities |
|
127,709 |
|
2,117 |
|
421 |
|
129,405 |
|
||||
|
Equity investments |
|
3,459 |
|
1,505 |
|
— |
|
4,964 |
|
||||
|
Total available for sale securities, at fair value |
|
131,168 |
|
3,622 |
|
421 |
|
134,369 |
|
||||
|
FHLB stock, at cost(2) |
|
4,740 |
|
— |
|
— |
|
4,740 |
|
||||
|
Total investment securities |
|
$ |
135,908 |
|
$ |
3,622 |
|
$ |
421 |
|
$ |
139,109 |
|
|
|
|
2008 |
|
||||||||||
|
(Dollars in thousands) |
|
Amortized |
|
Unrealized |
|
Unrealized |
|
Carrying |
|
||||
|
Federal agency MBS(1) |
|
$ |
81,282 |
|
$ |
1,701 |
|
$ |
47 |
|
$ |
82,936 |
|
|
Non-agency MBS |
|
4,561 |
|
— |
|
245 |
|
4,316 |
|
||||
|
Municipal securities |
|
60,924 |
|
966 |
|
504 |
|
61,386 |
|
||||
|
Total fixed income securities |
|
146,767 |
|
2,667 |
|
796 |
|
148,638 |
|
||||
|
Equity investments |
|
6,175 |
|
21 |
|
201 |
|
5,995 |
|
||||
|
Total available for sale securities, at fair value |
|
152,942 |
|
2,688 |
|
997 |
|
154,633 |
|
||||
|
FHLB stock, at cost(2) |
|
4,740 |
|
— |
|
— |
|
4,740 |
|
||||
|
Total investment securities |
|
$ |
157,682 |
|
$ |
2,688 |
|
$ |
997 |
|
$ |
159,373 |
|
(1) Investments issued or guaranteed by government sponsored enterprises such as Fannie Mae (FNMA), Freddie Mac (FHLMC), Ginnie Mae (GNMA) or one of several Federal Home Loan Banks (FHLB). All agency MBS investments by the Company are backed by residential mortgages.
(2) The Bank is required to purchase FHLB stock in association with outstanding advances from the FHLB; this stock is classified as a restricted investment and carried at cost, which management believes approximates fair value.
ENTERPRISE BANCORP, INC.
Notes to Consolidated Financial Statements
The following tables summarize investments having temporary impairment, due to the fair market values having declined below the amortized costs of the individual securities, and the period that the investments have been impaired at December 31, 2009 and 2008.
|
|
|
2009 |
|
||||||||||||||||
|
|
|
Less than 12 months |
|
12 months or longer |
|
Total |
|
||||||||||||
|
(Dollars in thousands) |
|
Fair |
|
Unrealized |
|
Fair |
|
Unrealized |
|
Fair |
|
Unrealized |
|
||||||
|
|
|
|
|
|
|
|
|
|
|
|
|
|
|
||||||
|
Federal Agency Obligations |
|
$ |
7,415 |
|
$ |
67 |
|
$ |
|
$ |
|
$ |
7,415 |
|
$ |
67 |
|
||
|
Federal agency MBS |
|
18,909 |
|
$ |
168 |
|
— |
|
— |
|
18,909 |
|
168 |
|
|||||
|
Non-agency MBS |
|
3,445 |
|
34 |
|
— |
|
— |
|
3,445 |
|
34 |
|
||||||
|
Municipal securities |
|
9,421 |
|
133 |
|
468 |
|
19 |
|
9,889 |
|
152 |
|
||||||
|
Equity investments |
|
— |
|
— |
|
— |
|
— |
|
— |
|
— |
|
||||||
|
Total temporarily impaired securities |
|
$ |
39,190 |
|
$ |
402 |
|
$ |
468 |
|
$ |
19 |
|
$ |
39,658 |
|
$ |
421 |
|
|
|
|
2008 |
|
||||||||||||||||
|
|
|
Less than 12 months |
|
12 months or longer |
|
Total |
|
||||||||||||
|
(Dollars in thousands) |
|
Fair |
|
Unrealized |
|
Fair |
|
Unrealized |
|
Fair |
|
Unrealized |
|
||||||
|
|
|
|
|
|
|
|
|
|
|
|
|
|
|
||||||
|
Federal agency MBS |
|
$ |
4,976 |
|
$ |
47 |
|
$ |
— |
|
$ |
— |
|
$ |
4,976 |
|
$ |
47 |
|
|
Non-agency MBS |
|
— |
|
— |
|
4,316 |
|
245 |
|
4,316 |
|
245 |
|
||||||
|
Municipal securities |
|
11,934 |
|
415 |
|
903 |
|
89 |
|
12,837 |
|
504 |
|
||||||
|
Equity investments |
|
632 |
|
201 |
|
— |
|
— |
|
632 |
|
201 |
|
||||||
|
Total temporarily impaired securities |
|
$ |
17,542 |
|
$ |
663 |
|
$ |
5,219 |
|
$ |
334 |
|
$ |
22,761 |
|
$ |
997 |
|
See Note 14, “Fair Values of Financial Instruments”, for additional information regarding the Company’s fair value measurement of investment securities.
The net unrealized gain or loss in the Company’s fixed income portfolio fluctuates as market interest rates rise and fall. Due to the fixed rate nature of this portfolio, as market rates fall the value of the portfolio rises, and as market rates rise, the value of the portfolio declines. The unrealized gains or losses on fixed income investments will also decline as the securities approach maturity. Unrealized gains or losses will be recognized in the statements of income if the securities are sold. However, if an unrealized loss on the fixed income portfolio is deemed to be other than temporary the credit loss portion is charged to earnings and the noncredit portion is recognized in accumulated other comprehensive income.
As of December 31, 2009, the unrealized losses on the federal agency obligations and federal agency MBS investments were limited to nine individual securities, which were attributed to market volatility. The contractual cash flows of those investments are guaranteed by an agency of the U.S. Government, and the agencies that issued these securities are sponsored by the U.S. Government. Accordingly, it is expected that the securities would not be settled at a price less than the par value of the Company’s investment. The Company does not consider those investments to be other-than-temporarily impaired at December 31, 2009, because the decline in market value is attributable to changes in interest rate volatility and not credit quality, and because the Company does not intend to, and it is more likely than not that it will not be required to, sell those investments prior to a market price recovery or maturity.
As of December 31, 2009, the Company’s non-agency MBS portfolio consisted of one residential mortgage backed security. The unrealized loss was due to market conditions which resulted generally in lower prices for most non-agency MBSs in relation to government issued and agency securities. The Company does not consider this investment to be other-than-temporarily impaired at December 31, 2009 due to the AAA rating of the security and the high credit quality of the underlying loans. In
ENTERPRISE BANCORP, INC.
Notes to Consolidated Financial Statements
addition, the Company does not intend to, and it is more likely than not that it will not be required to, sell those investments prior to a market price recovery or maturity.
As of December 31, 2009, the unrealized losses on the Company’s municipal securities were related to eighteen obligations and were attributed to market volatility and not a fundamental deterioration in the issuers. The Company does not consider these investments to be other-than-temporarily impaired at December 31, 2009 due to the securities being classified as “investment grade” and also because of the lower risk nature of municipal investments. In addition, the Company does not intend to, and it is more likely than not that it will not be required to, sell those investments prior to a market price recovery or maturity.
The net unrealized gain or loss on equity securities will fluctuate based on changes in the market value of the funds and individual securities held in the portfolio. Unrealized gains or losses will be recognized in the statements of income if the securities are sold. However, if an unrealized loss on an equity security is deemed to be other than temporary prior to a sale, the loss is charged to earnings.
During the year ended December 31, 2009, primarily in the first quarter, the Company recorded fair value impairment charges, on certain investments contained in its equity portfolio, to reflect the impact of declines in the equities markets. Management’s decision to record this charge was based primarily on the severity of the declines and the uncertainty of recovery in the short-term for these equities. The pretax impairment charges of $797 thousand represented a $526 thousand after tax charge against earnings. There were no other securities at December 31, 2009 that were considered other than temporarily impaired. During 2009, the Company sold $2.0 million of previously impaired equity funds and recognized additional losses of $299 thousand and gains of $515 thousand.
At December 31, 2009, the equity portfolio consisted primarily of investments in a diversified group of mutual funds, with a small portion of the portfolio (approximately 9%) invested in funds or individual common stock of entities in the financial services industry. At December 31, 2009, after the impairment charge discussed above, the Company did not have any investments in its equity portfolio with unrealized losses.
As a member of the Federal Home Loan Bank of Boston (FHLB), the Company is required to purchase FHLB capital stock in association with the Bank’s outstanding advances from the FHLB; this stock is classified as a restricted investment and carried at cost. The FHLB is currently operating with retained earnings below its target level. The FHLB has instituted a plan to increase retained earnings which includes suspending its quarterly dividend and a moratorium on the repurchase of excess capital stock from member banks, among other programs. If further deterioration in the FHLB financial condition or capital levels occurs, the FHLB capital stock may become other than temporarily impaired to some degree and its carrying value correspondingly reduced. Management reviews its investment in FHLB stock for other than temporary impairment based on an assessment of the ultimate recoverability of the par value. Management’s most recent evaluation considered the long term nature of the investments, the liquidity position of the FHLB, actions taken by FHLB to address the issue, and the Company’s intent and ability to hold the investment for sufficient time to recover the par value. Based on this review, management concluded that no other than temporary impairment charge on FHLB stock was necessary as of December 31, 2009.
ENTERPRISE BANCORP, INC.
Notes to Consolidated Financial Statements
The contractual maturity distribution of total fixed income securities at December 31, 2009 is as follows:
|
(Dollars in thousands) |
|
Amortized |
|
Percent |
|
Fair |
|
Percent |
|
||
|
Within one year |
|
$ |
12,699 |
|
9.9 |
% |
$ |
12,757 |
|
9.9 |
% |
|
After one but within three years |
|
25,166 |
|
19.7 |
% |
25,513 |
|
19.7 |
% |
||
|
After three but within five years |
|
6,728 |
|
5.3 |
% |
6,847 |
|
5.3 |
% |
||
|
After five but within ten years |
|
29,026 |
|
22.7 |
% |
29,442 |
|
22.7 |
% |
||
|
After ten years |
|
54,090 |
|
42.4 |
% |
54,846 |
|
42.4 |
% |
||
|
Total fixed income securities |
|
$ |
127,709 |
|
100.0 |
% |
$ |
129,405 |
|
100.0 |
% |
Scheduled contractual maturities may not reflect the actual maturities of the investments. MBS securities are shown at their final maturity but are expected to have shorter average lives due to principal prepayments. Included in municipal securities and federal agency obligations are investments that can be called prior to final maturity with amortized cost and fair values of $50.1 million and $50.7 million, respectively, at December 31, 2009.
At December 31, 2009, securities with a fair value of $23.7 million were pledged as collateral for various municipal deposit accounts and repurchase agreements (see note 7 below). At December 31, 2008, securities with a fair value of $42.2 million and $599 thousand were pledged as collateral for municipal deposit accounts and repurchase agreements, and treasury tax and loan deposits, respectively. At December 31, 2007, securities with a fair value of $22.5 million and $2.0 million were pledged as collateral for municipal deposit accounts and repurchase agreements, and treasury tax and loan deposits, respectively.
The fair market value of securities designated as qualified collateral for FHLB borrowing capacity amounted to $44.1 million, $49.2 million and $54.2 million at December 31, 2009, 2008 and 2007, respectively.
The fair market value of securities designated as qualified collateral for borrowing from the Federal Reserve Bank of Boston (the “FRB”) through its discount window amounted to $55.2 million and $49.1 million at December 31, 2009 and 2008, respectively. This borrowing facility was put in place during 2008.
Sales of investment securities for the years ended December 31, 2009, 2008, and 2007 are summarized as follows:
|
(Dollars in thousands) |
|
2009 |
|
2008 |
|
2007 |
|
|||
|
Amortized cost of securities sold |
|
$ |
39,502 |
|
$ |
4,608 |
|
$ |
9,907 |
|
|
Gross realized gains on sales |
|
1,786 |
|
305 |
|
1,674 |
|
|||
|
Gross realized losses on sales |
|
(299 |
) |
— |
|
(19 |
) |
|||
|
Total proceeds from sales of investment securities |
|
$ |
40,989 |
|
$ |
4,913 |
|
$ |
11,562 |
|
Tax exempt interest earned on the municipal securities portfolio was $2.3 million for the year ended December 31, 2009, $2.3 million for the year ended December 31, 2008, and $2.1 million for the year ended December 31, 2007.
See Item d “Investment Securities”, contained in Note 1, “Summary of Accounting Policies”, for additional information regarding the accounting for the Company’s investment securities portfolio.
ENTERPRISE BANCORP, INC.
Notes to Consolidated Financial Statements
(3) Loans and Loans Held for Sale
Major classifications of loans and loans held for sale at December 31, are as follows:
|
(Dollars in thousands) |
|
2009 |
|
2008 |
|
||
|
Real estate: |
|
|
|
|
|
||
|
Commercial real estate |
|
$ |
553,768 |
|
$ |
472,279 |
|
|
Commercial construction |
|
107,467 |
|
98,365 |
|
||
|
Residential mortgages |
|
90,468 |
|
84,609 |
|
||
|
Residential construction |
|
6,260 |
|
6,375 |
|
||
|
Loans held for sale |
|
378 |
|
1,596 |
|
||
|
Total real estate |
|
758,341 |
|
663,224 |
|
||
|
|
|
|
|
|
|
||
|
Commercial and industrial |
|
263,151 |
|
231,815 |
|
||
|
Home equity |
|
58,732 |
|
49,773 |
|
||
|
Consumer |
|
3,824 |
|
4,857 |
|
||
|
Gross loans |
|
1,084,048 |
|
949,669 |
|
||
|
|
|
|
|
|
|
||
|
Deferred loan origination fees, net |
|
(1,218 |
) |
(1,028 |
) |
||
|
Total loans |
|
1,082,830 |
|
948,641 |
|
||
|
Allowance for loan losses |
|
(18,218 |
) |
(15,269 |
) |
||
|
Net loans and loans held for sale |
|
$ |
1,064,612 |
|
$ |
933,372 |
|
Tax exempt interest earned on qualified commercial loans was $759 thousand for the year ended December 31, 2009 and $524 thousand and $445 thousand for the years ended December 31, 2008 and 2007 respectively.
Certain directors, officers, principal stockholders and their associates are credit customers of the Company in the ordinary course of business. In addition, certain directors are also directors, trustees, officers or stockholders of corporations and non-profit entities or members of partnerships that are customers of the Bank and that enter into loan and other transactions with the Bank in the ordinary course of business. All loans and commitments included in such transactions are on such terms, including interest rates, repayment terms and collateral, as those prevailing at the time for comparable transactions with persons who are not affiliated with the Bank and do not involve more than a normal risk of collectability or present other features unfavorable to the Bank.
As of December 31, 2009 and 2008, the outstanding loan balances to directors, officers, principal stockholders and their associates were $8.8 million and $9.8 million, respectively. Unadvanced portions of lines of credit available to these individuals were $3.5 million and $2.5 million, as of December 31, 2009 and 2008, respectively. During 2009, new loans and net increases in loan balances or lines of credit under existing commitments of $737 thousand were made and principal paydowns of $1.7 million were received. All loans to these related parties are current.
At December 31, 2009 and 2008, the Company was servicing residential mortgage loans owned by investors amounting to $18.9 million and $9.2 million, respectively. Additionally, the Company was servicing commercial loans participated out to various other institutions amounting to $34.7 million and $19.2 million at December 31, 2009 and 2008, respectively.
ENTERPRISE BANCORP, INC.
Notes to Consolidated Financial Statements
Loans designated as qualified collateral and pledged to the FHLB for borrowing capacity at December 31, are summarized below:
|
|
|
2009 |
|
2008 |
|
||
|
Commercial real estate and other residential mortgages |
|
$ |
215,975 |
|
$ |
191,995 |
|
|
First lien 1-4 family owner occupied residential mortgages |
|
59,391 |
|
59,394 |
|
||
|
Home equity |
|
26,532 |
|
23,947 |
|
||
|
Total loans pledged |
|
$ |
301,898 |
|
$ |
275,336 |
|
Non-performing assets at December 31 are summarized as follows:
|
(Dollars in thousands) |
|
2009 |
|
2008 |
|
||
|
|
|
|
|
|
|
||
|
Commercial real estate |
|
$ |
11,789 |
|
$ |
3,691 |
|
|
Commercial and industrial |
|
2,748 |
|
1,713 |
|
||
|
Commercial construction |
|
4,662 |
|
1,400 |
|
||
|
Residential |
|
1,379 |
|
1,019 |
|
||
|
Home Equity |
|
18 |
|
149 |
|
||
|
Consumer |
|
8 |
|
39 |
|
||
|
Total non-accrual loans |
|
$ |
20,604 |
|
$ |
8,011 |
|
|
Overdrafts > 90 days past due |
|
5 |
|
256 |
|
||
|
Total non-performing loans |
|
$ |
20,609 |
|
$ |
8,267 |
|
|
Other real estate owned |
|
1,086 |
|
318 |
|
||
|
Total non-performing assets |
|
$ |
21,695 |
|
$ |
8,585 |
|
There were no commitments to lend additional funds to those borrowers whose loans were classified as non-accrual at December 31, 2009 or 2008.
The reduction in interest income for the years ended December 31, associated with non-accruing loans is summarized as follows:
|
(Dollars in thousands) |
|
2009 |
|
2008 |
|
2007 |
|
|||
|
|
|
|
|
|
|
|
|
|||
|
Income in accordance with original loan terms |
|
$ |
1,190 |
|
$ |
666 |
|
$ |
423 |
|
|
Less income recognized |
|
78 |
|
196 |
|
32 |
|
|||
|
Reduction in interest income |
|
$ |
1,112 |
|
$ |
470 |
|
$ |
391 |
|
Non-performing statistics have trended upward in 2008 and 2009, as would be expected given the historically low level of these statistics in recent years, and are consistent with the regional economic environment and its impact on the local commercial markets. Management believes that the current levels of non-performing statistics are reflective of normalized commercial credit statistics compared to the historic lows seen in recent years. Management does not consider the increase since 2008 to be indicative of significant deterioration in the credit quality of the general loan portfolio at December 31, 2009, as indicated by the following factors: the reasonable ratio of non-performing loans given the size and mix of the Company’s loan portfolio; the minimal level of OREO; the low levels of loans 60-89 days delinquent; and management’s assessment that the majority of impaired loans at December 31, 2009 will ultimately be collected.
The $12.3 million net increase in total non-performing loans, and the resulting increase in the ratio of non-performing loans as a percentage of total loans outstanding, was due to net additions within the commercial real estate ($8.1 million), commercial construction ($3.3 million), and the commercial and industrial portfolios ($1.0 million). In addition, one overdraft deposit account of $256 thousand outstanding at December 31, 2008, was subsequently funded in January 2009.
ENTERPRISE BANCORP, INC.
Notes to Consolidated Financial Statements
The majority of the non-accrual loans were also carried as impaired loans during the periods, and are discussed further below.
Total impaired commercial loans amounted to $39.7 million and $10.4 million at December 31, 2009 and December 31, 2008, respectively. Total accruing impaired loans amounted to $20.1 million and $3.7 million at December 31, 2009 and December 31, 2008, respectively, while, non—accrual impaired commercial loans amounted to $19.5 million and $6.7 million as of December 31, 2009 and December 31, 2008, respectively. There were ten larger commercial relationships added to impaired status during 2009 amounting to $29.1 million at December 31, 2009. Four of these ten relationships, amounting to $17.1 million, remained on accrual status during the period, while the remaining six relationships amounting to $12.0 million were in non-accrual status. In management’s opinion the majority of impaired loan balances at December 31, 2009 were adequately supported by expected future cash flows or the net realizable value of the underlying collateral and management expects that the majority of these principal advances will ultimately be collected. Based on management’s assessment at December 31, 2009, impaired loans totaling $29.6 million required no specific reserves and impaired loans totaling $10.1 million required specific reserve allocations of $2.1 million. At December 31, 2008, impaired loans totaling $5.2 million required no specific reserves and impaired loans totaling $5.2 million required specific reserve allocations of $478 thousand. Management closely monitors these relationships for collateral or credit deterioration.
Total TDR commercial loans, included in the impaired loan figures above as of December 31, 2009 and December 31, 2008 were $28.3 million and $4.7 million, respectively. The increase was due primarily to several of the newly impaired relationships referred to above. TDR loans on accrual status amounted to $20.1 million and $3.7 million at December 31, 2009 and December 31, 2008, respectively. Restructured loans included in non-performing loans amounted to $8.2 million and $1.0 million at December 31, 2009 and December 31, 2008, respectively. The Company continues to work with commercial relationships and enters into loan modifications to the extent deemed to be necessary or appropriate to ensure the best mutual outcome given the current economic environment.
During the years ended December 31, 2009, 2008 and 2007, the average recorded value of impaired loans was $26.1 million, $7.1 million and $3.1 million, respectively. Included in the reduction in interest income in the table above is $1.0 million, $477 thousand and $384 thousand of interest income that was not recognized on loans that were deemed impaired as of December 31, 2009, 2008 and 2007, respectively. All payments received on impaired loans in non-accrual status are applied to principal. The Company is not committed to lend additional funds on any loans that are considered impaired.
Changes in the allowance for loan losses for the years ended December 31, are summarized as follows:
|
(Dollars in thousands) |
|
2009 |
|
2008 |
|
2007 |
|
|||
|
|
|
|
|
|
|
|
|
|||
|
Balance at beginning of year |
|
$ |
15,269 |
|
$ |
13,545 |
|
$ |
12,940 |
|
|
Provision charged to operations |
|
4,846 |
|
2,505 |
|
1,000 |
|
|||
|
Loan recoveries |
|
638 |
|
597 |
|
256 |
|
|||
|
Loans charged off |
|
(2,535 |
) |
(1,378 |
) |
(651 |
) |
|||
|
Balance at end of year |
|
$ |
18,218 |
|
$ |
15,269 |
|
$ |
13,545 |
|
ENTERPRISE BANCORP, INC.
Notes to Consolidated Financial Statements
(4) Premises and Equipment
Premises and equipment at December 31 are summarized as follows:
|
(Dollars in thousands) |
|
2009 |
|
2008 |
|
||
|
|
|
|
|
|
|
||
|
Land |
|
$ |
2,830 |
|
$ |
2,830 |
|
|
Buildings, renovations and leasehold improvements |
|
22,646 |
|
21,131 |
|
||
|
Computer software and equipment |
|
10,767 |
|
9,547 |
|
||
|
Furniture, fixtures and equipment |
|
9,784 |
|
8,382 |
|
||
|
Total premises and equipment, before accumulated depreciation |
|
46,027 |
|
41,890 |
|
||
|
Less accumulated depreciation |
|
(23,103 |
) |
(20,239 |
) |
||
|
|
|
|
|
|
|
||
|
Total premises and equipment, net of accumulated depreciation |
|
$ |
22,924 |
|
$ |
21,651 |
|
Total depreciation expense related to premises and equipment amounted to $3.2 million, $2.7 million and $2.6 million for the years ended December 31, 2009, 2008 and 2007, respectively.
Total rent expense for the years ended December 31, 2009, 2008 and 2007 amounted to $917 thousand, $740 thousand, and $991 thousand, respectively.
The Company is obligated under various non-cancelable operating leases, some of which provide for periodic adjustments. At December 31, 2009 minimum lease payments for these operating leases were as follows:
|
(Dollars in thousands) |
|
|
|
|
|
Payable in: |
|
|
|
|
|
2010 |
|
$ |
954 |
|
|
2011 |
|
723 |
|
|
|
2012 |
|
686 |
|
|
|
2013 |
|
638 |
|
|
|
2014 |
|
447 |
|
|
|
Thereafter |
|
3,223 |
|
|
|
Total minimum lease payments |
|
$ |
6,671 |
|
With the purchase of the operations and lending office building in late 2007, the Company collects rents on two units within these facilities. Rental income was $146 thousand, $154 thousand and $31 thousand for the years ended December 31, 2009, 2008 and 2007, respectively.
(5) Accrued Interest Receivable
Accrued interest receivable consists of the following at December 31:
|
(Dollars in thousands) |
|
2009 |
|
2008 |
|
||
|
|
|
|
|
|
|
||
|
Investments |
|
$ |
812 |
|
$ |
951 |
|
|
Loans and loans held for sale |
|
4,556 |
|
4,406 |
|
||
|
|
|
|
|
|
|
||
|
Total accrued interest receivable |
|
$ |
5,368 |
|
$ |
5,357 |
|
ENTERPRISE BANCORP, INC.
Notes to Consolidated Financial Statements
(6) Deposits
Deposits at December 31 are summarized as follows:
|
(Dollars in thousands) |
|
2009 |
|
2008 |
|
||
|
|
|
|
|
|
|
||
|
Non-interest demand deposits |
|
$ |
192,515 |
|
$ |
166,430 |
|
|
Interest bearing checking |
|
185,693 |
|
158,005 |
|
||
|
Savings |
|
149,582 |
|
139,530 |
|
||
|
Money market |
|
320,126 |
|
154,488 |
|
||
|
Certificates of deposit less than $100,000 |
|
132,095 |
|
121,280 |
|
||
|
Certificates of deposit of $100,000 or more |
|
137,025 |
|
132,806 |
|
||
|
Brokered certificates of deposit |
|
27,912 |
|
75,364 |
|
||
|
Total deposits |
|
$ |
1,144,948 |
|
$ |
947,903 |
|
The aggregate amount of overdrawn deposits that have been reclassified as loan balances were $594 thousand and $1.2 million at December 31, 2009 and 2008, respectively.
The following table shows the scheduled maturities of certificates of deposit with balances less than $100,000 and greater than $100,000 at December 31, 2009:
|
(Dollars in thousands) |
|
Less |
|
$100,000 |
|
Total |
|
|||
|
|
|
|
|
|
|
|
|
|||
|
Due in less than twelve months(1) |
|
$ |
124,485 |
|
$ |
138,589 |
|
$ |
263,074 |
|
|
Due in over one year through two years |
|
14,383 |
|
11,052 |
|
25,435 |
|
|||
|
Due in over two years through three years |
|
3,741 |
|
4,782 |
|
8,523 |
|
|||
|
Due in over three years |
|
— |
|
— |
|
— |
|
|||
|
Total certificates of deposit |
|
$ |
142,609 |
|
$ |
154,423 |
|
$ |
297,032 |
|
(1) The line item “Due in less than twelve months” includes individual brokered certificates of deposit totaling $10.5 million in the less than $100,000 category and $17.4 million in the $100,000 and Greater category.
Interest expense on certificates of deposit with balances of $100,000 or more amounted to $3.4 million, $4.9 million, and $4.4 million, in 2009, 2008 and 2007, respectively.
ENTERPRISE BANCORP, INC.
Notes to Consolidated Financial Statements
(7) Borrowed Funds and Debentures
Borrowed funds and debentures at December 31 are summarized as follows:
|
|
|
2009 |
|
2008 |
|
2007 |
|
|||||||||
|
(Dollars in thousands) |
|
Amount |
|
Average |
|
Amount |
|
Average |
|
Amount |
|
Average |
|
|||
|
Securities sold under agreements to repurchase |
|
$ |
1,416 |
|
0.56 |
% |
$ |
1,418 |
|
2.22 |
% |
$ |
8,267 |
|
4.60 |
% |
|
Federal Home Loan Bank of Boston borrowings |
|
23,460 |
|
0.52 |
% |
119,832 |
|
0.40 |
% |
73,162 |
|
3.64 |
% |
|||
|
Total borrowed funds |
|
24,876 |
|
0.53 |
% |
121,250 |
|
0.43 |
% |
81,429 |
|
3.74 |
% |
|||
|
|
|
|
|
|
|
|
|
|
|
|
|
|
|
|||
|
Junior subordinated debentures |
|
10,825 |
|
10.88 |
% |
10,825 |
|
10.88 |
% |
10,825 |
|
10.88 |
% |
|||
|
|
|
|
|
|
|
|
|
|
|
|
|
|
|
|||
|
Total borrowed funds and debentures |
|
$ |
35,701 |
|
3.66 |
% |
$ |
132,075 |
|
1.28 |
% |
$ |
92,254 |
|
4.57 |
% |
Repurchase agreements for securities sold as of December 31, 2009 had terms ranging generally from thirty days to three months, with a weighted average term of 75 days. Maximum amounts outstanding at any month end during 2009, 2008, and 2007 were $1.4 million, $8.3 million, and $8.3 million, respectively.
FHLB borrowings at December 31, 2009 consisted of overnight borrowings, short-term borrowings with a weighted average term of approximately 7.6 months, and one term advance maturing in 3.5 years. Maximum amounts outstanding at any month end during 2009, 2008, and 2007 were $112.8 million, $119.8 million, and $73.2 million, respectively.
The contractual maturity distribution as of December 31, 2009, of borrowed funds with the weighted average cost for each category is set forth below:
|
|
|
Overnight |
|
Under 1 month |
|
>1 — 3 months |
|
>3 — 12 months |
|
Over 12 months |
|
|||||||||||||||
|
(Dollars in thousands) |
|
Balance |
|
Rate |
|
Balance |
|
Rate |
|
Balance |
|
Rate |
|
Balance |
|
Rate |
|
Balance |
|
Rate |
|
|||||
|
|
|
|
|
|
|
|
|
|
|
|
|
|
|
|
|
|
|
|
|
|
|
|||||
|
Repurchase |
|
$ |
— |
|
— |
|
$ |
17 |
|
0.50 |
% |
$ |
1,399 |
|
0.56 |
% |
— |
|
— |
|
— |
|
— |
|
||
|
FHLB |
|
2,705 |
|
0.43 |
% |
— |
|
— |
|
285 |
|
0.44 |
% |
$ |
20,000 |
|
0.41 |
% |
$ |
470 |
|
5.94 |
% |
|||
|
|
|
|
|
|
|
|
|
|
|
|
|
|
|
|
|
|
|
|
|
|
|
|||||
|
Total borrowed funds |
|
$ |
2,705 |
|
0.43 |
% |
$ |
17 |
|
0.50 |
% |
$ |
1,684 |
|
0.54 |
% |
$ |
20,000 |
|
0.41 |
% |
$ |
470 |
|
5.94 |
% |
The following table summarizes the average balance and average rate paid for securities sold under agreements to repurchase and FHLB borrowings for the year ended December 31,
|
|
|
Year ended December 31, |
|
|||||||||||||
|
|
|
2009 |
|
2008 |
|
2007 |
|
|||||||||
|
(Dollars in thousands) |
|
Average |
|
Average |
|
Average |
|
Average |
|
Average |
|
Average |
|
|||
|
|
|
|
|
|
|
|
|
|
|
|
|
|
|
|||
|
Repurchase agreements |
|
$ |
1,415 |
|
1.10 |
% |
$ |
3,425 |
|
3.72 |
% |
$ |
3,464 |
|
4.54 |
% |
|
Other borrowed funds |
|
58 |
|
0.46 |
% |
131 |
|
2.19 |
% |
— |
|
— |
|
|||
|
FHLB advances |
|
65,325 |
|
0.34 |
% |
75,516 |
|
2.33 |
% |
18,547 |
|
5.02 |
% |
|||
|
Total borrowed funds |
|
$ |
66,798 |
|
0.36 |
% |
$ |
79,072 |
|
2.39 |
% |
$ |
22,011 |
|
4.94 |
% |
ENTERPRISE BANCORP, INC.
Notes to Consolidated Financial Statements
The average balance of “other borrowed funds” above represents overnight advances from the FRB or federal funds purchased from correspondent banks during those years to test arrangements. The Company had no outstanding balances due to the FRB or correspondent banks at December 31, 2009.
As a member of the FHLB, the Bank has the capacity to borrow an amount up to the value of its qualified collateral, as defined by the FHLB which includes access to a pre-approved overnight line of credit for up to 5% of its total assets. Borrowings from the FHLB are secured by certain securities from the Company’s investment portfolio not otherwise pledged and certain residential and commercial real estate loans. At December 31, 2009, based on qualifying collateral less outstanding advances, the Bank had the capacity to borrow additional funds from the FHLB of up to approximately $182.9 million, which includes a pre-approved overnight line of credit in the amount of $11 million. In addition, based on qualifying collateral the Bank had the capacity to borrow funds from the FRB Discount Window of up to $52.4 million. The Bank also has pre-approved federal funds purchase arrangements with large regional correspondent banks in order to provide overnight and short-term borrowing capacity.
See note 2 and note 3 above to these consolidated financial statements for further information regarding securities and loans pledged for borrowed funds.
On March 10, 2000 the Company organized Enterprise (MA) Capital Trust I (the “Trust”), a statutory business trust created under the laws of Delaware. The Trust issued $10.5 million of 10.875% trust preferred securities that mature in 2030 and are callable beginning in 2010, at a premium if called between 2010 and 2020. The proceeds from the sale of the trust preferred securities were used by the Trust, along with the Company’s $325 thousand capital contribution, to acquire $10.8 million in aggregate principal amount of the Company’s 10.875% Junior Subordinated Debt Securities that mature in 2030 and are callable beginning in 2010.
(8) Stockholders’ Equity
The Company’s authorized capital is divided into common stock and preferred stock. The Company is authorized to issue 20,000,000 shares of common stock and 1,000,000 shares of preferred stock.
Holders of common stock are entitled to one vote per share, and are entitled to receive dividends if and when declared by the Board of Directors. Dividend and liquidation rights of the common stock may be subject to the rights of any outstanding preferred stock.
The Company has maintained a shareholders rights plan since 1998. The plan as originally adopted expired pursuant to its terms on January 13, 2008, and in conjunction with such expiration the Company adopted a renewed shareholders rights plan containing terms that are substantially similar to the terms of the original plan. Under the renewed plan, each share of common stock includes a right to purchase under certain circumstances one one-hundredth of a share of the Company’s Series A Junior Participating Preferred Stock, par value $0.01 per share, at a purchase price of $52.00 per one one-hundredth of a preferred share, subject to adjustment, or, in certain circumstances, to receive cash, property, shares of common stock or other securities of the Company. The rights are not presently exercisable and remain attached to the shares of common stock until the occurrence of certain triggering events that would ordinarily be associated with an unsolicited acquisition or attempted acquisition of 10% or more of the Company’s outstanding shares of common stock. The rights will expire, unless earlier redeemed, exchanged, or otherwise rescinded by the Company, on January 13, 2018. The rights have no voting or dividend privileges, and unless and until they become exercisable have no dilutive effect on the earnings of the Company.
ENTERPRISE BANCORP, INC.
Notes to Consolidated Financial Statements
Capital Adequacy Requirements
Capital planning by the Company and the Bank considers current needs and anticipated future growth. The primary sources of capital have been the original capitalization of the Bank of $15.5 million from the sale of common stock in 1988 and 1989, the issuance of $10.5 million of trust preferred securities in 2000 by the Trust, net proceeds of $8.8 million from the 2009 offering discussed below, retention of earnings less dividends paid since the Bank commenced operations, proceeds from the exercise of employee stock options and proceeds from purchases of shares pursuant to the Company’s dividend reinvestment plan.
On September 10, 2009, the Company filed a shelf registration of rights and common stock with the Securities and Exchange Commission for the flexibility to raise, over a three year period, up to $25 million in capital, in order to increase capital to ensure the Company is positioned to take advantage of growth and market share opportunities. In the fourth quarter of 2009, the Company successfully completed a combined Shareholder Subscription Rights Offering and Supplemental Community Offering under the shelf registration, raising $8.9 million in new capital ($8.8 million net of offering expenses). The Company contributed the net proceeds from these offerings to the Bank.
Management believes that current capital is adequate to support ongoing operations.
Applicable regulatory requirements require the Company to maintain minimum total capital equal to 8.00% of total risk-weighted assets (total capital ratio), minimum Tier 1 capital equal to 4.00% of total risk-weighted assets (Tier 1 capital ratio) and minimum Tier 1 capital equal to 4.00% of quarterly average total assets (leverage capital ratio). Tier 1 capital, in the case of the Company, is composed of common equity and, subject to regulatory limits, trust preferred securities, reduced by certain intangible assets. Total capital includes Tier 1 capital plus Tier 2 capital which, in the case of the Company, is composed of the allowance for loan losses up to 1.25% of risk-weighted assets. Applicable regulatory requirements for the Bank are not materially different from those of the Company.
Failure to meet minimum capital requirements can initiate or result in certain mandatory and possibly additional discretionary, actions by regulators that, if undertaken, could have a material adverse effect on the Company’s financial statements. Under applicable capital adequacy requirements and the regulatory framework for prompt corrective action applicable to the Bank, the Company must meet specific capital guidelines that involve quantitative measures of the Company’s assets, liabilities, and certain off-balance sheet items as calculated under regulatory accounting practices. The Company’s capital amounts and classifications are also subject to qualitative judgments by the regulators about components, risk weightings, and other factors.
Management believes, as of December 31, 2009, that the Company meets all capital adequacy requirements to which it is subject. As of December 31, 2009 and 2008, both the Company and the Bank qualified as “well capitalized” under applicable Federal Reserve Board and FDIC regulations.
ENTERPRISE BANCORP, INC.
Notes to Consolidated Financial Statements
The Company’s and the Bank’s actual capital amounts and ratios are presented in the following tables. To be categorized as well capitalized, the Company and the Bank must maintain minimum total, Tier 1 and, in the case of the Bank, leverage capital ratios as set forth below.
|
|
|
Actual |
|
Minimum Capital |
|
Minimum Capital |
|
|||||||||
|
(Dollars in thousands) |
|
Amount |
|
Ratio |
|
Amount |
|
Ratio |
|
Amount |
|
Ratio |
|
|||
|
As of December 31, 2009 |
|
|
|
|
|
|
|
|
|
|
|
|
|
|||
|
The Company |
|
|
|
|
|
|
|
|
|
|
|
|
|
|||
|
Total Capital (to risk weighted assets) |
|
$ |
124,929 |
|
11.08 |
% |
$ |
90,164 |
|
8.00 |
% |
$ |
112,706 |
|
10.00 |
% |
|
|
|
|
|
|
|
|
|
|
|
|
|
|
|
|||
|
Tier 1 Capital (to risk weighted assets) |
|
110,112 |
|
9.77 |
% |
45,082 |
|
4.00 |
% |
67,623 |
|
6.00 |
% |
|||
|
|
|
|
|
|
|
|
|
|
|
|
|
|
|
|||
|
Tier 1 Capital (to average assets) |
|
110,112 |
|
8.62 |
% |
51,120 |
|
4.00 |
% |
N/A |
|
N/A |
|
|||
|
|
|
|
|
|
|
|
|
|
|
|
|
|
|
|||
|
The Bank |
|
|
|
|
|
|
|
|
|
|
|
|
|
|||
|
Total Capital (to risk weighted assets) |
|
$ |
124,650 |
|
11.06 |
% |
$ |
90,166 |
|
8.00 |
% |
$ |
112,708 |
|
10.00 |
% |
|
|
|
|
|
|
|
|
|
|
|
|
|
|
|
|||
|
Tier 1 Capital (to risk weighted assets) |
|
109,833 |
|
9.74 |
% |
45,083 |
|
4.00 |
% |
67,625 |
|
6.00 |
% |
|||
|
|
|
|
|
|
|
|
|
|
|
|
|
|
|
|||
|
Tier 1 Capital (to average assets) |
|
109,833 |
|
8.61 |
% |
51,041 |
|
4.00 |
% |
63,801 |
|
5.00 |
% |
|||
|
|
|
|
|
|
|
|
|
|
|
|
|
|
|
|||
|
|
|
Actual |
|
Minimum Capital |
|
Minimum Capital |
|
|||||||||
|
(Dollars in thousands) |
|
Amount |
|
Ratio |
|
Amount |
|
Ratio |
|
Amount |
|
Ratio |
|
|||
|
As of December 31, 2008 |
|
|
|
|
|
|
|
|
|
|
|
|
|
|||
|
The Company |
|
|
|
|
|
|
|
|
|
|
|
|
|
|||
|
Total Capital (to risk weighted assets) |
|
$ |
106,511 |
|
10.70 |
% |
$ |
79,623 |
|
8.00 |
% |
$ |
99,529 |
|
10.00 |
% |
|
|
|
|
|
|
|
|
|
|
|
|
|
|
|
|||
|
Tier 1 Capital (to risk weighted assets) |
|
94,035 |
|
9.45 |
% |
39,812 |
|
4.00 |
% |
59,717 |
|
6.00 |
% |
|||
|
|
|
|
|
|
|
|
|
|
|
|
|
|
|
|||
|
Tier 1 Capital (to average assets) |
|
94,035 |
|
8.28 |
% |
45,432 |
|
4.00 |
% |
N/A |
|
N/A |
|
|||
|
|
|
|
|
|
|
|
|
|
|
|
|
|
|
|||
|
The Bank |
|
|
|
|
|
|
|
|
|
|
|
|
|
|||
|
Total Capital (to risk weighted assets) |
|
$ |
106,528 |
|
10.70 |
% |
$ |
79,620 |
|
8.00 |
% |
$ |
99,524 |
|
10.00 |
% |
|
|
|
|
|
|
|
|
|
|
|
|
|
|
|
|||
|
Tier 1 Capital (to risk weighted assets) |
|
94,053 |
|
9.45 |
% |
39,810 |
|
4.00 |
% |
59,715 |
|
6.00 |
% |
|||
|
|
|
|
|
|
|
|
|
|
|
|
|
|
|
|||
|
Tier 1 Capital (to average assets) |
|
94,053 |
|
8.29 |
% |
45,403 |
|
4.00 |
% |
56,753 |
|
5.00 |
% |
|||
* For the Bank to qualify as “well capitalized”, it must maintain a leverage capital ratio (Tier 1 capital to average assets) of at least 5%. This requirement does not apply to the Company.
ENTERPRISE BANCORP, INC.
Notes to Consolidated Financial Statements
Dividends
Neither the Company nor the Bank may declare or pay dividends on its stock if the effect thereof would cause stockholders’ equity to be reduced below applicable regulatory capital requirements or if such declaration and payment would otherwise violate regulatory requirements.
As the principal asset of the Company, the Bank currently provides the only source of cash for the payment of dividends by the Company. Under Massachusetts law, trust companies such as the Bank may pay dividends only out of “net profits” and only to the extent that such payments will not impair the Bank’s capital stock. Any dividend payment that would exceed the total of the Bank’s net profits for the current year plus its retained net profits of the preceding two years would require the Commissioner’s approval. The FDIC Improvement Act of 1991 also prohibits a bank from paying any dividends on its capital stock if the bank is in default on the payment of any assessment to the FDIC or if the payment of dividends would otherwise cause the bank to become undercapitalized. These restrictions on the ability of the Bank to pay dividends to the Company may restrict the ability of the Company to pay dividends to the holders of its common stock.
The statutory term “net profits” essentially equates with the accounting term “net income” and is defined under the Massachusetts banking statutes to mean the remainder of all earnings from current operations plus actual recoveries on loans and investments and other assets after deducting from such total all current operating expenses, actual losses, accrued dividends on any preferred stock and all federal and state taxes.
The Company maintains a dividend reinvestment plan (the “DRP”). The DRP enables stockholders, at their discretion, to elect to reinvest dividends paid on their shares of the Company’s common stock by purchasing additional shares of common stock from the Company at a purchase price equal to fair market value. Shareholders utilized the DRP to reinvest $1.1 million, of the $3.1 million total dividends paid by the Company in 2009, into 96,116 shares of the Company’s common stock, and $1.0 million, of the $2.9 million total dividends paid by the Company in 2008, into 85,586 shares of the Company’s common stock.
(9) Stock-Based Compensation Plans
The Company currently has three individual stock incentive plans (the 1998 plan as amended in 2001 (the “1998 Plan”), the 2003 plan, and the 2009 plan). The plans permit the Board of Directors to grant, under various terms, both incentive and non-qualified stock options, (as well as restricted stock, restricted stock units and stock appreciation rights) for the purchase of newly issued shares of common stock to officers and other employees, directors and consultants. These plans also allow for newly issued shares of common stock to be issued with or without restrictions, to officers and other employees, directors and consultants. As of December 31, 2009, 455,305 shares remain available for future grants under the 2003 and 2009 plans. The 1998 plan is closed to future grants, although several awards previously granted under this plan remain outstanding and may be exercised in the future.
To date the Company has utilized the plans to issue stock option awards and restricted stock awards to officers and other employees, and stock in lieu of cash fees to directors. No options or other awards of any kind have been granted to consultants.
Total stock-based compensation expense related to these plans was $707 thousand, $519 thousand and $573 thousand for the years ended 2009, 2008 and 2007 respectively. The total tax benefit recognized related to the stock-based compensation expense was $283
ENTERPRISE BANCORP, INC.
Notes to Consolidated Financial Statements
thousand, $207 thousand and $201 thousand, for the years ended 2009, 2008 and 2007 respectively.
In February 2005, the Company’s shares began trading on the NASDAQ National Market (now the NASDAQ Global Market) under the trading symbol “EBTC”, and all stock options and any other equity based compensation granted after this date utilize the Company’s NASDAQ Global Market trading price for purposes of determining the fair market value of the common stock on the date of the grant. Prior to February 14, 2005, in the absence of an active trading market for the Company’s common stock, the per share exercise price on all stock options granted had been determined on the basis of a fair market valuation provided to the Company by an outside financial advisor, which does not necessarily reflect the actual prices at which shares of the common stock had been purchased and sold in privately negotiated transactions.
Stock Option Awards
Accounting guidance requires that the stock-based compensation expense recognized in earnings be based on the amount of awards ultimately expected to vest; therefore, a forfeiture assumption must be estimated at the time of grant and revised, if necessary, in subsequent periods if actual forfeitures differ from those estimates. The Company has estimated forfeitures based on historical experience for the portion of the grant which had vested and/or grants already vested based on similarities in the type of options and employee group.
All options that have been granted under the plans generally become exercisable at the rate of 25% per year on the anniversary date of the original grant, and provide for accelerated vesting of the entire grant for those who are age 62 on the grant date or upon attaining age 62 during the normal vesting period. Vested options are only exercisable while the employee remains employed with the Bank and for a limited period thereafter. Options have been granted with expiration dates ranging between 7 to 10 years from the date of grant. All unexercised options granted prior to 2003 have expired. Options outstanding at December 31, 2009 consist of grants from 2004 and 2007 through 2009 which expire 7 years from the grant date, and options granted in 2005 and 2006 which expire 8 years from the grant date. There were no options granted in 2003.
Under the terms of the plans, incentive stock options may not be granted at less than 100% of the fair market value of the shares on the date of grant and may not have a term of more than ten years. Any shares of common stock reserved for issuance pursuant to options granted under the plans that are returned to the Company unexercised shall remain available for issuance under such plans. For participants owning 10% or more of the Company’s outstanding common stock (of which there are currently none), incentive stock options may not be granted at less than 110% of the fair market value of the shares on the date of grant.
ENTERPRISE BANCORP, INC.
Notes to Consolidated Financial Statements
The Company utilizes the Black-Scholes option valuation model in order to determine the per share grant date fair value of option grants. The table below provides a summary of the options granted, fair value, the fair value as a percentage of the market value of the stock at the date of grant and the average assumptions used in the model for the years indicated.
|
|
|
2009 |
|
2008 |
|
2007 |
|
|||
|
|
|
|
|
|
|
|
|
|||
|
Options granted |
|
51,050 |
|
132,000 |
|
127,600 |
|
|||
|
Per share weighted average fair value |
|
$ |
2.51 |
|
$ |
2.47 |
|
$ |
3.69 |
|
|
Percentage of market value at grant date |
|
29 |
% |
19 |
% |
22 |
% |
|||
|
Average assumptions used in the model: |
|
|
|
|
|
|
|
|||
|
Expected volatility |
|
40 |
% |
25 |
% |
21 |
% |
|||
|
Expected dividend yield |
|
4.54 |
% |
2.82 |
% |
2.03 |
% |
|||
|
Expected life in years |
|
5.5 |
|
5.5 |
|
5.5 |
|
|||
|
Risk-free interest rate |
|
2.32 |
% |
2.61 |
% |
4.43 |
% |
|||
The expected volatility is the anticipated variability in the Company’s share price over the expected life of the option. The Company’s shares began trading on a public exchange in February 2005 and limited trading has occurred. Management assesses the Company’s expected volatility by comparing the Company’s historical volatility to that of peer financial institutions and a banking index.
The expected dividend yield is the Company’s annualized dividend rate divided by its share price at the date of grant.
The expected life represents the period of time that the option is expected to be outstanding. The Company utilized the simplified method and under this method, the expected term equals the vesting term plus the contractual term divided by 2.
The risk-free interest rate is based on the U.S. Treasury rate in effect at the time of grant for a period equivalent to the expected life of the option.
Stock option transactions during the year ended December 31, 2009 are summarized as follows:
|
|
|
Options |
|
Wtd. Avg. |
|
Wtd. Avg. |
|
Aggregate |
|
||
|
Outstanding at December 31, 2008 |
|
771,231 |
|
$ |
13.83 |
|
3.70 |
|
$ |
276,242 |
|
|
Granted |
|
51,050 |
|
8.75 |
|
|
|
|
|
||
|
Exercised |
|
124,483 |
|
9.11 |
|
|
|
|
|
||
|
Forfeited |
|
10,093 |
|
13.44 |
|
|
|
|
|
||
|
Outstanding December 31, 2009 |
|
687,705 |
|
14.31 |
|
3.55 |
|
$ |
111,650 |
|
|
|
|
|
|
|
|
|
|
|
|
|
||
|
Vested and Exercisable at December 31, 2009 |
|
514,883 |
|
$ |
14.85 |
|
3.00 |
|
$ |
8,360 |
|
The aggregate intrinsic value in the table above represents the difference between the closing price of the Company’s common stock on December 31, 2009 and the exercise price, multiplied by the number of options. If the closing price was less than the exercise price of the option, no intrinsic value was assigned to the grant. In-the-money vested options total 50,750 at December 31, 2009. The intrinsic value of options vested and exercisable represents the total pretax intrinsic value that would have been received by the option holders had all in-the-money vested option holders
ENTERPRISE BANCORP, INC.
Notes to Consolidated Financial Statements
exercised their options on December 31, 2009. The intrinsic value will change based on the fair market value of the Company’s stock.
Cash received from option exercises was $222 thousand, $119 thousand and $598 thousand in 2009, 2008 and 2007, respectively. Total intrinsic value of options exercised was $368 thousand, $86 thousand and $1.1 million in 2009, 2008 and 2007, respectively.
The actual tax benefit arising during the period for the tax deduction from the disqualifying disposition of shares acquired upon exercise was $13 thousand, $4 thousand and $16 thousand in 2009, 2008, and 2007, respectively.
Compensation expense recognized in association with the stock option awards amounted to $254 thousand, $301 thousand and $358 thousand for the years ended 2009, 2008 and 2007, respectively. The total tax benefit recognized related to the stock option expense was $98 thousand, $118 thousand, and $113 thousand for the years ended 2009, 2008, and 2007, respectively.
As of December 31, 2009, there was $293 thousand of unrecognized stock-based compensation expense, net of estimated forfeitures, related to non-vested stock options. That cost is expected to be recognized over the remaining weighted average vesting period of 2.1 years.
Restricted Stock Awards
Compensation expense recognized in association with the restricted stock award amounted to $263 thousand for the year ended December 31, 2009 and $50 thousand for the each of the years ended December 31, 2008 and 2007. The total tax benefit recognized related to the restricted stock compensation expense was $108 thousand for the year ended December 31, 2009 and $20 thousand for each of the years ended December 31, 2008 and 2007.
During the first quarter of 2009, the Company granted 83,200 shares of common stock to employees as restricted stock awards. These were the only restricted stock awards granted in 2009. The grant date fair value of the restricted stock awarded was $8.75 per share, which reflects the market value of the common stock on the grant date. Of the 2009 award, 43,200 shares vest twenty-five percent per year and 40,000 shares vest fifty percent per year, in each case starting on the first anniversary date of the award. There have been 150 awards forfeited to date.
There were no restricted stock awards granted in 2008. Prior to the 2009 restricted stock grant, the Company had granted one restricted stock award, comprised of 17,500 shares, issued in September 2005. The grant date fair value of the restricted stock awarded was $14.25 per share, which reflects the market value of the common stock on the grant date. The shares granted vest twenty percent per year starting on the first anniversary date of the award and there have been no forfeitures to date.
The restricted stock awards allow for the receipt of dividends, and the voting of all shares, whether or not vested, throughout the vesting periods.
As of December 31, 2009, 14,000 restricted stock award shares have vested and 86,550 remain unvested. As of December 31, 2009, there remained $547 thousand of unrecognized compensation expense related to the restricted stock award. That cost is expected to be recognized over the remaining vesting period of 2.3 years.
Director Stock Compensation
The members of the Company’s Board of Directors are offered the choice to receive newly issued shares of the Company’s common stock in lieu of cash compensation for attendance at Board and Board Committee meetings. Directors must make an irrevocable
ENTERPRISE BANCORP, INC.
Notes to Consolidated Financial Statements
election to receive shares of common stock in lieu of cash compensation prior to December 31st of the preceding year. Directors are granted shares of common stock in lieu of cash fees at a per share price which reflects the value of the common stock on the first business day of the year, based on the average of the high and low trade prices of the common stock on that date.
Total Director Compensation expense amounted to $288 thousand, $278 thousand and $256 thousand for the years ended December 31, 2009, 2008 and 2007, respectively.
Included in the 2009 expense was stock compensation of $190 thousand, which represented 16,891 shares issued to Directors in January 2010, at a fair market value price of $11.275 per share, which reflected the fair value of the common stock on January 2, 2009.
Included in the 2008 expense was stock compensation of $168 thousand, which represented 13,013 shares issued to Directors in January 2009, at a fair market value price of $12.875 per share, which reflected the fair value of the common stock on January 2, 2008.
Included in the 2007 expense was stock compensation of $165 thousand, which represented 10,739 shares issued to Directors in January 2008, at a fair market value price of $15.40 per share, which reflected the value of the common stock on January 3, 2007.
The total tax benefit recognized related to the Director stock compensation expense was $78 thousand, $69 thousand and $68 thousand, for the years ended 2009, 2008 and 2007 respectively.
(10) Employee Benefit Plans
401(k) Defined Contribution Plan
The Company has a 401(k) defined contribution employee benefit plan. The 401(k) plan allows eligible employees to contribute a base percentage, plus a supplemental percentage, of their earnings to the plan. A portion of the base percentage, as determined by the Compensation Committee of the Board of Directors, is matched by the Company. The percentage matched was 50% in 2008 and 2007 and respectively, up to the first 6% contributed by the employee. The Company’s percentage match was increased beginning January 1, 2009 to 60% up to the first 6% contributed by the employee. The Company’s total expense for the 401(k) plan match, including any discretionary match as discussed below, was $531 thousand, $424 thousand and $382 thousand, respectively, for the years ended December 31, 2009, 2008, and 2007.
All eligible employees, at least 18 years of age and completing 1 hour of service, may participate. Vesting for the Company’s 401(k) plan matching contribution is based on years of service with participants becoming 20% vested on January 1st of the year following their date of hire and each subsequent January 1st increasing pro-rata to 100% vesting on January 1st following five years of service. Amounts not distributable to an employee following termination of employment are used to offset plan expenses and other contributions.
Employee Bonus and Incentive Programs
The Company’s bonus and incentive programs include all employees and are approved by the Compensation Committee of the Board of Directors. Bonuses are paid to employees based on the accomplishment of certain goals and objectives that are determined at the beginning of the fiscal year and may also be granted on a discretionary basis based on performance.
ENTERPRISE BANCORP, INC.
Notes to Consolidated Financial Statements
From time to time the Company may also make an annual discretionary employer contribution to the 401(k) plan of an additional percentage of employee contributions.
In 2009, 2008 and 2007 amounts charged to salaries and benefits under these programs were $766 thousand, $475 thousand and $1.0 million, respectively.
Supplemental Retirement Plan
In 2005 the Company entered into salary continuation and supplemental life insurance agreements (see Supplement Life Insurance below) with three of its senior executives.
The salary continuation agreements (SERPs) provide for a predetermined fixed-cash supplemental retirement benefit, the amount subject to vesting requirements, to be provided for a period of 20 years after the individual reaches a defined “retirement age.”
This non-qualified plan represents a direct liability of the Company, and as such has no specific assets set aside to settle the benefit obligation. The funded status is the aggregate amount accrued, or the “Accumulated Postretirement Benefit Obligation”, which is equal to the present value of the retirement benefits to be provided to the employee or any beneficiary in exchange for the employee’s service rendered to that date. Because the Company’s retirement benefit obligations provide for predetermined fixed-cash payments the Company does not have any unrecognized costs to be included as a component of accumulated other comprehensive income.
The amounts charged to expense for the SERPs was $341 thousand, $503 thousand and $678 thousand, for the years ended December 31, 2009, 2008 and 2007, respectively. The Company anticipates accruing an additional $240 thousand to the plan for the year ending December 31, 2010.
The following table provides a reconciliation of the changes in the supplemental retirement benefit obligation and the net periodic benefit cost for the years ended December 31:
|
(Dollars in thousands) |
|
2009 |
|
2008 |
|
2007 |
|
|||
|
|
|
|
|
|
|
|
|
|||
|
Reconciliation of benefit obligation: |
|
|
|
|
|
|
|
|||
|
Benefit obligation at beginning of year |
|
$ |
2,870 |
|
$ |
2,477 |
|
$ |
1,799 |
|
|
Service cost |
|
164 |
|
339 |
|
552 |
|
|||
|
Interest cost |
|
177 |
|
164 |
|
126 |
|
|||
|
Benefits paid |
|
(180 |
) |
(110 |
) |
— |
|
|||
|
Benefit obligation at end of year |
|
$ |
3,031 |
|
$ |
2,870 |
|
$ |
2,477 |
|
|
|
|
|
|
|
|
|
|
|||
|
Funded status: |
|
|
|
|
|
|
|
|||
|
Accrued liability as of December 31 |
|
$ |
(3,031 |
) |
$ |
(2,870 |
) |
$ |
(2,477 |
) |
|
|
|
|
|
|
|
|
|
|||
|
Discount rate used for benefit obligation |
|
6.00 |
% |
6.00 |
% |
6.00 |
% |
|||
|
|
|
|
|
|
|
|
|
|||
|
Net periodic benefit cost: |
|
|
|
|
|
|
|
|||
|
Service cost |
|
$ |
164 |
|
$ |
339 |
|
$ |
552 |
|
|
Interest cost |
|
177 |
|
164 |
|
126 |
|
|||
|
|
|
$ |
341 |
|
$ |
503 |
|
$ |
678 |
|
Management utilizes the Moody’s 20 year A and AA corporate bond rates to evaluate the reasonableness of the discount rate used. The Company recognizes that the duration of the benchmark should reflect the timing of the cash flows of each benefit obligation. However, since the duration of most fixed income investments do not exceed 20 years and the cash flows on the benefit obligations may extend to 30-40 years, it was resolved that the Company shall assume a long term duration for all participants.
ENTERPRISE BANCORP, INC.
Notes to Consolidated Financial Statements
Benefits expected to be paid in each of the next five years and in the aggregate five years thereafter:
|
(Dollars in thousands) |
|
|
|
|
|
2010 |
|
$ |
244 |
|
|
2011 |
|
276 |
|
|
|
2012 |
|
276 |
|
|
|
2013 |
|
276 |
|
|
|
2014 |
|
276 |
|
|
|
2015-2019 |
|
1,379 |
|
|
Bank Owned Life Insurance
The Company has purchased bank owned life insurance (“BOLI”) on certain senior and executive officers. The cash surrender value carried on the balance sheet at December 31, 2009 and December 31, 2008 amounted to $13.8 million and $13.3 million, respectively. There are no associated surrender charges under the outstanding policies.
Supplemental Life Insurance
For certain senior and executive officers on whom the Bank owns BOLI, the Bank has provided supplement life insurance which provides a death benefit to the officer’s designated beneficiaries.
On January 1, 2008, the FASB issued new accounting guidance for deferred compensation and postretirement benefit aspects of endorsement split dollar life insurance arrangements, which required that an employer recognize a liability for future benefits associated with an endorsement split-dollar life insurance arrangement that provides a benefit to an employee that extends to postretirement periods. Upon adoption of the accounting guidance, the Company recorded a cumulative-effect adjustment to retained earnings of $1.0 million.
This non-qualified plan represents a direct liability of the Company, and as such has no specific assets set aside to settle the benefit obligation. The funded status is the aggregate amount accrued, or the “Accumulated Postretirement Benefit Obligation”, which is the present value of the future benefits associated with this arrangement.
The following table provides a reconciliation of the changes in the supplemental life insurance plan and the net periodic benefit cost for the years ended December 31:
|
(Dollars in thousands) |
|
2009 |
|
2008 |
|
||
|
|
|
|
|
|
|
||
|
Reconciliation of benefit obligation: |
|
|
|
|
|
||
|
Benefit obligation at beginning of year |
|
$ |
1,092 |
|
$ |
— |
|
|
Cumulative effect adjustment to retained earnings |
|
— |
|
1,010 |
|
||
|
Service cost |
|
21 |
|
20 |
|
||
|
Interest cost |
|
81 |
|
62 |
|
||
|
Benefit obligation at end of year |
|
$ |
1,194 |
|
$ |
1,092 |
|
|
|
|
|
|
|
|
||
|
Funded status: |
|
|
|
|
|
||
|
Accrued liability as of December 31 |
|
$ |
(1,194 |
) |
$ |
(1,092 |
) |
|
|
|
|
|
|
|
||
|
Discount rate used for benefit obligation |
|
6.00 |
% |
6.00 |
% |
||
|
Net periodic benefit cost: |
|
|
|
|
|
||
|
Service cost |
|
$ |
21 |
|
$ |
20 |
|
|
Interest cost |
|
81 |
|
62 |
|
||
|
|
|
$ |
102 |
|
$ |
82 |
|
ENTERPRISE BANCORP, INC.
Notes to Consolidated Financial Statements
For management’s method of evaluating the discount rate, refer to the Supplemental Retirement Plan.
The benefit expense of the postretirement cost of insurance for split dollar insurance coverage amounted to $102 thousand for the year ended December 31, 2009, $82 thousand for the year ended December 31, 2008 and $0 for the year ended December 31, 2007. The Company anticipates accruing an additional $26 thousand to the plan for the year ending December 31, 2010.
See note 9 “Stock-Based Compensation Plans” above, for additional information regarding employee benefits offered in the form of stock option awards.
(11) Income Taxes
The components of income tax expense for the years ended December 31 were calculated using the asset and liability method as follows:
|
(Dollars in thousands) |
|
2009 |
|
2008 |
|
2007 |
|
|||
|
|
|
|
|
|
|
|
|
|||
|
Current tax expense: |
|
|
|
|
|
|
|
|||
|
Federal |
|
$ |
3,482 |
|
$ |
3,362 |
|
$ |
4,464 |
|
|
State |
|
1,272 |
|
1,109 |
|
1,665 |
|
|||
|
Total current tax expense |
|
4,754 |
|
4,471 |
|
6,129 |
|
|||
|
|
|
|
|
|
|
|
|
|||
|
Deferred tax (benefit)/ expense: |
|
|
|
|
|
|
|
|||
|
Federal |
|
(1,144 |
) |
(2,155 |
) |
(853 |
) |
|||
|
State |
|
(392 |
) |
33 |
|
(231 |
) |
|||
|
Total deferred tax benefit |
|
(1,536 |
) |
(2,122 |
) |
(1,084 |
) |
|||
|
|
|
|
|
|
|
|
|
|||
|
Total income tax expense |
|
$ |
3,218 |
|
$ |
2,349 |
|
$ |
5,045 |
|
On July 3, 2008, the Commonwealth of Massachusetts enacted a law that included reducing future tax rates on net income applicable to financial institutions. For tax years beginning on or after January 1, 2010, the tax rate drops from the current rate of 10.5% to 10%, for tax years beginning on or after January 1, 2011 the rate drops to 9.5%, and to 9% for tax years beginning on or after January 1, 2012 and thereafter. Therefore, the Company recorded additional income tax expense of approximately $130 thousand in the third quarter of 2008 to adjust the Company’s net deferred tax assets down to the future realizable tax rates.
The provision for income taxes differs from the amount computed by applying the statutory federal income tax rate as follows:
|
|
|
2009 |
|
2008 |
|
2007 |
|
|||||||||
|
(Dollars in thousands) |
|
Amount |
|
% |
|
Amount |
|
% |
|
Amount |
|
% |
|
|||
|
|
|
|
|
|
|
|
|
|
|
|
|
|
|
|||
|
Computed income tax expense at statutory rate |
|
$ |
3,796 |
|
34.0 |
% |
$ |
2,685 |
|
34.0 |
% |
$ |
5,081 |
|
34.0 |
% |
|
State income taxes, net of federal tax benefit |
|
581 |
|
5.2 |
% |
754 |
|
9.6 |
% |
946 |
|
6.3 |
% |
|||
|
Tax exempt income, net of disallowance |
|
(1,035 |
) |
(9.3 |
)% |
(936 |
) |
(11.9 |
)% |
(741 |
) |
(5.0 |
)% |
|||
|
Bank Owned Life Insurance |
|
(184 |
) |
(1.6 |
)% |
(186 |
) |
(2.4 |
)% |
(184 |
) |
(1.2 |
)% |
|||
|
Other |
|
60 |
|
0.5 |
% |
32 |
|
0.4 |
% |
(57 |
) |
(0.3 |
)% |
|||
|
|
|
|
|
|
|
|
|
|
|
|
|
|
|
|||
|
Total income tax expense |
|
$ |
3,218 |
|
28.8 |
% |
$ |
2,349 |
|
29.7 |
% |
$ |
5,045 |
|
33.8 |
% |
ENTERPRISE BANCORP, INC.
Notes to Consolidated Financial Statements
At December 31 the tax effects of each type of income and expense item that give rise to deferred taxes are:
|
(Dollars in thousands) |
|
2009 |
|
2008 |
|
||
|
|
|
|
|
|
|
||
|
Deferred tax asset: |
|
|
|
|
|
||
|
Allowance for loan losses |
|
$ |
7,357 |
|
$ |
6,160 |
|
|
Depreciation |
|
2,227 |
|
1,959 |
|
||
|
Other-than-temporary impairment on equity securities |
|
959 |
|
1,259 |
|
||
|
Supplemental employee retirement plans |
|
1,223 |
|
1,157 |
|
||
|
Non-accrual interest |
|
838 |
|
487 |
|
||
|
Non-qualified stock option expense |
|
375 |
|
279 |
|
||
|
Other |
|
34 |
|
24 |
|
||
|
|
|
|
|
|
|
||
|
Total |
|
13,013 |
|
11,325 |
|
||
|
|
|
|
|
|
|
||
|
Deferred tax liability: |
|
|
|
|
|
||
|
Goodwill |
|
1,098 |
|
940 |
|
||
|
Net unrealized gains on investments securities |
|
1,148 |
|
608 |
|
||
|
Deferred origination costs |
|
422 |
|
394 |
|
||
|
Other |
|
— |
|
34 |
|
||
|
|
|
|
|
|
|
||
|
Total |
|
2,668 |
|
1,976 |
|
||
|
|
|
|
|
|
|
||
|
Net deferred tax asset |
|
$ |
10,345 |
|
$ |
9,349 |
|
Management believes that it is more likely than not that current recoverable income taxes and the expectation of future taxable income, based on the Company’s history of reporting taxable income, will generate sufficient taxable income to realize the deferred tax asset existing at December 31, 2009. The Company paid total income taxes for 2009, 2008, and 2007 of $4.0 million, $4.8 million and $5.0 million, respectively. However, factors, beyond management’s control, such as the general state of the economy can affect future levels of taxable income and there can be no assurances that sufficient taxable income will be generated to fully realize the deferred tax assets in the future. In addition, management has the ability to sell any of the equity securities affected by the OTTI charge. A sale of the equity securities would ensure that, for tax purposes, a portion of the losses on sales could be applied against investment gains realized on the portfolio during the past two years, before the ability to carry back losses against these gains expires.
The Company did not have any unrecognized tax benefits accrued as income tax liabilities or receivables or as deferred tax items at December 31, 2009 or December 31, 2008. The Company’s tax years beginning after December 31, 2006 are open to federal and state income tax examinations.
(12) Related Party Transactions
The Bank leases its headquarters from a realty trust, the sole beneficiary of which is a limited partnership in which one of the Company’s Directors, who became a member of the Board of Directors in 2008, holds a 13.7% limited partnership interest. Total amounts paid by the Bank to this realty trust for annual rent for the years ended December 31, 2009, 2008, and 2007, were $250 thousand, $237 thousand, and $242 thousand, respectively. The Company believes that the terms of this lease, including the amounts paid by the Bank, are substantially similar to such terms as would be included in a comparable lease transaction entered into at the time of such lease with a party who is not affiliated with the Bank or any of its Directors.
The Bank formerly leased another building used for operations from another realty trust, the sole beneficiary of which was a general partnership in which two of the
ENTERPRISE BANCORP, INC.
Notes to Consolidated Financial Statements
Company’s Directors (one of whom was the Director who joined the Board in 2008) held a combined 18.6% general partnership interest. The Bank purchased this building in 2007 for $2.8 million. This purchase price was based on an independent market appraisal of the building and the transaction was reviewed and approved by the Company’s Board of Directors, with the one Director who had a financial interest in the transaction and was then a current member of the Board abstaining from the approval process.
Prior to the Bank’s purchase of the building, the Bank paid $331 thousand to this realty trust for annual rent, which the Company believes approximated a market rate, for the year ended December 31, 2007.
The Bank also formerly leased a parking lot that was used by the Bank’s employees from a third realty trust in which the Director who joined the Board in 2008 held a 25% beneficial interest. The Bank purchased this parking lot in 2007 for $188 thousand, which the Company believes approximated fair market value. Prior to the Bank’s purchase of the parking lot, the Bank paid $3 thousand to this realty trust for annual rent, which the Company believes approximated a market rate, for the year ended December 31, 2007.
See note 3 “Loans and Loans Held for Sale” above, for information regarding loans to related parties.
(13) Commitments, Contingencies and Financial Instruments with Off-Balance Sheet Risk and Concentrations of Credit Risk
The Company is party to financial instruments with off-balance sheet risk in the normal course of business to meet the financing needs of its customers. These financial instruments include commitments to originate loans, standby letters of credit and unadvanced portions of loans and lines of credit.
The instruments involve, to varying degrees, elements of credit risk in excess of the amount recognized in the balance sheets. The contract amounts of these instruments reflect the extent of involvement the Company has in the particular classes of financial instruments.
The Company’s exposure to credit loss in the event of nonperformance by the other party to the financial instrument for loan commitments and standby letters of credit is represented by the contractual amounts of those instruments. The Company uses the same credit policies in making commitments and conditional obligations as it does for on-balance sheet instruments.
Financial instruments with off-balance sheet credit risk at December 31, 2009 and 2008 are as follows:
|
(Dollars in thousands) |
|
2009 |
|
2008 |
|
||
|
|
|
|
|
|
|
||
|
Commitments to originate loans |
|
$ |
31,612 |
|
$ |
32,448 |
|
|
Commitments to originate loans for sale |
|
2,875 |
|
2,331 |
|
||
|
Commitments to sell loans |
|
3,255 |
|
3,927 |
|
||
|
Standby letters of credit |
|
21,019 |
|
17,197 |
|
||
|
Unadvanced portions of consumer loans (including credit card loans and overdraft protection lines) |
|
3,585 |
|
3,710 |
|
||
|
Unadvanced portions of construction loans (cmml & resid) |
|
65,099 |
|
64,976 |
|
||
|
Unadvanced portions of home equity lines |
|
57,771 |
|
55,494 |
|
||
|
Unadvanced portions of commercial loans and lines |
|
189,685 |
|
164,709 |
|
||
ENTERPRISE BANCORP, INC.
Notes to Consolidated Financial Statements
Commitments to originate loans are agreements to lend to a customer provided there is no violation of any condition established in the contract. Commitments generally have fixed expiration dates or other termination clauses and may require payment of a fee. Since some of the commitments are expected to expire without being drawn upon, the total commitment amounts do not necessarily represent future cash requirements. The Company evaluates each customer’s credit worthiness on a case-by-case basis. The amount of collateral obtained, if deemed necessary by the Company upon extension of credit, is based on management’s credit evaluation of the borrower.
The Company originates residential mortgage loans under agreements to sell such loans, generally with servicing released. All loans sold are currently sold without recourse, subject to an early payment default period covering the first four payments for certain loan sales
Standby letters of credit are conditional commitments issued by the Company to guarantee the performance by a customer to a third party. The credit risk involved in issuing letters of credit is essentially the same as that involved in extending loan facilities to customers. If the letter of credit is drawn upon the Company creates a loan for the customer with the same criteria associated with similar loans.
Unadvanced portions of loans and lines of credit represent credit extended to customers but not yet drawn upon, and are secured or guaranteed under preexisting loan agreements. Commercial loans and lines may be collateralized by the assets underlying the borrower’s business such as accounts receivable, equipment, inventory and real property or may be unsecured loans and lines to financially strong borrowers and are generally guaranteed by the principals of the borrower. Commercial real estate loans are generally secured by the underlying real property and rental agreements. Residential mortgage and home equity loans are secured by the real property financed. Consumer loans such as installment loans are generally secured by the personal property financed. Credit card loans are generally unsecured. The Company manages its loan portfolio to avoid concentration by industry or loan size to minimize its credit risk exposure.
The Bank is required by the FRB to maintain in reserves certain amounts of vault cash and/or deposits with the FRB. The average daily reserve requirement included in “Cash and Due from Banks” was approximately $1.2 million and $858 thousand, based on the two week computation periods encompassing December 31, 2009, and 2008, respectively.
The Company is involved in various legal proceedings incidental to its business. After review with legal counsel, management does not believe resolution of any present litigation will have a material adverse effect on the financial condition or results of operations of the Company.
(14) Fair Values of Financial Instruments
Fair Value Measurements
On January 1, 2008, the Company adopted new accounting guidance regarding fair value measurements which provides a single definition of fair value and establishes a framework for measuring fair value in generally accepted accounting principles, with the intention of increasing consistency and comparability in fair value measurements. The primary impact of the application of this guidance was expanded disclosure requirements about fair value measurements. The adoption did not require any new fair value measurements, as the guidance applies under other existing accounting pronouncements that require or permit fair value measurements.
The fair value is defined as the price which a seller would receive in an orderly transaction between market participants (an exit price) and also establishes a fair value hierarchy segregating fair value measurements using three levels of inputs:
ENTERPRISE BANCORP, INC.
Notes to Consolidated Financial Statements
(Level 1) quoted market prices in active markets for identical assets or liabilities; (Level 2) significant other observable inputs, including quoted prices for similar items in active markets, quoted prices for identical or similar items in market that are not active, inputs such as interest rates and yield curves, volatilities, prepayment speeds, credit risks and default rates which provide a reasonable basis for fair value determination or inputs derived principally from observed market data; (Level 3) significant unobservable inputs for situations in which there is little, if any, market activity for the asset or liability. Unobservable inputs must reflect reasonable assumptions that market participants would use in pricing the asset or liability, which are developed on the basis of the best information available under the circumstances.
The following tables summarize significant assets and liabilities carried at fair value at December 31, 2009 and 2008:
|
|
|
December 31,
|
|
Fair Value Measurements using: |
|
||||||||
|
(Dollars in thousands) |
|
Fair Value |
|
(level 1) |
|
(level 2) |
|
(level 3) |
|
||||
|
Assets measured on a recurring basis: |
|
|
|
|
|
|
|
|
|
||||
|
Fixed income securities |
|
$ |
129,405 |
|
$ |
— |
|
$ |
129,405 |
|
$ |
— |
|
|
Equity securities |
|
4,964 |
|
4,964 |
|
— |
|
— |
|
||||
|
|
|
|
|
|
|
|
|
|
|
||||
|
Assets measured on a non-recurring basis: |
|
|
|
|
|
|
|
|
|
||||
|
Impaired loans |
|
7,912 |
|
— |
|
— |
|
7,912 |
|
||||
|
Other real estate owned |
|
1,086 |
|
— |
|
— |
|
1,086 |
|
||||
|
|
|
December 31,
|
|
Fair Value Measurements using: |
|
||||||||
|
(Dollars in thousands) |
|
Fair Value |
|
(level 1) |
|
(level 2) |
|
(level 3) |
|
||||
|
Assets measured on a recurring basis: |
|
|
|
|
|
|
|
|
|
||||
|
Fixed income securities |
|
$ |
148,638 |
|
$ |
— |
|
$ |
148,638 |
|
$ |
— |
|
|
Equity securities |
|
5,995 |
|
5,995 |
|
— |
|
— |
|
||||
|
|
|
|
|
|
|
|
|
|
|
||||
|
Assets measured on a non-recurring basis: |
|
|
|
|
|
|
|
|
|
||||
|
Impaired loans |
|
1,272 |
|
— |
|
— |
|
1,272 |
|
||||
|
Other real estate owned |
|
318 |
|
— |
|
— |
|
318 |
|
||||
Investment securities that are considered “available for sale” are carried at fair value. The fixed income category above includes, federal agency obligations, federal agency MBS, non-agency MBS, and municipal securities, as held at those periods. The Company utilizes third-party pricing vendors to provide valuations on its fixed income securities. These vendors generally determine fair value prices based upon pricing matrices utilizing observable market data inputs for similar or benchmark securities, therefore these securities are categorized as Level 2 within the fair value hierarchy. The Company’s equity portfolio fair value is measured based on quoted market prices for the shares, therefore these securities are categorized as Level 1 within the fair value hierarchy. Net unrealized appreciation and depreciation on investments available for sale, net of applicable income taxes, are reflected as a component of accumulated other comprehensive income.
Impaired loan balances in the table above represent those collateral dependent impaired commercial loans where management has estimated the credit loss by comparing the loan’s carrying value against the expected realizable fair value of the collateral (appraised value less estimated cost to sell, adjusted as necessary for changes in relevant valuation factors subsequent to the measurement date). Certain inputs used in appraisals, and possible subsequent adjustments, are not always observable, and therefore, collateral dependent impaired loans are categorized as Level 3 within the fair value hierarchy. A specific allowance is assigned to the collateral dependent impaired loan for the amount of management’s estimated credit loss. The specific allowances assigned to the collateral dependent impaired loans at
ENTERPRISE BANCORP, INC.
Notes to Consolidated Financial Statements
December 31, 2009 amounted to $2.0 million, a net increase of $1.7 million since December 31, 2008.
Real estate acquired by the Company through foreclosure proceedings or the acceptance of a deed in lieu of foreclosure is classified as Other Real Estate Owned (“OREO”). When property is acquired, it is generally recorded at the lesser of the loan’s remaining principal balance, net of unamortized deferred fees, or the estimated fair value of the property acquired, less estimated costs to sell. The estimated fair value is based on market appraisals. Certain inputs used in appraisals are not always observable, and therefore, OREO may be categorized as Level 3 within the fair value hierarchy.
Other Guarantees and Commitments
Standby letters of credit are conditional commitments issued by the Company to guarantee the performance by a customer to a third party. The fair value of these commitments was estimated to be the fees charged to enter into similar agreements, and accordingly these fair value measures are deemed to be FASB Level 2 measurements. In accordance with the FASB, the estimated fair values of these commitments are carried on the balance sheet as a liability and amortized to income over the life of the letters of credit, which are typically one year. The estimated fair value of these commitments carried on the balance sheet was $53 thousand and $12 thousand at December 31, 2009 and 2008, respectively, and were deemed immaterial.
Interest rate lock commitments related to the origination of mortgage loans that will be sold are considered derivative instruments. The Company estimates the fair value of these derivatives using the difference between the guaranteed interest rate in the commitment and the current market interest rate. To reduce the net interest rate exposure arising from its loan sale activity, the Company enters into the commitment to sell these loans at essentially the same time that the interest rate lock commitment is quoted on the origination of the loan. The commitments to sell loans are also considered derivative instruments, with estimated fair values based on changes in current market rates. These commitments represent the Company’s only derivative instruments and are accounted for in accordance with FASB guidance. The fair values of the Company’s derivative instruments are deemed to be FASB Level 2 measurements. At December 31, 2009 and December 31, 2008, the estimated fair value of the Company’s derivative instruments was considered to be immaterial.
Estimated Fair Values of Assets and Liabilities
In addition to disclosures regarding the measurement of assets and liabilities carried at fair value on the balance sheet, the Company is also required to disclosure fair value information about financial instruments for which it is practicable to estimate that value, whether or not recognized on the balance sheet. In cases where quoted fair values are not available, fair values are based upon estimates using various valuation techniques. Those techniques are significantly affected by the assumptions used, including the discount rate and estimates of future cash flows. The following methods and assumptions were used by the Company in estimating fair values of its financial instruments:
The respective carrying values of certain financial instruments approximated their fair value, as they were short-term in nature or payable on demand. These include cash and due from banks, total short-term investments, accrued interest receivable, repurchase agreements, accrued interest payable and non-certificate deposit accounts.
Investments: Fair values for investments were based on quoted market prices, where available, as provided by third-party accounting and pricing vendors. If quoted market prices were not available, fair values provided by the vendors were based on quoted market prices of comparable instruments in active markets and/or based on a matrix pricing methodology which employs The Bond Market Association’s standard
ENTERPRISE BANCORP, INC.
Notes to Consolidated Financial Statements
calculations for cash flow and price/yield analysis, live benchmark bond pricing and terms/condition data available from major pricing sources. Management regards the inputs and methods used by third party pricing vendors to be “Level 2 inputs and methods” as defined in the “fair value hierarchy” provided in ASC Topic 820.
The carrying amount of FHLB stock reported approximates fair value. If the FHLB stock is redeemed, the Company will receive an amount equal to the par value of the stock. The FHLB is currently operating with retained earnings below its target level. The FHLB has instituted a plan to increase retained earnings which includes suspending its quarterly dividend and a moratorium on the repurchase of excess capital stock from member banks, among other programs. If further deterioration in the FHLB financial condition or capital levels occurs, the FHLB capital stock may become other-than-temporarily impaired to some degree.
Loans: The fair value of loans was determined using discounted cash flow analysis, using interest rates currently being offered by the Company. The incremental credit risk for non-accrual loans was considered in the determination of the fair value of the loans.
Commitments: The fair values of the unused portion of lines of credit and letters of credit were estimated to be the fees currently charged to enter into similar agreements. Commitments to originate non-mortgage loans were short-term and were at current market rates and estimated to have no significant change in fair value.
Financial liabilities: The fair values of certificates of deposit and FHLB borrowings were estimated using discounted cash flow analysis using rates offered by the Bank, or advance rates offered by the FHLB on December 31, 2009 and 2008 for similar instruments. The fair value of junior subordinated debentures was estimated using discounted cash flow analysis using a market rate of interest at December 31, 2009 and 2008.
Limitations: The estimates of fair value of financial instruments were based on information available at December 31, 2009 and 2008 and are not indicative of the fair market value of those instruments as of the date of this report. These estimates do not reflect any premium or discount that could result from offering for sale at one time the Company’s entire holdings of a particular financial instrument.
Because no active market exists for a portion of the Company’s financial instruments, fair value estimates were based on judgments regarding future expected loss experience, current economic conditions, risk characteristics of various financial instruments, and other factors. These estimates are subjective in nature and involve uncertainties and matters of significant judgment and therefore cannot be determined with precision. Changes in assumptions could significantly affect the estimates.
Fair value estimates were based on existing on- and off-balance sheet financial instruments without an attempt to estimate the value of anticipated future business and the value of assets and liabilities that are not considered financial instruments, including premises and equipment and foreclosed real estate.
In addition, the tax ramifications related to the realization of the unrealized appreciation and depreciation can have a significant effect on fair value estimates and have not been considered in any of the estimates. Accordingly, the aggregate fair value amounts presented do not represent the underlying value of the Company.
ENTERPRISE BANCORP, INC.
Notes to Consolidated Financial Statements
The carry value and estimated fair values of the Company’s financial instruments as of December 31 are summarized as follows:
|
|
|
2009 |
|
2008 |
|
||||||||
|
(Dollars in thousands) |
|
Carrying |
|
Fair Value |
|
Carrying |
|
Fair |
|
||||
|
|
|
|
|
|
|
|
|
|
|
||||
|
Financial assets: |
|
|
|
|
|
|
|
|
|
||||
|
Cash and cash equivalents |
|
$ |
32,610 |
|
$ |
32,610 |
|
$ |
25,276 |
|
$ |
25,276 |
|
|
Investment securities |
|
139,109 |
|
139,109 |
|
159,373 |
|
159,373 |
|
||||
|
Loans, net |
|
1,064,612 |
|
1,058,786 |
|
933,372 |
|
955,010 |
|
||||
|
Accrued interest receivable |
|
5,368 |
|
5,368 |
|
5,357 |
|
5,357 |
|
||||
|
|
|
|
|
|
|
|
|
|
|
||||
|
Financial liabilities: |
|
|
|
|
|
|
|
|
|
||||
|
Non-interest demand deposits |
|
192,515 |
|
192,515 |
|
166,430 |
|
166,430 |
|
||||
|
Interest bearing checking, savings, money market accounts |
|
655,401 |
|
655,401 |
|
452,023 |
|
452,023 |
|
||||
|
Certificates of deposit (including brokered) |
|
297,032 |
|
297,431 |
|
329,450 |
|
330,184 |
|
||||
|
Borrowed funds |
|
24,876 |
|
24,927 |
|
121,250 |
|
121,274 |
|
||||
|
Junior subordinated debentures |
|
10,825 |
|
10,825 |
|
10,825 |
|
10,825 |
|
||||
|
Accrued interest payable |
|
1,320 |
|
1,320 |
|
1,849 |
|
1,849 |
|
||||
(15) Parent Company Only Financial Statements
Balance Sheets
|
|
|
December 31, |
|
||||
|
(Dollars in thousands) |
|
2009 |
|
2008 |
|
||
|
|
|
|
|
|
|
||
|
Assets |
|
|
|
|
|
||
|
Cash and due from subsidiary |
|
$ |
253 |
|
$ |
79 |
|
|
Investment in subsidiary |
|
118,581 |
|
102,301 |
|
||
|
Other assets |
|
36 |
|
47 |
|
||
|
Total assets |
|
$ |
118,870 |
|
$ |
102,427 |
|
|
|
|
|
|
|
|
||
|
Liabilities and Stockholders’ Equity |
|
|
|
|
|
||
|
Junior subordinated debentures |
|
$ |
10,825 |
|
$ |
10,825 |
|
|
Accrued interest payable |
|
370 |
|
370 |
|
||
|
Other liabilities |
|
11 |
|
128 |
|
||
|
Total liabilities |
|
11,206 |
|
11,323 |
|
||
|
|
|
|
|
|
|
||
|
Stockholder’s equity: |
|
|
|
|
|
||
|
Preferred stock, $0.01 par value per share; 1,000,000 shares authorized; no shares issued |
|
— |
|
— |
|
||
|
Common stock $0.01 par value per share; 20,000,000 shares authorized; 9,090,518 and 8,025,239 shares issued and outstanding at December 31, 2009 and 2008, respectively |
|
91 |
|
80 |
|
||
|
Additional paid-in capital |
|
40,453 |
|
29,698 |
|
||
|
Retained earnings |
|
65,042 |
|
60,200 |
|
||
|
Accumulated other comprehensive income |
|
2,078 |
|
1,126 |
|
||
|
Total stockholders’ equity |
|
107,664 |
|
91,104 |
|
||
|
|
|
|
|
|
|
||
|
Total liabilities and stockholders’ equity |
|
$ |
118,870 |
|
$ |
102,427 |
|
ENTERPRISE BANCORP, INC.
Notes to Consolidated Financial Statements
Statements of Income
|
|
|
For the years ended December 31, |
|
|||||||
|
(Dollars in thousands) |
|
2009 |
|
2008 |
|
2007 |
|
|||
|
Undistributed equity in net income of Subsidiary |
|
$ |
6,556 |
|
$ |
4,670 |
|
$ |
9,854 |
|
|
Dividends distributed by subsidiary |
|
2,800 |
|
2,220 |
|
1,225 |
|
|||
|
Total income |
|
9,356 |
|
6,890 |
|
11,079 |
|
|||
|
|
|
|
|
|
|
|
|
|||
|
Interest expense |
|
1,177 |
|
1,177 |
|
1,177 |
|
|||
|
Other operating expenses |
|
223 |
|
158 |
|
— |
|
|||
|
Total operating expenses |
|
1,400 |
|
1,335 |
|
1,177 |
|
|||
|
|
|
|
|
|
|
|
|
|||
|
Income before income taxes |
|
7,956 |
|
5,555 |
|
9,902 |
|
|||
|
Provision for(benefit from) income tax |
|
10 |
|
7 |
|
4 |
|
|||
|
|
|
|
|
|
|
|
|
|||
|
Net income |
|
$ |
7,946 |
|
$ |
5,548 |
|
$ |
9,898 |
|
Statements of Cash Flows
|
|
|
For the years ended December 31, |
|
|||||||
|
(Dollars in thousands) |
|
2009 |
|
2008 |
|
2007 |
|
|||
|
Cash flows from operating activities: |
|
|
|
|
|
|
|
|||
|
Net income |
|
$ |
7,946 |
|
$ |
5,548 |
|
$ |
9,898 |
|
|
Adjustments to reconcile net income to net cash |
|
|
|
|
|
|
|
|||
|
Undistributed equity in net income of subsidiary |
|
(6,556 |
) |
(4,670 |
) |
(9,854 |
) |
|||
|
Payment from subsidiary bank for stock compensation expense |
|
684 |
|
516 |
|
575 |
|
|||
|
(Increase)/decrease in other assets |
|
13 |
|
(10 |
) |
(17 |
) |
|||
|
Decrease in other liabilities |
|
(117 |
) |
128 |
|
— |
|
|||
|
Net cash provided by operating activities |
|
1,970 |
|
1,512 |
|
602 |
|
|||
|
|
|
|
|
|
|
|
|
|||
|
Cash flows from investing activities: |
|
|
|
|
|
|
|
|||
|
Purchase of equity securities |
|
— |
|
— |
|
— |
|
|||
|
Proceeds from sales of equity securities |
|
— |
|
— |
|
— |
|
|||
|
Investments in subsidiaries |
|
(8,774 |
) |
9 |
|
— |
|
|||
|
Net cash provided by investing activities |
|
(8,774 |
) |
9 |
|
— |
|
|||
|
|
|
|
|
|
|
|
|
|||
|
Cash flows from financing activities: |
|
|
|
|
|
|
|
|||
|
Cash dividends paid |
|
(3,104 |
) |
(2,865 |
) |
(2,498 |
) |
|||
|
Proceeds from issuance of common stock |
|
9,847 |
|
1,009 |
|
1,058 |
|
|||
|
Proceeds from exercise of stock options |
|
222 |
|
119 |
|
598 |
|
|||
|
Tax benefit from exercise of stock options |
|
13 |
|
4 |
|
16 |
|
|||
|
Net cash used in financing activities |
|
6,978 |
|
(1,733 |
) |
(826 |
) |
|||
|
|
|
|
|
|
|
|
|
|||
|
Net decrease in cash and cash equivalents |
|
174 |
|
(212 |
) |
(224 |
) |
|||
|
|
|
|
|
|
|
|
|
|||
|
Cash and cash equivalents, beginning of year |
|
79 |
|
291 |
|
515 |
|
|||
|
|
|
|
|
|
|
|
|
|||
|
Cash and cash equivalents, end of year |
|
$ |
253 |
|
$ |
79 |
|
$ |
291 |
|
Cash and cash equivalents include cash and due from subsidiary.
On September 10, 2009, the Company filed a shelf registration of rights and common stock with the Securities and Exchange Commission for the flexibility to raise, over a three year period, up to $25 million in capital. In the fourth quarter of 2009, the Company successfully completed a combined Shareholder Subscription Rights Offering and Supplemental Community Offering under the shelf registration, raising $8.9 million in new capital ($8.8 million net of offering expenses). The Company contributed the net proceeds from these offerings to the Bank.
ENTERPRISE BANCORP, INC.
Notes to Consolidated Financial Statements
The parent Company’s Statements of Changes in Shareholders’ Equity are identical to the Consolidated Statements of Changes in Shareholders’ Equity and therefore are not presented here.
(16) Quarterly Results of Operations (Unaudited)
|
|
|
2009 |
|
||||||||||
|
(Dollars in thousands, except share data) |
|
First |
|
Second |
|
Third |
|
Fourth |
|
||||
|
|
|
|
|
|
|
|
|
|
|
||||
|
Interest and dividend income |
|
$ |
15,220 |
|
$ |
15,272 |
|
$ |
15,791 |
|
$ |
16,059 |
|
|
Interest expense |
|
4,028 |
|
3,656 |
|
3,284 |
|
2,928 |
|
||||
|
Net interest income |
|
11,192 |
|
11,616 |
|
12,507 |
|
13,131 |
|
||||
|
Provision for loan losses |
|
1,102 |
|
864 |
|
1,140 |
|
1,740 |
|
||||
|
Net interest income after provision for loan losses |
|
10,090 |
|
10,752 |
|
11,367 |
|
11,391 |
|
||||
|
|
|
|
|
|
|
|
|
|
|
||||
|
Non-interest income |
|
2,160 |
|
2,371 |
|
2,365 |
|
2,686 |
|
||||
|
Other-than-temporary impairment charge |
|
(758 |
) |
(16 |
) |
(8 |
) |
(15 |
) |
||||
|
Net gains on sales of investment securities |
|
971 |
|
— |
|
— |
|
516 |
|
||||
|
Non-interest expense |
|
10,325 |
|
11,230 |
|
10,520 |
|
10,633 |
|
||||
|
Income before income taxes |
|
2,138 |
|
1,877 |
|
3,204 |
|
3,945 |
|
||||
|
Provision for income tax |
|
620 |
|
503 |
|
935 |
|
1,160 |
|
||||
|
Net income, as reported |
|
$ |
1,518 |
|
$ |
1,374 |
|
$ |
2,269 |
|
$ |
2,785 |
|
|
|
|
|
|
|
|
|
|
|
|
||||
|
Basic earnings per share |
|
$ |
0.19 |
|
$ |
0.17 |
|
$ |
0.28 |
|
$ |
0.32 |
|
|
|
|
|
|
|
|
|
|
|
|
||||
|
Diluted earnings per share |
|
$ |
0.19 |
|
$ |
0.17 |
|
$ |
0.28 |
|
$ |
0.32 |
|
|
|
|
2008 |
|
||||||||||
|
(Dollars in thousands, except share data) |
|
First |
|
Second |
|
Third |
|
Fourth |
|
||||
|
|
|
|
|
|
|
|
|
|
|
||||
|
Interest and dividend income |
|
$ |
16,159 |
|
$ |
15,611 |
|
$ |
15,976 |
|
$ |
15,859 |
|
|
Interest expense |
|
6,243 |
|
5,456 |
|
5,061 |
|
4,650 |
|
||||
|
Net interest income |
|
9,916 |
|
10,155 |
|
10,915 |
|
11,209 |
|
||||
|
Provision for loan losses |
|
317 |
|
550 |
|
1,173 |
|
465 |
|
||||
|
Net interest income after provision for loan losses |
|
9,599 |
|
9,605 |
|
9,742 |
|
10,744 |
|
||||
|
|
|
|
|
|
|
|
|
|
|
||||
|
Non-interest income |
|
2,350 |
|
2,388 |
|
2,405 |
|
2,345 |
|
||||
|
Other-than-temporary impairment charge |
|
— |
|
— |
|
— |
|
(3,702 |
) |
||||
|
Net gains on sales of investment securities |
|
47 |
|
— |
|
220 |
|
38 |
|
||||
|
Non-interest expense |
|
9,031 |
|
9,604 |
|
9,639 |
|
9,610 |
|
||||
|
Income (loss) before income taxes |
|
2,965 |
|
2,389 |
|
2,728 |
|
(185 |
) |
||||
|
Provision for (benefit from) income tax |
|
948 |
|
$ |
606 |
|
$ |
1,009 |
|
$ |
(214 |
) |
|
|
Net income, as reported |
|
$ |
2,017 |
|
1,783 |
|
1,719 |
|
29 |
|
|||
|
|
|
|
|
|
|
|
|
|
|
||||
|
Basic earnings per share |
|
$ |
0.25 |
|
$ |
0.22 |
|
$ |
0.22 |
|
$ |
0.00 |
|
|
|
|
|
|
|
|
|
|
|
|
||||
|
Diluted earnings per share |
|
$ |
0.25 |
|
$ |
0.22 |
|
$ |
0.21 |
|
$ |
0.00 |
|
REPORT OF INDEPENDENT REGISTERED PUBLIC ACCOUNTING FIRM
The Board of Directors
Enterprise Bancorp, Inc.:
We have audited the accompanying consolidated balance sheets of Enterprise Bancorp, Inc. and subsidiaries (the “Company”) as of December 31, 2009 and 2008, and the related consolidated statements of income, changes in stockholders’ equity, and cash flows for each of the years in the three-year period ended December 31, 2009. These consolidated financial statements are the responsibility of the Company’s management. Our responsibility is to express an opinion on these consolidated financial statements based on our audits.
We conducted our audits in accordance with the standards of the Public Company Accounting Oversight Board (United States). Those standards require that we plan and perform the audit to obtain reasonable assurance about whether the consolidated financial statements are free of material misstatement. An audit includes examining, on a test basis, evidence supporting the amounts and disclosures in the consolidated financial statements. An audit also includes assessing the accounting principles used and significant estimates made by management, as well as evaluating the overall financial statement presentation. We believe that our audits provide a reasonable basis for our opinion.
In our opinion, the consolidated financial statements referred to above present fairly, in all material respects, the financial position of Enterprise Bancorp, Inc. and subsidiaries as of December 31, 2009 and 2008, and the results of their operations and their cash flows for each of the years in the three-year period ended December 31, 2009, in conformity with U.S. generally accepted accounting principles.
We have also audited, in accordance with the standards of the Public Company Accounting Oversight Board (United States), the Company’s internal control over financial reporting as of December 31, 2009, based on criteria established in Internal Control-Integrated Framework issued by the Committee of Sponsoring Organizations of the Treadway Commission (COSO), and our report dated March 15, 2010 expressed an unqualified opinion on the effectiveness of the Company’s internal control over financial reporting.
![]()
Boston, Massachusetts
March 12, 2010
REPORT OF INDEPENDENT REGISTERED PUBLIC ACCOUNTING FIRM
ON INTERNAL CONTROL OVER FINANCIAL REPORTING
The Board of Directors and Stockholders
Enterprise Bancorp, Inc:
We have audited Enterprise Bancorp, Inc. and subsidiaries’ internal control over financial reporting as of December 31, 2009, based on criteria established in Internal Control - Integrated Framework issued by the Committee of Sponsoring Organizations of the Treadway Commission (COSO). Enterprise Bancorp, Inc.’s management is responsible for maintaining effective internal control over financial reporting and for its assessment of the effectiveness of internal control over financial reporting, included in the accompanying Management’s Report on Internal Control Over Financial Reporting. Our responsibility is to express an opinion on the Company’s internal control over financial reporting based on our audit.
We conducted our audit in accordance with the standards of the Public Company Accounting Oversight Board (United States). Those standards require that we plan and perform the audit to obtain reasonable assurance about whether effective internal control over financial reporting was maintained in all material respects. Our audit included obtaining an understanding of internal control over financial reporting, assessing the risk that a material weakness exists, and testing and evaluating the design and operating effectiveness of internal control based on the assessed risk. Our audit also included performing such other procedures as we considered necessary in the circumstances. We believe that our audit provides a reasonable basis for our opinion.
A company’s internal control over financial reporting is a process designed to provide reasonable assurance regarding the reliability of financial reporting and the preparation of financial statements for external purposes in accordance with generally accepted accounting principles. A company’s internal control over financial reporting includes those policies and procedures that (1) pertain to the maintenance of records that, in reasonable detail, accurately and fairly reflect the transactions and dispositions of the assets of the company; (2) provide reasonable assurance that transactions are recorded as necessary to permit preparation of financial statements in accordance with generally accepted accounting principles, and that receipts and expenditures of the company are being made only in accordance with authorizations of management and directors of the company; and (3) provide reasonable assurance regarding prevention or timely detection of unauthorized acquisition, use, or disposition of the company’s assets that could have a material effect on the financial statements.
Because of its inherent limitations, internal control over financial reporting may not prevent or detect misstatements. Also, projections of any evaluation of effectiveness to future periods are subject to the risk that controls may become inadequate because of changes in conditions, or that the degree of compliance with the policies or procedures may deteriorate.
In our opinion, Enterprise Bancorp, Inc. and subsidiaries maintained, in all material respects, effective internal control over financial reporting as of December 31, 2009, based on criteria established in Internal Control - Integrated Framework issued by the Committee of Sponsoring Organizations of the Treadway Commission.
We also have audited, in accordance with the standards of the Public Company Accounting Oversight Board (United States), the consolidated balance sheets of Enterprise Bancorp, Inc and subsidiaries as of December 31, 2009 and 2008, and the related consolidated statements of income, changes in stockholders’ equity, and cash flows for each of the years in the three-year period ended December 31, 2009, and our report dated March 12, 2010 expressed an unqualified opinion on those consolidated financial statements.
![]()
Boston, Massachusetts
March 12, 2010
Item 9. Changes In and Disagreements with Accountants on Accounting and Financial Disclosure
None
Item 9A. Controls and Procedures
Evaluation of Disclosure Controls and Procedures
The Company maintains a set of disclosure controls and procedures designed to ensure that the information required to be disclosed in reports that it files or submits to the SEC under the Securities Exchange Act of 1934, as amended (the “Exchange Act”), is recorded, processed, summarized and reported within the time periods specified in the SEC’s rules and forms.
The Company carried out an evaluation as of the end of the period covered by this report, under the supervision and with the participation of the Company’s management, including its chief executive officer and chief financial officer, of the effectiveness of the design and operation of the Company’s disclosure controls and procedures pursuant to Exchange Act Rule 13a-15(b). Based upon that evaluation, the Company’s chief executive officer and chief financial officer concluded that the Company’s disclosure controls and procedures are effective.
Management’s Report on Internal Control Over Financial Reporting
The Company’s management is responsible for establishing and maintaining adequate internal control over financial reporting. The Company’s internal control system was designed to provide reasonable assurance to the Company’s management and Board of Directors regarding the preparation and fair presentation of published financial statements. All internal control systems, however, no matter how well designed, have inherent limitations and may not prevent or detect misstatement. Also, projections of any evaluation of effectiveness to future periods are subject to the risk that controls may become inadequate because of changes in conditions, or that the degree of compliance with the policies or procedures may deteriorate. Therefore, even those systems determined to be effective can provide only reasonable assurance with respect to financial statement preparation and presentation.
The Company’s management assessed the effectiveness of the Company’s internal control over financial reporting as of December 31, 2009. In making this assessment, it used the criteria set forth by the Committee of Sponsoring Organizations of the Treadway Commission in “Internal Control-Integrated Framework.” Based on management’s assessment, the Company believes that, as of December 31, 2009, the Company’s internal control over financial reporting is effective based on these criteria.
The Company’s independent registered public accounting firm has issued a report on the effectiveness of Company’s internal control over financial reporting, which appears on page 109 of this report.
Changes in Internal Control Over Financial Reporting
There has been no change in the Company’s internal control over financial reporting that has occurred during the Company’s most recent fiscal quarter (i.e., the three months ended December 31, 2009) that has materially affected, or is reasonably likely to materially affect, such internal controls.
None
Part III
Item 10. Directors, Executive Officers and Corporate Governance
Certain information regarding directors, executive officers and significant employees of the Company, compliance with Section 16(a) of the Securities Exchange Act of 1934 and corporate governance, in response to this item, is incorporated herein by reference from the definitive proxy statement for the Company’s annual meeting of stockholders to be held May 5, 2010, which it expects to file with the SEC within 120 days of the end of the fiscal year covered by this report.
The Company maintains a code of business conduct and ethics. This code applies to every director, officer (including the principal executive officer, principal financial officer and principal accounting officer) and employee of the Company and its subsidiaries. The code is available on the Company’s website: EnterpriseBanking.com.
Directors of the Company
George L. Duncan
Chairman of the Company and the Bank
Richard W. Main
President of the Company and the Bank
John P. Clancy, Jr.
Chief Executive Officer of the Company and the Bank
Kenneth S. Ansin
Entrepreneur and Private Investor
John R. Clementi
President, Plastican, Inc., a privately held manufacturer of plastic pails and covers
James F. Conway, III
President, Chief Executive Officer and Chairman, Courier Corporation, a publicly held company specializing in the publishing, printing and sale of books
Dr. Carole A. Cowan (audit committee)
President, Middlesex Community College, the largest community college in Massachusetts
Nancy L. Donahue
Philanthropist
Lucy A. Flynn (audit committee)
Vice President Global Marketing Communications, Raytheon Company, a publicly held technology company specializing in defense, homeland security and other government markets
Eric W. Hanson
Chief Financial Officer of Klin Spirits, LLC, a privately held distributor of imported Russian vodka
John P. Harrington (audit committee)
Retired Energy Industry Executive; Assistant Secretary of the Company and the Bank
Arnold S. Lerner
Retired Radio Station Owner; Vice Chairman of the Company and the Bank
Michael T. Putziger
Vice Chairman of WinnCompanies, a private real estate company that develops, acquires and manages multi-family and mixed income properties nationwide and Of Counsel to Murtha Cullina, LLP, a firm which provides legal services to businesses, governmental units, non-profit organizations and individuals
Carol L. Reid (audit committee vice chairman and audit committee financial expert)
Financial Executive; former Vice President, Corporate Controller and Chief Accounting Officer of Avid Technology Inc., a publicly held company specializing in digital media creation tools for film, audio, animation, games and broadcast
Michael A. Spinelli
Founder, Global Tourism Solutions, an international tourism consulting firm for emerging nations; Secretary of the Company and the Bank
Nickolas Stavropoulos (audit committee chairman and audit committee financial expert)
Executive Vice President, U. S. Gas Distribution, National Grid, a publicly held company focused on the delivery of electricity and natural gas
Additional Executive Officers of the Company
|
Name |
|
Position |
|
|
|
|
|
Brian H. Bullock |
|
Executive Vice President and Chief Commercial Lending Officer of the Bank |
|
|
|
|
|
Robert R. Gilman |
|
Executive Vice President, Administration, and Commercial Lender of the Bank |
|
|
|
|
|
Stephen J. Irish |
|
Executive Vice President and Chief Operating Officer of the Bank |
|
|
|
|
|
Steven R. Larochelle |
|
Executive Vice President and Chief Banking Officer of the Bank |
|
|
|
|
|
James A. Marcotte |
|
Executive Vice President, Chief Financial Officer and Treasurer of the Company and the Bank |
|
|
|
|
|
Chester J. Szablak, Jr. |
|
Executive Vice President and Chief Sales and Marketing Officer of the Bank |
The information required in Items 11, 12, 13 and 14 of this part is incorporated herein by reference to the Company’s definitive proxy statement for its annual meeting of stockholders to be held May 5, 2010, which it expects to file with the SEC within 120 days of the end of the fiscal year covered by this report.
Item 15. Exhibits, Financial Statement Schedules
(a) The following documents are filed as part of this annual report:
Financial Statements
See Index to Consolidated Financial Statements contained in Item 8 above.
Financial Statement Schedules
None (information included in financial statements)
Exhibits
|
Exhibit No. and Description |
||
|
|
|
|
|
3.1 |
|
Restated Articles of Organization of the Company, as amended as of January 13, 2009, incorporated by reference to the Company’s Form 10-K for the year ended December 31, 2008. |
|
|
|
|
|
3.2 |
|
Amended and Restated Bylaws of the Company, as amended as of May 1, 2008, incorporated by reference to Exhibit 3.2 to the Company’s Form 10-Q for the quarter ended March 31, 2008. |
|
|
|
|
|
4.1 |
|
Renewal Rights Agreement dated as of December 11, 2008 by and between the Company and Computershare Trust Company, N.A., as Rights Agent, including Terms of Series A Junior Participating Preferred Stock, Summary of Rights to Purchase Shares of Series A Junior Participating Preferred Stock, and Form of Rights Certificate attached as Exhibits A, B and C thereto, incorporated by reference to Exhibit 4.5 to the Company’s Form 8-K filed on December 13, 2008. |
|
|
|
|
|
10.1 |
|
Lease agreement dated July 22, 1988, between the Bank and First Holding Trust relating to the premises at 222 Merrimack Street, Lowell, Massachusetts, incorporated by reference to Exhibit 10.1 to the Company’s Form 10-QSB for the quarter ended June 30, 1996. |
|
|
|
|
|
10.2 |
|
Amendment to lease dated December 28, 1990, between the Bank and First Holding Trust for and relating to the premises at 222 Merrimack Street, Lowell, Massachusetts, incorporated by reference to Exhibit 10.2 to the Company’s Form 10-QSB for the quarter ended June 30, 1996. |
|
|
|
|
|
10.3 |
|
Amendment to lease dated August 15, 1991, between the Bank and First Holding Trust for 851 square feet relating to the premises at 222 Merrimack Street, Lowell, Massachusetts, incorporated by reference to Exhibit 10.3 to the Company’s Form 10-QSB for the quarter ended June 30, 1996. |
|
|
|
|
|
10.4 |
|
Enterprise Bancorp, Inc. Amended and Restated 1998 Stock Incentive Plan, incorporated by reference to Exhibit 4.1 to the Company’s Registration Statement on Form S-8 (Reg. No. 333-60036), filed May 2, 2001. |
|
|
|
|
|
10.5 |
|
Enterprise Bancorp, Inc. 2003 Stock Incentive Plan, as amended May 2, 2006, incorporated by reference to Exhibit 4 to the Company’s Registration Statement on Form S-8 (Reg. No. 333-133792) filed May 4, 2006. |
|
|
|
|
|
10.6.1 |
|
Specimen Incentive Stock Option Agreement for executive officers under Enterprise Bancorp, Inc. Amended and Restated 1998 Stock Incentive Plan and 2003 Stock Incentive Plan, as amended, incorporated by reference to Exhibit 10.38.1 to the Company’s Form 10-K for the year ended December 31, 2005 (applicable to grants prior to January 1, 2007). |
|
|
|
|
|
10.6.2 |
|
Specimen Nonqualified Stock Option Agreement for executive officers under Enterprise Bancorp, Inc. Amended and Restated 1998 Stock Incentive Plan and 2003 Stock Incentive Plan, as amended, incorporated by reference to Exhibit |
|
|
|
10.38.2 to the Company’s Form 10-K for the year ended December 31, 2005 (applicable to grants prior to January 1, 2007). |
|
|
|
|
|
10.6.3 |
|
Specimen Incentive Stock Option Agreement under Enterprise Bancorp, Inc. Amended and Restated 1998 Stock Incentive Plan and 2003 Stock Incentive Plan, as amended, incorporated by reference to Exhibit 10.49.1 to the Company’s Form 10-Q for the quarter ended March 31, 2007 (applicable to grants after December 31, 2006). |
|
|
|
|
|
10.6.4 |
|
Specimen Nonqualified Stock Option Agreement under Enterprise Bancorp, Inc. Amended and Restated 1998 Stock Incentive Plan and 2003 Stock Incentive Plan, as amended, incorporated by reference to Exhibit 10.49.2 to the Company’s Form 10-Q for the quarter ended March 31, 2007 (applicable to grants after December 31, 2006 and prior to March 17,2009). |
|
|
|
|
|
10.6.5 |
|
Specimen Incentive Stock Option Agreement (includes Company right of repayment) under Enterprise Bancorp, Inc. Amended and Restated 1998 Stock Incentive Plan and 2003 Stock Incentive Plan, as amended, incorporated by reference to Exhibit 10.49.3 to the Company’s Form 10-Q for the quarter ended March 31, 2007 (applicable to grants after December 31, 2006). |
|
|
|
|
|
10.6.6 |
|
Specimen Nonqualified Stock Option Agreement (includes Company right of repayment) under Enterprise Bancorp, Inc. Amended and Restated 1998 Stock Incentive Plan and 2003 Stock Incentive Plan, as amended, incorporated by reference to Exhibit 10.49.4 to the Company’s Form 10-Q for the quarter ended March 31, 2007 (applicable to grants after December 31, 2006 and prior to March 17,2009). |
|
|
|
|
|
10.7.1 |
|
Restricted Stock Agreement dated as of September 7, 2005 by and between the Company and John P. Clancy, Jr., incorporated by reference to Exhibit 10.42 to the Company’s 8-K filed on September 12, 2005. |
|
|
|
|
|
10.7.2 |
|
Amendment No. 1 dated as of February 3, 2006 to Restricted Stock Agreement dated as of September 7, 2005 by and between the Company and John P. Clancy, Jr., incorporated by reference to Exhibit 10.44 to the Company’s 8-K filed on February 3, 2006. |
|
|
|
|
|
10.8 |
|
Enterprise Bancorp, Inc. Amended and Restated Dividend Reinvestment Plan, incorporated by reference to the section of the Company’s Registration Statement on Form S-3 (Reg. No. 333-152076), filed on July 2, 2008, appearing under the heading “The Plan.” |
|
|
|
|
|
10.9 |
|
Enterprise Bancorp, Inc. Employee Stock Purchase Plan, incorporated by reference to Exhibit 4 to the Company’s Registration Statement on Form S-8 (Reg. No. 333-136700), filed on August 17, 2006. |
|
|
|
|
|
10.10.1 |
|
Employment Agreement dated as of December 19, 2008 by and among the Company, the Bank and George L. Duncan, incorporated by reference to Exhibit 10.2.1 to the Company’s Form 8-K filed on December 24, 2008. |
|
|
|
|
|
10.10.2 |
|
Employment Agreement dated as of December 19, 2008 by and among the Company, the Bank and Richard W. Main, incorporated by reference to Exhibit 10.2.2 to the Company’s Form 8-K filed on December 24, 2008. |
|
|
|
|
|
10.10.3 |
|
Employment Agreement dated as of December 19, 2008 by and among the Company, the Bank and John P. Clancy, Jr., incorporated by reference to Exhibit 10.2.3 to the Company’s Form 8-K filed on December 24, 2008. |
|
|
|
|
|
10.11 |
|
Change in Control/Noncompetition Agreement dated as of December 19, 2008 by and among the Company, the Bank and Robert R. Gilman, incorporated by reference to Exhibit 10.3.1 to the Company’s Form 8-K filed on December 24, 2008. |
|
|
|
|
|
10.12 |
|
Change in Control/Noncompetition Agreement dated as of December 18, 2008 by and among the Company, the Bank and Stephen J. Irish, incorporated by |
|
|
|
reference to Exhibit 10.12 to the Company’s Form 10-K for the year ended December 31, 2008. |
|
|
|
|
|
10.13.1 |
|
Salary Continuation Agreement dated as of July 15, 2005 by and between the Bank and George L. Duncan, incorporated by reference to Exhibit 10.39.1 to the Company’s 8-K filed on July 20, 2005, as amended by Form 8-K/A filed on February 23, 2006. |
|
|
|
|
|
10.13.2 |
|
Salary Continuation Agreement dated as of July 15, 2005 by and between the Bank and Richard W. Main, incorporated by reference to Exhibit 10.39.2 to the Company’s 8-K filed on July 20, 2005, as amended by Form 8-K/A filed on February 23, 2006. |
|
|
|
|
|
10.13.3 |
|
Salary Continuation Agreement dated as of July 15, 2005 by and between the Bank and Robert R. Gilman, incorporated by reference to Exhibit 10.39.3 to the Company’s 8-K filed on July 20, 2005, as amended by Form 8-K/A filed on February 23, 2006. |
|
|
|
|
|
10.14.1 |
|
First Amendment dated as of December 19, 2008 to Salary Continuation Agreement dated as of July 15, 2005 by and between the Bank and George L. Duncan, incorporated by reference to Exhibit 10.1.1 to the Company’s Form 8-K filed on December 24, 2008. |
|
|
|
|
|
10.14.2 |
|
First Amendment dated as of December 19, 2008 to Salary Continuation Agreement dated as of July 15, 2005 by and between the Bank and Richard W. Main, incorporated by reference to Exhibit 10.1.2 to the Company’s Form 8-K filed on December 24, 2008. |
|
|
|
|
|
10.14.3 |
|
First Amendment dated as of December 19, 2008 to Salary Continuation Agreement dated as of July 15, 2005 by and between the Bank and Robert R. Gilman, incorporated by reference to Exhibit 10.1.3 to the Company’s Form 8-K filed on December 24, 2008. |
|
|
|
|
|
10.15.1 |
|
Supplemental Life Insurance Agreement dated as of July 15, 2005 by and between the Bank and George L. Duncan, incorporated by reference to Exhibit 10.40.1 to the Company’s 8-K filed on July 20, 2005. |
|
|
|
|
|
10.15.2 |
|
Supplemental Life Insurance Agreement dated as of July 15, 2005 by and between the Bank and Richard W. Main, incorporated by reference to Exhibit 10.40.2 to the Company’s 8-K filed on July 20, 2005. |
|
|
|
|
|
10.15.3 |
|
Supplemental Life Insurance Agreement dated as of July 15, 2005 by and between the Bank and Robert R. Gilman, incorporated by reference to Exhibit 10.40.3 to the Company’s 8-K filed on July 20, 2005. |
|
|
|
|
|
10.16 |
|
Enterprise Bank and Trust Company Supplemental Life Insurance Plan adopted April 5, 2006, incorporated by reference to Exhibit 10.52 to the Company’s Form 10-Q for the quarter ended September 30, 2006. |
|
|
|
|
|
10.17 |
|
Enterprise Bank Employee Incentive Compensation Plan, including information regarding grants to named executive officers, incorporated by reference to Exhibits 10.48.1 and 10.48.2 to the Company’s Form 8-K/A filed on August 7, 2008. |
|
|
|
|
|
10.18 |
|
Description of directors’ compensation, incorporated by reference to Exhibit 20 to the Company’s Form 10-K for the year ended December 31, 2007. |
|
|
|
|
|
10.19.1 |
|
Option Agreement between the Bank and Michael T. Putziger, incorporated by reference to Exhibit 10.1 to the Company’s Form 8-K filed on September 9, 2008. |
|
|
|
|
|
10.19.2 |
|
Amendment to Option Agreement between the Bank and Michael T. Putziger, incorporated by reference to Exhibit 10.2 to the Company’s Form 8-K filed on September 9, 2008. |
|
10.20.1 |
|
Form of Restricted Stock Agreement dated as of March 17, 2009 under Enterprise Bancorp, Inc. 2003 Stock Incentive Plan, as amended, by and between the Company and each of George L. Duncan, James A. Marcotte and Robert R. Gilman, incorporated by reference to Exhibit 10.1 to the Company’s Form 8-K filed on March 26, 2009. |
|
|
|
|
|
10.20.2 |
|
Form of Nonqualified Stock Option Agreement dated as of March 17, 2009 under Enterprise Bancorp, Inc. 2003 Stock Incentive Plan, as amended, by and between the Company and each of James A. Marcotte and Robert R. Gilman, incorporated by reference to Exhibit 10.2 to the Company’s Form 8-K filed on March 26, 2009. |
|
|
|
|
|
10.21 |
|
Enterprise Bancorp, Inc. 2009 Stock Incentive Plan, incorporated by reference to Exhibit 10.1 to the Company’s Form 8-K filed on May 6, 2009. |
|
|
|
|
|
10.22.1 |
|
Specimen Incentive Stock Option Agreement under Enterprise Bancorp, Inc. 2009 Stock Incentive Plan, incorporated by reference to Exhibit 10.2 to the Company’s Form 8-K filed on May 6, 2009. |
|
|
|
|
|
10.22.2 |
|
Specimen Nonqualified Stock Option Agreement under Enterprise Bancorp, Inc. 2009 Stock Incentive Plan, incorporated by reference to Exhibit 10.3 to the Company’s Form 8-K filed on May 6, 2009. |
|
|
|
|
|
10.22.3 |
|
Specimen Restricted Stock Agreement under Enterprise Bancorp, Inc. 2009 Stock Incentive Plan, incorporated by reference to Exhibit 10.4 to the Company’s Form 8-K filed on May 6, 2009. |
|
|
|
|
|
10.23.1 |
|
First Amendment dated as of April 1, 2009 to Employment Agreement dated as of December 19, 2008 by and among the Company, the Bank and George L. Duncan, incorporated by reference to Exhibit 10.1.1 to the Company’s Form 10-Q for the quarter ended June 30, 2009. |
|
|
|
|
|
10.23.2 |
|
First Amendment dated as of April 1, 2009 to Employment Agreement dated as of December 19, 2008 by and among the Company, the Bank and Richard W. Main, incorporated by reference to Exhibit 10.1.2 to the Company’s Form 10-Q for the quarter ended June 30, 2009. |
|
|
|
|
|
10.23.3 |
|
First Amendment dated as of April 1, 2009 to Employment Agreement dated as of December 19, 2008 by and among the Company, the Bank and John P. Clancy, Jr., incorporated by reference to Exhibit 10.1.3 to the Company’s Form 10-Q for the quarter ended June 30, 2009. |
|
|
|
|
|
10.24.1 |
|
Change in Control/Noncompetition Agreement dated as of December 22, 2008 by and among the Company, the Bank and Brian H. Bullock, incorporated by reference to Exhibit 10.2.1 to the Company’s Form 10-Q for the quarter ended June 30, 2009. |
|
|
|
|
|
10.24.2 |
|
Change in Control/Noncompetition Agreement dated as of December 23, 2008 by and among the Company, the Bank and Chester J. Szablak, incorporated by reference to Exhibit 10.2.2 to the Company’s Form 10-Q for the quarter ended June 30, 2009. |
|
|
|
|
|
10.24.3 |
|
Change in Control/Noncompetition Agreement dated as of March 18, 2009 by and among the Company, the Bank and Steven R. Larochelle, incorporated by reference to Exhibit 10.2.3 to the Company’s Form 10-Q for the quarter ended June 30, 2009. |
|
|
|
|
|
21.0 |
|
Subsidiaries of the Registrant. |
|
23.0 |
|
Consent of KPMG LLP. |
|
|
|
|
|
31.1 |
|
Certification of principal executive officer under Securities and Exchange Act Rule 13a—14(a) |
|
|
|
|
|
31.2 |
|
Certification of principal financial officer under Securities and Exchange Act Rule 13a—14(a) |
|
|
|
|
|
32.0 |
|
Certification of principal executive officer and principal financial officer under 18 U.S.C § 1350 furnished pursuant to Securities and Exchange Act Rule 13a—14(b) |
(b) Exhibits required by Item 601 of Regulation S-K
The exhibits listed above either have been previously filed and are incorporated herein by reference to the applicable prior filing or are filed herewith.
(c) Additional Financial Statement Schedules
None
ENTERPRISE BANCORP, INC.
Pursuant to the requirements of Section 13 or 15(d) of the Securities Exchange Act of 1934, the registrant has duly caused this report to be signed on its behalf by the undersigned thereunto duly authorized.
|
|
|
ENTERPRISE BANCORP, INC. |
|
|
|
|
|
|
|
Date: March 12, 2010 |
|
By: |
/s/ James A. Marcotte |
|
|
|
|
James A. Marcotte |
|
|
|
|
Executive Vice President, |
|
|
|
|
Chief Financial Officer and Treasurer |
Pursuant to the requirements of the Securities Exchange Act of 1934, this report has been signed below by the following persons on behalf of the registrant and in the capacities and on the dates indicated.
|
/s/ George L. Duncan |
|
Chairman |
|
March 12, 2010 |
|
George L. Duncan |
|
|
|
|
|
|
|
|
|
|
|
/s/ James A. Marcotte |
|
Executive Vice President, Chief |
|
March 12, 2010 |
|
James A. Marcotte |
|
Financial Officer and Treasurer |
|
|
|
|
|
|
|
|
|
/s/ Michael K. Sullivan |
|
Controller of the Bank |
|
March 12, 2010 |
|
Michael K. Sullivan |
|
|
|
|
|
|
|
|
|
|
|
/s/ Kenneth S. Ansin |
|
Director |
|
March 12, 2010 |
|
Kenneth S. Ansin |
|
|
|
|
|
|
|
|
|
|
|
/s/ John P. Clancy, Jr. |
|
Director, Chief Executive Officer |
|
March 12, 2010 |
|
John P. Clancy Jr. |
|
|
|
|
|
|
|
|
|
|
|
/s/ John R. Clementi |
|
Director |
|
March 12, 2010 |
|
John R. Clementi |
|
|
|
|
|
|
|
|
|
|
|
/s/ James F. Conway, III |
|
Director |
|
March 12, 2010 |
|
James F. Conway, III |
|
|
|
|
|
|
|
|
|
|
|
/s/ Carole A. Cowan |
|
Director |
|
March 12, 2010 |
|
Carole A. Cowan |
|
|
|
|
|
|
|
|
|
|
|
|
|
Director |
|
March 12, 2010 |
|
Nancy L. Donahue |
|
|
|
|
|
|
|
|
|
|
|
/s/ Lucy A. Flynn |
|
Director |
|
March 12, 2010 |
|
Lucy A. Flynn |
|
|
|
|
|
|
|
|
|
|
|
/s/ Eric W. Hanson |
|
Director |
|
March 12, 2010 |
|
Eric W. Hanson |
|
|
|
|
|
|
|
|
|
|
|
/s/ John P. Harrington |
|
Director |
|
March 12, 2010 |
|
John P. Harrington |
|
|
|
|
|
|
|
|
|
|
|
/s/ Arnold S. Lerner |
|
Director, Vice Chairman |
|
March 12, 2010 |
|
Arnold S. Lerner |
|
|
|
|
|
|
|
|
|
|
|
/s/ Richard W. Main |
|
Director, President |
|
March 12, 2010 |
|
Richard W. Main |
|
|
|
|
|
|
|
|
|
|
|
/s/ Michael T. Putziger |
|
Director |
|
March 12, 2010 |
|
Michael T. Putziger |
|
|
|
|
|
|
|
|
|
|
|
/s/ Carol L. Reid |
|
Director |
|
March 12, 2010 |
|
Carol L. Reid |
|
|
|
|
|
|
|
|
|
|
|
/s/ Michael A. Spinelli |
|
Director, Secretary |
|
March 12, 2010 |
|
Michael A. Spinelli |
|
|
|
|
|
|
|
|
|
|
|
/s/ Nickolas Stavropoulos |
|
Director |
|
March 12, 2010 |
|
Nickolas Stavropoulos |
|
|
|
|