Attached files
| file | filename |
|---|---|
| EX-21.1 - SUBSIDIARIES OF DENNY'S - DENNY'S Corp | ex21_1.htm |
| EX-23.1 - CONSENT OF KPMG LLP - DENNY'S Corp | ex23_1.htm |
| EX-10.30 - DENNY'S CORPORATE INCENTIVE PLAN - DENNY'S Corp | ex10_30.htm |
| EX-31.1 - NELSON J. MARCHIOLI CERTIFICATION - DENNY'S Corp | njmcertification_ex311.htm |
| EX-31.2 - F. MARK WOLFINGER CERTIFICATION - DENNY'S Corp | fmwcertification_ex312.htm |
| EX-32.1 - NJM AND FMW SECTION 906 CERTIFICATION - DENNY'S Corp | section906certification.htm |
UNITED
STATES
SECURITIES
AND EXCHANGE COMMISSION
Washington,
D.C. 20549
Form
10-K
ANNUAL
REPORT PURSUANT TO SECTION 13 OR 15(d) OF
THE
SECURITIES EXCHANGE ACT OF 1934
For
the Fiscal Year Ended December 30,
2009
Commission
file number 0-18051

DENNY'S
CORPORATION
(Exact
name of registrant as specified in its charter)
|
Delaware
|
13-3487402
|
|
(State
or other jurisdiction of
incorporation
or organization)
|
(I.R.S.
employer
identification
number)
|
|
203
East Main Street
|
|
|
Spartanburg,
South Carolina 29319-9966
|
|
| (Address of principal executive offices) | |
| (Zip Code) | |
(864)
597-8000
(Registrant’s
telephone number, including area code)
Securities
registered pursuant to Section 12(b) of the Act:
|
Title of each
class
|
Name
of each exchange on which registered
|
|
$.01
Par Value, Common Stock
|
The
Nasdaq Stock Market
|
Securities
registered pursuant to Section 12(g) of the Act: None
Indicate
by check mark if the registrant is a well-known seasoned issuer, as defined in
Rule 405 of the Securities Act.
Yes ¨ No þ
Indicate
by check mark if the registrant is not required to file reports pursuant to
Section 13 or Section 15(d) of the Act.
Yes ¨ No þ
Indicate
by check mark whether the registrant (1) has filed all reports required to
be filed by Section 13 or 15(d) of the Securities Exchange Act of 1934
during the preceding 12 months (or for such shorter period that the registrant
was required to file such reports), and (2) has been subject to such filing
requirements for the past 90 days.
Yes þ No ¨
Indicate
by check mark whether the registrant has submitted electronically and posted on
its corporate Web site, if any, every Interactive Data File required to be
submitted and posted pursuant to Rule 405 of Regulation S-T during the preceding
12 months (or for such shorter period that the registrant was required to submit
and post such files).
Yes ¨ No ¨
Indicate
by check mark if disclosure of delinquent filers pursuant to Item 405 of
Regulation S-K is not contained herein, and will not be contained, to the best
of the registrant’s knowledge, in definitive proxy or information statements
incorporated by reference in Part III of this Form 10-K or any amendment to this
Form 10-K. þ
Indicate
by check mark whether the registrant is a large accelerated filer, an
accelerated filer, a non-accelerated filer, or a smaller reporting
company. See the definitions of “large accelerated filer,"
"accelerated filer” and "smaller reporting company" in Rule 12b-2 of the
Exchange Act.
Large accelerated
filer ¨ Accelerated filer
þ Non-accelerated
filer ¨ Smaller reporting
company ¨
(Do
not check if a smaller reporting
company)
Indicate
by check mark whether the registrant is a shell company (as defined in Rule
12b-2 of the Exchange Act).
Yes ¨ No þ
The
aggregate market value of the voting common stock held by non-affiliates of the
registrant was approximately $214.2 million as of July 1, 2009, the last
business day of the registrant’s most recently completed second fiscal quarter,
based upon the closing sales price of registrant’s common stock on that date of
$2.26 per share and, for purposes of this computation only, the assumption
that all of the registrant’s directors, executive officers and beneficial owners
of 10% or more of the registrant’s common stock are affiliates.
As of
March 1, 2010, 96,826,746 shares of the registrant’s common stock, $.01 par
value per share, were outstanding.
Documents
incorporated by reference:
Portions
of the registrant’s definitive Proxy Statement for the 2010 Annual Meeting of
Stockholders are incorporated by reference into Part III of this Form
10-K.
TABLE
OF CONTENTS
|
Page
|
||
|
1
|
||
|
4
|
||
|
7
|
||
|
8
|
||
|
9
|
||
| Item 4. Reserved | 9 | |
|
9
|
||
|
11
|
||
|
12
|
||
|
23
|
||
|
24
|
||
|
24
|
||
|
24
|
||
|
26
|
||
|
26
|
||
|
26
|
||
|
26
|
||
|
26
|
||
|
26
|
||
|
26
|
||
|
F-1
|
||
FORWARD-LOOKING
STATEMENTS
The
forward-looking statements included in the “Business,” “Risk Factors,” “Legal
Proceedings,” “Management’s Discussion and Analysis of Financial Condition and
Results of Operations,” and “Quantitative and Qualitative Disclosures About
Market Risk” sections and elsewhere herein, which reflect our best judgment
based on factors currently known, involve risks and uncertainties. Words such as
“expects,” “anticipates,” “believes,” “intends,” “plans,”
“hopes,” and variations of such words and similar expressions are intended
to identify such forward-looking statements. Except as may be required by law,
we expressly disclaim any obligation to update these forward-looking statements
to reflect events or circumstances after the date of this Form 10-K or to
reflect the occurrence of unanticipated events. Actual results could differ
materially from those anticipated in these forward-looking statements as a
result of a number of factors including, but not limited to, the factors
discussed in such sections and, in particular, those set forth in the cautionary
statements contained in “Risk Factors.” The forward-looking information we have
provided in this Form 10-K pursuant to the safe harbor established under the
Private Securities Litigation Reform Act of 1995 should be evaluated in the
context of these factors.
Description
of Business
Denny’s
Corporation, or Denny’s, is one of America’s largest family-style restaurant
chains. Denny’s, through its wholly owned subsidiaries, Denny’s Holdings, Inc.
and Denny’s, Inc., owns and operates the Denny’s restaurant brand. At
December 30, 2009, the Denny’s brand consisted of 1,551 restaurants, 1,318
(85%) of which were franchised/licensed restaurants and 233 (15%) of
which were company-owned and operated. Denny’s restaurants are operated in 49
states, the District of Columbia, two U.S. territories and five foreign
countries with concentrations in California (26% of total restaurants), Florida
(10%) and Texas (10%).
Our
restaurants generally are open 24 hours a day, 7 days a week. We provide high
quality menu offerings and generous portions at reasonable prices with friendly
and efficient service in a pleasant atmosphere. Denny’s expansive menu offers
traditional American-style food such as breakfast items, appetizers, sandwiches,
dinner entrees and desserts. Denny's restaurants are best known for
breakfast items, such as our Grand Slam®. Sales are broadly distributed across
each of the dayparts (i.e., breakfast, lunch, dinner and
late-night).
References
to "Denny's," the "Company," "we," "us," and "our" in this Form 10-K are
references to Denny's Corporation and its subsidiaries.
Restaurant
Operations
We
believe that the superior execution of basic restaurant operations in each
Denny’s restaurant, whether it is company-owned or franchised, is critical to
our success. To meet and exceed our guests’ expectations, we require both our
company-owned and our franchised restaurants to maintain the same strict brand
standards. These standards relate to the preparation and efficient serving of
quality food and the maintenance, repair and cleanliness of
restaurants.
We devote
significant effort to ensuring all restaurants offer quality food served by
friendly, knowledgeable and attentive employees in a clean and well-maintained
restaurant. We seek to ensure that our company-owned restaurants meet our high
standards through a network of Regional Directors of Company Operations,
Company Business Leaders and restaurant level managers, all of whom spend the
majority of their time in the restaurants. A network of Regional Directors of
Franchise Operations and Franchise Business Leaders oversee our franchised
restaurants to ensure compliance with brand standards, promote operational
excellence, and provide general support to our franchisees.
A
principal feature of Denny’s restaurant operations is the consistent focus on
improving operations at the unit level. Unit managers are hands-on and versatile
in their supervisory activities. Many of our restaurant management personnel
began as hourly associates in the restaurants and, therefore, know how to
perform restaurant functions and are able to train by example.
Denny’s
maintains training programs for associates and restaurant managers including
Denny's University. Denny's University is a training program conducted at
our Corporate Support Center for our company and franchise managers and general
managers. The mission of Denny's University is to teach managers the skills
needed to become business leaders with an owner/operator mentality, operating
successful Denny's restaurants.
Franchising
and Development
Our
criteria to become a Denny’s franchisee include minimum liquidity and net worth
requirements and appropriate operational experience. We believe that Denny’s is
an attractive financial proposition for current and potential franchisees and
that our fee structure is competitive with other full service brands. The
initial fee for a single twenty-year Denny’s franchise agreement is $40,000 and
the royalty payment is 4% of gross sales. Additionally, our franchisees are
required to contribute up to 4% of gross sales for advertising and, depending on
their market location, may make additional advertising contributions as part of
a local marketing co-operative.
During
2009, we continued our Franchise Growth Initiative ("FGI") to increase franchise
restaurant development through the sale of certain geographic clusters of
company restaurants to both current and new franchisees. As a result, we
sold 81 restaurant operations and certain related real estate to 18 franchisees
for net proceeds of $30.3 million. As of December 30, 2009, the total
number of company restaurants sold since our FGI program began in early 2007 is
290. The Denny’s system is approximately 85% franchised and 15%
company-operated. Our targeted portfolio mix is 90% franchised and 10%
company-operated. We anticipate achieving this goal through a combination of new
franchise unit growth and the sale of restaurants to franchisees over the next
couple of years. We expect that the future growth of the brand will come
primarily from the development of franchise restaurants.
Fulfilling
the unit growth expectations of this program, certain franchisees that purchased
company restaurants during the year also signed development agreements to build
additional new franchise restaurants. In addition to franchise development
agreements signed under our FGI, we have been negotiating development
agreements outside of our FGI program under our Market Growth
Incentive Plan ("MGIP"). Over the
last 30 months we have signed development agreements for 185 new restaurants under our FGI and MGIP
programs, 58 of which have opened. The majority of
the units in the pipeline are expected to open over the next five years. While the majority of the
units developing under FGI and MGIP agreements are on track, from time to time
some of our franchisees' ability to grow and meet their development commitments
is hampered by the economy, access to capital and the difficult lending
environment.
The table
below sets forth information regarding the distribution of single-store and
multi-store franchisees as of December 30, 2009:
|
Franchisees
|
Percentage
of Franchisees
|
Restaurants
|
Percentage
of Restaurants
|
|||||||||||||
|
One
|
94
|
35.5
|
%
|
94
|
7.1
|
%
|
||||||||||
|
Two
to five
|
115
|
43.4
|
%
|
329
|
25.0
|
%
|
||||||||||
|
Six
to ten
|
30
|
11.3
|
%
|
221
|
16.8
|
%
|
||||||||||
|
Eleven
to fifteen
|
7
|
2.6
|
%
|
90
|
6.8
|
%
|
||||||||||
|
Sixteen
to thirty
|
11
|
4.2
|
%
|
251
|
19.0
|
%
|
||||||||||
|
Thirty-one and
over
|
8
|
3.0
|
%
|
333
|
25.3
|
%
|
||||||||||
|
Total
|
265
|
100.0
|
%
|
1,318
|
100.0
|
%
|
||||||||||
1
Site
Selection
The
success of any restaurant is influenced significantly by its location. Our
development team works closely with franchisees and real estate brokers to
identify sites which meet specific standards. Sites are evaluated on the basis
of a variety of factors, including but not limited to:
|
•
|
demographics;
|
|
•
|
traffic
patterns;
|
|
•
|
visibility;
|
|
•
|
building
constraints;
|
|
•
|
competition;
|
|
•
|
environmental
restrictions; and
|
|
•
|
proximity
to high-traffic consumer
activities.
|
Competition
The
restaurant industry is highly competitive. Competition among major
companies that own or operate restaurant chains is especially intense.
Restaurants compete on the basis of name recognition and advertising; the price,
quality, variety, and perceived value of their food offerings; the quality and
speed of their guest service; and the convenience and attractiveness
of their facilities.
Denny’s
direct competition in the family-style category includes a collection of
national and regional chains, as well as thousands of independent operators.
Denny’s also competes with quick service restaurants as they attempt to upgrade
their menus with premium sandwiches, entree salads, new breakfast offerings and
extended hours.
We
believe that Denny’s has a number of competitive strengths, including strong
brand name recognition, well-located restaurants and market penetration. We
benefit from economies of scale in a variety of areas, including advertising,
purchasing and distribution. Additionally, we believe that Denny’s has
competitive strengths in the value, variety, and quality of our food products,
and in the quality and training of our employees. See “Risk Factors” for certain
additional factors relating to our competition in the restaurant
industry.
Research
and Innovation
We
continue our emphasis on being a consumer driven organization with particular
focus on our service, menu, marketing, and overall guest
experience. We rely on consumer insights obtained through
secondary and primary qualitative and quantitative studies. These insights
form the strategic foundation for menu architecture, pricing, promotion and
advertising. The added-value of these insights and strategic understandings also
assist our Restaurant Operations and Information Technology personnel in the
evaluation and development of new restaurant processes and upgraded restaurant
equipment that may improve our speed of service, food quality and order
accuracy.
Through
this consumer focused effort, we are successfully innovating our brand and
concept, striving for continued relevance and brand differentiation. This
allows us the opportunity to protect margins, gain market share and efficiently
maximize our research investment.
Marketing and
Advertising
Our
marketing department manages contributions from both company-owned and
franchised units and provides integrated marketing and advertising to promote
our brand. The department focuses include brand and communications strategy,
media, advertising, menu management, product innovation and development,
consumer insights, public relations, field marketing and national
promotions.
Our
marketing campaigns, including broadcast advertising, focus on amplifying
Denny's brand strengths with the consumer -- made-to-order variety with an
emphasis on breakfast at an affordable value offered all day, every day. On
a national level and through recently formed local co-operatives, the campaigns
reach their consumer targets through network, cable and local television,
radio, online, digital, social, outdoor and print.
Denny's
reaches out to all consumers through integrated marketing programs, including
community outreach. These programs are designed to enhance our brand image,
support our brand message and, in some cases, augment our diversity
efforts.
Product
Sources and Availability
Our
purchasing department administers programs for the procurement of food and
non-food products. Our franchisees also purchase food and non-food products
directly from the vendors under these programs. Our centralized purchasing
program is designed to ensure uniform product quality as well as to
minimize food, beverage and supply costs. Our size provides significant
purchasing power which often enables us to obtain products at favorable prices
from nationally recognized manufacturers.
While
nearly all products are contracted for by our purchasing department, the
majority are purchased and distributed through Meadowbrook Meat Company, or MBM,
under a long-term distribution contract. MBM distributes restaurant products and
supplies to the Denny’s system from nearly 250 vendors, representing
approximately 88% of our restaurant product and supply purchases. We believe
that satisfactory sources of supply are generally available for all the items
regularly used by our restaurants. We have not experienced any material
shortages of food, equipment, or other products which are necessary to our
restaurant operations.
Seasonality
Our
business is moderately seasonal. Restaurant sales are generally greater in the
second and third calendar quarters (April through September) than in the first
and fourth calendar quarters (October through March). Additionally, severe
weather, storms and similar conditions may impact sales volumes seasonally in
some operating regions. Occupancy and other operating costs, which remain
relatively constant, have a disproportionately greater negative effect on
operating results during quarters with lower restaurant sales.
2
Trademarks
and Service Marks
Through
our wholly owned subsidiaries, we have certain trademarks and service marks
registered with the United States Patent and Trademark Office and in
international jurisdictions, including "Denny's" and "Grand Slam
Breakfast". We consider our trademarks and service marks important to the
identification of our restaurants and believe they are of material importance to
the conduct of our business. Domestic trademark and service mark
registrations are renewable at various intervals from 10 to 20 years.
International trademark and service mark registrations have various durations
from 5 to 20 years. We generally intend to renew trademarks and service marks
which come up for renewal. We own or have rights to all trademarks we believe
are material to our restaurant operations. In addition, we have registered
various domain names on the internet that incorporate certain of our trademarks
and service marks, and believe these domain name registrations are an integral
part of our identity. From time to time, we may resort to legal measures to
defend and protect the use of our intellectual property.
Economic,
Market and Other Conditions
The
restaurant industry is affected by many factors, including changes in national,
regional and local economic conditions affecting consumer spending, the
political environment (including acts of war and terrorism), changes in customer
travel patterns, changes in socio-demographic characteristics of areas where
restaurants are located, changes in consumer tastes and preferences, increases
in the number of restaurants, unfavorable trends affecting restaurant
operations, such as rising wage rates, healthcare costs and utilities expenses,
and unfavorable weather. See "Risk Factors" for additional
information.
Government
Regulations
We and
our franchisees are subject to local, state and federal laws and regulations
governing various aspects of the restaurant business, including, but not limited
to:
|
•
|
health;
|
|
•
|
sanitation;
|
|
•
|
land
use, sign restrictions and environmental matters;
|
|
•
|
safety;
|
|
•
|
disabled
persons’ access to facilities;
|
|
•
|
the
sale of alcoholic beverages; and
|
|
•
|
hiring
and employment practices.
|
The
operation of our franchise system is also subject to regulations enacted by a
number of states and rules promulgated by the Federal Trade Commission. We
believe we are in material compliance with applicable laws and regulations, but
we cannot predict the effect on operations of the enactment of additional
regulations in the future.
We are
also subject to federal and state laws, including the Fair Labor Standards Act,
governing matters such as minimum wage, tip reporting, overtime, exempt
status classification and other working conditions. At December 30, 2009, a
substantial number of our employees were paid the minimum wage. Accordingly,
increases in the minimum wage or decreases in the allowable tip credit (which
reduces wages deemed to be paid to tipped employees in certain states) increase
our labor costs. This is especially true for our operations in California, where
there is no tip credit. Employers must pay the higher of the federal or state
minimum wage. We have attempted to offset increases in the minimum wage through
pricing and various cost control efforts; however, there can be no assurance
that we will be successful in these efforts in the future.
Environmental
Matters
Federal,
state and local environmental laws and regulations have not historically had a
material impact on our operations; however, we cannot predict the effect of
possible future environmental legislation or regulations on our
operations.
Executive
Officers of the Registrant
The
following table sets forth information with respect to each executive officer of
Denny’s:
|
Name
|
Age
|
Current
Principal Occupation or Employment and Five-Year Employment
History
|
|||
|
Nelson
J. Marchioli
|
60 |
Chief
Executive Officer and President of Denny’s
(2001-present).
|
|||
|
F.
Mark Wolfinger
|
54 |
Executive
Vice President and Chief Administrative Officer of Denny’s (April,
2008-present); Executive Vice President, Growth Initiatives of
Denny's (October, 2006-April, 2008); Chief Financial Officer of
Denny’s (2005-present); Senior Vice President of Denny's (2005-October,
2006); Executive Vice President and Chief Financial Officer of Danka
Business Systems (a document imaging company)
(1998-2005).
|
|||
In
addition to the executive officer positions noted above, our executive officer
positions also include a Chief Operating Officer and a Chief Marketing
Officer. These positions are currently vacant. We are in the process
of identifying appropriate talent for both positions and expect to
complete this process during 2010.
Employees
At
December 30, 2009, we had approximately 11,000 employees, none of whom are
subject to collective bargaining agreements. Many of our restaurant employees
work part-time, and many are paid at or slightly above minimum wage levels. As
is characteristic of the restaurant industry, we experience a high level of
turnover among our restaurant employees. We have experienced no significant work
stoppages, and we consider relations with our employees to be
satisfactory.
The staff
for a typical restaurant consists of one general manager, two or three
restaurant managers and approximately 50 hourly employees. All managers of
company-owned restaurants receive a salary and may receive a performance bonus
based on financial measures. In addition, we employ Divisional Vice
Presidents, Company and Franchise Regional Directors of Operations
and Company and Franchise Business Leaders. The Directors of Operations'
and Business Leaders’ duties include regular restaurant visits and inspections,
which ensure the ongoing maintenance of our standards of quality, service,
cleanliness, value, and courtesy.
3
Available
Information
We make
available free of charge through our website at www.dennys.com (in the Investor
Relations—SEC Filings section) copies of materials that we file with, or furnish
to, the Securities and Exchange Commission ("SEC"), including our Annual Reports
on Form 10-K, Quarterly Reports on Form 10-Q, Current Reports on Form 8-K, and
amendments to those reports, as soon as reasonably practicable after we
electronically file such materials with, or furnish them to, the
SEC.
We
caution you that our business and operations are subject to a number of risks
and uncertainties. The factors listed below are important factors that could
cause actual results to differ materially from our historical results and from
those anticipated in forward-looking statements contained in this Form 10-K, in
our other filings with the SEC, in our news releases and in public statements
made orally by our representatives. However, other factors that we do not
anticipate or that we do not consider significant based on currently available
information may also have an adverse effect on our results.
Risks
Related to Our Business
Our
financial condition depends on our ability and the ability of our franchisees to
operate restaurants profitably, to generate positive cash flows and to generate
acceptable returns on invested capital. The returns and profitability
of our restaurants may be negatively impacted by a number of factors, including
those described below.
Food
service businesses are often adversely affected by changes in:
|
•
|
consumer
tastes;
|
|
•
|
consumer
spending habits;
|
|
•
|
global,
national, regional and local economic conditions; and
|
|
•
|
demographic
trends.
|
The
performance of our individual restaurants may be adversely affected by factors
such as:
|
•
|
traffic
patterns;
|
|
•
|
demographic
considerations; and
|
|
•
|
the
type, number and location of competing
restaurants.
|
Multi-unit
food service chains such as ours can also be adversely affected by publicity
resulting from:
|
•
|
poor
food quality;
|
|
•
|
food-related
illness;
|
|
•
|
injury;
and
|
|
•
|
other
health concerns or operating
issues.
|
Dependence
on frequent deliveries of fresh produce and groceries subjects food service
businesses to the risk that shortages or interruptions in supply caused by
adverse weather or other conditions could adversely affect the availability,
quality and cost of ingredients. In addition, the food service industry in
general, and our results of operations and financial condition in particular,
may also be adversely affected by unfavorable trends or developments such
as:
|
•
|
inflation;
|
|
•
|
increased
food costs;
|
|
•
|
increased
energy costs;
|
|
•
|
labor
and employee benefits costs (including increases in minimum hourly wage
and employment tax rates and health care and workers' compensation
cost);
|
|
•
|
regional
weather conditions; and
|
|
•
|
the
availability of experienced management and hourly
employees.
|
A
decline in general economic conditions could adversely affect our financial
results.
Consumer
spending habits, including discretionary spending on dining out at restaurants
such as ours, are affected by many factors, including:
|
•
|
prevailing
economic conditions, such as the housing and credit
markets;
|
|
•
|
energy
costs, especially gasoline prices;
|
|
•
|
levels
of employment;
|
|
•
|
salaries
and wage rates;
|
|
•
|
consumer
confidence; and
|
|
•
|
consumer
perception of economic conditions.
|
Continued
weakness or uncertainty of the United States economy as a result of reactions to
consumer credit availability, increasing energy prices, inflation, increasing
interest rates, unemployment, war, terrorist activity or other unforeseen events
could adversely affect consumer spending habits, which may result in lower
restaurant sales.
The
locations where we have restaurants may cease to be attractive as demographic
patterns change.
The
success of our owned and franchised restaurants is significantly influenced by
location. Current locations may not continue to be attractive as demographic
patterns change. It is possible that the neighborhood or economic conditions
where our restaurants are located could decline in the future, potentially
resulting in reduced sales in those locations.
4
Our
growth strategy depends on our ability and that of our franchisees to open new
restaurants. Delays or failures in opening new restaurants could
adversely affect our planned growth.
The
development of new restaurants may be adversely affected by risks such
as:
|
•
|
costs
and availability of capital for the Company and/or
franchisees;
|
|
•
|
competition
for restaurant sites;
|
|
•
|
negotiation
of favorable purchase or lease terms for restaurant
sites;
|
|
•
|
inability
to obtain all required governmental approvals and
permits;
|
|
•
|
developed
restaurants not achieving the expected revenue or cash flow;
and
|
|
•
|
general
economic conditions.
|
A
majority of Denny's restaurants are owned and operated by independent
franchisees, and as a result the financial performance of franchisees can
negatively impact our business.
As we
become more heavily franchised, our financial results are increasingly
contingent upon the operational and financial success of our franchisees. We
receive royalties and contributions to advertising and, in some cases, lease
payments from our franchisees. We set forth operational standards, guidelines
and strategic plans; however, we have limited control over how our franchisees’
businesses are run. While we are responsible for ensuring the success of our
entire chain of restaurants and for taking a longer term view with respect to
system improvements, our franchisees have individual business strategies and
objectives, which might sometimes conflict with our interests. Our franchisees
may not be able to secure adequate financing to open or continue operating their
Denny’s restaurants. If they incur too much debt or if economic or
sales trends deteriorate such that they are unable to repay debt existing debt,
it could result in financial distress or even bankruptcy. If a
significant number of franchisees become financially distressed, it could harm
our operating results through reduced royalties and lease income.
For 2009,
our ten largest franchisees accounted for approximately 33% of our franchise
revenue. The balance of our franchise revenue is derived from the remaining 255
franchisees. Although the loss of revenues from the closure of any one franchise
restaurant may not be material, such revenues generate margins that may exceed
those generated by other restaurants or offset fixed costs which we continue to
incur.
The
restaurant business is highly competitive, and if we are unable to compete
effectively, our business will be adversely affected.
We expect
competition to continue to increase. The following are important aspects of
competition:
|
•
|
restaurant
location;
|
|
•
|
number
and location of competing restaurants;
|
|
•
|
food
quality and value;
|
|
•
|
quality
and speed of service;
|
|
•
|
attractiveness
and repair and maintenance of facilities; and
|
|
•
|
the
effectiveness of marketing and advertising
programs.
|
Each of
our restaurants competes with a wide variety of restaurants ranging from
national and regional restaurant chains to locally owned restaurants. There is
also active competition for advantageous commercial real estate sites suitable
for restaurants.
Many
factors, including those over which we have no control, affect the trading price
of our stock.
Factors
such as reports on the economy or the price of commodities, as well as negative
or positive announcements by competitors, regardless of whether the report
relates directly to our business, could have an impact of the trading price of
our stock. In addition to investor expectations about our prospects, trading
activity in our stock can reflect the portfolio strategies and investment
allocation changes of institutional holders, as well as non-operating
initiatives that we may institute from time to time. Any failure to meet market
expectations whether for sales growth rates, refranchising goals, earnings per
share or other metrics could cause our share price to decline.
Numerous
government regulations impact our business, and our failure to comply with them
could adversely affect our business.
We and
our franchisees are subject to federal, state and local laws and regulations
governing, among other things:
|
•
|
health;
|
|
•
|
sanitation;
|
|
•
|
environmental
matters;
|
|
•
|
safety;
|
|
•
|
the
sale of alcoholic beverages; and
|
|
•
|
hiring
and employment practices, including minimum wage laws and fair labor
standards.
|
Our
restaurant operations are also subject to federal and state laws that prohibit
discrimination and laws regulating the design and operation of facilities, such
as the Americans with Disabilities Act of 1990. The operation of our franchisee
system is also subject to regulations enacted by a number of states and rules
promulgated by the Federal Trade Commission. If we or our franchisees fail to
comply with these laws and regulations, we or our franchisees could be subjected
to restaurant closure, fines, penalties, and litigation, which may be costly and
could adversely affect our results of operations and financial condition. In
addition, the future enactment of additional legislation regulating the
franchise relationship could adversely affect our operations, particularly our
relationship with franchisees.
Negative
publicity generated by incidents at a few restaurants can adversely affect the
operating results of our entire chain and the Denny’s brand.
Food
safety concerns, criminal activity, alleged discrimination or other operating
issues stemming from one restaurant or a limited number of restaurants do not
just impact that particular restaurant or a limited number of restaurants.
Rather, our entire chain of restaurants may be at risk from negative publicity
generated by an incident at a single restaurant. This negative publicity can
adversely affect the operating results of our entire chain and the Denny’s
brand.
5
If
we lose the services of any of our key management personnel, our business could
suffer.
Our
future success significantly depends on the continued services and performance
of our key management personnel. Our future performance will depend on our
ability to motivate and retain these and other key officers and key team
members, particularly regional and area managers and restaurant general
managers. Competition for these employees is intense. The loss of the services
of members of our senior management or key team members or the inability to
attract additional qualified personnel as needed could harm our
business.
The
positions of Chief Operating Officer and Chief Marketing Officer are
currently vacant. We are in the process of identifying appropriate talent
for both positions and expect to complete this process during
2010. We do not expect our business to suffer as a result of
these temporary vacancies.
If
our internal controls are ineffective, we may not be able to accurately report
our financial results or prevent fraud.
We
maintain a documented system of internal controls which is reviewed and tested
by the Company’s full time Internal Audit Department. The Internal Audit
Department reports to the Audit Committee of the Board of Directors. We believe
we have a well-designed system to maintain adequate internal controls on the
business; however, we cannot be certain that our controls will be adequate in
the future or that adequate controls will be effective in preventing errors or
fraud. Any failures in the effectiveness of our internal controls could have an
adverse effect on our operating results or cause us to fail to meet reporting
obligations.
Risks
Related to our Indebtedness
Our
indebtedness could have an adverse effect on our financial condition and
operations.
We have a
significant amount of indebtedness. As of December 30, 2009, we had total
indebtedness of approximately $278.7 million.
Our level
of indebtedness could:
|
•
|
make
it more difficult for us to satisfy our obligations with respect to our
indebtedness;
|
|
•
|
require
us to continue to dedicate a substantial portion of our cash flow from
operations to pay interest and principal on our indebtedness, which would
reduce the availability of our cash flow to fund future working capital,
capital expenditures, acquisitions and other general corporate
purposes;
|
|
•
|
increase
our vulnerability to general adverse economic and industry
conditions;
|
|
•
|
limit
our flexibility in planning for, or reacting to, changes in our business
and the industry in which we operate;
|
|
•
|
restrict
us from making strategic acquisitions or pursuing business
opportunities;
|
|
•
|
place
us at a competitive disadvantage compared to our competitors that may have
less indebtedness; and
|
|
•
|
limit
our ability to borrow additional
funds.
|
We may
need to access the capital markets in the future to raise the funds to repay our
indebtedness. We have no assurance that we will be able to complete a
refinancing or that we will be able to raise any additional financing,
particularly in view of our anticipated high levels of indebtedness and the
restrictions contained in the credit agreements and indenture that govern our
indebtedness. If we are unable to satisfy or refinance our current debt as it
comes due, we may default on our debt obligations. If we default on payments
under our debt obligations, virtually all of our other debt would become
immediately due and payable.
Despite
our current level of indebtedness, we may still be able to incur substantially
more debt, which could further exacerbate the risks associated with our
leverage.
Despite
our current and anticipated debt levels, we may be able to incur substantial
additional indebtedness in the future. Our credit agreement and the indenture
governing our indebtedness limit, but do not fully prohibit, us from incurring
additional indebtedness. If new debt is added to our current debt levels, the
related risks that we now face could intensify.
At
December 30, 2009, we had an outstanding term loan of $80.0 million and
outstanding letters of credit of $28.2 million under our letter of credit
facility. There were no outstanding letters of credit under our revolver
facility and no revolving loans outstanding at December 30, 2009. These balances
result in availability of $1.8 million under our letter of credit facility
and $50.0 million under the revolving facility. As of March 8, 2010, we had
availability of $5.0 million under our letter of credit facility and $50.0
million under the revolving facility. There were no outstanding letters of
credit under our revolving facility and no revolving loans outstanding at March
8, 2010. In addition, we have Denny's Holdings Inc. 10% Senior Notes due in 2012
(the "10% Notes") with an aggregate principal amount of $175
million.
We
continue to monitor our cash flow and liquidity needs. Although we believe that
our existing cash balances, funds from operations and amounts available under
our credit facility will be adequate to cover those needs, we may seek
additional sources of funds including additional financing sources and continued
selected asset sales, to maintain sufficient cash flow to fund our ongoing
operating needs, pay interest and scheduled debt amortization and fund
anticipated capital expenditures over the next twelve months. There are no
material debt maturities until March 2012.
Our
ability to generate cash depends on many factors beyond our control, and we may
not be able to generate the cash required to service or repay our
indebtedness.
Our
ability to make scheduled payments on our indebtedness will depend upon our
subsidiaries’ operating performance, which will be affected by general economic,
financial, competitive, legislative, regulatory and other factors that are
beyond our control. Our historical financial results have been, and our future
financial results are expected to be, subject to substantial fluctuations. We
cannot be sure that our subsidiaries will generate sufficient cash flow from
operations to enable us to service or reduce our indebtedness or to fund our
other liquidity needs. Our subsidiaries’ ability to maintain or increase
operating cash flow will depend upon:
|
•
|
consumer
tastes and spending habits;
|
|
•
|
the
success of our marketing initiatives and other efforts by us to
increase guest traffic in our restaurants; and
|
|
•
|
prevailing
economic conditions and other matters discussed throughout "Risk Factors"
in this Form 10-K, many of which are beyond our
control.
|
If we are
unable to meet our debt service obligations or fund other liquidity needs, we
may need to refinance all or a portion of our indebtedness on or before maturity
or seek additional equity capital. We cannot be sure that we will be able to pay
or refinance our indebtedness or obtain additional equity capital on
commercially reasonable terms, or at all, especially in a difficult economic
environment.
6
Restrictive
covenants in our debt instruments restrict or prohibit our ability to engage in
or enter into a variety of transactions, which could adversely affect
us.
The
credit agreement and the indenture governing our indebtedness contain various
covenants that limit, among other things, our ability to:
|
•
|
incur
additional indebtedness;
|
|
•
|
pay
dividends or make distributions or certain other restricted
payments;
|
|
•
|
make
certain investments;
|
|
•
|
create
dividend or other payment restrictions affecting restricted
subsidiaries;
|
|
•
|
issue
or sell capital stock of restricted subsidiaries;
|
|
•
|
guarantee
indebtedness;
|
|
•
|
enter
into transactions with stockholders or affiliates;
|
|
•
|
create
liens;
|
|
•
|
sell
assets and use the proceeds thereof;
|
|
•
|
engage
in sale-leaseback transactions; and
|
|
•
|
enter
into certain mergers and
consolidations.
|
Our
credit agreement contains additional restrictive covenants, including financial
maintenance requirements. These covenants could have an adverse effect on our
business by limiting our ability to take advantage of financing, merger,
acquisition or other corporate opportunities and to fund our
operations.
A
breach of a covenant in our debt instruments could cause acceleration of a
significant portion of our outstanding indebtedness.
A breach
of a covenant or other provision in any debt instrument governing our current or
future indebtedness could result in a default under that instrument and, due to
cross-default and cross-acceleration provisions, could result in a default under
our other debt instruments. In addition, our credit agreement requires us to
maintain certain financial ratios. Our ability to comply with these covenants
may be affected by events beyond our control (such as uncertainties related to
the current economy), and we cannot be sure that we will be able to comply with
these covenants. Upon the occurrence of an event of default under any of our
debt instruments, the lenders could elect to declare all amounts outstanding to
be immediately due and payable and terminate all commitments to extend further
credit. If we were unable to repay those amounts, the lenders could proceed
against the collateral granted to them, if any, to secure the indebtedness. If
the lenders under our current or future indebtedness accelerate the payment of
the indebtedness, we cannot be sure that our assets would be sufficient to repay
in full our outstanding indebtedness.
We
may not be able to repurchase the 10% Senior Notes due 2012 upon a change of
control.
Upon the
occurrence of specific kinds of change of control events, we would be required
to offer to repurchase all outstanding 10% Notes at 101% of their principal
amount, together with any accrued and unpaid interest and liquidated damages, if
any, from the issue date. We may not be able to repurchase the notes upon a
change of control because we may not have sufficient funds. Further, our credit
agreement restricts our ability to repurchase the notes, and also provides that
certain change of control events will constitute a default under our credit
agreement that permits our lenders thereunder to accelerate the maturity of
related borrowings, and, if such debt is not paid, to enforce security interests
in the collateral securing such debt, thereby limiting our ability to raise cash
to purchase the notes. Any future credit agreements or other agreements relating
to indebtedness to which we become a party may contain similar restrictions and
provisions. In the event a change of control occurs at a time when we are
prohibited by any other indebtedness from purchasing the notes, we could
seek consent of the lenders of such indebtedness to the purchase of the
notes or could attempt to refinance the borrowings that contain such
prohibition. If we do not obtain such consent or repay or refinance such
borrowings, we will remain prohibited from purchasing the notes. In such case,
our failure to purchase tendered notes would constitute an event of default
under the indenture governing the notes which would, in turn, constitute a
default under our credit agreement.
As
holding companies, Denny’s Corporation and Denny’s Holdings depend on upstream
payments from their operating subsidiaries. Our ability to repay our
indebtedness depends on the performance of those subsidiaries and their ability
to make distributions to us.
A
substantial portion of our assets are owned, and a substantial percentage of our
total operating revenues are earned, by our subsidiaries. Accordingly, Denny’s
Corporation and Denny’s Holdings depend upon dividends, loans and other
intercompany transfers from these subsidiaries to meet their debt service and
other obligations. These transfers are subject to contractual
restrictions.
The
subsidiaries are separate and distinct legal entities and they have no
obligation to Denny's Corporation or Denny's Holdings, contingent or otherwise,
to make any funds available to meet our debt service and other obligations,
whether by dividend, distribution, loan or other payments. If the subsidiaries
do not pay dividends or other distributions, Denny’s Corporation and Denny’s
Holdings may not have sufficient cash to fulfill their
obligations.
Item 1B. Unresolved Staff
Comments
None.
7
Most
Denny’s restaurants are free-standing facilities, with property sizes averaging
approximately one acre. The restaurant buildings average 4,500 square feet,
allowing them to accommodate an average of 140 guests. The number and location
of our restaurants as of December 30, 2009 and December 31, 2008 are presented
below:
|
2009
|
2008
|
|||||||||
|
State/Country
|
Company
Owned
|
Franchised/Licensed
|
Company
Owned
|
Franchised/Licensed
|
||||||
|
Alabama
|
—
|
3
|
2
|
1
|
||||||
|
Alaska
|
—
|
3
|
—
|
3
|
||||||
|
Arizona
|
18
|
58
|
18
|
57
|
||||||
|
Arkansas
|
—
|
9
|
—
|
9
|
||||||
|
California
|
80
|
328
|
102
|
304
|
||||||
|
Colorado
|
7
|
19
|
7
|
19
|
||||||
|
Connecticut
|
—
|
8
|
—
|
8
|
||||||
|
District
of Columbia
|
—
|
1
|
—
|
1
|
||||||
|
Delaware
|
1
|
—
|
2
|
—
|
||||||
|
Florida
|
22
|
132
|
22
|
137
|
||||||
|
Georgia
|
—
|
14
|
—
|
13
|
||||||
|
Hawaii
|
5
|
3
|
4
|
3
|
||||||
|
Idaho
|
—
|
7
|
—
|
7
|
||||||
|
Illinois
|
17
|
35
|
20
|
32
|
||||||
|
Indiana
|
1
|
32
|
1
|
31
|
||||||
|
Iowa
|
—
|
1
|
—
|
1
|
||||||
|
Kansas
|
—
|
8
|
—
|
8
|
||||||
|
Kentucky
|
6
|
6
|
6
|
6
|
||||||
|
Louisiana
|
1
|
1
|
1
|
1
|
||||||
|
Maine
|
—
|
6
|
—
|
6
|
||||||
|
Maryland
|
3
|
20
|
3
|
20
|
||||||
|
Massachusetts
|
—
|
6
|
—
|
6
|
||||||
|
Michigan
|
9
|
13
|
10
|
12
|
||||||
|
Minnesota
|
—
|
14
|
—
|
15
|
||||||
|
Mississippi
|
—
|
1
|
—
|
1
|
||||||
|
Missouri
|
4
|
30
|
4
|
28
|
||||||
|
Montana
|
—
|
4
|
—
|
4
|
||||||
|
Nebraska
|
—
|
1
|
—
|
1
|
||||||
|
Nevada
|
8
|
22
|
8
|
20
|
||||||
|
New
Hampshire
|
—
|
3
|
—
|
3
|
||||||
|
New
Jersey
|
2
|
8
|
3
|
8
|
||||||
|
New
Mexico
|
—
|
24
|
—
|
23
|
||||||
|
New
York
|
1
|
42
|
33
|
9
|
||||||
|
North
Carolina
|
—
|
19
|
—
|
18
|
||||||
|
North
Dakota
|
—
|
4
|
—
|
4
|
||||||
|
Ohio
|
4
|
28
|
9
|
23
|
||||||
|
Oklahoma
|
—
|
13
|
—
|
12
|
||||||
|
Oregon
|
—
|
24
|
—
|
23
|
||||||
|
Pennsylvania
|
17
|
19
|
30
|
6
|
||||||
|
Rhode
Island
|
—
|
2
|
—
|
2
|
||||||
|
South
Carolina
|
—
|
14
|
—
|
13
|
||||||
|
South
Dakota
|
—
|
2
|
—
|
2
|
||||||
|
Tennessee
|
1
|
3
|
3
|
1
|
||||||
|
Texas
|
20
|
140
|
21
|
137
|
||||||
|
Utah
|
—
|
21
|
—
|
21
|
||||||
|
Vermont
|
—
|
2
|
—
|
2
|
||||||
|
Virginia
|
6
|
19
|
6
|
18
|
||||||
|
Washington
|
—
|
50
|
—
|
51
|
||||||
|
West
Virginia
|
—
|
2
|
—
|
2
|
||||||
|
Wisconsin
|
—
|
17
|
—
|
17
|
||||||
|
Guam
|
—
|
2
|
—
|
2
|
||||||
|
Puerto
Rico
|
—
|
11
|
—
|
10
|
||||||
|
Canada
|
—
|
49
|
—
|
50
|
||||||
|
Other
International
|
—
|
15
|
—
|
15
|
||||||
|
Total
|
233
|
1,318
|
315
|
1,226
|
||||||
8
Of the
total 1,551 company-owned and franchised units, our interest in restaurant
properties consists of the following:
|
Company-Owned Units
|
Franchised
Units
|
Total
|
||||||||||
|
Own
land and building
|
60
|
40
|
100
|
|||||||||
|
Lease
land and own building
|
17
|
—
|
17
|
|||||||||
|
Lease
both land and building
|
156
|
384
|
540
|
|||||||||
|
233
|
424
|
657
|
||||||||||
In
addition to the restaurants, we own an 18-story, 187,000 square foot office
building in Spartanburg, South Carolina, which serves as our corporate
headquarters. Our corporate offices currently occupy approximately 16 floors of
the building, with a portion of the building leased to others.
See Note
10
to our Consolidated Financial Statements for information concerning encumbrances
on substantially all of our properties.
There are
various claims and pending legal actions against or indirectly involving us,
including actions concerned with civil rights of employees and guests, other
employment related matters, taxes, sales of franchise rights and businesses and
other matters. Based on our examination of these matters and our experience to
date, we have recorded liabilities reflecting our best estimate of loss, if any,
with respect to these matters. However, the ultimate disposition of these
matters cannot be determined with certainty.
Our
common stock is listed under the symbol “DENN” and trades on the NASDAQ Capital
Market. As of March 1, 2010, 96,826,746 shares of common stock were
outstanding, and there were approximately 10,250 record and beneficial
holders of common stock. We have never paid dividends on our common equity
securities. Furthermore, restrictions contained in the instruments governing our
outstanding indebtedness prohibit us from paying dividends on our common stock
in the future. See “Management’s Discussion and Analysis of Financial Condition
and Results of Operations—Liquidity and Capital Resources” and Note 10 to our
Consolidated Financial Statements.
The
following tables list the high and low sales prices of the common stock for each
quarter of fiscal years 2009 and 2008, according to NASDAQ. Our common stock
began trading on the NASDAQ Capital Market on May 10, 2005.
|
High
|
Low
|
|||||||
|
2009
|
||||||||
|
First
quarter
|
$
|
2.23
|
$
|
1.15
|
||||
|
Second
quarter
|
3.10
|
1.60
|
||||||
|
Third
quarter
|
2.87
|
2.07
|
||||||
|
Fourth
quarter
|
3.02
|
2.14
|
||||||
|
2008
|
||||||||
|
First
quarter
|
$
|
4.22
|
$
|
2.50
|
||||
|
Second
quarter
|
4.10
|
2.90
|
||||||
|
Third
quarter
|
3.20
|
1.98
|
||||||
|
Fourth
quarter
|
2.83
|
1.18
|
||||||
9
Stockholder
Return Performance Graph
The
following graph compares the cumulative total stockholders’ return on our Common
Stock for the five fiscal years ended December 30, 2009 (December 29, 2004 to
December 30, 2009) against the cumulative total return of the Russell 2000®
Index and a peer group. The graph and table assume that $100 was
invested on December 29, 2004 (the last day of fiscal year 2004) in each of the
Company’s Common Stock, the Russell 2000® Index and the peer group and that all
dividends were reinvested.
COMPARISON
OF FIVE-YEAR CUMULATIVE TOTAL RETURN AMONG
DENNY’S
CORPORATION, RUSSELL 2000® INDEX AND PEER GROUP
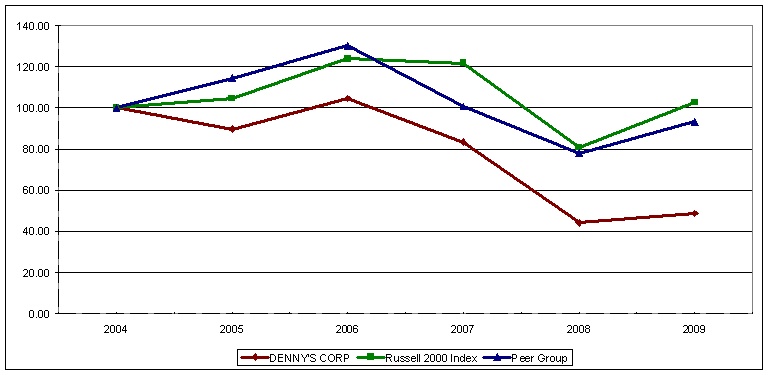
ASSUMES
$100 INVESTED ON DECEMBER 29, 2004
ASSUMES
DIVIDENDS REINVESTED
FISCAL
YEAR ENDED DECEMBER 30, 2009
|
Russell
2000® Index (1)
|
Peer
Group (2)
|
Denny's
Corporation
|
||||||||||
|
December
29, 2004
|
$
|
100.00
|
$
|
100.00
|
$
|
100.00
|
||||||
|
December
28, 2005
|
$
|
104.56
|
$
|
114.48
|
$
|
89.55
|
||||||
|
December
27, 2006
|
$
|
123.75
|
$
|
130.15
|
$
|
104.67
|
||||||
|
December
26, 2007
|
$
|
121.83
|
$
|
100.67
|
$
|
83.33
|
||||||
|
December
31, 2008
|
$
|
80.66
|
$
|
78.01
|
$
|
44.22
|
||||||
|
December
30, 2009
|
$
|
102.59
|
$
|
93.16
|
$
|
48.66
|
||||||
| (1) |
The
Russell 2000 Index is a broad equity market index of 2,000 companies that
measures the performance of the small-cap segment of the U.S. equity
universe. As of December 31, 2009, the average market capitalization
of companies within the index was approximately $1.0 billion with the
median market capitalization being approximately $0.4
billion.
|
| (2) |
The
peer group consists of 20 public companies that operate in the restaurant
industry. The peer group includes the following companies: Burger
King Holdings, Inc. (BKC), Bob Evans Farms, Inc. (BOBE), Buffalo Wild
Wings, Inc. (BWLD), Cracker Barrel Old Country Store, Inc. (CBRL),
O’Charleys Inc. (CHUX), CKE Restaurants, Inc. (CKR), California Pizza
Kitchen, Inc. (CPKI), Domino’s Pizza, Inc. (DPZ), Darden Restaurants, Inc.
(DRI), Brinker International, Inc. (EAT), DineEquity, Inc. (DIN),
Jack In The Box Inc. (JACK), Panera Bread Company (PNRA), Papa John’s
International, Inc. (PZZA), Red Robin Gourmet Burgers, Inc. (RRGB), Ruby
Tuesday, Inc. (RT), Steak 'n Shake Company (SNS), Sonic Corp. (SONC),
Texas Roadhouse, Inc. (TXRH) and Wendy’s/Arby’s Group, Inc.
(WEN).
|
10
The
following table summarizes the consolidated financial and operating data of
Denny’s Corporation as of and for the years ended December 30, 2009, December
31, 2008, December 26, 2007, December 27, 2006 and December 28, 2005. The
consolidated statements of operations for the years ended December 30, 2009,
December 31, 2008 and December 26, 2007 and the balance sheet data as of
December 30, 2009 and December 31, 2008 are derived from our audited
Consolidated Financial Statements included in this Form 10-K. The consolidated
statements of operations for the years ended December 27, 2006 and December 28,
2005 and balance sheet data as of December 26, 2007, December 27, 2006 and
December 28, 2005 are derived from our Audited Consolidated Financial Statements
not included in this Form 10-K. The selected consolidated financial and
operating data set forth below should be read together with “Management’s
Discussion and Analysis of Financial Condition and Results of Operations” and
our Consolidated Financial Statements and related notes.
|
Fiscal
Year Ended
|
||||||||||||||||||||
|
December
30,
2009
|
December
31,
2008
(a)
|
December
26,
2007
|
December
27,
2006
|
December
28,
2005
|
||||||||||||||||
|
(In
millions, except ratios and per share amounts)
|
||||||||||||||||||||
|
Statement of Operations
Data:
|
||||||||||||||||||||
|
Operating
revenue
|
$
|
608.1
|
$
|
760.3
|
$
|
939.4
|
$
|
994.0
|
$
|
978.7
|
||||||||||
|
Operating
income
|
72.4
|
60.9
|
79.8
|
110.5
|
48.5
|
|||||||||||||||
|
Income
(loss) from continuing operations before cumulative effect
of
change
in accounting principle (b)
|
41.6
|
12.7
|
29.5
|
28.5
|
(7.3
|
)
|
||||||||||||||
|
Cumulative
effect of change in accounting principle, net of tax
|
—
|
—
|
—
|
0.2
|
—
|
|||||||||||||||
|
Income
(loss) from continuing operations (b)
|
41.6
|
12.7
|
29.5
|
28.7
|
(7.3
|
)
|
||||||||||||||
|
Basic
net income (loss) per share:
|
||||||||||||||||||||
|
Basic
net income (loss) before cumulative effect of change in
accounting
principle,
net of tax (b)
|
$
|
0.43
|
$
|
0.13
|
$
|
0.31
|
$
|
0.31
|
$
|
(0.08
|
)
|
|||||||||
|
Cumulative
effect of change in accounting principle, net of tax
|
—
|
—
|
—
|
0.00
|
—
|
|||||||||||||||
|
Basic
net income (loss) per share from continuing operations
(b)
|
$
|
0.43
|
$
|
0.13
|
$
|
0.31
|
$
|
0.31
|
$
|
(0.08
|
)
|
|||||||||
|
Diluted
net income (loss) per share:
|
||||||||||||||||||||
|
Diluted
net income (loss) before cumulative effect of change in
accounting
principle, net of tax (b)
|
$
|
0.42
|
$
|
0.13
|
$
|
0.30
|
$
|
0.29
|
$
|
(0.08
|
)
|
|||||||||
|
Cumulative
of effect of change in accounting principle, net of
tax
|
—
|
—
|
—
|
0.00
|
—
|
|||||||||||||||
|
Diluted
net income (loss) per share from continuing operations
(b)
|
$
|
0.42
|
$
|
0.13
|
$
|
0.30
|
$
|
0.30
|
$
|
(0.08
|
)
|
|||||||||
|
Cash
dividends per common share (c)
|
—
|
—
|
—
|
—
|
—
|
|||||||||||||||
|
Balance
Sheet Data (at end of period):
|
||||||||||||||||||||
|
Current
assets
|
$
|
58.3
|
$
|
53.5
|
$
|
57.9
|
$
|
63.2
|
$
|
62.1
|
||||||||||
|
Working
capital deficit (d)
|
(33.8
|
)
|
(53.7
|
)
|
(73.6
|
)
|
(72.6
|
)
|
(86.3
|
)
|
||||||||||
|
Net
property and equipment
|
131.5
|
160.0
|
184.6
|
236.3
|
288.1
|
|||||||||||||||
|
Total
assets
|
312.6
|
341.8
|
373.9
|
442.7
|
511.7
|
|||||||||||||||
|
Long-term
debt, excluding current portion
|
274.0
|
322.7
|
346.8
|
440.7
|
545.7
|
|||||||||||||||
|
(a)
|
The
fiscal year ended December 31, 2008 includes 53 weeks of operations
as compared with 52 weeks for all other years presented. We estimate that
the additional, or 53rd, week
added approximately $14.3 million of operating revenue in
2008.
|
|
(b)
|
Fiscal years 2006 through 2008 have been adjusted from amounts
previously reported to reflect certain adjustments as discussed in
"Adjustments to Previously Issued Financial Statements" in Note 2 to our
Consolidated Financial Statements.
|
|
(c)
|
Our
bank facilities have prohibited, and our previous and current public debt
indentures have significantly limited, distributions and dividends on
Denny’s Corporation’s common equity securities.
|
|
(d)
|
A negative
working capital position is not unusual for a restaurant operating
company. The decrease in working
capital deficit from December
26, 2007 to December 30, 2009 is primarily due to the sale of
company-owned restaurants to franchisees during 2007, 2008 and
2009.
|
11
The
following discussion should be read in conjunction with “Selected Financial
Data,” and our Consolidated Financial Statements and the notes
thereto.
Overview
At
December 30, 2009, the Denny’s brand consisted of 1,551 restaurants, 1,318 (85%)
of which were franchised/licensed restaurants and 233 (15%) of which were
company-owned and operated. Prior to the implementation of our
Franchise Growth Initiative in 2007, the Denny’s brand consisted of 1,545
restaurants, 1,024 (66%) of which were franchised/licensed restaurants and 521
(34%) of which were company-owned and operated.
Revenues
Our
revenues are derived primarily from two sources: the sale of food and beverages
at our company-owned restaurants and the collection of royalties and fees from
restaurants operated by our franchisees under the Denny’s name.
During
2009, we continued our Franchise Growth Initiative (“FGI”), a strategic
initiative to increase franchise restaurant development through the sale of
certain geographic clusters of company restaurants to both current and new
franchisees. In 2009, as a result of our FGI, we sold 81 restaurant operations
and certain related real estate to 18 franchisees for net proceeds of $30.3
million. As of December 30, 2009, the total number of company restaurants sold
since our FGI program began in early 2007 is 290.
The sale
of company restaurants to franchisees has a significant impact on company
restaurant sales and the collection of royalties and fees from restaurants
operated by our franchisees. Specifically, revenues are impacted as
follows:
|
•
|
Company
restaurant sales have decreased significantly as a result of the sale
of restaurants to franchisees. In general, we have sold restaurants
with below-average sales volumes, which in turn should
raise the average sales volume and average operating margin of our
remaining company restaurant portfolio.
|
|
•
|
The
decline in company restaurant revenues is partially offset by increased
royalty income derived from the growing franchise restaurant
base. This royalty income is included as a component of franchise and
license revenue. The resulting net reduction in total revenue related
to our FGI is generally recovered by a decrease in depreciation and
amortization from the sale of restaurant related assets to franchisees and
a reduction in interest expense resulting from the use of our FGI proceeds
to reduce debt.
|
|
•
|
Additionally,
initial franchise fees, included as a component of franchise and license
revenue, are generally recorded in the period in which a restaurant is
sold to a franchisee. These initial fees are completely dependent on
the number of restaurants sold during a particular
period.
|
Certain
franchisees purchasing company restaurants under our FGI have also signed
development agreements to build additional new franchise restaurants. In
addition to franchise development agreements signed under our FGI, we have
negotiated development agreements outside of our FGI program under our Market
Growth Incentive Plan ("MGIP"). The positive impact of these development
programs is evident in the 39 new franchise restaurant openings in
2009.
As a
result of our FGI and MGIP programs, we expect that the majority of new Denny’s
restaurants will be developed by our franchisees. Development of company-owned
restaurants will focus on core markets, strategic locations and nontraditional
opportunities. As a result of continued franchisee demand for Denny’s
restaurants and our desire to expand our base of franchise locations, we expect
to continue to sell company restaurants to franchisees during 2010. Our
targeted portfolio mix is appropriately 90% franchised and 10% company-operated.
We anticipate achieving this goal through a combination of new franchise unit
growth and the sale of restaurants to franchisees over the next couple of
years. However, the current economic environment and availability of credit
to franchisees will impact the number of restaurants we are able to sell to
franchisees and the number of restaurants our franchisees are able to
develop.
Sales and
customer traffic at both company-operated and franchised restaurants are
affected by the success of our marketing campaigns, new product introductions
and customer service, as well as external factors including competition,
economic conditions affecting consumer spending, and changes in guest tastes and
preferences. As with many other restaurant companies, the economy has had a
significant impact on sales during 2008 and 2009.
Cost
of Company Restaurant Sales
Our costs
of company restaurant sales are exposed to volatility in two main areas: product
costs and payroll and benefit costs.
Many of
the products sold in our restaurants are affected by commodity pricing and are,
therefore, subject to price volatility. This volatility is caused by factors
that are fundamentally outside of our control and are often unpredictable. In
general, we purchase food products based on market prices or we set firm prices
in purchase agreements with our vendors. During 2008 and 2009, our ability to lock in prices on
several key commodities added to our favorable product costs in an environment
in which many commodity prices were on the rise.
In addition, our continued success with menu
management helped to further reduce product
costs. Our promotional activities focused on menu items with lower
food costs that still provided a compelling value to our customers, such as our Build Your Own Grand Slam®
promotion. Increased incident rates of menu items such as our
signature Grand Slam® breakfast, Everyday
Value Slam®
and Weekday Slam®
contributed to favorable product costs as a percentage of sales.
The
volatility of payroll and benefit costs results primarily from changes in
wage rates and increases in labor related expenses such as medical benefit costs
and workers’ compensation costs. A number of our employees are paid the minimum
wage. Accordingly, substantial increases in the minimum wage increase our labor
costs. Additionally, declines in guest counts and investments in
store-level labor can cause payroll and benefit costs to increase as a
percentage of sales. During 2009, payroll and benefit costs
especially benefited from the favorable development of workers'
compensation claims. This benefit is the result of multiple years of increased
focus on safety at the unit level in addition to the benefit derived from
selling company-owned restaurants to franchisees.
Many of
our costs vary based on sales and unit count. Certain costs such as
occupancy and other operating expenses have fixed components that may not react
as directly to changes in sales and unit count. However, as noted above,
many of our below-average sales volume units have been sold through our
FGI. As a
result, cost of company restaurant sales as a percentage of sales have generally
improved during 2009.
12
Costs
of Franchise and License Revenue
Our costs
of franchise and license revenue include occupancy costs related to restaurants
leased or subleased to franchisees and direct costs consisting primarily of
payroll and benefit costs of franchise operations personnel. These costs
are significantly affected by our FGI. As units are sold to franchisees,
Denny’s generally leases or subleases the land and building to the
franchisee. As a result, the occupancy costs related to these restaurants
moves from costs of company restaurant sales to costs of franchise and
license revenue to match the related occupancy income from franchisee lease
payments.
Debt
and Interest
Interest
expense has a significant impact on our net income as a result of our
indebtedness. However, during 2008 and 2009, we continued to reduce interest
expense through a series of debt repayments using the proceeds generated from
our FGI transactions, sales of real estate and cash flow from operations. These
repayments resulted in an overall debt reduction of approximately $49
million during 2009 and $25 million in 2008.
We
continue to take a conservative approach to our cash management. While we
paid down approximately $49 million in debt during 2009, we chose to maintain
more than $26 million in cash at year end given the uncertain outlook for the
economy and the capital markets. We will continue to balance our debt
reduction goals and our commitment to maintain an ample liquidity
cushion.
We are
subject to the effects of interest rate volatility since approximately $80.0
million, or 31%, of our debt has variable interest rates. To minimize the
interest rate volatility we participated in an interest rate swap on the first
$100 million of floating rate debt. The interest rate swap, which was scheduled
to end on March 30, 2010, was terminated on December 17,
2009.
13
Statements
of Operations
|
Fiscal
Year Ended
|
|||||||||||||||||||||
|
December
30, 2009
|
December
31, 2008
|
December
26, 2007
|
|||||||||||||||||||
|
(Dollars
in thousands)
|
|||||||||||||||||||||
|
Revenue:
|
|||||||||||||||||||||
|
Company
restaurant sales (a)
|
$
|
488,948
|
80.4
|
%
|
$
|
648,264
|
85.3
|
%
|
$
|
844,621
|
89.9
|
%
|
|||||||||
|
Franchise
and license revenue (b)
|
119,155
|
19.6
|
%
|
112,007
|
14.7
|
%
|
94,747
|
10.1
|
%
|
||||||||||||
|
Total
operating revenue
|
608,103
|
100.0
|
%
|
760,271
|
100.0
|
%
|
939,368
|
100.0
|
%
|
||||||||||||
|
Costs
of company restaurant sales (c):
|
|||||||||||||||||||||
|
Product
costs
|
114,861
|
23.5
|
%
|
157,545
|
24.3
|
%
|
215,943
|
25.6
|
%
|
||||||||||||
|
Payroll
and benefits
|
197,612
|
40.4
|
%
|
271,933
|
41.9
|
%
|
355,710
|
42.1
|
%
|
||||||||||||
|
Occupancy
|
31,937
|
6.5
|
%
|
40,415
|
6.2
|
%
|
50,977
|
6.0
|
%
|
||||||||||||
|
Other
operating expenses
|
73,496
|
15.0
|
%
|
100,182
|
15.5
|
%
|
123,310
|
14.6
|
%
|
||||||||||||
|
Total
costs of company restaurant sales
|
417,906
|
85.5
|
%
|
570,075
|
87.9
|
%
|
745,940
|
88.3
|
%
|
||||||||||||
|
Costs
of franchise and license revenue (c)
|
42,626
|
35.8
|
%
|
34,933
|
31.2
|
%
|
28,005
|
29.6
|
%
|
||||||||||||
|
General
and administrative expenses
|
57,282
|
9.4
|
%
|
60,970
|
8.0
|
%
|
67,374
|
7.2
|
%
|
||||||||||||
|
Depreciation
and amortization
|
32,343
|
5.3
|
%
|
39,766
|
5.2
|
%
|
49,347
|
5.3
|
%
|
||||||||||||
|
Operating
(gains), losses and other charges, net
|
(14,483
|
)
|
(2.4
|
%)
|
(6,384
|
)
|
(0.8
|
%)
|
(31,082
|
)
|
(3.3
|
%)
|
|||||||||
|
Total
operating costs and expenses
|
535,674
|
88.1
|
%
|
699,360
|
92.0
|
%
|
859,584
|
91.5
|
%
|
||||||||||||
|
Operating
income
|
72,429
|
11.9
|
%
|
60,911
|
8.0
|
%
|
79,784
|
8.5
|
%
|
||||||||||||
|
Other
expenses:
|
|||||||||||||||||||||
|
Interest
expense, net
|
32,600
|
5.4
|
%
|
35,457
|
4.7
|
%
|
42,957
|
4.6
|
%
|
||||||||||||
|
Other
nonoperating (income) expense, net
|
(3,125
|
)
|
(0.5
|
%)
|
|
9,190
|
1.2
|
%
|
668
|
0.1
|
%
|
||||||||||
|
Total
other expenses, net
|
29,475
|
4.8
|
%
|
44,647
|
5.9
|
%
|
43,625
|
4.6
|
%
|
||||||||||||
|
Net
income before income taxes
|
42,954
|
7.1
|
%
|
16,264
|
2.1
|
%
|
36,159
|
3.8
|
%
|
||||||||||||
|
Provision
for income taxes (d)
|
1,400
|
0.2
|
%
|
3,522
|
0.5
|
%
|
6,675
|
0.7
|
%
|
||||||||||||
|
Net
income (d)
|
$ |
41,554
|
6.8
|
%
|
$ |
12,742
|
1.7
|
%
|
$ |
29,484
|
3.1
|
%
|
|||||||||
|
Other
Data:
|
|||||||||||||||||||||
|
Company-owned
average unit sales
|
$
|
1,810
|
$
|
1,813
|
$
|
1,716
|
|||||||||||||||
|
Franchise
average unit sales
|
$
|
1,396
|
$
|
1,490
|
$
|
1,523
|
|||||||||||||||
|
Company-owned
equivalent units (e)
|
270
|
357
|
492
|
||||||||||||||||||
|
Franchise
equivalent units (e)
|
1,274
|
1,186
|
1,049
|
||||||||||||||||||
|
Same-store
sales increase (decrease) (company-owned) (f)(g)
|
(3.7
|
%)
|
(1.4
|
%)
|
0.3
|
%
|
|||||||||||||||
|
Guest
check average increase (g)
|
1.0
|
%
|
5.9
|
%
|
4.6
|
%
|
|||||||||||||||
|
Guest
count decrease (g)
|
(4.6
|
%)
|
(6.9
|
%)
|
(4.1
|
%)
|
|||||||||||||||
|
Same-store
sales increase (decrease) (franchised and
licensed units) (f)(g)
|
(5.2
|
%)
|
(4.6
|
%)
|
1.7
|
%
|
|||||||||||||||
| (a) | We estimate that the additional, or 53rd, week added approximately $12.1 million of company restaurant sales in 2008. |
| (b) | We estimate that the additional, or 53rd, week added approximately $2.2 million of franchise and license revenue in 2008, consisting of $1.5 million of royalties and $0.7 million of occupancy revenue. |
|
(c)
|
Costs
of company restaurant sales percentages are as a percentage of company
restaurant sales. Costs of franchise and license revenue percentages are
as a percentage of franchise and license revenue. All other percentages
are as a percentage of total operating revenue.
|
|
(d)
|
Fiscal
years 2007 and 2008 have been adjusted from amounts previously
reported to reflect certain adjustments as discussed in “Adjustments to
Previously Issued Financial Statements” in Note 2 to our Consolidated
Financial Statements.
|
|
(e)
|
Equivalent
units are calculated as the weighted-average number of units outstanding
during the defined time period.
|
|
(f)
|
Same-store
sales include sales from restaurants that were open the same period in the
prior year. For purposes of calculating same-store sales, the 53rd week of
2008 was compared to the 1st week of
2008.
|
| (g) |
Prior
year amounts have not been restated for 2009 comparable
units.
|
14
2009
Compared with 2008
Unit
Activity
|
2009
|
2008
|
|||||||
|
Company-owned
restaurants, beginning of period
|
315
|
394
|
||||||
|
Units
opened
|
1
|
3
|
||||||
|
Units
sold to franchisees
|
(81
|
)
|
(79
|
)
|
||||
|
Units
closed
|
(2
|
)
|
(3
|
)
|
||||
|
End
of period
|
233
|
315
|
||||||
|
Franchised
and licensed restaurants, beginning of period
|
1,226
|
1,152
|
||||||
|
Units
opened
|
39
|
31
|
||||||
|
Units
purchased from Company
|
81
|
79
|
||||||
|
Units
closed
|
(28
|
)
|
(36
|
)
|
||||
|
End
of period
|
1,318
|
1,226
|
||||||
|
Total
company-owned, franchised and licensed restaurants, end of
period
|
1,551
|
1,541
|
||||||
Company
Restaurant Operations
During
the year ended December 30, 2009, we incurred a 3.7% decrease in same-store
sales, comprised of a 1.0% increase in guest check average and a 4.6%
decrease in guest counts. Company restaurant sales decreased $159.3 million, or
24.6%, primarily resulting from an 87 equivalent unit decrease in
company-owned restaurants and the 53rd week
in 2008. The decrease in equivalent units primarily resulted from the sale of
company-owned restaurants to franchisees as part of our FGI
program.
Total
costs of company restaurant sales as a percentage of company restaurant sales
decreased to 85.5% from 87.9%. Product costs decreased to 23.5% from 24.3%
due to price increases taken to help offset commodity inflation. Payroll and
benefits costs decreased to 40.4% from 41.9% primarily as a result of
$5.2 million in favorable workers’ compensation claims development over the
prior year (1.2%). Payroll and benefit costs also benefited from improved
scheduling of restaurant staff (0.7%), partially offset by higher incentive
compensation (0.4%). Occupancy costs increased to 6.5% from
6.2% as a result of changes in the portfolio of company-owned
restaurants and the decrease in same-store sales. Other operating expenses
were comprised of the following amounts and percentages of company restaurant
sales:
|
Fiscal
Year Ended
|
||||||||||||||||
|
December
30, 2009
|
December
31, 2008
|
|||||||||||||||
|
(Dollars
in thousands)
|
||||||||||||||||
|
Utilities
|
$
|
23,083
|
4.7
|
%
|
$
|
33,160
|
5.1
|
%
|
||||||||
|
Repairs
and maintenance
|
9,909
|
2.0
|
%
|
14,592
|
2.3
|
%
|
||||||||||
|
Marketing
|
20,082
|
4.1
|
%
|
23,243
|
3.6
|
%
|
||||||||||
|
Legal
settlement costs
|
412
|
0.1
|
%
|
2,283
|
0.4
|
%
|
||||||||||
|
Other direct
costs
|
20,010
|
4.1
|
%
|
26,904
|
4.2
|
%
|
||||||||||
|
Other
operating expenses
|
$
|
73,496
|
15.0
|
%
|
$
|
100,182
|
15.5
|
%
|
||||||||
Utilities
decreased by 0.4 percentage points primarily due to lower natural gas and
electricity costs. Marketing increased by 0.5 percentage points
primarily as a result of the establishment of local advertising cooperatives
during 2008 and 2009. The overall decrease in other operating expenses primarily
results from the sale of company-owned restaurants to
franchisees.
Franchise
Operations
Franchise
and license revenue and costs of franchise and license revenue were comprised of
the following amounts and percentages of franchise and license revenue for the
periods indicated:
|
Fiscal
Year Ended
|
||||||||||||||||
|
December
30, 2009
|
December
31, 2008
|
|||||||||||||||
|
(Dollars in
thousands)
|
||||||||||||||||
|
Royalties
|
$
|
70,743
|
59.4
|
%
|
$
|
70,081
|
62.6
|
%
|
||||||||
|
Initial
and other fees
|
4,910
|
4.1
|
%
|
4,949
|
4.4
|
%
|
||||||||||
|
Occupancy
revenue
|
43,502
|
36.5
|
%
|
36,977
|
33.0
|
%
|
||||||||||
|
Franchise
and license revenue
|
119,155
|
100.0
|
%
|
112,007
|
100.0
|
%
|
||||||||||
|
Occupancy
costs
|
33,658
|
28.3
|
%
|
28,451
|
25.4
|
%
|
||||||||||
|
Other
direct costs
|
8,968
|
7.5
|
%
|
6,482
|
5.8
|
%
|
||||||||||
|
Costs
of franchise and license revenue
|
$
|
42,626
|
35.8
|
%
|
$
|
34,933
|
31.2
|
%
|
||||||||
15
Royalties
increased by $0.7 million, or 0.9%, primarily resulting from an 88 equivalent
unit increase in franchised and licensed units. This increase was partially
offset by the decrease from the 53rd week
in 2008 and the effects of a 5.2% decrease in same-store sales. The increase in
equivalent units resulted from the sale of company-owned restaurants to
franchisees. During 2009 we opened 39 franchise restaurants and sold 81
restaurants to franchisees as compared to the opening of 31 franchise
restaurants and the sale of 79 restaurants to franchisees during 2008. Although
we opened more franchise units during 2009, initial fees remained essentially
flat as a result of incentives included in certain franchise development
agreements. The increase in occupancy revenue of $6.5 million, or 17.6%, is
primarily the result of the sale of company-owned restaurants to franchisees,
offset by the decrease from the 53rd week
in 2008.
Costs of
franchise and license revenue increased by $7.7 million, or 22.0%. The increase
in occupancy costs of $5.2 million, or 18.3%, is primarily the result
of the sale of company-owned restaurants to franchisees. Other direct costs
increased by $2.5 million, or 38.4%, due primarily to $1.1 million of
franchise-related costs associated with our 2009 Super Bowl promotion and $1.0
million increase in field management labor and incentive
compensation. Occupancy costs as a percentage of occupancy revenue are
generally higher than other direct costs as a percentage of royalties and fees.
Therefore, as occupancy revenue increases as a percentage of total franchise and
license revenue, the cost of franchise and license revenue as a percentage of
franchise and license revenue will increase. As a result, costs of
franchise and license revenue as a percentage of franchise and license revenue
increased to 35.8% for the year ended December 30, 2009 from 31.2% for the year
ended December 31, 2008.
Other
Operating Costs and Expenses
Other
operating costs and expenses such as general and administrative expenses and
depreciation and amortization expense relate to both company and franchise
operations.
General and administrative
expenses were comprised of the following:
|
Fiscal
Year Ended
|
||||||||
|
December
30, 2009
|
December
31, 2008
|
|||||||
|
(In
thousands)
|
||||||||
|
Share-based
compensation
|
$
|
4,671
|
$
|
4,117
|
||||
|
General
and administrative expenses
|
52,611
|
56,853
|
||||||
|
Total
general and administrative expenses
|
$
|
57,282
|
$
|
60,970
|
||||
The
increase in share-based compensation expense is primarily due to the adjustment
of the liability classified restricted stock units to fair value as of
December 30, 2009. The $4.2 million decrease in other general and administrative
expenses is primarily the result of decreased staffing attributable to
organizational structure changes implemented during the second quarter of 2008.
This decrease is partially offset by a $2.8 million increase in expense related
to our deferred compensation plan resulting from gains on the underlying assets
of the plan and a $0.7 million increase in incentive
compensation.
Depreciation and amortization
was comprised of the following:
|
Fiscal
Year Ended
|
||||||||
|
December
30, 2009
|
December
31, 2008
|
|||||||
|
(In
thousands)
|
||||||||
|
Depreciation
of property and equipment
|
$
|
24,240
|
$
|
30,609
|
||||
|
Amortization
of capital lease assets
|
2,723
|
3,420
|
||||||
|
Amortization
of intangible assets
|
5,380
|
5,737
|
||||||
|
Total
depreciation and amortization
|
$
|
32,343
|
$
|
39,766
|
||||
The
overall decrease in depreciation and amortization expense was due to the sale of
company-owned restaurants to franchisees during 2008 and
2009.
Operating gains, losses and other
charges, net were comprised of the following:
|
Fiscal
Year Ended
|
||||||||
|
December
30, 2009
|
December
31, 2008
|
|||||||
|
(In
thousands)
|
||||||||
|
Gains
on sales of assets and other, net
|
$
|
(19,429
|
)
|
$
|
(18,701
|
)
|
||
|
Restructuring
charges and exit costs
|
3,960
|
9,022
|
||||||
|
Impairment
charges
|
986
|
3,295
|
||||||
|
Operating
(gains), losses and other charges, net
|
$
|
(14,483
|
)
|
$
|
(6,384
|
)
|
||
During
the year ended December 30, 2009, we recognized $12.5 million of gains on the
sale of 81 restaurant operations to 18 franchisees for net proceeds of $30.3
million, which included notes receivable of $3.5 million. During the year ended
December 31, 2008, we recognized $15.2 million of gains on the sale of 79
restaurant operations to 22 franchisees for net proceeds of $35.5 million, which
included notes receivable of $2.7 million. The remaining gains for the two
periods resulted from the recognition of gains on the sale of other real estate
assets and deferred gains.
16
Restructuring
charges and exit costs were comprised of the following:
|
Fiscal
Year Ended
|
||||||||
|
December
30, 2009
|
December
31, 2008
|
|||||||
|
(In
thousands)
|
||||||||
|
Exit
costs
|
$
|
698
|
$
|
3,435
|
||||
|
Severance
and other restructuring charges
|
3,262
|
5,587
|
||||||
|
Total
restructuring and exist costs
|
$
|
3,960
|
$
|
9,022
|
||||
Exit
costs for the year ended December 30, 2009 decreased by $2.7 million, resulting
primarily from the favorable termination of certain leases related to closed
restaurants. Severance and other restructuring charges decreased by $2.3
million. The $3.3 million of severance and other restructuring charges for the
year ended December 30, 2009 primarily resulted from the departure of our Chief
Operating Officer and Chief Marketing Officer during the fourth quarter. The
$5.6 million of severance and other restructuring charges for the year
ended December 31, 2008 resulted primarily from a reorganization to support our
ongoing transition to a franchise-focused business model. The reorganization led
to the elimination of approximately 70 positions in 2008.
Impairment
charges for the years ended December 30, 2009 and December 31, 2008 related to
underperforming restaurants, as well as restaurants and real estate held for
sale.
Operating income was $72.4
million during 2009 compared with $60.9 million during 2008.
Interest expense, net was
comprised of the following:
|
Fiscal
Year Ended
|
||||||||
|
December
30, 2009
|
December
31, 2008
|
|||||||
|
(In
thousands)
|
||||||||
|
Interest
on senior notes
|
$
|
17,452
|
$
|
17,740
|
||||
|
Interest
on credit facilities
|
8,101
|
9,278
|
||||||
|
Interest
on capital lease liabilities
|
3,785
|
3,804
|
||||||
|
Letters
of credit and other fees
|
1,695
|
2,019
|
||||||
|
Interest
income
|
(1,721
|
)
|
(1,289
|
)
|
||||
|
Total
cash interest
|
29,312
|
31,552
|
||||||
|
Amortization
of deferred financing costs
|
1,077
|
1,100
|
||||||
|
Interest
accretion on other liabilities
|
2,211
|
2,805
|
||||||
|
Total
interest expense, net
|
$
|
32,600
|
$
|
35,457
|
||||
The
decrease in interest expense resulted primarily from the repayment
of $46.7 million and $25.9 million on the credit facilities during the
years ended December 30, 2009 and December 31, 2008, respectively.
Other nonoperating income, net
was $3.1 million for the year ended December 30, 2009 compared with nonoperating
expense of $9.2 million for the year ended December 31, 2008. The $12.3 million
improvement over the prior year is primarily comprised of a $7.6 million
increase related to the interest rate swap and a $2.7 million increase related
to gains on investments included in our deferred compensation
plan.
The
provision for income taxes was $1.4
million compared with $3.5 million for the years ended December 30, 2009
and December 31, 2008, respectively. The reduction in our effective tax
rate for the years ended December 30, 2009 and December 31, 2008 results
primarily from the recognition of $0.7 million and $0.7 million of current tax
benefits in 2009 and 2008 related to the enactment of certain federal laws
during the first quarter of 2009 and the third quarter of 2008, respectively. We
have provided valuation allowances related to any benefits from income taxes
resulting from the application of a statutory tax rate to our net operating
losses (“NOL”) generated in previous periods. In addition, during 2008, we
utilized certain state NOL carryforwards and deductions from expired federal
wage based income tax credits whose valuation allowances were established
in connection with fresh start reporting on January 7, 1998. Accordingly, for
the year ended December 31, 2008, we recognized approximately $2.0 million
of federal and state deferred tax expense with a corresponding reduction to
the goodwill that was recorded in connection with fresh start reporting. The
adoption of the Accounting Standards Codification’s guidance on business
combinations during the first quarter of 2009 requires that any additional
reversal of deferred tax asset valuation allowance established in connection
with fresh start reporting be recorded as a component of income tax expense
rather than as a reduction to the goodwill established in connection with
the fresh start reporting.
Net
income was $41.6 million for the year ended December 30, 2009
compared with $12.7 million for the year ended December 31, 2008 due to the
factors noted above.
17
2008
Compared with 2007
Unit
Activity
|
2008
|
2007
|
|||||||
|
Company-owned
restaurants, beginning of period
|
394
|
521
|
||||||
|
Units
opened
|
3
|
5
|
||||||
|
Units
acquired from franchisees
|
—
|
1
|
||||||
|
Units
sold to franchisees
|
(79
|
)
|
(130
|
)
|
||||
|
Units
closed
|
(3
|
)
|
(3
|
)
|
||||
|
End
of period
|
315
|
394
|
||||||
|
Franchised
and licensed restaurants, beginning of period
|
1,152
|
1,024
|
||||||
|
Units
opened
|
31
|
18
|
||||||
|
Units
acquired by Company
|
—
|
(1
|
)
|
|||||
|
Units
purchased from Company
|
79
|
130
|
||||||
|
Units
closed
|
(36
|
)
|
(19
|
)
|
||||
|
End
of period
|
1,226
|
1,152
|
||||||
|
Total
company-owned, franchised and licensed restaurants, end of
period
|
1,541
|
1,546
|
||||||
Company
Restaurant Operations
During
the year ended December 31, 2008, we incurred a 1.4% decrease in same-store
sales, comprised of a 5.9% increase in guest check average and a 6.9%
decrease in guest counts. Company restaurant sales decreased $196.4 million, or
23.2%, primarily resulting from a 135 equivalent unit decrease in
company-owned restaurants, partially offset by the impact of the 53rd week in 2008.
The decrease in equivalent units primarily resulted from the sale of
company-owned restaurants to franchisees as part of our FGI
program.
Total
costs of company restaurant sales as a percentage of company restaurant sales
decreased to 87.9% from 88.3%. Product costs decreased to 24.3% from 25.6%
due to favorable shifts in menu mix. Payroll and benefits costs
decreased to 41.9% from 42.1% primarily as a result of a decrease in
management labor and restaurant staffing related to improved scheduling (0.8%),
partially offset by the impact of unfavorable workers' compensation claims
development (0.3%) and higher incentive compensation (0.2%). Occupancy costs
increased slightly to 6.2% from 6.0% primarily due to base rent
increases. Other operating expenses were comprised of the following amounts
and percentages of company restaurant sales:
|
Fiscal
Year Ended
|
||||||||||||||||
|
December
31, 2008
|
December
26, 2007
|
|||||||||||||||
|
(Dollars
in thousands)
|
||||||||||||||||
|
Utilities
|
$
|
33,160
|
5.1
|
%
|
$
|
40,898
|
4.8
|
%
|
||||||||
|
Repairs
and maintenance
|
14,592
|
2.3
|
%
|
18,300
|
2.2
|
%
|
||||||||||
|
Marketing
|
23,243
|
3.6
|
%
|
27,469
|
3.3
|
%
|
||||||||||
|
Legal
settlement costs
|
2,283
|
0.4
|
%
|
3,621
|
0.4
|
%
|
||||||||||
|
Other direct
costs
|
26,904
|
4.2
|
%
|
33,022
|
3.9
|
%
|
||||||||||
|
Other
operating expenses
|
$
|
100,182
|
15.5
|
%
|
$
|
123,310
|
14.6
|
%
|
||||||||
Utilities
increased by 0.3 percentage points primarily due to higher natural gas costs.
Marketing increased by 0.3 percentage points primarily as a result of
incremental advertising expenses during the fourth quarter of 2008. The overall
decrease in other operating expenses primarily results from the sale of
company-owned restaurants to franchisees.
Franchise
Operations
Franchise
and license revenue and costs of franchise and license revenue were comprised of
the following amounts and percentages of franchise and license revenue for the
periods indicated:
|
Fiscal
Year Ended
|
||||||||||||||||
|
December
31, 2008
|
December
26, 2007
|
|||||||||||||||
|
(Dollars in
thousands)
|
||||||||||||||||
|
Royalties
|
$
|
70,081
|
62.6
|
%
|
$
|
63,127
|
66.6
|
%
|
||||||||
|
Initial
and other fees
|
4,949
|
4.4
|
%
|
6,349
|
6.7
|
%
|
||||||||||
|
Occupancy
revenue
|
36,977
|
33.0
|
%
|
25,271
|
26.7
|
%
|
||||||||||
|
Franchise
and license revenue
|
112,007
|
100.0
|
%
|
94,747
|
100.0
|
%
|
||||||||||
|
Occupancy
costs
|
28,451
|
25.4
|
%
|
20,225
|
21.4
|
%
|
||||||||||
|
Other
direct costs
|
6,482
|
5.8
|
%
|
7,780
|
8.2
|
%
|
||||||||||
|
Costs
of franchise and license revenue
|
$
|
34,933
|
31.2
|
%
|
$
|
28,005
|
29.6
|
%
|
||||||||
18
Royalties
increased by $7.0 million, or 11.0%, primarily resulting from a 137 equivalent
unit increase in franchised and licensed units and the impact of the 53rd week in 2008.
This increase was partially offset by the effects of a 4.6% decrease in
same-store sales. The increase in equivalent units resulted from the sale of
company-owned restaurants to franchisees. The decrease in initial fees of $1.4
million, or 22.1% primarily results from the opening of 31 franchise restaurants and the sale
of 79 restaurants to franchisees during 2008 as compared to the opening of 18 franchise restaurants and the sale
of 130 restaurants to franchisees during 2007. The increase in
occupancy revenue of $11.7 million, or 46.3%, is also primarily the result of
the sale of restaurants to franchisees and the impact of the 53rd week in
2008.
Costs of
franchise and license revenue increased by $6.9 million, or 24.7%. The increase
in occupancy costs of $8.2 million, or 40.7%, is primarily the result
of the sale of company-owned restaurants to franchisees. Other direct costs
benefited by $1.3 million, or 16.7%, primarily as a result of the reorganization
of the field management structure that occurred in the third quarter of 2007. As
a percentage of franchise and license revenue, costs of franchise and license
revenue increased to 31.2% for the year ended December 31, 2008 from 29.6% for
the year ended December 26, 2007.
Other
Operating Costs and Expenses
Other
operating costs and expenses such as general and administrative expenses and
depreciation and amortization expense relate to both company and franchise
operations.
General and administrative
expenses were comprised of the following:
|
Fiscal
Year Ended
|
||||||||
|
December
31, 2008
|
December
26, 2007
|
|||||||
|
(In
thousands)
|
||||||||
|
Share-based
compensation
|
$
|
4,117
|
$
|
4,774
|
||||
|
General
and administrative expenses
|
56,853
|
62,600
|
||||||
|
Total
general and administrative expenses
|
$
|
60,970
|
$
|
67,374
|
||||
The
decrease in share-based compensation expense is primarily due to the adjustment
of the liability classified restricted stock units to fair value as of
December 31, 2008. The $5.7 million decrease in other general and administrative
expenses is primarily due to a reorganization to support our ongoing transition
to a franchise-focused business model.
Depreciation and amortization
was comprised of the following:
|
Fiscal
Year Ended
|
||||||||
|
December
31, 2008
|
December
26, 2007
|
|||||||
|
(In
thousands)
|
||||||||
|
Depreciation
of property and equipment
|
$
|
30,609
|
$
|
37,994
|
||||
|
Amortization
of capital lease assets
|
3,420
|
4,703
|
||||||
|
Amortization
of intangible assets
|
5,737
|
6,650
|
||||||
|
Total
depreciation and amortization
|
$
|
39,766
|
$
|
49,347
|
||||
The
overall decrease in depreciation and amortization expense was due to the sale of
company-owned restaurants to franchisees during 2007 and
2008.
Operating gains, losses and other
charges, net were comprised of the following:
|
Fiscal
Year Ended
|
||||||||
|
December
31, 2008
|
December
26, 2007
|
|||||||
|
(In
thousands)
|
||||||||
|
Gains
on sales of assets and other, net
|
$
|
(18,701
|
)
|
$
|
(39,028
|
)
|
||
|
Restructuring
charges and exit costs
|
9,022
|
6,870
|
||||||
|
Impairment
charges
|
3,295
|
1,076
|
||||||
|
Operating
(gains), losses and other charges, net
|
$
|
(6,384
|
)
|
$
|
(31,082
|
)
|
||
During
the year ended December 31, 2008, we recognized $15.2 million of gains on the
sale of 79 restaurant operations to 22 franchisees for net proceeds of $35.5
million, which included notes receivable of $2.7 million. During the year ended
December 26, 2007, we recognized $32.8 million of gains on the sale of 130
restaurant operations to 30 franchisees for net proceeds of $73.2 million. The
remaining gains for the two periods resulted from the recognition of gains on
the sale of other real estate assets and deferred gains.
19
Restructuring
charges and exit costs were comprised of the following:
|
Fiscal
Year Ended
|
||||||||
|
December
31, 2008
|
December
26, 2007
|
|||||||
|
(In
thousands)
|
||||||||
|
Exit
costs
|
$
|
3,435
|
$
|
1,665
|
||||
|
Severance
and other restructuring charges
|
5,587
|
5,205
|
||||||
|
Total
restructuring and exist costs
|
$
|
9,022
|
$
|
6,870
|
||||
Exit
costs for the year ended December 31, 2008 increased by $1.8 million, resulting
primarily from changes in sublease assumptions related to closed stores.
Severance and other restructuring charges for the year ended December 31, 2008
increased by $0.4 million. The $5.6 million of severance and other
restructuring charges for the year ended December 31, 2008 resulted
primarily from a reorganization to support our ongoing transition to a
franchise-focused business model. The reorganization led to the elimination of
approximately 70 positions. The $5.2 million of severance and other
restructuring charges for the year ended December 26, 2007 resulted primarily
from the reorganization of our field management structure, which led to the
elimination of 80 to 90 out-of-restaurant operational positions. Of these
eliminations, approximately 30 employees were reassigned to other positions
within the Company.
Impairment
charges for the years ended December 31, 2008 and December 26, 2007 related to
closed and underperforming restaurants, as well as restaurants identified as
held for sale.
Operating income was $60.9
million during 2008 compared with $79.8 million during 2007.
Interest expense, net was
comprised of the following:
|
Fiscal
Year Ended
|
||||||||
|
December
31, 2008
|
December
26, 2007
|
|||||||
|
(In
thousands)
|
||||||||
|
Interest
on senior notes
|
$
|
17,740
|
$
|
17,452
|
||||
|
Interest
on credit facilities
|
9,278
|
16,296
|
||||||
|
Interest
on capital lease liabilities
|
3,804
|
3,868
|
||||||
|
Letters
of credit and other fees
|
2,019
|
2,280
|
||||||
|
Interest
income
|
(1,289
|
)
|
(1,372
|
)
|
||||
|
Total
cash interest
|
31,552
|
38,524
|
||||||
|
Amortization
of deferred financing costs
|
1,100
|
1,177
|
||||||
|
Interest
accretion on other liabilities
|
2,805
|
3,256
|
||||||
|
Total
interest expense, net
|
$
|
35,457
|
$
|
42,957
|
||||
The
decrease in interest expense resulted primarily from the repayment
of $25.9 million and $100.3 million on the credit facilities during the
years ended December 31, 2008 and December 26, 2007, respectively. The decrease
from 2007 is partially offset by a 53rd week of interest in
2008.
Other nonoperating expenses, net
were $9.2 million for the year ended December 31, 2008 compared with $0.7
million for the year ended December 26, 2007. Of the 2008 amount, approximately
$5.4 million resulted from the discontinuance of hedge accounting related to our
interest rate swap. The $5.4 million of expense is comprised of a $4.2 million
change in the fair value of the swap and $1.2 million of amortization of losses
included in accumulated other comprehensive income. The remainder of the
increase in other nonoperating expenses relates primarily to losses on
investments included in our deferred compensation plan.
The provision for income taxes was
$3.5 million compared with $6.7 million for the years ended December
31, 2008 and December 26, 2007, respectively. The provision for income
taxes for the year ended December 31, 2008 included the recognition of $0.7
million of current tax benefits. This item resulted from the enactment of
certain federal laws that benefited us during the third quarter of 2008. The
year ended December 26, 2007 included the recognition of $0.3 million of current
tax benefits and a $0.6 million reduction to the valuation allowance. These
items resulted from the enactment of certain federal and state laws that
benefited us during the second quarter of 2007. We have provided valuation
allowances related to any benefits from income taxes resulting from the
application of a statutory tax rate to our net operating losses (“NOL”)
generated in previous periods. In addition, during 2008 and 2007, we utilized
certain federal and state NOL carryforwards and deductions from expired wage
based federal income tax credits whose valuation allowances were
established in connection with fresh start reporting on January 7, 1998.
Accordingly, for the years ended December 31, 2008 and December 26, 2007, we
recognized approximately $2.0 million and $6.4 million, respectively,
of federal and state deferred tax expense with a corresponding reduction to
the goodwill that was recorded in connection with fresh start reporting on
January 7, 1998. The reduction in our effective tax rate for the year ended
December 31, 2008, as compared to the year ended December 26, 2007, was
primarily due to the utilization of federal net operating loss carryforwards
during 2007 from periods prior to fresh start reporting on January 7, 1998.
These federal net operating loss carryforwards were fully utilized during fiscal
2007. We still have certain state net operating loss carryforwards from periods
prior to fresh start reporting that have been utilized in both fiscal 2007 and
2008.
Net income was $12.7 million
for the year ended December 31, 2008 compared with $29.5 million for the
year ended December 26, 2007 due to the factors noted above.
20
Liquidity
and Capital Resources
Our
primary sources of liquidity and capital resources are cash generated
from operations, borrowings under our Credit Facility (as defined in Note
10) and, in recent years, cash proceeds from the sale of surplus properties
and sales of restaurant operations to franchisees, to the extent allowed by
our Credit Facility. Principal uses of cash are operating expenses, capital
expenditures and debt repayments.
The
following table presents a summary of our sources and uses of cash and cash
equivalents for the periods indicated:
|
Fiscal
Year Ended
|
||||||||
|
December
30, 2009
|
December
31, 2008
|
|||||||
|
(In
thousands)
|
||||||||
|
Net
cash provided by operating activities
|
$
|
33,261
|
$
|
20,483
|
||||
|
Net
cash provided by investing activities
|
23,763
|
9,661
|
||||||
|
Net
cash used in financing activities
|
(51,541
|
)
|
(30,667
|
)
|
||||
|
Net
increase (decrease) in cash and cash equivalents
|
$
|
5,483
|
|
$
|
(523
|
)
|
||
The
increase in operating cash flows primarily resulted from a decrease in the
runoff of working capital deficit during 2008 following the sale of a large
number of restaurant operations to franchisees during the fourth quarter of
2007. We believe that our estimated cash flows from operations for 2010,
combined with our capacity for additional borrowings under our Credit Facility,
will enable us to meet our anticipated cash requirements and fund capital
expenditures over the next twelve months.
Net cash
flows provided by investing activities were $23.8 million for the year ended
December 30, 2009. These cash flows primarily represent net proceeds of
$40.7 million on sales of restaurant operations to franchisees and sales of
other real estate assets. The proceeds were partially offset by capital
expenditures of $20.2 million, of which $1.8 million was financed through
capital leases. Our principal capital requirements have been largely associated
with the maintenance of our existing company-owned restaurants and facilities,
new construction, remodeling and our strategic initiatives, as
follows:
|
Fiscal
Year Ended
|
||||||||
|
December
30, 2009
|
December
31, 2008
|
|||||||
|
(In
thousands)
|
||||||||
|
Facilities
|
$
|
6,733
|
$
|
10,432
|
||||
|
New
construction
|
4,604
|
4,992
|
||||||
|
Remodeling
|
4,130
|
8,306
|
||||||
|
Strategic
initiatives
|
1,065
|
3,175
|
||||||
|
Other
|
1,875
|
975
|
||||||
|
Total
capital expenditures
|
$ |
18,407
|
$ |
27,880
|
||||
We
generally expect our capital requirements to trend downward as we reduce our
company-owned restaurant portfolio and remain selective in our new restaurant
investments.
Cash
flows used in financing activities were $51.5 million for the year ended
December 30, 2009, which included $45.5 million of term loan prepayments and
$1.2 million of scheduled term loan payments made through a combination of asset
sale proceeds, as noted above, and cash generated from operations.
Our
Credit Facility consists of a $50 million revolving credit facility (including
up to $10 million for a revolving letter of credit facility), a $80.0 million
term loan and an additional $30 million letter of credit facility (reduced from
$37 million during the fourth quarter of 2009). At December 30, 2009, we had
outstanding letters of credit of $28.2 million under our letter of credit
facility. There were no outstanding letters of credit under our revolving
facility and no revolving loans outstanding at December 30, 2009. These balances
result in availability of $1.8 million under our letter of credit facility
and $50.0 million under the revolving facility.
The
revolving facility matures on December 15, 2011. The term loan and the
$30 million letter of credit facility mature on March 31, 2012. The term
loan amortizes in equal quarterly installments at a rate equal to approximately
1% per annum with all remaining amounts due on the maturity date. The revolving
facility is available for working capital, capital expenditures and other
general corporate purposes. We will be required to make mandatory prepayments
under certain circumstances (such as required payments related to asset sales)
typical for this type of credit facility and may make certain optional
prepayments under the Credit Facility.
The
Credit Facility is guaranteed by Denny's and its subsidiaries and is secured by
substantially all of the assets of Denny's and its subsidiaries. In addition,
the Credit Facility is secured by first-priority mortgages on 99 company-owned
real estate assets. The Credit Facility contains certain financial covenants
(i.e., maximum total debt to EBITDA (as defined under the Credit Facility) ratio
requirements, maximum senior secured debt to EBITDA ratio requirements, minimum
fixed charge coverage ratio requirements and limitations on capital
expenditures), negative covenants, conditions precedent, material adverse change
provisions, events of default and other terms, conditions and provisions
customarily found in credit agreements for facilities and transactions of this
type. We were in compliance with the terms of the Credit Facility as of December
30, 2009.
As of December 30, 2009, interest on loans under the revolving
facility is payable at per annum rates equal to LIBOR plus 250 basis points and
will adjust over time based on our leverage ratio. Interest on the term loan and
letter of credit facility is payable at per annum rates equal to LIBOR plus 200
basis points. As of December 30, 2009, the weighted-average interest rate under
the term loan was 2.55%.
21
Our
future contractual obligations and commitments at December 30, 2009 consisted of
the following:
|
Payments
Due by Period
|
||||||||||||||||||||
|
Total
|
Less
than 1 Year
|
1-2
Years
|
3-4
Years
|
5
Years and Thereafter
|
||||||||||||||||
|
(In
thousands)
|
||||||||||||||||||||
|
Long-term
debt
|
$
|
255,257
|
$
|
900
|
$
|
254,349
|
$
|
8
|
$
|
—
|
||||||||||
|
Capital
lease obligations (a)
|
40,165
|
7,210
|
13,164
|
9,005
|
10,786
|
|||||||||||||||
|
Operating
lease obligations
|
320,476
|
40,629
|
70,420
|
55,624
|
153,803
|
|||||||||||||||
|
Interest
obligations (a)
|
57,083
|
19,553
|
37,530
|
—
|
—
|
|||||||||||||||
|
Pension
and other defined contribution plan
obligations (b)
|
221
|
221
|
—
|
—
|
—
|
|||||||||||||||
|
Purchase
obligations (c)
|
152,820
|
147,690
|
5,130
|
—
|
—
|
|||||||||||||||
|
Total
|
$
|
826,022
|
$
|
216,203
|
$
|
380,593
|
$
|
64,637
|
$
|
164,589
|
||||||||||
|
(a)
|
Interest
obligations represent payments related to our long-term debt outstanding
at December 30, 2009. For long-term debt with variable rates, we have used
the rate applicable at December 30, 2009 to project interest over the
periods presented in the table above. The capital lease obligation amounts
above are inclusive of interest.
|
|
(b)
|
Pension
and other defined contribution plan obligations are estimates based on
facts and circumstances at December 30, 2009. Amounts cannot currently be
estimated for more than one year.
|
|
(c)
|
Purchase
obligations include amounts payable under purchase contracts for food and
non-food products. In most cases, these agreements do not obligate us to
purchase any specific volumes and include provisions that
would allow us to cancel such agreements with appropriate notice. Amounts
included in the table above represent our estimate of purchase obligations
during the periods presented if we were to cancel these contracts
with appropriate notice.
|
We have
not included in the contractual obligations table approximately $1.5 million for
long-term liabilities for unrecognized tax benefits including potential interest
and penalties. These liabilities may increase or decrease over time as a result
of tax examinations, and given the status of the examinations, we cannot
reliably estimate the period of any cash settlement with the respective taxing
authorities.
At
December 30, 2009, our working capital deficit was $33.8 million compared with
$53.7 million at December 31, 2008. The decrease in working capital deficit
resulted primarily from the sale of company-owned restaurants to franchisees
during 2008 and 2009. We are able to operate with a substantial working capital
deficit because (1) restaurant operations and most food service operations
are conducted primarily on a cash (and cash equivalent) basis with a low level
of accounts receivable, (2) rapid turnover allows a limited investment in
inventories, and (3) accounts payable for food, beverages and supplies
usually become due after the receipt of cash from the related
sales.
Off-Balance
Sheet Arrangements
Except
for operating leases entered into the normal course of business, we do not have
any off balance sheet arrangements.
Critical
Accounting Policies and Estimates
Our
discussion and analysis of our financial condition and results of operations are
based upon our Consolidated Financial Statements, which have been prepared in
accordance with U.S. generally accepted accounting principles. The preparation
of these financial statements requires us to make estimates and judgments that
affect the reported amounts of assets, liabilities, revenues and expenses, and
related disclosure of contingent assets and liabilities. On an ongoing basis, we
evaluate our estimates, including those related to self-insurance liabilities,
impairment of long-lived assets, restructuring and exit costs, income taxes and
share-based compensation. We base our estimates on historical experience and on
various other assumptions that we believe to be reasonable under the
circumstances, the results of which form the basis for making judgments about
the carrying values of assets and liabilities that are not readily apparent from
other sources. Actual results may differ from these estimates under different
assumptions or conditions; however, we believe that our estimates, including
those for the above-described items, are reasonable.
We
believe the following critical accounting policies affect our more significant
judgments and estimates used in the preparation of our Consolidated Financial
Statements:
Self-insurance liabilities.
We record liabilities for insurance claims during periods in which we
have been insured under large deductible programs or have been self-insured for
our medical and dental claims and workers’ compensation, general/product and
automobile insurance liabilities. Maximum self-insured retention, including
defense costs per occurrence, ranges from $0.5 million to $1.0 million per
individual claim for workers’ compensation and for general/product and
automobile liability. The liabilities for prior and current estimated incurred
losses are discounted to their present value based on expected loss payment
patterns determined by independent actuaries using our actual historical
payments. These estimates include assumptions regarding claims frequency and
severity as well as changes in our business environment, medical costs and the
regulatory environment that could impact our overall self-insurance
costs.
Total
discounted workers' compensation and general liability insurance liabilities at
December 30, 2009 and December 31, 2008 were $30.2 million reflecting a 2.5%
discount rate and $37.1 million reflecting a 3.5% discount rate,
respectively. The related undiscounted amounts at such dates were $32.2 million
and $40.5 million, respectively.
Impairment of long-lived
assets. We evaluate our long-lived assets for impairment at the
restaurant level on a quarterly basis, when assets are identified as held for
sale or whenever changes or events indicate that the carrying value may not be
recoverable. We assess impairment of restaurant-level assets based on the
operating cash flows of the restaurant, expected proceeds from the sale of
assets and our plans for restaurant closings. Generally, all units with
negative cash flows from operations for the most recent twelve months at each
quarter end are included in our assessment. In performing our assessment, we
make assumptions regarding estimated future cash flows, including estimated
proceeds from similar asset sales, and other factors to determine both the
recoverability and the estimated fair value of the respective assets. If the
long-lived assets of a restaurant are not recoverable based upon estimated
future, undiscounted cash flows, we write the assets down to their fair value.
If these estimates or their related assumptions change in the future, we may be
required to record additional impairment charges.
22
During
2009, 2008 and 2007, we recorded impairment charges of $1.0 million, $3.3
million and $1.1 million, respectively, for underperforming restaurants,
including restaurants closed and company-owned restaurants classified as held
for sale. These charges are included as a component of operating gains,
losses and other charges, net in our Consolidated Statements of
Operations. At December 30, 2009, we had a total of three restaurants
with an aggregate net book value of less than $0.1 million, after taking into
consideration impairment charges recorded, which had negative cash flows from
operations for the most recent twelve months.
Restructuring and exit costs.
As a result of changes in our organizational structure and in our
portfolio of restaurants, we have recorded charges for restructuring and exit
costs. These costs consist primarily of the costs of future obligations related
to closed units and severance and other restructuring charges for terminated
employees. These costs are included as a component of operating gains,
losses and other charges, net in our Consolidated Statements of
Operations.
Discounted
liabilities for future lease costs and the fair value of related subleases
of closed units are recorded when the units are closed. All other
costs related to closed units are expensed as incurred. In assessing the
discounted liabilities for future costs of obligations related to closed units,
we make assumptions regarding amounts of future subleases. If these assumptions
or their related estimates change in the future, we may be required to record
additional exit costs or reduce exit costs previously recorded. Exit costs
recorded for each of the periods presented include the effect of such changes in
estimates.
The most
significant estimate included in our accrued exit costs liabilities relates to
the timing and amount of estimated subleases. At December 30, 2009, our total
discounted liability for closed units was approximately $6.6 million, net of
$3.1 million related to existing sublease agreements and $1.4 million related to
properties for which we expect to enter into sublease agreements in the future.
If any of the estimates noted above or their related assumptions change in the
future, we may be required to record additional exit costs or reduce exit costs
previously recorded.
Income taxes. We record
valuation allowances against our deferred tax assets, when necessary.
Realization of deferred tax assets is dependent on future taxable earnings and
is therefore uncertain. We assess the likelihood that our deferred tax assets in
each of the jurisdictions in which we operate will be recovered from future
taxable income. Deferred tax assets do not include future tax benefits that we
deem likely not to be realized.
Share-based compensation.
Stock-based compensation is estimated for equity awards at fair value at the
grant date. We determine the fair value of stock options using the Black-Scholes
option pricing model. Use of this option pricing model requires the
input of subjective assumptions. These assumptions include estimating the length
of time employees will retain their vested stock options before exercising them
(“expected term”), the estimated volatility of our common stock price over the
expected term and the number of options that will ultimately not complete their
vesting requirements (“forfeitures”). The fair value of restricted stock
units containing a market condition is determined using the Monte Carlo
valuation method, which utilizes multiple input variables to determine the
probability of the Company achieving the market condition. Changes in the
subjective assumptions can materially affect the estimate of the fair value of
share-based compensation and consequently, the related amount recognized in
the Consolidated Statements of Operations.
Recent
Accounting Pronouncements
See the
New Accounting Standards section of Note 2 to our Consolidated Financial
Statements included in Part II, Item 8 of this report for further details of
recent accounting pronouncements.
Interest
Rate Risk
We have
exposure to interest rate risk related to certain instruments entered into for
other than trading purposes. Specifically, borrowings under the term loan and
revolving credit facility bear interest at variable rates based on LIBOR plus a
spread of 200 basis points per annum for the term loan and letter of credit
facility and 250 basis points per annum for the revolving credit
facility.
During
the second quarter of 2007, we entered into an interest rate swap with a
notional amount of $150 million to hedge a portion of the cash flows of our
variable rate debt. The interest rate swap economically hedged our exposure
to variability in future cash flows attributable to interest payments on the
first $150 million of floating rate debt. Under the terms of the swap, through
March 26, 2008, we paid a fixed rate of 4.8925% on the $150 million notional
amount and received payments from the counterparties based on the 3-month LIBOR
rate for a term ending on March 30, 2010, effectively resulting in a fixed rate
of 6.8925% on the $150 million notional amount. On March 26, 2008, we terminated
$50 million of the notional amount of the interest rate swap. On December 17, 2009, we terminated the remaining $100
million of the notional amount of the interest rate swap.
Based on
the levels of borrowings under the credit facility at December 30,
2009, if interest rates changed by 100 basis points our annual cash flow
and income before income taxes would change by approximately $0.8 million. This
computation is determined by considering the impact of hypothetical interest
rates on the variable rate portion of the credit facility at December 30,
2009. However, the nature and amount of our borrowings under the credit
facility may vary as a result of future business requirements, market
conditions and other factors.
Our other
outstanding long-term debt bears fixed rates of interest. The estimated fair
value of our fixed rate long-term debt (excluding capital lease obligations and
revolving credit facility advances) was approximately $179.2 million compared
with a book value of $175.3 million at December 30, 2009. This computation
is based on market quotations for the same or similar debt issues or the
estimated borrowing rates available to us. Specifically, the difference between
the estimated fair value of long-term debt compared with its historical cost
reported in our Consolidated Balance Sheets at December 30, 2009 relates
primarily to market quotations for our Denny's Holdings, Inc. 10% Senior
Notes due 2012.
We also
have exposure to interest rate risk related to our pension plan, other defined
benefit plans and self-insurance liabilities. A 25 basis point increase or
decrease in discount rate would decrease or increase our projected benefit
obligation related to our pension plan by approximately $1.8 million and
would impact the pension plan's net periodic benefit cost by $0.1
million. The impact of a 25 basis point increase or decrease in discount rate
would decrease or increase our projected benefit obligation related to our other
defined benefit plans by less than $0.1 million while the plans' net
periodic benefit cost would remain flat. A 25 basis point increase or decrease
in discount rate related to our self-insurance liabilities would result in a
decrease or increase
of $0.2 million, respectively.
23
Commodity
Price Risk
We
purchase certain food products, such as beef, poultry, pork, eggs and coffee,
and utilities such as gas and electricity, which are affected by commodity
pricing and are, therefore, subject to price volatility caused by weather,
production problems, delivery difficulties and other factors that are outside
our control and which are generally unpredictable. Changes in commodity prices
affect us and our competitors generally and often simultaneously. In general, we
purchase food products and utilities based upon market prices established with
vendors. Although many of the items purchased are subject to changes in
commodity prices, the majority of our purchasing arrangements are structured to
contain features that minimize price volatility by establishing fixed pricing
and/or price ceilings and floors. We use these types of purchase arrangements to
control costs as an alternative to using financial instruments to hedge
commodity prices. In many cases, we believe we will be able to address
commodity cost increases which are significant and appear to be long-term in
nature by adjusting our menu pricing or changing our product delivery strategy.
However, competitive circumstances could limit such actions and, in those
circumstances, increases in commodity prices could lower our margins. Because of
the often short-term nature of commodity pricing aberrations and our ability to
change menu pricing or product delivery strategies in response to commodity
price increases, we believe that the impact of commodity price risk is not
significant.
We have
established a policy to identify, control and manage market risks which may
arise from changes in interest rates, commodity prices and other relevant rates
and prices. We do not use derivative instruments for trading
purposes.
See Index
to Financial Statements which appears on page F-1 herein.
None.
A. Disclosure Controls and
Procedures. As required by Rule 13a-15(b) under the Securities Exchange
Act of 1934, as amended, (the “Exchange Act”) our management conducted an
evaluation (under the supervision and with the participation of our President
and Chief Executive Officer, Nelson J. Marchioli, and our Executive Vice
President, Chief Administrative Officer and Chief Financial Officer, F.
Mark Wolfinger) as of the end of the period covered by this Annual Report on
Form 10-K, of the effectiveness of our disclosure controls and procedures as
defined in Rules 13a-15(e) and 15d-15(e) under the Exchange Act. Based on
that evaluation, Messrs. Marchioli and Wolfinger each concluded that our
disclosure controls and procedures are effective to provide reasonable assurance
that information required to be disclosed in the reports that we file or submit
under the Exchange Act, (i) is recorded, processed, summarized and reported
within the time periods specified in the Securities and Exchange Commission’s
rules and forms and (ii) is accumulated and communicated to our management,
including Messrs. Marchioli and Wolfinger, as appropriate to allow timely
decisions regarding required disclosure.
B. Management’s Report on Internal
Control Over Financial Reporting. Our management is responsible for
establishing and maintaining adequate internal control over financial reporting,
as such term is defined in Exchange Act Rules 13a-15(f) and 15d-15(f). Our
internal control system is designed to provide reasonable assurance to our
management and Board of Directors regarding the reliability of financial
reporting and the preparation and fair presentation of financial statements
for external purposes in accordance with generally accepted accounting
principles. Because of its inherent limitations, internal control over financial
reporting may not prevent or detect misstatements. Also, projections of any
evaluation of effectiveness to future periods are subject to the risk that
controls may become inadequate because of changes in conditions, or that the
degree of compliance with the policies or procedures may
deteriorate.
Management
has assessed the effectiveness of our internal control over financial reporting
as of December 30, 2009. Management’s assessment was based on criteria set forth
in Internal Control -
Integrated Framework, issued by the Committee of Sponsoring Organizations
of the Treadway Commission (COSO). Based upon this assessment, management
concluded that, as of December 30, 2009, our internal control over financial
reporting was effective, based upon those criteria.
The
Company’s independent registered public accounting firm, KPMG LLP, has issued an
attestation report on our internal control over financial reporting, which
follows this report.
C. Changes in Internal Control Over
Financial Reporting. There have been no changes in our internal control
over financial reporting identified in connection with the evaluation required
by Rule 13a-15(d) of the Exchange Act that occurred during our last fiscal
quarter (our fourth fiscal quarter) that have materially affected, or are
reasonably likely to materially affect, our internal control over financial
reporting.
24
Report of Independent Registered
Public Accounting Firm
The Board
of Directors
Denny's
Corporation
We have
audited Denny’s Corporation’s (the Company) internal control over financial
reporting as of December 30, 2009, based on criteria established in Internal Control - Integrated
Framework issued by the Committee of Sponsoring Organizations of the
Treadway Commission (COSO).
The Company's management is responsible for maintaining effective
internal control over financial reporting and for its assessment of the
effectiveness of internal control over financial reporting, included in the
accompanying Management’s Report on Internal Control Over Financial Reporting
(Item 9A.B.). Our responsibility is to express an opinion on the Company’s
internal control over financial reporting based on our audit.
We
conducted our audit in accordance with the standards of the Public Company
Accounting Oversight Board (United States). Those standards require that we plan
and perform the audit to obtain reasonable assurance about whether effective
internal control over financial reporting was maintained in all material
respects. Our audit included obtaining an understanding of internal control over
financial reporting, assessing the risk that a material weakness exists, and
testing and evaluating the design and operating effectiveness of internal
control based on the assessed risk. Our audit also included performing such
other procedures as we considered necessary in the circumstances. We believe
that our audit provides a reasonable basis for our opinion.
A
company's internal control over financial reporting is a process designed to
provide reasonable assurance regarding the reliability of financial reporting
and the preparation of financial statements for external purposes in accordance
with generally accepted accounting principles. A company's internal
control over financial reporting includes those policies and procedures that (1)
pertain to the maintenance of records that, in reasonable detail, accurately and
fairly reflect the transactions and dispositions of the assets of the company;
(2) provide reasonable assurance that transactions are recorded as necessary to
permit preparation of financial statements in accordance with generally accepted
accounting principles, and that receipts and expenditures of the company are
being made only in accordance with authorizations of management and directors of
the company; and (3) provide reasonable assurance regarding prevention or timely
detection of unauthorized acquisition, use, or disposition of the company’s
assets that could have a material effect on the financial
statements.
Because
of its inherent limitations, internal control over financial reporting may not
prevent or detect misstatements. Also, projections of any evaluation
of effectiveness to future periods are subject to the risk that controls may
become inadequate because of changes in conditions, or that the degree of
compliance with the policies or procedures may deteriorate.
In our
opinion, Denny’s Corporation maintained, in all material respects, effective
internal control over financial reporting as of December 30, 2009, based on
criteria established in Internal Control - Integrated
Framework issued by the Committee of Sponsoring Organizations of the
Treadway Commission.
We also
have audited, in accordance with the standards of the Public Company Accounting
Oversight Board (United States), the consolidated balance sheets of Denny’s
Corporation and subsidiaries as of December 30, 2009 and December 31, 2008, and
the related consolidated statements of
operations, shareholders’ deficit and comprehensive income (loss), and cash
flows for each of the fiscal years in the three-year period ended December 30,
2009, and our report dated March 12, 2010 expressed an
unqualified opinion on those consolidated financial statements.

Greenville,
South Carolina
March 12,
2010
25
Item 9B. Other
Information
None.
Information
required by this item with respect to our executive officers and directors;
compliance by our directors, executive officers and certain beneficial owners of
our common stock with Section 16(a) of the Securities Exchange Act of 1934;
the committees of our Board of Directors; our Audit Committee Financial Expert;
and our Code of Ethics is furnished by incorporation by reference to information
under the captions entitled “Election of Directors”, “Section 16(a)
Beneficial Ownership Reporting Compliance”, and "Code of Ethics" in the
proxy statement (to be filed hereafter) in connection with Denny’s Corporation
2010 Annual Meeting of the Shareholders and possibly elsewhere in the proxy
statement (or will be filed by amendment to this report). The information
required by this item related to our executive officers appears in Item 1
of Part I of this report under the caption “Executive Officers of the
Registrant.”
The
information required by this item is furnished by incorporation by reference to
information under the captions entitled “Executive Compensation” and "Election
of Directors" in the proxy statement and possibly elsewhere in the proxy
statement (or will be filed by amendment to this report).
The
information required by this item is furnished by incorporation by reference to
information under the caption “General—Equity Security Ownership” in the proxy
statement and possibly elsewhere in the proxy statement (or will be filed by
amendment to this report).
The
information required by this item is furnished by incorporation by reference to
information under the captions “Related Party Transactions” and "Election
of Directors" in the proxy statement and possibly elsewhere in the proxy
statement (or will be filed by amendment to this report).
The
information required by this item is furnished by incorporation by reference to
information under the caption entitled “Selection of Independent Registered
Public Accounting Firm - 2009 and 2008 Audit Information” and “Audit
Committee’s Pre-approval Policies and Procedures” in the proxy statement and
possibly elsewhere in the proxy statement (or will be filed by amendment to this
report).
(a)(1)
Financial Statements:
See the Index to Financial Statements which appears on page F-1
hereof.
(a)(2) Financial Statement
Schedules: No schedules are filed herewith because of the absence of
conditions under which they are required or because the information called for
is in our Consolidated Financial Statements or notes thereto appearing elsewhere
herein.
(a)(3) Exhibits: Certain of the
exhibits to this Report, indicated by an asterisk, are hereby incorporated by
reference from other documents on file with the Commission with which they are
electronically filed, to be a part hereof as of their respective
dates.
|
Exhibit
No.
|
Description
|
|
*3.1
|
Restated
Certificate of Incorporation of Denny’s Corporation dated March 3, 2003 as
amended by Certificate of Amendment to Restated Certificate of
Incorporation to Increase Authorized Capitalization dated August 25, 2004
(incorporated by reference to Exhibit 3.1 to the Annual Report on Form
10-K of Denny’s Corporation for the year ended December 29,
2004)
|
|
*3.2
|
By-Laws
of Denny’s Corporation, as effective as of November 11, 2009 (incorporated by
reference to Exhibit 3.1 to Current Report on Form 8-K of Denny’s
Corporation filed with the Commission on November 16, 2009)
|
|
*4.1
|
10%
Senior Notes due 2012 Indenture dated as of October 5, 2004 between
Denny’s Holdings, Inc., as Issuer, Denny’s Corporation, as Guarantor, and
U.S. Bank National Association, as Trustee (incorporated by reference to
Exhibit 4.3 to the Quarterly Report on Form 10-Q of Denny’s Corporation
for the quarter ended September 29, 2004)
|
|
*4.2
|
Form
of 10% Senior Note due 2012 and annexed Guarantee (included in Exhibit 4.1
hereto)
|
|
+*10.1
|
Advantica
Restaurant Group Director Stock Option Plan, as amended through January
24, 2001 (incorporated by reference to Exhibit 10.1 to the Quarterly
Report on Form 10-Q of Denny’s Corporation (then known as Advantica) filed
with the Commission on May 14, 2001)
|
|
+*10.2
|
Advantica
Stock Option Plan as amended through November 28, 2001 (incorporated by
reference to Exhibit 10.19 to the Annual Report on Form 10-K of Denny’s
Corporation (then known as Advantica) for the year ended December 26,
2001)
|
| +*10.3 |
Form
of Agreement, dated February 9, 2000, providing certain retention
incentives and severance benefits for company management (incorporated by
reference to Exhibit 10.2 to the Quarterly Report on Form 10-Q of Denny’s
Corporation (then known as Advantica) for the quarter ended March 29,
2000)
|
26
|
Exhibit
No.
|
Description
|
|
+*10.4
|
Denny’s,
Inc. Omnibus Incentive Compensation Plan for Executives (incorporated by
reference to Exhibit 99 to the Registration Statement on Form S-8 of
Denny’s Corporation (No. 333-103220) filed with the Commission on February
14, 2003)
|
|
+*10.5
|
Description
of amendments to the Denny’s, Inc. Omnibus Incentive Compensation Plan for
Executives, the Advantica Stock Option Plan and the Advantica Restaurant
Group Director Stock Option Plan (incorporated by reference to Exhibit
10.7 to the Quarterly Report on Form 10-Q of Denny’s Corporation for the
quarter ended September 29, 2004)
|
|
+*10.6
|
Form
of stock option agreement to be used under the Denny’s Corporation 2004
Omnibus Incentive Plan (incorporated by reference to Exhibit 99.2 to the
Registration Statement on Form S-8 of Denny’s Corporation (File No.
333-120093) filed with the Commission on October 29,
2004)
|
|
+*10.7
|
Form
of deferred stock unit award certificate to be used under the Denny’s
Corporation 2004 Omnibus Incentive Plan (incorporated by reference to
Exhibit 10.27 to the Annual Report on Form 10-K of Denny’s Corporation for
the year ended December 29, 2004)
|
|
+*10.8
|
Employment
Agreement dated May 11, 2005 between Denny’s Corporation and Nelson J.
Marchioli (incorporated by reference to Exhibit 99.1 to the Current Report
on Form 8-K of Denny’s Corporation filed with the Commission on May 13,
2005)
|
|
+*10.9
|
Amendment
dated November 10, 2006 to the Employment Agreement dated May 11, 2005
between Denny’s Corporation, Denny’s Inc. and Nelson J. Marchioli
(incorporated by reference to Exhibit 10.1 to the Current Report on Form
8-K of Denny's Corporation filed with the Commission on November 13,
2006)
|
|
+*10.10
|
Amendment
dated December 12, 2008 to the Employment Agreement dated May 11, 2005 and
amended November 10, 2006, between Denny’s Corporation, Denny’s Inc. and
Nelson J. Marchioli (incorporated by reference to Exhibit 10.10 the
Annual Report on Form 10-K of Denny’s Corporation for the year ended
December 31, 2008)
|
|
+*10.11
|
Amended and Restated Employment Agreement dated
May 1, 2009 between Denny’s Corporation, Denny’s Inc. and Nelson J.
Marchioli (incorporated by reference to Exhibit 10.1 to the
Current Report on Form 8-K of Denny’s Corporation filed with the
Commission on May 7, 2009)
|
|
+*10.12
|
Amendment
dated December 10, 2008 to the letter agreement dated February 09, 2000
between Denny’s Corporation, then known as Advantica, and Janis S. Emplit
(incorporated by reference to Exhibit 10.11 the
Annual Report on Form 10-K of Denny’s Corporation for the year ended
December 31, 2008)
|
|
+*10.13
|
Employment
Offer Letter dated August 16, 2005 between Denny’s Corporation and F. Mark
Wolfinger (incorporated by reference to Exhibit 10.1 to the Quarterly
Report on Form 10-Q of Denny’s Corporation for the quarter ended September
28, 2005)
|
|
*10.14
|
Amended
and Restated Credit Agreement dated as of December 15, 2006, among Denny’s
Inc. and Denny’s Realty, LLC, as Borrowers, Denny’s Corporation, Denny’s
Holdings, Inc., and DFO, LLC, as Guarantors, the Lenders named therein,
Bank of America, N.A., as Administrative Agent and Collateral Agent, and
Banc of America Securities LLC as Sole Lead Arranger and Sole Bookrunner
(incorporated by reference to Exhibit 10.1 to the Quarterly Report on Form
10-Q of Denny's Corporation for the quarter ended September 30,
2009)
|
|
*10.15
|
Amended
and Restated Guarantee and Collateral Agreement dated as of December 15,
2006, among Denny’s Inc., Denny’s Realty, LLC, Denny’s Corporation,
Denny’s Holdings, Inc., DFO, LLC, each other Subsidiary Loan Party
referenced therein and Bank of America, N.A., as Collateral Agent
(incorporated by reference to Exhibit 10.2 to the Quarterly Report on Form
10-Q of Denny's Corporation for the quarter ended September 30,
2009)
|
|
+*10.16
|
Written
Description of Denny’s 2007 Corporate Incentive Plan (incorporated by
reference to Exhibit 10.1 to the Quarterly Report on Form 10-Q of Denny’s
Corporation for the quarter ended March 28, 2007)
|
|
+*10.17
|
Written
Description of 2007 Long-Term Growth Incentive Program (incorporated by
reference to Exhibit 10.2 to the Quarterly Report on Form 10-Q of Denny’s
Corporation for the quarter ended March 28, 2007)
|
|
*10.18
|
Amendment
No. 1 dated as of March 8, 2007 to the Amended and Restated Credit
Agreement dated as of December 15, 2006 (incorporated by reference to
Exhibit 99.1 to the Current Report on Form 8-K of Denny’s Corporation
filed with the Commission on March 14, 2007)
|
|
+*10.19
|
Award
certificate evidencing restricted stock unit award to F. Mark Wolfinger,
effective July 9, 2007 (incorporated by reference to Exhibit 10.1 to the
Current Report on Form 8-K of Denny’s Corporation filed with the
Commission on July 12, 2007)
|
|
+*10.20
|
Written
Description of Denny's Paradigm Shift Incentive Program (incorporated by
reference to the Current Reports on Form 8-K of Denny's Corporation
filed with the Commission on December 4, 2007 and May 27,
2008)
|
|
+*10.21
|
Denny's
Corporation Executive Severance Pay Plan (incorporated by reference to
Exhibit 99.1 to the Current Report on Form 8-K of Denny's Corporation
filed with the Commission on February 4, 2008)
|
|
+*10.22
|
Denny's
Corporation 2008 Omnibus Incentive Plan (incorporated by reference to
Exhibit 99.1 to the Current Report on Form 8-K of Denny's Corporation
filed with the Commission on May 27,
2008)
|
27
|
Exhibit
No.
|
Description
|
| +*10.23 |
Amendment
to the Denny’s Corporation 2008 Omnibus Incentive Plan (incorporated by
reference to Exhibit 10.3 to the Quarterly Report on Form 10-Q of Denny’s
Corporation for the quarter ended April 1, 2009)
|
|
+*10.24
|
Denny's
Corporation Amended and Restated 2004 Omnibus Incentive Plan (incorporated
by reference to Exhibit 10.2 to the Quarterly Report on Form 10-Q of
Denny's Corporation for the quarter ended June 25,
2008)
|
|
+*10.25
|
Form
of Performance-Based Restricted Stock Unit Award Certificate (incorporated
by reference to Exhibit 10.1 to the Quarterly Report on Form 10-Q of
Denny's Corporation for the quarter ended September 24,
2008)
|
|
+*10.26
|
2008
Performance Restricted Stock Unit Program Description (incorporated by
reference to Exhibit 10.2 to the Quarterly Report on Form 10-Q of Denny's
Corporation for the quarter ended September 24, 2008)
|
|
+*10.27
|
Form of 2009 Long-Term Performance Incentive
Program Performance Shares and Target Cash Opportunity Award Certificate
(incorporated by reference to Exhibit 10.1 to the Quarterly Report on Form
10-Q of Denny’s Corporation for the quarter ended April 1,
2009)
|
|
+*10.28
|
Written Description of Denny’s 2009 Long-Term
Performance Incentive Program (incorporated by reference to Exhibit 10.2
to the Quarterly Report on Form 10-Q of Denny’s Corporation for the
quarter ended April 1, 2009)
|
| +*10.29 | Written Description of the Denny's 2009 Corporate Incentive Program (incorporate by reference to Exhibit 10.28 to the Annual Report on Form 10-K of Denny's Corporation for the year ended December 31, 2008) |
| +10.30 | Denny's Corporate Incentive Plan |
|
21.1
|
Subsidiaries
of Denny’s
|
|
23.1
|
Consent
of KPMG LLP
|
|
31.1
|
Certification
of Nelson J. Marchioli, President and Chief Executive Officer of Denny’s
Corporation, pursuant to Rule 13a-14(a), as adopted pursuant to Section
302 of the Sarbanes-Oxley Act of 2002
|
|
31.2
|
Certification
of F. Mark Wolfinger, Executive Vice President, Chief Administrative
Officer and Chief Financial Officer of Denny’s Corporation, pursuant to
Rule 13a-14(a), as adopted pursuant to Section 302 of the Sarbanes-Oxley
Act of 2002
|
|
32.1
|
Statement
of Nelson J. Marchioli, President and Chief Executive Officer of Denny’s
Corporation, and F. Mark Wolfinger, Executive Vice President, Chief
Administrative Officer and Chief Financial Officer of Denny’s
Corporation, pursuant to 18 U.S.C. Section 1350, as adopted pursuant to
Section 906 of the Sarbanes-Oxley Act of
2002
|
|
+
|
Denotes
management contracts or compensatory plans or
arrangements.
|
28
DENNY’S
CORPORATION AND SUBSIDIARIES
|
Page
|
|
|
Report
of Independent Registered Public Accounting Firm on Consolidated Financial
Statements
|
F-2
|
|
Consolidated
Statements of Operations for each of the Three Fiscal Years in the Period
Ended December 30, 2009
|
F-3
|
|
Consolidated
Balance Sheets as of December 30, 2009 and December 31,
2008
|
F-4
|
|
Consolidated
Statements of Shareholders’ Deficit and Comprehensive Loss for each of the
Three Fiscal Years in the Period Ended December 30,
2009
|
F-5
|
|
Consolidated
Statements of Cash Flows for each of the Three Fiscal Years in the Period
Ended December 30, 2009
|
F-6
|
|
Notes
to Consolidated Financial Statements
|
F-7
|
F-1
Report
of Independent Registered Public Accounting Firm
The Board
of Directors
Denny's
Corporation
We have
audited the accompanying consolidated balance sheets of Denny’s Corporation and
subsidiaries as of December 30, 2009 and December 31, 2008, and the related
consolidated statements of operations, shareholders’ deficit and comprehensive
income (loss), and cash flows for each of the fiscal years in the three-year
period ended December 30, 2009. These consolidated financial statements are the
responsibility of the Company’s management. Our responsibility is to express an
opinion on these consolidated financial statements based on our
audits.
We
conducted our audits in accordance with the standards of the Public Company
Accounting Oversight Board (United States). Those standards require that we plan
and perform the audit to obtain reasonable assurance about whether the financial
statements are free of material misstatement. An audit includes examining, on a
test basis, evidence supporting the amounts and disclosures in the financial
statements. An audit also includes assessing the accounting principles used and
significant estimates made by management, as well as evaluating the overall
financial statement presentation. We believe that our audits provide a
reasonable basis for our opinion.
In our
opinion, the consolidated financial statements referred to above present fairly,
in all material respects, the financial position of Denny’s Corporation and
subsidiaries as of December 30, 2009 and December 31, 2008, and the results of
their operations and their cash flows for each of the fiscal years in the
three-year period ended December 30, 2009, in conformity with U.S. generally
accepted accounting principles.
We also
have audited, in accordance with the standards of the Public Company Accounting
Oversight Board (United States), the Company’s internal control over financial
reporting as of December 30, 2009, based on criteria established in Internal Control—Integrated
Framework issued by the Committee of Sponsoring Organizations of the
Treadway Commission (COSO), and our report dated March 12, 2010 expressed an
unqualified opinion on the effectiveness of the Company's internal control
over financial reporting.
Greenville,
South Carolina
March 12,
2010
F-2
Denny’s
Corporation and Subsidiaries
Consolidated
Statements of Operations
|
Fiscal
Year Ended
|
||||||||||||
|
December
30, 2009
|
December
31, 2008
|
December
26, 2007
|
||||||||||
|
(In
thousands, except per share amounts)
|
||||||||||||
|
Revenue:
|
||||||||||||
|
Company
restaurant sales
|
$
|
488,948
|
$
|
648,264
|
$
|
844,621
|
||||||
|
Franchise
and license revenue
|
119,155
|
112,007
|
94,747
|
|||||||||
|
Total
operating revenue
|
608,103
|
760,271
|
939,368
|
|||||||||
|
Costs
of company restaurant sales:
|
||||||||||||
|
Product
costs
|
114,861
|
157,545
|
215,943
|
|||||||||
|
Payroll
and benefits
|
197,612
|
271,933
|
355,710
|
|||||||||
|
Occupancy
|
31,937
|
40,415
|
50,977
|
|||||||||
|
Other
operating expenses
|
73,496
|
100,182
|
123,310
|
|||||||||
|
Total
costs of company restaurant sales
|
417,906
|
570,075
|
745,940
|
|||||||||
|
Costs
of franchise and license revenue
|
42,626
|
34,933
|
28,005
|
|||||||||
|
General
and administrative expenses
|
57,282
|
60,970
|
67,374
|
|||||||||
|
Depreciation
and amortization
|
32,343
|
39,766
|
49,347
|
|||||||||
|
Operating
(gains), losses and other charges, net
|
(14,483
|
)
|
(6,384
|
)
|
(31,082
|
)
|
||||||
|
Total
operating costs and expenses
|
535,674
|
699,360
|
859,584
|
|||||||||
|
Operating
income
|
72,429
|
60,911
|
79,784
|
|||||||||
|
Other
expenses:
|
||||||||||||
|
Interest
expense, net
|
32,600
|
35,457
|
42,957
|
|||||||||
|
Other
nonoperating (income) expense, net
|
(3,125
|
)
|
9,190
|
668
|
||||||||
|
Total
other expenses, net
|
29,475
|
44,647
|
43,625
|
|||||||||
|
Net
income before income taxes
|
42,954
|
16,264
|
36,159
|
|||||||||
|
Provision
for income taxes
|
1,400
|
3,522
|
6,675
|
|||||||||
|
Net
income
|
$
|
41,554
|
$
|
12,742
|
$
|
29,484
|
||||||
|
Net
income per share:
|
||||||||||||
|
Basic
|
$
|
0.43
|
$
|
0.13
|
$
|
0.31
|
||||||
|
Diluted
|
$
|
0.42
|
$
|
0.13
|
$
|
0.30
|
||||||
|
Weighted-average
shares outstanding:
|
||||||||||||
|
Basic
|
96,318
|
95,230
|
93,855
|
|||||||||
|
Diluted
|
98,499
|
98,842
|
98,844
|
|||||||||
See
accompanying notes to consolidated financial statements.
F-3
Denny’s
Corporation and Subsidiaries
Consolidated
Balance Sheets
|
December
30, 2009
|
December
31, 2008
|
|||||||
|
(In
thousands)
|
||||||||
|
Assets
|
||||||||
|
Current
Assets:
|
||||||||
|
Cash
and cash equivalents
|
$
|
26,525
|
$
|
21,042
|
||||
|
Receivables,
less allowance for doubtful accounts of $171 and $475,
respectively
|
18,106
|
15,146
|
||||||
|
Inventories
|
4,165
|
5,455
|
||||||
|
Assets
held for sale
|
—
|
2,285
|
||||||
|
Prepaid
and other current assets
|
9,549
|
9,531
|
||||||
|
Total
Current Assets
|
58,345
|
53,459
|
||||||
|
Property,
net of accumulated depreciation of $258,695 and $284,933,
respectively
|
131,484
|
159,978
|
||||||
|
Other
Assets:
|
||||||||
|
Goodwill
|
32,440
|
34,609
|
||||||
|
Intangible
assets, net
|
55,110
|
58,832
|
||||||
|
Deferred
financing costs, net
|
2,676
|
3,879
|
||||||
|
Other
noncurrent assets
|
32,572
|
31,041
|
||||||
|
Total
Assets
|
$
|
312,627
|
$
|
341,798
|
||||
|
Liabilities
|
||||||||
|
Current
Liabilities:
|
||||||||
|
Current
maturities of notes and debentures
|
$
|
900
|
$
|
1,403
|
||||
|
Current
maturities of capital lease obligations
|
3,725
|
3,535
|
||||||
|
Accounts
payable
|
22,842
|
25,255
|
||||||
|
Other
current liabilities
|
64,641
|
76,924
|
||||||
|
Total
Current Liabilities
|
92,108
|
107,117
|
||||||
|
Long-Term
Liabilities:
|
||||||||
|
Notes
and debentures, less current maturities
|
254,357
|
300,617
|
||||||
|
Capital
lease obligations, less current maturities
|
19,684
|
22,084
|
||||||
|
Liability
for insurance claims, less current portion
|
21,687
|
25,832
|
||||||
|
Deferred
income taxes
|
13,016
|
12,345
|
||||||
|
Other
noncurrent liabilities and deferred credits
|
39,273
|
53,237
|
||||||
|
Total
Long-Term Liabilities
|
348,017
|
414,115
|
||||||
|
Total
Liabilities
|
440,125
|
521,232
|
||||||
|
Commitments
and contingencies
|
||||||||
|
Shareholders'
Deficit
|
||||||||
|
Common
stock $0.01 par value; shares authorized - 135,000; issued and
outstanding: 2009 – 96,613; 2008 – 95,713
|
966
|
957
|
||||||
|
Paid-in
capital
|
542,576
|
538,911
|
||||||
|
Deficit
|
(652,827
|
)
|
(694,381
|
)
|
||||
|
Accumulated
other comprehensive loss, net of tax
|
(18,213
|
)
|
(24,921
|
)
|
||||
|
Total
Shareholders' Deficit
|
(127,498
|
)
|
(179,434
|
)
|
||||
|
Total
Liabilities and Shareholders' Deficit
|
$
|
312,627
|
$
|
341,798
|
||||
See
accompanying notes to consolidated financial statements.
F-4
Denny’s
Corporation and Subsidiaries
Consolidated
Statements of Shareholders’ Deficit and Comprehensive Loss
|
Common
Stock
|
Accumulated
Other
Comprehensive
|
Total
Shareholders’
|
||||||||||||||||||||||
|
Shares
|
Amount
|
Paid-in
Capital
|
(Deficit)
|
Loss,
Net
|
Deficit
|
|||||||||||||||||||
|
(In
thousands)
|
||||||||||||||||||||||||
|
Balance,
December 27, 2006
|
93,186
|
$
|
932
|
$
|
527,911
|
$
|
(734,997
|
)
|
$
|
(17,423
|
)
|
$
|
(223,577
|
)
|
||||||||||
|
Income
tax adjustment (Note 2)
|
—
|
—
|
—
|
(1,610
|
)
|
—
|
(1,610
|
)
|
||||||||||||||||
|
Balance,
December 27, 2006
|
93,186
|
932
|
|
527,911
|
|
(736,607
|
)
|
(17,423
|
)
|
(225,187
|
)
|
|||||||||||||
|
Comprehensive
income:
|
||||||||||||||||||||||||
|
Net
income (Note 2)
|
—
|
—
|
—
|
29,484
|
—
|
29,484
|
||||||||||||||||||
|
Recognition
of unrealized loss on hedged transactions,
net
of tax
|
—
|
—
|
—
|
—
|
(2,753
|
)
|
(2,753
|
)
|
||||||||||||||||
|
Reclassification
of unrealized loss on hedged transactions
resulting
from the loss of hedge accounting
|
—
|
—
|
—
|
—
|
400
|
400
|
||||||||||||||||||
|
Minimum
pension liability adjustment, net of tax
|
—
|
—
|
—
|
—
|
6,632
|
6,632
|
||||||||||||||||||
|
Comprehensive
income
|
—
|
—
|
—
|
29,484
|
4,279
|
33,763
|
||||||||||||||||||
|
Share-based
compensation on equity classified awards
|
—
|
—
|
3,367
|
—
|
—
|
3,367
|
||||||||||||||||||
|
Issuance
of common stock for share-based compensation
|
247
|
2
|
220
|
—
|
—
|
222
|
||||||||||||||||||
|
Exercise
of common stock options
|
1,193
|
12
|
2,114
|
—
|
—
|
2,126
|
||||||||||||||||||
|
Balance,
December 26, 2007
|
94,626
|
946
|
533,612
|
(707,123
|
)
|
(13,144
|
)
|
(185,709
|
)
|
|||||||||||||||
|
Comprehensive
income:
|
||||||||||||||||||||||||
|
Net
income (Note 2)
|
—
|
—
|
—
|
12,742
|
—
|
12,742
|
||||||||||||||||||
|
Amortization of
unrealized loss on hedged transactions,
net
of tax
|
—
|
—
|
—
|
—
|
1,166
|
1,166
|
||||||||||||||||||
|
Minimum
pension liability adjustment, net of tax
|
—
|
—
|
—
|
—
|
(12,943
|
)
|
(12,943
|
)
|
||||||||||||||||
|
Comprehensive
income
|
—
|
—
|
—
|
12,742
|
(11,777
|
)
|
965
|
|||||||||||||||||
|
Share-based
compensation on equity classified awards
|
—
|
—
|
4,025
|
—
|
—
|
4,025
|
||||||||||||||||||
|
Issuance
of common stock for share-based compensation
|
385
|
4
|
286
|
—
|
—
|
290
|
||||||||||||||||||
|
Exercise
of common stock options
|
702
|
7
|
988
|
—
|
—
|
995
|
||||||||||||||||||
|
Balance,
December 31, 2008
|
95,713
|
957
|
538,911
|
(694,381
|
)
|
(24,921
|
)
|
(179,434
|
)
|
|||||||||||||||
|
Comprehensive
income:
|
||||||||||||||||||||||||
|
Net
income
|
—
|
—
|
—
|
41,554
|
—
|
41,554
|
||||||||||||||||||
|
Amortization of
unrealized loss on hedged transactions,
net
of tax
|
—
|
—
|
—
|
—
|
1,020
|
1,020
|
||||||||||||||||||
|
Minimum
pension liability adjustment, net of tax
|
—
|
—
|
—
|
—
|
5,688
|
5,688
|
||||||||||||||||||
|
Comprehensive
income
|
—
|
—
|
—
|
41,554
|
6,708
|
48,262
|
||||||||||||||||||
|
Share-based
compensation on equity classified awards
|
—
|
—
|
3,567
|
—
|
—
|
3,567
|
||||||||||||||||||
|
Issuance
of common stock for share-based compensation
|
806
|
8
|
(8
|
)
|
—
|
—
|
—
|
|||||||||||||||||
|
Exercise
of common stock options
|
94
|
1
|
106
|
—
|
—
|
107
|
||||||||||||||||||
|
Balance,
December 30, 2009
|
96,613
|
$
|
966
|
$
|
542,576
|
$
|
(652,827
|
)
|
$
|
(18,213
|
)
|
$
|
(127,498
|
)
|
||||||||||
See
accompanying notes to consolidated financial statements.
F-5
Denny’s
Corporation and Subsidiaries
Consolidated
Statements of Cash Flows
|
Fiscal
Year Ended
|
||||||||||||
|
December
30, 2009
|
December
31, 2008
|
December
26, 2007
|
||||||||||
|
(In
thousands)
|
||||||||||||
|
Cash
Flows from Operating Activities:
|
||||||||||||
|
Net
income
|
$
|
41,554
|
$
|
12,742
|
$
|
29,484
|
||||||
|
Adjustments
to reconcile net income to cash flows provided by operating
activities:
|
||||||||||||
|
Depreciation
and amortization
|
32,343
|
39,766
|
49,347
|
|||||||||
|
Operating
(gains), losses and other charges, net
|
(14,483
|
)
|
(6,384
|
)
|
(31,082
|
)
|
||||||
|
Amortization
of deferred financing costs
|
1,077
|
1,100
|
1,177
|
|||||||||
|
Loss
on early extinguishment of debt
|
109
|
6
|
545
|
|||||||||
|
(Gain)
loss on interest rate swap
|
(2,241
|
) |
5,351
|
400
|
||||||||
|
Deferred
income tax expense
|
671
|
2,757
|
5,788
|
|||||||||
|
Share-based
compensation
|
4,671
|
4,117
|
4,774
|
|||||||||
|
Changes
in assets and liabilities, net of effects of acquisitions and
dispositions:
|
||||||||||||
|
Decrease
(increase) in assets:
|
||||||||||||
|
Receivables
|
(736
|
)
|
(727
|
)
|
1,420
|
|||||||
|
Inventories
|
1,290
|
1,030
|
1,714
|
|||||||||
|
Other
current assets
|
(17
|
)
|
(5
|
)
|
(447
|
)
|
||||||
|
Other
assets
|
(3,486
|
)
|
(2,148
|
)
|
(3,338
|
)
|
||||||
|
Increase
(decrease) in liabilities:
|
||||||||||||
|
Accounts
payable
|
(1,366
|
)
|
(14,838
|
)
|
2,329
|
|||||||
|
Accrued
salaries and vacations
|
(3,946
|
)
|
(6,408
|
)
|
(2,514
|
)
|
||||||
|
Accrued
taxes
|
(893
|
)
|
(861
|
)
|
(2,076
|
)
|
||||||
|
Other
accrued liabilities
|
(13,323
|
)
|
(5,406
|
)
|
1,184
|
|||||||
|
Other
noncurrent liabilities and deferred credits
|
(7,963
|
)
|
(9,609
|
)
|
(8,410
|
)
|
||||||
|
Net
cash flows provided by operating activities
|
33,261
|
20,483
|
50,295
|
|||||||||
|
Cash
Flows from Investing Activities:
|
||||||||||||
|
Purchase
of property
|
(18,407
|
)
|
(27,880
|
)
|
(30,852
|
)
|
||||||
|
Proceeds
from disposition of property
|
40,658
|
37,541
|
80,721
|
|||||||||
|
Collections
on notes receivable
|
1,512 | — | — | |||||||||
|
Acquisition
of restaurant units
|
—
|
—
|
(2,208
|
)
|
||||||||
|
Net
cash flows provided by investing activities
|
23,763
|
9,661
|
47,661
|
|||||||||
|
Cash
Flows from Financing Activities:
|
||||||||||||
|
Long-term
debt payments
|
(50,452
|
)
|
(30,200
|
)
|
(102,104
|
)
|
||||||
|
Proceeds
from exercise of stock options
|
107
|
995
|
2,126
|
|||||||||
|
Tax
withholding on share-based payments
|
(253
|
) |
—
|
—
|
||||||||
|
Net
bank overdrafts
|
(943 | ) | (1,462 | ) | (2,238 | ) | ||||||
|
Deferred
financing costs paid
|
—
|
—
|
(401
|
)
|
||||||||
|
Net
cash flows used in financing activities
|
(51,541
|
)
|
(30,667
|
)
|
(102,617
|
)
|
||||||
|
Increase
(decrease) in cash and cash equivalents
|
5,483
|
|
(523
|
)
|
(4,661
|
)
|
||||||
|
Cash
and Cash Equivalents at:
|
||||||||||||
|
Beginning
of year
|
21,042
|
21,565
|
26,226
|
|||||||||
|
End
of year
|
$
|
26,525
|
$
|
21,042
|
$
|
21,565
|
||||||
See
accompanying notes to consolidated financial statements.
F-6
Denny’s
Corporation and Subsidiaries
Notes
to Consolidated Financial Statements
Note
1. Introduction and Basis of Reporting
Denny’s
Corporation, or Denny’s, is one of America’s largest family-style restaurant
chains. At December 30, 2009, the Denny’s brand consisted of 1,551
restaurants, 1,318 (85%) of which were franchised/licensed restaurants
and 233 (15%) of which were company-owned and operated. Denny’s restaurants are
operated in 49 states, the District of Columbia, two U.S. territories and five
foreign countries with principal concentrations in California (26% of total
restaurants), Florida (10%) and Texas (10%).
The
following table shows the unit activity for the years ended December 30,
2009 and December 31, 2008:
|
2009
|
2008
|
|||||||
|
Company-owned
restaurants, beginning of period
|
315
|
394
|
||||||
|
Units
opened
|
1
|
3
|
||||||
|
Units
sold to franchisees
|
(81
|
)
|
(79
|
)
|
||||
|
Units
closed
|
(2
|
)
|
(3
|
)
|
||||
|
End
of period
|
233
|
315
|
||||||
|
Franchised
and licensed restaurants, beginning of period
|
1,226
|
1,152
|
||||||
|
Units
opened
|
39
|
31
|
||||||
|
Units
purchased from Company
|
81
|
79
|
||||||
|
Units
closed
|
(28
|
)
|
(36
|
)
|
||||
|
End
of period
|
1,318
|
1,226
|
||||||
|
Total
company-owned, franchised and licensed restaurants, end of
period
|
1,551
|
1,541
|
||||||
Note
2. Summary of Significant Accounting
Policies
The
following accounting policies significantly affect the preparation of our
Consolidated Financial Statements:
Use of
Estimates. In preparing our Consolidated Financial Statements in
conformity with U.S. generally accepted accounting principles, management
is required to make certain assumptions and estimates that affect reported
amounts of assets, liabilities, revenues, expenses and the disclosure of
contingencies. In making these assumptions and estimates, management may from
time to time seek advice and consider information provided by actuaries and
other experts in a particular area. Actual amounts could differ materially from
these estimates.
Consolidation
Policy. Our Consolidated Financial Statements include the
financial statements of Denny’s Corporation and its wholly-owned subsidiaries,
the most significant of which are Denny’s Holdings, Inc. and the subsidiaries of
Denny's Holdings, Inc.; Denny’s, Inc. and DFO, LLC. All significant intercompany
balances and transactions have been eliminated in consolidation.
Fiscal
Year. Our fiscal year ends on the Wednesday in December closest to
December 31 of each year. As a result, a fifty-third week is added to a
fiscal year every five or six years. Fiscal 2008 included 53 weeks of
operations, whereas 2009 and 2007 each included 52 weeks of
operations.
Cash
Equivalents and Short-term Investments. We consider all highly
liquid investments with an original maturity of three months or less to be cash
equivalents. Cash and cash equivalents include short-term investments of $24.2
million and $16.2 million at December 30, 2009 and December 31, 2008,
respectively. These amounts were held overnight in Denny's main
bank account due to earnings credits and asset security provided under the FDIC
Transaction Account Guarantee Program (TAGP).
Allowances for Doubtful Accounts. We
maintain allowances for doubtful accounts for estimated losses resulting from
the inability of our franchisees to make required payments for franchise
royalties, rent, advertising and notes receivable. In assessing recoverability
of these receivables, we make judgments regarding the financial condition of the
franchisees based primarily on past and current payment trends and periodic
financial information, which the franchisees are required to submit to
us.
Inventories. Inventories consist of food
and beverages and are valued primarily at the lower of average cost (first-in,
first-out) or market.
Assets Held for Sale. Assets held for
sale consist of real estate properties and restaurant operations that we expect
to sell within the next 12 months. The assets are reported at the lower of
carrying amount or fair value less costs to sell. We cease recording
depreciation on assets that are classified as held for sale. If the
determination is made that we no longer expect to sell an asset within the next
12 months, the asset is reclassified out of held for sale.
Property and Depreciation. Owned
property is stated at cost. Property under capital leases is stated at the
present value of the minimum lease payments. We depreciate owned property
over its estimated useful life using the straight-line method. We
amortize property held under capital leases (at capitalized value) over the
lesser of its estimated useful life or the initial lease term. In certain
situations, one or more option periods may be used in determining the
depreciable life of certain properties leased under operating lease agreements
if we deem that an economic penalty will be incurred and exercise of such option
periods is reasonably assured. In either circumstance, our policy requires lease
term consistency when calculating the depreciation period, in classifying the
lease and in computing rent expense. The following estimated useful service
lives were in effect during all periods presented in the financial
statements:
Buildings—Five
to thirty years
Equipment—Two
to ten years
Leasehold
Improvements—Estimated useful life limited by the expected lease term, generally
between five and fifteen years.
F-7
Note 2.
Summary of Significant Accounting Policies
(continued)
Goodwill. Amounts recorded as goodwill
primarily represent excess reorganization value recognized as a result of our
1998 bankruptcy. We test goodwill for impairment at each fiscal year end, and
more frequently if circumstances indicate impairment may exist. Such indicators
include, but are not limited to, a significant decline in our expected future
cash flows; a significant adverse decline in our stock price; significantly
adverse legal developments; and a significant change in the business
climate.
Other Intangible Assets. Other
intangible assets consist primarily of trademarks, trade names, franchise
and other operating agreements and capitalized software development costs. Trade
names and trademarks are considered indefinite-lived intangible assets and are
not amortized. Franchise and other operating agreements are amortized using the
straight-line basis over the term of the related agreement. Capitalized software
development costs are amortized over the estimated useful life of the
software. We test trade name and trademark assets for impairment at each
fiscal year end, and more frequently if circumstances indicate impairment may
exist. We assess impairment of franchise and other operating agreements and
capitalized software development costs whenever changes or events indicate that
the carrying value may not be recoverable.
Long-term
Investments. Long-term
investments include nonqualified deferred compensation plan assets held in a
rabbi trust. Each plan participant's account is comprised of their contribution,
our matching contribution and each participant's share of earnings or losses in
the plan. The investments of the rabbi trust are considered trading securities
and are reported at fair value in other noncurrent assets with an offsetting
liability included in other noncurrent liabilities and deferred credits in our
Consolidated Balance Sheets. The realized and unrealized holding gains and
losses related to the investments are recorded in other income (expense) with an
offsetting amount recorded in general and administrative expenses in our
Consolidated Statement of Operations. During 2009, 2008 and 2007, we
incurred a net gain of $1.0 million, a net loss of $1.7 million and a net
gain of $0.5 million, respectively. The fair value of the investments of
the deferred compensation plan were $5.7 million and $5.4 million at
December 30, 2009 and December 31, 2008, respectively.
Deferred Financing Costs. Costs related
to the issuance of debt are deferred and amortized as a component of interest
expense using the effective interest method over the terms of the respective
debt issuances.
Cash
Overdrafts. We have included in accounts payable in our
Consolidated Balance Sheets cash overdrafts totaling $7.6 million and $8.5
million at December 30, 2009 and December 31, 2008, respectively. Changes in
such amounts are reflected in the cash flows from financing activities in the
Consolidated Statements of Cash Flows.
Self-insurance liabilities. We record
liabilities for insurance claims during periods in which we have been insured
under large deductible programs or have been self-insured for our medical and
dental claims and workers’ compensation, general/product and automobile
insurance liabilities. Maximum self-insured retention levels, including defense
costs per occurrence, range from $0.5 million to $1.0 million per individual
claim for workers’ compensation and for general/product and automobile
liability. The liabilities for prior and current estimated incurred losses are
discounted to their present value based on expected loss payment patterns
determined by independent actuaries using our actual historical
payments.
Total
discounted insurance liabilities at December 30, 2009 and December 31, 2008 were
$30.2 million reflecting a 2.5% discount rate and $37.1 million reflecting
a 3.5% discount rate, respectively. The related undiscounted amounts at
such dates were $32.2 million and $40.5 million, respectively.
Income Taxes. We account for income
taxes under the asset and liability method. Deferred tax assets and liabilities
are recognized for the future tax consequences attributable to differences
between the financial statement carrying amounts of existing assets and
liabilities and their respective tax bases and operating loss and tax credit
carryforwards. We record a valuation allowance to reduce our net deferred tax
assets to the amount that is more-likely-than-not to be realized. While we have
considered ongoing, prudent and feasible tax planning strategies in assessing
the need for our valuation allowance, in the event we were to determine that we
would be able to realize our deferred tax assets in the future in an amount in
excess of the net recorded amount, an adjustment to the valuation allowance
would decrease income tax expense in the period such determination was made.
Interest and penalties accrued in relation to unrecognized tax benefits are
recognized in income tax expense.
Leases and
Subleases. Our policy requires the use of a consistent lease term for
(i) calculating the maximum depreciation period for related buildings and
leasehold improvements; (ii) classifying the lease; and
(iii) computing periodic rent expense increases where the lease terms
include escalations in rent over the lease term. The lease term commences on the
date when we become legally obligated for the rent payments. We account for rent
escalations in leases on a straight-line basis over the expected lease
term. Any rent holidays after lease commencement are recognized on a
straight-line basis over the expected lease term, which includes the rent
holiday period. Leasehold improvements that have been funded by lessors have
historically been insignificant. Any leasehold improvements we make that are
funded by lessor incentives or allowances under operating leases are recorded as
leasehold improvement assets and amortized over the expected lease term. Such
incentives are also recorded as deferred rent and amortized as reductions to
lease expense over the expected lease term. We record contingent rent expense
based on estimated sales for respective units over the contingency
period.
Fair
Value Measurements.
The carrying amounts of cash and cash equivalents,
investments, accounts receivables, accounts payable and accrued expenses are
deemed to approximate fair value due to the immediate or
short-term maturity of these instruments. The fair value of notes
receivable approximates the carrying value after consideration of recorded
allowances. The fair value of our debt is based on market quotations for the
same or similar debt issues or the estimated borrowing rates available to us.
The difference between the estimated fair value of long-term debt compared
with its historical cost reported in our Consolidated Financial Statements
relates to the market quotations for our 10% Notes. See Note 9.
Derivative
Instruments. We record all derivative instruments as either assets or
liabilities in the balance sheet at fair value. If we elect to apply hedge
accounting, we formally document all hedging relationships, our risk-management
objective and strategy for undertaking the hedge, the hedging instrument, the
hedged item, the nature of the risk being hedged, how the hedging instrument's
effectiveness in offsetting the hedged risk will be assessed prospectively and
retrospectively and a description of the method of measuring ineffectiveness. We
assess, both at the hedge's inception and on an ongoing basis, whether the
derivatives that are used in hedging transactions are highly effective in
offsetting cash flows of hedged items. To the extent the derivative instrument
is effective in offsetting the variability of the hedged cash flows, changes in
the fair value of the derivative instrument are not included in current earnings
but are reported as other comprehensive income (loss). The ineffective portion
of the hedge is recorded as an adjustment to earnings. If hedge accounting is
not elected for a derivative instrument, we carry the derivative at its fair
value on the balance sheet and recognize any subsequent changes in its fair
value in earnings.
During
various periods within 2009, 2008 and 2007, we utilized derivative financial
instruments to manage our exposure to interest rate risk and commodity risk in
relation to natural gas costs. We do not enter into derivative instruments for
trading or speculative purposes. See Note 11.
F-8
Note 2.
Summary of Significant Accounting Policies
(continued)
Contingencies and Litigation. We are
subject to legal proceedings involving ordinary and routine claims incidental to
our business, as well as legal proceedings that are nonroutine and include
compensatory or punitive damage claims. Our ultimate legal and financial
liability with respect to such matters cannot be estimated with certainty and
requires the use of estimates in recording liabilities for potential litigation
settlements. When the reasonable estimate is a range, the recorded loss will be
the best estimate within the range. We record legal settlement costs as
other operating expenses in our Consolidated Statements of Operations as those
costs are incurred.
Comprehensive Income
(Loss). Comprehensive income (loss) includes net income
(loss) and other comprehensive income (loss) items that are excluded from net
income (loss) under U.S. generally accepted accounting principles. Other
comprehensive income (loss) items include additional minimum pension liability
adjustments and the effective unrealized portion of changes in the fair value of
cash flow hedges. See Note 13.
Segment.
Denny’s operates in only one segment. All significant revenues and pre-tax
earnings relate to retail sales of food and beverages to the general public
through either company-owned or franchised restaurants.
Company
Restaurant Sales. Company restaurant sales are recognized when food and
beverage products are sold at company-owned units. We present company restaurant
sales net of sales taxes.
Gift
cards. We sell gift cards which have no stated expiration dates.
Proceeds from the sale of gift cards are deferred and recognized as revenue when
they are redeemed. We recognize breakage on gift cards when, among other things,
sufficient gift card history is available to estimate our potential
breakage. We do not believe gift card breakage will have a material impact on
our future operations.
Franchise and License Fees. We recognize
initial franchise and license fees when all of the material obligations have
been performed and conditions have been satisfied, typically when operations of
a new franchised restaurant have commenced. During 2009, 2008 and 2007, we
recorded initial fees of $4.7 million, $4.6 million and $6.0 million,
respectively, as a component of franchise and license revenue in our
Consolidated Statements of Operations. At December 30, 2009 and December 31,
2008, deferred fees were $1.2 million and $1.3 million, respectively, and are
included in other accrued liabilities in the accompanying Consolidated Balance
Sheets. Continuing fees, such as royalties and rents, are recorded as income on
a monthly basis. For 2009, our ten largest franchisees accounted for
approximately 33% of our franchise revenues.
Advertising Costs. We expense production
costs for radio and television advertising in the year in which the commercials
are initially aired. Advertising expense for 2009, 2008 and 2007 was $20.1
million, $23.2 million and $27.5 million, respectively, net of contributions
from franchisees of $46.6 million, $44.7 million and $39.0 million,
respectively. Advertising costs are recorded as a component of other operating
expenses in our Consolidated Statements of Operations.
Restructuring and exit costs. As a
result of changes in our organizational structure and in our portfolio of
restaurants, we have recorded restructuring and exit costs. These costs consist
primarily of the costs of future obligations related to closed units, severance
and other restructuring charges for terminated employees and are included as a
component of operating gains, losses and other charges, net in our
Consolidated Statements of Operations.
Discounted
liabilities for future lease costs and the fair value of related subleases
of closed units are recorded when the units are closed. All other
costs related to closed units are expensed as incurred. In assessing the
discounted liabilities for future costs of obligations related to closed units,
we make assumptions regarding amounts of future subleases. If these assumptions
or their related estimates change in the future, we may be required to record
additional exit costs or reduce exit costs previously recorded. Exit costs
recorded for each of the periods presented include the effect of such changes in
estimates.
We
evaluate store closures for potential disclosure as discontinued operations
based on an assessment of several quantitative and qualitative factors,
including the nature of the closure, revenue migration to other
company-owned and franchised stores and planned market development in the
vicinity of the disposed store.
Impairment of long-lived assets. We
evaluate our long-lived assets for impairment at the restaurant level on a
quarterly basis, when assets are identified as held for sale or whenever
changes or events indicate that the carrying value may not be recoverable. We
assess impairment of restaurant-level assets based on the operating cash flows
of the restaurant, expected proceeds from the sale of assets and our plans
for restaurant closings. Generally, all units with negative cash flows from
operations for the most recent twelve months at each quarter end are included in
our assessment. In performing our assessment, we make assumptions regarding
estimated future cash flows, including estimated proceeds from similar asset
sales, and other factors to determine both the recoverability and the estimated
fair value of the respective assets. If the long-lived assets of a restaurant
are not recoverable based upon estimated future, undiscounted cash flows, we
write the assets down to their fair value. If these estimates or their related
assumptions change in the future, we may be required to record additional
impairment charges. These charges are included as a component of operating
gains, losses and other charges, net in our Consolidated Statements of
Operations.
Gains on Sales of Restaurants Operations to
Franchisees, Real Estate and Other Assets. Generally, gains on
sales of restaurant operations to franchisees (which may include real
estate), real estate properties and other assets, are recognized when the sales
are consummated and certain other gain recognition criteria are met. Total
gains are included as a component of operating gains, losses and other
charges, net in our Consolidated Statements of Operations.
Share-Based
Compensation. Share-based compensation cost is measured at the
grant date based on the fair value of the award. These costs for 2009, 2008 and
2007 include compensation expense, recognized over the applicable vesting
periods, for new share-based awards and for share-based awards granted prior to,
but not yet vested on, December 29, 2005, the first day of fiscal 2006. We
estimate potential forfeitures of share-based awards and adjust the compensation
cost accordingly. Our estimate of forfeitures is adjusted over the requisite
service period to the extent that actual forfeitures differ, or are expected to
differ, from such estimates. Share-based compensation expense is included as a
component of general and administrative expenses in our Consolidated Statements
of Operations. Any benefit of tax deductions in excess of recognized
compensation cost is reported as a financing cash flow on our Consolidated
Statements of Cash Flows.
F-9
Note 2.
Summary of Significant Accounting Policies (continued)
The fair
value of the stock options granted during 2009, 2008 and 2007 was estimated at
the date of grant using the Black-Scholes option pricing model. We used the
following weighted average assumptions for the grants:
|
Fiscal
Year Ended
|
||||||||||||
|
December
30, 2009
|
December
31, 2008
|
December
26, 2007
|
||||||||||
|
Dividend
yield
|
0.0
|
%
|
0.0
|
%
|
0.0
|
%
|
||||||
|
Expected
volatility
|
57.5
|
%
|
50.1
|
%
|
67.5
|
%
|
||||||
|
Risk-free
interest rate
|
1.8
|
%
|
2.7
|
%
|
4.6
|
%
|
||||||
|
Weighted
average expected term
|
4.6
years
|
4.6
years
|
6.0 years
|
|||||||||
The
dividend yield assumption was based on our dividend payment history and
expectations of future dividend payments. The expected volatility was based on
the historical volatility of our stock for a period approximating the expected
life of the options granted. The risk-free interest rate was based on published
U.S. Treasury spot rates in effect at the time of grant with terms approximating
the expected life of the option. The weighted average expected term of the
options represents the period of time the options are expected to be outstanding
based on historical trends.
Compensation
expense for stock options granted prior to fiscal 2006 is recognized based on
the graded vesting attribution method. Compensation expense for options
granted subsequent to December 28, 2005 is recognized on a straight-line basis
over the requisite service period for the entire award.
Generally,
compensation expense related to restricted stock units, performance shares,
performance units and board deferred stock units is based on the number of
shares and units expected to vest, the period over which they are expected
to vest and the fair market value of the common stock on the date of
grant. For restricted stock units and performance shares that contain a
market condition, compensation expense is based on the Monte Carlo valuation
method, which utilizes multiple input variables to determine the probability of
the Company achieving the market condition and the fair value of the award. The
amount of certain cash-settled awards is determined based on the date of
payment. Therefore, compensation expense related to these cash-settled awards is
adjusted to fair value at each balance sheet date.
Subsequent
to the vesting period, earned stock-settled restricted stock units and
performance shares (both of which are equity classified) are paid to the holder
in shares of common stock, and the cash-settled restricted stock units and
performance units (both of which are liability classified) are paid to the
holder in cash, provided the holder is then still employed with Denny’s or an
affiliate.
Earnings Per
Share. Basic earnings (loss) per share is calculated by dividing
net income (loss) by the weighted-average number of common shares outstanding
during the period. Diluted earnings (loss) per share is calculated by dividing
net income (loss) by the weighted-average number of common shares and potential
common shares outstanding during the period.
Adjustments
to Previously Issued Financial Statements. Certain
previously reported amounts from fiscal years 2006, 2007 and 2008 included in
retained earnings have been reclassified to goodwill to conform to
Accounting Standards Codification 740, "Income Taxes." During fiscal 2009, we
recorded immaterial adjustments to correct errors in income tax accounting
for the deductions of expired income tax credits and the related release of
valuation allowance established in connection with fresh start reporting on
January 7, 1998. The adjustments increased our deficit as of December 27, 2006
by $1.6 million (see the Consolidated Statements of Shareholders' Deficit and
Comprehensive Loss) and had no impact on previously reported cash
flows.
The
following line items on the Consolidated Statements of Operations for the
fiscal year ended December 31, 2008 were impacted by the
adjustments:
|
Fiscal
Year Ended December 31, 2008
|
||||||||||||
|
Unadjusted
|
Adjustment
|
Adjusted
|
||||||||||
|
(In
thousands, except per share data)
|
||||||||||||
|
Provision
for income taxes
|
$
|
1,602
|
$
|
1,920
|
$
|
3,522
|
||||||
|
Net
income
|
14,662
|
(1,920
|
)
|
12,742
|
||||||||
|
Basic
net income per share
|
$
|
0.15
|
$
|
(0.02
|
)
|
$
|
0.13
|
|||||
|
Diluted
net income per share
|
$
|
0.15
|
$
|
(0.02
|
)
|
$
|
0.13
|
|||||
The
following line items on the Consolidated Statements of Operations for the
fiscal year ended December 26, 2007 were impacted by the
adjustments:
|
Fiscal
Year Ended December 26, 2007
|
||||||||||||
|
Unadjusted
|
Adjustment
|
Adjusted
|
||||||||||
|
(In
thousands, except per share data)
|
||||||||||||
|
Provision
for income taxes
|
$
|
4,808
|
$
|
1,867
|
$
|
6,675
|
||||||
|
Net
income
|
31,351
|
(1,867
|
)
|
29,484
|
||||||||
|
Basic
net income per share
|
$
|
0.33
|
$
|
(0.02
|
)
|
$
|
0.31
|
|||||
|
Diluted
net income per share
|
$
|
0.32
|
$
|
(0.02
|
)
|
$
|
0.30
|
|||||
F-10
Note 2.
Summary of Significant Accounting Policies (continued)
The
following line items on the Consolidated Balance Sheet as of December 31, 2008
were impacted by the adjustments:
|
December
31, 2008
|
Adjustment
|
Adjusted
December
31, 2008
|
||||||||||
|
(In
thousands)
|
||||||||||||
|
Goodwill
|
$
|
40,006
|
$
|
(5,397
|
)
|
$
|
34,609
|
|||||
|
Total
assets
|
347,195
|
(5,397
|
)
|
341,798
|
||||||||
|
Deficit
|
(688,984
|
)
|
(5,397
|
)
|
(694,381
|
)
|
||||||
|
Total
shareholders' deficit
|
(174,037
|
)
|
(5,397
|
)
|
(179,434
|
)
|
||||||
|
Total
liabilities and shareholders' deficit
|
347,195
|
(5,397
|
)
|
341,798
|
||||||||
See Note
20 for the adjusted quarterly data for 2008.
New
Accounting Standards.
Accounting Standards
CodificationTM
(the "Codification” or "ASC")
Accounting
Standards Update (“ASU”) No. 2009-01(Prior authoritative literature: Statement
of Financial Accounting Standards (“SFAS”) No. 168, “The FASB Accounting
Standards CodificationTM and the Hierarchy
of Generally Accepted Accounting Principles – a replacement of FASB Statement
162”)
Effective
September 30, 2009, we adopted ASU No. 2009-01, which provides for the
Codification to become the single official source of authoritative,
nongovernmental U.S. generally accepted accounting principles ("U.S. GAAP"). The
Codification does not change U.S. GAAP, but combines all authoritative standards
into a comprehensive, topically organized online database. The adoption impacted
the Company's financial statement disclosures, as all references to
authoritative accounting literature will be in accordance with the
Codification.
Fair
Value
ASU
No. 2010-06, “Fair Value Measurements and Disclosures (Topic 820): Improving
Disclosures about Fair Value Measurements” (Prior authoritative literature :
SFAS No. 157, “Fair Value Measurements”)
In
January 2010, the Financial Accounting Standards Board (“FASB”) issued ASU No.
2010-06, which improves disclosure requirements related to fair value
measurements under the Codification. The new disclosure requirements relate to
transfers in and out of Levels 1 and 2 and separate disclosures about purchases,
sales, issuances and settlements relating to Level 3 measurements. We are
required to adopt ASU No. 2010-06 in the first quarter of 2010 with the
exception of the requirements to provide the Level 3 activity, which will be
effective for the first quarter of 2011. We are currently in the process of
assessing the impact that ASU No. 2010-06 may have on our Consolidated Financial
Statements.
ASU
No. 2009-05,"Fair Value Measurements and Disclosures (Topic 820) - Measuring
Liabilities at Fair Value” (Prior authoritative literature: SFAS No. 157, “Fair
Value Measurements”)
Effective
December 30, 2009, we adopted ASU No. 2009-05 to provide guidance on measuring
the fair value of liabilities under FASB ASC 820. The adoption did not have a
material impact on our Consolidated Financial Statements.
FASB
ASC 820-10-65 (“Prior authoritative literature: FASB Staff Position (“FSP”) FAS
157-4, "Determining Fair Value When the Volume and Level of Activity for the
Asset or Liability Have Significantly Decreased and Identifying Transactions
That Are Not Orderly")
Effective
July 1, 2009, we adopted FASB ASC 820-10-65, which provides additional guidance
for estimating fair value when the volume and level of activity for the asset or
liability have significantly decreased. This Codification section also includes
guidance on identifying circumstances that indicate a transaction is not
orderly. The adoption of FASB ASC 820-10-65 did not have a material impact on
our Consolidated Financial Statements.
FASB
ASC 820-10 (Prior authoritative literature: FSP FAS 157-2, "Effective
Date of FASB Statement 157")
During
2008, we adopted FASB ASC 820-10, which deferred the provisions of previously
issued fair value guidance for nonfinancial assets and liabilities to the
first fiscal period beginning after November 15, 2008. Deferred
nonfinancial assets and liabilities include items such as goodwill and other
nonamortizable intangibles. Effective January 1, 2009, we adopted the fair value
guidance for nonfinancial assets and liabilities. The adoption of FASB ASC
820-10 did not have a material impact on our Consolidated Financial Statements.
See Note 9.
Postretirement Benefit
Plans
FASB
ASC 715-20-65 (Prior authoritative literature: FASB FSP FAS 132(R)-1,
“Employers’ Disclosures about Postretirement Benefit Plan Assets”)
Effective
December 30, 2009, we adopted FASB ASC 715-20-65, which expands the disclosure
requirements about plan assets for defined benefit pension plans and
postretirement plans. The adoption did not impact our Consolidated Financial
Statements. See Note 12.
ASU
No. 2009-12, “Investments in Certain Entities That Calculate Net Asset Value per
Share (or Its Equivalent)"
Effective
December 30, 2009, we adopted ASU No.
2009-12, which
amends the guidance on measuring fair value under FASB ASC 820 to permit, as a
practical expedient, an entity to measure the fair value of an investment within
the scope of ASU
2009-12 on the basis
of the net asset value per share of the investment. For the Company, ASU
No.
2009-12 pertains only to
alternative investments held in the defined benefit pension plan and
postretirement plans as we do not invest in alternative investments outside of
these plans. Furthermore, the disclosure provisions of ASU
No. 2009-12 are not applicable to
employer’s disclosures about pension and postretirement benefit plan assets.
FASB ASC 715 prescribes the disclosure requirements for pension and other
postretirement benefit plan assets.
F-11
Note 2.
Summary of Significant Accounting Policies
(continued)
Subsequent
Events
FASB
ASC 855-10 (Prior authoritative literature: SFAS 165, “Subsequent
Events”)
Effective
July 1, 2009, we adopted FASB ASC 855-10, which establishes general standards of
accounting for and disclosure of events that occur after the balance sheet date,
but before financial statements are issued or are available to be issued. The
adoption did not have a material impact on our Consolidated Financial
Statements. See Note 21.
ASU
No. 2010-09, “Subsequent Events (Topic 855):
Amendments to Certain Recognition and Disclosure
Requirements"
Effective
February 24, 2010, we adopted ASC No. 2010-09, which removes the requirement to
disclose the date through which subsequent events have been evaluated.
The adoption did not have a material impact on our Consolidated Financial
Statements. See Note 21.
Financial
Instruments
FASB
ASC 825-10-65 (Prior authoritative literature: FSP No. FAS 107-1 and Accounting
Principles Board 28-1, "Interim Disclosures about Fair Value of Financial
Instruments")
Effective
July 1, 2009, we adopted FASB ASC 825-10-65, which amends previous guidance to
require disclosures about fair value of financial instruments for interim
reporting periods of publicly traded companies as well as in annual financial
statements. The adoption did not have a material impact on our Consolidated
Financial Statements.
Investments – Debt and
Equity Securities
FASB
ASC 320-10-65 (Prior authoritative literature: FSP FAS 115-2 and FAS 124-2,
"Recognition and Presentation of Other-Than-Temporary Impairments")
Effective
July 1, 2009, we adopted FASB ASC 320-10-65, which amends the
other-than-temporary impairment guidance in U.S. GAAP for debt securities to
make the guidance more operational and to improve the presentation and
disclosure of other-than-temporary impairments on debt and equity securities in
the financial statements. It does not amend existing recognition and measurement
guidance related to other-than-temporary impairments of equity securities. The
adoption did not have a material impact on our Consolidated Financial
Statements.
Variable Interest
Entities
FASB
ASC 810-10 (Prior authoritative literature: SFAS 167, “Amendments to FASB
Interpretation No. 46(R)”)
In June
2009, the FASB issued FASB ASC 810-10, which amends the guidance on the
consolidation of variable interest entities for determining whether an entity is
a variable interest entity and modifies the methods allowed for determining the
primary beneficiary of a variable interest entity. In addition, it requires
ongoing reassessments of whether an enterprise is the primary beneficiary of a
variable interest entity and enhanced disclosures related to an enterprise’s
involvement in a variable interest entity. We are required to adopt FASB ASC
810-10 in the first quarter of 2010 and are currently in the process of
assessing the impact that it may have on our Consolidated Financial
Statements.
Intangible
Assets
FASB
ASC 350-30 and FASB ASC 275-10-50 (Prior authoritative literature: FSP FAS
142-3, “Determination of the Useful Life of Intangible Assets”)
Effective
January 1, 2009, the first day of fiscal 2009, we adopted FASB ASC 350-30 and
FASB ASC 275-10-50, which amend the factors that should be considered in
developing renewal or extension assumptions used to determine the useful life of
a recognized intangible asset. We will apply this literature prospectively to
intangible assets acquired subsequent to the adoption date. The adoption
had no impact on our Consolidated Financial Statements.
Derivative
Instruments
FASB
ASC 815-10-65 (Prior authoritative literature: SFAS 161, “Disclosures about
Derivative Instruments and Hedging Activities”)
Effective
January 1, 2009, we adopted FASB ASC 815-10-65, which amends and expands
previously existing guidance on derivative instruments to require tabular
disclosure of the fair value of derivative instruments and their gains and
losses. It also requires disclosure regarding the credit-risk related
contingent features in derivative agreements, counterparty credit risk, and
strategies and objectives for using derivative instruments. The adoption did not
have a material impact on our Consolidated Financial Statements. See Note
11.
Noncontrolling
Interests
FASB
ASC 810-10-65 (Prior authoritative literature: SFAS 160, "Noncontrolling
Interests in Consolidated Financial Statements — an amendment of ARB No.
51")
Effective
January 1, 2009, we adopted FASB ASC 810-10-65, which amends previously issued
guidance to establish accounting and reporting standards for the noncontrolling
interest in a subsidiary and for the deconsolidation of a subsidiary. It
clarifies that a noncontrolling interest in a subsidiary, which is sometimes
referred to as minority interest, is an ownership interest in the consolidated
entity that should be reported as equity in our Consolidated Financial
Statements. Among other requirements, this literature requires that the
consolidated net income attributable to the parent and the noncontrolling
interest be clearly identified and presented on the face of the consolidated
income statement. The adoption did not have a material impact on our
Consolidated Financial Statements.
F-12
Note 2.
Summary of Significant Accounting Policies (continued)
Business
Combinations
FASB
ASC 805-10, (Prior authoritative literature: SFAS 141R, "Business
Combinations")
Effective
January 1, 2009, we adopted FASB ASC 805-10, which establishes principles and
requirements for how an acquirer recognizes and measures in its financial
statements the identifiable assets acquired, the liabilities assumed, any
noncontrolling interest in an acquiree and the goodwill acquired. We will
apply this literature to any business combinations subsequent to adoption. In
addition, this FASB ASC requires that any additional reversal of deferred tax
asset valuation allowance established in connection with our fresh start
reporting on January 7, 1998 be recorded as a component of income tax
expense rather than as a reduction to the goodwill established in
connection with the fresh start reporting. The
adoption of FASB ASC 805-10 resulted a $2 million reduction to both our deferred
tax asset and valuation allowance, since we reversed only the valuation
allowance related to the deferred tax asset recognized during 2009. In the prior
year, we would have recognized $2 million as income tax expense with a
corresponding reduction to goodwill. See Note
14.
FASB
ASC 805-20 (Prior authoritative literature: FSP FAS 141R-1, "Accounting for
Assets Acquired and Liabilities Assumed in a Business Combination That Arise
from Contingencies")
Effective
January 1, 2009, we adopted FASB ASC 805-20, which amends the literature on
Business Combinations to require that an acquirer recognize at fair value, at
the acquisition date, an asset acquired or a liability assumed in a business
combination that arises from a contingency if the acquisition-date fair value of
that asset or liability can be determined during the measurement period. If the
acquisition-date fair value of such an asset acquired or liability assumed
cannot be determined, the acquirer should apply the provisions of the guidance
on contingencies to determine whether the contingency should be recognized at
the acquisition date or after such date. The adoption did not have a material
impact on our Consolidated Financial Statements.
Other accounting standards that have been issued or proposed by the FASB or other standards-setting bodies that do not require adoption until a future date are not expected to have a material impact on our Consolidated Financial Statements upon adoption.
Note
3. Assets Held for Sale
There
were no assets held for sale as of December 30, 2009. Assets held for sale of
$2.3 million as of December 31, 2008 included restaurants to be sold to
franchisees. Our Credit Facility (defined in Note 10) requires us to make
mandatory prepayments to reduce outstanding indebtedness with the net cash
proceeds from the sale of specified real estate properties restaurant
assets and restaurant operations to franchisees, net of a voluntary $10.0
million annual exclusion related to proceeds from the sale of restaurant
operations to franchisees and a voluntary $10.0 million annual exclusion related
to proceeds from the sale of restaurant assets. As of December 30, 2009 and
December 31, 2008, no reclassification of long-term debt to current liabilities
was required.
As a
result of classifying certain assets as held for sale, we recognized impairment
charges of $0.4 million and $2.4 million for the years ended December 30,
2009 and December 31, 2008, respectively. This expense is included as a
component of operating gains, losses and other charges, net in our Consolidated
Statements of Operations.
Note
4. Property, Net
Property,
net, consisted of the following:
|
December
30, 2009
|
December
31, 2008
|
|||||||
|
(In
thousands)
|
||||||||
|
Land
|
$
|
28,966
|
$
|
33,885
|
||||
|
Buildings
and leasehold improvements
|
243,832
|
276,745
|
||||||
|
Other
property and equipment
|
89,822
|
102,168
|
||||||
|
Total
property owned
|
362,620
|
412,798
|
||||||
|
Less
accumulated depreciation
|
243,387
|
266,462
|
||||||
|
Property
owned, net
|
119,233
|
146,336
|
||||||
|
Buildings,
vehicles, and other equipment held under capital
leases
|
27,559
|
32,113
|
||||||
|
Less
accumulated amortization
|
15,308
|
18,471
|
||||||
|
Property
held under capital leases, net
|
12,251
|
13,642
|
||||||
|
Total
property, net
|
$
|
131,484
|
$
|
159,978
|
||||
The
following table reflects the property assets, included in the table above,
which were leased to franchisees:
|
December
30, 2009
|
December
31, 2008
|
|||||||
|
(In
thousands)
|
||||||||
|
Land
|
$
|
10,973
|
$
|
10,209
|
||||
|
Buildings
and leasehold improvements
|
34,821
|
33,553
|
||||||
|
Total
property owned, leased to franchisees
|
45,794
|
43,762
|
||||||
|
Less
accumulated depreciation
|
30,672
|
29,017
|
||||||
|
Property
owned, leased to franchisees, net
|
15,122
|
14,745
|
||||||
|
Buildings
held under capital leases, leased to franchisees
|
15,227
|
12,779
|
||||||
|
Less
accumulated amortization
|
9,360
|
7,955
|
||||||
|
Property
held under capital leases, leased to franchisees,
net
|
5,867
|
4,824
|
||||||
|
Total
property leased to franchisees, net
|
$
|
20,989
|
$
|
19,569
|
||||
Depreciation
expense, including amortization of property under capital leases, for 2009,
2008 and 2007 was $27.0 million, $34.0 million and $42.7 million, respectively.
Substantially all owned property is pledged as collateral for our Credit
Facility. See Note 10.
F-13
Note 5.
Goodwill and Other Intangible Assets
The
following table reflects the changes in carrying amounts of
goodwill:
|
December
30, 2009
|
December
31, 2008
|
|||||||
|
(In
thousands)
|
||||||||
|
Balance,
beginning of year
|
$
|
34,609
|
$
|
38,961
|
||||
|
Write-offs
associated with sale of restaurants
|
(2,169
|
)
|
(2,360
|
)
|
||||
|
Reversal
of valuation allowance related to deferred tax assets (Notes 2 and
14)
|
—
|
(1,992
|
)
|
|||||
|
Balance,
end of year
|
$
|
32,440
|
$
|
34,609
|
||||
Goodwill
and intangible assets were comprised of the following:
|
December
30, 2009
|
December
31, 2008
|
|||||||||||||||
|
Gross
Carrying Amount
|
Accumulated
Amortization
|
Gross
Carrying Amount
|
Accumulated
Amortization
|
|||||||||||||
|
(In
thousands)
|
||||||||||||||||
|
Goodwill
|
$
|
32,440
|
$
|
—
|
$
|
34,609
|
$
|
—
|
||||||||
|
Intangible
assets with indefinite lives:
|
||||||||||||||||
|
Trade
names
|
$
|
42,454
|
$
|
—
|
$
|
42,438
|
$
|
—
|
||||||||
|
Liquor
licenses
|
176
|
—
|
262
|
—
|
||||||||||||
|
Intangible
assets with definite lives:
|
||||||||||||||||
|
Franchise
and license agreements
|
50,787
|
38,397
|
55,332
|
39,303
|
||||||||||||
|
Foreign
license agreements
|
241
|
151
|
241
|
138
|
||||||||||||
|
Intangible
assets
|
$
|
93,658
|
$
|
38,548
|
$
|
98,273
|
$
|
39,441
|
||||||||
|
Other
assets with definite lives:
|
||||||||||||||||
|
Software
development costs
|
$
|
32,806
|
$
|
28,401
|
$
|
31,979
|
$
|
26,446
|
||||||||
The $4.5 million decrease in franchise agreements
primarily resulted from the removal of fully amortized agreements. The
amortization expense for definite-lived intangibles and other assets for
2009, 2008 and 2007 was $5.4 million, $5.7 million and $6.7 million,
respectively.
Estimated
amortization expense for intangible assets with definite lives in the next five
years is as follows:
|
(In thousands)
|
||||
|
2010
|
$
|
2,894
|
||
|
2011
|
2,668
|
|||
|
2012
|
2,305
|
|||
|
2013
|
1,996
|
|||
|
2014
|
1,441
|
|||
We
performed an annual impairment test as of December 30, 2009 and determined that
none of the recorded goodwill or other intangible assets with indefinite lives
were impaired.
Note
6. Other Current Liabilities
Other
current liabilities consisted of the following:
|
December
30, 2009
|
December
31, 2008
|
|||||||
|
(In
thousands)
|
||||||||
|
Accrued
salaries and vacation
|
$
|
21,453
|
$
|
23,954
|
||||
|
Accrued
insurance, primarily current portion of liability for insurance
claims
|
10,814
|
13,591
|
||||||
|
Accrued
taxes
|
7,953
|
8,846
|
||||||
|
Accrued
interest
|
4,845
|
4,945
|
||||||
|
Restructuring
charges and exit costs
|
2,901
|
3,253
|
||||||
|
Accrued
advertising
|
3,697
|
6,425
|
||||||
|
Other
|
12,978
|
15,910
|
||||||
|
Other
current liabilities
|
$
|
64,641
|
$
|
76,924
|
||||
F-14
Note 7.
Operating Gains, Losses and Other Charges, Net
Operating
gains, losses and other charges, net were comprised of the
following:
|
Fiscal
Year Ended
|
||||||||||||
|
December
30, 2009
|
December
31, 2008
|
December
26, 2007
|
||||||||||
|
(In
thousands)
|
||||||||||||
|
Gains
on sales of assets and other, net
|
$
|
(19,429
|
)
|
$
|
(18,701
|
)
|
$
|
(39,028
|
)
|
|||
|
Restructuring
charges and exit costs
|
3,960
|
9,022
|
6,870
|
|||||||||
|
Impairment
charges
|
986
|
3,295
|
1,076
|
|||||||||
|
Operating
(gains), losses and other charges, net
|
$
|
(14,483
|
)
|
$
|
(6,384
|
)
|
$
|
(31,082
|
)
|
|||
Gains
on Sales of Assets
Proceeds
and gains on sales of assets were comprised of the following:
|
Fiscal
Year Ended
|
||||||||||||||||||||||||
|
December
30, 2009
|
December
31, 2008
|
December
26, 2007
|
||||||||||||||||||||||
|
Net
Proceeds
|
Gains
|
Net
Proceeds
|
Gains
|
Net
Proceeds
|
Gains
|
|||||||||||||||||||
|
(In
thousands)
|
||||||||||||||||||||||||
|
Sales
of restaurant operations and
related
real estate to franchisees
|
$
|
30,309
|
$
|
12,498
|
$
|
35,520
|
$
|
15,224
|
$
|
73,202
|
$
|
32,835
|
||||||||||||
|
Sales
of other real estate assets
|
14,014
|
6,695
|
4,691
|
3,354
|
7,519
|
4,166
|
||||||||||||||||||
|
Recognition
of deferred gains
|
—
|
236
|
—
|
123
|
—
|
2,027
|
||||||||||||||||||
|
Total
|
$
|
44,323
|
$
|
19,429
|
$
|
40,211
|
$
|
18,701
|
$
|
80,721
|
$
|
39,028
|
||||||||||||
During
2009, as part of our Franchise Growth Initiative ("FGI"), we recognized $12.5
million of gains on the sale of 81 restaurant operations to 18 franchisees for
net proceeds of $30.3 million, which included notes receivable of $3.5 million.
During 2008, we recognized $15.2 million of gains on the sale of 79 restaurant
operations to 22 franchisees for net proceeds of $35.5 million, which included
notes receivable of $2.7 million. During 2007, we recognized $32.8 million of
gains on the sale of 130 restaurant operations and certain related real
estate to 30 franchisees for net proceeds of $73.2 million. Gains of $1.9
million were deferred on the 2006 sales of franchisee-operated real estate
properties and were recognized during fiscal 2007. The remaining gains for the
three periods resulted from the recognition of gains on the sale of other real
estate assets, which include sales of certain real estate assets to franchisees,
and deferred gains.
The
balance, net of any allowance for doubtful accounts, and
classification of notes receivable in the Consolidated Balance
Sheets related to the sale of restaurants to franchisees were as
follows:
|
December
30, 2009
|
December
31, 2008
|
|||||||
|
(In
thousands)
|
||||||||
|
Current
assets:
|
||||||||
|
Receivables,
less allowance for doubtful accounts of $0 and $339,
respectively
|
$
|
3,505
|
$
|
1,366
|
||||
|
Noncurrent
assets:
|
||||||||
|
Other
noncurrent assets, less allowance for doubtful accounts of $0 and $0,
respectively
|
1,894
|
2,060
|
||||||
|
Total
receivables related to sale of restaurants to
franchisees
|
5,399
|
3,426
|
||||||
Restructuring
Charges and Exit Costs
Restructuring
charges and exit costs consist primarily of the costs of future obligations
related to closed units and severance and other restructuring charges for
terminated employees and were comprised of the following:
|
Fiscal
Year Ended
|
||||||||||||
|
December
30, 2009
|
December
31, 2008
|
December
26, 2007
|
||||||||||
|
(In
thousands)
|
||||||||||||
|
Exit
costs
|
$
|
698
|
$
|
3,435
|
$
|
1,665
|
||||||
|
Severance
and other restructuring charges
|
3,262
|
5,587
|
5,205
|
|||||||||
|
Total
restructuring charges and exit costs
|
$
|
3,960
|
$
|
9,022
|
$
|
6,870
|
||||||
Severance
and other restructuring charges of $3.3 million for 2009 primarily resulted from
severance costs related to the departure of our
Chief Operating Officer and Chief Marketing Officer during the fourth
quarter. The $5.6 million of severance and other restructuring charges
for 2008 primarily resulted from severance costs of $4.3 million
recognized during the second quarter related to the reorganization to support
our ongoing transition to a franchise-focused business model, which led to the
elimination of approximately 70 positions. The $5.2 million of severance and
other restructuring charges for 2007 resulted primarily from the reorganization
of our field management structure, which led to the elimination of 80 to 90
out-of-restaurant operational positions. Of these eliminations, approximately 30
employees were reassigned to other positions within the Company.
F-15
Note 7.
Operating Gains, Losses and Other Charges, Net (continued)
The
components of the change in accrued exit cost liabilities were as
follows:
|
December
30, 2009
|
December
31, 2008
|
|||||||
|
(In
thousands)
|
||||||||
|
Balance,
beginning of year
|
$
|
9,239
|
$
|
8,339
|
||||
|
Provisions
for units closed during the year (1)
|
683
|
1,021
|
||||||
|
Changes
in estimates of accrued exit costs, net (1)
|
15
|
2,414
|
||||||
|
Payments,
net of sublease receipts
|
(4,098
|
)
|
(3,366
|
)
|
||||
|
Interest
accretion
|
716
|
831
|
||||||
|
Balance,
end of year
|
6,555
|
9,239
|
||||||
|
Less
current portion included in other current
liabilities
|
2,003
|
2,079
|
||||||
|
Long-term
portion included in other noncurrent liabilities
|
$
|
4,552
|
$
|
7,160
|
||||
|
(1)
|
Included
as a component of operating gains, losses and other charges,
net
|
Estimated
cash payments related to exit cost liabilities in the next five years are as
follows:
|
(In thousands)
|
||||
|
2010
|
$
|
2,414
|
||
|
2011
|
1,317
|
|||
|
2012
|
998
|
|||
|
2013
|
761
|
|||
|
2014
|
672
|
|||
|
Thereafter
|
1,410
|
|||
|
Total
|
7,572
|
|||
|
Less
imputed interest
|
1,017
|
|||
|
Present
value of exit cost liabilities
|
$
|
6,555
|
||
The
present value of exit cost liabilities is net of $3.1 million of existing
sublease arrangements and $1.4 million related to properties for which we expect
to enter into sublease agreements in the future. See Note 8 for a schedule
of future minimum lease commitments and amounts to be received as lessor or
sub-lessor for both open and closed units.
As of
December 30, 2009 and December 31, 2008, we had accrued severance and other
restructuring charges of $0.9 million and $1.2 million, respectively. The
balance as of December 30, 2009 is expected to be paid during 2010.
Note
8. Leases and Related Guarantees
Our
operations utilize property, facilities, equipment and vehicles leased from
others. Buildings and facilities are primarily used for restaurants and support
facilities. Many of our restaurants are operated under lease arrangements which
generally provide for a fixed basic rent, and, in some instances, contingent
rent based on a percentage of gross revenues. Initial terms of land and
restaurant building leases generally are not less than 15 years exclusive of
options to renew. Leases of other equipment consist primarily of restaurant
equipment, computer systems and vehicles.
We lease
certain owned and leased property, facilities and equipment to others. Our net
investment in direct financing leases receivable, of which the current portion
is recorded in prepaid and other current assets and the long-term portion is
recorded in other noncurrent assets in our Consolidated Balance Sheets, was as
follows:
|
December
30, 2009
|
December
31, 2008
|
|||||||
|
(In
thousands)
|
||||||||
|
Total
minimum rents receivable
|
$
|
23,981
|
$
|
24,088
|
||||
|
Estimated
residual value of leased property (unguaranteed)
|
2,300
|
2,400
|
||||||
|
26,281
|
26,488
|
|||||||
|
Less
unearned income
|
19,743
|
20,101
|
||||||
|
Net
investment in direct financing leases receivable
|
$
|
6,538
|
$
|
6,387
|
||||
Minimum
future lease commitments and amounts to be received as lessor or sublessor under
non-cancelable leases, including leases for both open and closed units, at
December 30, 2009 are as follows:
|
Commitments
|
Lease
Receipts
|
|||||||||||||||
|
Capital
|
Operating
|
Direct
Financing
|
Operating
|
|||||||||||||
|
(In
thousands)
|
||||||||||||||||
|
2010
|
$
|
7,210
|
$
|
40,629
|
$
|
1,310
|
$
|
35,036
|
||||||||
|
2011
|
6,876
|
37,141
|
1,310
|
32,288
|
||||||||||||
|
2012
|
6,288
|
33,279
|
1,310
|
30,749
|
||||||||||||
|
2013
|
5,056
|
29,088
|
1,310
|
28,646
|
||||||||||||
|
2014
|
3,949
|
26,536
|
1,310
|
26,466
|
||||||||||||
|
Thereafter
|
10,786
|
153,803
|
17,431
|
168,487
|
||||||||||||
|
Total
|
40,165
|
$
|
320,476
|
$
|
23,981
|
$
|
321,672
|
|||||||||
|
Less
imputed interest
|
16,756
|
|||||||||||||||
|
Present
value of capital lease obligations
|
$
|
23,409
|
||||||||||||||
F-16
Note 8.
Leases and Related Guarantees (continued)
Rent expense
and lease and sublease rental income are recorded as components of
occupancy expense and costs of franchise and license revenue in our Consolidated
Statements of Operations and were comprised of the following:
|
Fiscal
Year Ended
|
||||||||||||
|
December
30, 2009
|
December
31, 2008
|
December
26, 2007
|
||||||||||
|
(In
thousands)
|
||||||||||||
|
Rent
expense:
|
||||||||||||
|
Base
rents
|
$
|
44,146
|
$
|
43,903
|
$
|
43,494
|
||||||
|
Contingent
rents
|
4,657
|
5,884
|
6,524
|
|||||||||
|
Total
rental expense
|
$
|
48,803
|
$
|
49,787
|
$
|
50,018
|
||||||
|
Rental
income:
|
||||||||||||
|
Base
rents
|
$
|
34,265
|
$
|
28,705
|
$
|
18,651
|
||||||
|
Contingent
rents
|
3,299
|
3,660
|
3,565
|
|||||||||
|
Total
rental income
|
$
|
37,564
|
$
|
32,365
|
$
|
22,216
|
||||||
|
Net
rent expense:
|
||||||||||||
|
Base
rents
|
$
|
9,881
|
$
|
15,198
|
$
|
24,843
|
||||||
|
Contingent
rents
|
1,358
|
2,224
|
2,959
|
|||||||||
|
Net
rental expense
|
$
|
11,239
|
$
|
17,422
|
$
|
27,802
|
||||||
Note
9. Fair Value of Financial Instruments
Effective
December 27, 2007, the first day of fiscal 2008, we adopted the Codification's
guidance on fair value measurements for financial assets and liabilities, as
well as any other assets and liabilities that are carried at fair value on a
recurring basis in financial statements. Effective January 1, 2009, the first
day of fiscal 2009, we applied the Codification's guidance on fair value
measurements to nonfinancial assets and liabilities.
Fair
Value of Assets and Liabilities Measured on a Recurring Basis
Financial
assets and liabilities measured at fair value on a recurring basis are
summarized below:
|
Fair
Value Measurements as of December 30, 2009
|
|||||||||||||||||
|
Total
|
Quoted
Prices in Active Markets for Identical Assets/Liabilities
(Level
1)
|
Significant
Other Observable Inputs
(Level
2)
|
Significant
Unobservable Inputs
(Level
3)
|
Valuation
Technique
|
|||||||||||||
|
(In
thousands)
|
|||||||||||||||||
|
Deferred
compensation plan investments
|
$
|
5,721
|
$
|
5,721
|
$
|
—
|
$
|
—
|
market
approach
|
||||||||
|
Total
|
$
|
5,721
|
|
$
|
5,721
|
$
|
—
|
$
|
—
|
||||||||
In
addition to the financial assets and liabilities that are measured at fair value
on a recurring basis, we measure certain assets and liabilities at fair value on
a nonrecurring basis. As of December 30, 2009, impaired assets related to an
underperforming unit were written down to a fair value of $0 based on the income
approach.
Fair
Value of Long-Term Debt
The book
value and estimated fair value of our long-term debt, excluding capital
lease obligations, was as follows:
|
December
30, 2009
|
December
31, 2008
|
|||||||
|
(In
thousands)
|
||||||||
|
Book
value:
|
||||||||
|
Fixed
rate long-term debt
|
$
|
175,257
|
$
|
175,368
|
||||
|
Variable
rate long-term debt
|
80,000
|
126,652
|
||||||
|
Long
term debt excluding capital lease obligations
|
$
|
255,257
|
$
|
302,020
|
||||
|
Estimate
fair value:
|
||||||||
|
Fixed
rate long-term debt
|
$
|
179,194
|
$
|
122,868
|
||||
|
Variable
rate long-term debt
|
80,000
|
126,652
|
||||||
|
Long
term debt excluding capital lease obligations
|
$
|
259,194
|
$
|
249,520
|
||||
The
difference between the estimated fair value of long-term debt compared with its
historical cost reported in our Consolidated Balance Sheets at December 30, 2009
and December 31, 2008 relates primarily to market quotations for our 10%
Notes.
F-17
Note
10. Long-Term Debt
Long-term
debt consisted of the following:
|
December
30, 2009
|
December
31, 2008
|
|||||||
|
(In
thousands)
|
||||||||
|
Notes
and Debentures:
|
||||||||
|
10%
Senior Notes due October 1, 2012, interest payable
semi-annually
|
$
|
175,000
|
$
|
175,000
|
||||
|
Credit
Facility:
|
||||||||
|
Revolver
Loans outstanding due December 15, 2011
|
—
|
—
|
||||||
|
Term
Loans due March 31, 2012
|
80,000
|
126,652
|
||||||
|
Other
notes payable, maturing over various terms up to 4 years, payable in
monthly installments
with interest
rates ranging from 9.0% to 9.17%
|
257
|
368
|
||||||
|
Capital
lease obligations
|
23,409
|
25,619
|
||||||
|
278,666
|
327,639
|
|||||||
|
Less
current maturities and mandatory prepayments
|
4,625
|
4,938
|
||||||
|
Total
long-term debt
|
$
|
274,041
|
$
|
322,701
|
||||
Aggregate
annual maturities of long-term debt, excluding capital lease obligations (see
Note 8), at December 30, 2009 are as follows:
|
Year:
|
(In
thousands)
|
|||
|
2010
|
$
|
900
|
||
|
2011
|
908
|
|||
|
2012
|
253,441
|
|||
|
2013
|
8
|
|||
|
2014
and thereafter
|
—
|
|||
|
Total
long-term debt, excluding capital lease obligations
|
$
|
255,257
|
||
Credit
Facility
Our
subsidiaries, Denny's, Inc. and Denny's Realty, LLC (the "Borrowers"), have a
senior secured credit agreement consisting of a $50 million revolving credit
facility (including up to $10 million for a revolving letter of credit
facility), a $80.0 million term loan and an additional $30 million letter of
credit facility (reduced from $37 million during the fourth quarter of 2009)
(together, the "Credit Facility"). At December 30, 2009, we had outstanding
letters of credit of $28.2 million under our letter of credit facility. There
were no outstanding letters of credit under our revolving facility and no
revolving loans outstanding at December 30, 2009. These balances result in
availability of $1.8 million under our letter of credit facility and $50.0
million under the revolving facility.
The
revolving facility matures on December 15, 2011. The term loan and the $30
million letter of credit facility mature on March 31, 2012. The term loan
amortizes in equal quarterly installments at a rate equal to approximately 1%
per annum with all remaining amounts due on the maturity date. The Credit
Facility is available for working capital, capital expenditures and other
general corporate purposes. We will be required to make mandatory prepayments
under certain circumstances (such as required payments related to asset sales)
typical for this type of credit facility and may make certain optional
prepayments under the Credit Facility. We believe that our estimated cash flows
from operations for 2010, combined with our capacity for additional borrowings
under our Credit Facility, will enable us to meet our anticipated cash
requirements and fund capital expenditures over the next twelve
months.
The
Credit Facility is guaranteed by Denny's and its subsidiaries and is secured by
substantially all of the assets of Denny's and its subsidiaries. In addition,
the Credit Facility is secured by first-priority mortgages on 99
company-owned real estate assets. The Credit Facility contains certain financial
covenants (i.e., maximum total debt to EBITDA (as defined under the Credit
Facility) ratio requirements, maximum senior secured debt to EBITDA ratio
requirements, minimum fixed charge coverage ratio requirements and limitations
on capital expenditures), negative covenants, conditions precedent, material
adverse change provisions, events of default and other terms, conditions and
provisions customarily found in credit agreements for facilities and
transactions of this type.
A
commitment fee of 0.5% is paid on the unused portion of the revolving credit
facility. Interest on loans under the revolving facility is payable at per annum
rates equal to LIBOR plus 250 basis points and will adjust over time based on
our leverage ratio. Interest on the term loan and letter of credit facility
is payable at per annum rates equal to LIBOR plus 200 basis points. The
weighted-average interest rate under the term loan was 2.55% and 4.35% as of
December 30, 2009 and December 31, 2008, respectively, prior to considering the
impact of our interest rate swap as of December 31, 2008, as described in Note
11. Taking into consideration our interest rate
swap, the weighted-average interest rate under the term loan was 6.36% as of
December 31, 2008. The interest rate swap was terminated during the
fourth quarter of 2009. See Note 11.
During
2009, we paid $46.7 million (which included $45.5 million of prepayments and
$1.2 million of scheduled payments) on the term loan through a combination
of proceeds on sales of restaurant operations to franchisees, real estate and
other assets, as well as cash generated from operations. As a result of these
prepayments, we recorded $0.1 million of losses on early extinguishment of debt
resulting from the write-off of deferred financing costs. These losses are
included as a component of other nonoperating expense in our Consolidated
Statements of Operations.
F-18
Note
10. Long-Term Debt (continued)
10%
Senior Notes Due 2012
On
October 5, 2004, Denny’s Holdings issued $175 million aggregate principal
amount of its 10% Senior Notes due 2012 (the “10% Notes”). The 10% Notes are
irrevocably, fully and unconditionally guaranteed on a senior basis by Denny’s
Corporation. The 10% Notes are general, unsecured senior obligations of Denny’s
Holdings, and rank equal in right of payment to all existing and future
indebtedness and other obligations that are not, by their terms, expressly
subordinated in right of payment to the 10% Notes; rank senior in right of
payment to all existing and future subordinated indebtedness; and are
effectively subordinated to all existing and future secured debt to the extent
of the value of the assets securing such debt and structurally subordinated to
all indebtedness and other liabilities of the subsidiaries of Denny’s Holdings,
including the Credit Facility. The 10% Notes bear interest at the rate of
10% per year, payable semi-annually in arrears on April 1 and
October 1 of each year. The 10% Notes mature on October 1,
2012.
Denny’s
Holdings may redeem all or a portion of the 10% Notes for cash at its option,
upon not less than 30 days nor more than 60 days notice to each holder of 10%
Notes, at the following redemption prices (expressed as percentages of the
principal amount) with accrued and unpaid interest and liquidated damages, if
any, thereon to the date of redemption of the 10% Notes (the “Redemption
Date”):
|
Year:
|
Percentage
|
|||
|
January
1, 2010 through September 30, 2010
|
102.5
|
%
|
||
|
October
1, 2010 and thereafter
|
100.0
|
%
|
||
The
indenture governing the 10% Notes (the "Indenture") contains certain
covenants limiting the ability of Denny’s Holdings and its subsidiaries (but not
its parent, Denny’s Corporation) to, among other things, incur additional
indebtedness (including disqualified capital stock); pay dividends or make
distributions or certain other restricted payments; make certain investments;
create liens on our assets to secure debt; enter into sale and leaseback
transactions; enter into transactions with affiliates; merge or consolidate with
another company; sell, lease or otherwise dispose of all or substantially all of
its assets; enter into new lines of business; and guarantee indebtedness. These
covenants are subject to a number of limitations and exceptions.
The
Indenture is fully and unconditionally guaranteed by Denny’s Corporation.
Denny’s Corporation is a holding company with no independent assets or
operations, other than as related to the ownership of the common stock of
Denny’s Holdings and its status as a holding company. Denny’s Corporation is not
subject to the restrictive covenants in the Indenture. Denny’s Holdings is
restricted from paying dividends and making distributions to Denny’s Corporation
under the terms of the Indenture.
Note 11.
Derivative Financial Instruments
We
utilize derivative financial instruments to manage our exposure to interest rate
risk and commodity risk in relation to natural gas costs.
Interest
Rate Swaps
We manage
our exposure to fluctuations in interest rates on our variable rate debt by
entering into interest rate swaps. The fair value of swaps is estimated based on
quoted market prices and is subject to market risk as the instruments may become
less valuable in case of changes in market conditions or interest
rates. We manage our exposure to counterparty credit risk by entering
into derivative financial instruments with high-quality financial institutions
that can be expected to fully perform under the terms of such
agreements. We monitor the credit rating of these institutions on a
quarterly basis. We do not require collateral or other security to support
derivative financial instruments, if any, with credit risk. The
interest rate swap described below was considered an obligation under the Credit
Facility as it was entered into with counterparties that are also lenders under
the Credit Facility. The security interest and collateral provided by the Credit
Facility is also available to the swap counterparties. Our counterparty
credit exposure is limited to the positive fair value of contracts at the
reporting date. Notional amounts of derivative financial instruments do not
represent exposure to credit loss.
In 2007,
we entered into an interest rate swap with a notional amount of $150 million and
designated it as a cash flow hedge of our interest rate exposure on the first
$150 million of floating rate debt. Under the terms of the swap, we paid a
fixed rate of 4.8925% on the $150 million notional amount and received payments
from the counterparties based on the 3-month LIBOR rate for a term ending
on March 30, 2010, effectively resulting in a fixed rate of 6.8925% on the $150
million notional amount at the inception of the swap. Interest rate
differentials paid or received under the swap agreement were recognized as
adjustments to interest expense.
In
accordance with hedge accounting, to the extent the swap was effective in
offsetting the variability of the hedged cash flows, changes in the fair value
of the swap were reported as adjustments to other comprehensive income. At
December 26, 2007, we determined that a portion of the underlying cash flows
related to the swap (i.e., interest payments on $150 million of floating rate
debt) was no longer probable of occurring over the term of the swap as a result
of the probability of paying the debt down below $150 million. As a result, we
discontinued hedge accounting treatment. The losses included in accumulated
other comprehensive income as of December 26, 2007 were and continue to be
amortized to other nonoperating expense over the remaining original
term of the interest rate swap. See Note 13. Additionally, changes in the
fair value of the swap were recorded in other nonoperating expense.
In 2008,
we terminated $50 million notional amount of the interest rate swap. The
termination resulted in a $2.4 million cash payment, which was made during
2008. In the fourth quarter of 2009, we terminated the
remaining $100 million of the notional amount of the interest rate swap. The
termination resulted in a $1.3 million cash payment, which was made in the
fourth quarter of 2009. There were no interest rate swaps outstanding as of
December 30, 2009.
Natural
Gas Hedge Contracts
We enter
into natural gas hedge contracts in order to limit our exposure to price
increases for natural gas. These pay fixed/receive floating agreements are based
on NYMEX prices. As of December 30, 2009, there were no outstanding contracts
related to our natural gas purchases. Realized gains (losses) on the contracts
are recorded as utility cost which is a component of other operating
expenses. The contracts are not accounted for under hedge accounting, and
therefore, changes in the contracts' fair value are recorded in other
nonoperating expense. Under the terms of the natural gas hedge contracts, both
parties may be required to provide collateral related to any liability positions
held. As of December 30, 2009, no collateral was held by the
counterparty.
F-19
Note 11.
Derivative Financial Instruments (continued)
As of
December 30, 2009,
there were no derivative instruments included in the Consolidated Balance Sheet.
The fair values of derivative instruments not designated as hedging instruments
included in the Consolidated Balance Sheet as of December 31, 2008 were as
follows:
|
Interest
Rate
Swap
|
Natural
Gas Contracts
|
|||||||
|
(In
thousands)
|
||||||||
|
December
31, 2008:
|
||||||||
|
Other
current liabilities
|
$
|
—
|
$
|
(933
|
)
|
|||
|
Other
noncurrent liabilities and deferred credits
|
(4,545
|
)
|
—
|
|||||
|
Fair
value of derivative instrument
|
$
|
(4,545
|
)
|
$
|
(933
|
)
|
||
The
changes in fair value of the interest rate swap were as follows:
|
Fiscal
Year Ended
|
||||||||
|
December
30, 2009
|
December
31, 2008
|
|||||||
|
(In
thousands)
|
||||||||
|
Fair
value of the interest rate swap, beginning of period
|
$
|
(4,545
|
)
|
$
|
(2,753
|
)
|
||
|
Change
in the fair value of the interest rate swap (recorded in other
nonoperating expense)
|
3,261
|
|
(4,184
|
)
|
||||
|
Termination
of a portion of the swap
|
1,284
|
2,392
|
||||||
|
Fair
value of the interest rate swap, end of period
|
$
|
—
|
|
$
|
(4,545
|
)
|
||
The gains
(losses) recognized in our Consolidated Statements of Operations as a
result of the interest rate swap and natural gas hedge contracts were as
follows:
|
December
30, 2009
|
December
31, 2008
|
December
26, 2007
|
||||||||||
|
(In
thousands)
|
||||||||||||
|
Realized
gains (losses):
|
||||||||||||
|
Interest
rate swap - included as a component of interest
expense
|
$ | (3,930 | ) | $ | (1,402 | ) | $ | 464 | ||||
|
Natural
gas contracts - included as a component of utility expense,
which
is
included in other operating expenses
|
$ | (1,484 | ) | $ | (556 | ) | $ | (263 | ) | |||
|
Unrealized
gains (losses) included as a component of nonoperating
expense:
|
||||||||||||
|
Interest
rate swap
|
$ | 2,241 | $ | (5,351 | ) | $ | (400 | ) | ||||
|
Natural
gas contracts
|
$ | 811 | $ | (811 | ) | $ | 143 | |||||
The
unrealized gains (losses) related to the interest rate swap include
both the changes in the fair value of the swap and the amortization of
losses previously recorded in accumulated other comprehensive
income.
F-20
Note 12.
Employee Benefit Plans
We
maintain several defined benefit plans which cover a substantial number of
employees. Benefits are based upon each employee’s years of service and average
salary. Our funding policy is based on the minimum amount required under the
Employee Retirement Income Security Act of 1974. Our pension plan was closed to
new participants as of December 31, 1999. Benefits ceased to accrue for
pension plan participants as of December 31, 2004. We also maintain defined
contribution plans.
Defined
Benefit Plans
The
obligations and funded status for our pension plan and other defined benefit
plans were as follows:
|
Pension
Plan
|
Other
Defined Benefit Plans
|
|||||||||||||||
|
December
30, 2009
|
December
31, 2008
|
December
30, 2009
|
December
31, 2008
|
|||||||||||||
|
(In
thousands)
|
||||||||||||||||
|
Change
in Benefit Obligation:
|
||||||||||||||||
|
Benefit
obligation at beginning of year
|
$
|
57,298
|
$
|
50,209
|
$
|
2,553
|
$
|
3,096
|
||||||||
|
Service
cost
|
390
|
350
|
—
|
—
|
||||||||||||
|
Interest
cost
|
3,452
|
3,388
|
151
|
194
|
||||||||||||
|
Actuarial
losses (gains)
|
1,018
|
6,389
|
98
|
|
(38
|
)
|
||||||||||
|
Settlement
loss
|
—
|
—
|
16
|
75
|
||||||||||||
|
Benefits
paid
|
(3,328
|
)
|
(3,038
|
)
|
(394
|
)
|
(774
|
)
|
||||||||
|
Benefit
obligation at end of year
|
$
|
58,830
|
$
|
57,298
|
$
|
2,424
|
$
|
2,553
|
||||||||
|
Accumulated
benefit obligation
|
$ | 58,830 | $ | 57,298 | $ | 2,424 | $ | 2,553 | ||||||||
|
Change
in Plan Assets:
|
||||||||||||||||
|
Fair
value of plan assets at beginning of year
|
$
|
44,451
|
$
|
49,410
|
$
|
—
|
$
|
—
|
||||||||
|
Actual
return on plan assets
|
8,933
|
|
(3,317
|
)
|
—
|
—
|
||||||||||
|
Employer
contributions
|
1,072
|
1,396
|
394
|
774
|
||||||||||||
|
Benefits
paid
|
(3,328
|
)
|
(3,038
|
)
|
(394
|
)
|
(774
|
)
|
||||||||
|
Fair
value of plan assets at end of year
|
$
|
51,128
|
$
|
44,451
|
$
|
—
|
$
|
—
|
||||||||
|
Reconciliation of Funded
Status:
|
||||||||||||||||
|
Funded
status
|
$
|
(7,702
|
)
|
$
|
(12,847
|
)
|
$
|
(2,424
|
)
|
$
|
(2,553
|
)
|
||||
The
amounts recognized in the Consolidated Balance Sheets were as
follows:
|
Pension
Plan
|
Other
Defined Benefit Plans
|
|||||||||||||||
|
December
30, 2009
|
December
31, 2008
|
December
30, 2009
|
December
31, 2008
|
|||||||||||||
|
(In
thousands)
|
||||||||||||||||
|
Other
current liabilities
|
$ | — | $ | — | $ | (221 | ) | $ | (215 | ) | ||||||
|
Other
noncurrent liabilities and deferred credits
|
(7,702 | ) | (12,847 | ) | (2,203 | ) | (2,338 | ) | ||||||||
|
Net
amount recognized
|
$ | (7,702 | ) | $ | (12,847 | ) | $ | (2,424 | ) | $ | (2,553 | ) | ||||
The
amounts recognized in accumulated other comprehensive income that have not yet
been recognized as a component of net periodic benefit cost were as
follows:
|
Pension
Plan
|
Other
Defined Benefit Plans
|
|||||||||||||||
|
December
30, 2009
|
December
31, 2008
|
December
30, 2009
|
December
31, 2008
|
|||||||||||||
|
(In
thousands)
|
||||||||||||||||
|
Net
loss
|
$ | (17,549 | ) | (23,307 | ) | (496 | ) | (426 | ) | |||||||
|
Accumulated
other comprehensive loss
|
$ | (17,549 | ) | (23,307 | ) | (496 | ) | (426 | ) | |||||||
|
Cumulative
employer contributions in excess of cost
|
9,847 | 10,460 | (1,928 | ) | (2,127 | ) | ||||||||||
|
Net
amount recognized
|
$ | (7,702 | ) | (12,847 | ) | (2,424 | ) | (2,553 | ) | |||||||
During
fiscal 2010, $0.9 million and less than $0.1 million of accumulated other
comprehensive income will be recognized related to the pension plan and other
defined benefit plans, respectively.
F-21
Note 12.
Employee Benefit Plans (continued)
The
components of the change in accumulated other comprehensive loss were as
follows:
|
Fiscal
Year Ended
|
||||||||
|
December
30, 2009
|
December
31, 2008
|
|||||||
|
(In
thousands)
|
||||||||
|
Pension
Plan:
|
||||||||
|
Balance,
beginning of year
|
$
|
(23,307
|
)
|
$
|
(10,325
|
)
|
||
|
Benefit
obligation actuarial gain (loss)
|
(1,018
|
)
|
(6,389
|
) | ||||
|
Net
gain (loss)
|
5,469
|
|
(7,194
|
) | ||||
|
Amortization
of net loss
|
1,307
|
601
|
||||||
|
Balance,
end of year
|
$
|
(17,549
|
)
|
$
|
(23,307
|
)
|
||
|
Other
Defined Benefit Plans:
|
||||||||
|
Balance,
beginning of year
|
$
|
(427
|
)
|
$
|
(466
|
)
|
||
|
Benefit
obligation actuarial gain
|
(98
|
) |
38
|
|||||
|
Net
gain (loss)
|
13
|
|
(18
|
)
|
||||
|
Amortization
of net loss
|
15
|
19
|
||||||
|
Balance,
end of year
|
$
|
(497
|
)
|
$
|
(427
|
)
|
||
Minimum
pension liability adjustments for 2009, 2008 and 2007 were a reduction
of $5.7 million, an addition of $12.9 million and a reduction of $6.6 million,
respectively. Accumulated other comprehensive losses of $18.0 million and $23.7
million related to minimum pension liability adjustments are included as a
component of accumulated other comprehensive income (loss) in our Consolidated
Statement of Shareholders' Deficit and Comprehensive Income (Loss) for the years
ended December 30, 2009 and December 31, 2008, respectively.
The
components of net periodic benefit cost were as follows:
|
Fiscal
Year Ended
|
||||||||||||
|
December
30, 2009
|
December
31, 2008
|
December
26, 2007
|
||||||||||
|
(In
thousands)
|
||||||||||||
|
Pension
Plan:
|
||||||||||||
|
Service
cost
|
$
|
390
|
$
|
350
|
$
|
350
|
||||||
|
Interest
cost
|
3,452
|
3,388
|
3,145
|
|||||||||
|
Expected
return on plan assets
|
(3,464
|
)
|
(3,877
|
)
|
(3,529
|
)
|
||||||
|
Amortization
of net loss
|
1,307
|
601
|
882
|
|||||||||
|
Net
periodic benefit cost
|
$
|
1,685
|
$
|
462
|
$
|
848
|
||||||
|
Other
comprehensive (income) loss
|
$
|
(5,758
|
) |
$
|
12,982
|
$
|
(6,478
|
)
|
||||
|
Other
Defined Benefit Plans:
|
||||||||||||
|
Service
cost
|
$
|
—
|
$
|
—
|
$
|
—
|
||||||
|
Interest
cost
|
151
|
194
|
190
|
|||||||||
|
Amortization
of net loss
|
15
|
19
|
23
|
|||||||||
|
Settlement
loss recognized
|
29
|
58
|
—
|
|||||||||
|
Net
periodic benefit cost
|
$
|
195
|
$
|
271
|
$
|
213
|
||||||
|
Other
comprehensive (income) loss
|
$
|
70
|
|
$
|
(39
|
)
|
$
|
(154
|
)
|
|||
Net
pension and other defined benefit plan costs (including premiums paid to the
Pension Benefit Guaranty Corporation) for 2009, 2008 and 2007 were $1.9 million,
$0.7 million and $1.1 million, respectively.
Assumptions
Because
our pension plan was closed to new participants as of December 31, 1999,
and benefits ceased to accrue for Pension Plan participants as of
December 31, 2004, an assumed rate of increase in compensation levels was
not applicable for 2009, 2008 or 2007. Weighted-average assumptions used to
determine benefit obligations were as follows:
|
December
30, 2009
|
December
31, 2008
|
|||||||
|
Discount
rate
|
5.99
|
%
|
6.19
|
%
|
||||
|
Measurement
date
|
12/30/09
|
12/31/08
|
||||||
Weighted-average
assumptions used to determine net periodic pension cost were as
follows:
|
December
30, 2009
|
December
31, 2008
|
December
26, 2007
|
||||||||||
|
Discount
rate
|
6.19
|
%
|
6.57
|
%
|
5.94
|
%
|
||||||
|
Rate
of increase in compensation levels
|
N/A
|
N/A
|
N/A
|
|||||||||
|
Expected
long-term rate of return on assets
|
8.00
|
%
|
8.00
|
%
|
8.00
|
%
|
||||||
|
Measurement
date
|
12/30/09
|
12/31/08
|
12/26/07
|
|||||||||
F-22
Note 12.
Employee Benefit Plans (continued)
In
determining the expected long-term rate of return on assets, we evaluated our
asset class return expectations, as well as long-term historical asset class
returns. Projected returns are based on broad equity and bond indices.
Additionally, we considered our historical 10-year and 15-year compounded
returns, which have been in excess of our forward-looking return expectations.
In determining the discount rate, we have considered long-term bond indices of
bonds having similar timing and amounts of cash flows as our estimated defined
benefit payments. We use a yield curve based on high quality, long-term
corporate bonds to calculate the single equivalent discount rate that results in
the same present value as the sum of each of the plan's estimated benefit
payments discounted at their respective spot rates.
Plan
Assets
The
investment policy of our pension plan is based on an evaluation of our ability
and willingness to assume investment risk in light of the financial and
benefit-related goals objectives deemed to be prudent by the fiduciaries of our
pension plan assets. These objectives include, but are not limited to, earning a
rate of return over time to satisfy the benefit obligation,
managing funded
status volatility, and maintaining sufficient liquidity. As of December 30,
2009, the strategic target asset allocation is 56% equity securities
(diversified between domestic and international holdings) and 44% fixed income
securities (diversified between corporate and government holdings and generally
long duration).
We review
the strategic asset allocation periodically to determine the appropriate balance
between cost and risk, taking into account the regulatory funding requirements
and the nature of our pension plan's liabilities. We monitor the competitive
performance versus market benchmarks and rebalance to target allocations if
necessary on a quarterly basis.
The fair
values of our pension plan assets were as follows:
|
Asset
Category
|
Total
|
Quoted
Prices in Active Markets for Identical Assets/Liabilities
(Level
1)
|
Significant
Other Observable Inputs
(Level
2)
|
Significant
Unobservable Inputs
(Level
3)
|
||||||||||||
|
(In
thousands)
|
||||||||||||||||
|
Cash
equivalents
|
$
|
1,033
|
$
|
—
|
$
|
1,033
|
$
|
—
|
||||||||
|
Equity
securities:
|
||||||||||||||||
|
U.S.
large-cap (a)
|
13,600
|
13,600
|
—
|
—
|
||||||||||||
|
U.S.
mid-cap (b)
|
4,004
|
4,004
|
—
|
—
|
||||||||||||
|
U.S.
small-cap (c)
|
1,005
|
1,005
|
—
|
—
|
||||||||||||
|
International
large-cap
|
8,161
|
8,161
|
—
|
—
|
||||||||||||
|
Fixed
income securities:
|
||||||||||||||||
|
U.S.
Treasuries
|
4,579 | 4,579 |
—
|
—
|
||||||||||||
|
Corporate
bonds (d)
|
15,657 | 15,657 |
—
|
—
|
||||||||||||
|
Other
types of investments:
|
||||||||||||||||
|
Commingled
funds (e)
|
3,089
|
—
|
3,089
|
—
|
||||||||||||
|
Total
|
$
|
51,128
|
|
$
|
47,006
|
$
|
4,122
|
$
|
—
|
|||||||
| (a) | The majority of this category represents a fund with the objective of approximating the return of the S&P 500 Index. The remaining securities include both a large-value fund and a large-growth fund investing in diverse industries. |
| (b) | This category includes both a mid-growth fund with the objective of outperforming the Russell Mid Cap Growth Index and a mid-value fund investing in diverse industries. |
| (c) | This category includes both a small-value fund and a small-growth fund investing in diverse industries. |
| (d) | This category includes intermediate and long-term investment grade bonds from diverse industries. |
| (e) | This category represents a fund of well diversified hedged mutual funds with the objective of providing a low-volatility means to access equity-like returns. |
Following is a description of the
valuation methodologies used for assets measured at fair
value.
· Equity Securities and Fixed Income
Securities: Valued at the net asset value (“NAV”) of shares held by
the pension plan at year-end. The NAV is a quoted price in an active
market.
· Cash Equivalents and Commingled
Funds: Valuation determined by the trustee of the money market funds
and commingled funds based on the fair value of the underlying securities within
the fund, which represent the NAV, a practical expedient to fair value, of the
units held by the pension plan at year-end.
Contributions
and Expected Future Benefit Payments
We made
contributions of $1.1 million and $1.4 million to our qualified pension plan
during the years ended December 30, 2009 and December 31, 2008, respectively. We
made contributions of $0.4 million and $0.8 million to our other defined benefit
plans during the years ended December 30, 2009 and December 31, 2008. We expect to
contribute $0.2 million to our other defined benefit plans
during 2010. We do not expect to contribute to our qualified pension plan during
2010. Benefits expected to be paid for each of the next five years and in
the aggregate for the five fiscal years from 2015 through 2019 are as
follows:
|
Pension
Plan
|
Other
Defined Benefit Plans
|
|||||||
|
(In
thousands)
|
||||||||
|
2010
|
$
|
3,057
|
$
|
221
|
||||
|
2011
|
3,052
|
284
|
||||||
|
2012
|
3,107
|
198
|
||||||
|
2013
|
3,188
|
245
|
||||||
|
2014
|
3,244
|
203
|
||||||
|
2015
through 2019
|
18,914
|
1,055
|
||||||
F-23
Note 12.
Employee Benefit Plans (continued)
Defined
Contribution Plans
Eligible
employees can elect to contribute 1% to 15% of their compensation to our 401(k)
plan. As a result of certain IRS limitations, participation in a
non-qualified deferred compensation plan is offered to certain
employees. Under this deferred compensation plan, participants are
allowed to defer 1% to 50% of their annual salary and 1% to 100% of their
incentive compensation. Under both plans, we make matching
contributions of up to 3% of compensation. Participants in the
deferred compensation plan are eligible to participate in the 401(k) plan;
however, due to the above referenced IRS limitations, they are not eligible to
receive the matching contributions under the 401(k) plan. Under these
plans, we made contributions of $1.6 million, $1.9 million and $2.2 million for
2009, 2008 and 2007, respectively.
Note
13. Accumulated Other Comprehensive Loss
The
components of Accumulated Other Comprehensive Loss in our Consolidated
Statements of Shareholders' Deficit and Comprehensive Loss were as
follows:
|
December
30, 2009
|
December
31, 2008
|
|||||||
|
(In
thousands)
|
||||||||
|
Additional
minimum pension liability (Note 12)
|
$
|
(18,046
|
)
|
$
|
(23,734
|
)
|
||
|
Unrealized
loss on interest rate swap (Note 11)
|
(167
|
)
|
(1,187
|
)
|
||||
|
Accumulated
other comprehensive loss
|
$
|
(18,213
|
)
|
$
|
(24,921
|
)
|
||
Note
14. Income Taxes
The
following is a summary of the provision for income taxes:
|
Fiscal
Year Ended
|
||||||||||||
|
December
30, 2009
|
December
31, 2008
|
December
26, 2007
|
||||||||||
|
(In
thousands)
|
||||||||||||
|
Current:
|
||||||||||||
|
Federal
|
$
|
(897
|
)
|
$
|
(542
|
)
|
$
|
(301
|
)
|
|||
|
State,
foreign and other
|
1,626
|
1,307
|
1,188
|
|||||||||
|
729
|
765
|
887
|
||||||||||
|
Deferred:
|
||||||||||||
|
Federal
|
525
|
2,408
|
5,996
|
|||||||||
|
State,
foreign and other
|
146
|
349
|
(208
|
)
|
||||||||
|
671
|
2,757
|
5,788
|
||||||||||
|
Provision
for income taxes
|
$
|
1,400
|
$
|
3,522
|
$
|
6,675
|
||||||
The federal provision for income taxes included the
recognition of $0.7 million, $0.7 million and $0.3 million of current tax
benefits related to the enactment of certain federal and state laws enacted
during the years ended December 30, 2009, December 31, 2008 and December 26,
2007, respectively. In addition, we recognized a $0.6 million reduction to
the valuation allowance related to the enactment of certain federal and state
laws during the year ended December 26, 2007.
The
reconciliation of income taxes at the U.S. federal statutory tax rate to our
effective tax rate was as follows:
|
December
30, 2009
|
December
31, 2008
|
December
26, 2007
|
||||||||||
|
Statutory
provision (benefit) rate
|
35
|
%
|
35
|
%
|
35
|
%
|
||||||
|
State,
foreign, and other taxes, net of federal income tax
benefit
|
3
|
6
|
3
|
|||||||||
|
Portion
of net operating losses, capital losses and unused income tax
credits
resulting from the establishment or reduction in the valuation
allowance
|
(35
|
)
|
(19
|
)
|
(18
|
)
|
||||||
|
Other
|
—
|
—
|
(2
|
)
|
||||||||
|
Effective
tax rate
|
3
|
%
|
22
|
%
|
18
|
%
|
||||||
F-24
Note 14.
Income Taxes (continued)
The
following represents the approximate tax effect of each significant type of
temporary difference giving rise to deferred income tax assets or
liabilities:
|
December
30, 2009
|
December
31, 2008
|
|||||||
|
(In
thousands)
|
||||||||
|
Deferred
tax assets:
|
||||||||
|
Lease
liabilities
|
$
|
569
|
$
|
947
|
||||
|
Self-insurance
accruals
|
12,408
|
15,076
|
||||||
|
Capitalized
leases
|
4,463
|
4,789
|
||||||
|
Closed
store liabilities
|
3,545
|
4,765
|
||||||
|
Fixed
assets
|
22,767
|
24,304
|
||||||
|
Pension,
other retirement and compensation plans
|
17,243
|
18,761
|
||||||
|
Other
accruals
|
1,047
|
5,047
|
||||||
|
Alternative
minimum tax credit carryforwards
|
12,307
|
12,629
|
||||||
|
General
business credit carryforwards - state and federal
|
38,887
|
45,644
|
||||||
|
Net
operating loss carryforwards - state
|
28,574
|
31,110
|
||||||
|
Net
operating loss carryforwards - federal
|
7,302
|
13,408
|
||||||
|
Total
deferred tax assets before valuation allowance
|
149,112
|
176,480
|
||||||
|
Less:
valuation allowance
|
(135,333
|
)
|
(161,615
|
)
|
||||
|
Deferred
tax assets
|
13,779
|
14,865
|
||||||
|
Deferred
tax liabilities:
|
||||||||
|
Intangible
assets
|
(26,795
|
)
|
(27,210
|
)
|
||||
|
Total
deferred tax liabilities
|
(26,795
|
)
|
(27,210
|
)
|
||||
|
Net
deferred tax liability
|
$
|
(13,016
|
)
|
$
|
(12,345
|
)
|
||
We have
provided valuation allowances related to any benefits from income taxes
resulting from the application of a statutory tax rate to our net operating
losses (“NOL”) generated in previous periods. The valuation allowance decreased
$26.3 million during the year ended December 30, 2009. The South Carolina net
operating loss carryforwards represent 77% of the total state net operating loss
carryforwards. During 2008 and 2007, we utilized certain state NOL
carryforwards whose valuation allowance was established in connection with fresh
start reporting on January 7, 1998. For the years ended December 31, 2008 and
December 26, 2007, we recognized an increase
of approximately $2.0 million and $6.4 million, respectively, of
federal and state deferred tax expense with
a corresponding reduction to goodwill (see Note 5) in connection with fresh
start reporting. The adoption of the Codification’s guidance on business
combinations during the first quarter of 2009 requires that any additional
reversal of deferred tax asset valuation allowance established in connection
with fresh start reporting be recorded as a component of income tax expense
rather than as a reduction to the goodwill established in connection with
the fresh start reporting.
At
December 30, 2009, we have available, on a consolidated basis, general
business credit carryforwards of approximately $38.9 million, most of which
expire in 2010 through 2029, and alternative minimum tax ("AMT") credit
carryforwards of approximately $12.3 million, which never expire. We also have
available regular NOL and AMT NOL carryforwards of approximately $24.3 million
and $111.4 million, respectively, which expire in 2021 through 2029. Prior to
2005, Denny’s had ownership changes within the meaning of Section 382 of
the Internal Revenue Code. Because of these changes, the amount of our NOL
carryforwards along with any other tax carryforward attribute, for periods prior
to the dates of change, are limited to an annual amount which may be increased
by the amount of our net unrealized built-in gains at the time of any ownership
change recognized in that taxable year. Therefore, some of our tax attributes
recorded in the gross deferred tax asset inventory may expire prior to their
utilization. A valuation allowance has already been established for a
significant portion of these deferred tax assets since it is our position it is
more-likely-than-not the tax benefit will not be realized from these
assets.
The
reconciliation of changes in unrecognized tax benefits was as
follows:
| Fiscal Year Ended | ||||||||
| December 30, 2009 | December 31, 2008 | |||||||
| (In thousands) | ||||||||
| Balance, beginning of year | $ | 1,271 | $ | 226 | ||||
| Increases attributable to tax positions taken during a prior year | 242 | 1,045 | ||||||
|
Balance, end of
year
|
$ | 1,513 | $ | 1,271 | ||||
The $1.5
million of unrecognized benefits as of December 30 2009 will have no impact on
our effective rate. We expect the unrecognized tax benefits to decrease over the
next twelve months by $1.0 to $1.5 million, none of which is expected to
impact our effective rate. The expected reduction is due to the timing of
recognition on certain income items. As of and for the years ended December
30, 2009 and December 31, 2008, there were no interest and penalties recognized
in our Consolidated Balance Sheet and Consolidated Statement of
Operations.
We file income tax returns in the U.S. federal jurisdictions and
various state jurisdictions. With few exceptions, we are no longer subject to
U.S. federal, state and local, or non-U.S. income tax examinations by tax
authorities for years before 2006. We remain subject to examination for
U.S. federal taxes for 2006-2009 and in the following major state jurisdictions:
California (2005-2009); Florida (2006-2009) and Texas (2005-2009).
Note
15. Share-Based Compensation
Share-Based
Compensation Plans
We
maintain five share-based compensation plans (the Denny’s Corporation 2008
Omnibus Incentive Plan (the “2008 Omnibus Plan”), the Denny’s Corporation
Amended and Restated 2004 Omnibus Incentive Plan (the “2004 Omnibus Plan”), the
Denny’s, Inc. Omnibus Incentive Compensation Plan for Executives, the Advantica
Stock Option Plan and the Advantica Restaurant Group Director Stock Option Plan)
under which stock options and other awards granted to our employees and
directors are outstanding.
F-25
Note 15.
Share-Based Compensation (continued)
The 2008
Omnibus Plan and the 2004 Omnibus Plan will be used to grant share-based
compensation to selected employees, officers and directors of Denny’s and its
affiliates. However, we reserve the right to pay discretionary bonuses, or other
types of compensation, outside of these plans. There were originally four and a
half million shares reserved for issuance under the 2008 Omnibus Plan. There
were originally ten million shares reserved for issuance under the 2004 Omnibus
Plan, plus a number of additional shares (not to exceed 1,500,000) underlying
awards that were outstanding prior to the adoption of the 2004 Omnibus Plan
pursuant to our other plans which thereafter cancel, terminate or expire
unexercised for any reason. We will not grant any awards under the 2008 Omnibus
Plan to our current President and Chief Executive Officer, but may continue to
grant awards to him under the 2004 Omnibus Plan.
The
Compensation Committee, or the Board of Directors as a whole, has sole
discretion to determine the terms and conditions of awards granted under such
plans. Under the terms of options
granted under the above referenced plans, generally, optionees who
terminate for any reason other than cause, disability, retirement or death will
be allowed 60 days after the termination date to exercise vested options. Vested
options are exercisable for one year when termination is by a reason of
disability, retirement or death. If termination is for cause, no option shall be
exercisable after the termination date.
Share-Based
Compensation Expense
Total
share-based compensation expense included as a component of net income was as
follows (in thousands):
|
Fiscal
Year Ended
|
||||||||||||
|
December
30, 2009
|
December
31, 2008
|
December
26, 2007
|
||||||||||
|
Share-based
compensation related to liability classified restricted stock
units
|
$
|
1,104
|
|
$
|
92
|
$
|
1,407
|
|||||
|
Share-based
compensation related to equity classified awards:
|
||||||||||||
|
Stock
options
|
$
|
1,567
|
$
|
1,817
|
$
|
1,386
|
||||||
|
Restricted
stock units
|
1,687
|
1,980
|
1,657
|
|||||||||
|
Board
deferred stock units
|
313
|
228
|
324
|
|||||||||
|
Total
share-based compensation related to equity classified
awards
|
3,567
|
4,025
|
3,367
|
|||||||||
|
Total
share-based compensation
|
$
|
4,671
|
$
|
4,117
|
$
|
4,774
|
||||||
Stock
Options
Options
granted to date generally vest evenly over 3 years, have a 10-year contractual
life and are issued at the market value at the date of grant.
The
following table summarizes information about stock option outstanding and
exercisable at December 30, 2009:
|
Options
|
Weighted-Average
Exercise Price
|
Weighted-Average
Remaining Contractual Life
|
Aggregate
Intrinsic Value
|
|||||||||||||
|
(In
thousands)
|
(In
thousands)
|
|||||||||||||||
|
Outstanding,
beginning of year
|
7,925
|
$
|
2.51
|
|||||||||||||
|
Granted
|
1,394
|
1.67
|
||||||||||||||
|
Exercised
|
(94
|
)
|
1.14
|
|||||||||||||
|
Forfeited
|
(408
|
)
|
2.42
|
|||||||||||||
|
Expired
|
(515
|
)
|
3.30
|
|||||||||||||
|
Outstanding,
end of year
|
8,302
|
2.34
|
4.56
|
$
|
3,374
|
|||||||||||
|
Exercisable,
end of year
|
6,366
|
2.36
|
3.30
|
$
|
2,788
|
|||||||||||
The
aggregate intrinsic value was calculated using the difference between the market
price of our stock on December 30, 2009 and the exercise price for only those
options that have an exercise price that is less than the market price of our
stock. The aggregate intrinsic value of the options exercised was $0.1
million, $1.1 million and $3.3 million during the years ended December 30, 2009,
December 31, 2008 and December 26, 2007, respectively.
The
weighted average fair value per option of options granted during the years ended
December 30, 2009, December 31, 2008 and December 26, 2007 was $0.81, $1.18 and
$3.07, respectively.
As of
December 30, 2009, we had approximately $1.1 million of unrecognized
compensation cost related to unvested stock option awards granted, which is
expected to be recognized over a weighted average of 1.7 years.
F-26
Note
15. Share-Based Compensation (continued)
Restricted
Stock Units
The
following table summarizes information about restricted stock units outstanding
at December 30, 2009:
|
Units
|
Weighted-Average
Grant Date
Fair
Value
|
|||||||
|
(In
thousands)
|
||||||||
|
Outstanding,
beginning of year
|
3,095
|
$
|
3.68
|
|||||
|
Granted
|
312
|
1.84
|
||||||
|
Vested
|
(1,035
|
)
|
3.82
|
|||||
|
Forfeited
|
(363
|
)
|
3.01
|
|||||
|
Outstanding,
end of year
|
2,009
|
3.56
|
||||||
In March
2009, we granted approximately 0.3 million performance shares and 0.3
million performance units to certain employees. As these awards contain a market
condition, a Monte Carlo valuation was used to determine the performance shares
grant date fair value of $1.84 per share. The awards granted to our named
executive officers also contain a performance condition based on certain
operating measures for the fiscal year ended December 30, 2009. The
performance units were valued at $2.00 per unit. The performance period is the
three year fiscal period beginning January 1, 2009 and ending December 28, 2011.
The performance shares and units will vest and be earned (from 0% to 200% of the
target award for each such increment) at the end of the performance period based
on the Total Shareholder Return of our stock compared to the Total Shareholder
Returns of a group of peer companies. As of December 30, 2009, approximately 0.2
million and 0.2 million performance shares and units were outstanding,
respectively.
During
2008, we granted approximately 1.2 million restricted stock units to certain
employees. As these awards contain a market condition, a Monte Carlo
valuation was used to determine the grant date fair value of $2.56 per share.
The awards granted to our named executive officers also contain a performance
condition based on certain operating measures for the four fiscal quarters
ending prior to July 16, 2009. These restricted units will be earned and vest in
1/3 increments (from 50% to 120% of the target award for each such increment)
based on the appreciation/(depreciation) of our common stock from the date of
grant to each of three vesting periods (July 16, 2009, July 16, 2010 and
July 16, 2011). During the year ended December 30, 2009, we issued 0.2
million shares of common stock, net of 0.1 million shares that were used to pay
taxes, related to the 0.3 million restricted stock units that vested as of July
16, 2009. As of December 30, 2009, approximately 0.6 million of the restricted
stock units were outstanding.
During
2007, we granted approximately 0.6 million performance shares and 0.6 million
performance units with a grant date fair value of $4.61 per share to
certain employees. The awards were earned at 100% of the target award based on
certain operating performance measures for fiscal 2007. The performance shares
and units vest 15% as of December 26, 2007, 35% as of December 31, 2008 and 50%
as of December 30, 2009. During the year ended December 30, 2009, we paid $0.7
million (before taxes) in cash and issued 0.1 million shares of common stock
related to the 0.1 million performance units and 0.1 million performance shares
that vested on December 31, 2008. During the year ended December 31, 2008, we
paid $0.4 million in cash and issued 0.1 million shares of common stock related
to the 0.1 million performance units and 0.1 million performance shares that
vested on December 26, 2007. As of December 30, 2009, approximately 0.2 million
and 0.2 million of the performance shares and units were outstanding,
respectively.
In
addition, during 2007, we granted approximately 0.1 million stock-settled
restricted stock units and 0.1 million cash-settled restricted stock units
with a grant date fair value of $4.55 per share to the Company's Chief
Financial Officer. The stock-settled and cash-settled units will vest in
20% annual increments between July 9, 2008 and July 9, 2012. The vested
stock-settled units will be paid in shares of common stock on July 9,
2012 and the vested cash-settled units will be paid in cash as of each
vesting period, provided that he is then still employed with Denny's or an
affiliate, previously terminated due to death or disability or previously
terminated within two years following a change in control by the Company without
cause or by grantee for good reason. During the year ended December 30,
2009, we paid less then $0.1 million in cash related to the cash-settled
restricted stock units that vested on July 9, 2009. During the year ended
December 31, 2008, we paid less then $0.1 million in cash related to the
cash-settled restricted stock units that vested on July 9, 2008. As of December
30, 2009, approximately 0.1 million and less than 0.1 million of the
stock-settled restricted stock units and cash-settled restricted stock units
were outstanding, respectively.
During
2006, we granted approximately 0.4 million performance shares and 0.4
million performance units with a grant date fair value of $4.45 per share to
certain employees. The awards were earned at 100% of the target award based
on certain operating performance measures for fiscal 2006. The performance
shares and units vested over a period of two years based on continued
employment of the holder. During the year ended December 30, 2009, we paid $1.0
million (before taxes) in cash and issued 0.2 million share of common stock
related to the 0.2 million performance units and 0.2 million performance shares
that vested as of December 31, 2008. As of December 30, 2009, there were no
performance shares or units outstanding under this award.
During
2005, we granted approximately 0.3 million performance shares and 0.3
million performance units with a grant date fair value of $4.06 per share to
certain employees. The awards will be earned in 1/3 increments (from 0% to 100%
of the target award for each such increment) based on the “total shareholder
return” of our common stock over a 1-year performance period (measured as the
increase of stock price plus reinvested dividends, divided by beginning stock
price) as compared with the total shareholder return of a peer group of
restaurant companies over the same period. The annual periods ended June
30, 2006, 2007 and 2008. The first two incremental portions of the
awards were not earned during the three annual periods, but will be considered
earned after 5 years based on continued employment. The third incremental
portion of the awards was earned on June 30, 2008. Once earned, the
performance shares and units will vest over a period of two years based on
continued employment of the holder. On each of the first two anniversaries of
the end of the performance period, 50% of the earned performance shares and 50%
of the earned performance units will be paid. During the year ended
December 30, 2009, we paid $0.1 million (before taxes) in cash and issued less
than 0.1 million shares of common stock related to the less than 0.1 million
performance units and less than 0.1 million performance shares that vested as of
June 30, 2009. As of December 30, 2009, approximately 0.2 million and 0.2
million of the performance shares and units were outstanding,
respectively.
F-27
Note 15.
Share-Based Compensation (continued)
During
2004, we granted approximately 1.7 million performance shares and 1.7 million
performance units with a grant date fair value of $4.22 per share to certain
employees. These awards will be earned in 1/3 increments (from 0% to 100% of the
target award for each such increment) based on the “total shareholder return” of
our common stock over a 1-year performance period (measured as the increase of
stock price plus reinvested dividends, divided by beginning stock price) as
compared with the total shareholder return of a peer group of restaurant
companies over the same period. The annual periods ended on June 30, 2005,
2006 and 2007. The first 1/3 of the award was earned on June 30, 2005. The
second 1/3 of the award was not earned on June 30, 2006, but was cumulatively
earned on June 30, 2007. The third 1/3 of the award was not earned on June 30,
2007, but will be considered earned after 5 years based on continued employment.
Once earned, the performance shares and units will vest over a period of two
years based on continued employment of the holder. On each of the first two
anniversaries of the end of the performance period, 50% of the earned
performance shares and 50% of the earned performance units will be paid. During
the year ended December 30, 2009, we paid $0.3 million (before taxes) in cash
and issued 0.1 million shares of common stock related to the 0.1 million
performance units and 0.1 million performance shares that vested as of June 30,
2009. During the year ended December 31, 2008, we paid $0.5 million in cash and
issued 0.2 million shares of common stock related to the 0.2 million performance
units and 0.2 million performance shares that vested as of June 30, 2008. During
the year ended December 26, 2007, we paid $0.9 million in cash and issued 0.2
million shares of common stock related to the 0.2 million performance units and
0.2 million performance shares that vested as of June 30, 2007. As of December
30, 2009, approximately 0.2 million and 0.2 million of the performance
shares and units were outstanding, respectively.
At
December 30, 2009, approximately $1.3 million and $0.5 million of accrued
compensation was included as a component of other current liabilities and other
noncurrent liabilities in our Consolidated Balance Sheet, respectively, (based
on the fair value of the related shares for the liability classified units as of
December 30, 2009) and $5.2 million was included as a component of additional
paid-in-capital in our Consolidated Balance Sheet related to the equity
classified restricted stock units. At December 31, 2008, approximately $2.0
million and $1.1 million of accrued compensation was included as a component of
other current liabilities and other noncurrent liabilities in our Consolidated
Balance Sheet, respectively, (based on the fair value of the related shares for
the liability classified units as of December 31, 2008) and $5.1 million was
included as a component of additional paid-in-capital in our Consolidated
Balance Sheet related to the equity classified restricted stock
units.
As of
December 30, 2009, we had approximately $1.9 million of unrecognized
compensation cost (approximately $0.5 million for liability classified units and
approximately $1.4 million for equity classified units) related to unvested
restricted stock unit awards granted, which is expected to be recognized over a
weighted average of 1.2 years.
Board
Deferred Stock Units
Non-employee
members of the Board of Directors are granted deferred stock units annually, as
well as in return for attendance at non-regularly scheduled meetings. The
directors may elect to convert these awards into shares of common stock either
on a specific date in the future (while still serving as a member of the Board
of Directors) or upon termination as a member of the Board of Directors. During
2009, two board members did not stand for re-election and during 2008, one board
member did not stand for re-election. As a result, the board members’ deferred
stock units were converted into shares of common stock. As of December 30, 2009
and December 31, 2008, approximately 0.3 million and 0.2 million of these units
were outstanding, respectively. As of December 30, 2009, there was no
unrecognized compensation cost related to deferred stock units.
Note
16. Net Income Per Share
The net
income per share was as follows:
|
Fiscal Year
Ended
|
||||||||||||
|
December
30, 2009
|
December
31, 2008
|
December
26, 2007
|
||||||||||
|
(In
thousands, except per share amounts)
|
||||||||||||
|
Numerator:
|
||||||||||||
|
Numerator
for basic and diluted net income per share - net
income
|
$
|
41,554
|
$
|
12,742
|
$
|
29,484
|
||||||
|
Denominator:
|
||||||||||||
|
Denominator
for basic net income per share—weighted-average
shares
|
96,318
|
95,230
|
93,855
|
|||||||||
|
Effect
of dilutive securities:
|
||||||||||||
|
Options
|
1,274
|
2,141
|
3,948
|
|||||||||
|
Restricted
stock units and awards
|
907
|
1,471
|
1,041
|
|||||||||
|
Denominator
for diluted net income per share—adjusted weighted-
average
shares and assumed conversions of dilutive
securities
|
98,499
|
98,842
|
98,844
|
|||||||||
|
Basic
net income per share
|
$
|
0.43
|
$
|
0.13
|
$
|
0.31
|
||||||
|
Diluted
net income per share
|
$
|
0.42
|
$
|
0.13
|
$
|
0.30
|
||||||
|
Stock
options excluded (1)
|
5,606
|
3,413
|
1,839
|
|||||||||
|
Restricted
stock units and awards excluded (1)
|
352
|
—
|
—
|
|||||||||
|
(1)
|
Excluded
from diluted weighted-average shares outstanding as the impact would be
antidilutive.
|
F-28
Note
17. Commitments and Contingencies
There are various claims
and pending legal actions against or indirectly involving us, including
actions concerned with civil rights of employees and guests, other employment
related matters, taxes, sales of franchise rights and businesses and other
matters. Based on our examination of these matters and our experience to date,
we have recorded liabilities reflecting our best estimate of loss, if any, with
respect to these matters. However, the ultimate disposition of these matters
cannot be determined with certainty. We record legal settlement costs as other
operating expenses in our Consolidated Statements of Operations as those costs
are incurred.
We have
amounts payable under purchase contracts for food and non-food products. In most
cases, these agreements do not obligate us to purchase any specific volumes and
include provisions that would allow us to cancel such agreements with
appropriate notice. Our future commitments at December 30, 2009 under these
contracts consist of the following:
|
Purchase
Obligations
|
||||
|
(In
thousands)
|
||||
|
Payments due by
period:
|
||||
|
Less
than 1 year
|
$
|
147,690
|
||
|
1-2
years
|
5,130
|
|||
|
3-4
years
|
—
|
|||
|
5
years and thereafter
|
—
|
|||
|
Total
|
$
|
152,820
|
||
Amounts
included in the table above represent our estimate of purchase obligations
during the periods presented if we were to cancel these contracts with
appropriate notice. We would likely take delivery of goods under such
circumstances.
Note
18. Supplemental Cash Flow Information
|
Fiscal
Year Ended
|
||||||||||||
|
December
30, 2009
|
December
31, 2008
|
December
26, 2007
|
||||||||||
|
(In
thousands)
|
||||||||||||
|
Income
taxes paid, net
|
$
|
610
|
$
|
1,067
|
$
|
2,257
|
||||||
|
Interest
paid
|
$
|
31,133
|
$
|
34,858
|
$
|
37,772
|
||||||
|
Noncash
investing activities:
|
||||||||||||
|
Notes
received in connection with disposition of property
|
$
|
3,665
|
$
|
2,670
|
$
|
—
|
||||||
|
Accrued
purchase of property
|
$
|
908
|
$
|
1,011
|
$
|
2,718
|
||||||
|
Execution
of direct financing leases
|
$
|
2,950
|
4,287
|
1,906
|
||||||||
|
Noncash
financing activities:
|
||||||||||||
|
Issuance
of common stock, pursuant to share-based compensation
plans
|
$
|
1,823
|
$
|
1,268
|
$
|
1,125
|
||||||
|
Execution
of capital leases
|
$
|
1,766
|
$
|
5,242
|
$
|
2,065
|
||||||
Note
19. Related Party Transactions
During
the past three years we sold company-owned restaurants to franchisees
that are former employees, including former officers. We received cash
proceeds of $2.5 million, $5.1 million and $9.1 million from these related party
sales during 2009, 2008 and 2007, respectively. We recognized gains
of $0.8 million, losses of $2.0 million and gains of $0.6 million from these
related party sales during 2009, 2008 and 2007, respectively. In
relation to these sales, we may enter into leases or subleases with the
franchisees. These leases and subleases are entered into at fair market
value.
F-29
Note 20.
Quarterly Data (Unaudited)
The
results for each quarter include all adjustments which, in our opinion, are
necessary for a fair presentation of the results for interim periods. All
adjustments are of a normal and recurring nature.
Selected
consolidated financial data for each quarter of fiscal 2009 and 2008 are set
forth below:
|
Fiscal
Year Ended December 30, 2009
|
||||||||||||||||
|
First Quarter
|
Second
Quarter
|
Third
Quarter
|
Fourth
Quarter
|
|||||||||||||
|
(In
thousands, except per share data)
|
||||||||||||||||
|
Company
restaurant sales
|
$
|
135,576
|
$
|
125,500
|
$
|
116,579
|
$
|
111,293
|
||||||||
|
Franchise
and licensing revenue
|
30,184
|
30,313
|
29,485
|
29,173
|
||||||||||||
|
Total
operating revenue
|
165,760
|
155,813
|
146,064
|
140,466
|
||||||||||||
|
Total
operating costs and expenses
|
153,840
|
138,367
|
127,429
|
116,038
|
||||||||||||
|
Operating
income
|
$
|
11,920
|
$
|
17,446
|
$
|
18,635
|
$
|
24,428
|
||||||||
|
Net
income
|
$
|
4,307
|
$
|
9,336
|
$
|
10,033
|
$
|
17,878
|
||||||||
|
Basic
net income per share (a)
|
$
|
0.04
|
$
|
0.10
|
$
|
0.10
|
$
|
0.19
|
||||||||
|
Diluted
net income per share (a)
|
$
|
0.04
|
$
|
0.09
|
$
|
0.10
|
$
|
0.18
|
||||||||
|
(a)
|
Per
share amounts do not necessarily sum to the total year amounts due to
changes in shares outstanding and
rounding.
|
|
Fiscal
Year Ended December 31, 2008
|
||||||||||||||||
|
First Quarter
|
Second
Quarter
|
Third
Quarter
|
Fourth
Quarter (a)
|
|||||||||||||
|
(In
thousands, except per share data)
|
||||||||||||||||
|
Company
restaurant sales
|
$
|
169,593
|
$
|
163,233
|
$
|
160,608
|
$
|
154,830
|
||||||||
|
Franchise
and licensing revenue
|
26,403
|
27,039
|
28,667
|
29,898
|
||||||||||||
|
Total
operating revenue
|
195,996
|
190,272
|
189,275
|
184,728
|
||||||||||||
|
Total
operating costs and expenses
|
176,749
|
179,735
|
168,586
|
174,290
|
||||||||||||
|
Operating
income
|
$
|
19,247
|
$
|
10,537
|
$
|
20,689
|
$
|
10,438
|
||||||||
|
Net
income (loss) (b)
|
$
|
3,662
|
$
|
3,090
|
$
|
9,470
|
$
|
(3,480
|
)
|
|||||||
|
Basic
and diluted net income (loss) per share (c)
|
$
|
0.04
|
$
|
0.03
|
$
|
0.10
|
$
|
(0.04
|
)
|
|||||||
|
(a)
|
The
fiscal quarter ended December 31, 2008 includes 14 weeks of operations as
compared to 13 weeks for all other quarters presented.
|
| (b) | The first, second and third quarters have been adjusted from amounts previously reported to reflect certain adjustments discussed in "Adjustments to Previously Issued Financial Statements" in Note 2. |
|
(c)
|
Per
share amounts do not necessarily sum to the total year amounts due to
changes in shares outstanding and
rounding.
|
The
fluctuations in net income during the fiscal 2009 and 2008 quarters relate
primarily to the timing of the sale of company-owned restaurants to
franchisees.
Note
21. Subsequent Events
We
performed an evaluation of subsequent events and determined that no events
required disclosure.
F-30
Pursuant
to the requirements of Section 13 or 15(d) of the Securities and Exchange
Act of 1934, the registrant has duly caused this report to be signed on its
behalf by the undersigned, thereunto duly authorized.
Date:
March 12, 2010
|
DENNY'S
CORPORATION
|
|
|
BY:
|
/s/
F. Mark Wolfinger
|
|
F.
Mark Wolfinger
|
|
|
Executive
Vice President,
Chief
Administrative Officer and
Chief
Financial Officer
|
Pursuant
to the requirements of the Securities Exchange Act of 1934, this report has been
signed below by the following persons on behalf of the registrant and in the
capacities and on the dates indicated.
|
Signature
|
Title
|
Date
|
|
/s/
Nelson J. Marchioli
|
President,
Chief Executive Officer and Director
|
March
12, 2010
|
|
(Nelson
J. Marchioli)
|
(Principal
Executive Officer)
|
|
|
/s/
F. Mark Wolfinger
|
Executive
Vice President, Chief Administrative Officer and Chief Financial
Officer
|
March
12, 2010
|
|
(F.
Mark Wolfinger)
|
(Principal
Financial Officer)
|
|
|
/s/
Jay C. Gilmore
|
Vice
President, Chief Accounting Officer and Corporate
Controller
|
March
12, 2010
|
|
(Jay
C. Gilmore)
|
(Principal
Accounting Officer)
|
|
|
/s/
Debra Smithart-Oglesby
|
Director
and Chair of the Board of Directors
|
March
12, 2010
|
|
(Debra
Smithart-Oglesby)
|
||
|
/s/
Brenda J. Lauderback
|
Director
|
March
12, 2010
|
|
(Brenda
J. Lauderback)
|
||
|
/s/
Robert E. Marks
|
Director
|
March
12, 2010
|
|
(Robert
E. Marks)
|
||
|
/s/
Louis P. Neeb
|
Director
|
March
12, 2010
|
|
(Louis
P. Neeb)
|
||
|
/s/
Donald C. Robinson
|
Director
|
March
12, 2010
|
|
(Donald
C. Robinson)
|
||
|
/s/
Donald R. Shepherd
|
Director
|
March
12, 2010
|
|
(Donald
R. Shepherd)
|
||
|
/s/
Laysha Ward
|
Director
|
March
12, 2010
|
|
(Laysha
Ward)
|