Attached files
Table of Contents
UNITED STATES
SECURITIES AND EXCHANGE COMMISSION
Washington, D.C. 20549
FORM 10-K
| x | ANNUAL REPORT PURSUANT TO SECTION 13 OR 15(d) OF THE SECURITIES EXCHANGE ACT OF 1934 |
For the fiscal year ended December 31, 2009
OR
| ¨ | TRANSITION REPORT UNDER SECTION 13 OR 15(d) OF THE SECURITIES EXCHANGE ACT OF 1934 |
For the transition period from to
Commission file number 000-02642
COGO GROUP, INC.
(Exact name of registrant as specified in its charter)
| Maryland | 52-0466460 | |
| (State or other jurisdiction of incorporation or organization) |
(I.R.S. Employer Identification No.) |
| Room 1001, Tower C, Skyworth Building High-Tech Industrial park Nanshan, Shenzhen, PRC |
518057 | |
| (Address of principal executive offices) | (Zip Code) |
Registrant’s telephone number, including area code: (86)-755-267-43210
Securities registered pursuant to Section 12(b) of the Act: $0.01 par value Common Stock
Securities registered pursuant to Section 12(g) of the Act: None
Indicate by check mark if the registrant is a well-known seasoned issuer, as defined in Rule 405 of the Securities Act. Yes ¨ No x
Indicate by check mark if the registrant is not required to file reports pursuant to Section 13 or Section 15(d) of the Exchange Act. Yes ¨ No x
Indicate by check mark whether the registrant (1) has filed all reports required by Section 13 or 15(d) of the Securities Exchange Act of 1934 during the preceding 12 months (or for such shorter period that the registrant was required to file such reports), and (2) has been subject to such filing requirements for the past 90 days. Yes x No ¨
Indicate by check mark whether the registrant has submitted electronically and posted on its corporate Web site, if any, every Interactive Data File required to be submitted and posted pursuant to Rule 405 of Regulation S-T (§229.405 of this chapter) during the preceding 12 months (or for such shorter period that the registrant was required to submit and post such files). Yes ¨ No ¨
Indicate by check mark if disclosure of delinquent filers pursuant to Item 405 of Regulation S-K (§229.405 of this chapter) is not contained herein, and will not be contained, to the best of registrant’s knowledge, in definitive proxy or information statements incorporated by reference in Part III of this Form 10-K or any amendment to this Form 10-K. ¨
Indicate by check mark whether the registrant is a large accelerated filer, an accelerated filer, a non-accelerated filer or a smaller reporting company. See definitions of “large accelerated filer,” “accelerated filer” and “smaller reporting company” in Rule 12b-2 of the Exchange Act.
| Large accelerated filer | ¨ | Accelerated filer | x | |||
| Non-accelerated filer | ¨ | Smaller reporting company | ¨ | |||
Indicate by check mark whether the registrant is a shell company (as defined in Rule 12b-2 of the Exchange Act). Yes ¨ No x
The aggregate market value of the voting stock held by non-affiliates of the Registrant was $153,812,608 based on the reported last sale price of common stock on the Nasdaq Global Market on June 30, 2009.
The number of shares outstanding of the registrant’s common stock at $.001 par value as of March 3, 2010 was 36,117,867.
DOCUMENTS INCORPORATED BY REFERENCE
None.
Table of Contents
Annual Report on Form 10-K for the Year Ended December 31, 2009
Table of Contents
FORWARD LOOKING STATEMENTS
This Annual Report on Form 10-K contains forward-looking statements within the meaning of Section 27A of the Securities Act of 1933, and Section 21E of the Securities Exchange Act of 1934. These statements relate to future events or our future financial performance. We have attempted to identify forward-looking statements by terminology including “anticipates”, “believes”, “expects”, “can”, “continue”, “could”, “estimates”, “expects”, “intends”, “may”, “plans”, “potential”, “predict”, “should” or “will” or the negative of these terms or other comparable terminology. These statements are only predictions. Uncertainties and other factors, including the risks outlined under Risk Factors contained in Item 1A of this Form 10-K, may cause our actual results, levels of activity, performance or achievements to be materially different from any future results, levels or activity, performance or achievements expressed or implied by these forward-looking statements.
A variety of factors, some of which are outside our control, may cause our operating results to fluctuate significantly. They include:
| • | the availability and cost of products from our suppliers incorporated into our customized module design solutions; |
| • | changes in end-user demand for the products manufactured and sold by our customers; |
| • | general and cyclical economic and business conditions, domestic or foreign, and, in particular, those in China’s mobile handset, telecommunications equipment and digital media industries; |
| • | the rate of introduction of new products by our customers; |
| • | the rate of introduction of enabling technologies by our suppliers; |
| • | changes in our pricing policies or the pricing policies of our competitors or suppliers; |
| • | our ability to compete effectively with our current and future competitors; |
| • | our ability to manage our growth effectively, including possible growth through acquisitions; |
| • | our ability to enter into and renew key corporate and strategic relationships with our customers and suppliers; |
| • | our implementation of share-based compensation plans; |
| • | changes in the favorable tax incentives enjoyed by our People’s Republic of China (“PRC”) operating companies; |
| • | foreign currency exchange rates fluctuations; |
| • | adverse changes in the securities markets; and |
| • | legislative or regulatory changes in China. |
Although we believe that the expectations reflected in the forward-looking statements are reasonable, we cannot guarantee future results, levels of activity, performance or achievements. Our expectations are as of the date this Form 10-K is filed, and we do not intend to update any of the forward-looking statements after the filing date to conform these statements to actual results, unless required by law.
We file annual reports on Form 10-K, quarterly reports on Form 10-Q, current reports on Form 8-K and proxy and information statements and amendments to reports filed or furnished pursuant to Sections 13(a) and 15(d) of the Securities Exchange Act of 1934, as amended. You may read and copy these materials at the SEC’s Public Reference Room at 100 F Street, N.E., Washington, D.C. 20549. You may obtain information on the operation of the public reference room by calling the SEC at 1-800-SEC-0330. The SEC also maintains a website (http://www.sec.gov) that contains reports, proxy and information statements and other information regarding us and other companies that file materials with the SEC electronically. You may also obtain copies of reports filed with the SEC, free of charge, via a link included on our website at http://www.cogo.com.cn.
1
Table of Contents
| ITEM 1. | BUSINESS |
Company Overview
We provide customized module design solutions for a diverse set of applications and end markets, serving as a gateway for our technology component suppliers to access leading electronics manufacturers in China. Our customized module design solutions allow our customers to take advantage of technology components from reputable suppliers in an efficient and cost-effective manner, effectively reducing their time-to-market and lowering their overall costs. Our close collaboration with our customers’ product development teams provides us with a unique understanding of their needs, enabling us to customize our suppliers’ technology components with module designs that meet our customers’ needs. In addition, in 2006 we began offering technology and engineering services in China and in 2007, we began offering software design service in China.
We focus on the digital media, telecommunications equipment and industrial business end-markets in China. In the digital media end-market, we provide mobile handset and module solutions for functionalities such as CMMB mobile TV, motion sensor, camera, power supply and bluetooth as well as solutions for high definition digital set-top box, GPS applications and solutions for Smartbook. In the telecommunications equipment end-market, we provide solutions for public switched telephone network, or PSTN, switching, optical transmitters, electrical signal processing and optical signal amplification. In the industrial business end-market, which commenced since the beginning of 2008, we provide industrial solutions for the smart meter, smart grid, railway and auto-electronics sectors. Currently, we have over 1,400 customers, including many of the most established manufacturers in the telecommunications equipment, digital media and industrial end-markets in China such as ZTE, TCL and BYD. We work with original equipment manufacturers, or OEMs, as well as subsystem designers and contract manufacturers to provide solutions to support industry leaders like Huawei. In developing customized module design solutions for use in our customers’ products, we collaborate closely with over 30 suppliers of technology components, including many large multinational companies such as Broadcom, Matsushita, Sandisk, Freescale and Atmel. Additionally, in October 2006 we became one of the first China-based companies to license software technology and have access to selected source codes relating to digital media directly from Microsoft.
Based on the customer’s specific requirements, we will propose a customized module reference design, which usually incorporates technology components from our suppliers. If the customer accepts our module reference design, it will generally agree to purchase specific components contained in our proposed design from us. However, our customers and their third-party contract manufacturers are responsible for the manufacture and assembly of the customized module based on our designs. Our business model is based on generating recurring revenue by reselling specific components required in our module reference designs. The difference between the purchase price we pay our suppliers for these components and our sales price to our customers for these components compensates us for our design, technical support and distribution services.
We continue to explore and identify new end-markets where we can leverage both our design and engineering expertise. For example, in 2009, we acquired Mega Smart Group Limited which provides industrial solutions for the green energy and auto-electronics sectors. In 2008, we acquired a 70% equity interest in Long Rise Holdings Limited and its subsidiary, which engages in the provision of design and distribution of mobile phone modules.
From 2007 to 2009, our net revenue grew from RMB1,666.5 million to RMB2,096.2 million ($307.1 million), representing a compound annual growth rate, or CAGR, of 12.2%, and our net income attributable to Cogo Group, Inc. decreased from RMB152.4 million to RMB80.2 million ($11.8 million) during the same period, representing a negative CAGR of 27.5%. This resulted from the difficult market environment in our mobile handset business since the third quarter of 2008 in which we strategically lowered our pricing in order to grow our business in a slowing economic environment.
2
Table of Contents
Competitive Strengths
We believe that our customized module design solutions allow our customers to more effectively utilize our suppliers’ enabling technology components, which in turn allows them to better compete in their targeted end-markets. We believe our competitive strengths include:
Broad customer base and deep customer relationships. Our broad customer base includes many major domestic telecommunications equipment, industrial business and digital consumer electronics manufacturers in China and many of their supporting subsystem suppliers. Being a customized module design solution provider to our customers requires a time-consuming and difficult procurement qualification process, which we believe serves as a significant barrier to entry for other participants. We believe that these close customer relationships, together with our continued qualified solution provider status, facilitate better understanding of our customers’ time-to-market, technology and cost requirements. These relationships also present new business opportunities by enabling us to identify and capture additional revenue streams from our customers’ new growth areas.
Differentiated business model. We facilitate our customers’ use of technology components in their end-products, thus reducing both their time-to-market and overall costs. As we focus on providing solutions to meet our customers’ specific requirements, we believe that we are less vulnerable to risks associated with the development and adoption of new and unproven technology. We do not directly charge a design fee for our customized module solutions. Instead, we are compensated by a markup on the components recommended in our design solution, which is determined principally by the extent of the design work we provide.
Accumulated design solutions expertise. Over the years, we have developed an extensive portfolio of design solutions we can leverage to accommodate the needs of new clients or existing clients with changed needs. As such, we are able to achieve significant design cost efficiencies by reducing the need to invest the time or resources associated with designing a new solution. In addition, our engineers have also accumulated a significant amount of design and engineering expertise from working with various clients from our extensive customer base.
Strong relationships with enabling technology components suppliers. We work closely with more than 30 technology components suppliers, including major global components suppliers such as Broadcom, Matsushita, Sandisk, Freescale and Atmel. In addition to facilitating the customization of their technology components, our suppliers often rely on us as a means of penetrating new China-based electronics manufacturers via our existing domestic relationships.
Strategy
We intend to strengthen our position as a technology solution provider for customers in China’s digital media, telecommunications equipment and industrial business end-markets.
Leverage our strong customer relationships into new opportunities. In 2008, we began targeting the industrial business end-market to provide industrial solutions for the green energy and auto-electronics sectors. We have since then grown our revenues generated from this market from constituting 4.5% of our 2008 revenue to 13.2% of our 2009 revenue. We anticipate that sales related to the industrial business end-markets will generally have higher profit margins than our digital media and telecom equipment modules related sales, though such higher margins may decline over time as this industry matures. We will also look for opportunities to expand into new end markets that we believe represent significant growth opportunities.
3
Table of Contents
Our success in the industrial business end-market will depend, in significant part, on our ability to leverage our existing customer base. We expect to continue to incur additional research and development expenses, through hiring additional engineering personnel to develop new solutions and expanding our intellectual property and technological capabilities, to meet the needs of our customers that have expanded into or are expected to expand into the industrial business end-market.
Strengthen our design and development capabilities. To meet the changing needs of our customers, which include increasingly shorter product life cycles, we intend to continue to improve and strengthen our in-depth and diversified solution development and design capabilities. We plan to continue investing resources to maintain the most experienced and skilled design team to preserve competitiveness within a frequently changing and challenging industry landscape. We expect to continue to incur additional research and development expenses, through hiring additional engineering personnel to develop new solutions and expanding our intellectual property and technological capabilities to meet the needs of our customers that have expanded into or are expected to expand into different end-markets, such as digital media and industrial business.
Enhance our competitiveness in new product areas through strategic alliances. We intend to broaden our product offerings by leveraging our existing design and engineering expertise as well as selectively entering into strategic alliances with third parties to complement our existing capabilities. For example, we entered into an arrangement with Microsoft whereby we will have the ability to license next generation software technology from Microsoft’s IP Ventures program and use Microsoft’s source codes to develop design solutions across a variety of digital media applications. We believe this arrangement will enhance our competitiveness in design solutions for digital media initiatives, targeting various end-markets including high definition digital set top-box, GPS, game console, smartphone and portable media player markets. We intend to continue working with third parties in ways that will enhance our competitiveness.
Make strategic investments and acquisitions. We intend to grow and expand our business by making strategic investments in and acquiring businesses complementary to ours that will enable us to expand the solutions we offer to our existing target customer base, and that will provide opportunities to expand into new markets. In particular, we plan to pursue opportunities where we expect to generate additional near-term revenue or expand our long-term growth opportunities by expanding our customer base or target end-markets. For example, in 2009, we acquired 100% of Mega Smart Group Limited and its subsidiary, which engage in the development of industrial applications components in China.
4
Table of Contents
Products and Technology
We provide customization of our suppliers’ technology components with module designs to suit each of our customers’ specific needs. Our customized module design solutions include:
| Digital Media Modules |
Telecommunications Equipment Modules |
Industrial Business Solutions | ||
| CMMB mobile TV |
Fixed line telecommunications network | Smart Meter | ||
| Motion Sensor |
Data communications | Smart Grid | ||
| Persistent storage |
Optical transmission | Railways | ||
| Input / output |
Wireless base-station | Auto-electronics | ||
| Sound system |
||||
| Power supplies |
||||
| Bluetooth |
||||
| Multimedia |
||||
| High definition digital set-top box |
||||
| GPS |
||||
| Multimedia module in portable media player |
||||
| Multimedia module in home entertainment |
||||
The following table sets forth the revenue contribution from our digital media, telecommunications equipment, industrial business and other services end-markets during 2007, 2008 and 2009.
| Market |
2007 | 2008 | 2009 | ||||||
| Digital media |
65.4 | % | 65.3 | % | 60.4 | % | |||
| Telecommunications equipment |
30.5 | % | 28.8 | % | 25.0 | % | |||
| Industrial business |
— | 4.5 | % | 13.2 | % | ||||
| Services revenue |
4.1 | % | 1.4 | % | 1.4 | % | |||
| Total |
100.0 | % | 100.0 | % | 100.0 | % |
5
Table of Contents
Our research and development (“R&D”) unit has always been a driving component in our business and remains crucial in providing the best design solutions for our customers. We have a team of approximately 237 highly qualified design and application engineering specialists and other technical employees engaged in R&D related activities to develop new customized module solutions targeted at the wireless handset, telecommunications equipment, industrial business and digital media industries. For 2009, we invested RMB67.5 million ($9.9 million) for R&D purposes and will continue to devote significant resources to supporting and enhancing the depth and capabilities of our R&D unit.
Customers
Our broad customer base includes many of the major domestic digital media, telecommunications equipment and industrial business manufacturers in China. In addition, our customers include industry participants supporting these OEMs, such as subsystem designers and contract manufacturers in China, as well as international manufacturers who have begun to manufacture end-products in China for the domestic and international market. Our three largest customers in the digital media market in terms of 2009 net revenue were ZTE, both a large domestic mobile handset manufacturer and one of the largest telecommunications equipment manufacturers in China, T&W Electronics, a major broadband terminal equipment and digital consumer electronic provider in China and TCL, one of the world’s leading mobile phone suppliers. Our two largest customers from the telecommunications equipment industry in terms of 2009 net revenue were ZTE and Wuhan Research Institute of Post & Telecommunications, a major telecommunications equipment manufacturer in China. Our customers in the industrial business end-market are mainly small and medium enterprises. During 2009, ZTE, T&W Electronics, Starnet Digital Technology, Wuhan Research Institute of Post & Telecommunications and TCL, accounted for 21.9%, 10.4%, 3.7%, 3.5% and 2.8% of our net revenue, respectively.
6
Table of Contents
As of December 31, 2009, our major customers by end-market were as follows:
| • | Digital Media Manufacturers—TCL, Starnet Digital Technology and ZTE. |
| • | Telecommunications Equipment Manufacturers—Huawei, ZTE and Wuhan Research Institute of Post & Telecommunications |
| • | Industrial Business—Small and medium enterprises |
In 2007, 2008 and 2009, our top 10 customers to whom we sold directly, including several contract manufacturers used by some of our major end-market customers, were as follows:
| 2009 | 2008 | 2007 | ||||||||||||||||
| Customer Name |
Net Revenue | Percentage of Net Revenue(%) |
Net Revenue | Percentage of Net Revenue(%) |
Net Revenue | Percentage of Net Revenue(%) |
||||||||||||
| (in millions, except for percentages) | ||||||||||||||||||
| ZTE |
RMB | 458.3 | 21.9 | % | RMB | 227.7 | 11.6 | % | RMB | 264.5 | 15.9 | % | ||||||
| T&W Electronics |
218.4 | 10.4 | 198.8 | 10.2 | 169.5 | 10.2 | ||||||||||||
| Starnet Digital Technology |
76.5 | 3.7 | * | * | * | * | ||||||||||||
| Wuhan Research Institute of Post & Telecommunications |
73.6 | 3.5 | 103.2 | 5.3 | 84.3 | 5.1 | ||||||||||||
| TCL |
57.8 | 2.8 | 63.1 | 3.2 | 39.2 | 2.4 | ||||||||||||
| Skyworth Digital |
51.5 | 2.5 | * | * | * | * | ||||||||||||
| COSHIP |
50.0 | 2.4 | 48.0 | 2.5 | * | * | ||||||||||||
| Yulong |
45.1 | 2.2 | * | * | * | * | ||||||||||||
| Allied Teleris |
36.0 | 1.7 | * | * | * | * | ||||||||||||
| Longcheer Communications |
27.4 | 1.3 | * | * | * | * | ||||||||||||
| Beijing Tianyu Communication Equipment |
* | * | 69.4 | 3.5 | * | * | ||||||||||||
| Young Poong Electronics |
* | * | 50.4 | 2.6 | 67.6 | 4.1 | ||||||||||||
| Accelink Technologies |
* | * | 33.7 | 1.7 | 49.5 | 3.0 | ||||||||||||
| Malata Group |
* | * | 30.1 | 1.5 | * | * | ||||||||||||
| Wuhan Fiberhome International Technologies |
* | * | 28.4 | 1.5 | * | * | ||||||||||||
| Huawei |
* | * | * | * | 60.6 | 3.6 | ||||||||||||
| Wuxi Zhongxing Optoelectronics |
* | * | * | * | 48.8 | 2.9 | ||||||||||||
| Oukexin Electronics |
* | * | * | * | 39.1 | 2.3 | ||||||||||||
| Soye Instrument |
* | * | * | * | 36.6 | 2.2 | ||||||||||||
| Total |
RMB | 1,094.6 | 52.4 | % | 852.8 | 43.6 | % | 859.7 | 51.7 | % | ||||||||
| * | Not a top 10 customer in the respective year. |
7
Table of Contents
The value of our technology solutions can be illustrated by specific examples of how we have worked closely with our customers and suppliers in leveraging our competitive position and unique business model to solidify and extend our existing business, as well as identify and capture new opportunities:
Applying our customized module design capabilities to new end-markets. We have leveraged our customized module design capabilities and our deep, multi-level customer relationships to follow our customers into new end-markets. Since 1995, we have been a provider of customized module design solutions for telecommunications equipment to ZTE, one of the largest telecommunications equipment manufacturers in China. ZTE first sought to enter the mobile handset market in China in 2000. Based on our working history with ZTE on telecommunications equipment solutions and on our proven design capabilities, ZTE selected us as a provider of customized module design solutions for their mobile handsets in 2000. Our total net revenue from ZTE was RMB458.3 million ($67.1 million) in 2009.
Suppliers
We develop our customized module design solutions based on technology components provided by key technology and other suppliers in our target end-markets. We work with a select list of more than 30 key suppliers, including:
| Supplier Name |
Product | |
| Broadcom |
Various products including integrated circuit and Bluetooth | |
| Matsushita |
Switches, connectors, relay | |
| Sandisk |
Flash memory | |
| Freescale Semiconductor |
Microcontrollers | |
| Atmel |
Microcontrollers | |
8
Table of Contents
In 2007, 2008 and 2009, based on cost, our major suppliers from whom we purchase components sold to our customers were as follows:
| 2009 | 2008 | 2007 | ||||
| Supplier Name |
Percentage of Cost of sales (%) |
Percentage of Cost of sales (%) |
Percentage of Cost of sales (%) | |||
| Broadcom |
36.3 | 31.7 | 28.6 | |||
| Matsushita |
10.1 | 7.5 | 10.0 | |||
| Sandisk |
9.7 | * | * | |||
| Freescale Semiconductor |
9.4 | * | * | |||
| Foxconn |
* | 12.6 | * | |||
| JDS Uniphase |
* | 5.1 | 9.1 |
| * | Not a significant supplier in the respective year. |
We have established long-standing relationships with our key suppliers. For example, we have worked with Matsushita since our inception in 1995. While we depend on our key suppliers, we believe that we can find alternate suppliers within a reasonable amount of time without significantly altering our proposed solutions. For further information concerning our reliance on Broadcom, Matsushita and other key suppliers, see “Risk factors—Reliance on our suppliers, with whom we often do not have long-term supply agreements, makes us vulnerable to the loss of one or more key suppliers or the delivery capabilities of our suppliers.”
Development of collaborative relationships with key component suppliers. We have expanded our business by collaborating with our key component suppliers and incorporating our suppliers’ technology components into our module reference designs to provide customized solutions for different OEM customers. For example, demand for flash memory integrated circuits has increased as the need for high volume storage has grown rapidly due to the more advanced data services offered over wireless networks onto mobile handsets. We developed a storage module by incorporating our supplier’s flash memory products, customizable for each customer according to their varying design criteria. Through this approach, we were able to customize each module to provide optimal functionality to a variety of OEM customers. Our ability to bring this solution to each of these OEM customers:
| • | allow our customers to optimize their mobile handsets by incorporating flash memory technology in a fast and cost-efficient fashion; |
| • | allow this supplier to penetrate the China market and specific OEM customers, without having to design and manufacture separate flash memory products; and |
| • | reinforce and broaden our relationship with this key component supplier. |
9
Table of Contents
Sales and Marketing
We generate sales of our customized module design solutions through our direct sales force, consisting of approximately 161 sales directors, account managers and sales support staff as at December 31, 2009. Our sales directors are responsible for establishing sales strategy and setting objectives for specific customer accounts. Each account manager is dedicated to a specific customer account and is responsible for the day-to-day management of that customer relationship. Account managers work closely with customers and, in many cases, provide on-site support. Account managers often attend our customers’ internal meetings related to production, engineering design and quality assurance to ensure that our customers’ expectations are appropriately interpreted and communicated to our operations group, and ultimately met or exceeded throughout the design process. Account managers also work with our customers to identify and meet their cost and design-to-delivery cycle time objectives.
Our new business development account managers initiate and maintain long-term, multi-level relationships with customer accounts and work closely with customers on new business opportunities throughout the design-to-delivery cycle.
Competition
We believe that the principal competitive factors affecting the markets for our customized module design solutions and engineering services include:
| • | understanding our customers’ time-to-market, technology and cost requirements; |
| • | access to technology providers; |
| • | pricing and efficiency; |
| • | design capabilities; |
| • | customer relationships; and |
| • | technical support. |
We believe that we compare favorably with respect to each of these criteria. In addition, while we do not believe that there are any direct competitors of any meaningful size that operate using the same business model as ours, we face indirect competition from the following:
Other technology component suppliers. For each project, we work with suppliers to compete against other technology component suppliers. Consequently, we indirectly compete against our suppliers’ competitors. For example, by working with JDS Uniphase, we compete indirectly against companies such as Avanex and Bookham in supplying optical transmission module designs.
Component manufacturers and distributors. We compete indirectly with component manufacturers such as Epcos, and component distributors such as Arrow Electronics, Inc. and Avnet, Inc., which may seek to expand their product/service offerings to include customized module design solutions. We believe that these large component manufacturers and distributors have not historically engaged in customized module design, and therefore we believe that it is not one of their core competencies.
We may also face indirect competition from customers and suppliers. Currently many of our customers and suppliers do not focus on customized module design. If our customers or suppliers decide to devote more time and resources to in-house module design, the demand for our solutions may decline. In addition, our customers may change their procurement strategy or decide to rely on us primarily for component delivery and not for integration or design work. Similarly, component suppliers may also seek to offer their component products or modules incorporating key components from our solutions directly to our customers.
10
Table of Contents
Intellectual Property
We currently have five issued utility patents relating to our lightning surge protection for network products and a ceramic-to-steel adhesive application and a patent on algorism for quality of services, or QoS, relating to our digital media application. Historically, we have derived a small percentage of our net revenue from our proprietary products.
Employees
As of December 31, 2009, we had approximately 485 employees, 237 in research and development, 161 in sales and marketing and 87 in administrative positions.
We make contributions for all of our employees in the PRC to retirement benefits based on their salaries and length of service upon retirement in accordance with a PRC government-managed retirement plan. The mandatory insurance schemes in Shenzhen, PRC includes a pension scheme, medical insurance, work-related insurance and unemployment insurance. The PRC government is directly responsible for the payments of benefits to these retired employees. We are required to make contributions to the government-managed retirement plan at specified rates of the salaries, bonuses and certain allowances of our employees, up to a maximum amount specified by the local government from time to time.
Our future success will depend, in part, on our ability to continue to attract, retain and motivate highly qualified technical, marketing and management personnel, for whom competition is intense. Our employees are not covered by any collective bargaining agreement and we have never experienced a work stoppage. We believe we enjoy good relations with our employees.
11
Table of Contents
| ITEM 1A. | RISK FACTORS |
In addition to the other information in this Form 10-K, readers should carefully consider the following important factors. These factors, among others, in some cases have affected, and in the future could affect, our financial condition and results of operations and could cause our future results to differ materially from those expressed or implied in any forward-looking statements that appear in this on Form 10-K or that we have made or will make elsewhere.
Risks Related to Our Business
Our operating results fluctuate from quarter to quarter.
Our quarterly revenue, income and other operating results have fluctuated in the past and may fluctuate significantly in the future due to a number of factors, including the following:
| • | the ability of our suppliers to meet our supply requirements; |
| • | the cancellation of large orders; |
| • | competitive pressures; |
| • | the time required for research and development; |
| • | changing design requirements resulting from rapid technology shifts; and |
| • | industry trends impacting the overall market for our customers’ end-products. |
As a result of these and other factors, our results of operations may vary on a quarterly basis and net revenue may be adversely affected from period to period. Our results of operations for a particular quarter may not be indicative of our future performance. If our operating results in a quarter fall below our expectations or the expectations of market analysts or investors, the price of our common stock is likely to decrease.
Our operating results are substantially dependent on development of new customized module design solutions.
We may be unable to develop new customized module design solutions in a timely or cost-efficient manner, and these new solutions may fail to meet the requirements of our customers’ end-markets. If we fail to develop new solutions that help our customers respond to competitive pressures, achieve shorter time-to-market or broaden and improve their product offerings, we will lose business and our results of operations will be materially and adversely affected.
If our customers do not accept our proposed customized module design solutions or do not purchase from us the specified components contained in the proposed module reference design, our net revenue will be adversely affected.
While many of our proposed customized module design solutions are accepted by our customers, there is no obligation for customers to accept our proposed solutions. We dedicate personnel, management and financial resources to research and development and technical support in developing new customized module design solutions for our customers. The time frames for most research and development projects typically range from two to 18 months. For our product sales segment, because we do not charge a design fee, but rather generate revenue through the resale of specified components contained in our proposed reference designs, if our customers do not accept our proposed designs, we will fail to capitalize on the invested resources, time and effort that we expended on a project. Furthermore, our customers typically make purchases on a purchase order basis. Prior to submission of a purchase order, our customers are not obligated to purchase from us any quantity of specific components that we propose to sell in our proposed module reference design. Our customers may cancel or defer their purchase orders on short notice without significant penalty. Even if a customer accepts our proposed module reference design, the customer could bypass us and contract with our competitors or possibly our suppliers directly for the purchase of the specific components we otherwise had proposed to sell. The failure to accept our proposed module reference design, the loss of ongoing business from our customers or the transition away from us in favor of direct purchases from our competitors or suppliers could each result in our failure to realize potentially significant net revenue.
12
Table of Contents
Reliance on our suppliers, with whom we often do not have long-term supply agreements, makes us vulnerable to the loss of one or more key suppliers or the delivery capabilities of our suppliers.
We typically rely on a limited number of key suppliers, and many customized module design solutions that we develop are designed around technology components provided by our suppliers. We typically do not have long-term supply agreements or other forms of exclusive arrangements with our suppliers. In 2009, for example, Broadcom, Matsushita, Sandisk and Freescale Semiconductor, accounted for approximately 36.3%, 10.1%, 9.7% and 9.4%, respectively, of our cost of sales. Furthermore, although we deal with approximately ten different divisions within Matsushita, purchases of relays and connectors from Matsushita accounted for a substantial portion of our cost of sales attributable to Matsushita. If we lose a key supplier or a supplier reduces the quantity of products it sells to us, does not maintain a sufficient inventory level of products required by us or is otherwise unable to meet our demand for its components, we may have to expend significant time, effort and other resources to locate a suitable alternative supplier and secure replacement components. For example, on one prior occasion, one of our key suppliers experienced an interruption in its production capacity due to a relocation of its production facilities, which resulted in its inability to meet our quarterly supply requirements. If suitable replacement components are unavailable, we may be forced to redevelop certain of our solutions, which ultimately may not be accepted by our customers.
Also, if our suppliers fail to introduce new products that keep up with new technologies, they may be surpassed by other suppliers entering the market with whom we may not have existing relationships. The costs and delays related to finding new suppliers or redeveloping solutions could significantly harm our business.
If we fail to attract and retain key personnel, particularly our chief executive officer, our business will be materially impaired and our financial condition and results of operations will suffer.
Our business greatly relies on the continued services of Jeffrey Kang, our principal shareholder and chief executive officer. Many relationships with our key suppliers and key customers have been developed by and continue to be maintained by Mr. Kang. Our future success will depend to a significant degree upon the performance and contribution of Mr. Kang and other members of our senior management team in areas including sales, research and development, information technology and finance. Therefore, our business and results of operations may be materially and adversely affected if Mr. Kang or another member of our senior management team leaves us, which they may do at any time. In addition, we will incur additional expenses to recruit and develop senior management members if one or more of our key employees are unwilling or unable to continue his or her employment with us. We do not maintain any life insurance covering our senior management or any of our key employees.
Our future success also depends on our ability to identify, attract, hire, train, retain and motivate highly-skilled personnel. If we cannot attract and retain the personnel we require at a reasonable cost, our cost of goods sold will increase and the profitability of our business could be negatively affected. Our business is especially dependent on sales, marketing, research and development, and services personnel. Competition in China for executive-level and skilled technical and sales and marketing personnel is strong, and recruiting, training, and retaining qualified key personnel are important factors affecting our ability to meet our growth objectives. Should key employees leave our company, we may lose both an important internal asset and net revenue from customer projects in which those employees were involved.
13
Table of Contents
Loss of key customers may adversely impact our net revenue.
We generate the majority of our net revenue from a small number of key customers, and we anticipate that a relatively small number of key customers will continue to account for a significant portion of our net revenue in the foreseeable future, particularly in the telecommunications equipment market. In 2009, our sales to ZTE, T&W and Starnet Digital Technology accounted for approximately 21.9%, 10.4%, and 3.7% respectively, of our net revenue. Sales to our top 10 customers represented approximately 52.4% of our net revenue in 2009. Should we lose, receive reduced orders from, or experience any adverse change in our relationship with any of our key customers, or should they decide to use solutions provided by other companies, we will suffer a substantial loss in net revenue.
The end-markets in which we operate are highly competitive and fragmented. Competition may intensify in the future, and if we fail to compete effectively, our business will be harmed.
Pressures from current or future competitors could cause our solutions to lose market acceptance or require us to significantly reduce our sales prices to keep and attract customers. Our competitors often have longer operating histories, stronger customer and supplier relationships, larger technical staffs and sales forces, and/or greater financial, technical and marketing resources than we do. Although we believe that there are no direct competitors of any meaningful size who operate using the same business model as ours, we face indirect competition from:
| • | Other technology component suppliers. For each project, we work with one enabling technology component supplier to compete against other enabling technology component suppliers. Consequently, we indirectly compete against our suppliers’ competitors. For example, by working with JDS Uniphase, we compete against companies such as Avanex Corp. and Bookham Inc. in supplying optical transmission module design solutions. |
| • | Component manufacturers and distributors. We compete indirectly with component manufacturers such as Epcos AG, and component distributors such as Arrow Electronics, Inc. and Avnet Inc., which may seek to expand their product/service offerings to include customized module design solutions. |
We may also face indirect competition from customers and suppliers. Currently many of our customers and suppliers do not focus on customized module design. If our customers or suppliers decide to devote more time and resources to in-house module design, the demand for our solutions may decline. In addition, our customers may change their procurement strategy or decide to rely on us primarily for component delivery and not for integration or design work. Similarly, component suppliers may also seek to offer their component products or modules incorporating key components from our solutions directly to our customers. The loss of customers for our customized module design solutions as a result of these competitive factors would have a material adverse effect on our business, financial condition and results of operations.
As we expand our business, we intend to develop new customized module design solutions and technological capabilities in end-markets where we do not currently have extensive experience or technological capability. Failure to develop or execute this growth strategy will have a material adverse effect on our net revenue.
Prior to 2005, we derived substantially all of our net revenue from our customized module design solutions provided to customers in the mobile handset and telecommunications equipment end-markets. In 2005, we began targeting the digital media end-market. In 2006 and 2007, we began our own business of providing engineering service and software design, respectively. In 2008, we also started targeting the industrial business end-market. Our success in the digital media end-market will depend, in significant part, on our ability to continue to develop the necessary technological capability and to leverage our existing customer base that has expanded into this end-market. If we are unable to quickly develop technological expertise, increase our research and development capabilities and leverage our customer base as anticipated, our return on our investment with respect to these efforts may be lower than anticipated and our operating results may suffer. Finally, our customer base may not respond to our efforts to expand our proprietary capabilities and may be unwilling to utilize these enhanced capabilities.
14
Table of Contents
We may be unable to manage rapid growth and a changing operating environment, which could adversely affect our ability to serve our customers and harm our business.
We have experienced rapid growth over the last five years, with our net revenue increasing from RMB866.3 million in 2005 to RMB2,096.2 million ($307.1 million) in 2009. Our number of employees has increased from approximately 30 in 2001 to 485 as at December 31, 2009. We have limited operational, administrative and financial resources, which may be inadequate to sustain our current growth rate. If we are unable to manage our growth effectively, the quality of our solutions could deteriorate and our business may suffer. As our customer base increases and we enter new end-markets, we will need to:
| • | increase our investments in personnel, research and development capabilities, facilities and other operational areas; |
| • | continue training, motivating and retaining our existing employees, and attract and integrate new qualified employees; |
| • | develop and improve our operational, financial, accounting and other internal systems and controls; and |
| • | take enhanced measures to protect any proprietary technology or technological capability we develop. |
Any failure to manage our growth successfully could distract management’s attention and result in our failure to serve our customers and harm our business.
We face risks associated with future investments or acquisitions.
An important component of our growth strategy is to invest in or acquire businesses complementary to ours that will enable us to expand the solutions we offer to our existing target customer base, and that will provide opportunities to expand into new markets. We may be unable to identify suitable investment or acquisition candidates or to make these investments or acquisitions on a commercially reasonable basis, if at all. If we complete an investment or acquisition, we may not realize the anticipated benefits from the transaction.
Integrating an acquired company or technology is complex, distracting and time consuming, as well as a potentially expensive process. The successful integration of an acquisition would require us to:
| • | integrate and retain key management, sales, research and development, and other personnel; |
| • | incorporate the acquired products or capabilities into our offerings both from an engineering and sales and marketing perspective; |
| • | coordinate research and development efforts; |
| • | integrate and support pre-existing supplier, distribution and customer relationships; and |
| • | consolidate duplicate facilities and functions and combine back office accounting, order processing and support functions. |
The geographic distance between the companies, the complexity of the technologies and operations being integrated and the disparate corporate cultures being combined may increase the difficulties of combining an acquired company or technology. Acquired businesses are likely to have different standards, controls, contracts, procedures and policies, making it more difficult to implement and harmonize company-wide financial, accounting, billing, information and other systems. Management’s focus on integrating operations may distract attention from our day-to-day business and may disrupt key research and development, marketing or sales efforts.
15
Table of Contents
Our acquisition strategy also depends on our ability to obtain necessary government approvals that may be required, as described under “—Risks Related to Doing Business in China—Our acquisition strategy may be subject to SDRC approval under legislation enacted in 2005.”
Our competitive position could decline if we are unable to obtain additional financing to acquire businesses or technologies that are strategic for our success, or otherwise execute our business strategy.
We believe that our current cash will be sufficient to fund our working capital and capital expenditure requirements for at least the next twelve months. However, we may need to raise additional funds to support more rapid expansion, respond to competitive pressures, acquire complementary businesses or technologies or respond to unanticipated requirements. We cannot assure you that additional funding will be available to us in amounts or on terms acceptable to us. If sufficient funds are not available or are not available on acceptable terms, our ability to fund our expansion, take advantage of acquisition opportunities, develop or enhance our services or products, or otherwise respond to competitive pressures would be significantly limited.
If appropriate opportunities arise, we intend to acquire businesses, technologies, services or products that we believe are strategic for our success. Our competitive position could decline if we are unable to identify and acquire businesses or technologies that are strategic for our success in this market.
The unauthorized use of our module design solutions could have a material adverse impact on our net revenue.
Our in-house design engineering teams develop our customized module design solutions. We typically do not have patent or other intellectual property protection for our solutions, nor do we typically have non-disclosure or confidentiality agreements with most of our suppliers or customers to keep our design specifications confidential. Suppliers or other competitors may attempt to circumvent us by selling products or providing module design solutions directly to our customers. The unauthorized use by our suppliers or other competitors of our module design solution specifications or other intellectual property in the future would result in a substantial decrease in out net revenue. The validity, enforceability and scope of protection of intellectual property in China is uncertain and still evolving, and PRC laws may not protect intellectual property rights to the same extent as the laws of some other jurisdictions, such as the United States. Moreover, litigation may be necessary in the future to enforce any intellectual property rights we may establish or acquire in the future, which could result in substantial costs and diversion of our resources, and have a material adverse effect on our business, financial condition and results of operations.
16
Table of Contents
We became a public company through a share exchange with a non-operating public shell company, where we were the accounting acquirer and assumed all known and unknown potential liabilities of our predecessor entity.
Our July 2004 share exchange with Trident was accounted for as a reverse merger in which Cogo Cayman was deemed the accounting acquirer and Trident, which was originally incorporated in 1917, was the legal acquirer. We have retained all the known and unknown liabilities of Trident. There may be other potential liabilities about which we are not yet aware, see “Item 3. Legal proceedings” for additional details.
We depend upon contractual agreements with the two shareholders of Shenzhen Comtech in conducting our business through Shenzhen Comtech and Shanghai E&T and receiving payments, which may not be as effective in providing operational control as direct ownership and may be difficult to enforce. Further, if the PRC government finds these contractual agreements violate or conflict with PRC governmental regulations, our business would be materially adversely affected.
At the time of its incorporation, foreign shareholding in a trading business such as Shenzhen Comtech could not exceed 65%. With subsequent PRC deregulation, foreign ownership of such a trading business can now reach 100%, and approval of foreign ownership of companies in the PRC engaged in commodity trading businesses—which includes agency trade, wholesale, retail and franchise operations is now delegated to local government agencies of the PRC Ministry of Commerce. In order to exercise control over Shenzhen Comtech (a PRC operating company legally permitted to engage in a commodity trading business), without direct shareholding by us (a U.S.-listed company and therefore a foreign-invested entity), Honghui Li, our vice president, and Huimo Chen, the mother of our principal shareholder and chief executive officer, Jeffrey Kang, hold 99% and 1%, respectively, of the equity interests of Shenzhen Comtech, and through contractual agreements with us hold such equity interests exclusively for the benefit of our 100% directly owned subsidiary, Comtech China. Shenzhen Comtech, in turn owns a 60% equity interest in another of our PRC operating companies, Shanghai E&T, with the other 40% being held by Comtech China through trust agreements. Under the trust agreements, Shenzhen Comtech owns a 35% equity interest in Shanghai E&T for the benefit of Comtech China and Honghui Li owns a 5% equity interest in Shanghai E&T for the benefit of Comtech China. While we do not have any equity interest in Shenzhen Comtech, through these contractual agreements, we enjoy voting control and are entitled to the economic interests associated with their equity interest in Shenzhen Comtech. For additional details regarding these contractual agreements, see “Item 13. Certain Relationships and Related Transactions, and Director Independence.” These contractual agreements may not be as effective in providing us with control over Shenzhen Comtech as direct ownership because we rely on the performance of Honghui Li and Huimo Chen under the agreements. If they fail to perform their respective obligations under the agreements, we may have to incur substantial costs and resources to enforce such agreements and may not be able to do so in any case. Further, the profits of Shenzhen Comtech may not be able to be remitted outside the PRC due to foreign exchange controls. Also, we must rely on legal remedies under applicable law, which may not be as effective as those in the United States. Because we rely on Shenzhen Comtech and Shanghai E&T in conducting our business operations in China, the realization of any of these risks relating to our corporate structure could result in a material disruption of our business, diversion of our resources and the incurrence of substantial costs, any of which could materially and adversely affect our operating results and financial condition.
In the opinion of our PRC counsel, the ownership structure of Shenzhen Comtech and the contractual agreements among Comtech China, Honghui Li and Huimo Chen do not violate existing PRC laws, rules and regulations. There are, however, substantial uncertainties regarding the interpretation and application of current or future PRC laws and regulations, including but not limited to the laws and regulations governing the validity and enforcement of these contractual agreements. Accordingly, we cannot assure you that PRC regulatory authorities will not determine that these contractual agreements violate or conflict with PRC laws or regulations.
If we or our PRC operating company, Shenzhen Comtech, are found to violate any existing or future PRC laws or regulations, the relevant regulatory authorities will have broad discretion in dealing with such violation, which would cause significant disruptions to our business operations or render us unable to conduct our business operations and may materially adversely affect our business, financial condition and results of operations.
17
Table of Contents
Risks Related to Our Industry
Our inability to respond quickly and effectively to rapid technological advances and market demands would adversely impact our competitive position and our results of operations.
Historically, we have focused on the digital media and telecommunications equipment end-markets in China. The digital media and telecommunications equipment end-markets are characterized by rapid technological advances, intense competition, frequent introduction of new products and services and consumer demand for greater functionality, lower costs, smaller products and better performance. We must constantly seek out new products and develop new solutions to maintain in our portfolio. We have experienced and will continue to experience some solution design obsolescence. We expect our customers’ demands for improvements in product performance to increase, which means that we must continue to improve our design solutions and develop new solutions to remain competitive and grow our business. Our failure to compete successfully for customers will result in price reductions, reduced margins or loss of market share, any of which would harm our business, results of operations and financial condition.
A large portion of our net revenue currently comes from sales to manufacturers in the cyclical digital media and telecommunications equipment end-markets and cyclical downturns could harm our operating results.
The digital media and telecommunications equipment end-markets in particular are highly cyclical and have experienced severe and prolonged downturns, often in connection with maturing product cycles and declines in general economic conditions. These downturns have been characterized by diminished product demand, production overcapacity, high inventory levels and accelerated erosion of average selling prices. The impact of slowing end-customer demand may be compounded by higher than normal levels of equipment and inventories among our customers and our customers’ adjustments in their order levels, resulting in increased pricing pressure.
In addition, our recent and significant growth in net revenue resulted, in large part, from the high growth in sales of industrial applications products in China. These domestic manufacturers may not continue to grow their sales at historical levels, if at all. The stagnation or reduction in overall demand for industrial applications products would materially affect our results of operations and financial condition.
The digital media end-market is characterized by a short product lifecycle, making time-to-market and sensitivity to customer needs critical to our success and our failure to respond will harm our business.
Mobile handsets in the digital media end-market typically have a lifecycle of approximately 6 to 12 months before the technology becomes obsolete. Time-to-market, both with respect to our customers’ ability to supply consumers with timely and marketable products and our ability to provide our customers with a wide array of latest generation customized module design solutions, is critical to our success. As design cycles in the industry shorten, we face logistical challenges in providing our solutions in an increasingly shorter timeframe. If we are unable to respond to the shortened lifecycles and time-to-market, our business will suffer.
The global financial crisis could harm our product demands and adversely affect our results of operations.
Due to difficult market conditions, the level of consumer and information technology spending has declined and the demand for our mobile handsets business since the third quarter of 2008 has decreased. Furthermore, we may need to strategically lower our pricing in order to grow our business in a slowing economic environment.
18
Table of Contents
Risks Related to Doing Business in China
There are substantial risks associated with doing business in China, including those set forth in the following risk factors.
Our operations may be adversely affected by China’s economic, political and social conditions.
Substantially all of our operations and assets are located in China and substantially all of our net revenue are derived from our operations in China. Accordingly, our results of operations and future prospects are subject to economic, political and social developments in China. In particular, our results of operations may be adversely affected by:
| • | changes in China’s political, economic and social conditions; |
| • | changes in policies of the government or changes in laws and regulations, or the interpretation of laws and regulations; |
| • | changes in foreign exchange regulations; |
| • | measures that may be introduced to control inflation, such as interest rate increases; and |
| • | changes in the rate or method of taxation. |
The PRC economy has historically been a planned economy. The majority of productive assets in China are still owned by various levels of the PRC government. In recent years the government has implemented economic reform measures emphasizing decentralization, utilization of market forces in the development of the economy and a high level of management autonomy. Such economic reform measures may be inconsistent or ineffectual, and we may not benefit from all such reforms. Furthermore, these measures may be adjusted or modified, possibly resulting in such economic liberalization measures being applied inconsistently from industry to industry, or across different regions of the country.
In the past twenty years, China has been one of the world’s fastest growing economies in terms of gross domestic product, or GDP. This growth may not be sustainable. Moreover, a slowdown in the economies of the United States, the European Union and certain Asian countries may adversely affect economic growth in China which depends on exports to those countries. Our financial condition and results of operations, as well as our future prospects, would be materially and adversely affected by an economic downturn in China.
Our financial results benefit from tax concessions granted by the PRC government, the change to or expiration of which would materially change our results of operations.
Our results of operation may be adversely affected by changes to or expiration of tax holiday and preferential tax concessions that some of our PRC operating companies currently enjoy or expect to enjoy in the future. Prior to January 1, 2008, the statutory tax rate generally applicable to Chinese companies is 33%. As a result of tax holiday and preferential tax rate incentives, our operations have been subject to relatively low tax liabilities. Tax that would otherwise have been payable without preferential tax treatment amounted to approximately RMB35.7 million ($5.2 million) in 2009. For additional details regarding these tax incentives, please see “Item 7. Management’s discussion and analysis of financial condition and result of operations—Taxation.”
Tax laws in China are subject to interpretations by relevant tax authorities. The preferential tax treatment may not remain in effect or may change, in which case we may be required to pay the higher income tax rate generally applicable to Chinese companies, or such other rate as is required by the laws of China.
19
Table of Contents
On March 16, 2007, the Fifth Plenary Session of the Tenth National People’s Congress passed the Corporate Income Tax law (the “CIT law”), which unified the income tax rate to 25% for all companies. The CIT law was effective as of January 1, 2008. The CIT law provides a five-year transitional period from its effective date for those companies which were established before March 16, 2007 and which were entitled to a preferential lower tax rate under the then effective tax laws or regulations, as well as grandfathering tax holidays. The transitional tax rates are 18%, 20%, 22%, 24% and 25% for 2008, 2009, 2010, 2011 and 2012 onwards, respectively (“the transitional tax rates”). For the Shenzhen subsidiaries that were entitled to tax holidays of the two-year tax exemption followed by three-year 50% tax reduction from the first profit making year after offsetting accumulated tax losses, they are entitled to continue the tax holiday until they expire. For the entities which had not commenced their respective tax holiday as of December 31, 2007, the CIT law requires the tax exemption period to begin on January 1, 2008.
The telecommunications equipment market is extensively regulated in China.
The telecommunications equipment end-market accounted for 25.0% of our net revenue in 2009. China’s telecommunications industry is heavily regulated. Changes in regulations affecting sales of these customers could negatively affect the telecommunications equipment end-market for our solutions, which will materially harm our business.
PRC government control of currency conversion may affect our ability to meet foreign currency obligations.
Because the majority of our net revenue are denominated in Renminbi, any restrictions on currency exchange may limit our ability to use revenue generated in Renminbi to meet our foreign currency obligations, such as settling the purchase of materials which may be denominated in U.S. dollars. The principal regulation governing foreign currency exchange in China is the Foreign Currency Administration Rules (1996), or the Rules, as amended. Under the Rules, once certain procedural requirements are met, Renminbi is convertible for current account transactions, including trade and service-related foreign exchange transactions and dividend payments, but not for capital account transactions, including direct investment, loans or investments in securities outside China, without prior approval of the PRC State Administration of Foreign Exchange (“SAFE”), or its local counter-parts. Since a significant amount of our future revenues will continue to be denominated in Renminbi, any existing and future restrictions on currency exchange may limit our ability to utilize revenue generated in China to fund our business activities outside of China, if any, or expenditures denominated in foreign currencies, or our ability to meet our foreign currency obligations, which could have a material adverse effect on our business, financial condition and results of operations. We cannot be certain that the PRC regulatory authorities will not impose more stringent restrictions on the convertibility of Renminbi with respect to foreign exchange transactions.
PRC regulations relating to offshore investment activities by PRC residents may increase the administrative burden we face and create regulatory uncertainties that could restrict our overseas and cross-border investment activity, and a failure by our shareholders who are PRC residents to make any required applications and filings pursuant to such regulations may prevent us from being able to distribute profits and could expose us and our PRC resident shareholders to liability under PRC law.
In October 2005, SAFE promulgated regulations that require PRC residents and PRC corporate entities to register with and obtain approvals from relevant PRC government authorities in connection with their direct or indirect offshore investment activities. These regulations apply to our shareholders who are PRC residents in connection with our prior and any future offshore acquisitions.
20
Table of Contents
The SAFE regulation required registration by March 31, 2006 of direct or indirect investments previously made by PRC residents in offshore companies prior to the implementation of the Notice on Issues Relating to the Administration of Foreign Exchange in Fund-Raising and Reverse Investment Activities of Domestic Residents Conducted via Offshore Special Purpose Companies on November 1, 2005. If a PRC shareholder with a direct or indirect stake in an offshore parent company fails to make the required SAFE registration, the PRC subsidiaries of such offshore parent company may be prohibited from making distributions of profit to the offshore parent and from paying the offshore parent proceeds from any reduction in capital, share transfer or liquidation in respect of the PRC subsidiaries, and may be prohibited from receiving capital contributions, shareholder loan or other payments from our offshore parent company, and may be further prohibited from making payments to or receiving payments from other overseas entities. Furthermore, failure to comply with the various SAFE registration requirements described above could result in liability under PRC law for foreign exchange evasion.
Some of our PRC resident shareholders may not have completed their registration with SAFE under the SAFE regulation, in part, due to confusion over the application of the SAFE regulation to our company. For example, in mid-2006, some of our PRC resident shareholders attempted to register with SAFE in Shenzhen under predecessor regulations to the SAFE regulation, but were informed by Shenzhen SAFE that the regulation did not apply to them. These PRC resident shareholders did not realize they might be required to register under the new SAFE regulations. Further, even if our PRC resident shareholders do apply for SAFE registration, they may not be able to obtain such registration at the discretion of SAFE due to various reasons including their failure to comply with the retroactive SAFE registration requirement prior to March 31, 2006, the statutorily prescribed deadline for compliance. The failure or inability of our PRC resident shareholders to obtain any required approvals or make any required registrations may subject us to fines and legal sanctions, prevent us from being able to make distributions or pay dividends or to receive capital contribution or shareholder loans, as a result of which our business operations and our ability to distribute profits to you or capitalize our operation in China could be materially and adversely affected.
In December 2006, the People’s Bank of China promulgated the Administrative Measures of Foreign Exchange Matters for Individuals, or the PBOC Regulation, setting forth the respective requirements for foreign exchange transactions by PRC individuals under either the current account or the capital account. In January 2007, SAFE issued implementing rules for the PBOC Regulation, which, among other things, specified approval requirements for certain capital account transactions such as a PRC citizen’s participation in the employee stock ownership plans or stock option plans of an overseas publicly-listed company. On March 28, 2007, SAFE promulgated the Application Procedure of Foreign Exchange Administration for Domestic Individuals Participating in Employee Stock Holding Plan or Stock Option Plan of Overseas-Listed Company, or the Stock Option Rule. Under the Stock Option Rule, PRC citizens who are granted stock options by an overseas publicly-listed company are required, through a PRC agent or PRC subsidiary of such overseas publicly-listed company, to register with SAFE and complete certain other procedures. We and our PRC employees who have been granted stock options will be subject to the Stock Option Rule when our company becomes an overseas publicly-listed company. If we or our PRC optionees fail to comply with these regulations, we or our PRC optionees may be subject to fines and legal sanctions.
Our acquisition strategy may be subject to SDRC approval under legislation enacted in 2004.
State Development and Reform Commission, or SDRC, promulgated a regulation in 2004 that requires SDRC approval in connection with direct or indirect offshore investment activities by individuals who are PRC residents and PRC corporate entities. This regulation may apply to our future offshore or cross-border acquisitions, as well as to the equity interests in offshore companies held by our PRC shareholders who are considered PRC residents. We intend to make all required application and filings, and will require the shareholders of the offshore entities in our corporate group who are considered PRC residents to make the application and filings, as required under the regulation and under any implementing rules or approval practices that may be established under this regulation. However, because this regulation lacks implementing rules, approval precedents or reconciliation with other approval requirements, it remains uncertain how this regulation, and any future legislation concerning offshore or cross-border transactions, will be interpreted and implemented by the relevant government authorities. The approval criteria by SDRC agencies for outbound investment by PRC residents are not provided under this regulation or other SDRC regulations. Accordingly, we cannot provide any assurances that we will be able to comply with, qualify under or obtain any approval as required by this regulation or other related legislations. Our failure or the failure of our PRC resident shareholders to obtain SDRC approvals may restrict our ability to acquire a company outside of China or use our entities outside of China to acquire or establish companies inside of China, which could negatively affect our business and future prospects.
21
Table of Contents
PRC laws and our corporate structure may restrict our ability to receive dividends and payments from, and transfer funds to, our PRC operating companies, which may negatively affect our results of operations and restrict our ability to act in response to changing market conditions.
Substantially all of our operations are conducted through our PRC operating companies. The ability of our PRC operating companies to make dividends and other payments to us may be restricted by factors such as changes in applicable foreign exchange and other laws and regulations. For example, under the regulations discussed above, the foreign exchange activities of our present or prospective PRC subsidiaries are conditioned upon the compliance with the SAFE registration requirements by the shareholders of our offshore entities who are PRC residents. Failure to comply with these SAFE registration requirements may substantially restrict or prohibit the foreign exchange inflow to and outflow from our PRC subsidiaries, namely Comtech Communications and Comtech Software, including, remittance of dividends and foreign-currency-denominated borrowings by these PRC subsidiaries. In addition, our PRC operating companies are required, where applicable, to allocate a portion of their net profit to certain funds before distributing dividends, including at least 10% of their net profit to certain reserve funds until the balance of such fund has reached 50% of their registered capital. These reserves can only be used for specific purposes, including making-up cumulative losses of previous years, conversion to equity capital, and application to business expansion, and are not distributable as dividends. Our PRC operating companies are also required, where applicable, to allocate an additional 5% to 10% of their net profits to the common welfare fund. The net profit available for distribution from our PRC operating companies is determined in accordance with generally accepted accounting principles in China, which may materially differ from a determination performed in accordance with Generally Accepted Accounting Principles (United States) (“U.S. GAAP”). As a result, we may not receive sufficient distributions or other payments from these entities to enable us to make dividend distributions to our shareholders in the future, even if our U.S. GAAP financial statements indicate that our operations have been profitable. For additional details regarding the taxation risk of dividend distributions from our PRC operating companies, please see “Risk factors – Our global income and your capital gain may be subject to PRC tax under the new PRC tax law, which may have an effect on our results of operations and your investments, respectively.”
We do not directly own the equity interest in Shenzhen Comtech, which accounted for approximately 2.2% of our net revenue in 2009, or Shanghai E&T, which is owned 60% by Shenzhen Comtech and 40% by Comtech China through contractual agreements with Shenzhen Comtech and Honghui Li respectively, and which accounted for approximately 2.8% of our net revenue in 2009. Honghui Li and Huimo Chen, the shareholders of Shenzhen Comtech, have contractually agreed, among others things, to apply all dividends or other payments they receive from Shenzhen Comtech to payments to our 100% directly owned subsidiary, Comtech China, or its designated entities, for valid and valuable consideration and to the extent permitted by applicable PRC law, including PRC foreign exchange law. PRC law and regulatory requirements would currently restrict the ability of the shareholders of Shenzhen Comtech, based solely upon the contractual agreement, to directly apply the dividends or other payments they receive from Shenzhen Comtech in U.S. dollars to payments to Comtech China or in Renminbi to Comtech China’s designated entities in China. For example, the PRC foreign exchange authorities would have discretion to review the adequacy of the consideration given in exchange for the application of any dividends or payments from Shenzhen Comtech to Comtech China. If Honghui Li and Huimo Chen fail to apply such dividends or other payments received from Shenzhen Comtech, which might include profit distributions from Shanghai E&T to Shenzhen Comtech, to payments to Comtech China or its designated entities, our financial condition would be negatively affected. Apart from the dividend distribution from our PRC subsidiaries to us, the transfer of funds from our company to our PRC operating companies, either as a shareholder loan or as an increase in registered capital or otherwise, is subject to registration or approval with or by PRC governmental authorities, including the relevant administration of foreign exchange and/or other relevant examining and approval authorities. These limitations on the free flow of funds between us and our PRC operating companies may restrict our ability to act in response to changing market conditions.
22
Table of Contents
Fluctuations in exchange rates could adversely affect our business.
Because a substantial majority of our earnings and cash assets are denominated in Renminbi, fluctuations in the exchange rate between the U.S. dollar and the Renminbi will affect the relative purchasing power of these proceeds and our balance sheet and earnings per share in U.S. dollars following this offering. In addition, appreciation or depreciation in the value of the Renminbi relative to the U.S. dollar would affect our financial results reported in U.S. dollar terms without giving effect to any underlying change in our business or results of operations. Fluctuations in the exchange rate will also affect the relative value any dividend we may issue after this offering that will be exchanged into U.S. dollars and earnings from and the value of any U.S. dollar-denominated investments we make in the future. In addition, a depreciation of the Renminbi relative to the U.S. dollar would have the effect of reducing our U.S. dollar-translated net revenue and increasing the debt servicing requirements for our U.S. dollar-denominated debt. On the other hand, the appreciation of the Renminbi would make our customers’ products more expensive to purchase outside of China because many of our customers are involved in the export of goods, which could adversely affect their sales, thereby eroding our customer base and adversely affecting our results of operations.
Since July 2005, the Renminbi has no longer been pegged to the U.S. dollar. Although currently the Renminbi exchange rate versus the U.S. dollar is restricted to a rise or fall of no more than 0.3% per day and the People’s Bank of China regularly intervenes in the foreign exchange market to prevent significant short-term fluctuations in the exchange rate, the Renminbi may appreciate or depreciate significantly in value against the U.S. dollar in the medium to long term. Moreover, it is possible that in the future, the PRC authorities may lift restrictions on fluctuations in the Renminbi exchange rate and lessen intervention in the foreign exchange market.
Very limited hedging transactions are available in China to reduce our exposure to exchange rate fluctuations. To date, we have not entered into any hedging transactions in an effort to reduce our exposure to foreign currency exchange risk. While we may enter into hedging transactions in the future, the availability and effectiveness of these transactions may be limited and we may not he able to successfully hedge our exposure at all. In addition, our foreign currency exchange losses may be magnified by PRC exchange control regulations that restrict our ability to convert Renminbi into foreign currencies.
The legal system in China has inherent uncertainties that may limit the legal protections available to you as an investor or to us in the event of any claims or disputes with third parties.
The legal system in China is based on written statutes. Prior court decisions may be cited for reference but have limited precedential value. Since 1979, the central government has promulgated laws and regulations dealing with economic matters such as foreign investment, corporate organization and governance, commerce, taxation and trade. As China’s foreign investment laws and regulations are relatively new and the legal system is still evolving, the interpretation of many laws, regulations and rules is not always uniform and enforcement of these laws, regulations and rules involve uncertainties, which may limit the remedies available to you as an investor and to us in the event of any claims or disputes with third parties. In addition, any litigation in China may be protracted and result in substantial costs and diversion of resources and management attention.
23
Table of Contents
On August 8, 2006, six PRC regulatory agencies, including the Chinese Securities Regulatory Commission, or CSRC, promulgated the Regulation on Mergers and Acquisitions of Domestic Companies by Foreign Investors, which became effective on September 8, 2006. This new regulation, among other things, requires offshore special purpose vehicles, or SPVs, formed for overseas listing purposes through acquisitions of PRC domestic companies and controlled by PRC individuals, to obtain the approval of the CSRC prior to publicly listing their securities on an overseas stock exchange. We believe, based on the advice of our PRC counsel, that this regulation does not apply to us or this offering and that CSRC approval is not required because such acquisition was completed long before September 8, 2006 when the new regulation became effective. On September 21, 2006, the CSRC published a notice specifying the documents and materials that are required to be submitted for obtaining CSRC approval. In the opinion of our PRC counsel, the new notice does not contradict its interpretation of the new regulation, nor does it add greater clarity to the applicability of the new regulation to us. Based on the advice we have received from our PRC counsel, we do not intend to seek CSRC approval in connection with this offering.
Since the new regulation has only recently been adopted, there may be some uncertainty as to how this regulation will be interpreted or implemented. If the CSRC or other PRC regulatory body subsequently determines that the CSRC’s approval is required for this offering, we may face sanctions by the CSRC or other PRC regulatory agencies. These regulatory agencies may impose fines and penalties on our operations in the PRC, limit our operation privileges in the PRC, delay or restrict the repatriation of the proceeds from this offering into the PRC, restrict or prohibit payment or remittance of dividends by Comtech China, or take other actions that could have a material adverse effect on our business, financial condition, results of operations, reputation and prospects, as well as the trading price of our shares. The CSRC or other PRC regulatory agencies may also take actions requiring us, or making it advisable to us, to halt this offering before settlement and delivery of the shares being offered by us.
You may experience difficulties in effecting service of legal process and enforcing judgments against us and our management.
Substantially all of our operations and assets are located in China. In addition, most of our directors, executive officers and some of the experts named in this document reside within China, and many of the assets of these persons are also located within China. As a result, it may not be possible to effect service of process within the United States or elsewhere outside China upon these directors or executive officers or some of the experts named in this document, including with respect to matters arising under U.S. federal securities laws or applicable state securities laws. Moreover, our PRC legal counsel has advised us that China does not have treaties with the United States or many other countries providing for the reciprocal recognition and enforcement of court judgments. As a result, recognition and enforcement in China of judgments of a court of the United States or any other jurisdiction, including judgments against us or our directors, executive officers, or the named experts, may be difficult or impossible.
24
Table of Contents
Our global income and your dividend/capital gain may be subject to PRC tax under the new PRC tax law, which may have an effect on our results of operations and your investment, respectively.
Under the new PRC tax law, effective January 1, 2008, an enterprise established outside of the PRC with “de facto management bodies” within the PRC is considered a resident enterprise and will be subject to the corporate income tax at the rate of 25% on its global income. The new PRC tax law does not, however, clearly define the term “de facto management bodies”. If the PRC tax authorities subsequently determine that we should be classified as a resident enterprise, then our global income may be subject to the corporate income tax at the rate of 25%.
Under the previous PRC tax law, dividend payments to foreign investors made by foreign-invested enterprises in China, are exempt from PRC withholding tax. We have been advised by our PRC counsel, Commerce & Finance Law Offices, that pursuant to the new PRC tax law which became effective on January 1, 2008, however, dividends payable for earnings accumulated beginning on January 1, 2008 by a PRC resident enterprise to its foreign corporate investors will be subject to a 10% withholding tax, unless any such foreign investor’s jurisdiction of incorporation has a tax treaty with China that provides for a different withholding arrangement. According to the Agreement between the Mainland China and Hong Kong Special Administrative Region for the Avoidance of Double Taxation and the Prevention of Fiscal Evasion with respect to Taxes on Income and its relevant regulations, dividends paid by a PRC resident enterprise to its direct holding company in Hong Kong will be subject to withholding tax at a rate of no more than 5% (if the Hong Kong investor is the “beneficial owner” and owns directly at least 25% of the equity interest of the PRC resident enterprise). The new PRC tax law provides, however, dividends distributed between qualified resident enterprises will be exempted. Dividends distributed between qualified resident enterprises refer to the dividends derived by a PRC resident enterprise from its direct investment in another PRC resident enterprise. In addition, we have been advised by our PRC counsel, Commerce & Finance Law Offices, that under the new PRC tax law, foreign corporate investors may be subject to a 10% withholding tax upon any gain they realize from the transfer of our shares, if such income is regarded as income from “sources within the PRC”. We have been advised by Commerce & Finance Law Offices that it is uncertain whether such income would be regarded as income from “sources within the PRC” because whether the Company would be regarded as a “PRC resident enterprise” is not clear. If we are required under the new PRC tax law to withhold PRC withholding tax on our dividends payable to our non-PRC corporate shareholders, or on any gains of the transfer of their shares, your investment in our ordinary shares may be affected.
Risks Related to Our Common Stock
Our principal shareholder and chief executive officer beneficially owns a substantial portion of our common stock. As a result, the trading price for our shares may be depressed due to market perception that our principal shareholder and chief executive officer will be able to take actions that may be adverse to your interests.
Jeffrey Kang, our principal shareholder and chief executive officer, directly and through entities he controls, currently beneficially owns approximately 29.21% of our issued and outstanding common stock. This significant concentration of share ownership may adversely affect the trading price of our common stock because investors, often perceive a disadvantage in owning shares in a company with only one or very few controlling shareholders. Furthermore, Mr. Kang has the ability to significantly influence the outcome of all matters requiring shareholder approval, including the election of directors and approval of significant corporate transactions, such as mergers, consolidations or the sale of substantially all of our assets. This concentration of ownership may have the effect of delaying or preventing a change of control, including a merger, consolidation or other business combination involving us, or discouraging a potential acquirer from making a tender offer or otherwise attempting to obtain control, even if such a change of control would benefit you.
25
Table of Contents
The trading prices of our shares have been and are likely to continue to be volatile, which could result in substantial losses to you.
The trading prices of our shares have been and are likely to continue to be volatile. Since January 1, 2006, the trading price of our shares on the Nasdaq Global Market has ranged from $2.49 to $22.15 per share, and the last reported sale price on March 3, 2010 was $7.45 per share. The trading prices of our shares could fluctuate widely in response to factors beyond our control. In particular, the performance and fluctuation of the market prices of other companies with business operations located mainly in China that have listed their securities in the United States may affect the volatility in the price of and trading volumes for our shares. Recently, a number of PRC companies have listed their securities, or are in the process of preparing for listing their securities, on U.S. stock markets. Some of these companies have experienced significant volatility, including significant price declines after their initial public offerings. The trading performances of these PRC companies’ securities at the time of or after their offerings may affect the overall investor sentiment towards PRC companies listed in the United States and consequently may impact the trading performance of our shares. These broad market and industry factors may significantly affect the market price and volatility of our shares, regardless of our actual operating performance.
In addition to market and industry factors, the price and trading volume for our shares may be highly volatile for specific business reasons. In particular, factors such as variations in our revenues, earnings and cash flow, announcements of new investments, cooperation arrangements or acquisitions or sales of large blocks of our shares, could cause the market price for our shares to change substantially. Any of these factors may result in large and sudden changes in the volume and trading price of our shares. In the past, following periods of volatility in the market price of a company’s securities, shareholders have often instituted securities class action litigation against that company. If we were involved in a class action suit, it could divert the attention of senior management, and, if adversely determined, could have a material adverse effect on our financial condition and results of operations.
Future sales of shares could have an adverse effect on the market price of our common stock.
A significant portion of our shares are held by a small number of shareholders. Historically, trading volume of our shares has been relatively low. Sales by our current shareholders of a substantial number of shares could significantly reduce the market price of our common stock. These sales could also impede our ability to raise future capital.
As of December 31, 2009, we had 35,770,025 shares of common stock outstanding, which shares will be able to be sold in the public market in the near future, subject to, with respect to shares of common stock held by affiliates and shares issued between 12 and 24 months ago, the volume restrictions and/or manner of sale requirements of Rule 144 under the Securities Act. These shares are freely tradable without restriction or further registration, subject to the related prospectus delivery requirements.
As of December 31, 2009, we had 2,501,433 stock options, equity share units, performance shares, warrants and shares issuable in relation to our acquisitions which may result in a significant number of shares entering the public market and the dilution of our common stock. In addition, in the event that any future financing should be in the form of securities convertible into, or exchangeable for, equity securities, investors may experience additional dilution upon the conversion or exchange of such securities.
| ITEM 1B. | UNRESOLVED STAFF COMMENTS |
Not applicable.
26
Table of Contents
| ITEM 2. | PROPERTIES |
We lease properties with a total area of approximately 120,000 square feet in 20 locations in China including Shenzhen, Shanghai, Beijing, Hangzhou and Hong Kong. Approximately 20,000 square feet is for our corporate headquarters located in Shenzhen, approximately 45,000 square feet is for our research and development centers in Shenzhen and Shanghai, approximately 35,000 square feet is for our representative offices located in the other cities, and approximately 20,000 square feet is used for manufacturing of our proprietary lightning protection product for wireless base stations. These leases have remaining terms ranging from 1 to 12 months.
We believe that our existing facilities and equipment are well maintained and in good operating condition, and are sufficient to meet our needs for the foreseeable future.
| ITEM 3. | LEGAL PROCEEDINGS |
We are not currently involved in any material litigation. From time to time, we may be also involved in litigation arising in the normal course of our business.
| ITEM 4. | Reserved for future use by the securities and exchange commission. |
| ITEM 5. | MARKET FOR REGISTRANT’S COMMON EQUITY, RELATED SHAREHOLDER MATTERS AND ISSUER PURCHASES OF EQUITY SECURITIES |
Market Prices of Common Stock
Our common stock is quoted on the Nasdaq Global Select Market under the symbol “COGO”. The following table sets forth the reported high and low sale prices for our common stock for the periods indicated. These prices represent prices between dealers, without adjustment for retail mark-ups, mark-downs or commissions, and may not necessarily represent actual transactions.
| 2009 | 2008 | |||||||
| Dollars Per Share |
High | Low | High | Low | ||||
| Quarter: | ||||||||
| First |
7.47 | 4.73 | 16.18 | 8.88 | ||||
| Second |
8.78 | 5.50 | 14.02 | 9.05 | ||||
| Third |
6.85 | 5.02 | 9.19 | 3.75 | ||||
| Fourth |
7.55 | 5.20 | 5.50 | 2.46 | ||||
The closing price of our common stock on March 3, 2010 as reported by the Nasdaq Global Select Market was $7.45.
27
Table of Contents
Shareholders
As of March 3, 2010, there were 36,117,867 shares of our common stock outstanding, and we had approximately 358 shareholders of record. The transfer agent and registrar for our common stock is American Stock Transfer & Trust Company.
Dividends
Prior to the share exchange with Trident on July 22, 2004, we declared dividends of RMB41.4 million ($5.0 million) on our common stock. In September 2004, we paid our shareholders of record prior to the share exchange such dividends. During the last four fiscal years we have not declared any other cash dividends on our common stock.
We currently intend to retain our future earnings, if any, to finance the further development and expansion of our business and do not intend to pay cash dividends in the foreseeable future. Any future determination to pay dividends will be at the discretion of our board of directors and will depend on our financial condition, results of operations, current and anticipated cash needs, restrictions contained in current or future financing instruments, plans for expansion and such other factors as our board of directors deems relevant.
Our PRC operating companies are required, where applicable, to allocate a portion of their net profit to certain funds before distributing dividends, including at least 10% of their net profit to certain reserve funds until the balance of such fund has reached 50% of their registered capital. These reserves can only be used for specific purposes, including making-up cumulative losses of previous years, conversion to our equity capital, and application to business expansion, and are not distributable as dividends. Our PRC operating companies are also required, where applicable, to allocate an additional 5% to 10% of their net profits to a common welfare fund. For risks associated with the uncertainty in our receipt of the equivalent economic interest in connection with the equity interest in Shenzhen Comtech, see “Risk factors—PRC laws and our corporate structure may restrict our ability to receive dividends and payments from, and transfer funds to, our PRC operating companies, which may negatively affect our results of operations and restrict our ability to act in response to changing market condition.; See “Risk factors – Our global income and your capital gain may be subject to PRC tax under the new PRC tax law, which may have an effect on our results of operations and your investment, respectively.”
28
Table of Contents
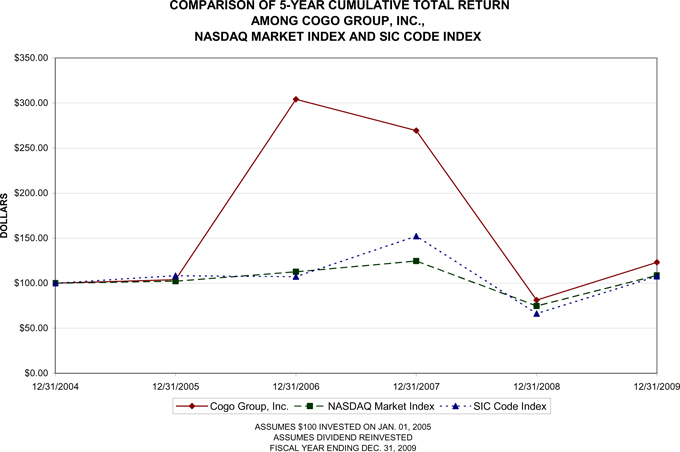
Recent Sales of Unregistered Securities
None.
Equity Compensation Plan Information
See “Item 11. Executive Compensation” for the aggregate information regarding our equity compensation plans in effect on December 31, 2009.
| ITEM 6. | SELECTED FINANCIAL DATA |
The following selected consolidated statements of income data for each of the years in the five-year period ended December 31, 2009 and selected consolidated balance sheet data as of December 31, 2009, 2008, 2007, 2006 and 2005, presented below are derived from our audited consolidated financial statements. The audited consolidated financial statements have been prepared in accordance with U.S. GAAP and have been audited by KPMG, an independent registered public accounting firm, for the years ended December 31, 2009, 2008, 2007 and 2006 and as of December 31, 2009, 2008, 2007 and 2006. The selected consolidated statements of income data for the year ended December 31, 2006 and 2005 and the selected consolidated balance sheet data as of December 31, 2007, 2006, and 2005 were derived from our audited financial statements which are not included in this report.
29
Table of Contents
The selected consolidated financial statements are reported in Renminbi. Renminbi and U.S. dollar amounts are presented in thousands, except share and per share data. This data should be read in conjunction with our “Management’s discussion and analysis of financial condition and results of operations” and our audited consolidated financial statements and the related notes included elsewhere in this Form 10-K.
The selected consolidated financial statement data are expressed in Renminbi (“RMB”), the national currency of the PRC. Solely for the convenience of the reader, the December 31, 2009 audited consolidated financial statements have been translated into United States dollars (“US$” or “$”) at the closing rate in New York City on December 31, 2009 for cable transfers in RMB as certified for customers purposes by the Federal Reserve Bank of New York of US$ 1.00 = RMB6.8259. No representation is made that the RMB could have been, or could be, converted into US$ at that rate or at any other certain rate on December 31, 2009, or at any other certain date.
30
Table of Contents
Selected Consolidated Statement of Income Data
| Year Ended December 31, | ||||||||||||||||||
| 2009 $ | 2009 RMB | 2008 RMB | 2007 RMB | 2006 RMB | 2005 RMB | |||||||||||||
| (in thousands, except share and per share amounts) | ||||||||||||||||||
| Net revenue |
||||||||||||||||||
| Product sales |
302,790 | 2,066,815 | 1,931,845 | 1,597,818 | 1,269,176 | 866,332 | ||||||||||||
| Services revenue |
4,307 | 29,401 | 27,695 | 68,690 | 54,387 | — | ||||||||||||
| 307,097 | 2,096,216 | 1,959,540 | 1,666,508 | 1,323,563 | 866,332 | |||||||||||||
| Cost of sales |
||||||||||||||||||
| Cost of goods sold |
(259,477 | ) | (1,771,166 | ) | (1,624,101 | ) | (1,297,225 | ) | (1,042,951 | ) | (714,881 | ) | ||||||
| Cost of services |
(3,475 | ) | (23,716 | ) | (18,664 | ) | (46,368 | ) | (33,928 | ) | — | |||||||
| (262,952 | ) | (1,794,882 | ) | (1,642,765 | ) | (1,343,593 | ) | (1,076,879 | ) | (714,881 | ) | |||||||
| Gross profit |
44,145 | 301,334 | 316,775 | 322,915 | 246,684 | 151,451 | ||||||||||||
| Selling, general and administrative expenses |
(18,290 | ) | (124,842 | ) | (152,898 | ) | (120,580 | ) | (82,177 | ) | (35,308 | ) | ||||||
| Research and development expenses |
(9,889 | ) | (67,504 | ) | (50,947 | ) | (40,973 | ) | (27,977 | ) | (15,837 | ) | ||||||
| Provision for doubtful accounts |
(5,272 | ) | (35,992 | ) | (6,847 | ) | (15,051 | ) | (7,920 | ) | (3,662 | ) | ||||||
| Impairment loss of goodwill and intangible assets |
— | — | (33,759 | ) | — | — | — | |||||||||||
| Other operating income, net |
17 | 116 | 214 | 170 | 185 | 180 | ||||||||||||
| Income from operations |
10,711 | 73,112 | 72,538 | 146,481 | 128,795 | 96,824 | ||||||||||||
| Gain on disposal of a subsidiary |
— | — | — | — | 6,673 | — | ||||||||||||
| Interest expense |
(288 | ) | (1,963 | ) | (1,056 | ) | (2,335 | ) | (2,896 | ) | (1,762 | ) | ||||||
| Interest income |
2,123 | 14,490 | 27,895 | 25,637 | 7,352 | 2,493 | ||||||||||||
| Earnings before income taxes and extraordinary item |
12,546 | 85,639 | 99,377 | 169,783 | 139,924 | 97,555 | ||||||||||||
| Income tax expense (1) |
(1,349 | ) | (9,207 | ) | (2,215 | ) | (14,275 | ) | (11,104 | ) | (6,736 | ) | ||||||
| Income before extraordinary item |
11,197 | 76,432 | 97,162 | 155,508 | 128,820 | 90,819 | ||||||||||||
| Extraordinary item, net of nil tax |
987 | 6,737 | — | — | — | — | ||||||||||||
31
Table of Contents
| Year Ended December 31, | ||||||||||||||||||
| 2009 $ | 2009 RMB | 2008 RMB | 2007 RMB | 2006 RMB | 2005 RMB | |||||||||||||
| (in thousands, except share and per share amounts) | ||||||||||||||||||
| Net income |
12,184 | 83,169 | 97,162 | 155,508 | 128,820 | 90,819 | ||||||||||||
| Less net income attributable to noncontrolling interest |
(431 | ) | (2,945 | ) | (1,255 | ) | (3,065 | ) | (5,545 | ) | (3,977 | ) | ||||||
| Net income attributable to Cogo Group, Inc. |
11,753 | 80,224 | 95,907 | 152,443 | 123,275 | 86,842 | ||||||||||||
| Earnings per share attributable to Cogo Group, Inc. |
||||||||||||||||||
| Income before extraordinary item |
0.29 | 2.01 | 2.49 | 4.12 | 3.83 | 3.08 | ||||||||||||
| Extraordinary item |
0.03 | 0.19 | — | — | — | — | ||||||||||||
| Basic |
0.32 | 2.20 | 2.49 | 4.12 | 3.83 | 3.08 | ||||||||||||
| Income before extraordinary item |
0.29 | 1.95 | 2.42 | 3.98 | 3.64 | 2.94 | ||||||||||||
| Extraordinary item |
0.03 | 0.18 | — | — | — | — | ||||||||||||
| Diluted |
0.32 | 2.13 | 2.42 | 3.98 | 3.64 | 2.94 | ||||||||||||
| Dividends declared per share |
— | — | — | — | — | — | ||||||||||||
| Weighted average number of common shares outstanding |
||||||||||||||||||
| Basic |
36,541,037 | 38,488,861 | 36,974,100 | 32,200,044 | 28,168,274 | |||||||||||||
| Diluted |
37,673,351 | 39,585,921 | 38,306,969 | 33,829,519 | 29,507,939 | |||||||||||||
| Selected Consolidated Balance Sheet Data |
||||||||||||||||||
| Cash |
97,764 | 667,320 | 686,379 | 919,650 | 375,147 | 177,098 | ||||||||||||
| Accounts receivable, net |
90,481 | 617,613 | 497,992 | 418,329 | 278,589 | 267,543 | ||||||||||||
| Property and equipment, net |
2,110 | 14,406 | 17,993 | 17,848 | 12,395 | 6,904 | ||||||||||||
| Total assets |
281,505 | 1,921,527 | 1,686,810 | 1,840,540 | 907,098 | 668,935 | ||||||||||||
| Total current liabilities |
51,333 | 350,397 | 257,662 | 361,114 | 241,534 | 153,777 | ||||||||||||
| Total liabilities |
54,132 | 369,505 | 277,355 | 386,672 | 241,534 | 153,777 | ||||||||||||
| Total equity |
227,373 | 1,552,022 | 1,409,455 | 1,453,868 | 665,564 | 515,158 | ||||||||||||
| (1) | Certain of our operating subsidiaries were entitled to tax holidays. The effect of the tax holiday increased our net income for 2009, 2008, 2007, 2006 and 2005 by RMB29.5 million ($4.3 million), RMB28.2 million, RMB29.4 million, RMB28.9 million and RMB16.7 million, respectively (equivalent to basic earnings per share amount of RMB0.81 ($0.12), RMB0.73, RMB0.80, RMB0.90 and RMB0.59 and a diluted earnings per share amount of RMB0.78 ($0.11), RMB0.71, RMB0.77, RMB0.85 and RMB0.57 for the years ended December 31, 2009, 2008, 2007, 2006 and 2005, respectively). |
32
Table of Contents
| ITEM 7. | MANAGEMENT’S DISCUSSION AND ANALYSIS OF FINANCIAL CONDITION AND RESULTS OF OPERATIONS |
The following discussion of our financial condition and results of operations should be read in conjunction with our audited consolidated financial statements and the notes to those financial statements appearing elsewhere in this Form 10-K. This discussion contains forward-looking statements that involve significant risks and uncertainties. As a result of many factors, such as those set forth under “Forward Looking Statements” and “Item 1A. Risk Factors” and elsewhere in this Form 10-K, our actual results may differ materially from those anticipated in these forward-looking statements.
Overview
We provide customized module design solutions for a diverse set of applications and end markets, serving as a gateway for our technology component suppliers to access leading electronics manufacturers in China. Our customized module design solutions allow our customers to take advantage of technology components from reputable suppliers in an efficient and cost-effective manner, effectively reducing their time-to-market and lowering their overall costs. Our close collaboration with our customers’ product development teams provides us with a unique understanding of their needs, enabling us to customize our suppliers’ technology components with module designs that meet our customers’ needs. In addition, in 2006, we began offering technology and engineering, services in China and in 2007, we began offering software design services in China.
We focus on the digital media, telecommunications equipment and industrial business end-markets in China. In the digital media end-market, we provide mobile handset and module solutions for functionalities such as CMMB mobile TV, motion sensor, camera, power supply and Bluetooth as well as solutions for high definition digital set-top box, GPS applications and solutions for Smartbook. In the telecommunications equipment end-market, we provide solutions for PSTN switching, optical transmitters, electrical signal processing and optical signal amplification; in the industrial business end-market, which commenced in the beginning of 2008, we provide industrial solutions for the green energy and auto-electronics sectors. Currently, we have over 1,400 customers, including a many of the most established manufacturers in the digital media, telecommunications equipment and industrial business end-markets in China such as ZTE, TCL and BYD. We work with original equipment manufacturers, or OEMs, as well as subsystem designers and contract manufacturers to provide solutions to support industry leader like Huawei. In developing customized module design solutions for use in our customers’ products, we collaborate closely with over 30 suppliers of technology components, including many large multinational companies such as Broadcom, Matsushita, Sandisk, Freescale and Atmel. Additionally, in October 2006, we became one of the first China-based companies to license software technology and have access to selected source codes directly from Microsoft.
We have two reportable operating segments: product sales consisting of revenues generated by providing customized module design solutions focusing primarily in the digital media, telecommunications equipment and industrial business end-markets, and services revenue, generated by providing technology and engineering services, network system integration and related training and maintenance services.
Principal Factors Affecting Our Results of Operations
The major factors affecting our results of operations and financial condition include:
Revenue mix. Our net revenue and gross profit are affected by our product mix. Over the last year, digital media related sales, which have generally higher profit margins than our mobile handset module related sales and our telecommunications equipment module related sales, have constituted a significantly greater portion of our total net revenue as compared to previous years.
33
Table of Contents
Growth in end-market industries. The rapid growth of the domestic telecommunications equipment, industrial business and digital media end-markets have been important growth drivers for China’s electronics manufacturing industries. Specific markets that we expect to experience continued growth are the data communications market, consisting of asymmetric digital subscriber line (ADSL) modems and Voice over Internet Protocol (VoIP) equipment; the routers and network security equipment markets; the optical transmission systems market; the fixed line telecommunications network market, as well as the digital media market particularly relating to digital TV and GPS applications. Increased domestic consumer spending power has contributed to rapid growth in these markets. This growth in domestic consumer spending power in turn has driven, and we believe will continue to drive, growth in the electronics manufacturing businesses supporting hardware OEMs, including those engaged in the customized design of module solutions such as ourselves. However, these industries and the respective domestic manufacturers that operate in these industries may not continue to grow their sales at historical levels, if at all. The stagnation or reduction in overall demand for telecommunications equipment, industrial business and digital media products could materially affect our results of operations.
Increase in exports. We believe that the development of a highly-skilled, low-cost manufacturing base has also enabled China’s domestic telecommunications equipment and digital consumer electronics manufacturers to be competitive in the global marketplace. As an example, ZTE, a major manufacturer of mobile handset and telecommunications equipment in China, as well as other telecommunications equipment and mobile handset manufacturers, have also begun to expand overseas. We believe that growth in the export market will likely have a positive effect on our results of operations and financial condition, as it should increase the demand for our solutions, particularly among our digital media clients.
Growth by entering new end-markets, strengthening in-house capabilities and leveraging our customer base. In 2008, we began targeting the industrial business end-market by providing industrial solutions for the green energy and auto-electronics sectors. Since then the revenues generated from this market have grown from 4.5% of our 2008 revenue to 13.3% of our 2009 revenue. We anticipate that sales related to the industrial business end-markets will generally have higher profit margins than our digital media and telecom equipment modules related sales, though such higher margins may decline over time as this industry matures. We will also look for opportunities to expand into new end markets that we believe represent significant growth opportunities.
Our success in the industrial business end-market will depend, in significant part, on our ability to leverage our existing customer base. We expect to continue to incur additional research and development expenses, through hiring additional engineering personnel to develop new solutions and expanding our intellectual property and technological capabilities, to meet the needs of our customers that have expanded into or are expected to expand into the industrial business end-market.
General economic and market conditions. Due to a tough market conditions, the level of consumer and information technology spending has declined and reduced the demand for our mobile handsets since the third quarter of 2008. Furthermore, our profit margins have been reduced since we strategically lowered our pricing in order to grow the business in a slowing economic environment. Our other businesses, such as industrial business and digital medial products, continue to show solid growth, driven by stable infrastructure investments in the PRC.
34
Table of Contents
Net Revenue
Product sales
For our product sales segment, we do not charge our customers an independent design fee. Instead, our business model is to generate revenue by reselling a limited number of specific components required in our module reference design. The difference between the purchase price we pay our suppliers for these components and our sales price to the customer for these components compensates us for our design, technical support and distribution services. Our net revenue is net of a 17% value-added tax, or VAT. Costs incurred for the design of modules are expensed as incurred and recorded as research and development expense in the Company’s consolidated states of income and comprehensive income.
Our broad and diversified customer base includes many of the major telecommunications equipment, industrial business and digital consumer electronics manufacturers in China. In addition, our customers include industry participants supporting these OEMs, such as subsystem designers and contract manufacturers in China, as well as international manufacturers who have begun to manufacture end-products in China for the domestic and international market. Our two largest customers from the telecommunications equipment industry in terms of 2009 net revenue were ZTE and Wuhan Research Institute of Post & Telecommunications, a major telecommunications equipment manufacturer in China. Our largest customers in the digital media end-market in terms of 2009 net revenue was ZTE, T&W Electronics, a major broadband terminal equipment and digital consumer electronic provider in China and Star-net, a leading provider of network and communication products in China. During 2009, ZTE, T&W Electronics, Starnet, Wuhan Research Institute of Post & Telecommunications and TCL, accounted for 21.9%, 10.4%, 3.7%, 3.5% and 2.8% of our net revenue, respectively.
Our net revenue are subject to seasonal fluctuation and periods of increased demand. All product module sales are typically highest in the fourth quarter of the year due to desire by OEMs to spend remaining budgets allocated for a given period, usually on an annual basis. Net revenue have historically been lowest in the first quarter of the year due to the Chinese New Year holiday and the general reduction in sales following the holiday season. The digital media industry also experiences cyclical fluctuations, as well as fluctuations in how quickly certain new digital media products and technologies are adopted by the market. These sales patterns may not be indicative of future sales performance.
Services Revenue
We provide technology and engineering services, and related training and maintenance services to our customers. We generate revenue when our services are rendered and acknowledged by our customers. Our service revenue is net of business tax.
Cost of Sales
Our cost of sales comprises cost of goods sold and cost of services.
Cost of Goods Sold
Cost of goods sold primarily consists of the purchase of components from suppliers. We develop our customized module design solutions based on specific technology components purchased from suppliers in our target end-markets. Our list of over 30 key suppliers includes Broadcom (integrated circuit and Bluetooth), Sandisk (flash memory), Maxim (Integrated Circuits), Matsushita (switches) and Freescale Semiconductor (automotive solutions). We typically issue purchase orders to our suppliers only after we receive customer orders, enabling us to maintain low inventory levels and, in turn, minimize risks typically associated with holding inventory. During 2009, based on cost of sales, we purchased approximately 36.3%, 10.1%, 9.7% and 9.4% of the components sold to our customers from Broadcom, Matsushita, Sandisk and Freescale and its affiliated entities, respectively. If we lose a key supplier, or a supplier reduces the quantity of products it sells to us, does not maintain a sufficient inventory level of products required by us or is otherwise unable to meet our demands for its components, we may have to expend significant time, effort and other resources to locate a suitable alternative supplier and secure replacement components. Even if we are able to find a replacement supplier, we may be required to redevelop the customized module design solution to effectively incorporate the replacement components.
35
Table of Contents
Cost of Services
Cost of services consists of direct staff costs and other direct related costs for providing engineering and technology services including training and materials.
Operating Expenses
Selling, General and Administrative Expenses
Our selling expenses include expenditures to promote our new module solutions and gain a larger customer base, personnel expenses and travel and entertainment costs related to sales and marketing activities, and freight charges. We expense all these expenditures as they are incurred. Selling expenses are expected to continue to grow in the future as we diversify by developing and acquiring new design capabilities and expanding into new end-markets. Also included in selling expenses are allowance for doubtful accounts.
General and administrative expenses include compensation and benefits for our general and administrative staff, professional fees, amortization of intangible assets, foreign exchange losses and general travel and entertainment costs. We expense all general and administrative expenses as they are incurred. We expect that general and administrative expenses will continue to increase for the foreseeable future as a result of our expected continued growth and the continuing costs of complying with U.S. rules and regulations necessary to maintain our listing in the United States.
Research and Development Expenses
Research and development expenses consist primarily of salaries and related costs of the employees engaged in research, design and development activities; the costs for design and testing; the cost of parts for prototypes; equipment depreciation; and third party development expenses. We expense research and development expenses as they are incurred. As of December 31, 2009, we had approximately 237 engineers and other technical employees engaged in research and development related activities to develop new customized module design solutions targeted at the telecommunications equipment, industrial business and digital media industries. As a result of additional costs incurred in developing new customized module design solutions, research and development expenses were higher in 2009 than they were in 2008, and we expect that our research and development expenses, including those relating to the planned hiring of additional research and development personnel, will increase in the future as we seek to expand our business by developing new customized module design solutions and penetrating new end-markets, and as we seek to grow our engineering services business.
Noncontrolling Interest
Noncontrolling interest consisted of 30% of the outstanding equity interest in Long Rise. For the year ended December 31, 2009, approximately 11.6% of our total net revenue was generated through this subsidiary.
Taxation
USA
We are a holding company incorporated in the State of Maryland and conduct substantially all our operations through our PRC operating companies. Although we are subject to United States taxation, we do not anticipate incurring significant United States income tax liability for the foreseeable future because:
| • | we do not conduct any material business in the United States, |
36
Table of Contents
| • | the earnings generated from our non-U.S. operating companies are generally eligible for a deferral from United States taxation until such earnings are repatriated to the United States, and |
| • | we believe that we will not generate any significant amount of income inclusions under the income imputation rules applicable to a United States company that owns “controlled foreign corporations” for United States federal income tax purposes. |
Cayman Islands and British Virgin Islands
Under the current laws of the Cayman Islands and British Virgin Islands, the Company’s subsidiaries that are incorporated in the Cayman Islands and the British Virgin Islands are not subject to tax on income or capital gains. In addition, upon payments of dividends by these companies, no Cayman Islands or British Virgin Islands withholding tax will be imposed.
Hong Kong
The Company’s subsidiaries that are incorporated in Hong Kong are subject to a Hong Kong profits tax. The applicable profits tax rates are 17.5%, 16.5% and 16.5% for 2007, 2008 and 2009, respectively. As of February 27, 2008, the Hong Kong SAR Government announced a reduction on the Hong Kong Profits Tax rate from 17.5% to 16.5%. The payments of dividends by Hong Kong companies are not subject to any Hong Kong withholding tax.
PRC
Prior to January 1, 2008, the PRC’s statutory income tax rate was 33%. In addition, Shenzhen Comtech, Comtech Communication, Comtech Software, Comloca, Epcot, Huameng PRC and Viewtran PRC (collectively the “Shenzhen Subsidiaries), being located in the Shenzhen Special Economic Zone in the PRC, were subject to a reduced tax rate of 15%. Since the Shenzhen Subsidiaries agreed to operate for a minimum of 10 years in the PRC, the Shenzhen Subsidiaries were each entitled to a tax holiday of two-year tax exemption followed by three-year 50% tax reduction from the first profit making year after offsetting accumulated tax losses of the respective Shenzhen Subsidiaries.
Also prior to January 1, 2008, Shanghai E&T which is located in Shanghai Qingpu Zone, was taxed on a deemed basis at 2.31% of its turnover in accordance with the tax guidelines issued by the local tax authority in Qingpu Zone in 2007.
On March 16, 2007, the National People’s Congress passed the Corporate Income Tax law (the “CIT law”) which unified the income tax rate to 25% for all companies. The CIT law was effective as of January 1, 2008. Accordingly, the Company’s PRC subsidiaries are subject to income tax at 25% effective from January 1, 2008 unless otherwise specified.
The CIT law and its relevant regulations provide a five-year transition period from January 1, 2008 for those companies which were established before March 16, 2007 and which were entitled to preferential lower tax rates under the then effective tax laws or regulations, as well as grandfathering certain tax holidays. The transitional tax rates are 18%, 20%, 22%, 24% and 25% for 2008, 2009, 2010, 2011 and 2012 onwards, respectively. For the Shenzhen Subsidiaries that were entitled to a two-year tax exemption followed by a three-year 50% tax reduction from the first profit making year after offsetting accumulated tax losses, and they are entitled to continue the tax holidays until they expire. For Comloca and Huameng PRC which had not commenced their respective tax holiday as of December 31, 2007, the CIT law and its relevant regulations require the tax exemption period to begin on January 1, 2008.
37
Table of Contents
Based on the above, the Shenzhen Subsidiaries are subject to the following tax rates:
| • | Shenzhen Comtech is subject to income tax at rates of 15%, 18,%, 20%, 22%, 24% and 25% for 2007, 2008, 2009, 2010, 2011 and 2012 onwards respectively. |
| • | Comtech Communications is subject to income tax at rates of 7.5%, 18%, 20%, 22%, 24% and 25% for 2007, 2008, 2009, 2010, 2011 and 2012 onwards, respectively. |
| • | Comtech Software is subject to income tax at rates of 7.5%, 9%, 10%, 22%, 24% and 25% for 2007, 2008, 2009, 2010, 2011 and 2012 onwards, respectively. |
| • | Comloca and Huameng PRC had no assessable profits up to 2007 and were tax exempt for 2008 and 2009. They are subject to income tax at rates of 11%, 12%, 12.5% and 25% for 2010, 2011, 2012 and 2013 onwards, respectively. |
| • | Viewtran PRC and Epcot were tax exempt for 2007 and 2008 and are subject to income tax at rates of 10%, 11%, 12% and 25% for 2009, 2010, 2011 and 2012 onwards, respectively. |
As a result of the incentives above, our operations have historically been subject to relatively low tax liabilities, which increase in the near future. See “Risk Factors – Our financial results benefit from tax concessions granted by the PRC government, the change to or expiration of which would materially change our results of operations.” Our effective tax rate was 10.8%, 2.2% and 8.4% in 2009, 2008 and 2007, respectively. Included in the income tax expense for the year ended December 31, 2009 was deferred income tax benefit of RMB4.5 million as a result of the amortization of intangible assets of RMB28.5 million.
Basis of Presentation
Our financial statements reflect the historical consolidated operations of Cogo Cayman. In the July 2004 share exchange with Trident, the stockholders of Cogo Cayman received in exchange for our business approximately 91.2% of the then-outstanding common stock of Trident. This share exchange transaction was accounted for as a reverse acquisition in which Cogo Cayman was deemed the accounting acquirer and Trident was deemed the legal acquirer. In connection with the share exchange, we changed our name to Comtech Group, Inc. from Trident. On May 13, 2008, we changed our name to Cogo Group, Inc.
As a result of the share exchange transaction:
| • | the historical financial statements of Trident for periods prior to the date of the share exchange transaction are no longer presented; |
| • | the historical financial statements for periods prior to the date of the transaction are those of Cogo Cayman, as the accounting acquirer; |
| • | all references to the financial statements apply to the historical financial statements of Cogo Cayman prior to the transaction; and |
| • | the number of our shares of common stock has been restated retroactively to reflect the share exchange ratio as at the date of the share exchange transaction. |
In order to exercise control over Shenzhen Comtech (a PRC operating company legally permitted to engage in a commodity trading business), without direct shareholding by us (a U.S.-listed company and therefore a foreign-invested entity), Honghui Li, our vice president, and Huimo Chen, the mother of Jeffrey Kang, our chief executive officer, through contractual agreements exercise control over Shenzhen Comtech, which in turn owns a controlling interest in Shanghai E&T. Under these contractual agreements, we enjoy voting control and are entitled to the economic interests associated with their equity interest in Shenzhen Comtech and Shanghai E&T. For additional details regarding these contractual agreements, see “Item 13. Certain Relationships and Related Transactions, and Director Independence.”
38
Table of Contents
Critical Accounting Policies and Estimates
The preparation of our consolidated financial statements requires us to make estimates and judgments that affect the reported amounts of our assets, liabilities, revenue and expenses. These estimates are based on our historical experience and on various other assumptions that we believe to be reasonable. Estimates are evaluated on an ongoing basis, but actual results may differ from these estimates.
Critical accounting policies are those that, in management’s view, are most important in the portrayal of our financial condition and results of operations. Those that require significant judgments and estimates include:
Business Combinations. In 2009, we acquired 100% equity interest in Mega Smart. Prior to 2009, our significant acquisitions included the acquisition of the 70% equity interest in Long Rise, the acquisition of the remaining 45% equity interest in Comtech Broadband, the acquisition of the 100% equity interest in Keen Awards which the consideration payable was contingent upon achieving certain agreed earning levels over an agreed measurement period, and the acquisition of the 100% equity interest in Viewtran.
We have adopted ASC 805, Business Combinations, in connection with the acquisition of Mega Smart in 2009, and SFAS No. 141, Business Combinations, in connection with the acquisitions prior to 2009. For our acquisitions, we allocate the cost of an acquired entity to the assets acquired and the liabilities assumed based on their estimated fair value on the date of acquisition. This process is commonly referred to as the purchase price allocation. As part of the purchase price allocation, we are required to determine the fair value of any identifiable intangible assets acquired. The determination of the fair value of the intangible assets acquired involves certain judgements and estimates. These judgements can include, but are not limited to, the cash flows that an asset is expected to generate in the future. A change in the amount allocated to identifiable intangible assets would have an offsetting effect on the amount of goodwill recognized from the acquisition and would change the amount of amortization expense recognized related to those identifiable intangible assets.
The fair values of our identifiable intangible assets were determined by us with inputs from our independent appraisers using mainly the income approach. Future cash flows are predominately based on the historical pricing and expense levels, taking into consideration the relevant market size, growth factors and expected industry growth. The resulting cash flows are then discounted at a rate approximating our weighted average cost of capital.
Valuation of Long-Lived Assets. We assess the impairment of long-lived assets, which include goodwill, identifiable intangible assets, and property and equipment (“P&E”), at least annually for goodwill or whenever events or changes in circumstances indicate that the carrying value may not be recoverable for all long-lived assets. Changes in the underlying business could adversely affect the fair value of the enterprise and intangible asset and P&E asset groups. Important factors which could require an impairment review include: (i) underperformance relative to expected historical or projected future operating results; (ii) changes in the manner of use of the assets or the strategy for our overall business; (iii) negative industry or economic trends; (iv) our enterprise fair value relative to net book value.
Our impairment evaluation of identifiable intangible assets and P&E includes an analysis of estimated future undiscounted net cash flows expected to be generated by the assets over their remaining estimated useful lives. If the estimated future undiscounted net cash flows are insufficient to recover the carrying value of the assets over the remaining estimated useful lives, we record an impairment loss in the amount by which the carrying value of the assets exceeds the fair value. We determine fair value based on either market quotes, if available, or discounted cash flows using a discount rate commensurate with the risk inherent in our current business model for the specific asset being valued. Major factors that influence our cash flow analysis are our estimates for future revenue and expenses associated with the use of the asset. Different estimates could have a significant impact on the results of our evaluation. If, as a result of our analysis, we determine that our amortizable intangible assets or other long-lived assets have been impaired, we will recognize an impairment loss in the period in which the impairment is determined. Any such impairment charge could be significant and could have a material negative effect on our results of operations.
39
Table of Contents
Our impairment evaluation of goodwill is based on comparing the fair value to the carrying value of our reporting units. The reporting units’ fair value is measured using a combination of the income approach, utilizing the discounted cash flow method that incorporates our estimates of future revenues and costs for our business, and the public company comparables approach, utilizing multiples of profit measures in order to estimate the fair value of the reporting units. The estimates we use in evaluating goodwill are consistent with the plans and estimates that we use to manage our operations. If we fail to deliver new products, if the products fail to gain expected market acceptance, or if market conditions fail to materialize as anticipated, our revenue and cost forecasts may not be achieved and we may incur charges for goodwill impairment, which could be significant and could have a material negative effect on our results of operations.
The net book values of these tangible and intangible long-lived assets at December 31, 2009 and 2008 were as follows:
| Years ended December 31, | |||||||
| 2009 | 2008 | ||||||
| Amount | Amount | Amount | |||||
| (in millions) | |||||||
| Property and equipment, net |
$ | 2.1 | RMB14.4 | RMB18.0 | |||
| Goodwill |
28.8 | 196.9 | 116.6 | ||||
| Intangible assets, net |
17.0 | 115.8 | 120.6 | ||||
| Total net book value |
$ | 47.9 | RMB327.1 | RMB255.2 | |||
Allowance for Doubtful Accounts. We establish an allowance for doubtful accounts primarily based upon the age of receivables and factors surrounding the credit risk of specific customers. We generally do not require collateral or other security from our customers. As of December 31, 2009, our accounts receivable balance was RMB617.6 million ($90.5 million), net of a RMB73.3 million ($10.7 million) allowance for doubtful accounts. As our business grows, we expect our accounts receivable balance to increase, as could our allowance for doubtful accounts. If the financial condition of our customers deteriorates, our uncollectible accounts receivable could exceed our current or future allowances.
Share-based Compensation. We applied ASC 718, Compensation—Stock Compensation (formerly SFAS No. 123R, Share-Based Payment). ASC 718 requires that all share-based compensation be recognized as an expense in the consolidated financial statements and that such cost be measured at the fair value of the award and requires compensation cost to reflect estimated forfeitures. The determination of the fair value of share-based compensation awards on the date of grant using an option-pricing model is affected by our stock price as well as assumptions regarding a number of complex and subjective variables, including our expected stock price volatility over the term of the awards, actual and projected share option exercise behaviors, risk-free interest rate and expected dividends. Furthermore, we estimate forfeitures at the time of grant and record share-based compensation expense only for those awards that are expected to vest. If actual forfeitures differ from those estimates, we revise the estimates used in subsequent periods which will affect the amount of employee share-based compensation expenses we recognize in our consolidated financial statements. ASC 718 was adopted using the modified prospective method of application. Under this method, we record share-based compensation expense for awards granted prior to, but not yet vested as of January 1, 2006 and for share-based awards granted after January 1, 2006. Compensation cost is recognized on a straight line basis over the requisite service period, which is generally the same as the vesting period. Since the adoption of ASC 718, we have only granted equity share unit and performance shares to minimize the level of estimation. Our share-based compensation expense for the years ended December 31, 2009 and 2008 was RMB59.1 million ($8.7 million) and RMB40.7 million, respectively.
40
Table of Contents
We currently use authorized shares to satisfy share award exercises.
Allowance for Obsolete Inventories. We established inventory allowance for estimated obsolescence or unmarketable inventory in an amount equal to the difference between the cost of inventory and its estimated realizable value based upon assumptions about future demand and market conditions. Management records a write-down against inventory based on several factors, including expected sales price of the item and the length of time the item has been in inventory. If actual demand and market conditions are less favorable than those projected by management, additional inventory allowance could be required. In that event, our gross margin would be reduced.
Taxation. We provide for income taxes in accordance with the provisions of ASC 740, Income Taxes (formerly SFAS No. 109, “Accounting for Income Taxes”). Deferred tax assets and liabilities are recognized consistent with the asset and liability method required by ASC 740. Our deferred tax assets and liabilities primarily result from temporary differences between the amounts recorded in our consolidated financial statements and the tax basis of our assets and liabilities.
At each balance sheet date, management assesses the need to establish a valuation allowance that reduces deferred tax assets when it is more likely than not that all, or some portion, of the deferred tax assets will not be realized. A valuation allowance would be based on all available information including our assessment of uncertain tax positions and projections of future taxable income from each tax-paying component in each jurisdiction, principally derived from business plans and available tax planning strategies. The deferred tax asset balance is analyzed regularly by management. Based on these analyses, we have determined that our deferred tax asset is irrecoverable and full valuation allowance is provided as of December 31, 2009. Projections of future taxable income incorporate several assumptions of future business and operations that are apt to differ from actual experience. If, in the future, our assumptions and estimates that resulted in our forecast of future taxable income for each tax-paying component prove to be incorrect, the valuation allowance against our deferred tax asset may be adjusted.
On January 1, 2007, we adopted the provisions of FIN 48, Accounting for Uncertainty in Income Taxes, which is codified as ASC740-10-25. As a result, we apply a more likely than not recognition threshold for all tax uncertainties. ASC 740-10-25 only allows the recognition of those tax benefits that have a greater than 50% likelihood of being sustained upon examination by the taxing authorities. As of December 31, 2009, all uncertain tax positions were considered to be more likely than not to be sustained upon examination by the relevant authorities. If, in the future, our assumptions and estimates that resulted in the determination of sustainability prove to be incorrect, a tax expense adjustment may be necessary.
41
Table of Contents
Results of Operations
Year ended December 31, 2009 compared to year ended December 31, 2008
Net Revenue. Total net revenue increased RMB136.7 million ($20.0 million), or 7.0%, in 2009 when compared to 2008. The increase was mainly due to growing demand in the industrial applications end-market, but partly offset by a decrease in telecommunications equipment revenue as a result of a strategic reduction in selling price in order to maintain the sales volume and market share.
Product Sales
Details of product sales by product type for the years ended December 31, 2009 and 2008 were as follows:
| Years ended December 31, | ||||||||||||||||
| 2009 | 2009 | 2008 | 2008 | |||||||||||||
| (in millions, except for percentages) | ||||||||||||||||
| Amount | % of Net Revenue |
Amount | % of Net Revenue |
% change | ||||||||||||
| Digital media |
$ | 185.6 | RMB1,267.1 | 60.4 | % | RMB1,279.7 | 65.3 | % | (1.0 | )% | ||||||
| Telecommunications equipment |
76.8 | 523.9 | 25.0 | 563.4 | 28.8 | (7.0 | ) | |||||||||
| Industrial business |
40.4 | 275.8 | 13.2 | 88.7 | 4.5 | 210.9 | ||||||||||
| Total product sales |
$ | 302.8 | RMB2,066.8 | 98.6 | % | RMB1,931.8 | 98.6 | % | 7.0 | % | ||||||
Product sales for the year ended 2009 was RMB2,066.8 million ($302.8 million), or RMB135.0 million ($19.8 million), higher than the year ended 2008. Digital media related sales decreased by RMB12.6 million ($1.8 million), or 1.0%, telecommunications equipment related sales decreased by RMB39.5 million ($5.8 million), or 7.0%, and industrial business related sales increased by RMB187.1 million ($27.4 million), or 210.9%. The increase in product sales was mainly attributable to the Group’s continued effort and strategic focus in the expansion of the industrial business end-market, and increased sales volume, which resulted from an increase in customer base and an increase in our product variety for all product markets offset by lower selling prices (which attracted additional customers), particularly for mobile handset and telecommunications equipment products. The wider variety of component solutions drove an increase in sales orders from some existing customers such as ZTE and T&W. The contribution to total net revenue by digital media sales in 2009 decreased to RMB1,267.1 million ($185.6 million), or 60.4% of total net revenue, from RMB1,279.7 million, or 65.3% of total net revenue, in 2008. The contribution to total net revenue by telecommunications equipment sales in 2009 decreased to RMB 523.9 million ($76.8 million), or 25.0% of total net revenue, from RMB563.4 million, or 28.8% of total net revenue in 2008. The contribution to total net revenue by industrial business sales increased, from RMB88.7 million or 4.5% in 2008 to RMB275.8 million ($40.4 million) or 13.2% in 2009.
42
Table of Contents
Services Revenue. Services revenue for the years ended December 31, 2009 and 2008 were as follows:
| Years ended December 31, | |||||||||||||||
| 2009 | 2009 | 2008 | 2008 | ||||||||||||
| Amount | % of Net Revenue |
Amount | % of Net Revenue |
||||||||||||
| (in millions, except for percentages) | |||||||||||||||
| Services revenue |
$ | 4.3 | RMB | 29.4 | 1.4 | % | RMB | 27.7 | 1.4 | % | |||||
Services revenue was derived from the provision of technology and engineering services, software design, network system integration and related training and maintenance services. The increase of RMB1.7 million ($0.2 million), or 6.1%, was mainly attributable to more sales generated from software design services in 2009, such as MS software for embedded systems, as compared to 2008.
Gross Profit. Gross profit was RMB301.3 million ($44.1 million) in 2009, a decrease of RMB15.5 million ($2.3 million), or 4.9%, when compared to RMB316.8 million in 2008. Gross margin was 14.4% in 2009, compared to 16.2% in 2008. The decrease in both gross profit and percentage is primarily attributable to reduced selling prices for mobile handset and telecommunications equipment products, partly offset by an increase in industrial business revenue, which has a higher margin than the other markets in which we operate. The comparatively higher margin in industrial business revenue was driven by the growth prospects on the small and medium-sized customers with large spending on projects like smart grid, smart meter and railways.
Selling, General, Administrative, Research & Development Expenses, provision for doubtful accounts and impairment loss of goodwill and intangible assets. Selling, general and administrative, R&D expenses and provision for doubtful accounts and were RMB228.3million ($33.4 million) in the year ended 2009, or 6.6% lower than those of the same period the prior year. The expenses for the years ended December 31, 2009 and 2008 were as follows:
| Years ended December 31, | |||||||||||||||
| 2009 | 2009 | 2008 | 2008 | ||||||||||||
| Amount | Amount | % of Net Revenue |
Amount | % of Net Revenue |
|||||||||||
| (in millions, except for percentages) | |||||||||||||||
| Selling expenses |
$ | 5.2 | RMB | 35.4 | 1.7 | % | RMB | 38.9 | 2.0 | % | |||||
| General and administrative expenses |
13.1 | 89.4 | 4.3 | 114.0 | 5.8 | ||||||||||
| R&D expenses |
9.9 | 67.5 | 3.2 | 51.0 | 2.6 | ||||||||||
| Provision for doubtful accounts |
5.3 | 36.0 | 1.7 | 6.8 | 0.3 | ||||||||||
| Impairment loss of goodwill and intangible assets |
— | — | — | 33.8 | 1.7 | ||||||||||
| Total |
$ | 33.5 | RMB | 228.3 | 10.9 | % | RMB | 244.5 | 12.4 | % | |||||
Selling, General and Administrative Expenses. The decrease in selling expenses in 2009 of RMB3.5 million ($0.5 million), or 9.0%, was mainly attributable to the reduced expenditures on other indirect selling expenses such as travelling and promotion expenses. Stock based compensation expense was also decreased in 2009, as compared to 2008.
43
Table of Contents
The decrease in general and administrative expenses of RMB24.6 million ($3.6 million), or 21.6%, was primarily attributable to foreign currency exchange gain of RMB14.4 million ($2.1 million), mainly consisting of RMB14.9 million ($2.2 million) unrealized gain resulted by the appreciation of Australian Dollars against RMB during 2009, as compared to exchange loss of RMB19.5 million for the same period of 2008, and offset by an increase in other general and administrative expenses such as staff cost and office rental due to an increase in headcount as a result of our acquisition of Long Rise in July 2008 and Mega Smart in May 2009.
R&D Expenses. R&D expenses increased in 2009 by RMB16.5 million ($2.4 million), or 32.4%, as compared to 2008. The increase was primarily attributable to the increase in share based compensation cost of RMB19.3 million ($2.8 million) as a result of additional R&D personnel and engineers and research expenditures spent for potential new markets, such as industrial business.
Provision for Doubtful Accounts. Additional charge of doubtful account of RMB 36.0 million ($5.3 million) was made in 2009, as compared to RMB 6.8 million made in 2008. The additional charge of doubtful accounts was due to certain receivable balance being overdue in which the assessment of recoverability is remote.
Interest Expense. Interest expense increased in 2009 by RMB0.9 million ($0.1 million) or 81.8%, as compared to 2008. The increase in interest expense was attributable to an increase in the average bank borrowing balances.
Interest Income. Interest income in 2009 amounted to RMB14.5 million ($2.1 million), compared to RMB27.9 million in 2008. The decrease by RMB13.4 million ($2.0 million) was mainly attributable to a decrease in average interest rates as compared to 2008.
Income Tax. The effective tax rate for 2009 was 10.8% compared to 2.2% for 2008. The increase in effective tax rate was contributed by the transitional tax rates under the PRC CIT law of 18% in 2008 to 20% in 2009 and the expiry of tax holiday for certain Shenzhen subsidiaries.
Extraordinary Item. On August 28, 2009, the Company and the seller of Keen Awards agreed that the contingency in respect of the acquisition for Keen Awards was resolved and the Company determined that no further consideration was payable. Therefore, because the amount of contingent consideration recognized, as if it were a liability, exceeded the amount settled, the excess of RMB29.1 million ($4.3 million) was first allocated to reduce the assets acquired being the intangibles asset of RMB26.8 million ($3.9 million) net of deferred taxation in respect of intangible assets of Keen Awards of RMB4.4 million ($0.6 million) and remaining amount of RMB6.7 million ($1.0 million) was recognized as an extraordinary gain in the consolidated statements of income and comprehensive income.
Noncontrolling Interest. Noncontrolling interest consisted of 30% of the outstanding equity interest in Long Rise. For the year ended December 31, 2009, net income attributable to noncontrolling interest amounted to RMB2.9 million ($0.4 million).
Net Income and Earnings Per Share attributable to Cogo Group, Inc. As a result of the above items, net income attributable to Cogo Group, Inc. for 2009 was RMB80.2 million ($11.8 million), compared to net income attributable to Cogo Group, Inc. of RMB95.9 million in 2008. We reported basic per share earnings of RMB2.2 ($0.32) for 2009, based on 36,541,037 outstanding weighted average shares, and a diluted per share earnings of RMB2.13 ($0.32), based on 37,673,351 outstanding weighted average shares, compared to basic per share earnings of RMB2.49 for 2008, based on 38,488,861 outstanding weighted average shares, and a diluted per share earnings of RMB2.42, based on 39,585,921 outstanding weighted average shares.
44
Table of Contents
Year ended December 31, 2008 compared to year ended December 31, 2007
Net Revenue. Total net revenue increased RMB293.0 million, or 17.6%, in 2008 when compared to 2007. The increase was mainly due to an increase in product sales by approximately RMB334.0 million, but partly offset by a decrease in services revenue of RMB41.0 million.
Product Sales
Details of product sales by product type for the years ended December 31, 2008 and 2007 were as follows:
| Years ended December 31, | |||||||||||||||
| 2008 | 2007 | ||||||||||||||
| (in millions, except for percentages) | |||||||||||||||
| Amount | % of Net Revenue |
Amount | % of Net Revenue |
% Change | |||||||||||
| Digital Media |
RMB | 1,279.7 | 65.3 | % | RMB | 1,088.7 | 65.4 | % | 17.5 | % | |||||
| Telecommunications equipment |
563.4 | 28.8 | 509.1 | 30.5 | 10.7 | ||||||||||
| Industrial business |
88.7 | 4.5 | — | — | — | ||||||||||
| Total product sales |
RMB | 1,931.8 | 98.6 | % | RMB | 1,597.8 | 95.9 | 20.9 | % | ||||||
Product sales for the year ended 2008 was RMB1,931.8 million, or 20.9%, higher than the year ended 2007. Digital media related sales increased by RMB191.0 million, or 17.5%, and telecommunications equipment related sales increased by RMB54.3 million, or 10.7%. In 2008, we had a new market, industrial business, which contributed RMB88.7 million of sales for the year ended 2008. The increase in product sales was mainly attributable to increased sales volume, which resulted from an increase in customer base, an increase in our product variety for all product markets and lower selling prices (which attracted additional customers), particularly for mobile handset products in the digital media market. The wider variety of component solutions drove an increase in sales orders from some existing customers such as ZTE and T&W. The contribution to total net revenue by digital media sales was consistent from RMB1,088.7 million, or 65.4% in 2007, to RMB1,279.7 million, or 65.3% of total net revenue, in 2008. Though we had an increase in revenue for telecommunications equipment related sales, its contribution to total net revenue decreased from 30.5% in 2007 to 28.8% in 2008.
Services Revenue. Services revenue for the years ended December 31, 2008 and 2007 were as follows:
| Years ended December 31, | ||||||||||||
| 2008 | 2007 | |||||||||||
| (in millions, except for percentages) | ||||||||||||
| Amount | % of Net Revenue |
Amount | % of Net Revenue |
|||||||||
| Services revenue |
RMB | 27.7 | 1.4 | % | RMB | 68.7 | 4.1 | % | ||||
45
Table of Contents
Services revenue was derived from the provision of technology and engineering services, software design, network system integration and related training and maintenance services. The decrease of RMB41.0 million ($6.0 million), or 59.7%, was mainly attributable to our strategic focus on lower-end product markets.
Gross Profit. Gross profit was RMB316.8 million in 2008, a decrease of RMB6.1 million ($0.9 million), or 1.9% when compared to RMB322.9 million in 2007. Gross margin was 16.2% in 2008, compared to 19.4% in 2007. The decrease in both gross profit and percentage is primarily attributable to reduced selling prices for mobile handset products and a decrease in services revenue, which has a higher margin than the other markets in which we operate.
Selling, General, Administrative, Research & Development Expenses, provision for doubtful accounts and impairment loss of goodwill and intangible assets. Selling, general and administrative, R&D expenses, provision for doubtful accounts and impairment loss of goodwill and intangible assets were RMB244.5 million in the year ended 2008, or 38.4% higher than those of the same period the prior year. The expenses for the years ended December 31, 2008 and 2007 were as follows:
| Years ended December 31, | ||||||||||||
| 2008 | 2007 | |||||||||||
| (in millions, except for percentages) | ||||||||||||
| Amount | % of Net Revenue |
Amount | % of Net Revenue |
|||||||||
| Selling expenses |
RMB | 38.9 | 2.0 | % | RMB | 37.7 | 2.3 | % | ||||
| General and administrative expenses |
114.0 | 5.8 | 82.8 | 4.9 | ||||||||
| R&D expenses |
51.0 | 2.6 | 41.0 | 2.5 | ||||||||
| Provision for doubtful accounts |
6.8 | 0.3 | 15.1 | 0.9 | ||||||||
| Impairment loss of goodwill and intangible assets |
33.8 | 1.7 | — | — | ||||||||
| Total |
RMB | 244.5 | 12.4 | % | RMB | 176.6 | 10.6 | % | ||||
Selling, General and Administrative Expenses. The increase in selling expenses in 2008 of RMB1.2 million, or 3.2%, was mainly attributable to an increase in other selling expenses such as freight charges of approximately RMB1.3 million as a result of increased sales volume.
The increase in general and administrative expenses of RMB31.2 million, or 37.7%, was primarily attributable to an increase in amortization of intangible assets of RMB15.3 million, increased foreign exchange loss of RMB11.7 million, an increase in share-based compensation cost of RMB7.0 million. The increase was offset in part by a decrease in general administrative expenses of RMB2.8 million.
R&D Expenses. R&D expenses increased in 2008 by RMB10.0 million, or 24.4%, as compared to 2007. The increase was primarily attributable to the increase in in-process research and development of RMB4.4 million and R&D personnel and engineers and additional research expenditures spent for potential new markets, such as industrial business.
46
Table of Contents
Provision for Doubtful Accounts. Additional charge of doubtful accounts of RMB6.8 million was made in 2008, as compared to RMB15.1 million made in 2007. The additional charge of doubtful accounts was due to certain receivable balance being overdue in which the assessment of recoverability is remote.
Interest Expense. Interest expense decreased in 2008 by RMB1.2 million or 52.2%, as compared to 2007. The decrease in interest expense was attributable to a decrease in average interest rate and the average bank borrowing balances.
Interest Income. Interest income in 2008 amounted to RMB27.9 million, compared to RMB25.6 million in 2007. The increase by RMB2.3 million was mainly attributable to the net proceeds of approximately $83.3 million from the underwritten offering in April 2007.
Income Tax. The effective tax rate for 2008 was 2.2% compared to 8.4% for 2007. Included in the income tax expense for the year ended December 31, 2008 was a deferred income tax benefit of RMB10.8 million as a result of the amortization of intangible assets and impairment of goodwill and intangible assets of RMB28.7 million and RMB33.8 million, respectively.
Net Income; Earnings Per Share. As a result of the above items, net income for 2008 was RMB95.9 million, compared to net income of RMB152.4 million in 2007. We reported basic per share earnings of RMB2.49 for 2008, based on 38,488,861 outstanding weighted average shares, and a diluted per share earnings of RMB2.42, based on 39,585,921 outstanding weighted average shares, compared to basic per share earnings of RMB4.12 for 2007, based on 36,974,100 outstanding weighted average shares, and a diluted per share earnings of RMB3.98, based on 38,306,969 outstanding weighted average shares.
47
Table of Contents
Quarterly Results of Operations
The following table presents our supplemental selected unaudited quarterly results of operations for the eight quarters prior to and including the quarter ended December 31, 2009. You should read the following table in conjunction with our audited consolidated financial statements and related notes contained elsewhere in this Form 10-K. In our management’s opinion, we have prepared our unaudited quarterly results of operations on substantially the same basis as our audited consolidated financial statements. Due to the evolving nature of our business and other factors affecting our business as described under “Item 1A. Risk factors”, our results of operations for any quarter are not necessarily indicative of results that may be expected for any future periods.
| For the three months ended, | ||||||||||||||||
| Dec 31, 2009 |
Sept 30, 2009 |
June 30, 2009 |
Mar 31, 2009 |
Dec 31, 2008 |
Sept 30, 2008 |
June 30, 2008 |
Mar. 31, 2008 | |||||||||
| (in millions of RMB, except per share data) | ||||||||||||||||
| Net revenue |
601.3 | 560.0 | 502.6 | 432.3 | 561.8 | 507.8 | 467.9 | 422.0 | ||||||||
| Gross profit |
87.5 | 80.8 | 71.6 | 61.4 | 80.0 | 70.2 | 84.2 | 82.4 | ||||||||
| Net income attributable to Cogo Group Inc. |
29.3 | 23.0 | 17.3 | 10.6 | 5.1 | 9.4 | 44.4 | 37.0 | ||||||||
| Earnings per share |
||||||||||||||||
| Basic |
0.79 | 0.62 | 0.48 | 0.30 | 0.14 | 0.24 | 1.14 | 0.95 | ||||||||
| Diluted |
0.77 | 0.61 | 0.46 | 0.29 | 0.14 | 0.24 | 1.11 | 0.93 | ||||||||
The overall increase in our net revenue over the past two years was consistent with (1) the Group’s continued effect and strategic focus in the expansion of the industrial business end-market, and (2) a wider variety of products (due to the various acquisitions made since 2006 which brought new businesses to the Group) generating revenue.
The gradual increase in gross profit in 2009 was primarily attributable to an increase in industrial business related sales and increased sales volume for mobile handset and telecommunications equipment products as a result of reduced selling price.
The increase in our net income attributable to Cogo Group, Inc. in the later half of 2009 was primarily due to increased revenue amount and operating profit.
48
Table of Contents
Recently Issued Accounting Pronouncements
Since the third quarter of 2009, we adopted the Financial Accounting Standards Board (“FASB”) Accounting Standards Codification (“ASC”). The ASC is the single official source of authoritative, nongovernmental GAAP, other than guidance issued by the SEC. The adoption of the ASC did not have any impact on the financial statements included herein.
ASC 805, Business Combinations and ASC 810, Consolidation
In December 2007, the FASB issued SFAS No. 141(R), Business Combinations (codified as ASC 805, Business Combinations) and SFAS No. 160, Noncontrolling Interests in Consolidated Financial Statements – an amendment to ARB No. 51 (codified as ASC 810, Consolidation). ASC 805 and ASC 810 require most identifiable assets, liabilities, noncontrolling interests and goodwill acquired in a business combination to be recorded at “full fair value” and require noncontrolling interests (previously referred to as minority interest) to be reported as a component of equity, which changes the accounting for transactions with noncontrolling interest holders. The amendments to ASC 805 were effective for business combinations closing after January 1, 2009. Effective January 1, 2009, the Group adopted the provisions of ASC 805 without a material impact to the consolidated financial statements. ASC 810 requires the Company to make certain changes to the presentation of financial statements. This standard requires the Company to classify noncontrolling interests (previously referred to as “minority interest”) as part of consolidated net income and to include the accumulated amount of noncontrolling interests as part of equity. The net income amounts the Company has previously reported are now presented as “Net income attributable to the Cogo Group, Inc.” and, as required by ASC 810, earnings per share continues to reflect amounts attributable only to the Company. Similarly, in the presentation of equity, the Company distinguishes between equity amounts attributable to Cogo Group, Inc. stockholders and the amounts attributable to the noncontrolling interests were previously classified as minority interest outside of equity.
ASC 855, Subsequent events
In May 2009, the FASB issued SFAS No. 165, Subsequent Events, which was primarily codified into ASC 855 – Subsequent Events. ASC 855 sets forth: (1) the period after the balance sheet date during which management of a reporting entity should evaluate events or transactions that may occur for potential recognition or disclosure in financial statements, (2) the circumstances under which an entity should recognize events or transactions occurring after the balance sheet date in its financial statements and (3) the disclosures that an entity should make about events or transactions that occurred after the balance sheet date. The Group has evaluated the period beginning January 1, 2010 through to March 12, 2010, the date the consolidated financial statements were issued. See Note 9 to the consolidated financial statements.
Accounting Standards Update (“ASU”) 2009-05, an update to ASC 820, Fair Value Measurements and Disclosures
In August 2009, the FASB issued ASU 2009-05, an update to ASC 820, Fair Value Measurements and Disclosures. This update provides amendments to reduce potential ambiguity in financial reporting when measuring the fair value of liabilities. Among other provisions, this update provides clarification that in circumstances in which a quoted price in an active market for the identical liability is not available, a reporting entity is required to measure fair value using one or more of the valuation techniques described in ASU 2009-05. ASU 2009-05 is effective in the current financial period. The Company has evaluated that there are no significant impacts to the consolidated financial statements.
49
Table of Contents
ASU 2009-13, Revenue Recognition (ASC 605) – Multiple-Deliverable Revenue Arrangements and ASU 2009-14, Software (ASC 985) – Certain Revenue Arrangements That Include Software Elements
In September 2009, the FASB reached a consensus on ASU 2009-13, Revenue Recognition (ASC 605) – Multiple-Deliverable Revenue Arrangements and ASU 2009-14, Software (ASC 985) – Certain Revenue Arrangements That Include Software Elements. ASU 2009-13 modifies the requirements that must be met for an entity to recognize revenue from the sale of a delivered item that is part of a multiple-element arrangement when other items have not yet been delivered. ASU 2009-13 eliminates the requirement that all undelivered elements must have either: i) vendor-specific objective evidence (“VSOE”) or ii) third-party evidence (“TPE”), before an entity can recognize the portion of an overall arrangement consideration that is attributable to items that already have been delivered. In the absence of VSOE or TPE of the standalone selling price for one or more delivered or undelivered elements in a multiple-element arrangement, entities will be required to estimate the selling prices of those elements. Overall arrangement consideration will be allocated to each element (both delivered and undelivered items) based on their relative selling prices, regardless of whether those selling prices are evidenced by VSOE or TPE or are based on the entity’s estimated selling price. The residual method of allocating arrangement consideration has been eliminated. ASU 2009-14 modifies the software revenue recognition guidance to exclude from its scope tangible products that contain both software and non-software components that function together to deliver a product’s essential functionality. These new updates are effective for revenue arrangements entered into or materially modified in fiscal years beginning on or after June 15, 2010. Early adoption is permitted. The Company has evaluated that there are no impacts that the adoption of these ASUs will have on the consolidated financial statements.
Liquidity and Capital Resources
Cash Flows and Working capital
Our accounts payable cycle typically averages approximately one month, whereas our receivables cycle typically averages approximately three to four months. Accordingly, additional working capital, being current assets less current liabilities, is needed to fund this timing difference.
As at December 31, 2009, apart from the cash payable in relation to our acquisition of the subsidiaries, we had no material commitments for capital expenditures.
As of December 31, 2009, we had approximately RMB667.3 million ($97.8 million) in cash. We regularly review our cash funding requirements and attempt to meet those requirements through a combination of cash on hand, cash provided by operations, available borrowings under bank lines of credit and factoring facilities and possible future public or private equity offerings. At times, we may evaluate possible acquisitions of, or investments in, businesses that are complementary to ours, which may require the use of cash. We believe that our cash, increased operating cash flows, credit arrangements, and access to equity and debt capital markets, taken together, provide adequate resources to fund our ongoing operating expenditures for the next 12 months. In the event that they do not, we may require additional funds in the future to support our working capital requirements or for other purposes and may seek to raise such additional funds through the sale of public or private equity, as well as from other sources.
As of December 31, 2009, we had working capital of RMB1,243.6 million ($182.2 million), including RMB667.3 million ($97.8 million) in cash, as compared with working capital of RMB1,172.3 million including RMB686.4 million in cash as of December 31, 2008.
Operating activities used cash of RMB33.5 million ($4.9 million) for the year ended December 31, 2009, compared to cash generated of RMB97.5 million for the year ended December 31, 2008. The increase in cash used in operating activities as compared to the prior year was primarily due to an increase in accounts receivables as sales increased in the fourth quarter of 2009 which have not been settled.
50
Table of Contents
Operating activities provided cash of RMB97.5 million for the year ended December 31, 2008. The increase in cash generated from operating activities as compared to the prior year was primarily due to tighter inventory purchase control.
Investing activities used RMB91.6 million ($13.4 million) during 2009, mainly for payments for acquisitions of subsidiaries, net of cash acquired of RMB89.2 million ($13.1 million) and purchases of property and equipment of RMB2.4 million ($0.4 million). Investing activities used RMB117.8 million during 2008, mainly for an increase in pledged bank deposits of RMB69.0 million and payments for the acquisition of subsidiaries of RMB41.3 million. The remaining major investing activities were the purchases of fixed assets of RMB7.5 million.
Financing activities provided cash of RMB105.9 million ($15.5 million) during 2009, primarily for proceed from bank borrowings of RMB 119.5 million ($17.5 million) and proceeds from exercises of stock warrants and options of RMB 2.0 million ($0.3 million), partly offset by purchase of treasury stock of RMB15.6 million ($2.3 million). Financing activities used net cash of RMB180.6 million during 2008, primarily for purchase of treasury stock of RMB162.7 million and repayment of bank borrowings of RMB18.0 million.
Distributions by our PRC operating companies to us may be subject to governmental approval and taxation. Any transfer of funds from us to our PRC operating companies, either as a shareholder loan or as an increase in registered capital, is subject to registration or approval with or by PRC governmental authorities, including the relevant administration of foreign exchange and/or other relevant examining and approval authorities. These limitations on the free flow of funds between us and our PRC operating companies may restrict our ability to act in response to changing market conditions. To date, none of our PRC operating companies, including Shenzhen Comtech and Shanghai E&T, have declared or paid dividends to us, and historically, we have not relied on such distributions for our liquidity needs. In addition, we have not declared dividends since the share exchange transaction. Our holding companies have no business operations and therefore the related expenses are relatively low, consisting mainly of legal, accounting and other fees and expenses associated with being a holding company or, in the case of Cogo Group, Inc., a public company. Our major operating companies, Comtech Hong Kong, Comtech Broadband and Comtech Industrial, Hong Kong incorporated companies, and Comtech Communication, Comtech Software and Viewtran, wholly owned foreign enterprises, are legally permitted to declare and pay dividends, enabling them to provide any funds necessary to meet the holding companies’ limited operating expenses, although in the case of a wholly owned foreign enterprise, such dividends would be subject to the conditions described in “Risk Factors—PRC laws and our corporate structure may restrict our ability to receive dividend payments from, and transfer funds to, our PRC operating companies, which may negatively affect our results of operations and restrict our ability to act in response to changing market conditions.” We do not expect restrictions between us and our PRC operating companies to affect our liquidity and capital resources in the near future. For risks associated with the uncertainty in our receipt of the equivalent economic interest in connection with the equity interest in Shenzhen Comtech, see “Risk factors—PRC laws and our corporate structure may restrict our ability to receive dividends and payments from, and transfer funds to, our PRC operating companies, which may negatively affect our results of operations and restrict our ability to act in response to changing market conditions.”
51
Table of Contents
Our PRC operating companies are required, where applicable, to allocate a portion of their net profit to certain funds before distributing dividends, including at least 10% of their net profit to certain reserve funds until the balance of such fund has reached 50% of their registered capital. These reserves can only be used for specific purposes, including making-up cumulative losses of previous years, conversion to equity capital, and application to business expansion, and are not distributable as dividends. Our PRC operating subsidiaries are required, where applicable, to allocate an additional 5% to 10% of their net profits to a statutory common welfare fund. These reserves can only be used for specific purposes and are not distributable as dividends. For risks associated with the uncertainty in our receipt of the equivalent economic interest in connection with the equity interest in Shenzhen Comtech or Shanghai E&T, see “Risk factors—PRC laws and our corporate structure may restrict our ability to receive dividends and payments from, and transfer funds to, our PRC operating companies, which may negatively affect our results of operations and restrict our ability to act in response to changing market conditions.”
Indebtedness
On October 7, 2005, the Group entered into a $5 million U.S. dollar denominated credit facility with Standard Chartered Bank (Hong Kong) Limited, or SCB, and a $9 million U.S. dollar denominated facility with Bank of China, or BOC. In 2006, BOC increased the amount available under the facility $15 million. Both of the SCB and BOC facilities are guaranteed by Cogo Group, Inc. On October 10, 2008, the amount available under the facility in BOC was increased to $41 million. Apart from income from operations, these revolving credit facilities serve as our principal source of liquidity to fund our working capital needs.
As of December 31, 2009, the outstanding loan balance under the SCB facility was RMB31.0 million. This facility is secured by funds on deposit in an amount not less than $2 million, and bears interest from 1.5% per annum over HIBOR or U.S. prime, depending on different kinds of borrowings made. The SCB facility is repayable on demand and SCB may immediately terminate the facility without our consent or that of any third party.
As of December 31, 2009, RMB34.0 million was outstanding under the BOC facility. This facility is secured by funds on deposit in an amount not less than $15 million, and bears interest from LIBOR plus 2.25% per annum, depending on different kinds of borrowings made and is used to settle foreign exchange obligations to the extent needed. The facility is repayable on demand and BOC may increase, reduce and/or cancel the facility by notice to us.
On November 18, 2009, the Group entered into a RMB65.0 million credit facility with Shenzhen Futian Branch of GuangDong Development Bank (“GDB”). The facility is valid for 12 months commencing November 18, 2009 and terminating on November 17, 2010, and loans under the Facility bear interest at the 3-month LIBOR rate, plus 150 basis points. GDB may terminate the facility if the Group does not regain its ability to perform its obligations and cannot provide guarantees acceptable to GDB within 30 days after it ceases performing it obligations. As of December 31, 2009, the outstanding loan balance under the GDB facility was RMB54.4 million.
On January 22, 2010, the Group entered into a Credit Extension Agreement with GDB which established a revolving secured trade finance term loan under which the Group may borrow up to HK150.0 million or its equivalent amount in USD for the purpose of purchasing goods. The credit extension is valid for 12 months commencing January 22, 2010, and loans under the Credit Extension Agreement bear an interest rate of 3-month LIBOR or HIBOR rate plus 1.5% per annum, depending on the drawdown currency.
52
Table of Contents
Some of our customers enter into arrangements with their respective banks for purposes of settling their bills. Under such arrangements, we are entitled to collect the amounts owed directly from the customers’ banks when the invoice becomes due. In certain circumstances, we have arranged to transfer with recourse certain of our bills receivable to the bank. Under this discounting arrangement, the bank pays a discounted amount to us and collects the amounts owed from the customers’ banks. The discount typically ranges from 0.1% to 1.5% of the balance transferred, which is recorded as interest expense. For the year ended December 31, 2009, we had received proceeds from the sales of the bills receivable amounting to RMB72.6 million ($10.6 million), compared with RMB74.6 million for the previous year.
Contractual Obligations and Commercial Commitments
The following table sets forth our contractual payment obligations for operating leases and purchase obligations as of December 31, 2009:
| Payments due by Period | ||||||||||
| Contractual Obligations |
Total | Less than 1 year |
1-3 Years | 3-5 Years | More Than 5 Years | |||||
| (in millions of RMB) | ||||||||||
| Operating lease obligations |
4.5 | 4.5 | — | — | — | |||||
| Purchase obligations |
774.5 | 774.5 | — | — | — | |||||
| Payable for acquisitions |
121.5 | 121.5 | — | — | — | |||||
| Total |
900.5 | 900.5 | — | — | — | |||||
Operating lease obligations consist primarily of operating lease agreements for our office facilities, including our head office and research center in Shenzhen. Our leases have remaining terms ranging from one to 12 months.
Purchase obligations consists of outstanding purchase orders for components from our suppliers. We do not have any minimum purchase obligations with these suppliers.
Payable for acquisitions consists of amounts payable by us in relation to our acquisition of the remaining 45% noncontrolling interest of Comtech Broadband Corporation Limited in 2007, 70% of Long Rise in 2008 and 100% of Mega Smart in 2009.
Off-Balance Sheet Arrangements
Apart from the discounting of receivables discussed under “Indebtedness” and operating lease obligations discussed under “Contractual Obligations,” we have no outstanding off-balance sheet arrangements, derivative financial instruments, interest rate swap transactions or foreign currency forward contracts. We do not engage in trading activities involving non-exchange traded contracts.
| ITEM 7A. | QUANTITATIVE AND QUALITATIVE DISCLOSURES ABOUT MARKET RISK |
Foreign Exchange Risk
Our reporting currency is the Renminbi. Transactions in other currencies are recorded in Renminbi at the rates of exchange prevailing when the transactions occur. Monetary assets and liabilities denominated in other currencies are remeasured into Renminbi at rates of exchange in effect at the balance sheet dates. Exchange gains and losses are recorded in our statements of operations as a component of current period earnings.
53
Table of Contents
The SAFE of the PRC, under the authority of the People’s Bank of China, controls the conversion of Renminbi into foreign currencies. The principal regulation governing foreign currency exchange in China is the Foreign Currency Administration Rules (1996), as amended, or the “Rules”. Under the Rules, once various procedural requirements are met, Renminbi is convertible for current account transactions, including trade and service-related foreign exchange transactions and dividend payments, but not for capital account transactions, including direct investment, loans or investments in securities outside China, without prior approval of the SAFE of the PRC, or its local counterparts.
Since July 2005, the Renminbi is no longer pegged to the U.S. dollar. Although currently the Renminbi exchange rate versus the U.S. dollar is restricted to a rise or fall of no more than 0.3% per day and the People’s Bank of China regularly intervenes in the foreign exchange market to prevent significant short-term fluctuations in the exchange rate, the Renminbi may appreciate or depreciate significantly in value against the U.S. dollar in the medium to long term. Moreover, it is possible that in the future, the PRC authorities may lift restrictions on fluctuations in the Renminbi exchange rate and lessen intervention in the foreign exchange market. As of December 31, 2009, the exchange rate of RMB to $1 was RMB6.8259.
We conduct substantially all of our operations through our PRC operating companies, and their financial performance and position are measured in terms of Renminbi. Our solutions are primarily procured, sold and delivered in the PRC for Renminbi. The majority of our net revenue are denominated in Renminbi.
Any devaluation of the Renminbi against the U.S. dollar would consequently have an adverse effect on our financial performance and asset values when measured in terms of U.S. dollars. On the other hand, the appreciation of the Renminbi could make our customers’ products more expensive to purchase because many of our customers are involved in the export of goods, which may have an adverse impact on their sales. A decrease in sales by our customers could have an adverse effect on our operating results. In addition, as of December 31, 2009 and 2008, we have cash denominated in U.S. dollars amounting to RMB149.4 million ($21.9 million) and RMB299.6 million. Also, from time to time we may have U.S. dollar denominated borrowings. Accordingly, a decoupling of the Renminbi many affect our financial performance in the future.
We recognized a foreign currency translation adjustment of approximately RMB0.3 million ($0.1 million) for the year ended December 31, 2009. We do not currently engage in hedging activities, as such, we may in the future experience economic loss as a result of any foreign currency exchange rate fluctuations.
Interest Rate Risk
We are exposed to interest rate risk arising from short-term variable rate borrowings from time to time. Our future interest expense will fluctuate in line with any change in our borrowing rates. We do not have any derivative financial instruments and believe our exposure to interest rate risk and other relevant market risks is not material. Our bank borrowings amounted to RMB119.4 million ($17.5 million) as of December 31, 2009. Based on the variable nature of the underlying interest rate, the bank borrowings approximated fair value at that date.
If there was a hypothetical 1% change in interest rates, the net impact to earnings and cash flows would be approximately RMB 1.2 million ($0.2 million). The potential change in cash flows and earning is calculated based on the change in the net interest expense over a one year period due to an immediate 1% change in price.
Inflation
In recent years, China has not experienced significant inflation, and thus inflation has not had a material impact on our results of operations. According to the National Bureau of Statistics of China, the change in Consumer Price Index in China was 4.8%, 5.9%, and 5.2% in 2007, 2008 and 2009 respectively.
54
Table of Contents
| ITEM 8. | FINANCIAL STATEMENTS AND SUPPLEMENTARY DATA |
The following financial statements and the footnotes thereto are included in the section beginning on page F-1.
| 1. | Reports of Independent Registered Public Accounting Firm. |
| 2. | Consolidated Balance Sheets as of December 31, 2009 and 2008. |
| 3. | Consolidated Statements of Income and Comprehensive Income for the years ended December 31, 2009, 2008 and 2007. |
| 4. | Consolidated Statements of Change in Equity for the years ended December 31, 2009, 2008 and 2007. |
| 5. | Consolidated Statements of Cash Flows for the years ended December 31, 2009, 2008 and 2007. |
| 6. | Notes to Consolidated Financial Statements. |
The Management’s Report on Internal Control over Financial Reporting, Reports of Independent Registered Public Accounting Firm, Consolidated Financial Statements and Notes to Consolidated Financial Statements which are listed in the Index to Financial Statements and which appear beginning on page F-2 of this report are incorporated into this Item 8. Quarterly Results of Operations information is included elsewhere in this report and is incorporated into this Item 8.
| ITEM 9. | CHANGES IN AND DISAGREEMENTS WITH ACCOUNTANTS ON ACCOUNTING AND FINANCIAL DISCLOSURE |
None.
| ITEM 9A. | CONTROLS AND PROCEDURES |
Evaluation of Disclosure Controls and Procedures
Based on an evaluation under the supervision of and with the participation of the Company’s management, including the Company’s Chief Executive Officer and Chief Financial Officer have concluded that the Company’s disclosure controls and procedures as defined in Rules 13a-15(e) and 15d-15(e) under the Exchange Act were effective as of December 31, 2009.
Disclosure controls and procedures are designed to provide reasonable assurance that information required to be disclosed by the Company in reports that it files or submits under the Exchange Act is (i) recorded, processed, summarized and reported within the time periods specified in the Securities and Exchange Commission rules and forms and (ii) accumulated and communicated to the Company’s management, including its Chief Executive Officer and Chief Financial Officer, as appropriate to allow timely decisions regarding required disclosure.
Inherent Limitations Over Internal Controls
The Company’s internal control over financial reporting is designed to provide reasonable assurance regarding the reliability of financial reporting and the preparation of financial statements for external purposes in accordance with GAAP. The Company’s internal control over financial reporting includes those policies and procedures that:
| (i) | pertain to the maintenance of records that, in reasonable detail, accurately and fairly reflect the transactions and dispositions of the Company’s assets; |
55
Table of Contents
| (ii) | provide reasonable assurance that transactions are recorded as necessary to permit preparation of financial statements in accordance with GAAP, and that the Company’s receipts and expenditures are being made only in accordance with authorizations of the Company’s management and directors; and |
| (iii) | provide reasonable assurance regarding prevention or timely detection of unauthorized acquisition, use, or disposition of the Company’s assets that could have a material effect on the financial statements. |
Management, including the Company’s Chief Executive Officer and Chief Financial Officer, does not expect that the Company’s internal controls will prevent or detect all errors and all fraud. A control system, no matter how well designed and operated, can provide only reasonable, not absolute, assurance that the objectives of the control system are met. Further, the design of a control system must reflect the fact that there are resource constraints, and the benefits of controls must be considered relative to their costs. Because of the inherent limitations in all control systems, no evaluation of internal controls can provide absolute assurance that all control issues and instances of fraud, if any, have been detected. Also, any evaluation of the effectiveness of controls in future periods are subject to the risk that those internal controls may become inadequate because of changes in business conditions, or that the degree of compliance with the policies or procedures may deteriorate.
Management’s Annual Report on Internal Control Over Financial Reporting
The Company’s management is responsible for establishing and maintaining adequate internal control over financial reporting (as defined in Rule 13a-15(f) under the Exchange Act. Management conducted an evaluation of the effectiveness of the Company’s internal control over financial reporting based on the criteria set forth in Internal Control – Integrated Framework issued by the Committee of Sponsoring Organizations of the Treadway Commission (“COSO”). Our management’s annual report on internal control over financial reporting and the related report of our independent registered public accounting firm are included in this report on pages F-2 and F-3, respectively.
Changes in Internal Control Over Financial Reporting
There were no changes in the Company’s internal control over financial reporting during the fourth quarter of fiscal 2009, which were identified in connection with management’s evaluation required by paragraph (d) of rules 13a-15 and 15d-15 under the Exchange Act, that have materially affected, or are reasonably likely to materially affect, the Company’s internal control over financial reporting.
56
Table of Contents
| ITEM 9B. | OTHER INFORMATION |
At its Annual Meeting of shareholders held on December 22, 2009, the Company submitted the following matters to a vote of its shareholders:
| 1. | Election of Directors: |
| Name of Director |
Votes For |
Votes Withheld | ||
| Jeffrey Kang |
30,305,338 | 1,081,401 | ||
| Frank Zheng |
29,855,875 | 1,530,864 | ||
| Q.Y. Ma |
29,365,063 | 2,021,676 | ||
| J P Gan |
29,822,386 | 1,564,353 | ||
| George Mao |
29,816,692 | 1,570,047 | ||
|
2. Approval of the Cogo Group, Inc. 2009 Stock Incentive Plan | ||||
| Votes For |
Votes Against |
Abstentions | ||
| 16,228,136 | 10,426,470 | 199,058 | ||
|
3. Appointment of KPMG as the independent registered public accounting firm of the Company: | ||||
| Votes For |
Votes Against |
Abstentions | ||
| 31,327,299 | 64,027 | 45,016 | ||
57
Table of Contents
| ITEM 10. | DIRECTORS, EXECUTIVE OFFICERS AND CORPORATE GOVERNANCE |
Directors and Executive Officers
The following table sets forth information about our directors and executive officers as of March 3, 2010.
| Name |
Age | Position | ||
| Jeffrey Kang |
40 | Chief Executive Officer and Chairman of the Board | ||
| Yi Yuan |
49 | President | ||
| Frank Zheng |
43 | Chief Financial Officer, Treasurer and Secretary and Director | ||
| Q.Y. Ma (1)(2)(3) |
53 | Director | ||
| JP Gan (1)(2)(3) |
38 | Director | ||
| George Mao (1)(2)(3) |
48 | Director |
| (1) | Member of Audit Committee |
| (2) | Member of Nominating and Governance Committee |
| (3) | Member of Compensation Committee |
Jeffrey Kang, Chairman of the Board and Chief Executive Officer. Mr. Kang was a co-founder of Cogo and has served as our chief executive officer and chairman of the board since September 1999. Mr. Kang founded Shenzhen Matsunichi Electronics Co., Ltd. and Matsunichi Electronic (Hong Kong) Limited, a predecessor of the Company, in 1995, when Matsunichi commenced operations as a distributor for Matsushita. In 1999, Mr. Kang transferred all operations and assets of Matsunichi into the Company’s immediate predecessor. Prior to forming Matsunichi, Mr. Kang worked for Matsushita Electronics from June 1992 to July 1995 where he was responsible for selling components to the telecommunications industry within China. From 1998 to 1999, Mr. Kang was vice president of Shenzhen SME (Small and Medium Enterprises) Association, a non-profit association in Shenzhen. Mr. Kang earned a B.S. degree in Electrical Engineering from South China Technology University in Guangzhou, China.
Yi Yuan, President. Mr. Yuan has been the President of Cogo since May 8, 2008 and was the Chief Operating Officer from April 1, 2008 through May 8, 2008. Prior to joining Cogo, Mr. Yuan was the President of TCL Communication Technology from September 2005 to February 2008. Prior to joining TCL, he had been in various positions at Broadcom from March 2000 to August 2005, including the Chief Representative, General Manager and Director of Sales for Greater China and the Director of Asia business development. Prior to joining Broadcom, he was the global business manager at Texas Instruments where he pioneered China development. Mr. Yuan received a B.S. degree from Shanghai Jiao Tong University and obtained a M.S. degree in Electronic Engineering from Northern Illinois University.
58
Table of Contents
Frank Zheng, Chief Financial Officer, Treasurer, Secretary and Director. Mr. Zheng has been Chief Financial Officer since January 1, 2008, Treasurer and Secretary from May 2008, was a director from January 2005 to December 2007 and was re-elected a director in December 2008. He was the vice president of travel service for eLong, Inc., a leading online travel service company in China, from July 2000 to June 2007. Mr. Zheng was responsible for the overall operation of eLong’s travel services. Before he joined eLong, Mr. Zheng was a senior director of travel services with Asia.com. From 1994 through 2000, Mr. Zheng held various financial and operations positions with The Bank of New York, The Reserve Management Corp, and Dean Witter Intercapital Company. Mr. Zheng received a B.B.A degree in Accounting from City University of New York.
Q.Y. Ma, Director. Dr. Ma has been a director since December 2004. Dr. Ma has been the managing director of Time Innovation Ventures, a venture capital firm, since 2000, and served as a professor at the University of Hong Kong from 1998 to 2000. Dr. Ma was an associate professor at Columbia University from 1994 to 2000. He has also served as a technology consultant to IBM, General Electric, TRW, Inc. and DuPont. Dr. Ma is a co-founder and advisor of Semiconductor Manufacturing International Corp., and has served as an adviser to the Ministry of Information Industry, Beijing Government, and a senior advisor to Zhangjiang Hi-Tech Park in Shanghai. Dr. Ma received his Ph.D. from Columbia University, and attended the Executive Program of Stanford University’s School of Business.
59
Table of Contents
JP Gan, Director. Mr. Gan has been a director since January 2008. Mr. Gan has been a managing director of Qiming Venture Partners since January 2007. From May 2005 to December 2006, Mr. Gan was the Chief Financial Officer of KongZhong Corporation, a Nasdaq listed wireless internet company. Prior to joining KongZhong, Mr. Gan was a director of The Carlyle Group responsible for venture capital investments in the Greater China region from May 2000 to May 2005. Mr. Gan worked at the investment banking division of Merrill Lynch, in Hong Kong from August 1999 to May 2000, and worked at Price Waterhouse in the United States from August 1994 to September 1997. Mr. Gan obtained his Masters of Business Administration from the University of Chicago Graduate School of Business and his Bachelor of Business Administration from the University of Iowa. He is a Certified Public Accountant in the United States.
George Mao, Director. Dr. Mao has been a director since January 2008. Dr. Mao is the co-founder and has been the general manager of RYHT Asset Management Inc. since 2005. Before co-founding RYHT, Dr. Mao was Vice General Manager of Franklin Templeton Sealand Fund Management Co. Ltd. from May 2003 to December 2004. Dr. Mao held management positions with Pin An Securities Company Inc. and China Eagle Securities Company overseeing IPOs from September 1999 through May 2003. Dr. Mao obtained an MBA degree and a PhD degree from the University of Western Ontario in Canada and an M.A. degree from the Chinese Academy of Sciences, Beijing. Dr. Mao holds various board memberships including Shenzhen Cao Technology Co., Ltd. which is listed on Shenzhen Stock Exchange and Beijing Zhong Biao Fang Yuan Technology Anti-counterfeiting Company.
Board Practices
Our business and affairs are managed under the direction of our board of directors. The primary responsibilities of our board of directors are to provide oversight, strategic guidance, counseling and direction to our management. It is our expectation that the board of directors will meet regularly on a quarterly basis and additionally as required.
Board Committees
Our board of directors has an audit committee, a nominating and corporate governance committee, and a compensation committee, each established in 2005. Our board of directors has determined that Dr. Q.Y. Ma, Mr. JP Gan and Dr. George Mao, the members of these committees, are “independent” under the current independence standards of Rule 5605(a)(2) of the Marketplace Rules of The NASDAQ Stock Market, LLC and meet the criteria for independence set forth in Rule 10A(m)(3) under the U.S. Securities Exchange Act of 1934, as amended (the Exchange Act). Our board of directors has also determined that these persons have no material relationships with us—either directly or as a partner, stockholder or officer of any entity—which could be inconsistent with a finding of their independence as members of our board of directors.
Audit Committee
The audit committee, consisting of Dr. Ma, Mr. Gan and Dr. Mao, oversees our financial reporting process on behalf of the board of directors. The committee’s responsibilities include the following functions:
| • | approve and retain the independent auditors to conduct the annual audit of our books and records; |
| • | review the proposed scope and results of the audit; |
| • | review and pre-approve the independent auditors’ audit and non-audited services rendered; |
| • | approve the audit fees to be paid; |
| • | review accounting and financial controls with the independent auditors and our internal auditors and financial and accounting staff; |
60
Table of Contents
| • | review and approve transactions between us and our directors, officers and affiliates; |
| • | recognize and prevent prohibited non-audit services; and |
| • | meeting separately and periodically with management and our internal auditor and independent auditors. |
Our board of directors has determined that Mr. Gan, the Chair of the Audit Committee, is an “audit committee financial expert” as defined by the SEC’s rules.
Nominating And Corporate Governance Committee
The nominating and governance committee, consisting of Dr. Ma, Mr. Gan and Dr. Mao, is responsible for identifying potential candidates to serve on our board and its committees. The committee’s responsibilities include the following functions:
| • | making recommendations to the board regarding the size and composition of the board; |
| • | identifying and recommending to the board nominees for election or re-election to the board, or for appointment to fill any vacancy; |
| • | establishing procedures for the nomination process; |
| • | advising the board periodically with respect to corporate governance matters and practices, including periodically reviewing corporate governance guidelines to be adapted by the board; and |
| • | establishing and administering a periodic assessment procedure relating to the performance of the board as a whole and its individual members. |
The nominating and corporate governance committee will consider director candidates recommended by security holders. Potential nominees to the board of directors are required to have such experience in business or financial matters as would make such nominee an asset to the board and may, under certain circumstances, be required to be “independent”, as such term is defined under independence standards applicable to the Company. Security holders wishing to submit the name of a person as a potential nominee to the board must send the name, address, and a brief (no more than 500 words) biographical description of such potential nominee to the committee at the following address: Nominating and Corporate Governance Committee of the Board of Directors, c/o Cogo Group, Inc., Suite 1001, Tower C, Skyworth Building, High-Tech Industrial Park, Nanshan, Shenzhen 518057, People’s Republic of China. Potential director nominees will be evaluated by personal interview, such interview to be conducted by one or more members of the committee, and/or any other method the committee deems appropriate, which may, but need not, include a questionnaire. The committee may solicit or receive information concerning potential nominees from any source it deems appropriate. The committee need not engage in an evaluation process unless (1) there is a vacancy on the board, (2) a director is not standing for re-election, or (3) the committee does not intend to recommend the nomination of a sitting director for re-election. A potential director nominee recommended by a security holder will not be evaluated any differently than any other potential nominee.
Compensation Committee
The compensation committee, consisting of Dr. Ma, Mr. Gan and Dr. Mao, is responsible for making recommendations to the board concerning salaries and incentive compensation for our officers and employees and administers our stock option plans. Its responsibilities include the following functions:
| • | reviewing and recommending policy relating to the compensation and benefits of our officers and employees, including reviewing and approving corporate goals and objectives relevant to the compensation of our chief executive officer and other senior officers; evaluating the performance of these officers in light of those goals and objectives; and setting compensation of these officers based on such evaluations; |
| • | administering our benefit plans and the issuance of stock options and other awards under our stock plans; and reviewing and establishing appropriate insurance coverage for our directors and executive officers; |
| • | recommending the type and amount of compensation to be paid or awarded to members of our board of directors, including consulting, retainer, meeting, committee and committee chair fees and stock option grants or awards; and |
| • | reviewing and approving the terms of any employment agreements, severance arrangements, change-of-control protections and any other compensatory arrangements for our executive officers. |
61
Table of Contents
Compensation Committee Interlocks And Insider Participation
No member of our compensation committee has at any time been an officer or employee of ours, or our subsidiaries. No interlocking relationship exists between our board of directors or compensation committee and the board of directors or compensation committee of any other company, nor has any interlocking relationship existed in the past.
Section 16(a) Beneficial Ownership Reporting Compliance
Section 16(a) of the Securities Exchange Act of 1934, as amended, or the Exchange Act, requires our executive officers, directors and persons who beneficially own more than 10% of a registered class of our equity securities to file with the Securities and Exchange Commission initial reports of ownership and reports of changes in ownership of our common stock and other equity securities. These executive officers, directors, and greater than 10% beneficial owners are required by SEC regulation to furnish us with copies of all Section 16(a) forms filed by such reporting persons.
Based solely on our review of such forms furnished to us and written representations from certain reporting persons, we believe that all other filing requirements applicable to our executive officers, directors and greater than 10% beneficial owners were complied with during 2009.
Code of Ethics
On November 4, 2004, we adopted a Code of Business Conduct and Ethics that applies to our directors, officers and employees, including our chief executive officer and chief financial officer. A copy of our Code of Business Conduct and Ethics is available on the Investor Information page of our website, http://www.cogo.com.cn/investorinfo_coe.html.
| ITEM 11. | EXECUTIVE COMPENSATION |
COMPENSATION DISCUSSION AND ANALYSIS
Overview
This compensation discussion describes the material elements of compensation awarded to, earned by, or paid to each of our executive officers listed in the Summary Compensation Table below (the “named executive officers”) during the last completed fiscal year. This compensation discussion focuses on the information contained in the following tables and related footnotes and narrative for primarily the last completed fiscal year, but we also describe compensation actions taken before or after the last completed fiscal year to the extent it enhances the understanding of our executive compensation disclosure.
62
Table of Contents
The compensation committee currently oversees the design and administration of our executive compensation program.
The principal elements of our executive compensation program are base salary, annual cash incentives, long-term equity incentives in the form of stock options, other benefits and perquisites, post-termination severance and acceleration of stock option vesting for certain named executive officers upon termination and/or a change in control. Our other benefits and perquisites consist of life and health insurance benefits.
Objectives and Philosophy
In General. The objectives of our compensation programs are to:
| • | attract, motivate and retain talented and dedicated executive officers, |
| • | provide our executive officers with both cash and equity incentives to further the interests of us and our stockholders, and |
| • | provide employees with long-term incentives so we can retain them and provide stability during our growth stage. |
Generally, the compensation of our executive officers is composed of a base salary, an annual incentive compensation award and equity awards in the form of stock options. In setting base salaries, the compensation committee generally reviews the individual contributions of the particular executive. In addition, stock options are granted to provide the opportunity for long-term compensation based upon the performance of our common stock over time. Our philosophy is to position the aggregate of these elements at a level that is commensurate with our size and sustained performance.
Elements of Compensation
Compensation consists of following elements:
Base Salary. Base salaries for our executive officers are established based on the scope of their responsibilities, taking into account competitive market compensation paid by other companies in our industry and comparable PRC-based companies listed on US exchanges for similar positions, and the other elements of the executive officer’s compensation, including share-based compensation. Our intent is to target executive base salaries near the median of the range of salaries for executives in similar positions with similar responsibilities at comparable companies, in line with our compensation philosophy. Base salaries are reviewed annually, and may be increased annually to realign salaries with market levels after taking into account individual responsibilities, performance and experience. Based on publicly available information, we believe that the base salaries established for our executive officers are comparable to those paid by similar companies in our industry.
Annual Bonuses. Our executive officers and certain other employees are eligible for annual cash bonuses, which are paid at the discretion of our compensation committee. The determination of the amount of annual bonuses paid to our executive officers generally reflects a number of subjective considerations, including the performance of our company overall and the contributions of the executive officer during the relevant period.
Incentive Compensation. We believe that long-term performance is achieved through an ownership culture that encourages long-term performance by our executive officers through the use of share-based awards. We adopted the Cogo Group, Inc. 2006 Equity Incentive Plan, which permits the grant of shares of our incentive stock options, non-qualified stock options, restricted stock, stock appreciation rights, and performance stock awards. Our board of directors or a committee created by the board of directors will have the authority under the plan to award incentive compensation to our executive officers, employees, consultants and directors in such amounts and on such terms as the committee determines in its sole discretion.
63
Table of Contents
Currently, we do not maintain any incentive compensation plans based on pre-defined performance criteria. Incentive compensation is intended to compensate executive officers, employees, consultants and directors for achieving financial and operational goals and for achieving individual annual performance objectives. These objectives are expected to vary depending on the individual executive, but are expected to relate generally to strategic factors such as expansion of our services and to financial factors such as improving our results of operations. The actual amount of incentive compensation for the prior year will be determined following a review of each executive’s individual performance and contribution to our strategic goals conducted during the first quarter of each year. Specific performance targets used to determine incentive compensation for each of our executive officers in 2010 have not yet been determined.
Other Employee Grants.
Other Compensation. Each employment agreement provides the executive with certain other benefits, including reimbursement of business and entertainment expenses and life insurance. Each executive is eligible to participate in all benefit plans and programs that are or in the future may be available to other executive employees of our company, including any profit-sharing plan, thrift plan, health insurance or health care plan, disability insurance, pension plan, supplemental retirement plan, vacation and sick leave plan, and other similar plans. The compensation committee in its discretion may revise, amend or add to the officer’s executive benefits and perquisites as it deems advisable. We believe that these benefits and perquisites are typically provided to senior executives of similar companies.
Compensation of Chief Executive Officer
In December 2007 the Compensation Committee met to review the salaries that seven PRC-based companies listed on US exchanges with market capitalizations ranging from under $20 million to greater than $147 billion, paid to their chief executive officer. The companies included SORL Auto Parts, Inc., Sohu.com Inc, Netease.com Inc., Huaneng Power International Inc., Guangshen Railway Co., Ltd, e-Future Information Technology Inc. and Asiainfo Holdings Inc. The Compensation Committee’s intent was to target the chief executive officer’s base salary near the median of the range of salaries for executives in a similar position and with similar responsibilities, in line with our compensation philosophy. The Compensation Committee determined that the median base salaries for persons acting as chief executive officer for the above companies were approximately $93,000.
On December 21, 2007, the Compensation Committee of our Board of Directors approved the following compensation package for its Chief Executive Officer: a base salary of $100,000 per year, which was not materially different from the median base salary of the chief executive officers listed above; the grant of 20,000 shares of the Company’s common stock for each of 2008, 2009 and 2010 (for a total of 60,000 shares) that vest each quarter; the potential grant of a bonus on a yearly basis of up to an additional (i) 40,000 shares of the Company’s common stock if the Company’s pro forma earnings per share CAGR is at or above 30% and (ii) 40,000 shares of the Company’s common stock if the pro forma earnings per share is 40% or more above the previous year’s pro forma earnings per share. The bonus shares would vest in three equal yearly installments beginning immediately after the filing of the Form 10-K for the applicable year. The Compensation Committee based the level of compensation for our Chief Executive Officer on its belief of what is typical for public companies of our size and type and the fact that the Compensation Committee was satisfied with the performance of the Chief Executive Officer. No executive officer participated in the determination of the salary for the Chief Executive Officer.
64
Table of Contents
Although the Compensation Committee originally agreed to pay our Chief Executive Officer $100,000, the actual base salary paid to our Chief Executive Officer in 2009 was $74,904. The Compensation Committee did not issue our Chief Executive Officer the 40,000 shares of common stock he was eligible to receive in the event that the Company’s pro forma earnings per share CAGR was greater than 40%, as the Company did not meet that threshold.
Compensation of Other Officers
In December 2007 the Compensation Committee met to review the salaries that seven PRC-based companies listed on US exchanges with market capitalizations ranging from under $20 million to greater than $147 billion, paid to their president and chief financial officer. The companies included SORL Auto Parts, Inc., Sohu.com Inc, Netease.com Inc., Huaneng Power International Inc., Guangshen Railway Co., Ltd, e-Future Information Technology Inc. and Asiainfo Holdings Inc. The Compensation Committee’s intent was to target executive base salaries near the median of the range of salaries for executives in similar positions with similar responsibilities, in line with our compensation philosophy. The Compensation Committee determined that the median base salaries for persons acting as President and Chief Financial Officer for the above companies was approximately $93,000 and $103,000, respectively.
On December 21, 2007, the Compensation Committee of our Board of Directors approved the following compensation package for its Chief Financial Officer: a salary of $100,000 per year; the grant of 15,000 shares of the Company’s common stock for each of 2008, 2009 and 2010 (for a total of 45,000 shares) that vest each quarter; and the potential grant of a bonus on a yearly basis of up to an additional (i) 5,000 shares of the Company’s common stock for achieving timely filing of Form 10-Ks and Form 10-Qs in each of 2008, 2009 and 2010 and (ii) 5,000 shares of the Company’s common stock if the pro forma earnings per share compared annual growth rate, or CAGR, is at or above 30% for each of 2008, 2009 and 2010.
On March 27, 2008, the Compensation Committee of our Board of Directors approved the following compensation package for its President: a salary of $100,000 per year for the three-year period commencing April 1, 2008 through and including March 31, 2011; the grant of 80,000 shares of the Company’s common stock that vests in twelve equal installments on a quarterly basis, beginning June 30, 2008; and the potential grant of a bonus on a yearly basis of up to an additional (i) 26,667 shares of the Company’s common stock if the Company’s pro forma earnings per share compound annual growth rate is at or above 30% and (ii) 26,667 shares of the Company’s common stock if the pro forma earnings per share is 40% or more above the previous year’s pro forma earnings per share.
The salaries for our Chief Financial Officer and President were negotiated with such persons prior to their becoming employed by us. The Compensation Committee based the level of compensation for such officers on its belief of what is typical for public companies of our size and type and the amounts that it believed that such persons would be willing to accept top join us. Our Chief Executive Officer participated in the determination of the salary for each of such officers. The actual base salary paid to our President and Chief Financial Officer in 2009 was $100,000 each.
Other Determinations of the Compensation Committee
The Compensation Committee did not award any cash bonus to any named executive officer in 2009, 2008 or 2007. The Compensation Committee has determined that the combination of base salary, stock awards and option awards resulted in satisfactory aggregate compensation levels for our executives and determined that additional cash compensation was not necessary to adequately reward its executives. The Compensation Committee does not establish thresholds by which executives may earn a cash bonus, and the lack of any cash bonus award being paid during these years does not indicate that any executive failed to meet any particular performance threshold.
65
Table of Contents
In making its equity award determinations, the Compensation Committee agreed that Jeffrey Kang and Yi Yuan, our Chief Executive Officer and President, respectively, were crucial to the Company’s day-to-day operations, as well as to its long-term growth. The Compensation Committee agreed that, based on the Company’s results of operations and its market outlook, it was appropriate to reward Messrs. Kang and Yuan for the Company having exceeded expectations in 2009 as documented in their employment agreements. The Compensation Committee considered a pro forma earnings per share CAGR of 30% to be a benchmark achievement, and considered a pro forma earnings per share CAGR of 40% or above to be extraordinary performance. Since the Company’s pro forma earnings per share CAGR for 2009 was below 30%, the Compensation Committee did not issue our Chief Financial Officer or our President 5,000 shares and 26,667 shares of common stock that each respectively would have been eligible to receive under his employment agreement if the Company’s pro forma earnings per share CAGR for 2009 was above 30%. However, the Compensation Committee determined that it was appropriate to award Mr. Zheng the 5,000 shares of the Company’s common stock which he was entitled to receive under his employment agreement for, among other things, timely filing the Company’s Annual Report on Form 10-K, his successful oversight of the Company’s financial activities and internal controls over financial reporting, and exceeding managements expectations for his dedication to the Company and his management efforts.
Compensation Committee Report on Executive Compensation
Our compensation committee has certain duties and powers as described in its charter. The compensation committee is currently composed of the three non-employee directors named at the end of this report, each of whom is independent as defined by the Nasdaq Global Market listing standards.
The compensation committee has reviewed and discussed with management the disclosures contained in the Compensation Discussion and Analysis section of this proxy statement. Based upon this review and discussion, the compensation committee recommended to our Board of Directors that the Compensation Discussion and Analysis section be included in our Annual Report on Form 10-K to be filed with the SEC.
The Compensation Committee of
the Board of Directors consists of the following members:
Q. Y. Ma
JP Gan
George Mao
SEC filings sometimes “incorporate information by reference.” This means that we are referring you to information that has previously been filed with the SEC, and that this information should be considered as part of the filing you are reading. Unless we specifically state otherwise, this report shall not be deemed to be incorporated by reference and shall not constitute soliciting material or otherwise be considered filed under the Securities Act or the Securities Exchange Act.
66
Table of Contents
Executive Compensation
Summary Compensation Table
| Name and Principal Position |
Year | Salary ($) |
Bonus ($) |
Stock Awards ($) |
Option Awards ($) |
Non-Equity Incentive Plan Compensation ($) |
All Other Compensation ($) |
Total ($) | |||||||||
| Jeffrey Kang, Chairman and Chief Executive Officer |
2009 2008 2007 |
74,904 74,940 30,776 |
— — — |
320,600 320,600 — |
— — 269,800 |
— — — |
2,251 2,119 1,539 |
(1)(2) (1)(2) (2) |
397,755 397,659 302,115 | ||||||||
| Yi Yuan, President |
2009 2008 |
100,000 100,000 |
— | 289,333 217,000 |
— | — | 1,548 1,548 |
(3) (3) |
390,881 318,548 | ||||||||
| Frank Zheng, Chief Financial Officer |
2009 2008 |
100,000 100,000 |
— | 307,242 387,392 |
— | — | 1,548 1,548 |
(4) (4) |
408,790 488,940 | ||||||||
| (1) | Mr. Kang is entitled to retirement benefits under a PRC government-managed retirement plan. Expenses related to Mr. Kang’s participation in the PRC government managed retirement plan amounted to approximately RMB4,800 ($703) for the year ended December 31, 2009 and RMB3,893 ($571) for the year ended December 31, 2008. |
| (2) | Mr. Kang is entitled to retirement benefits under Hong Kong’s mandatory provident fund scheme. Expenses related to Mr. Kang’s participation in the mandatory provident fund scheme amounted to approximately HKD 12,000 ($1,548) for the years ended December 31, 2009 and December 31, 2008 and HKD12,000 ($1,539) for the year ended December 31, 2007. |
| (3) | Mr. Yuan is entitled to retirement benefits under Hong Kong’s mandatory provident fund scheme. Expenses related to Mr. Yuan’s participation in the mandatory provident fund scheme amounted to approximately HKD 12,000 ($1,548) for the years ended December 31, 2009 and December 31, 2008. |
| (4) | Mr. Zheng is entitled to retirement benefits under Hong Kong’s mandatory provident fund scheme. Expenses related to Mr. Zheng’s participation in the mandatory provident fund scheme amounted to approximately HKD 12,000 ($1,548) for the years ended December 31, 2009 and December 31, 2008. |
67
Table of Contents
Director Compensation
The following table summarizes compensation that our directors earned during 2009 for services as members of our Board.
| Name |
Fees Earned or Paid in Cash ($) |
Stock Awards ($) |
Option Awards ($) |
Non-Equity Incentive Plan Compensation ($) |
Change in Pension Value and Nonqualified Deferred Compensation Earnings ($) |
All Other Compensation ($) |
Total ($) | ||||||||
| Jeffrey Kang |
— | — | — | — | — | — | — | ||||||||
| Frank Zheng |
— | — | — | — | — | — | — | ||||||||
| Q.Y. Ma |
25,000 | 18,920 | (1) | — | — | — | — | 43,920 | |||||||
| JP Gan |
45,000 | 34,062 | (2) | — | — | — | — | 79,062 | |||||||
| George Mao |
25,000 | 18,920 | (1) | — | — | — | — | 43,920 |
| (1) | Consists of 3,440 shares of restricted stock. |
| (2) | Consists of 6,193 shares of restricted stock. |
In the event a non-employee joins our Board of Directors, such person will be entitled to receive restricted shares on a pro rata basis for the portion of the period for which he or she will serve. All of the restricted shares granted to the incoming directors will be exercisable at the fair market value on the date of grant and will vest quarterly during the remainder of the period following the close of grant.
On December 17, 2009, the Compensation Committee of our Board of Director approved the following compensation for members of our Board of Directors in 2010: Mr. Gan will receive $48,000 in cash and Dr. Ma and Dr. Mao each will receive $28,000 in cash. No options were granted to our non-employee directors in 2009.
Grants of Plan Based Awards
No plan based awards were made to our named executive officers under any plan in 2009.
2004 Stock Incentive Plan
On August 3, 2004, the Company’s board of directors adopted the 2004 Stock Incentive Plan (the 2004 Plan), under which 2,500,000 shares of common stock are reserved for issuance upon exercise of stock options, and for the issuance of stock appreciation rights (SAR’s), restricted stock awards and performance shares. The purpose of the 2004 Plan is to provide additional incentive to employees, directors, advisors and consultants by facilitating their acquisition of common stock. The 2004 Plan provides for a term of ten years from the date of its adoption by the board of directors (unless the 2004 Plan is earlier terminated), after which no awards may be made. Options granted under the 2004 Plan are either incentive stock options (i.e., options that afford favorable tax treatment to recipients upon compliance with certain restrictions pursuant to Section 422 of the U.S. Internal Revenue Code (IRC) and that do not result in tax deductions to us unless participants fail to comply with that Section) or options that do not so qualify.
68
Table of Contents
Our board of directors determines when options under the 2004 Plan are exercisable and the option exercise price. The 2004 Plan permits options to be exercised with cash, check, certain other shares of our common stock, consideration received by us under “cashless exercise” programs, or if permitted by our board, promissory notes or other property. Our board also determines the performance goals and performance period for performance shares; the purchase price and conditions of repurchase for restricted stock and the terms of stock appreciation rights. Our board may at any time accelerate the vesting of any outstanding award. In the event we are sold, merged, consolidated, reorganized or liquidated, our board may take any of the following actions as to outstanding awards: (a) provide that the successor will assume or provide a substitute for the awards; (b) provide that all unexercised options and stock appreciation rights shall terminate immediately prior to the consummation of the transaction, if not previously exercised; (c) in the event of a sale where common stockholders receive cash for their shares, provide that each outstanding vested option and stock appreciation right will be exchanged for a payment in cash equal to the excess of the sales price over the exercise price; and (d) make such other adjustments deemed necessary to provide participants with a benefit substantially similar to that which they would have been entitled had the event not occurred. In the event of any stock dividend, split, recapitalization or other similar change, our board may adjust the number and kind of shares subject to outstanding awards, the exercise or purchase price of awards, and any other equitable adjustments it deems appropriate.
The 2004 Plan and the Directors’ Plan are administered by the compensation committee of our board of directors. The compensation committee selects the employees to whom awards are to be granted, the number of shares to be subject to such awards, and the terms and conditions of such awards, provided that any discretion exercised by the compensation committee must be consistent with resolutions adopted by our board and the terms of the 2004 Plan.
As of December 31, 2009, options to purchase an aggregate of 2,235,832 shares had been granted under the 2004 Plan, and options to purchase an aggregate of 115,000 shares had been granted under the Directors’ Plan.
2006 Equity Incentive Plan
On November 24, 2006, the Company’s board of directors adopted the 2006 Stock Incentive Plan (the 2006 Plan), under which 4,800,000 shares of common stock are reserved for issuance. The purpose of the 2006 Plan is to attract and retain the best available personnel for positions of substantial responsibility, to provide additional incentive to employees, directors and consultants and to promote the success of the Company’s business. The 2006 Plan provides for the grant of options, stock appreciation rights (“SARs”), performance share awards and restricted stock awards to officers, employees and independent contractors of the Company or its affiliates. If any award expires, is cancelled, or terminates unexercised or is forfeited, the number of shares subject thereto is again available for grant under the 2006 Plan. The number of shares of Common Stock for which awards may be granted to a participant under the 2006 Plan in any calendar year cannot exceed 2,400,000.
The 2006 Plan is administered by the compensation committee of the board of directors, which has complete discretion, subject to the express limits of the 2006 Plan, to determine the employees and independent contractors to be granted an award, the type of award to be granted, the number of shares of Common Stock subject to each award, the exercise price of each option and base price of each SAR, the term of each award, the vesting schedule for an award, whether to accelerate vesting, the value of the stock, and the required withholding. The compensation committee may amend, modify or terminate any outstanding award, provided that the participant’s consent to such action is required if the action would materially and adversely affect the participant. The compensation committee is also authorized to construe the award agreements, and may prescribe rules relating to the 2006 Plan. Notwithstanding the foregoing, the compensation committee does not have any authority to grant or modify an award under the 2006 Plan with terms or conditions that would cause the grant, vesting or exercise to be considered nonqualified “deferred compensation” subject to Code Section 409A.
69
Table of Contents
Options granted under the 2006 Plan may be either “incentive stock options” (“ISOs”), which are intended to meet the requirements for special federal income tax treatment under the Code, or “nonqualified stock options” (“NQSOs”). Except as provided in the 2006 Plan, awards granted under the 2006 Plan are not transferable and may be exercised only by the respective grantees during their lifetime or by their guardian or legal representative. The 2006 Plan is effective for 10 years, unless it is sooner terminated or suspended. The Committee may at any time amend, alter, suspend or terminate the 2006 Plan; provided, that no amendment requiring stockholder approval will be effective unless such approval has been obtained. No termination or suspension of the 2006 Plan will affect an award which is outstanding at the time of the termination or suspension.
As of December 31, 2009, restricted stock awards of an aggregate of 4,086,971 shares had been granted under the 2006 Plan.
The Cogo Group, Inc. 2009 Omnibus Securities and Incentive Plan
The Company’s Board of Directors adopted the Group, Inc. 2009 Omnibus Securities and Incentive Plan (the “2009 Plan”) on November 9, 2009.
Administration. The 2009 Plan is administered by the compensation committee of the board of directors, which consists of three members of the board of directors, each of whom is a “non-employee director” within the meaning of Rule 16b-3 promulgated under the Exchange Act and an “outside director” within the meaning of Code Section 162(m). Among other things, the compensation committee has complete discretion, subject to the express limits of the 2009 Plan, to determine the directors, employees and independent contractors to be granted an award, the type of award to be granted, the number of shares of Common Stock subject to each award, the exercise price of each option and base price of each SAR, the term of each award, the vesting schedule for an award, whether to accelerate vesting, the value of the stock, and the required withholding. The compensation committee may amend, modify or terminate any outstanding award, provided that the participant’s consent to such action is required if the action would materially and adversely affect the participant. The compensation committee is also authorized to construe the award agreements, and may prescribe rules relating to the 2009 Plan. Notwithstanding the foregoing, the Committee does not have any authority to grant or modify an award under the 2009 Plan with terms or conditions that would cause the grant, vesting or exercise to be considered nonqualified “deferred compensation” subject to Section 409A of the Code.
Grant of Awards; Shares Available for Awards. The 2009 Plan provides for the grant of options, SARs, performance share awards, performance unit awards, distribution equivalent right awards, restricted stock awards and unrestricted stock awards in an amount equal to 6,000,000 shares of common stock, to directors, officers, employees and independent contractors of the Company or its affiliates. If any award expires, is cancelled, or terminates unexercised or is forfeited, the number of shares subject thereto is again available for grant under the 2009 Plan. The number of shares of Common Stock for which awards may be granted to a participant under the 2009 Plan in any calendar year cannot exceed 2,400,000.
Currently, there are 58 employees and directors who would be entitled to receive stock options and/or restricted shares under the 2009 Plan. Future new hires and additional consultants would be eligible to participate in the 2009 Plan as well. The number of stock options and/or restricted shares to be granted to executives and directors cannot be determined at this time as the grant of stock options and/or restricted shares is dependent upon various factors such as hiring requirements and job performance.
70
Table of Contents
Stock Options. Options granted under the 2009 Plan may be either “incentive stock options” (“ISOs”), which are intended to meet the requirements for special federal income tax treatment under the Code, or “nonqualified stock options” (“NQSOs”). Options may be granted on such terms and conditions as the Committee may determine; provided, however, that the exercise price of an option may not be less than the fair market value of the underlying stock on the date of grant and the term of the option my not exceed 10 years (110% of such value and 5 years in the case of an ISO granted to an employee who owns (or is deemed to own) more than 10% of the total combined voting power of all classes of capital stock of the Company or a parent or subsidiary of the Company). ISOs may only be granted to employees. In addition, the aggregate fair market value of Common Stock covered by ISOs (determined at the time of grant) which are exercisable for the first time by an employee during any calendar year may not exceed $100,000. Any excess is treated as a NQSO.
Stock Appreciation Rights. A SAR entitles the participant, upon exercise, to receive an amount, in cash or stock or a combination thereof, equal to the increase in the fair market value of the underlying stock between the date of grant and the date of exercise. SARs may be granted in tandem with, or independently of, options granted under the 2009 Plan. A SAR granted in tandem with an option (i) is exercisable only at such times, and to the extent, that the related option is exercisable in accordance with the procedure for exercise of the related option; (ii) terminates upon termination or exercise of the related option (likewise, the option granted in tandem with a SAR terminates upon exercise of the SAR); (iii) is transferable only with the related option; and (iv) if the related option is an ISO, may be exercised only when the value of the stock subject to the option exceeds the exercise price of the option. A SAR that is not granted in tandem with an option is exercisable at such times as the Committee may specify.
Performance Shares or Performance Unit Awards. Performance share or performance unit awards entitle the participant to receive cash or shares of stock upon attaining specified performance goals. In the case of performance units, the right to acquire the units is denominated in cash values.
Distribution Equivalent Right Awards. A distribution equivalent right award under the 2009 Plan entitles the participant to receive bookkeeping credits, cash payments and/or common stock distributions equal in amount to the distributions that would have been made to the participant had the participant held a specified number of shares of the Company’s common stock during the period the participant held the distribution equivalent right. A distribution equivalent right may be awarded under the 2009 Plan as a component of another award, where, if so awarded, such distribution equivalent right will expire or be forfeited by the participant under the same conditions as under such other award.
Restricted Stock Awards or Restricted Stock Unit Award. A restricted stock award is a grant or sale of stock to the participant, subject to the Company’s right to repurchase all or part of the shares at their purchase price (or to require forfeiture of such shares if purchased at no cost) in the event that conditions specified by the Committee in the award are not satisfied prior to the end of the time period during which the shares subject to the award may be repurchased by or forfeited to the Company. A restricted stock unit entitles the holder to receive a cash payment equal to the fair market value of a share of Common Stock, or one (1) share of Common Stock for each restricted stock unit subject to such restricted stock unit award, if the holder satisfies the applicable vesting requirement.
Unrestricted Stock Awards. An unrestricted stock award under the 2009 Plan is a grant or sale of the Company’s common stock to the participant that is not subject to transfer, forfeiture or other restrictions, in consideration for past services rendered to the Company or an affiliate or for other valid consideration.
71
Table of Contents
Change-in-Control Provisions. In connection with the grant of an award, the compensation committee may provide that, in the event of a change in control, any outstanding awards that are unexercisable or otherwise unvested will become fully vested and immediately exercisable.
Amendment and Termination. The compensation committee may adopt, amend and rescind rules relating to the administration of the 2009 Plan, and amend, suspend or terminate the 2009 Plan, but no amendment will be made that adversely affects in a material manner any rights of the holder of any award without the holder’s consent, other than amendments that are necessary to permit the granting of awards in compliance with applicable laws. We have attempted to structure the 2009 Plan so that remuneration attributable to stock options and other awards will not be subject to a deduction limitation contained in Section 162(m) of the Code.
Certain Federal Income Tax Consequences of the 2009 Plan.
The following is a general summary of the federal income tax consequences under current tax law of options, stock appreciation rights and restricted stock. It does not purport to cover all of the special rules, including special rules relating to participants subject to Section 16(b) of the Exchange Act and the exercise of an option with previously-acquired shares, or the state or local income or other tax consequences inherent in the ownership and exercise of stock options and the ownership and disposition of the underlying shares or the ownership and disposition of restricted stock.
A participant does not recognize taxable income upon the grant of NQSO or an ISO. Upon the exercise of a NQSO, the participant recognizes ordinary income in an amount equal to the excess, if any, of the fair market value of the shares acquired on the date of exercise over the exercise price thereof, and the Company will generally be entitled to a deduction for such amount at that time. If the participant later sells shares acquired pursuant to the exercise of a NQSO, the participant recognizes long-term or short-term capital gain or loss, depending on the period for which the shares were held. Long-term capital gain is generally subject to more favorable tax treatment than ordinary income or short-term capital gain.
Upon the exercise of an ISO, the participant does not recognize taxable income. If the participant disposes of the shares acquired pursuant to the exercise of an ISO more than two years after the date of grant and more than one year after the transfer of the shares to the participant, the participant recognizes long-term capital gain or loss and the Company is not be entitled to a deduction. However, if the participant disposes of such shares within the required holding period, all or a portion of the gain is treated as ordinary income and the Company is generally entitled to deduct such amount.
In addition to the tax consequences described above, a participant may be subject to the alternative minimum tax, which is payable to the extent it exceeds the participant’s regular tax. For this purpose, upon the exercise of an ISO, the excess of the fair market value of the shares over the exercise price therefore is an adjustment which increases alternative minimum taxable income. In addition, the participant’s basis in such shares is increased by such excess for purposes of computing the gain or loss on the disposition of the shares for alternative minimum tax purposes. If a participant is required to pay an alternative minimum tax, the amount of such tax which is attributable to deferral preferences (including the incentive option adjustment) is allowed as a credit against the participant’s regular tax liability in subsequent years. To the extent the credit is not used, it is carried forward.
A participant does not recognize income upon the grant of an SAR. The participant has ordinary compensation income upon exercise of the SAR equal to the increase in the value of the underlying shares, and the Company will generally be entitled to a deduction for such amount.
72
Table of Contents
A participant does not recognize income on the receipt of a performance share award until the shares are received. At such time, the participant recognizes ordinary compensation income equal to the excess, if any, of the fair market value of the shares over any amount paid for the shares, and the Company is generally entitled to deduct such amount at such time.
A participant who receives a grant of restricted stock generally recognizes ordinary compensation income equal to the excess, if any of fair market value of the stock at the time the restriction lapses over any amount paid for the shares. Alternatively, the participant may elect to be taxed on the value at the time of grant. The Company is generally entitled to a deduction at the same time and in the same amount as the income required to be included by the participant.
Outstanding Equity Awards at Fiscal Year-End
The following table summarizes the number of securities underlying outstanding plan awards for each named executive officer as of December 31, 2009.
| Option Awards | Stock Awards | ||||||||||||||||||
| Number of Securities Underlying Unexercised Options (#) |
Number of Securities Underlying Unexercised Options (#) |
Equity Incentive Plan Awards: Number of Securities Underlying Unexercised Unearned Options (#) |
Option Exercise Price ($) |
Option Expiration Date |
Number of Shares or Units of Stock That Have Not Vested (#) |
Market Value of Shares or Units of Stock That Have Not Vested ($) (4) |
Equity Incentive Plan Awards: Number of Unearned Shares, Units or Other Rights That Have Not Vested (#) |
Equity Incentive Plan Awards: Market or Payout Value of Unearned Shares, Units or Other Rights That Have Not Vested ($) | |||||||||||
| Name |
Exercisable | Unexercisable | — | — | — | — | — | — | — | ||||||||||
| Jeffrey Kang |
450,043 | — | — | 3.74 | November 11, 2014 | 20,000 | (1) | 147,400 | — | — | |||||||||
| Yi Yuan |
— | — | — | — | — | 33,333 | (2) | 245,664 | — | — | |||||||||
| Frank Zheng |
— | — | — | — | — | 15,000 | (3) | 110,550 | — | — | |||||||||
| (1) | 5,000 shares each quarter on March 31, June 30, September 30 and December 31 in 2010. |
| (2) | 6,667 shares vest each quarter on June 30 and December 31, 2010 and March 31, 2011; 6,666 shares vest on March 31 and September 30, 2010. |
| (3) | 3,750 shares vest each quarter on March 31, June 30, September 30 and December 31 in 2010. |
| (4) | The market value of the shares that have not vested has been calculated by multiplying the number of shares times $7.37, which represents the last reported sale price of our common stock on the Nasdaq Global Market on December 31, 2009, which is the last day of the most recent fiscal year. |
Option Exercises and Stock Vested
The following table summarizes stock option exercises by our named executive officers in 2009 and shares of restricted stock that vested in 2009.
73
Table of Contents
| Option Awards | Stock Awards | ||||||||
| Name |
Number of Shares Acquired on Exercise (#) |
Value Realized on Exercise ($) |
Number of Shares Acquired on Vesting (#) |
Value Realized on Vesting ($)(4) | |||||
| Jeffrey Kang |
— | — | 20,000 | (1) | 130,700 | ||||
| Yi Yuan |
— | — | 26,667 | (2) | 174,269 | ||||
| Frank Zheng |
— | — | 15,000 | (3) | 98,025 | ||||
| (1) | 5,000 shares vested each quarter on March 31, June 30, September 30 and December 31. |
| (2) | 6,666 shares vested on June 30 and 6,667 vested on March 31, September 30 and December 31. |
| (3) | 3,750 shares vested each quarter on March 31, June 30, September 30 and December 31. |
| (4) | The market value of the shares realized on vesting has been calculated by adding the number of shares vested in each quarter times the last reported sale price of our common stock on the Nasdaq Global Market on March 31, June 30, September 30 and December 31, which are $6.68, $5.97, $6.12 and $7.37, respectively. |
Pension Benefits
We do not sponsor any qualified or non-qualified defined benefit plans.
Nonqualified Deferred Compensation
We do not maintain any non-qualified defined contribution or deferred compensation plans. The compensation committee may elect to provide our officers and other employees with non-qualified defined contribution or deferred compensation benefits if the compensation committee determines that doing so is in our best interests.
Potential Payments Upon Termination or Change In Control
We have no potential payments upon termination or change in control.
74
Table of Contents
| ITEM 12. | SECURITY OWNERSHIP OF CERTAIN BENEFICIAL OWNERS AND MANAGEMENT AND RELATED SHAREHOLDER MATTERS |
The following table sets forth, as of March 3, 2010, certain information as to the stock ownership of (1) each person known by us to own beneficially more than five percent of our common stock, (2) each of our directors, (3) each of our executive officers, and (4) our executive officers and directors as a group. The business address of each shareholder is c/o Cogo Group, Inc. Company, Suite 1001, Tower C, Skyworth Building, High-Tech Industrial Park, Nanshan, Shenzhen 518057, People’s Republic of China.
| Number of Shares Beneficially Owned (1) |
Percentage Ownership |
|||||
| Name of Beneficial Owner |
||||||
| Jeffrey Kang |
10,221,567 | (2)(3) | 28.30 | % | ||
| Yi Yuan |
53,333 | * | ||||
| Frank Zheng |
53,801 | * | ||||
| Q.Y. Ma |
11,301 | (4) | * | |||
| JP Gan |
9,000 | * | ||||
| George Mao |
5,000 | * | ||||
| All executive officers and directors as a group (6 persons) |
10,354,002 | 28.67 | % | |||
| Principal Stockholders |
||||||
| Nan Ji |
9,711,524 | (3)(5) | 26.89 | % | ||
| Comtech Global Investment Ltd. |
9,711,524 | (3)(5) | 26.89 | % | ||
| Yi Kang |
2,290,028 | (6) | 6.34 | % | ||
| Ren Investment International Ltd. |
2,290,028 | (6) | 6.34 | % | ||
| AXA Assurances |
2,080,591 | (7) | 5.76 | % | ||
| * | Represents beneficial ownership of less than one percent of our outstanding shares. |
| (1) | Beneficial ownership is determined in accordance with the rules and regulations of the U.S. Securities and Exchange Commission (SEC). In computing the number of shares beneficially owned by a person and the percentage ownership of that person, shares of common stock subject to options held by that person that are currently exercisable or exercisable within 60 days of March 3, 2010 are deemed outstanding. Such shares, however, are not deemed outstanding for the purposes of computing the percentage ownership of any other person. Except as indicated in the footnotes to the following table or pursuant to applicable community property laws, each stockholder named in the table has sole voting and investment power with respect to the shares set forth opposite such stockholder’s name. The percentage of beneficial ownership is based on 36,117,867 shares of common stock outstanding as of March 3, 2010. |
| (2) | Includes (a) 450,043 shares issuable upon exercise of currently exercisable stock options, (b) 60,000 shares and (c) 9,711,524 shares beneficially owned by Comtech Global Investment Ltd., over which Mr. Jeffrey Kang and his wife, Ms. Nan Ji, share voting and investment power. |
75
Table of Contents
| (3) | Mr. Jeffrey Kang owns a 29% interest and Ms. Nan Ji a 71% interest in Comtech Global Investment Ltd. The directors of Comtech Global Investment Ltd. are Mr. Jeffrey Kang and Mr. Yi Kang. |
| (4) | Includes (a) 5,000 shares issuable upon exercise of currently exercisable stock options and (b) 6,301 shares owned by Dr. Ma. |
| (5) | Represents 9,711,524 shares beneficially owned by Comtech Global Investment Ltd., over which Mr. Jeffrey Kang and his wife, Ms. Nan Ji, share voting and investment power. |
| (6) | Includes 2,290,028 shares beneficially owned by Ren Investment International Ltd., over which Mr. Yi Kang, as sole director, has sole voting and investment power. Mr. Yi Kang, the brother of Jeffery Kang, does not have an economic interest in any shares of Ren Investment International Ltd. |
| (7) | Based on the Schedule 13G filed jointly by AXA Assurances I.A.R.D. Mutuelle and AXA Financial, Inc., on February 12, 2010. The business address of AXA is 1290 Avenue of the Americas, New York, NY 10104. |
76
Table of Contents
| ITEM 13. | CERTAIN RELATIONSHIPS AND RELATED TRANSACTIONS, AND DIRECTOR INDEPENDENCE |
Other Related Party Transactions
At the time of its incorporation, foreign shareholding in a trading business such as Shenzhen Comtech could not exceed 65%. With subsequent PRC deregulation, foreign ownership of such a trading business can now reach 100%, and approval of foreign ownership of companies in the PRC engaged in commodity trading businesses—which includes agency trade, wholesale, retail and franchise operations is now delegated to local government agencies of the PRC Ministry of Commerce. In order to exercise control over Shenzhen Comtech (a PRC operating company legally permitted to engage in a commodity trading business), without direct shareholding by us (a U.S.-listed company and therefore a foreign-invested entity), Honghui Li, our vice president, and Huimo Chen, the mother of our principal shareholder and chief executive officer, Jeffrey Kang, hold 99% and 1%, respectively, of the equity interests of Shenzhen Comtech, and through contractual agreements with us hold such equity interests exclusively for the benefit of our 100% directly owned subsidiary, Comtech China. Shenzhen Comtech, in turn owns a 60% equity interest in another of our PRC operating companies, Shanghai E&T, with the other 40% being held by Comtech China through trust agreements. Under the trust agreements, Shenzhen Comtech owns a 35% equity interest in Shanghai E&T for the benefit of Comtech China and Honghui Li owns a 5% equity interest in Shanghai E&T for the benefit of Comtech China. While we do not have any equity interest in Shenzhen Comtech, through these contractual agreements, we enjoy voting control and are entitled to the economic interests associated with their equity interest in Shenzhen Comtech. For additional details regarding these contractual agreements, see “Risk Factors—Risks Related to our Business—We depend upon contractual agreements with the two shareholders of Shenzhen Comtech in conducting our business through Shenzhen Comtech and Shanghai E&T and receiving payments, which may not be as effective in providing operational control as direct ownership and may be difficult to enforce. Further, if the PRC government finds these contractual agreements violate or conflict with PRC governmental regulations, our business would be materially adversely affected.”
In 2005, Nan Ji executed an agreement to transfer her 70% equity interest in Shenzhen Comtech to Jeffrey Kang and her 1% equity interest in Shenzhen Comtech to Huimo Chen, the mother of Jeffrey Kang, who is a PRC citizen. Jeffrey Kang and Huimo Chen have also agreed that upon the successful transfer of Nan Ji’s equity interest as described above, they will enter into and be bound by the same contractual arrangements with Comtech China relating to the voting control of Shenzhen Comtech. In 2006, Jeffrey Kang executed an agreement to transfer his 99% equity interest in Shenzhen Comtech to Honghui Li.
On August 6, 2006, Comtech China, our wholly-owned subsidiary, entered into a share acquisition agreement pursuant to which Comtech China acquired the remaining 40% minority interests of Shanghai E&T for cash consideration of RMB16.0 million. Comtech China in turn entered into trust agreements with Honghui Li and Shenzhen Comtech. Under the trust agreements, Honghui Li owns 5% interest in Shanghai E&T, and Shenzhen Comtech owns 35% interest in Shanghai E&T, in addition to 60% equity interest it owned previously. We enjoy voting control over and all economic interests associated with Shanghai E&T.
At present, most of our business in China is done through Shenzhen Comtech and Shenzhen Communication, except for business in Shanghai, which is conducted mostly through Shanghai E&T.
77
Table of Contents
In the event any transaction in which we propose to engage is a related-person transaction, our management must present information regarding the proposed related-person transaction to the disinterested non-employee members of our board of directors for consideration and approval or ratification. The presentation must include a description of, among other things, the material facts, the interests, direct and indirect, of the related persons, the benefits to us of the transaction and whether any alternative transactions were available. To identify related-person transactions in advance, we rely on information supplied by our executive officers, directors and significant stockholders. In considering related-person transactions, the disinterested non-employee members of the board take into account the relevant available facts and circumstances including, but not limited to (a) the risks, costs and benefits to us, (b) the impact on a director’s independence in the event the related person is a director, immediate family member of a director or an entity with which a director is affiliated, (c) the terms of the transaction, (d) the availability of other sources for comparable services or products and (e) the terms available to or from, as the case may be, unrelated third parties or to or from employees generally. In the event a director has an interest in the proposed transaction, the director must excuse himself or herself from the deliberations and approval. The policy requires that, in determining whether to approve, ratify or reject a related-person transaction, the disinterested non-employee members of the board look at, in light of known circumstances, whether the transaction is in, or is not inconsistent with, our best interests and our stockholders, as determined in the good faith exercise of such directors’ discretion.
Director Independence
See the information set forth in the section titled “Directors, Executive Officers and Corporate Governance—Board Committees” in Part III, Item 10 of this Annual Report.
| ITEM 14. | PRINCIPAL ACCOUNTANT FEES AND SERVICES |
The following table presents the aggregate fees for professional services and other services rendered by our principal accountant to us in 2009 and 2008.
| 2009 | 2008 | |||
| (in millions) | ||||
| Audit fees (1) |
4.2 | 4.2 | ||
| Audit related fees |
0.8 | 0.6 | ||
| Tax fees |
— | — | ||
| All other fees |
— | — | ||
| Total |
RMB5.0 | RMB4.8 | ||
| (1) | Audit fees consist of fees billed for the professional services rendered for the audit of our consolidated financial statements for each of these fiscal years and the review of the interim financial statements for the fiscal years ended December 31, 2009 and December 31, 2008, respectively. |
We are required to obtain pre-approval by our audit committee for all audit and permitted non-audit services performed by our independent auditors. In accordance with this requirement, during fiscal 2009, 100% of all audit, audit-related, tax and other services performed by KPMG were approved in advance by the audit committee. Any pre-approved decisions are presented to the full audit committee at the next scheduled meeting. KPMG was our principal auditor and no work was performed by persons outside of this firm.
78
Table of Contents
| ITEM 15. | EXHIBITS AND FINANCIAL STATEMENT SCHEDULES |
(a)(1) Index to Consolidated Financial Statements
Please see the accompanying Index to Consolidated Financial Statements which appears on page F-1 of this report. The Management’s Report on Internal Control over Financial Reporting, Reports of Independent Registered Public Accounting Firm, Consolidated Financial Statements and Notes to Consolidated Financial Statements which are listed in the Index to Consolidated Financial Statements and which appear beginning on page F-2 of this report are included in Item 8 above.
(a)(2) Financial Statements Schedule
All financial statements schedules have been omitted because the information required to be set forth therein is not applicable or is included in the Consolidated Financial Statements or notes thereto.
Exhibits
The following exhibits are filed as part of, or are incorporated by reference in, this Form 10-K:
| Descriptions | ||
| 3.1 | Amended Articles of Restatement of the Articles of Incorporation. (Incorporated by reference to Exhibit 3.1 of the Annual Report on Form 10-K for the fiscal year ended December 31, 1996 filed with the Securities and Exchange Commission on April 15, 1997.) | |
| 3.1(a) | Amendments to Articles of Incorporation. (Incorporated by reference to the Registration Statement on Form S-1 filed on December 23, 2004, and subsequently amended on February 2, 2005.) | |
| 3.2 | Amended and Restated Bylaws. (Incorporated by reference to Exhibit 3.1 of the Current Report on Form 8-K filed with the Securities and Exchange Commission on May 13, 2008.) | |
| 3.3 | Articles of Merger. (Incorporated by reference to Exhibit 3.1 of the Current Report on Form 8-K filed with the Securities and Exchange Commission on May 13, 2008.) | |
| 4.1 | Specimen Stock Certificate. (Incorporated by reference to the Registration Statement on Form S-1 filed on December 23, 2004, and subsequently amended on February 2, 2005.) | |
| 4.2 | Shareholders Agreement, dated July 23, 2004. (Incorporated by reference to Exhibit 4.1 of the Form 8-K filed with the Securities and Exchange Commission on July 22, 2004.) | |
| 10.1 | Comtech Group, Inc. 2004 Incentive Stock Option Plan. (Incorporated by reference to the Registration Statement on Form S-1 filed on December 23, 2004, and subsequently amended on February 2, 2007.) | |
| 10.2 | Revolving Credit Agreement with Bank of Communications Hong Kong branch, dated September 14, 2004. (Incorporated by reference to Exhibit 10.3 to our Form 10-K for the year ended December 31, 2004 filed on March 31, 2005) | |
| 10.3 | Share Exchange Agreement between Trident Rowan Group Inc., Comtech Group Inc., and certain other parties, dated May 25, 2004. (Incorporated by reference to Exhibit 10.1 of the Form 8-K filed with the Securities and Exchange Commission on May 28, 2005.) | |
79
Table of Contents
| Descriptions | ||
| 10.4 | Equity Joint Venture Agreement between Comtech Group, Inc. and Broadwell Group Ltd. dated January 17, 2005. (Incorporated by reference to Exhibit 10.12 of the Form 8-K filed with the Securities and Exchange Commission on January 21, 2005.) | |
| 10.5 | Trident 1995 Director’s Plan. (Incorporated by reference to Exhibit 10.1 of Form 10-K filed with the Securities and Exchange Commission on May 24, 1996.) | |
| 10.6 | Agreement between Comtech Group, Inc. and United Information Technology Co. Ltd., dated May 12, 2005. (Incorporated by reference to Exhibit 10.1 of the Form 8-K filed with the Securities and Exchange Commission on May 17, 2005.) | |
| 10.7 | Agreement between Comtech Cayman and Century Teltone Technology Co. Ltd., dated November 9, 2005. (Incorporated by reference to Exhibit 10.1 of the Form 8-K filed with the Securities and Exchange Commission on November 17, 2005.) | |
| 10.8 | Share Acquisition Agreement, dated August 6, 2006, between Comtech (China) Holding Ltd. and Duckworth Investments, Ltd. (Incorporated by reference to Exhibit 10.3 of the Form 8-K filed with the Securities and Exchange Commission on August 9, 2006) | |
| 10.9 | 2006 Equity Incentive Plan. (Incorporated by reference to Exhibit A to our Schedule A filed with the Securities and Exchange Commission on December 1, 2006.) | |
| 10.10 | Deed Concerning Shares of Shanghai E & T System Company Limited, dated December 12, 2006, among Honghui Li and Comtech (China) Holding Ltd. (Incorporated by reference to Exhibit 10.13 to our Form 10-K for the year ended December 31, 2006 filed on March 16, 2007) | |
| 10.11 | Deed Concerning Shares of Shenzhen Comtech International Ltd, dated December 12, 2006, among Jeffrey (Jingwei) Kang, Honghui Li and Comtech (China) Holding Ltd. (Incorporated by reference to Exhibit 10.14 to our Form 10-K for the year ended December 31, 2006 filed on March 16, 2007) | |
| 10.12 | 2009 Securities and Incentive Plan (Incorporated by reference to Exhibit A of our Schedule 14A filed with the Commission on November 24, 2009). | |
| 10.13 | Form of Comprehensive Credit Facility Agreement by and between Shenzhen Futian Branch of GuangDong Development Bank and Comtech Communication Technology (Shenzhen) Company Limited (Incorporated by reference to the Current Report on Form 8-K filed with the Commission on November 20, 2009) | |
| 10.14 | Form of Maximum Guarantee Contract by and between Shenzhen Futian Branch of GuangDong Development Bank and Shenzhen Comtech International Limited (Incorporated by reference to the Current Report on Form 8-K filed with the Commission on November 20, 2009) | |
| 10.15 | Form of Maximum Guarantee Contract by and between Shenzhen Futian Branch of GuangDong Development Bank and Comtech International (Hong Kong) Limited (Incorporated by reference to the Current Report on Form 8-K filed with the Commission on November 20, 2009) | |
80
Table of Contents
| Descriptions | ||
| 10.16 | Form of Maximum Guarantee Contract by and between Shenzhen Futian Branch of GuangDong Development Bank and Keen Awards Limited (Incorporated by reference to the Current Report on Form 8-K filed with the Commission on November 20, 2009) | |
| 10.17 | Credit Extension Agreement by and between GuangDong Development Bank and Comtech International (Hong Kong) Limited, dated January 22, 2010 (Incorporated by reference to the Current Report on Form 8-K filed with the Commission on January 28, 2010) | |
| 10.18 | Maximum Pledge Contract by and between Shenzhen Futian Branch of GuangDong Development Bank and Comtech Software Technology (Shenzhen) Company Limited, dated January 22, 2010 (Incorporated by reference to the Current Report on Form 8-K filed with the Commission on January 28, 2010) | |
| 14.1 | Code of Business Conduct and Ethics. (Incorporated by reference to Exhibit 14.1 to our Form 10-K for the year ended December 31, 2004 filed on March 31, 2005) | |
| 21.1 | List of Subsidiaries of the Registrant. (Incorporated by reference to Exhibit 21.1 to our Form 10-K for the year ended December 31, 2007 filed on March 17, 2008) | |
| 23.1† | Consent of KPMG, Independent Registered Public Accounting Firm | |
| 24.1 | Power of Attorney (included on signature page to Form 10-K) | |
| 31.1† | Certification of Chief Executive Officer pursuant to Section 302 of the Sarbanes-Oxley Act of 2002. | |
| 31.2† | Certification of Chief Financial Officer pursuant to Section 302 of the Sarbanes-Oxley Act of 2002. | |
| 32.1†† | Certification of Chief Executive Officer pursuant to Section 906 of the Sarbanes-Oxley Act of 2002. | |
| 32.2†† | Certification of Chief Financial Officer pursuant to Section 906 of the Sarbanes-Oxley Act of 2002. | |
| † | Filed herewith |
| †† | Furnished herewith |
81
Table of Contents
SIGNATURES
Pursuant to the requirements of Section 13 or 15(d) of the Exchange Act of 1934, the registrant caused this report to be signed on its behalf by the undersigned, thereunto duly authorized.
| COGO GROUP, INC. | ||||
| Dated: March 12, 2010 | By: | /s/ Jeffrey Kang | ||
| Name: | Jeffrey Kang | |||
| Title: | Chairman and Chief Executive Officer | |||
POWER OF ATTORNEY
KNOW ALL PERSONS BY THESE PRESENT, that each person whose signature appears below constitutes and appoints Jeffrey Kang and Frank Zheng, and each of them, his or her true and lawful attorneys-in-fact and agents, each with full power of substitution and resubstitution, for him or her in any and all capacities, to sign any or all amendments to this Annual Report on Form 10-K, and to file the same, with all exhibits thereto and other documents in connection therewith, with the Securities and Exchange Commission, hereby ratifying and confirming all that said attorneys-in-fact and agents, or any of them, or their substitutes, may lawfully do or cause to be done by virtue hereof.
Pursuant to the requirements of the Securities Exchange Act of 1934, this report has been signed below by the following persons on behalf of the registrant and in the capacities and on the dates indicated.
| Dated: March 12, 2010 | By: | /s/ Jeffrey Kang | ||
| Name: | Jeffrey Kang | |||
| Title: | Chairman and Chief Executive Officer (Principal Executive Officer) | |||
| Dated March 12, 2010 | By: | /s/ Frank Zheng | ||
| Name: | Frank Zheng | |||
| Title: | Chief Financial Officer (Principal Financial Officer) and Director | |||
| Dated March 12, 2010 | By: | /s/ Allen Wu | ||
| Name: | Allen Wu | |||
| Title: | Financial Controller and Chief Accounting Officer (Principal Accounting Officer) | |||
Table of Contents
| Dated March 12, 2010 | By: | /s/ Q.Y. Ma | ||
| Name: | Q.Y. Ma | |||
| Title: | Director | |||
| Dated March 12, 2010 | By: | /s/ JP Gan | ||
| Name: | JP Gan | |||
| Title: | Director | |||
| Dated March 12, 2010 | By: | /s/ George Mao | ||
| Name: | George Mao | |||
| Title: | Director | |||
Table of Contents
INDEX TO CONSOLIDATED FINANCIAL STATEMENTS
F-1
Table of Contents
MANAGEMENT’S REPORT ON INTERNAL CONTROL OVER FINANCIAL REPORTING
Our management is responsible for establishing and maintaining adequate “internal control over financial reporting” (as defined in Rule 13a-15(f) under the Securities Exchange Act of 1934) for Cogo Group, Inc. (the “Company”) and its subsidiaries (collectively, the “Group”). Our internal control over financial reporting is a process designed under the supervision of the Chief Executive Officer and Chief Financial Officer to provide reasonable assurance regarding the reliability of financial reporting and the preparation of our financial statements for external reporting purposes in accordance with U.S. generally accepted accounting principles. A company’s internal control over financial reporting includes policies and procedures that (1) pertain to the maintenance of records that accurately and fairly reflect, in reasonable detail, transactions and dispositions of our assets, (2) provide reasonable assurance that transactions are recorded as necessary to permit preparation of financial statements in accordance with U.S. generally accepted accounting principles and that receipts and expenditures are being made only in accordance with authorizations of management and the directors of the Company, and (3) provide reasonable assurance regarding the prevention or timely detection of unauthorized acquisition, use, or disposition of our assets that could have a material effect on our financial statements.
Because of its inherent limitations, internal control over financial reporting cannot provide absolute assurance of achieving financial reporting objectives. Also, projections of any evaluation of effectiveness to future periods are subject to the risk that controls may become inadequate because of changes in conditions, or that the degree of compliance with policies or procedures may deteriorate.
Under the supervision of and with the participation of our management, including the Chief Executive Officer and Chief Financial Officer, management evaluated the effectiveness of Cogo’s internal control over financial reporting as of December 31, 2009. In its evaluation, management used the criteria set forth by the Committee of Sponsoring Organizations of the Treadway Commission (COSO) in Internal Control-Integrated Framework. Management believes that as of December 31, 2009, the Company’s internal control over financial reporting was effective based on those criteria.
Based on our assessment and the criteria described above, management has concluded that, as of December 31, 2009, our internal control over financial reporting was effective.
The Company’s independent registered public accounting firm has issued an audit report on management’s assessment of the Company’s internal control over financial reporting. This report is included herein.
F-2
Table of Contents
Report of Independent Registered Public Accounting Firm
The Board of Directors and Stockholders
Cogo Group, Inc.:
We have audited Cogo Group, Inc.’s internal control over financial reporting as of December 31, 2009, based on criteria established in Internal Control – Integrated Framework issued by the Committee of Sponsoring Organizations of the Treadway Commission (COSO). Cogo Group, Inc.’s management is responsible for maintaining effective internal control over financial reporting and for its assessment of the effectiveness of internal control over financial reporting, included in the accompanying Management’s Report on Internal Control over Financial Reporting. Our responsibility is to express an opinion on Cogo Group, Inc.’s internal control over financial reporting based on our audit.
We conducted our audit in accordance with the standards of the Public Company Accounting Oversight Board (United States). Those standards require that we plan and perform the audit to obtain reasonable assurance about whether effective internal control over financial reporting was maintained in all material respects. Our audit included obtaining an understanding of internal control over financial reporting, assessing the risk that a material weakness exists, and testing and evaluating the design and operating effectiveness of internal control based on the assessed risk. Our audit also included performing such other procedures as we considered necessary in the circumstances. We believe that our audit provides a reasonable basis for our opinion.
A company’s internal control over financial reporting is a process designed to provide reasonable assurance regarding the reliability of financial reporting and the preparation of financial statements for external purposes in accordance with generally accepted accounting principles. A company’s internal control over financial reporting includes those policies and procedures that (1) pertain to the maintenance of records that, in reasonable detail, accurately and fairly reflect the transactions and dispositions of the assets of the company; (2) provide reasonable assurance that transactions are recorded as necessary to permit preparation of financial statements in accordance with generally accepted accounting principles, and that receipts and expenditures of the company are being made only in accordance with authorizations of management and directors of the company; and (3) provide reasonable assurance regarding prevention or timely detection of unauthorized acquisition, use, or disposition of the company’s assets that could have a material effect on the financial statements.
Because of its inherent limitations, internal control over financial reporting may not prevent or detect misstatements. Also, projections of any evaluation of effectiveness to future periods are subject to the risk that controls may become inadequate because of changes in conditions, or that the degree of compliance with the policies or procedures may deteriorate.
In our opinion, Cogo Group, Inc. maintained, in all material respects, effective internal control over financial reporting as of December 31, 2009, based on criteria established in Internal Control – Integrated Framework issued by the Committee of Sponsoring Organizations of the Treadway Commission.
We also have audited, in accordance with the standards of the Public Company Accounting Oversight Board (United States), the consolidated balance sheets of Cogo Group, Inc. and subsidiaries as of December 31, 2009 and 2008, and the related consolidated statements of income and comprehensive income, changes in equity, and cash flows for each of the years in the three-year period ended December 31, 2009, and our report dated March 12, 2010 expressed an unqualified opinion on those consolidated financial statements.
/s/ KPMG
Hong Kong, China
March 12, 2010
F-3
Table of Contents
Report of Independent Registered Accounting Firm
The Board of Directors and Stockholders
Cogo Group, Inc.:
We have audited the accompanying consolidated balance sheets of Cogo Group, Inc. and subsidiaries as of December 31, 2009 and 2008, and the related consolidated statements of income and comprehensive income, changes in equity, and cash flows for each of the years in the three-year period ended December 31, 2009. These consolidated financial statements are the responsibility of Cogo Group, Inc.’s management. Our responsibility is to express an opinion on these consolidated financial statements based on our audits.
We conducted our audits in accordance with the standards of the Public Company Accounting Oversight Board (United States). Those standards require that we plan and perform the audit to obtain reasonable assurance about whether the financial statements are free of material misstatement. An audit includes examining, on a test basis, evidence supporting the amounts and disclosures in the financial statements, assessing the accounting principles used and significant estimates made by management, as well as evaluating the overall financial statement presentation. We believe that our audits provide a reasonable basis for our opinion.
In our opinion, the consolidated financial statements referred to above present fairly, in all material respects, the financial position of Cogo Group, Inc. and subsidiaries as of December 31, 2009 and 2008, and the results of their operations and their cash flows for each of the years in the three-year period ended December 31, 2009, in conformity with U.S. generally accepted accounting principles.
The accompanying consolidated financial statements as of and for the year ended December 31, 2009 have been translated into United States dollars solely for the convenience of the reader. We have audited the translation and, in our opinion, such consolidated financial statements expressed in Renminbi have been translated into United States dollars on the basis set forth in Note 2(c) to the consolidated financial statements.
As discussed in Note 2 to the consolidated financial statements, Cogo Group, Inc. changed its method of accounting for business combinations and noncontrolling interest in 2009.
We also have audited, in accordance with the standards of the Public Company Accounting Oversight Board (United States), Cogo Group, Inc.’s internal control over financial reporting as of December 31, 2009, based on criteria established in Internal Control — Integrated Framework issued by the Committee of Sponsoring Organizations of the Treadway Commission (COSO), and our report dated March 12, 2010 expressed an unqualified opinion on the effectiveness of Cogo Group, Inc.’s internal control over financial reporting.
/s/ KPMG
Hong Kong, China
March 12, 2010
F-4
Table of Contents
CONSOLIDATED BALANCE SHEETS
(in thousands, except share data)
| December 31, | |||||||||||
| Note | 2009 | 2009 | 2008 | ||||||||
| USD | RMB | RMB | |||||||||
| ASSETS |
|||||||||||
| Current assets: |
|||||||||||
| Cash |
97,764 | 667,320 | 686,379 | ||||||||
| Pledged bank deposits |
9 | 17,000 | 116,040 | 115,983 | |||||||
| Accounts receivable, net |
3 | 90,481 | 617,613 | 497,992 | |||||||
| Bills receivable |
4 | 2,577 | 17,592 | 13,555 | |||||||
| Inventories |
5 | 21,408 | 146,132 | 95,855 | |||||||
| Income taxes receivable |
185 | 1,263 | — | ||||||||
| Prepaid expenses and other receivables |
4,114 | 28,083 | 20,211 | ||||||||
| Total current assets |
233,529 | 1,594,043 | 1,429,975 | ||||||||
| Property and equipment, net |
6 | 2,110 | 14,406 | 17,993 | |||||||
| Intangible assets, net |
7 & 8 | 16,965 | 115,804 | 120,602 | |||||||
| Goodwill |
7 & 8 | 28,840 | 196,858 | 116,632 | |||||||
| Other assets |
61 | 416 | 1,608 | ||||||||
| TOTAL ASSETS |
281,505 | 1,921,527 | 1,686,810 | ||||||||
| LIABILITIES AND EQUITY |
|||||||||||
| Current liabilities: |
|||||||||||
| Accounts payable |
11,887 | 81,140 | 107,512 | ||||||||
| Bank borrowings |
9 | 17,492 | 119,402 | — | |||||||
| Income taxes payable |
1,736 | 11,847 | 8,225 | ||||||||
| Accrued expenses and other liabilities |
11 | 20,218 | 138,008 | 141,925 | |||||||
| Total current liabilities |
51,333 | 350,397 | 257,662 | ||||||||
| Deferred tax liabilities |
10 | 2,799 | 19,108 | 19,693 | |||||||
| Total liabilities |
54,132 | 369,505 | 277,355 | ||||||||
| Equity: |
|||||||||||
| Common stock |
|||||||||||
| Par value: USD0.01 |
|||||||||||
| Authorized: 200,000,000 shares |
|||||||||||
| Issued: 40,079,336 shares |
|||||||||||
| Outstanding: 35,770,025 shares in 2009 |
|||||||||||
| 35,231,661 shares in 2008 |
477 | 3,258 | 3,196 | ||||||||
| Additional paid in capital |
178,957 | 1,221,538 | 1,146,840 | ||||||||
| Retained earnings |
88,554 | 604,464 | 524,240 | ||||||||
| Accumulated other comprehensive loss |
(15,732 | ) | (107,384 | ) | (107,645 | ) | |||||
| 252,256 | 1,721,876 | 1,566,631 | |||||||||
| Less cost of common stock in treasury, 4,309,311 shares in 2009 and 3,944,411 shares in 2008 |
(26,122 | ) | (178,309 | ) | (162,687 | ) | |||||
| Total Cogo Group, Inc. equity |
226,134 | 1,543,567 | 1,403,944 | ||||||||
| Noncontrolling interest |
1,239 | 8,455 | 5,511 | ||||||||
| Total equity |
227,373 | 1,552,022 | 1,409,455 | ||||||||
| Commitments and contingencies |
16 | ||||||||||
| TOTAL LIABILITIES AND EQUITY |
281,505 | 1,921,527 | 1,686,810 | ||||||||
See accompanying notes to consolidated financial statements.
F-5
Table of Contents
CONSOLIDATED STATEMENTS OF INCOME AND COMPREHENSIVE INCOME
(in thousands, except share data)
| Year ended December 31, | ||||||||||||||
| Note | 2009 | 2009 | 2008 | 2007 | ||||||||||
| USD | RMB | RMB | RMB | |||||||||||
| Net revenue |
||||||||||||||
| Product sales |
14 | 302,790 | 2,066,815 | 1,931,845 | 1,597,818 | |||||||||
| Services revenue |
14 | 4,307 | 29,401 | 27,695 | 68,690 | |||||||||
| 307,097 | 2,096,216 | 1,959,540 | 1,666,508 | |||||||||||
| Cost of sales |
||||||||||||||
| Cost of goods sold |
(259,477 | ) | (1,771,166 | ) | (1,624,101 | ) | (1,297,225 | ) | ||||||
| Cost of services |
(3,475 | ) | (23,716 | ) | (18,664 | ) | (46,368 | ) | ||||||
| (262,952 | ) | (1,794,882 | ) | (1,642,765 | ) | (1,343,593 | ) | |||||||
| Gross profit |
44,145 | 301,334 | 316,775 | 322,915 | ||||||||||
| Selling, general and administrative expenses |
(18,290 | ) | (124,842 | ) | (152,898 | ) | (120,580 | ) | ||||||
| Research and development expenses |
(9,889 | ) | (67,504 | ) | (50,947 | ) | (40,973 | ) | ||||||
| Provision for doubtful accounts |
3 | (5,272 | ) | (35,992 | ) | (6,847 | ) | (15,051 | ) | |||||
| Impairment loss of goodwill and intangible assets |
— | — | (33,759 | ) | — | |||||||||
| Other operating income, net |
17 | 116 | 214 | 170 | ||||||||||
| Income from operations |
10,711 | 73,112 | 72,538 | 146,481 | ||||||||||
| Interest expense |
(288 | ) | (1,963 | ) | (1,056 | ) | (2,335 | ) | ||||||
| Interest income |
2,123 | 14,490 | 27,895 | 25,637 | ||||||||||
| Earnings before income taxes and extraordinary item |
12,546 | 85,639 | 99,377 | 169,783 | ||||||||||
| Income tax expense |
10 | (1,349 | ) | (9,207 | ) | (2,215 | ) | (14,275 | ) | |||||
| Income before extraordinary item |
11,197 | 76,432 | 97,162 | 155,508 | ||||||||||
| Extraordinary item, net of nil tax |
7 | 987 | 6,737 | — | — | |||||||||
| Net income |
12,184 | 83,169 | 97,162 | 155,508 | ||||||||||
| Less net income attributable to noncontrolling interest. |
(431 | ) | (2,945 | ) | (1,255 | ) | (3,065 | ) | ||||||
| Net income attributable to Cogo Group, Inc. |
11,753 | 80,224 | 95,907 | 152,443 | ||||||||||
| Earnings per share attributable to Cogo Group, Inc. |
||||||||||||||
| Income before extraordinary item |
0.29 | 2.01 | 2.49 | 4.12 | ||||||||||
| Extraordinary item |
0.03 | 0.19 | — | — | ||||||||||
| - Basic |
13 | 0.32 | 2.20 | 2.49 | 4.12 | |||||||||
| Income before extraordinary item |
0.29 | 1.95 | 2.42 | 3.98 | ||||||||||
| Extraordinary item |
0.03 | 0.18 | — | — | ||||||||||
| - Diluted |
13 | 0.32 | 2.13 | 2.42 | 3.98 | |||||||||
| Weighted average number of common shares outstanding |
||||||||||||||
| - Basic |
13 | 36,541,037 | 38,488,861 | 36,974,100 | ||||||||||
| - Diluted |
13 | 37,673,351 | 39,585,921 | 38,306,969 | ||||||||||
| Amounts attributable to Cogo Group, Inc. |
||||||||||||||
| Income before extraordinary item |
10,766 | 73,487 | 95,907 | 152,443 | ||||||||||
| Extraordinary item |
987 | 6,737 | — | — | ||||||||||
| Net income attributable to Cogo Group, Inc. |
11,753 | 80,224 | 95,907 | 152,443 | ||||||||||
| Comprehensive income: |
||||||||||||||
| Net income |
12,184 | 83,169 | 97,162 | 155,508 | ||||||||||
| Other comprehensive income (loss), net of tax |
||||||||||||||
| Foreign currency translation adjustments |
38 | 260 | (44,570 | ) | (45,766 | ) | ||||||||
| Comprehensive income |
12,222 | 83,429 | 52,592 | 109,742 | ||||||||||
| Less: comprehensive income, net of tax attributable to noncontrolling interest |
(431 | ) | (2,944 | ) | (1,256 | ) | (2,955 | ) | ||||||
| Comprehensive income attributable to Cogo Group, Inc. |
11,791 | 80,485 | 51,336 | 106,787 | ||||||||||
See accompanying notes to consolidated financial statements.
F-6
Table of Contents
CONSOLIDATED STATEMENTS OF CHANGES IN EQUITY
(in thousands, except share data)
| Cogo Group, Inc. Stockholders | ||||||||||||||||||||||
| Common Stock | Additional paid in capital |
Retained earnings |
Accumulated other comprehensive loss |
Treasury Stock |
Non-controlling interest |
Total equity |
||||||||||||||||
| Number of shares | RMB | RMB | RMB | RMB | RMB | RMB | RMB | |||||||||||||||
| Balance as of January 1, 2007 |
32,971,901 | 2,725 | 402,721 | 275,890 | (17,418 | ) | 1,646 | 665,564 | ||||||||||||||
| Net income |
— | — | — | 152,443 | — | — | 3,065 | 155,508 | ||||||||||||||
| Foreign currency translation adjustments |
— | — | — | — | (45,656 | ) | — | (110 | ) | (45,766 | ) | |||||||||||
| Purchase of subsidiary shares from noncontrolling interest |
— | — | — | — | — | — | (4,601 | ) | (4,601 | ) | ||||||||||||
| Issuance of common stock pursuant to share-based compensation plan |
464,266 | 35 | 3,245 | — | — | — | — | 3,280 | ||||||||||||||
| Issuance of share in connection with public offering, net of issuance costs of RMB7,709 |
5,060,000 | 390 | 641,478 | — | — | — | — | 641,868 | ||||||||||||||
| Share-based compensation |
— | — | 38,015 | — | — | — | — | 38,015 | ||||||||||||||
| Balance as of December 31, 2007 |
38,496,167 | 3,150 | 1,085,459 | 428,333 | (63,074 | ) | — | — | 1,453,868 | |||||||||||||
| Net income |
— | — | — | 95,907 | — | — | 1,255 | 97,162 | ||||||||||||||
| Foreign currency translation adjustments |
— | — | — | — | (44,571 | ) | — | 1 | (44,570 | ) | ||||||||||||
| Acquisition of Long Rise (note 7) |
— | — | — | — | — | — | 4,255 | 4,255 | ||||||||||||||
| Issuance of common stock pursuant to share-based compensation plan |
502,602 | 34 | (34 | ) | — | — | — | — | — | |||||||||||||
| Share-based compensation |
— | — | 40,722 | — | — | — | — | 40,722 | ||||||||||||||
| Issuance of common stock in connection with consideration paid for the acquisition of Comtech Broadband |
177,303 | 12 | 20,693 | — | — | — | — | 20,705 | ||||||||||||||
| Purchase of treasury stock |
(3,944,411 | ) | — | — | — | — | (162,687 | ) | — | (162,687 | ) | |||||||||||
| Balance as of December 31, 2008 |
35,231,661 | 3,196 | 1,146,840 | 524,240 | (107,645 | ) | (162,687 | ) | 5,511 | 1,409,455 | ||||||||||||
| Net income |
80,224 | __ | __ | 2,945 | 83,169 | |||||||||||||||||
| Foreign currency translation adjustments |
__ | __ | __ | __ | 261 | __ | (1 | ) | 260 | |||||||||||||
| Issuance of common stock pursuant to share-based compensation plan |
785,059 | 53 | 1,996 | __ | __ | __ | 2,049 | |||||||||||||||
| Share-based compensation |
__ | __ | 59,045 | __ | __ | __ | __ | 59,045 | ||||||||||||||
| Issuance of common stock in connection with consideration paid for the acquisition of Comtech Broadband |
118,205 | 9 | 13,657 | __ | __ | __ | 13,666 | |||||||||||||||
| Purchase of treasury stock |
(364,900 | ) | — | — | — | — | (15,622 | ) | — | (15,622 | ) | |||||||||||
| Balance as of December 31, 2009 |
35,770,025 | 3,258 | 1,221,538 | 604,464 | (107,384 | ) | (178,309 | ) | 8,455 | 1,552,022 | ||||||||||||
| Balance as of December 31, 2009 (in USD) |
477 | 178,957 | 88,554 | (15,732 | ) | (26,122 | ) | 1,239 | 227,373 | |||||||||||||
See accompanying notes to consolidated financial statements.
F-7
Table of Contents
CONSOLIDATED STATEMENTS OF CASH FLOWS
(in thousands)
| Years ended December 31, | ||||||||||||
| 2009 | 2009 | 2008 | 2007 | |||||||||
| USD | RMB | RMB | RMB | |||||||||
| Cash flows from operating activities: |
||||||||||||
| Net income |
12,184 | 83,169 | 97,162 | 155,508 | ||||||||
| Adjustments to reconcile net income to net cash provided by operating activities: |
||||||||||||
| Depreciation expense |
854 | 5,826 | 8,765 | 5,110 | ||||||||
| Amortization of intangible assets |
4,178 | 28,521 | 28,719 | 13,405 | ||||||||
| Impairment loss of goodwill and intangible assets |
— | — | 33,759 | — | ||||||||
| In-process research and development |
— | — | 4,390 | — | ||||||||
| Deferred income taxes |
(659 | ) | (4,500 | ) | (10,841 | ) | (440 | ) | ||||
| Loss on disposal of property and equipment |
26 | 175 | 50 | 87 | ||||||||
| Extraordinary item (note 7) |
(987 | ) | (6,737 | ) | — | — | ||||||
| Provision for doubtful accounts |
5,273 | 35,992 | 6,847 | 15,051 | ||||||||
| Share-based compensation |
8,650 | 59,045 | 40,722 | 38,015 | ||||||||
| Changes in current assets and liabilities, net of effects of acquisitions and dispositions: |
||||||||||||
| Accounts receivable |
(22,790 | ) | (155,560 | ) | (92,852 | ) | (171,348 | ) | ||||
| Bills receivable |
(591 | ) | (4,037 | ) | 21,745 | (3,503 | ) | |||||
| Inventories |
(7,370 | ) | (50,309 | ) | 40,748 | (59,104 | ) | |||||
| Prepaid expenses and other receivables |
(976 | ) | (6,665 | ) | (3,958 | ) | (5,999 | ) | ||||
| Income taxes receivable |
(185 | ) | (1,265 | ) | — | — | ||||||
| Accounts payable |
(3,865 | ) | (26,382 | ) | (60,698 | ) | 65,670 | |||||
| Amount due to a related party |
— | — | (1,338 | ) | — | |||||||
| Income taxes payable |
530 | 3,620 | (156 | ) | (2,603 | ) | ||||||
| Accrued expenses and other liabilities |
820 | 5,597 | (15,602 | ) | (3,434 | ) | ||||||
| Net cash provided by (used in) operating activities |
(4,908 | ) | (33,510 | ) | 97,462 | 46,415 | ||||||
| Cash flows from investing activities: |
||||||||||||
| Decrease (increase) in pledged bank deposits |
— | — | (68,963 | ) | 203 | |||||||
| Payments for acquisitions of subsidiaries, net of cash acquired |
(13,070 | ) | (89,215 | ) | (41,333 | ) | (82,837 | ) | ||||
| Purchases of property and equipment |
(356 | ) | (2,429 | ) | (7,551 | ) | (9,034 | ) | ||||
| Net cash used in investing activities |
(13,426 | ) | (91,644 | ) | (117,847 | ) | (91,668 | ) | ||||
| Cash flow from financing activities: |
||||||||||||
| Purchase of treasury stock |
(2,289 | ) | (15,622 | ) | (162,687 | ) | — | |||||
| Proceeds from bank borrowings |
17,505 | 119,486 | — | — | ||||||||
| Repayment of bank borrowings |
— | — | (17,962 | ) | (20,039 | ) | ||||||
| Proceeds from issuance of common stock, net |
— | — | — | 641,868 | ||||||||
| Proceeds from exercises of stock warrants and options |
300 | 2,049 | — | 3,280 | ||||||||
| Net cash provided by (used in) financing activities |
15,516 | 105,913 | (180,649 | ) | 625,109 | |||||||
| Effect of exchange rate changes on cash |
27 | 182 | (32,237 | ) | (35,353 | ) | ||||||
| Net increase (decrease) in cash |
(2,791 | ) | (19,059 | ) | (233,271 | ) | 544,503 | |||||
| Cash at beginning of the year |
100,555 | 686,379 | 919,650 | 375,147 | ||||||||
| Cash at end of the year |
97,764 | 667,320 | 686,379 | 919,650 | ||||||||
| Supplementary cash flow information: |
||||||||||||
| Interest paid |
288 | 1,963 | 1,056 | 2,335 | ||||||||
| Income taxes paid |
1,663 | 11,349 | 11,680 | 17,028 | ||||||||
| Non-cash investing activities: |
||||||||||||
| Shares issued for Comtech Broadband acquisition consideration payable, included in other liabilities |
2,002 | 13,666 | 20,468 | — | ||||||||
| Acquisition of Mega Smart included in accrued expenses and other liabilities (note 7) |
17,934 | 122,415 | — | — | ||||||||
| Acquisition of Long Rise included in accrued expenses and other liabilities (note 7) |
— | — | 60,921 | — | ||||||||
| Reduction of intangible assets upon reversal of contingent consideration payable in respect of Keen Awards (note 7) |
3,927 | 26,803 | — | — | ||||||||
See accompanying notes to consolidated financial statements.
F-8
Table of Contents
NOTES TO CONSOLIDATED FINANCIAL STATEMENTS
(in thousands, except share data)
| 1. | ORGANIZATION AND NATURE OF OPERATIONS |
Cogo Group, Inc. (the “Company”), formerly Comtech Group, Inc., and its subsidiaries (together, the “Group”) are principally engaged in the sale of component parts for electronic devices and equipment, such as liquid crystal display, cameras, persistent storage and peripheral devices for wireless handsets and fixed-line telecommunications, to manufacturers in the People’s Republic of China (“PRC”) and other overseas countries. The Group also provides technology and engineering services, business process outsourcing and other related services in the PRC.
As of December 31, 2009, the subsidiaries which principally affect the results of operations and financial condition of the Company are as follows:
| Name of company |
Place of incorporation or |
Attributable equity interest held |
Principal activity | ||||
| Comloca Technology (Shenzhen) Company Limited (“Comloca”) |
PRC |
100 | % | Location-based search business | |||
| Comtech Broadband Corporation Limited (“Comtech Broadband”) |
Hong Kong |
100 | % | Sales of electronics components and related products | |||
| Comtech Communication Technology (Shenzhen) Company Limited (“Comtech Communication”) |
PRC |
100 | % | Sales of electronics components and related products | |||
| Comtech International (Hong Kong) Limited (“Comtech Hong Kong”) |
Hong Kong |
100 | % | Sales of electronics components and related products | |||
| Comtech Software Technology (Shenzhen) Company Limited (“Comtech Software”) |
PRC |
100 | % | Sales of electronics components and related products and research and development of software products | |||
| Epcot Multimedia Technology (SZ) Co. Ltd. (“Epcot”) |
PRC | 100 |
% |
Provision of media communication and collaboration platforms and solutions | |||
| Keen Awards Limited (“Keen Awards”) |
Hong Kong | 100 |
% |
Sales of technology components and provision of design and engineering services for integrated display technology solutions | |||
| Shenzhen Comtech International Limited (“Shenzhen Comtech”) |
PRC | 100 |
% |
Sales of electronics components and related products (note a) | |||
| Shanghai E&T System Company Limited (“Shanghai E & T”) |
PRC | 100 |
% |
Sales of electronics components and related products (note a) | |||
| Shenzhen Huameng Software Company Limited (“Huameng PRC”) |
PRC | 100 |
% |
Provision of technology and engineering services, outsourcing, network system integration and related training and maintenance services | |||
| Viewtran Technology (Shenzhen) Co., Limited (“Viewtran PRC”) |
PRC | 100 |
% |
Provision of media communication and collaboration platforms and solutions | |||
| Rise Year Limited (“Rise Year”) |
Hong Kong | 70 | % | Provision of code division multiple access (“CDMA”) mobile handset design solutions | |||
| Comtech Industrial (Hong Kong) Limited (“Comtech Industrial”) |
Hong Kong | 100 | % | Sale of industrial applications | |||
F-9
Table of Contents
COGO GROUP, INC.
NOTES TO CONSOLIDATED FINANCIAL STATEMENTS
(in thousands, except share data)
| Note a | The Company exercises its control over Shenzhen Comtech, which in turn, has 95% equity interest in Shanghai E&T, through legal arrangements between Comtech (China) Holding Limited (“Comtech China”), a wholly-owned subsidiary of the Company, and Shenzhen Comtech’s legal shareholders (“Legal Shareholders”), Jeffrey Kang, CEO of the Group, Huimo Chen, the mother of Jeffrey Kang, and Honghui Li, the Vice President of the Group. In 2006, Jeffrey Kang executed an agreement to transfer his 99% equity interest in Shenzhen Comtech to Honghui Li. The Legal Shareholders agreed to hold the equity interest in Shenzhen Comtech on behalf of Comtech China, and waived their full rights and risks of ownership of the equity interests in favor of Comtech China. | |
| The legal shareholders of Shanghai E&T is Shenzhen Comtech and Honghui Li with equity interests of 95% and 5% respectively. Honghui Li entered into and is bound by similar legal arrangements with Comtech China relating to his holding of 5% equity interest in Shanghai E&T on behalf of Comtech China waiving his full rights and risks of ownership of the equity interests in favor of Comtech China. |
| 2. | SUMMARY OF SIGNIFICANT ACCOUNTING POLICIES |
The accompanying consolidated financial statements have been prepared in accordance with U.S. generally accepted accounting principles (“U.S. GAAP”).
| (a) | Principle of Consolidation |
The consolidated financial statements include the accounts of Cogo Group, Inc. and its subsidiaries. All significant inter-company balances and transactions have been eliminated upon consolidation.
| (b) | Use of estimates |
The preparation of the consolidated financial statements in conformity with U.S. GAAP requires management of the Group to make a number of estimates and assumptions relating to the reported amounts of assets and liabilities and the disclosure of contingent assets and liabilities at the date of the consolidated financial statements and the reported amounts of revenues and expenses during the period. Significant items subject to such estimates and assumptions include the recoverability of the carrying amount of property and equipment, goodwill and intangible assets; the allocation of the purchase price for the Company’s acquisitions; the collectibility of accounts receivable; the realizability of deferred tax assets and inventories; fair value of share-based compensation; the useful lives and salvage values of property and equipment; and amounts recorded for contingencies. These estimates are often based on complex judgments and assumptions that management believes to be reasonable but are inherently uncertain and unpredictable. Actual results may differ from those estimates.
| (c) | Foreign Currency Transactions and Translation |
The Group’s reporting currency is the Renminbi (“RMB”). The functional currency of the Company is the U.S. dollar (“USD”), whereas the functional currency of the Company’s subsidiaries in the PRC and Hong Kong is the RMB and Hong Kong dollar, respectively. Transactions denominated in currencies other than the functional currency are translated into the functional currency at the exchange rates prevailing at the date of the transaction. Monetary assets and liabilities denominated in currencies other than the functional currency are translated into the functional currency using the applicable exchange rates at each balance sheet date. The net foreign currency exchange gain/(loss) amounted to RMB14,381 (USD2,107), RMB(19,510) and RMB(7,780) for the years ended December 31, 2009, 2008 and 2007, respectively, are included in ‘Selling, general and administrative expenses’ in the consolidated statements of income and comprehensive income.
Gains and losses resulting from translation of the financial statements of the Company and the Company’s subsidiaries in Hong Kong into the RMB reporting currency are recorded as a separate component of accumulated other comprehensive loss within equity.
F-10
Table of Contents
COGO GROUP, INC.
NOTES TO CONSOLIDATED FINANCIAL STATEMENTS
(in thousands, except share data)
For the convenience of the readers, the December 31, 2009 RMB amounts, included in the accompanying consolidated financial statements have been translated into USD at the rate of USD1.00 = RMB6.8259, representing the rate quoted by the People’s Bank of China at the close of business on December 31, 2009. No representation is made that the RMB amounts could have been, or could be, converted into USD at that rate or at any particular rate or at all.
| (d) | Cash and Pledged Bank Deposits |
Cash consists of cash on hand, cash in bank accounts and interest-bearing savings accounts. Cash deposits that are restricted as to withdrawal or pledged as security, are disclosed separately on the face of the consolidated balance sheet, and not included in the total cash for the purpose of the consolidated statements of cash flows.
| (e) | Accounts Receivable |
Accounts receivable are recorded at the invoiced amount and do not bear interest. The allowance for doubtful accounts is the Group’s best estimate of the amount of probable credit losses in the Group’s existing accounts receivable. The Group determines the allowance based on a review of specifically identified accounts and aging data. The Group reviews its allowance for doubtful accounts monthly. Past due balances over 90 days and over a specified amount are reviewed individually for collectibility. All other balances are reviewed on a pooled basis.
Account balances are charged off against the allowance after all means of collection have been exhausted and the potential for recovery is considered remote. The Company’s subsidiaries in the PRC are required to comply with local tax requirements on the write-offs of doubtful accounts, which allow for the deductibility of such write-offs only when sufficient evidence is available to prove the debtors’ inability to make payments. For financial reporting purposes, the Group generally records write-offs of doubtful accounts at the same time the local tax requirements for the write-offs are met. As a result, there are generally time lags between the time when a provision for doubtful accounts is provided and the time the doubtful accounts and the related allowance are written off.
Apart from those disclosed in note 16(c), the Group does not have any off balance-sheet credit exposure related to its customers.
| (f) | Inventories |
Inventories are stated at the lower of cost or market. Cost is determined by the first-in, first-out method. Cost of inventories comprises direct materials.
| (g) | Long-lived Assets |
Property and Equipment and Intangible Assets
Property and equipment is stated at cost less depreciation and if applicable, impairment. Depreciation is calculated on a straight-line method over the estimated useful lives of the assets. The estimated useful lives are as follows:
| Property | 20 years | |
| Furniture and office equipment | 1 to 5 year(s) | |
| Machinery | 5 years | |
| Motor vehicles | 5 years | |
|
Intangible assets that are subject to amortization are amortized over their respective estimated useful lives as follows:
| ||
| Customer relationships | 5 to 10 years | |
| Supplier relationships | 11.5 years | |
| Proprietary technology | 3 to 6.5 years | |
| Proprietary designs | 3 years | |
| Website and software assets | 3 years | |
| Non-compete agreements | 1 to 6 year(s) | |
| License agreements | 2 years | |
F-11
Table of Contents
COGO GROUP, INC.
NOTES TO CONSOLIDATED FINANCIAL STATEMENTS
(in thousands, except share data)
Property and equipment and intangible assets subject to depreciation/amortization are reviewed for impairment whenever events or changes in circumstances indicate that the carrying amount of an asset may not be recoverable. Recoverability of assets to be held and used is measured by a comparison of the carrying amount of an asset to estimated undiscounted future cash flows expected to be generated by the asset. If the carrying amount of an asset exceeds its estimated future cash flows, an impairment charge is recognized by the amount by which the carrying amount of the asset exceeds the estimated fair value of the asset. Assets to be disposed of are separately presented in the balance sheet and reported at the lower of the carrying amount or fair value less costs to sell, and are no longer depreciated.
Goodwill
Goodwill represents the excess of the aggregate purchase price over the fair value of the net assets acquired in a purchase business combination. Goodwill is not amortized, but instead tested for impairment at the reporting unit level at least annually and whenever events or changes in circumstances indicate that the carrying value may not be recoverable. The goodwill impairment test is a two-step test. Under the first step, the fair value of a reporting unit is compared with its carrying amount, including goodwill. If the fair value of the reporting unit exceeds its carrying value, step two does not need to be performed. However, if the fair value of the reporting unit is less than its carrying value, an indication of goodwill impairment exists for the reporting unit and the Group must perform step two of the impairment test (measurement). Under step two, an impairment loss is recognized for any excess of the carrying amount of the reporting unit’s goodwill over the implied fair value of that goodwill. The implied fair value of goodwill is determined by allocating the fair value of the reporting unit in a manner similar to a purchase price allocation. The residual fair value after this allocation is the implied fair value of the reporting unit goodwill. Fair value of the reporting unit is determined using a discounted cash flow analysis. For the year ended December 31, 2009, the Group performed its annual impairment review of goodwill and no impairment loss was recorded (2008: RMB4,264, 2007: Nil).
| (h) | Income Taxes |
Income taxes are accounted for under the asset and liability method. Deferred tax assets and liabilities are recognized for the future tax consequences attributable to differences between the financial statement carrying amounts of existing assets and liabilities and their respective tax bases and tax loss and tax credit carryforwards. Deferred tax assets and liabilities are measured using enacted tax rates expected to apply to taxable income in the years in which those temporary differences are expected to be recovered or settled. The effect on deferred tax assets and liabilities of a change in tax rates is recognized in consolidated statements of income and comprehensive income in the period that includes the enactment date or date of change in tax rate. A valuation allowance is provided to reduce the amount of deferred tax assets if it is considered more likely than not that some portion or all of the deferred tax assets will not be realized.
The Group adopts Financial Accounting Standards Board (“FASB”) Interpretation No. 48, Accounting for Uncertainty in Income Taxes, an interpretation of Statement of Financial Accounting Standards No. 109 which is codified as Accounting Standards Codification (“ASC”) 740-10-25. ASC 740-10-25 clarifies the accounting for uncertain tax positions. This requires that an entity recognizes in the consolidated financial statements the impact of a tax position, if that position is more likely than not of being sustained upon examination, based on the technical merits of the position. Recognized income tax positions are measured at the largest amount that is greater than 50% likely of being realized. Changes in recognition or measurement are reflected in the period in which the change in judgment occurs. The Group has elected to classify interest and penalties related to unrecognized tax benefits, if and when required, as a component of income tax expense in the consolidated statements of income and comprehensive income.
| (i) | Revenue Recognition |
Product Sales
The Company recognizes revenue at the point in time when the components are delivered and the customer takes ownership and assumes risk of loss, collection of the relevant receivable is probable, persuasive evidence of an arrangement exists and the sales price is fixed or determinable.
F-12
Table of Contents
COGO GROUP, INC.
NOTES TO CONSOLIDATED FINANCIAL STATEMENTS
(in thousands, except share data)
Sales of components represent the invoiced value of goods, net of value added taxes (“VAT”), sales returns, trade discounts and allowances.
In the PRC, VAT at a general rate of 17% on invoice amount is collected on behalf of tax authorities in respect of the sales of products and is not recorded as revenue. VAT collected from customers, net of VAT paid for purchases, is recorded as a liability in the consolidated balance sheets until it is paid to the authorities.
Services Revenue
Revenue for services is generally recognized when services are performed.
| (j) | Research and Development and Advertising |
Research and development and advertising costs are expensed as incurred. Research and development costs, inclusive of in-process research and development, amounted to RMB67,504 (USD9,889), RMB50,947 and RMB40,973 for the years ended December 31, 2009, 2008 and 2007, respectively. Advertising costs amounted to RMB59 (USD9), RMB713 and RMB801 for the years ended December 31, 2009, 2008 and 2007, respectively.
| (k) | Shipping and Handling Fees and Costs |
Costs incurred by the Group for shipping and handling, including costs paid to third-party transportation companies, to transport and deliver products to customers, are included in “selling, general and administrative expenses”. Shipping and handling fees and costs amounted to RMB7,749 (USD1,135), RMB8,423 and RMB7,247 for the years ended December 31, 2009, 2008 and 2007, respectively.
| (l) | Share-based Compensation |
The Group applies Statements of Financial Accounting Standards (“SFAS”) No. 123R, Share-Based Payment (“SFAS No. 123R”) which was codified into ASC 718, “Compensation- Stock Compensation” to measure the cost of employee services received in exchange for an award of equity instruments based on the grant-date fair value of the award and recognizes the costs over the period the employee is required to provide service in exchange for the award, which generally is the vesting period. For awards with performance conditions, the compensation expense is based on the grant-date fair value of the award, the number of shares ultimately expected to vest and the vesting period.
Share-based compensation expense of RMB59,045 (USD8,650), RMB40,722 and RMB38,015 for the years ended December 31, 2009, 2008 and 2007, respectively. Since share-based compensation is not tax deductible in the PRC and the United States, no related tax benefit has been recognized.
The Company currently uses authorized shares to satisfy share award exercises.
| (m) | Earnings per Share |
Basic earnings per share is computed by dividing net income by the weighted average number of common stock outstanding during the year, including contingently issuable shares when all necessary conditions for the issuance have been satisfied. Diluted earnings per share is computed by dividing net income by the weighted average number of common and dilutive potential common shares outstanding during the year. Dilutive potential common shares consist of common shares issuable upon the exercise of stock options, non-vested equity share units, including performance shares, warrants using the treasury stock method. Dilutive potential common shares also includes common shares issuable in connection with a business combination upon resolution of contingencies based on the number of such shares that would be issuable at the end of the year assuming it was the end of the contingency period.
| (n) | Commitments and Contingencies |
Liabilities for loss contingencies arising from claims, assessments, litigation, fines and other sources are recorded when it is probable that a liability has been incurred and the amount of the assessment can be reasonably estimated.
F-13
Table of Contents
COGO GROUP, INC.
NOTES TO CONSOLIDATED FINANCIAL STATEMENTS
(in thousands, except share data)
| (o) | Recently Issued Accounting Pronouncements |
Since the third quarter of 2009, the Group adopted FASB ASC. The ASC is the single official source of authoritative, nongovernmental GAAP, other than guidance issued by the SEC. The adoption of the ASC did not have any impact on the financial statements included herein.
ASC 805, Business Combinations and ASC 810, Consolidation
In December 2007, the FASB issued SFAS No. 141(R), Business Combinations (codified as ASC 805, Business Combinations) and SFAS No. 160, Noncontrolling Interests in Consolidated Financial Statements – an amendment to ARB No. 51 (codified as ASC 810, Consolidation). ASC 805 and ASC 810 require most identifiable assets, liabilities, noncontrolling interests and goodwill acquired in a business combination to be recorded at “full fair value” and require noncontrolling interests (previously referred to as minority interest) to be reported as a component of equity, which changes the accounting for transactions with noncontrolling interest holders. The amendments to ASC 805 were effective for business combinations closing after January 1, 2009. Effective January 1, 2009, the Group adopted the provisions of ASC 805 without a material impact to the consolidated financial statements. ASC 810 requires the Company to make certain changes to the presentation of financial statements. This standard requires the Company to classify noncontrolling interests (previously referred to as “minority interest”) as part of consolidated net income and to include the accumulated amount of noncontrolling interests as part of equity. The net income amounts the Company has previously reported are now presented as “Net income attributable to the Cogo Group, Inc.” and, as required by ASC 810, earnings per share continues to reflect amounts attributable only to the Company. Similarly, in the presentation of equity, the Company distinguishes between equity amounts attributable to Cogo Group, Inc. stockholders and the amounts attributable to the noncontrolling interests were previously classified as minority interest outside of equity.
ASC 855, Subsequent events
In May 2009, the FASB issued SFAS No. 165, Subsequent Events, which was primarily codified into ASC 855 —Subsequent Events. ASC 855 sets forth: (1) the period after the balance sheet date during which management of a reporting entity should evaluate events or transactions that may occur for potential recognition or disclosure in financial statements, (2) the circumstances under which an entity should recognize events or transactions occurring after the balance sheet date in its financial statements and (3) the disclosures that an entity should make about events or transactions that occurred after the balance sheet date. The Group has evaluated the period beginning January 1, 2010 through to March 12, 2010, the date the consolidated financial statements were issued. See note 9.
Accounting Standards Update (“ASU”) 2009-05, an update to ASC 820, Fair Value Measurements and Disclosures
In August 2009, the FASB issued ASU 2009-05, an update to ASC 820, Fair Value Measurements and Disclosures. This update provides amendments to reduce potential ambiguity in financial reporting when measuring the fair value of liabilities. Among other provisions, this update provides clarification that in circumstances in which a quoted price in an active market for the identical liability is not available, a reporting entity is required to measure fair value using one or more of the valuation techniques described in ASU 2009-05. ASU 2009-05 is effective in the current financial period. The Company has evaluated that there are no significant impacts to the consolidated financial statements.
F-14
Table of Contents
COGO GROUP, INC.
NOTES TO CONSOLIDATED FINANCIAL STATEMENTS
(in thousands, except share data)
ASU 2009-13, Revenue Recognition (ASC 605) — Multiple-Deliverable Revenue Arrangements and ASU 2009-19, Software (ASC 985) — Certain Revenue Arrangements that include Software Elements
In September 2009, the FASB reached a consensus on ASU 2009-13, Revenue Recognition (ASU 605)—Multiple-Deliverable Revenue Arrangements and ASU 2009-14, Software (ASC 985) — Certain Revenue Arrangements That Include Software Elements. ASU 2009-13 modifies the requirements that must be met for an entity to recognize revenue from the sale of a delivered item that is part of a multiple-element arrangement when other items have not yet been delivered. ASU 2009-13 eliminates the requirement that all undelivered elements must have either: i) vendor-specific objective evidence (“VSOE”) or ii) third-party evidence (“TPE”), before an entity can recognize the portion of an overall arrangement consideration that is attributable to items that already have been delivered. In the absence of VSOE or TPE of the standalone selling price for one or more delivered or undelivered elements in a multiple-element arrangement, entities will be required to estimate the selling prices of those elements. Overall arrangement consideration will be allocated to each element (both delivered and undelivered items) based on their relative selling prices, regardless of whether those selling prices are evidenced by VSOE or TPE or are based on the entity’s estimated selling price. The residual method of allocating arrangement consideration has been eliminated. ASU 2009-14 modifies the software revenue recognition guidance to exclude from its scope tangible products that contain both software and non-software components that function together to deliver a product’s essential functionality. These new updates are effective for revenue arrangements entered into or materially modified in fiscal years beginning on or after June 15, 2010. Early adoption is permitted. The Company has evaluated that there are no impacts that the adoption of these ASUs will have on the consolidated financial statements.
| 3 | ACCOUNTS RECEIVABLE, NET |
Accounts receivable consist of the following:
| 2009 | 2009 | 2008 | |||||||
| USD | RMB | RMB | |||||||
| Accounts receivable |
101,220 | 690,919 | 535,306 | ||||||
| Less: allowance for doubtful accounts |
(10,739 | ) | (73,306 | ) | (37,314 | ) | |||
| 90,481 | 617,613 | 497,992 | |||||||
An analysis of the allowance for doubtful accounts is as follows:
| 2009 | 2009 | 2008 | 2007 | |||||
| USD | RMB | RMB | RMB | |||||
| Balance at the beginning of year |
5,467 | 37,314 | 30,467 | 15,415 | ||||
| Addition charged to allowance for doubtful accounts |
5,272 | 35,992 | 6,847 | 15,052 | ||||
| Balance at the end of year |
10,739 | 73,306 | 37,314 | 30,467 | ||||
The Group has a credit policy in place and the exposure to credit risk is monitored on an ongoing basis. Credit evaluations are performed on all customers requiring credit over a certain amount.
| 4. | BILLS RECEIVABLE |
To reduce the Group’s credit risk, the Group requires certain customers to pay for the sale of the Group’s products by bills receivable. Bills receivable represent short-term notes receivable issued by a financial institution that entitles the Group to receive the full face amount from the financial institution at maturity, which generally ranges from 3 to 6 months from the date of issuance. Historically, the Group has experienced no losses on bills receivable.
The Group, in certain circumstances, has arranged to transfer with recourse certain of its bills receivable to banks. Under this discounting arrangement, the bank pays a discounted amount to the Group and collects the amounts owed from the customers’ banks. The discount typically ranges from 0.1% to 1.5% of the balance transferred, which is recorded as interest expense.
For the years ended December 31, 2009, 2008 and 2007, the Group received proceeds from the sale of bills receivable amounting to RMB72,613 (USD10,638), RMB74,576 and RMB90,928, respectively. In addition, the Group recorded discounts amounting to RMB479 (USD70), RMB783 and RMB1,193 in respect of the bills receivable sold for the years ended December 31, 2009, 2008 and 2007, respectively, which have been included in interest expense.
F-15
Table of Contents
COGO GROUP, INC.
NOTES TO CONSOLIDATED FINANCIAL STATEMENTS
(in thousands, except share data)
For bills receivable sold to banks that the Group has surrendered control, the Group derecognized the discounted bills receivable pursuant to the provisions of ASC 860, Transfers and Servicing. As of December 31, 2009 and 2008, the Group has derecognized discounted bills receivable amounting to RMB33,871 (USD4,962) and RMB22,054, respectively in accordance with ASC 860.
| 5. | INVENTORIES |
Inventories by major categories are as follows:
| 2009 | 2009 | 2008 | ||||
| USD | RMB | RMB | ||||
| Raw materials |
262 | 1,792 | 6,364 | |||
| Finished goods |
21,146 | 144,340 | 89,491 | |||
| Total |
21,408 | 146,132 | 95,855 | |||
Inventories amounting to RMB6,365 (USD932), RMB1,200 and Nil were written off during the years ended December 31, 2009, 2008 and 2007, respectively.
| 6 | PROPERTY AND EQUIPMENT, NET |
Property and equipment consists of the following:
| 2009 | 2009 | 2008 | |||||||
| USD | RMB | RMB | |||||||
| Property |
244 | 1,671 | 1,671 | ||||||
| Machinery |
531 | 3,627 | 3,472 | ||||||
| Furniture and office equipment |
3,866 | 26,388 | 25,992 | ||||||
| Motor vehicles |
923 | 6,298 | 5,648 | ||||||
| Total |
5,564 | 37,984 | 36,783 | ||||||
| Less: accumulated depreciation |
(3,454 | ) | (23,578 | ) | (18,790 | ) | |||
| Property and equipment, net |
2,110 | 14,406 | 17,993 | ||||||
Depreciation expense for the years ended December 31, 2009, 2008 and 2007 is as follows:
| 2009 | 2009 | 2008 | 2007 | |||||
| USD | RMB | RMB | RMB | |||||
| Cost of sales |
21 | 139 | 296 | 369 | ||||
| Selling, general and administrative expenses |
553 | 3,776 | 3,829 | 3,245 | ||||
| Research and development expenses |
280 | 1,911 | 4,640 | 1,496 | ||||
| Total |
854 | 5,826 | 8,765 | 5,110 | ||||
| 7 | ACQUISITIONS |
2009 Acquisitions
Mega Smart Group Limited (“Mega Smart”)
On May 30, 2009, the acquisition date, the Group acquired 100% of the outstanding shares which in turn obtained control of Mega Smart and its subsidiary for a consideration of USD18,000 (RMB122,866). The purchase consideration will be paid in thirteen installments. The first installment was USD6,000 (RMB40,955), which was payable within three months of May 30, 2009. The subsequent amount of USD12,000 (RMB81,911) is payable over twelve equal monthly installments of USD1,000 (RMB6,826) one month following the first installment. In light of the installment schedule, the borrowing rate adopted reflects the normal borrowing rate that the Group can obtain for transactions with similar terms over the payment period and calculated the fair value of the purchase consideration as RMB122,415.
F-16
Table of Contents
COGO GROUP, INC.
NOTES TO CONSOLIDATED FINANCIAL STATEMENTS
(in thousands, except share data)
The principal activities of Mega Smart and its subsidiary are the development of the industrial applications component business in China.
The acquisition of Mega Smart was accounted for by the Group as a purchase business combination in accordance with ASC 805, Business Combinations (formerly SFAS No. 141(R)). The acquisition of Mega Smart resulted in the recognition of goodwill of RMB83,647 and the recording of net identifiable assets of RMB38,768 at the date of acquisition. Recognized intangible assets relate to supplier relationships, customer relationships, non-compete agreements and proprietary technology which have a total weighted-average useful life of 7.5 years from the date of acquisition. Goodwill and the amortization of these intangible assets are not deductible for tax purposes.
The acquisition is expected to support the expansion of the Company’s industrial applications component business in China. Goodwill is attributed by (1) synergy to expand Mega Smart’s operation and business on the established platform, industry knowledge and experience of the Group; (2) assembled workforce including engineers and management; and (3) the expected outlook in the PRC industrial application market with the PRC government stimulus package. The combination of these factors are the drivers behind the excess of purchase price paid over the value of assets and liabilities acquired.
Management has increased the fair value of acquired proprietary technology from RMB2,048 as of May 30, 2009 (the “acquisition date”) to RMB6,145 due to the refinement of the valuation for the year ended December 31, 2009. The impact of all changes were charged to goodwill and resulted in the reduction of goodwill by RMB3,421 and deferred tax liabilities by RMB676 for the year ended December 31, 2009.
The impact of the purchase price allocation after refinement is as follows:
| RMB | |||
| Intangible assets |
|||
| – supplier relationships |
8,876 | ||
| – customer relationships |
24,580 | ||
| – non-compete agreements |
10,925 | ||
| – proprietary technology |
6,145 | ||
| Goodwill |
80,226 | ||
| Deferred tax liabilities |
(8,337 | ) | |
| Net asset acquired |
122,415 | ||
The Group is in the process of finalizing the purchase price allocations; thus, the allocation of the purchase price is subject to further refinement. The amounts of revenue and earnings for Mega Smart since the acquisition date included in the consolidated income statement and comprehensive income from May 30, 2009 to December 31, 2009 are RMB155,827 and RMB10,724, respectively.
Unaudited proforma financial information
The following unaudited proforma financial information represents the combined results of operations of the Group as if the acquisition of Mega Smart had occurred as of each of the years beginning January 1, 2009 and 2008. The unaudited proforma information is not necessarily indicative of what the Company’s consolidated results of operations actually would have been had it completed the acquisition at the beginning of each year. In addition, the unaudited proforma financial information does not attempt to project the future results of operations of the Group.
F-17
Table of Contents
COGO GROUP, INC.
NOTES TO CONSOLIDATED FINANCIAL STATEMENTS
(in thousands, except share data)
| Year ended December 31, | ||||||
| 2009 | 2009 | 2008 | ||||
| USD (unaudited) |
RMB (unaudited) |
RMB (unaudited) | ||||
| Net revenue |
||||||
| Product sales |
308,786 | 2,107,743 | 1,997,307 | |||
| Services revenue |
4,307 | 29,401 | 27,695 | |||
| 313,093 | 2,137,144 | 2,025,002 | ||||
| Income from operations |
11,106 | 75,806 | 80,172 | |||
| Net Income attributable to Cogo Group, Inc. |
12,083 | 82,475 | 102,280 | |||
| Earnings per share attributable to Cogo Group, Inc. |
||||||
| Basic |
0.33 | 2.26 | 2.66 | |||
| Diluted |
0.32 | 2.19 | 2.58 | |||
2008 Acquisition
Long Rise
On July 31, 2008, the Group entered into a share purchase agreement to purchase 70% of the outstanding shares of Long Rise Holdings Limited (“Long Rise”) and its subsidiary, Rise Year, for a consideration of RMB60,921 payable in cash, none of which is contingent. The purchase agreement did not include a fixed payment schedule, and as a result the acquisition price was payable on demand. The Company and the selling shareholders of Long Rise agreed that the consideration could be held back by the Company to settle any claims that might arise for contractual warranties and for any misrepresentations made to the Company. The Company paid approximately RMB3,485 and RMB476 in 2008 and 2009, respectively, and also expects that approximately RMB44,553 will be paid by 2010 and the remaining balance of approximately RMB12,436 will be paid in 2011.
The acquisition of Long Rise was accounted for by the Group as a purchase business combination in accordance with SFAS No. 141, Business Combinations (“SFAS No.141”). The acquisition of Long Rise resulted in the recognition of goodwill of RMB21,422 and recording net identifiable assets of RMB39,499 at the date of acquisition. Recognized intangible assets relate to customer relationships, non-compete agreements and proprietary technology which have a weighted-average useful life of 3.9 years from the date of acquisition. Goodwill and the amortization of these intangible assets are not deductible for tax purposes. Purchased in-process research and development of RMB4,390 was also recognized as an intangible asset and was expensed upon acquisition because technological feasibility had not been established and no future alternative uses exist. This amount is included in research and development expense and is not deductible for tax purposes.
The acquisition is expected to extend the Group’s product offerings to address the demand of the expanding CDMA market, stimulated by new entrance into the CDMA market in the second half of 2008 following the restructuring of the PRC’s telecommunications industry. Because Long Rise’s operations and business model was similar to the Group, management has been able to achieve significant operating synergies from this acquisition. The combination of these factors are the drivers behind the excess of purchase price paid over the value of assets and liabilities acquired.
The following table summarizes the amounts assigned to each major asset acquired and liability assumed at the date of acquisition.
F-18
Table of Contents
COGO GROUP, INC.
NOTES TO CONSOLIDATED FINANCIAL STATEMENTS
(in thousands, except share data)
| RMB | |||
| Cash |
8,753 | ||
| Accounts receivable |
16,807 | ||
| Inventories |
8,010 | ||
| Property and equipment |
17 | ||
| Intangible assets |
|||
| – customer relationships |
10,671 | ||
| – non-compete agreements |
13,527 | ||
| – in-process research and development |
4,390 | ||
| – proprietary technology |
5,959 | ||
| Goodwill |
21,422 | ||
| Bank borrowings |
(9,314 | ) | |
| Income taxes payable |
(1,584 | ) | |
| Accrued expenses and other liabilities |
(8,506 | ) | |
| Deferred tax liabilities |
(4,976 | ) | |
| Noncontrolling interest |
(4,255 | ) | |
| Purchase price allocated |
60,921 | ||
Unaudited proforma financial information
The following unaudited proforma financial information presents the combined results of operations of the Group as if the acquisition of Long Rise had occurred as of the beginning of January 1, 2007. The unaudited proforma information is not necessarily indicative of what the Company’s consolidated results of operations actually would have been had it completed the acquisition at the beginning of each year. In addition, the unaudited proforma financial information does not attempt to project the future results of operations of the Group.
| Year ended December 31, | ||||
| 2008 | 2007 | |||
| RMB (unaudited) |
RMB (unaudited) | |||
| Net revenue |
||||
| Product sales |
1,983,300 | 1,925,273 | ||
| Services revenue |
27,695 | 68,690 | ||
| 2,010,995 | 1,993,963 | |||
| Income from operations |
83,549 | 147,531 | ||
| Net income attributable to Cogo Group, Inc. |
105,114 | 152,900 | ||
| Earnings per share |
||||
| Basic |
2.73 | 4.14 | ||
| Diluted |
2.66 | 3.99 | ||
F-19
Table of Contents
COGO GROUP, INC.
NOTES TO CONSOLIDATED FINANCIAL STATEMENTS
(in thousands, except share data)
2007 Acquisitions
Comtech Broadband
On August 27, 2007, the Group entered into a stock purchase agreement pursuant to which the Group acquired the remaining 45% noncontrolling interest of Comtech Broadband for RMB75,462 payable in cash and RMB37,731 payable in the common stock of the Company valued as of August 31, 2007. No amount of the consideration for the acquisition of Comtech Broadband is contingent. The purchase agreement did not include a fixed payment schedule and as a result the acquisition price was payable on demand. However, the Company and the selling shareholders agreed that the consideration could be held back by the Company to settle any claims that might arise for contractual warranties and for any misrepresentations made to the Company. Therefore the consideration price was held back and RMB21,901 was settled in 2007, RMB46,843 was settled in 2008, RMB34,107 was settled in 2009 and RMB10,341 is to be paid in 2010.
The terms of the stock purchase agreement were publicly announced on August 31, 2007. Management considered the daily traded price of the Company’s shares during a reasonable period before and after August 31, 2007 (which management determined to be from August 29, 2007 to September 5, 2007) for determining the appropriate fair value of the 295,508 Company’s shares issuable for the Comtech Broadband acquisition. The simple average of the daily traded prices of the Company’s shares over this 5-day trading period was USD16.82 as compared to the traded price of USD16.92 on August 31, 2007. Given that the traded price for the Company’s common shares during the period from August 29, 2007 to September 5, 2007 was consistent with the traded price of the Company’s common shares on August 31, 2007, management determined the fair value assigned to common shares the Company agreed to issue in connection with the acquisition of Comtech Broadband based on the traded price of Company’s shares as of August 31, 2007.
The acquisition of the remaining 45% of Comtech Broadband was accounted for by the Group as a step purchase transaction in accordance with SFAS No. 141. The purchase price was allocated (on a proportionate share) to the tangible and intangible assets acquired and liabilities assumed on the basis of their respective estimated fair values on the acquisition date. Intangible assets have been recognized and relate to customer relationships, non-compete agreements and website which have a weighted-average useful life of 9.1 years from the date of acquisition. Goodwill and the amortization of these intangible assets are not deductible for tax purposes. The excess of purchase price paid over the value of assets and liabilities acquired is driven by the expected high growth potential on Broadband’s business in the coming future and the acquisition of the remaining 45% noncontrolling interest of Comtech Broadband would benefit the Group’s results. The following table summarizes the proportionate share of the amounts assigned to each major asset acquired and liability assumed at the date of acquisition.
| RMB | |||
| Cash |
4,863 | ||
| Accounts and receivable |
138,343 | ||
| Inventories |
9,113 | ||
| Property and equipment |
241 | ||
| Intangible assets |
|||
| – customer relationships |
66,202 | ||
| – non-compete agreements |
8,371 | ||
| – website |
5 | ||
| Goodwill |
47,561 | ||
| Income taxes payable |
(2,198 | ) | |
| Accrued expenses and other liabilities |
(146,257 | ) | |
| Deferred tax liabilities |
(13,051 | ) | |
| Purchase price allocated |
113,193 | ||
F-20
Table of Contents
COGO GROUP, INC.
NOTES TO CONSOLIDATED FINANCIAL STATEMENTS
(in thousands, except share data)
Keen Awards
The Group entered into a share purchase agreement on August 1, 2007 to purchase all the outstanding common shares of Keen Awards, for a consideration of approximately RMB150,924 payable in cash, common stock of the Company and the common stock of Keen Awards, all of which are contingently payable at various dates upon achieving certain agreed earnings levels over the two year period following the acquisition. Since the sum of the fair market values of the identifiable assets acquired less liabilities assumed which amounted to RMB63,032 exceeded the acquisition cost, excluding the contingent consideration by RMB63,032, resulting in negative goodwill. Since the contingent consideration could result in recognition of additional purchase price in a future period, the Company recognized, as if it were a liability, an amount equal to the lesser of the maximum of the amount of the contingent consideration and the total amount of negative goodwill. Accordingly, the amount of the negative goodwill of RMB63,032 was recognized as if it were a liability at the date of acquisition.
Subsequent to the initial recognition of the contingent consideration and due to certain earning milestones being achieved, the Company made cash payments in relation to the contingent consideration for the acquisition of Keen Awards of RMB33,914 (RMB11,283 in 2007, RMB22,597 in 2008 and RMB34 in 2009). The terms of the Keen Awards acquisition were publicly announced on August 1, 2007. The consideration recognized of RMB63,032 for the Keen Awards acquisition was contingently payable in cash. In addition to the contingent cash payment actually recognized, the agreement includes additional contingent payments of:
| • | an additional RMB27,522 in cash; |
| • | 287,770 shares with an assigned fair value of RMB30,185 at acquisition date; and |
| • | a 20% equity interest in Keen Awards with an assigned fair value of RMB30,185 at acquisition date. |
In determining the fair value of the 287,770 shares issuable for the Keen Awards acquisition, management considered the daily traded price of the Company’s shares during a reasonable period before and after August 1, 2007 (which management determined to be from July 27, 2007 to August 3, 2007) for determining the appropriate fair value of the Company’s shares issuable for the Keen Awards acquisition. The simple average of the daily traded prices of the Company’s shares over this 5-day trading period was USD13.99 as compared to the traded price of USD13.90 on August 1, 2007. Given that the traded price for the Company’s common shares during the period from July 27, 2007 to August 3, 2007 was consistent with the traded price of the Company’s common shares on August 1, 2007, management determined the fair value assigned to common shares the Company agreed to issue in connection with the acquisition of Keen Awards based on the traded price of Company’s shares as of August 1, 2007.
Based on the terms of the Keen Awards acquisition agreement, the Company is first required to settle the cash contingent consideration until all cash payments are settled, followed by the issuance of the shares of the Company and finally, the issuance of 20% of the shares in Keen Awards. However, the contingent consideration recognized was restricted to the lesser of the maximum of the amount of the contingent consideration and the total amount of negative goodwill. Therefore, the Company was not required to recognize the fair value of any of the shares contingently issuable for the acquisition of Keen Awards. The principal activities of Keen Awards are sales of technology components and provision of design and engineering services for integrated display technology solutions.
The acquisition of Keen Awards was accounted for by the Group as a purchase business combination in accordance with SFAS No. 141. Intangible assets have been recognized and relate to customer relationships, non-compete agreements and proprietary designs which have a weighted-average useful life of 8.9 years from the date of acquisition. The amortization of these intangible assets is not deductible for tax purposes. The following table summarizes the amounts assigned to each major asset acquired and liability assumed at the date of acquisition.
F-21
Table of Contents
COGO GROUP, INC.
NOTES TO CONSOLIDATED FINANCIAL STATEMENTS
(in thousands, except share data)
| RMB | |||
| Cash |
823 | ||
| Accounts receivable |
4,920 | ||
| Intangible assets |
|||
| – customer relationships |
63,009 | ||
| – non-compete agreements |
7,558 | ||
| – proprietary designs |
2,440 | ||
| Accounts payable |
(505 | ) | |
| Income taxes payable |
(589 | ) | |
| Accrued expenses and other liabilities |
(1,848 | ) | |
| Deferred tax liabilities |
(12,776 | ) | |
| Purchase price allocated |
63,032 | ||
On August 28, 2009, the Company and the seller of Keen Awards agreed that the contingency in respect of the acquisition for Keen Awards was resolved and it was also determined that no further consideration was payable. Therefore, because the amount of contingent consideration recognized, as if it were a liability, exceeded the amount settled, the excess of RMB29,118 (USD4,266) was first allocated to reduce the assets acquired being the intangibles asset of RMB26,803 (USD3,927) net of deferred taxation in respect of intangible assets of Keen Awards of RMB4,422 (USD648) and remaining amount of RMB6,737 (USD987) was recognized as an extraordinary gain in the consolidated statements of income and comprehensive income.
Unaudited proforma financial information
The following unaudited proforma financial information presents the combined results of operations of the Group as if the acquisition of Keen Awards had occurred as of the beginning of January 1, 2007. The unaudited proforma information is not necessarily indicative of what the Company’s consolidated results of operations actually would have been had it completed the acquisition at the beginning of each year. In addition, the unaudited proforma financial information does not attempt to project the future results of operations of the Group.
| Year ended December 31 | ||
| 2007 RMB | ||
| (unaudited) | ||
| Net revenue |
||
| Product sales |
1,597,818 | |
| Services revenue |
79,403 | |
| 1,677,221 | ||
| Income from operations |
142,407 | |
| Net income attributable to Cogo Group, Inc. |
149,881 | |
| Earnings per share |
||
| Basic |
4.05 | |
| Diluted |
3.91 | |
F-22
Table of Contents
COGO GROUP, INC.
NOTES TO CONSOLIDATED FINANCIAL STATEMENTS
(in thousands, except share data)
| 8 | GOODWILL AND INTANGIBLE ASSETS |
| (a) | Goodwill |
The changes in the carrying amount of our goodwill, by segment, for the years ended December 31, 2009, 2008 and 2007 are as follows:
| Product Sales |
Services Revenue |
Total | ||||||
| RMB | RMB | RMB | ||||||
| Balance as of January 1, 2007 |
||||||||
| Goodwill |
4,264 | 42,428 | 46,692 | |||||
| Accumulated impairment losses |
— | — | — | |||||
| 4,264 | 42,428 | 46,992 | ||||||
| Adjustment on goodwill of Viewtran PRC (note a) |
— | 5,221 | 5,221 | |||||
| Acquisition of the remaining noncontrolling interest of Comtech Broadband |
47,561 | — | 47,561 | |||||
| Balance as of December 31, 2007 |
||||||||
| Goodwill |
51,825 | 47,649 | 99,474 | |||||
| Accumulated impairment losses |
— | — | — | |||||
| Balance as of December 31, 2007 |
51,825 | 47,649 | 99,474 | |||||
| Acquisition of 70% interest of Long Rise |
21,422 | — | 21,422 | |||||
| Impairment loss of Shanghai E&T (note b) |
(4,264 | ) | — | (4,264 | ) | |||
| Balance as of December 31, 2008 |
||||||||
| Goodwill |
73,247 | 47,649 | 120,896 | |||||
| Accumulated impairment losses |
(4,264 | ) | — | (4,264 | ) | |||
| 68,983 | 47,649 | 116,632 | ||||||
| Acquisition of Mega Smart |
83,647 | — | 83,647 | |||||
| Adjustment on goodwill of Mega Smart (note a) |
(3,421 | ) | — | (3,421 | ) | |||
| Balance as of December 31, 2009 |
||||||||
| Goodwill |
153,473 | 47,649 | 201,122 | |||||
| Accumulated impairment losses |
(4,264 | ) | — | (4,264 | ) | |||
| 149,209 | 47,649 | 196,858 | ||||||
| Balance as of December 31, 2009 (in USD) |
21,859 | 6,981 | 28,840 | |||||
| Note a | Goodwill arising from the acquisitions of Viewtran PRC and Mega Smart was adjusted in 2007 and 2009, respectively, on completion of the assessments of the estimated discounted cash flows in relation to the proprietary technology acquired. | |
| Note b | During the year ended December 31, 2008, the Company recognized an impairment loss of RMB4,264 in relation to one of the reporting units of the Product Sales segment. The impairment loss was due to the difficult end-market environment which had led to a reduction in demand for this reporting unit. As a result of the reduced demand, management revised its future cash flow expectations for its business in this reporting unit. Since the carrying value exceeded the fair value of this reporting unit, which was determined by a discounted cash flow model, a second step of the goodwill impairment test was performed to measure the impairment loss based on any excess of the carrying value of the reporting unit’s goodwill over the implied fair value of that goodwill. The implied fair value of goodwill was determined by allocating the fair value of the reporting unit in a manner similar to a purchase price allocation. |
F-23
Table of Contents
COGO GROUP, INC.
NOTES TO CONSOLIDATED FINANCIAL STATEMENTS
(in thousands, except share data)
| (b) | Intangible Assets |
The Company reviews long-lived assets, including its intangible assets subject to amortization, which for the Company are its customer relationships, supplier relationships, proprietary designs, proprietary technology, website and software asset, license agreement and non-compete agreements, for impairment whenever events or changes in circumstances indicate that the carrying amount of such assets may not be recoverable. Recoverability of long-lived assets is measured by a comparison of the carrying amount of the asset group to the future undiscounted net cash flows expected to be generated by those assets. If such assets are considered to be impaired, the impairment charge recognized is the amount by which the carrying amounts of the assets exceeds the fair value of the assets.
There were no significant events or changes in circumstances to indicate that the carrying value of intangible assets in other asset group of the Company may not be recoverable. As of December 31, 2009 and 2008, the Company’s intangible assets related to the Company’s acquisitions consisted of the following:
| As of December 31, 2009 | ||||||||||
| Gross carrying amount |
Amortization period |
Accumulated amortization |
Adjustment on intangible assets of Keen Awards (note 7) |
Net Carrying Amount | ||||||
| RMB | Years | RMB | RMB | RMB | ||||||
| Customer relationships |
169,929 | 5 to 10 | 63,005 | 25,990 | 80,934 | |||||
| Supplier relationships |
8,876 | 11.5 | 450 | — | 8,426 | |||||
| Proprietary technology |
18,713 | 3 to 6.5 | 9,272 | — | 9,441 | |||||
| Proprietary designs |
2,440 | 3 | 1,627 | 813 | — | |||||
| Website and software asset |
575 | 3 | 573 | — | 2 | |||||
| Non-compete agreements |
41,659 | 1 to 6 | 24,658 | — | 17,001 | |||||
| License agreement |
1,249 | 2 | 1,249 | — | — | |||||
| Total |
243,441 | 100,834 | 26,803 | 115,804 | ||||||
| Total (in USD) |
35,664 | 14,772 | 3,927 | 16,965 | ||||||
| As of December 31, 2008 | ||||||||||
| Gross carrying amount |
Amortization period |
Accumulated amortization |
Impairment loss (note a) |
Net Carrying Amount | ||||||
| RMB | Years | RMB | RMB | RMB | ||||||
| Customer relationships |
145,349 | 5 to 10 | 20,812 | 29,495 | 95,042 | |||||
| Proprietary technology |
12,569 | 3 to 4 | 5,122 | — | 7,447 | |||||
| Proprietary designs |
2,440 | 3 | 1,152 | — | 1,288 | |||||
| Website and software asset |
575 | 3 | 391 | — | 184 | |||||
| Non-compete agreements |
30,734 | 1 to 3 | 14,093 | — | 16,641 | |||||
| License agreement |
1,249 | 2 | 1,249 | — | — | |||||
| Total |
192,916 | 42,819 | 29,495 | 120,602 | ||||||
| Note a |
During the year ended December 31, 2008, the Company experienced a reduction in cash flow generated from customers. As a result, the Company compared the carrying value of the customer relationships to the undiscounted cash flow expected to be generated from those customers. For those customer relationships for which the carrying amount was larger than its estimated undiscounted cash flow, the Company recorded an impairment charge to the extent the carrying amount of customer relationships exceeded its fair value. |
Amortization expense for intangible assets for the years ended December 31, 2009, 2008 and 2007 was RMB28,521 (USD4,178), RMB28,719 and RMB13,405 was included in selling, general and administrative expenses, respectively. Estimated amortization expense for the next five years is: RMB21,803 in 2010, RMB19,924 in 2011, RMB16,673 in 2012, RMB14,915 in 2013, and RMB 13,670 in 2014.
F-24
Table of Contents
COGO GROUP, INC.
NOTES TO CONSOLIDATED FINANCIAL STATEMENTS
(in thousands, except share data)
| 9 | BANK BORROWINGS AND BANKING FACILITIES |
On October 7, 2005, the Group entered into a USD5,000 credit facility with Standard Chartered Bank (Hong Kong) Limited (“SCB”). This facility is secured by funds on deposit in an amount not less than USD2,000 as of December 31, 2009 and 2008, and bears interest ranging from HIBOR + 1.5% to USD Prime per annum, depending on the borrowings made. The SCB facility is repayable on demand and SCB may immediately terminate the facility without the Group’s consent. Interest on this facility accrues until payment is demanded by SCB and no commitment fees is required for this facility. As of December 31, 2009, the outstanding loan balance under the SCB facility was RMB31,040 (USD4,547).
On October 7, 2005, the Group entered into a USD9,000 credit facility with the Bank of China (Hong Kong) Limited (“BOC”).
On January 17, 2008 and October 10, 2008, the facility with the BOC increased to USD14,000 and USD41,000, respectively. The facility is secured by funds on deposit in an amount not less than USD15,000 and bears interest from LIBOR +2.25% per annum, depending on the different kinds of borrowings made and is used to settle foreign exchange obligations to the extent needed. The BOC facility is repayable on demand and the BOC may increase, reduce and/or cancel the facility by providing written notice to the Group. Interest on this facility accrues until payment is demanded by the BOC and no commitment fee is required for this facility. As of December 31, 2009, the outstanding loan balance under the BOC facility was RMB33,957 (USD4,975).
On November 18, 2009, the Group entered into a RMB65,000 credit facility with GuangDong Development Bank (“GDB”). The facility is valid for 12 months commencing November 18, 2009 and terminating on November 17, 2010, and loans under the Facility bear interest at the 3-month LIBOR rate, plus 150 basis points and no commitment fee is required for this facility. GDB may terminate the facility if the Group does not regain its ability to perform its obligations and cannot provide guarantees acceptable to GDB within 30 days after it ceases performing its obligations. No minimum guarantee deposits are required. As of December 31, 2009, the outstanding loan balance under the GDB facility was RMB54,405 (USD7,970).
As of December 31, 2009, the weighted average interest rate on the outstanding bank borrowings was 2.0% (2008: Nil). There were no bank borrowings as of December 31, 2008.
On January 22, 2010, the Group entered into a Credit Extension Agreement with GDB which established a revolving secured trade finance term loan under which the Group may borrow up to HKD150.0 million or its equivalent amount in USD for the purpose of purchasing goods. The credit extension is valid for 12 months commencing January 22, 2010, and loans under the Credit Extension Agreement bear an interest rate of 3-month LIBOR or HIBOR rate plus a 1.5% per annum, depending on the drawdown currency.
F-25
Table of Contents
COGO GROUP, INC.
NOTES TO CONSOLIDATED FINANCIAL STATEMENTS
(in thousands, except share data)
| 10 | INCOME TAXES |
The Company and its subsidiaries file separate income tax returns.
USA
The Company is incorporated in the United States, and is subject to United States federal and state income taxes. The Company did not generate taxable income in the United States in 2007, 2008 and 2009.
Cayman Islands and British Virgin Islands
Under the current laws of the Cayman Islands and British Virgin Islands, the Company’s subsidiaries that are incorporated in the Cayman Islands and the British Virgin Islands are not subject to tax on income or capital gains. In addition, upon payments of dividends by these companies, no Cayman Islands or British Virgin Islands withholding tax will be imposed.
Hong Kong
The Company’s subsidiaries that are incorporated in Hong Kong are subject to Hong Kong Profits Tax. The applicable profits tax rates are 17.5%, 16.5% and 16.5% for 2007, 2008 and 2009, respectively. As of February 27, 2008, the Hong Kong SAR Government announced a reduction on the Hong Kong Profits Tax rate from 17.5% to 16.5%. The payments of dividends by Hong Kong companies are not subject to any Hong Kong withholding tax.
PRC
Prior to January 1, 2008, the PRC’s statutory income tax rate was 33%. In addition, Shenzhen Comtech, Comtech Communication, Comtech Software, Comloca, Epcot, Huameng PRC and Viewtran PRC (collectively the “Shenzhen Subsidiaries”), being located in the Shenzhen Special Economic Zone in the PRC, were subject to a reduced tax rate of 15%. Since the Shenzhen Subsidiaries agreed to operate for a minimum of 10 years in the PRC, the Shenzhen Subsidiaries were each entitled to a tax holiday of two-year tax exemption followed by three-year 50% tax reduction from the first profit making year after offsetting accumulated tax losses of the respective Shenzhen Subsidiaries.
Also prior to January 1, 2008, Shanghai E & T which is located in Shanghai Qingpu Zone, was taxed on a deemed basis at 2.31% of its turnover in accordance with the tax guidelines issued by the local tax authority in Qingpu Zone in 2007.
On March 16, 2007, the National People’s Congress passed the Corporate Income Tax law (the “CIT law”) which unified the income tax rate to 25% for all companies. The CIT law was effective as of January 1, 2008. Accordingly, the Company’s PRC subsidiaries are subject to income tax at 25% effective from January 1, 2008 unless otherwise specified.
The CIT law and its relevant regulations provide a five-year transition period from January 1, 2008 for those companies which were established before March 16, 2007 and which were entitled to preferential lower tax rates under the then effective tax laws or regulations, as well as grandfathering certain tax holidays. The transitional tax rates are 18%, 20%, 22%, 24% and 25% for 2008, 2009, 2010, 2011 and 2012 onwards, respectively. For the Shenzhen Subsidiaries that were entitled to the tax holidays of the two-year tax exemption followed by three-year 50% tax reduction from the first profit making year after offsetting accumulated tax losses, they are entitled to continue the tax holidays until they expire. For Comloca and Huameng PRC which had not commenced their respective tax holiday as of December 31, 2007, the CIT law and its relevant regulations require the tax exemption period to begin on January 1, 2008.
Based on the above, the Shenzhen Subsidiaries are subject to the following tax rates:
| • | Shenzhen Comtech is subject to income tax at rates of 15%, 18%, 20%, 22%, 24% and 25% for 2007, 2008, 2009, 2010, 2011 and 2012 onwards, respectively. |
| • | Comtech Communications is subject to income tax at rates of 7.5%, 18%, 20%, 22%, 24% and 25% for 2007, 2008, 2009, 2010, 2011 and 2012 onwards, respectively. |
| • | Comtech Software is subject to income tax at rates of 7.5%, 9%, 10%, 22%, 24% and 25% for 2007, 2008, 2009, 2010, 2011 and 2012 onwards, respectively. |
| • | Comloca and Huameng PRC had no assessable profits up to 2007 and were tax exempt for 2008 and 2009. They are subject to income tax at rates of 11%, 12%, 12.5% and 25% for 2010, 2011, 2012 and 2013 onwards, respectively. |
| • | Viewtran PRC and Epcot were tax exempt for 2007 and 2008 and are subject to income tax at rates of 10%, 11%, 12% and 25% for 2009, 2010, 2011 and 2012 onwards, respectively. |
F-26
Table of Contents
COGO GROUP, INC.
NOTES TO CONSOLIDATED FINANCIAL STATEMENTS
(in thousands, except share data)
| (a) | Income before Income Taxes and Provision for Income Taxes |
The Group’s earnings/(loss) before income taxes and noncontrolling interest consists of the following:
| 2009 | 2009 | 2008 | 2007 | ||||||||
| USD | RMB | RMB | RMB | ||||||||
| PRC, excluding Hong Kong |
18,500 | 126,278 | 138,876 | 145,295 | |||||||
| Non-PRC |
(5,954 | ) | (40,639 | ) | (39,499 | ) | 24,488 | ||||
| 12,546 | 85,639 | 99,377 | 169,783 | ||||||||
The provision for income taxes consists of the following:
| 2009 | 2009 | 2008 | 2007 | |||||||||
| USD | RMB | RMB | RMB | |||||||||
| Current tax |
||||||||||||
| PRC, excluding Hong Kong |
1,321 | 9,020 | 6,570 | 9,497 | ||||||||
| Hong Kong |
687 | 4,687 | 6,486 | 5,218 | ||||||||
| Deferred tax |
||||||||||||
| PRC, excluding Hong Kong |
(25 | ) | (172 | ) | (984 | ) | 984 | |||||
| Hong Kong |
(634 | ) | (4,328 | ) | (9,857 | ) | (1,424 | ) | ||||
| Income tax expense |
1,349 | 9,207 | 2,215 | 14,275 | ||||||||
Reconciliation between income tax expense and the amounts that result by applying the PRC statutory tax rates to earnings before income taxes and extraordinary item is as follows:
| 2009 | 2009 | 2008 | 2007 | |||||||||
| USD | RMB | RMB | RMB | |||||||||
| Earnings before income taxes and extraordinary item |
12,546 | 85,639 | 99,377 | 169,783 | ||||||||
| PRC statutory tax rate |
25 | % | 25 | % | 33 | % | ||||||
| Computed “expected” income tax expense |
3,138 | 21,409 | 24,844 | 56,028 | ||||||||
| Effect of PRC preferential income tax rate |
(912 | ) | (6,227 | ) | (10,641 | ) | (18,404 | ) | ||||
| Effect of tax holiday |
(4,322 | ) | (29,501 | ) | (28,214 | ) | (29,399 | ) | ||||
| Tax rate differential for non-PRC entities |
2 | 19 | 2,921 | 1,924 | ||||||||
| Non-PRC entities not subject to income tax |
8 | 58 | (727 | ) | (1,124 | ) | ||||||
| Changes in enacted tax rates/laws |
— | — | (1,395 | ) | 984 | |||||||
| Non-taxable items: |
||||||||||||
| Interest income |
(61 | ) | (416 | ) | (1,939 | ) | (4,534 | ) | ||||
| Foreign exchange gain |
(354 | ) | (2,418 | ) | — | — | ||||||
| Change in valuation allowance |
1,244 | 8,492 | 2,513 | 321 | ||||||||
| Non-deductible items: |
||||||||||||
| Impairment loss of goodwill |
— | — | 1,066 | — | ||||||||
| In-process research and development |
— | — | 725 | — | ||||||||
| Provision for inventory write-down |
95 | 646 | 142 | — | ||||||||
| Allowance for doubtful accounts |
778 | 5,311 | 1,130 | 2,417 | ||||||||
| Foreign exchange loss |
— | — | 3,530 | — | ||||||||
| Share-based compensation |
1,730 | 11,809 | 7,330 | 5,702 | ||||||||
| Other non-deductible items |
3 | 25 | 930 | 360 | ||||||||
| Income tax expense |
1,349 | 9,207 | 2,215 | 14,275 | ||||||||
The PRC tax rates have been used because the majority of the Company’s pre-tax and taxable incomes arise in the PRC. The effect of the tax holiday amounted to RMB29,501 (USD4,322), RMB28,214 and RMB29,399 in the years ended December 31, 2009, 2008, and 2007, respectively (equivalent to basic earnings per share amount of RMB0.81 (USD0.12), RMB0.73 and RMB0.80 and a diluted earnings per share amount of RMB0.78 (USD0.11), RMB0.71 and RMB0.77 for the years ended December 31, 2009, 2008 and 2007, respectively).
F-27
Table of Contents
COGO GROUP, INC.
NOTES TO CONSOLIDATED FINANCIAL STATEMENTS
(in thousands, except share data)
| (b) | Deferred Tax Assets and Liabilities |
The tax effects of the Group’s temporary differences that give rise to significant portions of the deferred tax assets and liabilities are as follows:
| 2009 | 2009 | 2008 | |||||||
| USD | RMB | RMB | |||||||
| Deferred tax assets: |
|||||||||
| Tax loss carryforwards |
2,767 | 18,884 | 10,398 | ||||||
| Valuation allowance |
(2,767 | ) | (18,884 | ) | (10,398 | ) | |||
| Net deferred tax asset |
— | — | — | ||||||
| Deferred tax liabilities: |
|||||||||
| Intangible assets |
(2,799 | ) | (19,108 | ) | (19,693 | ) | |||
| Net deferred tax liability |
(2,799 | ) | (19,108 | ) | (19,693 | ) | |||
| Classification on consolidated balance sheets: |
|||||||||
| Deferred tax liabilities: |
|||||||||
| - Non-current |
(2,799 | ) | (19,108 | ) | (19,693 | ) | |||
The increase/(decrease) in the valuation allowance during the years ended December 31, 2009, 2008 and 2007 were RMB8,486 (USD1,243), RMB1,943 and RMB(438), respectively.
In assessing the realizability of deferred tax assets, management considers whether it is more likely than not that some portion or all of the deferred tax assets will not be realized. The ultimate realization of deferred tax assets is dependent upon the generation of future taxable income during the periods in which those temporary differences become deductible or tax loss carryforwards are utilized.
As of December 31, 2009, for United States federal income tax purposes, the Company had net tax loss carryforwards of approximately USD15,790 which would expire at various dates through 2029. Included in these US tax losses were net tax loss carryforwards of approximately USD9,734 that were subject to significant limitations due to prior ownership change, as defined under Section 382 of the Internal Revenue Code. Based on management’s best estimate, these US tax loss carryforwards are not expected to be utilizable due to this prior ownership change and thus, deferred tax assets recognized in respect of tax loss carryforwards as of December 31, 2009 and 2008 were the net tax loss carryforwards that were not subject to such limitations. However, management determines it is more likely than not that the recognized net tax loss carryforwards will not be realized, and therefore, full valuation allowances have been provided as of December 31, 2009 and 2008.
As of December 31, 2009, the Company’s PRC and Hong Kong subsidiaries had tax loss carryforwards of approximately RMB13,855 (USD2,030) and RMB8,272 (USD1,212), respectively. The tax losses for the PRC subsidiaries amounting to RMB4,739 and RMB9,120 will expire in 2013 and 2014, respectively, and the tax loss for the Hong Kong subsidiary does not expire under the current Hong Kong tax legislation. However, management determines it is more likely than not that the tax loss carryforwards will not be realized, and therefore, full valuation allowances have been provided as of December 31, 2009.
According to the CIT law and its relevant regulations, PRC-resident enterprises are levied withholding tax at 10% on dividends to their non-PRC-resident corporate investors for earnings accumulated beginning on January 1, 2008, and undistributed earnings generated prior to January 1, 2008 are exempt from such withholding tax. In addition, under the Arrangement between the Mainland of China and Hong Kong Special Administration Region for the Avoidance of Double Taxation and the Prevention of Fiscal Evasion and its related regulations, a qualified Hong Kong company will be liable for withholding tax at the rate of 5% for dividend income derived from the PRC, if the Hong Kong company is the “beneficial owner” and holds 25% of equity interests or more of the PRC company directly. The Company has not provided for income taxes on accumulated earnings amounting RMB190,157 and RMB373,652 that are subject to the PRC withholding tax as of December 31, 2008 and 2009, respectively, since these earnings are intended to be permanently reinvested. It is not practicable to estimate the amounts of unrecognized deferred tax liabilities thereof.
F-28
Table of Contents
COGO GROUP, INC.
NOTES TO CONSOLIDATED FINANCIAL STATEMENTS
(in thousands, except share data)
| (c) | Accounting for uncertainty in Income Taxes |
As of January 1, 2007 and for the years ended December 31, 2007, 2008 and 2009, the Group did not have unrecognized tax benefits, and it does not expect that the amount of unrecognized tax benefits will change significantly within the next 12 months. Accordingly, no interest or penalties related to unrecognized tax benefits were accrued.
The Company and its subsidiaries file income tax returns in the United States, PRC and Hong Kong. The Company could be subject to U.S. federal income tax examination by tax authorities for years beginning in 2006. According to the PRC Tax Administration and Collection Law, the statute of limitations is three years if the underpayment of taxes is due to computational errors made by the taxpayer or the withholding agent. The statute of limitations is extended to five years under special circumstances where the underpayment of taxes is more than RMB100 (USD15). In the case of transfer pricing issues, the statute of limitation is ten years. There is no statute of limitation in the case of tax evasion. Accordingly, the PRC tax returns for the Company’s PRC subsidiaries are open to examination by the PRC state and local tax authorities for the tax years beginning in 2004. The tax returns for the Company’s Hong Kong subsidiaries are currently open to examination by the Hong Kong tax authorities for the tax years beginning in 2003.
| 11 | ACCRUED EXPENSES AND OTHER LIABILITIES |
Accrued expenses and other liabilities consists of the following:
| 2009 | 2009 | 2008 | ||||
| USD | RMB | RMB | ||||
| Legal and professional fees |
631 | 4,305 | 2,600 | |||
| Accrued staff related costs |
1,167 | 7,967 | 4,713 | |||
| Payables for acquisitions (Note a) |
17,793 | 121,453 | 131,037 | |||
| Other accruals |
627 | 4,283 | 3,575 | |||
| 20,218 | 138,008 | 141,925 | ||||
| Note a | The balance at December 31, 2009 represents amounts payable in relation to the Group’s acquisitions of Comtech Broadband, Long Rise and Mega Smart amounting to RMB10,341 (USD1,515), RMB56,989 (USD8,349) and RMB54,123 (USD7,929), respectively. The balance of December 31, 2008 represents amounts payable in relation to the Group’s acquisitions of Keen Awards, Comtech Broadband and Long Rise amounting to RMB29,152, RMB44,449 and RMB57,436, respectively. The amount payable in relation to the Group’s acquisition of Comtech Broadband and Mega Smart are expected to be settled within one year. The amounts payable in relation to the Group’s acquisition of Long Rise is expected to be settled in 2010 and 2011 as discussed in note 7. Amounts payable in relation to the acquisitions are non-interest bearing. As discussed in note 7, on July 31, 2009, the contingency in respect of the acquisition for Keen Awards was resolved and the Company determined that no further consideration was payable. |
| 12 | SHARE-BASED COMPENSATION |
| (a) | Options and stock warrants assumed under the Share Exchange Agreement |
Under the Company’s 1995 Stock Option Plan for Outside Directors (the “Directors’ Plan”), the Company issued options to purchase 115,000 shares of the Company’s common stock. The options granted under the Directors’ Plan have a weighted average exercise price per option of USD3.00 and expired on July 1, 2009. No options under the Directors’ Plan were exercised during the year ended December 31, 2008. During the year ended December 31, 2007 and 2009, 15,000 and 100,000 options under the Directors’ Plan were exercised, respectively.
The Company granted fully exercisable stock warrants to purchase up to 925,417 shares of its common stock. The stock warrants have a weighted average exercise price per stock warrant of USD2.76 each and expired on July 1, 2009. No stock warrants were exercised during the years ended December 31, 2009 and 2008. During the year ended December 31, 2007, 151,029 stock warrants with a weighted average exercise price per stock warrant of USD2.63 were exercised.
F-29
Table of Contents
COGO GROUP, INC.
NOTES TO CONSOLIDATED FINANCIAL STATEMENTS
(in thousands, except share data)
| (b) | 2004 Incentive Plan |
On August 3, 2004, the Board of Directors adopted the 2004 Stock Incentive Plan (the “2004 Incentive Plan”) pursuant to which 2,500,000 shares of the Company’s common stock are reserved for issuance upon exercise of stock options, and for the issuance of stock appreciation rights, non-vested shares and performance shares. The purpose of the 2004 Incentive Plan is to provide additional incentive to employees, directors, advisors and consultants. The 2004 Incentive Plan provides for a term of 10 years from the date of its adoption by the Board of Directors, after which no awards may be made, unless the 2004 Incentive Plan is early terminated by the Board.
Stock options
A summary of stock options activity is as follows:
| Number of options |
Weighted average exercise price |
Weighted average remaining contractual term |
Aggregate intrinsic value | ||||||
| USD | Years | USD | |||||||
| Balance as of December 31, 2006 |
1,313,519 | 4.01 | |||||||
| Exercised |
(121,250 | ) | 3.20 | ||||||
| Balance as of December 31, 2007 |
1,192,269 | 4.09 | |||||||
| Exercised |
— | — | |||||||
| Balance as of December 31, 2008 |
1,192,269 | 4.09 | |||||||
| Exercised |
— | — | |||||||
| Balance as of December 31, 2009 |
1,192,269 | 4.09 | 5.02 | 3,914 | |||||
The total intrinsic value of options exercised during the year ended December 31, 2007 was USD1,948.
Non-vested equity share unit
A summary of non-vested equity share unit activity is as follows:
| Shares | Weighted average Grant- date fair value | ||||
| USD | |||||
| Balance as of December 31, 2006 |
62,738 | 9.89 | |||
| Vested |
(59,774 | ) | 9.93 | ||
| Balance as of December 31, 2007 |
2,964 | 9.14 | |||
| Vested |
(2,500 | ) | 9.14 | ||
| Balance as of December 31, 2008 |
464 | 9.14 | |||
| Vested |
(464 | ) | 9.14 | ||
| Balance as of December 31, 2009 |
— | — | |||
The total fair value of equity share units vested during the years ended December 31, 2009, 2008 and 2007 was USD4, USD23 and USD593, respectively. As of December 31, 2008, the aggregate fair value of all non-vested equity share units was USD4, which is expected to be amortized on a straight-line basis over a weighted average period of approximately 2 months. The equity share units were fully vested as of December 31, 2009.
F-30
Table of Contents
COGO GROUP, INC.
NOTES TO CONSOLIDATED FINANCIAL STATEMENTS
(in thousands, except share data)
Performance shares
A summary of performance shares activity is as follows:
| Shares | Weighted average Grant-date fair value | ||||
| USD | |||||
| Balance as of December 31, 2006 |
69,333 | 10.12 | |||
| Vested |
(69,333 | ) | 10.12 | ||
| Balance as of December 31, 2007, 2008 and 2009 |
— | — | |||
No performance shares were vested during the years ended December 31, 2008 and 2009. The aggregate fair value of performance shares vested during the year ended December 31, 2007 was USD702.
| (c) | 2006 Incentive Plan |
On December 20, 2006, the Board of Directors adopted the 2006 Equity Incentive Plan (the “2006 Incentive Plan”) pursuant to which 4,800,000 shares of the Company’s common stock are reserved for issuance upon exercise of stock options, and for the issuance of stock appreciation rights, restricted stock awards and performance shares. The purpose of the 2006 Incentive Plan is to provide additional incentive to employees, directors, advisors and consultants. The 2006 Incentive Plan provides for a term of 10 years from the date of its adoption by the Board of Directors, after which no awards may be made, unless the 2006 Incentive Plan is early terminated by the Board.
Non-vested equity share unit
A summary of non-vested equity share units issued under the 2006 Incentive Plan is as follows:
| Shares | Weighted average Grant-date fair value | ||||
| USD | |||||
| Balance as of January 1, 2007 |
— | — | |||
| Granted on February 14, 2007 (note i) |
6,505 | 5.37 | |||
| Granted on March 14, 2007 (note ii) |
55,000 | 15.20 | |||
| Granted on March 14, 2007 (note iii) |
16,000 | 15.20 | |||
| Granted on August 1, 2007 (note iv) |
140,000 | 13.90 | |||
| Granted on December 24, 2007 (note v) |
8,734 | 16.03 | |||
| Granted on December 24, 2007 (note vi) |
105,000 | 16.03 | |||
| Vested |
(203,755 | ) | 14.31 | ||
| Balance as of December 31, 2007 |
127,484 | 15.94 | |||
| Granted on January 28, 2008 (note vii) |
962,700 | 9.67 | |||
| Granted on March 27, 2008 (note vii) |
80,000 | 10.85 | |||
| Granted on August 4, 2008 (note iii) |
280,000 | 4.52 | |||
| Granted on October 31, 2008 (note viii) |
29,412 | 5.44 | |||
| Granted on November 21, 2008 (note iii) |
80,125 | 2.7 | |||
| Granted on November 21, 2008 (note viii) |
1,400,000 | 2.7 | |||
| Vested |
(678,284 | ) | 7.28 | ||
| Balance as of December 31, 2008 |
2,281,437 | 5.56 | |||
| Granted on January 14, 2009 (note ix) |
500,000 | 5.50 | |||
| Vested |
(1,472,273 | ) | 5.42 | ||
| Balance as of December 31, 2009 |
1,309,164 | 5.70 | |||
F-31
Table of Contents
COGO GROUP, INC.
NOTES TO CONSOLIDATED FINANCIAL STATEMENTS
(in thousands, except share data)
| Note i | The stock awards vest 50% on June 30, 2007, 25% on September 30, 2007 and 25% on December 31, 2007. | |
| Note ii | The stock awards vest in equal quarterly installments over a period of one year from the date of grant. | |
| Note iii | The stock awards were fully vested on the date of grant. | |
| Note iv | The stock awards vest in equal installments on August 31, September 30, October 31, November 30 and December 31, 2007, respectively. | |
| Note v | The stock awards vest in equal installments on March 24, June 24, September 24 and December 24, 2008. | |
| Note vi | The stock awards vest in equal annual installments over a period of three years from January 1, 2008. | |
| Note vii | The stock awards vest in equal quarterly installments over a period of three years from the date of grant. | |
| Note viii | The stock awards vest in equal quarterly installments over a period of two years from the date of grant. | |
| Note ix | The stock awards vest in equal quarterly installments over a period of one year from the date of grant. | |
The total fair value of the above equity share units vested during the years ended December 31, 2009, 2008 and 2007 were USD7,986, USD4,936 and USD2,916, respectively. As of December 31, 2009, 2008 and 2007, the aggregate fair value of all non-vested equity share units were USD7,459, USD12,695 and USD2,032, respectively, which is expected to be amortized on a straight-line basis over a weighted average period of approximately 12 months (2008: 24 months).
Performance shares
A summary of performance shares activity is as follows:
| Shares | Weighted average Grant-date fair value | ||||
| USD | |||||
| Balance as of January 1, 2007 |
— | — | |||
| Granted on December 24, 2007 (note i) |
255,000 | 16.03 | |||
| Granted on December 24, 2007 (note ii) |
15,000 | 16.03 | |||
| Balance as of December 31, 2007 |
270,000 | 16.03 | |||
| Granted on March 27, 2008 (note i) |
160,000 | 10.85 | |||
| Vested |
(5,000 | ) | 16.03 | ||
| Balance as of December 31, 2008 |
425,000 | 14.08 | |||
| Vested |
(5,000 | ) | 16.03 | ||
| Balance as of December 31, 2009 |
420,000 | 14.06 | |||
| Note i | The performance shares vest in equal annual installments over three years from January 1, 2008 to December 31, 2010 and were subject to the Group meeting certain earning measures in 2008, 2009 and 2010. Management assessed that the earning measures for these performance shares were improbable of achievement for 2008 and 2009. | |
| Note ii | The performance shares vest in equal annual installments over three years from January 1, 2008 to December 31, 2010 and were subject to the Group meeting performance measures in 2008, 2009 and 2010. The performance measures for these performance shares have been achieved in 2008 and 2009. | |
The total fair value of performance shares vested during the year ended December 31, 2009 and 2008 was USD80. No performance shares were vested during the year ended December 31, 2007. As of December 31, 2009, 2008 and 2007, the aggregate fair value of all performance share units were USD5,904, USD5,984 and USD4,328, respectively.
F-32
Table of Contents
COGO GROUP, INC.
NOTES TO CONSOLIDATED FINANCIAL STATEMENTS
(in thousands, except share data)
| (d) | 2009 Incentive Plan |
On November 9, 2009, the Board of Directors adopted the 2009 Omnibus Securities and Incentive Plan (the “2009 Incentive Plan”) pursuant to which 6,000,000 shares of the Company’s common stock are reserved for issuance upon exercise of stock options, and for the issuance of stock appreciation rights, restricted stock awards and performance shares. The purpose of the 2009 Incentive Plan is to provide additional incentive to employees, directors, advisors and consultants. The 2009 Incentive Plan provides for a term of 10 years from the date of its adoption by the Board of Directors, after which no awards may be made, unless the 2009 Incentive Plan is early terminated by the Board. No stock options, or the issuance or stock appreciation rights, restricted stock awards and performance shares have been granted under the 2009 Incentive Plan for the year ended December 31, 2009.
| 13 | EARNINGS PER SHARE |
The following table sets forth the computation of basic and diluted earnings per share for the year ended December 31:
| 2009 | 2009 | 2008 | 2007 | |||||
| USD | RMB | RMB | RMB | |||||
| Numerator for basic and diluted earnings per share: |
||||||||
| Income before extraordinary item |
10,766 | 73,487 | 95,907 | 152,443 | ||||
| Extraordinary item |
987 | 6,737 | — | — | ||||
| Net income attributable to Cogo Group, Inc. |
11,753 | 80,224 | 95,907 | 152,443 | ||||
| Denominator: |
||||||||
| Basic weighted average shares |
36,541,037 | 38,488,861 | 36,974,100 | |||||
| Effect of dilutive non-vested equity share units, performance shares, options and warrants |
1,132,314 | 1,097,060 | 1,332,869 | |||||
| Diluted weighted average shares |
37,673,351 | 39,585,921 | 38,306,969 | |||||
| Income before extraordinary item |
0.29 | 2.01 | 2.49 | 4.12 | ||||
| Extraordinary item |
0.03 | 0.19 | — | — | ||||
| Basic earnings per share |
0.32 | 2.20 | 2.49 | 4.12 | ||||
| Income before extraordinary item |
0.29 | 1.95 | 2.42 | 3.98 | ||||
| Extraordinary item |
0.03 | 0.18 | — | — | ||||
| Diluted earnings per share |
0.32 | 2.13 | 2.42 | 3.98 | ||||
Non-vested equity share units, performance shares, and options and warrants amounting to approximately 661 thousand, 942 thousand, and 384 thousand at December 31, 2009, 2008 and 2007, respectively are excluded from the Company’s dilutive computation as their effect would be anti-dilutive.
F-33
Table of Contents
COGO GROUP, INC.
NOTES TO CONSOLIDATED FINANCIAL STATEMENTS
(in thousands, except share data)
| 14 | OPERATING SEGMENT INFORMATION |
ASC 280, Segment Reporting (formerly SFAS No. 131, Disclosures about Segments of an Enterprise and Related Information), establishes standards for reporting information about operating segments in financial statements. Operating segments are defined as components of an enterprise about which separate financial information is available that is evaluated regularly by the chief operating decision maker, or decision making group, in deciding how to allocate resources and in assessing performance.
The Company determined it has two operating segments: Product Sales and Services Revenue.
The Product Sales segment primarily consists of the sale of components for digital media (such as network protection devices and data storage), telecommunication system equipment and industrial applications end-markets. The Services Revenue segment primarily consists of the provision of technology and engineering services, business process outsourcing, network system integration and related training and maintenance services. Segment revenue from external customers eliminates only intra-segment revenue. Unallocated expenses include items such as corporate staff and overhead. Unallocated assets mainly include cash for corporate use.
Substantially all of the Group’s operations are in the PRC. Consequentially, no geographic information is presented.
The following is the segment information for the year ended December 31, 2009:
| Product Sales RMB |
Services Revenue RMB |
Unallocated RMB |
Total RMB |
||||||||
| Net revenue |
|||||||||||
| Segment revenue from external customers |
2,066,815 | 29,401 | — | 2,096,216 | |||||||
| Inter-segment revenue |
513 | 5,978 | — | 6,491 | |||||||
| 2,067,328 | 35,379 | — | 2,102,707 | ||||||||
| Income from operations |
145,881 | 531 | (73,300 | ) | 73,112 | ||||||
| Interest expense |
(1,963 | ) | — | — | (1,963 | ) | |||||
| Interest income |
14,482 | 8 | — | 14,490 | |||||||
| Earnings before income taxes and extraordinary item |
158,400 | 539 | (73,300 | ) | 85,639 | ||||||
| Significant non-cash items: |
|||||||||||
| – Depreciation and amortization |
31,347 | 3,000 | — | 34,347 | |||||||
| – Provision for inventory write-down |
3,588 | 2,777 | — | 6,365 | |||||||
| – Allowance for doubtful accounts |
35,992 | — | — | 35,992 | |||||||
| – Income tax expense |
6,846 | 2,361 | — | 9,207 | |||||||
| – Share-based compensation cost |
— | — | 59,045 | 59,045 | |||||||
| – Extraordinary item |
6,737 | — | — | 6,737 | |||||||
| Segment assets |
1,851,356 | 66,444 | 3,727 | 1,921,527 | |||||||
| Total expenditures for additions to long-lived assets |
|||||||||||
| – Property and equipment |
2,094 | 335 | — | 2,429 | |||||||
| – Intangible assets (Note 7) |
50,526 | — | — | 50,526 | |||||||
| – Goodwill (Note 7) |
80,226 | — | — | 80,226 | |||||||
F-34
Table of Contents
COGO GROUP, INC.
NOTES TO CONSOLIDATED FINANCIAL STATEMENTS
(in thousands, except share data)
The following is the segment information for the year ended December 31, 2008:
| Product Sales RMB |
Services Revenue RMB |
Unallocated RMB |
Total RMB |
|||||||||
| Net revenue |
||||||||||||
| Segment revenue from external customers |
1,931,845 | 27,695 | — | 1,959,540 | ||||||||
| Inter-segment revenue |
8,368 | 63,216 | — | 71,584 | ||||||||
| 1,940,213 | 90,911 | — | 2,031,124 | |||||||||
| Income from operations |
124,265 | (1,740 | ) | (49,987 | ) | 72,538 | ||||||
| Interest expense |
(1,056 | ) | — | — | (1,056 | ) | ||||||
| Interest income |
25,426 | 2,390 | 79 | 27,895 | ||||||||
| Earnings before income taxes and extraordinary item |
148,635 | 650 | (49,908 | ) | 99,377 | |||||||
| Significant non-cash items: |
||||||||||||
| – Depreciation and amortization |
31,164 | 6,320 | — | 37,484 | ||||||||
| – In-process research and development |
4,390 | — | — | 4,390 | ||||||||
| – Impairment loss of goodwill and intangible assets (Note 8) |
33,759 | — | — | 33,759 | ||||||||
| – Provision for inventory write-down |
511 | 689 | — | 1,200 | ||||||||
| – Allowance for doubtful accounts |
6,847 | — | — | 6,847 | ||||||||
| – Income tax expense |
2,054 | 161 | — | 2,215 | ||||||||
| – Share-based compensation cost |
— | — | 40,722 | 40,722 | ||||||||
| Segment assets |
1,607,409 | 75,846 | 3,555 | 1,686,810 | ||||||||
| Total expenditures for additions to long-lived assets |
||||||||||||
| – Property and equipment |
6,257 | 1,294 | — | 7,551 | ||||||||
| – Intangible assets (Note 7) |
30,157 | — | — | 30,157 | ||||||||
| – Goodwill (Note 7) |
21,422 | — | — | 21,422 | ||||||||
F-35
Table of Contents
COGO GROUP, INC.
NOTES TO CONSOLIDATED FINANCIAL STATEMENTS
(in thousands, except share data)
The following is the segment information for the year ended December 31, 2007:
| Product Sales RMB |
Services Revenue RMB |
Unallocated RMB |
Total RMB |
|||||||||
| Net revenue |
||||||||||||
| Segment revenue from external customers |
1,597,818 | 68,690 | — | 1,666,508 | ||||||||
| Inter-segment revenue |
9,725 | 100,027 | — | 109,752 | ||||||||
| 1,607,543 | 168,717 | — | 1,776,260 | |||||||||
| Income from operations |
200,554 | 2,161 | (56,234 | ) | 146,481 | |||||||
| Interest expense |
(1,943 | ) | (392 | ) | — | (2,335 | ) | |||||
| Interest income |
24,903 | 117 | 617 | 25,637 | ||||||||
| Earnings before income taxes and extraordinary item |
223,514 | 1,886 | (55,617 | ) | 169,783 | |||||||
| Significant non-cash items: |
||||||||||||
| – Depreciation and amortization |
12,394 | 6,121 | — | 18,515 | ||||||||
| – Allowance for doubtful accounts |
15,052 | — | — | 15,052 | ||||||||
| – Income tax expense |
14,275 | — | — | 14,275 | ||||||||
| – Share-based compensation cost |
— | — | 38,015 | 38,015 | ||||||||
| Segment assets |
1,716,207 | 121,763 | 2,570 | 1,840,540 | ||||||||
| Total expenditures for additions to long-lived assets |
||||||||||||
| – Property and equipment |
4,005 | 5,029 | — | 9,034 | ||||||||
| – Intangible assets (Note 7) |
147,585 | (5,049 | ) | — | 142,536 | |||||||
| – Goodwill (Note 7) |
47,561 | 5,221 | — | 52,782 | ||||||||
Revenues from external customers by product category are summarized as follows:
| 2009 | 2009 | 2008 | 2007 | |||||
| USD | RMB | RMB | RMB | |||||
| Net revenue |
||||||||
| Product Sales |
||||||||
| Digital media |
185,635 | 1,267,124 | 1,279,683 | 1,088,764 | ||||
| Telecommunications equipment |
76,757 | 523,940 | 563,461 | 509,054 | ||||
| Industrial Business |
40,398 | 275,751 | 88,701 | — | ||||
| 302,790 | 2,066,815 | 1,931,845 | 1,597,818 | |||||
| Services Revenue |
4,307 | 29,401 | 27,695 | 68,690 | ||||
| Total net revenue |
307,097 | 2,096,216 | 1,959,540 | 1,666,508 | ||||
F-36
Table of Contents
COGO GROUP, INC.
NOTES TO CONSOLIDATED FINANCIAL STATEMENTS
(in thousands, except share data)
| 15 | STATUTORY RESERVES |
According to laws applicable to the foreign investment enterprises in the PRC and the Articles of Association of certain subsidiaries of the Company in the PRC (the “PRC subsidiaries”), the PRC subsidiaries are required to appropriate part of their net profits as determined in accordance with the accounting principles and the relevant financial regulations applicable to enterprises limited by shares as established by the Ministry of Finance of the PRC (“PRC GAAP”) to various reserves. These include general reserves, statutory surplus reserve and statutory public welfare fund.
For general reserve, appropriation to general reserve is at the discretion of the board of directors of the relevant PRC subsidiaries. The reserve can only be used for specific purposes and is not distributable as cash dividends.
For statutory surplus reserve, 10% of the net profit, as determined in accordance with PRC GAAP, of the relevant PRC subsidiaries is transferred to the statutory surplus reserve until the reserve balance reaches 50% of the registered capital of the relevant PRC companies. The transfer to this reserve must be made before distribution of dividends to shareholders can be made. The statutory surplus reserve can be used to make good previous years’ losses, if any, and may be converted into share capital by the issue of new shares to shareholders in proportion to their existing shareholders in proportion to their existing shareholdings or by increasing the par value of the shares currently held by the shareholders, provided that the balance after such issue is not less than 25% of the registered capital.
For statutory public welfare fund, 5% to 10% of the net profit, as determined in accordance with PRC GAAP, of the relevant PRC subsidiaries is transferred to the statutory public welfare fund. This fund can only be utilized on capital items for the collective benefit of the employees such as the construction of dormitories, canteen and other staff welfare facilities. The fund is non-distributable other than on liquidation. The transfer to this fund must be made before distribution of dividends to shareholders can be made.
The accumulated balance of these statutory reserves maintained at the Company’s PRC subsidiaries as of December 31, 2009 and 2008 were RMB42,294 (USD6,196).
| 16 | COMMITMENTS AND CONTINGENCIES |
| (a) | The Group leases its office facilities under non-cancelable operating leases. The leases have remaining terms up to 12 months. Rental expense was RMB9,682 (USD1,418), RMB9,496 and RMB7,831 for the years ended December 31, 2009, 2008 and 2007, respectively. |
Future minimum lease payments under non-cancellable operating leases as of December 31, 2009 were as follows:
| USD | RMB | |||
| Year ending December 31, |
||||
| 2010 |
659 | 4,498 | ||
| Total |
659 | 4,498 | ||
| (b) | As of December 31, 2009, the Group has outstanding purchase orders for components from suppliers in the amount of approximately RMB774,512 (USD113,467). The Group does not have any minimum purchase obligations with these suppliers. Other than as disclosed above, the Group had no other contractual obligations, off-balance sheet guarantees or arrangements as on December 31, 2009. |
| (c) | As of December 31, 2009, outstanding bills discounted with banks for which the Group has retained a recourse obligation amounting to RMB33,871 (USD4,962). |
F-37
Table of Contents
COGO GROUP, INC.
NOTES TO CONSOLIDATED FINANCIAL STATEMENTS
(in thousands, except share data)
| 17 | CONCENTRATION OF RISK |
Revenue concentration
A substantial percentage of the Group’s sales are made to the following customers. Details of the customers accounting for 10% or more of total net revenue are as follows:
| 2009 | 2008 | 2007 | |||||||
| Customer A |
22 | % | 12 | % | 16 | % | |||
| Customer B |
10 | % | 10 | % | 10 | % |
The total amount of revenues from each customer accounting for 10% or more of total net revenue is as follow:
| 2009 | 2009 | 2008 | 2007 | |||||
| USD | RMB | RMB | RMB | |||||
| Customer A |
67,136 | 458,266 | 227,736 | 264,531 | ||||
| Customer B |
31,996 | 218,399 | 198,829 | 169,524 |
All of the Group’s customers with sales over 10% are within the Product Sales segment.
Details of the accounts receivable from the two customers with the largest receivable balances at December 31, 2009 and 2008 are as follows:
| Percentage of accounts receivable | ||||||
| 2009 | 2008 | |||||
| Customer A |
40 | % | 9 | % | ||
| Customer B |
13 | % | 23 | % | ||
| 53 | % | 32 | % | |||
Dependence on suppliers
The Group typically rely on a limited number of key suppliers, and many customized module design solutions that are developed by the Group are designed around technology components provided by these suppliers. The Group typically do not have long-term supply agreements or other forms of exclusive arrangements with these suppliers. If the Group loses a key supplier or a supplier reduces the quantity of products it sells to the Group, it does not maintain a sufficient inventory level of products required or is otherwise unable to meet the demand for its components, the Group may have to expend significant time, effort and other resources to locate a suitable alternative supplier and secure replacement components. If suitable replacement components are unavailable, the Group may be forced to redevelop certain of its solutions, which ultimately may not be accepted by the customers.
A substantial percentage of the Group’s purchases are made from the following suppliers. Details of the major suppliers are as follows:
| 2009 | 2008 | 2007 | |||||||
| Supplier A |
36.3 | % | 31.7 | % | 28.6 | % | |||
| Supplier B |
10.1 | % | 7.5 | % | 10.0 | % | |||
| Supplier C |
9.7 | % | 4.4 | % | 3.8 | % | |||
| Supplier D |
9.4 | % | 1.4 | % | Nil |
F-38
Table of Contents
COGO GROUP, INC.
NOTES TO CONSOLIDATED FINANCIAL STATEMENTS
(in thousands, except share data)
| 18 | EMPLOYEE BENEFIT PLANS |
Certain employees of the Group in the PRC are entitled to retirement benefits based on their salaries and length of service upon retirement in accordance with a PRC government-managed retirement plan. The PRC government is directly responsible for the payments of the benefits to these retired employees. The Group is required to make contributions to the government-managed retirement plan at 6.5% to 9% of the monthly basic salaries of certain employees. The contribution expense for the years ended December 31, 2009, 2008 and 2007 was RMB5,354 (USD784), RMB5,726 and RMB2,062, respectively.
The Group operates a Mandatory Provident Fund Scheme (“the MPF scheme”) under the Hong Kong Mandatory Provident Fund Schemes Ordinance for employees employed under the jurisdiction of the Hong Kong Employment Ordinance. The assets of the MPF scheme are held by independent trustees and are separated from those of the Group’s assets. Under the MPF scheme, the employer and its employees are each required to make contributions to the plan at 5% of the employees’ relevant income, subject to a cap of monthly relevant income of HKD20. Contributions to the plan by the employee vest immediately. The contributions paid by the Group for the years ended December 31, 2009, 2008 and 2007 were RMB285 (USD42), RMB189 and RMB103, respectively.
| 19 | FAIR VALUE OF FINANCIAL INSTRUMENTS |
The fair values of pledged bank deposits, accounts receivable, accounts payable, bank borrowings, and accrued expenses and other liabilities approximated the respective carrying amounts because of the short maturity of these instruments. The Group adopted ASC 820-10 (SFAS No. 157, Fair Value Measurements), for the nonfinancial assets and liabilities that are remeasured at fair value on a nonrecurring basis, prospectively effective January 1, 2009. The nonfinancial assets and liabilities that are remeasured at fair value on a nonrecurring basis did not impact our financial position or results of operations; however, it could have an impact in future periods. In addition, the Group may have additional disclosure requirements in the event we incur impairment of our assets in future periods.
| 20 | FOREIGN CURRENCY RISK |
The RMB is not a freely convertible currency. The State Administration for Foreign Exchange, under the authority of the People’s Bank of China, controls the conversion of RMB into foreign currencies. The value of the RMB is subject to changes in central government policies and to international economic and political developments affecting supply and demand in the China Foreign Exchange Trading System market.
The PRC subsidiaries conduct their business substantially in the PRC, and their financial performance and position are measured in terms of RMB. Any devaluation of the RMB against the USD would consequently have an adverse effect on the financial performance and asset values of the Group when measured in terms of USD. The PRC subsidiaries’ products are primarily procured, sold and delivered in the PRC for RMB. Thus, their revenues and profits are predominantly denominated in RMB.
| 21 | INTEREST RATE RISK |
The Group is exposed to interest rate risk arising from short-term variable rate borrowings from time to time. The Group’s future interest expense will fluctuate in line with any change in borrowing rates. The Group does not have any derivative financial instruments as of December 31, 2009 and 2008 and believes its exposure to interest rate risk is not material.
F-39