Attached files
Table of Contents
UNITED STATES
SECURITIES AND EXCHANGE COMMISSION
Washington, D.C. 20549
FORM 10-K
FOR ANNUAL AND TRANSITION REPORTS
PURSUANT TO SECTIONS 13 OR 15(d) OF THE
SECURITIES EXCHANGE ACT OF 1934
| x | ANNUAL REPORT PURSUANT TO SECTION 13 OR 15(d) OF THE SECURITIES EXCHANGE ACT OF 1934 |
For the fiscal year ended December 31, 2009
OR
| ¨ | TRANSITION REPORT PURSUANT TO SECTION 13 OR 15(d) OF THE SECURITIES EXCHANGE ACT OF 1934 |
For the transition period from to
Commission file number 0-17089
BOSTON PRIVATE FINANCIAL HOLDINGS, INC.
(Exact name of registrant as specified in its charter)
| Commonwealth of Massachusetts | 04-2976299 | |
| (State or other jurisdiction of incorporation or organization) |
(I.R.S. Employer Identification Number) | |
| Ten Post Office Square Boston, Massachusetts |
02109 | |
| (Address of principal executive offices) | (Zip Code) | |
(Registrant’s telephone number, including area code): (617) 912-1900
Securities registered pursuant to Section 12(b) of the Act:
| Title of Each Class |
Name of Each Exchange on Which Registered | |
| Common Stock |
The NASDAQ Stock Market LLC |
Securities registered pursuant to Section 12(g) of the Act:
None
Indicate by check mark whether the registrant is a well-known seasoned issuer, as defined in Rule 405 of the Securities Act. Yes ¨ No x
Indicate by check mark whether the registrant is not required to file reports pursuant to Section 13 or Section 15(d) of the Securities Act. Yes ¨ No x
Indicate by check mark whether the registrant (1) has filed all reports required to be filed by Section 13 or 15(d) of the Securities Exchange Act of 1934 during the preceding 12 months (or for such shorter period that the registrant was required to file such reports), and (2) has been subject to such filing requirements for the past 90 days. Yes x No ¨
Indicate by check mark whether the registrant has submitted electronically and posted on its corporate Web site, if any, every Interactive Data File required to be submitted and posted pursuant to Rule 405 of Regulation S-T during the preceding 12 months (or for such shorter period that the registrant was required to submit and post such files). Yes ¨ No ¨
Indicate by check mark if disclosure of delinquent filers pursuant to Item 405 of Regulation S-K is not contained herein, and will not be contained, to the best of registrant’s knowledge, in definitive proxy or information statements incorporated by reference in Part III of this Form 10-K or any amendment to this Form 10-K. ¨
Indicate by check mark whether the registrant is a large accelerated filer, an accelerated filer, a non-accelerated filer, or a smaller reporting company.
| Large accelerated filer ¨ | Accelerated filer x | Non-accelerated filer ¨ (Do not check if a Smaller reporting company) |
Smaller reporting company ¨ |
Indicate by check mark whether the registrant is a shell company (as defined in Rule 12b-2 of the Exchange Act.) Yes ¨ No x
The aggregate market value of the voting and non-voting common equity held by non-affiliates of the registrant, computed by reference to the last reported sales price on the NASDAQ Global Select Market on June 30, 2009 was $303,734,767.
The number of shares of the registrant’s common stock outstanding on March 5, 2010 was 68,792,790.
Documents Incorporated by Reference:
Portions of the registrant’s proxy statement for the Company’s 2010 Annual Meeting of Stockholders are incorporated by reference in Item 5 of Part II and Items 10, 11, 12, 13, and 14 of Part III.
Table of Contents
i
Table of Contents
The discussions set forth below and elsewhere herein may contain statements that may be considered forward-looking statements within the meaning of Section 27A of the Securities Act of 1933, as amended (the “Securities Act”), and Section 21E of the Securities Exchange Act of 1934, as amended (the “Exchange Act”). All statements, other than statements of historical facts, including statements regarding our strategy, effectiveness of investment programs, evaluations of future interest rate trends and liquidity, expectations as to growth in assets, deposits and results of operations, success of acquisitions, future operations, market position, financial position, and the impact on our results of market conditions and prevailing and future interest rates and prospects, plans and objectives of management are forward-looking statements.
Actual results, performance or achievements could differ materially from those contemplated, expressed or implied by the forward-looking statements contained or incorporated by reference in this document. Important factors that could cause actual results to differ materially from our forward-looking statements are set forth in Part II, Item 7, “Management’s Discussion and Analysis of Financial Condition and Results of Operations” and Item 1A, “Risk Factors.” Forward-looking statements are based on the current assumptions and beliefs of management and are only expectations of future results. Our actual results could differ materially from those projected in the forward-looking statements as a result of, among other factors, adverse conditions in the capital and debt markets, and the impact of such conditions on our private banking, asset management and investment advisory activities; changes in interest rates; competitive pressures from other financial institutions; the effects of a continuing deterioration in general economic conditions on a national basis or in the local markets in which we operate, including changes which adversely affect borrowers’ ability to service and repay our loans; changes in loan defaults and charge-off rates; changes in the value of securities and other assets; the adequacy of loan loss reserves or deposit levels necessitating increased borrowing to fund loans and investments; the passing of adverse government regulation; the risk that goodwill and intangibles recorded in our financial statements will become impaired; risks related to the identification and implementation of acquisitions and changes in assumptions used in making such forward-looking statements. This is not an exhaustive list and as a result of variations in any of these factors actual results may differ materially from any forward-looking statements.
Forward-looking statements speak only as of the date they are made. You should not place undue reliance on these forward-looking statements. We will not update forward-looking statements to reflect facts, assumptions, circumstances or events which have changed after a forward-looking statement was made.
ii
Table of Contents
Boston Private Financial Holdings, Inc. (the “Company” or “BPFH”) was incorporated on September 2, 1987, under the laws of The Commonwealth of Massachusetts. On July 1, 1988, the Company registered with the Board of Governors of the Federal Reserve System (the “FRB”) as a bank holding company under the Bank Holding Company Act of 1956, as amended (the “BHCA”), and became the parent holding company of Boston Private Bank & Trust Company (“Boston Private Bank”), a trust company chartered by The Commonwealth of Massachusetts and insured by the Federal Deposit Insurance Corporation (the “FDIC”). In addition to Boston Private Bank, the Company has three other consolidated Private Banking affiliate partners, two consolidated Investment Management affiliate partners, and three consolidated Wealth Advisory affiliate partners. The Company conducts substantially all of its business through its three reportable segments, Private Banking, Investment Management, and Wealth Advisory. The parent company (Boston Private Financial Holdings Inc.) (the “Holding Company”) includes the operations of the Holding Company and equity in earnings of the equity method investees. All significant intercompany accounts and transactions have been eliminated in consolidation.
As of December 31, 2009 the Company holds approximately 45% equity interest in Coldstream Holdings, Inc. (“Coldstream”). Coldstream is the parent of Coldstream Capital Management, Inc. (“Coldstream Capital”), a registered investment adviser, and Coldstream Securities, Inc., a registered broker dealer. Coldstream’s financial results are accounted for using the equity method, and are included in other assets. For segment reporting purposes, the equity in earnings of Coldstream is included with the Holding Company’s results.
In 2009 the Company divested its interest in Westfield Capital Management Company, LP, formerly known as Westfield Capital Management Company, LLC (“Westfield”), Gibraltar Private Bank & Trust Company (“Gibraltar”), RINET Company, LLC (“RINET”), Sand Hill Advisors, LLC (“Sand Hill”), and Boston Private Value Investors, Inc. (“BPVI”). Both Westfield and BPVI were previously included in the Investment Management segment, RINET and Sand Hill were previously included in the Wealth Advisory segment and Gibraltar was previously included in the Private Banking segment. As a result of these divestitures, the results of operations and the gain/ (loss) on sale related to each are now included in “Net loss from discontinued operations” in the consolidated statement of operations for current and prior periods. In addition, the assets and liabilities of the divested companies have been reflected as assets and liabilities of discontinued operations in the accompanying consolidated balance sheets for periods prior to the divestiture.
For further details relating to the Company’s divestitures, see Part II, Item 8, “Financial Statements and Supplementary Data—Note 2: Divestitures and Acquisitions.”
The Company’s Segment CEOs manage the segments and have full authority and responsibility for the performance and the allocation of resources within their respective segments. The Segment CEOs report to the Company’s CEO and President who are the Company’s Chief Operating Decision Makers (“CODMs”). There is currently one Segment CEO for the Private Banking segment, and one Segment CEO who is responsible for both the Wealth Advisory and Investment Management segments. The Company also has Segment Controllers who provide direct financial support to the affiliate partners and the Segment CEOs.
The Company’s operating business model provides that the affiliate partners are given operating autonomy. Under the current management structure, day to day activities of the individual affiliates continue to be directed by the Affiliate CEOs. The Segment CEOs have authority with respect to the allocation of capital within their segments, management oversight responsibility, performance assessments, and overall authority and accountability for all of the affiliates within their segment. The Segment CEOs communicate with the Affiliate CEOs within their segment regarding profit and loss responsibility, strategic planning, priority setting and other matters.
1
Table of Contents
The Company CFO and the Segment Controllers review the affiliate company financial detail with the relevant Segment CEOs. The Segment CEOs and the Company CFO then review the overall segment results with the CODMs on a quarterly basis. In addition, the Segment CEOs are fully responsible for the execution of the annual budget at the affiliate level, and aggregated industry segment results are then reported to the CODMs.
The Company’s approach to the wealth management market is to create a financial umbrella that helps to preserve, grow, and transfer assets over the financial lifetime of a client through three financial disciplines: private banking, investment management and wealth advisory. Each reportable segment reflects the services provided by the Company to a distinct segment of the wealth management markets as described below.
Private Banking
The Private Banking segment has four consolidated affiliate partners, including Boston Private Bank, chartered by The Commonwealth of Massachusetts; Borel Private Bank & Trust Company (“Borel”) and First Private Bank & Trust (“FPB”), both California state chartered banks; and Charter Bank (“Charter”), a Washington state chartered bank; all of which are insured by the FDIC (together, the “Banks”). The Banks pursue private banking and community-oriented business strategies in their operating regions. The Banks are principally engaged in providing banking, commercial banking, and a variety of other fiduciary services including investment management, advisory, and administrative services to high net worth individuals, their families, small and medium-sized businesses and professionals. In addition, the Banks offer their clients a broad range of deposit and lending products. The specific mix of products, services and clientele can vary from affiliate to affiliate. The Banks are located in New England, Northern California, Southern California, and the Pacific Northwest.
Investment Management
The Investment Management segment has two consolidated affiliate partners, including Dalton, Greiner, Hartman, Maher & Co., LLC (“DGHM”), a registered investment adviser, and Anchor Capital Holdings, LLC (“Anchor”), which is the parent company of Anchor Capital Advisors LLC (“Anchor Capital Advisors”) and Anchor/ Russell Capital Advisors LLC (“Anchor Russell”), both of which are registered investment advisers (together, DGHM and Anchor are referred to as “the Investment Managers”). The Investment Managers serve the needs of pension funds, endowments, trusts, foundations and select institutions, mutual funds and high net worth individuals and their families throughout the United States (“U.S.”) and abroad. The Investment Managers specialize in value-driven equity portfolios with products across the capitalization spectrum. The specific mix of products, services and clientele varies between affiliates. The Investment Managers are located in New England and New York, with one affiliate administrative office in South Florida.
Wealth Advisory
The Wealth Advisory segment has three consolidated affiliate partners, including KLS Professional Advisors Group, LLC (“KLS”), Bingham, Osborn & Scarborough, LLC (“BOS”), and Davidson Trust Company (“DTC”), all of which are registered investment advisers, with the exception of DTC, and wealth management firms (together, the “Wealth Advisors”). The Wealth Advisors provide comprehensive, planning-based financial strategies to high net worth individuals and their families, and non-profit institutions. The firms offer fee-only financial planning, tax planning and preparation, estate and insurance planning, retirement planning, charitable planning and intergenerational giving planning. The Wealth Advisors manage investments covering a wide range of asset classes for both taxable and tax-exempt portfolios. The Wealth Advisors are located in New York, Northern California, and Pennsylvania.
For revenue, net income, assets, and other financial information for each of the Company’s reportable segments, see Part II, Item 8, “Financial Statements and Supplementary Data—Note 4: Reportable Segments.”
2
Table of Contents
Competition
The Company operates in the highly competitive wealth management marketplace. The Company believes its regional presence enables it to provide better access to decision makers and more customized personal service for its clients.
In the Company’s private banking business, the ability of the Banks to attract loans and deposits may be limited by their small size relative to some of their competitors. The Banks maintain a smaller staff and have fewer financial and other resources than larger institutions with which they compete in their market areas. In particular, in attempting to attract deposits and originate loans, the Banks encounter competition from other institutions, including larger national and suburban-based commercial banking organizations, savings banks, credit unions, and other financial institutions and nonbank financial service companies. The principal methods of competition include the level of loan interest rates charged to borrowers, interest rates paid on deposits, range of services provided and the quality of these services. To compete effectively, the Banks rely substantially on local promotional activity, personal contacts by officers, directors, and employees, personalized service and their reputation within the communities they serve.
In this competitive environment, the Banks may be unable to attract sufficient and high quality loans in order to continue their loan growth, which may adversely affect the Banks’ results of operations and financial condition, including the level of their non-performing assets. The Banks’ competitors include several major financial companies whose greater resources may afford them a marketplace advantage by enabling them to maintain numerous banking locations and mount extensive promotional and advertising campaigns. The Banks’ current commercial borrowing customers may develop needs for credit facilities larger than the Banks can accommodate. Moreover, under the Gramm-Leach-Bliley Act of 1999 (the “GLBA”), securities firms, insurance companies and other financial services providers that elect to become financial holding companies may acquire banks and other financial institutions. The GLBA has significantly changed the competitive environment in which the Company and its subsidiaries conduct business. (See “Supervision and Regulation of the Banks”, below.) The financial services industry is also likely to become more competitive as further technological advances enable more companies to provide financial services. These technological advances may diminish the importance of depository institutions and other financial intermediaries in the transfer of funds among parties.
The reportable segments’ ability to attract investment management and trust business may be inhibited by the relatively short history and record of performance at each affiliate. The Company’s principal competitors with respect to investment management and trust services are primarily commercial banks and trust companies, mutual fund companies, investment advisory firms, stock brokerage firms, other financial companies and law firms. Many of BPFH’s competitors have greater resources than its individual affiliates or the Company on a consolidated basis. Competition can impact revenue and current and future fee structures.
The Company believes that its ability to compete effectively with other firms is dependent upon its products, level of investment performance and client service, as well as the marketing and distribution of the investment products. Moreover, BPFH’s ability to retain investment management clients may be impaired by the fact that investment management contracts are typically short-term in nature, allowing clients to withdraw funds from accounts under management, generally at their sole discretion. There can be no assurance that BPFH will be able to achieve favorable investment performance and retain its existing clients.
In the wealth advisory industry, BPFH competes with a wide variety of firms including national and regional financial services firms, accounting firms, trust companies, and law firms. Many of these companies have greater resources and broader product lines, and may already have relationships with BPFH’s clients in related product areas. The Company believes that the ability of its wealth advisory affiliates to compete effectively with other firms is dependent upon the quality and level of service, personal relationships, and investment performance. There can be no assurance that the Company’s Wealth Advisors will be able to retain their existing clients, expand existing relationships, or add new clients.
3
Table of Contents
Employees
At December 31, 2009, the Company had 859 employees. The Company’s employees are not subject to a collective bargaining agreement, and the Company believes its employee relations are good.
III. Regulatory Considerations
Supervision and Regulation
In addition to the generally applicable state and federal laws governing businesses and employers, the Company is further subject to federal and state laws and regulations applicable to depository institutions, investment advisers, and their parent companies. Virtually all aspects of the Company’s operations are subject to specific requirements or restrictions and general regulatory oversight. State and federal banking laws have as their principal objective the safety and soundness of depository institutions, the federal deposit insurance system, and the protection of depositors, rather than the protection of stockholders of a bank or its parent company. Many of the Company’s affiliates are also subject to regulation under federal and state securities laws as described below under “Government Regulation of Other Activities.”
Set forth below is a summary description of certain laws and regulations that relate to the supervision and regulation of BPFH and its affiliate partners. In response to the deterioration of the financial markets in 2008, comprehensive financial regulatory reform proposals are pending in both the U.S. House of Representatives and the U.S. Senate which may be adopted in whole or in part in 2010. These proposals would restructure the regulatory regime for financial institutions and impose significant additional requirements and restrictions on banks and bank holding companies. To the extent the following material describes statutory or regulatory provisions, it is qualified in its entirety by reference to the particular statute or regulation.
Certain Restrictions on Activities and Operations of BPFH
BPFH is a bank holding company registered with the FRB under the BHCA. As such, BPFH and its non-bank subsidiaries are subject to the supervision, examination, and reporting requirements of the BHCA and the regulations of the FRB. BPFH is also a bank holding company for purposes of (i) the laws of The Commonwealth of Massachusetts, and subject to the jurisdiction of the Massachusetts Board of Bank Incorporation (the “BBI”) and the Massachusetts Commissioner of Banks (the “Commissioner”), (ii) the laws of the State of California, and subject to the jurisdiction of the California Department of Financial Institutions (the “CDFI”) and (iii) the laws of the State of Washington, and subject to the jurisdiction of the Washington State Department of Financial Institutions (the “WDFI”). BPFH has not elected financial holding company (“FHC”) status under the BHCA and, accordingly, may not engage in “certain financial activities,” such as merchant banking, that are only authorized under the BHCA for bank holding companies that have elected FHC status.
The FRB has the authority to issue orders to bank holding companies to cease and desist from unsafe or unsound banking practices and violations of conditions imposed by, or violations of agreements with, the FRB. The FRB is also empowered, among other things, to assess civil money penalties against companies or individuals who violate BHCA orders or, among other things, regulations thereunder, to order termination of nonbanking activities of bank holding companies, and to order termination of ownership and control of a nonbanking subsidiary by a bank holding company.
BHCA: Activities and Other Limitations. The BHCA prohibits a bank holding company from acquiring substantially all the assets of a bank or acquiring direct or indirect ownership or control of more than 5% of the voting shares of any bank, or increasing such ownership or control of any bank, or merging or consolidating with any bank holding company without prior approval of the FRB. The Riegle-Neal Interstate Banking and Branching Efficiency Act of 1994 (“Riegle-Neal”) permits adequately or well capitalized and adequately or well managed bank holding companies, as determined by the FRB, to acquire banks in any state, subject to certain deposit concentration limits and other conditions. Riegle-Neal also generally authorizes the interstate merger of banks. In addition, among other things, Riegle-Neal permits banks and federal savings associations to establish new branches on an interstate basis provided that the law of the host state specifically authorizes such action.
4
Table of Contents
Unless a bank holding company becomes a financial holding company under the GLBA (as discussed below), the BHCA prohibits a bank holding company from acquiring a direct or indirect interest in or control of more than 5% of the voting shares of any company that is not a bank or a bank holding company. In addition, the BHCA prohibits engaging directly or indirectly in activities other than those of banking, managing or controlling banks or furnishing services to its subsidiary banks. However, a bank holding company may engage in and may own shares of companies engaged in certain activities that the FRB determines to be so closely related to banking or managing and controlling banks so as to be a proper incident thereto. In making such determinations, the FRB is required to weigh the expected benefit to the public, including such factors as greater convenience, increased competition or gains in efficiency, against the possible adverse effects, such as undue concentration of resources, decreased or unfair competition, conflicts of interests or unsafe or unsound banking practices. As discussed more fully below, Massachusetts law imposes certain approval requirements with respect to acquisitions by a bank holding company of certain banking institutions and to the merger of bank holding companies.
Capital Requirements. The FRB has adopted guidelines which it uses in assessing the adequacy of capital when examining and supervising a bank holding company and in analyzing applications upon which it acts. The FRB’s capital adequacy guidelines generally require bank holding companies to maintain total capital of at least 8% of total risk-adjusted assets and off-balance sheet items, with at least 50% of that amount consisting of Tier I or core capital and the remaining amount consisting of Tier II or supplementary capital. Tier I capital for bank holding companies generally consists of the sum of common stockholders’ equity, perpetual preferred stock and trust preferred securities (both subject to certain limitations and in the case of the latter to specific limitations on the kind and amount of such securities which may be included as Tier I capital), and minority interests in the equity accounts of consolidated subsidiaries, less goodwill and other non-qualifying intangible assets. Tier II capital generally consists of hybrid capital instruments, perpetual debt and mandatory convertible debt securities; perpetual preferred stock and trust preferred securities, to the extent it is not eligible to be included as Tier I capital; term subordinated debt and intermediate-term preferred stock; and, subject to limitations, general allowances for loan losses. Assets are adjusted under the risk-based guidelines to take into account different risk characteristics.
In addition to the risk-based capital requirements, the FRB requires bank holding companies to maintain a minimum leverage capital ratio of Tier I capital (defined by reference to the risk-based capital guidelines) to its average total consolidated assets (the “Leverage Ratio”) of at least 3.0% to be classified as “adequately capitalized” and of at least 5.0% to be classified as “well-capitalized.” Total consolidated average assets for this purpose does not include, for example, goodwill and any other intangible assets, unrealized gains or losses on investments and investments that the FRB determines should be deducted from Tier I capital. The 3% Leverage Ratio requirement is the minimum for the top-rated bank holding companies without any supervisory, financial or operational weaknesses or deficiencies or those which are not experiencing or anticipating significant growth. Bank holding companies with supervisory, financial, operational or managerial weaknesses, as well as bank holding companies that are anticipating or experiencing significant growth, are often required to maintain capital ratios above the minimum levels. Finally, the FRB has also imposed certain capital requirements applicable to certain nonbanking activities, including adjustments in connection with off-balance sheet items. BPFH’s Leverage Ratio as of December 31, 2009 was 11.62%.
U.S. bank regulatory authorities and international bank supervisory organizations, principally the Basel Committee on Banking Supervision (the “Basel Committee”), continue to consider changes to the risk-based capital adequacy framework which ultimately could affect the appropriate capital guidelines to which BPFH and the Banks are subject. The federal banking agencies issued a final rule entitled “Risk-Based Capital Standards: Advanced Capital Adequacy Framework—Basel II” (“Basel II”) which became effective on April 1, 2008 and “core banks” (“core banks” are the approximately 15 largest U.S. bank holding companies) were required to adopt a board-approved plan to implement Basel II by October 1, 2008. Basel II will result in significant changes to the risk-based capital standards for core banks subject to Basel II and other banks that elect to use such rules to calculate their risk-based capital requirements. Furthermore, it is possible that Basel II will be revised to reflect new proposals from the Basel Committee. In addition, in connection with Basel II, the federal banking agencies
5
Table of Contents
published a joint notice of proposed rulemaking entitled “Risk-Based Capital Guidelines; Capital Adequacy Guidelines: Standardized Framework” on July 29, 2008 (the “Standardized Approach Proposal”). The Standardized Approach Proposal would provide all non-core banks with an optional framework, based upon the standardized approach under the international Basel II Accord, for calculating their risk-based capital requirements. It is possible, however, that the Standardized Approach Proposal may never be adopted by the federal banking agencies. BPFH and the Banks do not currently expect to calculate their capital ratios under Basel II or in accordance with the Standardized Approach Proposal. Accordingly, BPFH is not yet in a position to determine the effect of such rules on its risk capital requirements.
Troubled Asset Relief Program (“TARP”). In 2008, the U.S. Department of the Treasury (the “Treasury”) instituted the TARP in response to adverse economic conditions in the financial markets, particularly the inability of creditworthy borrowers to obtain credit. Under the TARP, the Treasury developed the Capital Purchase Program (“CPP”), whereby it purchased non-voting senior preferred shares of participating financial institutions. Under the CPP, the Company sold $154 million of Series C Fixed Rate Cumulative Perpetual Preferred Stock (the “Series C Preferred”) to the Treasury in November of 2008 by entering into the Capital Purchase Program Securities Purchase Agreement (the “CPP Securities Purchase Agreement”). The Series C Preferred will pay cumulative dividends at a rate of five percent per year for the first five years and will reset to a rate of nine percent per year after the fifth year. Subject to consultation with the FRB, the Series C Preferred may be redeemed without regard to whether the Company has replaced such funds from any other source and without being subject to any waiting period. For as long as any Series C Preferred are outstanding, no dividend may be declared or paid on any junior preferred shares, preferred shares ranking pari passu with the Series C Preferred, or common shares unless all of the accrued and unpaid dividends for the cumulative Series C Preferred are fully paid. Dividends may be declared on pari passu preferred shares on a pro rata basis with Series C Preferred. The Company may not repurchase or redeem any junior preferred shares, preferred shares ranking pari passu with the Series C Preferred or common shares unless all the accrued and unpaid dividends for the Series C Preferred are fully paid.
As discussed above, the consent of the Treasury will be required for any increase in common stock dividends for the first three years, unless prior to the end of three years the Series C Preferred have been redeemed in full or the Treasury has transferred all of the Series C Preferred to third parties. The consent of the Treasury will also be required for any share repurchases, other than repurchases of the Series C Preferred or junior preferred shares or common shares in connection with any benefit plan in the ordinary course of business consistent with past practice, for the first three years, unless prior to the end of three years the Series C Preferred have been redeemed in full or the Treasury has transferred all of the Series C Preferred to third parties. No repurchases of junior preferred shares, preferred shares ranking pari passu with the Series C Preferred or common shares will be allowed if such repurchase is prohibited by a restriction on dividends.
In conjunction with the purchase of Series C Preferred, the Treasury also received warrants to purchase common stock with an aggregate market price equal to 15 percent of its investment in the Series C Preferred (the “TARP warrants”). The exercise price on the TARP warrants is $8.00. The TARP warrants have a term of 10 years and are freely transferrable and immediately exercisable, in whole or in part.
Because of its participation in the CPP, and for so long as such participation continues, the Company will be subject to stringent executive compensation and corporate governance rules and limitations for the period during which Treasury holds Series C Preferred. These standards and limitations include: (i) prohibiting the Company and its subsidiaries from paying or accruing any bonus, retention award or incentive compensation to any of the five most highly compensated employees of the Company or its subsidiaries (other than certain qualifying awards of restricted stock or restricted stock units); (ii) ensuring that incentive compensation for senior executives and employees does not encourage the taking of unnecessary and excessive risks that threaten the value of the financial institution through periodic risk reviews and assessments with the Company’s compensation committee and senior risk officers; (iii) requiring a “clawback” of any bonus or incentive compensation paid to a senior executive officer or one of the next twenty most highly compensated employees of
6
Table of Contents
the Company or its subsidiaries based on materially inaccurate financial statements or other materially inaccurate performance metric criteria; (iv) prohibiting the financial institution from making any golden parachute payment to a senior executive officer or one of the next five most highly compensated employees of the Company or its subsidiaries (generally, any severance payments or payments due to a change in control); (v) agreeing not to deduct for tax purposes executive compensation in excess of $500,000 for each senior executive officer, (vi) requiring an annual disclosure of any perquisites with a value in excess of $25,000 to certain employees; (vii) prohibiting the payment of any reimbursement for taxes owed with respect to any compensation, or “gross up,” paid to a senior executive officer or one of the next twenty most highly compensated employees of the Company or its subsidiaries; (viii) the adoption of a luxury expenditure policy; and (ix) including a non-binding “say-on-pay” resolution within the Company’s annual Proxy Statement, approving the compensation of the senior executive officers described in the Proxy Statement. As used above, the term senior executive officer means, for each year, the chief executive officer, chief financial officer, plus the next three most highly compensated executive officers identified in the Company’s annual Proxy Statement. The limitation on accrual or payment of bonuses does not apply to any payment required to be paid under certain valid employment contracts executed on or before February 11, 2009 which is paid in accordance to its terms. The Company and its senior executive officers have granted the Treasury a waiver releasing the Treasury from any claims that the Company or such officer may otherwise have as a result of the issuance of any regulation which modifies the terms of benefits plans, arrangements and agreements to eliminate any provisions that would not be in compliance with these executive compensation and corporate governance standards. Finally, the Company’s chief executive officer and chief financial officer must each certify as to compliance with all applicable compensation and governance rules on an annual basis and the Company’s compensation committee must provide a written narrative disclosure describing the review process noted in (ii), above, and certify as to its completion of this review.
Importantly, the CPP Securities Purchase Agreement may be unilaterally amended by the Treasury. Accordingly, the Company or the Banks may be subject to further restrictions or obligations as a result of their participation in the CPP. On January 13, 2010 the Company redeemed $50 million of its outstanding Series C Preferred stock, however, all restrictions listed above will continue to apply until the Company redeems the entire amount of the Series C Preferred issuance.
Limitations on Acquisitions of Common Stock. The Change in Bank Control Act prohibits a person or group of persons from acquiring “control” of a bank holding company unless the FRB has been notified and has not objected to the transaction. Under a rebuttable presumption established by the FRB, the acquisition of 10% or more of a class of voting securities of a bank holding company, such as BPFH, with a class of securities registered under Section 12 of the Exchange Act, would, under the circumstances set forth in the presumption, constitute the acquisition of control of a bank holding company. Massachusetts law, California law and Washington law also impose certain limitations on the ability of persons and entities to acquire control of banking institutions and their parent companies.
In addition, any company would be required to obtain the approval of the FRB under the BHCA before acquiring 25% (5% in the case of an acquirer that is a bank holding company) or more, or otherwise obtaining control or a controlling influence over a bank holding company. In 2008, the FRB released guidance on minority investments in banks that relaxed the presumption of control for investments of greater than 10% of a class of outstanding voting securities of a bank holding company in certain instances discussed in the guidance. In 2008, BP Holdco, L.P., a company controlled by The Carlyle Group, became the largest stockholder of BPFH, owning a 9.98% interest in the Company. The Carlyle Group’s investment is subject to certain restrictions under the terms of the investment agreement with BPFH. Under the agreement, the Carlyle Group cannot convert its non-voting preferred stock or exercise its warrants if as a result it would own more than 9.99% of the Company’s outstanding common stock.
Support of Subsidiary Institutions and Liability of Commonly Controlled Depository Institutions. Under FRB policy, BPFH is expected to act as a source of financial and managerial strength for, and commit its resources to, supporting the Banks during periods of financial stress or adversity. This support may be required at
7
Table of Contents
times when BPFH may not be inclined to provide it. In addition, any capital loans by a bank holding company to any of its bank subsidiaries are subordinate to the payment of deposits and to certain other indebtedness. In the event of a bank holding company’s bankruptcy, any commitment by the bank holding company to a federal bank regulatory agency to maintain the capital of a bank subsidiary will be assumed by the bankruptcy trustee and entitled to a priority of payment.
Depository institutions insured by the FDIC, such as the Banks, can be held liable for any loss incurred by, or reasonably expected to be incurred by, the FDIC in connection with the default of a commonly controlled FDIC-insured depository institution or any assistance provided by the FDIC to any commonly controlled FDIC-insured depository institution “in danger of default.” “Default” is defined generally as the appointment of a conservator or receiver, and “in danger of default” is defined generally as the existence of certain conditions indicating that a default is likely to occur in the absence of supervisory assistance. The FDIC’s claim for damages is superior to claims of stockholders of the insured depository institution or its holding company, but is subordinate to claims of depositors, secured creditors, and holders of subordinated debt (other than affiliates) of the commonly controlled insured depository institution. The Banks are subject to these cross-guarantee provisions. As a result, any loss suffered by the FDIC in respect of any of the Banks would likely result in assertion of the cross-guarantee provisions, the assessment of estimated losses against the other Banks, and a potential loss of BPFH’s investments in the Banks.
Massachusetts Law. As a bank holding company for purposes of Massachusetts law, BPFH has registered with the Commissioner and is obligated to make reports to the Commissioner. Further, as a Massachusetts bank holding company, BPFH may not acquire all or substantially all of the assets of a banking institution, merge or consolidate with another bank holding company or acquire direct or indirect ownership or control of any voting stock in any other banking institution if it will own or control more than 5% thereof without the prior consent of the BBI. As a general matter, however, the Commissioner does not rule upon or regulate the activities in which bank holding companies or their non-bank subsidiaries engage.
California Law. BPFH is also a bank holding company within the meaning of Section 3700 of the California Financial Code. As such, BPFH and its subsidiaries are subject to examination by, and may be required to file reports with, the CDFI.
Washington Law. BPFH is also a bank holding company within the meaning of Chapter 30.04 of the Revised Code of Washington. As such, BPFH and its subsidiaries are subject to examination by, and may be required to file reports with, the WDFI.
Cash Dividends. The FRB has the authority to prohibit bank holding companies from paying dividends if such payment is deemed to be an unsafe or unsound practice. The FRB has indicated generally that it may be an unsafe or unsound practice for bank holding companies to pay dividends unless the bank holding company’s net income over the preceding year is sufficient to fund the dividends and the expected rate of earnings retention is consistent with the organization’s capital needs, asset quality and overall financial condition. FRB policy further provides that a bank holding company should not maintain a level of cash dividends to its stockholders that places undue pressure on the capital of bank subsidiaries, or that can be funded only through additional borrowings or other arrangements that may undermine the bank holding company’s ability to serve as a source of strength to bank subsidiaries. The FDIC may also regulate the amount of dividends payable by the subsidiary banks. Further, as discussed above, in late 2008 the Company received funds from the Treasury under the TARP-CPP, which subjects the Company to certain restrictions on increases in, or payments of, cash dividends. The inability of the Banks to pay dividends may have an adverse affect on the Company.
Regulation of the Banks
The Banks are subject to the extensive supervision and regulation of various federal and state authorities, which include the FDIC, the CDFI, the WDFI, and the Commissioner. Each of the Banks is subject to numerous state and federal statutes and regulations that affect its business, activities, and operations, and each is supervised
8
Table of Contents
and examined by one or more federal or state bank regulatory agencies. Each of the Banks is required to file ongoing reports on their financial condition and other business activities with these various regulatory agencies and are also required to obtain the approval from the regulatory authorities prior to entering into certain transactions, including mergers with, or acquisitions of, other financial institutions. As FDIC-insured institutions, the Banks are also subject to certain requirements applicable to all insured depository institutions.
FDIC Insurance Premiums. The Banks pay deposit insurance premiums to the FDIC based on an assessment rate established by the FDIC. For most banks and savings associations, including the Banks, effective April 1, 2009 FDIC rates depend upon a combination of CAMELS component ratings, capital ratios, and, if applicable, the level of brokered deposits. CAMELS ratings reflect the applicable bank regulatory agency’s evaluation of the financial institution’s capital, asset quality, management, earnings, liquidity and sensitivity to risk. To determine the actual deposits insurance premiums, our Banks compute the amount based on insurable deposits and the applicable assessment rate for that individual bank. In 2009, the aggregate FDIC Insurance expense for the Banks was $9.7 million, which included a charge of $2.5 million for the special assessment. Future expenses will be based on deposit levels, assessment rates, CAMELS ratings, and whether there are any future special assessments by the FDIC.
In November 2009, the FDIC issued a final rule that mandated that insured depository institutions prepay their quarterly risk-based assessments to the FDIC for the fourth quarter of 2009 and for all of 2010, 2011, and 2012 on December 30, 2009. Each institution, including the Banks, recorded the entire amount of its prepayment as an asset (a prepaid expense). The prepaid assessments bear a zero-percent risk weight for risk-based capital purposes. The prepaid assessment base for the Banks was calculated using their third quarter 2009 assessment rate (using their CAMELS rating on that date). That assessment base will be adjusted quarterly with an estimated 5 percent annual growth in the assessment base through the end of 2012. The prepaid assessment rate for the fourth quarter of 2009 and for 2010 was based on the Banks’ total base assessment rate for the third quarter of 2009, adjusted as if the assessment rate in effect on September 30, 2009 had been in effect for the entire third quarter. Further, the prepaid assessment rate for 2011 and 2012 is equal to the adjusted third quarter 2009 total base assessment rate plus 3 basis points. As of December 31, 2009, and each quarter thereafter, the Banks recorded and will record an expense for their regular quarterly assessment for the quarter and a corresponding credit to the prepaid assessment until the asset is exhausted. The FDIC will not refund or collect additional prepaid assessments because of a decrease or growth in deposits over the next three years. However, should the prepaid assessment not be exhausted after collection of the amount due on June 30, 2013, the remaining amount of the prepayment will be returned to the applicable institution. In 2008, the level of FDIC deposit insurance was temporarily increased from $100,000 to $250,000 per depositor and the increased level of insurance coverage will remain in effect through December 31, 2013.
The FDIC has the power to adjust deposit insurance assessment rates at any time. We cannot predict whether, as a result of the adverse change in U.S. economic conditions and, in particular, declines in the value of real estate in certain markets served by the Banks, the FDIC will in the future further increase deposit insurance assessment levels.
Temporary Liquidity Guarantee Program. On November 21, 2008 the Board of Directors of the FDIC adopted a Final Rule relating to the Temporary Liquidity Guarantee Program (“TLGP”). The TLGP is part of a coordinated effort by the FDIC, the U.S. Department of the Treasury, and the FRB to address unprecedented disruptions in the credit markets and the resultant inability of financial institutions to fund themselves and make loans to creditworthy borrowers. The TLGP provided two limited guarantee programs: the Debt Guarantee Program and the Transaction Account Guarantee Program (“TAGP”). The coverage under the TAGP, if banks elected to participate, insured in full certain noninterest-bearing transaction accounts and NOW accounts by the FDIC until December 31, 2009. Our Banks elected to participate in the TAGP but not the Debt Guarantee Program. The Banks were required to pay an additional ten basis point deposit insurance assessment on any deposit amount in excess of $250,000 that was covered by the TAGP.
9
Table of Contents
In 2009, to assure an orderly phase out of the TAGP, the FDIC announced an optional extension of the TAGP for six months until June 30, 2010. Each insured depository institution that participates in the extended TAGP is subject to increased fees during the six month extension period for the FDIC’s guarantee of qualifying accounts. The additional fee that applies during the six month extension period increases from ten basis points to either 15, 20, or 25 basis points depending on the entity’s risk category. Our Banks have all elected to participate in the extension of the TAGP.
Capital Requirements. The FDIC has promulgated regulations and adopted a statement of policy regarding the capital adequacy of state-chartered banks, which, like the Banks, are not members of the Federal Reserve System. These requirements are substantially similar to those adopted by the FRB regarding bank holding companies, as described above.
Moreover, the federal banking agencies have promulgated substantially similar regulations to implement the system of prompt corrective action established by Section 38 of the Federal Deposit Insurance Act (“FDIA”). Under the regulations, a bank generally shall be deemed to be:
| • | “well capitalized” if it has a total risk-based capital ratio of 10.0% or greater, has a Tier I risk-based capital ratio of 6.0% or more, has a leverage ratio of 5.0% or greater and is not subject to any written agreement, order or capital directive or prompt corrective action directive; |
| • | “adequately capitalized” if it has a total risk-based capital ratio of 8.0% or greater, a Tier I risk-based capital ratio of 4.0% or more, and a leverage ratio of 4.0% or greater (3.0% under certain circumstances) and does not meet the definition of a “well capitalized bank;” |
| • | “undercapitalized” if it has a total risk-based capital ratio that is less than 8.0%, a Tier I risk-based capital ratio that is less than 4.0% or a leverage ratio that is less than 4.0% (3.0% under certain circumstances); |
| • | “significantly undercapitalized” if it has a total risk-based capital ratio that is less than 6.0%, a Tier I risk-based capital ratio that is less than 3.0% or a leverage ratio that is less than 3.0%; and |
| • | “critically undercapitalized” if it has a ratio of tangible equity to total assets that is equal to or less than 2.0%. |
An institution generally must file a written capital restoration plan which meets specified requirements with an appropriate FDIC regional director within 45 days of the date that the institution receives notice or is deemed to have notice that it is undercapitalized, significantly undercapitalized or critically undercapitalized. An institution, which is required to submit a capital restoration plan, must concurrently submit a performance guaranty by each company that controls the institution. A critically undercapitalized institution generally is to be placed in conservatorship or receivership within 90 days unless the FDIC formally determines that forbearance from such action would better protect the Deposit Insurance Fund.
Immediately upon becoming undercapitalized, an institution becomes subject to the prompt corrective action provisions of Section 38 of the FDIA, that for example, (i) restrict payment of capital distributions and management fees, (ii) require that the FDIC monitor the condition of the institution and its efforts to restore its capital, (iii) require submission of a capital restoration plan, (iv) restrict the growth of the institution’s assets and (v) require prior regulatory approval of certain expansion proposals.
At December 31, 2009, each of the Banks, except for the Company’s Southern California and Pacific Northwest subsidiaries, was deemed to be a well capitalized institution for the above purposes. Regulators may raise capital requirements applicable to banking organizations above current levels. We are unable to predict whether higher capital requirements will be imposed and, if so, at what levels and on what schedules. Therefore, we cannot predict what effect such higher requirements may have on us. As discussed above, the Banks would be required to remain well-capitalized institutions at all times if we elected to be treated as a FHC.
10
Table of Contents
The Company’s Southern California and Pacific Northwest subsidiaries were considered adequately capitalized as of December 31, 2009 and remain adequately capitalized as of the date of this Report. Although the Company and all of the Banks within the segment maintain capital at levels that would otherwise be considered “well capitalized” under the applicable regulations, for supervisory reasons, the Southern California and Pacific Northwest banks, and therefore the Company, are not deemed “well capitalized.”
Brokered Deposits. Section 29 of the FDIA and FDIC regulations generally limit the ability of an insured depository institution to accept, renew or roll over any brokered deposit unless the institution’s capital category is “well capitalized” or, with the FDIC’s approval, “adequately capitalized.” These restrictions have not in the past had a material impact on the operations of the Banks. Under amendments to FDIC regulations effective in 2009, depository institutions, other than those in the lowest risk category, that have brokered deposits in excess of 10% of total deposits will be subject to increased FDIC deposit insurance premium assessments. Under an amendment to the FDIC regulations effective in 2010, depository institutions considered “adequately capitalized” that need FDIC approval to accept, renew or roll over any brokered deposits are subject to additional restrictions on the interest rate they may pay on deposits.
Activities and Investments of Insured State-Chartered Banks. Section 24 of the FDIA generally limits the investment activities of FDIC-insured, state-chartered banks, (including Boston Private Bank, Borel, FPB, and Charter), when acting as principal to those that are permissible for national banks. In 1999, the FDIC revised its regulations implementing Section 24 of the FDIA to ease the ability of FDIC-insured state-chartered banks to engage in certain activities not permissible for national banks, and to expedite FDIC review of bank applications and notices to engage in such activities.
Further, the GLBA permits national banks and state banks, to the extent permitted under state law, to engage through “financial subsidiaries” in certain new activities which are permissible for subsidiaries of a FHC. Further, it expressly preserves the ability of national banks and state banks to retain all existing subsidiaries. In order to form a financial subsidiary, a national bank or state bank must be well capitalized, and such banks would be subject to certain capital deduction, risk management and affiliate transaction rules, among other things. Also, the FDIC’s final rules governing the establishment of financial subsidiaries adopt the position that activities that a national bank could engage in only through a financial subsidiary, such as securities underwriting, may be conducted only in a financial subsidiary by a state nonmember bank. However, activities that a national bank could not engage in through a financial subsidiary, such as real estate development or investment, continue to be governed by the FDIC’s standard activities rules. Moreover, to mirror the FRB’s actions with respect to state member banks, the final rules provide that a state bank subsidiary that engages only in activities that the bank could engage in directly (regardless of the nature of the activities) will not be deemed to be a financial subsidiary.
Transactions with Affiliates. Under Sections 23A and 23B of the Federal Reserve Act and Regulation W promulgated thereunder, there are various legal restrictions on the extent to which a bank holding company, such as BPFH, and its non-bank subsidiaries may borrow, obtain credit from or otherwise engage in “covered transactions” with its FDIC insured depository institution subsidiaries. Such borrowings and other covered transactions by an insured depository institution subsidiary (and its subsidiaries) with its non-depository institution affiliates are limited to the following amounts:
| • | in the case of one such affiliate, the aggregate amount of covered transactions of the insured depository institution and its subsidiaries cannot exceed 10% of the capital stock and surplus of the insured depository institution; and |
| • | in the case of all affiliates, the aggregate amount of covered transactions of the insured depository institution and its subsidiaries cannot exceed 20% of the capital stock and surplus of the insured depository institution. |
“Covered transactions” are defined by statute for these purposes to include a loan or extension of credit to an affiliate, a purchase of or investment in securities issued by an affiliate, a purchase of assets from an affiliate unless
11
Table of Contents
exempted by the FRB, the acceptance of securities issued by an affiliate as collateral for a loan or extension of credit to any person or company, or the issuance of a guarantee, acceptance, or letter of credit on behalf of an affiliate. Covered transactions are also subject to certain collateral security requirements.
Lending Restrictions. Federal law limits a bank’s authority to extend credit to its directors, executive officers and 10% stockholders, as well as to entities controlled by such persons. Among other things, extensions of credit to insiders are required to be made on terms that are substantially the same as, and follow credit underwriting procedures that are not less stringent than, those prevailing for comparable transactions with unaffiliated persons. Also, the terms of such extensions of credit may not involve more than the normal risk of repayment or present other unfavorable features and may not exceed certain limitations on the amount of credit extended to such persons, individually and in the aggregate, which limits are based, in part, on the amount of the bank’s capital.
A bank holding company and its subsidiaries are subject to prohibitions on certain tying arrangements. These institutions are prohibited, subject to some exceptions, from extending credit to or offering any other service, or fixing or varying the consideration for such extension of credit or service, on the condition that the customer obtain some additional service from the institution or its affiliates or not obtain services of a competitor of the institution.
Consumer Protection Laws. The Company is subject to a number of federal and state laws designed to protect consumers and prohibit unfair or deceptive business practices. These laws include the Equal Credit Opportunity Act, Fair Housing Act, Home Ownership Protection Act, Fair Credit Reporting Act, as amended by the Fair and Accurate Credit Transactions Act of 2003 (“FACT Act”), GLBA, Truth in Lending Act, Community Reinvestment Act (the “CRA”), the Home Mortgage Disclosure Act, Real Estate Settlement Procedures Act, National Flood Insurance Act and various state law counterparts. These laws and regulations mandate certain disclosure requirements and regulate the manner in which financial institutions must interact with customers when taking deposits, making loans, collecting loans and providing other services. Failure to comply with these laws and regulations can subject financial institutions to enforcement actions, fines and other penalties.
Community Reinvestment Act. The CRA requires the FDIC to evaluate the Banks’ performance in helping to meet the credit needs of their entire communities, including low and moderate-income neighborhoods, consistent with their safe and sound banking operations, and to take this record into consideration when evaluating certain applications. The CRA does not establish specific lending requirements or programs for financial institutions, nor does it limit an institution’s discretion to develop the type of products and services that it believes are best suited to its particular community, consistent with the purposes of the CRA. Massachusetts has also enacted a similar statute that requires the Commissioner to evaluate the performance of the Banks, such as Boston Private Bank, in helping to meet the credit needs of its entire community and to take that record into account in considering certain applications.
The FDIC’s CRA regulations are generally based upon objective criteria of the performance of institutions under three key assessment tests: (i) a lending test, to evaluate the institution’s record of making loans in its service areas; (ii) an investment test, to evaluate the institution’s record of investing in community development projects, affordable housing, and programs benefiting low or moderate income individuals and businesses; and (iii) a service test, to evaluate the institution’s delivery of services through its branches, ATMs, and other offices. Each of the Banks currently has either a “satisfactory” or “outstanding” CRA rating. In 2005, the federal banking agencies adopted less burdensome CRA requirements for “intermediate—small banks,” which are banks with $250 million or more, but less than $1 billion in total assets in either of the two prior calendar years (adjusted annually for inflation), including the Southern California and Pacific Northwest subsidiaries. Under these new requirements, such banks are examined using only two tests, a Lending Test and a new Community Development Test, and are relieved of certain data collection and reporting requirements.
Customer Information Security. The FDIC and other bank regulatory agencies have adopted final guidelines for establishing standards for safeguarding nonpublic personal information about customers. These guidelines implement provisions of the GLBA. Specifically, the Information Security Guidelines established by the GLBA
12
Table of Contents
require each financial institution, under the supervision and ongoing oversight of its Board of Directors or an appropriate committee thereof, to develop, implement and maintain a comprehensive written information security program designed to ensure the security and confidentiality of customer information (as defined under GLBA), to protect against anticipated threats or hazards to the security or integrity of such information; and to protect against unauthorized access to or use of such information that could result in substantial harm or inconvenience to any customer. The federal banking regulators have issued guidance for banks on response programs for unauthorized access to customer information. This guidance, among other things, requires notice to be sent to customers whose “sensitive information” has been compromised if unauthorized use of this information is “reasonably possible.” Most of the states, including the states where the Company maintains banking operations, have enacted legislation concerning breaches of data security and the duties of the Banks in response to a data breach. Congress continues to consider federal legislation that would require consumer notice of data security breaches. In addition, Massachusetts has promulgated data security regulations, that became effective March 1, 2010, with respect to personal information of Massachusetts residents.
Identity Theft Red Flags. The federal banking agencies jointly issued final rules and guidelines in 2007 implementing Section 114 of the FACT Act and final rules implementing Section 315 of the FACT Act. The rules implementing Section 114 require each financial institution or creditor to develop and implement a written Identity Theft Prevention Program (the “Program”) to detect, prevent, and mitigate identity theft in connection with the opening of certain accounts or certain existing accounts. In addition, the federal banking agencies issued guidelines to assist financial institutions and creditors in the formulation and maintenance of a Program that satisfies the requirements of the rules. The rules implementing Section 114 also require credit and debit card issuers to assess the validity of notifications of changes of address under certain circumstances. Additionally, the federal banking agencies issued joint rules, that became effective in 2008, under Section 315 that provide guidance regarding reasonable policies and procedures that a user of consumer reports must employ when a consumer reporting agency sends the user a notice of address discrepancy.
Privacy. The GLBA requires financial institutions to implement policies and procedures regarding the disclosure of nonpublic personal information about consumers to nonaffiliated third parties. In general, the statute requires financial institutions to explain to consumers their policies and procedures regarding the disclosure of such nonpublic personal information, and, except as otherwise required or permitted by law, financial institutions are prohibited from disclosing such information except as provided in their policies and procedures. The Banks are required to provide notice to their customers on an annual basis disclosing their policies and procedures on the sharing of nonpublic personal information. In December 2009, the federal banking agencies promulgated regulations that incorporate a two-page model form that financial institutions may use to satisfy their privacy disclosure obligations under GLBA. These regulations are effective in January 2011.
Anti-Money Laundering and the Bank Secrecy Act. Under the Bank Secrecy Act (“BSA”), a financial institution, is required to have systems in place to detect certain transactions, based on the size and nature of the transaction. Financial institutions are generally required to report to the United States Treasury any cash transactions involving more than $10,000. In addition, financial institutions are required to file suspicious activity reports for transactions that involve more than $5,000 and which the financial institution knows, suspects or has reason to suspect involves illegal funds, is designed to evade the requirements of the BSA or has no lawful purpose. The USA PATRIOT Act of 2001 (the “PATRIOT Act”), which amended the BSA, is designed to deny terrorists and others the ability to obtain anonymous access to the U.S. financial system. The PATRIOT Act has significant implications for financial institutions and businesses of other types involved in the transfer of money. The PATRIOT Act, together with the implementing regulations of various federal regulatory agencies, has caused financial institutions, such as the Banks, to adopt and implement additional policies or amend existing policies and procedures with respect to, among other things, anti-money laundering compliance, suspicious activity, currency transaction reporting, customer identity verification and customer risk analysis. In evaluating an application under Section 3 of the BHCA to acquire a bank or an application under the Bank Merger Act to merge banks or affect a purchase of assets and assumption of deposits and other liabilities, the applicable federal banking regulator must consider the anti-money laundering compliance record of both the applicant and the
13
Table of Contents
target. In 2006, final regulations under the PATRIOT Act were issued requiring financial institutions, including the Banks, to take additional steps to monitor their correspondent banking and private banking relationships as well as their relationships with “shell banks.”
OFAC. The United States has imposed economic sanctions that affect transactions with designated foreign countries, nationals and others. These sanctions, which are administered by the Treasury Office of Foreign Assets Control (“OFAC”), take many different forms. Generally, however, they contain one or more of the following elements: (i) restrictions on trade with or investment in a sanctioned country, including prohibitions against direct or indirect imports from and exports to a sanctioned country and prohibitions on “U.S. persons” engaging in financial transactions relating to making investments in, or providing investment-related advice or assistance to, a sanctioned country; and (ii) a blocking of assets in which the government or specially designated nationals of the sanctioned country have an interest, by prohibiting transfers of property subject to U.S. jurisdiction (including property in the possession or control of U.S. persons). Blocked assets (for example, property and bank deposits) cannot be paid out, withdrawn, set off or transferred in any manner without a license from OFAC. Failure to comply with these sanctions could have serious legal and reputational consequences for the Company.
FDIC Restrictions on Bank Dividends. The FDIC has the authority to use its enforcement powers to prohibit a bank from paying dividends if, in its opinion, the payment of dividends would constitute an unsafe or unsound practice. Federal law also prohibits the payment of dividends by a bank that will result in the bank failing to meet its applicable capital requirements on a pro forma basis. In addition, currently the Company’s Southern California subsidiary may not pay cash dividends without the prior written approval of the FDIC and the CDFI, and the Company’s Pacific Northwest subsidiary may not pay cash dividends without the prior written approval of the FDIC and the WDFI.
Massachusetts Law—Dividends. Under Massachusetts law the board of directors of a trust company, such as our New England subsidiary, may declare from “net profits” cash dividends no more often than quarterly, provided that there is no impairment to the trust company’s capital stock. Moreover, prior Commissioner approval is required if the total of all dividends declared by a trust company in any calendar year would exceed the total of its net profits for that year combined with its retained net profits for the previous two years, less any required transfer to surplus or a fund for the retirement of any preferred stock.
Washington Law—Dividends. Under Washington law a bank may not declare or pay any dividend greater than its retained earnings without approval from the director of the WDFI. As noted above, currently the Company’s Pacific Northwest subsidiary may not declare or pay cash dividends without prior written consent of the WDFI.
California Law-Dividends. Under California law a bank may declare dividends out of funds legally available for such purpose. Under the California Financial Code, funds available for cash dividends are restricted to the lesser of: (i) the bank’s retained earnings; or (ii) the bank’s net income for its last three fiscal years (less any distributions to stockholders made during such period). With the prior approval of the CDFI, cash dividends may also be paid out of the greater of: (a) the bank’s retained earnings; (b) net income for the bank’s last preceding fiscal year; or (c) net income or the bank’s current fiscal year. If the CDFI determines that the stockholders’ equity of the bank paying the dividend is not adequate or that the payment of the dividend would be unsafe or unsound for the bank, the CDFI may order the bank not to pay the dividend. As noted above, currently the Company’s Southern California subsidiary may not declare or pay cash dividends without the prior written approval of the CDFI.
Possible Effects of Federal and State Restrictions and Limits on Dividends. The foregoing federal and state restrictions and limits on dividends paid by the Banks to BPFH may restrict BPFH’s ability to pay dividends to its stockholders. We cannot predict future dividend payments by our Banks at this time.
Regulatory Enforcement Authority. The enforcement powers available to federal banking regulators include, among other things, the ability to assess civil money penalties, to issue cease and desist or removal orders to terminate insurance of deposits, to issues directives to increase capital, to issues formal or informal agreements,
14
Table of Contents
to impose a conservator or place the bank into receivership, and to initiate injunctive actions against banking organizations and institution-affiliated parties, as defined. In general, these enforcement actions may be initiated for violations of law and regulations and unsafe or unsound practices. Other actions or inactions may provide the basis for enforcement action, including misleading or untimely reports filed with regulatory authorities. Under certain circumstances, federal and state law requires public disclosure and reports of certain criminal offenses and also final formal enforcement actions by the federal banking agencies.
Securities Law Issues. The GLBA also amended the federal securities laws to eliminate the blanket exceptions that banks traditionally have had from the definition of “broker,” “dealer” and “investment adviser” under the Exchange Act. The GLBA provided 11 exceptions from the definition of “broker” in Section 3(a)(4) of the Securities Exchange Act of 1934 (the “Exchange Act”) that permit banks not to register as broker-dealers with the Securities and Exchange Commission (the “SEC”) to effect securities transactions under certain conditions. Regulation R, which was issued jointly by the SEC and the FRB, implements certain of these exceptions. The Banks’ compliance with Regulation R became mandatory in the fourth quarter of 2008.
Regulation of Nondepository Trust Companies
BPFH indirectly owns a 70.1% interest in DTC. DTC is a Pennsylvania non-depository trust company that is subject to regulation by the Pennsylvania Department of Banking. DTC must maintain total equity capital and liquid assets in the amount of $2 million. DTC is prohibited from paying cash dividends or making other capital distributions that would cause DTC’s total equity capital or liquid assets to be less than $2 million.
Government Policies and Legislative and Regulatory Proposals
The operations of the Banks are generally affected by the economic, fiscal, and monetary policies of the U.S. and its agencies and regulatory authorities, particularly the FRB which regulates the money supply of the U.S., reserve requirements against deposits, the discount rate on FRB borrowings and related matters, and which conducts open-market operations in U.S. government securities. The fiscal and economic policies of various governmental entities and the monetary policies of the FRB have a direct effect on the availability, growth, and distribution of bank loans, investments, and deposits. In late 2008 and 2009, because of economic turmoil in the credit markets, a sharp decline in real estate values and general economic recessionary conditions, Congress, the Treasury and the FRB took significant steps, including the TARP discussed above, to stabilize U.S. economic conditions, credit markets and individual financial institutions.
In addition, various proposals to change the laws and regulations governing the operations and taxation of, and deposit insurance premiums paid by, federally and state-chartered banks and other financial institutions are from time to time pending in Congress and in state legislatures as well as before the FRB, the FDIC and other federal and state bank regulatory authorities. The likelihood of any additional major changes in the future, and the impact any such changes might have on our banking subsidiaries are not possible to determine.
Government Regulation of Other Activities
Virtually all aspects of the Company’s Investment Management and Wealth Advisory businesses are subject to extensive regulation. Certain subsidiaries of the Company are registered with the SEC as investment advisers under the Investment Advisers Act of 1940, as amended (the “Investment Advisers Act”). As an investment adviser, each is subject to the provisions of the Investment Advisers Act and the SEC’s regulations promulgated thereunder. The Investment Advisers Act imposes numerous obligations on registered investment advisers, including fiduciary, recordkeeping, operational, and disclosure obligations. Certain subsidiaries of the Company are also subject to regulation under the securities laws and fiduciary laws of certain states. Each of the mutual funds for which the Investment Managers act as sub-adviser is registered with the SEC under the Investment Company Act of 1940, as amended (the “1940 Act”). Shares of each such fund are registered with the SEC under the Securities Act, and the shares of each fund are qualified for sale (or exempt from such qualification) under the laws of each state and the District of Columbia to the extent such shares are sold in any of such jurisdictions.
15
Table of Contents
The Company is also subject to the Employee Retirement Income Security Act of 1974 (“ERISA”), and to regulations promulgated thereunder, insofar as it is a “fiduciary” under ERISA with respect to certain of its clients. ERISA and the applicable provisions of the Internal Revenue Code of 1986, as amended (the “Code”) impose certain duties on persons who are fiduciaries under ERISA, and prohibit certain transactions by the fiduciaries (and certain other related parties) to such plans.
As sub-adviser to registered investment companies, the Investment Managers are subject to requirements under the 1940 Act and the SEC’s regulations promulgated thereunder. Under the Investment Advisers Act, every investment advisory contract between a registered investment adviser and its clients must provide that it may not be assigned by the investment adviser without the consent of the client. In addition, under the 1940 Act, each contract with a registered investment company must provide that it terminates upon its assignment. Under both the Investment Advisers Act and the 1940 Act, an investment advisory contract is deemed to have been assigned in the case of a direct “assignment” of the contract as well as in the case of a sale, directly or indirectly, of a “controlling block” of the adviser’s voting securities. Such an assignment may be deemed to take place when a firm is acquired by the Company.
The foregoing laws and regulations generally grant supervisory agencies and bodies broad administrative powers, including the power to limit or restrict certain subsidiaries of the Company from conducting their business in the event that they fail to comply with such laws and regulations. Possible sanctions that may be imposed in the event of such noncompliance include the suspension of individual employees, limitations on the business activities for specified periods of time, revocation of registration as an investment adviser, commodity trading adviser and/or other registrations, and other censures and fines.
Federal Taxation
The Company and its incorporated affiliate partners are subject to federal income taxation generally applicable to corporations under the Code. In addition, the Banks are subject to Subchapter H of the Code, which provides specific rules for the treatment of securities, reserves for loan losses, and any common trust funds.
The Company and its incorporated affiliate partners are members of an affiliated group of corporations within the meaning of Section 1504 of the Code and file a consolidated federal income tax return. Some of the advantages of filing a consolidated tax return include the avoidance of tax on intercompany distributions and the ability to offset operating and capital losses of one company against operating income and capital gains of another company.
The Company’s taxable income includes the taxable income or loss from its subsidiaries that are limited liability companies.
State and Local Taxation
The Company and its affiliates are subject to the tax rate established in the state in which they perform their operations. Substantially all of the Company’s taxable income is derived from the following jurisdictions: Massachusetts, California, New York, and the City of New York.
The Massachusetts tax rate is 10.50% on taxable income apportioned to Massachusetts. Massachusetts’ taxable income is defined as federal taxable income subject to certain modifications. The Company believes these modifications allow for a deduction for 95% of dividends received from stock in which the entity owns 15% or more of the voting stock of the institution paying the dividend and to allow deductions for certain expenses allocated to federally tax exempt obligations. Combined reporting was not permitted under Massachusetts statutes for financial institutions for 2008 and prior years but is required starting in 2009. The tax rate will decrease to 10.0% for 2010, 9.5% for 2011 and 9.0% for 2012 and beyond.
16
Table of Contents
The California tax rate is 8.84% for corporations that are not financial institutions and 10.84% for financial institutions. The California tax is on California taxable income, which is defined as federal taxable income subject to certain modifications. Such modifications are not significant with respect to the Company’s California taxable income.
The New York state tax rate is 7.1% on taxable income apportioned to New York, plus a surcharge for business operations in the Metropolitan Commuter Transportation district.
The New York City tax rate is 9.0% on taxable income apportioned to New York City.
The Company’s Internet address is www.bostonprivate.com. The Company makes available on or through its Internet website, without charge, its annual reports on Form 10-K, quarterly reports on Form 10-Q, and current reports on Form 8-K and amendments to those reports filed or furnished pursuant to Section 13(a) or 15(d) of the Securities Exchange Act of 1934, as amended, as soon as reasonably practicable after such reports are electronically filed with, or furnished to, the SEC. The Company’s reports filed with, or furnished to, the SEC are also available at the SEC’s website at www.sec.gov. The quarterly earnings release conference call can also be accessed from the Company’s website. Press releases are also maintained on the Company’s website. Information on our website is not incorporated by reference into this document and should not be considered part of this Report.
| ITEM 1A. | RISK FACTORS |
Before deciding to invest in us or deciding to maintain or increase your investment, you should carefully consider the risks described below, in addition to the other information contained in this report and in our other filings with the SEC. The risks and uncertainties described below and in our other filings are not the only ones facing us. Additional risks and uncertainties not presently known to us or that we currently deem immaterial may also affect our business. If any of these known or unknown risks or uncertainties actually occurs, our business, financial condition and results of operations could be seriously harmed. In that event, the market price for our common stock could decline and you may lose your investment.
Recent market volatility has impacted and may continue to impact our business.
The performance of our business has been and may continue to be affected by many factors including the recent volatility in the credit, mortgage and housing markets, the markets for securities relating to mortgages or housing, and with respect to financial institutions generally. Government action may also affect the business performance of our Company. Given the unprecedented nature of this volatility, we cannot predict what impact, if any, this volatility will have on our business which will subsequently affect the price of our common stock.
Market conditions and other factors have affected and may continue to affect the value of our common stock.
The trading price of the shares of our common stock will depend on many factors, which may change from time to time, including recent market volatility and:
| • | conditions in the credit, mortgage and housing markets, the markets for securities relating to mortgages or housing, and developments with respect to financial institutions generally; |
| • | interest rates; |
| • | the market for similar securities; |
| • | government action or regulation; |
| • | general economic conditions or conditions in the financial markets; |
17
Table of Contents
| • | our past and future dividend practices; and |
| • | our financial condition, performance, creditworthiness and prospects. |
As a result of changes in any of the foregoing factors, the shares of common stock that an investor purchases may trade at a price lower than that at which they were purchased.
The market price and trading volume of our common stock may be volatile.
The market price of our common stock may be volatile. In addition, the trading volume in our common stock may fluctuate and cause significant price variations to occur. We cannot assure you that the market price of our common stock will not fluctuate or decline significantly in the future. A significant decrease in the market price of our common stock could be considered a triggering event for goodwill impairment testing under Financial Accounting Standards Board (“FASB”) Accounting Standards Codification (“ASC”) No. 350, Intangibles—Goodwill and Other.
Some of the factors that could negatively affect our share price or result in fluctuations in the price or trading volume of our common stock include:
| • | quarterly variations in our operating results or the quality of our assets; |
| • | operating results that vary from the expectations of management, securities analysts and investors; |
| • | changes in expectations as to our future financial performance; |
| • | announcements of innovations, new products, strategic developments, significant contracts, acquisitions and other material events by us or our competitors; |
| • | the operating and securities price performance of other companies that investors believe are comparable to us; |
| • | future sales of our equity or equity-related securities; and |
| • | changes in global financial markets and global economies and general market conditions, such as interest or foreign exchange rates, stock, commodity or real estate valuations or volatility. |
If we are required to write down goodwill and other intangible assets, our financial condition and results of operations would be negatively affected.
When we acquire a business, a substantial portion of the purchase price of the acquisition could be allocated to goodwill and other identifiable intangible assets. The amount of the purchase price which is allocated to goodwill is determined by the excess of the purchase price over the net identifiable assets acquired. At December 31, 2009, our goodwill and other identifiable intangible assets were approximately $150.1 million. Under current accounting standards, if we determine goodwill or intangible assets are impaired, we will be required to write down the value of these assets. We conduct an annual review to determine whether goodwill and other identifiable intangible assets are impaired.
Our goodwill and intangible assets are tested for impairment annually in the fourth quarter at the reporting unit level. In addition, an impairment test could be triggered between annual testing dates if an event occurs or circumstances change that would more likely than not reduce the fair value below the carrying amount. Examples of those events or circumstances include the following:
| • | significant adverse change in business climate; |
| • | significant decrease in stock price and/or market capitalization; |
| • | significant unanticipated loss of clients/assets under management; |
| • | loss of key personnel; |
| • | sustained periods of poor investment performance; |
| • | significant loss of deposits or loans; |
18
Table of Contents
| • | significant reductions in profitability; |
| • | significant changes in loan credit quality; |
| • | potential sale or disposal of an affiliate; and |
| • | adverse action or assessment by a regulator. |
We have taken impairment charges at various times in 2007, 2008 and 2009. We cannot assure you that we will not be required to take further impairment charges in the future. Any impairment charge would have a negative effect on our stockholders’ equity and financial results.
In connection with our acquisitions and divestitures, and to the extent that we acquire or divest other companies in the future, our business may be negatively impacted by certain risks inherent in such transactions.
At this time, we do not intend to make acquisitions or further divestitures of other private banking, investment management, and wealth advisory companies in the foreseeable future. With respect to our past acquisitions, our business may be negatively impacted by certain risks inherent in such acquisitions. These risks include, but are not limited to, the following:
| • | the risk that we may lose key clients or employees of the acquired business as a result of the change of ownership to us; |
| • | the risk that the acquired business will not perform in accordance with our expectations; |
| • | the risk that difficulties will arise in connection with the integration of the operations of the acquired business with the operations of our private banking, investment management, or wealth advisory businesses, particularly to the extent we are entering new geographic markets; |
| • | the risk that we will need to make significant investments in infrastructure, controls, staff, emergency backup facilities or other critical business functions that become strained by our growth; |
| • | the risk that management will divert its attention from other aspects of our business; |
| • | the risk associated with entering into geographic and product markets in which we have limited or no direct prior experience; |
| • | the risk that we may assume potential liabilities of the acquired company as a result of the acquisition; and |
| • | the risk that an acquisition will dilute our earnings per share, in both the short and long term, or that it will reduce our tangible capital ratios. |
With respect to our past divestitures, our business may be negatively impacted by the risk that our business reputation may be adversely impacted or the risk that a divestiture will not have the anticipated positive impact on our consolidated balance sheets, consolidated statements of operations, and consolidated statements of cash flows.
Our deferred tax assets may not ultimately be realized or our tax positions may be subject to challenge by the IRS.
Our deferred tax assets may provide significant future tax savings to the Company. Our use of these deferred tax benefits may depend on a number of factors including the ability of the Company to generate significant future taxable income; the character of that income (ordinary versus capital); the absence of a future ownership change of the Company that could limit or eliminate the tax benefits; the acceptance by the taxing authorities of the positions taken on our tax returns as to the amount and timing of our income and expenses; and future changes in laws or regulations relating to tax deductions and net operating losses.
We assess the likelihood that deferred tax assets will be realizable based on future taxable income and, if necessary, establish a valuation allowance for those deferred tax assets determined to not likely be realizable. Management judgment is required in determining the appropriate recognition of deferred tax
19
Table of Contents
assets and liabilities, including projections of future taxable income, as well as the character of that income. There can be no absolute assurance however, that the net deferred assets will ultimately be realized.
We utilize a decentralized management structure, which may affect our ability to manage and control our subsidiaries.
Our subsidiaries have localized management teams. This decentralized structure gives the subsidiaries control over the day-to-day management of their business, including credit decisions, the selection of personnel, the pricing of loans and deposits, marketing decisions and the strategy in handling problem loans. This structure may affect our ability to manage and control our subsidiaries and implement corporate or enterprise-wide strategy and procedures at the subsidiary level.
We may be unable to attract and retain key personnel.
Our success depends, in large part, on our ability to attract and retain key personnel. Competition for the best people can be intense and we may not be able to hire or retain the key personnel that we depend upon for success. The unexpected loss of services of one or more of our key personnel could have a material adverse impact on our business because of their skills, knowledge of the markets in which we operate, years of industry experience and the difficulty of promptly finding qualified replacement personnel. Further, as described below, we are currently participating in the Treasury’s Capital Purchase Program. As a result, the Company is subject to certain limitations on executive compensation that could limit our ability to attract and retain key executive management personnel.
Competition in the local banking industry may impair our ability to attract and retain banking customers at current levels.
Competition in the local banking industry coupled with our relatively small size may limit the ability of our private banking affiliate partners to attract and retain banking customers.
In particular, the Banks’ competitors include several major financial companies whose greater resources may afford them a marketplace advantage by enabling them to maintain numerous banking locations and mount extensive promotional and advertising campaigns. Additionally, banks and other financial institutions with larger capitalization and financial intermediaries not subject to bank regulatory restrictions have larger lending limits and are able to serve the credit and investment needs of larger customers. Areas of competition include interest rates for loans and deposits, efforts to obtain deposits, and range and quality of services provided. Our Banks also face competition from out-of-state financial intermediaries which have opened low-end production offices or which solicit deposits in their respective market areas.
Because our Banks maintain smaller staffs and have fewer financial and other resources than larger institutions with which they compete, they may be limited in their ability to attract customers. In addition, some of the Banks’ current commercial banking customers may seek alternative banking sources as they develop needs for credit facilities larger than our Banks can accommodate.
If our Banks are unable to attract and retain banking customers, they may be unable to continue their loan growth and their results of operations and financial condition may otherwise be negatively impacted.
Fluctuations in interest rates may negatively impact our banking business.
Fluctuations in interest rates may negatively impact the business of our Banks. Our Banks’ main source of income from operations is net interest income, which is equal to the difference between the interest income received on interest-bearing assets (usually loans and investment securities) and the interest expense incurred in connection with interest-bearing liabilities (usually deposits and borrowings). These rates are highly sensitive to many factors beyond our control, including general economic conditions, both domestic and foreign, and the monetary and fiscal policies of various governmental and regulatory authorities. Our Banks’ net interest income can be affected significantly by changes in market interest rates. Changes in relative interest rates may reduce our Banks’ net interest income as the difference between interest income and interest expense decreases. As a result, our Banks have adopted asset and liability management policies
20
Table of Contents
to minimize the potential adverse effects of changes in interest rates on net interest income, primarily by altering the mix and maturity of loans, investments funding sources, and derivatives. However, even with these policies in place, a change in interest rates can impact our results of operations or financial condition.
An increase in interest rates could also have a negative impact on our Banks’ results of operations by reducing the ability of borrowers to repay their current loan obligations, which could not only result in increased loan defaults, foreclosures and write-offs, but also necessitate further increases to the Banks’ allowances for loan losses. Fluctuations in interest rates, in certain circumstances, may also lead to high levels of loan prepayments, which may also have an adverse impact on our net interest income.
Our cost of funds for banking operations may increase as a result of general economic conditions, interest rates and competitive pressures.
Our Banks have traditionally obtained funds principally through deposits and through borrowings. As a general matter, deposits are a cheaper source of funds than borrowings, because interest rates paid for deposits are typically less than interest rates charged for borrowings. Historically and in comparison to commercial banking averages, our Banks have had a higher percentage of their time deposits in denominations of $100,000 or more. Within the banking industry, the amounts of such deposits are generally considered more likely to fluctuate than deposits of smaller denominations. If, as a result of general economic conditions, market interest rates, competitive pressures or otherwise, the value of deposits at our Banks decreases relative to their overall banking operations, our Banks may have to rely more heavily on borrowings as a source of funds in the future.
Defaults in the repayment of loans may require additional loan loss reserves and negatively impact our business.
A borrower’s default on its obligations under one or more of the Banks’ loans may result in lost principal and interest income and increased operating expenses as a result of the allocation of management time and resources to the collection and work-out of the loan.
In certain situations, where collection efforts are unsuccessful or acceptable work-out arrangements cannot be reached, our Banks may have to write-off the loan in whole or in part. In such situations, the Banks may acquire real estate or other assets, if any, which secure the loan through foreclosure or other similar available remedies. In such cases, the amount owed under the defaulted loan often exceeds the value of the assets acquired.
Our Banks’ management periodically makes a determination of an allowance for loan losses based on available information, including the quality of their loan portfolio, certain economic conditions, and the value of the underlying collateral and the level of its non-accruing and criticized loans. We rely on our loan quality reviews, our experience and our evaluation of economic conditions, among other factors, in determining the amount of provision required for the allowance for loan losses. Provisions to this allowance result in an expense for the period. If, as a result of general economic conditions, previously incorrect assumptions, or an increase in defaulted loans, management determines that additional increases in the allowance for loan losses are necessary, the Banks will incur additional expenses.
If it is determined that a Bank should sell certain loans or a portfolio of loans, we are required to classify those loans as “held for sale” which requires us to carry such loans at the lower of cost or market. If we decide to sell loans at a time when the fair value of those loans is less than their carrying value, the adjustment will result in a loss. We may from time to time decide to sell particular loans or groups of loans, and the required adjustment could negatively affect our financial condition or results of operations.
In addition, bank regulatory agencies periodically review our Banks’ allowances for loan losses and the values they attribute to real estate acquired through foreclosure or other similar remedies. Such regulatory agencies may require the Banks to adjust their determination of the value for these items. These adjustments could negatively impact our results of operations or financial condition.
21
Table of Contents
A downturn in local economies or real estate markets could negatively impact our banking business.
A downturn in the local economies or real estate markets could negatively impact our banking business. Primarily, our Banks serve individuals and smaller businesses located in four geographic regions: New England, Northern California, Southern California, and the Pacific Northwest. The ability of the Banks’ customers to repay their loans is impacted by the economic conditions in these areas.
The Banks’ commercial loans are generally concentrated in the following customer groups:
| • | real estate developers and investors; |
| • | financial service providers; |
| • | technology companies; |
| • | manufacturing and communications companies; |
| • | professional service providers; |
| • | general commercial and industrial companies; and |
| • | individuals. |
Our Banks’ commercial loans, with limited exceptions, are secured by real estate (usually income producing residential and commercial properties), marketable securities or corporate assets (usually accounts receivable, equipment or inventory). Substantially all of our Banks’ residential mortgage and home equity loans are secured by residential property. Consequently, our Banks’ abilities to continue to originate real estate loans may be impaired by adverse changes in local and regional economic conditions in the real estate markets, or by acts of nature, including earthquakes, hurricanes and flooding. Due to the concentration of real estate collateral in the geographic regions in which we operate, these events could have a material adverse impact on the ability of our Banks’ borrowers to repay their loans and affect the value of the collateral securing these loans.
Collectively, our Banks have a sizable exposure to Commercial Real Estate, particularly in Northern California and New England, and industry analysts have predicted that this specific class of commercial loans may suffer elevated losses across the banking industry.
Environmental liability associated with commercial lending could result in losses.
In the course of business, our Banks may acquire, through foreclosure, properties securing loans they have originated or purchased which are in default. Particularly in commercial real estate lending, there is a risk that hazardous substances could be discovered on these properties. In this event, we, or our Banks, might be required to remove these substances from the affected properties at our sole cost and expense. The cost of this removal could substantially exceed the value of affected properties. We may not have adequate remedies against the prior owner or other responsible parties and could find it difficult or impossible to sell the affected properties. These events could have a material adverse effect on our business, results of operations and financial condition.
Prepayments of loans may negatively impact our business.
Generally, our Banks’ customers may prepay the principal amount of their outstanding loans at any time. The speed at which such prepayments occur, as well as the size of such prepayments, are within our customers’ discretion. If customers prepay the principal amount of their loans, and we are unable to lend those funds to other borrowers or invest the funds at the same or higher interest rates, our interest income will be reduced. A significant reduction in interest income could have a negative impact on our results of operations and financial condition.
22
Table of Contents
Our banking business is highly regulated, which could limit or restrict our activities and impose financial requirements or limitations on the conduct of our business.
Bank holding companies and banks operate in a highly regulated environment and are subject to supervision and examination by federal and state regulatory agencies. We are subject to the BHCA and to regulation and supervision by the Federal Reserve Board. Our Banks are subject to regulation and supervision by their respective federal and state regulatory agencies, which currently include the Massachusetts Commissioner of Banks, the California Department of Financial Institutions, the Washington State Department of Financial Institutions and the FDIC.
Federal and state laws and regulations govern numerous matters including changes in the ownership or control of banks and bank holding companies, maintenance of adequate capital and the financial condition of a financial institution, permissible types, amounts and terms of extensions of credit and investments, permissible nonbanking activities, the level of reserves against deposits and restrictions on dividend payments. The FDIC, the California Department of Financial Institutions, the Washington State Department of Financial Institutions, and the Massachusetts Commissioner of Banks possess the power to issue cease and desist orders to prevent or remedy unsafe or unsound practices or violations of law by banks subject to their regulation, and the Federal Reserve Board possesses similar powers with respect to bank holding companies. These and other restrictions limit the manner in which our Banks and we may conduct business and obtain financing.
We are participating in the Treasury’s CPP, which was developed as part of the TARP. On November 21, 2008, we issued and sold shares of our Series C Preferred, together with the TARP warrants, to the Treasury. In accordance with the terms of the CPP Securities Purchase Agreement with the Treasury with respect to the issuance of the Series C Preferred, our ability to declare or pay dividends or distributions on, or purchase, redeem or otherwise acquire for consideration, shares of our common and preferred stock will be subject to restrictions until the earlier of (a) the third anniversary of the date of issuance of the Series C Preferred and (b) the date on which the Series C Preferred has been redeemed in whole or Treasury has transferred all of the Series C Preferred to third parties. Participation in this Program also imposes certain other limits, including limits relating to executive compensation which could impact our ability to attract and retain key personnel. In addition, the Treasury has the ability to unilaterally amend the terms of the CPP, and may impose additional restrictions or obligations on the Company that could have a negative impact. Our banking business is also affected by the monetary policies of the Federal Reserve Board. Changes in monetary or legislative policies may affect the interest rates our Banks must offer to attract deposits and the interest rates they must charge on their loans, as well as the manner in which they offer deposits and make loans. These monetary policies have had, and are expected to continue to have, significant effects on the operating results of depository institutions generally, including our Banks.
The recent increase in FDIC deposit insurance premiums will increase our non-interest expense.
On December 16, 2008, the FDIC adopted a final rule, which took effect on January 1, 2009, increasing the deposit insurance assessment rate by seven cents per $100 of deposits. On February 27, 2009, the FDIC adopted another final rule, effective as of April 1, 2009, that, among other things, changed the way that the FDIC’s assessment system differentiates for risk and makes corresponding changes to assessment rates. As a result, our base assessment rate increased on April 1, 2009. In addition, in May 2009, the FDIC imposed a special assessment on all insured institutions. The special assessment amounted to 5 basis points on each institution’s assets minus Tier 1 capital as of June 30, 2009, subject to a maximum equal to 10 basis points times the institution’s assessment base. The Banks’ special assessment in the aggregate amounted to $2.5 million. The increase in our deposit insurance premiums will result in an increase in our non-interest expense.
The value of our investment in FHLB stock may be reduced.
The Company’s affiliate Banks are members of the Federal Home Loan Bank (“FHLB”) in the Boston, San Francisco, and Seattle districts (the “FHLBs”). The FHLBs have advised their members that they are focusing on preserving capital in response to ongoing market volatility and, accordingly, there will be little
23
Table of Contents
or no dividend payout in near term quarterly periods. Further, moratoriums have been placed on excess stock repurchases at some of the FHLBs. The Boston FHLB and Seattle FHLB had net losses in 2009. The FHLBs had other-than-temporary impairment charges in 2009 due to decreases in the estimated fair values of private-label mortgage-backed securities they own. If these losses and impairment charges continue, depending upon the severity and the impact on the FHLBs capital position, they could possibly put into question whether the FHLB stock owned by the Company was impaired. The FHLBs have stated that they expect and intend to hold their private-label mortgage-backed securities to maturity. The Company will continue to monitor its investment in FHLB stock.
We may not be able to attract and retain investment management and wealth advisory clients at current levels.
Due to intense competition, our investment management and wealth advisory subsidiaries may not be able to attract and retain clients at current levels. Competition is especially strong in our geographic market areas, because there are numerous well-established and successful investment management and wealth advisory firms in these areas. Many of our competitors have greater resources than we have.
Our ability to successfully attract and retain investment management and wealth advisory clients is dependent upon our ability to compete with competitors’ investment products, level of investment performance, client services and marketing and distribution capabilities. If we are not successful, our results of operations and financial condition may be negatively impacted.
For example, during the years ended December 31, 2009 and 2008, approximately 32% and 38%, respectively, of our segment revenues were derived from investment management and trust fees and wealth advisory contracts. Investment management contracts are typically terminable upon less than 30 days’ notice. Most of our investment management clients may withdraw funds from accounts under management generally in their sole discretion. Wealth advisory client contracts must typically be renewed on an annual basis and are terminable upon relatively short notice. The combined financial performance of our investment management and wealth advisory affiliate partners is a significant factor in our overall results of operations and financial condition.
Our investment management business is highly dependent on people to produce investment returns and to solicit and retain clients.
We rely on our investment managers to produce investment returns. We believe that investment performance is one of the most important factors for the growth of our assets under management. Poor investment performance could impair our revenues and growth because existing clients might withdraw funds in favor of better performing products, which would result in lower investment management fees or our ability to attract funds from existing and new clients might diminish.
The market for investment managers is extremely competitive and is increasingly characterized by frequent movement of investment managers among different firms. In addition, our individual investment managers often have regular direct contact with particular clients, which can lead to a strong client relationship based on the client’s trust in that individual manager. The loss of a key investment manager could jeopardize our relationships with our clients and lead to the loss of client accounts. Losses of such accounts could have a material adverse effect on our results of operations and financial condition.
In addition to the risk of loss of key investment managers, our investment management business is dependent on the integrity of our asset managers and our employees. If an asset manager or employee were to misappropriate any client funds, the reputation of our asset management business could be negatively affected, which may result in the loss of accounts and have a material adverse effect on our results of operations and financial condition.
24
Table of Contents
Our investment management business may be negatively impacted by changes in economic and market conditions.
Our investment management business may be negatively impacted by changes in general economic and market conditions because the performance of such business is directly affected by conditions in the financial and securities markets. The financial markets and businesses operating in the securities industry are highly volatile (meaning that performance results can vary greatly within short periods of time) and are directly affected by, among other factors, domestic and foreign economic conditions and general trends in business and finance, all of which are beyond our control. We cannot assure you that broad market performance will be favorable in the future. The world financial and securities markets will likely continue to experience significant volatility as a result of, among other things, world economic and political conditions. Declines in the financial markets or a lack of sustained growth may result in a corresponding decline in our performance and may adversely affect the assets that we manage.
In addition, our management contracts generally provide for fees payable for investment management services based on the market value of assets under management, although there are a portion of our contracts that provide for the payment of fees based on investment performance in addition to a base fee. Because most contracts provide for a fee based on market values of securities, fluctuations in securities prices may have a material adverse effect on our results of operations and financial condition.
Our investment management and wealth advisory businesses are highly regulated, and the regulators have the ability to limit or restrict our activities and impose fines or suspensions on the conduct of our business.
Our investment management and wealth advisory businesses are highly regulated, primarily at the federal level. The failure of any of our subsidiaries that provide investment management and wealth advisory services to comply with applicable laws or regulations could result in fines, suspensions of individual employees or other sanctions including revocation of such subsidiary’s registration as an investment adviser.
All of our investment managers and wealth advisory affiliate partners, except DTC, are registered investment advisers under the Investment Advisers Act. The Investment Advisers Act imposes numerous obligations on registered investment advisers, including fiduciary, record keeping, operational and disclosure obligations. These subsidiaries, as investment advisers, are also subject to regulation under the federal and state securities laws and the fiduciary laws of certain states. In addition, the affiliate partners acting as sub-advisers to mutual funds are subject to certain provisions and regulations of the Investment Company Act of 1940.
We are also subject to the provisions and regulations of ERISA to the extent that we act as a “fiduciary” under ERISA with respect to certain of our clients. ERISA and the applicable provisions of the federal tax laws, impose a number of duties on persons who are fiduciaries under ERISA and prohibit certain transactions involving the assets of each ERISA plan which is a client, as well as certain transactions by the fiduciaries (and certain other related parties) to such plans.
In addition, applicable law provides that all investment contracts with mutual fund clients may be terminated by the clients, without penalty, upon no more than 60 days notice. Investment contracts with institutional and other clients are typically terminable by the client, also without penalty, upon 30 days notice.
Also, Coldstream Securities, Inc., a wholly-owned subsidiary of Coldstream Holdings, Inc., as a registered broker-dealer, is subject to extensive regulation under federal and state laws, as well as the rules promulgated by the Financial Industry Regulatory Authority.
Changes in these laws or regulations could have a material adverse impact on our profitability and mode of operations.
25
Table of Contents
We are a holding company and depend on our subsidiaries for dividends, distributions and other payments.
We are a separate and distinct legal entity from our banking and nonbanking subsidiaries and depend on dividends, distributions and other payments from our banking and nonbanking subsidiaries to fund dividend payments on our common and preferred stock and to fund all payments on our other obligations. Many of our subsidiaries are subject to laws that authorize regulatory bodies to block or reduce the flow of funds from those subsidiaries to us. Regulatory action of that kind could impede access to funds we need to make payments on our obligations or dividend payments. Additionally, if our subsidiaries’ earnings are not sufficient to make dividend payments to us while maintaining adequate capital levels, we may not be able to make dividend payments to our common and preferred stockholders. Furthermore, our right to participate in a distribution of assets upon a subsidiary’s liquidation or reorganization is subject to the prior claims of the subsidiary’s creditors.
Our stockholders may not receive dividends on the common stock.
Holders of our common stock are entitled to receive dividends only when, as and if declared by our board of directors. Although we have historically declared cash dividends on our common stock, we are not required to do so and our board of directors may reduce or eliminate our common stock dividend in the future. A reduction or elimination of dividends could adversely affect the market price of our common stock. In addition, as noted above, our ability to declare or pay dividends on shares of our common stock is subject to restrictions as a result of our participation in the U.S. Treasury’s TARP Capital Purchase Program.
Future capital offerings may adversely affect the market price of our common stock.
In the future, we may attempt to increase our capital resources or, if our or our banking subsidiaries’ capital ratios fall below the required minimums, we or our banking subsidiaries could be forced to raise additional capital by making additional offerings of debt, common, or preferred equity securities, including medium-term notes, trust preferred securities, senior or subordinated notes and preferred stock. Upon liquidation, holders of our debt securities and shares of preferred stock and lenders with respect to other borrowings will receive distributions of our available assets prior to the holders of our common stock.
Additional equity offerings may dilute the holdings of our existing stockholders or reduce the market price of our common stock, or both. Although holders of our common stock are not entitled to preemptive rights or other protections against dilution, the terms of our Series B Preferred stock do provide for certain anti-dilution adjustments. Because our decision to issue securities in any future offering will depend on market conditions and other factors beyond our control, we cannot predict or estimate the amount, timing or nature of our future offerings.
We cannot assure you that such capital will be available to us on acceptable terms or at all. Our inability to raise sufficient additional capital on acceptable terms when needed could adversely affect our businesses, financial condition and results of operations. Thus, our stockholders bear the risk of our future offerings reducing the market price of our common stock and diluting their stock holdings in us.
Anti-takeover provisions could negatively impact our stockholders.
Provisions of Massachusetts law and provisions of our articles of organization and bylaws could make it more difficult for a third party to acquire control of us or have the effect of discouraging a third party from attempting to acquire control of us. We have a classified board of directors and as such it is subject to the provisions of Massachusetts Business Corporations Act Section 8.06(b), which provides for certain anti-takeover provisions for public companies incorporated in Massachusetts. Additionally, our articles of organization authorize our board of directors to issue preferred stock without stockholder approval and such preferred stock could be issued as a defensive measure in response to a takeover proposal. These provisions could make it more difficult for a third party to acquire us even if an acquisition might be in the best interest of our stockholders.
26
Table of Contents
ITEM 1B. UNRESOLVED STAFF COMMENTS
There are no unresolved written comments that were received from the SEC staff 180 days or more before the end of our fiscal year relating to our periodic or current reports under the Exchange Act.
The Company and its subsidiaries conduct operations in leased premises. The Company’s headquarters are located at Ten Post Office Square, Boston, Massachusetts. The premises are generally located in the vicinity of the headquarters for all of the affiliate partners.
Generally, the initial terms of the leases for these properties range from five to fifteen years. Most of the leases also include options to renew at fair market value for periods of five to ten years. In addition to minimum rentals, certain leases include escalation clauses based upon various price indices and include provisions for additional payments to cover taxes.
Trust Litigation
Beginning in 1984, Borel served as the trustee of a private family trust (the “Trust”) that was the joint owner of a certain real property known as the Guadalupe Oil Field. The field was leased for many years to Union Oil Company of California (d/b/a UNOCAL) for oil and gas production. Significant environmental contamination resulting from UNOCAL’s operations was found on the property in 1994. The subject property was the subject of lengthy litigation brought by certain beneficiaries of the Trust against Borel and others in 1994. In 2002, during the course of that litigation, Borel (as Trustee) sold the property to its former lessee, the Union Oil Company of California (d/b/a UNOCAL) in exchange for cash and a comprehensive indemnity on behalf of the Trust. Litigation with the beneficiaries continued until 2005, when Borel, UNOCAL, and others entered into a comprehensive settlement with all of the beneficiaries, except one, dismissing all of their pending actions in exchange for a payment of cash and other considerations from UNOCAL. Borel paid nothing in the settlement. The dissenting beneficiary attempted to continue the litigation against Borel on his own, acting pro se. The state court dismissed this individual action with prejudice in 2005, whereupon the dissenting beneficiary filed a similar action, again pro se, in the U.S. District Court for the Northern District of California. The federal court dismissed this action with prejudice, and the dissenting beneficiary then unsuccessfully pursued appeals to the Ninth Circuit Court of Appeals and the U.S. Supreme Court. His petition for certiorari was denied in February 2008, concluding the litigation. The 2005 settlement with the other beneficiaries was thereafter consummated. All of the property formerly belonging to the Trust was distributed to separate subtrusts established for each individual beneficiary. Borel is not the trustee of these subtrusts of the litigants. Borel’s petition for termination of the Trust was heard in March 2009. The motion for termination was granted and the order signed on March 18, 2009. Borel was formally discharged as Trustee on June 2, 2009. No further action will be required with respect to this matter.
Other
The Company is also involved in routine legal proceedings occurring in the ordinary course of business. In the opinion of management, final disposition of these proceedings will not have a material adverse effect on the consolidated balance sheets or consolidated statements of operations of the Company.
27
Table of Contents
| ITEM 5. | MARKET FOR REGISTRANT’S COMMON EQUITY, RELATED STOCKHOLDER MATTERS, AND ISSUER PURCHASES OF EQUITY SECURITIES |
The Company’s common stock, par value $1.00 per share, is traded on the NASDAQ Global Select Market (“NASDAQ”) under the symbol “BPFH.” At March 5, 2010, there were 68,792,790 shares of common stock outstanding. The number of holders of record of the Company’s common stock as of March 5, 2010 was 1,285. The Company believes that the number of beneficial owners of its common stock, as of the record date, was greater. The closing price of the Company’s common stock on March 5, 2010 was $7.34.
The following table sets forth the high and low sale prices for the Company’s common stock for the periods indicated, as reported by NASDAQ:
| High | Low | |||||
| Fiscal year ended December 31, 2009 |
||||||
| Fourth Quarter |
$ | 6.73 | $ | 4.55 | ||
| Third Quarter |
7.25 | 4.13 | ||||
| Second Quarter |
6.94 | 3.00 | ||||
| First Quarter |
7.07 | 2.07 | ||||
| Fiscal year ended December 31, 2008 |
||||||
| Fourth Quarter |
$ | 10.66 | $ | 5.01 | ||
| Third Quarter |
13.80 | 4.53 | ||||
| Second Quarter |
11.75 | 5.63 | ||||
| First Quarter |
27.30 | 10.15 | ||||
The Company presently plans to pay cash dividends on its common stock on a quarterly basis dependent upon the results of operations of the immediately preceding quarters. However, declaration of dividends by the Board of Directors of the Company will depend on a number of factors, including capital requirements, liquidity, regulatory limitations, the Company’s operating results and financial condition and general economic conditions.
The Company is a legal entity separate and distinct from its affiliate partners. These affiliate partners are the principal assets of the Company and, as such, provide the main source of payment of dividends by the Company. As to the payment of dividends, as discussed below, each of the Banks is subject to the laws and regulations of its chartering jurisdiction and to the regulations of its primary federal regulator. If the federal banking regulator determines that a depository institution under its jurisdiction is engaged in or is about to engage in an unsafe or unsound practice, the regulator may require, after notice and hearing, that the institution cease and desist from such practice. Depending on the financial condition of the depository institution, an unsafe or unsound practice could include the payment of dividends. The federal banking agencies have indicated that paying dividends that deplete a depository institution’s capital base to an inadequate level would be an unsafe and unsound banking practice. Under the Federal Deposit Insurance Corporation Improvement Act of 1991, a depository institution may not pay any dividend if payment would cause it to become undercapitalized or if it already is undercapitalized. The federal agencies have also issued policy statements that provide that bank holding companies and insured banks should generally only pay dividends out of current operating earnings.
The Company paid dividends on its common stock of $0.04 and $0.22 in 2009 and 2008, respectively.
Under Massachusetts, California, and Washington law, payment of dividends from the Banks may be restricted and limited under certain circumstances. These restrictions on the Banks’ ability to pay dividends to the Company may restrict the ability of the Company to pay dividends to the holders of the common stock. The
28
Table of Contents
payment of dividends by BPFH and the Banks may also be affected or limited by other factors, such as the requirement to maintain adequate capital above regulatory guidelines. See Part 1, Item 1, “Business—Regulatory Considerations” for further detail. There are no such comparable statutory restrictions on the Company’s Investment Managers’ and Wealth Advisors’ ability to pay dividends.
On July 22, 2008, the Company announced that it had reduced its dividend to $0.04 per share on an annualized basis. As a result of the Treasury’s purchase of the Company’s Series C Preferred stock on November 21, 2008, the Treasury’s consent shall be required for any increase in common stock dividends per share until the third anniversary of the date of November 21, 2008, unless prior to such date the Series C Preferred is redeemed in whole or the Treasury has transferred all of the Series C Preferred to third parties.
III. Securities Authorized for Issuance Under Equity Compensation Plans
Information regarding securities authorized for issuance under our equity compensation plans, shall be included in the definitive Proxy Statement (the “Proxy Statement”) for the 2010 Annual Meeting of Stockholders to be held on April 29, 2010 and is incorporated herein by reference.
IV. Recent Sales of Unregistered Securities
None.
On November 21, 2008, the Company issued 154,000 shares of Series C Preferred to the Treasury. The Company also issued the Treasury the TARP warrants to purchase 2,887,500 shares of common stock at a price of $8.00 per share. The total consideration received by the Company for this transaction was approximately $154.0 million.
On December 19, 2008, the Company filed a registration statement on Form S-3 with the SEC to register, among other securities, 154,000 shares of the Series C Preferred and the TARP Warrants. The registration statement was declared effective on March 17, 2009.
On January 13, 2010, the Company redeemed $50 million of the Company’s outstanding $154 million in Series C Preferred that was issued to the Treasury in November 2008. The Company paid approximately $50.4 million to the Treasury to repurchase the Series C Preferred, which included payment for accrued and unpaid dividends for the shares.
29
Table of Contents
The Total Return Performance Graph set forth below is a line graph comparing the yearly percentage change in the cumulative total stockholder return on the Company’s common stock, based on the market price of the Company’s common stock, with the total return on companies within the NASDAQ Composite, companies within the SNL $5-$10B Bank Index and companies within the SNL Asset Manager Index. The calculation of cumulative return assumes a $100 investment in the Company’s common stock, the NASDAQ Composite, the SNL $5-$10B Bank Index and the SNL Asset Manager Index on December 31, 2004. It also assumes that all dividends are reinvested during the relevant periods.
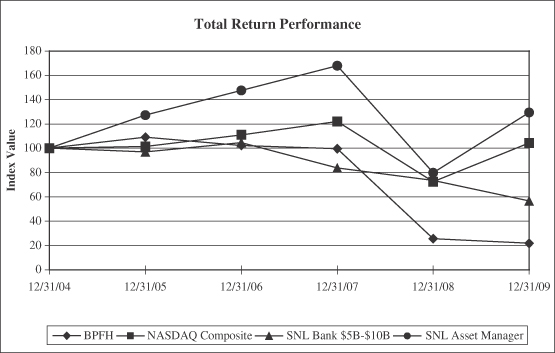
| Year Ending December 31, | ||||||||||||||||||
| 2004 | 2005 | 2006 | 2007 | 2008 | 2009 | |||||||||||||
| BPFH |
$ | 100.00 | $ | 109.14 | $ | 102.34 | $ | 99.52 | $ | 25.57 | $ | 21.75 | ||||||
| NASDAQ Composite |
100.00 | 101.37 | 111.03 | 121.92 | 72.49 | 104.31 | ||||||||||||
| SNL Bank $5B-$10B |
100.00 | 96.89 | 104.56 | 83.86 | 73.57 | 56.56 | ||||||||||||
| SNL Asset Manager |
100.00 | 127.18 | 147.49 | 167.89 | 79.79 | 129.44 | ||||||||||||
30
Table of Contents
ITEM 6. SELECTED FINANCIAL DATA
The following table represents selected financial data for the five fiscal years ended December 31. The data set forth below does not purport to be complete. It should be read in conjunction with, and is qualified in its entirety by, the more detailed information, including the Company’s Consolidated Financial Statements and related notes, appearing elsewhere herein. All items presented below, for all years presented, have been adjusted for discontinued operations related to the five affiliates divested in 2009.
| 2009 | 2008(1) | 2007(2) | 2006 | 2005(6) | ||||||||||||||||
| (In thousands, except share data) | ||||||||||||||||||||
| At December 31: |
||||||||||||||||||||
| Total balance sheet assets |
$ | 6,049,265 | $ | 7,282,835 | $ | 6,940,829 | $ | 5,789,015 | $ | 5,134,219 | ||||||||||
| Assets of discontinued operations |
— | 1,578,170 | 1,663,893 | 1,569,078 | 1,374,007 | |||||||||||||||
| Total loans (excluding loans held for sale) |
4,307,040 | 4,129,081 | 4,003,291 | 3,094,276 | 2,643,057 | |||||||||||||||
| Allowance for loan losses |
68,444 | 64,091 | 59,933 | 33,234 | 29,741 | |||||||||||||||
| Cash and investments |
1,387,483 | 1,132,290 | 842,335 | 754,504 | 838,903 | |||||||||||||||
| Goodwill and intangible assets |
150,117 | 155,051 | 276,912 | 244,951 | 161,232 | |||||||||||||||
| Deposits |
4,255,219 | 3,748,912 | 3,550,499 | 3,140,347 | 2,792,998 | |||||||||||||||
| Borrowed funds |
992,034 | 1,329,898 | 1,273,945 | 678,489 | 661,843 | |||||||||||||||
| Total Company’s stockholders’ equity |
651,154 | 648,676 | 619,372 | 595,415 | 510,969 | |||||||||||||||
| Non-performing assets |
106,938 | 76,828 | 35,301 | 8,751 | 4,998 | |||||||||||||||
| Net loans (charged off)/recoveries |
(40,606 | ) | (192,485 | ) | 478 | (746 | ) | (170 | ) | |||||||||||
| Client assets under management and advisory(3): |
||||||||||||||||||||
| Private Banking |
$ | 3,479,000 | $ | 3,253,000 | $ | 3,656,000 | $ | 3,105,000 | $ | 2,971,000 | ||||||||||
| Investment Management |
7,048,000 | 6,381,000 | 9,115,000 | 8,746,000 | 3,259,000 | |||||||||||||||
| Wealth Advisory |
7,161,000 | 6,235,000 | 6,412,000 | 3,727,000 | 3,140,000 | |||||||||||||||
| Inter-company relationships |
(18,000 | ) | (16,000 | ) | — | (13,000 | ) | (26,000 | ) | |||||||||||
| Total client assets under management and advisory |
$ | 17,670,000 | $ | 15,853,000 | $ | 19,183,000 | $ | 15,565,000 | $ | 9,344,000 | ||||||||||
| For The Year Ended December 31: |
||||||||||||||||||||
| Net interest income |
$ | 159,485 | $ | 150,228 | $ | 136,993 | $ | 120,172 | $ | 114,745 | ||||||||||
| Provision for loan losses |
44,959 | 196,643 | 23,449 | 4,240 | 4,890 | |||||||||||||||
| Net interest income/(loss) after provision for loan losses |
114,526 | (46,415 | ) | 113,544 | 115,932 | 109,855 | ||||||||||||||
| Fees and other income |
126,449 | 129,449 | 106,204 | 83,364 | 62,275 | |||||||||||||||
| Operating expense |
221,259 | 213,785 | 184,626 | 152,840 | 128,978 | |||||||||||||||
| Impairment of goodwill and intangibles |
1,699 | 133,202 | 31,780 | — | — | |||||||||||||||
| Income/(loss) from continuing operations before income taxes |
18,017 | (263,953 | ) | 3,342 | 46,456 | 43,152 | ||||||||||||||
| Income tax expense/ (benefit) |
1,632 | (70,737 | ) | (6,339 | ) | 12,431 | 13,151 | |||||||||||||
| Net income/(loss) from continuing operations |
16,385 | (193,216 | ) | 9,681 | 34,025 | 30,001 | ||||||||||||||
| Net (loss)/income from discontinued operations |
(7,505 | ) | (191,209 | ) | (1,524 | ) | 24,047 | 16,057 | ||||||||||||
| Less: Net income attributable to noncontrolling interests |
3,649 | 4,327 | 3,987 | 3,699 | 2,512 | |||||||||||||||
| Net income/(loss) attributable to the Company |
$ | 5,231 | $ | (388,752 | ) | $ | 4,170 | $ | 54,373 | $ | 43,546 | |||||||||
| Per Share Data: |
||||||||||||||||||||
| Basic (loss)/earnings per share from continuing operations |
$ | (0.41 | ) | $ | (4.85 | ) | $ | 0.15 | $ | 0.96 | $ | 1.02 | ||||||||
| Diluted (loss)/earnings per share from continuing operations |
$ | (0.41 | ) | $ | (4.85 | ) | $ | 0.15 | $ | 0.85 | $ | 0.89 | ||||||||
| Average basic common shares outstanding |
66,696,977 | 47,528,418 | 36,731,621 | 35,452,880 | 29,425,157 | |||||||||||||||
| Average diluted common shares outstanding |
66,696,977 | 47,528,418 | 38,315,330 | 40,089,380 | 33,824,717 | |||||||||||||||
| Cash dividends per share |
$ | 0.04 | $ | 0.22 | $ | 0.36 | $ | 0.32 | $ | 0.28 | ||||||||||
| Book value per share(7) |
$ | 6.51 | $ | 7.36 | $ | 16.53 | $ | 16.27 | $ | 14.68 | ||||||||||
| Selected Operating Ratios: |
||||||||||||||||||||
| Return on average assets |
0.15 | % | nm | 0.13 | % | 1.09 | % | 1.19 | % | |||||||||||
| Return on average equity |
1.37 | % | nm | 1.39 | % | 10.43 | % | 12.84 | % | |||||||||||
| Net interest margin(4) |
3.14 | % | 3.18 | % | 3.44 | % | 3.61 | % | 3.80 | % | ||||||||||
| Total fees and other income/total revenue(5) |
44.22 | % | 46.29 | % | 43.67 | % | 40.96 | % | 35.18 | % | ||||||||||
| Asset Quality Ratios: |
||||||||||||||||||||
| Non-accrual loans to total loans (excluding loans held for sale) |
2.10 | % | 1.55 | % | 0.85 | % | 0.27 | % | 0.19 | % | ||||||||||
| Non-performing assets to total assets |
1.77 | % | 1.05 | % | 0.51 | % | 0.15 | % | 0.10 | % | ||||||||||
| Allowance for loan losses to total loans (excluding loans held for sale) |
1.59 | % | 1.55 | % | 1.50 | % | 1.07 | % | 1.13 | % | ||||||||||
| Allowance for loan losses to non-accrual loans (excluding loans held for sale) |
0.76 | 1.00 | 1.76 | 4.05 | 5.95 | |||||||||||||||
| Allowance for loan losses to classified loans (excluding loans held for sale) |
0.49 | 1.01 | 0.63 | 1.01 | 4.00 | |||||||||||||||
| Other Ratios: |
||||||||||||||||||||
| Dividend payout ratio |
nm | nm | nm | 37.65 | % | 31.46 | % | |||||||||||||
| Total equity to total assets ratio |
10.76 | % | 8.91 | % | 8.92 | % | 10.29 | % | 9.95 | % | ||||||||||
| Tangible common equity to tangible assets ratio(8) |
6.66 | % | 5.07 | % | 3.15 | % | 3.27 | % | 3.26 | % | ||||||||||
31
Table of Contents
nm - not meaningful
| (1) | Earnings for 2008 were reduced by $115.3 million, or $2.43 per share, for the after tax and minority interest impact of impairment charges at FPB, Charter, DGHM and the Holding Company; and by $124.3 million, or $2.61 per share, for the after tax provisions for loan losses. These charges were slightly offset by the gains recognized, net of tax, of $14.2 million, or $0.30 per share, from the repurchase of the Company’s 3% Contingent Convertible Senior Notes due 2027. To determine net of tax amounts, an assumed effective tax rate of approximately 37% is used, except for the non-deductible impairment at the Private Banking affiliates and portions of the impairment at DGHM. For further details see Part II, Item 7, “Management’s Discussion and Analysis of Financial Condition and Results of Operations.” |
| (2) | Net income for 2007 was reduced by $18.1 million, or $0.47 per share, for the after tax and minority interest impact of impairment charges at DGHM, and $11.4 million, or $0.30 per share, for the increase in the allowance for loan losses and other adjustments related to the increase in classified loans at FPB described in Part II, Item 7, “Management’s Discussion and Analysis of Financial Condition and Results of Operations.” To determine net of tax amounts, an assumed effective tax rate of approximately 37% is used. Return on average assets and return on average equity were also reduced. |
| (3) | The Company changed the accounting for its interest in BOS from the equity method to the consolidation method as a result of the majority interest ownership of BOS in the third quarter of 2007. BOS’s prior period Assets Under Management were not included in the Company’s prior period consolidated balances. |
| (4) | Net interest margin represents net interest income on a fully-taxable equivalent basis as a percent of average interest-earning assets. |
| (5) | Total revenue is defined as net interest income plus fees and other income. |
| (6) | Adjusted to include the impact of stock-based compensation, see Part II, Item 8, “Financial Statements and Supplementary Data—Note 18: Employee Benefits” for additional information. |
| (7) | Book value per share is calculated by reducing the Company’s total equity by the preferred stock balance, then dividing that value by the total common shares outstanding as of the end of that period. |
| (8) | The Company calculates tangible assets by adjusting total assets to exclude goodwill and intangible assets. The Company calculates tangible common equity by adjusting total equity to exclude the equity from the TARP funding of $154 million and goodwill and intangible assets and include the difference between redemption value and value per Accounting Research Bulletin 51, Consolidated Financial Statements (“ARB 51”) for redeemable non-controlling interests. The Company uses certain non-GAAP financial measures, such as the Tangible Common Equity to Tangible Assets ratio, to provide information for investors to effectively analyze financial trends of ongoing business activities, and to enhance comparability with peers across the financial sector. A reconciliation from the Company’s GAAP Total Equity to Total Assets ratio to the Non-GAAP Tangible Common Equity to Tangible Assets ratio is presented below: |
| 2009 | 2008 | 2007 | 2006 | 2005 | ||||||||||||||||
| Total balance sheet assets |
$ | 6,049,265 | $ | 7,282,835 | $ | 6,940,829 | $ | 5,789,015 | $ | 5,134,219 | ||||||||||
| LESS: Goodwill and intangible assets, net(a) |
(150,117 | ) | (178,543 | ) | (458,238 | ) | (460,964 | ) | (384,407 | ) | ||||||||||
| Tangible assets (non-GAAP) |
$ | 5,899,148 | $ | 7,104,292 | $ | 6,482,591 | $ | 5,328,051 | $ | 4,749,812 | ||||||||||
| Total Company’s stockholders’ equity |
$ | 651,154 | $ | 648,676 | $ | 619,372 | $ | 595,415 | $ | 510,969 | ||||||||||
| LESS: Goodwill and intangible assets, net(a) |
(150,117 | ) | (178,543 | ) | (458,238 | ) | (460,964 | ) | (384,407 | ) | ||||||||||
| TARP Funding |
(154,000 | ) | (154,000 | ) | — | — | — | |||||||||||||
| ADD: Difference between redemption value of non-controlling interests and value under ARB 51 |
46,016 | 43,800 | 43,091 | 39,782 | 28,379 | |||||||||||||||
| Total adjusting items |
(258,101 | ) | (288,743 | ) | (415,147 | ) | (421,182 | ) | (356,028 | ) | ||||||||||
| Tangible Common Equity (non-GAAP) |
$ | 393,053 | $ | 359,933 | $ | 204,225 | $ | 174,233 | $ | 154,941 | ||||||||||
| Total Equity/Total Assets |
10.76 | % | 8.91 | % | 8.92 | % | 10.29 | % | 9.95 | % | ||||||||||
| Tangible Common Equity/Tangible Assets (non-GAAP) |
6.66 | % | 5.07 | % | 3.15 | % | 3.27 | % | 3.26 | % | ||||||||||
| (a) | Includes goodwill and intangible assets of divested affiliates for years 2008—2005. |
32
Table of Contents
| ITEM 7. | MANAGEMENT’S DISCUSSION AND ANALYSIS OF FINANCIAL CONDITION AND RESULTS OF OPERATIONS |
Management’s discussion and analysis of financial condition and results of operations should be read in conjunction with the Consolidated Financial Statements, the notes thereto, and other statistical information included in this annual report.
The Company offers a broad range of wealth management services to high net worth individuals, families, businesses and select institutions through its three reportable segments: Private Banking, Investment Management, and Wealth Advisory. This executive summary provides an overview of the most significant aspects of the operating segments and the Company’s operations in 2009. Details of the matters addressed in this summary are provided elsewhere in this document and, in particular, in the sections immediately following.
In 2009, the Company recorded net income attributable to the Company of $5.2 million, but recorded a loss attributable to common shareholders of $0.52 per diluted share after accounting for non-cash equity charges and preferred dividends. This compares to a net loss attributable to the Company of $388.8 million and a loss attributable to common shareholders of $8.87 per diluted share in 2008. In 2009, the Company recorded net income from continuing operations attributable to the Company of $12.7 million and a loss of $0.41 per diluted share from continuing operations, compared to a net loss from continuing operations attributable to the Company of $197.5 million and a loss of $4.85 per diluted share from continuing operations in 2008. See Part II, Item 8, “Financial Statements and Supplementary Data—Note 1. Basis of Presentation and Summary of Significant Accounting Policies” for further detail on the charges made to arrive to income attributable to the common shareholders. The increase in net income attributable to the Company in 2009 from 2008 was largely due to a decrease in provision for loan losses of $151.7 million, a decrease in goodwill and intangible impairment charges of $131.5 million, and a decrease in losses related to discontinued operations of $183.7 million.
The Company has taken a number of steps in 2009 to increase capital, reduce credit and operating risk, and create financial flexibility in a difficult economic environment. These steps include divesting of five affiliates, repurchasing the remaining convertible debt, and repurchasing a portion of the convertible trust preferred debt.
In 2009, the Company divested its interests in five of its affiliates—Westfield, Gibraltar, RINET, Sand Hill, and BPVI. The results of operations for these affiliates and the gain/ (loss) on sale related to each are included in “Net loss from discontinued operations” in the consolidated statements of operations for current and prior periods. In addition, the assets and liabilities of the divested companies have been reclassified to assets and liabilities of discontinued operations in the accompanying consolidated balance sheets for periods prior to divestiture. The Company recognized an after-tax loss from discontinued operations of $7.5 million, or $0.11 per share. For further detail on the divestitures, refer to Part II, Item 8, “Financial Statements and Supplementary Data—Note 2: Divestitures and Acquisitions.”
In 2009, the Company repurchased the remaining balance of its 3% Contingent Convertible Senior Notes due 2027 (the “Notes”) of $52.4 million and recognized a $0.4 million pretax gain on repurchase. In addition, the Company also repurchased $44.5 million of its publicly traded convertible trust preferred securities issued in 2004 by Boston Private Capital Trust I, a wholly-owned subsidiary of the Company (the “Boston Private Capital Trust I”) and recognized an $18.3 million pretax gain on repurchase. The Company expects these transactions to increase net interest income in future periods due to lower interest expense.
Results for 2009 and 2008 were affected by the economic recession that began in late 2007. The recession and the programs implemented to mitigate its effect have had the following results on the Company’s business: (i) the declining real estate markets continued to affect credit quality at the Banks, leading to higher charge-offs and provision for loan losses in both years as compared to historical values as well as increased costs to manage a large portfolio of problematic loans; (ii) the declining stock market and illiquid credit markets triggered goodwill
33
Table of Contents
impairment tests at all affiliates and led to significant impairment charges in late 2008; (iii) government intervention through programs such as the TARP CPP and the TLGP has helped to provide low cost liquidity and stabilize operations in late 2008 and continued into 2009; and (iv) the FDIC raised insurance rates on deposits in early 2009 and later requested banks prepay premiums for 2010, 2011 and 2012 to replenish its funds due to a decrease in its deposit insurance fund reserve ratios to below the minimum.
The following table presents a summary of profits/(losses), revenues and expenses for the Private Banking segment continuing operations for 2009, 2008, and 2007.
| As of and for the year ended December 31, | 2009 vs. 2008 | 2008 vs. 2007 | ||||||||||||||||||||||
| 2009 | 2008 | 2007 | $ Change | % | $ Change | % | ||||||||||||||||||
| (In thousands) | ||||||||||||||||||||||||
| Net interest income |
$ | 169,802 | $ | 163,767 | $ | 149,948 | $ | 6,035 | 4 | % | $ | 13,819 | 9 | % | ||||||||||
| Fees and other income: |
||||||||||||||||||||||||
| Investment management and trust fees |
20,810 | 22,303 | 20,773 | (1,493 | ) | -7 | % | 1,530 | 7 | % | ||||||||||||||
| Other income |
17,711 | 6,776 | 9,889 | 10,935 | 161 | % | (3,113 | ) | -31 | % | ||||||||||||||
| Total fees and other income |
38,521 | 29,079 | 30,662 | 9,442 | 32 | % | (1,583 | ) | -5 | % | ||||||||||||||
| Total revenues |
208,323 | 192,846 | 180,610 | 15,477 | 8 | % | 12,236 | 7 | % | |||||||||||||||
| Provision for loan losses |
44,959 | 196,643 | 23,449 | (151,684 | ) | -77 | % | 173,194 | nm | |||||||||||||||
| Expenses: |
||||||||||||||||||||||||
| Operating expenses |
144,713 | 125,019 | 108,354 | 19,694 | 16 | % | 16,665 | 15 | % | |||||||||||||||
| Impairment of goodwill and intangibles |
— | 91,621 | — | (91,621 | ) | -100 | % | 91,621 | nm | |||||||||||||||
| Total expenses |
144,713 | 216,640 | 108,354 | (71,927 | ) | -33 | % | 108,286 | 100 | % | ||||||||||||||
| Income/ (loss) before income taxes |
18,651 | (220,437 | ) | 48,807 | 239,088 | nm | (269,244 | ) | nm | |||||||||||||||
| Income tax expense/ (benefit) |
4,746 | (53,708 | ) | 14,132 | 58,454 | nm | (67,840 | ) | nm | |||||||||||||||
| Net income/ (loss) attributable to the Company |
$ | 13,905 | $ | (166,729 | ) | $ | 34,675 | $ | 180,634 | nm | $ | (201,404 | ) | nm | ||||||||||
| Total loans(1) |
$ | 4,304,110 | $ | 4,126,444 | $ | 3,901,333 | $ | 177,666 | 4 | % | $ | 225,111 | 6 | % | ||||||||||
| Assets |
$ | 5,669,645 | $ | 5,399,691 | $ | 4,933,439 | $ | 269,954 | 5 | % | $ | 466,252 | 9 | % | ||||||||||
| Deposits(2) |
$ | 4,368,780 | $ | 3,940,454 | $ | 3,569,718 | $ | 428,326 | 11 | % | $ | 370,736 | 10 | % | ||||||||||
| Assets Under Management |
$ | 3,479,000 | $ | 3,253,000 | $ | 3,656,000 | $ | 226,000 | 7 | % | $ | (403,000 | ) | -11 | % | |||||||||
nm - not meaningful
| (1) | Loans presented in this table are loans from the Private Banking segment and do not include loans of non-banking affiliates or the Holding Company. |
| (2) | Deposits presented in this table do not include intercompany eliminations related to deposits in the Banks from non-banking affiliates or the Holding Company. |
The Company’s Private Banking segment reported net income of $13.9 million in 2009, compared to a net loss of $166.7 million in 2008 and net income of $34.7 million in 2007. The 2009 increase in net income was a result of the following items: lower charge-offs and provision for loan losses, although they remained higher than historical trends; no impairment charge was taken in 2009, compared to the significant 2008 goodwill and intangible asset impairment charge; higher gains on sales of investments as the banks sold more of their investments in 2009 than in 2008; and higher gains on sales of loans and other real estate owned (“OREO”) primarily related to the Southern California non-strategic loans portfolio. These changes were partially offset by increased professional services expenses for legal fees related to loan workouts, including collection costs; increased FDIC insurance assessments due to higher rates, a special assessment, increased deposits and increased thresholds for deposits insured by the FDIC; and increased intangible amortization as the Company accelerated
34
Table of Contents
the amortization of core deposit intangibles at some of the Banks to more accurately reflect the runoff of these assets. Additionally, the segment was negatively impacted in 2009 by net interest margin compression. The 2008 decrease in net income was also a result of the increased provision for loan losses, charge-offs, and impairment charge. The 2008 charge-offs and provision were primarily related to the revaluation of the non-strategic loans portfolio in Southern California, while the impairment charges were related to the Southern California and Pacific Northwest banks.
Due to the adverse economic environment, especially in the real estate markets in which the Banks operate, the Company has had lower loan growth in 2009 than in historical years as the economy remained in a recession. Additionally, the Banks have generally reduced or stopped originating construction loans, which have higher associated risk than other loan types. A portion of the increase in loans in 2009 was due to two of the Banks purchasing residential loans.
The changes in Assets Under Management (“AUM”) at the Banks in 2009 and 2008 were largely related to market changes. In 2009, market appreciation of $0.3 billion was slightly offset by $0.1 billion of net outflows. In 2008, market depreciation of $0.7 billion was partially offset by net inflows of $0.3 billion.
Total loans at the Banks increased $177.7 million, or 4%, to $4.3 billion or 76% of total assets at the Banks in 2009 from $4.1 billion or 76% of total assets at the Banks in 2008. A discussion of the Company’s loan portfolio can be found below in Part II, Item 7, “Management’s Discussion and Analysis of Financial Condition and Results of Operations: Loan Portfolio and Credit Quality.”
Deposits at the Banks increased $428.3 million, or 11%, to $4.4 billion in 2009 from $3.9 billion in 2008. A discussion of the Company’s deposits can be found below in Part II, Item 7, “Management’s Discussion and Analysis of Financial Condition and Results of Operations: Financial Condition.”
The following table presents a summary of profits/(losses), revenues and expenses for the Investment Management segment continuing operations for 2009, 2008, and 2007.
| As of and for the year ended December 31, | 2009 vs. 2008 | 2008 vs. 2007 | |||||||||||||||||||||||
| 2009 | 2008 | 2007 | $ Change | % | $ Change | % | |||||||||||||||||||
| (In thousands) | |||||||||||||||||||||||||
| Investment management and trust fees |
$ | 33,189 | $ | 45,075 | $ | 54,015 | $ | (11,886 | ) | -26 | % | $ | (8,940 | ) | -17 | % | |||||||||
| Other income and net interest income |
180 | 415 | 590 | (235 | ) | -57 | % | (175 | ) | -30 | % | ||||||||||||||
| Total revenues |
33,369 | 45,490 | 54,605 | (12,121 | ) | -27 | % | (9,115 | ) | -17 | % | ||||||||||||||
| Expenses: |
|||||||||||||||||||||||||
| Operating expenses |
28,221 | 35,026 | 38,224 | (6,805 | ) | -19 | % | (3,198 | ) | -8 | % | ||||||||||||||
| Impairment of goodwill and intangibles |
— | 37,659 | 31,780 | (37,659 | ) | -100 | % | 5,879 | nm | ||||||||||||||||
| Total expenses |
28,221 | 72,685 | 70,004 | (44,464 | ) | -61 | % | 2,681 | 4 | % | |||||||||||||||
| Income/ (loss) before income taxes |
5,148 | (27,195 | ) | (15,399 | ) | 32,343 | nm | (11,796 | ) | -77 | % | ||||||||||||||
| Income tax expense/ (benefit) |
2,236 | (10,958 | ) | (6,561 | ) | 13,194 | nm | (4,397 | ) | -67 | % | ||||||||||||||
| Noncontrolling interests |
997 | 1,393 | 2,054 | (396 | ) | -28 | % | (661 | ) | -32 | % | ||||||||||||||
| Net income/ (loss) attributable to the Company |
$ | 1,915 | $ | (17,630 | ) | $ | (10,892 | ) | $ | 19,545 | nm | $ | (6,738 | ) | -62 | % | |||||||||
| Assets |
$ | 112,497 | $ | 115,693 | $ | 156,054 | $ | (3,196 | ) | -3 | % | $ | (40,361 | ) | -26 | % | |||||||||
| Assets Under Management |
$ | 7,048,000 | $ | 6,381,000 | $ | 9,115,000 | $ | 667,000 | 10 | % | $ | (2,734,000 | ) | -30 | % | ||||||||||
nm - not meaningful
35
Table of Contents
The Company’s Investment Management segment reported net income of $1.9 million in 2009 compared to net losses of $17.6 million and $10.9 million in 2008 and 2007, respectively. Exclusive of the impairment charges, net of tax, of $22.4 million and $18.1 million, recorded in 2008 and 2007 respectively, the Company would have recorded net income in both 2008 and 2007.
Investment management fee revenue decreased 26% from 2008, despite AUM increase of $0.7 billion in 2009 as compared to 2008. Approximately 75% of investment management fee revenue is billed quarterly in advance and based on AUM at the beginning of the quarter; therefore changes in revenue generally lag behind changes in AUM. As a result, the steep market depreciation experienced in 2008, especially in the fourth quarter, had a greater impact on 2009 revenues than on 2008 revenues. Similarly, market appreciation in the fourth quarter of 2009 will have an impact on 2010 revenues.
In 2009, the changes to AUM were impacted by market appreciation of $1.2 billion, which was partially offset by $0.5 billion of net outflows. In 2008, both market depreciation of $2.5 billion and net outflows of $0.2 billion negatively impacted AUM.
Operating expenses, excluding impairment charges, at the Investment Managers decreased both in 2009 and 2008 primarily due to decreased variable compensation related to decreased fee revenue and decreased intangible amortization related to the impairments taken in 2008.
The following table presents a summary of profits/(losses), revenues and expenses for the Wealth Advisory segment continuing operations for 2009, 2008, and 2007.
| As of and for the year ended December 31, | 2009 vs. 2008 | 2008 vs. 2007 | |||||||||||||||||||||
| 2009 | 2008 | 2007 | $ Change | % | $ Change | % | |||||||||||||||||
| (In thousands) | |||||||||||||||||||||||
| Wealth advisory fees |
$ | 34,834 | $ | 34,644 | $ | 20,322 | $ | 190 | 1 | % | $ | 14,322 | 70 | % | |||||||||
| Other income and net interest income |
46 | 172 | 279 | (126 | ) | -73 | % | (107 | ) | -38 | % | ||||||||||||
| Total revenues |
34,880 | 34,816 | 20,601 | 64 | 0 | % | 14,215 | 69 | % | ||||||||||||||
| Expenses: |
|||||||||||||||||||||||
| Operating expenses |
24,156 | 24,337 | 13,744 | (181 | ) | -1 | % | 10,593 | 77 | % | |||||||||||||
| Impairment of goodwill and intangibles |
1,699 | — | — | 1,699 | nm | — | nm | ||||||||||||||||
| Total expenses |
25,855 | 24,337 | 13,744 | 1,518 | 6 | % | 10,593 | 77 | % | ||||||||||||||
| Income before income taxes |
9,025 | 10,479 | 6,857 | (1,454 | ) | -14 | % | 3,622 | 53 | % | |||||||||||||
| Income tax expense |
3,573 | 3,330 | 2,204 | 243 | 7 | % | 1,126 | 51 | % | ||||||||||||||
| Noncontrolling interests |
2,652 | 2,934 | 1,933 | (282 | ) | -10 | % | 1,001 | 52 | % | |||||||||||||
| Net income attributable to the Company |
$ | 2,800 | $ | 4,215 | $ | 2,720 | $ | (1,415 | ) | -34 | % | $ | 1,495 | 55 | % | ||||||||
| Assets |
$ | 72,062 | $ | 78,707 | $ | 65,133 | $ | (6,645 | ) | -8 | % | $ | 13,574 | 21 | % | ||||||||
| Assets Under Management |
$ | 7,161,000 | $ | 6,235,000 | $ | 6,412,000 | $ | 926,000 | 15 | % | $ | (177,000 | ) | -3 | % | ||||||||
nm - not meaningful
The Company’s Wealth Advisory segment reported net income of $2.8 million in 2009, compared to net income of $4.2 million and $2.7 million in 2008 and 2007, respectively. The 2009 impairment charge was related to the 2009 contingent consideration payment made to DTC. For more information on the impairment, see Part II,
36
Table of Contents
Item 8, “Financial Statements and Supplementary Data—Note 10: Goodwill and Other Intangible Assets.” Other than the impairment charge, 2009 results were relatively consistent with 2008. Increased revenues and expenses for 2008 compared to 2007 are attributed to the acquisition and consolidation of DTC and BOS.
AUM changes for the Wealth Advisors in 2009 were primarily the result of market appreciation of $0.8 billion and net inflows of $0.1 billion. AUM changes for the Wealth Advisors in 2008 were primarily the result of market depreciation of $1.2 billion, offset by the acquired AUM of DTC of $0.9 billion and net inflows of $0.1 billion.
The Wealth Advisory segment adds profitable fee income to the Company’s revenue base that is more resistant to fluctuations in market conditions in comparison to the Investment Management segment since financial planning fees are usually not tied to the market value of AUM. Asset based fees are driven by the underlying market value changes in AUM.
Critical accounting policies are reflective of significant judgments and uncertainties, and could potentially result in materially different results under different assumptions and conditions. The Company believes that its most critical accounting policies upon which its financial condition depends, and which involve the most complex or subjective decisions or assessments are as follows:
Allowance for Loan and Lease Losses
The allowance for loan losses is an estimate of the inherent risk of loss in the loan portfolio as of the consolidated balance sheet date. Management estimates the level of the allowance for loan losses based on all relevant information available. The allowance for loan losses is established through the provision for loan losses, which is a direct charge to earnings. Loan losses are charged to the allowance when management believes that the collectability of the loan principal is unlikely. Recoveries on loans previously charged off are credited to the allowance when received in cash.
The Company’s allowance is accounted for in accordance with guidance issued by various regulatory agencies, including: the Federal Financial Institutions Examination Council Policy Statement on the Allowance for Loan and Lease Losses (December 2006); Securities and Exchange Commission (“SEC”) Staff Accounting Bulletin No. 102, Selected Loan Loss Methodology and Documentation Issues; ASC 310, Receivables (formerly FAS 114, Accounting by Creditors for Impairment of a Loan) (“ASC 310”); and ASC 450, Contingencies (Formerly FAS 5, Accounting for Contingencies).
The allowance consists of three primary components: General Reserves on pass graded loans (loans that pose a normal credit risk) (ASC 450), Allocated Reserves on non-impaired Special Mention and Sub Standard Loans (ASC 450), and the Allocated Reserves on Impaired Loans (ASC 310). The allowance involves a high degree of management judgment and estimates, and results in an acceptable allowance which is reflective of the inherent risk of loss in the loan portfolio at the measurement date.
General Reserves are calculated for each loan pool consisting of pass graded loans segregated by loan type, by applying estimated net loss percentages based upon the Bank’s actual historical net charge-offs and, adjusted as appropriate, on a consistent manner based upon consideration of qualitative factors to arrive at a total loss factor for each loan type. The rationale for qualitative adjustments is to more accurately reflect the current inherent risk of loss in the respective loan types than would be determined through the sole consideration of the Bank’s actual historical net charge-off rates. The numerical factors assigned are based upon observable data, if applicable, as well as management’s analysis and judgment. The qualitative factors considered by the Company include:
| • | Volume and severity of past due, non-accrual, and adversely graded loans, |
| • | Volume and terms of loans, |
37
Table of Contents
| • | Concentrations of Credit, |
| • | Management’s experience, as well as loan underwriting and loan review policy and procedures, and |
| • | Economic and business conditions impacting the Bank’s loan portfolios, including consideration of collateral values and external factors |
Each one of the Banks makes an independent determination of the applicable loss rate for these factors based on their relevant local market conditions, credit quality, and portfolio mix. Each quarter, all of the Banks review the loss factors to determine if there have been any changes in their respective loan portfolios, market conditions, or other risk indicators which would result in a change to the current loss factor.
Allocated Reserves on non-impaired special mention and substandard loans reflect management’s assessment of increased risk of losses associated with adversely graded loans. An allocated reserve is assigned to these pools of loans based upon management’s consideration of the credit attributes of individual loans within each pool of loans, including consideration, of loan to value ratios, past due status, strength and willingness of the guarantors, and other relevant attributes, including the quantitative factors considered for the general reserve as discussed above. These considerations are determined separately for each type of loan. The allocated reserves are a multiple of the general reserve for each respective loan types, with a greater multiple for loans with increased risk (i.e., special-mention loans versus substandard loans).
A loan (usually a larger commercial type loan) is considered impaired in accordance with ASC 310 when, based upon current information and events, it is probable that a creditor will be unable to collect all amounts due according to the contractual terms of the loan agreement. Impairment is measured based on the fair value of the loan, expected future cash flows discounted at the loan’s effective interest rate, or as a practical expedient, the fair value of the collateral if the loan is “collateral dependent.” For collateral dependent loans, appraisals or broker opinions are generally used to determine the fair value. Appraised values may be discounted if conditions warrant, such as the date when the appraisal was performed if collateral values have declined since the date the appraisal was done. All expected costs to liquidate the collateral are considered when determining the net realizable value. If the loan is deemed to be collateral dependent, generally the difference between the book balance (customer balance less any prior charge-offs or customer interest payments applied to principal) and the net realizable value is taken as a partial charge-off through the allowance for loan losses in the current period. If the loan is not determined to be collateral dependent, then a specific allocation is established for the difference between the book balance of the loan and the expected future cash flows discounted at the loan’s effective interest rate. Charge-offs for loans not considered to be collateral dependant are made when appropriate. Impaired Loans are removed from the general loan pools. There may be instances where the loan is considered impaired although based on the net realizable value or the discounted expected future cash flows there is no impairment. In addition, all loans which are classified as troubled debt restructurings (“TDRs”) are considered impaired.
In addition to the three primary components of the allowance for loan losses discussed above (General Reserve, Allocated Reserves on non-impaired special-mention and substandard loans, and the Allocated Reserves on impaired loans), the Company’s affiliate Banks also maintain an insignificant amount of additional allowance for loan losses (the unallocated allowance for loan losses) which primarily relates to a general assessment of the potential variability of applicable qualitative factors subject to a higher degree of variability. The respective qualitative factors, as discussed above, are considered for each respective loan type. Only the assessment of the potential variability of applicable qualitative factors is included in the unallocated allowance for loan losses. The unallocated allowance for loan losses is not considered significant by the Company.
While this evaluation process utilizes historical and other objective information, the classification of loans and the establishment of the allowance for loan losses rely to a great extent on the judgment and experience of management. While management evaluates currently available information in establishing the allowance for loan losses, future adjustments to the allowance may be necessary if economic conditions differ substantially from the assumptions used in making the evaluations. In addition, various regulatory agencies, as an integral part of their
38
Table of Contents
examination process, periodically review a financial institution’s allowance for loan losses as well as loan grades/classifications. Such agencies may require the financial institution to recognize additions to the allowance or increases to adversely graded classified loans based on their judgments about information available to them at the time of their examination.
Valuation of Goodwill/Intangible Assets and Analysis for Impairment
The Company allocates the cost of an acquired entity to the assets acquired and liabilities assumed based on their estimated fair values at the date of acquisition. Other intangible assets identified in acquisitions generally consist of advisory contracts, core deposit intangibles, and non-compete agreements. The value attributed to advisory contracts is based on the time period over which they are expected to generate economic benefits. The advisory contracts are generally amortized over 8-15 years depending on the contract. Core deposit intangibles are valued based on the expected longevity of the core deposit accounts and the expected cost savings associated with the use of the existing core deposit base rather than alternative funding sources. The core deposit intangibles are generally amortized over a period of 10-12 years. Non-compete agreements are valued based on the expected receipt of future economic benefits protected by clauses in the non-compete agreements that restrict competitive behavior. Non-compete agreements are amortized over the life of the agreement, generally 2-4 years.
Other intangible assets with definite lives are tested for impairment at the reporting unit level at least annually in the fourth quarter or more frequently when events or circumstances occur that indicate that it is more likely than not that an impairment has occurred. The Company tests other intangible assets with definite lives for impairment by comparing the carrying amount to the sum of the net undiscounted cash flows expected to be generated by the asset whenever events or changes in circumstances indicate that the carrying amount of the asset may not be recoverable. If the carrying amount of the asset exceeds its net undiscounted cash flows, then an impairment loss is recognized for the amount by which the carrying amount exceeds its fair value. The intangible impairment test is performed at the reporting unit level, and each affiliate is considered a reporting unit for goodwill and intangible impairment testing purposes. Intangible assets with an indefinite useful economic life are not amortized, but are subject to impairment testing at the reporting unit on an annual basis, or when events or changes in circumstances indicate that the carrying amounts may be impaired.
The excess of the purchase price for acquisitions over the fair value of the net assets acquired, including other intangible assets, is recorded as goodwill. Goodwill is not amortized but is tested for impairment at the reporting unit level, defined as the affiliate partner level, at least annually in the fourth quarter or more frequently when events or circumstances occur that indicate that it is more likely than not that an impairment has occurred. Goodwill is tested for impairment using a two-step process that begins with an estimation of the fair value of a reporting unit. Goodwill impairment exists when a reporting unit’s carrying value of goodwill exceeds its implied fair value. Significant judgment is applied when goodwill is assessed for impairment. This judgment includes developing cash flow projections, selecting appropriate discount rates, identifying relevant market comparables, incorporating general economic and market conditions, and selecting an appropriate control premium. The selection and weighting of the various fair value techniques may result in a higher or lower fair value. Judgment is applied in determining the weightings that are most representative of fair value.
The first step (“Step 1”) of impairment testing requires a comparison of each reporting unit’s fair value to carrying value to identify potential impairment. The reporting units fall under one of the three segments: Private Banking, Investment Management, and Wealth Advisory.
For the Private Banking segment, the Company utilizes both the income and market approaches to determine fair value. The income approach is based on discounted cash flows derived from assumptions of balance sheet and income statement activity. For the market approach, earnings and market capitalization multiples of comparable public companies are selected and applied to the banking reporting unit’s applicable metrics.
39
Table of Contents
For the Investment Management and Wealth Advisory segments, the Company utilizes both the income and market approaches to determine fair value. The income approach is primarily based on discounted cash flows derived from assumptions of income statement activity. For the market approach, earnings and tangible book value multiples of comparable companies are selected and applied to the financial services reporting unit’s applicable metrics.
The aggregate fair values are compared to market capitalization as an assessment of the appropriateness of the fair value measurements. A control premium analysis is performed to determine whether the implied control premium was within range of overall control premiums observed in the market place.
The second step (“Step 2”) of impairment testing is necessary only if a reporting unit’s carrying amount exceeds its fair value. Step 2 compares the implied fair value of the reporting unit goodwill with the carrying amount of the goodwill for the reporting unit. The implied fair value of goodwill is determined in the same manner as goodwill that is recognized in a business combination. Significant judgment and estimates are involved in estimating the fair value of the assets and liabilities of the reporting unit. The excess goodwill is recognized as an impairment loss.
Tax Estimates
The Company accounts for income taxes in accordance with ASC 740, Income Taxes (formerly FAS 109, Accounting for Income Taxes) (“ASC 740”). The deferred tax assets and/or liabilities are determined by multiplying the differences between the financial reporting and tax reporting basis for assets and liabilities by the enacted tax rates expected to be in effect when such differences are recovered or settled. The effect on deferred taxes for a change in tax rates is recognized in income in the period that includes the enactment date. Valuation allowances on deferred tax assets are estimated based on the Company’s assessment of the realizability of such amounts. Significant management judgment is required in determining the provision for income taxes and, in particular, any valuation allowance recorded against the Company’s deferred tax assets.
In accordance with ASC 740, deferred tax assets are to be reduced by a valuation allowance if, based on the weight of available evidence, it is more likely than not that some portion or all of the deferred tax assets will not be realized. The realization of the tax benefit depends upon the existence of sufficient taxable income within the carry-back and carry-forward periods.
Management considered the following items in evaluating the need for a valuation allowance:
| • | Earnings in 2009 and a strong earnings history for many years before 2008. |
| • | While for the three years ended December 31, 2009 there has been a cumulative loss, it was caused entirely by the 2008 loss, which was partly comprised of losses attributable to discontinued operations, as well as other losses not considered to be recurring or reflective of prospective earnings. The 2008 loss for continuing operations included the following items: goodwill and intangible impairment charges of $133.2 million and losses on the sale of the non-strategic loans portfolio in Southern California of $160.6 million. These losses will not recur and, as such, will not affect future earnings. |
| • | Deferred tax assets are expected to reverse in periods when there will be taxable income. |
| • | The Company projects future taxable income to be generated by operations. |
| • | No loss of significant customers. |
| • | Certain tax planning strategies are available, such as reducing investments in tax exempt securities. |
| • | The Company has not had any operating loss or tax credit carry-overs expiring unused in recent years. The Company carried back the entire 2008 tax loss and obtained a federal tax refund. |
The Company believes that it is more likely than not that the net deferred tax asset will be realized based primarily on the generation of future taxable income. The net deferred tax asset at December 31, 2009 and 2008 is net of a valuation allowance for capital losses. The Company incurred a capital loss from the sale of Gibraltar
40
Table of Contents
in 2009 and recognized a potential capital loss on its equity method investment, Coldstream, in 2008. Capital losses are deductible to the extent of offsetting capital gains and the Company does not anticipate that it will generate capital gains in future periods. Therefore, the Company has recorded a valuation allowance on capital losses in excess of capital gains as of December 31, 2009 and 2008.
Net Interest Income and Margin
Net interest income represents the difference between interest earned, primarily on loans and investments, and interest paid on funding sources, primarily deposits and borrowings. Interest rate spread is the difference of the average rate earned on total interest earning assets and the average rate paid on total interest-bearing liabilities. Net interest margin is the amount of net interest income, on a fully taxable-equivalent (“FTE”) basis, expressed as a percentage of average interest-earning assets. The average rate earned on earning assets is the amount of taxable equivalent interest income expressed as a percentage of average earning assets. The average rate paid on interest-bearing liabilities is equal to interest expense expressed as a percentage of average interest-bearing liabilities. The following table sets forth the composition of the Company’s net interest margin for the years ended December 31, 2009, 2008, and 2007.
| Year Ended December 31, | |||||||||||||||||||||||||||
| 2009 | 2008 | 2007 | |||||||||||||||||||||||||
| Average Balance |
Interest Earned/ Paid(3) |
Avg. Rate(3) |
Average Balance |
Interest Earned/ Paid(3) |
Avg. Rate(3) |
Average Balance |
Interest Earned/ Paid(3) |
Avg. Rate(3) |
|||||||||||||||||||
| (In thousands) | |||||||||||||||||||||||||||
| ASSETS |
|||||||||||||||||||||||||||
| Earning assets: |
|||||||||||||||||||||||||||
| Cash and investments(1)(4) |
$ | 1,127,045 | $ | 30,530 | 2.71 | % | $ | 894,128 | $ | 35,901 | 4.02 | % | $ | 723,977 | $ | 35,738 | 4.94 | % | |||||||||
| Loans:(2)(5) |
|||||||||||||||||||||||||||
| Commercial and construction(1) |
2,609,118 | 154,358 | 5.92 | % | 2,607,435 | 172,757 | 6.63 | % | 2,218,840 | 180,036 | 8.11 | % | |||||||||||||||
| Residential mortgage |
1,370,119 | 72,214 | 5.27 | % | 1,294,124 | 72,177 | 5.58 | % | 1,147,124 | 59,565 | 5.19 | % | |||||||||||||||
| Home equity and other consumer |
206,343 | 9,321 | 4.52 | % | 154,157 | 9,888 | 6.41 | % | 102,808 | 7,836 | 7.62 | % | |||||||||||||||
| Total earning assets |
5,312,625 | 266,423 | 5.01 | % | 4,949,844 | 290,723 | 5.87 | % | 4,192,749 | 283,175 | 6.75 | % | |||||||||||||||
| Less: Allowance for loan losses |
70,771 | 66,972 | 39,710 | ||||||||||||||||||||||||
| Non-interest bearing cash and due from banks |
25,677 | 53,417 | 61,478 | ||||||||||||||||||||||||
| Other assets(3)(4)(5) |
688,852 | 2,066,375 | 2,107,021 | ||||||||||||||||||||||||
| Total assets |
$ | 5,956,383 | $ | 7,002,664 | $ | 6,321,538 | |||||||||||||||||||||
| LIABILITIES AND STOCKHOLDERS’ EQUITY |
|||||||||||||||||||||||||||
| Interest-bearing liabilities: |
|||||||||||||||||||||||||||
| Deposits: |
|||||||||||||||||||||||||||
| Savings and NOW |
$ | 457,280 | 3,240 | 0.71 | % | $ | 484,182 | 6,974 | 1.44 | % | $ | 439,419 | 8,019 | 1.82 | % | ||||||||||||
| Money market |
1,315,082 | 19,518 | 1.48 | % | 1,129,668 | 30,534 | 2.70 | % | 1,319,319 | 42,429 | 3.22 | % | |||||||||||||||
| Certificates of deposit |
1,525,844 | 36,114 | 2.37 | % | 1,189,606 | 44,088 | 3.71 | % | 953,624 | 45,889 | 4.81 | % | |||||||||||||||
| Borrowed funds |
1,058,249 | 40,957 | 3.87 | % | 1,440,972 | 51,572 | 3.58 | % | 945,849 | 42,830 | 4.53 | % | |||||||||||||||
| Total interest-bearing liabilities |
4,356,455 | 99,829 | 2.29 | % | 4,244,428 | 133,168 | 3.14 | % | 3,658,211 | 139,167 | 3.80 | % | |||||||||||||||
| Noninterest bearing demand deposits |
846,916 | 655,030 | 607,359 | ||||||||||||||||||||||||
| Payables and other liabilities(3) |
62,599 | 1,420,180 | 1,424,348 | ||||||||||||||||||||||||
| Total liabilities |
5,265,970 | 6,319,638 | 5,689,918 | ||||||||||||||||||||||||
| Redeemable noncontrolling interests |
42,119 | 50,893 | 46,562 | ||||||||||||||||||||||||
| Stockholders’ equity |
648,294 | 632,133 | 585,058 | ||||||||||||||||||||||||
| Total liabilities, redeemable noncontrolling interests and stockholders’ equity |
$ | 5,956,383 | $ | 7,002,664 | $ | 6,321,538 | |||||||||||||||||||||
| Net interest income, FTE basis |
$ | 166,594 | $ | 157,555 | $ | 144,008 | |||||||||||||||||||||
| Less: FTE adjustment |
7,109 | 7,327 | 7,015 | ||||||||||||||||||||||||
| Net interest income |
$ | 159,485 | $ | 150,228 | $ | 136,993 | |||||||||||||||||||||
| Interest rate spread |
2.72 | % | 2.73 | % | 2.95 | % | |||||||||||||||||||||
| Net interest margin |
3.14 | % | 3.18 | % | 3.44 | % | |||||||||||||||||||||
41
Table of Contents
| (1) | Interest income on non-taxable investments and certain loans is presented on a FTE basis using the federal statutory rate of 35% for each year presented. |
| (2) | Loans held for sale are included with loans in the average balance sheets above. |
| (3) | Assets and liabilities of discontinued operations are included in other assets in the average balance sheets above. Interest income, interest expense and average yields exclude discontinued operations. |
| (4) | Unrealized gains and losses on investment securities are included in other assets in the average balance sheets above. |
| (5) | Non-accrual loans are included with other assets in the average balance sheets above. The average balances of non-accrual loans were $78.9 million, $74.7 million, and $15.1 million for the years ended December 31, 2009, 2008, and 2007, respectively. |
The following table describes the extent to which changes in interest rates and changes in the volume of interest-earning assets and interest-bearing liabilities have affected the Company’s interest income and interest expense during the periods indicated. Information is provided in each category with respect to (i) changes attributable to changes in volumes (changes in average balance multiplied by prior year average rate) and (ii) changes attributable to changes in rate (change in average interest rate multiplied by prior year average balance). Changes attributable to the combined impact of volumes and rates have been allocated proportionately to separate volume and rate categories.
| 2009 vs. 2008 | 2008 vs. 2007 | |||||||||||||||||||||||
| Change Due To | Change Due To | |||||||||||||||||||||||
| Rate | Volume | Total | Rate | Volume | Total | |||||||||||||||||||
| (In thousands) | ||||||||||||||||||||||||
| Interest income on interest-earning assets: |
||||||||||||||||||||||||
| Cash and investments |
$ | (11,478 | ) | $ | 7,077 | $ | (4,401 | ) | $ | (6,340 | ) | $ | 6,624 | $ | 284 | |||||||||
| Loans: |
||||||||||||||||||||||||
| Commercial and construction |
(19,260 | ) | 109 | (19,151 | ) | (35,969 | ) | 28,257 | (7,712 | ) | ||||||||||||||
| Residential mortgage |
(4,081 | ) | 4,118 | 37 | 4,620 | 7,992 | 12,612 | |||||||||||||||||
| Home equity and other consumer loans |
(3,383 | ) | 2,816 | (567 | ) | (1,391 | ) | 3,443 | 2,052 | |||||||||||||||
| Total interest income |
(38,202 | ) | 14,120 | (24,082 | ) | (39,080 | ) | 46,316 | 7,236 | |||||||||||||||
| Interest expense on interest-bearing liabilities: |
||||||||||||||||||||||||
| Deposits: |
||||||||||||||||||||||||
| Savings and NOW |
$ | (3,366 | ) | $ | (368 | ) | $ | (3,734 | ) | $ | (1,806 | ) | $ | 761 | $ | (1,045 | ) | |||||||
| Money market |
(15,425 | ) | 4,409 | (11,016 | ) | (6,257 | ) | (5,638 | ) | (11,895 | ) | |||||||||||||
| Certificates of deposit |
(18,459 | ) | 10,485 | (7,974 | ) | (11,803 | ) | 10,002 | (1,801 | ) | ||||||||||||||
| Borrowed funds |
3,936 | (14,551 | ) | (10,615 | ) | (10,323 | ) | 19,065 | 8,742 | |||||||||||||||
| Total interest expense |
(33,314 | ) | (25 | ) | (33,339 | ) | (30,189 | ) | 24,190 | (5,999 | ) | |||||||||||||
| Net interest income |
$ | (4,888 | ) | $ | 14,145 | $ | 9,257 | $ | (8,891 | ) | $ | 22,126 | $ | 13,235 | ||||||||||
Net Interest Income. Net interest income increased 6% from 2008 to 2009, and 10% from 2007 to 2008. The growth in net interest income for 2009 was accomplished through growing the Company’s interest earning assets which were primarily funded by increased deposits. The growth in net interest income for 2008 was accomplished through growing the Company’s interest earning assets, primarily loans, which were funded by additional FHLB borrowings and, to a lesser extent, by deposits. The Company’s net interest margin, on a FTE basis, decreased 4 basis points to 3.14% in 2009 from 3.18% in 2008 and decreased 26 basis points in 2008 from 3.44% in 2007. The decrease in the Company’s net interest margin in 2009 as compared to 2008 is a result of several factors including a higher percentage of the Company’s assets in lower yielding short-term liquid investments, lower rates earned on residential mortgages as adjustable rate mortgages have reset with lower rates, as well as the increase in non-performing loans. These declines in interest income have been partially offset by the higher percentage of interest bearing liabilities that have shifted to lower cost deposits from borrowed funds, as well as by the steep yield curve. The decrease in the Company’s net interest margin in 2008 as compared to 2007 is a result of the increase in non-performing assets in 2008 as well as the compression due to the decline in short-term interest rates.
42
Table of Contents
Interest and Dividend Income. Interest and dividend income decreased 8%, from 2008 to 2009, and increased 3% from 2007 to 2008. The 2009 decrease is due primarily to lower rates earned on loans and investments. The 2008 increase is the result of increases in interest income on loans, primarily residential loans, and increases in interest income on investments (taxable investment securities, non-taxable investment securities, mortgage-backed securities, federal funds sold, FHLB dividends, and other).
Interest income on commercial and construction loans decreased in both 2009 and 2008. The 2009 decrease was primarily the result of a 71 basis point decrease in average yield. In 2008, there was a 148 basis point decrease in yield which was partially offset by an 18% increase in the average balance. The average balance of commercial and construction loans in 2009 was fairly flat as compared to 2008 with the increase in commercial loans (real estate and industrial) offsetting the decline in construction and land loans. There were two factors impacting the average balance of construction and land loans; first, at the end of the third quarter of 2008, the Company made a decision to sell the non-strategic construction and land loans at FPB, at the time of transfer to the held for sale category, these non-strategic loans had an approximate book value of $253.0 million. The decline in the average balance in 2009 was impacted by not having these loans on the balance sheet for a full year versus one quarter in 2008. Second, the Banks have either reduced or stopped originating new construction and land loans due to the uncertain economic environment and the additional risk associated with these types of loans. The average balance of commercial loans, primarily real estate and industrial, has increased in 2009 although at a much slower pace than in recent years as the Banks are waiting until their local economic conditions improve as well as many of the Banks’ customers are delevering their own balance sheets. The 2008 increase in the average balance of commercial loans was due to the organic growth of loan portfolios at the Banks and the acquisition of Charter in the third quarter of 2007. The decreases in average yields of commercial and construction loans in 2009 and 2008 were primarily due to the reductions in the Prime rate to which most of the Banks’ commercial, including construction, loans are indexed. The Prime rate has decreased from 8.25% at the beginning of 2007 to 3.25% at the end of 2008, or 500 basis points. There were no changes in the Prime rate in 2009. The rates on the commercial and industrial loans at the New England Bank are indexed to either Prime or the London Interbank Offered Rate (“LIBOR”). The LIBOR rate fluctuates daily and the trend has been a general decline the past three years.
Interest income from residential mortgage loans remained flat in 2009 compared to 2008, and increased 21% in 2008 from 2007. In 2009, a 6% increase in average balance was offset by a 31 basis point decrease in the average yield. The 2008 increase was the result of a 13% increase in average balance and a 39 basis point increase in the average yield. The 2009 decrease in average yield of residential mortgage loans was primarily due to adjustable rate mortgage (“ARM”) loans repricing to lower rates. The decline in U.S. Treasury yields, the index to which the ARMs are typically linked, has decreased the yields on mortgage loans. The increases in the average balances of residential mortgage loans in 2009 and 2008 were due to the organic growth of loan portfolios at the Banks as well as two of the Banks purchasing additional high quality residential mortgage loans. The 2008 increase in the average yield of residential mortgage loans was primarily due to the ARM loans repricing or modifying at higher rates in the earlier half of 2008 or late in 2007 and new originations at higher yields.
Interest income from consumer and other loans decreased 6%, from 2008 to 2009, and increased 26% from 2007 to 2008. The 2009 decrease was the result of a 189 basis point, or 29%, decrease in the average yield offset by a 34% increase in average balance. The 2008 increase was the result of a 50% increase in average balance offset by a 121 basis point decrease in the average yield. The increase in the average balances of consumer and other loans in 2009 and 2008 was due to the organic growth of loan portfolios at the Banks and the acquisition of Charter in the third quarter of 2007. The decrease in the average yields of consumer and other loans in 2009 and 2008 was primarily due to the decreases in the Prime rate during late 2007 and 2008, the rate to which a majority of the home equity loan rates are indexed.
Investment income decreased 14%, from 2008 to 2009 and remained relatively flat from 2007 to 2008. The 2009 decrease was primarily related to a 131 basis point decrease in the average yield, partially offset by a 26% increase in average balance. In 2008, a 24% increase in average balance was offset by a 92 basis point decrease
43
Table of Contents
in the average yield. The increase in the average balances of cash and investments in 2009 and 2008 was primarily due to the Banks increasing their liquidity and in some cases, their investment portfolio as well and the acquisition of Charter in the third quarter of 2007. The decline in the average yields of cash and investments in 2009 and 2008 was primarily due to lower yields on short-term liquid investments such as federal funds and interest bearing accounts as well as longer term investments such as bonds. Investment decisions are made based on anticipated liquidity, loan demand, and asset liability management considerations. The FHLBs to which the Banks belong have not declared any dividends in 2009, except for the FHLB of San Francisco, which declared a dividend in the second quarter of 2009. The Southern and Northern California Banks are members of the FHLB of San Francisco. FHLB dividend income for 2009 was less than $0.1 million. FHLB dividend income for 2008 and 2007 was $1.4 million and $1.8 million, respectively. The Company does not anticipate significant dividend income from its FHLB stock in 2010.
Accrual of interest income is discontinued and all interest previously accrued but not collected is reversed against current period interest income when a loan is initially classified as non-accrual. Interest received on non-accrual loans is either applied against principal or reported as interest income according to management’s judgment as to the collectability of principal. Interest income recorded on non-accrual loans for the year ended December 31, 2009 was $3.2 million. If the non-accrual loans had been on accrual status for the full year or, if originated during the year, since origination, interest income would have been $9.0 million.
Interest income recorded on troubled debt restructured loans, where loans are restructured as a concession to borrowers who have experienced financial difficulty, was $0.2 million for the year ended December 31, 2009. If these loans had been performing normally, the Company would have recorded $0.8 million in interest income for the year ended December 31, 2009.
Interest Expense. Interest paid on deposits and borrowings decreased 25%, from 2008 to 2009 and decreased 4% from 2007 to 2008. The decreases were attributable to the decline in the average rates paid on customer deposits and charged on borrowings and the lower average balance of borrowings in 2009, partially offset by the increase in the average balances of deposits in both 2008 and 2009 and borrowings in 2008.
Interest paid on deposits decreased 28% from 2008 to 2009 and 15% from 2007 to 2008. The 2009 decrease was the result of a 113 basis point decrease in the average rate paid, partially offset by an 18% increase in the average balance. The 2008 decrease was the result of a 64 basis point decrease in the average rate paid, partially offset by a 3% increase in the average balance. The decreases in the average rates paid on deposits in 2009 and 2008 were primarily due to the Banks’ ability to lower interest rates on deposits due to the decline in short-term rates since the fourth quarter of 2007. The increases in the average balances of deposits in 2009 were primarily driven by organic growth of the Banks’ core deposits and retail certificates of deposit. The increase in the average balances of deposits in 2008 was primarily related to the increased brokered deposits at the Banks, which generally have higher rates than retail deposits. As a result of increased concern from depositors over the stability of the banking environment in 2008, the Banks experienced a decline in core deposits, checking and money market accounts. The TLGP instituted in the fourth quarter of 2008 helped to stabilize the deposit environment. The TLGP insures all demand deposit checking accounts and certain NOW accounts. The current TLGP, in which all of the Banks elected to participate, expires on June 30, 2010.
Interest paid on borrowings decreased 21% from 2008 to 2009 and increased 20% from 2007 to 2008. The 2009 decrease was the result of a 27% decrease in average balance, partially offset by a 29 basis point increase in the average rate paid. The decrease in average balance of borrowings in 2009 was primarily the result of the Banks repaying FHLB borrowings with lower cost core deposits, the repurchases of convertible debt in the first half of 2009, and the repurchase of a portion of the Company’s Boston Private Capital Trust I in late 2009. The 2009 decrease in the average rate is primarily due to LIBOR, the rate to which some borrowings are indexed, remaining low during 2009. The 2008 increase was the result of a 52% increase in average balance, offset by a 95 basis point decrease in the average rate paid. The increase in the average balance of borrowings in 2008 was primarily due to the additional FHLB borrowings used to fund a portion of the Banks’ loan portfolio growth in
44
Table of Contents
excess of deposit growth, borrowings used to fund the Charter acquisition in the third quarter of 2007. The 2008 decrease in the average rate is primarily due to LIBOR, the rate to which some borrowings are indexed, decreasing during the year.
Condensed Consolidated Statement of Operations and Discussion
| Year ended December 31, | 2009 vs. 2008 | 2008 vs. 2007 | ||||||||||||||||||||||||
| 2009 | 2008 | 2007 | $ Change | % | $ Change | % | ||||||||||||||||||||
| (In thousands, except share data) | ||||||||||||||||||||||||||
| Net interest income |
$ | 159,485 | $ | 150,228 | $ | 136,993 | $ | 9,257 | 6 | % | $ | 13,235 | 10 | % | ||||||||||||
| Fees and other income: |
||||||||||||||||||||||||||
| Investment management and trust fees |
53,999 | 67,379 | 74,789 | (13,380 | ) | -20 | % | (7,410 | ) | -10 | % | |||||||||||||||
| Wealth advisory fees |
34,834 | 34,644 | 20,322 | 190 | 1 | % | 14,322 | 70 | % | |||||||||||||||||
| Other income |
37,616 | 27,426 | 11,093 | 10,190 | 37 | % | 16,333 | nm | ||||||||||||||||||
| Total fees and other income |
126,449 | 129,449 | 106,204 | (3,000 | ) | -2 | % | 23,245 | 22 | % | ||||||||||||||||
| Total revenues |
285,934 | 279,677 | 243,197 | 6,257 | 2 | % | 36,480 | 15 | % | |||||||||||||||||
| Provision for loan losses |
44,959 | 196,643 | 23,449 | (151,684 | ) | -77 | % | 173,194 | 739 | % | ||||||||||||||||
| Expenses: |
||||||||||||||||||||||||||
| Operating expenses |
221,259 | 213,785 | 184,626 | 7,474 | 3 | % | 29,159 | 16 | % | |||||||||||||||||
| Impairment of goodwill and intangibles |
1,699 | 133,202 | 31,780 | (131,503 | ) | -99 | % | 101,422 | nm | |||||||||||||||||
| Total expenses |
222,958 | 346,987 | 216,406 | (124,029 | ) | -36 | % | 130,581 | 60 | % | ||||||||||||||||
| Income/ (loss) before income taxes |
18,017 | (263,953 | ) | 3,342 | 281,970 | nm | (267,295 | ) | nm | |||||||||||||||||
| Income tax expense/ (benefit) |
1,632 | (70,737 | ) | (6,339 | ) | 72,369 | nm | (64,398 | ) | nm | ||||||||||||||||
| Net income/ (loss) from continuing operations |
16,385 | (193,216 | ) | 9,681 | 209,601 | nm | (202,897 | ) | nm | |||||||||||||||||
| Net loss from discontinued operations |
(7,505 | ) | (191,209 | ) | (1,524 | ) | 183,704 | 96 | % | (189,685 | ) | nm | ||||||||||||||
| LESS: Net income attributable to noncontrolling interests |
3,649 | 4,327 | 3,987 | (678 | ) | -16 | % | 340 | 9 | % | ||||||||||||||||
| Net income/ (loss) attributable to the Company |
$ | 5,231 | $ | (388,752 | ) | $ | 4,170 | $ | 393,983 | nm | $ | (392,922 | ) | nm | ||||||||||||
| Adjustments to net income/ (loss) attributable to the Company to arrive at net (loss)/ income attributable to common shareholders |
$ | (40,231 | ) | $ | (33,029 | ) | $ | — | $ | (7,202 | ) | -22 | % | $ | (33,029 | ) | nm | |||||||||
| Basic and diluted (loss)/earnings per share from continuing operations |
$ | (0.41 | ) | $ | (4.85 | ) | $ | 0.15 | $ | 4.44 | 92 | % | $ | (5.00 | ) | nm | ||||||||||
| Basic and diluted (loss)/earnings per share attributable to the Company’s common shareholders |
$ | (0.52 | ) | $ | (8.87 | ) | $ | 0.11 | $ | 8.35 | 94 | % | $ | (8.98 | ) | nm | ||||||||||
nm - not meaningful
Comparison of Years Ended December 31, 2009, 2008 and 2007
Net Income. The Company reported net income attributable to the Company of $5.2 million in 2009, but recorded a loss of $0.52 per diluted share after accounting for non-cash equity charges and preferred dividends made to arrive at net (loss)/ income attributable to the common shareholder. See Part II, Item 8, “Financial Statements and Supplementary Data—Note 1. Basis of Presentation and Summary of Significant Accounting
45
Table of Contents
Policies” for further detail on the charges made to arrive to income attributable to the common shareholder. In 2008, the Company recorded a net loss attributable to the Company of $388.8 million, or $8.87 per diluted share, and in 2007 the Company recorded net income attributable to the Company of $4.2 million or $0.11 per diluted share. The Company’s 2009 earnings from continuing operations were positively impacted by the pretax gains of $0.4 million recognized from the repurchase of Company’s Notes and $18.3 million recognized from the repurchase of a portion of its Boston Private Capital Trust I securities, enabling revenue streams to outpace expense flows and resulting in positive earnings from continuing operations of $16.4 million. The Company’s 2008 earnings from continuing operations were negatively impacted by non-cash impairment charges and high levels of provision for loan losses and losses related to the decision to sell the non-strategic loans portfolio in Southern California, offset by a gain on the repurchase of debt, resulting in a loss from continuing operations of $193.2 million.
Fees and Other Income. Total fees and other income decreased 2% in 2009 compared to 2008 after increasing 22% in 2008 from 2007. The 2009 decrease is attributable to decreased investment management fees which were partially offset by increases in other income, primarily gains on sales of investments, gains on repurchase of debt, and gains on sales of the non-strategic loans portfolio. The 2008 increase is primarily attributable to increases in wealth advisory fees and in other income, primarily gains recorded from the repurchase of the Company’s Notes and gain on sale of investments. These increases were partially offset by decreased investment management and trust fees.
Investment Management and Trust Fees. Investment management and trust fees decreased 20% in 2009 compared to 2008 and decreased 10% in 2008 from 2007. Although AUM at December 31, 2009 for the Banks and Investment Managers increased 9% from 2008 to $10.5 billion, the average quarter-end AUM was 9% lower in 2009 than the 2008 average. AUM as of December 31, 2008 for the Banks and Investment Managers was $9.6 billion, a decrease of 25% compared to 2007. The 2008 decrease in AUM is attributed to market depreciation of $3.2 billion, offset by net inflows of less than $0.1 billion. Investment management and trust fees from the Banks and Investment Managers are typically calculated based on a percentage of AUM. Two of the four Banks and Investment Managers bill quarterly in advance, while the remainder of the Banks and Investment Managers bill in arrears. Investment management fees billed in advance will not reflect subsequent changes in the market value of AUM for that period, while fees billed in arrears will reflect changes in the market value of AUM for that period.
Wealth Advisory Fees. Wealth advisory fees remained relatively flat in 2009 compared to 2008 and increased 70% in 2008 from 2007. The 2008 increase was attributed to the acquisition of DTC and consolidation of BOS. Assets under advisory managed by the Wealth Advisors were $7.2 billion, $6.2 billion, and $6.4 billion as of December 31, 2009, 2008 and 2007 respectively.
Other Income. Other income increased 37% in 2009 compared to 2008 after increasing more than 100% in 2008 from 2007. Other income is comprised of the Gain on repurchase of debt; Gain on sale of investments, net; Gain on sale of loans, net; Gain on sale of non-strategic loans portfolio, net; and Other on the consolidated statements of operations.
Gain on the repurchase of debt for 2009 and 2008 was $18.7 million and $22.5 million, respectively. The 2009 gain is primarily due to the repurchase of $44.5 million of the Company’s Boston Private Capital Trust I securities during the fourth quarter of 2009. The Company used available cash received from certain of its divestiture transactions to repurchase the Boston Private Capital Trust I securities. The Company also repurchased the remaining $52.4 million of its Notes in 2009. The 2008 gain was due to the $235.1 million repurchase of the Company’s Notes in 2008. The Company repurchased its Notes in 2008 using cash received from the repayment of intercompany notes which were previously made to certain Banks with proceeds from the original issuance of the Notes.
Gain on sale of investments, net for 2009 and 2008 was $5.8 million and $2.4 million, respectively. The reported gains were the result of the declining interest rate environment in 2008, which remained low in 2009. The Banks’ investment portfolios, comprised of mainly fixed rate investments, generally increase in fair value
46
Table of Contents
when interest rates decline. As a result of monitoring their individual investment portfolios, including liquidity and reinvestment risk, the Banks may periodically decide to sell investments which are designated as available for sale.
Gain/(loss) on sale of non-strategic loans portfolio, net relates to a portfolio of 72 non-strategic construction and land loans in Southern California and a portfolio of approximately $20.5 million in non-strategic leases in the Pacific Northwest that were transferred to held-for-sale in 2008. After adjusting the loans to fair value through a charge-off and corresponding provision for loan losses of $160.6 million, the Company sold 52 of the loans in 2008 for a net gain of $7.7 million, which was offset by loss on revaluation of the remaining 18 loans of $9.5 million at December 31, 2008, and the net loss on sale of leases in the Pacific Northwest of $2.5 million. In 2009, the Company transferred three of the remaining non-strategic loans to OREO, two loans were transferred back to the held to maturity portfolio, five loans were sold, four loans had gains recognized when payments were made, of which three were fully paid off, and one had an additional write down taken, for a 2009 net gain on non-strategic loans held for sale of $2.8 million. At December 31, 2009, there were five loans remaining in the non-strategic loans portfolio.
Other income increased 19% in 2009 compared to 2008 and decreased 34% in 2008 from 2007. Fluctuations in Other income are primarily due to the investment gains and losses from the Company’s Rabbi Trust. The Company’s Rabbi Trust was established to offset the Company’s deferred compensation plan liability. The Company’s deferred compensation plan enables certain executives to elect to defer a portion of their income. The amounts deferred are excluded from the employee’s taxable income and are not deductible by the Company until paid. The employee selects from a limited number of mutual funds and the deferred liability is increased or decreased to correspond to the fair value of these underlying hypothetical mutual fund investments. The increase/decrease in value is recognized as compensation expense/benefit. The Rabbi Trust holds similar assets and approximately mirrors the activity in the hypothetical mutual funds. The increase/decrease in the value of the mutual funds in the Rabbi Trust is recognized in other income/loss.
Provision for Loan Losses. The provision for loan losses is determined as a result of the required level of the allowance for loan losses, estimated by management, which reflects the inherent risk of loss in the loan portfolio as of the balance sheet dates. Net charge-offs were $40.6 million and $192.5 million in 2009 and 2008, respectively, as compared to net recoveries of $0.5 million in 2007. The 2008 provision for loan losses was primarily driven by net charge-offs of $160.6 million to record at fair value a portfolio of non-strategic construction and land loans at FPB upon transfer to the held for sale category.
Most of the 2008 provision was related to FPB’s decision to sell its non-strategic construction and land loan portfolio. At the time of the decision to sell this portfolio, the related loans were transferred to the held for sale category at the then fair value. The fair value of the construction and land loans had deteriorated rapidly as a result of the dramatically slowing real estate market in the Inland Empire of California where most of these loans were located. The effect of this deterioration resulted in very significant charge-offs at the time the loans were transferred to the held for sale category. The charge-offs required a very significant increase to the provision for loan losses to absorb the charges.
Although the provision for loan losses declined in 2009 from 2008, the continued high level of classified loans and net charge-offs has required the provision for loan losses to be higher than historical trends. The continued weakness in the real estate market and general economic conditions in Southern and Northern California and the Pacific Northwest accounted for the majority of the impact to the provision for loan losses.
Expenses. Total expenses decreased 36% in 2009 compared to 2008 and increased 60% in 2008 from 2007. The decrease in 2009 and increase in 2008 is primarily attributed to the goodwill and other identifiable intangible impairment charges taken in 2008. Excluding the goodwill and other identifiable intangible impairment charges, operating expenses increased 3% in 2009 compared to 2008 and increased 16% in 2008 from 2007. The 2009 increase is primarily attributed to the additional FDIC insurance assessments at the Banks and additional legal
47
Table of Contents
expenses related to the loan workouts. The 2008 increase is primarily due to the Charter and DTC acquisitions (together “the Acquisitions”), the consolidation of BOS and the warrant expense related to the Company’s private capital raise during the third quarter of 2008.
Salaries and employee benefits, the largest component of operating expenses, decreased 1% in 2009 compared to 2008 after increasing 11% in 2008 from 2007. The decrease in 2009 is primarily related to reduced executive bonuses, reduced commission payments associated with lower investment management fees, and lower stock option expense, offset by higher employee salaries and expenses related to deferred compensation. The increase in 2008 is attributable to the Acquisitions and consolidation of BOS, offset by decreased variable expenses attributable to decreased performance and reductions in the Rabbi Trust deferred compensation amounts.
Professional services increased 7% in 2009 compared to 2008 and increased 59% in 2008 from 2007. The 2009 increase is primarily attributable to increased professional fees associated with loan work out services. If recessionary economic conditions continue, it is likely that the Company will continue to incur increased legal and professional fees associated with loan work out services as compared to historical trends. The 2008 increase is primarily attributable to increased legal and accounting fees and the Acquisitions and consolidation of BOS. Increases in the 2008 legal fees are primarily due to the 2008 re-equitization of Westfield, additional services relating to disclosure requirements based on the Company’s new segment reporting structure, and other corporate legal matters. Increases in the 2008 accounting fees are primarily due to increased audit services and compliance outsourcing.
Impairment of goodwill and identifiable intangibles decreased 99% in 2009 compared to 2008 and was approximately four times more in 2008 than in 2007. The 2009 impairment charge was attributed to the contingent consideration payment made to DTC during the fourth quarter of 2009. The 2008 impairment charges at FPB, Charter, DGHM, and Coldstream resulted from the significant adverse economic environment in 2008, including the declining real estate, credit and equity markets. Please refer to Part II, Item 8, “Financial Statements and Supplementary Data—Note 10: Goodwill and Other Intangible Assets” for a detailed discussion of the triggering events and valuation techniques surrounding the impairments.
FDIC insurance increased in 2009 compared to 2008 as well as in 2008 from 2007. The 2009 increase is primarily due to the special assessment in the second quarter of 2009, higher assessment rates, increased deposits, and the additional cost for the Banks participating in the TLGP. In the second quarter of 2009 there was a $2.5 million special assessment charged by the FDIC. Participating in the TLGP has helped the Banks increase their deposits as customers with balances in excess of the FDIC insurance coverage of $250 thousand can receive 100% FDIC insurance coverage on certain deposit products covered by the TLGP. The mix of deposits and the FDIC’s ratings of the Banks have an effect on the amount of FDIC insurance expense as well. The Company cannot predict whether there will be future special assessments from the FDIC.
Income Tax Expense. The effective tax rate and expense for 2009, 2008 and 2007 are not consistent primarily due to the non-deductibility of a significant amount of goodwill impairment charges that were recorded in 2008 as well as the increases in the proportional amount of tax-exempt income as compared to lower earnings in 2009 and 2007. See Part II, Item 8, “Financial Statements and Supplementary Data—Note 17: Income Taxes” for further details.
Discontinued operations. In 2009, the Company divested its interests in five affiliates—Westfield, Gibraltar, RINET, Sand Hill and BPVI. The Company recorded a pretax gain on sale of these affiliates of $3.1 million and a net loss from discontinued operations of $7.5 million. In 2008 and 2007, the Company recorded net losses from discontinued operations of $191.2 million and $1.5 million, respectively. The 2008 loss was due primarily to goodwill and intangible impairment charges of $153.6 million at Gibraltar and Sand Hill, and $66.0 million in re-equitization charges at Westfield. The 2007 loss was due to losses at Gibraltar related to goodwill impairment charges of $29.1 million, offset by income from operations at the other four divested affiliates of $21.1 million. See Part II, Item 8, “Financial Statements and Supplementary Data—Note 2: Divestitures and Acquisitions” for further details.
48
Table of Contents
Condensed Consolidated Balance Sheets and Discussion
| December 31, | Increase/ (decrease) |
% Change |
|||||||||||
| 2009 | 2008 | ||||||||||||
| (In thousands) | |||||||||||||
| Assets: |
|||||||||||||
| Total cash and investments |
$ | 1,387,483 | $ | 1,132,290 | $ | 255,193 | 23 | % | |||||
| Loans held for sale |
12,714 | 36,846 | (24,132 | ) | -65 | % | |||||||
| Total loans |
4,307,040 | 4,129,081 | 177,959 | 4 | % | ||||||||
| Less: allowance for loan losses |
68,444 | 64,091 | 4,353 | 7 | % | ||||||||
| Net loans |
4,238,596 | 4,064,990 | 173,606 | 4 | % | ||||||||
| Goodwill and intangible assets |
150,117 | 155,051 | (4,934 | ) | -3 | % | |||||||
| Other assets |
260,355 | 315,488 | (55,133 | ) | -17 | % | |||||||
| Assets of continuing operations |
6,049,265 | 5,704,665 | 344,600 | 6 | % | ||||||||
| Assets of discontinued operations |
— | 1,578,170 | (1,578,170 | ) | -100 | % | |||||||
| Total assets |
$ | 6,049,265 | $ | 7,282,835 | $ | (1,233,570 | ) | -17 | % | ||||
| Liabilities and Equity: |
|||||||||||||
| Deposits |
$ | 4,255,219 | $ | 3,748,912 | $ | 506,307 | 14 | % | |||||
| Total borrowings |
992,034 | 1,329,898 | (337,864 | ) | -25 | % | |||||||
| Other liabilities |
99,008 | 88,647 | 10,361 | 12 | % | ||||||||
| Liabilities of continuing operations |
5,346,261 | 5,167,457 | 178,804 | 3 | % | ||||||||
| Liabilities of discontinued operations |
— | 1,416,535 | (1,416,535 | ) | -100 | % | |||||||
| Total liabilities |
5,346,261 | 6,583,992 | (1,237,731 | ) | -19 | % | |||||||
| Redeemable noncontrolling interests |
51,850 | 50,167 | 1,683 | 3 | % | ||||||||
| Total Company’s stockholders’ equity |
651,154 | 648,676 | 2,478 | 0 | % | ||||||||
| Total liabilities, redeemable noncontrolling interests and stockholders’ equity |
$ | 6,049,265 | $ | 7,282,835 | $ | (1,233,570 | ) | -17 | % | ||||
Total Assets. Total assets decreased $1.2 billion, or 17%, to $6.0 billion at December 31, 2009 from $7.3 billion at December 31, 2008. Assets from continuing operations increased $0.3 billion, 6%, to $6.0 billion at December 31, 2009 from $5.7 billion at December 31, 2008. This increase was due to increases in loans and investments, offset by decreased income taxes receivable and deferred and loans held for sale.
Cash and Investments. Total cash and investments (consisting of cash and cash equivalents, investment securities, and stock in the FHLB) increased $255.2 million, or 23%, to $1.4 billion, or 23% of total assets in 2009 from $1.1 billion or 20% of assets from continuing operations in 2008. The increase was primarily due to additional liquidity at the Banks and Holding Company. The additional liquidity at the Banks was the result of deposits growing faster than loans and the Banks not wanting to invest the additional funds in long term investments due to the low interest rate environment and the potential to lose value should rates rise in the short-term. The additional liquidity at the Holding Company was primarily the result of the proceeds received from the divestitures of Westfield, Gibraltar, RINET, Sand Hill, and BPVI.
Investment maturities, principal payments and sales of the Company’s available for sale and held to maturity securities provided $0.7 billion of cash proceeds, and $0.7 billion was deployed on purchases of new investments. The timing of sales and reinvestments is based on various factors, including management’s evaluation of interest rate trends and the Company’s liquidity. The Company’s available for sale investment portfolio carried a total of $13.1 million of unrealized gains and $1.9 million of unrealized losses at December 31, 2009, compared to $15.0 million of unrealized gains and $0.8 million of unrealized losses at December 31, 2008.
49
Table of Contents
The Banks’ investment policies require management to maintain a portfolio of securities which will provide liquidity necessary to facilitate funding of loans and to cover deposit fluctuations, and to mitigate the Banks’ overall balance sheet exposure to interest rate risk, while at the same time achieving a satisfactory return on the funds invested. The securities in which the Banks may invest are subject to regulation and are generally limited to securities that are considered “investment grade”. In addition, the Banks have internal investment policies which restrict investments to the following categories: U.S. Treasury securities and obligations of U.S. government agencies; obligations of government sponsored entities; mortgage-backed securities, including securities issued by the Federal National Mortgage Association (“FNMA”), the Government National Mortgage Association (“GNMA”) and the Federal Home Loan Mortgage Corporation (“FHLMC”), securities of states and political subdivisions and corporate debt, all of which must be considered investment grade by a recognized rating service. The credit rating of each security or obligation in the portfolio is monitored and reviewed by each Bank’s portfolio manager and Asset/Liability Management Committee.
At December 31, 2009 and 2008, the amount of investment securities in an unrealized loss position greater than 12 months as well as the total amount of unrealized losses was not significant and was primarily due to movements in interest rates. The Company has no intent to sell any securities in an unrealized loss position at December 31, 2009 and it is not more likely than not that the Company would be forced to sell any of these securities prior to the full recovery of all unrealized loss amounts. Subsequent to December 31, 2009 and through the date of the filing of this Annual Report on Form 10-K, no securities were downgraded to below investment grade. The Company has determined that none of its available for sale or held to maturity investments were other-than-temporarily impaired at December 31, 2009 and 2008. At December 31, 2009 there were no equity or cost method investments, which are included in other assets, that were other-than-temporarily impaired. See Part II, Item 8, “Financial Statements and Supplementary Data—Note 4: Investment Securities” for further information.
The majority of the investments held by the Company are within the Private Banking segment and, at times, the Holding Company. The Investment Managers and Wealth Advisors held approximately $0.4 million in other available for sale securities and approximately $4.0 million in held to maturity securities at December 31, 2009.
The following table summarizes the Company’s carrying value (fair value) of available for sale investments and carrying value (amortized cost) of held to maturity investments at the dates indicated:
| December 31, | |||||||||
| 2009 | 2008 | 2007 | |||||||
| (In thousands) | |||||||||
| Available for sale: |
|||||||||
| Mortgage-backed securities(1) |
$ | 311,511 | $ | 281,355 | $ | 52,992 | |||
| Government-sponsored entities |
188,394 | 268,570 | 326,312 | ||||||
| U.S. government and agencies(2) |
184,722 | 8,574 | 12,205 | ||||||
| Municipal bonds |
184,544 | 212,943 | 232,616 | ||||||
| Corporate bonds |
15,943 | 23,233 | 27,012 | ||||||
| Other |
2,918 | 4,351 | 2,895 | ||||||
| Total available for sale |
$ | 888,032 | $ | 799,026 | $ | 654,032 | |||
| Held to maturity: |
|||||||||
| U.S. government and agencies(2) |
$ | 4,001 | $ | 3,999 | $ | 1,998 | |||
| Other |
500 | 500 | 500 | ||||||
| Total held to maturity |
$ | 4,501 | $ | 4,499 | $ | 2,498 | |||
| (1) | Most mortgage-backed securities are guaranteed by Government-sponsored entities or U.S. agencies. |
| (2) | Includes money market mutual fund that invests in U.S. government securities. |
50
Table of Contents
The following table presents the concentration of securities with any one issuer that exceeds ten percent of stockholders’ equity as of December 31, 2009:
| Amortized Cost |
Fair Value | |||||
| (In thousands) | ||||||
| U.S. Treasury |
$ | 182,047 | $ | 182,059 | ||
| Government National Mortgage Association |
165,045 | 169,200 | ||||
| Federal National Mortgage Association |
165,485 | 166,015 | ||||
| Federal Home Loan Mortgage Corporation |
80,515 | 81,165 | ||||
| Federal Home Loan Bank |
67,268 | 67,521 | ||||
| Total |
$ | 660,360 | $ | 665,960 | ||
Loans Held for Sale. Loans held for sale decreased $24.1 million, or 65%, from the prior year to $12.7 million. This decrease was primarily the result of the Company continuing to dispose of its non-strategic loans portfolio in Southern California that was classified as held for sale in the third quarter of 2008. In the normal course of business, the Banks sell a majority of their fixed rate residential loan originations and hold most variable rate loans to mitigate interest rate risk. The Southern California non-strategic loans portfolio held for sale decreased $23.7 million, or 87%, to five loans with a carrying value of $3.6 million at December 31, 2009 from 18 loans with a carrying value of $27.2 million at December 31, 2008. The Company continues to actively market the sale of the remaining loans. The remaining loans held for sale are fixed rate residential real estate loans which are carried at the lower of aggregate cost or fair value. These loans are generally sold on a no recourse and servicing retained basis. Mortgage servicing rights recorded in connection with loans sold are not significant.
Deposits. Total deposits increased $506.3 million, or 14% from prior year to $4.3 billion. The increase in deposits is primarily driven by the organic growth in deposits, primarily retail, at the Banks. The participation by the Banks in the FDIC’s TAGP contributed to the increase. As long as there are no regulatory restrictions, the Banks use wholesale deposits such as brokered certificates of deposit to a limited extent when the rates and availability are more favorable than traditional retail deposits or borrowings from the FHLB.
Deposits are the principal source of the Banks’ funds for use in lending, investments, and liquidity. Certificates of deposits represented approximately 34% and 36% of total deposits at December 31, 2009 and 2008, respectively. See Part II, Item 8, “Financial Statements and Supplementary Data—Note 11: Deposits” for further information.
The following table sets forth the average balances and interest rates paid on the Banks’ deposits:
| Year Ended December 31, 2009 |
||||||
| Average Balance |
Average Rate |
|||||
| (In thousands) | ||||||
| Noninterest bearing deposits: |
||||||
| Checking accounts |
$ | 846,916 | 0.00 | % | ||
| Interest bearing deposits: |
||||||
| Savings and NOW |
457,280 | 0.71 | % | |||
| Money market |
1,315,082 | 1.48 | % | |||
| Certificates of deposit under $100,000* |
666,248 | 1.88 | % | |||
| Certificates of deposit of $100,000 or greater |
859,596 | 2.74 | % | |||
| Total deposits |
$ | 4,145,122 | 1.78 | % | ||
| * | Includes brokered CDs |
51
Table of Contents
Certificates of deposit in denominations of $100,000 or greater had the following schedule of maturities:
| December 31, | ||||||
| 2009 | 2008 | |||||
| (In thousands) | ||||||
| Less than 3 months remaining |
$ | 556,499 | $ | 394,352 | ||
| 3 to 6 months remaining |
338,588 | 235,234 | ||||
| 6 to 12 months remaining |
153,102 | 103,706 | ||||
| More than 12 months remaining |
43,001 | 17,186 | ||||
| Total |
$ | 1,091,190 | $ | 750,478 | ||
Borrowings. Total borrowings (consisting of securities sold under agreements to repurchase (“repurchase agreements”), FHLB borrowings, junior subordinated debentures and other long-term debt) decreased 25%, to $1.0 billion, or 16% of total assets in 2009 from $1.3 billion or 23% of assets from continuing operations in 2008.
Junior subordinated debentures and other long-term debt decreased $96.9 million, or 33%, to $193.6 million, or 3% of total assets, in 2009 from $290.6 million, or 5% of assets from continuing operations, in 2008. The Company repurchased $52.4 million of its Notes during 2009. As a result of the repurchases, the Company replaced the debt with lower cost funding. The Company also repurchased $44.5 million of its Boston Private Capital Trust I using available cash. In conjunction with the repurchase of the Notes and a portion of the Boston Private Capital Trust I, the Company realized a pretax gain on retirement of debt of $18.7 million for the year ended December 31, 2009.
FHLB borrowings decreased $190.5 million, or 26%, to $555.0 million, or 9% of total assets, in 2009 from $745.5 million, or 13% of assets of continuing operations, in 2008. The decrease in FHLB borrowings at the Banks was due to deposits growing faster than loans at the Banks in 2009. The Banks prefer to fund new loans with liquidity from deposits as the rates paid on deposits are generally lower than rates on borrowings. In times when loans are growing faster than deposits, the Banks may utilize borrowings from the FHLB to fund the excess when alternative funding sources, such as the sale of investments, are not preferable. The Banks may also employ a leverage strategy whereby they pledge existing loans and investments to the FHLBs to increase collateral available to fund future loan demand in excess of deposit growth. In addition, Boston Private Bank may use FHLB borrowings to lock in an interest rate spread over the term of certain commercial loans.
The Banks have established various borrowing arrangements to provide additional sources of liquidity and funding. Management believes that the Banks currently have adequate liquidity available to respond to current demands. As members of a FHLB, the Banks have access to both short and long-term borrowings. As of December 31, 2009, the Banks had $555.0 million of outstanding FHLB borrowings with a weighted average interest rate of 4.17%, compared to $745.5 million of FHLB borrowings outstanding with a weighted average interest rate of 3.58% at December 31, 2008. In addition, the Banks had FHLB borrowings available of $789.3 million. See Part II, Item 8, “Financial Statements and Supplementary Data—Note 12: Federal Home Loan Bank Borrowings” for further information.
The Banks also obtain funds from the sales of securities to institutional investors and deposit customers under repurchase agreements. In 2009, repurchase agreements decreased $50.5 million, or 17%. In a repurchase agreement transaction, the Banks will generally sell an investment security, agreeing to repurchase either the same or a substantially identical security on a specified later date (generally not more than 90 days for institutional investors and overnight for deposit customers) at a price slightly greater than the original sales price. The difference in the sale price and repurchase price is the cost of the use of the proceeds, or interest expense. The investment securities underlying these agreements may be delivered to securities dealers who arrange such transactions as collateral for the repurchase obligation. Repurchase agreements represent a cost competitive
52
Table of Contents
funding source for the Banks. However, the Company is subject to the risk that the borrower of the securities may default at maturity and not return the collateral. In order to minimize this potential risk, the Banks generally deal with large, established investment brokerage firms when entering into such transactions with institutional investors, and deal with established deposit customers on overnight transactions. Repurchase transactions are accounted for as financing arrangements rather than as sales of such securities, and the obligation to repurchase such securities is reflected as a liability in the Company’s consolidated balance sheets. At December 31, 2009, the total amount of outstanding repurchase agreements was $243.4 million with a weighted average interest rate of 1.78%, compared to $293.8 million with a weighted average interest rate of 1.15% at December 31, 2008. See Part II, Item 8, “Financial Statements and Supplementary Data—Note 13: Other Short Term Borrowings” for further information.
From time to time the Banks purchase federal funds from the FHLB and other banking institutions to supplement their liquidity positions. The Banks had unused federal fund lines of credit totaling $166.0 million with correspondent institutions to provide them with immediate access to overnight borrowings. At both December 31, 2009 and 2008, the Banks had no outstanding borrowings under these federal funds lines.
The Banks have also negotiated brokered deposit agreements with several institutions that have nationwide distribution capabilities. At December 31, 2009, the Banks had $146.3 million of brokered deposits (net of premiums paid) outstanding under these agreements. See Part II, Item 7, “Management’s Discussion and Analysis of Financial Condition and Results of Operations: Liquidity.”
Loan Portfolio and Credit Quality
Loans. Total portfolio loans increased $178.0 million, or 4%, to $4.3 billion or 71% of total assets in 2009 from $4.1 billion, or 72% of assets from continuing operations in 2008. The increase in the loan portfolio was less than in previous years as a result of the economic conditions in the markets the Banks are located as well as commercial clients de-levering their balance sheet. The Banks also shifted away from higher risk construction and land loans to high quality residential loans.
The majority of the Company’s loan portfolio is managed by the Banks. Within the Company’s loan portfolio, $2.9 million at December 31, 2009 and $2.6 million at December 31, 2008, or less than 1% of total loans at both dates, are managed by the Holding Company and a nonbanking affiliate partner. Loans managed by the Holding Company and the nonbanking affiliate partner include loans made to certain principals of DGHM, DTC, Anchor, and BOS at market rates and terms.
The Banks specialize in lending to individuals, real estate investors, and middle market businesses, including corporations, partnerships, associations and nonprofit organizations. Loans made by the Banks to individuals may include residential mortgage loans and mortgage loans on investment and vacation properties to individuals, unsecured and secured personal lines of credit, home equity loans, and overdraft protection. Loans made by the Banks to businesses include commercial construction and mortgage loans, revolving lines of credit, working capital loans, equipment financing, and community lending programs. The types and size of loans the Banks originate are limited by regulatory requirements.
The Banks’ loans are affected by the economic and real estate environments in which they are located. Generally commercial, construction, and land loans are affected more than residential loans in an economic downturn, and this is seen in the current economic downturn. Of the Banks’ loans at December 31, 2009, $2.2 billion were in commercial and $0.3 billion were in construction and land loans, compared to $2.2 billion in commercial and $0.4 billion in construction and land loans at December 31, 2008.
53
Table of Contents
Geographic concentration. The Banks primarily serve customers in the geographic region in which they are based. The following table details the Banks’ outstanding loan balance concentrations at December 31, 2009 based on the location of the lender:
| Commercial Loans | Construction and Land Loans |
Residential Mortgage Loans |
Home Equity and Other Consumer Loans |
||||||||||||||||||||||
| Amount | Percent | Amount | Percent | Amount | Percent | Amount | Percent | ||||||||||||||||||
| (In thousands) | |||||||||||||||||||||||||
| New England |
$ | 943,740 | 43 | % | $ | 117,817 | 37 | % | $ | 1,113,842 | 75 | % | $ | 179,792 | 63 | % | |||||||||
| Northern California |
927,074 | 42 | % | 161,839 | 51 | % | 219,394 | 15 | % | 74,192 | 27 | % | |||||||||||||
| Southern California |
231,684 | 10 | % | 7,719 | 3 | % | 124,212 | 8 | % | 20,947 | 7 | % | |||||||||||||
| Pacific Northwest |
111,039 | 5 | % | 28,286 | 9 | % | 37,255 | 2 | % | 5,278 | 2 | % | |||||||||||||
| Eliminations and other, net |
(517 | ) | 0 | % | — | — | — | — | 3,447 | 1 | % | ||||||||||||||
| Total |
$ | 2,213,020 | 100 | % | $ | 315,661 | 100 | % | $ | 1,494,703 | 100 | % | $ | 283,656 | 100 | % | |||||||||
Loan Portfolio Composition and Maturity. The following table sets forth the Banks’ outstanding loan balances for certain loan categories at the dates indicated and the percent of each category to total loans. The table does not include loans from the Holding Company to certain principals of the Company’s subsidiaries or loans at nonbanking affiliate partners.
| 2009 | 2008 | 2007 | 2006 | 2005 | ||||||||||||||||||||||||||
| Amount | Percent | Amount | Percent | Amount | Percent | Amount | Percent | Amount | Percent | |||||||||||||||||||||
| (In thousands) | ||||||||||||||||||||||||||||||
| Commercial loans |
$ | 2,213,537 | 51 | % | $ | 2,158,052 | 52 | % | $ | 1,979,682 | 51 | % | $ | 1,547,466 | 50 | % | $ | 1,288,638 | 49 | % | ||||||||||
| Construction and land loans |
315,661 | 7 | % | 431,717 | 11 | % | 594,920 | 15 | % | 386,906 | 12 | % | 359,464 | 14 | % | |||||||||||||||
| Residential mortgage loans |
1,494,703 | 35 | % | 1,352,881 | 33 | % | 1,211,861 | 31 | % | 1,068,482 | 35 | % | 905,623 | 34 | % | |||||||||||||||
| Home equity and other consumer loans |
280,209 | 7 | % | 183,794 | 4 | % | 114,870 | 3 | % | 87,725 | 3 | % | 88,937 | 3 | % | |||||||||||||||
| Subtotal Bank loans |
4,304,110 | 100 | % | 4,126,444 | 100 | % | 3,901,333 | 100 | % | 3,090,579 | 100 | % | 2,642,662 | 100 | % | |||||||||||||||
| Less: Allowance for loan losses |
68,444 | 64,091 | 59,933 | 33,234 | 29,741 | |||||||||||||||||||||||||
| Net Bank loans |
$ | 4,235,666 | $ | 4,062,353 | $ | 3,841,400 | $ | 3,057,345 | $ | 2,612,921 | ||||||||||||||||||||
Commercial, Construction and Land Loans. Commercial, construction and land loans include working capital loans, equipment financing, term loans, revolving lines of credit, commercial real estate, and construction and land loans.
Residential Mortgage Loans. While the Banks have no minimum size for their mortgage loans, they concentrate their origination activities in the “Jumbo” segment of the market. This segment consists of loans secured by single-family properties in excess of the amount eligible for purchase by the FNMA, which was $0.4 million at December 31, 2009 for the “General” limit and $0.7 million for the “High-Cost” limit. The majority of the Banks’ residential mortgage loans are ARMs. The type of ARM loans the Banks originate generally have a fixed interest rate for the first 3 to 7 years and then adjust annually based on an index such as the U.S. Treasury yields. ARM loans may negatively impact the Banks’ interest income when they reprice if yields on U.S. Treasuries are low as they were in 2009. If rates reset higher, the Banks could see increased delinquencies if customers’ ability to make payments is impacted by the higher payments. Historically, the Banks have had very low delinquencies and charge-offs on residential loans.
54
Table of Contents
While the majority of the Banks’ residential mortgages are originated by the Banks, they occasionally purchase residential mortgages originated elsewhere. Purchasing mortgages is one way the Banks manage the risk levels in their loan portfolios. In 2009, the Banks purchased $79.7 million of residential loans. There were no residential mortgage purchases in 2008.
Home Equity and Other Consumer Loans. Home equity and other consumer loans consist of balances outstanding on home equity loans, consumer loans including personal lines of credit, credit cards and loans arising from overdraft protection extended to individual and business customers. The amount of home equity loans and other consumer loans typically depends on customer demand.
Portfolio mix. During 2009, the Banks had lower loan growth than in recent years as economic conditions have reduced the demand for commercial loans and underwriting standards have become more stringent. Additionally, the Banks have generally reduced or stopped originating construction and land loans. The Banks have made a shift away from higher risk construction and land loans to higher quality residential mortgage loans. This shift in the portfolio mix has affected net interest income as the interest rates on residential mortgage loans are generally lower than rates on commercial, construction and land loans.
The following table discloses the scheduled contractual maturities of loans in the Banks’ portfolios at December 31, 2009. Loans having no stated maturity are reported as due in one year or less. The following table also sets forth the dollar amounts of loans that are scheduled to mature after one year which have fixed or adjustable interest rates.
| Commercial, Construction and Land Loans |
Residential Mortgage Loans |
Home Equity and Other Consumer Loans |
Total Bank Loans | |||||||||||||||||||||
| Balance | Percent | Balance | Percent | Balance | Percent | Balance | Percent | |||||||||||||||||
| (In thousands) | ||||||||||||||||||||||||
| Amounts due: |
||||||||||||||||||||||||
| One year or less |
$ | 633,233 | 25 | % | $ | 1,103 | 0 | % | $ | 62,105 | 22 | % | $ | 696,441 | 16 | % | ||||||||
| After one through five years |
743,876 | 29 | % | 4,243 | 0 | % | 62,188 | 22 | % | 810,307 | 19 | % | ||||||||||||
| Beyond five years |
1,152,089 | 46 | % | 1,489,357 | 100 | % | 155,916 | 56 | % | 2,797,362 | 65 | % | ||||||||||||
| Total |
$ | 2,529,198 | 100 | % | $ | 1,494,703 | 100 | % | $ | 280,209 | 100 | % | $ | 4,304,110 | 100 | % | ||||||||
| Interest rate terms on amounts due after one year: |
||||||||||||||||||||||||
| Fixed |
$ | 684,551 | 36 | % | $ | 138,503 | 9 | % | $ | 33,176 | 15 | % | $ | 856,230 | 24 | % | ||||||||
| Adjustable |
1,211,414 | 64 | % | 1,355,097 | 91 | % | 184,928 | 85 | % | 2,751,439 | 76 | % | ||||||||||||
| Total |
$ | 1,895,965 | 100 | % | $ | 1,493,600 | 100 | % | $ | 218,104 | 100 | % | $ | 3,607,669 | 100 | % | ||||||||
Scheduled contractual maturities typically do not reflect the actual maturities of loans. The average maturity of loans is substantially less than their average contractual terms because of prepayments and, in the case of conventional mortgage loans, due on sale clauses, which generally give the Banks the right to declare a loan immediately due and payable in the event, among other things, that the borrower sells the real property subject to the mortgage. The average life of mortgage loans tends to increase when current market rates are substantially higher than rates on existing mortgage loans and decrease when current market rates are substantially lower than rates on existing mortgages (due to refinancing of adjustable-rate and fixed-rate loans at lower rates). Under the latter circumstances, the weighted average yield on loans decreases as higher yielding loans are repaid or refinanced at lower rates. In addition, due to the likelihood that the Banks will, consistent with industry practice, “rollover” a significant portion of commercial real estate and commercial loans at or immediately prior to their maturity by renewing credit on substantially similar or revised terms, the principal repayments actually received
55
Table of Contents
by the Banks are anticipated to be significantly less than the amounts contractually due in any particular period. A portion of such loans also may not be repaid due to the borrowers’ inability to satisfy the contractual obligations of the loan.
The interest rates charged on loans vary with the degree of risk, maturity and amount of the loan, and are further subject to competitive pressures, market rates, the availability of funds, and legal and regulatory requirements. At December 31, 2009, approximately 76% of the Banks’ outstanding loans had interest rates that were either floating or adjustable in nature. See Part II, Item 7A, “Quantitative and Qualitative Disclosures about Market Risk—Interest Rate Sensitivity and Market Risk.”
Allowance for Loan Losses. The following table is an analysis of the Banks’ allowances for loan losses for the periods indicated:
| Year ended December 31, | ||||||||||||||||||||
| 2009 | 2008 | 2007 | 2006 | 2005 | ||||||||||||||||
| (In thousands) | ||||||||||||||||||||
| Average loans outstanding |
$ | 4,185,580 | $ | 4,055,716 | $ | 3,468,772 | $ | 2,863,360 | $ | 2,455,486 | ||||||||||
| Allowance for loan losses, beginning of year |
$ | 64,091 | $ | 59,933 | $ | 33,234 | $ | 29,741 | $ | 25,021 | ||||||||||
| Charged off loans: |
||||||||||||||||||||
| Commercial, construction, and land |
(40,596 | ) | (192,259 | ) | (130 | ) | (837 | ) | (122 | ) | ||||||||||
| Residential mortgage |
(436 | ) | (151 | ) | — | — | — | |||||||||||||
| Home equity and other consumer |
(902 | ) | (386 | ) | (61 | ) | (7 | ) | (128 | ) | ||||||||||
| Total charged-off loans |
(41,934 | ) | (192,796 | ) | (191 | ) | (844 | ) | (250 | ) | ||||||||||
| Recoveries on loans previously charged off: |
||||||||||||||||||||
| Commercial and construction |
1,248 | 305 | 664 | 82 | 64 | |||||||||||||||
| Residential mortgage |
69 | — | — | — | — | |||||||||||||||
| Home equity and other consumer |
11 | 6 | 5 | 16 | 16 | |||||||||||||||
| Total recoveries |
1,328 | 311 | 669 | 98 | 80 | |||||||||||||||
| Net loans (charged off)/ recoveries |
(40,606 | ) | (192,485 | ) | 478 | (746 | ) | (170 | ) | |||||||||||
| Provision for loan losses |
44,959 | 196,643 | 23,449 | 4,240 | 4,890 | |||||||||||||||
| Addition due to acquisition |
— | — | 2,772 | — | — | |||||||||||||||
| Allowance for loan losses, end of year |
$ | 68,444 | $ | 64,091 | $ | 59,933 | $ | 33,235 | $ | 29,741 | ||||||||||
| Net loans charged off/ (recovered) to average loans |
0.97 | % | 4.75 | % | -0.01 | % | 0.03 | % | 0.01 | % | ||||||||||
| Allowance for loan losses to total loans |
1.59 | % | 1.55 | % | 1.50 | % | 1.07 | % | 1.13 | % | ||||||||||
| Allowance for loan losses to nonaccrual loans(1) |
0.76 | 1.00 | 1.76 | 4.05 | 5.95 | |||||||||||||||
| (1) | Includes loans in the held for sale category that are on non-accrual status. |
The allowance for loan losses is formulated based on the judgment and experience of management. See Part II, Item 7, “Management’s Discussion and Analysis of Financial Conditions and Results of Operations: Critical Accounting Policies” for details on the Company’s allowance for loan loss policy.
56
Table of Contents
The following table represents the allocation of the Banks’ allowance for loan losses and the percent of loans in each category to total loans as of the dates indicated:
| December 31, | ||||||||||||||||||||||||||||||
| 2009 | 2008 | 2007 | 2006 | 2005 | ||||||||||||||||||||||||||
| Amount | %(1) | Amount | %(1) | Amount | %(1) | Amount | %(1) | Amount | %(1) | |||||||||||||||||||||
| (In thousands) | ||||||||||||||||||||||||||||||
| Loan category: |
||||||||||||||||||||||||||||||
| Commercial, construction and land(2) |
$ | 59,263 | 58 | % | $ | 47,552 | 63 | % | $ | 43,795 | 66 | % | $ | 25,525 | 62 | % | $ | 21,633 | 63 | % | ||||||||||
| Residential mortgage |
5,805 | 35 | % | 7,780 | 33 | % | 6,406 | 31 | % | 5,274 | 35 | % | 3,703 | 34 | % | |||||||||||||||
| Home equity and other consumer(2) |
1,898 | 7 | % | 1,490 | 4 | % | 946 | 3 | % | 689 | 3 | % | 608 | 3 | % | |||||||||||||||
| Unallocated |
1,478 | 7,269 | 8,786 | 1,747 | 3,797 | |||||||||||||||||||||||||
| Total allowance for loan losses |
$ | 68,444 | 100 | % | $ | 64,091 | 100 | % | $ | 59,933 | 100 | % | $ | 33,235 | 100 | % | $ | 29,741 | 100 | % | ||||||||||
| (1) | Percent refers to the amount of loans in each category as a percent of total loans |
| (2) | The Banks originate unsecured loans and loans secured by cash or marketable securities. These loan types may by classified either as consumer or commercial loans. For purposes of this schedule, the allowance associated with these types of loans are included in Commercial, construction, and land loans. |
The increased level of allowance for loan losses, as well as the ratio of the allowance for loan losses to total loans, reflects the higher amount of non-performing and classified loans, particularly in the Northern California region, recent net charge-off trends at a level that is considered higher than the historic norm, and current economic conditions in the Banks’ market areas, partially offset by a smaller required amount of specific reserves on impaired loans, due primarily to charge-offs taken, and the changing mix of the total loan portfolio. An analysis of the risk in the loan portfolio as well as management judgment is used to determine the estimated appropriate amount of the allowance for loan losses. The Company’s affiliate Banks maintain an insignificant amount of unallocated allowance for loan losses in addition to the three primary components of the Company’s allowance for loan losses (General Reserve, Allocated Reserves on non-impaired special-mention and substandard loans, and the Allocated Reserves on impaired loans). The unallocated allowance for loan losses primarily relates to a general assessment of the potential variability of applicable qualitative factors subject to a higher degree of variability. The respective qualitative factors are considered for each respective loan type and only the assessment of the potential variability of applicable qualitative factors is included in the unallocated allowance for loan losses.
In 2009, certain Banking affiliates refined their estimation methodology related to the allocation of the allowance for loan losses to provide for more specific allocation of the allowance. This is the primary reason for the decline in the unallocated portion of the allowance for loan losses as of December 31, 2009 from December 31, 2008. The result was the allocation of the previous unallocated portion of the allowance for loan losses to the specific loan portfolios related to their general assessment of each respective portfolios’ potential variability of applicable qualitative considerations subject to a higher degree of uncertainty. Management does not consider this refinement to the methodology to be significant. The unallocated allowance for loan losses at December 31, 2009 represents only 2.2% of the total allowance for loan losses at that date. See Part II, Item 8, “Financial Statements and Supplementary Data—Note 7: Allowance for Loan Losses” and Part II, Item 7, “Management’s Discussion and Analysis of Financial Condition and Results of Operations: Critical Accounting Policies” for further information.
57
Table of Contents
The following table presents a summary by geography of loans charged off, net of recoveries, for the periods indicated. The geography assigned to the Private Banking data is based on the location of the lender.
| For the year ended December 31, | ||||||||||||||||||||
| 2009 | 2008 | 2007 | 2006 | 2005 | ||||||||||||||||
| (In thousands) | ||||||||||||||||||||
| Net loans (charged off)/ recoveries: |
||||||||||||||||||||
| New England |
$ | (2,495 | ) | $ | (4,003 | ) | $ | (51 | ) | $ | (547 | ) | $ | (39 | ) | |||||
| Northern California |
(8,387 | ) | (407 | ) | (33 | ) | 13 | (86 | ) | |||||||||||
| Southern California |
(13,017 | ) | (185,904 | ) | 575 | (212 | ) | (45 | ) | |||||||||||
| Pacific Northwest |
(16,707 | ) | (2,171 | ) | (13 | ) | — | — | ||||||||||||
| Total net loans (charged off)/ recoveries |
$ | (40,606 | ) | $ | (192,485 | ) | $ | 478 | $ | (746 | ) | $ | (170 | ) | ||||||
Non-performing assets. The Company’s non-performing assets include non-accrual loans, OREO, and repossessed assets. The following table sets forth information regarding non-accrual loans (including loans in the held for sale category), OREO, repossessed assets, loans past due 90 days or more but still accruing, delinquent loans 30-89 days past due as to interest or principal held by the Banks, and troubled debt restructured loans (“TDRs”) at the dates indicated. Reductions in fair values of the collateral for the non-performing assets, if they are collateral dependent, could result in additional future expense depending on the timing and severity of the decline.
| December 31, | ||||||||||||||||||||
| 2009 | 2008 | 2007 | 2006 | 2005 | ||||||||||||||||
| (In thousands) | ||||||||||||||||||||
| Loans accounted for on a non-accrual basis(1) |
$ | 90,338 | $ | 63,990 | $ | 34,115 | $ | 8,201 | $ | 4,998 | ||||||||||
| OREO |
16,600 | 12,838 | 711 | — | — | |||||||||||||||
| Repossessed assets |
— | — | 475 | 550 | — | |||||||||||||||
| Total non-performing assets |
$ | 106,938 | $ | 76,828 | $ | 35,301 | $ | 8,751 | $ | 4,998 | ||||||||||
| Loans past due 90 days or more, but still accruing |
$ | — | $ | — | $ | — | $ | 24 | $ | — | ||||||||||
| Delinquent loans 30-89 days past due |
$ | 21,194 | $ | 18,655 | $ | 18,419 | $ | 12,436 | $ | 6,316 | ||||||||||
| Troubled debt restructured loans(2) |
$ | 8,003 | $ | 1,400 | $ | — | $ | — | $ | — | ||||||||||
| Non-accrual loans as a % of total loans |
2.10 | % | 1.55 | % | 0.85 | % | 0.27 | % | 0.19 | % | ||||||||||
| Non-performing assets as a % of total assets |
1.77 | % | 1.05 | % | 0.51 | % | 0.15 | % | 0.10 | % | ||||||||||
| Delinquent loans 30-89 days past due as a % of total loans |
0.49 | % | 0.45 | % | 0.46 | % | 0.40 | % | 0.24 | % | ||||||||||
| (1) | Includes loans in the held for sale category that are on non-accrual status. |
| (2) | Troubled debt restructured loans are a subset of non-accrual loans. |
A rollforward of non-accrual loans for the years ended December 31, 2009 and 2008 is presented in the table below:
| December 31, | ||||||||
| 2009 | 2008 | |||||||
| (In thousands) | ||||||||
| Non-accrual loans, beginning of year(1) |
$ | 63,990 | $ | 34,115 | ||||
| Transfers in to non-accrual status |
148,249 | 309,967 | ||||||
| Transfers out to OREO |
(28,344 | ) | (14,165 | ) | ||||
| Transfers out to accrual status |
(12,396 | ) | (9,346 | ) | ||||
| Charge offs |
(37,309 | ) | (192,604 | ) | ||||
| Paid off/ paid down |
(43,852 | ) | (63,977 | ) | ||||
| Non-accrual loans, end of year(1) |
$ | 90,338 | $ | 63,990 | ||||
| (1) | Includes loans in the held for sale category that are on non-accrual status. |
58
Table of Contents
The following tables are a summary of the Private Banking credit quality and concentration data by geography of the lender, based on the location of the lender.
| December 31, 2009 |
December 31, 2008 | |||||
| (In thousands) | ||||||
| Non-accrual loans: |
||||||
| New England |
$ | 8,346 | $ | 4,098 | ||
| Northern California |
37,584 | 6,102 | ||||
| Southern California(1) |
21,953 | 37,885 | ||||
| Pacific Northwest |
22,455 | 15,905 | ||||
| Total non-accrual loans |
$ | 90,338 | $ | 63,990 | ||
| Loans 30-89 days past due and accruing: |
||||||
| New England |
$ | 6,658 | $ | 6,641 | ||
| Northern California |
6,799 | 5,080 | ||||
| Southern California |
4,259 | 6,276 | ||||
| Pacific Northwest |
3,478 | 658 | ||||
| Total loans 30-89 days past due |
21,194 | 18,655 | ||||
| Accruing classified loans:(2) |
||||||
| New England |
$ | 14,534 | $ | 2,896 | ||
| Northern California |
14,768 | 4,773 | ||||
| Southern California |
8,117 | 5,474 | ||||
| Pacific Northwest |
15,118 | 19,063 | ||||
| Total accruing classified loans |
$ | 52,537 | $ | 32,206 | ||
| (1) | Includes loans held for sale of $3.6 million and $27.2 million as of December 31, 2009 and December 31, 2008, respectively. |
| (2) | Accruing classified loans include loans that are classified as substandard but are still accruing interest income. The Banks may classify a loan as substandard where known information about possible credit problems of the related borrowers causes management to have doubts as to the ability of such borrowers to comply with the present repayment terms and which may result in disclosure of such loans as nonperforming at some time in the future. |
The following tables are a summary of the Private Banking credit quality and concentration data by loan type. The loan type assigned to the Private Banking credit quality data is based on the purpose of the loan.
| December 31, 2009 |
December 31, 2008 | |||||
| (In thousands) | ||||||
| Non-accrual loans:(1)(5) |
||||||
| Commercial and industrial(2) |
$ | 10,434 | $ | 6,642 | ||
| Commercial real estate(2) |
37,111 | 13,465 | ||||
| Construction and land |
35,406 | 39,602 | ||||
| Residential mortgage |
7,017 | 4,254 | ||||
| Home equity and other consumer |
370 | 27 | ||||
| Total non-accrual loans |
$ | 90,338 | $ | 63,990 | ||
| Loans 30-89 days past due and accruing: |
||||||
| Commercial and industrial(2) |
$ | 6,370 | $ | 3,243 | ||
| Commercial real estate(2) |
1,782 | 7,974 | ||||
| Construction and land |
3,799 | 658 | ||||
| Residential mortgage |
8,346 | 6,353 | ||||
| Home equity and other consumer |
897 | 427 | ||||
| Total loans 30-89 days past due |
21,194 | 18,655 | ||||
| Accruing classified loans:(3) |
||||||
| Commercial and industrial(2) |
$ | 20,884 | $ | 6,470 | ||
| Commercial real estate(2) |
25,225 | 6,755 | ||||
| Construction and land |
6,155 | 18,971 | ||||
| Residential mortgage |
148 | — | ||||
| Home equity and other consumer |
125 | 10 | ||||
| Total accruing classified loans |
$ | 52,537 | $ | 32,206 | ||
59
Table of Contents
| (1) | Includes loans held for sale of $3.6 million and $27.2 million as of December 31, 2009 and December 31, 2008, respectively. |
| (2) | Commercial and industrial loans and Commercial real estate loans are included in the Commercial loans line item on the Consolidated Balance Sheets. |
| (3) | Accruing classified loans include loans that are classified as substandard but are still accruing interest income. The Banks may classify a loan as substandard where known information about possible credit problems of the related borrowers causes management to have doubts as to the ability of such borrowers to comply with the present repayment terms and which may result in disclosure of such loans as nonperforming at some time in the future. |
The Banks’ policy is to discontinue the accrual of interest on a loan when the collectability of principal or interest is in doubt. When management determines that it is probable that the Bank will not collect all principal and interest on a loan in accordance with the original loan terms, the loan is designated as impaired. Impaired loans are generally included within the balance of non-accrual loans. Impaired loans totaled $83.2 million as of December 31, 2009 as compared to $35.2 million at December 31, 2008. In certain instances, although very infrequent, loans that have become 90 days past due may remain on accrual status if the value of the collateral securing the loan is sufficient to cover principal and interest and the loan is in the process of collection. OREO consists of real estate acquired through foreclosure proceedings and real estate acquired through acceptance of a deed in lieu of foreclosure. In addition, the Company may, under certain circumstances, restructure loans as a concession to borrowers who have experienced financial difficulty. Restructured loans are included in impaired loans. These troubled debt restructurings typically result from the Company’s loss mitigation activities and could include rate reductions, payment extensions, and principal forgiveness.
The Company may, under certain circumstances, restructure loans as a concession to borrowers who have experienced financial difficulty. TDRs are included in impaired loans. These TDRs typically result from the Company’s loss mitigation activities and could include rate reductions, payment extensions, and principal forgiveness. TDRs included in impaired loans totaled $8.0 million and $1.4 million at December 31, 2009 and 2008, respectively. At December 31, 2009, the Company had an immaterial amount of commitments to lend additional funds to debtors for loans whose terms had been modified in a troubled debt restructuring and no commitments at December 31, 2008.
Interest income recorded on non-accrual loans and TDRs and interest income that would have been recorded if the non-accrual loans and TDRs had been on accrual status for the full year or, if originated during the year, since origination are presented in the table below.
| Year ended December 31, | |||||||||||||||
| 2009 | 2008 | 2007 | 2006 | 2005 | |||||||||||
| (In thousands) | |||||||||||||||
| Loans accounted for on a non-accrual basis(1) |
$ | 90,338 | $ | 63,990 | $ | 34,115 | $ | 8,201 | $ | 4,998 | |||||
| Interest income recorded during the year on these loans(2) |
3,200 | 6,130 | 1,435 | 287 | 174 | ||||||||||
| Interest income that would have been recorded on these non-accrual loans during the year if the loans had been performing in accordance with their original terms and had been outstanding for the full year or since origination, if held for part of the year |
9,011 | 10,165 | 3,399 | 741 | 273 | ||||||||||
| Troubled debt restructured loans(3) |
8,003 | 1,400 | — | — | — | ||||||||||
| Interest income recorded on TDRs |
211 | 38 | — | — | — | ||||||||||
| Interest income that would have been recorded on TDRs during the year if the loans had been performing in accordance with their original terms and had been outstanding for the full year or since origination, if held for part of the year |
828 | 81 | — | — | — | ||||||||||
| (1) | Includes loans in the held for sale category that are on non-accrual status. |
| (2) | Represents interest income recorded while loans were in a performing status, prior to being placed on non-accrual status. |
| (3) | Troubled debt restructured loans are a subset of non-accrual loans. |
60
Table of Contents
The Banks continue to evaluate the underlying collateral of each non-performing loan and pursue the collection of interest and principal. Where appropriate, the Banks obtain updated appraisals on the collateral. Please refer to Part II, Item 8, “Financial Statements and Supplementary Data—Note 6: Loans Receivable” for further information on non-performing assets.
Delinquencies. Loans 30-89 days past due increased slightly from year end 2008. The increase in loan delinquencies is primarily due to the continued growth in the Banks’ loan portfolios as well as general economic conditions where the Banks are located. The Company believes most of these loans are adequately secured and the payment performance of these borrowers varies from month to month. Further deterioration in the real estate market where the collateral is located or the local economy could lead to these delinquent loans going to non-accrual status and corresponding downgrade of the credit. Downgrades would generally result in additional provisions for loan losses.
Potential Problem Loans. The Company classifies certain loans as “substandard,” “doubtful,” or “loss” based on criteria consistent with guidelines provided by banking regulators. Potential problem loans consist of classified accruing loans that were less than 90 days past due, but where known information about possible credit problems of the related borrowers causes management to have doubts as to the ability of such borrowers to comply with the present loan repayment terms and which may result in disclosure of such loans as nonperforming at some time in the future. These loans are not included in the disclosure of non-accrual or restructured loans above. Management cannot predict the extent to which economic conditions may worsen or other factors which may impact borrowers and the potential problem loans. Accordingly, there can be no assurance that other loans will not become 90 days or more past due, be placed on non-accrual, become restructured, or require increased allowance coverage and provision for loan losses. The Company has identified approximately $52.5 million in potential problem loans at December 31, 2009, as compared to $32.2 million at December 31, 2008.
Liquidity is defined as the Company’s ability to generate cash adequate to meet its needs for day-to-day operations and material long and short-term commitments. Liquidity risk is the risk of potential loss if the Company were unable to meet its funding requirements at a reasonable cost. The Company manages its liquidity based on demand, commitments, specific events and uncertainties to meet current and future financial obligations of a short-term nature. The Company’s objective in managing liquidity is to respond to the needs of depositors and borrowers as well as to earnings enhancement opportunities in a changing marketplace.
Management is responsible for establishing and monitoring liquidity targets as well as strategies to meet these targets. At December 31, 2009, consolidated cash and cash equivalents and securities available for sale, less securities pledged, amounted to $1.0 billion, or 16% of total assets, as compared to $619.1 million, or 11% of assets from continuing operations at December 31, 2008. In addition, the Company has access to available borrowings through the FHLB totaling $789.3 million as of December 31, 2009. Combined, this liquidity totals $1.8 billion, or 29% of assets and 41% of total deposits as of December 31, 2009.
During the fourth quarter of 2008, the Company received $154.0 million in funding through the U.S. Treasury’s CPP through the issuance of the Series C Preferred and the TARP warrants. The Banks have increased total loans and investments in mortgage backed securities by $215.3 million and $97.5 million, respectively, since receiving the funds. In January 2010, the Company repurchased $50.0 million of its $154.0 million of Series C Preferred originally issued to the U.S. Treasury. Upon repurchase, a proportionate amount of the unamortized discount was accelerated, and will reduce per share income attributable to the common shareholder for the first quarter and for the year 2010. If the Company repurchases additional portions of the Series C Preferred, a proportionate amount of the unamortized discount will be accelerated upon repurchase and will further reduce per share income attributable to the common shareholder in the period of repurchase.
61
Table of Contents
Holding Company Liquidity. The Company and several of the Company’s majority-owned affiliate partners hold put and call options that would require the Company to purchase (and the majority-owned affiliate partners to sell) the remaining noncontrolling interests in these companies at the then fair value generally as determined by the respective agreements. These put and call options are discussed in detail in Part II, Item 8, “Financial Statements and Supplementary Data – Note 15: Noncontrolling Interests.” At December 31, 2009, the estimated maximum redemption value for these affiliates related to outstanding put options was approximately $51.9 million, all of which could be redeemed within the next 12 months, and is classified on the consolidated balance sheets as redeemable noncontrolling interests. In January 2010, the Company paid out approximately $29.7 million to KLS pursuant to its put option to require the Company to purchase the remaining 19% interest in KLS along with additional consideration paid for performance targets negotiated in the original agreement with KLS.
The Holding Company’s primary sources of funds are dividends from its affiliate partners, primarily the Investment Managers and Wealth Advisors, access to the capital and debt markets, and private equity investments. Additionally, the Holding Company received contingent consideration related to the divestitures of certain affiliates in 2009, and may receive additional contingent consideration in future years, however divestitures are not ongoing sources of funds for the Holding Company. Dividends from the Banks are limited by various regulatory requirements relating to capital adequacy and retained earnings. See Part II, Item 5, “Market for Registrant’s Common Equity, Related Stockholders Matters, and Issuers Purchases of Equity Securities.”
Although not a significant source of liquidity to the Holding Company, some of the Banks have paid dividends to the Holding Company depending on their profitability and asset growth. If regulatory agencies were to require banks to increase their capital ratios, it may limit the ability of the Banks to pay dividends to the Holding Company and/or limit the amount the Banks could grow.
At December 31, 2009, Holding Company cash, cash equivalents, and securities available for sale amounted to $265.2 million. Management believes that the Company has adequate liquidity to meet its commitments for the foreseeable future, including the payments made in early 2010 to repurchase $50.0 million of its Series C Preferred stock associated with the TARP CPP, and $29.7 million to purchase the additional 19% interest in KLS along with additional consideration paid for performance targets negotiated in the original Agreement with KLS.
The Company is required to pay interest quarterly on its junior subordinated debentures and semi-annually on its long-term debt. The estimated cash outlay for the interest payments in 2010 on the junior subordinated debentures is approximately $10.4 million based on the debt outstanding at December 31, 2009 and estimated interest rates.
The Company presently plans to pay cash dividends on its common stock on a quarterly basis. Based on the current dividend rate and estimated shares outstanding, the Company estimates the amount to be paid out in 2010 for dividends to common stockholders will be approximately $2.8 million. Based on the Company’s preferred stock outstanding after the January 2010 repurchase of $50.0 million of Series C Preferred associated with the TARP CPP and the dividend rate, the Company expects to pay $5.9 million in cash dividends on preferred stock in 2010. The amount of dividends paid on the Series C Preferred would be reduced if the Company repays additional amounts in 2010.
While the Company believes its current and anticipated capital levels are adequate to support its business plan, the capital and credit markets have been experiencing volatility and disruption. In some cases, the markets have produced downward pressure on stock prices and credit availability for certain issuers without regard to those issuers’ underlying financial strength. If current levels of market disruption and volatility continue or worsen, there can be no assurance that the Company will not experience an adverse effect, which may be material, on the Company’s ability to access capital and on the Company’s business, financial condition and results of operations.
62
Table of Contents
Bank Liquidity. The Banks are each a member of their regional FHLB, and as such, have access to short and long-term borrowings from those institutions. At December 31, 2009, the Banks had available credit of $789.3 million from the various FHLBs. Liquid assets (i.e., cash and due from banks, federal funds sold, and investment securities available for sale, net of securities pledged) of the Banks totaled $0.8 billion, which equals 14% of the Banks’ total assets and 18% of the Banks’ total deposits. The FHLB can change the advance amounts that banks can utilize based on the bank’s current financial condition as obtained from publicly available data such as FDIC Call Reports. Decreases in the amount of FHLB borrowings available to the Banks would lower their liquidity and possibly limit the Bank’s ability to grow in the short term. Management believes that the Banks have adequate liquidity to meet their commitments for the foreseeable future.
In addition to the above liquidity, the Banks have access to the Federal Reserve Board’s (“FRB’s”) discount window facility, which can provide short-term liquidity as “lender of last resort,” brokered certificates of deposit, and federal funds lines. In October 2009, the FRB reduced the amount of borrowings that would be available under the discount window facility for all banks for various collateral. This reduction requires the Banks to increase the amount of collateral at the FRB to maintain the same level of borrowing capacity. If the Banks did not provide additional collateral, their borrowing capacity would be reduced. This change did not have a material effect on the Banks’ liquidity. The use of non-core funding sources, including brokered deposits and borrowings, by the Banks may be limited by regulatory agencies. Generally, the regulatory agencies prefer that banks rely on core-funding sources for liquidity.
If the Banks were no longer able to utilize the FHLBs for borrowing, collateral currently used for FHLB borrowings could be transferred to other facilities such as the FRB’s discount window. In addition, the Banks could increase their usage of brokered certificates of deposit. Other borrowing arrangements may have higher rates than the FHLB would typically charge.
Consolidated cash flow comparison for the years ended December 31, 2009 and 2008
Net cash provided by operating activities of continuing operations totaled $133.8 million and $42.1 million for the years ended December 31, 2009 and 2008, respectively. Cash flows from operating activities of continuing operations are generally the cash effects of transactions and other events that enter into the determination of net income of continuing operations. Cash provided by operating activities of continuing operations increased $91.6 million from 2008 to 2009 due primarily to proceeds from the sale of loans held for sale, income from continuing operations, excluding the non-cash impairment charge and the additional provision for loan losses, and federal and state tax refunds, offset by increased loans originated for sale.
Net cash used in investing activities of continuing operations totaled $214.6 million and $537.3 million for the years ended December 31, 2009 and 2008, respectively. Investing activities of the Company include loan activities, investment activities and capital expenditures. Cash used in investing activities of continuing operations decreased $322.7 million from 2008 to 2009 and was due primarily to a decrease in cash used by the Banks’ loan activity, lower net purchases of investments for the Banks’ investment portfolios, and offset by the cash received from the sale of discontinued operations and decreased proceeds from the sale of the non-strategic loans portfolio in Southern California.
Net cash provided by financing activities of continuing operations totaled $172.0 million and $601.4 million for the years ended December 31, 2009 and 2008, respectively. Cash provided by financing activities of continuing operations decreased $429.4 million from 2008 to 2009 due primarily to the 2008 issuances of preferred stock, common stock and warrants to purchase common stock. There were reduced financing activities in 2009 compared to 2008, with increased deposits offset by a decrease in FHLB borrowings.
Net cash provided by (used in) operating activities of discontinued operations totaled $111.5 million and ($121.9) million for the years ended December 31, 2009 and 2008, respectively. Net cash provided by investing activities of discontinued operations totaled $39.6 million and $2.2 million for the years ended December 31, 2009 and 2008, respectively. Net cash (used in) provided by financing activities of discontinued operations totaled ($76.1) million and $139.2 million for the years ended December 31, 2009 and 2008, respectively.
63
Table of Contents
Consolidated cash flow comparison for the years ended December 31, 2008 and 2007
Net cash provided by operating activities of continuing operations totaled $42.1 million and $50.6 million for the years ended December 31, 2008 and 2007, respectively. Cash flows from operating activities are generally the cash effects of transactions and other events that enter into the determination of net income from continuing operations. Cash provided by operating activities of continuing operations decreased $8.4 million from 2007 to 2008 due primarily to lower proceeds from the sale of loans and an increase in the deferred tax asset, offset by increased income from continuing operations excluding the non-cash impairment charges and additional provision for loan losses.
Net cash used in investing activities of continuing operations totaled $537.3 million and $776.9 million for the years ended December 31, 2008 and 2007, respectively. Investing activities of the Company include loan activities, investment activities and capital expenditures. Cash used in investing activities decreased $239.5 million from 2007 to 2008 due primarily to a decrease in cash used by the Banks’ loan activity, partially offset by increases in purchases for the Banks’ investment portfolio, net of sales maturities and calls, as compared to 2007.
Net cash provided by financing activities of continuing operations totaled $601.4 million and $663.2 million for the years ended December 31, 2008 and 2007, respectively. Cash provided by financing activities decreased $61.8 million from 2007 to 2008 due primarily to the 2008 debt repurchases and the 2007 debt issuances, and slower growth in securities sold under agreements to repurchase, offset by the proceeds from the issuance of the preferred stock, common stock and warrants to purchase common stock.
Net cash (used in) provided by operating activities of discontinued operations totaled ($121.9) million and $58.5 million for the years ended December 31, 2008 and 2007, respectively. Net cash provided by (used in) investing activities of discontinued operations totaled $2.2 million and ($139.7) million for the years ended December 31, 2008 and 2007, respectively. Net cash provided by financing activities of discontinued operations totaled $139.2 million and $95.5 million for the years ended December 31, 2008 and 2007, respectively.
Total Company’s stockholders’ equity at December 31, 2009 was $651.2 million, compared to $645.2 million at December 31, 2008, an increase of $6.0 million, or 1%. The increase in the Company’s stockholders’ equity was the result of net income, stock issued for deferred acquisition payments, stock compensation, and stock issued in connection with the Company’s employee stock purchase plan, offset by the change in accumulated other comprehensive income and dividends paid to the Company’s preferred and common stockholders.
As a bank holding company, the Company is subject to various regulatory capital requirements administered by federal agencies. Failure to meet minimum capital requirements can result in certain mandatory, and possibly additional discretionary actions by regulators that, if undertaken, could have a material effect on the Company’s financial statements. For example, under capital adequacy guidelines and the regulatory framework for prompt corrective action, the Banks, which are wholly owned subsidiaries of the Company, must each meet specific capital guidelines that involve quantitative measures of each Bank’s assets and certain off-balance sheet items as calculated under regulatory guidelines. The Banks’ respective capital amounts and classifications are also subject to qualitative judgments by the regulators about components, risk weightings, and other factors. Similarly, the Company is also subject to capital requirements administered by the Federal Reserve with respect to certain nonbanking activities, including adjustments in connection with off-balance sheet items.
To be categorized as “well capitalized,” the Company and the Banks must maintain minimum total risk-based, Tier I risk-based, and Tier I leverage ratios as set forth in the following table. In addition, the Company and the Banks cannot be subject to any written agreement, order or capital directive or prompt corrective action to be considered “well capitalized.” See Part II, Item 8, “Financial Statements and Supplementary Data—Note 23: Regulatory Matters” for further detail.
64
Table of Contents
Although the Company and all of the Banks within the segment maintain capital at levels that would otherwise be considered “well capitalized” under the applicable regulations, for supervisory reasons, the Southern California and Pacific Northwest banks, and therefore the Company, are not deemed “well capitalized.”
The Company contributed an additional $34.0 million of capital during 2009 to certain of its Bank affiliates, and received a dividend of $10.0 million from one of its Banks. The Company also contributed $18.0 million of capital to Gibraltar prior to divestiture. These capital contributions were made to meet applicable regulatory capital requirements and to increase regulatory capital levels given the economic conditions in the regions in which these affiliate Banks operate and increased uncertainty in the local real estate markets.
The schedules below present a detail of the maturities of the Company’s contractual obligations and commitments as of December 31, 2009. See Part II, Item 8, “Financial Statements and Supplementary Data—Notes 12 through 14” for terms of borrowing arrangements and interest rates.
| Payments Due by Period | |||||||||||||||
| Total | Less than 1 Year |
1-3 Years |
3-5 Years |
More than 5 Years | |||||||||||
| (In thousands) | |||||||||||||||
| Federal Home Loan Bank Borrowings |
$ | 555,012 | $ | 158,232 | $ | 233,079 | $ | 98,748 | $ | 64,953 | |||||
| Securities sold under agreements to repurchase |
243,377 | 190,377 | — | 53,000 | — | ||||||||||
| Junior subordinated debentures |
193,645 | — | — | — | 193,645 | ||||||||||
| Operating lease obligations |
73,297 | 12,435 | 23,416 | 16,995 | 20,451 | ||||||||||
| Data processing |
5,803 | 2,626 | 2,409 | 768 | — | ||||||||||
| Bonus and commissions |
4,346 | 3,278 | 1,068 | — | — | ||||||||||
| Other long-term obligations |
1,586 | 918 | 443 | 222 | 3 | ||||||||||
| Total contractual obligations at December 31, 2009 |
$ | 1,077,066 | $ | 367,866 | $ | 260,415 | $ | 169,733 | $ | 279,052 | |||||
The amounts below related to commitments to originate loans, unused lines of credit, and standby letters of credit are at the discretion of the customer and may never actually be drawn upon. The contractual amount of the Company’s financial instruments with off-balance sheet risk are as follows:
| Payments Due by Period | |||||||||||||||
| Total | Less than 1 Year |
1-3 Years |
3-5 Years |
More than 5 years | |||||||||||
| (In thousands) | |||||||||||||||
| Unadvanced portion of loans, unused lines of credit, and commitments to originate loans |
$ | 904,331 | $ | 504,828 | $ | 160,156 | $ | 40,330 | $ | 199,017 | |||||
| Standby letters of credit |
29,432 | 27,358 | 1,236 | 434 | 404 | ||||||||||
| Forward commitments to sell loans |
30,722 | 30,722 | — | — | — | ||||||||||
| Total commitments at December 31, 2009 |
$ | 964,485 | $ | 562,908 | $ | 161,392 | $ | 40,764 | $ | 199,421 | |||||
Off-Balance Sheet Arrangements
The Company and its affiliate partners own equity interests in certain limited partnerships and limited liability companies. Most of these are investment vehicles that are managed by the Company’s investment adviser subsidiaries. The Company accounts for these investments under the equity method of accounting so the total amount of assets and liabilities of the investment partnerships are not included in the consolidated financial statements of the Company.
65
Table of Contents
Impact of Accounting Estimates
Management of the Company is required to make certain estimates and assumptions during the preparation of consolidated financial statements in accordance with accounting principles generally accepted in the U.S. (“GAAP”). These estimates and assumptions impact the reported amount of assets, liabilities and disclosures of contingent assets and liabilities as of the date of the consolidated financial statements. They also impact the reported amount of net earnings during any period. Actual results could differ from those estimates.
Impact of Inflation and Changing Prices
The consolidated financial statements and related notes thereto presented in Part II, Item 8, “Financial Statements and Supplementary Data,” have been prepared in accordance with GAAP, which require the measurement of financial position and operating results in terms of historical dollars without considering changes in the relative purchasing power of money over time due to inflation.
Unlike many industrial companies, substantially all of the assets and liabilities of the Company are monetary in nature. As a result, interest rates have a more significant impact on the Company’s performance than the general level of inflation. Over short periods of time, interest rates may not necessarily move in the same direction or in the same magnitude as inflation.
Recent Accounting Pronouncements
Effective July 1, 2009, the FASB’s ASC became the single official source of authoritative, nongovernmental GAAP. The historical GAAP hierarchy was eliminated and the ASC became the only level of authoritative GAAP, other than guidance issued by the SEC. The Company’s accounting policies were not affected by the conversion to ASC. However, references to specific accounting standards in the footnotes to the Company’s consolidated financial statements have been changed to refer to the appropriate section of ASC.
Effective January 1, 2009, the Company adopted ASC 805, Business Combinations (formerly FAS Statement 141(R), Business Combinations), which provides guidance in accounting for business combinations for which the acquisition date is on or after that date. The Statement had no impact on the Company’s financial position or results of operations during 2009. However, the Company’s accounting for future acquisitions, if any, will be significantly impacted by this standard.
Effective January 1, 2009, the Company adopted updates to ASC 260, Earnings Per Share, (formerly FASB Staff Position No. Emerging Issues Task Force 03-6-1, Determining Whether Instruments Granted in Share-Based Payment Transactions Are Participating Securities) (“ASC 260 updates”), which required unvested share-based payments that contain nonforfeitable rights and dividends or dividend equivalents to be treated as participating securities and be included in the calculation of EPS pursuant to the two-class method. The January 1, 2009 adoption of these ASC 260 updates did not have a material impact on the Corporation’s financial position or results of operations.
In April 2009, the FASB issued updates to ASC 320, Investments—Debt and Equity Securities (formerly FASB Staff Position FAS 115-2 and FAS 124-2, Recognition and Presentation of Other-Than-Temporary Impairments) “ASC 320 updates” to address concerns about evaluating and recognizing other-than-temporary impairments of investments in debt securities. The ASC 320 updates establish a new method of recognizing and reporting other-than-temporary impairments of debt securities. The ASC 320 update also contains additional disclosure requirements. It was effective for interim and annual periods ending after June 15, 2009, and had no material impact on the Company’s financial position or results of operations for 2009.
In June 2009, the FASB issued updates to ASC 860, Transfers and Servicing (formerly FAS 166, Accounting for Transfers of Financial Assets) (“ASC 860 updates”). Among other things, the ASC 860 updates amend ASC 860 (formerly FAS 140, Accounting for Transfers and Servicing of Financial Assets and Extinguishments of Liabilities a replacement of FAS 125) to remove the concept of a qualifying special purpose
66
Table of Contents
entity (“QSPE”) from the prior statement and removes the exception from applying FASB Interpretation No. 46, Consolidation of Variable Interest Entities, to QSPEs. Effective as of January 1, 2010, the ASC 860 updates will not have a material impact on the Company’s financial position or results of operations.
In June 2009, the FASB issued ASC 810, updates to Consolidation, (formerly FAS 167, Amendments to FASB Interpretation No. 46(R), Consolidation of Variable Interest Entities) (“ASC 810”). These updates require an enterprise to perform an analysis to determine whether the enterprise’s variable interest or interests give it a controlling financial interest in a variable interest entity. It determines whether a reporting entity is required to consolidate another entity based on, among other things, the other entity’s purpose and design and the reporting entity’s ability to direct the activities of the other entity that most significantly impact the other entity’s economic performance. These updates are effective on a prospective basis in fiscal years beginning on or after November 15, 2009, and interim periods within those fiscal years, and will be adopted by the Company in the first quarter of fiscal year 2010. The Company is performing an analysis to determine whether any variable interests give the Company a controlling financial interest in such variable interest entity. The impact of adoption will not be material to the Company’s financial position or results of operations.
ITEM 7A. QUANTITATIVE AND QUALITATIVE DISCLOSURES ABOUT MARKET RISK
Interest Rate Sensitivity and Market Risk
The Company considers interest rate risk to be a significant market risk for the Banks. Interest rate risk is the exposure to adverse changes in the net income of the Company as a result of changes in interest rates. Consistency in the Company’s earnings is related to the effective management of interest rate sensitive assets and liabilities due to changes in interest rates, and on the degree of fluctuation of investment management fee income due to movements in the bond and equity markets.
Fee income from investment management and trust services is not directly dependent on market interest rates and may provide the Company a relatively stable source of income in varying market interest rate environments. However, this fee income is generally based upon the value of assets under management and, therefore, can be significantly affected by changes in the values of equities and bonds. Furthermore, performance fees and partnership income earned by some of the Company’s affiliates, as managers of limited partnerships, are directly dependent upon short-term investment performance that can fluctuate significantly with changes in the capital markets. The Company does not have any trading operations for its own account.
In addition to directly impacting net interest income, changes in the level of interest rates can also affect (i) the amount of loans originated and sold by the Company, (ii) the ability of borrowers to repay adjustable rate loans, (iii) the average maturity of loans and mortgage-backed securities, (iv) the rate of amortization of premiums paid on securities and, (v) the amount of unrealized gains and losses on securities available for sale.
The principal objective of the Banks’ asset and liability management is to maximize profit potential while minimizing the vulnerability of its operations to changes in interest rates by means of managing the ratio of interest rate sensitive assets to interest rate sensitive liabilities within specified maturities or repricing dates. The Banks’ actions in this regard are taken under the guidance of their respective Asset/Liability Committees (“ALCO”), which are comprised of members of senior management. These committees are actively involved in formulating the economic assumptions that the Banks use in their respective financial planning and budgeting processes and establish policies which control and monitor the sources, uses and pricing of funds. The Banks may utilize hedging techniques to reduce interest rate risk. See Part II, Item 8 “Financial Statements and Supplementary Data—Note 8: Derivatives” for additional information.
The ALCOs use both interest rate “gap” sensitivity and interest income simulation analysis to measure inherent risk in the Banks’ balance sheets at a specific point in time. The simulations look forward at one and two year increments with gradual and sustained changes in interest rates of up to 200 basis points, and take into
67
Table of Contents
account the repricing, maturity and prepayment characteristics of individual products and investments. The simulation results are reviewed to determine whether the exposure of net interest income to interest rate changes is within the following guidelines: (i) projected net interest income during the first 12 months of the simulation will not be reduced by more than 7% to 10%, dependent on the Bank, and (ii) projected net interest income during the first 24 months of the simulation will not be reduced by more than 10% to 20%, dependent on the Bank. These guidelines are set and monitored at both the ALCO and Board levels. The Banks were in compliance with their applicable guidelines at all times during the year. The ALCOs review the results with regard to the established tolerance levels and recommend appropriate strategies to manage this exposure.
Generally, the Banks hold variable rate mortgage loans. When possible the Banks make use of the secondary mortgage loan market to sell fixed rate mortgages to investors. This provides fee income and reduces interest rate risk. As a hedge against rising interest rates, the Banks may utilize fixed rate borrowings.
As of December 31, 2009, the net interest income simulation indicated that the Banks’ exposure to changing interest rates was within the established tolerance levels described above. While the ALCOs review simulation assumptions to ensure that they reflect historical experience, it should be noted that income simulation may not always prove to be an accurate indicator of interest rate risk because the actual repricing, maturity, and prepayment characteristics of individual products may differ from the estimates used in the simulations. The following table presents the impact of interest rate changes on pro forma net interest income for the Company over a 12 month period:
| Twelve months beginning 1/1/10 | |||||||
| Dollar Change |
Percent Change |
||||||
| (In thousands) | |||||||
| Up 200 basis points |
$ | (978 | ) | -0.55 | % | ||
| Down 100 basis points |
$ | 1,107 | 0.63 | % | |||
| Twelve months beginning 1/1/09 | |||||||
| Dollar Change |
Percent Change |
||||||
| (In thousands) | |||||||
| Up 200 basis points |
$ | (3,336 | ) | -1.87 | % | ||
| Down 100 basis points |
$ | 1,326 | 0.75 | % | |||
Model Methodologies
| • | The base model is built as a static balance sheet simulation. Growth and/or contraction are not incorporated into the base model to avoid masking of the inherent interest rate risk in the balance sheet as it stands at a point in time, however, balance sheet adjustments may be incorporated into the model to reflect anticipated changes in certain balance sheet categories. |
| • | The model utilizes the FHLB, LIBOR, and Treasury yield curves in effect as of December 31, 2009. Other market rates used in this analysis include the Prime rate, which was 3.25%, and Fed Funds rate, which ranged from 0.00% to 0.25%, respectively, at December 31, 2009. All interest rate changes are assumed to occur in the first 12 months and remain flat thereafter. Fed Funds and Treasury yields are floored at 0.01% while Prime is floored at 3.00%. All other market rates (LIBOR, FHLB, Brokered CD) are floored at 0.25% to reflect credit spreads. All points on the treasury yield curve increase/decrease congruently. |
| • | Short-term interest rates (e.g. Prime & Fed Funds) are assumed to drive non-maturity deposit (Savings, NOW and money market accounts) pricing. Term deposit (CD, IRA) pricing changes are reflective of changes in the LIBOR swap and/or FHLB yield curves. For rising and falling rate environments, prepayment speeds accelerate/decelerate over a 12 month period and remain flat thereafter. |
68
Table of Contents
The Banks also use interest rate sensitivity “gap” analysis to provide a general overview of their interest rate risk profile. The effect of interest rate changes on the assets and liabilities of a financial institution may be analyzed by examining the extent to which such assets and liabilities are “interest rate sensitive” and by monitoring an institution’s interest rate sensitivity gap. An asset or liability is said to be interest rate sensitive within a specific time period if it will mature or reprice within that time period. The interest rate sensitivity gap is defined as the difference between interest-earning assets and interest-bearing liabilities maturing or repricing within a given time period. A gap is considered positive when the amount of interest rate sensitive assets exceeds the amount of interest rate sensitive liabilities. A gap is considered negative when the amount of interest rate sensitive liabilities exceeds interest rate sensitive assets. During a period of falling interest rates, a positive gap would tend to adversely affect net interest income, while a negative gap would tend to result in an increase in net income. During a period of rising interest rates, a positive gap would tend to result in an increase in net interest income while a negative gap would tend to affect net interest income adversely.
The Banks have historically sought to maintain a relatively narrow gap position and have, in some instances, foregone investment in higher yielding assets when such investment, in management’s opinion, exposed the Banks to undue interest rate risk. At December 31, 2009, the Company’s overall balance sheet in the short-term was, in theory, liability sensitive. The actual ability to reprice certain interest-bearing liabilities depends on other factors in addition to the movement of interest rates. These factors include competitor’s pricing, the current rate paid on interest-bearing liabilities, and alternative products offered in the financial market place. The Banks do not attempt to perfectly match interest rate sensitive assets and liabilities and will selectively mismatch their assets and liabilities to a controlled degree when they consider such a mismatch both appropriate and prudent. There are a number of relevant time periods in which to measure the gap position, such as at the 30, 60, 90, or 180 day points in the maturity schedule. Management monitors the Banks’ gap position at each of these maturity points, and also tends to focus closely on the gap at the one-year point in making funding decisions. Assumptions based on the historical behavior of deposit rates and balances in relation to changes in interest rates are also incorporated into the repricing schedule. These assumptions are inherently uncertain and, as a result, the repricing schedule cannot precisely measure net interest income or predict the impact of fluctuations in interest rates on net interest income.
69
Table of Contents
The repricing schedule for the Company’s interest-earning assets and interest-bearing liabilities is measured on a cumulative basis. The simulation analysis is based on expected cash flows and repricing characteristics, and incorporates market-based assumptions regarding the impact of changing interest rates on the prepayment speeds of certain assets and liabilities. Actual results will differ from simulated results due to timing, magnitude, and frequency of interest rate changes as well as changes in market conditions and management strategies. The following table presents the repricing schedule for the Company’s interest-earning assets and interest-bearing liabilities at December 31, 2009:
| Within Three Months |
Over Three to Six Months |
Over Six to Twelve Months |
Over One Year to Five Years |
Over Five Years |
Total | ||||||||||||||||||
| (In thousands) | |||||||||||||||||||||||
| Interest earning assets(1): |
|||||||||||||||||||||||
| Interest bearing cash |
$ | 416,746 | $ | 105 | $ | — | $ | — | $ | — | $ | 416,851 | |||||||||||
| Federal funds sold |
544 | — | — | — | — | 544 | |||||||||||||||||
| Investment securities |
262,460 | 63,640 | 118,672 | 354,662 | 93,099 | 892,533 | |||||||||||||||||
| FHLB stock |
47,490 | — | — | — | — | 47,490 | |||||||||||||||||
| Loans held for sale |
8,979 | 167 | 1,073 | 1,215 | 1,280 | 12,714 | |||||||||||||||||
| Loans—Fixed rate |
60,697 | 69,261 | 75,668 | 456,003 | 319,033 | 980,662 | |||||||||||||||||
| Loans—Variable rate |
1,306,023 | 189,862 | 292,126 | 1,241,448 | 296,919 | 3,326,378 | |||||||||||||||||
| Total interest earning assets |
$ | 2,102,939 | $ | 323,035 | $ | 487,539 | $ | 2,053,328 | $ | 710,331 | $ | 5,677,172 | |||||||||||
| Interest bearing liabilites(2): |
|||||||||||||||||||||||
| Savings and NOW accounts(3) |
$ | 507,182 | $ | — | $ | — | $ | — | $ | — | $ | 507,182 | |||||||||||
| Money market accounts |
1,447,811 | — | — | — | — | 1,447,811 | |||||||||||||||||
| Certificates of deposit under $100,000 |
106,655 | 101,782 | 63,321 | 93,767 | 7,835 | 373,360 | |||||||||||||||||
| Certificates of deposit $100,000 or more |
556,499 | 338,588 | 153,102 | 35,991 | 7,010 | 1,091,190 | |||||||||||||||||
| Securities sold under agreements to repurchase |
190,377 | — | — | 53,000 | — | 243,377 | |||||||||||||||||
| FHLB borrowings |
41,109 | 55,921 | 68,669 | 331,566 | 57,747 | 555,012 | |||||||||||||||||
| Junior subordinated debentures and other long-term debt |
26,805 | — | 103,093 | — | 63,747 | 193,645 | |||||||||||||||||
| Total interest bearing liabilities |
$ | 2,876,438 | $ | 496,291 | $ | 388,185 | $ | 514,324 | $ | 136,339 | $ | 4,411,577 | |||||||||||
| Net interest sensitivity gap during the period |
$ | (773,499 | ) | $ | (173,256 | ) | $ | 99,354 | $ | 1,539,004 | $ | 573,992 | $ | 1,265,595 | |||||||||
| Cumulative gap |
$ | (773,499 | ) | $ | (946,755 | ) | $ | (847,401 | ) | $ | 691,603 | $ | 1,265,595 | ||||||||||
| Interest-sensitive assets as a percent of interest-sensitive liabilities (cumulative) |
73.11 | % | 71.93 | % | 77.47 | % | 116.18 | % | 128.69 | % | |||||||||||||
| Cumulative gap as a percent of total assets |
-12.79 | % | -15.65 | % | -14.01 | % | 11.43 | % | 20.92 | % | |||||||||||||
| (1) | Adjustable and floating-rate assets are included in the period in which interest rates are next scheduled to adjust rather than in the period in which they are due, and fixed rate loans are included in the periods in which they are scheduled to mature. |
| (2) | Does not include $835.7 million of demand accounts because they are non-interest bearing. |
| (3) | While savings, NOW and money market accounts can be withdrawn any time, management believes they have characteristics that make their effective maturity longer. |
The preceding table does not necessarily indicate the impact of general interest rate movements on the Banks’ net interest income because the repricing of various assets and liabilities is discretionary and is subject to competitive and other factors. As a result, assets and liabilities indicated as repricing within the same period may in fact reprice at different times and at different rates.
70
Table of Contents
ITEM 8. FINANCIAL STATEMENTS AND SUPPLEMENTARY DATA.
BOSTON PRIVATE FINANCIAL HOLDINGS, INC. AND SUBSIDIARIES
CONSOLIDATED BALANCE SHEETS
| December 31, 2009 |
December 31, 2008 |
|||||||
| (In thousands, except share and per share data) | ||||||||
| Assets: |
||||||||
| Cash and due from banks |
$ | 446,916 | $ | 216,932 | ||||
| Federal funds sold |
544 | 64,343 | ||||||
| Cash and cash equivalents |
447,460 | 281,275 | ||||||
| Investment securities: |
||||||||
| Available for sale (amortized cost of $876,910 and $784,903, respectively) |
888,032 | 799,026 | ||||||
| Held to maturity (fair value of $4,511 and $4,597 respectively) |
4,501 | 4,499 | ||||||
| Total investment securities |
892,533 | 803,525 | ||||||
| Loans held for sale |
12,714 | 36,846 | ||||||
| Loans: |
||||||||
| Commercial |
2,213,020 | 2,156,908 | ||||||
| Construction and land |
315,661 | 431,717 | ||||||
| Residential mortgage |
1,494,703 | 1,352,881 | ||||||
| Home equity and other consumer loans |
283,656 | 187,575 | ||||||
| Total loans |
4,307,040 | 4,129,081 | ||||||
| Less: Allowance for loan losses |
68,444 | 64,091 | ||||||
| Net loans |
4,238,596 | 4,064,990 | ||||||
| Other real estate owned (“OREO”) |
16,600 | 12,838 | ||||||
| Stock in Federal Home Loan Banks |
47,490 | 47,490 | ||||||
| Premises and equipment, net |
28,349 | 28,746 | ||||||
| Goodwill |
108,692 | 105,090 | ||||||
| Intangible assets, net |
41,425 | 49,961 | ||||||
| Fees receivable |
7,320 | 7,179 | ||||||
| Accrued interest receivable |
19,292 | 21,665 | ||||||
| Income tax receivable and deferred |
52,267 | 112,426 | ||||||
| Other assets |
136,527 | 132,634 | ||||||
| Assets of discontinued operations |
— | 1,578,170 | ||||||
| Total assets |
$ | 6,049,265 | $ | 7,282,835 | ||||
| Liabilities: |
||||||||
| Deposits |
$ | 4,255,219 | $ | 3,748,912 | ||||
| Securities sold under agreements to repurchase |
243,377 | 293,841 | ||||||
| Federal Home Loan Bank borrowings |
555,012 | 745,472 | ||||||
| Junior subordinated debentures and other long-term debt |
193,645 | 290,585 | ||||||
| Other liabilities |
99,008 | 88,647 | ||||||
| Liabilities of discontinued operations |
— | 1,416,535 | ||||||
| Total liabilities |
5,346,261 | 6,583,992 | ||||||
| Redeemable Noncontrolling Interests |
51,850 | 50,167 | ||||||
| The Company’s Stockholders’ Equity: |
||||||||
| Preferred stock, $1.00 par value; authorized: 2,000,000 shares; |
||||||||
| Series B, issued (contingently convertible): 401 shares at December 31, 2009 and 2008; liquidation value: $100,000 per share |
58,089 | 33,703 | ||||||
| Series C, issued: 154,000 shares at December 31, 2009 and 2008; liquidation value: $1,000 per share |
146,012 | 144,642 | ||||||
| Common stock, $1.00 par value; authorized: 170,000,000 shares; issued and outstanding: 68,666,263 shares at December 31, 2009 and 63,874,024 shares at December 31, 2008 |
68,666 | 63,874 | ||||||
| Additional paid-in capital |
629,001 | 654,903 | ||||||
| Accumulated deficit |
(258,186 | ) | (263,417 | ) | ||||
| Accumulated other comprehensive income |
7,572 | 11,471 | ||||||
| Total Company’s stockholders’ equity |
651,154 | 645,176 | ||||||
| Noncontrolling interests |
— | 3,500 | ||||||
| Total stockholders’ equity |
651,154 | 648,676 | ||||||
| Total liabilities, redeemable noncontrolling interests and stockholders’ equity |
$ | 6,049,265 | $ | 7,282,835 | ||||
See accompanying notes to consolidated financial statements.
71
Table of Contents
BOSTON PRIVATE FINANCIAL HOLDINGS, INC. AND SUBSIDIARIES
CONSOLIDATED STATEMENTS OF OPERATIONS
| Year Ended December 31, | ||||||||||||
| 2009 | 2008 | 2007 | ||||||||||
| (In thousands, except share and per share data) | ||||||||||||
| Interest and dividend income: |
||||||||||||
| Loans |
$ | 232,017 | $ | 251,698 | $ | 244,746 | ||||||
| Taxable investment securities |
6,566 | 14,089 | 13,633 | |||||||||
| Non-taxable investment securities |
6,041 | 7,798 | 7,809 | |||||||||
| Mortgage-backed securities |
13,487 | 5,951 | 1,868 | |||||||||
| Federal funds sold and other |
1,203 | 3,860 | 8,104 | |||||||||
| Total interest and dividend income |
259,314 | 283,396 | 276,160 | |||||||||
| Interest expense: |
||||||||||||
| Deposits |
58,872 | 81,596 | 96,337 | |||||||||
| Federal Home Loan Bank borrowings |
25,324 | 27,584 | 19,560 | |||||||||
| Junior subordinated debentures and other long-term debt |
12,324 | 18,158 | 18,361 | |||||||||
| Other short-term borrowings |
3,309 | 5,830 | 4,909 | |||||||||
| Total interest expense |
99,829 | 133,168 | 139,167 | |||||||||
| Net interest income |
159,485 | 150,228 | 136,993 | |||||||||
| Provision for loan losses |
44,959 | 196,643 | 23,449 | |||||||||
| Net interest income/(loss) after provision for loan losses |
114,526 | (46,415 | ) | 113,544 | ||||||||
| Fees and other income: |
||||||||||||
| Investment management and trust fees |
53,999 | 67,379 | 74,789 | |||||||||
| Wealth advisory fees |
34,834 | 34,644 | 20,322 | |||||||||
| Gain on repurchase of debt |
18,739 | 22,513 | — | |||||||||
| Gain on sale of investments, net |
5,803 | 2,393 | 2 | |||||||||
| Gain on sale of loans, net |
2,656 | 433 | 1,444 | |||||||||
| Gain/(loss) on sale of non-strategic loans portfolios, net |
2,811 | (4,310 | ) | — | ||||||||
| Other |
7,607 | 6,397 | 9,647 | |||||||||
| Total fees and other income |
126,449 | 129,449 | 106,204 | |||||||||
| Operating expense: |
||||||||||||
| Salaries and employee benefits |
127,707 | 129,001 | 116,318 | |||||||||
| Occupancy and equipment |
26,818 | 24,406 | 22,093 | |||||||||
| Professional services |
19,841 | 18,564 | 11,694 | |||||||||
| Marketing and business development |
6,462 | 7,606 | 7,871 | |||||||||
| Contract services and data processing |
5,271 | 5,104 | 4,249 | |||||||||
| Warrant expense |
— | 2,233 | — | |||||||||
| Amortization of intangibles |
8,289 | 8,070 | 9,049 | |||||||||
| Impairment of goodwill and intangibles |
1,699 | 133,202 | 31,780 | |||||||||
| FDIC insurance |
9,746 | 3,309 | 1,326 | |||||||||
| Other |
17,125 | 15,492 | 12,026 | |||||||||
| Total operating expense |
222,958 | 346,987 | 216,406 | |||||||||
| Income/(loss) before income taxes |
18,017 | (263,953 | ) | 3,342 | ||||||||
| Income tax expense/(benefit) |
1,632 | (70,737 | ) | (6,339 | ) | |||||||
| Net income/(loss) from continuing operations |
16,385 | (193,216 | ) | 9,681 | ||||||||
| Net loss from discontinued operations |
(7,505 | ) | (191,209 | ) | (1,524 | ) | ||||||
| Net income/(loss) before attribution to noncontrolling interests |
8,880 | (384,425 | ) | 8,157 | ||||||||
| Less: Net income attributable to noncontrolling interests |
3,649 | 4,327 | 3,987 | |||||||||
| Net income/(loss) attributable to the Company |
$ | 5,231 | $ | (388,752 | ) | $ | 4,170 | |||||
| Adjustments to net income/(loss) attributable to the Company to arrive at net (loss)/income attributable to common shareholders |
(40,231 | ) | (33,029 | ) | — | |||||||
| Net (loss)/income attributable to common shareholders for (loss)/earnings per share calculation |
$ | (35,000 | ) | $ | (421,781 | ) | $ | 4,170 | ||||
| (Loss)/earnings per share attributable to the Company’s common shareholders: |
||||||||||||
| (Loss)/earnings per share from continuing operations: |
||||||||||||
| Basic and diluted (loss)/earnings per share |
$ | (0.41 | ) | $ | (4.85 | ) | $ | 0.15 | ||||
| Loss per share from discontinued operations: |
||||||||||||
| Basic and diluted loss per share |
$ | (0.11 | ) | $ | (4.02 | ) | $ | (0.04 | ) | |||
| Net (loss)/earnings per share attributable to the Company’s common shareholders: |
||||||||||||
| Basic and diluted (loss)/earnings per share |
$ | (0.52 | ) | $ | (8.87 | ) | $ | 0.11 | ||||
| Average basic common shares outstanding |
66,696,977 | 47,528,418 | 36,731,621 | |||||||||
| Average diluted common shares outstanding |
66,696,977 | 47,528,418 | 38,315,330 | |||||||||
See accompanying notes to consolidated financial statements.
72
Table of Contents
BOSTON PRIVATE FINANCIAL HOLDINGS, INC. AND SUBSIDIARIES
CONSOLIDATED STATEMENTS OF CHANGES IN STOCKHOLDERS’ EQUITY
| Common Stock |
Preferred Stock |
Additional Paid-in Capital |
Retained Earnings/ (Accumulated Deficit) |
Accumulated Other Comprehensive Income/ (Loss) |
Noncontrolling Interests |
Total | |||||||||||||||||||||
| (In thousands, except share data) | |||||||||||||||||||||||||||
| Balance at December 31, 2006 |
$ | 36,590 | $ | — | $ | 385,005 | $ | 176,111 | $ | (2,291 | ) | $ | — | $ | 595,415 | ||||||||||||
| Comprehensive Income: |
|||||||||||||||||||||||||||
| Net income attributable to the Company |
— | — | — | 4,170 | — | — | 4,170 | ||||||||||||||||||||
| Other comprehensive income, net: |
|||||||||||||||||||||||||||
| Change in unrealized gain on securities available for sale, net |
— | — | — | — | 4,401 | — | 4,401 | ||||||||||||||||||||
| Change in unrealized gain on cash flow hedge, net |
— | — | — | — | 778 | — | 778 | ||||||||||||||||||||
| Change in unrealized gain on other, net |
— | — | — | — | 213 | — | 213 | ||||||||||||||||||||
| Total comprehensive income attributable to the Company, net |
9,562 | ||||||||||||||||||||||||||
| Dividends paid to common shareholders: $0.36 per share |
— | — | — | (13,361 | ) | — | — | (13,361 | ) | ||||||||||||||||||
| Net proceeds from issuance of: |
|||||||||||||||||||||||||||
| 1,920,417 shares of common stock |
1,920 | — | 52,847 | — | — | — | 54,767 | ||||||||||||||||||||
| Issuance of 89,952 shares of incentive stock grants |
90 | — | (90 | ) | — | — | — | — | |||||||||||||||||||
| Amortization of incentive stock grants |
— | — | 3,205 | — | — | — | 3,205 | ||||||||||||||||||||
| Amortization of stock options and employee stock purchase plan |
— | — | 6,781 | — | — | — | 6,781 | ||||||||||||||||||||
| Stock options exercised |
340 | — | 4,260 | — | — | — | 4,600 | ||||||||||||||||||||
| Excess tax benefit on stock options exercised |
— | — | 789 | — | — | — | 789 | ||||||||||||||||||||
| Buyback of 1,470,000 shares of common stock |
(1,470 | ) | — | (38,573 | ) | — | — | — | (40,043 | ) | |||||||||||||||||
| Other equity adjustments |
— | — | (2,386 | ) | 43 | — | — | (2,343 | ) | ||||||||||||||||||
| Balance at December 31, 2007 |
37,470 | — | 411,838 | 166,963 | 3,101 | — | 619,372 | ||||||||||||||||||||
| Comprehensive Loss: |
|||||||||||||||||||||||||||
| Net loss attributable to the Company |
— | — | — | (388,752 | ) | — | — | (388,752 | ) | ||||||||||||||||||
| Other comprehensive income/(loss), net: |
|||||||||||||||||||||||||||
| Change in unrealized gain on securities available for sale, net |
— | — | — | — | 6,131 | — | 6,131 | ||||||||||||||||||||
| Change in unrealized gain on cash flow hedge, net |
— | — | — | — | 2,453 | — | 2,453 | ||||||||||||||||||||
| Change in unrealized loss on other, net |
— | — | — | — | (214 | ) | — | (214 | ) | ||||||||||||||||||
| Total comprehensive loss attributable to the Company, net |
(380,382 | ) | |||||||||||||||||||||||||
| Dividends paid to common shareholders: $0.22 per share |
— | — | (635 | ) | (8,180 | ) | — | — | (8,815 | ) | |||||||||||||||||
| Dividends paid to preferred shareholders |
— | — | (715 | ) | (136 | ) | — | — | (851 | ) | |||||||||||||||||
| Net proceeds from issuance of: |
|||||||||||||||||||||||||||
| 18,400,000 shares of common stock related to the public offering |
18,400 | — | 86,480 | — | — | — | 104,880 | ||||||||||||||||||||
| 1,068,649 shares of common stock |
1,069 | — | 13,068 | — | — | — | 14,137 | ||||||||||||||||||||
| 351 shares of convertible Series A Preferred stock |
— | 22,770 | — | — | — | — | 22,770 | ||||||||||||||||||||
| 401 shares of convertible Series B Preferred stock |
— | 26,293 | — | — | — | — | 26,293 | ||||||||||||||||||||
| 154,000 shares of cumulative non-convertible Series C Preferred stock |
— | 144,517 | — | — | — | — | 144,517 | ||||||||||||||||||||
| Conversion of 351 shares of Series A Preferred stock to 6,346,572 shares of common stock |
6,347 | (47,413 | ) | 41,066 | — | — | — | — | |||||||||||||||||||
(continued)
73
Table of Contents
BOSTON PRIVATE FINANCIAL HOLDINGS, INC. AND SUBSIDIARIES
CONSOLIDATED STATEMENTS OF CHANGES IN STOCKHOLDERS’ EQUITY—(Continued)
| Common Stock |
Preferred Stock |
Additional Paid-in Capital |
Retained Earnings/ (Accumulated Deficit) |
Accumulated Other Comprehensive Income/ (Loss) |
Noncontrolling Interests |
Total | |||||||||||||||||||||
| (In thousands, except share data) | |||||||||||||||||||||||||||
| Proceeds from issuance of Carlyle warrants |
— | — | 19,090 | — | — | — | 19,090 | ||||||||||||||||||||
| Proceeds from issuance of TARP warrants |
— | — | 9,328 | — | — | — | 9,328 | ||||||||||||||||||||
| Reclassification of increase in fair value of Carlyle warrants |
— | — | 2,233 | — | — | — | 2,233 | ||||||||||||||||||||
| Accretion of the Beneficial Conversion Feature: |
|||||||||||||||||||||||||||
| Series A Preferred stock |
— | 24,643 | — | (24,643 | ) | — | — | — | |||||||||||||||||||
| Series B Preferred stock |
— | 7,410 | — | (7,410 | ) | — | — | — | |||||||||||||||||||
| Accretion of discount on Series C Preferred stock |
— | 125 | — | (125 | ) | — | — | — | |||||||||||||||||||
| Issuance of 327,348 shares of incentive stock grants |
327 | — | (327 | ) | — | — | — | — | |||||||||||||||||||
| Amortization of incentive stock grants |
— | — | 3,316 | — | — | — | 3,316 | ||||||||||||||||||||
| Amortization of stock options and employee stock purchase plan |
— | — | 6,079 | — | — | — | 6,079 | ||||||||||||||||||||
| Westfield re-equitization awards |
— | — | 62,500 | — | — | — | 62,500 | ||||||||||||||||||||
| Stock options exercised |
261 | — | 1,191 | — | — | — | 1,452 | ||||||||||||||||||||
| Other equity adjustments |
— | — | 391 | (1,134 | ) | — | 3,500 | 2,757 | |||||||||||||||||||
| Balance at December 31, 2008 |
63,874 | 178,345 | 654,903 | (263,417 | ) | 11,471 | 3,500 | 648,676 | |||||||||||||||||||
| Comprehensive Income: |
|||||||||||||||||||||||||||
| Net income attributable to the Company |
— | — | — | 5,231 | — | — | 5,231 | ||||||||||||||||||||
| Other comprehensive income/ (loss), net: |
|||||||||||||||||||||||||||
| Change in unrealized loss on securities available for sale, net |
— | — | — | — | (1,785 | ) | — | (1,785 | ) | ||||||||||||||||||
| Change in unrealized loss on cash flow hedge, net |
— | — | — | — | (1,283 | ) | — | (1,283 | ) | ||||||||||||||||||
| Change in unrealized loss on other, net |
— | — | — | — | (831 | ) | — | (831 | ) | ||||||||||||||||||
| Total comprehensive income attributable to the Company, net |
1,332 | ||||||||||||||||||||||||||
| Dividends paid to common shareholders: $0.04 per share |
— | — | (2,688 | ) | — | — | — | (2,688 | ) | ||||||||||||||||||
| Dividends paid to preferred shareholders |
— | — | (7,862 | ) | — | — | — | (7,862 | ) | ||||||||||||||||||
| Net proceeds from issuance of: 4,015,744 shares of common stock |
4,016 | — | 7,378 | — | — | — | 11,394 | ||||||||||||||||||||
| Accretion of Beneficial Conversion Feature on Series B Preferred stock |
— | 24,428 | (24,428 | ) | — | — | — | — | |||||||||||||||||||
| Accretion of discount on Series C Preferred stock |
— | 1,438 | (1,438 | ) | — | — | — | — | |||||||||||||||||||
| Issuance of 697,327 shares through incentive stock grants |
697 | — | (697 | ) | — | — | — | — | |||||||||||||||||||
| Amortization of incentive stock grants |
— | — | 3,273 | — | — | — | 3,273 | ||||||||||||||||||||
| Amortization of stock options and employee stock purchase plan |
— | — | 3,670 | — | — | — | 3,670 | ||||||||||||||||||||
| Stock options exercised |
79 | — | 262 | — | — | — | 341 | ||||||||||||||||||||
| Other equity adjustments |
— | (110 | ) | (3,372 | ) | — | — | (3,500 | ) | (6,982 | ) | ||||||||||||||||
| Balance at December 31, 2009 |
$ | 68,666 | $ | 204,101 | $ | 629,001 | $ | (258,186 | ) | $ | 7,572 | $ | — | $ | 651,154 | ||||||||||||
See accompanying notes to consolidated financial statements.
74
Table of Contents
BOSTON PRIVATE FINANCIAL HOLDINGS, INC. AND SUBSIDIARIES
CONSOLIDATED STATEMENTS OF CASH FLOWS
| Year Ended December 31, | ||||||||||||
| 2009 | 2008 | 2007 | ||||||||||
| (In thousands) | ||||||||||||
| Cash flows from operating activities: |
||||||||||||
| Net income/(loss) attributable to the Company |
$ | 5,231 | $ | (388,752 | ) | $ | 4,170 | |||||
| Adjustments to arrive at net income/(loss) from continuing operations |
||||||||||||
| Net income attributable to noncontrolling interests |
3,649 | 4,327 | 3,987 | |||||||||
| Net pretax (gain)/loss from operating activities of discontinued operations |
(1,574 | ) | 189,541 | (19,067 | ) | |||||||
| Net pretax gain on sale of discontinued operations |
(3,082 | ) | — | — | ||||||||
| Tax expense from discontinued operations |
12,161 | 1,668 | 20,591 | |||||||||
| Net income/(loss) from continuing operations |
16,385 | (193,216 | ) | 9,681 | ||||||||
| Adjustments to reconcile net income/(loss) from continuing operations to net cash provided by/(used in) operating activities: |
||||||||||||
| Depreciation and amortization |
17,904 | 10,288 | 9,560 | |||||||||
| Net income attributable to noncontrolling interests |
(3,649 | ) | (4,327 | ) | (3,987 | ) | ||||||
| Equity issued as compensation |
6,943 | 9,395 | 9,986 | |||||||||
| Reclassification of increase in fair value of warrants |
— | 2,233 | — | |||||||||
| Impairment of goodwill and intangibles |
1,699 | 133,202 | 31,780 | |||||||||
| Provision for loan losses |
44,959 | 196,643 | 23,449 | |||||||||
| Loans originated for sale |
(288,880 | ) | (118,903 | ) | (135,856 | ) | ||||||
| Proceeds from sale of loans held for sale |
290,903 | 104,176 | 134,116 | |||||||||
| Gain on the repurchase of debt |
(18,739 | ) | (22,513 | ) | — | |||||||
| Decrease/(increase) in income tax receivable and deferred |
60,159 | (73,425 | ) | (21,006 | ) | |||||||
| Net decrease/(increase) in other operating activities |
6,077 | (1,415 | ) | (7,171 | ) | |||||||
| Net cash provided by operating activities of continuing operations |
133,761 | 42,138 | 50,552 | |||||||||
| Net cash provided by/(used in) operating activities of discontinued operations |
111,507 | (121,877 | ) | 58,523 | ||||||||
| Net cash provided by/(used in) operating activities |
245,268 | (79,739 | ) | 109,075 | ||||||||
| Cash flows from investing activities: |
||||||||||||
| Investment securities available for sale: |
||||||||||||
| Purchases |
(741,073 | ) | (3,182,664 | ) | (1,453,817 | ) | ||||||
| Sales |
304,822 | 106,112 | 95 | |||||||||
| Maturities, redemptions, and principal payments |
345,766 | 2,917,449 | 1,385,979 | |||||||||
| Investment securities held to maturity: |
||||||||||||
| Purchases |
(8,027 | ) | (11,533 | ) | (1,997 | ) | ||||||
| Maturities and principal payments |
8,026 | 9,533 | 1,500 | |||||||||
| (Investments)/distributions in trusts, net |
(1,092 | ) | 995 | (1,057 | ) | |||||||
| Purchase of Federal Home Loan Banks stock |
— | (17,141 | ) | (2,154 | ) | |||||||
| Net increase in portfolio loans |
(240,165 | ) | (410,303 | ) | (666,300 | ) | ||||||
| Proceeds from sale of OREO |
24,979 | 1,013 | 1,530 | |||||||||
| Proceeds from sale and repayments of non-strategic loan portfolio, net of advances |
21,367 | 58,357 | — | |||||||||
| Capital expenditures, net of sale proceeds |
(5,587 | ) | (5,106 | ) | (9,048 | ) | ||||||
| Cash paid for acquisitions, including deferred acquisition obligations, net of cash acquired |
(2,744 | ) | (4,017 | ) | (31,582 | ) | ||||||
| Cash received from sale of discontinued operations, net of cash divested |
79,103 | — | — | |||||||||
| Net cash used in investing activities—continuing operations |
(214,625 | ) | (537,305 | ) | (776,851 | ) | ||||||
| Net cash provided by/(used in) investing activities—discontinued operations |
39,626 | 2,219 | (139,720 | ) | ||||||||
| Net cash used in investing activities |
(174,999 | ) | (535,086 | ) | (916,571 | ) | ||||||
(continued)
75
Table of Contents
BOSTON PRIVATE FINANCIAL HOLDINGS, INC. AND SUBSIDIARIES
CONSOLIDATED STATEMENTS OF CASH FLOWS—(Continued)
| Year Ended December 31, | ||||||||||||
| 2009 | 2008 | 2007 | ||||||||||
| (In thousands) | ||||||||||||
| Cash flows from financing activities: |
||||||||||||
| Net increase in deposits |
506,307 | 198,413 | 184,134 | |||||||||
| Net (decrease)/increase in securities sold under agreements to repurchase and other |
(50,464 | ) | 25,501 | 172,150 | ||||||||
| Net (decrease)/increase in federal funds purchased |
— | (6,000 | ) | 6,000 | ||||||||
| Net (decrease)/increase in short-term Federal Home Loan Bank borrowings |
(134,300 | ) | 109,300 | 25,000 | ||||||||
| Advances of long-term Federal Home Loan Bank borrowings |
30,777 | 223,527 | 140,965 | |||||||||
| Repayments of long-term Federal Home Loan Bank borrowings |
(86,937 | ) | (61,327 | ) | (101,863 | ) | ||||||
| Proceeds from issuance of Notes, net of discount |
— | — | 284,625 | |||||||||
| Repurchase of debt |
(76,939 | ) | (210,941 | ) | — | |||||||
| Share buyback |
— | — | (40,043 | ) | ||||||||
| Dividends paid to common shareholders |
(2,688 | ) | (8,815 | ) | (13,361 | ) | ||||||
| Dividends paid to preferred shareholders |
(7,862 | ) | (851 | ) | — | |||||||
| Excess tax benefit from stock options exercised |
— | — | 789 | |||||||||
| Proceeds from issuance of preferred stock, net |
— | 193,580 | — | |||||||||
| Proceeds from issuance of warrants, net |
— | 28,418 | — | |||||||||
| Proceeds from stock option exercises |
341 | 1,452 | 4,600 | |||||||||
| Proceeds from issuance of common stock, net |
769 | 106,431 | 2,557 | |||||||||
| Other equity adjustments |
(6,982 | ) | 2,757 | (2,343 | ) | |||||||
| Net cash provided by financing activities—continuing operations |
172,022 | 601,445 | 663,210 | |||||||||
| Net cash (used in)/provided by financing activities—discontinued operations |
(76,106 | ) | 139,199 | 95,515 | ||||||||
| Net cash provided by financing activities |
95,916 | 740,644 | 758,725 | |||||||||
| Net increase/(decrease) in cash and cash equivalents |
166,185 | 125,819 | (48,771 | ) | ||||||||
| Cash and cash equivalents at beginning of year |
281,275 | 155,456 | 204,227 | |||||||||
| Cash and cash equivalents at end of year |
$ | 447,460 | $ | 281,275 | $ | 155,456 | ||||||
| Supplementary schedule of non-cash investing and financing activities: |
||||||||||||
| Cash paid for interest |
$ | 102,126 | $ | 132,661 | $ | 135,316 | ||||||
| Cash paid for income taxes, net of (refunds received) |
(76,089 | ) | 27,633 | 36,779 | ||||||||
| Change in unrealized (loss)/gain on securities available for sale, net of tax |
(1,785 | ) | 6,131 | 4,401 | ||||||||
| Change in unrealized (loss)/gain on cash flow hedge, net of tax |
(1,283 | ) | 2,453 | 778 | ||||||||
| Change in unrealized (loss)/gain on other, net of tax |
(831 | ) | (214 | ) | 213 | |||||||
| Non-cash transactions: |
||||||||||||
| Loans transferred into other real estate owned from held for sale or portfolio |
28,418 | 13,365 | 2,275 | |||||||||
| Loans transferred into/(out of) held for sale from/(to) portfolio |
(1,744 | ) | 93,635 | — | ||||||||
| Equity issued for acquisitions, including deferred acquisition obligations |
10,625 | 12,586 | 52,210 | |||||||||
See accompanying notes to consolidated financial statements.
76
Table of Contents
BOSTON PRIVATE FINANCIAL HOLDINGS, INC. AND SUBSIDIARIES
NOTES TO CONSOLIDATED FINANCIAL STATEMENTS
1. BASIS OF PRESENTATION AND SUMMARY OF SIGNIFICANT ACCOUNTING POLICIES
Boston Private Financial Holdings, Inc. (the “Company” or “BPFH”), is a holding company with three reportable segments, Private Banking, Investment Management, and Wealth Advisory. The Private Banking segment has four consolidated affiliate partners, including Boston Private Bank & Trust Company (“Boston Private Bank”), Borel Private Bank & Trust Company (“Borel”), First Private Bank & Trust (“FPB”), and Charter Bank (“Charter”) (together, the “Banks”). The Investment Management segment has two consolidated affiliate partners, including Dalton, Greiner, Hartman, Maher & Co., LLC (“DGHM”), and Anchor Capital Holdings, LLC (“Anchor”) (together, the “Investment Managers”). The Wealth Advisory segment has three consolidated affiliate partners, including KLS Professional Advisors Group, LLC (“KLS”), Bingham, Osborn & Scarborough, LLC (“BOS”), and Davidson Trust Company (“DTC”) (together, the “Wealth Advisors”). In addition, the Company holds an equity interest in Coldstream Holdings, Inc. (“Coldstream Holdings”) of approximately 45%.
Basis of Presentation
The consolidated financial statements of the Company include the accounts of the Company and its wholly-owned and majority-owned subsidiaries. All significant intercompany accounts and transactions have been eliminated in consolidation, and the portion of income allocated to owners other than the Company is included in “Income attributable to noncontrolling interests” in the consolidated statements of operations. “Redeemable noncontrolling interests” in the consolidated balance sheets reflects the maximum fair value of agreements with other owners. All accounts related to divested affiliates are included within the results of discontinued operations for all periods presented.
The Company applies the equity method of accounting to investments that the Company or its subsidiaries do not hold a majority interest in. The Company includes its proportionate share of earnings of equity method investments within “Other income” on the consolidated statements of operations. Equity method investments, which include the minority interests in Coldstream Holdings, affordable housing partnerships, and other partnership holdings, were $8.9 million at December 31, 2009 and 2008, and included in “Other assets” on the consolidated balance sheets. BOS was included in equity method investments at December 31, 2006, and until it was consolidated in the 3rd quarter of 2007 after BPFH’s ownership increased to 60.9%.
The financial statements are prepared in accordance with accounting principles generally accepted in the United States (“U.S.”) (“GAAP”). Reclassifications of amounts in prior year consolidated financial statements are made whenever necessary to conform to the current year’s presentation.
Use of Estimates
In preparing the consolidated financial statements, management is required to make estimates and assumptions that affect the reported amounts of assets and liabilities as of the date of the balance sheet and revenues and expenses for the period. Actual results could differ from those estimates. Material estimates that are particularly susceptible to change, in the near term, relate to the determination of the allowance for loan losses, evaluation of potential impairment of goodwill and other intangibles, and income taxes. The current economic environment has increased the degree of uncertainty inherent in those estimates and assumptions.
Investment Management and Wealth Advisory Fees
The Company generates fee income from providing investment management and trust services to its clients at the Banks and from providing investment management and wealth advisory services through the Investment Managers and the Wealth Advisors. These fees are generally based upon the value of assets under management
77
Table of Contents
NOTES TO CONSOLIDATED FINANCIAL STATEMENTS—(Continued)
and are billed monthly, quarterly, or annually. Asset-based advisory fees are recognized as services are rendered and are based upon a percentage of the market value of client assets managed. Certain wealth advisory fees are not asset-based and are negotiated individually with clients. Any fees collected in advance are deferred and recognized as income over the period earned. Performance-based advisory fees are generally assessed as a percentage of the investment performance realized on a client’s account, generally over an annual period, and are not recognized until any contingencies in the contract that could require the performance fee to be reduced have been eliminated.
Assets under management and advisory (“AUM”) at the Company’s consolidated affiliates totaled $17.7 billion and $15.9 billion at December 31, 2009 and 2008 respectively. These assets are not included in the consolidated financial statements since they are held in a fiduciary or agency capacity and are not assets of the Company.
Significant Group Concentrations of Credit Risk
Most of the Company’s activities are with customers within the New England, Northern and Southern California, and Pacific Northwest regions of the country. The Company does not believe it has any significant concentrations in any one industry, geographic location, or with any one customer. Part II. Item 8. “Financial Statements and Supplementary Data—Note 5: Investment Securities”, highlights the types of securities in which the Company invests, and Part II. Item 8. “Financial Statements and Supplementary Data—Note 6: Loans Receivable”, describes the concentration of the Private Banking loan data based on the location of the lender.
The current economic environment has increased the degree of uncertainty inherent in the value of the collateral for construction and land loans. These loans are considered to be more risky due to the nature of the collateral. The Banks have approximately $315.7 million of construction and land loans at December 31, 2009, which represents 7% of total loans outstanding. Also, the majority of the Banks commercial loans are secured by real estate.
Statement of Cash Flows
For purposes of reporting cash flows, the Company considers cash and due from banks and federal funds sold, all of which have original maturities with 90 days or less, to be cash equivalents.
Cash and Due from Banks
Each Bank is required to maintain average reserve balances in an account with the Federal Reserve Bank based upon a percentage of certain deposits. As of December 31, 2009, the daily amount required to be held in the aggregate for banking affiliates was $16.3 million.
Investment Securities
Investments available for sale are reported at fair value, with unrealized gains and losses credited or charged, net of the estimated tax effect, to accumulated other comprehensive income/(loss). Investments held to maturity are those which the Company has the positive intent and ability to hold to maturity and are reported at amortized cost.
Investments available for sale are carried at estimated fair value. Effective January 1, 2008, the Company adopted the provisions of the Financial Accounting Standards Board (“FASB”) Accounting Standards Codification (“ASC”) 820, Fair Value Measurements and Disclosures (formerly FAS 157, Fair Value Measurements) (“ASC 820”) a standard issued by the FASB concerning fair value measurements and disclosures
78
Table of Contents
NOTES TO CONSOLIDATED FINANCIAL STATEMENTS—(Continued)
with respect to: (i) all financial instruments; and (ii) non-financial instruments accounted for at fair value on a recurring basis, if any. The standard specifies a hierarchy of valuation techniques based on whether the inputs to those techniques are observable or unobservable. Observable inputs reflect market data obtained from independent sources, while unobservable inputs reflect the Company’s market assumptions from a market participant’s perspective.
Premiums and discounts on the investment securities are amortized or accreted into net interest income by the level-yield method. Actual prepayment experience is reviewed periodically and the timing of the accretion and amortization is adjusted accordingly. Gains and losses on the sale of the investments available for sale are recognized at the time of sale on a specific identification basis. Dividend and interest income is recognized when earned.
Net interest income is recorded on the accrual basis adjusted for amortization of premium and accretion of discount.
The Company conducts a periodic review and evaluation of its investment securities to determine if the decline in fair value of any security is deemed to be other-than-temporary. Other-than-temporary impairment losses are recognized on securities when: (i) the holder has an intention to sell the security; (ii) it is more likely than not that the security will be required to be sold prior to recovery; or (iii) the holder does not expect to recover the entire amortized cost basis of the security. Other-than-temporary losses are reflected in earnings as a charge against gain on sale of investments to the extent the impairment is related to credit losses. The amount of the impairment related to other factors is recognized in other comprehensive income. The Company has no intention to sell any securities in an unrealized loss position at December 31, 2009 nor is it more likely than not that the Company would be required to sell such securities prior to the recovery of the unrealized losses. As of December 31, 2009, the Company believes that all impairments of investment securities are temporary in nature. No other-than-temporary impairment losses were recognized in the consolidated statements of operations for the years ended December 31, 2009, 2008 and 2007.
Loans Held for Sale
Loans originated and held for sale in the secondary market are carried at the lower of cost or estimated fair value in the aggregate. Fair value is based on commitments on hand from investors or prevailing market prices. Net unrealized losses, if any, are recognized through a valuation allowance by charges to income. Loans transferred to the held for sale category are carried at the lower of cost or fair value as determined at the individual loan level.
Loans
Loans are carried at the principal amount outstanding, net of deferred loan origination fees and costs, or for purchased loans, net of premium or discount. Loan origination fees, net of related direct incremental loan origination costs and premium or discount on purchased loans, are deferred and recognized into income over the contractual lives of the related loans as an adjustment to the loan yield, using the level-yield method. When a loan is paid-off or sold, the unamortized portion of net fees/cost is recognized into interest income.
Impaired loans are usually commercial loans for which it is probable that the Company will not collect all amounts due according to the contractual terms of the loan agreement, and all loans restructured in a troubled debt restructuring. The measurement of the amount of impairment is determined based upon the present value of the expected future cash flows discounted at the loan’s effective interest rate, except that as a practical expedient, impairment may be determined based upon the observable market price for the loan, or based on the fair value of the collateral if the loan is collateral dependent. Regardless of the measurement method, impairment is measured
79
Table of Contents
NOTES TO CONSOLIDATED FINANCIAL STATEMENTS—(Continued)
based on the fair value of the collateral if it is determined that foreclosure is probable. Accrual of interest income is discontinued and all interest previously accrued but not collected is reversed against current period interest income when a loan is initially classified as non-accrual. Interest received on non-accrual loans is either applied against principal or reported as interest income according to management’s judgment as to the collectability of principal.
Reserve for Unfunded Loan Commitments
The Company maintains a reserve for unfunded commitments at a level management believes sufficient to absorb estimated probable losses related to unfunded credit facilities. This reserve is included in Other liabilities in the consolidated balance sheets. Net adjustments to the reserve for unfunded commitments are included in Other operating expense in the consolidated statements of operations.
Restructured Loans
When the Banks, for economic or legal reasons related to a borrower’s financial difficulties, grant a concession to a borrower that it would not otherwise consider, the loan is classified as a restructured loan pursuant to ASC 470, Debt (formerly FAS 15, Accounting by Debtors and Creditors for Troubled Debt Restructurings). The concession either stems from an agreement between the creditor and the bank or is imposed by law or a court. The concessions may include:
| • | Reduction of the stated interest rate |
| • | Lower interest rate as compared to a new loan with comparable risk and terms |
| • | Extension of the maturity date |
| • | Reduction in the principal balance owed |
| • | Reduction of accrued interest |
All loans whose terms have been modified in a troubled debt restructuring, including both commercial and residential, are evaluated for impairment under ASC 310, Receivables (formerly FAS 114, Accounting by Creditors for Impairment of a Loan) (“ASC 310”).
Generally, a nonaccrual loan that is restructured remains on nonaccrual for a period of at least six months to demonstrate that the borrower can meet the restructured terms. However, performance prior to the restructuring, or significant events that coincide with the restructuring, are considered when assessing whether the borrower can meet the new terms and may result in the loan being returned to accrual at the time of the restructuring or after a shorter performance period. If the borrower’s ability to meet the revised payment schedule is uncertain, the loan remains classified as a nonaccrual loan.
A loan may be removed from a restructured classification when the loan terms are returned to comparable terms for loans with similar credit risks and after the next calendar year end.
Allowance for Loan and Lease Losses
The allowance for loan losses is an estimate of the inherent risk of loss in the loan portfolio as of the consolidated balance sheet date. Management estimates the level of the allowance for loan losses based on all relevant information available. The allowance for loan losses is established through the provision for loan losses, which is a direct charge to earnings. Loan losses are charged to the allowance when management believes that the collectability of the loan principal is unlikely. Recoveries on loans previously charged off are credited to the allowance when received in cash.
80
Table of Contents
NOTES TO CONSOLIDATED FINANCIAL STATEMENTS—(Continued)
The Company’s allowance is accounted for in accordance with guidance issued by various regulatory agencies, including: the Federal Financial Institutions Examination Council Policy Statement on the Allowance for Loan and Lease Losses (December 2006); Securities and Exchange Commission (“SEC”) Staff Accounting Bulletin No. 102, Selected Loan Loss Methodology and Documentation Issues; ASC 310; and ASC 450, Contingencies (Formerly FAS 5, Accounting for Contingencies).
The allowance consists of three primary components: General Reserves on pass graded loans (loans that pose a normal credit risk) (ASC 450), Allocated Reserves on non-impaired Special Mention and Sub Standard Loans (ASC 450), and the Allocated Reserves on Impaired Loans (ASC 310). The allowance involves a high degree of management judgment and estimates, and results in an acceptable allowance which is reflective of the inherent risk of loss in the loan portfolio at the measurement date.
General Reserves are calculated for each loan pool consisting of pass graded loans segregated by loan type, by applying estimated net loss percentages based upon the Bank’s actual historical net charge-offs and, adjusted as appropriate, on a consistent manner based upon consideration of qualitative factors to arrive at a total loss factor for each loan type. The rationale for qualitative adjustments is to more accurately reflect the current inherent risk of loss in the respective loan types then would be determined through the sole consideration of the Bank’s actual historical net charge-off rates. The numerical factors assigned are based upon observable data, if applicable, as well as management’s analysis and judgment. The qualitative factors considered by the Company include:
| • | Volume and severity of past due, non-accrual, and adversely graded loans, |
| • | Volume and terms of loans, |
| • | Concentrations of Credit, |
| • | Management’s experience, as well as loan underwriting and loan review policy and procedures, and |
| • | Economic and business conditions impacting the Bank’s loan portfolio’s, including consideration of collateral values and external factors |
Each one of the Banks makes an independent determination of the applicable loss rate for these factors based on their relevant local market conditions, credit quality, and portfolio mix. Each quarter, all of the Banks review the loss factors to determine if there have been any changes in their respective loan portfolios, market conditions, or other risk indicators which would result in a change to the current loss factor.
Allocated Reserves on non-impaired special mention and substandard loans reflect management’s assessment of increased risk of losses associated with adversely graded loans. An allocated reserve is assigned to these pools of loans based upon management’s consideration of the credit attributes of individual loans within each pool of loans, including consideration, of loan to value ratios, past due status, strength and willingness of the guarantors, and other relevant attributes, including the quantitative factors considered for the general reserve as discussed above. These considerations are determined separately for each type of loan. The allocated reserves are a multiple of the general reserve for each respective loan types, with a greater multiple for loans with increased risk (i.e., special-mention loans versus substandard loans).
A loan (usually a larger commercial type loan) is considered impaired in accordance with ASC 310 when, based upon current information and events, it is probable that a creditor will be unable to collect all amounts due according to the contractual terms of the loan agreement. Impairment is measured based on the fair value of the loan, expected future cash flows discounted at the loan’s effective interest rate, or as a practical expedient, the fair value of the collateral if the loan is “collateral dependent.” For collateral dependent loans, appraisals or broker opinions are generally used to determine the fair value. Appraised values may be discounted if conditions
81
Table of Contents
NOTES TO CONSOLIDATED FINANCIAL STATEMENTS—(Continued)
warrant, such as the date when the appraisal was performed if collateral values have declined since the date the appraisal was done. All expected costs to liquidate the collateral are considered when determining the net realizable value. If the loan is deemed to be collateral dependent, generally the difference between the book balance (customer balance less any prior charge-offs or customer interest payments applied to principal) and the net realizable value is taken as a partial charge-off through the allowance for loan losses in the current period. If the loan is not determined to be collateral dependent, then a specific allocation is established for the difference between the book balance of the loan and the expected future cash flows discounted at the loan’s effective interest rate. Charge-offs for loans not considered to be collateral dependant are made when appropriate. Impaired Loans are removed from the general loan pools. There may be instances where the loan is considered impaired although based on the net realizable value of underlying collateral or the discounted expected future cash flows there is no impairment. In addition, all loans which are classified as troubled debt restructurings (“TDRs”) are considered impaired.
In addition to the three primary components of the allowance for loan losses discussed above (General Reserve, Allocated Reserves on non-impaired special-mention and substandard loans, and the Allocated Reserves on impaired loans), generally the Company’s affiliate Banks also maintain an insignificant amount of additional allowance for loan losses (the unallocated allowance for loan losses) which primarily relates to a general assessment of the potential variability of applicable qualitative factors subject to a higher degree of variability. The respective qualitative factors, as discussed above, are considered for each respective loan type. Only the assessment of the potential variability of applicable qualitative factors is included in the unallocated allowance for loan losses. The unallocated allowance for loan losses is not considered significant by the Company.
While this evaluation process utilizes historical and other objective information, the classification of loans and the establishment of the allowance for loan losses rely to a great extent on the judgment and experience of management. While management evaluates currently available information in establishing the allowance for loan losses, future adjustments to the allowance may be necessary if economic conditions differ substantially from the assumptions used in making the evaluations. In addition, various regulatory agencies, as an integral part of their examination process, periodically review a financial institution’s allowance for loan losses as well as loan grades/classifications. Such agencies may require the financial institution to recognize additions to the allowance or increases to adversely graded classified loans based on their judgments about information available to them at the time of their examination.
Premises and Equipment
Premises and equipment consists of leasehold improvements, equipment, buildings and land. Equipment consists primarily of computer equipment, art, and furniture and fixtures. Premises and equipment are carried at cost, less accumulated depreciation and amortization. Depreciation and amortization are computed primarily by the straight-line method over the estimated useful lives of the assets, or the terms of the leases, if shorter, for leasehold improvements. The estimated useful lives for leasehold improvements and buildings are 5-15 years and 40 years, respectively. The estimated useful life for furniture and fixtures is 2-10 years and is 3-5 years for computer equipment. The costs of improvements that extend the life of an asset are capitalized, while the cost of repairs and maintenance are expensed as incurred. Neither land nor art are depreciated.
Goodwill and Other Intangible Assets
The Company allocates the cost of an acquired entity to the assets acquired and liabilities assumed based on their estimated fair values at the date of acquisition. Other intangible assets identified in acquisitions generally consist of advisory contracts, core deposit intangibles, and non-compete agreements. The value attributed to advisory contracts is based on the time period over which they are expected to generate economic benefits. The advisory contracts are generally amortized over 8-15 years depending on the contract. Core deposit intangibles
82
Table of Contents
NOTES TO CONSOLIDATED FINANCIAL STATEMENTS—(Continued)
are valued based on the expected longevity of the core deposit accounts and the expected cost savings associated with the use of the existing core deposit base rather than alternative funding sources. The core deposit intangibles are generally amortized over a period of 10-12 years. Non-compete agreements are valued based on the expected receipt of future economic benefits protected by clauses in the non-compete agreements that restrict competitive behavior. Non-compete agreements are amortized over the life of the agreement, generally 2-4 years.
Other intangible assets with definite lives are tested for impairment at the reporting unit level at least annually in the fourth quarter or more frequently when events or circumstances occur that indicate that it is more likely than not that an impairment has occurred. The Company tests other intangible assets with definite lives for impairment by comparing the carrying amount to the sum of the net undiscounted cash flows expected to be generated by the asset whenever events or changes in circumstances indicate that the carrying amount of the asset may not be recoverable. If the carrying amount of the asset exceeds its net undiscounted cash flows, then an impairment loss is recognized for the amount by which the carrying amount exceeds its fair value. The intangible impairment test is performed at the reporting unit level, and each affiliate is considered a reporting unit for goodwill and intangible impairment testing purposes. Intangible assets with an indefinite useful economic life are not amortized, but are subject to impairment testing at the reporting unit on an annual basis, or when events or changes in circumstances indicate that the carrying amounts may be impaired.
The excess of the purchase price for acquisitions over the fair value of the net assets acquired, including other intangible assets, is recorded as goodwill. Goodwill is not amortized but is tested for impairment at the reporting unit level, defined as the affiliate partner level, at least annually in the fourth quarter or more frequently when events or circumstances occur that indicate that it is more likely than not that an impairment has occurred. Goodwill is tested for impairment using a two-step process that begins with an estimation of the fair value of a reporting unit. Goodwill impairment exists when a reporting unit’s carrying value of goodwill exceeds its implied fair value. Significant judgment is applied when goodwill is assessed for impairment. This judgment includes developing cash flow projections, selecting appropriate discount rates, identifying relevant market comparables, incorporating general economic and market conditions, and selecting an appropriate control premium. The selection and weighting of the various fair value techniques may result in a higher or lower fair value. Judgment is applied in determining the weightings that are most representative of fair value.
The first step (“Step 1”) of impairment testing requires a comparison of each reporting unit’s fair value to carrying value to identify potential impairment. The reporting units fall under one of the three segments: Private Banking, Investment Management, and Wealth Advisory.
For the Private Banking segment, the Company utilizes both the income and market approaches to determine fair value. The income approach is based on discounted cash flows derived from assumptions of balance sheet and income statement activity. For the market approach, earnings and market capitalization multiples of comparable public companies are selected and applied to the banking reporting unit’s applicable metrics.
For the Investment Management and Wealth Advisory segments, the Company utilizes both the income and market approaches to determine fair value. The income approach is primarily based on discounted cash flows derived from assumptions of income statement activity. For the market approach, earnings and tangible book value multiples of comparable companies are selected and applied to the financial services reporting unit’s applicable metrics.
The aggregate fair values are compared to market capitalization as an assessment of the appropriateness of the fair value measurements. A control premium analysis is performed to determine whether the implied control premium was within range of overall control premiums observed in the market place.
83
Table of Contents
NOTES TO CONSOLIDATED FINANCIAL STATEMENTS—(Continued)
The second step (“Step 2”) of impairment testing is necessary only if a reporting unit’s carrying amount exceeds its fair value. Step 2 compares the implied fair value of the reporting unit goodwill with the carrying amount of the goodwill for the reporting unit. The implied fair value of goodwill is determined in the same manner as goodwill that is recognized in a business combination. Significant judgment and estimates are involved in estimating the fair value of the assets and liabilities of the reporting unit. The excess goodwill is recognized as an impairment loss.
Debt Issuance Costs
Debt issuance costs related to the issuance of long-term debt are recorded as an asset. The costs associated with the debt are amortized using the effective yield method over the life of the securities. The Company had approximately $2.1 million and $3.8 million in debt issuance costs at December 31, 2009 and 2008, respectively.
Stock-Based Incentive Plans
At December 31, 2009, the Company has three stock-based incentive compensation plans. These plans encourage and enable the officers, employees, non-employee directors, and other key persons of the Company to acquire an interest in the Company. Under ASC 718, Compensation—Stock Compensation (formerly FAS 123R, Share-Based Payment, Revised 2004) (“ASC 718”) the Company applies the fair value recognition provisions using the modified retrospective application method. See Part II. Item 8. “Financial Statements and Supplementary Data—Note 18: Employee Benefits” for more information on stock based compensation.
Derivative Instruments and Hedging Activities
The Company records all derivatives on the balance sheet at fair value. The accounting for changes in the fair value of derivatives depends on the intended use of the derivative and the resulting designation. Derivatives used to hedge exposure to changes in the fair value of an asset, liability, or firm commitment attributable to a particular risk, such as interest rate risk, are considered fair value hedges. Derivatives used to hedge exposure to variability in expected future cash flows, or other types of forecasted transactions, are considered cash flow hedges.
For derivatives designated as cash flow hedges, the effective portion of changes in the fair value of the derivative is initially reported in other comprehensive income/ (loss) (a component of stockholders’ equity), net of tax, and subsequently reclassified to earnings when the hedged transaction affects earnings, and the ineffective portion of changes in the fair value of the derivative is recognized directly in earnings. The Company assesses the effectiveness of each hedging relationship by comparing the changes in cash flows of the derivative hedging instrument with the changes in cash flows of the designated hedged transactions.
For derivatives designated as fair value hedges, changes in the fair value of the derivative are recognized in earnings together with the changes in the fair value of the related hedged item. The net amount, if any, representing hedge ineffectiveness, is reflected in earnings.
Income Taxes
The Company recognizes income taxes under the asset and liability method. Under this method, deferred tax assets and liabilities are established for the future tax consequences attributable to temporary differences between the financial statement carrying amounts of existing assets and liabilities and their respective tax basis and operating loss and tax credit carry forwards. Deferred tax assets and liabilities are measured using enacted tax rates expected to apply to taxable income in the years in which those temporary differences are expected to be recovered or settled.
84
Table of Contents
NOTES TO CONSOLIDATED FINANCIAL STATEMENTS—(Continued)
The deferred tax assets and/or liabilities are determined by multiplying the differences between the financial reporting and tax reporting basis for assets and liabilities by the enacted tax rates expected to be in effect when such differences are recovered or settled. The effect on deferred taxes for a change in tax rates is recognized in income in the period that includes the enactment date. Valuation allowances on deferred tax assets are estimated based on the Company’s assessment of the realizability of such amounts. Significant management judgment is required in determining the provision for income taxes and, in particular, any valuation allowance recorded against the Company’s deferred tax assets.
The Company records low-income housing and rehabilitation investment tax credits using the equity method. The equity method recognizes tax credits in the same year they are allowed for tax reporting purposes.
Earnings Per Share (“EPS”)
Basic EPS is computed by dividing net (loss)/ income attributable to common shareholders by the weighted average number of common shares outstanding during the year. Diluted EPS is determined in the same manner as basic EPS except that the number of shares is increased assuming exercise or contingent issuance of the options, warrants or other dilutive securities; and conversion of the convertible trust preferred securities and Series B Non-Cumulative Perpetual Contingent Convertible Preferred Stock (“Series B Preferred”). Additionally, interest expense (net of tax) related to the convertible trust preferred securities, warrant expense, and dividends and accretion related to the preferred stock are added back to net income attributable to common shareholders. The calculation of diluted EPS excludes the potential dilution of common shares and the inclusion of any related expenses if the effect is antidilutive.
85
Table of Contents
NOTES TO CONSOLIDATED FINANCIAL STATEMENTS—(Continued)
The following table is a reconciliation of the components of basic and diluted EPS computations for the three years ended December 31:
| 2009 | 2008 | 2007 | ||||||||||
| (In thousands, except share and per share data) | ||||||||||||
| Net income/(loss) from continuing operations |
$ | 16,385 | $ | (193,216 | ) | $ | 9,681 | |||||
| Less: Net income attributable to noncontrolling interests |
3,649 | 4,327 | 3,987 | |||||||||
| Net income/(loss) from continuing operations attributable to the Company |
12,736 | (197,543 | ) | 5,694 | ||||||||
| Increase in noncontrolling interests redemption values(1) |
(6,503 | ) | — | — | ||||||||
| Accretion of Beneficial Conversion Feature on Series A and B Preferred stock(2) |
(24,428 | ) | (32,053 | ) | — | |||||||
| Accretion of discount on Series C Preferred stock(3) |
(1,438 | ) | (125 | ) | — | |||||||
| Dividends on preferred securities |
(7,862 | ) | (851 | ) | — | |||||||
| Total adjustments to income attributable to common shareholders |
(40,231 | ) | (33,029 | ) | — | |||||||
| (Loss)/income from continuing operations attributable to common shareholders |
(27,495 | ) | (230,572 | ) | 5,694 | |||||||
| Net loss from discontinued operations |
(7,505 | ) | (191,209 | ) | (1,524 | ) | ||||||
| Net (loss)/income attributable to common shareholders |
$ | (35,000 | ) | $ | (421,781 | ) | $ | 4,170 | ||||
| Weighted average basic common shares outstanding |
66,696,977 | 47,528,418 | 36,731,621 | |||||||||
| Dilutive effect of: |
||||||||||||
| Stock options, stock grants and other |
— | — | 1,583,709 | |||||||||
| Total dilutive potential common shares |
— | — | 1,583,709 | |||||||||
| Weighted average diluted common shares outstanding(4) |
66,696,977 | 47,528,418 | 38,315,330 | |||||||||
| Per share data: |
||||||||||||
| Basic and diluted |
||||||||||||
| (Loss)/earnings from continuing operations |
$ | (0.41 | ) | $ | (4.85 | ) | $ | 0.15 | ||||
| Loss from discontinued operations |
(0.11 | ) | (4.02 | ) | $ | (0.04 | ) | |||||
| Net (loss)/earnings attributable to common shareholders |
$ | (0.52 | ) | $ | (8.87 | ) | $ | 0.11 | ||||
| (1) | See Part II. Item 8. “Financial Statements and Supplementary Data—Note 15: Noncontrolling Interests” for a description of the redemption values related to the redeemable noncontrolling interests. In accordance with ASC 480, Distinguishing Liabilities from Equity (“ASC 480”), an increase in redemption value from period to period reduces income attributable to common shareholders. |
| (2) | See Part II. Item 8. “Financial Statements and Supplementary Data—Note 16: Equity” for description of the preferred securities issued during 2008 that gave rise to the beneficial conversion feature. The beneficial conversion feature is accounted for as a preferred stock dividend and reduces income attributable to common shareholders. The beneficial conversion feature on the Series A Preferred was fully accreted as of September 30, 2008. The beneficial conversion feature on the Series B Preferred was fully accreted as of December 31, 2009. |
| (3) | See Part II. Item 8. “Financial Statements and Supplementary Data—Note 16: Equity” for a description of the Series C Preferred securities issued during 2008 that gave rise to the accretion of the discount at issuance. The accretion of the discount is accounted for as a preferred stock dividend and reduces income attributable to common shareholders. |
86
Table of Contents
NOTES TO CONSOLIDATED FINANCIAL STATEMENTS—(Continued)
| (4) | As a result of the anti-dilution, the potential common shares excluded from the diluted EPS computation for the three years ended December 31 are as follows: |
| 2009 | 2008 | 2007 | ||||
| (In thousands) | ||||||
| Potential common shares from: |
||||||
| Convertible trust preferred securities |
3,086 | 3,208 | 3,184 | |||
| Exercise or contingent issuance of options or other dilutive securities |
888 | 1,262 | — | |||
| Conversion of the Series A and B Preferred stock |
7,261 | 4,178 | — | |||
| Effect of dilutive warrants |
— | 369 | — | |||
| Total |
11,235 | 9,017 | 3,184 | |||
In addition, if the effect of the conversion of the convertible trust preferred securities would have been dilutive, interest expense, net of tax, related to the convertible trust preferred securities of $2.8 million, $3.0 million and $3.0 million for the years ended December 31, 2009, 2008 and 2007, respectively, would have been added back to net (loss)/ income attributable to common shareholders for diluted EPS computations for the periods presented.
Also, options to purchase approximately 5.3 million shares and 5.4 million shares of common stock were outstanding at December 31, 2009 and December 31, 2008, respectively, but were not included in the computation of diluted EPS or in the above anti-dilution table because the options’ exercise prices were greater than the average market price of the common shares during the year.
Furthermore, warrants to purchase approximately 8.3 million shares of common stock were outstanding at December 31, 2009 and 2008, but were not included in the computation of diluted EPS because the warrants’ exercise prices were greater than the average market price of the common shares during the year.
Recent Accounting Pronouncements
Effective July 1, 2009, the FASB’s ASC became the single official source of authoritative, nongovernmental GAAP. The historical GAAP hierarchy was eliminated and the ASC became the only level of authoritative GAAP, other than guidance issued by the SEC. The Company’s accounting policies were not affected by the conversion to ASC. However, references to specific accounting standards in the footnotes to the Company’s consolidated financial statements have been changed to refer to the appropriate section of ASC.
Effective January 1, 2009, the Company adopted ASC 805, Business Combinations (formerly FAS Statement 141(R), Business Combinations), which provides guidance in accounting for business combinations for which the acquisition date is on or after that date. The Statement had no impact on the Company’s financial position or results of operations during 2009. However, the Company’s accounting for future acquisitions, if any, will be significantly impacted by this standard.
Effective January 1, 2009, the Company adopted updates to ASC 260, Earnings Per Share, (formerly FASB Staff Position No. Emerging Issues Task Force 03-6-1, Determining Whether Instruments Granted in Share-Based Payment Transactions Are Participating Securities) (“ASC 260 updates”), which required unvested share-based payments that contain nonforfeitable rights and dividends or dividend equivalents to be treated as participating securities and be included in the calculation of EPS pursuant to the two-class method. The January 1, 2009 adoption of these ASC 260 updates did not have a material impact on the Corporation’s financial position or results of operations.
In April 2009, the FASB issued updates to ASC 320, Investments—Debt and Equity Securities (formerly FASB Staff Position FAS 115-2 and FAS 124-2, Recognition and Presentation of Other-Than-Temporary
87
Table of Contents
NOTES TO CONSOLIDATED FINANCIAL STATEMENTS—(Continued)
Impairments) “ASC 320 updates” to address concerns about evaluating and recognizing other-than-temporary impairments of investments in debt securities. The ASC 320 updates establish a new method of recognizing and reporting other-than-temporary impairments of debt securities. The ASC 320 updates also contain additional disclosure requirements. It was effective for interim and annual periods ending after June 15, 2009, and had no material impact on the Company’s financial position or results of operations for 2009.
In June 2009, the FASB issued updates to ASC 860, Transfers and Servicing (formerly FAS 166, Accounting for Transfers of Financial Assets) (“ASC 860 updates”). Among other things, the ASC 860 updates amend ASC 860 (formerly FAS 140, Accounting for Transfers and Servicing of Financial Assets and Extinguishments of Liabilities a replacement of FAS 125) to remove the concept of a qualifying special purpose entity (“QSPE”) from the prior statement and removes the exception from applying FASB Interpretation No. 46, Consolidation of Variable Interest Entities, to QSPEs. Effective as of January 1, 2010, the ASC 860 updates will not have a material impact on the Company’s financial position or results of operations.
In June 2009, the FASB issued ASC 810, updates to Consolidation, (formerly FAS 167, Amendments to FASB Interpretation No. 46(R), Consolidation of Variable Interest Entities) (“ASC 810”). These updates require an enterprise to perform an analysis to determine whether the enterprise’s variable interest or interests give it a controlling financial interest in a variable interest entity. It determines whether a reporting entity is required to consolidate another entity based on, among other things, the other entity’s purpose and design and the reporting entity’s ability to direct the activities of the other entity that most significantly impact the other entity’s economic performance. These updates are effective on a prospective basis in fiscal years beginning on or after November 15, 2009, and interim periods within those fiscal years, and will be adopted by the Company in the first quarter of fiscal year 2010. The Company is performing an analysis to determine whether any variable interests give the Company a controlling financial interest in such variable interest entity. The impact of adoption will not be material to the Company’s financial position or results of operations.
2. DIVESTITURES AND ACQUISITIONS
Divestitures
In 2009, the Company divested its interest in Westfield Capital Management Company, LP, formerly known as Westfield Capital Management Company, LLC (“Westfield”), Gibraltar Private Bank & Trust Company (“Gibraltar”), RINET Company, LLC (“RINET”), Sand Hill Advisors, LLC (“Sand Hill”), and in Boston Private Value Investors, Inc. (“BPVI”). Both Westfield and BPVI were previously included in the Investment Management segment, RINET and Sand Hill were previously included in the Wealth Advisory segment and Gibraltar was previously included in the Private Banking segment. As a result of these divestitures, the results of operations and the gain/(loss) on sale related to each are now included in “Net loss from discontinued operations” in the consolidated statements of operations for current and prior years. In addition, the assets and liabilities of the divested companies have been reflected as assets and liabilities of discontinued operations in the accompanying consolidated balance sheets for periods prior to the divestiture. In accordance with ASC 350, Intangibles—Goodwill and Other (“ASC 350”), the goodwill and intangibles, if any, at Westfield, Gibraltar, RINET, Sand Hill, and BPVI were tested for impairment upon divestiture.
On December 14, 2009, the Company divested its interest in Westfield, instead of in 2014 as provided for at the time of the Company’s re-equitization of Westfield on June 30, 2008. Westfield’s expansion of its institutional money management business diverged from the Company’s core strategy of providing wealth management services to high net worth individuals, their families and their businesses. There was no loss upon remeasurement of the investment in Westfield to its fair value. While the Company will continue to have no significant involvement or influence on Westfield, it retains a 12.5% share in Westfield’s revenues (up to an annual maximum of $11.6 million) for eight years, subject to certain conditions. The Company has deferred any gains related to these payments until determinable.
88
Table of Contents
NOTES TO CONSOLIDATED FINANCIAL STATEMENTS—(Continued)
On September 17, 2009, the Company divested its interest in Gibraltar. The sale of Gibraltar allowed the Company to exit the South Florida market which continued to experience economic stress with a long-term projected recovery. The Company recorded a $16.3 million pretax intangible impairment charge upon remeasurement of Gibraltar to its fair value. The Company will have no future influence on Gibraltar and does not expect any future operating cash flows from Gibraltar.
On September 16, 2009, the Company divested its interest in RINET. The sale of RINET provided an opportunity for the Company to reallocate resources toward the growth of its other affiliates. There was no loss upon remeasurement of the investment in RINET to its fair value. The Company will have no future influence on RINET and has deferred potential future gains from contingent payments, if any, until determinable.
On June 29, 2009, the Company divested its interest in Sand Hill. As Sand Hill’s business evolved, it created overlap with other affiliates in the Northern California market. There was no loss upon remeasurement of the investment in Sand Hill to its fair value. The Company will have no future influence on Sand Hill and has deferred potential future gains from contingent payments, if any, until determinable.
On April 1, 2009, the Company divested its interest in BPVI. Based on both size and overlap with other affiliates in the New England market, BPVI no longer fit with the Company’s long-term strategy for growth. The Company recorded a $2.1 million pretax intangible impairment charge upon remeasurement of BPVI to its fair value. The Company will have no future influence on BPVI and has deferred potential future gains from contingent payments, if any, until determinable.
The following tables include summary income statement information, reflected as discontinued operations, for the periods presented:
| Westfield | Gibraltar | RINET | Sand Hill | BPVI | Total | ||||||||||||||||||
| (In thousands) | |||||||||||||||||||||||
| 2009 |
|||||||||||||||||||||||
| Revenues(1) |
$ | 59,289 | $ | 38,572 | $ | 5,471 | $ | 2,414 | $ | 909 | $ | 106,655 | |||||||||||
| Pretax income/(loss) from operations |
$ | 18,167 | $ | (16,039 | ) | $ | 313 | $ | (735 | ) | $ | (132 | ) | $ | 1,574 | ||||||||
| Pretax gain/(loss) on sale(2) |
47,967 | (44,300 | ) | 1,909 | (172 | ) | (2,322 | ) | 3,082 | ||||||||||||||
| Income tax expense/(benefit) |
28,525 | (17,469 | ) | 1,657 | (5 | ) | (547 | ) | 12,161 | ||||||||||||||
| Net income/(loss) from discontinued operations |
$ | 37,609 | $ | (42,870 | ) | $ | 565 | $ | (902 | ) | $ | (1,907 | ) | $ | (7,505 | ) | |||||||
| 2008 |
|||||||||||||||||||||||
| Revenues(1) |
$ | 70,520 | $ | 46,050 | $ | 9,195 | $ | 6,358 | $ | 5,427 | $ | 137,550 | |||||||||||
| Pretax (loss)/ income from operations |
$ | (38,671 | ) | $ | (143,318 | ) | $ | 1,178 | $ | (9,779 | ) | $ | 1,049 | $ | (189,541 | ) | |||||||
| Income tax expense/(benefit) |
11,260 | (6,961 | ) | 495 | (3,582 | ) | 456 | 1,668 | |||||||||||||||
| Net (loss)/income from discontinued operations |
$ | (49,931 | ) | $ | (136,357 | ) | $ | 683 | $ | (6,197 | ) | $ | 593 | $ | (191,209 | ) | |||||||
| 2007 |
|||||||||||||||||||||||
| Revenues(1) |
$ | 77,028 | $ | 58,157 | $ | 9,189 | $ | 7,341 | $ | 7,898 | $ | 159,613 | |||||||||||
| Pretax income/(loss) from operations |
$ | 32,282 | $ | (18,089 | ) | $ | 1,062 | $ | 1,395 | $ | 2,417 | $ | 19,067 | ||||||||||
| Income tax expense/(benefit) |
14,009 | 4,552 | 446 | 561 | 1,023 | 20,591 | |||||||||||||||||
| Net income/(loss) from discontinued operations |
$ | 18,273 | $ | (22,641 | ) | $ | 616 | $ | 834 | $ | 1,394 | $ | (1,524 | ) | |||||||||
89
Table of Contents
NOTES TO CONSOLIDATED FINANCIAL STATEMENTS—(Continued)
| (1) | Revenues include net interest income, fees and other income. |
| (2) | Includes pretax intangible and goodwill impairment charges, if any, resulting from the remeasurement of the affiliates’ fair value at the time of divestiture. |
Acquisitions
The Company completed one business combination in 2008 and two in 2007. All were accounted for under the purchase method of accounting. The results of operations prior to the date of acquisition are not included in the accompanying consolidated financial statements. Goodwill, investment advisory contracts, non-compete agreements, core deposit intangibles, and other purchase accounting adjustments, if applicable, were recorded upon the completion of each acquisition.
On February 1, 2008, the Company acquired a 70.1% interest in DTC. DTC is a wealth management company chartered as a trust company by the Commonwealth of Pennsylvania and located in the “Main Line” area of Philadelphia. At the closing of the transaction, the Company paid approximately $3.3 million in cash, which represents approximately 50% of the total estimated consideration at closing. The remaining consideration is payable over the next three years contingent upon DTC’s financial performance. These earn-out payments will be paid in 100% cash. Goodwill of approximately $0.5 million, which is expected to be deducted for tax purposes, was recorded as part of the purchase price. The acquisition of DTC provides the Company the opportunity to further expand its business and establishes the Company’s footprint in the growing Philadelphia market. Contingent payments for the DTC transaction are additional costs of the acquisition and will be recorded as goodwill.
On August 1, 2007, BPFH increased its ownership interest in BOS from 49.7% to approximately 60.9%. In conjunction with the transaction, BOS’s financial results beginning August 1, 2007 are included in the Company’s consolidated financial statements. BOS’s operating results for the first seven months of 2007 were accounted for under the equity method of accounting, and are included with other income. The Company increased its ownership in August of 2008 to approximately 70%.
On July 1, 2007, the Company acquired Charter Financial Corporation, the holding company of Charter, a Washington chartered commercial bank, situated in the Puget Sound region. In the transaction, the Company acquired 100% of Charter Financial Corporation’s common stock through the issuance of approximately 1.5 million shares of BPFH common stock valued at $42.5 million and $29.4 million in cash payments to shareholders, including stock options. The purchase price was approximately $77.2 million, which included the trust preferred debt assumed and the Company’s transaction costs.
3. COMPREHENSIVE AND ACCUMULATED OTHER COMPREHENSIVE INCOME/(LOSS)
Comprehensive income/ (loss) represents the change in equity of the Company during a year from transactions and other events and circumstances from non-stockholder sources. It includes all changes in equity during a year except those resulting from investments by stockholders and distributions to stockholders.
90
Table of Contents
NOTES TO CONSOLIDATED FINANCIAL STATEMENTS—(Continued)
The Company’s other comprehensive income/(loss) and related tax effect for the years ended December 31, 2009, 2008, and 2007 is as follows:
| Other comprehensive income/(loss): | ||||||||||||
| Pre-tax | Tax expense/ (benefit) |
Net | ||||||||||
| (In thousands) | ||||||||||||
| 2009 |
||||||||||||
| Unrealized gain on securities available for sale |
$ | 2,802 | $ | 1,074 | $ | 1,728 | ||||||
| Less: adjustment for realized gains |
5,803 | 2,290 | 3,513 | |||||||||
| Net unrealized loss on securities available for sale |
(3,001 | ) | (1,216 | ) | (1,785 | ) | ||||||
| Unrealized loss on cash flow hedge |
(2,614 | ) | (929 | ) | (1,685 | ) | ||||||
| Add: scheduled reclass and other |
674 | 272 | 402 | |||||||||
| Net unrealized loss on cash flow hedge |
(1,940 | ) | (657 | ) | (1,283 | ) | ||||||
| Unrealized loss on other |
(1,763 | ) | (932 | ) | (831 | ) | ||||||
| Other comprehensive loss |
$ | (6,704 | ) | $ | (2,805 | ) | $ | (3,899 | ) | |||
| 2008 |
||||||||||||
| Unrealized gain on securities available for sale |
$ | 12,531 | $ | 4,932 | $ | 7,599 | ||||||
| Less: Adjustment for realized gains |
2,393 | 851 | 1,542 | |||||||||
| Adjustment for realized losses of discontinued operations |
(121 | ) | (47 | ) | (74 | ) | ||||||
| Net unrealized loss on securities available for sale |
10,259 | 4,128 | 6,131 | |||||||||
| Unrealized gain on cash flow hedge |
3,839 | 1,512 | 2,327 | |||||||||
| Add: scheduled reclass and other |
215 | 89 | 126 | |||||||||
| Net unrealized gain on cash flow hedge |
4,054 | 1,601 | 2,453 | |||||||||
| Unrealized loss on other |
(349 | ) | (135 | ) | (214 | ) | ||||||
| Other comprehensive income |
$ | 13,964 | $ | 5,594 | $ | 8,370 | ||||||
| 2007 |
||||||||||||
| Unrealized gain on securities available for sale |
$ | 7,238 | $ | 2,836 | $ | 4,402 | ||||||
| Less: adjustment for realized gains |
2 | 1 | 1 | |||||||||
| Net unrealized loss on securities available for sale |
7,236 | 2,835 | 4,401 | |||||||||
| Unrealized gain on cash flow hedge |
1,071 | 398 | 673 | |||||||||
| Add: adjustment for ineffective portion and scheduled reclass |
168 | 63 | 105 | |||||||||
| Net unrealized gain on cash flow hedge |
1,239 | 461 | 778 | |||||||||
| Unrealized gain on other |
355 | 142 | 213 | |||||||||
| Other comprehensive income |
$ | 8,830 | $ | 3,438 | $ | 5,392 | ||||||
The following table details the components of the Company’s accumulated other comprehensive income/ (loss) as of December 31:
| 2009 | 2008 | 2007 | |||||||||
| (In thousands) | |||||||||||
| Unrealized gain on securities available for sale, net of tax |
$ | 6,854 | $ | 8,639 | $ | 2,508 | |||||
| Unrealized gain on cash flow hedge, net of tax |
1,650 | 2,933 | 480 | ||||||||
| Unrealized (loss)/gain on other, net of tax |
(932 | ) | (101 | ) | 113 | ||||||
| Accumulated other comprehensive income |
$ | 7,572 | $ | 11,471 | $ | 3,101 | |||||
91
Table of Contents
NOTES TO CONSOLIDATED FINANCIAL STATEMENTS—(Continued)
4. REPORTABLE SEGMENTS
Management Reporting
The Company has three reportable segments: Private Banking, Investment Management, and Wealth Advisory, and the Parent Company (Boston Private Financial Holdings, Inc.) (“Holding Company”). The financial performance of the Company is managed and evaluated by these three areas. The segments are managed separately as a result of the concentrations in each function.
Description of Reportable Segments
Private Banking
The Private Banking segment has four consolidated affiliate partners, including Boston Private Bank, chartered by The Commonwealth of Massachusetts; Borel and FPB, both California state chartered banks; and Charter, a Washington state chartered bank; all of which are insured by the Federal Deposit Insurance Corporation (the “FDIC”). The Banks pursue private banking and community-oriented business strategies in their operating regions. The Banks are principally engaged in providing banking, commercial banking, and a variety of other fiduciary services including investment management, advisory, and administrative services to high net worth individuals, their families, small and medium-sized businesses and professionals. In addition, the Banks offer their clients a broad range of deposit and lending products. The specific mix of products, services and clientele can vary from affiliate to affiliate. The Banks are located in New England, Northern California, Southern California, and the Pacific Northwest.
Investment Management
The Investment Management segment has two consolidated affiliate partners, including DGHM, a registered investment adviser, and Anchor, which is the parent company of Anchor Capital Advisors LLC (“Anchor Capital Advisors”) and Anchor/Russell Capital Advisors LLC (“Anchor Russell”), both of which are registered investment advisers. The Investment Managers serve the needs of pension funds, endowments, trusts, foundations and select institutions, mutual funds and high net worth individuals and their families throughout the U.S. and abroad. The Investment Managers specialize in value-driven equity portfolios with products across the capitalization spectrum. The specific mix of products, services and clientele varies between affiliates. The Investment Managers are located in New England and New York, with one affiliate administrative office in South Florida.
Wealth Advisory
The Wealth Advisory segment has three consolidated affiliate partners, including KLS, BOS, and DTC. KLS and BOS are registered investment advisers, and all three are wealth management firms. The Wealth Advisors provide comprehensive, planning-based financial strategies to high net worth individuals and their families, and non-profit institutions. The firms offer fee-only financial planning, tax planning and preparation, estate and insurance planning, retirement planning, charitable planning and intergenerational giving planning. The Wealth Advisors manage investments covering a wide range of asset classes for both taxable and tax-exempt portfolios. The Wealth Advisors are located in New York, Northern California, and Pennsylvania.
Measurement of Segment Profit and Assets
The accounting policies of the segments are the same as those described in Part II. Item 8. “Financial Statements and Supplementary Data—Note 1: Basis of Presentation and Summary of Significant Accounting Policies”. Revenues, expenses, and assets are recorded by each segment, and separate financial statements are reviewed by their management and the Company’s Segment CEOs.
92
Table of Contents
NOTES TO CONSOLIDATED FINANCIAL STATEMENTS—(Continued)
Reconciliation of Reportable Segment Items
The following tables are a reconciliation of revenues, segment profit, assets, and other significant items of reportable segments:
| For the year ended December 31, | ||||||||||||||||||||||||||||||||||||
| Net interest income | Non-interest income | Total revenues | ||||||||||||||||||||||||||||||||||
| 2009 | 2008 | 2007 | 2009 | 2008 | 2007 | 2009 | 2008 | 2007 | ||||||||||||||||||||||||||||
| (In thousands) | (In thousands) | (In thousands) | ||||||||||||||||||||||||||||||||||
| Total Banks |
$ | 169,802 | $ | 163,767 | $ | 149,948 | $ | 38,521 | $ | 29,079 | $ | 30,662 | $ | 208,323 | $ | 192,846 | $ | 180,610 | ||||||||||||||||||
| Total Investment Managers |
177 | 394 | 308 | 33,192 | 45,096 | 54,297 | 33,369 | 45,490 | 54,605 | |||||||||||||||||||||||||||
| Total Wealth Advisors |
70 | 192 | 279 | 34,810 | 34,624 | 20,322 | 34,880 | 34,816 | 20,601 | |||||||||||||||||||||||||||
| Total Segments |
170,049 | 164,353 | 150,535 | 106,523 | 108,799 | 105,281 | 276,572 | 273,152 | 255,816 | |||||||||||||||||||||||||||
| Holding Company and Eliminations |
(10,564 | ) | (14,125 | ) | (13,542 | ) | 19,926 | 20,650 | 923 | 9,362 | 6,525 | (12,619 | ) | |||||||||||||||||||||||
| Total Company |
$ | 159,485 | $ | 150,228 | $ | 136,993 | $ | 126,449 | $ | 129,449 | $ | 106,204 | $ | 285,934 | $ | 279,677 | $ | 243,197 | ||||||||||||||||||
| For the year ended December 31, | ||||||||||||||||||||||||||||||||||||
| Non-interest expense | Income tax expense/(benefit) | Net income/(loss) from continuing operations(1) |
||||||||||||||||||||||||||||||||||
| 2009 | 2008 | 2007 | 2009 | 2008 | 2007 | 2009 | 2008 | 2007 | ||||||||||||||||||||||||||||
| (In thousands) | (In thousands) | (In thousands) | ||||||||||||||||||||||||||||||||||
| Total Banks |
$ | 144,713 | $ | 216,640 | $ | 108,354 | $ | 4,746 | $ | (53,708 | ) | $ | 14,132 | $ | 13,905 | $ | (166,729 | ) | $ | 34,675 | ||||||||||||||||
| Total Investment Managers |
28,221 | 72,685 | 70,004 | 2,236 | (10,958 | ) | (6,561 | ) | 2,912 | (16,237 | ) | (8,838 | ) | |||||||||||||||||||||||
| Total Wealth Advisors |
25,855 | 24,337 | 13,744 | 3,573 | 3,330 | 2,204 | 5,452 | 7,149 | 4,653 | |||||||||||||||||||||||||||
| Total Segments |
198,789 | 313,662 | 192,102 | 10,555 | (61,336 | ) | 9,775 | 22,269 | (175,817 | ) | 30,490 | |||||||||||||||||||||||||
| Holding Company and Eliminations |
24,169 | 33,325 | 24,304 | (8,923 | ) | (9,401 | ) | (16,114 | ) | (5,884 | ) | (17,399 | ) | (20,809 | ) | |||||||||||||||||||||
| Total Company |
$ | 222,958 | $ | 346,987 | $ | 216,406 | $ | 1,632 | $ | (70,737 | ) | $ | (6,339 | ) | $ | 16,385 | $ | (193,216 | ) | $ | 9,681 | |||||||||||||||
| For the year ended December 31, | ||||||||||||||||||||||||||||||||||||
| Net income from continuing operations attributable to noncontrolling interests |
Net income/(loss) attributable to the Company(2) |
Amortization of intangibles | ||||||||||||||||||||||||||||||||||
| 2009 | 2008 | 2007 | 2009 | 2008 | 2007 | 2009 | 2008 | 2007 | ||||||||||||||||||||||||||||
| (In thousands) | (In thousands) | (In thousands) | ||||||||||||||||||||||||||||||||||
| Total Banks |
$ | — | $ | — | $ | — | $ | 13,905 | $ | (166,729 | ) | $ | 34,675 | $ | 2,724 | $ | 1,288 | $ | 1,246 | |||||||||||||||||
| Total Investment Managers |
997 | 1,393 | 2,054 | 1,915 | (17,630 | ) | (10,892 | ) | 3,955 | 5,041 | 6,514 | |||||||||||||||||||||||||
| Total Wealth Advisors |
2,652 | 2,934 | 1,933 | 2,800 | 4,215 | 2,720 | 1,502 | 1,589 | 1,035 | |||||||||||||||||||||||||||
| Total Segments |
3,649 | 4,327 | 3,987 | 18,620 | (180,144 | ) | 26,503 | 8,181 | 7,918 | 8,795 | ||||||||||||||||||||||||||
| Holding Company and Eliminations |
— | — | — | (13,389 | ) | (208,608 | ) | (22,333 | ) | 108 | 152 | 254 | ||||||||||||||||||||||||
| Total Company |
$ | 3,649 | $ | 4,327 | $ | 3,987 | $ | 5,231 | $ | (388,752 | ) | $ | 4,170 | $ | 8,289 | $ | 8,070 | $ | 9,049 | |||||||||||||||||
93
Table of Contents
NOTES TO CONSOLIDATED FINANCIAL STATEMENTS—(Continued)
| As of December 31, | ||||||||||||||||||||
| Assets(3) | AUM(4) | |||||||||||||||||||
| 2009 | 2008 | 2007 | 2009 | 2008 | 2007 | |||||||||||||||
| (In thousands) | (In millions) | |||||||||||||||||||
| Total Banks |
$ | 5,669,645 | $ | 5,399,691 | $ | 4,933,439 | $ | 3,479 | $ | 3,253 | $ | 3,656 | ||||||||
| Total Investment Managers |
112,497 | 115,693 | 156,054 | 7,048 | 6,381 | 9,115 | ||||||||||||||
| Total Wealth Advisors |
72,062 | 78,707 | 65,133 | 7,161 | 6,235 | 6,412 | ||||||||||||||
| Total Segments |
5,854,204 | 5,594,091 | 5,154,626 | 17,688 | 15,869 | 19,183 | ||||||||||||||
| Holding Company and Eliminations |
195,061 | 1,688,744 | 1,786,203 | (18 | ) | (16 | ) | — | ||||||||||||
| Total Company |
$ | 6,049,265 | $ | 7,282,835 | $ | 6,940,829 | $ | 17,670 | $ | 15,853 | $ | 19,183 | ||||||||
| (1) | Net income/(loss) from continuing operations for the years ended December 31, 2009, 2008, and 2007 were reduced by $1.2 million, $115.3 million, and $18.1 million, respectively, for the impairment of goodwill and intangible assets, net of tax. These decreases were offset by gains on repurchase of debt for the years ended December 31, 2009 and 2008. The Company’s effective tax rates for 2009, 2008, and 2007 are not consistent due to the non-deductibility of a significant amount of goodwill impairment charges that were recorded in 2008 as well as the increases in the proportional amount of tax-exempt income as compared to lower earnings in 2009 and 2007. See Part II, Item 8, “Financial Statements and Supplementary Data—Note 17: Income Taxes” for further details. |
| (2) | Net losses from discontinued operations for the years ended December 31, 2009, 2008, and 2007 of $7.5 million, $191.2 million and $1.5 million, respectively, are included in Holding Company and Eliminations in the calculation of net loss attributable to the Company. |
| (3) | At December 31, 2009, 2008, and 2007, Holding Company and Eliminations assets include assets attributable to discontinued operations of $0, $1.6 billion and $1.7 billion, respectively. |
| (4) | AUM for 2008 includes acquired AUM of DTC of $0.9 billion. |
94
Table of Contents
NOTES TO CONSOLIDATED FINANCIAL STATEMENTS—(Continued)
5. INVESTMENT SECURITIES
A summary of investment securities follows:
| Amortized Cost |
Unrealized | Fair Value | |||||||||||
| Gains | Losses | ||||||||||||
| (In thousands) | |||||||||||||
| At December 31, 2009: |
|||||||||||||
| Available for sale securities at fair value: |
|||||||||||||
| Mortgage backed securities(1) |
$ | 306,761 | $ | 5,909 | $ | (1,159 | ) | $ | 311,511 | ||||
| Government-sponsored entities |
187,557 | 1,400 | (563 | ) | 188,394 | ||||||||
| U.S. government and agencies(2) |
184,719 | 3 | — | 184,722 | |||||||||
| Municipal bonds |
179,008 | 5,680 | (144 | ) | 184,544 | ||||||||
| Corporate bonds |
15,961 | — | (18 | ) | 15,943 | ||||||||
| Other |
2,904 | 65 | (51 | ) | 2,918 | ||||||||
| Total |
$ | 876,910 | $ | 13,057 | $ | (1,935 | ) | $ | 888,032 | ||||
| Held to maturity securities at amortized cost: |
|||||||||||||
| U.S. government and agencies |
$ | 4,001 | $ | 10 | $ | — | $ | 4,011 | |||||
| Other |
500 | — | — | 500 | |||||||||
| Total |
$ | 4,501 | $ | 10 | $ | — | $ | 4,511 | |||||
| At December 31, 2008: |
|||||||||||||
| Available for sale securities at fair value: |
|||||||||||||
| Mortgage backed securities(1) |
$ | 276,319 | $ | 5,589 | $ | (553 | ) | $ | 281,355 | ||||
| Government-sponsored entities |
264,708 | 3,868 | (6 | ) | 268,570 | ||||||||
| Municipal bonds |
208,084 | 4,977 | (118 | ) | 212,943 | ||||||||
| Corporate bonds |
22,826 | 407 | — | 23,233 | |||||||||
| U.S. government and agencies |
8,527 | 47 | — | 8,574 | |||||||||
| Other |
4,439 | 70 | (158 | ) | 4,351 | ||||||||
| Total |
$ | 784,903 | $ | 14,958 | $ | (835 | ) | $ | 799,026 | ||||
| Held to maturity securities at amortized cost: |
|||||||||||||
| U.S. government and agencies |
$ | 3,999 | $ | 98 | $ | — | $ | 4,097 | |||||
| Other |
500 | — | — | 500 | |||||||||
| Total |
$ | 4,499 | $ | 98 | $ | — | $ | 4,597 | |||||
| (1) | Most mortgage-backed securities are guaranteed by U.S. agencies or Government-sponsored entities. |
| (2) | Includes money market mutual fund that invests in U.S. government securities. |
95
Table of Contents
NOTES TO CONSOLIDATED FINANCIAL STATEMENTS—(Continued)
The following table sets forth the maturities of investment securities available for sale, based on contractual maturity, and the weighted average yields of such securities as of and for the year ended December 31, 2009:
| Mortgage backed securities(1) | Government sponsored entities(2) | |||||||||||||||||
| Amortized cost |
Fair value | Weighted average yield |
Amortized cost |
Fair value | Weighted average yield |
|||||||||||||
| (In thousands) | ||||||||||||||||||
| Within one year |
$ | 763 | $ | 774 | 2.92 | % | $ | 26,967 | $ | 27,044 | 2.71 | % | ||||||
| After one, but within five years |
11,196 | 11,482 | 3.49 | % | 147,588 | 148,672 | 2.33 | % | ||||||||||
| After five, but within ten years |
11,464 | 11,695 | 3.58 | % | 13,002 | 12,678 | 3.68 | % | ||||||||||
| Greater than ten years |
283,338 | 287,560 | 3.81 | % | — | — | — | |||||||||||
| Total |
$ | 306,761 | $ | 311,511 | 3.78 | % | $ | 187,557 | $ | 188,394 | 2.48 | % | ||||||
| U.S. government and agencies(2) | Municipal bonds(2) | |||||||||||||||||
| Amortized cost |
Fair value | Weighted average yield |
Amortized cost |
Fair value | Weighted average yield(3) |
|||||||||||||
| (In thousands) | ||||||||||||||||||
| Within one year |
$ | 178,046 | $ | 178,048 | 0.01 | % | $ | 19,222 | $ | 19,452 | 3.97 | % | ||||||
| After one, but within five years |
— | — | — | 117,131 | 121,644 | 4.52 | % | |||||||||||
| After five, but within ten years |
— | — | — | 36,907 | 37,432 | 4.73 | % | |||||||||||
| Greater than ten years |
6,673 | 6,674 | 3.76 | % | 5,748 | 6,016 | 5.81 | % | ||||||||||
| Total |
$ | 184,719 | $ | 184,722 | 0.16 | % | $ | 179,008 | $ | 184,544 | 4.54 | % | ||||||
| Corporate bonds(2) | Other | |||||||||||||||||
| Amortized cost |
Fair value |
Weighted average yield |
Amortized cost |
Fair value |
Weighted average yield |
|||||||||||||
| (In thousands) | ||||||||||||||||||
| Within one year |
$ | — | $ | — | — | $ | 404 | $ | 412 | 0.00 | % | |||||||
| After one, but within five years |
— | — | — | 2,500 | 2,506 | 3.70 | % | |||||||||||
| After five, but within ten years |
15,961 | 15,943 | 2.33 | % | — | — | — | |||||||||||
| Total |
$ | 15,961 | $ | 15,943 | 2.33 | % | $ | 2,904 | $ | 2,918 | 3.18 | % | ||||||
| (1) | Mortgage backed securities are shown based on their final maturity, but due to prepayments they are expected to have shorter lives. |
| (2) | Certain securities are callable before their final maturity. |
| (3) | Yield shown on a fully taxable equivalent (FTE) basis. |
The maturities of investment securities held to maturity, based on contractual maturity, at December 31, 2009 for both U.S. government and agencies, and Other were within one year. The weighted average yields for those security types were 2.88%, and 2.66%, respectively.
The weighted average remaining maturity at December 31, 2009 was 8.54 years for investment securities available for sale and approximately 2 months for investment securities held to maturity. As of December 31, 2009, approximately $207.4 million of investment securities available for sale were callable before maturity. The weighted average yield is calculated based on average amortized cost which does not include the effect of unrealized changes in fair value that are reflected as a component of stockholders’ equity.
96
Table of Contents
NOTES TO CONSOLIDATED FINANCIAL STATEMENTS—(Continued)
The following table presents the proceeds from sales, gross realized gains and gross realized losses for securities available for sale that were sold during the following years:
| Year ended December 31, | ||||||||||||
| 2009 | 2008 | 2007 | ||||||||||
| (In thousands) | ||||||||||||
| Proceeds from sales |
$ | 304,822 | $ | 106,112 | $ | 95 | ||||||
| Realized gains |
5,962 | 2,601 | 14 | |||||||||
| Realized losses |
(159 | ) | (208 | ) | (12 | ) | ||||||
The following tables set forth information regarding securities at December 31, 2009 and 2008 having temporary impairment, due to the fair values having declined below the amortized cost of the individual securities, and the time period that the investments have been temporarily impaired. There were no investment securities held to maturity in an unrealized loss position at December 31, 2009 or 2008.
| Less than 12 months | 12 months or longer | Total | |||||||||||||||||||||
| Fair value |
Unrealized losses |
Fair value |
Unrealized losses |
Fair value |
Unrealized losses |
# of securities | |||||||||||||||||
| (In thousands) | |||||||||||||||||||||||
| December 31, 2009 |
|||||||||||||||||||||||
| Available for sale securities |
|||||||||||||||||||||||
| Mortgage backed securities |
$ | 89,089 | $ | (1,128 | ) | $ | 2,877 | $ | (31 | ) | $ | 91,966 | $ | (1,159 | ) | 36 | |||||||
| Government-sponsored entities |
77,769 | (563 | ) | — | — | 77,769 | (563 | ) | 14 | ||||||||||||||
| Municipal bonds |
15,206 | (144 | ) | — | — | 15,206 | (144 | ) | 22 | ||||||||||||||
| Corporate bonds |
15,943 | (18 | ) | — | — | 15,943 | (18 | ) | 4 | ||||||||||||||
| Other |
— | — | 142 | (51 | ) | 142 | (51 | ) | 26 | ||||||||||||||
| Total |
$ | 198,007 | $ | (1,853 | ) | $ | 3,019 | $ | (82 | ) | $ | 201,026 | $ | (1,935 | ) | 102 | |||||||
All of the mortgage backed and government-sponsored entities securities in the table above had a Moody’s credit rating of AAA. All but two of the municipal bonds in the table above were rated by Moody’s and had credit ratings of at least Aa3, while the remaining two municipal bonds were rated by Standard and Poor’s and had credit ratings of AA-. The corporate bonds in the table above had Moody’s credit ratings of Baa3. The other securities consisted of equity securities. At December 31, 2009, the Company does not consider these investments other-than-temporarily impaired because the decline in fair value on investments is primarily attributed to changes in interest rates and not credit quality.
At December 31, 2009 and 2008, the amount of investment securities in an unrealized loss position greater than 12 months as well as in total was not significant and was primarily due to movements in interest rates. The Company has no intent to sell any securities in an unrealized loss position at December 31, 2009 and it is not more likely than not that the Company would be forced to sell any of these securities prior to the full recovery of all unrealized loss amounts. Subsequent to December 31, 2009 and through the date of the filing of this Annual Report on Form 10-K, no securities were downgraded to below investment grade.
97
Table of Contents
NOTES TO CONSOLIDATED FINANCIAL STATEMENTS—(Continued)
| Less than 12 months | 12 months or longer | Total | |||||||||||||||||||||
| Fair value |
Unrealized losses |
Fair value |
Unrealized losses |
Fair value |
Unrealized losses |
# of securities | |||||||||||||||||
| (In thousands) | |||||||||||||||||||||||
| December 31, 2008 |
|||||||||||||||||||||||
| Available for sale securities |
|||||||||||||||||||||||
| Mortgage backed securities |
$ | 39,731 | $ | (435 | ) | $ | 5,984 | $ | (118 | ) | $ | 45,715 | $ | (553 | ) | 7 | |||||||
| Government-sponsored entities |
4,328 | (6 | ) | — | — | 4,328 | (6 | ) | 2 | ||||||||||||||
| Municipal bonds |
10,260 | (118 | ) | — | — | 10,260 | (118 | ) | 15 | ||||||||||||||
| Other |
2,112 | (52 | ) | 91 | (106 | ) | 2,203 | (158 | ) | 51 | |||||||||||||
| Total |
$ | 56,431 | $ | (611 | ) | $ | 6,075 | $ | (224 | ) | $ | 62,506 | $ | (835 | ) | 75 | |||||||
At December 31, 2008, because the decline in fair value is primarily attributed to changes in interest rates and not credit quality, these investments were not considered other-than-temporarily impaired.
The Company had $20.8 million and $21.2 million in cost method investments included in other assets on the consolidated balance sheets at December 31, 2009 and 2008, respectively. Cost method investments may be temporarily impaired when the fair values decline below the amortized costs of the individual investments. There were no cost method investments with unrealized losses at December 31, 2009 or 2008. The Company invests primarily in low income housing partnerships which generate tax credits. The Company also holds partnership interests in venture capital funds formed to provide financing to small businesses and to promote community development.
The following table presents the concentration of securities with any one issuer that exceeds ten percent of stockholders’ equity as of December 31, 2009:
| Amortized cost | Fair value | |||||
| (In thousands) | ||||||
| U.S. Treasury |
$ | 182,047 | $ | 182,059 | ||
| Government National Mortgage Association |
165,045 | 169,200 | ||||
| Federal National Mortgage Association |
165,485 | 166,015 | ||||
| Federal Home Loan Mortgage Corporation |
80,515 | 81,165 | ||||
| Federal Home Loan Bank |
67,268 | 67,521 | ||||
| Total |
$ | 660,360 | $ | 665,960 | ||
6. LOANS RECEIVABLE
The Banks’ lending activities are conducted principally in New England, Northern and Southern California, and the Pacific Northwest. The Banks originate single and multi-family residential loans, commercial real estate loans, commercial loans, construction and land loans, and home equity and other consumer loans. The Banks also purchase high quality residential mortgage loans as a way to increase volumes more efficiently. Most loans are secured by borrowers’ personal or business assets. The ability of the Banks’ single family residential and consumer borrowers to honor their repayment commitments is generally dependent on the level of overall economic conditions within the Banks’ lending area. Commercial, construction, and land borrowers’ ability to repay is generally dependent upon the health of the economy and the real estate, including construction, sector in particular. Accordingly, the ultimate collectability of a substantial portion of the Banks’ loan portfolio is susceptible to changing conditions in the New England, Northern and Southern California, and the Pacific Northwest economies and real estate markets.
98
Table of Contents
NOTES TO CONSOLIDATED FINANCIAL STATEMENTS—(Continued)
Total loans include deferred loan fees/ (costs), net, of $0.8 million of net deferred loan costs and $0.9 million of net deferred loan fees as of December 31, 2009 and 2008, respectively. Deferred loan fees/ (costs) include unamortized premiums or discounts related to mortgage loans purchased by the Banks. Also included in total loans is the unamortized loan fair market valuation discount related to acquisitions of $1.0 million and $1.6 million as of December 31, 2009 and 2008, respectively. Mortgage loans serviced for others totaled $60.0 million and $64.2 million at December 31, 2009 and 2008, respectively and are not included in the total of the Company’s loans.
The following table is a summary of the loan portfolio based on the geography of the lender. The concentration of the Private Banking loan data is based on the location of the lender. Net loans from the Holding Company to certain principals of the Company’s affiliate partners, loans at the Company’s nonbanking segments, and inter-company loan eliminations are identified as “Eliminations and other, net.”
| December 31, 2009 |
December 31, 2008 |
|||||||
| (In thousands) | ||||||||
| Commercial loans: |
||||||||
| New England |
$ | 943,740 | $ | 986,381 | ||||
| Northern California |
927,074 | 821,308 | ||||||
| Southern California |
231,684 | 220,636 | ||||||
| Pacific Northwest |
111,039 | 129,727 | ||||||
| Eliminations and other, net |
(517 | ) | (1,144 | ) | ||||
| Total commercial loans |
$ | 2,213,020 | $ | 2,156,908 | ||||
| Construction and land loans: |
||||||||
| New England |
$ | 117,817 | $ | 107,991 | ||||
| Northern California |
161,839 | 225,536 | ||||||
| Southern California |
7,719 | 21,477 | ||||||
| Pacific Northwest |
28,286 | 76,713 | ||||||
| Total construction and land loans |
$ | 315,661 | $ | 431,717 | ||||
| Residential mortgage loans: |
||||||||
| New England |
$ | 1,113,842 | $ | 1,087,843 | ||||
| Northern California |
219,394 | 211,976 | ||||||
| Southern California |
124,212 | 29,204 | ||||||
| Pacific Northwest |
37,255 | 23,858 | ||||||
| Total residential mortgage loans |
$ | 1,494,703 | $ | 1,352,881 | ||||
| Home equity and other consumer loans: |
||||||||
| New England |
$ | 179,792 | $ | 87,619 | ||||
| Northern California |
74,192 | 78,159 | ||||||
| Southern California |
20,947 | 15,333 | ||||||
| Pacific Northwest |
5,278 | 2,683 | ||||||
| Eliminations and other, net |
3,447 | 3,781 | ||||||
| Total home equity and other consumer loans |
$ | 283,656 | $ | 187,575 | ||||
| Total loans |
$ | 4,307,040 | $ | 4,129,081 | ||||
Non-accrual loans totaled $90.3 million at December 31, 2009, compared to $64.0 million at December 31, 2008. The increase in non-accrual loans is generally the result of continued weakness in the U.S. housing, labor, and commercial real estate markets and increased bankruptcy filings. This weakness has caused a related
99
Table of Contents
NOTES TO CONSOLIDATED FINANCIAL STATEMENTS—(Continued)
deterioration in real estate, construction in process, and land loans as prices for these assets continued to decline. Further deterioration in the real estate markets or the local economies of the Banks’ market areas will lead to increased non-accrual loans, with a corresponding increase in provision for loan losses.
The Company discontinues the accrual of interest on a loan when the collectability of principal or interest is in doubt or the loan is 90 days past due. In certain instances, although very infrequent, loans that become 90 days past due may remain on accrual status if management determines that the loan is both well secured and in the process of collection. There were no loans 90 days past due, but still accruing, as of December 31, 2009 or December 31, 2008.
Non-performing loans, delinquent loans, and classified loans are impacted by factors such as the economic conditions in the Banks’ geographic regions, interest rates, collateral values, and seasonality. These factors are generally not within the Company’s control. A decline in fair values of the collateral, for loans that are collateral dependent, for non-performing loans or classified loans could result in additional future expense depending on the timing and severity of the decline. The Banks continue to evaluate the underlying collateral of each non-accrual loan and pursue the collection of interest and principal. Where appropriate, the Banks obtain updated appraisals on the collateral.
When management determines that it is probable that the Bank will not collect all principal and interest on a loan, usually commercial loans, in accordance with the original loan terms, as well as all troubled debt restructured loans (“TDRs”), the loan is designated as impaired. Impaired loans are generally included within the balance of non-accrual loans. Impaired loans totaled $83.2 million as of December 31, 2009 as compared to $35.2 million at December 31, 2008. At December 31, 2009, $20.7 million of the impaired loans had $5.0 million in specific allocations to the general reserve. The remaining $62.5 million of impaired loans did not have specific allocations due primarily to the adequacy of collateral or prior charge-offs taken. At December 31, 2008, $21.6 million of impaired loans had $8.0 million in specific allocations to the general reserve, and the remaining $13.6 million of impaired loans did not have specific allocations. For loans classified as impaired, while the loans were considered impaired, the Company recognized no interest income in 2009, an immaterial amount of interest income in 2008, and no interest income in 2007. The average investment in impaired loans in 2009 and 2008 was $67.8 million and $36.4 million, respectively. Loans that are designated as impaired require an analysis to determine the amount of impairment, if any. Impairment would be indicated as a result of the carrying value of the loan exceeding the estimated collateral value, less costs to sell, for collateral dependent loans or the net present value of cash flow for loans not considered to be collateral dependent. Generally, shortfalls in the analysis on collateral dependent loans would result in the impairment amount being charged off to the allowance for loan losses. Shortfalls on cash flow dependent loans may be carried as specific allocations to the general reserve as long as the impairment is not a significant percentage of the loan and the impairment has not been evident for a prolonged period of time.
Loans in the Held for Sale category are carried at fair value and are required to be excluded from the allowance for loan losses analysis.
The Company may, under certain circumstances, restructure loans as a concession to borrowers who have experienced financial difficulty. TDRs are included in impaired loans. These TDRs typically result from the Company’s loss mitigation activities and could include rate reductions, payment extensions, and principal forgiveness. TDRs included in impaired loans totaled $8.0 million and $1.4 million at December 31, 2009 and 2008, respectively. At December 31, 2009, the Company had an immaterial amount of commitments to lend additional funds to debtors for loans whose terms had been modified in a troubled debt restructuring and no commitments at December 31, 2008.
100
Table of Contents
NOTES TO CONSOLIDATED FINANCIAL STATEMENTS—(Continued)
Loans to senior management, executive officers, and directors are made in the ordinary course of business, under normal credit terms, including interest rates and collateral requirements prevailing at the time of origination for comparable transactions with other persons and do not represent more than normal credit risk. The majority of the loans are made by the Banks to their directors. Many of these directors have long-term business and personal accounts with the Banks which may include deposits, loans, and investment management and trust services.
The following table presents a summary of the activity of loans to senior management, executive officers, and directors:
| For the year ended December 31, |
||||||||
| 2009 | 2008 | |||||||
| (In thousands) | ||||||||
| Balance at beginning of year |
$ | 28,181 | $ | 24,467 | ||||
| Additions |
21,488 | 12,576 | ||||||
| Repayments |
(6,128 | ) | (8,862 | ) | ||||
| Adjustments(1) |
(6,346 | ) | — | |||||
| Balance at end of year |
$ | 37,195 | $ | 28,181 | ||||
| (1) | Adjustment is for a loan still outstanding at December 31, 2009 to a director who retired during the year. |
In addition, less than 1% of the Company’s loans at December 31, 2009 and 2008 are managed by the Holding Company and a nonbanking affiliate partner. Loans managed by the Holding Company and the nonbanking affiliate partner of $2.9 million and $2.6 million at December 31, 2009 and 2008, respectively, include loans made to certain principals of DGHM, DTC, Anchor, and BOS at market rates and terms.
7. ALLOWANCE FOR LOAN LOSSES
The allowance for loan losses is reported as a reduction of outstanding loan balances, and totaled $68.4 million and $64.1 million at December 31, 2009 and 2008, respectively.
The increased level of allowance for loan losses in 2009 reflects the higher amount of non-performing and classified loans, particularly in the Northern California region, and recent historical charge-off trends and current economic conditions in all regions. An analysis of the risk in the loan portfolio as well as management judgment is used to determine the estimated appropriate amount of the allowance for loan losses.
The following table summarizes the changes in the allowance for loan losses for the periods indicated:
| At and for the year ended December 31, | ||||||||||||
| 2009 | 2008 | 2007 | ||||||||||
| (In thousands) | ||||||||||||
| Total loans(1) |
$ | 4,307,040 | $ | 4,129,081 | $ | 4,003,291 | ||||||
| Allowance for loan losses, beginning of year |
$ | 64,091 | $ | 59,933 | $ | 33,234 | ||||||
| Provision for loan losses |
44,959 | 196,643 | 23,449 | |||||||||
| Charge-offs |
(41,934 | ) | (192,796 | ) | (189 | ) | ||||||
| Recoveries |
1,328 | 311 | 667 | |||||||||
| Acquisition and other |
— | — | 2,772 | |||||||||
| Allowance for loan losses, end of year |
$ | 68,444 | $ | 64,091 | $ | 59,933 | ||||||
| Allowance for loan losses to total loans(1) |
1.59 | % | 1.55 | % | 1.50 | % | ||||||
| (1) | Total loans include deferred loan origination fees/(costs), net, and purchase premiums and discounts. |
101
Table of Contents
NOTES TO CONSOLIDATED FINANCIAL STATEMENTS—(Continued)
The balance for the reserve for unfunded loan commitments, which is included in the consolidated balance sheets in Other Liabilities, was $3.0 million, $3.4 million, and $4.7 million at the year ending December 31, 2009, 2008, and 2007, respectively.
8. DERIVATIVES
The Company’s objective in using derivatives is to add stability to interest income and to manage the risk related to exposure to changes in interest rates. To accomplish this objective, one of the affiliate Banks entered into a $100 million prime-based interest rate floor (the “Floor”) to protect against movements in interest rates below the Floor’s strike rate of 6.5% over the life of the agreement. The Floor has an effective date of November 1, 2005, and a maturity date of November 1, 2010. The Floor hedges the variable cash flows associated with existing variable-rate loan assets that are based on the prime rate (“Prime”). For accounting purposes, the Floor is designated as a cash flow hedge of the overall changes in cash flows on the first Prime-based interest payments received by the Bank affiliate each calendar month during the term of the hedge that, in aggregate for each period, are interest payments on principal from specified portfolios equal to the notional amount of the Floor.
The Company uses the “Hypothetical Derivative Method” described in ASC 815, Derivatives and Hedging (formerly FAS 133, Accounting for Derivative Instruments and Hedging Activities) (ASC 815), for quarterly prospective and retrospective assessments of hedge effectiveness, as well as for measurements of hedge ineffectiveness. The effective portion of changes in the fair value of the derivative is initially reported in other comprehensive income (outside of earnings) and subsequently reclassified to earnings in “Interest and dividend income” when the hedged transactions affect earnings. Ineffectiveness resulting from the hedge is recorded as a gain or loss in the consolidated statement of operations as part of “Fees and other income”. The Bank affiliate did not have any hedge ineffectiveness recognized in earnings during the year ended December 31, 2009. The Bank affiliate also monitors the risk of counterparty default on an ongoing basis.
Interest payments received from loans that prepay are included in the hedged portfolio due to the guidance in ASC 815, which allows the designated forecasted transactions to be the variable, Prime-based interest payments on a rolling portfolio of prepayable interest-bearing loans using the first-payments-received technique.
102
Table of Contents
NOTES TO CONSOLIDATED FINANCIAL STATEMENTS—(Continued)
In addition to the above hedging activities, the Bank affiliate offers certain derivative products directly to qualified commercial borrowers. The Bank affiliate hedges derivative transactions executed with commercial borrowers by entering into mirror-image, offsetting derivatives with third parties. Derivative transactions executed as part of this program are not designated as qualifying hedging relationships and are, therefore, marked to market through earnings each period. Because the derivatives have mirror-image contractual terms, the changes in fair value substantially offset each other through earnings. As of December 31, 2009 and December 31, 2008, the fair value of the derivative assets was $4.9 million and $7.8 million, respectively, and the offsetting derivative liabilities had a fair value of $5.1 million and $7.7 million, respectively. Fees earned in connection with the execution of derivatives related to this program are recognized in “Other income”. The derivative asset and liability values below include an adjustment related to the consideration of credit risk required under ASC 820 of less than $0.1 million in the years ended December 31, 2009 and December 31, 2008, respectively. As of December 31, 2009 and December 31, 2008, the Bank affiliate had 18 interest rate swaps with aggregate notional amounts of $184.2 million and $185.8 million, respectively, related to this program. The table below presents the fair value of the Bank affiliate’s derivative financial instruments as well as their classification on the consolidated balance sheets as of December 31, 2009 and December 31, 2008.
| December 31, 2009 | December 31, 2008 | |||||||||||||||||||||
| Asset derivatives | Liability derivatives | Asset derivatives | Liability derivatives | |||||||||||||||||||
| Balance sheet location |
Fair value | Balance sheet location |
Fair value | Balance sheet location |
Fair value | Balance sheet location |
Fair value | |||||||||||||||
| (In thousands) | ||||||||||||||||||||||
| Derivatives designated as hedging instruments: |
||||||||||||||||||||||
| Interest rate products |
Other assets |
$ | 2,646 | Other liabilities |
$ | — | Other assets |
$ | 5,260 | Other liabilities |
$ | — | ||||||||||
| Derivatives not designated as hedging instruments: |
||||||||||||||||||||||
| Interest rate products(1) |
Other assets |
4,924 | Other assets |
(5,053 | ) | Other assets |
7,762 | Other assets |
(7,698 | ) | ||||||||||||
| Total |
$ | 7,570 | $ | (5,053 | ) | $ | 13,022 | $ | (7,698 | ) | ||||||||||||
| (1) | Interest rate product derivative liabilities are netted with interest rate product derivative assets within Other assets on the consolidated balance sheet. |
As indicated in the table above, as of December 31, 2009 and December 31, 2008, the Floor designated as a cash flow hedge had a fair value of $2.6 million and $5.3 million, respectively. For the year ended December 31, 2009 and December 31, 2008, the after-tax change in net unrealized gains/losses on the cash flow hedge reported in the consolidated statements of changes in stockholders’ equity were $1.3 million (net loss) and $2.5 million (net gain), respectively.
Amounts reported in accumulated other comprehensive income related to the Floor will be reclassified to interest income as interest payments are received on the Bank affiliate’s variable-rate assets. During 2010, the Bank affiliate estimates that an additional $2.4 million will be reclassified as an increase to interest income.
During the years ended December 31, 2009 and 2008, the Bank affiliate accelerated the reclassification of amounts in other comprehensive income to earnings as a result of the hedged forecasted transactions relating to the Bank affiliate’s previously designated interest rate floor becoming probable not to occur. The accelerated amount was an immaterial loss for both the years ended December 31, 2009 and December 31, 2008.
103
Table of Contents
NOTES TO CONSOLIDATED FINANCIAL STATEMENTS—(Continued)
The table below presents the effect of the Bank affiliate’s derivative financial instruments on the consolidated statement of operations for the years ended December 31, 2009.
| Year Ended December 31, 2009 | |||||||||||||
| Derivatives in |
Amount of gain/ (loss) recognized in OCI on derivative (effective portion) |
Location of gain/(loss) reclassified from accumulated OCI into income (effective portion) |
Amount of gain/ (loss) reclassified from accumulated OCI into income (effective portion) |
Location of gain/(loss) recognized in income on derivative (ineffective portion and amount excluded from effectiveness testing) |
Amount of gain/(loss) recognized in income on derivative (ineffective portion and amount excluded from effectiveness testing) | ||||||||
| (In thousands) | |||||||||||||
| Interest rate products |
$ | 674 | Interest and dividend income |
$ | 3,054 | Fees and other income |
$ | — | |||||
| Year Ended December 31, 2009 |
||||||
| Derivatives not |
Location of gain/(loss) recognized in income on derivative |
Amount of gain/ (loss) recognized in income on derivative |
||||
| (In thousands) | ||||||
| Interest rate products |
Fees and other income | $ | (193 | ) | ||
The Bank affiliate has agreements with its derivative counterparties that contain provisions where, if the Bank affiliate defaults on any of its indebtedness, including default where repayment of the indebtedness has not been accelerated by the lender, then the Bank affiliate could also be declared in default on its derivative obligations.
The Bank affiliate also has agreements with certain of its derivative counterparties that contain provisions where if the Bank affiliate fails to maintain its status as a well- or adequately-capitalized institution, then the counterparty could terminate the derivative positions and the Bank affiliate would be required to settle its obligations under the agreements.
Certain of the Bank affiliate’s agreements with its derivative counterparties contain provisions where if specified events or conditions occur that materially change the Bank affiliate’s creditworthiness in an adverse manner, the Bank affiliate may be required to fully collateralize its obligations under the derivative instruments.
As of December 31, 2009, the fair value of derivatives in a liability position, which includes accrued interest but excludes any adjustment for nonperformance risk, related to these agreements was $2.4 million. As of December 31, 2009, the Bank affiliate has minimum collateral posting thresholds with certain of its derivative counterparties and has posted collateral of $0.3 million against its obligations under these agreements.
104
Table of Contents
NOTES TO CONSOLIDATED FINANCIAL STATEMENTS—(Continued)
9. PREMISES AND EQUIPMENT
Premises and equipment consisted of the following:
| As of December 31, | ||||||
| 2009 | 2008 | |||||
| (In thousands) | ||||||
| Leasehold improvements |
$ | 29,077 | $ | 26,967 | ||
| Furniture, fixtures, and equipment |
32,941 | 29,806 | ||||
| Buildings |
4,258 | 4,258 | ||||
| Land |
374 | 374 | ||||
| Subtotal |
66,650 | 61,405 | ||||
| Less: accumulated depreciation and amortization |
38,301 | 32,659 | ||||
| Premises and equipment, net |
$ | 28,349 | $ | 28,746 | ||
Depreciation and amortization expense related to premises and equipment was $5.9 million, $5.4 million and $5.2 million for the years ended December 31, 2009, 2008, and 2007, respectively.
The Company is obligated for minimum payments under non-cancelable operating leases. In accordance with the terms of these leases, the Company is currently committed to minimum annual payments as follows:
| Minimum lease payments | |||
| (In thousands) | |||
| 2010 |
$ | 12,435 | |
| 2011 |
12,657 | ||
| 2012 |
10,759 | ||
| 2013 |
9,013 | ||
| 2014 |
7,982 | ||
| Thereafter |
20,451 | ||
| Total |
$ | 73,297 | |
Additionally, the Company remains a guarantor on a non-cancelable operating lease for a divested affiliate. Minimum lease payments on this lease are $0.6 million for 2010 and 2011; $0.7 million for 2012, 2013 and 2014; and $1.3 million thereafter.
Rent expense for the years ended December 31, 2009, 2008, and 2007 was $13.1 million, $11.8 million and $10.3 million, respectively.
105
Table of Contents
NOTES TO CONSOLIDATED FINANCIAL STATEMENTS—(Continued)
10. GOODWILL AND OTHER INTANGIBLE ASSETS
Goodwill
The following table details the changes in the carrying value of goodwill:
| Balance at December 31, 2008 |
Acquisitions | Impairment | Other adjustments |
Balance at December 31, 2009 | ||||||||||||
| (In thousands) | ||||||||||||||||
| Goodwill |
||||||||||||||||
| Private Banking |
$ | 2,403 | $ | — | $ | — | $ | — | $ | 2,403 | ||||||
| Investment Management |
59,361 | 3,303 | — | — | 62,664 | |||||||||||
| Wealth Advisory |
43,326 | 1,739 | (1,440 | ) | — | 43,625 | ||||||||||
| Total goodwill |
$ | 105,090 | $ | 5,042 | $ | (1,440 | ) | $ | — | $ | 108,692 | |||||
| Balance at December 31, 2007 |
Acquisitions | Impairment | Other adjustments |
Balance at December 31, 2008 | ||||||||||||
| (In thousands) | ||||||||||||||||
| Goodwill |
||||||||||||||||
| Private Banking |
$ | 86,219 | $ | 236 | $ | (84,178 | ) | $ | 126 | $ | 2,403 | |||||
| Investment Management |
81,915 | 9,855 | (32,409 | ) | — | 59,361 | ||||||||||
| Wealth Advisory |
38,539 | 4,787 | — | — | 43,326 | |||||||||||
| Equity method investments |
3,456 | — | (3,456 | ) | — | — | ||||||||||
| Total goodwill |
$ | 210,129 | $ | 14,878 | $ | (120,043 | ) | $ | 126 | $ | 105,090 | |||||
The following table details total goodwill and the cumulative impairment charges thereon as of December 31, 2009:
| Goodwill prior to impairment |
Cumulative goodwill impairment |
Goodwill | ||||||||
| (In thousands) | ||||||||||
| Goodwill |
||||||||||
| Private Banking |
$ | 86,581 | $ | (84,178 | ) | $ | 2,403 | |||
| Investment Management |
112,925 | (50,261 | ) | 62,664 | ||||||
| Wealth Advisory |
45,065 | (1,440 | ) | 43,625 | ||||||
| Equity method investments |
3,456 | (3,456 | ) | — | ||||||
| Total goodwill |
$ | 248,027 | $ | (139,335 | ) | $ | 108,692 | |||
In 2009, the Company recognized additional goodwill of $5.0 million due to contingent consideration payments at Anchor and DTC.
In 2008, the Company recognized additional goodwill of $15.0 million due primarily to contingent consideration payments at Anchor, DTC, and BOS.
For tax purposes, the goodwill relating to BOS, KLS, and DTC of $43.6 million and $43.3 million at December 31, 2009 and 2008, respectively, is expected to be deductible.
ASC 350 requires the Company to test goodwill for impairment on an annual basis and in between annual dates if events or circumstances change that would more likely than not reduce the fair value of the reporting unit
106
Table of Contents
NOTES TO CONSOLIDATED FINANCIAL STATEMENTS—(Continued)
below its carrying value. In addition, management evaluated the relationship of aggregate fair values of its reporting units to the Company’s overall market capitalization and book values during each quarter of 2009.
2009 Goodwill and Intangibles Impairment
Management completed its annual goodwill and intangibles impairment testing during the fourth quarter of 2009. The conclusion of the testing resulted in the Company recognizing a $1.4 million goodwill impairment charge and $0.3 million intangible impairment charge at DTC. The impairment was primarily due to the fourth quarter 2009 contingent consideration payment to DTC. For all other reporting units, the estimated fair value exceeded the carrying value.
To reach this impairment conclusion, the Company performed a detailed two step goodwill impairment analysis at DTC. The following describes the details of this testing.
The Company performed the Step 1 goodwill impairment analysis using a weighted average of the discounted cash flow method and comparable market multiples method. The income approach utilized a discounted cash flow analysis which was based on the expectation that DTC’s net AUM flows will continue to recover in 2010. The resulting operating earnings were expected to grow at a 13.0% compounded annual growth rate over the projected period. The terminal growth rate was estimated at 5.0% and the cash flows were discounted at a 16.0% cost of capital. Based on these inputs and assumptions, the income approach resulted in an $8.6 million valuation.
The market approach utilized revenue and earnings before interest, taxes, depreciation and amortization (“EBITDA”) multiples from a peer group of nine publicly traded comparable investment management firms. The comparables were chosen based on similar growth prospects and risks to that of DTC. A price to revenue multiple of 1.1x was selected and a price to EBITDA multiple of 10.0x was selected. Control premiums were considered and determined to be 15%. The average of the price to revenue multiple method and the price to EBITDA multiple method resulted in a $6.7 million valuation.
A weighted average, with 80% from the income and 20% from the market approach, indicated a fair value of approximately $8.2 million.
As the carrying amount of DTC exceeded its fair value, the Company proceeded to Step 2 of the goodwill impairment testing to measure the amount of the impairment loss. This was done by comparing the fair value of the reporting unit goodwill with the carrying amount of that goodwill. In order to do this, the fair value of the reporting unit was allocated to the assets and liabilities of the unit. This process included estimating the fair value of the advisory contracts, trade name, non-compete agreements, and trust charter.
2008 Goodwill and Intangibles Impairment
In 2008, the Company recognized $120.0 million of goodwill impairment charges related to three of its consolidated affiliates and its equity method investee. Triggering events occurred in each of the first three quarters of 2008, and the regular annual goodwill and intangible impairment testing in the fourth quarter also resulted in impairment charges. The triggering events were related to the downturn in local and national real estate markets, the resulting decrease in values of peer banks whose operations relate to the depressed real estate markets, and downturns in national and international stock markets. The Company also recognized intangible impairment charges for $13.2 million during 2008.
107
Table of Contents
NOTES TO CONSOLIDATED FINANCIAL STATEMENTS—(Continued)
FPB
A rapid downturn in the local real estate market and resulting decline in the credit quality of FPB’s loan portfolio in the first quarter of 2008, followed by a significant decrease in the market capitalization of comparable public companies in the second quarter of 2008, were considered triggering events for testing goodwill for impairment. The Company performed the Step 1 goodwill impairment analysis and determined that the goodwill at FPB was impaired. The fair value used in Step 1 was determined using an income approach and a market approach weighted equally. The income approach utilized a two stage dividend discount model which was based on the expectation that the Southern California economy will remain depressed throughout 2008 and 2009 with a recovery beginning in 2010. The resulting operating earnings were expected to grow at a 7.3% compounded annual growth rate over the projected period. The terminal growth rate was estimated at 4.5% and the cash flows were discounted at a 12.3% discount rate. The market multiples were determined using the price to earnings multiples of public banks in the Southern California region that were of a comparable size with similar lending activities. As a result of the Step 1 analysis, management determined that the goodwill at FPB was impaired and initiated a Step 2 valuation to determine the amount of goodwill impairment expense to recognize. Due to the timing of the impairment assessment, the Company believed that an impairment loss was probable and could be reasonably estimated. The significant estimates that management made for the Step 2 estimate were the value of the fixed rate loan portfolio and the core deposit intangibles. The fixed rate loans were valued as of March 31, 2008 based on a fair value analysis prepared as of December 31, 2007, and core deposit intangibles were valued based on the ratio of the core deposit intangible to core deposits at the time of acquisition applied to core deposits at March 31, 2008. Based on this valuation, the Company recognized a goodwill impairment expense of $20.6 million in the first quarter of 2008.
In the second quarter of 2008, FPB recognized additional loan losses and additional loans were classified as non-accrual in excess of what was expected in the March 31, 2008 valuation. The Company reviewed the market approach used at March 31, 2008 and determined that the stock prices of the comparable public companies used in that approach had decreased, on average, 23% in the second quarter of 2008. An updated market approach resulted in a valuation of FPB significantly below book value and, therefore, the remaining goodwill of $13.7 million was expensed for a total goodwill impairment of $34.3 million in 2008.
The Company recognized goodwill impairment charges for all of FPB’s $34.3 million of goodwill in 2008. The Company also recognized intangible impairment charges for $3.7 million of FPB’s core deposit intangibles in 2008.
Charter
The significant adverse change in business climate in the third quarter of 2008 was considered a triggering event for testing goodwill for impairment. This was followed by the annual goodwill and intangible impairment testing in the fourth quarter of 2008. The Company performed the detailed Step 1 goodwill impairment analysis and determined that the goodwill at Charter was impaired. The fair value used in Step 1 was determined using an income approach and a market approach each weighted equally. For the income approach, the projected cash flows of Charter were estimated based on future net income, capital needs, and dividends or capital contributions to or from the Company. The exit price to tangible book value was estimated at 1.25x. A control premium of 10% was applied to the exit price to tangible book which resulted in a value of 1.375. The terminal year financial value was multiplied by the 1.375 to obtain an implied exit value. The present value of the exit value was determined using a discount rate of 14.5%. The sum of the present value of the cash flows and the present value of the terminal value indicated a value from the income approach of $28.6 million.
For the market approach, the Price to Tangible Book Value Method and the Price to Earnings Value Method were used. The Price to Tangible Book was calculated using 12 comparable banks and was estimated at 1.25x. For the Price to Earnings Value Method, Charter’s financial information was forecasted through 2012. Based on
108
Table of Contents
NOTES TO CONSOLIDATED FINANCIAL STATEMENTS—(Continued)
comparisons to other banks, a price to earnings multiple of 7.5x was selected. A control premium of 10% was then applied to the price to tangible book and earnings multiples. The average of the Price to Tangible Book Value Method and the Price to Earnings Value Method was $36.5 million.
Based on equally weighting the income and market approaches, the fair value was approximately $32.6 million.
As the carrying amount of Charter exceeded its fair value, the Company proceeded to Step 2 of the goodwill impairment testing to measure the amount of the impairment loss. This was done by comparing the fair value of the reporting unit goodwill with the carrying amount of that goodwill. In order to do this, the fair value of the reporting unit was allocated to the assets and liabilities of the unit. This process included estimating the fair value of the investments, loans, core deposit intangibles, fixed assets, non-compete agreements, borrowings, and deposits.
The Company recognized goodwill impairment charges for all of Charter’s $49.9 million of goodwill in 2008. The Company also recognized intangible impairment charges for $3.7 million of Charter’s core deposit intangibles in 2008.
DGHM
The significant adverse change in business climate in the third quarter of 2008 was considered a triggering event for testing goodwill for impairment. This was followed by the annual goodwill and intangible impairment testing in the fourth quarter of 2008. In the third quarter of 2008, the Company estimated fair value of DGHM by comparing the ratios of price to EBITDA from a peer group of publicly traded comparable investment management firms. This estimate was refined during the fourth quarter of 2008 when the fair value was determined using an average of the discounted cash flow method and a comparable market multiple method. The Company performed the Step 1 goodwill impairment analysis using an average of the income approach and the market approach method and determined that the goodwill was impaired. The income approach utilized a discounted cash flow model which was based on the expectation that DGHM’s net AUM flows will remain weak throughout 2009 with a recovery beginning in 2010. The resulting operating earnings are expected to grow at a 6.4% compounded annual growth rate over the projected period. The terminal growth rate was estimated at 5.0% and the cash flows were discounted at an 18.0% cost of capital. Based on these inputs and assumptions, the income approach resulted in an $11.2 million valuation.
The market approach utilized revenue and EBITDA multiples from a peer group of nine publicly traded comparable investment management firms. The comparables were chosen based on similar growth prospects and risks to that of the reporting units. A price to revenue multiple of 1.3x was selected and a price to EBITDA multiple of 5.0x was selected. Control premiums were considered and determined to be 0%. The average of the price to revenue multiple method and the price to EBITDA multiple method resulted in a $12.3 million valuation.
Based on a weighted average of the income and market approaches, the fair value was approximately $11.5 million.
As the carrying amount of DGHM exceeded its fair value, the Company proceeded to Step 2 of the goodwill impairment testing to measure the amount of the impairment loss. This was done by comparing the fair value of the reporting unit goodwill with the carrying amount of that goodwill. In order to do this, the fair value of the reporting unit was allocated to the assets and liabilities of the unit. This process included estimating the fair value of the advisory contracts, trade name, and non-compete agreements.
The Company recognized goodwill impairment charges for all of DGHM’s $32.4 million of goodwill in 2008. The Company also recognized intangible impairment charges of $5.2 million for DGHM’s advisory contracts intangible assets in 2008.
109
Table of Contents
NOTES TO CONSOLIDATED FINANCIAL STATEMENTS—(Continued)
Coldstream
The Company’s equity method investee was tested for goodwill impairment as part of the annual goodwill impairment testing in the fourth quarter of 2008. The Company performed the Step 1 goodwill impairment analysis using an average of the discounted cash flow method and comparable market multiples method and determined that the goodwill was impaired. The income approach utilized a discounted cash flow which was based on the expectation that Coldstream’s net AUM flows will remain weak throughout 2009 with a recovery beginning in 2010. The resulting operating earnings are expected to grow at a 19.4% compounded annual growth rate over the projected period. The terminal growth rate was estimated at 5.0% and the cash flows were discounted at a 17.0% cost of capital. Based on these inputs and assumptions, the income approach resulted in a $7.0 million valuation.
The market approach utilized revenue and EBITDA multiples from a peer group of nine publicly traded comparable investment management firms. The comparables were chosen based on similar growth prospects and risks to that of the reporting units. A price to revenue multiple of 1.0x was selected and a price to EBITDA multiple of 9.0x was selected. Control premiums were considered and determined to be 0%. The average of the price to revenue multiple method and the price to EBITDA multiple method resulted in an $8.6 million valuation.
The weighted average of the income and market approaches indicated a fair value of approximately $7.5 million.
As the carrying amount of Coldstream exceeded its fair value, the Company proceeded to Step 2 of the goodwill impairment testing to measure the amount of the impairment loss. This was done by comparing the fair value of the reporting unit goodwill with the carrying amount of that goodwill. In order to do this, the fair value of the reporting unit was allocated to the assets and liabilities of the unit. This process included estimating the fair value of the advisory contracts.
The Company recognized goodwill impairment charges for all of Coldstream’s $3.5 million of goodwill in 2008. The Company also recognized intangible impairment charges of $0.5 million for Coldstream’s advisory contracts intangible assets in 2008.
Intangible assets
The following table shows the gross and net carrying amounts of identifiable intangible assets at December 31, 2009 and 2008:
| 2009 | 2008 | |||||||||||||||||
| Gross Carrying Amount |
Accumulated Amortization |
Net | Gross Carrying Amount |
Accumulated Amortization |
Net | |||||||||||||
| (In thousands) | ||||||||||||||||||
| Advisory contracts |
$ | 53,721 | $ | 17,289 | $ | 36,432 | $ | 53,709 | $ | 12,320 | $ | 41,389 | ||||||
| Core deposit intangibles |
3,058 | 2,639 | 419 | 3,058 | 141 | 2,917 | ||||||||||||
| Employment agreements |
3,977 | 2,743 | 1,234 | 3,977 | 2,028 | 1,949 | ||||||||||||
| Trade names and other |
2,890 | — | 2,890 | 3,150 | — | 3,150 | ||||||||||||
| Mortgage servicing rights |
649 | 199 | 450 | 649 | 93 | 556 | ||||||||||||
| Total |
$ | 64,295 | $ | 22,870 | $ | 41,425 | $ | 64,543 | $ | 14,582 | $ | 49,961 | ||||||
In 2008, the Company recognized additional identifiable intangible assets of $4.4 million. This was primarily related to the acquisition of DTC for $3.1 million and the purchase of additional interests in BOS for $1.2 million.
110
Table of Contents
NOTES TO CONSOLIDATED FINANCIAL STATEMENTS—(Continued)
The Company acquired DTC on February 1, 2008 and allocated $2.0 million to amortizable intangible assets. $1.6 million of the amortizable intangible assets was allocated to advisory contracts and will be amortized over a weighted average period of 10 years and $0.4 million was allocated to non-compete agreements that will be amortized over a period of seven years. These amortization periods are based upon estimates of their expected useful lives. The remaining $1.1 million was allocated to trade name intangibles, which are not amortizable.
When the Company acquired additional interests in BOS on January 2, 2008 and August 1, 2008, $0.5 million and $0.7 million, respectively, were allocated to intangible assets and will be amortized on an accelerated basis over a period of 15 years.
Management reviews, and adjusts if necessary, intangible asset amortization schedules to ensure that the remaining life on the amortization schedule accurately reflects the useful life of the intangible asset. Consolidated expense related to intangible assets subject to amortization was $8.3 million, $8.1 million, and $9.0 million for 2009, 2008, and 2007, respectively. The estimated annual amortization expense for these identifiable intangibles over the next five years is:
| Estimated intangible amortization expense | |||
| (In thousands) | |||
| 2010 |
$ | 5,264 | |
| 2011 |
4,942 | ||
| 2012 |
4,769 | ||
| 2013 |
4,538 | ||
| 2014 |
4,297 | ||
11. DEPOSITS
Deposits are summarized as follows:
| December 31, | ||||||
| 2009 | 2008 | |||||
| (In thousands) | ||||||
| Demand deposits (non-interest bearing) |
$ | 835,676 | $ | 826,797 | ||
| NOW |
348,674 | 262,963 | ||||
| Savings |
158,508 | 142,184 | ||||
| Money market |
1,447,811 | 1,180,518 | ||||
| Certificates of deposit under $100,000* |
373,360 | 585,972 | ||||
| Certificates of deposit $100,000 or greater |
1,091,190 | 750,478 | ||||
| Total |
$ | 4,255,219 | $ | 3,748,912 | ||
| * | Includes brokered CDs |
111
Table of Contents
NOTES TO CONSOLIDATED FINANCIAL STATEMENTS—(Continued)
Certificates of deposit had the following schedule of maturities:
| December 31, | ||||||
| 2009 | 2008 | |||||
| (In thousands) | ||||||
| Less than 3 months remaining |
$ | 663,086 | $ | 559,698 | ||
| 3 to 6 months remaining |
440,382 | 438,715 | ||||
| 6 to 12 months remaining |
216,456 | 207,098 | ||||
| 1 to 3 years remaining |
105,280 | 90,525 | ||||
| 3 to 5 years remaining |
24,501 | 31,180 | ||||
| More than 5 years remaining |
14,845 | 9,234 | ||||
| Total |
$ | 1,464,550 | $ | 1,336,450 | ||
Interest expense on certificates of deposit $100,000 or greater was $18.4 million, $27.9 million and $37.1 million for the years ended December 31, 2009, 2008, and 2007, respectively. At December 31, 2009 and 2008, $2.8 million and $1.7 million, respectively, of overdrawn deposit accounts were reclassified to loans.
12. FEDERAL HOME LOAN BANK BORROWINGS
The Banks are members of the FHLB System. As members of the FHLB, the Banks have access to short and long-term borrowings. Borrowings from the FHLB are secured by the Banks’ stock in the FHLB and a blanket lien on “qualified collateral” defined principally as a percentage of the principal balance of certain types of mortgage loans. The percentage of collateral allowed varies between 15% and 83% based on the type of the underlying collateral. As of December 31, 2009, the Banks had $555.0 million of borrowings outstanding and available credit of $789.3 million. The Banks had no federal fund borrowings outstanding with the FHLBs at December 31, 2009.
As members of the FHLB, the Banks are required to invest in FHLB stock based on a percentage of outstanding advances in addition to a membership stock requirement. The minimum requirements vary depending on the FHLB membership. The Banks are required to own FHLB stock at least equal to 4.0% to 4.7% of outstanding advances depending on the individual FHLB membership. FHLB stock owned in excess of the minimum requirements can be redeemed at par upon the FHLB’s request. The FHLB redeems excess stock at its option at par from time to time. The Banks may not redeem additional purchases of stock prior to a five year minimum holding period.
As of both December 31, 2009 and 2008, the Banks’ FHLB stock holdings totaled $47.5 million. The Banks’ investment in FHLB stock is recorded at cost and is redeemable at par after a five-year holding period. The FHLBs have advised their members that they are focusing on preserving capital in response to ongoing market volatility and, accordingly, there will be little or no dividend payout in future quarterly periods. Further, a moratorium has been placed on excess stock repurchases.
At each year end, the Company evaluates its investments in the respective FHLBs stock for other-than-temporary impairment based on publicly available financial information on the respective FHLBs. Based on the Company’s evaluation of the underlying investments, including the long-term nature of the investments, and the liquidity position of the respective FHLBs, the actions taken by the respective FHLBs to address their regulatory situations, and the Company’s current intention not to sell or redeem any of its investment in the respective FHLBs, and the determination that it is not more likely than not that the Company would be required to sell or redeem any of its investments in the respective FHLBs, the Company has concluded that the unrealized losses on its investments in the FHLBs is not other-than-temporarily impaired.
112
Table of Contents
NOTES TO CONSOLIDATED FINANCIAL STATEMENTS—(Continued)
A summary of borrowings from the FHLBs is as follows:
| December 31, 2009 | December 31, 2008 | |||||||||||
| Amount | Weighted Average Rate |
Amount | Weighted Average Rate |
|||||||||
| (In thousands) | ||||||||||||
| Within 1 year |
$ | 158,232 | 4.35 | % | $ | 210,202 | 1.93 | % | ||||
| Over 1 to 2 years |
129,182 | 4.02 | % | 159,009 | 4.37 | % | ||||||
| Over 2 to 3 years |
103,897 | 4.08 | % | 129,955 | 4.04 | % | ||||||
| Over 3 to 5 years |
98,748 | 4.06 | % | 164,692 | 4.16 | % | ||||||
| Over 5 years |
64,953 | 4.32 | % | 81,614 | 4.40 | % | ||||||
| Total |
$ | 555,012 | 4.17 | % | $ | 745,472 | 3.58 | % | ||||
As of December 31, 2009, approximately $136.0 million of the FHLB borrowings were callable before maturity.
13. SHORT-TERM BORROWINGS
| Federal Funds Purchased |
Securities Sold Under Agreement to Repurchase |
|||||||
| (In thousands) | ||||||||
| 2009 |
||||||||
| Outstanding at end of period |
$ | — | $ | 243,377 | ||||
| Maximum outstanding at any month-end |
65,000 | 243,377 | ||||||
| Average balance for the year |
9,455 | 182,592 | ||||||
| Weighted average rate at end of period |
— | 1.78 | % | |||||
| Weighted average rate paid for the period |
0.26 | % | 1.80 | % | ||||
| 2008 |
||||||||
| Outstanding at end of period |
$ | — | $ | 293,841 | ||||
| Maximum outstanding at any month-end |
130,000 | 353,520 | ||||||
| Average balance for the year |
43,369 | 311,620 | ||||||
| Weighted average rate at end of period |
— | 1.15 | % | |||||
| Weighted average rate paid for the period |
1.48 | % | 1.64 | % | ||||
| 2007 |
||||||||
| Outstanding at end of period |
$ | 6,000 | $ | 268,340 | ||||
| Maximum outstanding at any month-end |
36,100 | 268,340 | ||||||
| Average balance for the year |
2,093 | 164,451 | ||||||
| Weighted average rate at end of period |
2.50 | % | 2.80 | % | ||||
| Weighted average rate paid for the period |
5.87 | % | 2.96 | % | ||||
The federal funds purchased and securities sold under agreements to repurchase generally mature within 30 days of the transaction date. The Company enters into sales of securities under agreements to repurchase with clients and brokers. These agreements are treated as financing and the obligations to repurchase securities sold are reflected as a liability in the Company’s consolidated balance sheets. The securities underlying the agreements remain under the Company’s control. Investment securities with a fair value of $260.6 million and $308.3 million were pledged as collateral for the securities sold under agreements to repurchase at December 31, 2009 and 2008, respectively.
113
Table of Contents
NOTES TO CONSOLIDATED FINANCIAL STATEMENTS—(Continued)
As of December 31, 2009 the Banks had unused federal fund lines with correspondent banks of $166.0 million.
14. JUNIOR SUBORDINATED DEBENTURES AND OTHER LONG-TERM DEBT
The schedule below presents the detail of the Company’s junior subordinated debentures and other long-term debt:
| December 31, | ||||||
| 2009 | 2008 | |||||
| (In thousands) | ||||||
| Boston Private Capital Trust II junior subordinated debentures |
$ | 103,093 | $ | 103,093 | ||
| Boston Private Capital Trust I junior subordinated debentures |
63,747 | 108,247 | ||||
| Gibraltar junior subordinated debentures |
16,495 | 16,495 | ||||
| FPB junior subordinated debentures |
6,186 | 6,186 | ||||
| Charter junior subordinated debentures |
4,124 | 4,124 | ||||
| Contingent convertible senior notes |
— | 52,440 | ||||
| Total |
$ | 193,645 | $ | 290,585 | ||
All of the Company’s junior subordinated debentures and other long-term debt mature in more than five years.
Boston Private Capital Trust II junior subordinated debentures
In September, 2005, the Company and Boston Private Capital Trust II, a Delaware statutory trust (“Trust II”) entered into a Purchase Agreement for the sale of $100 million of trust preferred securities issued by Trust II and guaranteed by the Company on a subordinated basis. Trust II’s preferred securities pay interest quarterly and have an annual distribution rate of 6.25% up to, but not including, December 30, 2010. Subsequently, Trust II’s preferred securities will convert to a floating rate of a three-month London Inter Bank Offered Rate (“LIBOR”) plus 1.68%, provided, however, that the interest rate does not exceed the highest rate permitted by New York law, and may be modified by the U.S. law of general application.
Each of the Trust II preferred securities represents an undivided beneficial interest in the assets of Trust II. The Company owns all of Trust II’s common securities. Trust II’s only assets will be the junior subordinated debentures issued to it by the Company on substantially the same payment terms as Trust II’s preferred securities.
The junior subordinated debentures mature on December 30, 2035, and may not be redeemed prior to or on December 30, 2010, except that they may be redeemed at any time upon the occurrence and continuation of certain special events.
The Company has the following covenants with regard to Trust II:
| • | for so long as Trust II’s preferred securities remain outstanding, the Company shall maintain 100% ownership of the Trust II’s common securities; |
| • | the Company will use its commercially reasonable efforts to ensure Trust II remains a statutory trust, except in connection with a distribution of debt securities to the holders of the Trust II securities in liquidation of Trust II, the redemption of all Trust II’s securities or mergers, consolidations or incorporation, each as permitted by Trust II’s declaration of trust; |
114
Table of Contents
NOTES TO CONSOLIDATED FINANCIAL STATEMENTS—(Continued)
| • | to continue to be classified as a grantor trust for U.S. federal income tax purposes; and |
| • | the Company will ensure each holder of Trust II’s preferred securities is treated as owning an undivided beneficial interest in the junior subordinated debentures. |
At December 31, 2009, the Company was in compliance with the above covenants.
So long as the Company is not in default in the payment of interest on the junior subordinated debentures, the Company has the right under the indenture to defer payments of interest for up to 20 consecutive quarterly periods. The Company has no current intention to exercise its right to defer interest payments on the junior debentures issued to Trust II. If the Company defers interest payments, it would be subject to certain restrictions relating to the payment of dividends on or purchases of its capital stock and payments on its debt securities ranking equal with or junior to the junior subordinated debentures.
Boston Private Capital Trust I junior subordinated debentures
In October 2004, the Company and Boston Private Capital Trust I, a Delaware statutory trust (“Trust I”), entered into a Purchase Agreement for the sale of $75 million of convertible trust preferred securities to be issued by Trust I and guaranteed by the Company on a subordinated basis. The convertible trust preferred securities have a liquidation amount of $50.00 per security, pay interest quarterly and have a fixed distribution rate of 4.875%. The quarterly distributions are cumulative. The junior subordinated convertible debentures will mature on October 1, 2034. The Company also granted the initial purchasers an option to purchase up to an additional $30 million of convertible trust preferred securities, which was exercised in November 2004.
In November 2009, the Company repurchased $44.5 million of the Trust I’s convertible trust preferred securities, recognizing an $18.3 million pretax gain on repurchase.
Each of the convertible trust preferred securities represents an undivided beneficial interest in the assets of Trust I. The Company owns all of Trust I’s common securities. Trust I’s only assets will be the junior subordinated debentures issued to it by the Company on substantially the same payment terms as the convertible trust preferred securities.
The initial conversion ratio was 1.5151 shares of the Company’s common stock, $1.00 par value, for each trust preferred security (equivalent to a conversion price of approximately $33.00 per share), subject to adjustment as described in the offering memorandum. The conversion ratio at December 31, 2009 was 1.5375. The trust preferred securities were not redeemable prior to October 1, 2009, except that they may be redeemed at any time upon the occurrence of certain special events. The trust preferred securities may be redeemed in whole at any time or in part from time to time on or after October 1, 2009 if the closing price of BPFH’s common stock for 20 trading days in a period of 30 consecutive trading days ending on the trading day prior to the mailing of the redemption notice exceeds 130% of the then prevailing conversion price of the trust preferred securities. Assuming the remaining $60.5 million liquidation amount of convertible trust preferred securities are converted, the Company would issue approximately 1,860,339 shares of common stock, based on the December 31, 2009 conversion ratio.
The initial conversion ratio is subject to adjustment if the Company takes certain actions, including paying dividends to all holders of BPFH common stock, excluding any quarterly cash dividend on BPFH common stock to the extent that such quarterly cash dividend per share of BPFH common stock in any quarter does not exceed the greater of (i) $0.060 and (ii) 1.00% multiplied by the average of the daily closing prices per share of BPFH common stock for the ten consecutive trading days ending on the trading day immediately prior to the declaration date of the dividend. If an adjustment is required to be made as a result of a distribution that is a quarterly dividend, the adjustment would be based upon the amount by which the distribution exceeds the amount of the quarterly cash dividend permitted to be excluded.
115
Table of Contents
NOTES TO CONSOLIDATED FINANCIAL STATEMENTS—(Continued)
The Company has the following covenants with regard to Trust I:
| • | to cause Trust I to remain a statutory business Trust and not try to voluntarily dissolve, wind-up, liquidate, or terminate except as permitted by the Trust agreement; |
| • | to maintain directly or indirectly ownership of all of the common securities of Trust I; |
| • | to use its commercially reasonable efforts to ensure that Trust I will not be an “investment company” under the Investment Company Act of 1940, as amended from time to time, or any successor legislation; and |
| • | to take no action that would be reasonably likely to cause Trust I to be classified as an association or a partnership taxable as a corporation for U.S. federal income tax purposes. |
At December 31, 2009, the Company was in compliance with the above covenants.
So long as the Company is not in default in the payment of interest on the junior subordinated convertible debentures, the Company has the right under the indenture to defer payments of interest. The Company has no current intention to exercise its right to defer interest payments on the junior subordinated convertible debentures issued to Trust I. If the Company defers interest payments, it would be subject to certain restrictions relating to the payment of dividends on or purchases of its capital stock and payments on its debt securities ranking equal with or junior to the junior subordinated convertible debentures.
Gibraltar junior subordinated debentures
The Company, through the acquisition of Gibraltar, assumed the outstanding amount of Gibraltar’s junior subordinated debentures of $16 million. The junior subordinated debentures assumed are a liability of the Holding Company. The disposition of Gibraltar in 2009 had no impact on these debentures. The trust preferred securities pay interest quarterly at a floating rate based on the three month LIBOR plus a margin of 2.27%, provided, however, that the interest rate does not exceed the highest rate permitted by New York law, and may be modified by the U.S. law of general application. The interest rate on December 31, 2009 was 2.54% based on the three month LIBOR as of November 19, 2009. The junior subordinated debentures will mature on February 23, 2035, and are fully redeemable as of February 23, 2010.
FPB junior subordinated debentures
The Company, through the acquisition of FPB, assumed the outstanding amount of FPB’s junior subordinated debentures of $6 million. The junior subordinated debentures assumed are a liability of the Holding Company. The regulatory capital benefit of these debentures is solely with BPFH. FPB has no liability related to these debentures and accordingly gets no regulatory capital benefit. The trust preferred securities have a floating rate based on the three month LIBOR plus a margin of 3.15% with a maximum rate of 11.75% and pay interest quarterly. The interest rate on December 31, 2009 was 3.40% based on the three month LIBOR as of December 23, 2009. The junior subordinated debentures will mature on March 26, 2033, and they may be redeemed, in whole or in part from time to time, upon the occurrence and continuation of certain special events.
Charter junior subordinated debentures
The Company, through the acquisition of Charter, assumed the outstanding amount of Charter’s junior subordinated debentures of $4 million. The junior subordinated debentures assumed are a liability of the Holding Company. The regulatory capital benefit of these debentures is solely with BPFH. Charter has no liability related to these debentures and accordingly gets no regulatory capital benefit. The trust preferred securities pay interest quarterly on January 7, April 7, July 7, and October 7, at a floating rate based on the three month LIBOR plus a
116
Table of Contents
NOTES TO CONSOLIDATED FINANCIAL STATEMENTS—(Continued)
margin of 2.85%. The interest rate on December 31, 2009 was 3.13% based on the three month LIBOR as of October 13, 2009. The junior subordinated debentures will mature on January 7, 2034, and are currently redeemable.
Contingent Convertible Senior Notes
During 2008 and 2009, the Company repurchased its Convertible Senior Notes (the “Notes”) due 2027. In 2008, the Company repurchased $235.1 million of the Notes and recognized a $22.5 million gain on repurchase. In 2009, the Company repurchased the remaining $52.4 million of the Notes, and recognized a $0.4 million gain on repurchase.
The $287.5 million in Notes were initially sold to Merrill Lynch & Co., and RBC Capital Markets pursuant to Rule 144A under the Securities Act of 1933, as amended, in July 2007. The net proceeds from the offering, after deducting the initial purchasers’ discount of $2.9 million, or 1% of the total Notes, and the estimated offering expenses payable by the Company, was approximately $284.1 million. The Notes were senior, unsecured obligations of the Company and paid interest at 3.0% semi-annually on January 15 and July 15, beginning January 15, 2008.
Management has determined that each of the trusts qualify as variable interest entities under GAAP. The trusts issued preferred securities to investors and loaned the proceeds to the Company. Each of the trusts holds, as its sole asset, subordinated debentures issued by the Company.
In March 2005, the Board of Governors of the Federal Reserve System (“FRB”) adopted a final rule that would continue to allow the inclusion of trust preferred securities in Tier 1 capital, but with stricter quantitative limits. Under the final rule, after a five-year transition period, the aggregate amount of trust preferred securities and certain other capital elements would be limited to 25% of Tier 1 capital elements. The amount of trust preferred securities and certain other elements in excess of the limit could be included in Tier 2 capital, subject to restrictions.
15. NONCONTROLLING INTERESTS
Effective January 1, 2009, the Company adopted updates to ASC 810, Consolidation (formerly FAS 160, Noncontrolling Interests in Consolidated Financial Statements an amendment of ARB No. 51) (“ASC 810”), which affects the accounting, reporting and disclosure of the Company’s noncontrolling interests. More specifically, it establishes the accounting and reporting standards for noncontrolling interests in certain of the Company’s affiliates and for the deconsolidation of the affiliates under certain circumstances. It clarifies that, in general, a noncontrolling interest in an affiliate is an ownership interest in the consolidated entity that should be reported as equity in the consolidated balance sheets.
Also affected by this update was ASC 480, which requires that noncontrolling interests containing redemption features that make the interests probable to be redeemable at a fixed or determinable price on a fixed or determinable date, at the option of the holder, or upon the occurrence of an event that is not solely within the control of the issuer, be reported in a category outside permanent equity, between liabilities and equity on the consolidated balance sheets.
Redeemable noncontrolling interests have been reported at the estimated maximum redemption values for all periods presented in the accompanying consolidated balance sheets in accordance with the ASC 480.
ASC 810 changes the way the consolidated statement of operations is presented in the accompanying consolidated financial statements. It requires disclosure, on the face of the consolidated statements of operations, of the amounts of consolidated net income attributable to the Company and to the noncontrolling interests.
117
Table of Contents
NOTES TO CONSOLIDATED FINANCIAL STATEMENTS—(Continued)
At the Company, noncontrolling interests typically consist of equity owned by management of the Company’s respective majority-owned affiliate partners. Net income attributable to noncontrolling interests in the consolidated statements of operations represents the net income allocated to the noncontrolling interest owners of the affiliate partners. The net income allocated to the noncontrolling interest owners was $3.6 million, $4.3 million and $4.0 million for the years ended December 31, 2009, 2008 and 2007, respectively. To the extent that the increase in the estimated maximum redemption amounts exceeds the net income attributable to the noncontrolling interests, such excess reduces net income available to common shareholders for purposes of EPS computations.
Noncontrolling interests which are not redeemable as provided in ASC 480 are included in stockholders’ equity in the consolidated balance sheets, and include the capital and undistributed profits owned by the noncontrolling partner. The Company did not have any noncontrolling interests included in stockholder’s equity at December 31, 2009 and had $3.5 million in noncontrolling interests at December 31, 2008. The $3.5 million at December 31, 2008 related to the noncontrolling interest of Westfield, which was disposed of during 2009.
Each affiliate operating agreement provides the Company and/or the noncontrolling interests with contingent call or put redemption features used for the orderly transfer of noncontrolling equity interests between the affiliate minority shareholders and the Company at fair value. Fair value is generally defined in the operating agreements as a multiple of earnings before interest, taxes, depreciation, and amortization. The aggregate amount of such redeemable noncontrolling interests at the estimated maximum redemption amounts of $51.9 million and $50.2 million are included in the accompanying consolidated balance sheets at December 31, 2009 and December 31, 2008, respectively. The Company may pay for the purchases of these noncontrolling interests in cash, shares of the Company’s common stock, or other forms of consideration dependent on the operating agreement.
The new provisions of ASC 810 have been applied prospectively as of January 1, 2009, except for the presentation and disclosure requirements. The presentation and disclosure requirements were applied retrospectively for all years presented in the accompanying consolidated financial statements.
Generally, these put and call options refer to shareholder rights of both the Company and the noncontrolling interests of the Company’s majority-owned affiliate companies. The affiliate company noncontrolling interests generally take the form of LLC units, profits interests, or common stock (collectively, the “noncontrolling equity interests”). In most circumstances, the put and call options generally relate to the Company’s right and, in some cases, obligation to purchase and the noncontrolling equity interests’ right to sell their equity interests. There are various events that could cause the puts or calls to be exercised, such as a change in control, death, disability, retirement, resignation or termination. The puts and calls are generally to be exercised at the then fair value. The terms of these rights vary and are governed by the respective individual operating and legal documents that were negotiated at the time of acquisition.
The following is a summary, by individual affiliate, of the terms of the put and call options:
KLS
The Company acquired an 81% interest in KLS on December 31, 2004. The transaction purchase price was approximately $30.0 million, with approximately 90% paid in cash and the remainder paid in the Company’s common stock. The estimated fair value to repurchase the remaining 19% of KLS’s equity was approximately $30.0 million and $25.0 million at December 31, 2009 and 2008, respectively.
At December 31, 2009, KLS had an option to put and the Company had an option to call, at a negotiated formula that was intended to reflect a fair market value at the time of the transaction, the remaining 19% interest
118
Table of Contents
NOTES TO CONSOLIDATED FINANCIAL STATEMENTS—(Continued)
in KLS beginning in the first quarter of 2010. If the put or call was not exercised in the first quarter of 2010, the agreement specified that the put or call could be exercised in each successive even numbered year. KLS exercised their option to put on January 1, 2010. See Part II. Item 8. “Financial Statements and Supplementary Data—Note 26: Subsequent Events” for additional information.
DGHM
The Company acquired an 80% interest in DGHM on February 6, 2004. DGHM management and employees own the remaining 20% interest in DGHM. The agreement describes a process for the orderly transfer of noncontrolling equity interests between the Company and the DGHM minority shareholders at fair value, with appraisal rights for all parties. Certain events, such as a change in control, death, disability, retirement, resignation or termination may result in repurchase of the LLC units by the Company at the then fair value. DGHM noncontrolling equity interests’ units vest after five years. Beginning six months after vesting, a minority shareholder may put up to 10%-20% of his or her outstanding units annually to the Company. The six-month holding period ensures the risks and rewards of ownership are transferred to the noncontrolling equity interests. Beginning in December 2009, the Company has an annual call right under which it may elect to repurchase 10-20% of the non-management and management members’ vested units. No more than 40% of the outstanding noncontrolling equity interests’ units can be put in any one year. The noncontrolling equity interests must retain 50% of their total outstanding units until such time as they leave the firm. The estimated fair value to repurchase the remaining 20% of DGHM’s equity is approximately $1.8 million and $1.0 million as of December 31, 2009 and 2008, respectively.
Anchor
The Company, through its acquisition of Anchor, has acquired approximately an 80% interest in each of Anchor Capital Advisors and Anchor Russell on June 1, 2006. Anchor Capital Advisors and Anchor Russell management and employees, respectively, own the remaining 20% noncontrolling equity interests of each firm. The purchase agreement describes a process for the orderly transfer of noncontrolling equity interests between the Company and the Anchor Capital and Anchor Russell minority shareholders at fair value, with appraisal rights for all parties. Certain events, such as death, disability, retirement, resignation or termination may result in repurchase of the noncontrolling equity interests by the Company at the then fair value. These noncontrolling equity interests have a five-year vesting period. Beginning six months after vesting, a holder of noncontrolling equity interests may put up to 10% of his or her outstanding equity interests annually to the Company. The six-month holding period ensures the risks and rewards of ownership are transferred to the holder of the noncontrolling equity interests. Holders of noncontrolling equity interests must retain 50% of their total outstanding units until such time as they leave the firm. The estimated fair value to repurchase the remaining 20% of Anchor’s and Anchor Russell’s noncontrolling equity interests is approximately $13.0 million and $17.4 million, as of December 31, 2009 and 2008, respectively.
BOS
The Company has acquired approximately 70% of BOS through a series of purchases dating back to February 5, 2004. The BOS operating agreement provides for, upon the occurrence of certain events, various puts, calls, restrictions, and limitations on the transfer of noncontrolling equity interests, including certain purchase rights of noncontrolling equity interests at fair value.
The BOS operating agreement describes a procedure for the orderly transfer of noncontrolling equity interests between the BOS minority shareholders and the Company at fair value, with appraisal rights for all parties. The estimated fair value to repurchase the contractually obligated number of noncontrolling equity interests held by the noncontrolling interests is approximately $5.2 million and $4.8 million as of December 31, 2009 and 2008, respectively.
119
Table of Contents
NOTES TO CONSOLIDATED FINANCIAL STATEMENTS—(Continued)
DTC
The Company acquired a 70.1% interest in DTC on February 1, 2008. DTC management and employees own the remaining 30% interest in the firm. The purchase agreement describes a procedure for the orderly transfer of shares between the Company and DTC noncontrolling equity interests at fair value. Certain events, such as death, incapacity, retirement, bankruptcy, resignation or termination may result in repurchase of noncontrolling equity interests by the Company at the then fair value. The purchase agreements provide a formulaic mechanism to determine fair value. The estimated fair value to repurchase the remaining 30% of DTC’s noncontrolling equity interests is approximately $1.8 million and $2.0 million as of December 31, 2009 and 2008, respectively.
The following table is an analysis of the Company’s redeemable noncontrolling interests for the periods indicated:
| 2009 | 2008 | 2007 | ||||||||||
| (In thousands) | ||||||||||||
| Balance at beginning of year |
$ | 50,167 | $ | 48,814 | $ | 44,631 | ||||||
| Net income attributable to noncontrolling interests |
3,649 | 4,327 | 3,987 | |||||||||
| Distributions |
(2,663 | ) | (4,621 | ) | (5,366 | ) | ||||||
| Other |
(1,520 | ) | (782 | ) | (1,031 | ) | ||||||
| Adjustment to fair value |
2,217 | 2,429 | 6,593 | |||||||||
| Balance at end of year |
$ | 51,850 | $ | 50,167 | $ | 48,814 | ||||||
16. EQUITY
Preferred Stock and Related Warrants
On July 29, 2008, the Company entered into an investment agreement with The Carlyle Group (“Carlyle”) to obtain approximately $75 million in capital. Under that agreement, the Company issued approximately 351 shares of Series A Non-Cumulative Mandatorily Convertible Preferred Stock (“Series A Preferred”) to Carlyle with a liquidation preference of $100,000 per share and convertible into approximately 6.3 million common shares. The Series A Preferred had a par value of $1.00 per share, was convertible into common stock at $5.52 per share, and participated in dividends payable in common stock on an as-converted basis. The shares were perpetual and did not include any redemption provisions. All of the Series A Preferred converted into shares of the Company’s common stock effective October 1, 2008.
The Company also issued to Carlyle approximately 401 shares of Series B Preferred with a liquidation preference of $100,000 per share that is convertible into approximately 7.2 million common shares. The Series B Preferred has a par value of $1.00 per share, is convertible into common stock at $5.52 per share, and participates in dividends payable in common stock on an as-converted basis. There are no mandatory redemption features and preferred stockholders have no rights to require redemption. The conversion price was able to be adjusted upon various changes in outstanding shares of the Company such as the declaration of stock dividends, stock splits, issuance of stock purchase rights, self-tender offers, or a rights plan.
In connection with the preferred stock issuance, Carlyle was issued warrants (the “Carlyle warrants”) to purchase 5.4 million shares of common stock at a price of $6.62 per share. The Carlyle warrants are exercisable at any time, in whole or in part, over the five year term of the warrants.
The Company determined that the Carlyle warrants meet the definition of a derivative instrument under GAAP but do not require derivative treatment pursuant to certain scope exceptions as they are indexed to the Company’s common stock and are classified in the stockholders’ equity section of the consolidated balance
120
Table of Contents
NOTES TO CONSOLIDATED FINANCIAL STATEMENTS—(Continued)
sheets. As of the date of issuance, the Company did not have sufficient authorized but unissued common shares for issuance upon exercise of the Carlyle warrants. Therefore, the Company classified the Carlyle warrants as a liability. At issuance, the Carlyle warrants were valued at $3.51 per warrant, $19.1 million in total, using the Black-Scholes option pricing model with the following assumptions: 0.50% dividend yield; risk free rate of 3.30%; volatility of 39.2% and a contractual life of five years. On September 30, 2008, stockholders approved an increase in the Company’s authorized shares.
The Company allocated $19.1 million of the proceeds to the Carlyle warrants based on the fair value of the Carlyle warrants at the date of issuance. The remaining $56.0 million was allocated to the Series A Preferred and the Series B Preferred based upon their relative fair values at the closing date. Net of transaction fees, approximately $22.8 million of the proceeds was allocated to the Series A Preferred and $26.3 million was allocated to the Series B Preferred.
On September 30, 2008, the Company’s stockholders approved an amendment to the Company’s Restated Articles of Organization to increase the number of authorized shares of common stock from 70 million to 170 million. The Company’s stockholders also approved the future conversion of the Series B Preferred Stock into common stock and the exercise of the Carlyle warrants to purchase common stock. The conversion of the Series B Preferred stock and exercise of the Carlyle warrants may take place in accordance with their terms and subject to certain common stock ownership limitations. On that date, the Company had sufficient authorized but unissued shares for settlement of the Carlyle warrants and reclassified the Carlyle warrants as equity at their then fair value. The fair value of the Carlyle warrants on September 30, 2008 was $3.92 per warrant, or $21.3 million in total, using the Black-Scholes option pricing model with the following assumptions: 0.47% dividend yield; risk free rate of 2.88%; volatility of 41.4% and a contractual life of five years. An expense of $2.2 million was recognized in 2008 due to the change in the fair value of the Carlyle warrants during the period they were classified as a liability, which is recorded as “Warrant expense” on the 2008 consolidated statement of operations.
After allocation of the proceeds, the Company evaluated the effective conversion price of the preferred securities and concluded that they were issued in the money. The resulting discount to the fair value of the Company’s stock price on the date of issuance is accounted for as a beneficial conversion feature. The beneficial conversion feature is treated as a dividend to the preferred stockholder and accreted over the period of issuance to the earliest conversion date using the effective interest method. The Series A Preferred converted into shares of the Company’s common stock on October 1, 2008 and the Series B Preferred became convertible as of December 31, 2009 after a December 2009 amendment to the original agreement accelerating the earliest conversion date by one month. The accretion of the beneficial conversion feature on the Series B Preferred is a non-cash transaction which increases preferred stock and reduces additional paid in capital and income available to common shareholders.
On November 21, 2008, the Company entered into an investment agreement with the U.S. Department of the Treasury (the “Treasury”) and received in exchange $154 million (the “TARP agreement”). The TARP agreement was entered into under the Capital Purchase Program (“CPP”), which is a component of the Troubled Asset Relief Program (“TARP”) which in turn was created under the Emergency Economic Stabilization Act of 2008. Under the TARP agreement, the Company issued 154,000 shares of Series C Fixed Rate Cumulative Perpetual Preferred Stock (the “Series C Preferred”) to the Treasury. Subject to consultation with the FRB, the Series C Preferred may be redeemed without regard to whether the Company has replaced such funds from any other source or to any waiting period. There is no conversion feature on the Series C Preferred. Dividends on the Series C Preferred are paid quarterly on a cumulative basis at an annual rate of 5% through February 15, 2014 and at 9% thereafter. Importantly, the TARP Agreement may be unilaterally amended by the Treasury. It is likely that new obligations, such as a requirement to establish a foreclosure relief program or to increase lending levels, may be imposed on CPP participants. Accordingly, the Company or the Banks may be subject to further restrictions or obligations as a result of their participation in the CPP.
121
Table of Contents
NOTES TO CONSOLIDATED FINANCIAL STATEMENTS—(Continued)
In connection with the preferred stock issuance, the Company issued Treasury warrants to purchase approximately 2.9 million shares of common stock at a price of $8.00 per share (the “TARP warrants”). The term of the TARP warrants is ten years. 50% of the TARP warrants are immediately exercisable, and the remaining 50% of the TARP warrants became exercisable on December 31, 2009.
The Company determined that the TARP warrants met the definition of a derivative instrument under GAAP, but do not require derivative treatment pursuant to certain scope exceptions as they are indexed to the Company’s common stock and are classified in the stockholders’ equity section of the balance sheet. As of the date of issuance, the Company had sufficient authorized but unissued common shares for issuance upon exercise of the TARP warrants. Therefore, the Company classified the TARP warrants as equity. At issuance, the TARP warrants were valued at $2.65 per warrant, or $7.6 million in total, using the Black-Scholes option pricing model with the following assumptions: 0.71% dividend yield; risk free rate of 3.53%; volatility of 44.72% and a contractual life of ten years.
The Company allocated $9.3 million of the proceeds to the TARP warrants based on the relative fair value of the TARP warrants at the date of issuance. Net of transaction fees, the remaining $144.5 million was allocated to the Series C Preferred based upon the relative fair value at the date of issuance.
The discount on the Series C Preferred created by the TARP warrants is being amortized over the period from issuance through the date of the rate increase, February 15, 2014. If the Company repurchases all or a portion of the Series C Preferred, a proportionate amount of the unamortized discount will be accelerated upon repurchase. The accretion of the discount on the Series C Preferred is a non-cash transaction which increases preferred stock and reduces additional paid in capital and income available to common shareholders.
Both classes of preferred shares rank on parity with other classes or series of preferred shares and senior to any common shares with respect to dividends and upon liquidation or winding up of the Company.
Common Stock
In July 2008, the Company completed a public offering of its common stock in which 18.4 million shares were sold to the public at a price of $6.00 per share, for total gross proceeds of approximately $110.4 million, and net proceeds of $104.9 million.
17. INCOME TAXES
The components of income tax expense/(benefit) for continuing operations are as follows:
| Year Ended December 31, | ||||||||||||
| 2009 | 2008 | 2007 | ||||||||||
| (In thousands) | ||||||||||||
| Current expense/(benefit): |
||||||||||||
| Federal |
$ | 4,757 | $ | (55,926 | ) | $ | 14,580 | |||||
| State |
3,105 | 1,279 | 3,400 | |||||||||
| Total current expense/(benefit) |
7,862 | (54,647 | ) | 17,980 | ||||||||
| Deferred expense/(benefit): |
||||||||||||
| Federal |
(4,968 | ) | (10,824 | ) | (19,262 | ) | ||||||
| State |
(1,262 | ) | (5,266 | ) | (5,057 | ) | ||||||
| Total deferred (benefit)/expense |
(6,230 | ) | (16,090 | ) | (24,319 | ) | ||||||
| Income tax expense/(benefit) |
$ | 1,632 | $ | (70,737 | ) | $ | (6,339 | ) | ||||
122
Table of Contents
NOTES TO CONSOLIDATED FINANCIAL STATEMENTS—(Continued)
Income tax expense/(benefit) attributable to income/(loss) from continuing operations differs from the amounts computed by applying the Federal statutory rate to pretax income/(loss) from continuing operations. The valuation allowance recorded on capital losses that exceeded capital gains is recorded to discontinued operations, and therefore not reflected in the effective tax rate reconciliation presented below for continuing operations. Reconciliations between the expected Federal income tax expense using the Federal statutory rate of 35% to actual income tax expense/(benefit) and resulting effective income tax rates for 2009, 2008 and 2007 are as follows:
| Year Ended December 31, | |||||||||
| 2009 | 2008 | 2007 | |||||||
| Statutory Federal income tax rate |
35.0 | % | 35.0 | % | 35.0 | % | |||
| Increase (decrease) resulting from: |
|||||||||
| Nondeductible goodwill |
0.0 | % | -11.7 | % | 0.0 | % | |||
| Tax exempt interest, net |
-18.6 | % | 1.3 | % | -99.1 | % | |||
| Non deductible compensation |
6.9 | % | -0.2 | % | 14.0 | % | |||
| Officers life insurance |
-2.8 | % | 0.3 | % | -19.8 | % | |||
| State and local income tax, net of Federal tax benefit |
6.7 | % | 1.0 | % | -32.2 | % | |||
| Tax credits |
-7.3 | % | 0.5 | % | -40.2 | % | |||
| Noncontrolling interest |
-7.1 | % | 0.6 | % | -41.8 | % | |||
| Prior year provision to return differences |
-5.9 | % | 0.1 | % | -2.3 | % | |||
| Tax contingencies |
0.0 | % | 0.3 | % | -9.2 | % | |||
| Meals and entertainment |
0.9 | % | -0.1 | % | 5.3 | % | |||
| Other, net |
1.3 | % | -0.3 | % | 0.6 | % | |||
| Effective income tax rate |
9.1 | % | 26.8 | % | -189.7 | % | |||
On July 3, 2008, Massachusetts enacted legislation that requires corporations that are engaged in unitary business operations to file combined returns with their affiliates for tax years beginning on or after January 1, 2009. Starting in 2009, all of the affiliates will be included in the BPFH Massachusetts tax return instead of just those affiliates with nexus to Massachusetts. In addition, the Massachusetts excise tax on financial institutions will be reduced to 10% in 2010, 9.5% in 2011, and 9% in 2012 and thereafter. The Company incorporated the impact of these Massachusetts law changes in the third quarter of 2008 since the law was changed during the third quarter of 2008. The Company adjusted the Massachusetts state applicable rate for purposes of measuring the deferred tax assets and liabilities that will reverse after the effective date. The value of the net deferred state tax asset as of July 3, 2008 was reduced by $0.8 million which increased tax expense by $0.5 million, net of federal tax savings.
123
Table of Contents
NOTES TO CONSOLIDATED FINANCIAL STATEMENTS—(Continued)
The components of gross deferred tax assets and gross deferred tax liabilities are as follows:
| December 31, 2009 |
December 31, 2008 | |||||
| (In thousands) | ||||||
| Gross deferred tax assets: |
||||||
| Allowance for loan losses |
$ | 21,153 | $ | 16,977 | ||
| Allowance for losses on OREO |
2,647 | 877 | ||||
| Stock compensation |
11,393 | 10,763 | ||||
| Goodwill and acquired intangible assets |
18,365 | 15,052 | ||||
| Deferred and accrued compensation |
3,021 | 6,029 | ||||
| State loss carryforward, net of federal |
2,199 | 2,010 | ||||
| Capital loss carryforward |
12,834 | — | ||||
| Mark to market on securities available for sale |
2,855 | — | ||||
| Other |
3,585 | 2,357 | ||||
| Gross deferred tax assets |
78,052 | 54,065 | ||||
| Less: valuation allowance |
14,523 | 1,570 | ||||
| Total deferred tax assets |
63,529 | 52,495 | ||||
| Gross deferred tax liabilities: |
||||||
| Unrealized gain on investments |
4,376 | 2,833 | ||||
| Other |
2,544 | 2,667 | ||||
| Total gross deferred tax liabilities |
6,920 | 5,500 | ||||
| Net deferred tax asset |
$ | 56,609 | $ | 46,995 | ||
In accordance with ASC 740, Income Taxes (formerly FAS 109, Accounting for Income Taxes), deferred tax assets are to be reduced by a valuation allowance if, based on the weight of available evidence, it is more likely than not that some portion or all of the deferred tax assets will not be realized. The realization of the tax benefit depends upon the existence of sufficient taxable income within the carry-back and carry-forward periods.
The Company was profitable in 2009 and exhibited a strong earnings history before 2008. The Company recognized a loss in 2008, which was partly comprised of losses attributable to discontinued operations. Further, the 2008 loss attributable to continuing operations included items such as goodwill and intangible impairment charges of $133.2 million and losses on the sale of non-strategic loans in Southern California of $160.6 million. These losses will not affect future earnings. Due to the continued historical ability of the Company to generate taxable income, management believes it is more likely than not that the balance of deferred tax assets at December 31, 2009 is realizable with the exception of capital losses.
A deferred tax asset of $1.6 million was created in 2008 when impairment was recognized for the goodwill and intangibles at BPFH’s equity method investment, Coldstream. BPFH has fewer tax planning opportunities to avoid capital loss treatment where it holds a minority ownership position, so a valuation allowance of $1.6 million was established for the potential capital loss related to Coldstream. A deferred tax asset of $12.8 million was created in 2009 due to the capital loss incurred on the sale of Gibraltar in excess of the capital gain recognized on the sale of RINET. Capital losses are deductible only to the extent of offsetting capital gains and the Company has limited ability to generate capital gains. As such, a valuation allowance of $12.8 million was established for the net capital loss incurred on the sale of Gibraltar. The Company believes it is more likely than not that the deferred tax asset related to capital losses will not be realized and has recorded a valuation allowance of $14.5 million and $1.6 million at December 31, 2009 and 2008, respectively, attributable to deferred tax assets on these capital losses.
124
Table of Contents
NOTES TO CONSOLIDATED FINANCIAL STATEMENTS—(Continued)
The Company believes the existing net deductible temporary differences that give rise to the net deferred tax asset, excluding the capital losses, will reverse in future periods when the Company expects to generate net taxable income. BPFH would need to generate approximately $142.0 million of future net taxable income to realize the net deferred tax asset at December 31, 2009. The Company believes that it is more likely than not that the net deferred tax asset, excluding the capital losses, will be realized based on the expected generation of future taxable income.
Included in deferred taxes at December 31, 2009 is a $3.3 million California loss carryover. California has suspended the use of loss carryovers until 2010 but allows the loss to carry-forward for 20 years. The Company believes that it is more likely than not that the full amount of the California loss carryover will be utilized before it expires.
The Company adopted the provisions of ASC 740-10, Income Taxes, (formerly FASB Interpretation No. 48, Accounting for Uncertainty in Income Taxes), on January 1, 2007. A reconciliation of the beginning and ending amount of unrecognized tax benefits is as follows:
| 2009 | 2008 | 2007 | ||||||||||
| (In thousands) | ||||||||||||
| Balance at January 1 |
$ | 350 | $ | 1,142 | $ | 1,185 | ||||||
| Additions based on tax positions related to the current year |
97 | 166 | 152 | |||||||||
| Decreases based on tax positions taken in prior years |
— | (850 | ) | — | ||||||||
| Expiration of statute of limitations |
(97 | ) | (108 | ) | (266 | ) | ||||||
| Acquisition of Charter |
— | — | 71 | |||||||||
| Balance at December 31 |
$ | 350 | $ | 350 | $ | 1,142 | ||||||
The amount of unrecognized tax benefit which, if recognized, would affect the effective tax rate is $0.3 million at December 31, 2009 and December 31, 2008 and $1.1 million at December 31, 2007. The Company classifies interest and penalties, if applicable, related to unrecognized tax benefits as a component of income tax expense in the consolidated statement of operations. Interest and penalties recognized as part of the Company’s income tax expense for the years ending December 31, 2009, 2008, and 2007 were not material.
Income tax returns filed for the tax years ended December 31, 2008, 2007 and 2006 remain subject to examination by the Internal Revenue Service and various other state tax authorities. The Company is currently under examination by the Internal Revenue Service for the tax year ended December 31, 2008. Based upon the timing and status of the current examinations by taxing authorities, the Company does not expect that the amounts of unrecognized tax benefits will change significantly within the next twelve months.
18. EMPLOYEE BENEFITS
Employee 401(k) Profit Sharing Plan
The Company established a corporate-wide 401(k) Profit Sharing Plan for the benefit of the employees of the Company and its affiliates, which became effective on July 1, 2002. The Plan is a 401(k) savings and retirement plan that is designed to qualify as an ERISA section 404(c) plan. The assets of the Charter Bank 401(k) plan and the Davidson Trust Company 401(k) plan were merged into this Plan during 2009. The employees of BOS joined the Plan as new participants on January 1, 2009. Generally, employees that are at least twenty-one (21) years of age are eligible to participate in the plan on their date of hire. Employee contributions may be matched based on a predetermined formula and additional discretionary contributions may be made. Consolidated 401(k) expenses for all plans were $2.3 million, $2.7 million, and $1.9 million, in 2009, 2008, and 2007, respectively.
125
Table of Contents
NOTES TO CONSOLIDATED FINANCIAL STATEMENTS—(Continued)
Salary Continuation Plans
Borel maintains a discretionary salary continuation plan for certain officers. The officers become eligible for benefits under the salary continuation plan if they reach a defined retirement age while working for Borel. In December 1990, Borel implemented a discretionary deferred compensation plan for directors. The compensation expense relating to each contract is accounted for individually and on an accrual basis. The expense relating to these plans was $0.2 million, $0.2 million, and $0.3 million, for 2009, 2008, and 2007, respectively. The amount recognized in other liabilities was $2.2 million and $2.3 million at December 31, 2009 and 2008, respectively. Borel has purchased life insurance contracts to help fund these plans. Borel has single premium life insurance policies with cash surrender values totaling $5.7 million and $5.5 million, which are included in other assets on the accompanying consolidated balance sheets, as of December 31, 2009 and 2008, respectively.
FPB maintains a discretionary salary continuation plan for certain officers. The plan provides for payments to the participants at the age of retirement. The expense relating to these plans was $0.2 million, $0.2 million, and $0.2 million, for 2009, 2008, and 2007, respectively. The net amount recognized in other liabilities was $1.9 million and $1.7 million at December 31, 2009 and 2008, respectively. FPB has purchased life insurance contracts to help fund these plans. These life insurance policies have cash surrender values totaling $4.4 million and $4.3 million, which are included in other assets on the accompanying consolidated balance sheets as of December 31, 2009 and 2008, respectively.
Deferred Compensation Plan
The Company offers a deferred compensation plan that enables certain executives to elect to defer a portion of their compensation. The amounts deferred are excluded from the employee’s taxable income and are not deductible for income tax purposes by the Company until paid. The employee selects from a limited number of mutual funds and the deferred liability is increased or decreased to correspond to the market value of these underlying hypothetical mutual fund investments. The increase in value is recognized as compensation expense. The Company established and funded a Rabbi Trust to offset this liability. The Rabbi Trust holds similar assets and approximately mirrors the activity in the hypothetical mutual funds. Increases and decreases in the value of the mutual funds in the Rabbi Trust are recognized in other income.
Stock-Based Incentive Plans
At December 31, 2009, the Company has three stock-based compensation plans. These plans encourage and enable the officers, employees, non-employee directors, and other key persons of the Company to acquire a proprietary interest in the Company.
The 2009 Stock Option and Incentive Plan (the “Plan”), replaced the Company’s 2004 Stock Option and Incentive Plan. Under the Plan the Company may grant options, stock appreciation rights, restricted stock, restricted stock units, unrestricted stock awards, performance share awards and dividend equivalent rights to its officers, employees, non-employee directors, and other key persons of the Company for an amount not to exceed 2% of the total shares of common stock outstanding as of the last business day of the preceding fiscal year. The Plan provides for the authorization and issuance of 4,000,000 shares, along with any residual shares from previous plans. Under the Plan, the exercise price of each option shall not be less than 100% of the fair market value of the stock on the date the options are granted. Generally, options expire ten years from the date granted and vest over a three-year graded vesting period for officers and employees and a one-year or less period for non-employee directors. Stock grants generally vest over a three year cliff vesting period. As of December 31, 2009 the maximum number of shares of stock reserved and available for issuance under the plan was 4,036,345 shares.
The Company maintains both a qualified and non-qualified Employee Stock Purchase Plan (“the ESPPs”) with similar provisions. The non-qualified plan was approved in 2006 and allows for employees of certain
126
Table of Contents
NOTES TO CONSOLIDATED FINANCIAL STATEMENTS—(Continued)
subsidiaries that are structured as limited liability companies to participate. Under the ESPPs, eligible employees may purchase common stock of the Company at 85 percent of the lower of the closing price of the Company’s common stock on the first or last day of a six month purchase period on The NASDAQ® Stock Market. Employees pay for their stock purchases through payroll deductions at a rate equal to any whole percentage from 1 percent to 15 percent of after-tax earnings. Participants have a right to a full reimbursement of ESPP deferrals through the end of the offering period. Such a reimbursement would result in a reversal of the compensation expense, previously recorded, attributed to that participant. The Company issues shares under the ESPPs in January and July of each year. As of December 31, 2008 there were 43,983 and 193,548 shares available for issuance in the non-qualified and qualified ESPP plans, respectively. There were 15,995 shares issued to participants under the non-qualified ESPP plan in 2009 and 27,989 shares available for issuance at December 31, 2009. There were 253,030 shares issued to participants under the qualified ESPP in July 2009, of which 193,548 were issued from the qualified ESPP and the remaining 59,482 shares were issued to employees from the Plan.
Share-based payments recorded in salaries and benefits expense are as follows:
| Year Ended December 31, | |||||||||
| 2009 | 2008 | 2007 | |||||||
| (In thousands) | |||||||||
| Stock option and ESPP expense |
$ | 2,807 | $ | 4,293 | $ | 4,640 | |||
| Nonvested share expense |
2,315 | 2,525 | 2,340 | ||||||
| Subtotal |
5,122 | 6,818 | 6,980 | ||||||
| Tax benefit |
1,800 | 2,633 | 2,723 | ||||||
| Stock-based compensation expense, net of tax benefit |
$ | 3,322 | $ | 4,185 | $ | 4,257 | |||
The fair value of each stock option award is estimated on the date of grant using the Black-Scholes option pricing model that uses the assumptions noted in the table below. Expected volatility is determined based on historical volatility of the Company’s stock, historical volatility of industry peers, and other factors. The Company uses historical data to estimate employee option exercise behavior and post-vesting cancellation for use in determining the expected life assumption. The risk-free rate is determined on the grant date of each award using the yield on a U.S. Treasury zero-coupon issue with a remaining term that approximates the expected term for the award. The dividend yield is based on expectations of future dividends paid by the Company and the market price of the Company’s stock on the date of grant. Compensation expense is recognized using the straight-line method over the vesting period of the option or the retirement eligible date, whichever is shorter. Options issued to retirement eligible employees are expensed on the date of grant.
The fair value of each option grant is estimated on the date of grant using the Black-Scholes option-pricing model with the following assumptions:
| Year Ended December 31, | |||||||||
| 2009 | 2008 | 2007 | |||||||
| Expected volatility |
55.2 | % | 38.4 | % | 30.0 | % | |||
| Expected dividend yield |
0.8 | % | 1.2 | % | 1.5 | % | |||
| Expected term (in years) |
6.4 | 6.4 | 6.2 | ||||||
| Risk-free rate |
3.2 | % | 3.3 | % | 4.8 | % | |||
127
Table of Contents
NOTES TO CONSOLIDATED FINANCIAL STATEMENTS—(Continued)
Stock Options
A summary of option activity under the Plan for the year ended December 31, 2009 is as follows:
| Shares | Weighted- Average Exercise Price |
Weighted- Average Remaining Contractual Term in Years |
Aggregate Intrinsic Value (in 000’s) | |||||||
| Outstanding at January 1, 2009 |
5,464,138 | $ | 20.99 | |||||||
| Granted |
300,936 | $ | 4.94 | |||||||
| Exercised |
7,582 | $ | 4.23 | |||||||
| Forfeited or expired |
836,167 | $ | 19.02 | |||||||
| Outstanding at December 31, 2009 |
4,921,325 | $ | 20.33 | 5.46 | $ | 327 | ||||
| Exercisable at December 31, 2009 |
3,868,458 | $ | 22.19 | 4.62 | $ | 107 | ||||
The weighted-average grant-date fair value of options granted during the years ended December 31, 2009, 2008, and 2007 was $2.58, $3.57, and $9.85, respectively. The total intrinsic value of options exercised during the years ended December 31, 2009, 2008, and 2007 was less than $0.1 million, $1.5 million, and $5.0 million, respectively. As of December 31, 2009, there was $2.1 million of total unrecognized compensation cost related to stock option arrangements granted under the Plan that is expected to be recognized over a weighted-average period of 1.5 years.
Restricted Stock
A summary of the Company’s nonvested shares as of December 31, 2009 and changes during the year ended December 31, 2009 is as follows:
| Shares | Weighted- Average Grant- Date Fair Value | ||||
| Nonvested at January 1, 2009 |
492,546 | $ | 18.59 | ||
| Granted |
697,327 | $ | 4.97 | ||
| Vested |
159,398 | $ | 23.26 | ||
| Forfeited |
2,246 | $ | 12.24 | ||
| Nonvested at December 31, 2009 |
1,028,229 | $ | 8.95 | ||
The fair value of nonvested shares is determined based on the closing price of the Company’s stock on the grant date. The weighted-average grant-date fair value of shares granted during the year ended December 31, 2009, 2008, and 2007 was $4.97, $11.93, and $28.49, respectively. At December 31, 2009, there was $4.1 million of total unrecognized compensation cost related to nonvested share-based compensation arrangements under the Plan. That cost is expected to be recognized over a weighted-average period of 1.7 years. The total fair value of shares that vested during the years ended December 31, 2009, 2008, and 2007 was $3.7 million, $3.0 million, and $5.2 million, respectively.
Included in the restricted stock balances above are performance shares, which are accounted for in the same manner as restricted stock. In 2009 there were 112,469 performance shares granted to certain executives within the Company. The amount of the performance shares could increase up to 202,444 shares. The Company recognizes the expense for performance shares based upon the most likely outcome of shares to be issued based on current information.
128
Table of Contents
NOTES TO CONSOLIDATED FINANCIAL STATEMENTS—(Continued)
Supplemental Executive Retirement Plan
The Company has a non-qualified supplemental executive retirement plan (“SERP”) with an executive officer of the Company. The SERP, which is unfunded, provides a defined cash benefit based on a formula using average compensation, years of service, and age at retirement of the executive. The agreement was amended in July 2004 and then revised February of 2007. Expected benefits were increased and the full vesting age was increased to age 70. The actuarial present value of the projected benefit obligation was $7.5 million at both December 31, 2009 and 2008. The accrued SERP liability was $6.6 million and $6.2 million at December 31, 2009 and 2008, respectively. The expense associated with the SERP was $0.5 million, $1.1 million and $1.1 million in 2009, 2008 and 2007, respectively. The benefit will be fully accrued by November 2011. The discount rate used to calculate the SERP liability was 5.50%, 5.75%, and 5.75% for the 2009, 2008 and 2007, respectively.
Charter has a SERP with various current and previous executives of Charter. The SERP, which is unfunded, provides a defined cash benefit based on a formula using compensation, years of service, and age at retirement of the executives. The actuarial present value of the projected benefit obligation was $3.1 million at both December 31, 2009 and 2008. The accrued SERP liability was $3.1 million and $1.3 million at December 31, 2009 and 2008, respectively. The expense associated with the SERP was $0.6 million, $0.3 million and $0.1 million in 2009, 2008 and 2007, respectively. The benefits for each executive under the plan are accrued until the full vesting age of 65. The discount rate used to calculate the SERP liability was 6.50%, 6.50%, and 6.50% for the years 2009, 2008 and 2007, respectively.
19. OTHER OPERATING EXPENSE
Major components of other operating expense are as follows:
| Year Ended December 31, | |||||||||
| 2009 | 2008 | 2007 | |||||||
| (In thousands) | |||||||||
| Insurance |
$ | 3,025 | $ | 2,482 | $ | 1,989 | |||
| OREO and repossessed asset expenses |
2,048 | 1,470 | 267 | ||||||
| Forms and supplies |
1,415 | 1,391 | 1,337 | ||||||
| Telephone |
1,145 | 1,098 | 860 | ||||||
| Employee travel and meals |
1,932 | 1,781 | 1,220 | ||||||
| Courier and express mail |
805 | 957 | 905 | ||||||
| Publications and dues |
818 | 851 | 678 | ||||||
| Training and education |
658 | 691 | 627 | ||||||
| Postage |
666 | 653 | 633 | ||||||
| Correspondent bank charges |
979 | 429 | 284 | ||||||
| Other |
3,634 | 3,689 | 3,226 | ||||||
| Total |
$ | 17,125 | $ | 15,492 | $ | 12,026 | |||
20. FINANCIAL INSTRUMENTS WITH OFF-BALANCE SHEET RISK
The Company is party to financial instruments with off-balance sheet risk in the normal course of business to meet the financing needs of its customers. These financial instruments include commitments to originate loans, unadvanced portion of loans, unused lines of credit, standby letters of credit, commitments to sell loans, and rate locks related to loans that if originated will be held for sale. The instruments involve, to varying degrees, elements of credit and interest rate risk in excess of the amount recognized in the consolidated balance sheets. The contract or notional amounts of those instruments reflect the extent of involvement the Company has in particular classes of financial instruments.
129
Table of Contents
NOTES TO CONSOLIDATED FINANCIAL STATEMENTS—(Continued)
The Company’s exposure to credit loss in the event of nonperformance by the other party to the financial instrument for loan commitments and standby letters of credit is represented by the contractual amount of those instruments. The Company uses the same credit policies in making commitments and conditional obligations as it does for on-balance sheet instruments.
Commitments to originate loans, the unadvanced portion of loans, and the unused lines of credit are agreements to lend to a customer, provided there is no violation of any condition established in the contract. Commitments generally have fixed expiration dates or other termination clauses and may require payment of a fee. Since certain commitments may expire without being drawn upon, the total commitment amounts do not necessarily represent future cash requirements. The Company evaluates each customer’s creditworthiness on a case-by-case basis. The amount of collateral obtained, if deemed necessary by the Company upon extension of credit, is based on management’s credit evaluation of the borrower.
Standby letters of credit are conditional commitments issued by the Company to guarantee the performance by a customer to a third party. The credit risk involved in issuing standby letters of credit is essentially the same as that involved in extending loan facilities to customers.
Loans sold to investors have recourse to the Company on any loans that are deemed to have been fraudulent or misrepresented. In addition, investors would require the Company to repurchase any loan sold which has a first payment default.
Financial instruments with off-balance sheet risk are summarized as follows:
| December 31, 2009 |
December 31, 2008 | |||||
| (In thousands) | ||||||
| Commitments to originate loans |
||||||
| Variable rate |
$ | 47,951 | $ | 78,355 | ||
| Fixed rate |
24,767 | 23,506 | ||||
| Total commitments to originate new loans |
$ | 72,718 | $ | 101,861 | ||
| Unadvanced portion of loans and unused lines of credit |
$ | 831,613 | $ | 882,856 | ||
| Standby letters of credit |
$ | 29,432 | $ | 33,292 | ||
| Forward commitments to sell loans |
$ | 30,722 | $ | 39,322 | ||
21. FAIR VALUE OF FINANCIAL INSTRUMENTS
Fair Value is defined under GAAP as the exchange price that would be received to sell an asset or paid to transfer a liability (an exit price) in an orderly transaction between market participants on the measurement date. The Company determines the fair values of its financial instruments based on the fair value hierarchy established in ASC 820, which requires an entity to maximize the use of observable inputs and minimize the use of unobservable inputs when measuring fair value. ASC 820 describes three levels of inputs that may be used to measure fair value. Financial instruments are considered Level 1 when valuation can be based on quoted prices in active markets for identical assets or liabilities. Level 2 financial instruments are valued using quoted prices for similar assets or liabilities; quoted prices in markets that are not active; or models using inputs that are observable or can be corroborated by observable market data of substantially the full term of the assets or liabilities. Financial instruments are considered Level 3 when their values are determined using pricing models, discounted cash flow methodologies or similar techniques and at least one significant model assumption or input is unobservable and when determination of the fair value requires significant management judgment or estimation.
130
Table of Contents
NOTES TO CONSOLIDATED FINANCIAL STATEMENTS—(Continued)
The following table presents the Company’s assets and liabilities measured at fair value on a recurring basis as of December 31, 2009 and December 31, 2008, aggregated by the level in the fair value hierarchy within which those measurements fall.
| At December 31, 2009 |
Fair value measurements at reporting date using: | |||||||||||
| Quoted prices in active markets for identical assets (level 1) |
Significant other observable inputs (level 2) |
Significant unobservable inputs (level 3) | ||||||||||
| (In thousands) | ||||||||||||
| Assets: |
||||||||||||
| Available for sale securities: |
||||||||||||
| Mortgage-backed securities |
$ | 311,511 | $ | — | $ | 308,360 | $ | 3,151 | ||||
| Government-sponsored entities |
188,394 | — | 188,394 | — | ||||||||
| U.S. government and agencies |
184,722 | 178,048 | 6,674 | — | ||||||||
| Municipal bonds |
184,544 | — | 184,544 | — | ||||||||
| Corporate bonds |
15,943 | — | 15,943 | — | ||||||||
| Other |
2,918 | 412 | 2,006 | 500 | ||||||||
| Total available for sale securities |
888,032 | 178,460 | 705,921 | 3,651 | ||||||||
| Derivatives—interest rate floor |
2,646 | — | 2,646 | — | ||||||||
| Derivatives—customer swaps |
4,924 | — | 4,924 | — | ||||||||
| Other investments |
9,628 | 4,176 | 5,452 | — | ||||||||
| Liabilities: |
||||||||||||
| Derivatives—customer swaps* |
$ | 5,053 | $ | — | $ | 5,053 | $ | — | ||||
| * | Derivatives-customer swap (liabilities) is netted with the Derivative assets within Other assets on the consolidated balance sheets. |
| Fair value measurements at reporting date using: | ||||||||||||
| At December 31, 2008 |
Quoted prices in active markets for identical assets (level 1) |
Significant other observable inputs (level 2) |
Significant unobservable inputs (level 3) | |||||||||
| (In thousands) | ||||||||||||
| Assets: |
||||||||||||
| Available for sale securities |
||||||||||||
| Mortgage-backed securities |
$ | 281,355 | $ | — | $ | 281,355 | $ | — | ||||
| Government-sponsored entities |
268,570 | — | 268,570 | — | ||||||||
| Municipal bonds |
212,943 | — | 212,943 | — | ||||||||
| Corporate bonds |
23,233 | — | 23,233 | — | ||||||||
| U.S. government and agencies |
8,574 | — | 8,574 | — | ||||||||
| Other |
4,351 | — | 4,351 | — | ||||||||
| Total available for sale securities |
799,026 | — | 799,026 | — | ||||||||
| Derivatives—interest rate floor |
5,260 | — | 5,260 | — | ||||||||
| Derivatives—customer swaps |
7,762 | — | 7,762 | — | ||||||||
| Other investments |
7,441 | 3,084 | 4,357 | — | ||||||||
| Liabilities: |
||||||||||||
| Derivative—customer swaps* |
$ | 7,698 | $ | — | $ | 7,698 | $ | — | ||||
| * | Derivatives-customer swap (liabilities) is netted with the Derivative assets within Other assets on the consolidated balance sheets. |
131
Table of Contents
NOTES TO CONSOLIDATED FINANCIAL STATEMENTS—(Continued)
Available for sale securities consist primarily of U.S. government and agency securities, government-sponsored entities, municipal bonds, mortgage-backed securities (primarily residential), corporate bonds, and other investments. The U.S. government securities, and equities and mutual funds (which are categorized as other investments) are valued with prices quoted in active markets. Therefore, they have been categorized as a Level 1 measurement. The government-sponsored entities, corporate bonds, municipal bonds, most of the mortgage-backed securities, and certain investments in SBA loans (which are categorized as other investments) generally have quoted prices but are traded less frequently than exchange-traded securities and can be priced using market data from similar assets. Therefore, they have been categorized as a Level 2 measurement. The remaining investments—one mortgage-backed security and two CRA loan funds (which are categorized as other investments) have unobservable inputs and are not actively traded. The value for these securities is determined by third party pricing models. Therefore, they have been categorized as a Level 3 measurement.
Currently, the Company uses an interest rate floor and interest rate customer swaps to manage its interest rate risk. The valuation of these instruments is determined using widely accepted valuation techniques including discounted cash flow analysis on the expected cash flows of each derivative. This analysis reflects the contractual terms of the derivatives, including the period to maturity, and uses observable market-based inputs, including interest rate curves and implied volatilities. Therefore, they have been categorized as a Level 2 measurement. See “Notes to Consolidated Financial Statements—Note 10: Derivatives and Hedging Activities” for further details.
To comply with the provisions of ASC 820, the Company incorporates credit valuation adjustments to appropriately reflect both its own nonperformance risk and the respective counterparty’s nonperformance risk in the fair value measurements. In adjusting the fair value of its derivative contracts for the effect of nonperformance risk, the Company has considered the impact of netting and any applicable credit enhancements, such as collateral postings, thresholds, mutual puts and guarantees.
The Company has determined that the majority of the inputs used to value its derivatives fall within Level 2 of the fair value hierarchy, although the credit valuation adjustments associated with its derivatives utilize Level 3 inputs, such as estimates of current credit spreads to evaluate the likelihood of default by itself and its counterparties. As a result, the Company has determined that its derivative valuations in their entirety are classified in Level 2 of the fair value hierarchy.
Other investments, which are not considered available for sale investments, consist of deferred compensation trusts for the benefit of employees, which consist of publicly traded mutual fund investments that are valued at prices quoted in active markets. Therefore, they have been categorized as a Level 1 measurement.
The following table presents a rollforward of the Level 3 assets for the period ended December 31, 2009. The unrealized gains/(losses) on the Level 3 assets included in the table below are included in Accumulated comprehensive income on the consolidated balance sheet as of December 31, 2009.
| Balance at January 1, 2009 |
Purchase, (sales), issuances and (settlements), net |
Transfers into Level 3 |
Unrealized gains (losses) |
Amortization | Balance at December 31, 2009 | ||||||||||||||
| (In thousands) | |||||||||||||||||||
| Mortgage-backed securities |
$ | — | $ | 3,141 | $ | — | $ | 33 | $ | (23 | ) | $ | 3,151 | ||||||
| Other available for sale investments |
— | — | 500 | — | — | 500 | |||||||||||||
| Total Level 3 assets |
$ | — | $ | 3,141 | $ | 500 | $ | 33 | $ | (23 | ) | $ | 3,651 | ||||||
132
Table of Contents
NOTES TO CONSOLIDATED FINANCIAL STATEMENTS—(Continued)
The following tables present the Company’s assets and liabilities measured at fair value on a non-recurring basis as of December 31, 2009 and December 31, 2008, aggregated by the level in the fair value hierarchy within which those measurements fall.
| December 31, 2009 |
Fair value measurements recorded during the year: | |||||||||||
| Quoted prices in active markets for identical assets (level 1) |
Significant other observable inputs (level 2) |
Significant unobservable inputs (level 3) | ||||||||||
| (In thousands) | ||||||||||||
| Assets: |
||||||||||||
| Impaired loans(1) |
$ | 34,471 | $ | — | $ | — | $ | 34,471 | ||||
| Loans held for sale(2) |
473 | — | — | 473 | ||||||||
| OREO(3) |
6,129 | — | — | 6,129 | ||||||||
| Goodwill and identifiable intangible assets(4) |
3,654 | — | — | 3,654 | ||||||||
| $ | 42,526 | $ | — | $ | — | $ | 42,526 | |||||
| (1) | Collateral-dependent impaired loans whose specific reserve changed during 2009. |
| (2) | Two loans in the loans held for sale category had write downs during 2009. |
| (3) | Six OREO properties had write downs during 2009. |
| (4) | Goodwill and identifiable intangible assets at one affiliate partner had write downs during 2009. |
| December 31, 2008 |
Fair value measurements recorded during the year: | |||||||||||
| Quoted prices in active markets for identical assets (level 1) |
Significant other observable inputs (level 2) |
Significant unobservable inputs (level 3) | ||||||||||
| (In thousands) | ||||||||||||
| Assets: |
||||||||||||
| Impaired loans(1) |
$ | 26,271 | $ | — | $ | — | $ | 26,271 | ||||
| Loans held for sale(2) |
27,219 | — | — | 27,219 | ||||||||
| OREO(3) |
2,436 | — | — | 2,436 | ||||||||
| $ | 55,926 | $ | — | $ | — | $ | 55,926 | |||||
| (1) | Collateral-dependent impaired loans whose specific reserve changed during 2008. |
| (2) | 18 loans in the loans held for sale category had write downs during 2008. |
| (3) | One OREO property had a write down during 2008. |
Impaired loans include those loans that were measured at the value of underlying collateral as allowed under ASC 310. The amount does not include impaired loans that are measured based on expected future cash flows discounted at the respective loan’s original effective interest rate, as that amount is not considered a fair value measurement. The Company uses appraisals, which management may adjust to reflect estimated market value declines, or apply other discounts to appraised values for unobservable factors resulting from its knowledge of the property. Therefore they have been categorized as a Level 3 measurement.
The loans held for sale in the table above represent the portfolio of loans in Southern California transferred to the held for sale category in the third quarter of 2008, as discussed in the Company’s 2008 Annual Report on Form 10-K, which had an adjustment to fair value for the year ended December 31, 2009. The fair value of these
133
Table of Contents
NOTES TO CONSOLIDATED FINANCIAL STATEMENTS—(Continued)
loans held for sale was based on broker quotes, comparable market transactions and information from the Company’s agent hired to assist with the sale of the portfolio. Therefore they have been categorized as a Level 3 measurement.
The OREO in the table above includes those properties that had an adjustment to fair value during the years ended December 31, 2009 and 2008. The Company uses appraisals, which management may adjust to reflect estimated fair value declines, or apply other discounts to appraised values for unobservable factors resulting from its knowledge of the property. Therefore they have been categorized as a Level 3 measurement.
The goodwill and identifiable intangible assets in the table above includes the goodwill and identifiable intangible assets at one affiliate that had an adjustment to fair value during the year ended December 31, 2009. The Company utilized a weighted average of the income and market approaches, with 80% from the income and 20% from the market approach, to determine fair value. Therefore they have been categorized as a Level 3 measurement. See Part II, Item 8, “Financial Statements and Supplementary Data—Note 10: Goodwill and Other Intangible Assets” for a detailed discussion of the fair value measurement techniques employed.
The following table presents the book and fair values of the Company’s financial instruments that are not measured at fair value on a recurring basis (other than certain loans, as noted below):
| December 31, 2009 | December 31, 2008 | |||||||||||
| Book Value | Fair Value | Book Value | Fair Value | |||||||||
| (In thousands) | ||||||||||||
| FINANCIAL ASSETS: |
||||||||||||
| Cash and cash equivalents |
$ | 447,460 | $ | 447,460 | $ | 281,275 | $ | 281,275 | ||||
| Held to maturity securities |
4,501 | 4,511 | 4,499 | 4,597 | ||||||||
| Loans, net (including loans held for sale) |
4,251,310 | 4,314,744 | 4,101,836 | 4,141,499 | ||||||||
| Other financial assets |
123,979 | 123,979 | 124,769 | 124,769 | ||||||||
| FINANCIAL LIABILITIES: |
||||||||||||
| Deposits |
4,255,219 | 4,265,309 | 3,748,912 | 3,763,141 | ||||||||
| Securities sold under agreements to repurchase |
243,377 | 246,592 | 293,841 | 298,208 | ||||||||
| Federal Home Loan Bank borrowings |
555,012 | 577,705 | 745,472 | 775,665 | ||||||||
| Junior subordinated debentures and other long-term debt |
193,645 | 156,568 | 290,585 | 211,085 | ||||||||
| Other financial liabilities |
15,588 | 15,588 | 16,738 | 16,738 | ||||||||
The estimated fair values have been determined by using available quoted market information or other appropriate valuation methodologies. The aggregate fair value amounts presented do not represent the underlying value of the Company taken as a whole.
The fair value estimates provided are made at a specific point in time, based on relevant market information and the characteristics of the financial instrument. The estimates do not provide for any premiums or discounts that could result from concentrations of ownership of a financial instrument. Because no active market exists for some of the Company’s financial instruments, certain fair value estimates are based on subjective judgments regarding current economic conditions, risk characteristics of the financial instruments, future expected loss experience, prepayment assumptions, and other factors. The resulting estimates involve uncertainties and therefore cannot be determined with precision. Changes made to any of the underlying assumptions could significantly affect the estimates.
Cash and cash equivalents
The carrying value reported in the balance sheet for cash and cash equivalents approximates fair value due to the short-term nature of their maturities.
134
Table of Contents
NOTES TO CONSOLIDATED FINANCIAL STATEMENTS—(Continued)
Securities held to maturity
The fair value presented for securities are based on quoted market prices received from third party pricing services, where available. If quoted market prices were not available, fair values were based on quoted market prices of comparable instruments, quotations, or analysis of estimated future cash flows.
Loans, net (including loans held for sale)
Fair value estimates are based on loans with similar financial characteristics. Fair values of commercial and residential mortgage loans are estimated by discounting contractual cash flows adjusted for prepayment estimates and using discount rates approximately equal to current market rates on loans with similar characteristics and maturities. The incremental credit risk for non-performing loans has been considered in the determination of the fair value of consumer loans. The fair value estimates for home equity and other loans are based on outstanding loan terms and pricing in each Bank’s local market. The Company’s fair value estimates, methods, and assumptions are set forth below for each type of financial instrument. The method of estimating the fair value of the financial instruments disclosed in the table above does not incorporate the exit price concept in the presentation of the fair value of these financial instruments.
Other financial assets
Other financial assets consist primarily of accrued interest and fees receivable, stock in FHLBs, and the cash surrender value of bank-owned life insurance, for which the carrying amount approximates fair value.
The Company carries the FHLB stock at the original cost basis (par value). Each of the Banks is a member of their local FHLB located in either Boston, Seattle, or San Francisco. At each period end, the Company evaluates its investment in the respective FHLB’s stock for other-than-temporary impairment. Based on the Company’s evaluation of the underlying investment, including the long-term nature of the asset, the liquidity position of the respective FHLBs, the actions being taken by the respective FHLBs to address their regulatory situations, and the Company’s current intention not to sell or redeem any of its investment in the respective FHLBs, and the determination that it is not more likely than not that the Company would be required to sell or redeem any of its investments in the respective FHLBs, the Company has not recognized an other-than-temporary impairment loss with respect to stock in the FHLBs.
Deposits
The fair values reported for transaction accounts (demand, NOW, savings, and money market) equal their respective book values reported on the balance sheet. The fair values disclosed are, by definition, equal to the amount payable on demand at the reporting date. The fair values for certificates of deposit are based on the discounted value of contractual cash flows. The discount rates used are representative of approximate rates currently offered on certificates of deposit with similar remaining maturities.
Securities sold under agreements to repurchase
The fair value of securities sold under agreements to repurchase are estimated based on contractual cash flows discounted at the Company’s incremental borrowing rate for FHLB borrowings with similar maturities.
Federal Home Loan Bank borrowings
The fair value reported for FHLB borrowings is estimated based on the discounted value of contractual cash flows. The discount rate used is based on the Company’s estimated current incremental borrowing rate for FHLB borrowings of similar maturities.
135
Table of Contents
NOTES TO CONSOLIDATED FINANCIAL STATEMENTS—(Continued)
Junior subordinated debentures and other long-term debt
The fair value of the junior subordinated debentures issued by Trust I was based on the current market price of the securities at December 31, 2009 and December 31, 2008. The fair value of the junior subordinated debentures issued by Trust II was based on the present value of cash flows discounted using the current rate for similar securities. The fair value of the junior subordinated debentures acquired in the FPB, Gibraltar, and Charter acquisitions approximates book value because of the floating rate nature of the securities. The fair value of the long-term debt was based on the price the Company repurchased this debt for in the open market.
Other financial liabilities
Other financial liabilities consist of accrued interest payable and deferred compensation for which the carrying amount approximates fair value.
Financial instruments with off-balance sheet risk
The Company’s commitments to originate loans and for unused lines and outstanding standby letters of credit are primarily at market interest rates and therefore, the carrying amount approximates fair value.
22. BOSTON PRIVATE FINANCIAL HOLDINGS, INC. (PARENT COMPANY ONLY)
CONDENSED BALANCE SHEETS
| December 31, 2009 |
December 31, 2008 | |||||
| (In thousands) | ||||||
| ASSETS: |
||||||
| Cash and cash equivalents |
$ | 90,195 | $ | 202,319 | ||
| Investment securities available for sale |
175,000 | — | ||||
| Investment in wholly-owned and majority-owned subsidiaries: |
||||||
| Banks |
468,121 | 432,652 | ||||
| Nonbanks |
138,609 | 142,194 | ||||
| Investment in partnerships and trusts |
8,841 | 8,839 | ||||
| Intangible assets, net |
692 | 798 | ||||
| Income tax receivable and deferred |
25,765 | 39,995 | ||||
| Other assets |
23,563 | 18,300 | ||||
| Investments in discontinued operations |
— | 164,359 | ||||
| Total assets |
$ | 930,786 | $ | 1,009,456 | ||
| LIABILITIES: |
||||||
| Deferred acquisition obligations |
$ | 3,476 | $ | 11,466 | ||
| Junior subordinated debentures and other long-term debt |
193,645 | 290,585 | ||||
| Other liabilities |
32,489 | 18,429 | ||||
| Total liabilities |
229,610 | 320,480 | ||||
| REDEEMABLE NONCONTROLLING INTERESTS(1) |
50,022 | 43,800 | ||||
| TOTAL COMPANY’S STOCKHOLDERS’ EQUITY(2) |
651,154 | 645,176 | ||||
| Total liabilities, redeemable noncontrolling interests and stockholders’ equity |
$ | 930,786 | $ | 1,009,456 | ||
| (1) | Represents the maximum redemption value, if any, of noncontrolling interests |
| (2) | Excludes noncontrolling interests |
136
Table of Contents
NOTES TO CONSOLIDATED FINANCIAL STATEMENTS—(Continued)
CONDENSED STATEMENTS OF OPERATIONS
| December 31, 2009 |
December 31, 2008 |
December 31, 2007 |
||||||||||
| (In thousands) | ||||||||||||
| INCOME: |
||||||||||||
| Interest income |
$ | 1,887 | $ | 4,364 | $ | 4,870 | ||||||
| Gain on repurchase of debt |
18,739 | 22,513 | — | |||||||||
| Dividends from subsidiaries: |
||||||||||||
| Banks |
10,000 | — | 13,900 | |||||||||
| Nonbanks |
17,511 | 29,782 | 22,171 | |||||||||
| Other income/(loss) |
1,187 | (1,866 | ) | 1,173 | ||||||||
| Total income |
49,324 | 54,793 | 42,114 | |||||||||
| EXPENSES: |
||||||||||||
| Salaries and employee benefits |
13,283 | 13,878 | 13,875 | |||||||||
| Professional fees |
6,192 | 7,785 | 4,987 | |||||||||
| Interest expense |
12,421 | 18,488 | 18,652 | |||||||||
| Warrant expense |
— | 2,233 | — | |||||||||
| Impairment of goodwill and intangibles |
— | 3,921 | — | |||||||||
| Other expenses |
4,725 | 5,505 | 5,453 | |||||||||
| Total expenses |
36,621 | 51,810 | 42,967 | |||||||||
| Income/(loss) from continuing operations before income taxes |
12,703 | 2,983 | (853 | ) | ||||||||
| Income tax benefit |
(8,924 | ) | (9,400 | ) | (16,115 | ) | ||||||
| Net loss from discontinued operations |
(7,505 | ) | (191,209 | ) | (1,524 | ) | ||||||
| Income/(loss) before equity in undistributed loss of subsidiaries |
14,122 | (178,826 | ) | 13,738 | ||||||||
| Equity in undistributed loss of subsidiaries |
(8,891 | ) | (209,926 | ) | (9,568 | ) | ||||||
| Net income/(loss) attributable to the Company |
$ | 5,231 | $ | (388,752 | ) | $ | 4,170 | |||||
137
Table of Contents
NOTES TO CONSOLIDATED FINANCIAL STATEMENTS—(Continued)
CONDENSED STATEMENTS OF CASH FLOWS
| December 31, 2009 |
December 31, 2008 |
December 31, 2007 |
||||||||||
| (In thousands) | ||||||||||||
| CASH FLOWS FROM OPERATING ACTIVITIES |
||||||||||||
| Net income/(loss) attributable to the Company |
$ | 5,231 | $ | (388,752 | ) | $ | 4,170 | |||||
| Net loss from discontinued operations |
(7,505 | ) | (191,209 | ) | (1,524 | ) | ||||||
| Net income/(loss) from continuing operations |
12,736 | (197,543 | ) | 5,694 | ||||||||
| Adjustments to reconcile net income/(loss) from continuing operations to net cash provided by/(used in) operating activities: |
||||||||||||
| Equity in loss/(earnings) of subsidiaries: |
||||||||||||
| Banks |
(13,905 | ) | 166,729 | (34,675 | ) | |||||||
| Nonbanks |
(4,715 | ) | 13,415 | 8,172 | ||||||||
| Dividends from subsidiaries: |
||||||||||||
| Banks |
10,000 | — | 13,900 | |||||||||
| Nonbanks |
17,511 | 29,782 | 22,171 | |||||||||
| Reclassification of increase in fair value of warrants |
— | 2,233 | — | |||||||||
| Impairment of goodwill and intangibles |
— | 3,921 | — | |||||||||
| Gain on the repurchase of debt |
(18,739 | ) | (22,513 | ) | — | |||||||
| Decrease/(increase) in income taxes receivable and deferred |
14,230 | (18,532 | ) | — | ||||||||
| Depreciation and amortization |
3,257 | 5,233 | 5,265 | |||||||||
| Net decrease in other operating activities |
13,905 | 10,808 | 21,397 | |||||||||
| Net cash provided by/(used in) operating activities of continuing operations |
34,280 | (6,467 | ) | 41,924 | ||||||||
| Net cash provided by operating activities of discontinued operations |
5,195 | 20,027 | 11,202 | |||||||||
| Net cash provided by operating activities |
39,475 | 13,560 | 53,126 | |||||||||
| CASH FLOWS FROM INVESTING ACTIVITIES |
||||||||||||
| Cash paid for acquisitions, including deferred acquisition obligations |
(2,744 | ) | (9,521 | ) | (64,721 | ) | ||||||
| Capital investments in subsidiaries: |
||||||||||||
| Banks |
(34,000 | ) | (134,702 | ) | (6,500 | ) | ||||||
| Nonbanks |
— | (1,132 | ) | — | ||||||||
| Intercompany notes repaid from/(issued to) Banks |
— | 214,000 | (214,000 | ) | ||||||||
| Intercompany notes issued to Nonbanks |
— | (1,000 | ) | — | ||||||||
| Purchases of investment securities available for sale |
(175,000 | ) | — | — | ||||||||
| Cash received from divestitures |
161,474 | — | — | |||||||||
| Net cash (used in)/provided by in other investing activities |
(112 | ) | 13 | (5,120 | ) | |||||||
| Net cash (used in)/provided by in investing activities of continuing operations |
(50,382 | ) | 67,658 | (290,341 | ) | |||||||
| Net cash used in in investing activities of discontinued operations |
(9,815 | ) | — | — | ||||||||
| Net cash (used in)/provided by in investing activities |
(60,197 | ) | 67,658 | (290,341 | ) | |||||||
| CASH FLOWS FROM FINANCING ACTIVITIES |
||||||||||||
| Proceeds from issuance of Notes, net of discounts |
— | — | 284,625 | |||||||||
| Repurchase of debt |
(76,939 | ) | (210,941 | ) | — | |||||||
| Share buyback |
— | — | (40,043 | ) | ||||||||
| Dividends paid to common shareholders |
(2,688 | ) | (8,815 | ) | (13,361 | ) | ||||||
| Dividends paid to preferred shareholders |
(7,862 | ) | (851 | ) | — | |||||||
| Excess tax benefit from stock options exercised |
— | — | 789 | |||||||||
| Proceeds from issuance of preferred stock, net |
— | 193,580 | — | |||||||||
| Proceeds from issuance of warrants, net |
— | 28,418 | — | |||||||||
| Proceeds from stock option exercises |
341 | 1,452 | 4,600 | |||||||||
| Proceeds from issuance of common stock, net |
2,728 | 108,120 | 3,355 | |||||||||
| Other equity adjustments |
(6,982 | ) | 2,757 | (2,343 | ) | |||||||
| Net cash (used in)/provided by in financing activities of continuing operations |
(91,402 | ) | 113,720 | 237,622 | ||||||||
| Net cash provided by financing activities of discontinued operations |
— | 291 | — | |||||||||
| Net cash (used in)/provided by in financing activities |
(91,402 | ) | 114,011 | 237,622 | ||||||||
| Net (decrease)/increase in cash and cash equivalents |
(112,124 | ) | 195,229 | 407 | ||||||||
| Cash and cash equivalents at beginning of year |
202,319 | 7,090 | 6,683 | |||||||||
| Cash and cash equivalents at end of year |
$ | 90,195 | $ | 202,319 | $ | 7,090 | ||||||
138
Table of Contents
NOTES TO CONSOLIDATED FINANCIAL STATEMENTS—(Continued)
23. REGULATORY MATTERS
Investment Management
The Company’s investment management business is highly regulated, primarily at the federal level by the SEC, National Association of Securities Dealers, and by state regulatory agencies. The Company has subsidiaries which are registered investment advisers under the Investment Advisers Act of 1940. The Investment Advisers Act imposes numerous obligations on registered investment advisers, including fiduciary, record keeping, operational, and disclosure obligations. The subsidiaries, as investment advisers, are also subject to regulation under the federal and state securities laws and the fiduciary laws of certain states. In addition, the Company has subsidiaries which act as sub-advisers to mutual funds, which are registered under the Investment Company Act of 1940 and are subject to that Act’s provisions and regulations. The Company’s subsidiaries are also subject to the provisions and regulations of the Employee Retirement Income Security Act of 1974 (“ERISA”), to the extent any such entities act as a “fiduciary” under ERISA with respect to certain of its clients. ERISA and the related provisions of the federal tax laws impose a number of duties on persons who are fiduciaries under ERISA, and prohibit certain transactions involving the assets of each ERISA plan which is a client, as well as certain transactions by the fiduciaries and certain other related parties to such plans.
Banking
The Company and its private banking subsidiaries are also subject to extensive supervision and regulation by the FRB, the FDIC, which insures the deposits of the Banks to the maximum extent permitted by law, the Massachusetts Commissioner of Banks, the California Department of Financial Institutions, and the Washington State Department of Financial Institutions. The federal and state laws and regulations which are applicable to banks regulate, among other things, the scope of their business, their investments, their reserves against deposits, the timing of the availability of deposited funds, and the nature and amount of collateral for certain loans. The laws and regulations governing the Banks generally have been promulgated to foster the safety and soundness of the Banks and protect depositors and not for the purpose of protecting stockholders.
As a bank holding company, the Company is subject to various regulatory capital requirements administered by federal agencies. Failure to meet minimum capital requirements can result in certain mandatory, and possibly additional discretionary actions by regulators that, if undertaken, could have a material effect on the Company’s financial statements. For example, under capital adequacy guidelines and the regulatory framework for prompt corrective action, the Banks, which are wholly-owned subsidiaries of the Company, must each meet specific capital guidelines that involve quantitative measures of each of the Banks’ assets and certain off-balance sheet items as calculated under regulatory accounting standards. The Banks’ respective capital amounts and classifications are also subject to qualitative judgments by the regulators about components, risk weightings, and other factors. Similarly, the Company is also subject to capital requirements administered by the Federal Reserve with respect to certain nonbanking activities, including adjustments in connection with off-balance sheet items.
Current FDIC regulations governing capital requirements state that FDIC-insured institutions, to be adequately capitalized, have qualifying total capital to risk-weighted assets of at least 8%, of which at least 4% must be Tier I capital. The primary items in the Company’s Tier I capital include total equity plus qualifying trust preferred securities, less accumulated other comprehensive income, goodwill and intangible assets, and disallowed deferred tax assets. Assets and off-balance sheet items are assigned to four risk categories, each with appropriate weights. The resulting capital ratio represents Tier I capital as a percentage of risk weighted assets and off-balance sheet items. The risk-based capital rules are designed to make regulatory capital more sensitive to differences in risk profiles among banks and bank holding companies, to account for off-balance sheet exposure and to minimize disincentives for holding liquid assets.
139
Table of Contents
NOTES TO CONSOLIDATED FINANCIAL STATEMENTS—(Continued)
To be categorized as “well capitalized,” the Company and the Banks must maintain minimum total risk-based, Tier I risk-based, and Tier I leverage ratios as set forth in the following table. In addition, the Company and the Banks cannot be subject to any written agreement, order or capital directive or prompt corrective action to be considered “well capitalized.”
Although the Company and all of the Banks within the segment maintain capital at levels that would otherwise be considered “well capitalized” under the applicable regulations, for supervisory reasons, the Southern California and Pacific Northwest banks, and therefore the Company, are not deemed “well capitalized.”
In 2009, the Company contributed $21.0 million of capital to Charter and $13.0 million to FPB. These capital contributions were made to meet applicable regulatory capital requirements and to increase regulatory capital levels given the economic conditions in the regions in which these affiliate Banks operate amid increased uncertainty in the local real estate markets. In addition, the Company contributed $18.0 million of capital to Gibraltar in 2009 prior to the divestiture in the third quarter.
The Company contributed $125.3 million of capital in 2008 to FPB. These capital contributions were needed for FPB to meet applicable regulatory capital requirements. In addition, the Company made capital contributions of $6.4 million to Borel and $3.0 million to Charter in 2008. The capital contributions to Borel were made to support significant loan growth during the year. The capital contribution to Charter was made to meet applicable regulatory capital requirements.
140
Table of Contents
NOTES TO CONSOLIDATED FINANCIAL STATEMENTS—(Continued)
The following table presents the Company’s and the Banks’ amount of regulatory capital and related ratios as of December 31, 2009 and 2008. Also presented are the capital guidelines established by the Federal Reserve, which pertain to the Company, and by the FDIC, which pertain to the Banks. To be categorized as “adequately capitalized” or “well capitalized”, the Company and the Banks must be in compliance with these ratios as long as the Company and/or the Banks are not subject to any written agreement, order, capital directive, or prompt corrective action directive. The Federal Reserve, the FDIC, and applicable state banking regulators may impose higher capital ratios than those listed below based on the results of regulatory exams.
| Actual | For capital adequacy purposes |
To be well capitalized under prompt corrective action provisions |
||||||||||||||||
| Amount | Ratio | Amount | Ratio | Amount | Ratio | |||||||||||||
| (In thousands) | ||||||||||||||||||
| As of December 31, 2009 |
||||||||||||||||||
| Total risk-based capital |
||||||||||||||||||
| Company |
$ | 759,807 | 18.95 | % | $ | 320,763 | >8.0 | % | $ | 400,954 | >10.0 | % | ||||||
| Boston Private Bank |
245,367 | 12.03 | 163,202 | 8.0 | 204,002 | 10.0 | ||||||||||||
| Borel |
159,459 | 11.73 | 108,754 | 8.0 | 135,943 | 10.0 | ||||||||||||
| FPB |
60,241 | 16.80 | 28,695 | 8.0 | 35,868 | 10.0 | ||||||||||||
| Charter |
38,984 | 19.50 | 15,995 | 8.0 | 19,994 | 10.0 | ||||||||||||
| Tier I risk-based capital |
||||||||||||||||||
| Company |
709,417 | 17.69 | 160,381 | 4.0 | 240,572 | 6.0 | ||||||||||||
| Boston Private Bank |
219,851 | 10.78 | 81,601 | 4.0 | 122,401 | 6.0 | ||||||||||||
| Borel |
142,412 | 10.48 | 54,377 | 4.0 | 81,566 | 6.0 | ||||||||||||
| FPB |
55,663 | 15.52 | 14,347 | 4.0 | 21,521 | 6.0 | ||||||||||||
| Charter |
36,397 | 18.20 | 7,998 | 4.0 | 11,996 | 6.0 | ||||||||||||
| Tier I leverage capital |
||||||||||||||||||
| Company |
709,417 | 11.62 | 244,189 | 4.0 | 305,236 | 5.0 | ||||||||||||
| Boston Private Bank |
219,851 | 6.54 | 134,537 | 4.0 | 168,171 | 5.0 | ||||||||||||
| Borel |
142,412 | 8.66 | 65,784 | 4.0 | 82,230 | 5.0 | ||||||||||||
| FPB |
55,663 | 10.59 | 21,028 | 4.0 | 26,286 | 5.0 | ||||||||||||
| Charter |
36,397 | 9.93 | 14,660 | 4.0 | 18,325 | 5.0 | ||||||||||||
| As of December 31, 2008 |
||||||||||||||||||
| Total risk-based capital |
||||||||||||||||||
| Company |
$ | 797,726 | 15.47 | % | $ | 412,500 | >8.0 | % | $ | 515,625 | >10.0 | % | ||||||
| Boston Private Bank |
229,476 | 11.57 | 158,678 | 8.0 | 198,347 | 10.0 | ||||||||||||
| Borel |
145,247 | 10.95 | 106,155 | 8.0 | 132,693 | 10.0 | ||||||||||||
| FPB |
52,835 | 13.74 | 30,771 | 8.0 | 38,463 | 10.0 | ||||||||||||
| Charter |
29,053 | 11.01 | 21,109 | 8.0 | 26,386 | 10.0 | ||||||||||||
| Tier I risk-based capital |
||||||||||||||||||
| Company |
731,768 | 14.19 | 206,250 | 4.0 | 309,375 | 6.0 | ||||||||||||
| Boston Private Bank |
204,666 | 10.32 | 79,339 | 4.0 | 119,008 | 6.0 | ||||||||||||
| Borel |
129,625 | 9.77 | 53,077 | 4.0 | 79,616 | 6.0 | ||||||||||||
| FPB |
48,003 | 12.48 | 15,385 | 4.0 | 23,078 | 6.0 | ||||||||||||
| Charter |
25,621 | 9.71 | 10,554 | 4.0 | 15,831 | 6.0 | ||||||||||||
| Tier I leverage capital |
||||||||||||||||||
| Company |
731,768 | 10.52 | 278,189 | 4.0 | 347,737 | 5.0 | ||||||||||||
| Boston Private Bank |
204,666 | 6.79 | 120,652 | 4.0 | 150,815 | 5.0 | ||||||||||||
| Borel |
129,625 | 9.08 | 57,110 | 4.0 | 71,387 | 5.0 | ||||||||||||
| FPB |
48,003 | 8.43 | 22,772 | 4.0 | 28,466 | 5.0 | ||||||||||||
| Charter |
25,621 | 6.27 | 16,354 | 4.0 | 20,442 | 5.0 | ||||||||||||
141
Table of Contents
NOTES TO CONSOLIDATED FINANCIAL STATEMENTS—(Continued)
Bank regulatory authorities restrict the Banks from lending or advancing funds to, or investing in the securities of, the Company. Further, these authorities restrict the amounts available for the payment of dividends by the Banks to the Company.
As of December 31, 2009, the Company has sponsored the creation of five statutory trusts for the sole purpose of issuing trust preferred securities and investing the proceeds in junior subordinated debentures of the Company. In accordance with ASC 810-10-55, Consolidation—Overall—Implementation Guidance and Illustrations—Variable Interest Entities, these statutory trusts created by the Company are not consolidated into the Company’s financial statements; however, the Company reflects the amounts of junior subordinated debentures payable to the preferred stockholders of statutory trusts as debt in its financial statements. As of December 31, 2009, all $186.5 million of the net balance of these trust preferred securities qualify as Tier I capital. As of December 31, 2008, $229.9 million of the net balance of these trust preferred securities qualify as Tier I capital and $1.1 qualified as Tier II capital.
On March 1, 2005, the FRB issued a final rule that would retain trust preferred securities in Tier I capital of bank holding companies, but with stricter quantitative limits and clearer standards. On March 17, 2009, the FRB announced the adoption of a final rule that delays until March 31, 2011, the effective date of new limits whereby the aggregate amount of trust preferred securities would be limited to 25% of Tier I capital elements, net of goodwill. The Company has evaluated the impact that the new limits would have and has concluded that it would still be in compliance with all required regulatory capital ratios.
24. LITIGATION AND CONTINGENCIES
Trust Litigation
Beginning in 1984, Borel served as the trustee of a private family trust (the “Trust”) that was the joint owner of a certain real property known as the Guadalupe Oil Field. The field was leased for many years to Union Oil Company of California (d/b/a UNOCAL) for oil and gas production. Significant environmental contamination resulting from UNOCAL’s operations was found on the property in 1994. The subject property was the subject of lengthy litigation brought by certain beneficiaries of the Trust against Borel and others in 1994. In 2002, during the course of that litigation, Borel (as Trustee) sold the property to its former lessee, the Union Oil Company of California (d/b/a UNOCAL) in exchange for cash and a comprehensive indemnity on behalf of the Trust. Litigation with the beneficiaries continued until 2005, when Borel, UNOCAL, and others entered into a comprehensive settlement with all of the beneficiaries, except one, dismissing all of their pending actions in exchange for a payment of cash and other considerations from UNOCAL. Borel paid nothing in the settlement. The dissenting beneficiary attempted to continue the litigation against Borel on his own, acting pro se. The state court dismissed this individual action with prejudice in 2005, whereupon the dissenting beneficiary filed a similar action, again pro se, in the U.S. District Court for the Northern District of California. The federal court dismissed this action with prejudice, and the dissenting beneficiary then unsuccessfully pursued appeals to the Ninth Circuit Court of Appeals and the U.S. Supreme Court. His petition for certiorari was denied in February 2008, concluding the litigation. The 2005 settlement with the other beneficiaries was thereafter consummated. All of the property formerly belonging to the Trust was distributed to separate subtrusts established for each individual beneficiary. Borel is not the trustee of these subtrusts of the litigants. Borel’s petition for termination of the Trust was heard in March 2009. The motion for termination was granted and the order signed on March 18, 2009. Borel was formally discharged as Trustee on June 2, 2009. No further action will be required with respect to this matter.
Other
The Company is also involved in routine legal proceedings occurring in the ordinary course of business. In the opinion of management, final disposition of these proceedings will not have a material adverse effect on the consolidated balance sheets or consolidated statements of operations of the Company.
142
Table of Contents
NOTES TO CONSOLIDATED FINANCIAL STATEMENTS—(Continued)
25. SELECTED QUARTERLY DATA (UNAUDITED)
| 2009(1) | ||||||||||||||||
| Fourth Quarter |
Third Quarter |
Second Quarter |
First Quarter |
|||||||||||||
| (In thousands, except per share data) | ||||||||||||||||
| Revenues |
||||||||||||||||
| Net interest income |
$ | 41,057 | $ | 39,717 | $ | 39,302 | $ | 39,409 | ||||||||
| Fees and other income |
42,364 | 26,523 | 26,941 | 30,620 | ||||||||||||
| Total revenues |
83,421 | 66,240 | 66,243 | 70,029 | ||||||||||||
| Provision for loan losses |
13,804 | 9,099 | 8,730 | 13,325 | ||||||||||||
| Operating expense |
57,739 | 55,936 | 57,657 | 51,626 | ||||||||||||
| Income/(loss) before income taxes |
11,878 | 1,205 | (144 | ) | 5,078 | |||||||||||
| Income tax expense/ (benefit) |
2 | 815 | (3 | ) | 818 | |||||||||||
| Net income/(loss) from discontinued operations |
31,501 | (30,614 | ) | (7,763 | ) | (629 | ) | |||||||||
| Less: Net income attributable to noncontrolling interests |
1,169 | 1,136 | 579 | 765 | ||||||||||||
| Net income/(loss) attributable to the Company(2) |
$ | 42,208 | $ | (31,360 | ) | $ | (8,483 | ) | $ | 2,866 | ||||||
| Net income/(loss) per share attributable to the Company’s common shareholders: |
||||||||||||||||
| Basic and diluted earnings/ (loss) per share |
$ | 0.42 | $ | (0.61 | ) | $ | (0.24 | ) | $ | (0.09 | ) | |||||
| 2008(1) | ||||||||||||||||
| Fourth Quarter |
Third Quarter |
Second Quarter |
First Quarter |
|||||||||||||
| (In thousands, except per share data) | ||||||||||||||||
| Revenues |
||||||||||||||||
| Net interest income |
$ | 37,842 | $ | 38,013 | $ | 38,636 | $ | 35,737 | ||||||||
| Fees and other income |
22,242 | 28,074 | 38,223 | 40,910 | ||||||||||||
| Total revenues |
60,084 | 66,087 | 76,859 | 76,647 | ||||||||||||
| Provision for loan losses |
15,709 | 135,145 | 30,804 | 14,986 | ||||||||||||
| Operating expense |
60,118 | 142,042 | 71,337 | 73,489 | ||||||||||||
| (Loss)/income before income taxes |
(15,743 | ) | (211,100 | ) | (25,282 | ) | (11,828 | ) | ||||||||
| Income tax (benefit)/expense |
(7,177 | ) | (59,297 | ) | (5,816 | ) | 1,553 | |||||||||
| Net (loss)/income from discontinued operations |
(16,045 | ) | (120,303 | ) | (59,817 | ) | 4,956 | |||||||||
| Less: Net income attributable to noncontrolling interests |
308 | 1,255 | 1,345 | 1,419 | ||||||||||||
| Net loss attributable to the Company(3) |
$ | (24,919 | ) | $ | (273,361 | ) | $ | (80,628 | ) | $ | (9,844 | ) | ||||
| Net loss per share attributable to the Company’s common shareholders: |
||||||||||||||||
| Basic and diluted loss per share |
$ | (0.47 | ) | $ | (5.92 | ) | $ | (2.11 | ) | $ | (0.26 | ) | ||||
| (1) | Due to rounding, the sum of the four quarters may not add to the year to date total. |
| (2) | Third quarter 2009 earnings include a $42.4 million pretax loss on sale of discontinued operations related to the divestiture of Gibraltar and RINET. Fourth quarter 2009 earnings include a $48.0 million pretax gain on sale of discontinued operations related to the divestiture of Westfield. See Part II. Item 8. “Financial Statements and Supplementary Data—Note 2: Divestitures and Acquisitions” for further details. |
| (3) | First quarter 2008 earnings include a $20.6 million non-deductible goodwill impairment charge. Second quarter 2008 earnings include a $17.4 million goodwill and intangibles impairment charge. Third quarter |
143
Table of Contents
NOTES TO CONSOLIDATED FINANCIAL STATEMENTS—(Continued)
| 2008 earnings include an $84.7 million goodwill and intangibles impairment charge, and a $135.1 million provision for loan losses. Fourth quarter 2008 earnings includes a $10.5 million goodwill and intangible impairment charge. See Part II. Item 8. “Financial Statements and Supplementary Data—Note 10: Goodwill and Other Intangible Assets and Note 7: Allowance for Loan Losses” for further details. |
| 26. | SUBSEQUENT EVENTS |
The Company evaluated subsequent events through the date the accompanying consolidated financial statements were issued, which was March 12, 2010. Pursuant to the requirements of ASC 855, there were no events or transactions during the subsequent event reporting period that required disclosure in the consolidated financial statements, other than the following items:
| • | On January 13, 2010, the Company redeemed $50.0 million of the Company’s outstanding $154.0 million in Series C Preferred stock that was issued to the Treasury pursuant to the TARP CPP in November of 2008. The Company paid approximately $50.4 million to the Treasury to repurchase the Series C Preferred, which included payment for accrued and unpaid dividends for the shares. |
| • | On January 20, 2010, the Company increased its investment in KLS to 100% from 81%. The acquisition of the remaining 19% interest of KLS was made pursuant to the Amended and Restated Limited Liability Agreement (“Agreement”) between the Company and KLS dated December 31, 2004. The consideration paid by the Company was approximately $29.7 million which represents the value of the additional 19% interest and additional consideration paid for performance targets negotiated in the original Agreement. |
144
Table of Contents
REPORT OF INDEPENDENT REGISTERED PUBLIC ACCOUNTING FIRM
The Board of Directors and Stockholders
Boston Private Financial Holdings, Inc.:
We have audited the accompanying consolidated balance sheets of Boston Private Financial Holdings, Inc. and subsidiaries (the “Company”) as of December 31, 2009 and 2008, and the related consolidated statements of operations, changes in stockholders’ equity, and cash flows for each of the years in the three-year period ended December 31, 2009. These consolidated financial statements are the responsibility of the Company’s management. Our responsibility is to express an opinion on these consolidated financial statements based on our audits. We did not audit the 2007 financial statements of Gibraltar Private Bank & Trust Company, a wholly-owned subsidiary, which statements reflect total revenues constituting 14.8 percent of the total revenue in 2007. Those statements were audited by other auditors whose report has been furnished to us, and our opinion, insofar as it relates to the amounts included for Gibraltar Private Bank & Trust Company for 2007 is based solely on the report of the other auditors.
We conducted our audits in accordance with the standards of the Public Company Accounting Oversight Board (United States). Those standards require that we plan and perform the audit to obtain reasonable assurance about whether the consolidated financial statements are free of material misstatement. An audit includes examining, on a test basis, evidence supporting the amounts and disclosures in the consolidated financial statements. An audit also includes assessing the accounting principles used and significant estimates made by management, as well as evaluating the overall financial statement presentation. We believe that our audits and the report of the other auditors provide a reasonable basis for our opinion.
In our opinion, based on our audits and the report of the other auditors, the consolidated financial statements referred to above present fairly, in all material respects, the financial position of Boston Private Financial Holdings, Inc. and subsidiaries as of December 31, 2009 and 2008, and the results of their operations and their cash flows for each of the years in the three-year period ended December 31, 2009, in conformity with U.S. generally accepted accounting principles.
As discussed in Note 15 to the consolidated financial statements, the Company has changed its method of accounting for noncontrolling interests in 2009 to comply with new accounting requirements issued by the Financial Accounting Standards Board.
We also have audited, in accordance with the standards of the Public Company Accounting Oversight Board (United States), the Company’s internal control over financial reporting as of December 31, 2009, based on criteria established in Internal Control—Integrated Framework issued by the Committee of Sponsoring Organizations of the Treadway Commission (COSO), and our report dated March 12, 2010 expressed an unqualified opinion on the effectiveness of the Company’s internal control over financial reporting.
/s/ KPMG LLP
Boston, Massachusetts
March 12, 2010
145
Table of Contents
REPORT OF INDEPENDENT REGISTERED PUBLIC ACCOUNTING FIRM
Gibraltar Private Bank & Trust Company
Coral Gables, Florida:
We have audited the consolidated statement of operations of Gibraltar Private Bank & Trust Company and Subsidiary (the “Bank”) for the year ended December 31, 2007, and the related changes in stockholders’ equity, and cash flows for the year then ended. These financial statements are the responsibility of the Bank’s management. Our responsibility is to express an opinion on these financial statements based on our audits.
We conducted our audit in accordance with the standards of the Public Company Accounting Oversight Board (United States). Those standards require that we plan and perform the audit to obtain reasonable assurance about whether the financial statements are free of material misstatement. An audit includes examining, on a test basis, evidence supporting the amounts and disclosures in the financial statements. An audit also includes assessing the accounting principles used and significant estimates made by management, as well as evaluating the overall financial statement presentation. We believe that our audit provides a reasonable basis for our opinion.
In our opinion, the consolidated financial statements referred to above present fairly, in all material respects, the results of operations of the Bank for the year ended December 31, 2007, and its cash flows for the year then ended, in conformity with U.S. generally accepted accounting principles.
/s/ Hacker, Johnson & Smith PA
Fort Lauderdale, Florida
February 26, 2008
146
Table of Contents
REPORT OF INDEPENDENT REGISTERED PUBLIC ACCOUNTING FIRM
The Board of Directors and Stockholders
Boston Private Financial Holdings, Inc.:
We have audited Boston Private Financial Holdings, Inc.’s (the “Company”) internal control over financial reporting as of December 31, 2009, based on criteria established in Internal Control-Integrated Framework issued by the Committee of Sponsoring Organizations of the Treadway Commission (“COSO”). The Company’s management is responsible for maintaining effective internal control over financial reporting and for its assessment of the effectiveness of internal control over financial reporting, included in the accompanying Management’s Report on Internal Control Over Financial Reporting. Our responsibility is to express an opinion on the Company’s internal control over financial reporting based on our audit.
We conducted our audit in accordance with the standards of the Public Company Accounting Oversight Board (United States). Those standards require that we plan and perform the audit to obtain reasonable assurance about whether effective internal control over financial reporting was maintained in all material respects. Our audit included obtaining an understanding of internal control over financial reporting, assessing the risk that a material weakness exists, and testing and evaluating the design and operating effectiveness of internal control based on the assessed risk. Our audit also included performing such other procedures as we considered necessary in the circumstances. We believe that our audit provides a reasonable basis for our opinion.
A company’s internal control over financial reporting is a process designed to provide reasonable assurance regarding the reliability of financial reporting and the preparation of financial statements for external purposes in accordance with generally accepted accounting principles. A company’s internal control over financial reporting includes those policies and procedures that (1) pertain to the maintenance of records that, in reasonable detail, accurately and fairly reflect the transactions and dispositions of the assets of the company; (2) provide reasonable assurance that transactions are recorded as necessary to permit preparation of financial statements in accordance with generally accepted accounting principles, and that receipts and expenditures of the company are being made only in accordance with authorizations of management and directors of the company; and (3) provide reasonable assurance regarding prevention or timely detection of unauthorized acquisition, use, or disposition of the company’s assets that could have a material effect on the financial statements.
Because of its inherent limitations, internal control over financial reporting may not prevent or detect misstatements. Also, projections of any evaluation of effectiveness to future periods are subject to the risk that controls may become inadequate because of changes in conditions, or that the degree of compliance with the policies or procedures may deteriorate.
In our opinion, the Company maintained, in all material respects, effective internal control over financial reporting as of December 31, 2009, based on criteria established in Internal Control—Integrated Framework issued by the Committee of Sponsoring Organizations of the Treadway Commission (“COSO”).
We also have audited, in accordance with the standards of the Public Company Accounting Oversight Board (United States), the consolidated balance sheets of the Company as of December 31, 2009 and 2008, and the related consolidated statements of operations, changes in stockholders’ equity, and cash flows for each of the years in the three-year period ended December 31, 2009, and our report dated March 12, 2010 expressed an unqualified opinion on those consolidated financial statements.
/s/ KPMG LLP
Boston, Massachusetts
March 12, 2010
147
Table of Contents
ITEM 9. CHANGES IN AND DISAGREEMENTS WITH ACCOUNTANTS ON ACCOUNTING AND FINANCIAL DISCLOSURE
None.
ITEM 9A. CONTROLS AND PROCEDURES.
A. Disclosure Controls and Procedures
As required by Rules 13a-15 and 15d-15 of the Securities Exchange Act of 1934, the Company has evaluated, with the participation of management, including the Chief Executive Officer, President, and the Chief Financial Officer, as of the end of the period covered by this report, the effectiveness of the design and operation of its disclosure controls and procedures.
Based on such evaluation, the Chief Executive Officer and Chief Financial Officer have concluded that such disclosure controls and procedures were effective as of December 31, 2009 in ensuring that material information required to be disclosed by the Company, including its consolidated subsidiaries:
| a. | was made known to the certifying officers by others within the Company and its consolidated subsidiaries in the reports that it files or submits under the Exchange Act; and |
| b. | is recorded, processed, summarized, and reported within the time periods specified in the Securities Exchange Commission rules and forms. |
On a quarterly basis, the Company evaluates the disclosure controls and procedures, and may from time to time make changes aimed at enhancing their effectiveness and to ensure that the Company’s systems evolve with its business.
B. Management’s Report on Internal Control Over Financial Reporting
The management of the Company is responsible for establishing and maintaining adequate internal control over financial reporting. The Company’s internal control over financial reporting is a process designed to provide reasonable assurance to the Company’s management and Board of Directors regarding the reliability and preparation of published financial statements in accordance with accounting principles generally accepted in the U.S.
In designing and evaluating the Company’s disclosure controls and procedures, the Company and its management recognize that any controls and procedures, no matter how well designed and operated, can provide only a reasonable assurance of achieving the desired control objectives, and management necessarily was required to apply its judgment in evaluating and implementing possible controls and procedures. Therefore, even those systems determined to be effective can provide only reasonable assurance with respect to financial statement preparation and presentation and may not prevent or detect misstatements. Also, projections of any evaluation of effectiveness to future periods are subject to the risk that controls may become inadequate because of changes in conditions, or that the degree of compliance with the policies or procedures may deteriorate.
The Company’s management assessed the effectiveness of the Company’s internal control over financial reporting as of December 31, 2009. In making this assessment, the Company used the criteria set forth in Internal Control—Integrated Framework issued by the Committee of Sponsoring Organizations of the Treadway Commission (“COSO”). Based on management’s assessment, the Company believes that, as of December 31, 2009, the Company’s internal control over financial reporting is effective based on the criteria established by COSO.
148
Table of Contents
KPMG LLP, the independent registered public accounting firm that reported on the Company’s consolidated financial statements, has issued an audit report on the effectiveness of the Company’s internal control over financial reporting as of December 31, 2009. This report can be found on page 147.
C. Changes in Internal Controls over Financial Reporting
There have been no changes in the Company’s internal controls over financial reporting that have materially affected, or are reasonably likely to materially affect, the Company’s internal controls over financial reporting in 2009.
None.
149
Table of Contents
ITEM 10. DIRECTORS, EXECUTIVE OFFICERS AND CORPORATE GOVERNANCE
Information with respect to Directors and Executive Officers required by Item 10 shall be included in the Proxy Statement and is incorporated herein by reference.
ITEM 11. EXECUTIVE COMPENSATION
Information with respect to executive compensation required by Item 11 shall be included in the Proxy Statement and is incorporated herein by reference.
ITEM 12. SECURITY OWNERSHIP OF CERTAIN BENEFICIAL OWNERS AND MANAGEMENT AND RELATED STOCKHOLDER MATTERS
Information with respect to security ownership and the other matters required by Item 12 shall be included in the Proxy Statement and is incorporated herein by reference.
ITEM 13. CERTAIN RELATIONSHIPS AND RELATED TRANSACTIONS, AND DIRECTOR INDEPENDENCE
Information with respect to certain relationships and related transactions required by Item 13 shall be included in the Proxy Statement and is incorporated herein by reference.
ITEM 14. PRINCIPAL ACCOUNTING FEES AND SERVICES
Information with respect to principal accountant fees and services required by Item 14 shall be included in the Proxy Statement and is incorporated herein by reference.
ITEM 15. EXHIBITS AND FINANCIAL STATEMENT SCHEDULES.
Financial Statements and Exhibits
1. Financial Statements
| Page No. | ||
| 71 | ||
| 72 | ||
| c) Consolidated Statements of Changes in Stockholders’ Equity |
73 | |
| 75 | ||
| 77 |
150
Table of Contents
2. Financial Schedules
None
3. Exhibits
| Exhibit No. |
Description |
Incorporated by Reference | ||||||||
| Form | SEC Filing Date |
Exhibit Number |
Filed with this 10-K | |||||||
| 3.1 | Restated Articles of Organization of Boston Private Financial Holdings, Inc. filed May 23, 1994. | 10-Q | 8/14/2001 | 3.1 | ||||||
| 3.2 | Articles of Amendment of Boston Private Financial Holdings, Inc. filed on April 22, 1998. | 10-Q | 8/14/2001 | 3.2 | ||||||
| 3.3 | Articles of Amendment of Boston Private Financial Holdings, Inc. filed on November 20, 2001. | S-8 | 11/28/2001 | 4.3 | ||||||
| 3.4 | Articles of Amendment of Boston Private Financial Holdings, Inc. filed on August 8, 2008 | 8-K | 8/11/2008 | 3.1 | ||||||
| 3.5 | Articles of Amendment of Boston Private Financial Holdings, Inc. filed on September 30, 2008 | 10-Q | 11/7/2008 | 3.2 | ||||||
| 3.6 | Articles of Amendment of Boston Private Financial Holdings, Inc. filed on November 19, 2008 | 8-K | 11/24/2008 | 3.2 | ||||||
| 3.7 | By-laws of Boston Private Financial Holdings, Inc., as amended and restated. | 8-K | 6/6/2007 | 99.1 | ||||||
| 10.1 | Employee Incentive Stock Option Plan of Boston Private Financial Holdings, Inc. | S-1 | 4/1/1991 | 10.1 | ||||||
| 10.2 | Employee Incentive Compensation Plan of Boston Private Financial Holdings, Inc. | S-1 | 4/1/1991 | 10.2 | ||||||
| 10.3 | Amended and Restated Commercial Lease dated June 30, 2004, by and between Boston Private Financial Holdings, Inc. and Leggat McCall Properties Management, Inc., as amended | X | ||||||||
| 10.4 | Change in Control Protection Agreement, by and between Boston Private Financial Holdings, Inc. and Walter M. Pressey, effective as of March 19, 1997 | 10-K | 3/13/2002 | 10.13 | ||||||
| 10.5 | Boston Private Financial Holdings, Inc. Deferred Compensation Plan | S-8 | 7/24/2001 | 4.1 | ||||||
| 10.6 | Boston Private Financial Holdings, Inc. 2001 Employee Stock Purchase Plan | S-8 | 11/28/2001 | 99.2 | ||||||
| 10.7 | Boston Private Financial Holdings, Inc. Amended and Restated 1997 Long-Term Incentive Plan | 10-K | 3/13/2002 | 10.16 | ||||||
| 10.8 | Borel Private Bank & Trust Company 1998 Stock Option Plan | S-8 | 12/3/2001 | 99.1 | ||||||
| 10.9 | 1998 Amendment and Restatement of Directors’ Stock Option Plan of Boston Private Financial Holdings, Inc., as amended February 7, 2003 | 10-K | 3/12/2004 | 10.21 | ||||||
151
Table of Contents
| Exhibit No. |
Description |
Incorporated by Reference | ||||||||
| Form | SEC Filing Date |
Exhibit Number |
Filed with this 10-K | |||||||
| 10.10 | January 2000 Amendment to Boston Private Financial Holdings, Inc. Directors’ Stock Option Plan | 10-K | 3/13/2002 | 10.20 | ||||||
| 10.11 | February 2003 Amendment to Boston Private Financial Holdings, Inc. Directors’ Stock Option Plan | 10-K | 3/7/2003 | 10.22 | ||||||
| 10.12 | Boston Private Financial Holdings, Inc. 401(k) Profit-Sharing Plan | S-8 | 6/28/2002 | N/A | ||||||
| 10.13 | Change in Control Protection Agreement by and between Boston Private Financial Holdings, Inc. and Margaret W. Chambers dated November 21, 2003 | 10-K | 3/15/2005 | 10.24 | ||||||
| 10.14 | Amended and Restated Employment Agreement, dated December 18, 2008, by and between Boston Private Financial Holdings, Inc. and Timothy L. Vaill | 8-K | 12/23/2008 | 10.1 | ||||||
| 10.15 | Amended and Restated Supplemental Executive Retirement Agreement, dated December 18, 2008, by and between Boston Private Financial Holdings, Inc. and Timothy L. Vaill | 8-K | 12/23/2008 | 10.2 | ||||||
| 10.16 | Boston Private Financial Holdings, Inc. 2004 Stock Option and Incentive Plan | S-8 | 6/15/2004 | N/A | ||||||
| 10.17 | Indenture dated October 12, 2004 between Boston Private Financial Holdings, Inc. and Sun Trust Bank, as debenture trustee | 8-K | 10/15/2004 | 10.1 | ||||||
| 10.18 | Guarantee Agreement dated as of October 19, 2004 by Boston Private Financial Holdings, Inc. and Sun Trust Bank, as trustee, for the benefit of the holders from time to time of the Trust Preferred Securities and Trust Common Securities of Boston Private Capital Trust I | 8-K | 10/15/2004 | 10.2 | ||||||
| 10.19 | First Private Bank & Trust 1994 Stock Option Plan | S-8 | 3/5/2004 | N/A | ||||||
| 10.20 | Non-Solicitation/Non-Accept and Confidentiality Agreement and Release and Change in Control Protection Agreement by and between Boston Private Financial Holdings, Inc. and Joseph H. Cromarty dated March 1, 2005 | 8-K | 3/7/2005 | 10.1 and 10.2 |
||||||
| 10.21 | Indenture dated September 27, 2005 between Boston Private Financial Holdings, Inc. and Wilmington Trust Company, as debenture trustee | 8-K | 9/30/2005 | 10.1 | ||||||
| 10.22 | Guarantee Agreement dated as of September 27, 2005 by Boston Private Financial Holdings, Inc. and Wilmington Trust Company, as trustee, for the benefit of the holders from time to time of the Capital Securities of Boston Private Capital Trust II | 8-K | 9/30/2005 | 10.2 | ||||||
| 10.23 | Amended and Restated Declaration of Trust of Boston Private Capital Trust II dated September 27, 2005 | 8-K | 9/30/2005 | 10.3 | ||||||
152
Table of Contents
| Exhibit No. |
Description |
Incorporated by Reference | ||||||||
| Form | SEC Filing Date |
Exhibit Number |
Filed with this 10-K | |||||||
| 10.24 | Forms of award grant agreements under the Company’s 2004 Stock Option and Incentive Plan | 8-K | 12/20/2006 | 10.1, 10.2 and 10.3 |
||||||
| 10.25 | Indenture, dated March 14, 2007, between Boston Private, Inc. and U.S. Bank, National Association, as Trustee | 8-K | 7/9/2007 | 4.1 | ||||||
| 10.26 | Registration Rights Agreement, dated July 5, 2007, between Boston Private, Inc. and the Initial Purchasers | 8-K | 7/9/2007 | 4.3 | ||||||
| 10.27 | Recapitalization Agreement, dated March 19, 2008, by and among Boston Private Financial Holdings, Inc., Westfield Capital Management Company, LLC, Westfield Capital Management, LP, WMS Management LLC and WCM General Partner LLC | 8-K | 3/26/2008 | 99.1 | ||||||
| 10.28 | Investment Agreement, dated July 22, 2008, between Boston Private Financial Holdings, Inc. and the investor party thereto | 8-K | 7/24/2008 | 10.1 | ||||||
| 10.29 | Warrant Agreement, dated July 22, 2008, between Boston Private Financial Holdings, Inc. and the investor party thereto | 8-K | 7/24/2008 | 10.2 | ||||||
| 10.30 | Letter Agreement, dated November 21, 2008, between Boston Private Financial Holdings, Inc. and the United States Department of the Treasury | 8-K | 11/24/2008 | 10.1 | ||||||
| 10.31 | Warrant for Purchase of Shares of Common Stock, dated November 21, 2008, between Boston Private Financial Holdings, Inc. and the United States Department of the Treasury | 8-K | 11/24/2008 | 4.2 | ||||||
| 10.32 | Form of Waiver of Senior Officers, dated November 21, 2008 | 8-K | 11/24/2008 | 10.2 | ||||||
| 10.33 | Change in Control Protection Agreement by and between Boston Private Financial Holdings, Inc. and James D. Dawson dated January 28, 2009 | 8-K | 1/28/2009 | 10.1 | ||||||
| 10.34 | Change in Control Protection Agreement by and between Boston Private Financial Holdings, Inc. and David J. Kaye dated January 28, 2009 | 8-K | 1/28/2009 | 10.2 | ||||||
| 10.35 | Change in Control Protection Agreement by and between Boston Private Financial Holdings, Inc. and Martha T. Higgins dated January 28, 2009 | 8-K | 1/28/2009 | 10.3 | ||||||
| 10.36 | Boston Private Financial Holdings, Inc. Executive Bonus Plan | 8-K | 1/28/2009 | 10.4 | ||||||
| 10.37 | Form of Non-Qualified Stock Option Agreement for Employees Under the Boston Private Financial Holdings, Inc. 2009 Stock Option and Incentive Plan | 10-Q | 8/7/2009 | 10.2 | ||||||
153
Table of Contents
| Exhibit No. |
Description |
Incorporated by Reference | ||||||||
| Form | SEC Filing Date |
Exhibit Number |
Filed with this 10-K | |||||||
| 10.38 | Form of Restricted Stock Award Agreement Under the Boston Private Financial Holdings, Inc. 2009 Stock Option and Incentive Plan | 10-Q | 8/7/2009 | 10.3 | ||||||
| 10.39 | Stock Purchase Agreement by and among Boston Private Financial Holdings, Inc. Gibraltar Private Bank and Trust Company, and Buyers dated September 17, 2009 | 8-K | 9/17/2009 | 10.1 | ||||||
| 10.40 | Redemption Agreement by and among Boston Private Financial Holdings, Inc., BPFH Manager, L.L.C., Westfield Capital Management Company, L.P. and WMS General Partner LLC dated October 6, 2009 | 8-K | 10/7/2009 | 10.1 | ||||||
| 10.41 | Change in Control Protection Agreement by and between Boston Private Financial Holdings, Inc. and George L. Alexakos dated October 27, 2009 | 8-K | 10/28/2009 | 10.1 | ||||||
| 10.42 | Letter Agreement by and between Boston Private Financial Holdings, Inc. and David J. Kaye, dated July 3, 2007 | 10-Q | 11/6/2009 | 10.1 | ||||||
| 10.43 | Amendment No. 1 to Investment Agreement by and among Boston Private Financial Holdings, Inc. and BP Holdco, L.P., dated December 15, 2009 | 8-K | 12/18/2009 | 10.1 | ||||||
| 10.44 | Boston Private Financial Holdings, Inc. Deferred Compensation Plan, As Amended and Restated as of January 1, 2009 | X | ||||||||
| 21.1 | List of Subsidiaries of Boston Private Financial Holdings, Inc. | X | ||||||||
| 23.1 | Consent of KPMG, LLP | X | ||||||||
| 23.2 | Consent of Hacker, Johnson & Smith PA | X | ||||||||
| 31.1 | Certification of Chief Executive Officer pursuant to Rule 13a - 14(a)/15d - 14(a) under the Securities Exchange Act of 1934 | X | ||||||||
| 31.2 | Certification of Chief Financial Officer pursuant to Rule 13a - 14(a)/15d - 14(a) under the Securities Exchange Act of 1934 | X | ||||||||
| 32.1 | Certification of the Chief Executive Officer pursuant to 18 U.S.C. 1350, as adopted pursuant to Section 906 of the Sarbanes-Oxley Act of 2002 | X | ||||||||
| 32.2 | Certification of the Chief Financial Officer pursuant to 18 U.S.C. 1350, as adopted pursuant to Section 906 of the Sarbanes-Oxley Act of 2002 | X | ||||||||
| 99.1 | Certification pursuant to Section 111(b)(4) of the Emergency Economic Stabilization Act of 2008, as amended | X | ||||||||
154
Table of Contents
Pursuant to the requirements of Section 13 or 15 (d) of the Securities Exchange Act of 1934, the registrant has duly caused this report to be signed on its behalf by the undersigned, thereunto duly authorized on this 12th day of March, 2010.
| BOSTON PRIVATE FINANCIAL HOLDINGS, INC. | ||
| By: |
/s/ TIMOTHY L. VAILL | |
| Timothy L. Vaill | ||
| Chief Executive Officer (Principal Executive Officer) | ||
Pursuant to the requirements of the Securities Exchange Act of 1934, this report has been signed below by the following persons on behalf of the registrant in the capacities indicated.
| /s/ TIMOTHY L. VAILL Timothy L. Vaill |
Chairman of the Board and Chief Executive Officer |
March 12, 2010 | ||
| /s/ WALTER M. PRESSEY Walter M. Pressey |
President and Vice Chairman |
March 12, 2010 | ||
| /s/ DAVID J. KAYE David J. Kaye |
Executive Vice President and Chief Financial Officer |
March 12, 2010 | ||
| /s/ WILLIAM A. GRATRIX William A. Gratrix |
Senior Vice President and Controller (Principal Accounting Officer) |
March 12, 2010 | ||
| /s/ HERBERT S. ALEXANDER Herbert S. Alexander |
Director |
March 12, 2010 | ||
| /s/ EUGENE S. COLANGELO Eugene S. Colangelo |
Director |
March 12, 2010 | ||
| /s/ KATHLEEN M. GRAVELINE Kathleen M. Graveline |
Director |
March 12, 2010 | ||
| /s/ ADOLFO HENRIQUES Adolfo Henriques |
Director |
March 12, 2010 | ||
| /s/ LYNN THOMPSON HOFFMAN Lynn Thompson Hoffman |
Director |
March 12, 2010 | ||
| /s/ DEBORAH F. KEUNSTNER Deborah F. Keunstner |
Director |
March 12, 2010 | ||
| /s/ JOHN MORTON, III John Morton, III |
Director |
March 12, 2010 | ||
| /s/ WILLIAM J. SHEA William J. Shea |
Director |
March 12, 2010 | ||
| /s/ DR. ALLEN L. SINAI Dr. Allen L. Sinai |
Director |
March 12, 2010 | ||
| /s/ STEPHEN M. WATERS Stephen M. Waters |
Director |
March 12, 2010 | ||
155