Attached files
UNITED STATES
SECURITIES AND EXCHANGE COMMISSION
Washington, D.C. 20549
FORM 10-K
(Mark One)
|
T
|
ANNUAL REPORT PURSUANT TO SECTION 13 OR 15(d) OF THE SECURITIES EXCHANGE ACT OF 1934
|
For the fiscal year ended December 31, 2009
OR
|
£
|
TRANSITION REPORT PURSUANT TO SECTION 13 OR 15(d) OF THE SECURITIES EXCHANGE ACT OF 1934
|
For the transition period from to
Commission file number 0-8933
APCO OIL AND GAS INTERNATIONAL INC.
(Exact Name of Registrant as Specified in its Charter)
|
Cayman Islands
|
98-0199453
|
|
(State or Other Jurisdiction of Incorporation or Organization)
|
(IRS Employer Identification No.)
|
|
One Williams Center, Mail Drop 35
|
|
|
Tulsa, Oklahoma
|
74172
|
|
(Address of Principal Executive Offices)
|
(Zip Code)
|
Registrant’s Telephone Number, Including Area Code: (918) 573-2164
Securities registered pursuant to Section 12(b) of the Act:
|
Title of Each Class
|
Name of Each Exchange on Which Registered
|
|
Ordinary Shares $.01 Par Value
|
The NASDAQ Stock Market
|
|
(The NASDAQ Capital Market)
|
Securities registered pursuant to Section 12(g) of the Act:
None
Indicate by check mark whether the registrant is a well-known seasoned issuer, as defined in Rule 405 of the Securities Act.
Yes £ No T
Indicate by check mark if the registrant is not required to file reports pursuant to Section 13 or Section 15(d) of the Act.
Yes £ No T
Indicate by check mark whether the registrant (1) has filed all reports required to be filed by Section 13 or 15(d) of the Securities Exchange Act of 1934 during the preceding 12 months (or for such shorter period that the registrant was required to file such reports), and (2) has been subject to such filing requirements for the past 90 days. Yes T No £
Indicate by check mark whether the registrant has submitted electronically and posted on its corporate Web site, if any, every Interactive Data File required to be submitted and posted pursuant to Rule 405 of Regulation S-T (§232.405 of this chapter) during the preceding 12 months (or for such shorter period that the registrant was required to submit and post such files). Yes o No o
Indicate by check mark if disclosure of delinquent filers pursuant to Item 405 of Regulation S-K is not contained herein, and will not be contained, to the best of registrant’s knowledge, in definitive proxy or information statements incorporated by reference in Part III of this Form 10-K or any amendment to this Form 10-K. T
Indicate by check mark whether the registrant is a large accelerated filer, an accelerated filer, a non-accelerated filer, or a smaller reporting company. See the definitions of “large accelerated filer,” “accelerated filer” and “smaller reporting company” in Rule 12b-2 of the Exchange Act.
Large Accelerated Filer £ Accelerated Filer T Non-Accelerated Filer £ Smaller reporting company £
(Do not check if a smaller reporting company)
Indicate by check mark whether the registrant is a shell company (as defined in Rule 12b-2 of the Exchange Act).
Yes £ No T
The aggregate market value of the voting and non-voting common equity of the registrant held by non-affiliates on June 30, 2009, the last business day of the registrant’s most recently completed second fiscal quarter, was $175,755,431. This value was computed by reference to the closing price of the registrant’s shares on such date. Since the registrant’s shares trade sporadically in The NASDAQ Capital Market, the bid and asked prices and the aggregate market value of shares held by non-affiliates based thereon may not necessarily be representative of the actual market value. Please read Item 5 for more information.
As of March 3, 2010 there were 29,441,240 shares of the registrant’s ordinary shares outstanding.
Documents Incorporated By Reference
List hereunder the following documents if incorporated by reference and the part of the Form 10-K (e.g., Part I, Part II, etc.) into which the document is incorporated:
None
APCO OIL AND GAS INTERNATIONAL INC.
FORM 10-K
TABLE OF CONTENTS
| PART I | ||
|
Page No.
|
||
|
Items 1 and 2.
|
1
|
|
|
Item 1A.
|
17
|
|
|
17
|
||
|
Item 1B.
|
29
|
|
|
Item 3.
|
29
|
|
|
Item 4.
|
29
|
|
| PART II | ||
|
Item 5.
|
30
|
|
|
Item 6.
|
32
|
|
|
Item 7.
|
32
|
|
|
Item 7A.
|
47
|
|
|
Item 8.
|
50
|
|
|
Item 9.
|
80
|
|
|
Item 9A.
|
80
|
|
|
Item 9B.
|
80
|
|
| PART III | ||
|
Item 10.
|
81
|
|
|
Item 11.
|
84
|
|
|
Item 12.
|
87
|
|
|
Item 13.
|
90
|
|
|
Item 14.
|
92
|
|
| PART IV | ||
|
Item 15.
|
93
|
|
DEFINITIONS
We use the following oil and gas measurements and abbreviations in this report:
- “Bbl” means barrel, or 42 gallons of liquid volume, “MBbls” means thousand barrels, and “MMBls” means million barrels.
- “MBbls/day” means thousand barrels per day.
- “Mcf” means thousand cubic feet, “MMcf” means million cubic feet, and “Bcf” means billion cubic feet.
- “Mcf/d” means thousand cubic feet per day.
- “BOE” means barrel of oil equivalent, a unit of measure used to express all of the Company’s products in one unit of measure based on choleric equivalency of the three products; one barrel of oil is equal to one barrel of oil equivalent, six mcf of gas are equal to one barrel of oil equivalent, and one ton of LPG is equivalent to 11.735 barrels of oil equivalent.
- “MBOE” means thousand barrels of oil equivalent, and “MMBOE” means million barrels of oil equivalent.
- “LPG” means liquefied petroleum gas. More specifically in this report, the Company produces propane and butane at its LPG plant; LPG may also be referred to as plant products.
- “Metric ton” means a unit of mass equal to 1,000 kilograms (2,205 pounds); as used in this report, a metric ton is equal to 11.735 barrels of oil equivalent.
- “2D” means two dimensional seismic imaging of the sub surface.
- “3D” means three dimensional seismic imaging of the sub surface.
- “WTI” means West Texas Intermediate crude oil, a type of crude oil used as a reference for prices of crude oil sold in Argentina.
PART I
ITEM I and 2. BUSINESS AND PROPERTIES
(a) General Development of Business
Apco Oil and Gas International Inc. (formerly Apco Argentina Inc.) is a Cayman Islands company organized on April 6, 1979 as a successor to Apco Argentina Inc., a Delaware corporation organized on July 1, 1970. References in this report to “we,” “us,” “our,” “Apco,” or the “Company” refer to Apco Oil and Gas International Inc. and its consolidated subsidiaries and, unless the context indicates otherwise, its proportionately consolidated interests in various joint ventures.
Apco is an international oil and gas exploration and production company with a focus on South America. Exploration and production will be referred to as “E&P” in this document. Apco began E&P activities in Argentina in the late 1960s, and as of December 31, 2009, had interests in nine oil and gas producing concessions and one exploration permit in Argentina, and two exploration and production contracts in Colombia.
The Williams Companies, Inc. (“Williams”) indirectly owns 68.96 percent of our outstanding ordinary shares. Please read “Security Ownership of Certain Beneficial Owners and Management and Related Shareholder Matters.” Our executive officers are employees of Williams and some of our directors are employees of Williams. In addition, pursuant to an administrative services agreement, Williams provides certain other services to us, such as risk management, internal audit services, and, for our headquarters office in Tulsa, Oklahoma, office supplies, office space and computer support. Please read “Certain Relationships and Related Party Transactions, and Director Independence — Transactions with Related Persons — Administrative Services Agreement.”
(b) Financial Information About Segments
We treat all operations as one operating segment.
(c) Narrative Description of Business
Our business model is to create strategic partnerships to share risk and gain operational efficiencies in the exploration, development and production of oil and natural gas. We have historically acquired non-operating interests in the producing properties in which we participate.
Although we place great reliance on our operating partners because we generally have non-operating interests, Apco actively participates in the management of our sub-surface resources and reservoirs. Our branch office in Buenos Aires includes technical, administration and accounting staff which obtains operational and financial data from our joint venture operators that is used to monitor operations. Our technical staff continuously analyzes and evaluates subsurface data and reservoir performance, provides technical assistance to our joint venture operators, makes recommendations regarding field development and reservoir management, and calculates our estimates of reserves. When deemed strategically appropriate, we have occasionally chosen to operate properties that are exploratory in nature and are prepared to operate producing properties given the right opportunity.
In Argentina, we are active in four of the five principal producing basins in the country. Our core assets are located in the Neuquén basin in the provinces of Río Negro and Neuquén in southwestern Argentina, where Apco has been active for more than 40 years. In 2009, we expanded our E&P activities into Colombia through two farm-in agreements.
In general, we conduct our E&P operations in our concessions through participation in various joint venture partnerships. We also have a significant equity interest in combination with our direct working interest in our core properties. The following table details the areas and basins where we have E&P operations and our respective direct working and equity interests in those areas:
| Interest | ||||||||||||||||||
|
Area
|
Basin
|
Province
|
Country
|
Working
|
Equity (1)
|
Combined
|
||||||||||||
|
Entre Lomas
|
Neuquén
|
Neuquén / Río Negro
|
Argentina
|
23.00 | % | 29.85 | % | 52.85 | % | |||||||||
|
Bajada del Palo
|
Neuquén
|
Neuquén
|
Argentina
|
23.00 | % | 29.85 | % | 52.85 | % | |||||||||
|
Charco del Palenque
|
Neuquén
|
Río Negro
|
Argentina
|
23.00 | % | 29.85 | % | 52.85 | % | |||||||||
|
Agua Amarga
|
Neuquén
|
Río Negro
|
Argentina
|
23.00 | % | 29.85 | % | 52.85 | % | |||||||||
|
Acambuco
|
Northwest
|
Salta
|
Argentina
|
1.50 | % | - | ||||||||||||
|
Río Cullen
|
Austral
|
Tierra del Fuego
|
Argentina
|
25.78 | % | - | ||||||||||||
|
Las Violetas
|
Austral
|
Tierra del Fuego
|
Argentina
|
25.78 | % | - | ||||||||||||
|
Angostura
|
Austral
|
Tierra del Fuego
|
Argentina
|
25.78 | % | - | ||||||||||||
|
Sur Río Deseado Este
|
San Jorge
|
Santa Cruz
|
Argentina
|
16.94 | % | - | ||||||||||||
|
Cañadón Ramirez
|
San Jorge
|
Chubut
|
Argentina
|
41.73 | % | - | ||||||||||||
|
Llanos 32
|
Llanos
|
Casanare
|
Colombia
|
20.00 | % | - | ||||||||||||
|
Turpial
|
Middle Magdalena
|
Boyaca / Antioquia
|
Colombia
|
50.00 | % | - | ||||||||||||
|
|
(1)
|
In addition to our direct working interests in the Entre Lomas, Bajada del Palo, Agua Amarga and Charco del Palenque blocks, Apco and its subsidiaries own 40.803 percent of the shares of Petrolera Entre Lomas S.A. (“Petrolera”) which holds a 73.15 percent direct working interest in the areas, resulting in a 29.85 percent equity interest for Apco. Consequently, Apco’s combined direct working interest and equity interest in the four areas totals 52.85 percent. We refer to these properties in a group as our “Neuquén basin properties.”
|
In 2009, we executed agreements formally transferring to Apco a previously earned interest in the Sur Rio Deseado Este concession in the San Jorge basin. We relinquished approximately one half of the area in the Cañadón Ramirez concession at the end of 2009.
Oil and Gas Producing Activities
All of our production and reserves are currently located in Argentina. Our core properties in the Neuquén basin predominantly produce crude oil and associated natural gas. Our other properties in the Northwest and Austral basins predominantly produce natural gas and condensate. On a barrel of oil equivalent basis, 60 percent of our combined consolidated and equity proved reserves are oil and condensate and 40 percent are natural gas as of December 31, 2009.
Our current portfolio of reserves provides us with strong capital investment opportunities for several years into the future. Our goal is to drill existing proved undeveloped reserves, which comprise 37 percent of our total proved reserves, and also drill in unproven areas as a result of exploration and/or field extension drilling to add to our proved reserves and replace as much of the current year’s production as possible. In recent years, we have complemented our development projects in Argentina by increasing exploration activities and this year by adding exploration blocks in Colombia.
On January 14, 2009, the SEC issued the Final Rule for Modernization of Oil and Gas Reporting which modifies how oil and gas companies report reserves estimates. These changes included an expanded definition of oil and gas reserves supported by reliable technologies used for reserves estimation, using the 12-month average, first-of-the-month price instead of a single-day, period-end price for estimated reserves for SEC disclosure, and certain additional disclosures around proved undeveloped reserves, internal controls used to ensure objectivity of the estimation process, and qualifications of those preparing and/or auditing the reserves. Apco adopted the revised SEC oil and gas reporting requirements, effective as of December 31, 2009. The new rules and expanded definitions of oil and gas reserves supported by reliable technologies and practices have not had a material impact on our current estimate of reserves.
Oil and Natural Gas Reserves
Summary of Proved Oil and Natural Gas Reserves as of December 31, 2009
Based on Average 2009 Prices and Costs
|
Oil (Mbbls) (1)
|
Natural Gas (Bcf) (2)
|
Total Proved (Mboe) (3)
|
||||||||||||||||||||||||||||||||||
|
Interests
|
Interests
|
Interests
|
||||||||||||||||||||||||||||||||||
|
Consolidated
|
Equity
|
Combined
|
Consolidated
|
Equity
|
Combined
|
Consolidated
|
Equity
|
Combined
|
||||||||||||||||||||||||||||
|
Proved Developed
|
7,526 | 8,521 | 16,047 | 44.0 | 23.0 | 67.0 | 14,854 | 12,363 | 27,217 | |||||||||||||||||||||||||||
|
Proved Undeveloped
|
4,419 | 5,313 | 9,732 | 23.8 | 13.1 | 36.9 | 8,394 | 7,491 | 15,885 | |||||||||||||||||||||||||||
|
Total Proved (4)
|
11,945 | 13,834 | 25,779 | 67.8 | 36.1 | 103.9 | 23,248 | 19,854 | 43,102 | |||||||||||||||||||||||||||
|
|
(1)
|
Volumes presented in the above table have not been reduced by the approximately 12 percent provincial production tax that is paid separately and is accounted for as an expense by Apco. For natural gas, the provincial production tax is paid on volumes sold to customers, but not on natural gas consumed in operations.
|
|
|
(2)
|
A portion of our natural gas reserves are consumed in field operations. The volume of natural gas reserves for 2009 estimated to be consumed in field operations included as proved natural gas reserves within our consolidated interests are13.8 Bcf and 14.3 Bcf for our equity interests, or an oil-equivalent combined amount of 4,700 Mboe.
|
|
|
(3)
|
Natural gas is converted to oil-equivalent at six Bcf to one million barrels.
|
|
|
(4)
|
All of our reserves are in Argentina.
|
Preparation of Reserves Estimates
Our engineering staff in our office in Buenos Aires provides reserves modeling and production forecasts for our concessions. The finance and accounting department provides supporting information such as pricing, costs, tax rates and other information pertinent to developing our discounted cash flows. The entire reserves process is coordinated by management in our head office. Our reserves analysis also includes working closely with joint venture operators to coordinate future investment plans; contracting with a third-party consultant to complete the independent review; ensuring internal controls are appropriate and making any changes required; performing internal overview of data for reasonableness and accuracy; and the final preparation of the year-end reserves report.
Preparing Apco’s year-end reserves is a formal process. It begins soon after finalizing year-end reserves with a review of the existing process to identify where improvements can be made. Usually in early summer of each year, the internal controls, as they relate to the year-end reserves, are reviewed and updated. Typically in late summer, our reserves engineering and geological technical staff, management, and the third-party engineering consultants meet to begin coordinating the year-end process and review. Throughout the third quarter, the reserves staff, third-party engineering consultants, and joint venture operators exchange data and interpretations to finish year-end reserves estimations. During the fourth quarter, forecasts, interpretations, maps and preliminary estimates of reserves are reviewed with upper management for their comment.
Approximately 93 percent of our total year-end 2009 proved reserves estimates were audited by Ralph E. Davis Associates, Inc. (“Davis”). When compared on a well-by-well basis, some of our estimates were greater and some were less than the estimates of Davis. Any differences were discussed and resolved. In the opinion of Davis, the estimates of our proved reserves are in the aggregate reasonable by basin and total and have been prepared in accordance with generally accepted petroleum engineering and evaluation principles. These principles are set forth in the Standards Pertaining to the Estimating and Auditing of Oil and Gas Reserves Information promulgated by the Society of Petroleum Engineers. Davis is satisfied with our methods and procedures in preparing the December 31, 2009 reserves estimates and saw nothing of an unusual nature that would cause Davis to take exception with the estimates, in the aggregate, as prepared by us. Reserves estimates related to our properties in the Northwest basin of Argentina represent approximately seven percent of our total proved reserves and were audited by RPS Energy. These reports are included as exhibits to this Form 10-K.
The engineer primarily responsible for overseeing preparation of the reserves estimates and the third party reserves audit is our Manager of Engineering. The Manager’s qualifications include over 20 years of reserves evaluation experience, a PHD in Petroleum Engineering from the University of New Mexico at Socorro, New Mexico and a B.S. in Petroleum Engineering from the University of Buenos Aires, Argentina.
Proved Undeveloped Reserves
Apco’s proved undeveloped reserves for its combined interests as of December 31, 2009, are 15.9 Mmboe, an increase from 11.2 Mmboe as of December 31, 2008. The largest component of the increase is successful development and exploration drilling, with a significant contribution from obtaining ten-year concession extensions on certain of our Neuquén basin properties. All locations comprising our remaining proved undeveloped reserves are forecast to be drilled by 2014; 26 percent of these locations are expected to be drilled in 2010. For many years, Apco has enjoyed a track record of success converting proved undeveloped reserves to proved producing reserves as we have drilled and put on production undeveloped locations, including both step-out and in-fill wells, with a greater than 90 percent success rate. Historically, all of our drilling investments have been financed by internally generated cash flows and cash reserves. During 2009, 1.7 Mmboe, or 15 percent of our net proved undeveloped reserves as of December 31, 2008, were converted to proved developed reserves.
Oil and Natural Gas Properties, Wells, Operations, and Acreage
The following table sets forth our productive oil and gas wells and our developed acreage assignable to such wells as of December 31, 2009. We use the terms “gross” to refer to all wells or acreage in which we have a working interest and “net” to refer to our ownership represented by that working interest. Because of our significant equity interest in our core areas, we also include our share of our equity investee’s net interests.
|
Productive Wells
|
||||||||||||||||||||||||||||||||||||||||
|
Oil
|
Gas
|
Developed Acreage
|
||||||||||||||||||||||||||||||||||||||
|
Gross
|
Net
|
Equity
|
Gross
|
Net
|
Equity
|
Gross
|
Net
|
Equity
|
Combined
|
|||||||||||||||||||||||||||||||
|
Neuquén basin
|
485 | 112 | 145 | 44 | 10 | 13 | 48,424 | 11,138 | 14,455 | 25,593 | ||||||||||||||||||||||||||||||
|
Austral basin
|
80 | 21 | - | 27 | 7 | - | 10,218 | 2,634 | - | 2,634 | ||||||||||||||||||||||||||||||
|
Northwest basin
|
3 | - | - | 6 | 0.1 | - | 10,759 | 161 | 161 | |||||||||||||||||||||||||||||||
|
Total Argentina
|
568 | 133 | 145 | 77 | 17 | 13 | 69,401 | 13,933 | 14,455 | 28,388 | ||||||||||||||||||||||||||||||
At December 31, 2009, we held the following undeveloped acreage in Argentina and Colombia:
|
Undeveloped Acreage
|
||||||||||||||||
|
Gross Acres
|
Net
|
Equity
|
Combined
|
|||||||||||||
|
Neuquén basin
|
339,205 | 78,017 | 101,253 | 179,270 | ||||||||||||
|
Austral basin
|
456,871 | 117,781 | - | 117,781 | ||||||||||||
|
Northwest basin
|
282,862 | 4,243 | - | 4,243 | ||||||||||||
|
San Jorge basin
|
81,898 | 60,396 | - | 60,396 | ||||||||||||
|
Total Argentina
|
1,160,836 | 260,437 | 101,253 | 361,690 | ||||||||||||
|
Colombia
|
211,363 | 72,362 | - | 72,362 | ||||||||||||
|
Total Company
|
1,372,199 | 332,799 | 101,253 | 434,052 | ||||||||||||
Our Neuquén basin properties have various concession terms that currently end between 2016 and 2034. Approximately 22% of our undeveloped acreage in our Neuquén basin properties is subject to an exploration permit that expires in July of 2010, although the exploration permit can be extended various times in exchange for relinquishing certain amounts of the acreage and making additional investment commitments. We expect to extend the term of that exploration permit. Our properties in the Austral, San Jorge and Northwest basins currently have concession terms which end on dates ranging from 2016 to 2036. Apco and its operating partners will attempt to secure the ten-year extensions from the respective provinces for all of our Argentine concessions for which such extensions have not yet been negotiated. Our acreage in Colombia is held under exploration and production contracts that expire in 2012 and 2014, unless commercial quantities of hydrocarbons are found, in which case a 24-year exploitation period would be granted.
Neuquén Basin Properties
Since 1968, Apco has participated in a joint venture partnership with two Argentine companies, Petrolera Entre Lomas S.A. and Petrobras Energía S.A. (“Petrobras Energía”), formerly Pecom Energía S.A. (“Pecom Energía”). The purpose of the joint venture is the exploration and development of the Entre Lomas oil and gas concession in the provinces of Río Negro and Neuquén in southwest Argentina. In 2007, the partners created two new joint ventures consisting of the same partners with the same interests in order to expand operations into two areas adjacent to Entre Lomas, the Agua Amarga exploration permit in the province of Río Negro, and the Bajada del Palo concession in the province of Neuquén. In 2009, a portion of the Agua Amarga permit was converted to a 25-year exploitation concession called Charco del Palenque.
Although these blocks are separate areas governed by their own concession and exploration permit agreements, the areas are operated and managed by Petrolera as an extension of Entre Lomas to achieve efficiencies through economies of scale. Infrastructure in the Entre Lomas concession has sufficient existing capacity to accommodate production volumes from all the areas during the early stages of exploration and development of Bajada del Palo, Agua Amarga and Charco del Palenque. Pipelines can be extended over relatively short distances to connect storage facilities in the new areas to treating, pumping and transportation facilities already in place in the Entre Lomas concession.
The partners' interests in the above mentioned joint ventures as of December 31, 2009 are as follows:
|
Petrolera Entre Lomas S.A. (Operator)
|
73.15 | % | ||
|
Apco
|
23.00 | % | ||
|
Petrobras Energía S.A.
|
3.85 | % | ||
| 100.00 | % |
In addition to its direct participation interest, Apco owns an effective 29.85 percent equity interest in the areas through its stock ownership in Petrolera, which holds a 73.15 percent direct interest in each of the properties. Our 23 percent direct participation interest combined with our 29.85 percent equity interest gives Apco an effective 52.85 percent interest in all of the properties.
Petrolera Entre Lomas S.A.
Petrolera is an Argentine company with administrative offices in Buenos Aires and Neuquén and a field office with technical staff located on the Entre Lomas concession. Petrolera has been a partner in the Entre Lomas joint venture since its inception. As of December 31, 2009, Petrolera had 104 employees. The shareholders of Petrolera and their ownership percentages are as follows:
|
Petrobras and affiliates
|
58.88 | % | ||
|
Apco and affiliates
|
40.80 | % | ||
|
Other
|
0.32 | % | ||
| 100.00 | % |
Investment decisions and strategy for development of the properties are agreed upon by the joint venture partners and implemented by Petrolera. Petrolera has a board of 11 directors, five of whom are nominees of Apco and six of whom are nominees of Petrobras and its affiliates. Petrolera’s operating and financial managers and field personnel are employed exclusively by Petrolera.
Apco’s branch office in Buenos Aires obtains operational and financial data from Petrolera that is used to monitor joint venture operations. The branch provides technical assistance to Petrolera and makes recommendations regarding field development and reservoir management.
Entre Lomas Concession
The Entre Lomas concession is located about 950 miles southwest of the city of Buenos Aires on the eastern slopes of the Andes Mountains. It straddles the provinces of Río Negro and Neuquén approximately 60 miles north of the city of Neuquén. The concession covers a surface area of approximately 183,000 acres and produces oil and gas from seven fields, the largest of which is Charco Bayo/Piedras Blancas (“CB/PB”). The concession is equipped with centralized facilities that serve all productive fields. These facilities include processing, treating, compression, injection, storage, power generation and an automatic custody transfer unit through which all oil production is transported to market.
The most productive formation in the concession is the Tordillo, but we also produce oil and gas from the Quintuco and the Punta Rosada formations (also known as the Petrolifera). The joint venture extracts propane and butane from gas production in its gas processing plant located in the concession. Secondary recovery projects whereby water is injected into the producing reservoirs to restore pressure and increase the ultimate volume of hydrocarbons to be recovered are used extensively in the Entre Lomas concession.
The Entre Lomas concession has a primary term of 25 years that expires in the year 2016 with an option to extend for an additional ten-year period with the consent of the government. In 2009, the Neuquén provincial government negotiated and granted ten-year extension periods with various companies. As detailed in the section below, in third-quarter 2009, the concession contract for the portion of the Entre Lomas concession located in the Neuquén province was extended to January 2026. This extension agreement does not apply to the portion of the Entre Lomas concession located in Río Negro province that we expect to negotiate in the near future.
Bajada del Palo Concession
The Bajada del Palo concession has a total surface area of approximately 111,000 acres. It is located in the province of Neuquén immediately to the southwest of the Entre Lomas concession and to the northwest of the Agua Amarga area. The primary target formations in Bajada del Palo are the same as those that have been developed and produced in Entre Lomas. As described in the following section, in the third quarter of 2009, the ten-year extension of the Bajada del Palo concession term was also obtained and as a result this concession’s term now expires in September 2025.
Concession Extensions
In the third quarter of 2009, the province of Neuquén agreed to extend the concession terms of the Entre Lomas and Bajada del Palo concessions for additional ten-year periods. The new concession term expiration dates were described in the previous sections. Pursuant to the extension agreement, Apco and its partners have agreed to pay a total bonus of $12.5 million ($2.9 million net to our direct working interest). The bonus payment is to be made in installments over 18 months commencing in July 2009. We have also agreed to spend $237 million ($54.5 million net to our direct working interest) for future exploitation and exploration activities in that portion of Entre Lomas located in Neuquén province and Bajada del Palo over a 17 year period. Provincial production taxes were increased from the previous rate of 12 percent to 15 percent and could increase up to a maximum of 18 percent depending on future increases in product price realizations. As previously mentioned, this agreement does not cover the portion of the Entre Lomas concession located in the province of Río Negro that must be negotiated separately with that province.
Agua Amarga and Charco del Palenque
The Agua Amarga exploration area was awarded to Petrolera by the province of Río Negro in 2007. The property has a total surface area of approximately 95,000 acres and is located immediately to the southeast of the Entre Lomas concession. The terms of the exploration permit include a work commitment over three years for the acquisition of three dimensional (“3D”) seismic information and exploration drilling. At the end of the term of the exploration permit, the balance of the acreage that has not been converted to an exploitation concession will be subject to relinquishment. As of December 31, 2009, the remaining value of the work commitment to be completed in the area is estimated to be $700,000 net to our working interest. In accordance with the estimated investment schedule per the exploration permit, we expect to drill an exploratory well in 2010 to satisfy this obligation.
In the fourth quarter of 2009, a portion of the Agua Amarga area covering approximately 18,000 acres was converted to a 25-year exploitation concession with a five-year optional extension period. This new producing concession is called Charco del Palenque.
Neuquén Exploration
Apco and its partners make extensive use of 3D seismic information to develop and explore in our Neuquén basin properties. In addition to aiding in the development of existing producing areas, the seismic surveys have two exploratory objectives. The primary exploratory objective is finding lower risk exploration opportunities that target formations known to be productive from structural closures and/or fault traps that exist away from the principal producing structures. The second objective is to evaluate high-risk, deep exploration potential.
Since 2005, on the basis of interpretation of 3D seismic, 16 lower risk wells have been drilled in our three blocks on structural closures or fault traps away from principal producing structures. All wells drilled were oil discoveries and have been completed and put on production. The structures on which these wells have been drilled are limited in size compared with the principal producing fields in Entre Lomas and do not present development opportunities of more than a few wells. The geologic model utilized for identifying fault traps in the southeast region of the Entre Lomas concession has proven to be an excellent predictor of trapped hydrocarbons. The acquisitions of both the Agua Amarga exploration permit and the Bajada del Palo concession were in part based on the interpretation that the trend of faults that have been identified in the southeast region of the Entre Lomas concession continues into both the Agua Amarga and Bajada del Palo areas, and has since resulted in proved reserve additions in 2009 due to successful exploration and subsequent development drilling.
We are drilling development wells on the structures where discoveries were made in the blocks. We will continue drilling these new structures in the foreseeable future and investigating other undrilled structures in this region of our Neuquén basin properties by applying the geologic model that has yielded these successes.
In addition to the above described activities, the joint venture partners are in the process of studying and evaluating exploration potential of sedimentary layers deeper than those currently on production in our blocks, including potential for shale production and unconventional natural gas.
Environment and Occupational Health
The Argentine Department of Energy and the government of the provinces in which oil and gas producing concessions are located have environmental control policies and regulations that must be adhered to when conducting oil and gas exploration and exploitation activities. In response to these requirements, Petrolera implemented and maintains an Environmental Management System needed to comply with ISO 14001: 2004 environmental standards, and OHSAS 18001: 1999 occupational health standards. This system encompasses all of the properties that it operates. Independent party audits are conducted annually to assure that Petrolera’s certifications remain in full force. These standards surpass those required by the local governing authorities.
Northwest Basin Properties
Acambuco Concession
Apco holds a 1.5 percent participation interest in the Acambuco concession located in the province of Salta in northwest Argentina on the border with Bolivia. The concession covers an area of 294,000 acres, and is one of the largest gas producing concessions in Argentina. There are two producing fields in this concession, the San Pedrito and Macueta fields, that produce primarily from the Huamampampa formation, which is a deep fractured quartzite with substantial natural gas reserves in this basin and in southern Bolivia. In Acambuco the Huamampampa is found at depths in excess of 14,000 feet. The concession term expires in 2036.
Acambuco is situated in an over-thrust belt where drilling is difficult and costly because of the depths of the primary objectives and extreme formation pressures encountered during drilling that create the risk of mechanical problems during drilling. Wells drilled to the Huamampampa formation in the Acambuco concession have generally required one year to drill with total costs for drilling and completion ranging from $50 to $70 million.
The operator of the Acambuco joint venture is Pan American Energy Investments L.L.C. (“PAE”), an affiliate of British Petroleum PLC, which holds a 52 percent interest. The remaining interests are held by three other partners, including a subsidiary of The Williams Companies, Inc., Northwest Argentina Corporation, which holds a 1.5 percent interest.
Austral Basin Properties
Apco holds a 25.78 percent direct working interest in a joint venture engaged in E&P activities in three concessions located on the island of Tierra del Fuego. The operator of the concessions is ROCH S.A., a privately owned Argentine oil and gas company.
We refer to the Río Cullen, Las Violetas and Angostura concessions as our “TDF concessions.” These properties are located in the Austral basin which extends both onshore and offshore from the provinces of Santa Cruz to Tierra del Fuego. The principal producing formation is the Springhill sandstone. Several large offshore producing gas condensate fields with significant reserves are productive in the basin, two of which are in close proximity to our concessions.
The concessions cover a total surface area of approximately 467,000 gross acres, or 120,000 acres net to Apco’s interest. Each of the concessions extends three kilometers offshore with their eastern boundaries paralleling the coastline. The concessions have terms of 25 years that expire in 2016 with an option to extend the concessions for an additional ten year period with the consent of the government. The most developed of the three concessions is the Las Violetas concession which is the largest onshore concession on the Argentine side of the island of Tierra del Fuego.
Operations in the TDF concessions are exempt from Argentine federal income taxes pursuant to Argentine law. This exemption is in effect until the year 2023.
San Jorge Basin Properties
In the San Jorge basin, our areas are more prospective and exploratory in nature. In the province of Chubut we have a 41.73 percent working interest in the Cañadón Ramirez concession that is currently not producing. In the Sur Río Deseado Este concession in the province of Santa Cruz we have a 16.94 percent working interest in an exploitation area with limited oil production and an 88 percent working interest in an exploratory area in the northern sector of the concession.
Colombia - Overview
In July 2008, a subsidiary of Apco, Apco Properties Ltd., opened a branch in Colombia, Apco Properties Sucursal de Colombia. We retained a legal representative in Colombia, and began searching for investment opportunities in the country. During 2009, Apco was successful in executing two farm-in agreements to obtain significant interests in two Exploration and Production Contracts covering approximately 200,000 acres in the Llanos and Middle Magdalena basins.
Llanos Basin
In July 2009, Apco entered into a farm-in agreement with TC Oil & Services, Ltd. to earn a 20 percent interest in the Llanos 32 Exploration and Production Contract (“Llanos 32”). The Llanos 32 block covers approximately 100,000 acres in the Llanos basin of western Colombia which was previously awarded to a consortium of TC Oil and Services, Ltd. and Ramshorn International Ltd. by the Colombia National Hydrocarbons Agency (the “ANH”) in 2008. Apco agreed to fund approximately $5.8 million - or 27 percent - of exploration activities during a three-year period ending in early 2012 to earn its 20 percent working interest. The farm-in was approved by the ANH in early 2010.
The work commitments associated with Llanos 32 include the acquisition of at least 200 square kilometers of 3D seismic and the drilling of at least two exploration wells. In December 2009, the partners commenced activities on Llanos 32 with a 260 square kilometer 3D seismic acquisition program. The program was designed to cover several leads already identified by the partners. We expect that drilling activities will commence during 2011.
Middle Magdalena Basin
In December 2009, Apco entered into a farm in agreement with Petrolifera Petroleum (Colombia) Limited to earn a 50 percent working interest in the Turpial Exploration and Production Contract “Turpial." Petrolifera will be the operator. Turpial covers approximately 111,000 acres of underexplored area between the Velazquez and Cocorna oil fields in the Middle Magdalena basin. Under the farm-in agreement Apco paid $2.6 million and agreed to carry second-phase expenditures up to $1.9 million in order to earn its working interest. The farm-in is subject to approval by the ANH.
The operator acquired Turpial in 2008 agreeing to a six year exploration term. During the completion of its first-phase obligations, 120 square kilometers of 3D seismic and 37 kilometers of 2D seismic were acquired. The operator elected to enter the second phase and agreed to acquire an additional 114 kilometers of 2D seismic prior to October 2010. Each additional phase will be at the election of the parties and will require the drilling of one exploration well. Should the parties declare commerciality, the contract allows for a 24 year exploitation period.
During 2010 the partners plan to comply with second phase work commitments by acquiring the additional 2D seismic information in the northern area of Turpial.
Oil and Natural Gas Production, Prices and Costs
The table below summarizes total sales volumes, prices and production costs per unit for our consolidated interests and sales volumes and prices for our equity interests for the periods presented:
|
For the Years Ended December 31,
|
||||||||||||||||||||||||
|
|
2009
|
2008
|
2007
|
|||||||||||||||||||||
|
Sales Volumes (1, 2, 3):
|
||||||||||||||||||||||||
|
Consolidated interests
|
||||||||||||||||||||||||
|
Crude oil and condensate (bbls)
|
1,330,020 | 1,218,896 | 1,159,834 | |||||||||||||||||||||
|
Natural gas (mcf)
|
5,849,497 | 4,850,144 | 4,802,497 | |||||||||||||||||||||
|
LPG (tons)
|
10,097 | 8,734 | 9,190 | |||||||||||||||||||||
|
Barrels of oil equivalent (boe)
|
2,423,425 | 55 | % | 2,129,747 | 54 | % | 2,068,096 | 54 | % | |||||||||||||||
|
Equity interests
|
||||||||||||||||||||||||
|
Crude oil and condensate (bbls)
|
1,533,828 | 1,417,203 | 1,327,962 | |||||||||||||||||||||
|
Natural gas (mcf)
|
1,900,786 | 1,882,529 | 1,924,635 | |||||||||||||||||||||
|
LPG (tons)
|
10,420 | 9,581 | 9,352 | |||||||||||||||||||||
|
Barrels of oil equivalent (boe)
|
1,972,900 | 45 | % | 1,843,388 | 46 | % | 1,758,484 | 46 | % | |||||||||||||||
|
Total volumes
|
||||||||||||||||||||||||
|
Crude oil and condensate (bbls)
|
2,863,848 | 2,636,099 | 2,487,795 | |||||||||||||||||||||
|
Natural gas (mcf)
|
7,750,283 | 6,732,673 | 6,727,132 | |||||||||||||||||||||
|
LPG (tons)
|
20,517 | 18,315 | 18,542 | |||||||||||||||||||||
|
Barrels of oil equivalent (boe)
|
4,396,325 | 100 | % | 3,973,134 | 100 | % | 3,826,580 | 100 | % | |||||||||||||||
|
Total volumes by basin
|
||||||||||||||||||||||||
|
Neuquén
|
3,493,189 | 80 | % | 3,263,878 | 82 | % | 3,113,547 | 81 | % | |||||||||||||||
|
Austral
|
635,193 | 14 | % | 409,865 | 10 | % | 458,425 | 12 | % | |||||||||||||||
|
Others
|
267,943 | 6 | % | 299,391 | 8 | % | 254,608 | 7 | % | |||||||||||||||
|
Barrels of oil equivalent (boe)
|
4,396,325 | 100 | % | 3,973,134 | 100 | % | 3,826,580 | 100 | % | |||||||||||||||
|
|
||||||||||||||||||||||||
|
Average Sales Prices:
|
||||||||||||||||||||||||
|
Consolidated interests
|
||||||||||||||||||||||||
|
Oil (per bbl)
|
$ | 43.46 | $ | 46.09 | $ | 43.62 | ||||||||||||||||||
|
Natural gas (per mcf)
|
1.70 | 1.46 | 1.45 | |||||||||||||||||||||
|
LPG (per ton)
|
264.33 | 490.27 | 447.65 | |||||||||||||||||||||
|
Equity interests
|
||||||||||||||||||||||||
|
Oil (per bbl)
|
$ | 44.04 | $ | 46.70 | $ | 42.77 | ||||||||||||||||||
|
Natural gas (per mcf)
|
1.52 | 1.35 | 1.65 | |||||||||||||||||||||
|
LPG (per ton)
|
273.02 | 468.94 | 449.33 | |||||||||||||||||||||
|
Average Production Costs (4) per Boe:
|
||||||||||||||||||||||||
|
Production and lifting cost
|
$ | 6.19 | $ | 7.43 | $ | 5.38 | ||||||||||||||||||
|
Provincial production tax
|
3.52 | 3.73 | 3.37 | |||||||||||||||||||||
|
DD&A
|
6.35 | 6.22 | 4.70 | |||||||||||||||||||||
|
|
(1)
|
Volumes presented in the above table represent those sold to customers and have not been reduced by the approximately 12 percent provincial production tax that is paid separately and is accounted for as an expense by Apco.
|
|
|
(2)
|
Natural gas production represents only volumes available for sale.
|
|
|
(3)
|
Natural gas is converted to oil-equivalent at six mcf to one barrel, and one ton of LPG is equivalent to 11.735 barrels.
|
|
|
(4)
|
Average production and lifting costs, provincial production taxes, and depreciation costs are calculated using total costs divided by consolidated interest sales volumes expressed in barrels of oil equivalent.
|
Drilling and Other Exploratory and Development Activities
The following tables summarize our drilling activity by number and type of well for the periods indicated. We use the terms “gross” to refer to all wells in which we have a working interest and “net consolidated” to refer to our ownership represented by that working interest. Because of our significant equity interest in our core areas, we also include our share of our equity investee’s net interests.
|
2009
|
2008
|
2007
|
||||||||||||||||||||||||||||||||||
|
Gross
|
Net Consolidated
|
Net Equity
|
Gross
|
Net Consolidated
|
Net Equity
|
Gross
|
Net Consolidated
|
Net Equity
|
||||||||||||||||||||||||||||
|
Development:
|
||||||||||||||||||||||||||||||||||||
|
Productive
|
26.0 | 6.0 | 7.8 | 55.0 | 13.0 | 12.8 | 40.0 | 9.0 | 11.0 | |||||||||||||||||||||||||||
|
Non-Productive
|
0.0 | 0.0 | 0.0 | 6.0 | 1.5 | 0.0 | 1.0 | 0.3 | 0.0 | |||||||||||||||||||||||||||
|
Total
|
26.0 | 6.0 | 7.8 | 61.0 | 14.5 | 12.8 | 41.0 | 9.3 | 11.0 | |||||||||||||||||||||||||||
|
Exploratory:
|
||||||||||||||||||||||||||||||||||||
|
Productive
|
6.0 | 1.4 | 1.8 | 7.0 | 1.64 | 1.8 | 1.0 | 0.23 | 0.30 | |||||||||||||||||||||||||||
|
Non-Productive
|
0.0 | 0.0 | 0.0 | 4.0 | 1.11 | 0.0 | 1.0 | 0.25 | 0.00 | |||||||||||||||||||||||||||
|
Total
|
6.0 | 1.4 | 1.8 | 11.0 | 2.74 | 1.8 | 2.0 | 0.48 | 0.30 | |||||||||||||||||||||||||||
|
Total:
|
||||||||||||||||||||||||||||||||||||
|
Productive
|
32.0 | 7.4 | 9.6 | 62.0 | 14.6 | 14.6 | 41.0 | 9.3 | 11.3 | |||||||||||||||||||||||||||
|
Non-Productive
|
0.0 | 0.0 | 0.0 | 10.0 | 2.6 | 0.0 | 2.0 | 0.6 | 0.0 | |||||||||||||||||||||||||||
|
Total
|
32.0 | 7.4 | 9.6 | 72.0 | 17.3 | 14.6 | 43.0 | 9.8 | 11.3 | |||||||||||||||||||||||||||
Present Activities
At December 31, 2009, we had four gross development wells (0.9 net consolidated 1.2 net equity) in various stages of drilling or completion. In Colombia, a program to acquire 260 km2 of 3D seismic information began in December of 2009.
Delivery Commitments
We hold obligations to deliver certain amounts of natural gas. Our properties contain sufficient reserves to fulfill these obligations without risk of non-performance during periods of normal infrastructure and market operations. These transactions do not represent a material exposure.
Government Regulations
The Company’s operations in Argentina are subject to various laws, taxes and regulations governing the oil and gas industry. Taxes generally include income taxes, value added taxes, export taxes, and other production taxes such as provincial production taxes and turnover taxes. Labor laws and provincial environmental regulations are also in place.
Our right to conduct E&P activities in Argentina is derived from participation in concessions and exploration permits granted by the Argentine federal government and provincial governments that control sub-surface minerals. In general, provincial governments have had full jurisdiction over concession contracts since early 2007, when the Argentine federal government transferred to the provincial governments full ownership and administration rights over all hydrocarbon deposits located within the respective territories of the provinces, including all exploration permits and exploitation concessions originally granted by the federal government.
A concession granted by the government gives the concession holders, or the joint venture partners, ownership of hydrocarbons at the moment they are produced through the wellhead. Under this arrangement, the concession holders have the right to freely sell produced hydrocarbons, and have authority over operations including exploration and development plans. The concessions have a term of 25 years which can be extended for 10 years with the consent of the government. Throughout the term of their concessions, the partners are subject to provincial production taxes, turnover taxes, and federal income taxes. These tax rates are fixed by law and are currently 12 to 18.5 percent, two percent, and 35 percent, respectively. Subsequent to the transfer of ownership and administrative rights over hydrocarbon deposits to the provinces, provincial governments have sometimes required higher provincial production tax rates in blocks awarded by the provinces or in concessions that have been granted the 10 year extension.
In Colombia, our right to conduct E&P activities is derived from participation in exploration and production contracts entered into directly with the Colombian National Hydrocarbons Agency (the “ANH”) with no mandatory participation by Ecopetrol, the state oil company. The ANH was formed in 2003 in response to declining reserves which was leading Colombia toward becoming a net oil importer.
Exploration and production contracts in Colombia typically run for an initial exploration period of up to six years. The first phase of work usually requires acquisition of new seismic data. After the first phase, contracts can be retained for up to five additional years, usually by drilling one well per year. An exploration and production contract can be relinquished after any completed phase at the option of the investor.
Once a field is declared commercial, the exploitation period is 24 years, which may be extended another 10 years under certain circumstances. The investor retains the rights to all reserves and production from newly discovered fields, subject to a sliding scale of royalty, which is initially eight percent for production up to 5,000 barrels of oil per day “bopd” per field up to a maximum of 25 percent for production exceeding 600,000 bopd per field. In addition, a windfall profit tax applies once a field has cumulatively produced more than five million barrels of oil. The windfall profits tax is 30 percent of the price per barrel received in excess of certain threshold prices which are periodically set by the ANH and are established by the quality of the oil produced.
MARKETING
Oil Markets
Crude oil produced in the Entre Lomas region of the Neuquén basin is referred to as Medanito crude oil, a high quality oil generally in strong demand among Argentine refiners for subsequent distribution in the domestic market. During 2009, all of the oil produced in our Neuquén properties was sold to Argentine refiners. In previous years, oil production has also been exported to Brazil and other countries in the southern cone of Latin America. Production from our Neuquén properties is transported to Puerto Rosales, a major industrial port in southern Buenos Aires Province through the Oleoductos del Valle S.A. (“Oldelval”) pipeline system.
In previous years, we exported our oil and condensate production from the TDF concessions to Chile. After the Argentine government levied an export tax on hydrocarbon exports from the island of Tierra del Fuego in early 2007, we began to sell our oil production to domestic refiners in Argentina.
The Argentine domestic refining market is limited, and basically consists of five active refiners. As a result, our oil sales have historically depended on a relatively limited group of customers. The largest of these five companies refines mostly its own crude oil production, while the smallest of the five operates only in the northwest basin of Argentina near our Acambuco concession. Decisions to sell to any of the remaining three refiners are based on advantages presented by the commercial terms negotiated with each customer.
A description of our major customers over the last three years is in Note 5 of Notes to Consolidated Financial Statements. As can be seen in Note 5, Petrobras Energía has been a major customer of us over the past several years. However, although our oil sales have historically depended on a relatively limited group of customers, we do not believe that the loss of Petrobras Energía as a customer would have a material adverse effect on the Company. As previously discussed, crude oil produced in the Entre Lomas region of the Neuquén basin, referred to as Medanito crude oil, is a high quality oil generally in strong demand among Argentine refiners. Our crude oil production can be marketed to other refiners or exported, but we have sold a significant amount of our production to Petrobras Energía over the past several years as we have been able to negotiate competitive prices with that particular customer.
For a full discussion about our oil sales prices, please read the information under the caption “Overview of 2009 – Oil and Natural Gas Marketing” in the Management’s Discussion and Analysis (MD&A) section of this report. Additional discussion about the reduced net backs is included in Item 1A. “Risk Factors – Risks Associated with Operations in Argentina,” and Item 7A. “Quantitative and Qualitative Disclosures about Market Risk – Commodity Price Risk.”
Natural Gas Markets
Natural gas markets in Argentina are heavily regulated by the Argentine government. In general, the government sets the volumes producers are required to sell to residential customers at low government-regulated prices. Incremental volumes are sold to industrial and other customers, and pricing varies with seasonal factors and industry category. Apco sells its natural gas to Argentine customers pursuant to short-term contracts and in the spot market.
The Neuquén basin is served by a substantial gas pipeline network that delivers gas to the Buenos Aires metropolitan and surrounding areas, and the industrial regions of Bahia Blanca and Rosario. Natural gas produced in our Neuquén basin properties is readily marketed due to accessibility to this infrastructure and our properties are well situated in the basin with two major pipelines in close proximity. Natural gas produced in this basin that is not under contract can readily be sold in the spot market.
Natural gas and condensate produced in Acambuco is being sold primarily to domestic distribution companies and industrial customers in the northern part of Argentina under contracts negotiated by the operator of the concession.
Natural gas production from the TDF concessions has been primarily sold under contract to industrial and residential markets in the island of Tierra del Fuego. When purchased, the TDF concessions were equipped with internal gathering lines, pipeline, gas treatment plant, and the San Luis LPG plant located in the Las Violetas concession that produces propane and butane that is exported and sold domestically under contract. In September of 2008, our joint venture’s production facilities were connected directly to the San Martín pipeline, giving us a physical outlet for transportation of gas from the island of Tierra del Fuego to continental Argentina, where higher prices are being realized.
Natural gas is a needed commodity in Argentina. The country’s energy consumption is highly reliant on natural gas as a source of fuel. With a highly sophisticated natural gas infrastructure in place to deliver natural gas to both industrial and residential markets, the country ranks near the top in the world in terms of percentage of natural gas as a source of energy. Heavy government regulation over gas prices since 2002 have kept natural gas prices artificially low and as a result, exploration efforts in Argentina targeting natural gas slowed dramatically during this period. Consequently, natural gas reserves in the country have fallen significantly and exploration discoveries and development of existing fields have not added sufficient reserves to replace production.
Argentina currently suffers from a shortage of natural gas and has to import natural gas from neighboring Bolivia and import high-priced LNG while Argentine producers are supplying domestic consumers with domestic production at prices significantly below those paid for imported natural gas. Subsidizing these high priced imports is a significant drain on the government’s finances. Hence, natural gas production in Argentina can readily be marketed either by contract or on the spot market because it is a highly a sought after commodity both for residential use and to drive industry and the country’s economy. For further discussion of natural gas prices and the Argentine government’s regulation of the supply of natural gas in the domestic market in Argentina, please see the information under the caption “Overview of 2009 – Oil and Natural Gas Marketing” in the MD&A section of this report.
EMPLOYEES
At March 2, 2010, the Company had 21 full-time employees.
FINANCIAL INFORMATION ABOUT GEOGRAPHIC AREAS
The Company is a Cayman Islands company with executive offices located in Tulsa, Oklahoma, a branch office located in Buenos Aires, Argentina and a branch office in Bogota, Colombia. All of the Company’s production and reserves are currently generated in Argentina.
The Company has no operating revenues in either the Cayman Islands or the United States. Because all of the Company’s operating revenues are generated in Argentina, all of its products are sold either domestically in Argentina, or exported from Argentina to neighboring countries. Refer to Note 5 of Notes to Consolidated Financial Statements for a description of sales during the last three years to customers that constitute greater than ten percent of total operating revenues.
With the exception of cash and cash equivalents deposited in banks in the Cayman Islands and the Bahamas, a bank account in Tulsa, Oklahoma and furniture and equipment in its executive offices, all of the Company’s assets are located in Argentina and Colombia.
Risks associated with foreign operations are discussed elsewhere in this Item 1, Item 1A “Risk Factors” and in Item 7A “Quantitative and Qualitative Disclosures about Market Risk.”
WEBSITE ACCESS TO REPORTS AND OTHER INFORMATION
We file our annual report on Form 10-K, quarterly reports on Form 10-Q, current reports on Form 8-K, proxy statements, and other documents electronically with the Securities and Exchange Commission (“SEC”) under the Securities Exchange Act of 1934, as amended (“Exchange Act”). You may read and copy any materials that we file with the SEC at the SEC’s Public Reference Room at 100 F Street, N.E., Washington, DC 20549. You may obtain information on the operation of the Public Reference Room by calling the SEC at 1-800-SEC-0330. You may also obtain such reports from the SEC’s Internet website at http://www.sec.gov.
Our Internet website is http://www.apcooilandgas.com. We make available free of charge on or through our Internet website our annual report on Form 10-K, quarterly reports on Form 10-Q, current reports on Form 8-K and amendments to those reports filed or furnished pursuant to Section 13(a) or 15(d) of the Exchange Act as soon as reasonably practicable after we electronically file such material with, or furnish it to, the SEC. Our Code of Ethics and Board committee charters are also available on our Internet website. We will also provide, free of charge, a copy of any of our corporate documents listed above upon written request to the Corporate Secretary, Apco Oil and Gas International Inc., 3500 One Williams Center, Tulsa, Oklahoma 74172.
FORWARD-LOOKING STATEMENTS/RISK FACTORS AND CAUTIONARY STATEMENT
FOR PURPOSES OF THE “SAFE HARBOR” PROVISIONS OF
THE PRIVATE SECURITIES LITIGATION REFORM ACT OF 1995
Certain matters contained in this report include “forward-looking statements” within the meaning of Section 27A of the Securities Act of 1933, as amended, and Section 21E of the Securities Exchange Act of 1934, as amended. These forward-looking statements relate to anticipated financial performance, management’s plans and objectives for future operations, business prospects, outcome of regulatory proceedings, market conditions and other matters. We make these forward-looking statements in reliance on the safe harbor protections provided under the Private Securities Litigation Reform Act of 1995.
All statements, other than statements of historical facts, included in this report that address activities, events or developments that we expect, believe or anticipate will exist or may occur in the future, are forward-looking statements. Forward-looking statements can be identified by various forms of words such as “anticipates,” “believes,” “seeks,” “could,” “may,” “should,” “continues,” “estimates,” “expects,” “forecasts,” “intends,” “might,” “goals,” “objectives,” “targets,” “planned,” “potential,” “projects,” “scheduled,” “will” or other similar expressions. These forward-looking statements are based on management’s beliefs and assumptions and on information currently available to management and include, among others, statements regarding:
|
|
·
|
Amounts and nature of future capital expenditures;
|
|
|
·
|
Volumes of future oil, gas and LPG production;
|
|
|
·
|
Expansion and growth of our business and operations;
|
|
|
·
|
Financial condition and liquidity;
|
|
|
·
|
Business strategy;
|
|
|
·
|
Estimates of proved oil and gas reserves;
|
|
|
·
|
Reserve potential;
|
|
|
·
|
Development drilling potential;
|
|
|
·
|
Cash flow from operations or results of operations;
|
|
|
·
|
Seasonality of natural gas demand; and
|
|
|
·
|
Oil and natural gas prices and demand for those products.
|
Forward-looking statements are based on numerous assumptions, uncertainties and risks that could cause future events or results to be materially different from those stated or implied in this report. Many of the factors that will determine these results are beyond our ability to control or predict. Specific factors that could cause actual results to differ from results contemplated by the forward-looking statements include, among others, the following:
|
|
·
|
Availability of supplies (including the uncertainties inherent in assessing, estimating, acquiring and developing future oil and natural gas reserves), market demand, volatility of prices, and the availability and cost of capital;
|
|
|
·
|
Inflation, interest rates, fluctuation in foreign currency exchange rates, and general economic conditions (including future disruptions and volatility in the global credit markets and the impact of these events on our customers and suppliers);
|
|
|
·
|
The strength and financial resources of our competitors;
|
|
|
·
|
Development of alternative energy sources;
|
|
|
·
|
The impact of operational and development hazards;
|
|
|
·
|
Costs of, changes in, or the results of laws, government regulations, environmental liabilities and litigation;
|
|
|
·
|
Political conditions in Argentina and other parts of the world;
|
|
|
·
|
The failure to renew participation in hydrocarbon concessions granted by the Argentine government on reasonable terms;
|
|
|
·
|
Risks associated with future weather conditions and earthquakes;
|
|
|
·
|
Acts of terrorism; and
|
|
|
·
|
Additional risks described in our filings with the SEC.
|
Given the uncertainties and risk factors that could cause our actual results to differ materially from those contained in any forward-looking statement, we caution investors not to unduly rely on our forward-looking statements. We disclaim any obligations to and do not intend to update the above list or to announce publicly the result of any revisions to any of the forward-looking statements to reflect future events or developments.
In addition to causing our actual results to differ, the factors listed above and referred to below may cause our intentions to change from those statements of intention set forth in this report. Such changes in our intentions may also cause our results to differ. We may change our intentions at any time and without notice, based upon changes in such factors, our assumptions, or otherwise.
Because forward-looking statements involve risks and uncertainties, we caution that there are important factors, in addition to those listed above, that may cause actual results to differ materially from those contained in the forward-looking statements. These factors are described in the following section.
RISK FACTORS
The reader should carefully consider the following risk factors in addition to the other information in this report. Each of these factors could adversely affect our business, operating results, and financial condition as well as adversely affect the value of an investment in our securities.
Risks Inherent to the Company’s Industry and Business
Significant capital expenditures are required to replace our reserves.
Our exploration, development and acquisition activities require substantial capital expenditures. Historically, we have funded our capital expenditures through a combination of cash flows from operations. Future cash flows are subject to a number of variables, including the level of production from existing wells, prices of oil and natural gas, and our success in developing and producing new reserves. If our cash flow from operations is not sufficient to fund our capital expenditure budget, we may not be able to access bank debt, issue debt or equity securities or access other methods of financing on an economic basis to meet our capital expenditure budget. As a result, our capital expenditure plans may have to be adjusted.
Failure to replace reserves may negatively affect our business.
The growth of our business depends upon our ability to find, develop or acquire additional oil and natural gas reserves that are economically recoverable. Our proved reserves generally decline when reserves are produced, unless we conduct successful exploration or development activities or acquire properties containing proved reserves, or both. We may not be able to find, develop or acquire additional reserves on an economic basis. If oil or natural gas prices increase, our costs for additional reserves would also increase, conversely if oil or natural gas prices decrease, it could make it more difficult to fund the replacement of our reserves.
Exploration and development drilling may not result in commercially productive reserves.
Our past success rate for drilling projects should not be considered a predictor of future commercial success. We do not always encounter commercially productive reservoirs through our drilling operations. The new wells we drill or participate in may not be productive and we may not recover all or any portion of our investment in wells we drill or participate in. The cost of drilling, completing and operating a well is often uncertain, and cost factors can adversely affect the economics of a project. Our efforts will be unprofitable if we drill dry wells or wells that are productive but do not produce enough reserves to return a profit after drilling, operating and other costs. Further, our drilling operations may be curtailed, delayed or canceled as a result of a variety of factors, including:
|
|
·
|
Increases in the cost of, or shortages or delays in the availability of, drilling rigs and equipment, skilled labor, capital or transportation;
|
|
|
·
|
Unexpected drilling conditions or problems;
|
|
|
·
|
Regulations and regulatory approvals;
|
|
|
·
|
Changes or anticipated changes in energy prices; and
|
|
|
·
|
Compliance with environmental and other governmental requirements.
|
Estimating reserves and future net revenues involves uncertainties. Negative revisions to reserve estimates, oil and natural gas prices or assumptions as to future oil and natural gas prices may lead to decreased earnings, losses, or impairment of oil and gas assets.
Reserve engineering is a subjective process of estimating underground accumulations of oil and gas that cannot be measured in an exact manner. Reserves that are “proved reserves” are those estimated quantities of crude oil, natural gas, and natural gas liquids that geological and engineering data demonstrate with reasonable certainty are recoverable in future years from known reservoirs under existing economic and operating conditions, but should not be considered as a guarantee of results for future drilling projects.
The process relies on interpretations of available geological, geophysical, engineering and production data. There are numerous uncertainties inherent in estimating quantities of proved reserves and in projecting future rates of production and timing of developmental expenditures, including many factors beyond the control of the producer. The reserve data included in this report represent estimates. In addition, the estimates of future net revenues from our proved reserves and the present value of such estimates are based upon certain assumptions about future production levels, prices and costs that may not prove to be correct.
Quantities of proved reserves are estimated based on economic conditions in existence during the period of assessment. Changes to oil and gas prices in the markets for such commodities may have the impact of shortening the economic lives of certain fields because it becomes uneconomic to produce all recoverable reserves on such fields, which reduces proved property reserve estimates.
If negative revisions in the estimated quantities of proved reserves were to occur, it would have the effect of increasing the rates of depreciation, depletion and amortization on the affected properties, which would decrease earnings or result in losses through higher depreciation, depletion and amortization expense. The revisions, as well as revisions in assumptions of future cash flows of these reserves, may also be sufficient to trigger impairment losses on certain properties which would result in a non-cash charge to earnings. Such a decline may result from lower market prices, which may make it uneconomic to drill for and produce higher cost reserves.
Our drilling, production, gathering, processing, and transporting activities involve numerous risks that might result in accidents and other operating risks and hazards.
Our operations are subject to all the risks and hazards typically associated with the development and exploration for, and the production and transportation of oil and gas. These operating risks include, but are not limited to:
|
|
·
|
Fires, blowouts, cratering, and explosions;
|
|
|
·
|
Uncontrolled releases of oil, natural gas, or well fluids;
|
|
|
·
|
Formations with abnormal pressures;
|
|
|
·
|
Operator error;
|
|
|
·
|
Pollution and other environmental risks;
|
|
|
·
|
Natural disasters;
|
|
|
·
|
Damages to pipelines and pipeline blockages;
|
|
|
·
|
Damage inadvertently caused by third party activity; and
|
|
|
·
|
Terrorist attacks or threatened attacks on our facilities or those of other energy companies.
|
These risks could result in loss of human life, personal injuries, significant damage to property, environmental pollution, impairment of our operations and substantial losses to us. In spite of our precautions, an event such as those described above could cause considerable harm to people or property, and could have a material adverse effect on our financial condition and results of operations, particularly if the event is not fully covered by insurance.
We do not insure against all potential losses and could be seriously harmed by unexpected liabilities or by the ability of the insurers we do use to satisfy obligations.
We are not fully insured against all risks inherent to our business, including some environmental accidents that might occur. The occurrence of any operating risks not fully covered by insurance could have a material adverse effect on our business, financial condition, results of operations and cash flows. We also may not be able to maintain or obtain insurance of the type and amount we desire at reasonable rates. In addition, certain insurance companies that provide coverage to us have experienced negative developments that could impair their ability to pay any potential claims. As a result, we could be exposed to greater losses than anticipated.
Costs of environmental liabilities and complying with existing and future environmental regulations, including greenhouse gas emissions, could exceed our current expectations.
Our operations are subject to environmental regulation pursuant to a variety of laws and regulations. Such laws and regulations impose, among other things, restrictions, liabilities, and obligations in connection with the generation, handling, use, storage, extraction, transportation, treatment, and disposal of hazardous substances and wastes in connection with spills, releases, and emissions of various substances into the environment, and in connection with the operation, maintenance, abandonment, and reclamation of our facilities.
Compliance with environmental legislation could require significant expenditures including for clean up costs and damages arising out of contaminated properties. In addition, the possible failure to comply with environmental legislation and regulations might result in the imposition of fines and penalties. Subject to any rights to indemnification, we are generally responsible for all liabilities associated with the environmental condition of our facilities and assets, whether acquired or developed, regardless of when the liabilities arose and whether they are known or unknown. In connection with certain acquisitions and divestitures, we could acquire, or be required to provide indemnification against environmental liabilities that could expose us to material losses, which may not be covered by insurance. In addition, the steps we could be required to take to bring certain facilities into compliance could be prohibitively expensive, and we might be required to shut down, divest or alter the operation of those facilities, which might cause us to incur losses. Although we do not expect that the costs of complying with current environmental laws will have a material adverse effect on our financial condition or results of operations, no assurance can be given that the costs of complying with environmental laws in the future will not have such an effect.
Legislative and regulatory responses related to climate change create financial risk. Many governing bodies have been considering various forms of legislation related to greenhouse gas emissions. Increased public awareness and concern may result in more laws and regulations requiring reductions in or mitigation of the emission of greenhouse gases. Our facilities may be subject to regulation under climate change policies introduced within the next few years. There is a possibility that, when and if enacted, the final form of such legislation could increase our costs of compliance with environmental laws. If we are unable to recover all costs related to complying with climate change regulatory requirements imposed on us, it could have a material adverse effect on our results of operations. To the extent financial markets view climate change and emissions of greenhouse gases as a financial risk, this could negatively impact our cost of and access to capital.
We make assumptions and develop expectations about possible expenditures related to environmental conditions based on current laws and regulations and current interpretations of those laws and regulations. If the interpretation of laws or regulations, or the laws and regulations themselves, change, our assumptions may change. We might not be able to obtain or maintain from time to time all required environmental regulatory approvals for certain development projects. If there is a delay in obtaining any required environmental regulatory approvals or if we fail to obtain and comply with them, the operation of our facilities could be prevented or become subject to additional costs, resulting in potentially material adverse consequences to our operations.
Drilling for oil and gas is an inherently risky business.
Drilling for oil and gas is inherently risky because we make assessments of where hydrocarbon reservoirs exist at considerable depths in the subsurface based on interpretation of geophysical, geological and engineering information and data without the benefit of physical contact with the accumulations of trapped oil and gas we believe can be produced. Finding and producing oil and gas requires the existence of a combination of geologic conditions in the subsurface that include the following: hydrocarbons must have been generated in a sedimentary basin, they must have migrated from the source into the subsurface area of interest, tectonic conditions in the area of interest must have created a trap required for the storage and accumulation of migrating hydrocarbons, and the sedimentary layer in which the hydrocarbons could be stored must have sufficient porosity and permeability to allow the flow of oil and gas into the drilled well bore.
Our oil sales have historically depended on a relatively limited group of customers. The lack of competition for buyers could result in unfavorable sales terms which, in turn, could adversely affect our financial results.
The Argentine domestic refining market is limited. There are five active refiners that constitute 99 percent of the total market. As a result, our oil sales have historically depended on a relatively limited group of customers. The largest of these five companies refines mostly its own crude oil production, while the smallest of the five operates only in the northwest basin of Argentina. The lack of competition in this market could result in unfavorable sales terms which, in turn, could adversely affect our financial results.
Competition in the markets in which we operate may adversely affect our results of operations.
We have numerous competitors in our businesses, and additional competitors may enter our markets. Other companies with which we compete may be able to respond more quickly to new laws or regulations or emerging technologies, or to devote greater resources to the construction, expansion or refurbishment of their assets than we can. In addition, current or potential competitors may make strategic acquisitions or have greater financial resources than we do, which could affect our ability to make investments or acquisitions. There can be no assurance that we will be able to compete successfully against current and future competitors and any failure to do so could have a material adverse effect on our businesses and results of operations.
We are not the operator of all our hydrocarbon interests. Our reliance on others to operate these interests could adversely affect our business and operating results.
We rely on Petrolera as the operator of our Neuquén basin properties which together comprise approximately 80 percent of our total hydrocarbon production in 2009. We also rely on Pan American Energy and ROCH as the operators of the Acambuco concession and the TDF concessions, respectively. As the non-operating partner, we have limited ability to control operations or the associated costs of such operations. The success of those operations is therefore dependent on a number of factors outside our control, including the competence and financial resources of the operators.
Changes in, and volatility of, supply, demand, and prices for crude oil, natural gas and other hydrocarbons have a significant impact on our ability to generate earnings, fund capital requirements, and pay shareholder dividends.
Our revenues, operating results, future rate of growth and the value of our business depends primarily upon the prices we receive for crude oil, natural gas or other hydrocarbons. Price volatility can impact both the amount we receive for our products and the volume of products we sell. Prices also affect the amount of cash flow available for capital expenditures.
Historically, the markets for crude oil, natural gas, and other hydrocarbons have been volatile, and they are likely to continue to be volatile. Wide fluctuations in prices might result from relatively minor changes in the supply of and demand for these commodities, market uncertainty, and other factors that are beyond our control, including:
|
|
·
|
Worldwide and domestic supplies of and demand for electricity, natural gas, petroleum, and related commodities;
|
|
|
·
|
Exploration discoveries throughout the world;
|
|
|
·
|
The level of development investment in the oil and gas industry;
|
|
|
·
|
Turmoil in the Middle East and other producing regions;
|
|
|
·
|
Terrorist attacks on production or transportation assets;
|
|
|
·
|
Weather conditions;
|
|
|
·
|
Strikes, work stoppages, or protests;
|
|
|
·
|
The level of market demand;
|
|
|
·
|
The price and availability of other types of fuels;
|
|
|
·
|
The availability of pipeline capacity;
|
|
|
·
|
Supply disruptions and transportation disruptions;
|
|
|
·
|
The price and level of foreign imports;
|
|
|
·
|
Domestic and foreign governmental regulations and taxes;
|
|
|
·
|
Adherence by Organization of Petroleum Exporting Countries (“OPEC”) member nations to production quotas, and future decisions by OPEC to either increase or decrease quotas;
|
|
|
·
|
Argentine governmental actions;
|
|
|
·
|
The overall economic environment;
|
|
|
·
|
The credit of participants in the markets where hydrocarbon products are bought and sold;
|
|
|
·
|
The adoption of regulations or legislation related to climate change.
|
Future disruptions in the global credit markets may make equity and debt markets less accessible, create a shortage in the availability of credit, and lead to credit market volatility which could limit our ability to grow.
In 2008, public equity markets experienced significant declines and global credit markets experienced a shortage in overall liquidity, resulting in a disruption in the availability of credit. Future disruptions in the global financial marketplace, including the bankruptcy or restructuring of financial institutions, may make equity and debt markets inaccessible, and the availability and cost of credit could increase in the future. Although we have historically funded capital programs and past property acquisitions with our internally generated cash flow, these developments could impair our ability to make acquisitions, finance growth projects, or proceed with capital expenditures as planned.
Oil and gas investments are inherently risky and there is no guarantee that the fiscal conditions that existed at the time of investment will not be changed by the host country.
Oil and gas investments are attractive when stable fiscal conditions exist over the productive life of an investment. There is no guarantee that the fiscal conditions that existed at the time of investment will not be changed by the host country, thereby lowering the future economic return that was anticipated when the decision to invest was made.
The vast amount of international oil and gas reserves are controlled by national oil companies and access to oil and gas reserves and resource potential is limited.
Access to oil and gas reserves and resource potential is becoming more limited over time. Known producing oil and gas reserves under production in developed countries are declining thereby increasing the concentration of oil and gas reserves and resource potential in undeveloped countries that reserve the right to explore and develop such reserves for their national oil companies. This restricts investment opportunities for international oil and gas companies and makes it more difficult to find international oil and gas investment opportunities with economic terms that are attractive.
Potential changes in accounting standards might cause us to revise our financial results and disclosures in the future, which might change the way analysts measure our business or financial performance.
Regulators and legislators continue to take a renewed look at accounting practices, financial disclosures, companies’ relationships with their independent registered public accounting firms, and retirement plan practices. It remains unclear what new laws or regulations will be adopted, and we cannot predict the ultimate impact that any such new laws or regulations could have. In addition, the Financial Accounting Standards Board (FASB) or the SEC could enact new accounting standards that might impact how we are required to record revenues, expenses, assets, liabilities and equity. Any significant change in accounting standards or disclosure requirements could have a material adverse effect on our business, results of operations and financial condition.
Risks Related to the Control Exercised by Williams that Affect Our Business and Corporate Governance.
Williams effectively controls the outcome of actions requiring the approval of our shareholders and there is a risk that Williams’ interests will not be consistent with the interests of our other shareholders.
Williams beneficially owns approximately 68.96 percent of our outstanding ordinary shares. In addition, our executive officers are employees of Williams and three of our seven directors are employees of Williams. Therefore, Williams (a) has the ability to exert substantial influence and actual control over our management policies and affairs, such as our business strategy, purchase or sale of assets, financing, business combinations, and other company transactions, (b) controls the outcome of any matter submitted to our shareholders, including amendments to our memorandum of association and articles of association, and (c) has the ability to elect or remove all of our directors. There is a risk that the interests of Williams and its other affiliates will not be consistent with the interests of our other shareholders. In general, our shareholders do not have an obligation to consider the interests of other shareholders when voting their shares.
Additionally, Williams and its other affiliates could make it more difficult for us to raise capital by selling shares or for us to use our shares in connection with acquisitions or other business arrangements. Williams could also adversely affect the market price of our shares by selling its shares. This concentrated ownership also might delay or prevent a change in control and may impede or prevent transactions in which shareholders might otherwise receive a premium for their shares.
The financial condition and liquidity of Williams affects our access to capital, our credit standing, and our financial condition.
Although we have not relied on debt as a source of capital, if we sought to do so in the future, our credit ratings and ability to access credit would be impacted by Williams’ credit standing. If Williams were to experience a deterioration in its credit standing or financial difficulties, our access to credit and our ratings could be adversely affected.
Williams’ debt agreements contain financial and operating restrictions that may limit our access to credit and affect our ability to operate our business.
Williams’ debt agreements contain covenants that restrict Williams’ and our ability to incur liens to support indebtedness. These covenants could adversely affect our ability to finance our future operations or capital needs or engage in, expand or pursue our business activities and prevent us from engaging in certain transactions that might otherwise be considered beneficial to us. Williams’ ability to comply with the covenants contained in its debt instruments may be affected by events beyond its control, including prevailing economic, financial and industry conditions. If market or other economic conditions continue to deteriorate, Williams’ ability to comply with these covenants may be negatively impacted.
Because we are a “controlled company” as defined by the rules of The Nasdaq Stock Market, we are not required to have the same level of corporate governance that we would otherwise have if we were not a controlled company.
We are a “controlled company” as defined by the rules of The Nasdaq Stock Market because Williams indirectly owns approximately 69 percent of our ordinary shares. Therefore, we are not subject to the requirements of The Nasdaq Stock Market that would otherwise require us to have (a) a majority of independent directors on the Board of Directors, (b) the compensation of executive officers determined by a majority of independent directors or a compensation committee composed solely of independent directors, and (c) a majority of the independent directors or a nominating committee composed solely of independent directors elect or recommend director nominees for selection by the Board of Directors.
Our Board of Directors does not have a compensation committee or any other committees performing similar functions. Compensation decisions for our executive officers are made by Williams and compensation decisions affecting our directors who are not employees of Williams are made by all of the members of the Board of Directors. Please read “Executive Compensation” and “Certain Relationships and Related Transactions, and Director Independence — Transactions with Related Persons — Administrative Services Agreement.” Therefore, we do not and are not required to have the same level of corporate governance that we would otherwise have if we were not a controlled company.
Williams and its affiliates may have conflicts of interest with us and they may favor their own interests to the detriment of our other shareholders. In addition, our executive officers and some of our directors are also officers and/or directors of Williams and/or its other affiliates, and these persons also owe fiduciary duties to those entities.
Williams and its affiliates may have conflicts of interest with us and they may favor their own interests to the detriment of our other shareholders. In general, our shareholders, including Williams, do not have an obligation to consider the interest of other shareholders when voting their shares.
Williams could engage in businesses that directly or indirectly compete with us without any obligation to offer us those opportunities. In addition, although our officers and directors have an obligation to act in our best interest, our executive officers and some of our directors are also officers and/or directors of Williams and/or its other affiliates, and these persons also owe fiduciary duties to those entities. For example, our Chief Executive Officer and the Chairman of our Board of Directors is also an executive officer of Williams. We also have business relationships with Williams, including an administrative services agreement pursuant to which Williams provides us with certain administrative and management services. Please read “Certain Relationships and Related Party Transactions, and Director Independence — Transactions with Related Persons and — Review, Approval or Ratification of Transactions with Related Persons.”
Our executive officers and certain other persons who provide services to us at our headquarters office are employees of Williams, and we rely on Williams to provide us with certain administrative services. The loss of any of these persons or administrative services could have a materially adverse effect on our business and results of operations.
Our executive officers and certain other persons who provide services to us pursuant to an administrative services agreement are employees of Williams. Any service provided under the agreement may be terminated by either us or Williams upon 60 days prior written notice. The loss of any of our key executive officers or other management personnel could have a material adverse effect on our business unless and until we find a qualified replacement. A limited number of persons exist with the requisite experience and skills to serve in our senior management positions and competition for the services of such persons is intense. We may not be able to locate or employ qualified executives or other key employees at a cost competitive with the amounts paid to Williams for the services of these persons.
Williams also provides certain other services to us, such as risk management, internal audit services, and at our headquarters office in Tulsa, Oklahoma, provides office supplies, office space, and computer support pursuant to the administrative services agreement. Please read “Certain Relationships and Related Party Transactions, and Director Independence — Transactions with Related Persons — Administrative Services Agreement.” If Williams did not provide these services, we would be required to provide these services ourselves or to obtain substitute arrangements with third parties. Our cost to replace such services may be significantly higher than the cost we currently pay. In addition, the failure to replace these services in a timely and effective fashion could have a material adverse effect on our business, including our ability to comply with our financial reporting requirements and other rules that apply to public companies.
Risks Associated with Operations in Argentina and Colombia
Our right to explore for, drill for, and produce hydrocarbons is generally derived from participation in concessions and/or exploration and production contracts granted by the governments where we do business, which have a finite term, the expiration or termination of which could materially affect our results.
Our right to explore for, drill for, and produce hydrocarbons is generally derived from participation in concessions or exploration and production contracts granted by the governments where we do business. These agreements have finite terms, the expiration or termination of which could materially affect our results. In Argentina, the terms of the portion of the Entre Lomas concession located in Río Negro province and our three TDF concessions expire in the years 2015 and 2016. The term of a concession can be extended for 10 years with the consent of the Argentine government. However, the government may withhold its consent, or could extend the term of the concession on terms less favorable than those we have today. Refer to the section “Concession Contracts in Argentina” in MD&A for additional discussion about concession extensions.
Argentina has a history of economic instability. Because our operations are exclusively located in Argentina, our operations and financial results have been, and could be in the future, adversely affected by economic, market, currency, and political instability in Argentina as well as measures taken by its government in response to such instability.
Please read “Quantitative and Qualitative Disclosures about Market Risk – Argentine Economic and Political Environment” for a description of Argentina’s economic crisis of 2002 and the government’s reaction to that crisis. Some of those actions had an adverse effect on our results.
Argentina’s economic and political situation continues to evolve, and the Argentine government may enact future regulations or policies that may materially impact, among other items, (i) the realized prices we receive for the commodities we produce and sell as a result of new taxes; (ii) the timing of repatriations of cash to the Cayman Islands; (iii) our asset valuations; and (iv) peso-denominated monetary assets and liabilities.
Strikes, work stoppages, and protests could increase our operating costs, hinder operations, reduce cash flow, and delay growth projects.
Strikes, work stoppages, and protests could arise from the delicate political and economic situation in Argentina and these actions could increase our operating costs, hinder operations, reduce cash flow, and delay growth projects.
Oil sales price realizations for oil produced and sold in Argentina are significantly influenced by Argentine governmental actions. Consequently, sharp increases in oil prices benefit oil producers outside of Argentina more than us.
Historically, the price per barrel for Argentine crude oil was based on the spot market price of West Texas Intermediate crude oil (“WTI”) less a discount for differences in gravity and quality. In the wake of the Argentine economic crises of 2002, and as the price of crude oil increased to record levels over the past several years, politically driven mechanisms were implemented to determine the sale price of oil produced and sold in Argentina. To alleviate the impact of higher crude oil prices on their economy, the Argentine government created an oil export tax and enacted strict price controls on gasoline prices to force producers and refiners to negotiate oil sales prices significantly below international market levels. For further discussion about oil prices, please read the section “Overview of 2009 – Oil and Natural Gas Marketing” in MD&A.
The Argentine government enforces strict price controls over the sale of natural gas.
The government of Argentina enforces strict price controls over the sale of natural gas in the country. These price controls are more strict when gas is destined for residential consumption or to power generators known to primarily serve residential customers. Price controls are less strict for sales to industrial customers and in certain cases can be freely negotiable with industrial customers. As a result, natural gas prices for gas sold in Argentina have, since 2002, been significantly below natural gas price levels in neighboring countries, or below natural gas prices paid by the Argentine government to import natural gas from neighboring countries or for imported LNG. Regulations in Argentina enable the government, under certain conditions, to nominate a producer’s natural gas for residential sales during peak demand seasons requiring a producer to sell gas at prices below $1.00 per mcf. Apco and Petrolera, our equity investee, are required to sell natural gas under these conditions.
Insurgency activity in Colombia could disrupt or delay our operations.
A 40-year armed conflict between the Colombian government and armed anti-government insurgent groups and illegal paramilitary groups is ongoing in Colombia. Insurgents continue to attack civilians and violent guerilla activity continues in many parts of the country.
We have acquired interests in the Middle Magdalena and Llanos basins in Colombia. While neither of the basins is located near the Colombian borders with Ecuador and Venezuela which have been more prone to recent guerilla activity, the ability of the Colombian government to maintain security in the areas where we have operations may not be successful and there is no assurance that guerilla related violence will not affect our operations in the future, resulting in losses or interruptions of our activities.
Risks Related to Regulations that Affect Our Business
The cost and outcome of legal and administrative claims and proceedings against us and our subsidiaries could adversely affect our results and operations.
We are a party to certain proceedings based upon alleged violation of foreign currency regulations as described in Note 11 of Notes to Consolidated Financial Statements under “Item 8. Financial Statements and Supplementary Data.” We anticipate that this matter will remain open for some time. Under the pertinent foreign exchange regulations, the central bank of Argentina may impose significant fines on us. The result of an adverse decision could adversely affect us. In addition, the cost and outcome of any future legal or administrative claims could adversely affect us.
Changes in Argentine laws and regulations to which we are subject, including tax, environmental and employment laws, and regulations, could have a material effect on financial condition and results of operations.
We are subject to numerous laws and regulations in Argentina, which, among others, include those related to taxation, environmental regulations, and employment. Regulation of certain aspects of our business that are currently unregulated in the future and changes in the laws or regulations could materially affect our financial condition and results of operations.
Possible changes in tax laws could affect us and our shareholders.
Tax laws and regulations are highly complex and subject to interpretation, and the tax laws, treaties and regulations to which we are subject may change over time. Our tax filings are based upon our interpretation of the tax laws in effect in various countries at the time that the filings were made. If these laws, treaties or regulations change, or if the taxing authorities do not agree with our interpretation of the effects of such laws, treaties and regulations, it could have a material adverse effect on us. In addition, the manner in which our shareholders are taxed on distributions in connection with our shares could be affected by changes in tax laws, treaties or regulations or the interpretation or enforcement thereof in the jurisdictions in which our shareholders reside. Any the foregoing changes could affect the trading price of our shares.
Risks Related to Employees
Institutional knowledge residing with current employees might not be adequately preserved.
Certain of our employees who have many years of service have extensive institutional knowledge. As these employees reach retirement age, we may not be able to replace them with employees of comparable knowledge and experience. In addition, we may not be able to retain or recruit other qualified individuals, and our efforts at knowledge transfer could be inadequate. If knowledge transfer, recruiting and retention efforts are inadequate, access to significant amounts of internal historical knowledge and expertise could become unavailable to us.
Risks Related to Weather, other Natural Phenomena, and Business Disruption
Our assets and operations can be affected by weather and other natural phenomena.
Our assets and operations can be adversely affected by hurricanes, floods, earthquakes, tornadoes, and other natural phenomena and weather conditions including extreme temperatures, making it more difficult for us to realize the historic rates of return associated with these assets and operations. Insurance may be inadequate, and in some instances, we have been unable to obtain insurance on commercially reasonable terms or insurance has not been available at all. A significant disruption in operations or a significant liability for which we were not fully insured could have a material adverse effect on our business, results of operations and financial condition.
In addition, there is a growing belief that emissions of greenhouse gases may be linked to global climate change. Climate change creates physical and financial risk. To the extent weather conditions are affected by climate change or demand is impacted by laws or regulations associated with climate change, energy use could increase or decrease depending on the duration and magnitude of the changes, leading to either increased investment or decreased revenues.
Acts of terrorism could have a material adverse effect on our financial condition, results of operations and cash flows.
Our assets and others may be targets of terrorist activities that could disrupt our business or cause significant harm to our operations, such as full or partial disruption to our ability to produce, process, transport or distribute oil, natural gas or other commodities. Acts of terrorism as well as events occurring in response to or in connection with acts of terrorism could cause environmental repercussions that could result in a significant decrease in revenues or significant reconstruction or remediation costs, which could have a material adverse effect on our financial condition, results of operations and cash flows.
Risks Related to Dividends and Distributions
Our articles of association provide that the Company may pay dividends or make distributions out of our profits, the share premium account, or as otherwise permitted by law.
In the event we have no profits for a given period and have accumulated deficits, we can make dividend or other distributions to our shareholders from the share premium account, which is similar to the paid in capital account under U.S. GAAP, as long as the distributions do not render us insolvent. If we elect to pay dividends at times when we do not otherwise have current profits or accumulated earnings and profits, such dividends could have a material adverse effect on our financial condition.
ITEM 1B. UNRESOLVED STAFF COMMENTS
None.
ITEM 3. LEGAL PROCEEDINGS
The information called for by this item is provided in Note 11 of Notes to Consolidated Financial Statements under Part II, Item 8 Financial Statements and Supplementary Data, which information is incorporated by reference into this item.
ITEM 4. [RESERVED]
PART II
|
ITEM 5.
|
MARKET FOR REGISTRANT’S COMMON EQUITY, RELATED SHAREHOLDER MATTERS AND ISSUER PURCHASES OF EQUITY SECURITIES
|
Market information, Number of Shareholders and Dividends
Apco’s ordinary shares are traded sporadically on The NASDAQ Capital Market under the symbol “APAGF.” At the close of business on March 9, 2010, there were 29,441,240 of the Company’s ordinary shares, $0.01 par value, outstanding, held by approximately 2,182 holders, including ordinary shares held in street name.
The Company’s articles of association allow the Company to pay dividends or distributions out of the profits of the Company, the Company’s share premium account, or as otherwise permitted by law.
The high and low trade closing sales price ranges and dividends declared by quarter for each of the past two years are as follows:
|
2009
|
2008
|
|||||||||||||||||||||||
|
Quarter
|
High
|
Low
|
Dividend
|
High
|
Low
|
Dividend
|
||||||||||||||||||
|
1st
|
$ | 27.28 | $ | 6.39 | $ | .0200 | $ | 28.39 | $ | 16.15 | $ | .0875 | ||||||||||||
|
2nd
|
$ | 20.40 | $ | 9.91 | $ | .0200 | $ | 29.64 | $ | 18.94 | $ | .0875 | ||||||||||||
|
3rd
|
$ | 27.25 | $ | 16.47 | $ | .0200 | $ | 30.22 | $ | 23.74 | $ | .0875 | ||||||||||||
|
4th
|
$ | 26.00 | $ | 20.05 | $ | .0200 | $ | 29.00 | $ | 22.86 | $ | .0875 | ||||||||||||
The quarterly dividends declared for the ordinary shares were $.02 per share during each of the four quarters of 2009, or $.08 for the year. The current quarterly dividend remains at $.02 cents per share. Future dividends are necessarily dependent upon numerous factors, including, among others, earnings, levels of capital spending, funds required for acquisitions, changes in governmental regulations and changes in crude oil and natural gas prices. The Company reserves the right to change the level of dividend payments or to discontinue or suspend such payments at the discretion of the Board of Directors.
The Company has been advised that: the Company may pay dividends to shareholders only out of its realized or unrealized profits, share premium account or otherwise as permitted by the laws of the Cayman Islands; there are no current applicable Cayman Islands laws, decrees or regulations relating to restrictions on the import or export of capital or exchange controls affecting remittances of dividends, interest and other payments to non-resident holders of the Company’s ordinary shares; there are no limitations either under the laws of the Cayman Islands or under the Company’s memorandum or articles of association restricting the right of foreigners to hold or vote the Company’s ordinary shares; there are no existing laws or regulations of the Cayman Islands imposing taxes or containing withholding provisions to which United States holders of the Company’s ordinary shares are subject; and there are no reciprocal tax treaties between the Cayman Islands and the United States.
Performance Graph
Set forth below is a line graph comparing Apco’s cumulative total shareholder return on its ordinary shares with the cumulative total return of The NASDAQ US and Foreign Securities Index and the NASDAQ US and Foreign Oil & Gas Extraction Index (SIC 1300-1399) for a five-year period commencing December 31, 2004. We will provide shareholders a list of the component companies included in the NASDAQ US and Foreign Oil & Gas Extraction Index upon request.
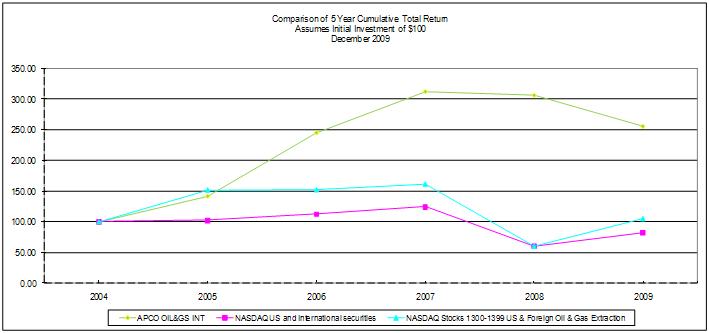
ITEM 6. SELECTED FINANCIAL DATA
The following financial data at December 31, 2009 and 2008, and for each of the three years in the period ended December 31, 2009, should be read in conjunction with Part II, Item 7, Management’s Discussion and Analysis of Financial Condition and Results of Operations and Part II, Item 8, Financial Statements and Supplementary Data of this Form 10-K. The following financial data at December 31, 2007, 2006, and 2005, and for the years ended December 31, 2006 and 2005, has been prepared from our accounting records.
|
(Amounts in thousands except per share amounts)
|
2009
|
2008
|
2007
|
2006
|
2005
|
|||||||||||||||
|
Revenues
|
$ | 72,716 | $ | 69,116 | $ | 62,506 | $ | 57,952 | $ | 41,739 | ||||||||||
|
Equity Income from Argentine investments
|
14,143 | 16,375 | 17,403 | 22,391 | 18,304 | |||||||||||||||
|
Net Income
|
23,527 | 23,825 | 31,385 | 40,108 | 29,854 | |||||||||||||||
|
Amounts attributable to Apco Oil and Gas International Inc.:
|
||||||||||||||||||||
|
Net Income
|
23,497 | 23,793 | 31,349 | 40,062 | 29,846 | |||||||||||||||
|
Income per Ordinary Share
|
0.80 | 0.81 | 1.06 | 1.36 | 1.01 | |||||||||||||||
|
Dividends Declared per Ordinary Share
|
0.08 | 0.35 | 0.35 | 0.325 | 0.2075 | |||||||||||||||
|
Total Assets at December 31
|
224,191 | 202,794 | 190,126 | 164,244 | 132,713 | |||||||||||||||
|
Total Liabilities at December 31
|
18,354 | 17,999 | 18,768 | 14,090 | 12,273 | |||||||||||||||
|
Total Equity at December 31
|
205,837 | 184,795 | 171,358 | 150,154 | 120,440 | |||||||||||||||
Refer to the table “Oil and Natural Gas Production, Prices and Costs” in Part I, Item I for variations in prices that influence our revenues and net income. All share and per share amounts have been adjusted to reflect the four-for-one share split effected in the fourth quarter of 2007.
|
ITEM 7.
|
MANAGEMENT’S DISCUSSION AND ANALYSIS OF FINANCIAL CONDITION AND RESULTS OF OPERATIONS
|
General
We are an international oil and gas exploration and production company focused on South America, with operations in Argentina and Colombia. As of December 31, 2009, we had interests in nine oil and gas producing concessions and one exploration permit in Argentina, and two exploration and production contracts in Colombia.
The global economic recession, resulting lower energy commodity price environment, and challenging financial markets during the past year have modestly impacted our results of operations, cash flow from operations and capital expenditures in 2009 compared to 2008.
In relation to Argentina, the global recession has negatively impacted economic conditions, lowering export revenues and capital inflows to the country, government revenues and tax collections have decreased, and the Argentine peso has weakened. However, drastically lower world prices for energy commodities in 2009 compared with 2008 has not had a material effect on our results of operations as oil prices in Argentina have been artificially low compared to world market prices and price realizations have fluctuated within a relatively narrow range compared to other countries for several years.
Nevertheless, anticipating any possible impact from potentially lower prices, our plan for 2009 was to focus on disciplined growth by reducing and optimizing capital expenditures and operating costs where appropriate. Although capital expenditures were reduced compared to the prior year, we continued to invest in our business with a focus on developing our core properties in the Neuquén basin, completing facility projects to allow for increased production in Tierra del Fuego, and maintaining a modest level of exploration activity. During this period, we also continued a disciplined approach toward seeking investment opportunities to take advantage of our cash reserves and lack of long-term debt in order to expand our presence in our core area in Argentina and to enter new markets outside Argentina to further position our company for future growth.
Our investments of $20.5 million in 2009 were primarily focused on our core areas in the Neuquén basin where we continued our track-record of successful development and exploration drilling campaigns in Entre Lomas, Bajada del Palo and Agua Amarga. Additional highlights for 2009 include the following:
|
|
·
|
Increased total consolidated and equity sales volumes on a barrel of oil equivalent basis by 11 percent;
|
|
|
·
|
Obtained concession extensions for a portion of our properties from the province of Neuquén;
|
|
|
·
|
Declared commerciality on a portion of the Agua Amarga exploration permit, converting 18,000 acres into the Charco del Palenque 25-year exploitation concession;
|
|
|
·
|
Completed additional flowlines and well-connections to allow for increased natural gas production from our Tierra del Fuego concessions; and
|
|
|
·
|
Executed two farm-in agreements in Colombia.
|
For 2009, net income attributable to Apco Oil and Gas International Inc. was $23.5 million compared with $23.8 million for 2008. Net income decreased compared with 2008 as the favorable effects of increased sales volumes and lower exploration expenses were more than offset by lower average oil and LPG sales prices, lower equity income from Argentine investments, and greater income tax expense.
Outlook for 2010
We believe we are well positioned to capture growth opportunities in our targeted areas as economic conditions improve and commodity prices strengthen. The economic environment for the oil and gas industry improved in the second half of 2009 compared to earlier in the year. In addition, economic and commodity price indicators for 2010 reflect continued improvement in the global economic environment. Product prices in Argentina have modestly increased since the second quarter of 2009 and thus far in 2010. We cannot predict if this pricing trend will continue.
Our plan for 2010 is structured around continued development in our core properties, adding to our presence in our region of the Neuquén basin, and completing the initial phases of our exploration projects in Colombia. Accordingly, our specific objectives for the year are to:
|
|
·
|
Obtain the ten-year concession extensions for our properties in Río Negro and Tierra del Fuego;
|
|
|
·
|
Re-commence development drilling in our Northwest and Austral basin properties;
|
|
|
·
|
Complete seismic activities and commence exploration drilling before year-end in Colombia; and
|
|
|
·
|
Continue a disciplined approach toward seeking investment opportunities in both Argentina and Colombia.
|
Our 2010 oil and gas capital expenditure budget including exploration expenditures is $33.6 million net to our consolidated interests. After taking into consideration the portion of capital expenditures attributable to our equity interest in Petrolera, our combined consolidated and equity capital expenditure budget including exploration expenditures for 2010 is $61.2 million. We expect the Company and Petrolera to have sufficient cash reserves and internally generated cash flows to fund these capital expenditures. However, throughout the year, we will review our capital spending program in light of any changing economic conditions and, if necessary, will adjust our planned investments accordingly.
Overview of 2009
Business Development
As we have indicated since 2007, our growth plans include diversification into countries outside of Argentina. Consistent with this strategy, we increased the number of employees dedicated to our objective to build core areas in other parts of South America. In 2008, we opened a branch office to facilitate our efforts to search for opportunities in Colombia. In December 2008, Apco participated in a public bidding process known as “ANH Miniround 2008” for the assignment of certain exploration properties by the government of Colombia. In 2009, our shareholders approved a change in the name of our company from Apco Argentina Inc. to Apco Oil and Gas International Inc. to further represent this evolution.
After extensively evaluating various investment opportunities, in 2009 we successfully executed farm-in agreements to obtain significant interests in two Exploration and Production Contracts covering approximately 200,000 acres in the Llanos and Middle Magdalena basins in Colombia. Both projects are being funded with internally generated cash.
In the Llanos basin, we entered into a farm-in agreement to earn a 20 percent interest in the Llanos 32 Exploration and Production Contract (“Llanos 32”). The Llanos 32 block covers 100,297 acres in the Llanos basin of western Colombia. Apco agreed to fund approximately $5.8 million - or 27 percent - of exploration activities during a three-year period ending in early 2012 to earn its 20 percent non-operated working interest.
The work commitments associated with Llanos 32 include the acquisition of at least 200 square kilometers of 3D seismic and the drilling of at least two exploration wells. In December 2009, the partners commenced activities on Llanos 32 with a 260 square kilometer 3D seismic acquisition program. We expect to spend approximately $2 million net to Apco in 2010 for this seismic activity. The program was designed to cover several leads already identified by the partners. We expect that drilling activities will commence before the end of 2010.
In the Middle Magdalena basin, we entered into a farm-in agreement to earn a 50 percent working interest in the Turpial Exploration and Production Contract “Turpial." The farm-in is subject to governmental approval. Turpial covers 111,066 acres of underexplored area between the Velazquez and Cocorna oil fields in the basin. Under the farm-in agreement, Apco reimbursed the operator of the block $2.6 million in December 2009 for a portion of its first-phase sunk costs and agreed to carry second-phase expenditures up to $1.9 million in order to earn its working interest.
During 2010 the partners plan to comply with second-phase work commitments by extending seismic coverage in the northern area of Turpial with 140 kilometers, or approximately 35,000 acres, of additional 2D seismic. We expect to spend approximately $1 million related to this commitment in 2010.
Subsequent Event
In February 2010, we entered into a farm-in agreement that allows us to acquire, through a “drill to earn” structure, up to a 45 percent net interest in the Coirón Amargo exploration permit in the Neuquén basin. The Coirón Amargo block covers approximately 100,000 acres and is adjacent to our Bajada del Palo and Entre Lomas concessions and close to our Agua Amarga exploration permit. ROCH S.A., the operator of our Austral basin properties, is a partner in and the operator of the Coirón Amargo block. Although this agreement in Coirón Amargo is outside of our joint ventures with Petrolera, this growth opportunity leverages Apco’s experience gained through exploring and developing in the region for over forty years.
Under the agreement, Apco will earn a 22.5 percent non-operated interest for funding the drilling of two exploration wells during 2010. After drilling the first two wells, Apco will have an option to proceed to a second phase and drill two additional wells during the latter part of 2010 and in 2011 enabling us to increase our interest to 45 percent. Additionally, by drilling the two wells in the second phase we will earn a 45 percent interest in a discovery well previously drilled by the partners under the commitments of the exploration permit. We expect to spend between $6 million to $9 million under this agreement in 2010, depending on our determination to proceed to a second phase. Should we proceed to the second phase, we expect to spend an additional $3 million in 2011.
Neuquén Basin Properties
Our core properties in the Neuquén basin continue to produce solid results. Although the joint venture partners reduced capital expenditures in the areas during 2009 compared to 2008, we continued to employ a prudent mix of development and exploration capital to be able to grow our business.
Additionally, a significant accomplishment for the year was extending a portion of the productive lives of our assets in the basin. We obtained ten-year extensions for the Bajada del Palo concession and the portion of the Entre Lomas concession located in the province of Neuquén. The Bajada del Palo concession was extended to September 2025, and the Entre Lomas concession was extended to January 2026. We also declared commerciality on a portion of the Agua Amarga exploration permit, converting approximately 18,000 acres into the Charco del Palenque exploitation concession with a 25 year term and a five-year optional extension period.
Apco and its partners used two rigs throughout 2009 to drill 26 gross development wells and six exploration wells in the areas. All wells were successful. Total gross capital and exploration expenditures was $80.8 million for the year, or $18.6 million net to our 23 percent direct working interest and $24.0 million attributable to our equity interest in Petrolera. Additionally, the partners drilled our first horizontal well in the Bajada del Palo concession, where we believe additional horizontal wells can be drilled in order to maximize production rates and ultimate recovery of reserves. We have a 23 percent direct working interest and an effective 29.85 percent equity interest in the wells mentioned above.
Concession Contracts in Argentina
In 2008, the province of Neuquén established minimum requirements and an estimated timetable for concession holders to negotiate their respective concession extensions. The basic requirements included negotiation of a cash bonus payment, an increase to provincial production taxes, and a future investment program.
In July of 2009, Petrolera concluded the formal negotiation process with the province of Neuquén on behalf of the Entre Lomas and Bajada del Palo joint venture partners. Terms of the agreement include a total bonus of $12.5 million ($2.9 million net to our direct working interest), payable in installments over 18 months commencing in July 2009. Provincial production taxes were increased from the previous rate of 12 percent to 15 percent and could increase up to a maximum of 18 percent depending on future increases in product price realizations. The partners also agreed to spend $237 million gross ($54.5 million net to our direct working interest) for future exploitation and exploration activities in the portion of Entre Lomas located in Neuquén province and in Bajada del Palo over a 17 year period.
For the portion of the Entre Lomas concession located in the province of Río Negro, similar negotiations have begun with the provincial government in 2010. Although we hope those negotiations can be concluded in 2010, we cannot predict when they will be achieved nor the final terms that may be negotiated. Executive and legislative approvals will be required.
The Tierra del Fuego concessions partners have held preliminary discussions with the province of Tierra del Fuego regarding the extension of our three concessions, but the province has not formally initiated a process similar to that conducted by the province of Neuquén.
Oil and Natural Gas Marketing
Oil Prices
Oil prices have a significant impact on our ability to generate earnings, fund capital projects, and pay shareholder dividends. Oil prices are affected by changes in market demands, global economic activity, political events, weather, inventory storage levels, refinery infrastructure capacity, OPEC production quotas, and other factors. Additionally, oil sales price realizations for oil produced and sold in Argentina are significantly influenced by Argentine governmental actions as described in the following paragraphs. As a result, we cannot accurately predict future prices, and therefore it is difficult for us to determine what effect increases or decreases in product prices may have on our capital programs, production volumes, or future revenues.
Historically, the price per barrel for Argentine crude oil was based on the spot market price of West Texas Intermediate crude oil (“WTI”) less a discount for differences in gravity and quality. In the wake of the Argentine economic crises of 2002, and as the price of crude oil increased to record levels over the past several years, politically driven mechanisms were implemented to determine the sale price of oil produced and sold in Argentina. To alleviate the impact of higher crude oil prices on Argentina’s economy, the Argentine government created an oil export tax and enacted strict price controls over gasoline prices to force producers and refiners to negotiate oil sales prices significantly below international market levels.
In response to those governmental actions over the last several years, Argentine producers and refiners had to negotiate domestic oil sale prices that take into consideration both net backs for oil exported from Argentina and the cost of feedstock to refiners in light of gasoline price controls. Consequently, Apco has not benefited from increases in world oil prices over the past several years as have producers outside of Argentina.
The years 2008 and 2009 have been unique for world oil prices as the spot price of WTI reached a peak of $145 per barrel in July 2008, then approached a low of $30 per barrel in December 2008 and have fluctuated throughout 2009. This volatility of world oil prices has not been reflected in our results of operations during 2008 and 2009 due to the price controls and marketing environment in Argentina. Our oil sales price per barrel for our consolidated interests averaged $43.46 for 2009 compared with $46.09 for 2008 and $43.62 in 2007.
As a result of the level of oil sale prices in Argentina when compared with oil sales prices in other countries, oil exploration investments and consequent oil discoveries in Argentina have not been sufficient to replace domestic production. Consequently, oil reserves in the country have been dropping in recent years. We cannot predict how world oil prices will evolve in 2010 and beyond or what additional actions the Argentine government will take in response to either future fluctuations in world oil prices or the drop in the level of the country’s oil reserves.
Natural Gas Prices
We sell our natural gas to Argentine customers pursuant to peso denominated contracts and spot market sales. As a consequence of the strong growth in Argentina’s economy over the past several years, and stimulated by low natural gas prices resulting from a price freeze implemented by the Argentine government in 2002, demand for natural gas in Argentina has grown significantly. However, the unfavorable price environment for producers has acted to discourage natural gas development activities. Without significant development of natural gas reserves in Argentina, the supply of natural gas has failed to keep up with increased demand. The result is a natural gas and power supply shortage in the country. Since 2004, the Argentine government has taken several steps to prevent shortages in the domestic market. Natural gas exports to Chile were suspended and the country began importing natural gas from Bolivia at significantly greater prices than sales prices for natural gas produced in Argentina, and was forced to import high priced LNG. As described in the following paragraphs, Resolution 599/2007 is designed to supply natural gas in the domestic market and provide a framework for natural gas prices in Argentina.
In 2007, the Argentine Secretary of Energy issued Resolution 599/2007 to regulate the supply of natural gas in the domestic market for the period 2007 to 2011 through a natural gas supply agreement referred to as the “Acuerdo 2007-2011.”
The resolution is intended to provide for equitable sharing of all sectors of the internal natural gas market among producers and establishes a mechanism for doing so based on average natural gas volumes produced from 2002 to 2004. The resolution determines which sectors of the market will have priority during periods of peak demand. During peak periods, the residential market will have first priority. With respect to the lower-priced residential market, each producer’s share of the residential market will be distributed based on an allocation of its volumes produced during the period 2002 to 2004, while natural gas production in excess of those volumes can be sold to electric power generators at regulated prices, and industrial customers at freely negotiated prices.
Producers that increased natural gas production since 2004 have an advantage compared to those producers whose production decreased because natural gas prices to residential customers remain frozen at less than 50 cents per Mcf. The resolution allows producers to choose to participate in the Acuerdo 2007-2011 natural gas supply agreement or not. However, if a producer chooses not to participate, then during periods of peak demand, or when there is a shortage of natural gas in the country, the government can force non-participating producers to be the first to supply excess residential volume demand above the base-line demand as projected in the Acuerdo 2007-2011, regardless of the non-participating producer’s contractual commitments.
In general, resolution 599/2007 has had a slightly positive impact on natural gas sales prices in Acambuco and Tierra del Fuego, but, during peak demand periods, it has lowered natural gas sales prices in Entre Lomas. Nevertheless, because natural gas revenues from Entre Lomas represent approximately three percent of our total operating revenues on an annual basis, the overall impact of the resolution is not expected to be material to our cash flows or results of operations. Our average natural gas sale price per Mcf, averaged $1.70 in 2009, $1.46 in 2008, and $1.45 during 2007.
The level of gas reserves in Argentina has been dropping in recent years in a country that is highly dependent on natural gas as a source of energy. Given the government’s tendency to intervene over pricing of a commodity in such high demand, we cannot predict how Argentine natural gas prices will evolve in 2010 and beyond or whether the current Argentine government will continue to maintain tight controls over prices or decide to loosen price controls in response to falling reserves.
Seasonality
Of the products we sell, only natural gas is subject to seasonal demand. Demand for natural gas in Argentina is reduced during the warmer months of October through April, with generally lower natural gas prices during this off-peak period. During 2009, natural gas sales represented 14 percent of our total operating revenues compared with 10 percent in 2008 and 11 percent in 2007. Consequently, the fluctuation in natural gas sales between summer and winter is not significant for the Company.
New Accounting Standards and Emerging Issues
Accounting standards that have been issued and are not yet effective may have a material effect on our Consolidated Financial Statements in the future. See Accounting Standards Issued but Not Yet Adopted in Note 1 of Notes to Consolidated Financial Statements for further information on these and other recently issued accounting standards.
Critical Accounting Policies and Estimates
The preparation of financial statements in accordance with generally accepted accounting principles requires management to make estimates and assumptions. We believe that these particular estimates and assumptions are critical due to their subjective nature and inherent uncertainties, the susceptibility of such matters to change, and the impact of these on our financial condition or results of operations. We have discussed the following accounting estimates and assumptions as well as related disclosures with our Audit Committee.
Proved reserve estimates. Estimates of the Company’s proved reserves included in the unaudited supplemental oil and gas information in this report on Form 10-K are prepared in accordance with guidelines established by GAAP and by the United States Securities and Exchange Commission (“SEC”). The accuracy of a reserve estimate is a function of: (i) the quality and quantity of available data; (ii) the interpretation of that data; (iii) the accuracy of various mandated economic assumptions; and (iv) the judgment of the reserve engineers and geologists that prepare the estimate.
The Company’s proved reserve information is based on estimates prepared by its reserve engineers. Because these estimates depend on many assumptions, all of which may substantially differ from actual results, reserve estimates may be different from the quantities of oil and gas that are ultimately recovered. In addition, results of drilling, testing, and production after the date of an estimate may justify material revisions to the estimate. The Company’s proved reserves are limited to the concession life. Certain of our existing concession terms can be extended for 10 years with the consent of the Argentine government. The extension of our concessions could materially affect the Company’s estimate of proved reserves.
The present value of future net cash flows should not be assumed to be the current market value of the Company’s estimated proved reserves. In accordance with SEC requirements, the Company based the estimated discounted future net cash flows from proved reserves on the 12-month unweighted arithmetic average of the first-day-of-the-month price received for the period January through December 2009 with the most current cost information. Actual future prices and costs may be materially higher or lower than the prices and costs used in the estimate.
Our estimates of proved reserves materially impact depreciation, depletion and amortization expense. If the estimates of proved reserves decline, the rate at which we record depreciation expense increases, reducing net income. Such a decline may result from lower market prices, which may make it uneconomic to drill for and produce higher cost reserves. In addition, the decline in proved reserve estimates may impact the outcome of our assessment of oil and gas producing properties for impairment.
Impairment of oil and gas properties. We review our proved properties for impairment on a concession by concession basis and recognizes an impairment whenever events or circumstances, such as declining oil and gas prices, indicate that a property’s carrying value may not be recoverable. If an impairment is indicated, then a provision is recognized to the extent that the carrying value exceeds the present value of the estimated future net revenues (“fair value”). In estimating future net revenues, we assume costs will escalate annually and apply an oil and gas price forecast that we believe to be reasonable. Due to the volatility of oil and gas prices and governmental regulations in Argentina, it is possible that the our assumptions regarding oil and gas prices may change in the future. However, at prices equivalent to those at year-end 2009, we do not expect to recognize any impairments in the near term. We could, depending upon the results of exploration, determine that some or all of our interests in unproved areas need to be impaired as we drill and evaluate certain of these areas in future periods.
Contingent Liabilities We record liabilities for estimated loss contingencies, including environmental matters, when we assess that a loss is probable and the amount of the loss can be reasonably estimated. Revisions to contingent liabilities are generally reflected in income when new or different facts or information become known or circumstances change that affect the previous assumptions with respect to the likelihood or amount of loss. Liabilities for contingent losses are based upon our assumptions and estimates and upon advice of legal counsel, engineers, or other third parties regarding the probable outcomes of the matter. As new developments occur or more information becomes available, our assumptions and estimates of these liabilities may change. Changes in our assumptions and estimates or outcomes different from our current assumptions and estimates could materially affect future results of operations for any particular quarterly or annual period. See Note 11 of Notes to Consolidated Financial Statements.
RESULTS OF OPERATIONS
Period to Period Comparisons
The table below presents selected financial data summarizing our results of operations for the most recent three years. Please read in conjunction with the Consolidated Statements of Income.
|
For the Years Ended December 31,
|
||||||||||||||||||||||||||||
|
2009
|
$ Change from 2008*
|
% Change from 2008*
|
2008
|
$ Change from 2007*
|
% Change from 2007*
|
2007
|
||||||||||||||||||||||
|
(Amounts in Thousands)
|
||||||||||||||||||||||||||||
|
Operating revenues
|
$ | 72,716 | 3,600 | 5 | % | $ | 69,116 | 6,610 | 11 | % | $ | 62,506 | ||||||||||||||||
|
Total costs and operating expenses
|
55,760 | 347 | 1 | % | 56,107 | (14,249 | ) | -34 | % | 41,858 | ||||||||||||||||||
|
Operating income
|
16,956 | 3,947 | 30 | % | 13,009 | (7,639 | ) | -37 | % | 20,648 | ||||||||||||||||||
|
Investment income
|
14,564 | (2,922 | ) | -17 | % | 17,486 | (1,394 | ) | -7 | % | 18,880 | |||||||||||||||||
|
Argentine income taxes
|
7,993 | (1,323 | ) | -20 | % | 6,670 | 1,473 | 18 | % | 8,143 | ||||||||||||||||||
|
Net Income
|
23,527 | 23,825 | 31,385 | |||||||||||||||||||||||||
|
Less: Net income attributable to noncontrolling interests
|
30 | 2 | 6 | % | 32 | 4 | 11 | % | 36 | |||||||||||||||||||
|
Net income attributable to Apco
|
$ | 23,497 | (296 | ) | -1 | % | $ | 23,793 | (7,556 | ) | -24 | % | $ | 31,349 | ||||||||||||||
* + = Favorable change; — = Unfavorable change; NM = A percentage calculation is not meaningful due to change in signs, a zero-value denominator, or a percentage change greater than 200.
Net Income
2009 vs. 2008 Our Net income attributable to Apco for 2009 was $23.5 million, a decrease of $296 thousand or one percent compared with 2008. Net income attributable to Apco decreased compared with 2008 as the favorable effects of increased sales volumes and lower exploration expenses were more than offset by a combination of lower average oil and LPG sales prices, greater depletion, depreciation and amortization expense, higher selling and administrative expense, lower equity income from Argentine investments, and greater income tax expense.
2008 vs. 2007 Our Net income attributable to Apco for 2008 was $23.8 million, a decrease of $7.6 million or 24 percent compared with $31.3 million for 2007. Net income attributable to Apco decreased year-over-year primarily due to increased costs and operating expenses and lower equity income from Argentine investments which more than offset higher operating revenues.
Total Operating Revenues
Operating revenues for 2009 increased by $3.6 million, or five percent compared with 2008. The following tables and discussion explain the components and variances in Operating revenues.
Changes in oil, natural gas and LPG sales volumes, prices and revenues from 2007 to 2009 for our consolidated interests accounted for as operating revenues are shown in the following tables.
|
Year Ended December 31,
|
||||||||||||||||||||
|
2009
|
% Change
|
2008
|
% Change
|
2007
|
||||||||||||||||
|
Sales Volumes
|
||||||||||||||||||||
|
Consolidated interests
|
||||||||||||||||||||
|
Oil (bbls)
|
1,330,020 | 9 | % | 1,218,896 | 5 | % | 1,159,834 | |||||||||||||
|
Natural Gas (mcf)
|
5,849,497 | 21 | % | 4,850,144 | 1 | % | 4,802,497 | |||||||||||||
|
LPG (tons)
|
10,097 | 16 | % | 8,734 | -5 | % | 9,190 | |||||||||||||
|
Oil, Natural Gas and LPG (boe)
|
2,423,425 | 14 | % | 2,129,747 | 3 | % | 2,068,096 | |||||||||||||
|
Average Sales Prices
|
||||||||||||||||||||
|
Consolidated interests
|
||||||||||||||||||||
|
Oil (per bbl)
|
$ | 43.46 | -6 | % | $ | 46.09 | 6 | % | $ | 43.62 | ||||||||||
|
Natural Gas (per mcf)
|
1.70 | 17 | % | 1.46 | 1 | % | 1.45 | |||||||||||||
|
LPG (per ton)
|
264.33 | -46 | % | 490.27 | 10 | % | 447.65 | |||||||||||||
|
Revenues ($ in thousands)
|
||||||||||||||||||||
|
Oil revenues
|
$ | 57,809 | 3 | % | $ | 56,182 | 11 | % | $ | 50,591 | ||||||||||
|
Natural Gas revenues
|
9,949 | 41 | % | 7,073 | 2 | % | 6,949 | |||||||||||||
|
LPG revenues
|
2,669 | -38 | % | 4,282 | 4 | % | 4,114 | |||||||||||||
| $ | 70,427 | 4 | % | $ | 67,537 | 10 | % | $ | 61,654 | |||||||||||
The volume and price changes in the table above caused the following changes to our oil, natural gas and LPG revenues from 2007 to 2009.
|
Oil
|
Gas
|
LPG
|
Total
|
|||||||||||||
|
(Amounts in Thousands)
|
||||||||||||||||
|
2007 Sales
|
$ | 50,591 | $ | 6,949 | $ | 4,114 | $ | 61,654 | ||||||||
|
Changes due to volumes
|
2,722 | 69 | (224 | ) | 2,568 | |||||||||||
|
Changes due to prices
|
2,868 | 54 | 392 | 3,314 | ||||||||||||
|
2008 Sales
|
56,182 | 7,073 | 4,282 | 67,536 | ||||||||||||
|
Changes due to volumes
|
4,830 | 1,700 | 360 | 6,890 | ||||||||||||
|
Changes due to prices
|
(3,203 | ) | 1,177 | (1,973 | ) | (3,999 | ) | |||||||||
|
2009 Sales
|
$ | 57,809 | $ | 9,949 | $ | 2,669 | $ | 70,427 | ||||||||
Oil Revenues
2009 vs. 2008 During 2009, Oil revenues increased by $1.6 million, or three percent compared with 2008. A nine percent increase in total consolidated oil sales volumes resulted in a positive variance of $4.8 million. Successful drilling in our Neuquén basin properties and increased condensate production in our Austal basin properties were the primary drivers of higher sales volumes. However, the benefit of greater sales volumes was offset by a six percent decrease in average oil sales prices which resulted in a $3.2 million decrease in revenues. For further explanation of oil sales prices in Argentina, please read the section “Oil and Natural Gas Marketing – Oil Prices,” previously discussed in MD&A.
2008 vs. 2007 During 2008, Oil revenues increased by $5.6 million, or 11 percent compared with 2007. For the year, the increase in oil revenues was evenly split between higher sales prices and increased volumes. Initial field re-activation activities in Bajada del Palo and successful drilling in our Neuquén basin properties resulted in greater sales volumes during the 2008.
Natural Gas Revenues
2009 vs. 2008 During 2009, Natural gas revenues increased by $2.9 million, or 41 percent compared with 2008. Production facility enhancements and well-connections in our Tierra del Fuego operations drove a 21 percent increase in consolidated natural gas sales volumes for the year, resulting in a $1.7 million benefit to revenues. Additionally, a 17 percent increase in average natural gas sales prices resulted in a $1.2 million increase in revenues for the year. Higher average natural gas sales prices are primarily attributable to a gas sales contract allowing for a portion of our Tierra del Fuego production volumes to be delivered to higher priced industrial markets. In addition, the Argentine government allowed natural gas sales prices in low priced residential markets to increase from approximately $0.36 per mcf to $0.50 per mcf beginning in the third quarter 2009. For further explanation of natural gas sales prices in Argentina, please read the section “Oil and Natural Gas Marketing – Natural Gas Prices,” previously discussed in MD&A.
LPG Revenues
2009 vs. 2008 LPG revenues decreased by $1.6 million in 2009, or 38 percent compared with 2008, as the benefit of higher volumes was more than offset by lower prices. In 2009, decreased international commodity prices and market conditions in Argentina resulted in a 46 percent decrease in average LPG sales prices, which decreased revenues by $2.0 million.
Other Operating Revenues
2009 vs. 2008 Other operating revenues increased by $710 thousand during 2009 compared with 2008. The majority of our other operating revenues relates to value-added tax collections related to hydrocarbon sales revenues from our operations in Tierra del Fuego. For oil, natural gas, and LPG that is produced on the island of Tierra del Fuego and sold domestically to continental Argentina, sellers are allowed to retain the value-added tax collected from buyers as part of the island’s tax exemption rules. This mechanism effectively increases our realized prices by 21 percent for sales made to the continent. As a result, fluctuations in our other operating revenues are driven by sales revenues from our operations in Tierra del Fuego.
2008 vs. 2007 Other operating revenues increased by $727 thousand during 2008 compared with 2007 due to greater amounts of value-added tax collections resulting from increased sales revenues from our operations in Tierra del Fuego.
Total Costs and Operating Expenses
2009 vs. 2008 Total costs and operating expenses decreased by $347 thousand due to certain offsetting variances. Specifically, lower exploration expense offset increases in certain operating costs as follows:
|
|
·
|
Exploration expense decreased by $4.6 million due to the absence of dry-hole expense for unsuccessful exploratory wells and lower exploration activity including acquiring less amounts of 3D seismic information;
|
|
|
·
|
Depreciation, depletion and amortization (DD&A) increased by $2.2 million, or 16 percent primarily due to increased volumes. See below for a more detailed discussion of DD&A expense; and
|
|
|
·
|
Selling and administrative expense increased by $1.5 million due to higher business development activity reflecting management’s strategy to search for and evaluate growth opportunities and increased salaries and wages.
|
2008 vs. 2007 Total costs and operating expenses increased by $14.2 million, or 34 percent, primarily due to the following factors:
|
|
·
|
Production and lifting costs increased by $4.7 million, or 42 percent due to higher volumes of oil and total fluid volumes lifted and an increase in the number of producing wells in Entre Lomas and Tierra del Fuego resulting from drilling activities. We also incurred greater well-service expenses, increased facility maintenance costs, and higher electricity expense. In addition, we experienced an increase of $2.5 million for incurring a full year’s expenses related to Bajada del Palo and Agua Amarga both of which commenced activities during 2007;
|
|
|
·
|
Exploration expense is greater by $3.4 million reflecting an increase of $1 million due to the acquisition of greater amounts of 3D seismic and other geological and geophysical costs, and an increase of $2.4 million in dry hole expense as a result of drilling more exploration wells outside of our core areas;
|
|
|
·
|
Depreciation, depletion and amortization increased $3.5 million, or 36 percent primarily due to increased unit rates. See below for a more detailed discussion of DD&A expense;
|
|
|
·
|
Selling and administrative expense increased by $1.7 million due to higher business development activity reflecting management’s strategy to search for and evaluate growth opportunities, increased staffing in our Buenos Aires office, increased salaries and wages in response to trending-higher compensation levels in the industry, and greater administrative expenses charged by our joint venture operators;
|
Depreciation, Depletion and Amortization Expenses (“DD&A”)
Our DD&A expense is based on the units-of-production method, which in basic terms multiplies the percentage of estimated proved developed reserves produced each period times the net carrying value of our proved oil and gas properties. Our proved developed reserves are limited to an area’s concession life even though a concession’s term can be extended for 10 years with the consent of the Argentine government. In the third quarter of 2009, the terms for a portion of our concessions were extended until 2025 and 2026. The extensions have had a favorable effect on our average DD&A rates beginning in the third quarter of 2009 compared with prior periods as more proved producing reserves are included in our DD&A calculation, resulting in a lowering of the DD&A rate for those concessions.
The changes in our total volumes, DD&A average rates per unit and DD&A expense of oil and gas properties between 2007 and 2009 are shown in the following table:
|
Year Ended December 31,
|
||||||||||||||||||||||||||||
|
2009
|
Change from 2008
|
% Change from 2008
|
2008
|
Change from 2007
|
% Change from 2007
|
2007
|
||||||||||||||||||||||
|
Consolidated Sales Volumes (boe)
|
2,423,425 | 293,679 | 14 | % | 2,129,747 | 61,650 | 3 | % | 2,068,096 | |||||||||||||||||||
|
DD&A Rate per boe
|
$ | 6.35 | $ | 0.13 | 2 | % | $ | 6.22 | $ | 1.52 | 32 | % | $ | 4.70 | ||||||||||||||
|
DD&A Expense (In thousands)
|
$ | 15,378 | $ | 2,138 | 16 | % | $ | 13,240 | $ | 3,530 | 36 | % | $ | 9,710 | ||||||||||||||
The following table details the increases in DD&A of oil and gas properties between 2007 and 2009 due to the changes in volumes and average DD&A rates presented in the table above:
|
(Thousands)
|
||||
|
2007 DD&A
|
$ | 9,710 | ||
|
Changes due to volumes
|
383 | |||
|
Changes due to rates
|
3,147 | |||
|
2008 DD&A
|
13,240 | |||
|
Changes due to volumes
|
1,864 | |||
|
Changes due to rates
|
274 | |||
|
2009 DD&A
|
$ | 15,378 | ||
2009 vs. 2008 DD&A increased by $2.2 million in 2009 compared with 2008. As seen in the table above, the majority of the increase in DD&A expense was due to greater volumes, which is contrary to our historical trend. Although our DD&A rate increased for the year, in 2009 our year-over-year DD&A rate increased at a decelerating rate, or was only two percent greater than it was in 2008, which is a significantly lower rate compared with previous years including the 32 percent increase we experienced in 2008. Various factors contributed to this deceleration of increased DD&A rates we have experienced, including the previously mentioned concession extensions, the increased proportion of sales volumes on a barrel of oil equivalent basis due to greater natural gas sales volumes from our Tierra del Fuego concessions which lowers our weighted average DD&A rate, and increased proved reserves from successful drilling in our Neuquén basin properties.
2008 vs. 2007 DD&A increased by $3.5 million in 2008 compared with 2007 primarily due to increased DD&A rates. During 2008, the increase in our DD&A rate was primarily a function of adding less proved reserves per well drilled per year as we approached the end of the primary terms of our concessions.
Investment Income
2009 vs. 2008 In 2009, our Total investment income decreased by $2.9 million, or 17 percent, primarily due to a $2.2 million decrease in equity income from Argentine investments. The decrease in our equity income is due to a decrease in the net income of our equity investee, Petrolera. The comparative decrease in Petrolera’s net income is a result of lower oil and LPG sales prices and increased depreciation expense. These two factors more than offset the benefits of greater oil sales volumes attributable to successful exploration and development drilling in our joint operations in the Neuquén basin. Additionally, interest and other income decreased by $690 thousand compared to 2008 due to lower yields on our financial investments and lower balances of cash equivalents.
2008 vs. 2007 In 2008, Total investment income decreased by $1.4 million primarily due to a $1.0 million decrease in equity income from Argentine investments. The decrease in our equity income is due to a decrease in the net income of our equity investee, Petrolera. The comparative decrease in Petrolera’s net income is a result of higher operating costs and depreciation expense attributable to operations in Entre Lomas. Additionally, Petrolera incurred a full year of operating and exploration expenses in 2008 associated with the Bajada del Palo concession and the Agua Amarga exploration permit both of which were acquired in 2007. Petrolera’s income was also impacted by a full year of interest expense on borrowings from its line of credit that was established in the second half of 2007.
Income Taxes
2009 vs. 2008 Income taxes increased by $1.3 million compared to 2008. Although our Income before income taxes is only two percent higher in 2009 compared with 2008, the effective tax rate for the period increased due to higher non-deductible costs including greater foreign exchange losses and higher general and administrative expenses in our home office, lower interest and other income which is not subject to income tax, lower equity earnings from Argentine investments which is recorded on an after-tax basis, and exploration expenses incurred in Colombia which are not deductible until we generate revenues in that country.
2008 vs. 2007 Income taxes decreased by $1.5 million compared to 2007 due to lower taxable income in Argentina compared with 2007.
LIQUIDITY AND CAPITAL RESOURCES
Cash Flow Analysis
We have historically funded capital programs and past property acquisitions with internally generated cash flow. Our direct participation in the Entre Lomas concession and dividends from our equity interest in Petrolera continue to be the largest contributors to our net cash provided by operating activities. We have not relied on debt or equity as sources of capital due to the turmoil that periodically affects Argentina’s economy which makes financing difficult to obtain at reasonable terms. We ended 2009 with $32.4 million of cash and cash equivalents and no bank debt.
As previously discussed in MD&A, world oil prices were sharply lower in 2009 compared to record highs in 2008. Oil price realizations in Argentina were also lower, though not as drastically due to governmental price controls in place. Anticipating any further deterioration in prices, and with increasing investment opportunities to grow our company, we lowered shareholder dividends in second-quarter 2009.
We will continue to monitor our capital programs and the quarterly shareholder dividend as necessary to preserve cash in response to changing economic conditions to provide Apco with the financial resources and liquidity needed to continue development drilling in its core properties over the long-term, meet work commitment obligations, fund new investment opportunities, meet future working capital needs and fund any further cash bonus payments that may be negotiated to obtain concession extensions, if any, while maintaining sufficient liquidity to reasonably protect against unforeseen circumstances requiring the use of funds.
In 2007, Petrolera arranged for a $50 million bank line of credit to fund its share of the acquisition cost for the Bajada del Palo concession and a portion of its capital expenditures. As of December 31, 2008, Petrolera borrowed the full $50 million thereby using the entire line of credit with the bank. In May 2009, an amendment to the initial agreement was made whereby the unpaid principal amount of the line of credit, or $48.4 million as of that date, was consolidated into one loan of $48.4 million. The consolidated loan will be paid in 15 quarterly installments starting in first quarter 2010, and interest will be paid quarterly at Libor plus 2.40% a year.
Petrolera’s ability to pay dividends is dependent upon numerous factors, including its cash flows provided by its operating activities, levels of capital spending, changes in crude oil and natural gas prices, and debt and interest payments. Due to increased capital spending for development and exploration activities in our Neuquén basin properties and Petrolera’s scheduled principal and interest payments, we expect to receive less dividends from Petrolera during the next four years compared with dividends paid over the past three years.
As previously described, we ended 2009 with cash and cash equivalents of $32.4 million, representing a decrease of $1.4 million during the year. The following table summarizes the change in cash and cash equivalents for the periods shown.
Sources (Uses) of Cash
|
Years Ended December 31,
|
||||||||||||
|
2009
|
2008
|
2007
|
||||||||||
|
(Thousands)
|
||||||||||||
|
Net cash provided (used) by:
|
||||||||||||
|
Operating activities
|
$ | 28,262 | $ | 29,236 | $ | 34,482 | ||||||
|
Investing activities
|
(25,295 | ) | (31,105 | ) | (27,844 | ) | ||||||
|
Financing activities
|
(4,352 | ) | (10,317 | ) | (10,325 | ) | ||||||
|
Decrease in cash and cash equivalents
|
$ | (1,385 | ) | $ | (12,186 | ) | $ | (3,687 | ) | |||
Operating Activities
Our net cash provided by operating activities in 2009 decreased by $974 thousand compared with 2008 primarily due to changes in operating assets and liabilities. Additionally, Apco received $5.3 million in dividends from its Argentine investment in Petrolera, compared with $7.0 million in 2008 and $12.5 million in 2006.
Investing Activities
During 2009, we spent $20.5 million for capital expenditures, including $17.9 million primarily related to development and exploration drilling, and $2.6 million as acquisition cost related to our entrance into Colombia. Additionally, $4 million was invested as collateral for a letter of credit for investments in Colombia. We expect to fulfill those investments before January 2011, at which time the collateral will no longer be required. During 2008, we spent a record level of capital expenditures, or $32.2 million.
Financing Activities
Apco paid $4.3 million of dividends to its shareholders in 2009, $10.3 million in 2008, and $10.3 million in 2007.
Capital Expenditures Budget for 2010
Our 2010 capital expenditure plan provides for $33.6 million for development and exploration expenditures and concession bonus payments net to our direct working interests. After taking into consideration the portion of capital expenditures attributable to our equity interest in Petrolera, our combined consolidated and equity capital expenditure budget including exploration expenditures for 2010 is $61.2 million. We expect the Company and Petrolera to have sufficient internally generated cash flows to fund our investment programs. As previously mentioned, throughout 2010 we will review our capital program considering developing circumstances in the world economy and changing energy markets and will adjust capital spending accordingly.
Contractual Obligations
The table below summarizes Apco’s contractual obligations. We expect to fund these contractual obligations with cash and cash generated from operating activities.
|
Obligations per Period
|
||||||||||||||||
|
2010
|
2011
|
Thereafter
|
Total
|
|||||||||||||
|
(Amounts in Thousands)
|
||||||||||||||||
|
International oil and gas activities
|
$ | 11,450 | $ | 4,800 | $ | - | $ | 16,250 | ||||||||
|
Other long-term liabilities
|
- | - | 3,047 | 3,047 | ||||||||||||
|
Total
|
$ | 11,450 | $ | 4,800 | $ | 3,047 | $ | 19,297 | ||||||||
International oil and gas activities includes estimates for remaining drilling or seismic investments pursuant to exploration permit work obligations and bonus payments for concession extensions. As described elsewhere in this report, during 2009 the terms of portions of our concessions located in the province of Neuquén were extended for an additional 10 years. As a result of the extensions, we also agreed to make expenditures for oil and gas activities net to our direct working interest of approximately $12 million during the three year period ending December 31, 2011, $13 million during the three year period ending December 31, 2014, and $29 million between 2015 and 2026. We expect to fund these expenditures with cash provided by operating activities.
Please read Note 10 in the Notes to Consolidated Financial Statements for further discussion about other long-term liabilities which include pension obligations and asset retirement obligations.
Off-Balance Sheet Arrangements
We do not currently use any off-balance sheet arrangements to enhance liquidity and capital resources.
ITEM 7A. QUANTITATIVE AND QUALITATIVE DISCLOSURES ABOUT MARKET RISK
The Company’s operations are exposed to market risks as a result of changes in commodity prices and foreign currency exchange rates.
Commodity Price Risk
The Company has historically not used derivatives to hedge price volatility. As previously mentioned in MD&A, oil sales price realizations for oil produced and sold in Argentina are significantly influenced by Argentine governmental actions. In the current regulatory environment, the combination of hydrocarbon export taxes and strict government controls over Argentine gasoline prices directly impacts net backs for the sale of crude oil in the domestic Argentine market. As a result, our price is impacted more by government controls than changes in world oil prices and our netbacks have not been responsive to fluctuations in world oil prices. Therefore, we cannot accurately predict our future sales prices, and it is difficult for us to determine what effect increases or decreases in world oil prices may have on our results of operations. Our oil sales price per barrel for our consolidated interests averaged $43.46 during 2009 and $43.62 in 2007. During 2008, when the per barrel price of WTI peaked at $145 in July and fell to nearly $30 in December 2008, our average price was $46.09.
Foreign Currency and Operations Risk
Devaluation and inflation are linked. Devaluation of a country’s currency in comparison to other world currencies is generally the result of greater inflation levels in that country relative to other countries.
The majority of the Company’s operations and all of its current production is located in Argentina which has had a history of high levels of inflation and resultant currency devaluation. Therefore, the Company’s financial results may be affected by factors such as changes in foreign currency exchange rates, weak economic conditions, or changes in Argentina’s political climate. During 2002 and 2003, the Company recorded sizeable foreign currency exchange losses due to the significant devaluation of the Argentine peso that occurred as a consequence of Argentina’s economic problems during 2001 and 2002. Since 2003, the Argentine government has used monetary policies to keep the peso to U.S. dollar exchange rate stable at approximately 3.00:1.
Fluctuations in the peso to U.S. dollar exchange rate generally impact us in two ways. The U.S. dollar value of peso denominated financial assets and liabilities fluctuate with changes in the value of the Argentine peso. If the Company has positive net working capital denominated in pesos, a devaluation of the peso will reduce the U.S. dollar value of that net working capital generating a foreign exchange loss. In the same scenario, a negative net working capital balance would generate a foreign exchange gain. Fluctuations in the peso to U.S. dollar exchange rate also impact the dollar value of our gas revenues and expenses incurred in Argentina. A portion of our natural gas is priced in pesos and a significant portion of our operating expense and the general and administrative expenses we incur in Argentina are peso-denominated costs. Oil is priced in U.S. dollars, hence, the value of oil revenues is only subject to currency fluctuations during the period our sales invoices remain outstanding. A devaluation of the peso reduces our gas revenues and peso-denominated costs. However, local governments can use monetary policy to control devaluation even in an environment of high inflation in the country and they generally do.
Argentina’s Central Bank has historically intervened to control exchange rates. As stated above, it has used monetary policy to stabilize Argentina’s peso to U.S. dollar exchange rate during periods of high inflation. Over the last several years, we have experienced a sharp increase in our peso denominated production and lifting costs in great part due to local inflation without a corresponding level of devaluation. History demonstrates that because of government intervention, inflation and devaluation rarely move in tandem, rather they move in cycles. So, after an extended period of inflation without corresponding devaluation, a sudden sharp devaluation will occur in order to complete the cycle. Such a sudden devaluation will impact the company in the manner previously described. At December 31, 2009 the peso to U.S. dollar exchange rate was 3.80:1.
Argentine Economic and Political Environment
During the decade of the 1990’s, Argentina’s government pursued free market policies, including the privatization of state owned companies, deregulation of the oil and gas industry, tax reforms to equalize tax rates for domestic and foreign investors, liberalization of import and export laws and the lifting of exchange controls. The cornerstone of these reforms was the 1991 convertibility law that established an exchange rate of one Argentine peso to one U.S. dollar. These policies were successful as evidenced by the elimination of inflation and substantial economic growth during the early to mid 1990’s. However, throughout the decade, the Argentine government failed to balance its fiscal budget, incurring repeated significant fiscal deficits that by the end of 2001 resulted in the accumulation of $140 billion of debt. The government subsequently defaulted on a significant portion of its debt in early 2002.
In January 2002, the national Congress passed Emergency Law 25,561, which, among other things, overturned the convertibility plan. The government subsequently adopted a floating exchange rate. The Emergency Law directly impacted the Company by establishing a tax on the value of hydrocarbon exports effective April 1, 2002. In addition the government implemented strict controls over the price of natural gas including the freezing prices for residential consumption.
The abandonment of the convertibility plan and the decision to allow the peso to float in international exchange markets resulted in a strong devaluation of the peso. By September 30, 2002, the peso to U.S. dollar exchange rate had increased from 1:1 to 3.74:1. Argentina’s economy has since shown signs of stabilization with economic conditions improving considerably growing at an average annual rate of eight percent until 2008. As a commodity exporter, the country benefited from increases in the price of its agricultural and natural resource exports such as crude oil, generating surpluses in both Argentina’s international trade balance and the government’s fiscal balance. The government, when possible, took advantage of this environment by increasing certain taxes, such as the oil export tax in order to increase its total tax revenues and improve its fiscal balance.
Over the last several years, the government has implemented various price control mechanisms in order to control inflation across many sectors of the economy. In order to shield the Argentine consumer from inflation, the government has implemented price controls over oil, diesel, gasoline and natural gas and imposed greater export taxes that result in lower energy prices in the country. These price controls together with higher taxes impacted the balance of supply and demand for hydrocarbons leading to energy shortages which exist today in Argentina and have created less favorable conditions for energy companies doing business in the country. Given the recent world economic crisis and economic contraction, demand for Argentine exports fell off significantly and Argentina’s economy began to contract. The reduction in economic activity in the country has reduced the previously described energy shortages in Argentina.
In late 2008, a sharp drop in world commodity prices, including oil and agricultural products, has strained Argentina’s economy. Sharply reduced exports resulted in reduced government export revenues and negatively impacted the country’s fiscal balance. Argentina continues to suffer from inflation and in 2009 little to no economic growth.
Cristina Kirchner, wife of former president Nestor Kirchner, was elected president in December 2007. Her term runs through November 2011. She has essentially pursued the same policies as her predecessor. Mrs. Kirchner’s party lost the mid-term congressional elections in 2009, losing control of both houses of Congress.
We cannot predict how the government will react to the present economic and political situation or what government policies will be implemented by this administration or any future administration or what government actions will impact the country’s energy sector and the Company in particular.
ITEM 8. FINANCIAL STATEMENTS AND SUPPLEMENTARY DATA
INDEX TO CONSOLIDATED FINANCIAL STATEMENTS
|
Page
|
|
|
Management’s Annual Report on Internal Control Over Financial Reporting
|
51
|
|
Report of Independent Registered Public Accounting Firm on Internal Control over Financial Reporting
|
52
|
|
Report of Independent Registered Public Accounting Firm
|
53
|
| Report of Independent Registered Public Accounting Firm |
54
|
|
Consolidated Balance Sheets at December 31, 2009 and 2008
|
55
|
|
Consolidated Statements of Income for each year in the three-year period ended December 31, 2009
|
56
|
|
Consolidated Statements of Changes in Equity for each year in the three-year period ended December 31, 2009
|
57
|
|
Consolidated Statements of Cash Flows for each year in the three-year period ended December 31, 2009
|
58
|
|
Notes to Consolidated Financial Statements
|
59
|
MANAGEMENT’S ANNUAL REPORT ON
INTERNAL CONTROL OVER FINANCIAL REPORTING
Management is responsible for establishing and maintaining adequate internal control over financial reporting (as defined in Rules 13a-15(f) and 15d-15(f) under the Securities Exchange Act of 1934). Our internal controls over financial reporting are designed to provide reasonable assurance to our management and board of directors regarding the preparation and fair presentation of financial statements in accordance with accounting principles generally accepted in the United States. Our internal control over financial reporting includes those policies and procedures that (i) pertain to the maintenance of records that, in reasonable detail, accurately and fairly reflect the transactions and dispositions of our assets; (ii) provide reasonable assurance that transactions are recorded as to permit preparation of financial statements in accordance with generally accepted accounting principles, and that our receipts and expenditures are being made only in accordance with authorization of our management and board of directors; and (iii) provide reasonable assurance regarding prevention or timely detection of unauthorized acquisition, use or disposition of our assets that could have a material effect on our financial statements.
All internal control systems, no matter how well designed, have inherent limitations including the possibility of human error and the circumvention or overriding of controls. Therefore, even those systems determined to be effective can provide only reasonable assurance with respect to financial statement preparation and presentation.
Under the supervision and with the participation of our management, including our Chief Executive Officer and Chief Financial Officer, we assessed the effectiveness of our internal control over financial reporting as of December 31, 2009, based on the criteria set forth by the Committee of Sponsoring Organizations of the Treadway Commission (COSO) in Internal Control — Integrated Framework. Based on our assessment we conclude that, as of December 31, 2009, our internal control over financial reporting was effective.
Ernst & Young LLP, our independent registered public accounting firm, has audited our internal control over financial reporting, as stated in their report which is included in this Annual Report on Form 10-K.
REPORT OF INDEPENDENT REGISTERED PUBLIC ACCOUNTING FIRM
ON INTERNAL CONTROL OVER FINANCIAL REPORTING
To the Board of Directors and Shareholders of
Apco Oil and Gas International Inc.
We have audited Apco Oil and Gas International Inc.’s internal control over financial reporting as of December 31, 2009, based on criteria established in Internal Control—Integrated Framework issued by the Committee of Sponsoring Organizations of the Treadway Commission (the COSO criteria). Apco Oil and Gas International Inc.’s management is responsible for maintaining effective internal control over financial reporting, and for its assessment of the effectiveness of internal control over financial reporting included in the accompanying Management’s Annual Report on Internal Control Over Financial Reporting. Our responsibility is to express an opinion on the Company’s internal control over financial reporting based on our audit.
We conducted our audit in accordance with the standards of the Public Company Accounting Oversight Board (United States). Those standards require that we plan and perform the audit to obtain reasonable assurance about whether effective internal control over financial reporting was maintained in all material respects. Our audit included obtaining an understanding of internal control over financial reporting, assessing the risk that a material weakness exists, testing and evaluating the design and operating effectiveness of internal control based on the assessed risk, and performing such other procedures as we considered necessary in the circumstances. We believe that our audit provides a reasonable basis for our opinion.
A company’s internal control over financial reporting is a process designed to provide reasonable assurance regarding the reliability of financial reporting and the preparation of financial statements for external purposes in accordance with generally accepted accounting principles. A company’s internal control over financial reporting includes those policies and procedures that (1) pertain to the maintenance of records that, in reasonable detail, accurately and fairly reflect the transactions and dispositions of the assets of the company; (2) provide reasonable assurance that transactions are recorded as necessary to permit preparation of financial statements in accordance with generally accepted accounting principles, and that receipts and expenditures of the company are being made only in accordance with authorizations of management and directors of the company; and (3) provide reasonable assurance regarding prevention or timely detection of unauthorized acquisition, use, or disposition of the company’s assets that could have a material effect on the financial statements.
Because of its inherent limitations, internal control over financial reporting may not prevent or detect misstatements. Also, projections of any evaluation of effectiveness to future periods are subject to the risk that controls may become inadequate because of changes in conditions, or that the degree of compliance with the policies or procedures may deteriorate.
In our opinion, Apco Oil and Gas International Inc. maintained, in all material respects, effective internal control over financial reporting as of December 31, 2009, based on the COSO criteria.
We also have audited, in accordance with the standards of the Public Company Accounting Oversight Board (United States), the consolidated balance sheets of Apco Oil and Gas International Inc. as of December 31, 2009 and 2008, and the related consolidated statements of income, changes in equity, and cash flows for each of the three years in the period ended December 31, 2009 of Apco Oil and Gas International Inc. and our report dated March 12, 2010 expressed an unqualified opinion thereon. We did not audit the 2009 financial statements of Apco Austral S.A., a majority-owned subsidiary, which statements reflect total assets of $26.3 million and total revenues of $11.2 million, as of and for the year ended December 31, 2009. Those statements were audited by other auditors whose report has been furnished to us, and our opinion on the consolidated financial statements of the Company, insofar as it relates to the amounts included for Apco Austral S.A., is based solely on the report of the other auditors.
|
/s/ ERNST & YOUNG LLP
|
|
|
Tulsa, Oklahoma
|
|
|
March 12, 2010
|
REPORT OF INDEPENDENT REGISTERED PUBLIC ACCOUNTING FIRM
To the Board of Directors and Shareholders of
Apco Oil and Gas International Inc.
We have audited the accompanying consolidated balance sheets of Apco Oil and Gas International Inc. as of December 31, 2009 and 2008, and the related consolidated statements of income, changes in equity, and cash flows for each of the three years in the period ended December 31, 2009. These financial statements are the responsibility of the Company’s management. Our responsibility is to express an opinion on these financial statements based on our audits. We did not audit the 2009 financial statements of Apco Austral S.A., a majority-owned subsidiary, which statements reflect total assets of $26.3 million and total revenues of $11.2 million, as of and for the year ended December 31, 2009. Those statements were audited by other auditors whose report has been furnished to us, and our opinion on the consolidated financial statements of the Company, insofar as it relates to the amounts included for Apco Austral S.A., is based solely on the report of the other auditors.
We conducted our audits in accordance with the standards of the Public Company Accounting Oversight Board (United States). Those standards require that we plan and perform the audit to obtain reasonable assurance about whether the financial statements are free of material misstatement. An audit includes examining, on a test basis, evidence supporting the amounts and disclosures in the financial statements. An audit also includes assessing the accounting principles used and significant estimates made by management, as well as evaluating the overall financial statement presentation. We believe that our audits and the report of other auditors provide a reasonable basis for our opinion.
In our opinion, based on our audits and, for 2009, the report of other auditors, the financial statements referred to above present fairly, in all material respects, the consolidated financial position of Apco Oil and Gas International Inc. at December 31, 2009 and 2008, and the consolidated results of its operations and its cash flows for each of the three years in the period ended December 31, 2009, in conformity with U.S. generally accepted accounting principles.
As discussed in Note 1 to the consolidated financial statements, in 2009 Apco Oil and Gas International Inc. has changed its reserve estimates and related disclosures as a result of adopting new oil and gas reserve estimation and disclosure requirements.
We also have audited, in accordance with the standards of the Public Company Accounting Oversight Board (United States), Apco Oil and Gas International Inc.’s internal control over financial reporting as of December 31, 2009, based on criteria established in Internal Control––Integrated Framework issued by the Committee of Sponsoring Organizations of the Treadway Commission and our report dated March 12, 2010 expressed an unqualified opinion thereon.
|
/s/ ERNST & YOUNG LLP
|
|
|
Tulsa, Oklahoma
|
|
|
March 12, 2010
|
53
REPORT OF INDEPENDENT REGISTERED PUBLIC ACCOUNTING FIRM
To the Board of Directors and Shareholders of
Apco Austral S.A.
We have audited the accompanying consolidated balance sheet of Apco Austral S.A. (the “Company”) as of December 31, 2009, and the related statement of income, shareholders’ equity, and cash flows for the year then ended. These financial statements are the responsibility of the Company’s management. Our responsibility is to express an opinion on these financial statements based on our audit.
We conducted our audit in accordance with the standards of the Public Company Accounting Oversight Board (United States). Those standards require that we plan and perform the audit to obtain reasonable assurance about whether the financial statements are free of material misstatement. The Company is not required to have, nor were we engaged to perform, an audit of its internal control over financial reporting. Our audit included consideration of internal control over financial reporting as a basis for designing audit procedures that are appropriate in the circumstances, but not for the purpose of expressing an opinion on the effectiveness of the Company’s internal control over financial reporting. Accordingly, we express no such opinion. An audit also includes examining, on a test basis, evidence supporting the amounts and disclosures in the financial statements, assessing the accounting principles used and significant estimates made by management, as well as evaluating the overall financial statement presentation. We believe that our audit provides a reasonable basis for our opinion.
In our opinion, such financial statements present fairly, in all material respects, the financial position of Apco Austral S.A. as of December 31, 2009, and the results of its operations and its cash flows for the year then ended, in conformity with accounting principles generally accepted in the United States of America.
Buenos Aires City, Argentina
March 8, 2010
/s/ Deloitte & Co. S.R.L
Guillermo D. Cohen
Partner
APCO OIL AND GAS INTERNATIONAL INC.
CONSOLIDATED BALANCE SHEETS
|
December 31,
|
||||||||
|
2009
|
2008
|
|||||||
|
(Amounts in Thousands Except Share Amounts)
|
||||||||
|
ASSETS
|
||||||||
|
Current assets:
|
||||||||
|
Cash and cash equivalents
|
$ | 32,404 | $ | 33,789 | ||||
|
Accounts receivable
|
9,984 | 9,120 | ||||||
|
Advances to joint venture partners
|
305 | 582 | ||||||
|
Affiliate receivables
|
156 | - | ||||||
|
Inventory
|
2,477 | 2,689 | ||||||
|
Dividend receivable from Argentine investment
|
2,448 | - | ||||||
|
Other current assets
|
2,429 | 2,351 | ||||||
|
Total current assets
|
50,203 | 48,531 | ||||||
|
Property and Equipment:
|
||||||||
|
Cost, successful efforts method of accounting
|
184,168 | 160,600 | ||||||
|
Accumulated depreciation, depletion and amortization
|
(94,354 | ) | (78,924 | ) | ||||
| 89,814 | 81,676 | |||||||
|
Argentine investment, equity method
|
78,028 | 71,711 | ||||||
|
Deferred Argentine income tax asset
|
1,078 | 767 | ||||||
|
Restricted cash and other assets (net of allowance of $623 at December 31, 2009 and $682 at December 31, 2008)
|
5,068 | 109 | ||||||
| $ | 224,191 | $ | 202,794 | |||||
|
LIABILITIES AND SHAREHOLDERS' EQUITY
|
||||||||
|
Current liabilities:
|
||||||||
|
Accounts payable
|
$ | 4,878 | $ | 7,644 | ||||
|
Advances from joint venture partners
|
- | 153 | ||||||
|
Affiliate payables
|
454 | 1,674 | ||||||
|
Accrued liabilities
|
5,662 | 3,384 | ||||||
|
Argentine income taxes payable
|
3,724 | - | ||||||
|
Dividends payable
|
589 | 2,576 | ||||||
|
Total current liabilities
|
15,307 | 15,431 | ||||||
|
Long-term liabilities
|
3,047 | 2,568 | ||||||
|
Contingent liabilites and commitments (Note 11)
|
||||||||
|
Equity:
|
||||||||
|
Shareholders' equity
|
||||||||
|
Ordinary shares, par value $0.01 per share; 60,000,000 shares authorized;29,441,240 shares issued and outstanding
|
295 | 295 | ||||||
|
Additional paid-in capital
|
9,105 | 9,105 | ||||||
|
Accumulated other comprehensive loss
|
(1,390 | ) | (1,270 | ) | ||||
|
Retained earnings
|
197,623 | 176,481 | ||||||
|
Total shareholders' equity
|
205,633 | 184,611 | ||||||
|
Noncontrolling interests in consolidated subsidiaries
|
204 | 184 | ||||||
|
Total equity
|
205,837 | 184,795 | ||||||
|
Total liabilities and equity
|
$ | 224,191 | $ | 202,794 | ||||
The accompanying notes are an integral part of these consolidated financial statements.
APCO OIL AND GAS INTERNATIONAL INC.
CONSOLIDATED STATEMENTS OF INCOME
|
For the Years Ended December 31,
|
||||||||||||
|
2009
|
2008
|
2007
|
||||||||||
|
(Amounts in Thousands Except Per Share Amounts)
|
||||||||||||
|
REVENUES:
|
||||||||||||
|
Oil revenues
|
$ | 57,809 | $ | 56,182 | $ | 50,591 | ||||||
|
Natural Gas revenues
|
9,949 | 7,073 | 6,949 | |||||||||
|
LPG revenues
|
2,669 | 4,282 | 4,114 | |||||||||
|
Other
|
2,289 | 1,579 | 852 | |||||||||
|
Total operating revenues
|
72,716 | 69,116 | 62,506 | |||||||||
|
COSTS AND OPERATING EXPENSES:
|
||||||||||||
|
Production and lifting costs
|
14,998 | 15,820 | 11,133 | |||||||||
|
Provincial production taxes
|
8,541 | 7,934 | 6,966 | |||||||||
|
Transportation and storage
|
807 | 966 | 896 | |||||||||
|
Selling and administrative
|
8,835 | 7,349 | 5,607 | |||||||||
|
Depreciation, depletion and amortization
|
15,430 | 13,278 | 9,764 | |||||||||
|
Exploration expense
|
994 | 5,577 | 2,162 | |||||||||
|
Argentine taxes other than income
|
3,650 | 3,217 | 4,295 | |||||||||
|
Foreign exchange losses (gains)
|
640 | 537 | (20 | ) | ||||||||
|
Other expense
|
1,865 | 1,429 | 1,055 | |||||||||
|
Total costs and operating expenses
|
55,760 | 56,107 | 41,858 | |||||||||
|
TOTAL OPERATING INCOME
|
16,956 | 13,009 | 20,648 | |||||||||
|
INVESTMENT INCOME
|
||||||||||||
|
Interest and other income
|
421 | 1,111 | 1,477 | |||||||||
|
Equity income from Argentine investments
|
14,143 | 16,375 | 17,403 | |||||||||
|
Total investment income
|
14,564 | 17,486 | 18,880 | |||||||||
|
Income before income taxes
|
31,520 | 30,495 | 39,528 | |||||||||
|
Income taxes
|
7,993 | 6,670 | 8,143 | |||||||||
|
NET INCOME
|
23,527 | 23,825 | 31,385 | |||||||||
|
Less: Net income attributable to noncontrolling interests
|
30 | 32 | 36 | |||||||||
|
Net Income attributable to Apco Oil and Gas International Inc.
|
$ | 23,497 | $ | 23,793 | $ | 31,349 | ||||||
|
Amounts attributable to Apco Oil and Gas International Inc.:
|
||||||||||||
|
Earnings per ordinary share – basic and diluted:
|
||||||||||||
|
NET INCOME PER SHARE
|
$ | 0.80 | $ | 0.81 | $ | 1.06 | ||||||
|
Average ordinary shares outstanding – basic and diluted
|
29,441 | 29,441 | 29,441 | |||||||||
The accompanying notes are an integral part of these consolidated financial statements.
APCO OIL AND GAS INTERNATIONAL INC.
CONSOLIDATED STATEMENTS OF CHANGES IN EQUITY
|
Shareholders' Equity
|
||||||||||||||||||||||||||||
|
Ordinary Shares
|
Additional Paid-in Capital
|
Accumulated Other Comprehensive Loss
|
Retained Earnings
|
Total Shareholders' Equity
|
Noncontrolling Interests
|
Total
|
||||||||||||||||||||||
|
(Amounts in Thousands Except Per Share Amounts)
|
||||||||||||||||||||||||||||
|
BALANCE, January 1, 2007 (1)
|
$ | 74 | $ | 9,326 | $ | (1,345 | ) | $ | 141,948 | $ | 150,003 | $ | 151 | $ | 150,154 | |||||||||||||
|
Comprehensive Income:
|
||||||||||||||||||||||||||||
|
Net Income
|
- | - | - | 31,349 | 31,349 | 36 | 31,385 | |||||||||||||||||||||
|
Pension plan liability adjustment in equity and consolidated interests (net of Argentine taxes of $60)
|
- | - | 144 | - | 144 | 144 | ||||||||||||||||||||||
|
Total Comprehensive Income
|
31,529 | |||||||||||||||||||||||||||
|
Four-for-one share split effected as share dividend
|
221 | (221 | ) | - | - | |||||||||||||||||||||||
|
Dividends declared ($0.3250 per share)
|
- | - | - | (10,304 | ) | (10,304 | ) | (21 | ) | (10,325 | ) | |||||||||||||||||
|
BALANCE, December 31, 2007 (1)
|
295 | 9,105 | (1,201 | ) | 162,993 | 171,192 | 166 | 171,358 | ||||||||||||||||||||
|
Comprehensive Income:
|
||||||||||||||||||||||||||||
|
Net Income
|
- | - | - | 23,793 | 23,793 | 32 | 23,825 | |||||||||||||||||||||
|
Pension plan liability adjustment in equity and consolidated interests (net of Argentine taxes of $37)
|
- | - | (69 | ) | - | (69 | ) | - | (69 | ) | ||||||||||||||||||
|
Total Comprehensive Income
|
23,756 | |||||||||||||||||||||||||||
|
Dividends declared ($0.35 per share)
|
- | - | - | (10,305 | ) | (10,305 | ) | (13 | ) | (10,318 | ) | |||||||||||||||||
|
BALANCE, December 31, 2008 (1)
|
295 | 9,105 | (1,270 | ) | 176,481 | 184,611 | 184 | 184,795 | ||||||||||||||||||||
|
Comprehensive Income:
|
||||||||||||||||||||||||||||
|
Net Income
|
- | - | - | 23,497 | 23,497 | 30 | 23,527 | |||||||||||||||||||||
|
Pension plan liability adjustment in equity and consolidated interests (net of Argentine taxes of $57)
|
- | - | (120 | ) | - | (120 | ) | - | (120 | ) | ||||||||||||||||||
|
Total Comprehensive Income
|
23,407 | |||||||||||||||||||||||||||
|
Dividends declared ($0.08 per share)
|
- | - | - | (2,355 | ) | (2,355 | ) | (10 | ) | (2,365 | ) | |||||||||||||||||
|
BALANCE, December 31, 2009 (1)
|
$ | 295 | $ | 9,105 | $ | (1,390 | ) | $ | 197,623 | $ | 205,633 | $ | 204 | $ | 205,837 | |||||||||||||
(1) The accumulated other comprehensive loss is net of tax and consists entirely of the adjustment related to pension plan liability
The accompanying notes are an integral part of these consolidated financial statements.
APCO OIL AND GAS INTERNATIONAL INC.
CONSOLIDATED STATEMENTS OF CASH FLOWS
|
For the Years Ended December 31,
|
||||||||||||
|
2009
|
2008
|
2007
|
||||||||||
|
(Amounts in Thousands Except Per Share Amounts)
|
||||||||||||
|
CASH FLOW FROM OPERATING ACTIVITIES:
|
||||||||||||
|
Net income
|
$ | 23,527 | $ | 23,825 | $ | 31,385 | ||||||
|
Adjustments to reconcile to net cash provided by operating activities:
|
||||||||||||
|
Equity income from Argentine investments
|
(14,143 | ) | (16,375 | ) | (17,403 | ) | ||||||
|
Dividends from Argentine investments
|
5,306 | 6,962 | 12,523 | |||||||||
|
Deferred income tax benefit
|
(315 | ) | (215 | ) | (605 | ) | ||||||
|
Depreciation, depletion and amortization
|
15,430 | 13,278 | 9,764 | |||||||||
|
Changes in accounts receivable
|
(864 | ) | 491 | (2,147 | ) | |||||||
|
Changes in inventory
|
212 | (656 | ) | (290 | ) | |||||||
|
Changes in affiliate receivables
|
(156 | ) | - | - | ||||||||
|
Changes in other current assets
|
(180 | ) | 3,894 | (4,289 | ) | |||||||
|
Changes in accounts payable
|
(3,418 | ) | 985 | 2,687 | ||||||||
|
Changes in advances to/from joint venture partners
|
(154 | ) | (3,688 | ) | 3,258 | |||||||
|
Changes in affiliate payables
|
(1,220 | ) | 1,220 | 146 | ||||||||
|
Changes in accrued liabilities
|
796 | 100 | 484 | |||||||||
|
Changes in income taxes payable
|
3,826 | (1,086 | ) | (2,431 | ) | |||||||
|
Other, including changes in noncurrent assets and liabilities
|
(385 | ) | 501 | 1,400 | ||||||||
|
Net cash provided by operating activities
|
28,262 | 29,236 | 34,482 | |||||||||
|
CASH FLOW FROM INVESTING ACTIVITIES:
|
||||||||||||
|
Property plant and equipment:
|
||||||||||||
|
Capital expenditures
|
(17,916 | ) | (32,202 | ) | (19,433 | ) | ||||||
|
Purchase of properties
|
(2,600 | ) | - | (7,314 | ) | |||||||
|
Short-term investments:
|
||||||||||||
|
Purchase of short-term investments
|
- | (17,130 | ) | (7,780 | ) | |||||||
|
Proceeds from short-term investments
|
- | 18,227 | 6,683 | |||||||||
|
Changes in long-term investments
|
(779 | ) | - | - | ||||||||
|
Changes in noncurrent restricted cash
|
(4,000 | ) | - | - | ||||||||
|
Net cash used in investing activities
|
(25,295 | ) | (31,105 | ) | (27,844 | ) | ||||||
|
CASH FLOW FROM FINANCING ACTIVITIES:
|
||||||||||||
|
Dividends paid to noncontrolling interests
|
(10 | ) | (13 | ) | (21 | ) | ||||||
|
Dividends paid
|
(4,342 | ) | (10,304 | ) | (10,304 | ) | ||||||
|
Net cash used in financing activities
|
(4,352 | ) | (10,317 | ) | (10,325 | ) | ||||||
|
Decrease in cash and cash equivalents
|
(1,385 | ) | (12,186 | ) | (3,687 | ) | ||||||
|
Cash and cash equivalents at beginning of period
|
33,789 | 45,975 | 49,662 | |||||||||
|
Cash and cash equivalents at end of period
|
$ | 32,404 | $ | 33,789 | $ | 45,975 | ||||||
|
Supplemental disclosures of cash flow information:
|
||||||||||||
|
Cash paid during the year for income taxes
|
$ | 4,980 | $ | 6,778 | $ | 8,053 | ||||||
|
________________________
|
||||||||||||
|
* Increases to property, plant and equipment
|
$ | (23,568 | ) | $ | (32,202 | ) | $ | (26,747 | ) | |||
|
Changes in related accounts payable and accrued liabilities
|
3,052 | - | - | |||||||||
|
Capital expenditures
|
$ | (20,516 | ) | $ | (32,202 | ) | $ | (26,747 | ) | |||
The accompanying notes are an integral part of these consolidated financial statements.
APCO OIL AND GAS INTERNATIONAL INC.
NOTES TO CONSOLIDATED FINANCIAL STATEMENTS
|
(1)
|
Description of Business, Basis of Presentation and Summary of Significant Accounting Policies
|
|
|
Description of Business
|
Apco Oil and Gas International Inc. (formerly Apco Argentina Inc.) is an international oil and gas exploration and production company with a focus on South America. Exploration and production will be referred to as “E&P” in this document.
Apco began E&P activities in Argentina in the late 1960s, and as of December 31, 2009, had interests in nine oil and gas producing concessions and one exploration permit in Argentina, and two exploration and production contracts in Colombia. Our producing operations are located in the Neuquén, Austral, and Northwest basins in Argentina. The Company also has exploration activities currently ongoing in both Argentina and Colombia. As of December 31, 2009, all of the Company’s operating revenues and equity income, and all but $2.6 million of its long-lived assets for which we have carrying values on our balance sheet, were in Argentina.
A wholly owned subsidiary of The Williams Companies, Inc. (“Williams”) currently owns 68.96 percent of the outstanding ordinary shares of the Company.
|
|
Basis of Presentation and Principles of Consolidation
|
The consolidated financial statements include the accounts of Apco Oil and Gas International Inc. (a Cayman Islands company) and its subsidiaries, Apco Properties Ltd. (a Cayman Islands company), Apco Austral S.A. (an Argentine corporation), and Apco Argentina S.A. (an Argentine corporation), which as a group are at times referred to in the first person as “we,” “us,” or “our.” We also sometimes refer to Apco as the “Company.”
The Company proportionately consolidates its direct interest of the accounts of its joint ventures into its consolidated financial statements.
Our core operations are our 23 percent working interests in the Entre Lomas, Bajada del Palo and Charco del Palenque concessions and the Agua Amarga exploration permit in the Neuquén basin, and a 40.803 percent equity interest in Petrolera Entre Lomas S.A. (Petrolera, a privately owned Argentine corporation), which is accounted for using the equity method (see Note 2). Petrolera is the operator and owns a 73.15 percent working interest in the same properties. Consequently, Apco’s combined direct consolidated and indirect equity interests in the properties underlying the joint ventures total 52.85 percent. The Charco del Palenque concession is the portion of the Agua Amarga exploration permit which was converted to a 25-year exploitation concession in the fourth quarter of 2009. We sometimes refer to these areas in a group as our “Neuquén basin properties.”
Certain prior year amounts have been reclassified due to our adoption of ASC 810-10-65 “Noncontrolling Interests in Consolidated Financial Statements and we have reclassified certain amounts of transportation costs into selling and administrative expense to conform to current year presentation.
In the fourth quarter of 2007, our Board of Directors approved a four-for-one share split effected in the form of a share dividend. Shareholders received three additional ordinary shares for each ordinary share held. The total number of authorized shares and associated par value per share were unchanged by this action. All share and per share amounts have been adjusted to reflect this share split.
APCO OIL AND GAS INTERNATIONAL INC.
NOTES TO CONSOLIDATED FINANCIAL STATEMENTS — Continued
Summary of Significant Accounting Policies
Use of Estimates
Oil and gas operations are high risk in nature. A successful operation requires that a company deal with uncertainties about the subsurface that even a combination of experience, scientific information and careful evaluation cannot always overcome. Because the Company’s assets are located primarily in Argentina, management has historically been required to deal with the impact of inflation, currency devaluation and currency controls. The preparation of financial statements in conformity with accounting principles generally accepted in the United States requires management to make estimates and assumptions that affect the reported amounts of assets and liabilities and disclosure of contingent assets and liabilities, if any, at the date of the financial statements, and the reported amounts of revenues and expenses during the reporting period. Actual results could differ from those estimates.
Segments
All of the Company’s producing operations which generate revenues are located in Argentina and its only business in Argentina is oil and gas exploration and production. As a result, management views all of the Company’s business and operations to be one segment.
Revenue Recognition
The Company recognizes revenues from sales of oil, gas, and plant products at the time the product is delivered to the purchaser and title has been transferred. Any product produced that has not been delivered is reported as inventory and is valued at the lower of cost or market. When cost is calculated, it includes total per unit operating cost and depreciation. Transportation and storage costs are recorded as expenses when incurred. The Company has had no contract imbalances relating to either oil or gas production.
Cash and Cash Equivalents
The Company considers all investments with a maturity of three months or less when acquired to be cash equivalents.
Inventory Valuation
Includes hydrocarbons and spare-parts materials, which are accounted for at production and acquisition cost, respectively.
Property and Equipment
The Company uses the successful-efforts method of accounting for oil and gas exploration and production operations, whereby costs of acquiring non-producing acreage and costs of drilling successful exploration wells and development costs are capitalized. Costs of unsuccessful exploratory drilling are expensed as incurred. Oil and gas properties are depreciated over their concession life using the units of production method based on proved and proved producing reserves. Non oil and gas property is recorded at cost and is depreciated on a straight-line basis, using estimated useful lives of 3 to 15 years.
APCO OIL AND GAS INTERNATIONAL INC.
NOTES TO CONSOLIDATED FINANCIAL STATEMENTS — Continued
The Company reviews its proved properties for impairment on a property by property basis and recognizes an impairment whenever events or circumstances, such as declining oil and gas prices, indicate that a property’s carrying value may not be recoverable. If an impairment is indicated, then a provision is recognized to the extent that the carrying value exceeds the present value of the estimated future net revenues (“fair value”). In estimating future net revenues, the Company utilizes what we believe are market participation assumptions, including an oil and natural gas price forecast that it believes to be reasonable given the pricing environment in Argentina. Due to the volatility of oil and gas prices, it is possible that the Company’s assumptions regarding oil and gas prices may change in the future.
Unproved properties may include concession acquisition costs and costs of acquired unproved reserves. Concession acquisition costs are assessed annually, or as conditions warrant, for impairment considering our future drilling plans, the remaining concession contract term and recent drilling results. Generally, the costs of acquired unproved reserves are associated with areas to which proved developed producing reserves are also attributed. Additionally, economic recovery of unproved reserves in such areas is not yet supported by actual production or conclusive formation tests, but may be confirmed by our continuing development program. Ultimate recovery of potentially recoverable reserves in areas with established production generally has greater probability than in areas with limited or no prior drilling activity. Costs of acquired unproved reserves are assessed annually, or as conditions warrant, for impairment using estimated future discounted cash flows on a field basis and considering our future drilling plans. If the unproved properties are determined to be productive, the appropriate related costs are transferred to proved oil and gas properties.
The Company records an asset and a liability upon incurrence equal to the present value of each expected future asset retirement obligation (ARO). The ARO asset is depreciated in a manner consistent with the depreciation of the underlying physical asset. We measure changes in the liability due to passage of time by applying an interest method of allocation. This amount is recognized as an increase in the carrying amount of the liability and as a corresponding accretion expense included in other operating expense.
Given the uncertainty inherent in the process of estimating future oil and gas reserves and future oil and gas production streams, the estimate of the number of future wells to be plugged and abandoned could change as new information is obtained. Furthermore, given past uncertainties associated with future levels of inflation in Argentina and devaluation of the peso, any future estimate of the cost to plug and abandon a well is subject to a wide range of outcomes as the estimate is updated as time passes. Finally, adjustments in the total asset retirement obligation included in the Company’s Consolidated Balance Sheets will take into consideration future estimates of inflation and present value factors based on the Company’s credit standing. Given past economic turmoil in Argentina, future inflation rates and interest rates, upon which present value factors are based, as recent history demonstrates, may be subject to large variations over short periods of time. A change in the total asset retirement obligation from year to year can result from changes in the estimate of number of wells that will need to be abandoned, changes in the estimate of the cost to abandon a well and accretion of the obligation.
Net Income per Ordinary Share
Net income per ordinary share is based on the weighted average number of ordinary shares outstanding. Basic and diluted net income per ordinary share are the same, as the Company has not issued any potentially dilutive securities such as stock options.
APCO OIL AND GAS INTERNATIONAL INC.
NOTES TO CONSOLIDATED FINANCIAL STATEMENTS — Continued
Foreign Exchange
The general policy followed in the translation of the Company’s financial statements of foreign operations into United States dollars is in accordance with ASC 830-30, “Translation of Financial Statements,” using the United States dollar as the functional currency. Accordingly, translation gains and losses that arise from exchange rate fluctuations applicable to transactions denominated in a currency other than the United States dollar, are included in results of operations as incurred.
Income Taxes
Deferred income taxes are computed using the liability method and are provided to reflect the future tax consequences of differences between the tax basis of assets and liabilities and their reported amounts in the financial statements.
Fair Value
The carrying amount reported in the balance sheet for cash equivalents, accounts receivable and accounts payable is equivalent to fair value.
Equity Investment Impairment Policy
We evaluate our equity investment for impairment when events or changes in circumstances indicate, in our management’s judgment, that the carrying value of such investment may have experienced an other-than-temporary decline in value. When evidence of loss in value has occurred, we compare our estimate of fair value of the investment to the carrying value of the investment to determine whether an impairment has occurred. If the estimated fair value is less than the carrying value and we consider the decline in value to be other-than-temporary, the excess of the carrying value over the fair value is recognized in the consolidated financial statements as an impairment.
Judgments and assumptions are inherent in our management’s estimate of discounted future cash flows and an asset’s fair value. The use of alternate judgments and/or assumptions could result in the recognition of different levels of impairment charges in the consolidated financial statements.
Recent Accounting Standards
In December 2009, the FASB issued its updates to oil and gas accounting rules to align the oil and gas reserve estimation and disclosure requirements of Extractive Industries - Oil and Gas (Topic 932) with the requirements in the Securities and Exchange Commission’s final rule, Modernization of the Oil and Gas Reporting Requirements, which was issued on December 31, 2008 and is effective for the year ended December 31, 2009. We have adopted these new accounting and disclosure requirements in 2009.
In December 2007, the FASB issued ASC 805 “Business Combinations.” ASC 805 establishes principles and requirements for how an acquirer of a business recognizes and measures, principally at fair value, in its financial statements the identifiable assets acquired, the liabilities assumed, any noncontrolling interest in the acquiree and the goodwill acquired. ASC 805 also requires the expensing of acquisition-related costs as incurred and establishes disclosure requirements to enable the evaluation of the nature and financial effects of the business combination. ASC 805 is effective for business combinations with an acquisition date in fiscal years beginning after December 15, 2008. We have adopted this standard.
APCO OIL AND GAS INTERNATIONAL INC.
NOTES TO CONSOLIDATED FINANCIAL STATEMENTS — Continued
In December 2007, the FASB issued ASC 810-10-65 “Noncontrolling Interests in Consolidated Financial Statements—an amendment of Accounting Research Bulletin No. 51”. ASC 810-10-65 establishes accounting and reporting standards for noncontrolling ownership interests in subsidiaries, formerly referred to as the minority interest. Noncontrolling ownership interests in subsidiaries will be classified in shareholders’ equity, but separately from the parent’s equity. Consolidated net income will include amounts attributable to the parent and the noncontrolling interest. ASC 810-10-65 also establishes disclosure requirements that clearly identify and distinguish between the interests of the parent and the interests of the noncontrolling owners and requires earnings per share calculations based on earnings attributable to the parent company. ASC 810-10-65 is effective on a prospective basis for fiscal years beginning after December 15, 2008, except for the presentation and disclosure provisions. The presentation and disclosure provisions require retrospective application to all periods presented.
The Company adopted ASC 810-10-65 January 1, 2009 We have applied the presentation and disclosure requirements retrospectively for all periods presented.
APCO OIL AND GAS INTERNATIONAL INC.
NOTES TO CONSOLIDATED FINANCIAL STATEMENTS — Continued
There have been no new accounting standards issued, but not yet adopted, that will have a material effect on our financial statements.
Subsequent Events
In February 2010, we entered into a “drill to earn” farm-in agreement in the Neuquén basin. Under the agreement, Apco will earn a 22.5 percent non-operated net interest for funding the drilling of two exploration wells during 2010, with an option to proceed to a second phase and drill two additional wells to increase our net interest to 45 percent. We expect to spend between $6 to $9 million under this agreement in 2010, depending on our determination to proceed to a second phase. Should we proceed to the second phase, we would expect to spend an additional $3 million in 2011.
We have evaluated our disclosure of subsequent events through the time of filing this 10-K with the Securities and Exchange Commission.
|
(2)
|
Investment in Argentine Oil and Gas Company
|
As described in Note 1, the Company uses the equity method to account for its investment in Petrolera, a non-public Argentine corporation. Petrolera’s only business is its operatorship and 73.15 percent interest in the Entre Lomas, Bajada del Palo and Charco del Palenque concessions and the Agua Amarga exploration permit.
In 2007, Petrolera arranged for a $50 million bank line of credit to fund its share of the acquisition cost for the Bajada del Palo concession and a portion of its capital expenditures. As of December 31, 2008, Petrolera borrowed the full $50 million thereby using the entire line of credit with the bank. In May 2009, an amendment to the initial agreement was made whereby the unpaid principal amount of the line of credit, or $48.4 million as of that date, was consolidated into one loan of $48.4 million. The consolidated loan will be paid in 15 quarterly installments starting in first quarter 2010, and interest shall be paid quarterly at Libor plus 2.40% a year.
Under the equity method of accounting, the Company's share of net income (loss) from Petrolera is reflected as an increase (decrease) in its investment accounts and is also recorded as equity income (loss) from Argentine investments. Dividends from Petrolera are recorded as reductions of the Company’s investment. At December 31, 2009, cumulative undistributed earnings in Petrolera were $140.5 million.
The Company’s carrying amount of its investment in Petrolera is greater than its proportionate share of Petrolera’s net equity by $661 thousand. The primary reason for this basis difference is due to goodwill, which is not amortized, recognized on its acquisition of additional Petrolera shares in 2002 and 2003. This basis difference is partially offset by a basis difference created in periods prior to 1991 when the Company accounted for its interest in Petrolera under the cost recovery method, which will be recognized upon full recovery of the Company's investment, and a basis difference due to recognition of a provision for doubtful account associated with a receivable held by Petrolera.
APCO OIL AND GAS INTERNATIONAL INC.
NOTES TO CONSOLIDATED FINANCIAL STATEMENTS — Continued
Petrolera’s financial position at December 31, 2009 and 2008 is as follows. Amounts are stated in thousands:
|
2009
|
2008
|
|||||||
|
Current assets
|
$ | 72,316 | $ | 60,538 | ||||
|
Non current assets
|
208,576 | 193,867 | ||||||
|
Current liabilities
|
47,106 | 33,226 | ||||||
|
Non current liabilities
|
44,175 | 46,707 | ||||||
Petrolera’s results of operations for the years ended December 31, 2009, 2008 and 2007 are as follows. Amounts are stated in thousands:
|
2009
|
2008
|
2007
|
||||||||||
|
Revenues
|
$ | 180,575 | $ | 179,980 | $ | 155,926 | ||||||
|
Expenses other than income taxes
|
124,021 | 116,842 | 83,596 | |||||||||
|
Net income
|
34,286 | 39,932 | 45,023 | |||||||||
|
(3)
|
Restricted Cash and Other Assets
|
Restricted cash and other assets of $5.1 million as of December 31, 2009, includes $4 million of restricted cash. The restricted cash is related to a farm-in agreement for an exploration block in Colombia. As part of the contractual requirements related to the block, Apco issued a $4 million letter of credit in July of 2009. The letter of credit expires on January 12, 2011, and is collateralized by cash. As a result, $4 million is considered restricted and is classified as other noncurrent assets on our balance sheet. The restricted cash is invested in a short-term money market account with a financial institution.
|
(4)
|
Exploratory Well Costs Pending the Determination of Proved Reserves
|
For the years ended December 31, 2009, 2008, and 2007, the changes in capitalized exploratory drilling costs pending the determination of proved reserves are detailed in the table below. The balance as of each year end consisted of wells that were in progress for less than one year.
|
(Amounts in thousands)
|
2009
|
2008
|
2007
|
|||||||||
|
Balance, beginning of year
|
$ | 1,188 | $ | 1,367 | $ | - | ||||||
|
Additions
|
- | 1,188 | 1,367 | |||||||||
|
Transfers to proved properties
|
(1,188 | ) | (445 | ) | - | |||||||
|
Expensed
|
- | (922 | ) | - | ||||||||
|
Total
|
$ | - | $ | 1,188 | $ | 1,367 | ||||||
|
(5)
|
Major Customers
|
Sales to customers with greater than ten percent of total operating revenues consists of the following:
|
|
For the Years Ended December 31,
|
|||||||||||
|
|
2009
|
2008
|
2007
|
|||||||||
|
Petrobras Energía S.A..
|
45.23 | % | 76.5 | % | 74.4 | % | ||||||
|
Esso Petrolera Argentina S.A..
|
25.77 | % | - | - | ||||||||
APCO OIL AND GAS INTERNATIONAL INC.
NOTES TO CONSOLIDATED FINANCIAL STATEMENTS — Continued
Management believes that the credit risk imposed by this concentration is offset by the creditworthiness of these two customers and upon expiration, the oil sales contracts with these customers will be extended or replaced.
|
(6)
|
Related Party Transactions
|
The Company incurred expenses in 2009, 2008, and 2007, from Williams and affiliates for management services, overhead allocation, rent, general and administrative expenses (including the costs of compensating employees of Williams who allocate a portion of their time to managing the affairs of the Company), internal audit services, and purchases of materials and supplies. These charges were incurred by the Company pursuant to an administrative services agreement between the Company and Williams.
The Company sold hydrocarbons to Petrobras Energía S.A., the majority shareholder of Petrolera Entre Lomas S.A, in 2009, 2008, and 2007.
The Company and Northwest Argentina Corporation (“NWA”), a wholly owned subsidiary of Williams, each own a 1.5 percent interest in the Acambuco concession. NWA has no employees and its sole asset is its interest in Acambuco. The Company’s branch office in Argentina provides administrative assistance to NWA. Specifically, the Company pays cash calls and collects revenues pertaining to NWA’s interest.
APCO OIL AND GAS INTERNATIONAL INC.
NOTES TO CONSOLIDATED FINANCIAL STATEMENTS — Continued
As of December 31, 2009 and 2008, the balances of related party transactions were as follows:
|
(Amounts in thousands)
|
||||||||
|
Accounts Receivable
|
December 31,
|
|||||||
|
2009
|
2008
|
|||||||
|
Petrobras Energía S.A.
|
$ | 4,167 | $ | 2,265 | ||||
| $ | 4,167 | $ | 2,265 | |||||
|
Affiliate Receivable
|
||||||||
|
Northwest Argentina Corporation (2)
|
$ | 156 | $ | - | ||||
| $ | 156 | $ | - | |||||
|
Affiliate Payable
|
||||||||
|
Williams Production Company LLC (1)
|
$ | 397 | $ | 316 | ||||
|
Northwest Argentina Corporation (2)
|
- | 1,274 | ||||||
|
The Williams Companies, Inc.
|
57 | 84 | ||||||
| $ | 454 | $ | 1,674 | |||||
For the years ended December 31, 2009, 2008 and 2007, revenues and expenses derived from related party transactions were as follows:
|
(Amounts in thousands)
|
||||||||||||
|
Revenues from hydrocarbons sold
|
2009
|
2008
|
2007
|
|||||||||
|
Petrobras Energía S.A.
|
$ | 32,877 | $ | 51,686 | $ | 45,773 | ||||||
|
Expenses
|
||||||||||||
|
Williams Production Company LLC (1)
|
$ | 1,389 | $ | 1,266 | $ | 913 | ||||||
|
The Williams Companies, Inc.
|
40 | 79 | 79 | |||||||||
| $ | 1,429 | $ | 1,345 | $ | 992 | |||||||
(1) Williams Production Company LLC is a wholly owned subsidiary of The Williams Companies, Inc.
(2) Northwest Argentina Corporation is a wholly owned subsidiary of The Williams Companies, Inc.
APCO OIL AND GAS INTERNATIONAL INC.
NOTES TO CONSOLIDATED FINANCIAL STATEMENTS — Continued
|
(7)
|
Accrued Liabilities
|
At December 31, 2009 and 2008 accrued liabilities consisted of the following:
|
(Amounts in thousands)
|
2009
|
2008
|
||||||
|
Taxes other than income payable
|
$ | 1,155 | $ | 531 | ||||
|
Accrued provincial production taxes
|
820 | 783 | ||||||
|
Accrued payroll and other general and adminstrative expenses
|
873 | 541 | ||||||
|
Accrued oil and gas expenditures
|
1,872 | 671 | ||||||
|
Accrued landowner costs
|
- | 300 | ||||||
|
Other
|
942 | 558 | ||||||
| $ | 5,662 | $ | 3,384 | |||||
|
(8)
|
Income and Other Argentine Taxes
|
The Company incorporated in the Cayman Islands in 1979. Since then, the Company’s income, to the extent that it is derived from sources outside the U.S., is not subject to U.S. income taxes. Also, the Company has been granted an undertaking from the Cayman Islands government, expiring in 2019, to the effect that the Company will be exempt from tax liabilities resulting from tax laws enacted by the Cayman Islands government subsequent to 1979. The Cayman Islands currently has no applicable income tax or corporation tax. All of the Company’s income during 2009, 2008, and 2007 was generated outside the United States.
The effective income tax rate reflected in the Consolidated Statements of Income differs from Argentina’s statutory rate of 35 percent. This is because although the Company incurs income taxes only in Argentina, the country where all of its oil and gas income generating activities are located, the Company also generates income and incurs expenses outside of Argentina that are not subject to income taxes in Argentina or in any other jurisdiction and therefore these amounts do not affect the amount of income taxes paid by the Company. Such items include interest income resulting from the Company’s cash and cash equivalents deposited in its Cayman Island and Bahamas banks, general and administrative expenses incurred by the Company in its headquarters office in Tulsa, Oklahoma, equity income from Argentine investments that is recorded by the Company on an after tax basis, and foreign exchange losses resulting from the devaluation of the peso which are not deductible in Argentina.
The Company recorded expenses for Argentine taxes as presented in the following table. Amounts are stated in thousands. The Company is not subject to taxes in any other jurisdiction.
|
Twelve Months Ended
|
||||||||||||
|
December 31,
|
||||||||||||
|
2009
|
2008
|
2007
|
||||||||||
|
Income taxes:
|
||||||||||||
|
Current
|
$ | 8,308 | $ | 6,885 | $ | 8,748 | ||||||
|
Deferred
|
(315 | ) | (215 | ) | (605 | ) | ||||||
|
Income tax expense
|
$ | 7,993 | $ | 6,670 | $ | 8,143 | ||||||
APCO OIL AND GAS INTERNATIONAL INC.
NOTES TO CONSOLIDATED FINANCIAL STATEMENTS — Continued
Reconciliations from the provision for income taxes from continuing operations at the Argentine statutory rate to the realized provision for income taxes as follows:
|
2009
|
2008
|
2007
|
||||||||||
|
Provision at statutory rate
|
$ | 11,032 | $ | 10,674 | $ | 13,822 | ||||||
|
Increases (decreases) in taxes resulting from:
|
||||||||||||
|
Equity income previously taxed in Argentina
|
(4,950 | ) | (5,703 | ) | (6,091 | ) | ||||||
|
Expenses incurred in non-tax jurisdictions
|
1,486 | 1,374 | 1,094 | |||||||||
|
Income received in non-tax jurisdictions
|
(1,105 | ) | (717 | ) | (1,461 | ) | ||||||
|
U.S. dollar remeasurement effect
|
949 | 713 | 779 | |||||||||
|
Changes in valuation allowance
|
256 | - | - | |||||||||
|
Other - net
|
325 | 329 | - | |||||||||
| $ | 7,993 | $ | 6,670 | $ | 8,143 | |||||||
Argentine income taxes (prepaid) or payable at December 31, 2009 and 2008 were $3.7 million and $(102) thousand, respectively. The deferred Argentine income tax benefit relates primarily to certain costs capitalized for Argentine tax purposes and the tax effect of accrued benefit plan obligations included in Accumulated Other Comprehensive Loss that are expensed for U.S. reporting purposes. The deferred tax asset at December 31 for each of the years presented consists of the following. Amounts are stated in thousands:
|
2009
|
2008
|
|||||||
|
Deferred tax assets:
|
||||||||
|
Defined contribution retirement plan accrual
|
$ | 152 | $ | 165 | ||||
|
Accrued liabilities
|
95 | - | ||||||
|
Property basis difference and asset retirement obligation
|
341 | 162 | ||||||
|
Foreign carryovers
|
294 | - | ||||||
|
Retirement plan obligations
|
452 | 440 | ||||||
|
Total deferred tax assets
|
1,334 | 767 | ||||||
|
Less valuation allowance
|
256 | - | ||||||
|
Net deferred tax assets
|
$ | 1,078 | $ | 767 | ||||
The valuation allowance at December 31, 2009 serves to reduce the recognized tax benefit associated with
a foreign carryover to an amount that will, more likely than not, be realized. We do not expect to be able to utilize $256 thousand of foreign deferred tax assets.
As of December 31, 2009 and December 31, 2008, the Company had no unrecognized tax benefits or reserve for uncertain tax positions.
It is the Company’s policy to recognize tax related interest and penalties as a component of income tax expense. The statute of limitations for income tax audits in Argentina is six years and the tax years 2003 through 2009 remain open to examination.
Tax Disputes - Obligatory Savings Deposit
In August 1993, the Dirección General Impositiva (“DGI”), the Argentine taxing authority, made a claim against Petrolera for a delinquent Obligatory Savings Deposit pertaining to the Entre Lomas joint venture operations, which including interest and indexation for inflation, amounted to 9.2 million Argentine pesos. The Entre Lomas partners did not pay the deposit because of the tax exemption provision included in the original Entre Lomas contract 12,507. After a lengthy judicial process, the Entre Lomas joint venture partners paid the 9.2 million Argentine peso obligatory savings deposit in twelve equal installments during the period July 2000 through June 2001. At the time of payment, the U.S. dollar to Argentine peso exchange rate was 1:1 and the payment was equivalent to $9.2 million, or $2.1 million net to the Company’s direct participation and $2.7 million net to the Company’s equity interest in Petrolera. The devaluation of the Argentine peso in 2001 and 2002 resulted in a substantial loss in the dollar value of deposit that was recognized by the Company as foreign exchange losses in those years. Originally, a request for reimbursement of the deposit was made in June 2005. It was subsequently determined that the due date for reimbursement of the deposit is five years from the date the joint venture partners paid the last installment, or June 30, 2006. On June 27, 2006, Petrolera filed a request for reimbursement on behalf of the joint venture partners. As of the date of this report, Petrolera has not yet received an official written response from the DGI.
APCO OIL AND GAS INTERNATIONAL INC.
NOTES TO CONSOLIDATED FINANCIAL STATEMENTS — Continued
In 2007, the Company recorded a provision for doubtful accounts of $745 thousand for its 23 percent direct interest in the obligatory savings deposit against its financial income and recorded a provision for doubtful accounts of $967 thousand pertaining to its equity interest in Petrolera against its equity income from Petrolera. As of December 31, 2009, the Company has recorded an allowance for doubtful accounts of $623 thousand for its 23 percent direct interest in the obligatory savings deposit and recorded a provision for doubtful accounts of $733 thousand pertaining to its equity interest in Petrolera. The Company had an allowance for doubtful accounts of $682 thousand and $745 thousand for its 23 percent direct interest in the obligatory savings deposit at December 31, 2008 and 2007, respectively. The Company had an allowance for doubtful accounts pertaining to its equity interest in Petrolera of $886 thousand and $967 thousand at December 31, 2008 and 2007, respectively.
The change in the provision for doubtful accounts is due to the U.S. dollar remeasurement of the provision at the year end peso exchange rate. The change in the Company’s provision pertaining to its 23 percent direct interest was recorded against its financial income and the change in the provision pertaining to its equity interest in Petrolera was recorded against its equity income from Petrolera.
|
(9)
|
Defined Contribution Retirement Plan
|
In April 2004, the Company formed a defined contribution retirement benefit plan for its Argentine employees. Assuming the current level of staffing, it is expected that future annual contributions will range between $50 thousand to $150 thousand and will be charged to expense as earned. In March 2010, the Company made a contribution of $96 thousand. This amount was accrued as administrative expense in 2009. The total amount expensed in 2008 was $77 thousand. Plan contributions are based on employees’ current levels of compensation and years of service. Employees vest at a rate of 20 percent per year with full vesting after five years.
APCO OIL AND GAS INTERNATIONAL INC.
NOTES TO CONSOLIDATED FINANCIAL STATEMENTS — Continued
|
(10)
|
Long-Term Liabilities
|
At December 31, 2009 and 2008, long-term liabilities consisted of the following. Amounts are stated in thousands:
|
2009
|
2008
|
|||||||
|
Long-term liabilities
|
||||||||
|
Retirement plan obligations
|
$ | 949 | $ | 942 | ||||
|
Asset retirement obligations
|
2,098 | 1,458 | ||||||
|
Other
|
- | 168 | ||||||
| $ | 3,047 | $ | 2,568 | |||||
Retirement plan obligations represent the Company’s proportionate share of the obligation arising from the pension plan that covers all employees of Petrolera, the operator of the Entre Lomas concession. The Company’s proportionate share of the projected benefit obligation at December 31, 2009 and 2008, was $2.4 million and $2.3 million, respectively, while the fair value of plan assets (which are invested in money market mutual funds and treasury federal funds) was $1.4 million and $1.3 million, respectively. The Company expects its contributions in 2010 to be less than $200 thousand.
|
(11)
|
Contingencies and Commitments
|
Certain conditions may exist as of the date of financial statements which may result in a loss to the Company but which will only be resolved when one or more future events occur or fail to occur. Contingent liabilities are assessed by the Company’s management based on the opinion of the Company's legal counsel and available evidence. Such contingencies could include outstanding lawsuits or claims for possible damages to third parties in the ordinary course of the Company’s business, as well as third party claims arising from disputes concerning the interpretation of legislation. If the assessment of a contingency indicates that it is probable that a loss has been incurred and the amount can be estimated, a liability is accrued. If the assessment indicates that a potential loss contingency is not probable, but is reasonably possible, or is probable but it cannot be estimated, then the nature of the contingent liability, together with an estimate of the possibility of occurrence, is disclosed in a note to the financial statements. Loss contingencies considered remote are not disclosed unless they involve guarantees, in which case the nature of the guarantee is disclosed. However, in some instances in which disclosure is not otherwise required, the Company may disclose contingent liabilities of an unusual nature which, in the judgment of management, may be of interest to the users of the financial statements. As facts concerning contingencies become known to the Company, the Company reassesses its position both with respect to accrued liabilities and other potential exposures.
In November of 2004, the Company received a formal notice from the Banco Central de la Republica Argentina (the Central Bank of Argentina or the “BCRA”), of certain proceedings based upon alleged violation of foreign currency regulations. Specifically, the BCRA claimed that between December of 2001 and November of 2002 the Company failed to bring into the country 100 percent of the foreign currency proceeds from its Argentine oil exports. In 1989, the government established guidelines that required most oil companies to bring into Argentina 30 percent of foreign currency proceeds from exports instead of 100 percent of such proceeds as was generally required of exporters in other industries. In 1991, all foreign exchange controls were lifted by the government. In response to Argentina’s economic crisis of 2001 and 2002, the government reintroduced foreign exchange controls in 2002 and as a result during 2002 the Company repatriated 30 percent of its proceeds from oil exports following the 1989 guidelines. An opinion from Argentina’s Attorney General, however, declared that the benefits granted to the oil and gas industry in 1989 were no longer effective and, therefore, 100 percent of such funds had to be repatriated. This opinion supported the position taken by the Argentine government during 2002. The government then revised its position in 2003 and expressly clarified that oil companies are required to only repatriate 30 percent of such proceeds. The government’s departure from its 2002 position was effective January 1, 2003, leaving some uncertainty in the law with regard to 2002.
APCO OIL AND GAS INTERNATIONAL INC.
NOTES TO CONSOLIDATED FINANCIAL STATEMENTS — Continued
The BCRA audited the Company in 2004 and took the position that 100 percent of its foreign currency proceeds from its 2002 exports were required to be returned to the country rather than only 30 percent, as had been returned to the country by the Company in 2002. The difference for the Company totals $6.2 million. In December 2004, the Company filed a formal response disagreeing with the position taken by the BCRA. In addition, without admitting any wrongdoing, the Company brought into the country $6.2 million and exchanged this amount for Argentine pesos using the applicable exchange rates required by the regulation.
To date, this process has not advanced beyond what is described in the previous paragraphs. The Company anticipates that this matter will remain open for some time. Under the pertinent foreign exchange regulations, the BCRA may impose significant fines on the Company; however, historically few fines have been made effective in those cases where the foreign currency proceeds were brought into the country and traded in the exchange market at the adequate exchange rate and the exporters had reasonable grounds to support their behavior. As a result, it is premature to reach a conclusion as to the probability of an outcome or the amount of any loss to the Company that might result from this proceeding. There have been no new developments with regard to this matter since the Company filed its formal response in December 2004.
Commitments
Commitments for international oil and gas activities including drilling, seismic investments and bonus payments for concession extensions are approximately $16.3 million at December 31, 2009. Additionally, during 2009 the terms of portions of our concessions located in the province of Neuquén were extended for an additional 10 years. As a result of the extensions, we also agreed to make expenditures for oil and gas activities net to our direct working interest of approximately $12 million during the three year period ending December 31, 2011, $13 million during the three year period ending December 31, 2014, and $29 million between 2015 and 2026.
APCO OIL AND GAS INTERNATIONAL INC.
NOTES TO CONSOLIDATED FINANCIAL STATEMENTS — Continued
|
(12)
|
Quarterly Financial Data (Unaudited)
|
|
First
|
Second
|
Third
|
Fourth
|
|||||||||||||
|
Quarter
|
Quarter
|
Quarter
|
Quarter
|
|||||||||||||
|
(Amounts in Thousands Except Per Share Amounts)
|
||||||||||||||||
|
2009
|
||||||||||||||||
|
Operating revenues
|
$ | 17,257 | $ | 15,818 | $ | 19,059 | $ | 20,582 | ||||||||
|
Costs and expenses
|
13,980 | 12,190 | 14,701 | 14,889 | ||||||||||||
|
Investment Income
|
3,212 | 3,562 | 3,585 | 4,205 | ||||||||||||
|
Net income
|
5,025 | 5,398 | 6,328 | 6,776 | ||||||||||||
|
Amounts attributable to Apco Oil and Gas International Inc.:
|
||||||||||||||||
|
Net Income
|
5,018 | 5,394 | 6,319 | 6,766 | ||||||||||||
|
Net income per ordinary share
|
0.17 | 0.18 | 0.21 | 0.23 | ||||||||||||
|
2008
|
||||||||||||||||
|
Operating revenues
|
$ | 15,605 | $ | 17,500 | $ | 17,675 | $ | 18,336 | ||||||||
|
Costs and expenses
|
11,122 | 13,652 | 14,818 | 16,515 | ||||||||||||
|
Investment Income
|
3,643 | 4,621 | 4,156 | 5,066 | ||||||||||||
|
Net income
|
6,456 | 7,201 | 5,735 | 4,433 | ||||||||||||
|
Amounts attributable to Apco Oil and Gas International Inc.:
|
||||||||||||||||
|
Net Income
|
6,449 | 7,192 | 5,727 | 4,425 | ||||||||||||
|
Net income per ordinary share
|
0.22 | 0.24 | 0.19 | 0.16 | ||||||||||||
APCO OIL AND GAS INTERNATIONAL INC.
UNAUDITED SUPPLEMENTAL OIL AND GAS INFORMATION
Oil and Natural Gas Reserves
Proved Oil, Condensate and Plant Products
The following table summarizes changes in quantities and balances of net proved oil, condensate and plant product reserves for each of the years presented. All of our reserves are located in Argentina. Ninety-nine percent of net proved reserves as of December 31, 2009, were audited by our independent reserve engineer, Ralph E. Davis Associates, Inc., and one percent was audited by RPS Energy. Ninety-nine percent of net proved reserves as of December 31, 2008, were reviewed and certified by Ralph E. Davis Associates, Inc., and one percent was audited by Gaffney, Cline & Associates, Inc. Ninety-six percent of the net proved reserves as of December 31, 2007, was estimated by Ryder Scott Company, L.P.
|
(Millions of Barrels)
|
||||||||||||
|
Interests
|
||||||||||||
|
Consolidated
|
Equity
|
Combined
|
||||||||||
|
December 31, 2006
|
10.4 | 11.4 | 21.8 | |||||||||
|
Revisions of previous estimates:
|
||||||||||||
|
Engineering revisions
|
0.2 | - | 0.2 | |||||||||
|
Extensions and discoveries
|
0.4 | 0.5 | 0.9 | |||||||||
|
Acquisition of reserves
|
0.4 | 0.5 | 0.9 | |||||||||
|
Production
|
(1.3 | ) | (1.4 | ) | (2.7 | ) | ||||||
|
December 31, 2007
|
10.1 | 11.0 | 21.1 | |||||||||
|
Proved developed as of December 31, 2007
|
6.2 | 6.8 | 13.0 | |||||||||
|
Proved undeveloped as of December 31, 2007
|
3.9 | 4.2 | 8.1 | |||||||||
|
December 31, 2007
|
10.1 | 11.0 | 21.1 | |||||||||
|
Revisions of previous estimates:
|
||||||||||||
|
Engineering revisions
|
(0.1 | ) | 0.2 | 0.1 | ||||||||
|
Extensions and discoveries
|
0.9 | 0.9 | 1.8 | |||||||||
|
Production
|
(1.4 | ) | (1.6 | ) | (3.0 | ) | ||||||
|
December 31, 2008
|
9.5 | 10.5 | 20.0 | |||||||||
|
Proved developed as of December 31, 2008
|
6.4 | 6.9 | 13.3 | |||||||||
|
Proved undeveloped as of December 31, 2008
|
3.1 | 3.6 | 6.7 | |||||||||
|
December 31, 2008
|
9.5 | 10.5 | 20.0 | |||||||||
|
Revisions of previous estimates:
|
||||||||||||
|
Engineering revisions
|
0.7 | 0.8 | 1.5 | |||||||||
|
Extensions and discoveries
|
1.9 | 2.5 | 4.4 | |||||||||
|
Contract modifications
|
1.3 | 1.7 | 3.0 | |||||||||
|
Production
|
(1.6 | ) | (1.7 | ) | (3.2 | ) | ||||||
|
December 31, 2009
|
11.9 | 13.8 | 25.8 | |||||||||
|
Proved developed as of December 31, 2009
|
7.5 | 8.5 | 16.1 | |||||||||
|
Proved undeveloped as of December 31, 2009
|
4.4 | 5.3 | 9.7 | |||||||||
APCO OIL AND GAS INTERNATIONAL INC.
UNAUDITED SUPPLEMENTAL OIL AND GAS INFORMATION
Natural Gas
The following table summarizes changes in quantities and balances of net proved natural gas reserves for each of the years presented. All of our reserves are located in Argentina. As of December 31, 2009, 84 percent of the net proved natural gas reserves was audited by Ralph E. Davis, Inc., and 16 percent was audited by RPS Energy. As of December 31, 2008, 85 percent of the net proved natural reserves was reviewed and certified by Ralph E. Davis, Inc., and 15 percent was audited by Gaffney, Cline & Associates, Inc. As of December 31, 2007, all of our net proved natural gas reserves were estimated by Ryder Scott Company, L.P.
|
(Billions of Cubic Feet)
|
||||||||||||
|
Interests
|
||||||||||||
|
Consolidated
|
Equity
|
Combined
|
||||||||||
|
December 31, 2006
|
54.1 | 27.9 | 82.0 | |||||||||
|
Revisions of previous estimates:
|
||||||||||||
|
Engineering revisions
|
2.1 | (0.8 | ) | 1.3 | ||||||||
|
Extensions and discoveries
|
1.6 | 0.6 | 2.2 | |||||||||
|
Acquisition of reserves
|
- | - | - | |||||||||
|
Production
|
(6.2 | ) | (3.6 | ) | (9.8 | ) | ||||||
|
December 31, 2007
|
51.6 | 24.1 | 75.7 | |||||||||
|
Proved developed as of December 31, 2007
|
33.7 | 19.3 | 53.0 | |||||||||
|
Proved undeveloped as of December 31, 2007
|
17.9 | 4.8 | 22.7 | |||||||||
|
December 31, 2007
|
51.6 | 24.1 | 75.7 | |||||||||
|
Revisions of previous estimates:
|
||||||||||||
|
Engineering revisions
|
9.9 | 1.6 | 11.5 | |||||||||
|
Extensions and discoveries
|
6.3 | 1.6 | 7.9 | |||||||||
|
Production
|
(6.2 | ) | (3.4 | ) | (9.6 | ) | ||||||
|
December 31, 2008
|
61.6 | 23.9 | 85.5 | |||||||||
|
Proved developed as of December 31, 2008
|
40.3 | 18.8 | 59.1 | |||||||||
|
Proved undeveloped as of December 31, 2008
|
21.3 | 5.1 | 26.4 | |||||||||
|
December 31, 2008
|
61.6 | 23.9 | 85.5 | |||||||||
|
Revisions of previous estimates:
|
||||||||||||
|
Engineering revisions
|
1.9 | 0.7 | 2.6 | |||||||||
|
Extensions and discoveries
|
7.5 | 9.7 | 17.2 | |||||||||
|
Contract modifications
|
4.3 | 5.6 | 9.9 | |||||||||
|
Production
|
(7.5 | ) | (3.8 | ) | (11.3 | ) | ||||||
|
December 31, 2009
|
67.8 | 36.1 | 103.9 | |||||||||
|
Proved developed as of December 31, 2009
|
44.0 | 23.0 | 67.0 | |||||||||
|
Proved undeveloped as of December 31, 2009
|
23.8 | 13.1 | 36.9 | |||||||||
|
|
·
|
A portion of our natural gas reserves are consumed in field operations. The volume of natural gas reserves for 2007, 2008, and 2009 estimated to be consumed in field operations included as proved natural gas reserves within consolidated interest is 16.5 bcf, 14.8 bcf, and 13.8 bcf, respectively, and within the equity interest is 15.6 bcf, 13.7 bcf, and 14.3 bcf.
|
APCO OIL AND GAS INTERNATIONAL INC.
UNAUDITED SUPPLEMENTAL OIL AND GAS INFORMATION
The increase in total proved net oil and gas reserves for 2009 is attributable to three factors: (i) successful results of development drilling that resulted in upgrading reserves previously classified as probable and possible to proved; (ii) successful exploration discoveries; and (iii) obtaining ten-year concession extensions on certain of our properties. There were no estimates of total proved net oil or gas reserves filed with any other United States Federal authority or agency during any of the years presented.
Standardized Measure of Discounted Future Net Cash Flows Relating to Proved Oil and Gas Reserves
The following is based on the estimated quantities of proved reserves. During 2009 we adopted prescribed accounting revisions associated with oil and gas authoritative guidance. Those revisions include using the 12-month average price computed as an un-weighted arithmetic average of the price as of the first day of each month, unless prices are defined by contractual arrangements. These revisions are reflected in our 2009 amounts. For the year-ended December 31, 2009, the average oil price used in the estimates was $43.62 per barrel. For the years ended December 31, 2008 and 2007, the year-end oil prices used in the estimates were $46.94 and $42.35 per barrel.
Future natural gas sales are priced at $1.93 per mcf. Future natural gas revenues included in the standardized measure consist of estimated natural gas production volumes, net of natural gas volumes consumed in operations as described in the footnote in the natural gas reserves table above. For the years ended December 31, 2008 and 2007, the year-end natural gas prices used in the estimates were $1.86 and $1.46 per mcf. In previous years, values for natural gas consumed in field operations were included both as revenues in future cash inflows and as gas consumption expense in future production and development costs. For the years 2007 and 2008, the amounts attributable to natural gas consumption values included in Consolidated Interests are $22 million and $27 million, and in Equity Interest are $21 million and $24 million.
Future income tax expenses have been computed considering applicable taxable cash flows and the appropriate statutory tax rate. The discount rate of 10 percent is as prescribed by authoritative guidance. Continuation of year-end economic conditions also is assumed. Conversion of U.S. dollars is made utilizing the rate of exchange at December 31 for each of the years presented. The calculation is based on estimates of proved reserves, which are revised over time as new data becomes available. Probable or possible reserves, which may become proved in the future, are not considered. The calculation also requires assumptions as to the timing of future production of proved reserves, and the timing and amount of future development and production costs.
Numerous uncertainties are inherent in estimating volumes and the value of proved reserves and in projecting future production rates and timing of development expenditures. Such reserve estimates are subject to change as additional information becomes available. The reserves actually recovered and the timing of production may be substantially different from the reserve estimates.
APCO OIL AND GAS INTERNATIONAL INC.
UNAUDITED SUPPLEMENTAL OIL AND GAS INFORMATION
Standardized Measure of Discounted Future Net Cash Flows
The following tables summarize the standardized measure of discounted future net cash flows from proved oil and natural gas reserves that could be produced from our concessions in Argentina for each of the years presented:
|
(Millions of Dollars)
|
||||||||||||
|
|
Interests
|
|||||||||||
|
Consolidated
|
Equity
|
Combined
|
||||||||||
|
As of December 31, 2007
|
||||||||||||
|
Future cash inflows
|
$ | 504 | $ | 490 | $ | 994 | ||||||
|
Less:
|
||||||||||||
|
Future production costs
|
(173 | ) | (184 | ) | (357 | ) | ||||||
|
Future development costs
|
(68 | ) | (68 | ) | (136 | ) | ||||||
|
Future income tax expense
|
(66 | ) | (69 | ) | (135 | ) | ||||||
|
Future net cash flows
|
197 | 169 | 366 | |||||||||
|
Less 10 percent annual discount for estimated timing of cash flows
|
(65 | ) | (54 | ) | (119 | ) | ||||||
|
Standardized measure of discounted future net cash flows
|
$ | 132 | $ | 115 | $ | 247 | ||||||
|
As of December 31, 2008
|
||||||||||||
|
Future cash inflows
|
$ | 555 | $ | 520 | $ | 1,075 | ||||||
|
Less:
|
||||||||||||
|
Future production costs
|
(169 | ) | (162 | ) | (331 | ) | ||||||
|
Future development costs
|
(87 | ) | (95 | ) | (182 | ) | ||||||
|
Future income tax expense
|
(66 | ) | (73 | ) | (139 | ) | ||||||
|
Future net cash flows
|
233 | 190 | 423 | |||||||||
|
Less 10 percent annual discount for estimated timing of cash flows
|
(72 | ) | (59 | ) | (131 | ) | ||||||
|
Standardized measure of discounted future net cash flows
|
$ | 161 | $ | 131 | $ | 292 | ||||||
|
As of December 31, 2009
|
||||||||||||
|
Future cash inflows
|
$ | 616 | $ | 614 | $ | 1,230 | ||||||
|
Less:
|
||||||||||||
|
Future production costs
|
(214 | ) | (228 | ) | (442 | ) | ||||||
|
Future development costs
|
(83 | ) | (91 | ) | (174 | ) | ||||||
|
Future income tax expense
|
(67 | ) | (73 | ) | (140 | ) | ||||||
|
Future net cash flows
|
252 | 222 | 474 | |||||||||
|
Less 10 percent annual discount for estimated timing of cash flows
|
(97 | ) | (93 | ) | (190 | ) | ||||||
|
Standardized measure of discounted future net cash flows
|
$ | 155 | $ | 129 | $ | 284 | ||||||
APCO OIL AND GAS INTERNATIONAL INC.
UNAUDITED SUPPLEMENTAL OIL AND GAS INFORMATION
Changes in Standardized Measure
The following analysis summarizes the factors that caused the changes in the amount of standardized measure attributable to the estimate of our Argentine proved oil and gas reserves for each of the years presented.
|
(Millions of Dollars)
|
||||||||||||
|
For the Year Ended December 31, 2007
|
Interests
|
|||||||||||
|
Consolidated
|
Equity
|
Combined
|
||||||||||
|
Standardized measure of discounted future net cash flows beginning of period
|
$ | 120 | $ | 115 | $ | 235 | ||||||
|
Changes during the year:
|
||||||||||||
|
Revenues, net of production costs
|
(49 | ) | (51 | ) | (100 | ) | ||||||
|
Net changes in prices and production costs
|
4 | (9 | ) | (5 | ) | |||||||
|
Additions and revisions of previous estimates
|
8 | 20 | 28 | |||||||||
|
Acquisition of reserves
|
4 | 5 | 9 | |||||||||
|
Changes in estimated development costs
|
(4 | ) | (17 | ) | (21 | ) | ||||||
|
Development costs incurred during current period
|
18 | 17 | 35 | |||||||||
|
Changes in production rates, timing, and other
|
(3 | ) | 4 | 1 | ||||||||
|
Accretion of discount
|
16 | 16 | 32 | |||||||||
|
Net changes in income taxes
|
18 | 15 | 33 | |||||||||
|
Net changes
|
12 | 0 | 12 | |||||||||
|
Standardized measure of discounted future net cash flows end of period
|
$ | 132 | $ | 115 | $ | 247 | ||||||
|
(Millions of Dollars)
|
||||||||||||
|
For the Year Ended December 31, 2008
|
Interests
|
|||||||||||
|
|
Consolidated
|
Equity
|
Combined
|
|||||||||
|
Standardized measure of discounted future net cash flows beginning of period
|
$ | 132 | $ | 115 | $ | 247 | ||||||
|
Changes during the year:
|
||||||||||||
|
Revenues, net of production costs
|
(51 | ) | (55 | ) | (106 | ) | ||||||
|
Net changes in prices and production costs
|
25 | 34 | 59 | |||||||||
|
Additions and revisions of previous estimates
|
50 | 38 | 88 | |||||||||
|
Changes in estimated development costs
|
(36 | ) | (36 | ) | (72 | ) | ||||||
|
Development costs incurred during current period
|
33 | 25 | 58 | |||||||||
|
Changes in production rates, timing, and other
|
(7 | ) | (8 | ) | (15 | ) | ||||||
|
Accretion of discount
|
12 | 18 | 30 | |||||||||
|
Net changes in income taxes
|
3 | 0 | 3 | |||||||||
|
Net changes
|
29 | 16 | 45 | |||||||||
|
Standardized measure of discounted future net cash flows end of period
|
$ | 161 | $ | 131 | $ | 292 | ||||||
APCO OIL AND GAS INTERNATIONAL INC.
UNAUDITED SUPPLEMENTAL OIL AND GAS INFORMATION
|
(Millions of Dollars)
|
||||||||||||
|
For the Year Ended December 31, 2009
|
Interests
|
|||||||||||
|
|
Consolidated
|
Equity
|
Combined
|
|||||||||
|
Standardized measure of discounted future net cash flows beginning of period
|
$ | 161 | $ | 131 | $ | 292 | ||||||
|
Changes during the year:
|
||||||||||||
|
Revenues, net of production costs
|
(44 | ) | (45 | ) | (89 | ) | ||||||
|
Net changes in prices and production costs
|
(35 | ) | (49 | ) | (84 | ) | ||||||
|
Additions and revisions of previous estimates
|
69 | 88 | 157 | |||||||||
|
Changes in estimated development costs
|
(1 | ) | (3 | ) | (4 | ) | ||||||
|
Development costs incurred during current period
|
17 | 21 | 38 | |||||||||
|
Changes in production rates, timing, and other
|
(28 | ) | (29 | ) | (57 | ) | ||||||
|
Accretion of discount
|
20 | 17 | 37 | |||||||||
|
Net changes in income taxes
|
(4 | ) | (2 | ) | (6 | ) | ||||||
|
Net changes
|
(6 | ) | (2 | ) | (8 | ) | ||||||
|
Standardized measure of discounted future net cash flows end of period
|
$ | 155 | $ | 129 | $ | 284 | ||||||
Capitalized Costs Related to Oil and Gas Producing Activities
Total capitalized costs related to oil and gas producing activities for our consolidated interests are as follows:
|
(Amounts in thousands)
|
2009
|
2008
|
||||||
|
Proved oil and gas properties
|
$ | 180,120 | $ | 156,474 | ||||
|
Unproved oil and gas properties
|
2,878 | 3,474 | ||||||
| 182,998 | 159,948 | |||||||
|
Accumulated depreciation, depletion and amortization
|
(93,621 | ) | (78,426 | ) | ||||
|
Total
|
$ | 89,377 | $ | 81,522 | ||||
Total capitalized costs related to oil and gas producing activities net to our equity interests included in the balance sheet of our equity investee, Petrolera, are as follows:
|
Capitalized costs related to Petrolera:
|
||||||||
|
(Amounts in thousands)
|
2009
|
2008
|
||||||
|
Proved oil and gas properties
|
$ | 187,019 | $ | 154,493 | ||||
|
Unproved oil and gas properties
|
- | 4,200 | ||||||
| 187,019 | 158,693 | |||||||
|
Accumulated depreciation, depletion and amortization
|
(108,539 | ) | (90,533 | ) | ||||
|
Total
|
$ | 78,480 | $ | 68,160 | ||||
APCO OIL AND GAS INTERNATIONAL INC.
UNAUDITED SUPPLEMENTAL OIL AND GAS INFORMATION
Costs Incurred in Acquisitions, Exploration, and Development
The following table details costs incurred for acquisitions, exploration, and development during 2009, 2008 and 2007. Costs incurred include capitalized and expensed items.
|
Interests
|
||||||||||||
|
(Amounts in Millions)
|
Consolidated
|
Equity
|
Combined
|
|||||||||
|
For the year ended December 31, 2007
|
||||||||||||
|
Acquisition:
|
||||||||||||
|
Proved properties
|
$ | 5.3 | $ | 6.8 | $ | 12.1 | ||||||
|
Unproved properties
|
2.0 | 2.6 | 4.6 | |||||||||
|
Exploration
|
4.1 | 1.9 | 6.0 | |||||||||
|
Development
|
17.2 | 17.7 | 34.9 | |||||||||
|
Asset retirement obligations
|
0.2 | 0.3 | 0.5 | |||||||||
|
Total
|
$ | 28.8 | $ | 29.4 | $ | 58.2 | ||||||
|
For the year ended December 31, 2008
|
||||||||||||
|
Acquisition
|
$ | - | $ | - | $ | - | ||||||
|
Exploration
|
8.8 | 6.7 | 15.5 | |||||||||
|
Development
|
27.3 | 24.8 | 52.1 | |||||||||
|
Asset retirement obligations
|
0.1 | 0.1 | 0.2 | |||||||||
|
Total
|
$ | 36.2 | $ | 31.6 | $ | 67.8 | ||||||
|
For the year ended December 31, 2009
|
||||||||||||
|
Acquisition:
|
||||||||||||
|
Unproved properties
|
$ | 2.6 | $ | - | $ | 2.6 | ||||||
|
Exploration
|
3.4 | 3.4 | 6.8 | |||||||||
|
Development
|
17.9 | 19.8 | 37.7 | |||||||||
|
Asset retirement obligations
|
0.7 | 0.9 | 1.6 | |||||||||
|
Total
|
$ | 24.6 | $ | 24.1 | $ | 48.7 | ||||||
ITEM 9. CHANGES IN AND DISAGREEMENTS WITH ACCOUNTANTS ON ACCOUNTING AND FINANCIAL DISCLOSURE
None.
ITEM 9A. CONTROLS AND PROCEDURES
Disclosure Controls and Procedures
Our management, including our Chief Executive Officer and Chief Financial Officer, does not expect that our disclosure controls and procedures (as defined in Rules 13a-15(e) and 15d-15(e) of the Securities Exchange Act) (Disclosure Controls) will prevent all errors and all fraud. A control system, no matter how well conceived and operated, can provide only reasonable, not absolute, assurance that the objectives of the control system are met. Further, the design of a control system must reflect the fact that there are resource constraints, and the benefits of controls must be considered relative to their costs. Because of the inherent limitations in all control systems, no evaluation of controls can provide absolute assurance that all control issues and instances of fraud, if any, within the company have been detected. These inherent limitations include the realities that judgments in decision-making can be faulty, and that breakdowns can occur because of simple error or mistake. Additionally, controls can be circumvented by the individual acts of some persons, by collusion of two or more people, or by management override of the control. The design of any system of controls also is based in part upon certain assumptions about the likelihood of future events, and there can be no assurance that any design will succeed in achieving its stated goals under all potential future conditions. Because of the inherent limitations in a cost-effective control system, misstatements due to error or fraud may occur and not be detected. We monitor our Disclosure Controls and make modifications as necessary; our intent in this regard is that the Disclosure Controls will be modified as systems change and conditions warrant.
An evaluation of the effectiveness of the design and operation of our Disclosure Controls was performed as of the end of the period covered by this report. This evaluation was performed under the supervision and with the participation of our management, including our Chief Executive Officer and Chief Financial Officer. Based upon that evaluation, our Chief Executive Officer and Chief Financial Officer concluded that these Disclosure Controls are effective at a reasonable assurance level.
Management’s Annual Report on Internal Control over Financial Reporting
See “Management’s Annual Report on Internal Control over Financial Reporting” set forth in Item 8, “Financial Statements and Supplementary Data.”
Report of Independent Registered Public Accounting Firm on Internal Control Over Financial Reporting
See report set forth in Item 8, “Financial Statements and Supplementary Data.”
Changes in Internal Controls Over Financial Reporting
There have been no changes during the fourth quarter of 2009 that have materially affected, or are reasonably likely to materially affect, our internal control over financial reporting.
ITEM 9B. Other Information
None.
PART III
ITEM 10. DIRECTORS, EXECUTIVE OFFICERS AND CORPORATE GOVERNANCE.
Directors and Executive Officers
Our articles of association provide for a Board of Directors of not less than three and not more than nine persons. The articles of association also provide that at each annual general meeting of shareholders one-third of the directors, or if their number is not three or a multiple of three, then the number nearest one-third, shall retire from office. The directors to retire in every year are those who have been longest in office since their last election and retiring directors are eligible to be re-elected as directors. Between persons who become directors on the same day those to retire are determined by lot unless they otherwise agree among themselves as to who will retire. Directors appointed by the Board of Directors to fill a vacancy or as an addition to the existing directors hold office until the next following annual meeting of shareholders and are not taken into account in determining the directors who are to retire by rotation as described above. Mr. Rodney J. Sailor was last elected as a director at the annual general meeting of shareholders held in 2006. Messrs. Bryan K. Guderian and Piero Ruffinengo were last elected as directors at the annual general meeting of shareholders held in 2007. Messrs. Keith E. Bailey and Messrs. Ralph A. Hill were last elected as directors at the annual general meeting of shareholders held in 2008. Messrs. Robert J. LaFortune and John H. Williams were last elected at the annual general meeting of shareholders held in 2009. The number of directors is currently seven and if this number remains the same by the next annual general meeting of shareholders, the term of Mr. Sailor and the term of one of Messrs. Guderian or Ruffinengo will expire at such meeting. Executive officers of the Company are elected by the Board of Directors and hold office until relieved of such office by action of the Board of Directors.
The following table sets forth certain information with respect to the Company’s executive officers and members of the board of directors.
|
Name
|
Age
|
Position
|
|
Ralph A. Hill
|
50
|
Chairman of the Board, Chief Executive Officer and Director
|
|
Landy L. Fullmer
|
57
|
Chief Financial Officer, Chief Accounting Officer, Controller and Vice President
|
|
Thomas Bueno
|
58
|
President and Chief Operating Officer
|
|
Keith E. Bailey
|
67
|
Director
|
|
Bryan K. Guderian
|
50
|
Director
|
|
Robert J. LaFortune
|
83
|
Director
|
|
Piero Ruffinengo
|
65
|
Director
|
|
Rodney J. Sailor
|
51
|
Director
|
|
John H. Williams
|
91
|
Director
|
Business Experience and Qualifications
Below is information about our directors and executive officers, including experience in the following areas that are important qualifications for directors in the context of our business and structure:
|
·
|
Industry Experience in the oil and gas exploration and production business.
|
|
·
|
Financial Experience with which to evaluate our financial statements and capital investments.
|
|
·
|
Corporate Governance Experience to support our goals of accountability for management and the Board of Directors and protection of shareholders interests.
|
|
·
|
Legal Experience is valuable to the Board of Director’s oversight of our legal and regulatory compliance.
|
|
·
|
Operating Experience which is relevant to the understanding of our operating plan and strategy.
|
|
·
|
International Business Experience because all of our operations are in South America.
|
Mr. Hill has served as a director of the Company, Chairman of the Board of Directors, and Chief Executive Officer since 2002. Since 2003 he has served as a Senior Vice President of The Williams Companies, Inc. (“Williams”) (which finds, produces, gathers, processes, and transports natural gas with operations concentrated in the Pacific Northwest, Rocky Mountains, Gulf Coast, and Eastern Seaboard) and acts as the President of Williams exploration and production unit. He joined Williams in 1981 and has held various positions in Williams’ exploration and production, gas marketing, and petroleum services businesses. Mr. Hill has served as a director of Petrolera Entre Lomas S.A. (“Petrolera”) since 2003.
Mr. Hill’s qualifications include industry, financial, operating, and international business experience.
Mr. Fullmer has served as our Chief Financial Officer since 2003 and as our Chief Accounting Officer and Controller since 2005. He currently serves as the director of finance and accounting business partner for the Exploration and Production unit of Williams. Mr. Fullmer served as the director of accounting/controller for the Exploration and Production unit of Williams from 1996 to 2007.
Mr. Bueno has served as our President and Chief Operating Officer since 2002. He served as a director of the Company from 1998 until becoming President in 2002 and he served as General Manager from 1999 to 2003. Mr. Bueno has been employed by Williams since 1984 and has held various positions with the Company since 1985. He has served as a director of Petrolera since 1991.
Mr. Bailey has served as a director of the Company since 2002. He has served as a director and Chairman of the Board of Cloud Peak Energy Inc. (a U.S. coal producer) since September 2009. Since 2005, Mr. Bailey has served as a director of Mark West Energy Partners, L.P. (a U.S. midstream energy company), and is the Chairman of the Audit Committee. He has served as a director of AEGIS Insurance Services Inc. (a mutual insurance company) since 2001. Since 2007, Mr. Bailey has served as a director of Integrys Energy Group, Inc. (“Integrys”) (which provides services and products in the regulated and unregulated U.S. energy markets) and additionally serves on the Audit and Investment committees. He served as a director and was a member of the Audit and Oil and Gas committees of People’s Energy from 2005 to 2007, when People’s Energy merged with Integrys. Mr. Bailey served as Chairman of the Board of Directors and Chief Executive Officer of Williams from 1994 to 2002, as President from 1992 to 2001, and as Executive Vice President and Chief Financial Officer from 1986 to 1992. Mr. Bailey previously served as a director of the Company from 1987 to 1998 and as our Chairman of the Board from 1992 to 1996. He served as a director of Petrolera from 1988 to 1999.
Mr. Bailey’s qualifications include industry, financial, corporate governance, and operating experience.
Mr. Guderian has served as a director of the Company since 2002. He has also served as Vice President of Williams’ Exploration and Production unit since 1998, where he is a member of the management team that pursued a growth strategy to transform the company into a top independent natural gas producer in the U.S. Mr. Guderian has served as a director of Petrolera since 2003. He is a member of numerous professional organizations, including the Independent Petroleum Association of America, the Natural Gas Supply Association, the American Association of Professional Landmen, and the Oklahoma Independent Petroleum Association.
Mr. Guderian’s qualifications include industry, financial, corporate governance, operating, and international business experience.
Mr. LaFortune has served as a director of the Company since 1998. He is self-employed and manages, evaluates, and analyzes personal investments. Mr. LaFortune is also a director of the Bank of Oklahoma Financial Corporation (a regional financial services company based in Tulsa, Oklahoma) and serves on the Credit Committee and formerly served on the Audit Committee. He served as a director of Williams from 1978 to 1999, including six years as Chairman of the Audit Committee. He was the Mayor of the City of Tulsa from 1970-1978 and the Commissioner of Streets and Public Property for the city from 1964 to 1970. Mr. La Fortune was a co-owner of an independent U.S. oil and gas exploration and production company from 1956 to 1963. He is also a member of the national executive board of the Boy Scouts of America, a member of the executive committee of the Philbrook museum, a member of the board of trustees of the Tulsa Performing Arts Center, and a member of the audit and compliance committees of St. John Health System.
Mr. La Fortune’s qualifications include industry, financial, and corporate governance experience.
Mr. Sailor has served as a director of the Company since 2006. He has served as Vice President and Treasurer of Williams since 2005 and is responsible for overseeing Williams’ enterprise risk management function. Mr. Sailor served as Assistant Treasurer of Williams from 2001 to 2005 and was responsible for capital structuring and capital markets transactions, and management of Williams’ liquidity position. Mr. Sailor served as Vice President of Strategic International Development and Latin America for the former telecommunications business unit of Williams from 1999 to 2001. He held various positions at Williams involving international finance, corporate finance, strategic planning and development, and accounting from 1985 to 1999.
Mr. Sailor’s qualifications include financial, industry, and international business experience.
Mr. Williams has served as a director of the Company since 1992. He is engaged in personal investments and has been for more than five years. Mr. Williams has over 60 years of experience in the energy industry. In 1949, he co-founded Williams and served as a director and its President and Chief Executive Officer from 1949 to 1978 and as Chairman of the Board from 1971 to 1978. Mr. Williams worked on pipeline construction projects in the U.S. and internationally for the family business that preceded Williams from 1946 to 1949. He has served as a director of Unit Corporation (a diversified energy company engaged in the exploration for and production of oil and natural gas, the acquisition of producing oil and natural gas properties, the contract drilling of onshore oil and natural gas wells, and the gathering and processing of natural gas) since 1988. Mr. Williams is an honorary director of Willbros Group, Inc. and Williams. He formerly served as a director of Petrolera.
Mr. Williams’ qualifications include industry, financial, corporate governance, operating, and international business experience.
Mr. Ruffinengo has served as a director of the Company since 2002. He has been engaged in the private practice of law in Salt Lake City, Utah since 1984. He served the Company as a consultant from 1984 through 1999. Mr. Ruffinengo served in a variety of positions for Northwest Energy Company (“Northwest Energy”) and its subsidiary, Northwest Pipeline Corporation (“Northwest Pipeline”), from 1975 to 1983, when Northwest Energy was acquired by Williams. Those positions included General Counsel of Northwest Pipeline and the Company, Vice President of Mergers and Acquisitions, and Vice President of International Operations. Over his career, Mr. Ruffinengo has practiced law in the areas of corporate governance and compliance, commercial transactions, oil and gas law, intellectual property, finance, and domestic and international litigation. Mr. Ruffinengo served as a director of Petrolera at various times in the past and most recently from from 2002 to 2003.
Mr. Ruffinengo’s qualifications include industry, financial, corporate governance, legal, and international business experience.
Section 16(a) Beneficial Ownership Reporting Compliance
Section 16(a) of the Securities Exchange Act of 1934 requires the Company’s officers and directors and persons who own more than ten percent of a registered class of the Company’s equity securities, to file with the SEC and The Nasdaq Stock Market reports of ownership of Company securities and changes in reported ownership. Officers, directors and greater than ten percent shareholders are required by SEC rules to furnish the Company with copies of all Section 16(a) reports they file. Based solely on a review of the reports furnished to the Company, or written representations from reporting persons that all reportable transactions were reported, the Company believes that during the fiscal year ended December 31, 2009 the Company’s officers, directors and greater than ten percent owners timely filed all reports they were required to file under Section 16(a).
Code of Ethics
The Company adopted a Code of Ethics that applies to the Company’s directors, officers and employees. The Code of Ethics is consistent with the criteria for codes of ethics and conduct established by the rules of the U.S. Securities and Exchange Commission and the listing standards of The Nasdaq Stock Market. The Code of Ethics is available on our Internet website at http://www.apcooilandgas.com under the “Investor Relations” tab. We will also provide, free of charge, a copy of any of our Code of Ethics upon written request to the Corporate Secretary, Apco Oil and Gas International Inc., 3500 One Williams Center, Tulsa, Oklahoma 74172.
Corporate Governance
Audit Committee
The Company’s Board of Directors has a separately-designated standing Audit Committee established in accordance with Section 3(a)(58)(A) of the Exchange Act. The members of the Audit Committee include Messrs. Bailey, LaFortune, Ruffinengo, and Williams. The Board of Directors has determined that each of these persons meets the independence and other qualification requirements of the rules of The Nasdaq Stock Market. In addition, the Board of Directors has determined that Mr. Bailey qualifies as an “audit committee financial expert” as defined by the rules of the SEC. Biographical information for Mr. Bailey is set forth above under the caption “Business Experience and Qualifications.” For more information about the Audit Committee, please read “Certain Relationships and Related Transactions, and Director Independence — Corporate Governance” and “Principal Accountant Fees and Services.”
ITEM 11. EXECUTIVE COMPENSATION
Compensation Discussion and Analysis
The Company is managed by the employees of Williams and all of our executive officers are employees of Williams. The Company’s executive officers are compensated directly by Williams rather than by the Company. All decisions as to the compensation of the Company’s executive officers are made by Williams. Therefore, the Company does not have any policies or programs relating to compensation of its executive officers and does not make any decisions relating to such compensation. A full discussion of the policies and programs of Williams will be set forth in the proxy statement for Williams’ 2010 annual meeting of stockholders which will be available upon its filing on the SEC’s website at http://www.sec.gov and on Williams’ website at http://www.williams.com under the heading “Investors — SEC Filings.” Williams charges the Company, pursuant to an administrative services agreement, an annual flat fee for the services of certain Williams’ employees, other than Mr. Bueno, who dedicate a significant amount of time to the affairs of the Company. Williams also charges the Company, pursuant to the terms of the same agreement, a fee for Mr. Bueno’s services based on both his actual total compensation and an estimated percentage of his time that is dedicated to performing services for the Company. Please read “Certain Relationships and Related Transactions, and Director Independence — Transactions with Related Persons — Administrative Services Agreement and — Review, Approval or Ratification of Transactions with Related Persons” for more information regarding this arrangement.
Executive Compensation
In 2009, the Company incurred an allocated charge of $173,504 for Mr. Bueno's salary and $108,478 for his cash incentive bonus. In 2008, the Company incurred an allocated charge of $160,793 for Mr. Bueno's salary and $95,963 for his cash incentive bonus. In 2007, the Company incurred an allocated charge of $140,511 for Mr. Bueno's salary and $86,263 for his cash incentive bonus. Each year the Company also incurs a charge for Mr. Bueno’s benefits, including without limitation his pension and welfare benefits, which charge is equal to approximately 33 percent of the allocated charge incurred by the Company for Mr. Bueno’s salary in that year. This benefits charge was $57,835 in 2009, $53,598 in 2008, and $46,837 in 2007.
Further information regarding the compensation of our principal executive officer, Ralph A. Hill, who also serves as a Senior Vice President of Williams, will be set forth in the proxy statement for Williams' 2010 annual meeting of stockholders which will be available upon its filing on the SEC's website at http://www.sec.gov and on Williams' website at http://www.williams.com under the heading "Investors—SEC Filings." Further information regarding the portion of Mr. Hill's compensation and that of Landy L. Fullmer, who serves as the Company’s Chief Financial Officer, allocable to us may be found in this filing under the heading "Certain Relationships and Related Transactions, and Director Independence — Transactions with Related Persons — Administrative Services Agreement."
Compensation Committee Interlocks and Insider Participation
The Board of Directors of the Company does not maintain a compensation committee. The executive officers of the Company during 2009 were employees of Williams and compensation decisions with respect to those individuals were determined by Williams.
Compensation Policies and Practices as They Relate to Risk Management
All of our employees are located in Argentina. We do not believe that our compensation policies and practices create risks reasonably likely to have a material adverse effect on us. Our executive officers and certain other persons who provide services to us pursuant to an administrative services agreement are employees of Williams. For more information about this arrangement, please read “Certain Relationships and Related Party Transactions, and Director Independence — Transactions with Related Persons — Administrative Services Agreement.” For an analysis of any risks arising from Williams’ compensation policies and practices, please read the proxy statement for Williams’ 2010 annual meeting of stockholders which will be available upon its filing on the SEC’s website at http://www.sec.gov and on Williams’ website at http://www.williams.com under the heading “Investors — SEC Filings.”
Compensation of Directors
Directors who are employees of Williams or an affiliate of the Company or Williams receive no compensation for service on the Company’s Board of Directors. Directors who are not employees of Williams or an affiliate of the Company or Williams (“Non-Management Directors”) receive a quarterly fee of $12,500 cash for Board service. In addition, the Chairman of the Audit Committee receives a quarterly fee of $2,500 cash and the Chairman of the Nominating Committee receives a quarterly fee of $1,250 in cash. Beginning after July 2009, each Non-Management Director receives a fee of $1,000 for each Board and committee meeting attended by such director, provided that such fee is limited to $1,000 per day regardless of the number of meetings attended on a given day. Fees are paid quarterly in arrears. Directors are also reimbursed for reasonable expenses (including costs of travel, food and lodging) incurred in attending meetings of the Board, committee, and shareholder meetings. Directors are also reimbursed for reasonable expenses associated with other business activities, including participation in director education programs.
For their service Non-Management Directors received the following compensation in 2009:
|
Name
|
Fees earned or
paid in cash(1)
|
Share
Awards
|
Option
Awards
|
Change in Pension Value and Nonqualified Deferred Compensation Earnings
|
All Other Compensation
|
Total
|
||||||||||||||||||
|
Keith E. Bailey
|
$ | 54,000 | — | — | — | $ | 0 | $ | 54,000 | |||||||||||||||
|
Robert J. LaFortune
|
$ | 64,000 | — | — | — | $ | 0 | $ | 64,000 | |||||||||||||||
|
Piero Ruffinengo
|
$ | 54,000 | — | — | — | $ | 0 | $ | 54,000 | |||||||||||||||
|
John H. Williams
|
$ | 59,000 | — | — | — | $ | 0 | $ | 59,000 | |||||||||||||||
|
|
(1)
|
This column includes $4,000 in fees earned for each person for attending meetings of the Board or its committees.
|
Compensation Committee Report
The Board of Directors does not have a compensation committee. The Board has reviewed and discussed the Compensation Discussion and Analysis set forth above and based on this review and discussion has approved it for inclusion in this Form 10-K.
|
The Board of Directors:
|
|
|
Keith E. Bailey, Bryan K. Guderian, Ralph A. Hill,
|
|
|
Robert J. LaFortune, Piero Ruffinengo,
|
|
|
Rod J. Sailor, John H. Williams
|
|
ITEM 12.
|
SECURITY OWNERSHIP OF CERTAIN BENEFICIAL OWNERS AND MANAGEMENT AND RELATED SHAREHOLDER MATTERS
|
Security Ownership of Certain Beneficial Owners and Management
The following table sets forth the number of ordinary shares and the percentage represented by such number of each person who is known to us to own beneficially five percent or more of our ordinary shares. We obtained certain information in the table from filings made with the SEC.
|
Name of Beneficial Owner
|
Number of Ordinary Shares Beneficially Owned
|
Percent of Class
|
||||||
|
The Williams Companies, Inc.
|
20,301,592 | (1)(2) | 68.96 | % | ||||
|
Williams Global Energy (Cayman) Limited
|
20,301,592 | (2) | 68.96 | % | ||||
|
Brown Advisory Holdings Incorporated
|
5,488,064 | (3) | 18.64 | % | ||||
|
(1)
|
Includes 20,301,592 ordinary shares held of record by Williams Global Energy (Cayman) Limited.
|
|
(2)
|
Williams Global Energy (Cayman) Limited (“Williams Global Energy”) is an indirect wholly-owned subsidiary of Williams International Company, which is a direct wholly-owned subsidiary of The Williams Companies, Inc. (“Williams”). As a result, Williams may be deemed to be the beneficial owner of the shares held by Williams Global Energy under the rules and regulations of the SEC. The address of both of these companies is One Williams Center, Tulsa, Oklahoma 74172.
|
|
(3)
|
A Schedule 13G/A filed with the SEC on February 16, 2010 indicates that Brown Advisory Holdings Incorporated (“BAHI”) is a parent holding company or control person in accordance with Section 240.13d-1(b)(1)(ii)(G) of the Exchange Act and that NSB Advisors LLC, a subsidiary of BAHI, is an Investment Advisor registered under Section 203 of the Investment Advisors Act of 1940.The Schedule 13G/A notes that clients of NSB Advisors LLC own 5,488,064 ordinary shares of the Company. The Schedule 13G/A indicates that the clients referenced in the report have the right to receive, or the power to direct the receipt of, dividends from, or the proceeds from, the sale of such ordinary shares. The address of BAHI is 901 South Bond Street, Suite 400, Baltimore, Maryland 21231.
|
The following table sets forth, as of March 1, 2010, the number of our ordinary shares beneficially owned by each of our directors, each of our named executive officers, and by all directors and executive officers as a group.
|
Name of Individual or Group
|
Number of Ordinary Shares Beneficially Owned
|
Percent of Class
|
||||||
|
Keith E Bailey
|
804 | * | ||||||
|
Thomas Bueno
|
0 | -- | ||||||
|
Landy L Fullmer
|
0 | -- | ||||||
|
Bryan K Guderian
|
4 | * | ||||||
|
Ralph A Hill
|
4 | * | ||||||
|
Robert J LaFortune
|
20 | * | ||||||
|
Piero Ruffinengo
|
4 | * | ||||||
|
Rodney J Sailor
|
4 | * | ||||||
|
John H Williams
|
40 | * | ||||||
|
All directors and executive officers as a group (9 persons)
|
880 | * | ||||||
* Less than one percent.
The following table sets forth, as of March 1, 2010, the number of shares of common stock of The Williams Companies, Inc., beneficially owned by each of our directors, each of our named executive officers, and by all directors and executive officers as a group:
|
Name of Beneficial Owner
|
Shares of Common Stock Owned Directly or Indirectly (1)(2)
|
Shares Underlying Options Exercisable Within 60 Days (3)
|
Total
|
Percentage of Class
|
||||||||||||
|
Keith E. Bailey
|
34,548 | 0 | 34,548 | * | ||||||||||||
|
Thomas Bueno
|
28,226 | 30,865 | 59,091 | * | ||||||||||||
|
Landy L. Fullmer
|
6,453 | 32,780 | 39,233 | * | ||||||||||||
|
Bryan K. Guderian
|
56,594 | 63,272 | 119,866 | * | ||||||||||||
|
Ralph A. Hill
|
273,657 | 216,874 | 490,531 | * | ||||||||||||
|
Robert J. LaFortune
|
57,937 | 0 | 57,937 | * | ||||||||||||
|
Piero Ruffinengo
|
0 | 0 | 0 | -- | ||||||||||||
|
Rodney J. Sailor
|
45,648 | 65,397 | 111,045 | * | ||||||||||||
|
John H. Williams
|
1,008,958 | 0 | 1,008,958 | * | ||||||||||||
|
All directors and executive officers as a group (9 persons)
|
1,512,021 | 409,188 | 1,921,209 | * | ||||||||||||
* Less than one percent.
|
(1)
|
Includes shares held under the terms of incentive and investment plans as follows: Mr. Bueno, 7,405 shares in The Williams Companies Investment Plus Plan and 8,525 restricted stock units; Mr. Fullmer, 370 shares in The Williams Companies Investment Plus Plan and 6,083 restricted stock units; Mr. Guderian, 43,468 restricted stock units; Mr. Hill, 27,954 shares in The Williams Companies Investment Plus Plan and 231,208 restricted stock units; Mr. Sailor, 6,417 shares in The Williams Companies Investment Plus and 36,899 restricted stock units. Restricted stock units, formerly referred to as deferred stock, includes both time-based and performance-based units and do not have voting or investment power. Shares held in The Williams Companies Investment Plus Plan have voting and investment power.
|
|
(2)
|
Includes 991,210 shares held in trust by Mr. Williams and 16,246 shares held in trust by his spouse; 32,581 shares held in trust by Mr. Bailey and 1,740 shares held in trust by his spouse; and 55,346 shares held in trust by Mr. LaFortune.
|
|
(3)
|
The shares indicated represent stock options granted under Williams’ current or previous stock option plans, which are currently exercisable or which will become exercisable within 60 days of March 1, 2010. Shares subject to options cannot be voted.
|
ITEM 13. CERTAIN RELATIONSHIPS AND RELATED TRANSACTIONS, AND DIRECTOR INDEPENDENCE
Transactions with Related Persons
Administrative Services Agreement
Williams owns 69 percent of the Company’s ordinary shares. The Company incurred charges of $1.4 million in fiscal year 2009 from Williams and its affiliates for management services, rent, overhead allocation, general and administrative expenses (including the costs of compensating employees of Williams who allocate a portion of their time to managing the affairs of the Company), insurance, internal audit services, and purchases of materials and supplies. The Company is also dependent upon Williams to cover certain other costs such as reproduction, office supplies, computer support, etc for which it reimburses Williams. These charges were incurred by the Company pursuant to an administrative services agreement between the Company and Williams.
The Company is managed by employees of Williams and all of its executive officers, including Mr. Hill, our Chairman of the Board and Chief Executive Officer, and Mr. Fullmer, our Chief Financial Officer and Chief Accounting Officer, are employees of Williams who are compensated directly by Williams rather than by the Company. Pursuant to the administrative services agreement, Williams charges the Company an executive support charge, which charge is incurred by the Company primarily for the time spent by employees of Williams, other than Mr. Bueno, in managing the affairs of the Company. In 2009, 2008, and 2007 the Company paid an annual aggregate charge of $150,000 for the services of these persons. In addition, Williams also charges the Company, pursuant to the terms of the same agreement, a fee for Mr. Bueno’s services based on both his actual total compensation and an estimated percentage of his time that is dedicated to performing services for the Company. Please read “Executive Compensation – Executive Compensation” for further information regarding the amounts paid by the Company for Mr. Bueno’s services.
Northwest Argentina Corporation
The Company and Northwest Argentina Corporation (“NWA”), a wholly owned subsidiary of Williams, each own a 1.5 percent interest in the Acambuco concession. NWA has no employees and its sole asset is its interest in Acambuco. The Company’s branch office in Argentina provides administrative assistance to NWA. Specifically, the Company pays cash calls and collects revenues pertaining to NWA’s interest. For the period from January 1, 2009 through March 1, 2010, $1.3 million was the largest aggregate amount that the Company owed NWA, representing the accumulated balance of revenues collected on NWA’s behalf in excess of cash calls paid on NWA’s behalf. For the same period, $156 thousand was the largest aggregate amount that NWA owed to the Company, representing the accumulated balance of cash calls paid on NWA’s behalf in excess of revenues collected on its behalf. This amount was outstanding as of March 1, 2010.
Review, Approval or Ratification of Transactions with Related Persons
The charter of the Audit Committee of the Company’s Board of Directors provides that the committee will review, on an ongoing basis and approve all related party transactions required to be disclosed pursuant to Item 404(a) of the SEC’s Regulation S-K (“Related Party Transactions”). The Audit Committee’s charter further provides that (i) the committee consider whether a Related Party Transaction is bona fide in the best interest of the Company and (ii) the members of the committee reviewing and taking action on a Related Party Transaction observe any relevant and applicable provisions of the Company’s articles of association and exercise the powers vested in them for the purpose in which they were conferred and not for a collateral purpose. The Audit Committee reviewed and approved each of the related transactions discussed above, including the administrative services agreement and amendments to that agreement, the annual charges to the Company pursuant to the administrative services agreement, and the arrangement with NWA.
Corporate Governance
The Company is a “controlled company” as defined by the rules of The Nasdaq Stock Market because a subsidiary of Williams owns approximately 69 percent of the Company’s ordinary shares. Therefore, the Company is not subject to the requirements of The Nasdaq Stock Market that would otherwise require the Company to have (1) a majority of independent directors on the Board, (2) the compensation of executive officers determined by a majority of independent directors or a compensation committee composed solely of independent directors, and (3) a majority of independent directors or a nominating committee composed solely of independent directors elect or recommend director nominees for selection by the Board. Notwithstanding the foregoing, the Board of Directors has established a nominating committee. The Board of Directors also has a standing audit committee. The Board of Directors does not have a compensation committee or any other committees performing similar functions. Compensation decisions for the Company’s executive officers are made by Williams. The Board of Directors has determined that it is more appropriate for compensation decisions affecting the Company’s directors who are not employees of Williams or the Company’s other affiliates to be made by all of the members of the Board.
The following indicates committee membership as of March 1, 2010.
|
Audit Committee
|
Nominating Committee
|
||
|
Keith E. Bailey
|
ü
|
ü
|
|
|
Robert J. LaFortune
|
●
|
ü
|
|
|
Piero Ruffinengo
|
ü
|
ü
|
|
|
John H. Williams
|
ü
|
●
|
|
●
|
= Chairperson
|
|
ü
|
= Committee Member
|
The Board of Directors annually reviews the independence of directors and makes a determination that each director expected to be independent qualifies as an “independent director” as defined by the rules of the Nasdaq Stock Market, including a determination that the director does not have a relationship, which, in the opinion of the Board, would interfere with the exercise of independent judgment in carrying out the responsibilities as director. The Board has determined that each of Messrs. Bailey, LaFortune, Ruffinengo, and Williams is an “independent director” under the current rules of The Nasdaq Stock Market. The Board of Directors also considered that (i) Mr. Bailey serves as a director of Aegis Insurance Services Inc. (“Aegis”), which participates in the insurance coverage programs of Williams and certain of its affiliates, including the Company; and (ii) Mr. LaFortune serves as a director of Bank of Oklahoma Financial Corporation, which provides banking services to the Company. The Board noted that because Messrs. Bailey and LaFortune, do not serve as executive officers and are not significant stockholders of these companies, these relationships would not interfere with the exercise of independent judgment in carrying out responsibilities as a director. In addition, the Board of Directors has determined that each of these persons meets the heightened independence requirements of the Nasdaq Stock Market for audit committee members. Although the Board does not require that members of the nominating committee be independent, the Board has determined that its current members are independent as defined by the rules of the Nasdaq Stock Market. Messrs. Guderian, Hill, and Sailor, as employees of Williams, are not independent directors under these standards.
ITEM 14. PRINCIPAL ACCOUNTANT FEES AND SERVICES
Fees for professional services provided by Ernst & Young LLP (“E&Y”), the Company’s principal independent registered public accounting firm, for each of the last two fiscal years in each of the following categories are:
|
2009
|
2008
|
|||||||
|
Audit fees
|
$ | 339,900 | $ | 330,200 | ||||
|
Audit-related fees
|
2,500 | 11,000 | ||||||
|
Tax fees
|
--- | --- | ||||||
|
All other fees
|
--- | --- | ||||||
|
Total
|
$ | 342,400 | $ | 341,200 | ||||
Fees for audit services in 2009 and 2008 include fees associated with the annual audit, the audit of the Company’s assessment of internal controls over financial reporting as required by Section 404 of the Sarbanes-Oxley Act of 2002, and services performed in connection with other filings with the SEC. Audit-related fees in 2009 and 2008 generally include fees for assurance and related services that are reasonably related to the performance of the audit or review of the Company’s financial statements. More specifically, these services consisted principally of consultation concerning financial accounting and reporting standards.
The Audit Committee of our Board of Directors is responsible for appointing (subject to shareholder approval), setting compensation for, and overseeing the work of E&Y. The Audit Committee has established a policy regarding pre-approval of all audit and non-audit services provided by E&Y. On an ongoing basis, our management presents specific projects and categories of service to the Audit Committee to request advance approval The Audit Committee reviews those requests and advises management if the Audit Committee approves the engagement of E&Y. On a quarterly basis, management reports to the Audit Committee regarding the actual spending for such projects and services compared to approved amounts. The Audit Committee may also delegate the ability to pre-approve permissible services, excluding services related to the Company’s internal control over financial reporting, to any two committee members, provided that any such pre-approvals are reported on at a subsequent Audit Committee meeting. In 2009 and 2008, 100 percent of E&Y’s fees were pre-approved by the Audit Committee.
The Audit Committee’s pre-approval policy with respect to audit and non-audit services is available on our website at http://www.apcooilandgas.com under the “Investor Relations” tab.
PART IV
ITEM 15. EXHIBITS AND FINANCIAL STATEMENT SCHEDULES
(a) 1
Financial Statements filed in this report are set forth in the Index to Consolidated Financial Statements under Item 8.
(a) 2 and (c)
Financial statement schedules are omitted because of the absence of conditions under which they are required or because the required information is included in the financial statements and notes thereto.
Separate financial statements and supplementary data of Petrolera, a 50-percent-or-less owned person are filed as Schedule S-1.
(a) 3 and (b)
The following documents are included as exhibits to this report:
|
Exhibit
Number
|
Description
|
|
|
3.1
|
-
|
Memorandum of Association of Apco Oil and Gas International Inc. (fomerly known as Apco Argentina Inc.) as amended (including Certificate of Incorporation on Change of Name issued by the Registry of Companies, Cayman Islands, dated July 13, 2009), (filed on August 7, 2009 as Exhibit 3.1 to Apco Oil and Gas International Inc.’s Form 10-Q (File No. 0-8933)) and incorporated herein by reference.
|
|
3.2
|
-
|
Articles of Association of Apco Oil and Gas International Inc. (formerly known as Apco Argentina Inc.) as amended, (filed on August 7, 2007 as Exhibit 3.2 to Apco Oil and Gas International Inc.’s Form 10-Q (File No. 0- 8933)) and incorporated herein by reference.
|
|
4.1
|
-
|
Specimen Share Certificate of Apco Oil and Gas International Inc. (filed on August 7, 2009 as Exhibit 4.1 to Apco Oil and Gas International Inc.’s Form 10-Q (File No. 0-8933)) and incorporated herein by reference.
|
|
10.1
|
-
|
Joint Venture Agreement dated April 1, 1968, among Apco Oil Corporation, Perez Companc and Petrolera (filed on September 26, 1978 with Apco Oil and Gas International Inc.’s Form S-1 (Registration No. 2-62187)) and incorporated herein by reference.
|
|
10.2
|
-
|
Joint Venture Agreement dated February 29, 1972, among Apco Oil and Gas International Inc., Perez Companc and Petrolera (filed on September 26, 1978 with Apco Oil and Gas International Inc.’s Form S-1 (Registration No. 2-62187)) and incorporated herein by reference.
|
|
10.3
|
-
|
Joint Venture Agreement dated March 23, 1977, among Apco Oil and Gas International Inc., Perez Companc and Petrolera(filed on September 26, 1978 with Apco Oil and Gas International Inc.’s Form S-1 (Registration No. 2-62187)) and incorporated herein by reference.
|
|
10.4
|
-
|
Memorandum of Agreement dated August 16, 1979, among Apco Oil and Gas International Inc., Perez Companc and Petrolera (filed on March 28, 1980 with Apco Oil and Gas International Inc.’s Form 10-K (File No. 0-8933)) and incorporated herein by reference.
|
|
Exhibit
Number
|
Description
|
|
|
10.5
|
-
|
Agreement dated December 7, 1983, between Petrolera and YPF regarding the delivery of propane and butane from the Entre Lomas area (filed on April 12, 2983 with Apco Oil and Gas International Inc.’s Form 10-K (File No. 0-8933)) and incorporated herein by reference.
|
|
10.6
|
-
|
Agreement between the Joint Committee created by the Ministry of Public Works and Services and the Ministry of Energy, YPF and Petrolera Perez Companc S.A. dated December 26, 1990, constituting the conversion to concession and deregulation of the original Entre Lomas contract number 12,507 (filed on April 13, 1992 with Apco Oil and Gas International Inc.’s Form 10-K (File No. 0-8933)) and incorporated herein by reference.
|
|
10.7
|
-
|
Share purchase agreement by and among Ms. Maria Carmen Sundblad de Perez Companc, Sudacia S.A. and Apco Oil and Gas International Inc. dated October 23, 2002, relating to the purchase by Apco Oil and Gas International Inc. of 27,700 shares of Petrolera Perez Companc S.A. (filed on March 28, 2008 as Exhibit 10 to Apco Oil and Gas International Inc.’s Form 10-K (File No. 0- 8933)) and incorporated herein by reference.
|
|
10.8
|
-
|
Share purchase agreement by and between the shareholders of Fimaipu S.A. and Apco Oil and Gas International Inc. dated December 5, 2002, relating to the purchase by Apco Oil and Gas International Inc. of all of the shares of Fimaipu S.A. (filed on March 28, 2003 as Exhibit 10 to Apco Oil and Gas International Inc.’s Form 10-K (File No. 0-8933)) and incorporated herein by reference.
|
|
#10.9
|
-
|
Administrative Services Agreement by and between The Williams Companies, Inc. and Apco Oil and Gas International Inc. (filed on August 12, 2004 as Exhibit 10.1 to Apco Oil and Gas International Inc.’s Form 10-Q (File No. 0-8933)) and incorporated herein by reference.
|
|
10.10
|
-
|
English translation of stock purchase agreement by and between the Tower Fund L.P., Apco Oil and Gas International Inc., Netherfield Corporation, Sucursal Tierra del Fuego, Antartida e Islas del Atlantico Sur and ROCH S.A. dated February 25, 2005 relating to the purchase by Apco Oil and Gas International Inc. of 79,752 shares of Rio Cullen-Las Violetas S.A. dated February 25, 2005 (filed on March 14, 2005 as Exhibit 10 to Apco Oil and Gas International Inc.’s Form 10-K (File No. 0-8933)) and incorporated herein by reference.
|
|
#10.11
|
-
|
Summary of Non-Management Director Compensation Action (filed on August 7, 2009 as Exhibit 10.1 to Apco Oil and Gas International Inc.’s Form 10-Q (File No. 0-8933)) and incorporated herein by reference.
|
|
#10.12
|
-
|
Amendment No. 1 to Administrative Services Agreement between the Williams Companies, Inc. and Apco Oil and Gas International Inc. dated March 7, 2008 (filed on March 11, 2008 as Exhibit 10.17 to Apco Oil and Gas International Inc.’s Form 10-K (File No. 0-8933)) and incorporated herein by reference.
|
|
10.13
|
-
|
English translation of Contrato de Union Transitoria de Empresas agreement by and between the Argentine branch of Apco Oil and Gas International Inc., Petrolera Entre Lomas S.A., and Petrobras Energia S.A. relating to the Bajada del Palo concession, dated January 26, 2009 (filed on March 16, 2009 as Exhibit 10.13 to Apco Oil and Gas International Inc.’s Form 10-K (File No. 0-8933)) and incorporated herein by reference.
|
|
10.14
|
-
|
English translation of agreement between the province of Neuquén Argentina, Apco Oil and Gas International Inc., Petrolera Entre Lomas S.A., and Petrobras Energía S.A., effective July 23, 2009, relating to the extension of the terms of the Bajada del Palo and Entre Lomas hydrocarbon concessions located in the Neuquén province for an additional 10 years (filed on August 7, 2009 as Exhibit 10.2 to Apco Oil and Gas International Inc.’s Form 10-Q (File No. 0-8933)) and incorporated herein by reference.
|
|
*21
|
-
|
Subsidiaries of the registrant.
|
|
Exhibit
Number
|
Description
|
|
|
*23.1
|
-
|
Consent of Independent Petroleum Engineers, Ralph E. Davis Associates, Inc.
|
|
*23.2
|
-
|
Consent of Independent Petroleum Engineers, Gaffney, Cline & Associates Inc.
|
|
*23.3
|
-
|
Consent of Independent Petroleum Engineers, Ryder Scott Company, L.P.
|
|
*23.4
|
-
|
Consent of Independent Petroleum Engineers, RPS Energy.
|
|
*24
|
-
|
Power of attorney.
|
|
*31.1
|
-
|
Certification of the Chief Executive Officer pursuant to Rules 13a-14(a) and 15d-14(a) promulgated under the Securities Exchange Act of 1934, as amended, and Item 601(b)(31) of Regulation S-K, as adopted pursuant to Section 302 of the Sarbanes-Oxley Act of 2002.
|
|
*31.2
|
-
|
Certification of the Chief Financial Officer pursuant to Rules 13a-14(a) and 15d-14(a) promulgated under the Securities Exchange Act of 1934, as amended, and Item 601(b)(31) of Regulation S-K, as adopted pursuant to Section 302 of the Sarbanes-Oxley Act of 2002.
|
|
*32
|
-
|
Certification of the Chief Executive Officer and the Chief Financial Officer pursuant to 18 U.S.C. Section 1350, as adopted pursuant to Section 906 of the Sarbanes-Oxley Act of 2002.
|
|
*99.1
|
-
|
Report of Independent Petroleum Engineers and Geologists, Ralph E. Davis Associates, Inc.
|
|
*99.2
|
- | Report of Independent Petroleum Engineers and Geologists, RPS Energy. |
|
+
|
In July 2009, the registrant’s name was changed from Apco Argentina Inc. to Apco Oil and Gas International Inc.
|
|
|
*
|
Filed herewith.
|
|
|
#
|
Management contract or compensatory plan or arrangement.
|
SIGNATURES
Pursuant to the requirements of Section 13 or 15(d) of the Securities Exchange Act of 1934, the registrant has duly caused this report to be signed on its behalf by the undersigned, thereunto duly authorized.
|
APCO OIL AND GAS INTERNATIONAL INC.
|
|||
|
(Registrant)
|
|||
|
By:
|
/s/ Landy L. Fullmer
|
||
|
Landy L. Fullmer
|
|||
|
Chief Financial Officer, Chief Accounting Officer, and Controller
|
|||
Date: March 12, 2010
Pursuant to the requirements of the Securities Exchange Act of 1934, this report has been signed below by the following persons on behalf of the registrant and in the capacities and on the dates indicated.
|
Signature
|
Title
|
Date
|
|
/s/ Ralph A. Hill
|
Chief Executive Officer and Chairman of the Board
|
March 12, 2010
|
| Ralph A. Hill | (Principal Executive Officer) | |
|
/s/ Landy L. Fullmer
|
Chief Financial Officer,
|
March 12, 2010
|
| Landy L. Fullmer |
Chief Accounting Officer, and Controller
(Principal Financial Officer and Principal Accounting Officer)
|
|
|
/s/ *Keith E. Bailey
|
Director
|
March 12, 2010
|
|
Keith E. Bailey
|
||
|
/s/ *Rodney J. Sailor
|
Director
|
March 12, 2010
|
|
Rodney J. Sailor
|
||
|
/s/ *Robert J. LaFortune
|
Director
|
March 12, 2010
|
|
Robert J. LaFortune
|
||
|
/s/ *Bryan K. Guderian
|
Director
|
March 12, 2010
|
|
Bryan K. Guderian
|
||
|
/s/ *Piero Ruffinengo
|
Director
|
March 12, 2010
|
|
Piero Ruffinengo
|
||
|
/s/ *John H. Williams
|
Director
|
March 12, 2010
|
|
John H. Williams
|
||
|
*By: /s/ Thomas Bueno
|
March 12, 2010
|
|
|
Thomas Bueno
Attorney-in-Fact
|
INDEX TO EXHIBITS
|
Exhibit
Number
|
Description
|
|
|
3.1
|
-
|
Memorandum of Association of Apco Oil and Gas International Inc. (fomerly known as Apco Argentina Inc.) as amended (including Certificate of Incorporation on Change of Name issued by the Registry of Companies, Cayman Islands, dated July 13, 2009), (filed on August 7, 2009 as Exhibit 3.1 to Apco Oil and Gas International Inc.’s Form 10-Q (File No. 0-8933)) and incorporated herein by reference.
|
|
3.2
|
-
|
Articles of Association of Apco Oil and Gas International Inc. (formerly known as Apco Argentina Inc.) as amended, (filed on August 7, 2007 as Exhibit 3.2 to Apco Oil and Gas International Inc.’s Form 10-Q (File No. 0- 8933)) and incorporated herein by reference.
|
|
4.1
|
-
|
Specimen Share Certificate of Apco Oil and Gas International Inc. (filed on August 7, 2009 as Exhibit 4.1 to Apco Oil and Gas International Inc.’s Form 10-Q (File No. 0-8933)) and incorporated herein by reference.
|
|
10.1
|
-
|
Joint Venture Agreement dated April 1, 1968, among Apco Oil Corporation, Perez Companc and Petrolera (filed on September 26, 1978 with Apco Oil and Gas International Inc.’s Form S-1 (Registration No. 2-62187)) and incorporated herein by reference.
|
|
10.2
|
-
|
Joint Venture Agreement dated February 29, 1972, among Apco Oil and Gas International Inc., Perez Companc and Petrolera (filed on September 26, 1978 with Apco Oil and Gas International Inc.’s Form S-1 (Registration No. 2-62187)) and incorporated herein by reference.
|
|
10.3
|
-
|
Joint Venture Agreement dated March 23, 1977, among Apco Oil and Gas International Inc., Perez Companc and Petrolera(filed on September 26, 1978 with Apco Oil and Gas International Inc.’s Form S-1 (Registration No. 2-62187)) and incorporated herein by reference.
|
|
10.4
|
-
|
Memorandum of Agreement dated August 16, 1979, among Apco Oil and Gas International Inc., Perez Companc and Petrolera as filed with Apco Oil and Gas International Inc.'s Form 10-K, No. 0-8933, dated March 28, 1980 incorporated by reference herein.
|
|
Exhibit
Number
|
Description
|
|
|
10.5
|
-
|
Agreement dated December 7, 1983, between Petrolera and YPF regarding the delivery of propane and butane from the Entre Lomas area (filed on April 12, 2983 with Apco Oil and Gas International Inc.’s Form 10-K (File No. 0-8933)) and incorporated herein by reference.
|
|
10.6
|
-
|
Agreement between the Joint Committee created by the Ministry of Public Works and Services and the Ministry of Energy, YPF and Petrolera Perez Companc S.A. dated December 26, 1990, constituting the conversion to concession and deregulation of the original Entre Lomas contract number 12,507 (filed on April 13, 1992 with Apco Oil and Gas International Inc.’s Form 10-K (File No. 0-8933)) and incorporated herein by reference.
|
|
10.7
|
-
|
Share purchase agreement by and among Ms. Maria Carmen Sundblad de Perez Companc, Sudacia S.A. and Apco Oil and Gas International Inc. dated October 23, 2002, relating to the purchase by Apco Oil and Gas International Inc. of 27,700 shares of Petrolera Perez Companc S.A. (filed on March 28, 2008 as Exhibit 10 to Apco Oil and Gas International Inc.’s Form 10-K (File No. 0- 8933)) and incorporated herein by reference.
|
|
10.8
|
-
|
Share purchase agreement by and between the shareholders of Fimaipu S.A. and Apco Oil and Gas International Inc. dated December 5, 2002, relating to the purchase by Apco Oil and Gas International Inc. of all of the shares of Fimaipu S.A. ( (filed on March 28, 2003 as Exhibit 10 to Apco Oil and Gas International Inc.’s Form 10-K (File No. 0-8933)) and incorporated herein by reference.
|
|
#10.9
|
-
|
Administrative Services Agreement by and between The Williams Companies, Inc. and Apco Oil and Gas International Inc. (filed on August 12, 2004 as Exhibit 10.1 to Apco Oil and Gas International Inc.’s Form 10-Q (File No. 0-8933)) and incorporated herein by reference.
|
|
10.10
|
-
|
English translation of stock purchase agreement by and between the Tower Fund L.P., Apco Oil and Gas International Inc., Netherfield Corporation, Sucursal Tierra del Fuego, Antartida e Islas del Atlantico Sur and ROCH S.A. dated February 25, 2005 relating to the purchase by Apco Oil and Gas International Inc. of 79,752 shares of Rio Cullen-Las Violetas S.A. dated February 25, 2005 (filed on March 14, 2005 as Exhibit 10 to Apco Oil and Gas International Inc.’s Form 10-K (File No. 0-8933)) and incorporated herein by reference.
|
|
#10.11
|
-
|
Summary of Non-Management Director Compensation Action (filed on August 7, 2009 as Exhibit 10.1 to Apco Oil and Gas International Inc.’s Form 10-Q (File No. 0-8933)) and incorporated herein by reference.
|
|
#10.12
|
-
|
Amendment No. 1 to Administrative Services Agreement between the Williams Companies, Inc. and Apco Oil and Gas International Inc. dated March 7, 2008 (filed on March 11, 2008 as Exhibit 10.17 to Apco Oil and Gas International Inc.’s Form 10-K (File No. 0-8933)) and incorporated herein by reference.
|
|
10.13
|
-
|
English translation of Contrato de Union Transitoria de Empresas agreement by and between the Argentine branch of Apco Oil and Gas International Inc., Petrolera Entre Lomas S.A., and Petrobras Energia S.A. relating to the Bajada del Palo concession, dated January 26, 2009 (filed on March 16, 2009 as Exhibit 10.13 to Apco Oil and Gas International Inc.’s Form 10-K (File No. 0-8933)) and incorporated herein by reference.
|
|
-
|
Subsidiaries of the registrant.
|
|
|
-
|
Consent of Independent Petroleum Engineers, Ralph E. Davis Associates, Inc.
|
|
|
-
|
Consent of Independent Petroleum Engineers, Gaffney, Cline & Associates Inc.
|
|
|
-
|
Consent of Independent Petroleum Engineers, Ryder Scott Company, L.P.
|
|
|
-
|
Consent of Independent Petroleum Engineers, RPS Energy.
|
|
|
-
|
Power of attorney.
|
|
|
-
|
Certification of the Chief Executive Officer pursuant to Rules 13a-14(a) and 15d-14(a) promulgated under the Securities Exchange Act of 1934, as amended, and Item 601(b)(31) of Regulation S-K, as adopted pursuant to Section 302 of the Sarbanes-Oxley Act of 2002.
|
|
Exhibit
Number
|
Description
|
|
|
-
|
Certification of the Chief Financial Officer pursuant to Rules 13a-14(a) and 15d-14(a) promulgated under the Securities Exchange Act of 1934, as amended, and Item 601(b)(31) of Regulation S-K, as adopted pursuant to Section 302 of the Sarbanes-Oxley Act of 2002.
|
|
|
-
|
Certification of the Chief Executive Officer and the Chief Financial Officer pursuant to 18 U.S.C. Section 1350, as adopted pursuant to Section 906 of the Sarbanes-Oxley Act of 2002.
|
|
| *99.1 |
Report of Independent Petroleum Engineers and Geologists, Ralph E. Davis Associates, Inc.
|
|
| *99.2 | Report of Independent Petroleum Engineers and Geologists, RPS Energy. | |
|
*
|
Each such exhibit has heretofore been filed with the SEC as part of the filing indicated and is incorporated herein by reference.
|
|
|
+
|
Filed herewith.
|
|
|
#
|
Management contract or compensatory plan or arrangement.
|
Schedule S-1
PETROLERA ENTRE LOMAS S.A.
Financial Statements for the fiscal year
ended December 31, 2009
with Report of Independent Registered Public Accounting Firm
PETROLERA ENTRE LOMAS S.A.
TABLE OF CONTENTS TO FINANCIAL STATEMENTS
|
CONTENTS
|
PAGE
|
|||
| · | Report of Independent Registered Public Accounting Firm | |||
|
·
|
Financial statements
|
|||
|
-
|
Balance sheets as of December 31, 2009 and 2008
|
- 1 -
|
||
|
-
|
Statements of income for the years ended December 31, 2009, 2008 and 2007
|
- 2 -
|
||
|
-
|
Statements of shareholders’ equity for the years ended December 31, 2009, 2008 and 2007
|
- 3 -
|
||
|
-
|
Statements of cash flows for the years ended December 31, 2009, 2008 and 2007
|
- 4 -
|
||
|
-
|
Notes to financial statements
|
- 5 -
|
||
REPORT OF INDEPENDENT REGISTERED PUBLIC ACCOUNTING FIRM
To the Board of Directors and Shareholders of
PETROLERA ENTRE LOMAS S.A.:
We have audited the accompanying balance sheets of Petrolera Entre Lomas S.A. (an Argentine corporation) as of December 31, 2009 and 2008, and the related statements of income, shareholders’ equity and cash flows for each of the three years in the period ended December 31, 2009. These financial statements are the responsibility of the Company’s management. Our responsibility is to express an opinion on these financial statements based on our audits.
We conducted our audits in accordance with the standards of the Public Company Accounting Oversight Board (United States). Those standards require that we plan and perform the audit to obtain reasonable assurance about whether the financial statements are free of material misstatement. We were not engaged to perform an audit of the Company’s internal control over financial reporting. Our audits included consideration of internal control over financial reporting as a basis for designing audit procedures that are appropriate in the circumstances, but not for the purpose of expressing an opinion on the effectiveness of the Company’s internal control over financial reporting. Accordingly, we express no such opinion. An audit also includes examining, on a test basis, evidence supporting the amounts and disclosures in the financial statements, assessing the accounting principles used and significant estimates made by management, and evaluating the overall financial statement presentation. We believe that our audits provide a reasonable basis for our opinion.
In our opinion, the financial statements referred to above present fairly, in all material respects, the financial position of Petrolera Entre Lomas S.A. as of December 31, 2009 and 2008, and the results of its operations and its cash flows for each of the three years in the period ended December 31, 2009, in conformity with U.S. generally accepted accounting principles.
|
Buenos Aires, Argentina
|
PISTRELLI, HENRY MARTIN Y ASOCIADOS S.R.L.
|
|
February 26, 2010
|
(member of Ernst & Young Global)
|
|
ENRIQUE C. GROTZ
|
|
|
Partner
|
PETROLERA ENTRE LOMAS S.A.
BALANCE SHEETS AS OF DECEMBER 31, 2009 AND 2008
(stated in thousands of U.S. dollars)
|
December 31,
|
||||||||
|
2009
|
2008
|
|||||||
|
ASSETS
|
||||||||
|
CURRENT ASSETS
|
||||||||
|
Cash and cash equivalents
|
41,672 | 30,499 | ||||||
|
Accounts receivable (14,063 and 5,685 with related parties, Note 6)
|
23,117 | 23,022 | ||||||
|
Other receivables (226 and 242 with related parties, Note 6)
|
5,385 | 4,647 | ||||||
|
Inventories
|
1,733 | 2,131 | ||||||
|
Other assets
|
409 | 239 | ||||||
|
Total current assets
|
72,316 | 60,538 | ||||||
|
NONCURRENT ASSETS
|
||||||||
|
Property and equipment, net (Note 5)
|
206,998 | 192,211 | ||||||
|
Deferred tax asset, net (Note 4)
|
529 | 522 | ||||||
|
Other assets
|
1,049 | 1,134 | ||||||
|
Total noncurrent assets
|
208,576 | 193,867 | ||||||
|
Total assets
|
280,892 | 254,405 | ||||||
|
LIABILITIES AND SHAREHOLDERS’ EQUITY
|
||||||||
|
CURRENT LIABILITIES
|
||||||||
|
Accounts payable and accrued liabilities (377 and 516 with related parties, Note 6)
|
11,980 | 13,918 | ||||||
|
Debt and accrued debt interest (Note 13)
|
13,096 | 9,814 | ||||||
|
Taxes payable and payroll (Note 10)
|
9,848 | 8,945 | ||||||
|
Other liabilities (Note 10)
|
12,182 | 549 | ||||||
|
Total current liabilities
|
47,106 | 33,226 | ||||||
|
NONCURRENT LIABILITIES
|
||||||||
|
Debt (Note 13)
|
35,493 | 40,400 | ||||||
|
Other liabilities (Note 10)
|
8,682 | 6,307 | ||||||
|
Total noncurrent liabilities
|
44,175 | 46,707 | ||||||
|
Total liabilities
|
91,281 | 79,933 | ||||||
|
SHAREHOLDERS’ EQUITY
|
||||||||
|
Paid-in capital (95,443,572 ordinary shares and 20,414,127 preferred shares authorized, issued and outstanding)
|
41,289 | 41,289 | ||||||
|
Legal reserve
|
7,829 | 7,829 | ||||||
|
Facultative reserve
|
91,004 | 75,281 | ||||||
|
Retained earnings
|
51,411 | 51,848 | ||||||
|
Accumulated other comprehensive loss
|
(1,922 | ) | (1,775 | ) | ||||
|
Total shareholders’ equity
|
189,611 | 174,472 | ||||||
|
Total liabilities and shareholders’ equity
|
280,892 | 254,405 | ||||||
The accompanying notes are an integral part of these financial statements.
PETROLERA ENTRE LOMAS S.A.
STATEMENTS OF INCOME
FOR THE YEARS ENDED DECEMBER 31, 2009, 2008 AND 2007
(stated in thousands of U.S. dollars)
|
Year ended December 31,
|
||||||||||||
|
2009
|
2008
|
2007
|
||||||||||
|
REVENUES:
|
||||||||||||
|
Operating revenues (97,153, 152,826 and 144,571 with related parties, Note 6)
|
180,575 | 179,980 | 155,926 | |||||||||
|
COST AND EXPENSES:
|
||||||||||||
|
Operating expenses (2,822, 2,705 and 2,631 with related parties, Note 6)
|
(40,744 | ) | (44,310 | ) | (29,640 | ) | ||||||
|
Provincial production tax
|
(21,961 | ) | (20,419 | ) | (17,520 | ) | ||||||
|
Transportation and storage
|
(2,257 | ) | (2,084 | ) | (1,935 | ) | ||||||
|
Selling and administrative
|
(4,420 | ) | (4,653 | ) | (3,745 | ) | ||||||
|
Depreciation of property and equipment
|
(44,129 | ) | (32,990 | ) | (22,979 | ) | ||||||
|
Exploration expense
|
(1,091 | ) | (2,950 | ) | (3,026 | ) | ||||||
|
Other than income tax
|
(4,306 | ) | (6,393 | ) | (4,117 | ) | ||||||
|
Financial losses
|
(3,377 | ) | (3,112 | ) | (917 | ) | ||||||
|
Foreign exchange (losses) gains
|
(836 | ) | (37 | ) | 184 | |||||||
|
Other (expense) income, net (0, 183 and 1,097 with related parties, Note 6)
|
(900 | ) | 106 | 99 | ||||||||
|
Total cost and expenses
|
(124,021 | ) | (116,842 | ) | (83,596 | ) | ||||||
|
Income before income tax
|
56,554 | 63,138 | 72,330 | |||||||||
|
Income tax (Note 4)
|
(22,268 | ) | (23,206 | ) | (27,307 | ) | ||||||
|
Net income
|
34,286 | 39,932 | 45,023 | |||||||||
The accompanying notes are an integral part of these financial statements.
PETROLERA ENTRE LOMAS S.A.
STATEMENTS OF SHAREHOLDERS’ EQUITY
FOR THE YEARS ENDED DECEMBER 31, 2009, 2008 AND 2007
(stated in thousands of U.S. dollars)
|
Balance
|
Capital stock
|
Legal reserve
|
Facultative reserve
|
Accumulated other comprehensive loss
|
Retained earnings
|
Total
|
||||||||||||||||||||
|
December 31, 2006
|
41,289 | 4,017 | 24,013 | (1,862 | ) | 69,973 | 137,430 | |||||||||||||||||||
| - |
Allocation of unappropiated retained earnings, as approved by Shareholders’ meeting
|
- | 2,797 | 53,136 | - | (55,933 | ) | - | ||||||||||||||||||
| - |
Pension plan liability adjustment (Note 11)
|
- | - | - | 184 | - | 184 | |||||||||||||||||||
| - |
Dividends
|
- | - | (31,000 | ) | - | - | (31,000 | ) | |||||||||||||||||
| - |
Net income
|
- | - | - | - | 45,023 | 45,023 | |||||||||||||||||||
|
December 31, 2007
|
41,289 | 6,814 | 46,149 | (1,678 | ) | 59,063 | 151,637 | |||||||||||||||||||
| - |
Allocation of unappropiated retained earnings, as approved by Shareholders’ meeting
|
- | 1,015 | 46,132 | - | (47,147 | ) | - | ||||||||||||||||||
| - |
Pension plan liability adjustment (Note 11)
|
- | - | - | (97 | ) | - | (97 | ) | |||||||||||||||||
| - |
Dividends
|
- | - | (17,000 | ) | - | - | (17,000 | ) | |||||||||||||||||
| - |
Net income
|
- | - | - | - | 39,932 | 39,932 | |||||||||||||||||||
|
December 31, 2008
|
41,289 | 7,829 | 75,281 | (1,775 | ) | 51,848 | 174,472 | |||||||||||||||||||
| - |
Allocation of unappropiated retained earnings, as approved by Shareholders’ meeting
|
- | - | 34,723 | - | (34,723 | ) | - | ||||||||||||||||||
| - |
Pension plan liability adjustment (Note 11)
|
- | - | - | (147 | ) | - | (147 | ) | |||||||||||||||||
| - |
Dividends
|
- | - | (19,000 | ) | - | - | (19,000 | ) | |||||||||||||||||
| - |
Net income
|
- | - | - | - | 34,286 | 34,286 | |||||||||||||||||||
|
December 31, 2009
|
41,289 | 7,829 | 91,004 | (1,922 | ) | 51,411 | 189,611 | |||||||||||||||||||
The accompanying notes are an integral part of these financial statements.
PETROLERA ENTRE LOMAS S.A.
STATEMENTS OF CASH FLOWS
FOR THE YEARS ENDED DECEMBER 31, 2009, 2008 AND 2007
(stated in thousands of U.S. dollars)
|
Year ended December 31,
|
||||||||||||
|
2009
|
2008
|
2007
|
||||||||||
|
CASH FLOWS FROM OPERATING ACTIVITIES
|
||||||||||||
|
Net income
|
34,286 | 39,932 | 45,023 | |||||||||
|
Adjustments to reconcile net income to net cash provided by operating activities:
|
||||||||||||
|
Depreciation of property and equipment
|
44,129 | 32,990 | 22,979 | |||||||||
|
Deferred income tax
|
(87 | ) | (300 | ) | (334 | ) | ||||||
|
Changes in assets and liabilities, net:
|
||||||||||||
|
(Increase) decrease in assets:
|
||||||||||||
|
Accounts receivable
|
8,283 | (14,800 | ) | (1,265 | ) | |||||||
|
Due from related parties
|
(8,378 | ) | 10,398 | 674 | ||||||||
|
Inventories
|
398 | (854 | ) | 210 | ||||||||
|
Other receivables
|
(738 | ) | (625 | ) | (848 | ) | ||||||
|
Other assets
|
(85 | ) | 6 | (30 | ) | |||||||
|
Increase (decrease) in liabilities:
|
||||||||||||
|
Accounts payable and accrued liabilities
|
(1,799 | ) | 2,409 | 3,505 | ||||||||
|
Due to related parties
|
(139 | ) | 45 | (6 | ) | |||||||
|
Taxes payable and payroll
|
903 | 2,756 | (10,668 | ) | ||||||||
|
Other liabilities
|
88 | (190 | ) | 1,155 | ||||||||
|
Net cash provided by operating activities
|
76,861 | 71,767 | 60,395 | |||||||||
|
CASH FLOWS FROM INVESTING ACTIVITIES
|
||||||||||||
|
Net purchase of property and equipment
|
(51,063 | ) | (63,539 | ) | (66,795 | ) | ||||||
|
CASH FLOWS FROM FINANCING ACTIVITIES
|
||||||||||||
|
Debt (paid) obtained
|
(1,625 | ) | 16,000 | 34,000 | ||||||||
|
Dividends paid
|
(13,000 | ) | (17,000 | ) | (31,000 | ) | ||||||
| (14,625 | ) | (1,100 | ) | 3,000 | ||||||||
|
Net increase (decrease) in cash and cash equivalents
|
11,173 | 7,228 | (3,400 | ) | ||||||||
|
Cash and cash equivalents at beginning of year
|
30,499 | 23,271 | 26,671 | |||||||||
|
Cash and cash equivalents at end of year
|
41,672 | 30,499 | 23,271 | |||||||||
|
Supplemental cash flow information:
|
||||||||||||
|
Interest paid
|
1,813 | 2,380 | 255 | |||||||||
|
Income taxes paid
|
16,245 | 17,026 | 37,796 | |||||||||
The accompanying notes are an integral part of these financial statements.
PETROLERA ENTRE LOMAS S.A.
NOTES TO FINANCIAL STATEMENTS
(stated in thousands of U.S. dollars, except otherwise indicated)
|
1.
|
CORPORATE ORGANIZATION
|
Petrolera Entre Lomas S.A. is an Argentine corporation. As of December 31, 2009 the shareholders of the Company and their participations were as follows:
|
Petrobras Energía S.A.
|
19.21 | % | ||
|
Apco Oil & Gas International Inc.
|
39.22 | % | ||
|
Apco Argentina S.A.
|
1.58 | % | ||
|
Petrobras Participacoes, S.L.
|
39.67 | % | ||
|
Other
|
0.32 | % | ||
| 100.00 | % |
Apco Argentina S.A. is a wholly owned subsidiary of Apco Oil & Gas International Inc.
The Company is operator and participant in Entre Lomas concession (Entre Lomas, an unincorporated joint venture founded in August 12, 1968) located in Río Negro and Neuquén provinces in southwest Argentina, which is accounted for following the proportional consolidation method.
The concession contract, renegotiated in 1991 and 1994, permitted the concessionaires to freely dispose of their crude oil and natural gas production and extended the concession term through January 21, 2016.
In 2007, the Company acquired a 73.15% participation interest in “Amarga Chica-Bajada del Palo U.T.E.” joint venture, concessionaire of the hydrocarbons explotation of Bajada del Palo Area, located in the Province of Neuquén. This concession extended through September 7, 2015.
The enactment of Law No. 26,197 amending Law No. 17,319, provides the legal framework for the provinces to exercise jurisdiction based on original ownership and to manage the oil and gas fields within their territory. Given this power, the province of Neuquén asked for the renegotiation of the concession terms. The Company accepted to renegotiate the Entre Lomas and Bajada del Palo concessions for another 10 years.
During 2009, the Company agreed with the province of Neuquén a 10-year extension to the portion of the exploitation concession of the Entre Lomas area located in such province, and the Bajada del Palo area.
The agreement establishes a concession fee to be paid in 19 monthly and consecutive installments totaling 12.5 million, a commitment to make investments and disbursements to operate both areas amounting to 236.6 million to be made between September 1, 2008, and the year 2026, and an increase of 3% of the provincial production tax.
The Company bears 73.15% of the amounts mentioned, in proportion to the interest it holds in such areas.
The negotiation for the extension of the concession term of the Entre Lomas area located in the province of Río Negro is still pending, since the provincial government has not yet called for its renegotiation.
PETROLERA ENTRE LOMAS S.A.
During 2007, an exploration permit was obtained for Agua Amarga Area in the Province of Río Negro. The permit consists of three periods of three, two and one years respectively. The partners committed investments for 23,2 million mainly in 3D seismic and drilling (17 million to 73.15% of PELSA’s interest). To guarantee the fulfillment of all the obligations assumed in the agreement for the first exploration period, the Company purchased a surety performance bond for the total amount committed.
Based on the results of the exploration carried out in the Agua Amarga area, the Company requested the province of Río Negro the exploitation concession of a portion of the area, which was granted for a 25-year term. The remaining area is still subject to the exploratory permit.
The partners’ interests in the above mentioned joint ventures as of December 31, 2009 were as follows:
|
Petrolera Entre Lomas S.A. (Operator)
|
73.15 | % | ||
|
Apco Oil & Gas International Inc. Argentine Branch
|
23.00 | % | ||
|
Petrobras Energía S.A.
|
3.85 | % | ||
| 100.00 | % |
The Company’s interest (73.15%) in assets and liabilities related to the mentioned joint ventures, as of December 2009 and 2008, is as follows:
|
2009
|
2008
|
|||||||
|
Current assets
|
12,870 | 31,664 | ||||||
|
Noncurrent assets
|
192,699 | 173,810 | ||||||
|
Total assets
|
205,569 | 205,474 | ||||||
|
Current liabilities
|
(26,911 | ) | (41,082 | ) | ||||
|
Noncurrent liabilities
|
(8,643 | ) | (6,396 | ) | ||||
|
Total liabilities
|
(35,554 | ) | (47,478 | ) | ||||
The Company’s interest (73.15%) in costs and expenses related to joint ventures as of December 2009, 2008 and 2007, is as follows:
|
2009
|
2008
|
2007
|
||||||||||
|
Operating costs
|
(99,812 | ) | (94,871 | ) | (70,579 | ) | ||||||
|
Selling expenses
|
(2,042 | ) | (2,141 | ) | (2,111 | ) | ||||||
|
Administrative expenses
|
(4,149 | ) | (4,147 | ) | (3,298 | ) | ||||||
|
Exploration expenses
|
(1,091 | ) | (2,950 | ) | (2,782 | ) | ||||||
|
Other operating expenses
|
(1,585 | ) | (534 | ) | (251 | ) | ||||||
|
Financial income and holding gains, net
|
(335 | ) | 835 | 333 | ||||||||
| (109,014 | ) | (103,808 | ) | (78,688 | ) | |||||||
|
2.
|
BASIS OF PRESENTATION AND SIGNIFICANT ACCOUNTING POLICIES
|
Basis of presentation
The financial statements have been prepared in accordance with U.S. generally accepted accounting principles (US GAAP).
PETROLERA ENTRE LOMAS S.A.
The Company has only one business segment and is engaged in the oil and gas exploration, development and production in the Entre Lomas, Bajada del Palo and Agua Amarga joint ventures. All of the Company´s operating revenues and all of its long-lived assets are in Argentina.
Oil and gas operation is high risk in nature. A successful operation requires that a company deal with uncertainties about the subsurface that even a combination of experience, scientific information and careful evaluation cannot always overcome.
The preparation of financial statements in conformity with US GAAP requires management to make estimates and assumptions that affect the reported amounts of assets and liabilities, at the date of the financial statements, and the reported amounts of revenues and expenses during the reporting period. Actual results could differ from those estimates.
Summary of significant accounting policies
Cash and cash equivalents
Cash and cash equivalents include highly liquid bank deposits of 41.7 million and 30.5 million of which 41.4 million and 10.3 million earned interest with an average rate of 0.56 and 4.54 percent in 2009 and 2008, respectively. The Company considers all investments with an original maturity of three months or less to be cash equivalents.
Other receivables
Mainly includes mandatory saving receivable detailed in Note 3.
Inventories
Includes hydrocarbons by 1,333 and 1,685 and material and spare parts by 400 and 446, in 2009 and 2008, respectively, which were accounted for at the lower of cost or market. The cost is determined by the first-in, first-out method.
Other assets
Includes prepaid expenses, and long term tax credit.
Property and Equipment
The Company uses the successful-efforts method of accounting for its oil and gas exploration and production activities. Under this method, exploration costs, excluding the costs of exploratory wells, are charged to expenses as incurred. Drilling costs of exploratory wells, including stratigraphic test wells, are capitalized pending determination of whether proved reserves exist which justify commercial development. If such reserves are not found, the drilling costs are charged to exploratory expense of the year. Drilling costs of productive wells and of dry holes drilled for development of oil and gas reserves are capitalized. Non oil and gas property is recorded at cost.
Wells and other oil an gas equipment are depreciated over their productive lives using the unit of production method, by applying the ratio of oil and gas produced to the proved developed oil and gas reserves. The Company’s remaining property and equipment are depreciated by the straight-line method based on their estimated useful lives, resulting in annual rates in a range of 10% to 33%.
PETROLERA ENTRE LOMAS S.A.
Acquisition costs of proved properties are depreciated and depleted by the unit-of-production method, applying the ratio of oil and gas produced to the total proved oil and gas reserves.
The Company reviews its proved properties for impairment and recognizes an impairment whenever events or circumstances, such as declining oil and gas prices, indicate that a property’s carrying value may not be recoverable. If an impairment is indicated, then a provision is recognized to the extent that the carrying value exceeds fair value. For the years ended December 31, 2009, 2008 and 2007, the Company did not experience any impairment indicators.
The oil and gas reserves estimations considered in these financial statements, have been calculated based on technical and economic conditions effective as of each year-end by Petrolera Entre Lomas S.A.’s engineers and are reviewed at least once a year. The Company believes that these estimates are fair and will be adjusted whenever facts or evidence justify it.
As a result of the extension of the concession terms mentioned in Note 1, as of December 31, 2009, the present value of the extension cost has been recognized as “Acquisition costs of proved property” as described in Note 5.
Accounting Standards requires that the fair value of a liability for an asset retirement obligation be recognized in the period in which it is incurred if a reasonable estimate of fair value can be made, and that the associated asset retirement costs be capitalized as part of the carrying amount of the long-lived asset.
The Company’s asset retirement obligation is based on estimates of the number of wells expected to be abandoned through the last year of the concessions term and an estimated cost to plug and abandon a well. Both estimates were provided by the Company’s engineers and are considered to be the best estimates that can be derived today based on present information. Such estimates are, however, subject to significant change as time passes. Given the uncertainty inherent in the process of estimating oil and gas reserves and future oil and gas production streams, the estimate of the number of wells to be plugged and abandoned could change as new information is obtained.
The Company estimates it will not be required to plug and abandon those wells that will continue to be producing wells upon the termination of the concessions. The estimated asset retirement obligation as of December 31, 2009 and 2008 totaled 5,624 and 3,401. The change in total asset retirement obligation from December 31, 2008 to December 31, 2009 mainly relates to changes in the amount of wells planned to be abandoned and increases in plugging costs.
Foreign currency translation
The financial statements have been translated into United States dollars in accordance with ASC 830, Foreign Currency Matters, using the United States dollar as the functional currency.
Fair value of financial instruments
The carrying amount reported in the balance sheet for financial instruments approximates to fair value.
Revenue recognition
The Company recognizes revenues from sales of oil, gas and plant products net of VAT at the time the product is delivered to the purchaser and title has passed. Any product produced that has not been delivered is reported as inventory. When cost is calculated, it includes total per unit operating cost and depreciation. Transportation and storage costs are recorded as expenses when incurred. The Company has had no contract imbalances relating to either oil or gas production.
PETROLERA ENTRE LOMAS S.A.
At the request of the Argentine Government, oil and gas refining companies and oil & gas production companies signed in 2003 an agreement with the intent to maintain the stability of crude oil, gasoline and diesel oil prices (the Agreement).
Under the Agreement crude oil producers and refiners agreed to cap amounts payable for a portion of domestic oil sales contracts at a price of 28.50 per barrel. In addition, producers and refiners also agreed that the excess of the actual price of West Texas Intermediate (WTI), the crude oil type that serves as a reference price for crude oil sales contracts in Argentina, over the 28.50 temporary cap would be payable at such time as WTI fell below 28.50. The debt payable by domestic refiners to producers accrues interest at 7% per annum.
The price stability agreement was renewed until April 30, 2004. However, the decision to not renew the agreement does not terminate the obligation of refiners to reimburse producers for the balances that accumulated from January 2003 through April 2004 if and when the price of WTI falls below 28.50. As of December 31, 2009, the total price credit available to the Company from domestic refiners amounts to 8.0 million and will be recognized in revenues when the price of WTI falls below 28.50 and the Company continues to receive the 28.50 price until its respective price credits are collected. As of December 31, 2009 none of such amounts have been recognized in revenues.
Derivative instruments
The Company does not usually use derivatives to hedge price volatility or for other purposes.
Recently issued accounting pronouncements
Accounting Standards Update (ASU) 2010-03 issued on January 6, 2010, amended ASC 932 Extractive Activities – Oil and Gas to substantially conform to the requirements in the SEC final rule N° 33-8995, Modernization of Oil and Gas Reporting Requirements. The ASU, among other things, expanded the definition of oil and gas producing activities to include nontraditional resources, updated definitions, changed the price used to determine whether reserves can be produced economically from the year-end spot price to a 12-month average price and modified the disclosures requirements. ASU 2010-03 is effective for annual reporting periods ending on or after December 31, 2009.
ASU 2009-05 issued on August 28, 2009 amended ASC 820 providing additional guidance on the measurement of liabilities at fair value. The amendments are effective for the first reporting period beginning after its issuance.
FASB Statement N° 168, the FASB Accounting Standards Codification and the Hierarchy of Generally Accepted Accounting Principles –a replacement of FASB Statement N° 162 was issued on June 30, 2009. The Codification became the source of authoritative US Generally Accepted Accounting Principles recognized by the FASB to be applied by nongovernmental entities. It superseded all existing non – SEC accounting and reporting standards. It is effective for financial statements issued for periods ending after September 15, 2009, with certain exceptions.
Statement 165, issued on May 28, 2009, provided subsequent events guidance, which is similar to current guidance in the auditing literature. It modified the definition of subsequent events to refer to events that occur after the balance sheet date, but before the financial statements are issued (for public entities) or available to be issued (for nonpublic entities that do not widely distribute their financial statements). It also required entities to disclose the date through which an entity has evaluated subsequent events and the basis for that date. Statement 165 is effective for periods ending after June 15, 2009.
The adoption of these rules did not have a significant effect on the Company’s financial statements.
PETROLERA ENTRE LOMAS S.A.
|
3.
|
MANDATORY SAVINGS RECEIVABLE
|
The Mandatory Savings Law, enacted in 1988, required all taxpayers to pay a five-year refundable mandatory savings deposit.
After a lengthy process before the courts, the Company paid a 6.7 million mandatory savings deposit in twelve installments during the period July 2000 to June 2001. The deposit is denominated in Argentine pesos and its principal should have been refunded 5 years after the last installment was paid, plus interest based on Banco de la Nación Argentina (Argentine National Bank) savings rate.
The devaluation of the Argentine peso has resulted in a substantial loss in the dollar value of this Argentine peso denominated deposit during 2001 and 2002. As of December 31, 2009, the dollar value of the Company’s deposit is 2.0 million. On June 27, 2006 the Company filed a request for reimbursement and, due to the lack of response from administrative authorities presented a judicial claim pursuing the collection of the total amount paid, plus a market interest rate until its effective collection.
As of the date of issuance of these financial statements, the claim is being processed. According to the Company’s Management and its legal counsel, the Company has solid grounds on which to base its position. The deposit is presented in the balance sheet within other current receivables.
|
4.
|
INCOME TAX
|
The Company accounts for income taxes under the liability method in accordance with ASC 740 “Accounting for Income Taxes”.
Under this method, deferred tax assets and liabilities are established for temporary differences between the financial reporting basis and the tax basis of the Company’s assets and liabilities at each year-end.
The income tax expense is comprised of:
|
For the years ended
|
||||||||||||
|
2009
|
2008
|
2007
|
||||||||||
|
Current expense
|
(22,145 | ) | (23,506 | ) | (27,641 | ) | ||||||
|
Prior years income tax amendments
|
(210 | ) (1) | - | - | ||||||||
|
Deferred income tax profit
|
87 | 300 | 334 | |||||||||
| (22,268 | ) | (23,206 | ) | (27,307 | ) | |||||||
|
|
(1)
|
Amendments to income tax returns for the periods comprised between 2004 and 2008. On August 28, 2009, the Company made use of a tax amnesty implemented by AFIP (Argentine Federal Public Revenue Agency) for the years 2004 through 2007.
|
Reconciliation of the tax provision to taxes calculated based on the statutory tax rates is as follows:
|
For the years ended
|
||||||||||||
|
2009
|
2008
|
2007
|
||||||||||
|
Pre-tax income
|
56,554 | 63,138 | 72,330 | |||||||||
|
Statutory tax rate
|
35 | % | 35 | % | 35 | % | ||||||
| 19,794 | 22,098 | 25,316 | ||||||||||
|
US dollar remeasurement effect
|
2,884 | 1,012 | 1,616 | |||||||||
|
Tax adjustments and other
|
(410 | ) | 96 | 375 | ||||||||
|
Income tax provision
|
22,268 | 23,206 | 27,307 | |||||||||
PETROLERA ENTRE LOMAS S.A.
The deferred tax assets and liabilities at December 31, 2009 and 2008 are as follows:
|
2009
|
2008
|
|||||||
|
Defined Benefit Pension Plan
|
952 | 951 | ||||||
|
Other liabilities
|
207 | 169 | ||||||
|
Other, net
|
49 | 45 | ||||||
|
Total deferred tax assets
|
1,208 | 1,165 | ||||||
|
Deferred tax liabilities – Property and equipment
|
(679 | ) | (643 | ) | ||||
|
Deferred income tax asset, net
|
529 | 522 | ||||||
Uncertain tax positions
No uncertain tax position as defined in ASC 740- 10- 25- 5 (formerly FIN 48) was identified. The Company does not have unrecognized tax benefits that require disclosure in its financial statements accordingly to that rule. The Company tax years 2004 to 2009 remain subject to examination by the Argentine Tax authority.
|
5.
|
PROPERTY AND EQUIPMENT
|
The capitalized cost of property and equipment and the related accumulated depreciation as of December 31, 2009 and 2008 were as follows:
|
December 31,
|
||||||||
|
2009
|
2008
|
|||||||
|
Wells and other oil and gas field equipment
|
426,659 | 366,332 | ||||||
|
Acquisition costs of proved properties
|
31,687 | 22,594 | ||||||
|
Other property and equipment
|
14,660 | 25,164 | ||||||
| 473,006 | 414,090 | |||||||
|
Less accumulated depreciation
|
(266,008 | ) | (221,879 | ) | ||||
|
Total
|
206,998 | 192,211 | ||||||
|
6.
|
RELATED PARTY TRANSACTIONS
|
As of December 31, 2009 and 2008, the balances from related parties transactions were as follows:
|
As of December 31,
|
||||||||
|
2009
|
2008
|
|||||||
|
Accounts receivable
|
||||||||
|
Petrobras Energía S.A.
|
14,063 | 5,685 | ||||||
| 14,063 | 5,685 | |||||||
|
Other receivable
|
||||||||
|
APCO Oil & Gas International Inc.- Argentine Branch
|
66 | 207 | ||||||
|
Petrobras Energía S.A.
|
160 | 35 | ||||||
| 226 | 242 | |||||||
|
Accounts payable
|
||||||||
|
Petrobras Energía S.A.
|
180 | 335 | ||||||
|
Oleoductos del Valle S.A. (1)
|
197 | 181 | ||||||
| 377 | 516 | |||||||
|
|
(1)
|
Affiliate of Petrobras Energía S.A.
|
PETROLERA ENTRE LOMAS S.A.
For the years ended December 31, 2009, 2008 and 2007, revenues and expenses derived from related parties transactions were as follows:
|
2009
|
2008
|
2007
|
||||||||||
|
Revenues from hydrocarbons sold
|
||||||||||||
|
Petrobras Energía S.A.
|
97,153 | 152,826 | 144,571 | |||||||||
| 97,153 | 152,826 | 144,571 | ||||||||||
|
2009
|
2008
|
2007
|
||||||||||
|
Other income / (expense)
|
||||||||||||
|
Petrobras Energía S.A.
|
- | 183 | - | |||||||||
|
APCO Oil & Gas International Inc. - Argentine Branch. (1)
|
- | - | 1,097 | |||||||||
| - | 183 | 1,097 | ||||||||||
|
|
(1)
|
The Entre Lomas Joint Venture sold fixed assets to Apco Oil & Gas International Inc. Argentine Branch for 1,097 at the Company’s participation interest.
|
|
2009
|
2008
|
2007
|
||||||||||
|
Expenses
|
||||||||||||
|
Petrobras Energía S.A.
|
570 | 620 | 696 | |||||||||
|
Oleoductos del Valle S.A. (1)
|
2,252 | 2,085 | 1,935 | |||||||||
| 2,822 | 2,705 | 2,631 | ||||||||||
|
|
(1)
|
Affiliate of Petrobras Energía S.A.
|
In 2007, the Company acquired from Petrobras Energía S.A. a 73.15 percent participation interest of “Amarga Chica - Bajada del Palo U.T.E.” joint venture for 23.3 million.
Director’s Compensation totaled 707, 483 and 483 for the years ended December 31, 2009, 2008 and 2007, respectively.
|
7.
|
MAJOR CUSTOMERS AND CONCENTRATION OF CREDIT RISK
|
Major Customers
Sales to customers greater than ten percent of total operating revenues consist of the following:
|
% for the Years Ended December 31,
|
||||||||||||
|
2009
|
2008
|
2007
|
||||||||||
|
Petrobras Energía S.A.
|
53.8 | 84.9 | 92.7 | |||||||||
|
Esso Petrolera Argentina S.A.
|
30.8 | 6.6 | - | |||||||||
The balances with Petrobras Energía S.A. and Esso Petrolera Argentina S.A. are 14,063 and 5,925 as of December 31, 2009 and 5,685 and 14,222 as of December 31, 2008.
PETROLERA ENTRE LOMAS S.A.
Management believes that the credit risk imposed by this concentration is offset by the creditworthiness of the Company’s customers and that upon expiration, the oil sales contracts of the main customers will be extended or replaced.
|
8.
|
DEFINED BENEFIT PENSION PLAN
|
The Company sponsors a defined benefit pension plan which covers all Company employees in payroll as of May 31, 1995. The objective of the plan is to supplement the national social security pension benefits of the employees of the Company. The plan requires from the Company a contribution to a fund, while no contribution is required from employees. The Company invests in high liquidity, low risk investments with minimal or no risk of loss of capital.
The fund's assets have been contributed to a trust and are mainly invested in money market-mutual funds and Treasury federal funds sat December 31, 2009. The Bank of New York is the trustee and Towers Watson is the servicing agent.
|
2009
|
2008
|
|||||||
|
Projected benefit obligation
|
7,551 | 7,230 | ||||||
|
Accumulated benefit obligation
|
7,524 | 7,206 | ||||||
|
Fair value of plan assets at year end
|
4,531 | 4,235 | ||||||
|
Funded status of the plan (underfunded)
|
(3,020 | ) | (2,995 | ) | ||||
|
Amounts recognized in the statement of financial position consist of:
|
||||||||
|
Accrued benefit cost
|
(3,020 | ) | (2,995 | ) | ||||
|
Accumulated other comprehensive income
|
2,957 | 2,731 | ||||||
|
Net amount recognized
|
(63 | ) | (264 | ) | ||||
|
2009
|
2008
|
|||||||
|
Projected benefit obligation at beginning of the year
|
7,230 | 6,569 | ||||||
|
Service cost
|
147 | 137 | ||||||
|
Interest cost
|
268 | 936 | ||||||
|
Net actuarial (gain)/loss due to plan experience
|
209 | 37 | ||||||
|
Benefit payment from fund
|
(303 | ) | (449 | ) | ||||
|
Projected benefit obligation at year end
|
7,551 | 7,230 | ||||||
|
Fair value of plan assets at beginning of the year
|
4,235 | 3,764 | ||||||
|
Company contributions
|
614 | 615 | ||||||
|
Benefit payments from fund
|
(303 | ) | (449 | ) | ||||
|
Actual return on assets
|
(15 | ) | 305 | |||||
|
Fair value of plan assets
|
4,531 | 4,235 | ||||||
PETROLERA ENTRE LOMAS S.A.
|
2009
|
2008
|
2007
|
||||||||||
|
Component of net periodic benefit cost:
|
||||||||||||
|
Service cost
|
147 | 137 | 96 | |||||||||
|
Interest cost
|
268 | 936 | 675 | |||||||||
|
Expected return on assets
|
(171 | ) | (552 | ) | (300 | ) | ||||||
|
Amortization of net prior service cost
|
15 | 16 | 16 | |||||||||
|
Amortization of net losses / (gains)
|
154 | 119 | (117 | ) | ||||||||
|
Net periodic benefit cost
|
413 | 656 | 370 | |||||||||
|
Pension liability adjustment included in other comprehensive income
|
227 | 148 | (282 | ) | ||||||||
The prior service cost and actuarial loss included in accumulated other comprehensive income and expected to be recognized in net periodic pension cost during 2010 is 15 and 67, respectively.
|
Asset Categories
|
||||||||
|
Money market - mutual funds
|
65 | % | 66 | % | ||||
|
Treasury federal funds
|
34 | % | 34 | % | ||||
|
Others
|
1 | % | - | |||||
|
Total
|
100 | % | 100 | % | ||||
The fair value of the plan assets was measured using quoted prices in active markets.
|
2009
|
2008
|
|||||||
|
Assumptions used to determine the benefit obligation and the net benefit cost:
|
||||||||
|
Discount rate
|
4 | % | 4 | % | ||||
|
Expected long-term rates of return on plan assets
|
4 | % | 4 | % | ||||
|
Rate of compensation increase
|
||||||||
|
up to 35 years of age
|
5 | % | 5 | % | ||||
|
from 36 up to 49 years of age
|
1.5 | % | 1.5 | % | ||||
The expected long-term rate of return is based on historical performance of the money market-mutual funds.
Contributions
The Company expects to contribute 614 to its pension plan in 2010.
Estimated Future Benefit Payment
The following benefit payments are expected to be paid.
|
Year
|
Benefit
|
|||
|
2010
|
430 | |||
|
2011
|
468 | |||
|
2012
|
471 | |||
|
2013
|
526 | |||
|
2014
|
711 | |||
|
2015-2019
|
3,971 | |||
The Company uses a December 31 measurement date for its plan.
PETROLERA ENTRE LOMAS S.A.
|
9.
|
DEFINED CONTRIBUTION PENSION PLAN
|
On June 10, 2009, the Board of Directors of Petrolera Entre Lomas S.A. approved the implementation of a defined voluntary contributions plan for all of the Company’s employees meeting certain requirements. By means of this plan, PELSA makes contributions to a trust in an amount equivalent to the contributions required by law and made by the employees included in the plan, in conformity with a contribution scheme defined for each salary level. The employees adhering to such plan may make voluntary contributions exceeding those established in the contribution scheme, which are not considered for the purposes of the contributions to be made by the Company.
|
10.
|
TAXES PAYABLE AND PAYROLL ACCOUNT AND OTHER LIABILITIES
|
At December 31, 2009 and 2008, taxes payable and payroll account consisted of the following:
|
2009
|
2008
|
|||||||
|
Income tax accrual
|
5,629 | 4,838 | ||||||
|
Provincial production taxes
|
2,163 | 2,448 | ||||||
|
Payroll
|
1,455 | 1,096 | ||||||
|
Other
|
601 | 563 | ||||||
| 9,848 | 8,945 | |||||||
At December 31, 2009 and 2008, current other liabilities consisted of the following:
|
2009
|
2008
|
|||||||
|
Dividends
|
6,000 | - | ||||||
|
Liability assumed for concession’s extension
|
5,624 | - | ||||||
|
Asset retirement liability
|
116 | 89 | ||||||
|
Others
|
442 | 460 | ||||||
| 12,182 | 549 | |||||||
At December 31, 2009 and 2008, non-current other liabilities consisted of the following:
|
2009
|
2008
|
|||||||
|
Liability for pension benefit (Note 8)
|
3,020 | 2,995 | ||||||
|
Asset retirement liability
|
5,508 | 3,312 | ||||||
|
Others
|
154 | - | ||||||
| 8,682 | 6,307 | |||||||
PETROLERA ENTRE LOMAS S.A.
|
11.
|
COMPREHENSIVE INCOME
|
Comprehensive income is as follows:
|
For the years ended December 31,
|
|||||||||||||
|
2009
|
2008
|
2007
|
|||||||||||
|
Net income
|
34,286 | 39,932 | 45,023 | ||||||||||
|
Other comprehensive loss:
|
|||||||||||||
| - |
Pension liability adjustment
|
(227 | ) | (148 | ) | 282 | |||||||
| - |
Income tax benefit on other comprehensive loss
|
80 | 51 | (98 | ) | ||||||||
|
Other comprehensive loss
|
(147 | ) | (97 | ) | 184 | ||||||||
|
Comprehensive income
|
34,139 | 39,835 | 45,207 | ||||||||||
|
12.
|
RESTRICTIONS ON RETAINED EARNINGS
|
Dividends distributed in cash or kind, in excess of taxable income accumulated as of the end of the fiscal year immediately preceding the distribution or payment date, shall be subject to a 35% income tax withholding as single and definitive payment. For the purposes of this tax, accumulated taxable income is defined as net income booked under Argentine GAAP as of the fiscal year-end immediately preceding the effective date of the law plus the taxable income determined as from such year.
|
13.
|
DEBT
|
On August 15, 2007, the Company arranged a debt agreement with Banco do Brasil S.A., London branch, for a 50 million bank line of credit that bears interest at Libor plus 1.20 percent per annum agreed on a quarterly basis. Such financing is to be used to invest in P&E and exploratory expenses.
Total amount was received by the Company in four disbursements between August 2007 and March 2008.
On May 15, 2009, an amendment to the initial agreement was made, whereby the unpaid principal as of such date, amounting to 48.4 million, shall be paid in 15 quarterly installments starting as from February 16, 2010. Disbursements cannot be repaid in advance before an average life of two years in accordance with local regulations.
Debt accrues interest at an annual rate of Libor plus 2.40%, and interests are payable on a quarterly basis along with the related income tax withholding. As of December 31, 2009, interest and taxes accrued for this debt amount to 1.6 million.
The maturity of debt principal as of year end for the next years is as follows:
| 2010 | 12,907 | |||
|
2011
|
12,907 | |||
|
2012
|
12,907 | |||
|
2013
|
9,679 |
PETROLERA ENTRE LOMAS S.A.
|
14.
|
CONTINGENCIES
|
Certain conditions may exist as of the date of financial statements which may result in a loss to the Company, but which will only be resolved when one or more future events occur or fail to occur. Such contingent liabilities are assessed by the Company’s management based on the opinion of the Company's legal counsel and the available evidence.
Such contingencies include outstanding lawsuits or claims for possible damages to third parties in the ordinary course of the Company´s business, as well as third party claims arising from disputes concerning the interpretation of legislation.
If the assessment of a contingency indicates that it is probable that a loss has been incurred and the amount can be estimated, a liability is accrued. If the assessment indicates that a potential loss contingency is not probable, but is reasonably possible, or is probable but it cannot be estimated, then the nature of the contingent liability, together with an estimate of the possibility of occurrence, is disclosed in a note to the financial statements. Loss contingencies considered remote are not disclosed unless they involve guarantees, in which case the nature of the guarantee is disclosed.
As of December 31, 2009 no contingent liabilities have been accrued.
|
15.
|
SUBSEQUENT EVENTS
|
Subsequent events have been evaluated through February, 26, which is the date these Financial Statements were available to be issued.
- 17 -