Attached files
| file | filename |
|---|---|
| EX-32.1 - EX-32.1 - PEOPLES FINANCIAL CORP /MS/ | d71305exv32w1.htm |
| EX-32.2 - EX-32.2 - PEOPLES FINANCIAL CORP /MS/ | d71305exv32w2.htm |
| EX-13.1 - EX-13.1 - PEOPLES FINANCIAL CORP /MS/ | d71305exv13w1.htm |
| EX-23.1 - EX-23.1 - PEOPLES FINANCIAL CORP /MS/ | d71305exv23w1.htm |
| EX-31.1 - EX-31.1 - PEOPLES FINANCIAL CORP /MS/ | d71305exv31w1.htm |
| EX-13.2 - EX-13.2 - PEOPLES FINANCIAL CORP /MS/ | d71305exv13w2.htm |
| EX-31.2 - EX-31.2 - PEOPLES FINANCIAL CORP /MS/ | d71305exv31w2.htm |
Table of Contents
SECURITIES AND EXCHANGE COMMISSION
WASHINGTON, D.C. 20549
FORM 10-K
| þ | ANNUAL REPORT PURSUANT TO SECTION 13 OR 15 (d) OF THE SECURITIES EXCHANGE ACT OF 1934 |
OR
| o | TRANSITION REPORT PURSUANT TO SECTION 13 OR 15 (d) OF THE SECURITIES EXCHANGE ACT OF 1934 |
For the fiscal year ended December 31, 2009
Commission File Number 001-12103
PEOPLES FINANCIAL CORPORATION
(Exact name of registrant as specified in its charter)
| Mississippi | 64-0709834 | |
| (State or other jurisdiction of incorporation or organization) |
(I.R.S. Employer Identification number) |
| Lameuse and Howard Avenues, Biloxi, Mississippi | 39533 | |
| (Address of principal executive offices) | (Zip code) |
228-435-5511
(Registrant’s telephone number, including area code)
Securities registered pursuant to Section 12 (b) of the Act:
| Title of Each Class |
Name of Each Exchange on Which Registered |
|
| None | None |
Securities registered pursuant to Section 12 (g) of the Act:
Common, $1.00 Par Value
(Title of each class)
Indicate by check mark if the registrant is a well-known seasoned issuer, as defined in Rule 405 of
the Securities Act. YES o NO þ
Indicate by check mark if the registrant is not required to file reports pursuant to Section 13 or
Section 15(d) of the Act. YES o NO þ
Note — Checking the box above will not relieve any registrant required to file reports pursuant to
Section 13 or 15(d) of the Exchange Act from their obligations under those Sections.
Indicate by check mark whether the registrant (1) has filed all reports required to be filed by
Section 13 or 15 (d) of the Securities Exchange Act of 1934 during the preceding 12 months (or for
such shorter period that the registrant was required to file such reports), and (2) has been
subject to such filing requirements for the past 90 days. YES þ NO o
Indicate by check mark if disclosure of delinquent filers pursuant to item 405 of Regulation S-K
is not contained herein, and will not be contained, to the best of the Registrant’s knowledge in
definitive proxy or information statements incorporated by reference in Part III of this Form 10-K
or any amendment to the Form 10-K. þ
Indicate by check mark whether the registrant has submitted electronically and posted on its
corporate Web site, if any, every Interactive Data File required to be submitted and posted
pursuant to Rule 405 of Regulation S-T during the preceding 12 months (or for such shorter period
that the registrant was required to submit and post such files.) Yes o No o
Indicate by check mark whether the registrant is a large accelerated filer, an accelerated filer,
non-accelerated filer or a smaller reporting company. See the definitions of “large accelerated
filer,” “accelerated filer” and “smaller reporting company” in Rule 12b-2 of the Exchange Act.
(Check one):
| Large accelerated filer o | Accelerated filer þ | Non-Accelerated filer o (Do not check if a smaller reporting company) | Smaller reporting company o |
Indicate by check mark whether the registrant is a shell company (as defined in Rule 12b-2 of the
Exchange Act). YES o NO þ
At June 30, 2009, the aggregate market value of the registrant’s voting stock held by
non-affiliates was approximately $78,306,000.
On February 26, 2010, the registrant had outstanding 5,151,697 shares of common stock, par value of
$1.00 per share.
DOCUMENTS INCORPORATED BY REFERENCE
Portions of the Registrant’s Annual Report to Shareholders for the year ended December 31, 2009 are
incorporated by reference into Parts I, II and III of this report. Except for those portions of
the Registrant’s Annual Report to Shareholders expressly incorporated herein by reference, the
Annual Report is not deemed filed with the Securities and Exchange Commission. Portions of the
Registrant’s Definitive Proxy Statement issued in connection with the Annual Meeting of
Shareholders to be held April 14, 2010, are incorporated by reference into Part III of this report.
CONTENTS
| Page | ||||||||
| 1 | ||||||||
| 26 | ||||||||
| 30 | ||||||||
| 30 | ||||||||
| 31 | ||||||||
| 31 | ||||||||
| 31 | ||||||||
| 32 | ||||||||
| 32 | ||||||||
| 33 | ||||||||
| 33 | ||||||||
| 33 | ||||||||
| 33 | ||||||||
| 34 | ||||||||
| 34 | ||||||||
| 35 | ||||||||
| 35 | ||||||||
| 35 | ||||||||
| 35 | ||||||||
| 35 | ||||||||
| EX-13.1 | ||||||||
| EX-13.2 | ||||||||
| EX-23.1 | ||||||||
| EX-31.1 | ||||||||
| EX-31.2 | ||||||||
| EX-32.1 | ||||||||
| EX-32.2 | ||||||||
Table of Contents
PART I
| ITEM 1 | - DESCRIPTION OF BUSINESS |
BACKGROUND AND CURRENT OPERATIONS
General
Peoples Financial Corporation (the “Company”) was organized as a one bank holding company in 1984.
The Company is headquartered in Biloxi, Mississippi. At December 31, 2009, the Company operates in
the state of Mississippi through its wholly-owned subsidiary, The Peoples Bank, Biloxi, Mississippi
(the “Bank”). The Company is engaged, through this subsidiary, in the banking business. The Bank
is the Company’s principal asset and primary source of revenue.
The Main Office, operations center and asset management and trust services of the Bank are located
in downtown Biloxi, MS. At December 31, 2009, the Bank also had 15 branches located throughout
Harrison, Hancock, Jackson and Stone Counties. The Bank has automated teller machines (“ATM”) at
its Main Office, all branch locations and at numerous non-proprietary locations.
The Bank Subsidiary
The Company’s wholly-owned bank subsidiary is The Peoples Bank, which was originally chartered in
1896 in Biloxi, Mississippi. The Bank is a state chartered bank whose deposits are insured under
the Federal Deposit Insurance Act. The Bank is not a member of the Federal Reserve System. The
legal name of the Bank was changed to The Peoples Bank, Biloxi, Mississippi, during 1991.
Most of the Bank’s business originates from the trade area of Harrison, Hancock, Stone and Jackson
Counties in Mississippi; however, some business is obtained from other counties in southern
Mississippi.
Nonbank Subsidiary
In 1985, PFC Service Corp. (“PFC”) was chartered and began operations as the second wholly-owned
subsidiary of Peoples Financial Corporation. The purpose of PFC was principally the leasing of
automobiles and equipment. PFC is inactive at this time.
Products And Services
The Bank currently offers a variety of services to individuals and small to middle market
businesses within its trade area.
The Bank’s primary lending focus is to offer business, commercial, real estate,
construction, personal and installment loans, with an emphasis on commercial lending. The Bank’s
exposure for out of area, land, development, construction and commercial real estate loans as well
as concentrations in the hotel/motel and gaming industries are monitored by the Company. Each loan
officer has board approved lending limits on the principal amount of secured and unsecured loans
that can be approved for a single borrower without prior approval of the loan committee. All
loans, however, must meet the credit underwriting standards and loan policies of the Bank.
1
Table of Contents
Deposit services include interest bearing and non-interest bearing checking accounts, savings
accounts, certificates of deposit, and IRA accounts. The Bank also offers a non-deposit funds
management account, which is not insured by the Federal Deposit Insurance Corporation (“FDIC”).
The Bank generally provides depository accounts to individuals and small and middle market
businesses in its trade area at interest rates consistent with market conditions.
The Bank’s Asset Management and Trust Services Department offers personal trust, agencies and
estate services, including living and testamentary trusts, executorships, guardianships, and
conservatorships. Benefit accounts maintained by the Department primarily include self-directed
individual retirement accounts. Escrow management, stock transfer and bond paying agency accounts
are available to corporate customers.
The Bank also offers a variety of other services including safe deposit box rental, wire transfer
services, night drop facilities, collection services, cash management and Internet banking. The
Bank has 47 ATMs at its branch locations and other off-site, non-proprietary locations, providing
bank customers access to their depository accounts. The Bank is a member of the PULSE network.
There has been no significant change in the kind of services offered by the Bank during the last
three fiscal years.
Customers
The Bank has a large number of customers acquired over a period of many years and is not dependent
upon a single customer or upon a few customers. The Bank also provides services to customers
representing a wide variety of industries including seafood, retail, hospitality, hotel/motel,
gaming and construction. While the Company has pursued external growth strategies on a limited
basis, its primary focus has been on internal growth by the Bank through the establishment of new
branch locations and an emphasis on strong customer relationships.
Employees
At December 31, 2009, the Bank employed 189 full-time employees and 15 part-time employees.
The Company has no employees who are not employees of the bank subsidiary. Through the Bank,
employees receive salaries and benefits, which include 401(k), ESOP, cafeteria plan, life, health
and disability insurance. The Company considers its relationship with its employees to be good.
Competition
The Bank is in direct competition with numerous local and regional commercial banks as well
as other non-bank institutions. Interest rates paid and charged on deposits and loans are the
primary competitive factors within the Bank’s trade area. The Bank also competes for deposits
and loans with insurance companies, finance companies, brokerage houses and credit unions.
The principal competitive factors in the markets for deposits and loans are interest rates paid and
charged. The
2
Table of Contents
Company also competes through efficiency, quality of customer service, the range of
services and products it provides, the convenience of its branch and ATM locations and the
accessibility of its staff. The Bank intends to continue its strategy of being a local, community
bank offering traditional bank services and providing quality service in its local trade area.
Miscellaneous
The Bank holds no patents, licenses (other than licenses required to be obtained from appropriate
bank regulatory agencies), franchises or concessions.
The Bank has not engaged in any research activities relating to the development of new services or
the improvement of existing services except in the normal course of its business activities. The
Bank presently has no plans for any new line of business requiring the investment of a material
amount of total assets.
Available Information
The Company maintains an internet website at www.thepeoples.com. The Company’s Annual
Report to Shareholders is available on the Company’s website. Also available through the website
is a link to the Company’s filings with the Securities and Exchange Commission (“SEC”).
Information on the Company’s website is not incorporated into this Form 10-K or the Company’s other
securities filings and is not part of them.
REGULATION AND SUPERVISION
Bank Holding Company
The Company is required to file certain reports with, and otherwise comply with the rules and
regulations of, the SEC under federal securities laws. The common stock of the Company is listed
on the NASDAQ capital market exchange, such listing subjecting the Company to compliance with the
exchange’s requirements with respect to reporting and other rules and regulations.
The Company is a registered one bank holding company under the Bank Holding Company Act of 1956, as
amended, and is subject to extensive regulation by the Board of Governors of the Federal Reserve
System. As such, the Company is required to file periodic reports and additional information
required by the Federal Reserve. The Federal Reserve Board may also make examinations of the
Company and its subsidiaries.
The Bank Holding Company Act requires every bank holding company to obtain the prior
approval of the Federal Reserve Board 1) before it may acquire substantially all the assets of any
bank or ownership or control of any voting shares of any bank if, after the acquisition, it would
own or control, directly or indirectly, more than 5 percent of the voting shares of the bank, 2)
before it or any of its subsidiaries other than a bank may acquire all of the assets of a bank, 3)
before it may merge with any other bank holding company or 4) before it may engage in permissible
non-banking activities.
3
Table of Contents
A bank holding company is generally prohibited from engaging in, or acquiring direct or indirect
control of, voting shares of any company engaged in non-banking activities. One of the principal
exceptions to this prohibition is for activities found by the Federal Reserve to be so closely
related to banking or the managing or controlling of banks as to be a proper incident thereto.
Some of the activities the Federal Reserve Board has determined by regulation to be closely related
to banking are the making and servicing of loans; performing certain bookkeeping or data processing
services; acting as fiduciary or investment or financial advisor; making equity or debt investments
in corporations or projects designed primarily to promote community welfare; and leasing
transactions if the functional equivalent of an extension of credit and mortgage banking or
brokerage. The Bank Holding Company Act does not place territorial limitations on permissible
bank-related activities of bank holding companies. Despite prior approval, however, the Federal
Reserve has the power to order a holding company or its subsidiaries to terminate any activity or
its control of any subsidiary when it has reasonable cause to believe that continuation of such
activity or control of such subsidiary constitutes a serious risk to the financial safety,
soundness or stability of any bank subsidiary of that holding company.
A bank holding company and its subsidiaries are also prohibited from acquiring any voting shares of
or interest in, any banks located outside the state in which the operations of the bank holding
company’s subsidiaries are located, unless the acquisition is specially authorized by the statute
of the state in which the target is located. Mississippi has enacted legislation which authorizes
interstate acquisitions of banking organizations by bank holding companies outside of Mississippi,
and also interstate branching transactions, subject to certain conditions and restrictions.
The Gramm-Leach-Bliley Act of 1999 (the “Financial Services Modernization Act”) allows bank holding
companies to engage in a wider range of financial activities. In order to engage in such
activities, which, among others, include underwriting and selling insurance; providing financial,
investment or economic advisory services; and underwriting, dealing in or making a market in
securities, a bank holding company must elect to become a financial holding company. The Financial
Services Modernization Act also authorized the establishment of financial subsidiaries in order to
engage in such financial activities, with certain limitations.
The Financial Services Modernization Act also contains a number of other provisions affecting the
Company’s operations. One of the most important provisions relates to the issue of privacy as
federal banking regulators were authorized to adopt rules designed to protect the financial privacy
of consumers. These rules implemented notice requirements and restrictions on a financial
institution’s ability to disclose nonpublic personal information about consumers to non-affiliated
third parties.
As of the date of this Form 10-K, the Company has not taken any action to adopt either the
financial holding company or the financial subsidiary structures that were authorized by the
Financial Services Modernization Act.
4
Table of Contents
The Federal Reserve has adopted capital adequacy guidelines for use in its examination and
regulation of bank holding companies. The regulatory capital of a bank holding company under
applicable federal capital adequacy guidelines is particularly important in the Federal Reserve’s
evaluation of a holding company and any applications by the bank holding company to the Federal
Reserve. A financial institution’s failure to meet minimum regulatory capital standards can lead
to other penalties, including termination of deposit insurance or appointment of a conservator or
receiver for the financial institution. Risk-based capital ratios are the primary measure of
regulatory capital presently applicable to bank holding companies. Risk-based capital guidelines
are designed to make regulatory capital requirements more sensitive to differences in risk profiles
among banks and bank holding companies, to account for off-balance sheet exposure and to minimize
disincentives for holding liquid assets.
The Federal Reserve rates bank holding companies by a component and composite 1 — 5 rating system.
This system is designed to help identify institutions which require special attention. Financial
institutions are assigned ratings in the areas of capital adequacy, asset quality, management
capability, the quality and level of earnings, the adequacy of liquidity and sensitivity to
interest rate fluctuations based on the evaluation of the financial condition and operations.
The Company is a legal entity separate and distinct from the Bank. There are various restrictions
that limit the ability of the Bank to finance, pay dividends or otherwise supply funds to the
Company. In addition, the Bank is subject to certain restrictions on any extension of credit to
the bank holding company or any of its subsidiaries, on investments in the stock or other
securities thereof and on the taking of such stock or securities as collateral for loans to any
borrower. Further, a bank holding company and its subsidiaries are prohibited from engaging in
certain tie-in arrangements in connection with extensions of credit, leases or sale of property or
furnishing of services.
Bank Subsidiary
The Bank is subject to the regulation of and examination by the Mississippi Department of Banking
and Consumer Finance (“Department of Banking”) and the FDIC. Areas subject to regulation include
required reserves, investments, loans, mergers, branching, issuance of securities, payment of
dividends, capital adequacy, management practices and other areas of banking operations. These
regulatory authorities examine such areas as loan and investment quality, management practices,
procedures and practices and other aspects of operations. In addition to these regular
examinations, the Bank must furnish periodic reports to its regulatory authorities containing a
full and accurate statement of affairs. The Bank is subject to deposit insurance assessments by
the FDIC and assessments by the Department of Banking to provide operating funds for that agency.
The Bank is a member of the FDIC, and its deposits are insured by law by the Bank Insurance Fund
(“BIF”). On December 19, 1991, the Federal Deposit Insurance Corporation Improvement
Act of 1991 (“FDICIA”) was enacted. The Federal Deposit Insurance Act, as amended by Section 302
of FDICIA, calls for risk-related deposit insurance assessment rates. This risk classification of
an institution will determine its deposit insurance premium. Assignment to one of the three
capital groups, coupled with assignment to one of three supervisory sub-groups, determines which of
the nine risk classifications is appropriate for an institution.
In general, FDICIA subjects bank and bank holding companies to significantly increased regulation
and supervision. FDICIA increased the borrowing authority of the FDIC in order to recapitalize the
5
Table of Contents
BIF, and the future borrowings are to be repaid by increased assessments on FDIC member banks.
Other significant provisions of FDICIA require a new regulatory emphasis linking supervision to
bank capital levels. Also, federal banking regulators are required to take prompt corrective
regulatory action with respect to depository institutions that fall below specified capital levels
and to draft non-capital regulatory measures to assure bank safety.
FDICIA further requires regulators to perform annual on-site bank examinations, places limits on
real estate lending and tightens audit requirements. The new legislation eliminated the “too big
to fail” doctrine, which protects uninsured deposits of large banks, and restricts the ability of
undercapitalized banks to obtain extended loans from the Federal Reserve Board discount window.
FDICIA also imposed new disclosure requirements relating to fees charged and interest paid on
checking and deposit accounts. Most of the significant changes brought about by FDICIA required
new regulations.
In addition to regulating capital, the FDIC has broad authority to prevent the development or
continuance of unsafe or unsound banking practices. Pursuant to this authority, the FDIC has
adopted regulations that restrict preferential loans and loan amounts to “affiliates” and
“insiders” of banks, require banks to keep information on loans to major stockholders and executive
officers and bar certain director and officer interlocks between financial institutions. The FDIC
is also authorized to approve mergers, consolidations and assumption of deposit liability
transactions between insured banks and between insured banks and uninsured banks or institutions to
prevent capital or surplus diminution in such transactions where the resulting, continuing or
assumed bank is an insured nonmember state bank.
Although the Bank is not a member of the Federal Reserve System, it is subject to Federal Reserve
regulations that require the Bank to maintain reserves against transaction accounts, primarily
checking accounts. Because reserves generally must be maintained in cash or in non-interest
bearing accounts, the effect of the reserve requirement is to increase the cost of funds for the
Bank.
The earnings of commercial banks and bank holding companies are affected not only by general
economic conditions but also by the policies of various governmental regulatory authorities,
including the Federal Reserve Board. In particular, the Federal Reserve Board regulates money and
credit conditions, and interest rates, primarily through open market operations in U. S. Government
securities, varying the discount rate of member and nonmember bank borrowing, setting reserve
requirements against bank deposits and regulating interest rates payable by banks on certain
deposits. These policies influence to a varying extent the overall growth and distribution of bank
loans, investments, deposits and the interest rates charged on loans. The monetary policies of the
Federal Reserve Board have had a significant effect on the operating results of commercial banks in
the past and are expected to continue to do so in the future.
The most recent legislation to potentially impact the Bank is the Emergency Economic Stabilization
Act, which was passed in 2008. Information concerning this legislation on page 5 of the 2009
Annual Report to Shareholders in incorporated herein by reference.
Information
relating to Regulatory Matters is disclosed on page 6 of the 2009 Annual Report to Shareholders and is incorporated herein by reference.
6
Table of Contents
Summary
The foregoing is a brief summary of certain statutes, rules and regulations affecting the Company and the Bank. It is not intended to be an exhaustive discussion of all the statutes and regulations having an impact on the operations of the Company or the Bank. Additional legislation may be enacted at the federal or state level which may alter the structure, regulation and competitive relationships of financial institutions. It cannot be predicted whether and, in what form, any of these proposals will be adopted or the extent to which the business of the Company or the Bank may be affected thereby.
The foregoing is a brief summary of certain statutes, rules and regulations affecting the Company and the Bank. It is not intended to be an exhaustive discussion of all the statutes and regulations having an impact on the operations of the Company or the Bank. Additional legislation may be enacted at the federal or state level which may alter the structure, regulation and competitive relationships of financial institutions. It cannot be predicted whether and, in what form, any of these proposals will be adopted or the extent to which the business of the Company or the Bank may be affected thereby.
SUPPLEMENTAL STATISTICAL INFORMATION
Schedules I-A through VII present certain statistical information regarding the Company. This
information is not audited and should be read in conjunction with the Company’s Consolidated
Financial Statements and Notes to Consolidated Financial Statements found at pages 8 — 28 of the
2009 Annual Report to Shareholders.
Distribution of Assets, Liabilities and Shareholders’ Equity and Interest Rates and
Differentials
Net Interest Income, the difference between Interest Income and Interest Expense, is the most
significant component of the Company’s earnings. For interest analytical purposes, Management
adjusts Net Interest Income to a “taxable equivalent” basis using a 34% Federal Income Tax rate of
34% in 2009 and 2008 and 35% in 2007 on tax-exempt items (primarily interest on municipal
securities).
Another significant statistic in the analysis of Net Interest Income is the effective interest
differential, also called the net yield on earning assets. The net yield is the difference between
the rate of interest earned on earning assets and the effective rate paid for all funds,
non-interest bearing as well as interest bearing. Since a portion of the Bank’s deposits do not
bear interest, such as demand deposits, the rate paid for all funds is lower than the rate on
interest bearing liabilities alone.
Recognizing the importance of interest differential to total earnings, Management places great
emphasis on managing interest rate spreads. Although interest differential is affected by
national, regional and area economic conditions, including the level of credit demand and interest
rates, there are significant opportunities to influence interest differential through appropriate
loan and investment policies which are designed to maximize the differential while maintaining
sufficient liquidity and availability of incremental funds for purposes of meeting existing
commitments and investment in lending and investment opportunities that may arise.
The information included in Schedule I-F presents the change in interest income and interest
expense along with the reason(s) for these changes. The change attributable to volume is computed
as the change in volume times the old rate. The change attributable
to rate is computed as the change in rate times the old volume. The change in rate/volume is computed as the change in rate
times the change in volume.
7
Table of Contents
Credit Risk Management and Loan Loss Experience
In the normal course of business, the Bank assumes risks in extending credit. The Bank manages these risks through its lending policies, credit underwriting analysis, appraisal requirements, concentration and exposure limits, loan review procedures and the diversification of its loan portfolio. Although it is not possible to predict loan losses with complete accuracy, Management constantly reviews the characteristics of the loan portfolio to determine its overall risk profile and quality.
In the normal course of business, the Bank assumes risks in extending credit. The Bank manages these risks through its lending policies, credit underwriting analysis, appraisal requirements, concentration and exposure limits, loan review procedures and the diversification of its loan portfolio. Although it is not possible to predict loan losses with complete accuracy, Management constantly reviews the characteristics of the loan portfolio to determine its overall risk profile and quality.
Constant attention to the quality of the loan portfolio is achieved by the loan review process.
Throughout this ongoing process, Management is advised of the condition of individual loans and of
the quality profile of the entire loan portfolio. Any loan or portion thereof which is classified
“loss” by regulatory examiners or which is determined by Management to be uncollectible because of
such factors as the borrower’s failure to pay interest or principal, the borrower’s financial
condition, economic conditions in the borrower’s industry or the inadequacy of underlying
collateral, is charged-off.
Provisions are charged to operating expense based upon historical loss experience, and additional
amounts are provided when, in the opinion of Management, such provisions are not adequate based
upon the current factors affecting loan collectibility.
The allocation of the allowance for loan losses by loan category is based on the factors mentioned
in the preceding paragraphs. Accordingly, since all of these factors are subject to change, the
allocation is not necessarily indicative of the breakdown of future losses.
Further information concerning the provision for loan losses and the allowance for loan losses is
presented in “Management’s Discussion and Analysis” at pages 1 — 7 of the 2009 Annual Report to
Shareholders and “Note A — Business and Summary of Significant Accounting Policies” at pages 13 -
16 of the 2009 Annual Report to Shareholders and are incorporated herein by reference.
Return on Equity and Assets
The information under the captions “Five-Year Comparative Summary of Selected Financial Information” on page 31 and “Management’s Discussion and Analysis” on pages 1 — 7 of the 2009 Annual Report are incorporated herein by reference.
The information under the captions “Five-Year Comparative Summary of Selected Financial Information” on page 31 and “Management’s Discussion and Analysis” on pages 1 — 7 of the 2009 Annual Report are incorporated herein by reference.
Dividend Payout
| Years Ended December 31, | ||||||||||||
| 2009 | 2008 | 2007 | ||||||||||
Dividend payout ratio |
48 | % | 60 | % | 26 | % | ||||||
8
Table of Contents
SCHEDULE I — A
Distribution of Average Assets, Liabilities and Shareholders’ Equity (2) (In thousands)
| Years Ended December 31, | 2009 | 2008 | 2007 | |||||||||
ASSETS: |
||||||||||||
Cash and due from banks |
$ | 34,069 | $ | 42,396 | $ | 49,491 | ||||||
Available for sale securities: |
||||||||||||
Taxable securities |
307,332 | 304,536 | $ | 388,577 | ||||||||
Non-taxable securities |
34,437 | 24,394 | 18,864 | |||||||||
Other securities |
3,373 | 3,022 | 5,264 | |||||||||
Held to maturity securities: |
||||||||||||
Taxable securities |
21,443 | |||||||||||
Non-taxable securities |
3,265 | 3,691 | 4,780 | |||||||||
Other investments |
4,036 | 3,889 | 467 | |||||||||
Net loans (1) |
458,092 | 453,723 | 417,995 | |||||||||
Federal funds sold |
3,227 | 5,694 | 5,763 | |||||||||
Other assets |
57,022 | 58,240 | 50,878 | |||||||||
TOTAL ASSETS |
$ | 904,853 | $ | 899,585 | $ | 963,522 | ||||||
LIABILITIES AND SHAREHOLDERS’ EQUITY: |
||||||||||||
Non-interest bearing deposits |
$ | 101,738 | $ | 114,380 | $ | 132,719 | ||||||
Interest bearing deposits |
425,809 | 443,696 | 481,877 | |||||||||
Total deposits |
527,547 | 558,076 | 614,596 | |||||||||
Federal funds purchased and securities
sold under agreements to repurchase |
217,509 | 210,049 | 225,246 | |||||||||
Other liabilities |
54,258 | 25,851 | 22,775 | |||||||||
Total liabilities |
799,314 | 793,976 | 862,617 | |||||||||
Shareholders’ equity |
105,539 | 105,609 | 100,905 | |||||||||
TOTAL LIABILITIES AND SHAREHOLDERS’
EQUITY |
$ | 904,853 | $ | 899,585 | $ | 963,522 | ||||||
| (1) | Gross loans and discounts, net of unearned income and allowance for loan losses. | |
| (2) | All averages are computed on a daily basis. |
9
Table of Contents
SCHEDULE I — B
Average (2) Amount Outstanding for Major Categories of Interest Earning Assets
and Interest Bearing Liabilities (In thousands)
and Interest Bearing Liabilities (In thousands)
| Years Ended December 31, | 2009 | 2008 | 2007 | |||||||||
INTEREST EARNING ASSETS: |
||||||||||||
Loans (1) |
$ | 467,992 | $ | 463,505 | $ | 428,447 | ||||||
Federal funds sold |
3,227 | 5,694 | 5,763 | |||||||||
Available for sale securities: |
||||||||||||
Taxable securities |
307,332 | 304,536 | $ | 388,577 | ||||||||
Non-taxable securities |
34,437 | 24,394 | 18,864 | |||||||||
Other securities |
3,373 | 3,022 | 5,264 | |||||||||
Held to maturity securities: |
||||||||||||
Taxable securities |
21,443 | |||||||||||
Non-taxable securities |
3,265 | 3,691 | 4,780 | |||||||||
TOTAL INTEREST EARNING ASSETS |
$ | 819,626 | $ | 804,842 | $ | 873,138 | ||||||
INTEREST BEARING LIABILITIES: |
||||||||||||
Savings and negotiable interest bearing
deposits |
$ | 232,916 | $ | 251,792 | $ | 268,710 | ||||||
Time deposits |
192,893 | 191,904 | 213,167 | |||||||||
Federal funds purchased and securities
sold under agreements to repurchase |
217,509 | 210,049 | 225,246 | |||||||||
Other borrowed funds |
38,708 | 10,993 | 8,794 | |||||||||
TOTAL INTEREST BEARING LIABILITIES |
$ | 682,026 | $ | 664,738 | $ | 715,917 | ||||||
| (1) | Net of unearned income. Includes nonaccrual loans. | |
| (2) | All averages are computed on a daily basis. |
10
Table of Contents
SCHEDULE I — C
Interest Earned or Paid on the Major Categories of Interest Earning Assets
and Interest Bearing Liabilities (In thousands)
and Interest Bearing Liabilities (In thousands)
| Years Ended December 31, | 2009 | 2008 | 2007 | |||||||||
INTEREST EARNED ON: |
||||||||||||
Loans (2) |
$ | 20,189 | $ | 26,874 | $ | 33,642 | ||||||
Federal funds sold |
8 | 122 | 295 | |||||||||
Available for sale securities: |
||||||||||||
Taxable securities |
12,840 | 15,331 | 19,822 | |||||||||
Non-taxable securities |
1,699 | 1,433 | 1,109 | |||||||||
Other securities |
17 | 148 | 199 | |||||||||
Held to maturity securities: |
||||||||||||
Taxable securities |
1,082 | |||||||||||
Non-taxable securities |
172 | 230 | 302 | |||||||||
TOTAL INTEREST EARNED (1) |
$ | 34,925 | $ | 44,138 | $ | 56,451 | ||||||
INTEREST PAID ON: |
||||||||||||
Savings and negotiable interest bearing
deposits |
$ | 1,831 | $ | 3,856 | $ | 5,358 | ||||||
Time deposits |
3,135 | 6,094 | 9,356 | |||||||||
Federal funds purchased and securities
sold under agreements to repurchase |
1,905 | 4,521 | 10,212 | |||||||||
Other borrowed funds |
530 | 492 | 526 | |||||||||
TOTAL INTEREST PAID |
$ | 7,401 | $ | 14,963 | $ | 25,452 | ||||||
| (1) | All interest earned is reported on a taxable equivalent basis using a tax rate of 34% in 2009 and 2008 and 35% in 2007. | |
| (2) | Loan fees of $511, $786 and $854 for 2009, 2008 and 2007, respectively, are included in these figures. |
11
Table of Contents
SCHEDULE I — D
Average Interest Rate Earned or Paid for Major Categories of
Interest Earning Assets and Interest Bearing Liabilities
Interest Earning Assets and Interest Bearing Liabilities
| Years Ended December 31, | 2009 | 2008 | 2007 | |||||||||
AVERAGE RATE EARNED ON: |
||||||||||||
Loans |
4.31 | % | 5.80 | % | 7.85 | % | ||||||
Federal funds sold |
0.25 | % | 2.14 | % | 5.12 | % | ||||||
Available for sale securities: |
||||||||||||
Taxable securities |
4.18 | % | 5.03 | % | 5.10 | % | ||||||
Non-taxable securities |
4.93 | % | 5.87 | % | 5.88 | % | ||||||
Other securities |
0.50 | % | 4.90 | % | 3.78 | % | ||||||
Held to maturity securities: |
||||||||||||
Taxable securities |
5.05 | % | ||||||||||
Non-taxable securities |
5.27 | % | 6.23 | % | 6.32 | % | ||||||
TOTAL (weighted average rate) (1) |
4.26 | % | 5.48 | % | 6.46 | % | ||||||
AVERAGE RATE PAID ON: |
||||||||||||
Savings and negotiable interest bearing
deposits |
0.79 | % | 1.53 | % | 1.99 | % | ||||||
Time deposits |
1.63 | % | 3.18 | % | 4.39 | % | ||||||
Federal funds purchased and securities
sold under agreements to repurchase |
0.88 | % | 2.15 | % | 4.53 | % | ||||||
Other borrowed funds |
1.37 | % | 4.48 | % | 5.98 | % | ||||||
TOTAL (weighted average rate) |
1.09 | % | 2.25 | % | 3.56 | % | ||||||
| (1) | All interest earned is reported on a taxable equivalent basis using a tax rate of 34% in 2009 and 2008 and 35% in 2007. |
12
Table of Contents
SCHEDULE I — E
Net Interest Earnings and Net Yield on Interest Earning Assets
(In thousands, except percentages)
Net Interest Earnings and Net Yield on Interest Earning Assets
(In thousands, except percentages)
| Years Ended December 31, | 2009 | 2008 | 2007 | |||||||||
Total interest income (1) |
$ | 34,925 | $ | 44,138 | $ | 56,451 | ||||||
Total interest expense |
7,401 | 14,963 | 25,452 | |||||||||
Net interest earnings |
$ | 27,524 | $ | 29,175 | $ | 30,999 | ||||||
Net yield on interest earning assets |
3.36 | % | 3.62 | % | 3.55 | % | ||||||
| (1) | All interest earned is reported on a taxable equivalent basis using a tax rate of 34% in 2009 and 2008 and 35% in 2007. |
13
Table of Contents
SCHEDULE I — F
Analysis of Changes in Interest Income and Interest Expense
(In thousands)
Analysis of Changes in Interest Income and Interest Expense
(In thousands)
| Increase | Attributable to: | |||||||||||||||||||||||
| Years Ended December 31, | 2009 | 2008 | (Decrease) | Volume | Rate | Rate/Volume | ||||||||||||||||||
INTEREST INCOME: (1) |
||||||||||||||||||||||||
Loans (2) (3) |
$ | 20,189 | $ | 26,874 | $ | (6,685 | ) | $ | 260 | $ | (6,878 | ) | $ | (67 | ) | |||||||||
Federal funds sold |
8 | 122 | (114 | ) | (53 | ) | (108 | ) | 47 | |||||||||||||||
Available for sale securities |
||||||||||||||||||||||||
Taxable securities |
12,840 | 15,331 | (2,491 | ) | 141 | (2,608 | ) | (24 | ) | |||||||||||||||
Non-taxable securities |
1,699 | 1,433 | 266 | 590 | (229 | ) | (95 | ) | ||||||||||||||||
Other securities |
17 | 148 | (131 | ) | 17 | (132 | ) | (16 | ) | |||||||||||||||
Held to maturity securities: |
||||||||||||||||||||||||
Non-taxable securities |
172 | 230 | (58 | ) | (27 | ) | (36 | ) | 5 | |||||||||||||||
Total |
$ | 34,925 | $ | 44,138 | $ | (9,213 | ) | $ | 928 | $ | (9,991 | ) | $ | (150 | ) | |||||||||
INTEREST EXPENSE: |
||||||||||||||||||||||||
Savings and negotiable
interest bearing deposits |
$ | 1,831 | $ | 3,856 | $ | (2,025 | ) | $ | (289 | ) | $ | (1,877 | ) | $ | 141 | |||||||||
Time deposits |
3,135 | 6,094 | (2,959 | ) | 31 | (2,975 | ) | (15 | ) | |||||||||||||||
Federal funds purchased
and securities sold under
agreements to repurchase |
1,905 | 4,521 | (2,616 | ) | 160 | (2,681 | ) | (95 | ) | |||||||||||||||
Other borrowed funds |
530 | 492 | 38 | 1,240 | (341 | ) | (861 | ) | ||||||||||||||||
Total |
$ | 7,401 | $ | 14,963 | $ | (7,562 | ) | $ | 1,142 | $ | (7,874 | ) | $ | (830 | ) | |||||||||
| (1) | All interest earned is reported on a taxable equivalent basis using a tax rate of 34% in 2009 and 2008. | |
| (2) | Loan fees are included in these figures. | |
| (3) | Includes interest on nonaccrual loans. |
14
Table of Contents
SCHEDULE I — F (continued)
Analysis of Changes in Interest Income and Interest Expense
(In thousands)
Analysis of Changes in Interest Income and Interest Expense
(In thousands)
| Increase | Attributable to: | |||||||||||||||||||||||
| Years Ended December 31, | 2008 | 2007 | (Decrease) | Volume | Rate | Rate/Volume | ||||||||||||||||||
INTEREST INCOME: (1) |
||||||||||||||||||||||||
Loans (2) (3) |
$ | 26,874 | $ | 33,642 | $ | (6,768 | ) | $ | 2,753 | $ | (8,801 | ) | $ | (720 | ) | |||||||||
Federal funds sold |
122 | 295 | (173 | ) | (4 | ) | (172 | ) | 3 | |||||||||||||||
Available for sale securities: |
||||||||||||||||||||||||
Taxable securities |
15,331 | 19,822 | (4,491 | ) | (4,287 | ) | (260 | ) | 56 | |||||||||||||||
Non-taxable securities |
1,433 | 1,109 | 324 | 326 | (1 | ) | (1 | ) | ||||||||||||||||
Other securities |
148 | 199 | (51 | ) | (85 | ) | 59 | (25 | ) | |||||||||||||||
Held to maturity
securities: |
||||||||||||||||||||||||
Taxable securities |
1,082 | (1,082 | ) | (1,082 | ) | |||||||||||||||||||
Non-taxable securities |
230 | 302 | (72 | ) | (69 | ) | (4 | ) | 1 | |||||||||||||||
Total |
$ | 44,138 | $ | 56,451 | $ | (12,313 | ) | $ | (2,448 | ) | $ | (9,179 | ) | $ | (686 | ) | ||||||||
INTEREST EXPENSE: |
||||||||||||||||||||||||
Savings and negotiable
interest bearing deposits |
$ | 3,856 | $ | 5,358 | $ | (1,502 | ) | $ | (337 | ) | $ | (1,243 | ) | $ | 78 | |||||||||
Time deposits |
6,094 | 9,356 | (3,262 | ) | (933 | ) | (2,587 | ) | 258 | |||||||||||||||
Federal funds purchased
and securities sold under
agreements to repurchase |
4,521 | 10,212 | (5,691 | ) | (689 | ) | (5,364 | ) | 362 | |||||||||||||||
Other borrowed funds |
492 | 526 | (34 | ) | 132 | (132 | ) | (34 | ) | |||||||||||||||
Total |
$ | 14,963 | $ | 25,452 | $ | (10,489 | ) | $ | (1,827 | ) | $ | (9,326 | ) | $ | 664 | |||||||||
| (1) | All interest earned is reported on a taxable equivalent basis using a tax rate of 34% in 2008 and 35% in 2007. | |
| (2) | Loan fees are included in these figures. | |
| (3) | Includes interest on nonaccrual loans. |
15
Table of Contents
SCHEDULE II — A
Securities Portfolio
Book Value of Securities Portfolio (In thousands)
Securities Portfolio
Book Value of Securities Portfolio (In thousands)
| December 31, | 2009 | 2008 | 2007 | |||||||||
Available for sale securities: |
||||||||||||
U.S. Treasury, U.S. Government
agency and Mortgage-backed securities |
$ | 270,580 | $ | 308,886 | $ | 360,489 | ||||||
States and political subdivisions |
40,204 | 30,926 | 22,483 | |||||||||
Other securities |
650 | 650 | 3,057 | |||||||||
Total |
$ | 311,434 | $ | 340,462 | $ | 386,029 | ||||||
Held to maturity securities: |
||||||||||||
States and political subdivisions |
$ | 3,202 | $ | 3,394 | $ | 4,630 | ||||||
Total |
$ | 3,202 | $ | 3,394 | $ | 4,630 | ||||||
16
Table of Contents
SCHEDULE II — B
Maturity of Securities Portfolio at December 31, 2009
And Weighted Average Yields of Such Securities
Maturity of Securities Portfolio at December 31, 2009
And Weighted Average Yields of Such Securities
| Maturity (In thousands except percentage data) | |||||||||||||||||||||||||||||||||
| After one but | After five but | ||||||||||||||||||||||||||||||||
| Within one year | within five years | within ten years | After ten years | ||||||||||||||||||||||||||||||
| Amount | Yield | Amount | Yield | Amount | Yield | Amount | Yield | ||||||||||||||||||||||||||
Available for sale
securities: |
|||||||||||||||||||||||||||||||||
U.S. Treasury, U.S.
Government agency
and Mortgage-
backed securities |
$ | 17,220 | 3.16 | % | $ | 63,126 | 3.43 | % | $ | 47,875 | 3.98 | % | $ | 142,359 | 5.12 | % | |||||||||||||||||
States and political
subdivisions |
2,137 | 3.42 | % | 6,842 | 3.83 | % | 14,608 | 3.99 | % | 16,617 | 3.90 | % | |||||||||||||||||||||
Other |
650 | 1.38 | % | ||||||||||||||||||||||||||||||
Totals |
$ | 19,357 | 3.19 | % | $ | 69,968 | 3.47 | % | $ | 62,483 | 3.98 | % | $ | 159,626 | 5.02 | % | |||||||||||||||||
Held to maturity
securities: |
|||||||||||||||||||||||||||||||||
States and political
subdivisions |
$ | 305 | 4.50 | % | $ | 1,901 | 4.01 | % | $ | 996 | 4.59 | % | $ | ||||||||||||||||||||
Totals |
$ | 305 | 4.50 | % | $ | 1,901 | 4.01 | % | $ | 996 | 4.59 | % | $ | ||||||||||||||||||||
Note: The weighted average yields are calculated on the basis of cost. Average yields on investments in states and
policital subdivisions are based on their contractual yield. Available for sale securities are stated at fair value and
held to maturity securities are stated at amortized cost.
17
Table of Contents
SCHEDULE III — A
Loan Portfolio
Loans by Type Outstanding (1) (In thousands)
Loan Portfolio
Loans by Type Outstanding (1) (In thousands)
| December 31, | 2009 | 2008 | 2007 | 2006 | 2005 | |||||||||||||||
Real estate, construction |
$ | 94,460 | $ | 118,455 | $ | 93,739 | $ | 24,317 | $ | 20,663 | ||||||||||
Real estate, mortgage |
299,403 | 290,458 | 265,465 | 300,807 | 258,573 | |||||||||||||||
Loans to finance
agricultural production |
1,755 | 3,178 | 2,545 | 2,502 | 2,795 | |||||||||||||||
Commercial and
industrial loans |
52,250 | 43,312 | 76,267 | 57,796 | 53,473 | |||||||||||||||
Loans to individuals for
household, family and
other consumer expenditures |
9,049 | 10,202 | 11,173 | 13,415 | 11,812 | |||||||||||||||
Obligations of states and
political subdivisions |
7,891 | 1,733 | 1,747 | 2,094 | 1,423 | |||||||||||||||
All other loans |
168 | 39 | 56 | 263 | 607 | |||||||||||||||
Totals |
$ | 464,976 | $ | 467,377 | $ | 450,992 | $ | 401,194 | $ | 349,346 | ||||||||||
| (1) | No foreign debt outstanding. |
18
Table of Contents
SCHEDULE III — B
Maturities and Sensitivity to Changes in
Interest Rates of the Loan Portfolio as of December 31, 2009
Maturities and Sensitivity to Changes in
Interest Rates of the Loan Portfolio as of December 31, 2009
| Maturity (In thousands) | ||||||||||||||||
| One year or | Over one year | |||||||||||||||
| less | through 5 years | Over 5 years | Total | |||||||||||||
Loans: |
||||||||||||||||
Real estate, construction |
$ | 47,347 | $ | 25,241 | $ | 21,872 | $ | 94,460 | ||||||||
Real estate, mortgage |
43,493 | 153,567 | 102,343 | 299,403 | ||||||||||||
Loans to finance
agricultural production |
1,755 | 1,755 | ||||||||||||||
Commercial and
industrial loans |
26,678 | 23,131 | 2,441 | 52,250 | ||||||||||||
Loans to individuals for
household, family and
other consumer
expenditures |
3,163 | 5,709 | 177 | 9,049 | ||||||||||||
Obligations of states and
political subdivisions |
6,445 | 1,446 | 7,891 | |||||||||||||
All other loans |
168 | 168 | ||||||||||||||
Totals |
$ | 129,049 | $ | 209,094 | $ | 126,833 | $ | 464,976 | ||||||||
Loans with pre-determined
interest rates |
$ | 43,134 | $ | 134,437 | $ | 14,794 | $ | 192,365 | ||||||||
Loans with floating
interest rates |
85,915 | 74,657 | 112,039 | 272,611 | ||||||||||||
Totals |
$ | 129,049 | $ | 209,094 | $ | 126,833 | $ | 464,976 | ||||||||
19
Table of Contents
SCHEDULE III — C
Non-Performing Loans (In thousands)
Non-Performing Loans (In thousands)
| December 31, | 2009 | 2008 | 2007 | 2006 | 2005 | |||||||||||||||
Loans accounted for on
a nonaccrual basis (1) |
$ | 22,006 | $ | 15,553 | $ | 45 | $ | 349 | $ | 267 | ||||||||||
Loans which are contractually past due 90 or more
days as to interest or
principal payment, but are
not included above |
4,218 | 2,340 | 1,234 | 3,295 | 762 | |||||||||||||||
| (1) | The Bank places loans on a nonaccrual status when, in the opinion of Management, they possess sufficient uncertainty as to timely collection of interest or principal so as to preclude the recognition in reported earnings of some or all of the contractual interest. See Note C to the 2009 Annual Report to Shareholders for discussion of impaired loans. |
20
Table of Contents
SCHEDULE IV — A
Summary of Loan Loss Expenses
(In thousands except percentage data)
Summary of Loan Loss Expenses
(In thousands except percentage data)
| 2009 | 2008 | 2007 | 2006 | 2005 | ||||||||||||||||
Average amount of loans
outstanding (1) (2) |
$ | 467,992 | $ | 463,505 | $ | 428,447 | $ | 377,172 | $ | 338,761 | ||||||||||
Balance of allowance for
loan losses at beginning
of period |
$ | 11,114 | $ | 9,378 | $ | 10,841 | $ | 10,966 | $ | 6,570 | ||||||||||
Loans charged-off: |
||||||||||||||||||||
Commercial, financial and
agricultural |
103 | 334 | 139 | 254 | 37 | |||||||||||||||
Consumer and other |
8,977 | 950 | 545 | 475 | 525 | |||||||||||||||
Total loans charged-off |
9,080 | 1,284 | 684 | 729 | 562 | |||||||||||||||
Recoveries of loans
previously charged-off: |
||||||||||||||||||||
Commercial, financial and
agricultural |
19 | 23 | 147 | 6 | ||||||||||||||||
Consumer and other |
569 | 654 | 243 | 316 | 1338 | |||||||||||||||
Total recoveries |
569 | 673 | 266 | 463 | 1,344 | |||||||||||||||
Net loans charged-off
(recovered) |
8,511 | 611 | 418 | 266 | (782 | ) | ||||||||||||||
Provision for loan losses
charged to operating expense |
5,225 | 2,347 | (1,045 | ) | 141 | 3,614 | ||||||||||||||
Balance of allowance for
loan losses at end of period |
$ | 7,828 | $ | 11,114 | $ | 9,378 | $ | 10,841 | $ | 10,966 | ||||||||||
Ratio of net charge-offs
during period to average
loans outstanding |
1.82 | % | 0.13 | % | 0.10 | % | 0.07 | % | (.23 | %) | ||||||||||
| (1) | Net of unearned income. | |
| (2) | Includes nonaccrual loans. |
21
Table of Contents
SCHEDULE IV — B
Allocation of the Allowance for Loan Losses (In Thousands)
| 2009 | 2008 | 2007 | 2006 | 2005 | ||||||||||||||||||||||||||||||||||||
| % of Loans | % of Loans | % of Loans | % of Loans | % of Loans | ||||||||||||||||||||||||||||||||||||
| Balance at | to Total | to Total | to Total | to Total | to Total | |||||||||||||||||||||||||||||||||||
| December 31, | Amount | Loans | Amount | Loans | Amount | Loans | Amount | Loans | Amount | Loans | ||||||||||||||||||||||||||||||
Real estate,
construction |
$ | 2,016 | 20 | $ | 5,277 | 25 | $ | 2,793 | 21 | $ | 1,474 | 6 | $ | 941 | 5 | |||||||||||||||||||||||||
Real estate,
mortgage |
4,279 | 64 | 3,922 | 61 | 3,980 | 59 | 6,058 | 74 | 7,605 | 74 | ||||||||||||||||||||||||||||||
Loans to finance
agricultural
production |
14 | 1 | 28 | 1 | 19 | 1 | 42 | 1 | 28 | 1 | ||||||||||||||||||||||||||||||
Commercial and
industrial loans |
1,420 | 11 | 1,581 | 9 | 2,462 | 16 | 3,038 | 14 | 2,184 | 15 | ||||||||||||||||||||||||||||||
Loans to individuals
for household,
family and other
consumer
expenditures |
99 | 2 | 306 | 2 | 122 | 1 | 225 | 3 | 206 | 3 | ||||||||||||||||||||||||||||||
Obligations of
states and political
subdivisions |
1 | 1 | 1 | 1 | 1 | |||||||||||||||||||||||||||||||||||
All other loans |
1 | 1 | 2 | 1 | 4 | 1 | 2 | 1 | ||||||||||||||||||||||||||||||||
Totals |
$ | 7,828 | 100 | $ | 11,114 | 100 | $ | 9,378 | 100 | $ | 10,841 | 100 | $ | 10,966 | 100 | |||||||||||||||||||||||||
22
Table of Contents
SCHEDULE V
Summary of Average Deposits and Their Yields
(In thousands except percentage data)
| 2009 | 2008 | 2007 | ||||||||||||||||||||||
| Years Ended December 31, | Amount | Rate | Amount | Rate | Amount | Rate | ||||||||||||||||||
Demand deposits in
domestic offices |
$ | 101,738 | N/A | $ | 114,380 | N/A | $ | 132,719 | N/A | |||||||||||||||
Negotiable interest
bearing deposits in
domestic offices |
189,308 | 0.90 | % | 205,420 | 1.71 | % | 217,352 | 2.24 | % | |||||||||||||||
Savings deposits in
domestic offices |
43,608 | 0.27 | % | 46,372 | 0.76 | % | 51,358 | 0.94 | % | |||||||||||||||
Time deposits in
domestic offices |
192,893 | 1.63 | % | 191,904 | 3.18 | % | 213,167 | 4.39 | % | |||||||||||||||
Total deposits |
527,547 | 0.94 | % | 558,076 | 1.78 | % | 614,596 | 2.39 | % | |||||||||||||||
Certificates of deposits in amounts of $100,000 or more (in thousands) by the amount of time
remaining until maturity as of December 31, 2009, are as follows:
Remaining maturity:
3 months or less |
$ | 75,176 | ||
Over 3 months through 6 months |
12,847 | |||
Over 6 months through 12 months |
28,753 | |||
Over 12 months |
572 | |||
Total |
$ | 117,348 | ||
23
Table of Contents
SCHEDULE VI
Short Term Borrowings
(In thousands except percentage data)
Short Term Borrowings
(In thousands except percentage data)
| 2009 | 2008 | 2007 | ||||||||||
Amount outstanding at
December 31, |
$ | 174,431 | $ | 256,609 | $ | 231,225 | ||||||
Weighted average interest rate
at December 31, |
4.03 | % | 1.52 | % | 3.96 | % | ||||||
Maximum outstanding at any
month-end during year |
309,828 | 256,609 | 238,464 | |||||||||
Average amount outstanding
during year |
253,662 | 213,422 | 225,246 | |||||||||
Weighted average interest rate |
2.78 | % | 2.14 | % | 4.53 | % | ||||||
Note: Short term borrowings include federal funds purchased from other banks and securities sold
under agreements to repurchase and short term borrowings from the Federal Home Loan Bank.
24
Table of Contents
SCHEDULE VII
Interest Sensitivity/Gap Analysis
(In thousands)
Interest Sensitivity/Gap Analysis
(In thousands)
| 0 - 3 | 4 - 12 | 1 - 5 | Over | |||||||||||||||||
| December 31, 2009 | Months | Months | Years | 5 years | Total | |||||||||||||||
ASSETS: |
||||||||||||||||||||
Loans (1) |
$ | 271,098 | $ | 33,065 | $ | 133,857 | $ | 4,951 | $ | 442,971 | ||||||||||
Available for sale securities |
2,220 | 17,137 | 69,968 | 222,109 | 311,434 | |||||||||||||||
Held to maturity securities |
305 | 1,901 | 996 | 3,202 | ||||||||||||||||
Totals |
$ | 273,318 | $ | 50,507 | $ | 205,726 | $ | 228,056 | $ | 757,607 | ||||||||||
FUNDING SOURCES: |
||||||||||||||||||||
Interest bearing deposits |
$ | 295,375 | $ | 63,988 | $ | 14,796 | $ | 1 | $ | 374,160 | ||||||||||
Federal funds purchased
and securities sold under
agreements to repurchase |
174,431 | 174,431 | ||||||||||||||||||
Borrowings from FHLB |
102,048 | 130 | 784 | 1,308 | 104,270 | |||||||||||||||
Totals |
$ | 571,854 | $ | 64,118 | $ | 15,580 | $ | 1,309 | $ | 652,861 | ||||||||||
REPRICING/MATURITY GAP: |
||||||||||||||||||||
Period |
$ | (298,536 | ) | $ | (13,611 | ) | $ | 190,146 | $ | 226,747 | ||||||||||
Cumulative |
(298,536 | ) | (312,147 | ) | (122,001 | ) | 104,746 | |||||||||||||
Cumulative Gap/Total Assets |
(34.35 | %) | (34.92 | %) | (14.04 | %) | 12.05 | % | ||||||||||||
| (1) | Amounts stated include fixed and variable rate investments of the balance sheet that are still accruing interest. Variable rate instruments are included in the next period in which they are subject to a change in rate. The principal portions of scheduled payments on fixed instruments are included in the period in which they become due or mature. |
25
Table of Contents
Liquidity
The information included in Management’s Discussion and Analysis at page 5 in the 2009 Annual
Report to Shareholders is incorporated herein by reference.
Capital Resources
The information included in Note K — Shareholders’ Equity in the 2009 Annual Report to Shareholders
is incorporated herein by reference.
ITEM 1a — RISK FACTORS
An investment in the Company’s stock involves a number of risks. Investors should carefully
consider the following risks as well as the other information in this Annual Report on Form 10-K
and the documents incorporated by reference before making an investment decision. The realization
of any of the risks described below could have a material adverse affect on the Company and the
price of its common stock.
RISKS RELATING TO THE COMPANY’S BUSINESS
Greater than expected loan losses may adversely affect the Company’s earnings.
The Company’s investment and loan portfolio subject the Company to credit risk. Credit
losses are always inherent in the banking business but the current economic downturn presents even
more exposure to loss. The Company makes various assumptions and judgments about the
collectibility of its loan portfolio and provides an allowance for estimated loan losses based on a
number of factors. The Company believes that its current allowance for loan losses is adequate.
However, if the Company’s assumptions or judgments prove to be incorrect, the allowance for loan
losses may not be sufficient to cover actual loan losses. In the event that our loan customers do
not repay their loans according to the terms of the loans, and the collateral securing the
repayment of these loans is insufficient to cover any remaining loan balances, the Company could
experience significant loan losses or increase the provision for loan losses or both, which could
have a material adverse effect on its operating results. The actual amount of future provisions
for loan losses cannot be determined at this time and may vary from the amounts of past provisions.
The Company has a high concentration of loans secured by real estate, and a greater downturn in
the real estate market could materially and adversely affect earnings.
A significant portion of the Company’s loan portfolio is dependent on real estate. At December 31,
2009, approximately 85% of the Company’s loans had real estate as a primary or secondary component
of collateral. The collateral in each case provides an alternate source of repayment if the
borrower defaults and may deteriorate in value during the time the credit is extended. A continued
deterioration in the economy affecting the value of real estate generally or in the Company’s trade
area specifically could significantly impair the value of the collateral and the ability to sell
the collateral upon foreclosure. Furthermore, it is likely that the Company would be required to
increase the provision for loan losses. If the Company were required to liquidate the collateral
securing a loan to satisfy the debit during a period of reduced real estate value or to increase
the allowance for
26
Table of Contents
loan losses, the Company’s profitability and financial condition could be
adversely impacted.
The Company has a high concentration of exposure to a number of industries.
The Company has concentrations of loan exposure to the hotel/motel and gaming industries. At
December 31, 2009, these exposures were $47,714,000 and $69,938,000 or 10% and 15%,
respectively, of the total loan portfolio. The recent downturn in the economy has negatively
impacted tourism, which is one of the major factors for success in these industries. Given the size
of these relationships, a significant loss in either of these portfolios could materially and
adversely affect the Company’s earnings.
The current economic downturn or a natural disaster, especially one affecting the Company’s
trade area, could adversely affect the Company.
The Company’s primary trade area includes four of the six counties in south Mississippi. With the
exception of a number of credits that are considered out of area, the Company’s credit exposure is
generally limited to the Mississippi Gulf Coast. As a result, the Company is at risk from
continuing adverse business developments in its trade area, including declining real estate value,
increasing loan delinquencies, personal and business bankruptcies and unemployment rates. The
Company is also at risk to weather-related disasters including hurricanes, floods and tornadoes.
If the Mississippi Gulf Coast economy experiences a natural disaster or worsening economic
conditions, our operating results could be negatively impacted.
Current economic factors could negatively impact the Company’s liquidity.
In addition to funds provided by its banking activities such as deposits, loan payments and
proceeds from the maturity of investment securities, the Company’s liquidity needs have
traditionally been met through the purchase of federal funds, often on an unsecured basis, and
advances from the Federal Home Loan Bank (“FHLB”). The recent disruption in the financial markets
has negatively impacted the availability of these unsecured funds. As a result, the Company has
increased its borrowing lines with the FHLB and secured approval to participate in the Federal
Reserve Bank’s Discount Window Primary Credit Program.
The Company is subject to industry competition which may have an impact on its success.
The profitability of the Company depends on its ability to compete successfully. The
Company operates in a highly competitive financial services environment. Certain competitors are
larger and may have more resources than the Company. The Company faces competition in its trade
area from other commercial banks, savings and loan associations, credit unions, internet banks,
finance
companies, insurance companies, brokerage and investment banking firms and other financial
intermediaries. Some of these non-bank competitors are not subject to the same extensive
regulations that govern the Company or the Bank and may have greater flexibility in competing for
business. Increased competition could require the Company to increase the rates paid on deposits
or lower the rates offered on loans, which could adversely affect and also limit future growth and
earnings prospects.
The Company’s profitability is vulnerable to interest rate fluctuations.
The Company’s profitability is dependent to a large extent on net interest income, which is the
27
Table of Contents
difference between interest income on interest-earning assets, such as loans and investment
securities, and interest expense on interest-bearing liabilities, such as deposits and borrowings.
The Company is asset sensitive to market interest rates, as its assets reprice more quickly to
changes in interest rates than do its liabilities. Interest rates dropped by the unprecedented
amount of 400 basis points during 2008 as the Federal Reserve, through its Federal Open Market
Committee, attempted to stabilize the financial markets, reduce the effects of the recession and
stimulate the economy. These actions taken by the Federal Reserve continued to impact the
Company’s earnings in 2009. On February 18, 2010, the Federal Reserve increased the discount rate
25 basis points; however, there was no effect on the fed funds or
prime interest rates. Discount or fed funds
rate changes that occur in 2010 may affect the Company’s earnings in the current year and/or in the
future.
Changes in the policies of monetary authorities and other government action could adversely
affect the Company’s profitability.
Many factors affect the demand for loans and the ability to attract deposits, including changes in
government economic and monetary policies, particularly by the Federal Reserve, modifications to
tax, banking and credit laws and regulations, national, state and local economic growth rates and
employment rates. The Emergency Economic Stabilization Act of 2008 (“EESA”) was enacted in 2008 to
address the asset quality, capital and liquidity issues facing certain financial institutions and
to improve the general availability of credit for consumers and businesses. In addition, the
American Recovery and Reinvestment Act (“ARRA”) was passed in 2009 in an effort to save and create
jobs, stimulate the national economy and promote long-term growth and stability. There can be no
assurance that EESA or ARRA will achieve their intended purposes. Furthermore, their failure could
result in continuing or worsening economic and market conditions, and this could adversely affect
our operations.
The Company is subject to regulation by various federal and state entities.
The Company is subject to the regulations of the SEC, the Federal Reserve Board, the FDIC and the
Department of Banking. New regulations issued by these agencies may adversely affect the Company’s
ability to carry on its business activities. The Company is also subject to various other federal
and state laws and certain changes in these laws and regulations may adversely affect the Company’s
operations. Noncompliance with certain of these regulations may impact the Company’s business
plans.
The Company is also subject to the accounting rules and regulations of the SEC and the
Financial
Accounting Standards Board. Changes in accounting rules could adversely affect the reported
financial statements or results of operations of the Company and may also require additional effort
or cost to implement.
The Company is subject to the requirements under The Sarbanes-Oxley Act of 2002 with respect to
the assessment of internal controls over financial reporting.
The Company’s management is required to report on, and the independent auditors to attest to, the
effectiveness of internal controls over financial reporting for each fiscal year end. The rules
governing the standards that must be met for management to assess internal controls are complex and
require significant documentation and testing. In connection with this effort, the Company has and
will continue to incur increased expenses and diversion of Management’s time and other internal
28
Table of Contents
resources. In connection with the attestation process by the Company’s independent auditors,
Management may encounter problems or delays in completing the implementation for any requested
improvements and receiving a favorable attestation. If the Company cannot make the required
report, or if the Company’s external auditors are unable to provide an unqualified attestation,
investor confidence in the Company’s common stock could be adversely affected.
The Company is subject to anti-terrorism and money laundering legislation.
The Company is subject to the Uniting and Strengthening America by Providing Appropriate Tools
Required to Intercept and Obstruct Terrorism (the “USA PATRIOT Act”), the Bank Secrecy Act, and
rules and regulations of the Office of Foreign Assets Control (the “OFAC”). These statutes and
related rules and regulations impose requirements and limitations on specified financial
transactions and account relationships, intended to guard against money laundering and terrorism
financing. Noncompliance with these rules and regulations may adversely affect the Company’s
operations and may impact the Company’s business plans.
The Company relies heavily on technology and computer systems, and advances and changes in
technology could significantly affect business.
The Company’s ability to compete depends on the ability to continue to adapt to changes in
technology on a timely and cost-effective basis to meet customers’ demands. In addition, the
Company’s operations are susceptible to negative effects from computer system failures,
communication and energy disruption and unethical individuals with technological ability to cause
disruptions or failures of data processing systems.
RISKS RELATING TO AN INVESTMENT IN THE COMPANY’S COMMON STOCK
Securities issued by the Company are not FDIC insured.
The Company’s common stock is not a savings or deposit account or other obligation of the Bank and is not insured by the FDIC, the Bank Insurance Fund or any other government agency or instrumentality, or any private insurer and is subject to investment risk, including the possible loss of principal.
The Company’s common stock is not a savings or deposit account or other obligation of the Bank and is not insured by the FDIC, the Bank Insurance Fund or any other government agency or instrumentality, or any private insurer and is subject to investment risk, including the possible loss of principal.
The directors of the Company and executive management own a significant number of shares of
stock, allowing further control over business and corporate affairs.
The Company’s directors and executive officers beneficially own approximately 20% of the outstanding common stock of Peoples Financial Corporation. As a result, in addition to their day-to-day management roles, they will be able to exercise significant influence on the Company’s business as shareholders, including influence over election of the Board and the authorization of other corporate actions requiring shareholder approval.
The Company’s directors and executive officers beneficially own approximately 20% of the outstanding common stock of Peoples Financial Corporation. As a result, in addition to their day-to-day management roles, they will be able to exercise significant influence on the Company’s business as shareholders, including influence over election of the Board and the authorization of other corporate actions requiring shareholder approval.
Provisions of the Company’s articles of incorporation and bylaws, Mississippi law and state and
federal banking regulations could delay or prevent a takeover by a third party.
Certain provisions of the Company’s articles of incorporation and bylaws and of state and federal
law may make it more difficult for someone to acquire control of the Company. Under federal law,
29
Table of Contents
subject to certain exemptions, a person, entity or group must notify the federal banking agencies
before acquiring 10% or more of the outstanding voting stock of a bank holding company, including
the Company’s shares. Banking agencies review the acquisition to determine if it will result in a
change of control. The banking agencies have 60 days to act on the notice, and take in to account
several factors, including the resources of the acquirer and the antitrust effects of the
acquisition. There are also Mississippi statutory provisions and provisions in the Company’s
articles of incorporation and bylaws that may be used to delay or block a takeover attempt. As a
result, these statutory provisions and provisions in the Company’s articles and bylaws could result
in the Company being less attractive to a potential acquirer.
The Company’s future ability to pay dividends is subject to restrictions.
Since the Company is a holding company with no significant assets other than the Bank, the Company
has no material source of funds other than dividends received from the Bank. Therefore, the
ability to pay dividends to the shareholders will depend on the Bank’s ability to pay dividends
to the Company. Moreover, banks and bank holding companies are both subject to certain federal and
state regulatory restrictions on cash dividends. Currently, the Federal Reserve Bank and the FDIC
must approve the declaration and payment of dividends by the Company and the Bank, respectively.
ITEM 1b — UNRESOLVED STAFF COMMENTS
None.
ITEM 2 — PROPERTIES
The principal properties of the Company are its 16 business locations, including the Main
Office, which is located at 152 Lameuse Street in Biloxi, MS, 39530. All such properties are owned
by the Company. The address of the other branch locations are:
Bay St. Louis Office
|
408 Highway 90 East, Bay St. Louis, MS 39520 | |
Cedar Lake Office
|
1740 Popps Ferry Road, Biloxi, MS 39532 | |
Diamondhead Office
|
5429 West Aloha Drive, Diamondhead, MS 39525 | |
D’Iberville-St. Martin Office
|
10491 Lemoyne Boulevard, D’Iberville, MS 39540 | |
Downtown Gulfport Office
|
1105 30th Avenue, Gulfport, MS 39501 | |
Gautier Office
|
2609 Highway 90, Gautier, MS 39553 | |
Handsboro Office
|
412 E. Pass Road, Gulfport, MS 39507 | |
Long Beach Office
|
298 Jeff Davis Avenue, Long Beach, MS 39560 | |
Ocean Springs Office
|
2015 Bienville Boulevard, Ocean Springs, MS 39564 | |
Orange Grove Office
|
12020 Highway 49 North, Gulfport, MS 39503 | |
Pass Christian Office
|
301 East Second Street, Pass Christian, MS 39571 | |
Saucier Office
|
17689 Second Street, Saucier, MS 39574 | |
Waveland Office
|
470 Highway 90, Waveland, MS 39576 | |
West Biloxi Office
|
2560 Pass Road, Biloxi, MS 39531 | |
Wiggins Office
|
1312 S. Magnolia Drive, Wiggins, MS 39577 |
30
Table of Contents
ITEM 3 — LEGAL PROCEEDINGS
The information included in Note N to the Consolidated Financial Statements included in the 2009
Annual Report to Shareholders is incorporated herein by reference.
ITEM 4 — RESERVED
PART II
ITEM 5 — MARKET FOR THE REGISTRANT’S COMMON STOCK AND RELATED STOCKHOLDER MATTERS
At December 31, 2009, there were 563 holders of the common stock of the Company. No shares of the
Company’s stock were repurchased during the fourth quarter of 2009. The information provided on
page 32 of the 2009 Annual Report is incorporated herein by reference.
The graph on the following page compares the Company’s annual percentage change in cumulative total
shareholder return on common shares over the last five years with the cumulative total return of a
broad equity market index of companies, the NASDAQ Market Index, and peer groups consisting of the
Hemscott Industry Group 413 — Regional Southeast Banks (“Hemscott”) and the Morningstar Industry
Group, Regional — Southeast Banks (“Morningstar”). The Company has used Hemscott as its peer
group in prior years but beginning in the current year will use Morningstar. The Hemscott and
Morningstar groups include most of the same financial institutions. Both peer groups are presented
below for comparison purposes.
This presentation assumes that $100 was invested in shares of the relevant issuers on January 1,
2005, and that dividends received were immediately invested in additional shares. The graph plots
the value of the initial $100 investment at one year intervals. For purposes of constructing this
data, the returns of each component issuer have been weighted according to that issuer’s market
capitalization.
31
Table of Contents
COMPARISON OF 5-YEAR CUMULATIVE TOTAL RETURN AMONG PEOPLES FINANCIAL
CORPORATION, NASDAQ MARKET INDEX, HEMSCOTT GROUP INDEX,
AND MORNINGSTAR GROUP INDEX
CORPORATION, NASDAQ MARKET INDEX, HEMSCOTT GROUP INDEX,
AND MORNINGSTAR GROUP INDEX
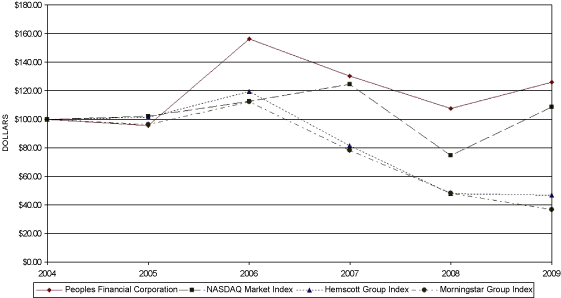
ASSUMES $100 INVESTED ON JAN 01 2005
ASSUMES DIVIDEND REINVESTED
FISCAL YEAR ENDING DEC 31 2009
ASSUMES DIVIDEND REINVESTED
FISCAL YEAR ENDING DEC 31 2009
ITEM 6 — SELECTED FINANCIAL DATA
The information under the caption “Five Year Comparative Summary of Selected Financial Information”
on page 31 of the 2009 Annual Report is incorporated herein by reference.
ITEM 7 — MANAGEMENT’S DISCUSSION AND ANALYSIS OF FINANCIAL CONDITION AND RESULTS OF OPERATIONS
The information under the caption “Management’s Discussion and Analysis of Financial Condition and
Results of Operations” on pages 1 — 7 of the 2009 Annual Report is incorporated herein by
reference.
The Company’s long-term contractual obligations relate to its borrowings from the Federal Home Loan
Bank and the maturities of certificates of deposits. Information relating the maturity of these
obligations is found under “Management’s Discussion and Analysis of Financial Condition and Results
of Operations” on page 7 of the 2009 Annual Report and is incorporated by reference and in Notes F
and H on pages 19 — 20 of the 2009 Annual Report and is incorporated by reference.
32
Table of Contents
ITEM 7a — QUANTITATIVE AND QUALITATIVE DISCLOSURE ABOUT MARKET RISK
The information under the caption “Quantitative and Qualitative Disclosures about Market Risk” on
pages 6 — 7 of the 2009 Annual Report is incorporated herein by reference.
ITEM 8 — FINANCIAL STATEMENTS AND SUPPLEMENTAL DATA
The following consolidated financial statements of the Company and consolidated subsidiaries and
the independent auditors’ report appearing on pages 8 — 30 of the 2009 Annual Report are
incorporated herein by reference:
| page | 8 | |||||||
| page | 9 | |||||||
| pages | 10 - 11 | |||||||
| page | 12 | |||||||
| pages | 13 - 28 | |||||||
| pages | 29 - 30 | |||||||
ITEM 9 — CHANGES IN AND DISAGREEMENTS WITH ACCOUNTANTS ON ACCOUNTING AND FINANCIAL DISCLOSURE
None.
ITEM 9a — CONTROLS AND PROCEDURES
Evaluation of Disclosure Controls and Procedures
As of December 31, 2009, an evaluation was performed under the supervision and with the
participation of the Chief Executive Officer and Chief Financial Officer of the effectiveness of
the Company’s disclosure controls and procedures (as defined in Exchange Act Rules 13a-15(e)).
Based on that evaluation, the Chief Executive Officer and the Chief Financial Officer have
concluded that the Company’s disclosure controls and procedures are effective to ensure that the
information required to be disclosed by the Company in the reports it files or submits under the
Securities Exchange Act of 1934 is recorded, processed, summarized and reported, within the time
periods specified in the SEC’s rules and forms.
Management’s Report on Internal Controls Over Financial Reporting
33
Table of Contents
The Company’s management is responsible for establishing and maintaining adequate internal control
over financial reporting, as defined in Rules 13(a) — 15 (f) of the Securities Exchange Act of
1934. In meeting its responsibility, management relies on its accounting and other related control
systems. The internal control systems are designed to ensure that transactions are properly
authorized and recorded in the Company’s financial records and to safeguard the Company’s assets
from material loss or misappropriation.
Management of the Company, including its Chief Executive Officer and Chief Financial Officer,
assessed the effectiveness of internal control over financial reporting as of December 31, 2009,
using the criteria set forth in Internal Control — Integrated Framework issued by the Committee of
Sponsoring Organizations of the Treadway Commission. Our assessment included a review of the
documentation of controls, evaluations of the design of the internal control system and tests of
operating effectiveness of the internal controls. Based on the assessment, management has
concluded that the Company had effective internal control over financial reporting as of December
31, 2009. Our independent registered public accountants have issued
an audit report on the Company’s internal control over financial
reporting. Their report is on page 29 of the 2009 Annual Report.
Chevis C. Swetman
|
Lauri A. Wood | |
Chairman, President and Chief Executive Officer
|
Chief Financial Officer | |
February 24, 2010
|
February 24, 2010 |
ITEM 9b — OTHER INFORMATION
None.
PART III
ITEM 10 — DIRECTORS AND EXECUTIVE OFFICERS OF THE REGISTRANT
The information in Sections II, III, VII, VIII and IX contained in the Proxy Statement in
connection with the Annual Meeting of Shareholders to be held April 14, 2010, which was filed by
the Company in definitive form with the Commission on March 11, 2010, is incorporated herein by
reference.
The Company’s Board of Directors has adopted a Code of Conduct that applies to not only the chief
executive officer and the chief financial officer, but also all of the officers, directors and
employees of the Company and its subsidiaries. A copy of this Code of Conduct can be found at the
Company’s internet website at www.thepeoples.com. The Company intends to disclose any
amendments to its Code of Conduct, and any waiver from a provision of the Code of Conduct granted
to the Company’s Chief Executive Officer or Chief Financial Officer on the Company’s internet
website within five business days following such amendment or waiver. The information contained on or connected to the
Company’s internet website is not incorporated by reference into this Form 10-K and should not be
considered part of this or any other report that the Company may file with or furnish to the SEC.
34
Table of Contents
ITEM 11 — EXECUTIVE COMPENSATION
The information in Section VI contained in the Proxy Statement in connection with the Annual
Meeting of Shareholders to be held April 14, 2010, which was filed by the Company in definitive
form with the Commission on March 11, 2010, is incorporated herein by reference.
ITEM 12 — SECURITY OWNERSHIP OF CERTAIN BENEFICIAL OWNERS AND MANAGEMENT
The information in Sections IV and V contained in the Proxy Statement in connection with the Annual
Meeting of Shareholders to be held April 14, 2010, which was filed by the Company in definitive
form with the Commission on March 11, 2010, is incorporated herein by reference.
ITEM 13 — CERTAIN RELATIONSHIPS AND RELATED TRANSACTIONS
The information in Sections II, IV, V, VI and IX contained in the Proxy Statement in connection
with the Annual Meeting of Shareholders to be held April 14, 2010, which was filed by the Company
in definitive form with the Commission on March 11, 2010, is incorporated herein by reference.
ITEM 14 — PRINCIPAL ACCOUNTANT FEES AND SERVICES
The information in Section XII contained in the Proxy Statement in connection with the Annual
Meeting of Shareholders to be held April 14, 2010, which was filed by the Company in definitive
form with the Commission on March 11, 2010, is incorporated herein by reference.
PART IV
ITEM 15 — EXHIBITS AND FINANCIAL STATEMENT SCHEDULES
| (a) | 1. Index of Financial Statements: | |
| See Item 8. | ||
| (a) | 2. Index of Financial Statement Schedules: | |
| All other schedules have been omitted as not applicable or not required or because the information has been included in the financial statements or applicable notes. | ||
| (a) | 3. Index of Exhibits: |
35
Table of Contents
| Incorporated by | ||||||||||||||
| Reference to | Exhibit | |||||||||||||
| Registration or | Form of | Date of | Number | |||||||||||
| Description | File Number | Report | Report | in Report | ||||||||||
| (3.1 | ) | Articles of Incorporation
|
0-30050 | 10/a | 6/21/1999 | 3.1 | ||||||||
| (3.2 | ) | By-Laws
|
0-30050 | 10/a | 6/21/1999 | 3.2 | ||||||||
| (10.1 | ) | Description of Automobile Plan
|
0-30050 | 10-K | 12/31/2003 | 10.1 | ||||||||
| (10.2 | ) | Directors’ Deferred Income Plan
Agreements
|
0-30050 | 10-K | 12/31/2003 | 10.2 | ||||||||
| (10.3 | ) | Executive Supplemental Income
Plan Agreement — Chevis C. Swetman
|
001-12103 | 10-Q | 9/30/2007 | 10.2 | ||||||||
| (10.4 | ) | Executive Supplemental Income
Plan Agreement — A. Wes Fulmer
|
001-12103 | 10-Q | 9/30/2007 | 10.3 | ||||||||
| (10.5 | ) | Executive Supplemental Income
Plan Agreement — Lauri A. Wood
|
001-12103 | 10-Q | 9/30/2007 | 10.4 | ||||||||
| (10.6 | ) | Split Dollar Agreements
|
0-30050 | 10-K | 12/31/2003 | 10.4 | ||||||||
| (10.7 | ) | Deferred Compensation Plan
|
001-12103 | 10-Q | 9/30/2007 | 10.1 | ||||||||
| (10.8 | ) | Description of Stock Incentive Plan
|
33-15595 | 10-K | 12/31/2001 | 10.6 | ||||||||
| (13.1 | ) | Annual Report to Shareholders for
year ended December 31, 2009 * (A) |
||||||||||||
| (13.2 | ) | Summary Report to Shareholders for
year ended December 31, 2009 * (A) |
||||||||||||
| (21 | ) | Subsidiaries of the registrant
|
33-15595 | 10-K | 12/31/1988 | 22 | ||||||||
| (23.1 | ) | Consent of Independent Registered
Public Accounting Firm — Porter
Keadle
Moore, LLP * |
||||||||||||
| (31.1 | ) | Certification of Chief Executive
Officer
Pursuant to Section 302 of the Sarbanes — Oxley Act of 2002 *
|
||||||||||||
| (31.2 | ) | Certification of Chief Financial Officer
Pursuant to Section 302 of the Sarbanes — Oxley Act of 2002 *
|
||||||||||||
| (32.1 | ) | Certification of Chief Executive Officer
Pursuant to 18 U.S.C. ss. 1350* |
||||||||||||
| (32.2 | ) | Certification of Chief Financial Officer
Pursuant to 18 U.S.C. ss. 1350* |
||||||||||||
| (A) | Furnished for the information of the Commission only and not deemed “filed” except for those portions which are specifically incorporated herein. | |
| * | Filed Herewith. |
36
Table of Contents
SIGNATURES
Pursuant to the requirements of Section 13 of the Securities Exchange Act of 1934, the
Registrant has duly caused this report to be signed on its behalf by the undersigned, thereunto
duly authorized.
| PEOPLES FINANCIAL CORPORATION (Registrant) |
||||
| Date: March 11, 2010 |
||||
| BY: | /s/ Chevis C. Swetman | |||
| Chevis C. Swetman, Chairman of the Board (principal executive officer) |
||||
Pursuant to the requirements of the Securities Exchange Act of 1934, this report has been signed
below by the following persons on behalf of the Registrant and in the capacities and on the dates
indicated.
| BY: | /s/ Chevis C. Swetman | |||
| Date: March 11, 2010 | ||||
| Chevis C. Swetman, Chairman, President and CEO (principal executive officer) |
||||
BY:
|
/s/ Drew Allen | BY: | /s/ Dan Magruder | |||
| Date: March 11, 2010 | Date: March 11, 2010 | |||||
| Drew Allen, Director | Dan Magruder, Director | |||||
BY:
|
/s/ Rex E. Kelly | BY: | ||||
| Date: March 11, 2010 | ||||||
| Rex E. Kelly, Director | Lyle M. Page, Director | |||||
| BY: | /s/ Lauri A. Wood | |||||
| Date: March 11, 2010 | ||||||
| Lauri A. Wood, Chief Financial Officer (principal financial and accounting officer) |
37