Attached files
| file | filename |
|---|---|
| EX-23.1 - EXHIBIT 23.1 - OPENTABLE INC | a2197111zex-23_1.htm |
| EX-32.2 - EXHIBIT 32.2 - OPENTABLE INC | a2197111zex-32_2.htm |
| EX-31.1 - EXHIBIT 31.1 - OPENTABLE INC | a2197111zex-31_1.htm |
| EX-31.2 - EXHIBIT 31.2 - OPENTABLE INC | a2197111zex-31_2.htm |
| EX-32.1 - EXHIBIT 32.1 - OPENTABLE INC | a2197111zex-32_1.htm |
UNITED STATES
SECURITIES AND EXCHANGE COMMISSION
WASHINGTON, D.C. 20549
FORM 10-K
| (Mark One) | ||
ý |
ANNUAL REPORT PURSUANT TO SECTION 13 OR 15(d) OF THE SECURITIES EXCHANGE ACT OF 1934 |
|
For the fiscal year ended December 31, 2009 |
||
or |
||
o |
TRANSITION REPORT PURSUANT TO SECTION 13 OR 15(d) OF THE SECURITIES EXCHANGE ACT OF 1934 |
|
For the transition period from to |
||
Commission file number 001-34357
OPENTABLE, INC.
(Exact name of registrant as specified in its charter)
| Delaware (State or other jurisdiction of incorporation or organization) |
94-3374049 (I.R.S. Employer Identification Number) |
|
799 Market Street, 4th Floor San Francisco, CA (Address of principal executive offices) |
94103 (Zip Code) |
(415) 344-4200
(Registrant's telephone number, including area code)
Securities registered pursuant to Section 12(b) of the Act:
| (Title of each class) | (Name of each exchange on which registered) | |
|---|---|---|
| Common Stock, $0.0001 par value | The NASDAQ Stock Market LLC |
Securities registered pursuant to Section 12(g) of the Act:
None.
(Title of Class)
Indicate by check mark if the registrant is a well-known seasoned issuer, as defined in Rule 405 of the Securities Act. Yes o No ý
Indicate by check mark if the registrant is not required to file reports pursuant to Section 13 or Section 15(d) of the Exchange Act. Yes o No ý
Indicate by check mark whether the registrant (1) has filed all reports required to be filed by Section 13 or 15(d) of the Securities Exchange Act of 1934 during the preceding 12 months (or for such shorter period that the registrant was required to file such reports), and (2) has been subject to such filing requirements for the past 90 days. Yes ý No o
Indicate by check mark whether the registrant has submitted electronically and posted on its corporate Web site, if any, every Interactive Data File required to be submitted and posted pursuant to Rule 405 of Regulation S-T (§232.405 of this chapter) during the preceding 12 months (or for such shorter period that the registrant was required to submit and post such files). Yes o No o
Indicate by check mark if disclosure of delinquent filers pursuant to Item 405 of Regulation S-K is not contained herein, and will not be contained, to the best of registrant's knowledge, in definitive proxy or information statements incorporated by reference in Part III of this Form 10-K or any amendment to this Form 10-K. ý
Indicate by check mark whether the registrant is a large accelerated filer, an accelerated filer, a non-accelerated filer, or a smaller reporting company. See the definitions of "large accelerated filer," "accelerated filer" and "smaller reporting company" in Rule 12b-2 of the Exchange Act. (Check one):
| Large accelerated filer o | Accelerated filer o | Non-accelerated filer ý (Do not check if a smaller reporting company) |
Smaller reporting company o |
Indicate by check mark whether the registrant is a shell company (as defined in Rule 12b-2 of the Exchange Act). Yes o No ý
As June 30, 2009 (the last business day of the registrant's most recently completed second fiscal quarter), the aggregate market value of voting stock held by non-affiliates of the registrant was $172,731,000.
As of February 28, 2010, the number of shares of the registrant's common stock outstanding was 22,582,543.
Documents Incorporated by Reference
Portions of the registrant's definitive proxy statement for its 2010 annual meeting of stockholders are incorporated by reference in Items 10, 11, 12, 13 and 14 of Part III.
OPENTABLE, INC.
INDEX TO FORM 10-K
PART I
SPECIAL NOTE REGARDING FORWARD-LOOKING STATEMENTS
This report includes forward-looking statements. We have based these forward-looking statements largely on our current expectations and projections about future events and financial trends affecting the financial condition of our business. Forward-looking statements should not be read as a guarantee of future performance or results, and will not necessarily be accurate indications of the times at, or by, which such performance or results will be achieved. Forward-looking statements are based on information available at the time those statements are made and/or management's good faith belief as of that time with respect to future events, and are subject to risks and uncertainties that could cause actual performance or results to differ materially from those expressed in or suggested by the forward-looking statements. Important factors that could cause such differences include, but are not limited to:
- •
- our ability to accurately forecast revenues and appropriately plan our expenses;
- •
- the impact of worldwide economic conditions, including the resulting effect on consumer spending;
- •
- our ability to maintain an adequate rate of growth;
- •
- our ability to effectively manage our growth;
- •
- our ability to attract new restaurant customers;
- •
- our ability to increase the number of visitors to our website and convert those visitors into diners who reserve a table
using our website and then dine with our restaurant customers;
- •
- our ability to retain existing restaurant customers and diners or encourage repeat reservations;
- •
- our ability to provide a high-quality customer experience through our website and ERB;
- •
- our ability to successfully enter new markets and manage our international expansion;
- •
- the impact of fluctuations in currency exchange rates;
- •
- the effects of increased competition in our business;
- •
- our ability to keep pace with changes in technology and our competitors;
- •
- our ability to successfully manage any acquisitions of businesses, solutions or technologies;
- •
- the success of our marketing efforts;
- •
- changes in consumer behavior and any related impact on the restaurant industry, especially in the geographic markets we
are operating in;
- •
- seasonal patterns in restaurant dining;
- •
- interruptions in service and any related impact on our reputation;
- •
- the attraction and retention of qualified employees and key personnel;
- •
- our ability to protect our intellectual property, including our proprietary ERB;
- •
- costs associated with defending intellectual property infringement and other claims;
- •
- the effects of natural or man-made catastrophic events;
- •
- the effectiveness of our internal controls;
- •
- changes in government regulation affecting our business; and
- •
- other risk factors included under "Risk Factors" in this report.
1
In addition, in this report, the words "believe," "may," "will," "estimate," "continue," "anticipate," "intend," "expect," "predict," "potential" and similar expressions, as they relate to our company, our business and our management, are intended to identify forward-looking statements. In light of these risks and uncertainties, the forward-looking events and circumstances discussed in this report may not occur and actual results could differ materially from those anticipated or implied in the forward-looking statements.
Forward-looking statements speak only as of the date of this report. You should not put undue reliance on any forward-looking statements. We assume no obligation to update forward-looking statements to reflect actual results, changes in assumptions or changes in other factors affecting forward-looking information, except to the extent required by applicable laws. If we update one or more forward-looking statements, no inference should be drawn that we will make additional updates with respect to those or other forward-looking statements.
Overview
OpenTable, Inc. (together with its subsidiaries, "OpenTable,"the "Company," "our," "we," or "us") was incorporated on October 13, 1998, and is a Delaware corporation. We provide solutions that form an online network connecting reservation-taking restaurants and people who dine at those restaurants. Our solutions include our proprietary Electronic Reservation Book, or ERB, for restaurant customers and www.opentable.com, a popular restaurant reservation website for diners. The OpenTable network includes approximately 12,000 OpenTable restaurant customers spanning all 50 states as well as select markets outside of the United States. Since our inception in 1998, we have seated approximately 130 million diners through OpenTable reservations, and during the three months ended December 31, 2009, we seated an average of approximately four million diners per month. Restaurants pay us a one-time installation fee for onsite installation and training, a monthly subscription fee for the use of our software and hardware and a fee for each restaurant guest seated through online reservations. Our online restaurant reservation service is free to diners. For the twelve months ended December 31, 2009 and 2008, our net revenues were $68.6 million and $55.8 million, respectively. For the twelve months ended December 31, 2009 and 2008, our subscription revenues accounted for 52% and 54% of our total revenues, respectively, our reservation revenues accounted for 43% and 41% of our total revenues, respectively, and our installation and other revenues accounted for 5% and 5% of our total revenues, respectively.
The OpenTable ERB combines proprietary software and computer hardware to deliver a solution that computerizes restaurant host-stand operations and replaces traditional pen-and-paper reservation books. Our ERB streamlines and enhances a number of business-critical functions and processes for restaurants, including reservation management, table management, guest recognition and email marketing. This enables restaurants to manage all of their reservations—those booked by phone or online as well as walk-in diners—in one unified system. The ERB also automatically accepts online reservations in real time directly from the OpenTable website as well as from our mobile applications and the websites of our partners and restaurant customers. The ERBs at our restaurant customers connect via the Internet to form an online network of restaurant reservation books. We also operate the OpenTable website, which enables diners to quickly and conveniently find, choose and book tables at restaurants on the OpenTable network, overcoming the inefficiencies associated with the traditional process of reserving by phone. Diners appreciate the convenience of being able to secure a reservation at any time, even when the restaurant is closed, and the time savings of being able to instantly find and reserve available tables without having to call restaurants one by one until they find an available reservation that suits their needs. Online visitors come to the OpenTable website directly, via natural search engine results and via our partners' and restaurant customers' websites. During the twelve
2
months ended December 31, 2009, less than 1% of reservations made through our website were attributable to paid-search advertising.
We initially focused on acquiring a critical mass of local restaurant customers in four metropolitan areas: Chicago, New York, San Francisco and Washington, D.C. These markets have since developed into active, local networks of restaurants and diners that continue to grow. We have applied and continue to apply the same fundamental strategy in developing and penetrating our other markets in the United States, Canada and Mexico. In 2004, we began to selectively expand into countries outside of North America that are characterized by large numbers of online consumer transactions and reservation-taking restaurants. To date, we have concentrated our international efforts in Germany, Japan and the United Kingdom. Our revenues outside of North America for the twelve months ended December 31, 2009 and 2008, were $3.8 million and $2.8 million, respectively, or 6% and 5% of our total revenues, respectively.
We measure our business geographically based on two segments: North America and International. Additional information required by this item is incorporated herein by reference to Note 12—"Segment Information" of the Notes to the consolidated financial statements, beginning on page 56 of this Form 10-K.
Restaurant Industry Background
The commercial restaurant industry is broadly divided into "quick-service" and "full-service" segments. We target our offerings to full-service restaurants that accept reservations. We believe based on our internal estimates that there are approximately 30,000 reservation-taking restaurants in North America that seat approximately 600 million diners through reservations annually, though this number fluctuates with economic and other conditions.
The ability of the restaurant industry to leverage the power of the Internet for reservation transactions has been inhibited by two key characteristics. First, the reservation-taking restaurant industry has been slow to computerize host-stand operations. During the last decade, other reservation-taking industries, such as airlines and hotels, have experienced a dramatic shift in consumer behavior as reservations have migrated from the phone to the Internet. In contrast, given the restaurant industry's relatively basic transaction needs, generally requiring only the diner's name and phone number and no advance payment, restaurant reservations historically have been largely handled by the traditional pen-and-paper reservation book, despite the inherent operational inefficiencies and potential for error. Second, the reservation-taking restaurant industry is highly fragmented, with independent restaurants and small, local restaurant groups comprising a significant majority of restaurant locations. Unlike other industries in which suppliers can deliver goods and services to customers around the world, the restaurant industry is inherently local. These conditions make it time-consuming and costly to aggregate the breadth of local restaurant table inventory required to attract a critical mass of diners to make reservations online and to create an online restaurant reservation network.
In addition, reservation-taking restaurants generally share the following operational challenges:
- •
- Profitability is dependent on filling seats. Because
restaurants typically have a high fixed cost structure, restaurant profitability is heavily dependent on filling as many seats as possible. Similar to hotel rooms and airplane seats, restaurant table
inventory is highly perishable, with unfilled seats representing a significant lost revenue opportunity.
- •
- Prospective business is lost due to the inefficiencies of reserving by phone. Most restaurants are not staffed to answer the phone until late morning or early afternoon, and many are only open six days per week. As a result, they lose potential business when prospective guests are not able to secure reservations by phone at their convenience. Additionally, restaurants experience costly "no-shows" when guests fail to cancel their reservations because of the inconvenience of doing so over the phone.
3
- •
- Managing and preserving guest information is
difficult. One of the ways in which restaurants compete is by providing exceptional, personalized service, for example, by recognizing
repeat diners and recalling their preferences or special occasions. Guest histories and preferences are typically stored in the memories of the maitre d' or host, and therefore the implications of
losing a staff member who is familiar with a restaurant's best and most frequent guests are considerable. In an industry characterized by a high rate of employee turnover, the ability to preserve and
transfer this information is critical.
- •
- Information technology resources to install and support computer-based systems are
limited. Few restaurants have the technical knowledge, resources or time to install computer systems and troubleshoot problems with computer systems or Internet connectivity.
At the same time, the fast pace of business operations means that restaurants cannot tolerate service interruptions from an equipment or networking failure.
- •
- Marketing opportunities with measurable results are limited. Typically, restaurants promote themselves through magazines and newspapers as well as online dining guides and directories. However, restaurants generally do not have the ability to track the number of people who ultimately dine in response to their advertisements, nor are the costs of these advertisements tied to the number of diners they attract. Therefore, restaurants usually are unable to measure or compare the effectiveness of these marketing channels.
Diner Behavior and Trends
For many diners, part of the appeal of dining out is experiencing a variety of restaurants. Therefore, diners value sources that help them discover new restaurants and provide information about these restaurants. Historically, diners learned about restaurants through word of mouth and local print media, such as dining guides, newspapers and magazines. While diners continue to value personal recommendations, the Internet now puts a wealth of restaurant information at their fingertips. However, arguably the most important piece of information—what restaurants can accommodate a dining party—has been missing from online dining sources. As a result, when it comes to booking a restaurant reservation, diners have had to use the phone instead of the Internet.
Reserving by phone can be a highly inefficient and inconvenient process, requiring diners to call one restaurant at a time until they find an available reservation that meets their needs, and then make a reservation without knowing the full range of available choices. Phone reservations can only be secured during the restaurant's business hours. Diners who call when a restaurant is closed or during peak service hours oftentimes must leave a voicemail message and wait for the restaurant to call back. Diners who do get through to a reservationist may be put on hold or informed that there are no available tables at the desired time, requiring them to call another restaurant and repeat the process until they find a suitable reservation. Diners who need to change or cancel an existing reservation experience similar difficulties in doing so by phone.
The Internet has the potential to redefine the reservation experience for diners and streamline the operations and increase the return on marketing spend for reservation-taking restaurants. In order for diners to fully embrace online restaurant reservations, they need real-time access to table inventory across a broad selection of local restaurants and the ability to instantly book confirmed reservations around-the-clock.
Our Solution
Reservation-taking restaurants and diners have interconnected needs. Restaurants require cost-effective ways to attract guests and manage their reservations, while diners seek convenient ways to find available restaurants, choose among them and secure reservations. By creating an online network
4
of restaurants and diners that transact with each other through real-time reservations, we have developed a specialized platform for addressing the needs of both.
Essential to this network is building a critical mass of local, computerized restaurant reservation books. We achieve this by offering software that provides important operational benefits for the restaurant, bundling it with computer hardware and installing this solution at the restaurant host stand, thereby creating a compelling solution for restaurants. We sell our solutions to individual restaurants within a market, typically one by one, via a direct sales force. We believe that we deliver a strong return on investment for our restaurant customers by streamlining their operations, filling additional seats and improving their quality of service. As a result, we have historically enjoyed high customer satisfaction and retention rates.
The OpenTable website gives diners real-time access to tables at restaurants on the OpenTable network. As more local restaurants are added to the network, the utility provided to diners increases and more diners discover the benefits of researching restaurants and making reservations on our website. The more diners who use our website to make their dining decisions, the more value we deliver to our restaurant customers and the more restaurants are attracted to our network.
Benefits of OpenTable to Reservation-Taking Restaurants
In response to the needs of reservation-taking restaurants, we offer the OpenTable ERB, an integrated solution consisting of proprietary OpenTable software which is installed on a touchscreen computer system and supported by various asset-protection and security tools. Additionally, we provide restaurants with access to diners via our website as well as through our mobile applications and our partners' websites. Participation in the OpenTable network helps restaurants:
- •
- Fill seats that might otherwise remain empty. We help
restaurants fill their seats and minimize "no-shows" by offering the convenience of online reservations directly through the OpenTable website as well as indirectly through the websites of
our partners and restaurant customers, all of which are stored in the ERB. In addition, restaurants may elect to be featured in OpenTable marketing programs, which drive incremental business to
participating restaurants through enhanced listings on the OpenTable website. Participating restaurants pay OpenTable a premium per-seated diner fee for diners seated in response to
these special listings.
- •
- Create operational efficiencies by automating reservations and table
management. The reservation module of the ERB replaces the restaurant's pen-and-paper system with a computerized
reservation book that records and tracks all reservations (online, phone and walk-in) in the same system, thereby improving accuracy and efficiency. Floor management capabilities improve
operational efficiencies by helping restaurants maximize seat utilization, facilitate server rotations and improve table turns.
- •
- Boost guest recognition and overall guest service. The
integrated guest-management database included in the ERB enables restaurant staff to record diner preferences and histories in order to recognize repeat diners and provide them with personalized
service. The ERB also includes email capabilities which provide restaurants with a cost-effective channel to reach and attract repeat diners. Additionally, we help restaurants monitor
customer satisfaction by collecting and delivering guest feedback from OpenTable diners.
- •
- Computerize host-stand operations with customized, on-site installation and training and technical support. We install our ERB, which combines proprietary software and computer hardware, at the restaurant, verifying Internet connectivity, configuring the system for the restaurant's unique needs and training staff members on its use. We monitor Internet connectivity and assist the restaurant in resolving connectivity issues. Additionally, we perform nightly data backups that enable us to restore the reservation book if necessary, and we provide around-the-clock technical support.
5
- •
- Market to a targeted audience with measurable results. Our website enables diners to find restaurants that can accommodate them, giving restaurants valuable marketing exposure during the diners' decision-making process. Moreover, restaurants pay OpenTable only for those diners whom they ultimately serve, unlike other marketing channels such as magazines, newspapers and online dining guides and directories. Consequently, restaurants know the number of diners acquired through OpenTable and the costs of acquiring each of these diners.
Benefits of OpenTable to Diners
In response to the needs of diners, we offer the OpenTable website, a destination website for those seeking a convenient way to research restaurants and make reservations. Additionally, we offer mobile applications for a variety of smartphone platforms. Our website and mobile applications enable diners to:
- •
- Find available tables. Diners can search for reservations
by location, date, time and party size and view table availability across a variety of restaurants. Because our website connects directly to the thousands of ERBs residing at OpenTable restaurants,
reservation search results reflect real-time availability.
- •
- Choose a restaurant. In response to their searches on our
website or via our mobile applications, diners are presented with a list of restaurants with available reservations at their desired dining times. Diners may also click on a restaurant listing to view
additional information, including restaurant descriptions, photos and menus. While making their restaurant choices, diners using our website may also consult the OpenTable Diners' Choice lists that
highlight restaurants that are most highly rated by OpenTable diners, for example, Best Overall, Best Italian, Most Romantic or Good for Groups.
- •
- Book instantly confirmed reservations for free. When a diner reserves through the OpenTable website or mobile applications, the reservation is instantly recorded in the ERB located at the restaurant—the same system in which the host would record a phone reservation. Diners can also change or cancel reservations online as well as invite guests via email. Diners receive on-screen and email messages confirming their reservation details. Additionally, registered diners can earn Dining Reward Points when they make and honor OpenTable reservations. Points can be redeemed for Dining Checks that are accepted at OpenTable restaurant customers.
Our Strategy
As our network of reservation-taking restaurants and diners grows, the value we deliver grows as well. Because the foundation of our network is building a critical mass of computerized reservation books, we enhance our offering to diners by adding new restaurant customers. In turn, as more diners use OpenTable to make their dining decisions and book their reservations, we deliver more value to our restaurant customers by helping them fill more of their seats. In this process, we grow the value of our business. The key elements of this strategy include:
Continue to Build the OpenTable Network in North America
The value of the OpenTable network grows as participation among restaurants and diners grows. Experience in our earliest markets provides a successful model that we have implemented while entering new markets, and, as a result, our newer markets in North America have grown relatively predictably over time. We intend to continue to build our North American network by employing this proven model.
- •
- Produce and maintain superior solutions. We continue to evolve our ERB based on nearly a decade of in-field experience as well as feedback from our installed base of approximately 12,000 restaurant customers. Additionally, we will continue to optimize our website through insights
6
- •
- Leverage our direct sales force. Over the last ten years,
we have expended considerable resources to build a direct sales force skilled at selling the benefits of OpenTable to reservation-taking restaurants, which operate in an industry that is highly
fragmented. We will continue to leverage our skilled direct sales force to add more restaurants to the network.
- •
- Provide excellent customer service and support. We believe
that our superior customer service is an integral component of high satisfaction rates among our restaurant customers and provides us with a deep understanding of restaurant needs and general industry
trends. We will continue to employ highly trained operational teams to provide installation and training services for our restaurant customers and augment our in-house support staff with
contract support services to deliver superior customer assistance.
- •
- Continue to attract diners to our website and mobile applications by offering the best reservation experience. We believe that providing the best diner reservation experience increases market adoption of our services, builds our brand awareness and drives word-of-mouth referrals to our website. We continue to enhance our website for ease of use and augment it with unique, helpful restaurant content. For example, we have begun to leverage the collective feedback of OpenTable diners to publish user-generated content that diners use while making restaurant choices. We will continue to evolve the diner reservation experience through usability testing and website analytics.
gained from the experience of seating approximately 130 million diners through online reservations.
Expand Internationally
We intend to augment our growing North American business by selectively expanding into countries outside of North America that are characterized by large numbers of online consumer transactions and reservation-taking restaurants. We currently have operations in Germany, Japan and the United Kingdom, each supported with a direct sales force and operational staff. We have approximately 1,500 restaurant customers in these markets. In general, our strategy internationally is to replicate the model we have successfully employed in North America. In particular, our initial focus in new international markets is to increase our restaurant customer base, and we believe the localized versions of our software solution will compete favorably against competitive software offerings, enabling us to expand our network of computerized reservation books across a broad selection of local restaurants.
Our Products
We have created a proprietary technology system comprised of stand-alone client-server applications located at each restaurant that connect via the Internet to our central servers which host our website. The distributed nature of this system design enables us to provide real-time solutions to our restaurant customers and to diners.
Restaurant Software and Hardware and Related Solutions
The ERB is an integrated solution consisting of proprietary OpenTable software that is installed on a dedicated, touchscreen computer system at the restaurant's host stand and supported by various asset-protection and security tools. The ERB supports reservation management, table and floor management, guest management, marketing and a number of other business processes. This functionality has evolved through eight major software releases over ten years based on feedback from and experience with thousands of restaurant customers. The software is built on a foundation that supports rapid translation into local languages.
7
We provide on-site installation, training and round-the-clock customer support for the ERB as part of our monthly subscription fee. We monitor Internet connectivity to the ERB, alerting restaurants when they are offline and working with them to resolve any problems we detect. We also provide data protection services, including managing firewalls and virus scanning software on all computers on our network to protect restaurants from harmful intrusions and performing nightly backups of each restaurant's database to prevent data loss in the event of a hardware failure. Our restaurant customers also receive a hardware replacement, populated with the restaurant's backed-up data, in the event of a computer failure, and software upgrades and updates, which are deployed automatically via the Internet to each ERB, requiring minimal interference with the restaurant's operations.
OpenTable Website
We design, build and operate the OpenTable website in North America and the United Kingdom as well as websites localized for Germany and Japan. Our system is a real-time reservation system with a patent pending on our high-speed inventory tracking and search technology. The OpenTable website maintains around-the-clock communications with restaurants on our online reservation network. As a result, any change made at the restaurant to the table inventory that affects the OpenTable website is updated on the website in real time, and diners using the website get current inventory information on every search request, typically in a few seconds.
OpenTable Mobile
In addition to the OpenTable website, we offer a version of the OpenTable website optimized for use on mobile devices as well as free mobile applications for use on Android, Blackberry, iPhone, and Palm smartphones. These mobile applications leverage the OpenTable network to enable diners on-the-go to view real-time table availability at restaurants in their vicinity and book a free, confirmed reservation. To date, more than 2,000,000 diners have been seated through reservations booked via OpenTable mobile applications.
OTRestaurant.com—Our Website for Restaurant Customers
We design, build and operate the OTRestaurant website, which serves as an information and services portal for our restaurant customers. The website provides restaurant customers with secure access to client-specific materials including detailed online reservation reports, online invoicing and feedback forms from recent diners. In addition, a restaurant can visit the OTRestaurant website to learn about upcoming OpenTable promotions, submit date-specific information such as Valentine's Day menus and update the profile information displayed on the OpenTable website such as restaurant description and hours of operation. The OTRestaurant website serves as a two-way communication channel between us and our restaurant customers, which ultimately improves the support we provide and drives increased operational efficiencies.
Sales and Marketing
Sales and Marketing to Restaurants
We employ a direct sales force of regional account executives. Our sales and marketing efforts focus on identifying qualified sales leads, communicating the benefits of computerizing the restaurant reservation book and filling seats through online reservations. Our marketing activities include lead generation, direct marketing, public relations and participation in trade shows and conferences.
Marketing to Diners
We generally benefit from significant word-of-mouth referrals and natural-search traffic to our website. We encourage repeat usage through our points-based loyalty program, OpenTable Dining
8
Rewards, which allows diners to earn Dining Points when they make and honor OpenTable reservations. We also optimize our website to improve our positioning in natural search engine results. To date, we have found limited value in print, broadcast, online or paid-search advertising, and, as a result, we do not purchase a material amount of marketing from those channels.
In addition to operating our own destination website and mobile applications, we work with hundreds of partners to enhance their restaurant listings with OpenTable online reservation capabilities. We also encourage our restaurant customers to incorporate OpenTable reservation capabilities into their own websites, which not only introduces diners to the convenience of online reservations but also helps restaurants fill more seats by providing around-the-clock reservation capabilities.
Customer Support
One of the reasons we enjoy high satisfaction among our restaurant customers is the quality of the support we provide. This support includes the following:
- •
- Implementation Services for Restaurants. Once the customer
agreement is signed, we contact the restaurant to begin the implementation process, including system installation and training. First, we complete a site survey to gather restaurant-specific
information such as table layouts, restaurant capacity, hours of operation, network and Internet connectivity setup, and other information necessary to properly set up the OpenTable system. During a
typical installation, we load the software onto OpenTable hardware, establish proper network connectivity, configure the system to a restaurant's specific needs, and train restaurant staff on the new
process.
- •
- Ongoing Restaurant Relationship Management. We work with
our restaurant customers to ensure that the restaurant realizes the full value of the system. For example, we assist restaurants in adjusting their reservation books to maximize capacity utilization,
enabling a restaurant's own website to take reservations, tracking guest preferences and marketing to their diners.
- •
- Restaurant Telephone Support. After the initial installation and training, restaurants may contact OpenTable via a toll-free number to receive technical support and follow-up training as part of our monthly service fee. Live telephone support is available 14 hours per day, seven days a week, with emergency support available around-the-clock.
- •
- Consumer Support for Website Users. Diners with questions about OpenTable have access to an online list of frequently asked questions, or FAQs, and can also email our support team via a web-based form. We use a commercially available email management system to queue, assign, track, escalate, categorize and report on these email inquiries.
Most routine support cases are handled by a U.S.-based third-party customer support partner. When necessary, the support partner escalates calls to our in-house support team located at our headquarters in San Francisco. Our support partner receives equivalent training and access to the same tools as the San Francisco support team.
Technology
Our technology infrastructure supports the network of restaurants and diners critical to our business.
Data Centers and Network Access
Our primary data center is hosted by a leading provider of hosting services in Santa Clara, California. We maintain a second data center in New Jersey for disaster recovery. Backup systems in the second data center can be brought online in the event of a failure in the primary data center.
9
The data center hosts the OpenTable website, the OTRestaurant website and intranet applications that are used to manage the website content. The websites are designed to be fault-tolerant, with a collection of identical web servers connecting to an enterprise database. The design also includes load balancers, firewalls and routers that connect the components and provide connections to the Internet. The failure of any individual component is not expected to affect the overall availability of our website.
Our system also includes a proprietary method of accessing website-relevant, real-time restaurant inventory from the data center, providing very fast response times. The system is designed to scale to accommodate the foreseeable growth in the number of restaurants and diners on our network.
Network Security
The data center and restaurant systems maintain real-time communication with proprietary, encrypted message protocols. We also use leading commercial antivirus, firewall and patch management technology to protect and maintain the systems located at the data center and at each restaurant.
Internal Management Systems
We have developed proprietary systems to ensure rapid, high-quality customer service, software development and website updates. ROMS is a system-integrated customer support application that gives us unique customer resource management tools designed specifically for the restaurant industry. It houses detailed restaurant customer information encompassing the entire customer lifecycle, including initiating a contract, installing the OpenTable system, issuing monthly bills, tracking restaurant inventory and providing ongoing support. In addition, ROMS leverages system-integrated tools allowing for remote technical diagnosis and repair, while operating under multi-tiered security protocols to ensure restaurant customer information is protected. The Customer Help and Restaurant Management system, or CHARM, is a proprietary web content management and consumer support tool that enables rapid website customization. Restaurant profiles, descriptions, maps, partner reviews, restaurant messaging and reservation parameter configurations are all driven out of CHARM.
Development
We devote a substantial portion of our resources to developing new solutions and enhancing existing solutions, conducting product testing and quality assurance testing, improving core technology and strengthening our technological expertise in the restaurant table management and reservation market. As of December 31, 2009, our technical group consisted of 73 employees, who are focused on new feature development for existing solutions and the design of new solutions. We also outsource a portion of our software development to a third-party service provider located in India. Additionally, our mobile website and application development efforts are partially outsourced to third-party mobile development firms. For the twelve month periods ended December 31, 2009, 2008, and 2007, technology expenses totaled $10.0 million, $9.5 million and $5.9 million, respectively.
Seasonality
The restaurant industry business is somewhat seasonal, with increases in dining at reservation-taking restaurants tied to certain holidays and restaurant-industry promotions. As a result, we typically experience higher sequential growth in diners seated during the first and fourth quarters, as compared with the second and third quarters.
Intellectual Property
Our success depends upon our ability to protect our core technology and intellectual property. To accomplish this, we rely on a combination of intellectual property rights, including trade secrets, patents, copyrights and trademarks, as well as contractual restrictions. We enter into confidentiality and
10
proprietary rights agreements with our employees, consultants and business partners, and we control access to and distribution of our proprietary information.
We have one issued patent which expires in 2020 and five patent applications pending in the United States. We have one patent application pending in India. We intend to pursue corresponding patent coverage in additional countries to the extent we believe such coverage is appropriate and cost effective.
Our registered trademarks in the United States, Japan and the European Union include "OpenTable" and the OpenTable logo. "OpenTable" is also registered in Canada, China, Mexico and Australia. "OpenTable.com" is also registered in the European Union. We have filed other trademark applications in the United States and certain other countries.
We are the registrant of the Internet domain name for our websites, www.opentable.com, www.otrestaurant.com and our international websites.
In addition to the foregoing protections, we generally control access to and use of our proprietary software and other confidential information through the use of internal and external controls, including contractual protections with employees, contractors, customers and partners. Our software is protected by United States and international copyright laws.
Competition
Competition for Reservation-Taking Restaurants
The primary competitor for the OpenTable ERB is the traditional pen-and-paper reservation book. Paper-based reservation books enjoy the advantage of being extremely familiar and simple; however, they are also time-consuming, error-prone, manual and not easily reproduced in case of loss or damage. Through our sales efforts, we explain the benefits of automation to restaurants including greater operational efficiency, superior guest recognition and service and the ability to fill additional seats by offering reservations over the Internet. Other companies attempt to address restaurant needs for computerized reservation management with a variety of technologies.
We believe the principal competitive factors in the market for computerized restaurant reservation management solutions include:
- •
- comprehensive reservation, table and guest management functionality;
- •
- ability to fill incremental seats for the restaurant;
- •
- ability to deliver strong return on investment for restaurant customers;
- •
- system responsiveness and ease-of-use;
- •
- on-site, custom system installation and training;
- •
- robust support; and
- •
- security, reliability and data protection.
In international markets that we entered more recently and where we have not yet achieved a high degree of penetration, we face more intense competition from local software-development and application service provider, or ASP, vendors. We believe that, over time, the advantages that have established us as a leading provider in North America will help us as we compete in international markets.
11
Competition for Diners
Our primary competitor for diners making reservations is the phone. The phone enjoys two inherent advantages over online reservations. First, every restaurant and diner has a phone. Second, making reservations by phone is a familiar, ingrained experience for diners.
In order to compete effectively with the phone, the OpenTable website must offer diners a critical mass of restaurants from which to choose and access to reservation inventory comparable to that available by phone. When combined with the growing number of restaurant customers, the OpenTable online reservation network achieves these requirements by communicating directly and in real time with the ERB maintained at each restaurant. Additionally, we offer diners all the conveniences and time savings associated with booking reservations online, including the ability to: book reservations around-the-clock, even when restaurants are closed; find available tables in real time across a selection of local restaurants; receive immediate confirmation of the reservation via email; change or cancel reservations online; and earn Dining Reward Points, redeemable for Dining Checks accepted by our restaurant customers.
Secondary competition comes from allocation-based reservation-taking websites that offer diners the ability to book reservations for a limited selection of restaurant table inventory. Participating restaurants identify specific reservations, generally at non-peak and unpopular times, which can be offered for booking via these allocation sites. Unlike OpenTable reservations which are immediately recorded in the ERB residing at the restaurant host stand, these allocation reservations are communicated to the restaurant by traditional phone and fax systems, email or web-based accounts that restaurants can check to access reservation requests. These methods are prone to errors, such as lost or double-booked reservations, and require additional effort on the part of restaurants. We believe the limited reservation inventory and unreliable reservation processing methods associated with these allocation-based websites limit their value proposition for diners.
Employees
As of December 31, 2009, we had 319 full-time employees including 101 in operations and support, 92 in sales and marketing, 73 in technology and 53 in general and administrative functions. None of our employees are covered by collective bargaining agreements. In addition, as of December 31, 2009, we had ten contractors who are full-time equivalents, including one in operations and support, two in sales and marketing, six in technology and one in general and administrative functions.
Available Information
We file reports with the Securities and Exchange Commission ("SEC"), including annual reports on Form 10-K, quarterly reports on Form 10-Q, current reports on Form 8-K and any other filings required by the SEC. We make available on our website (www.opentable.com) our annual report on Form 10-K, quarterly reports on Form 10-Q, current reports on Form 8-K, and all amendments to those reports as soon as reasonably practicable after such material is electronically filed with or furnished to the SEC. These materials are available free of charge on or through our website via the Investor Relations page at www.opentable.com. References to the Company's website address in this report are intended to be inactive textual references only, and none of the information contained on our website is part of this report or incorporated in this report by reference.
The public may read and copy any materials we file with the SEC at the SEC's Public Reference Room at 100 F Street, NE, Washington, DC 20549. The public may obtain information on the operation of the Public Reference Room by calling the SEC at 1-800-SEC-0330. The SEC maintains an Internet site (http://www.sec.gov) that contains reports, proxy and information statements, and other information regarding issuers that file electronically with the SEC.
12
Investing in our common stock involves a high degree of risk. You should carefully consider the risks described below and the other information in this Annual Report on Form 10-K. If any of such risks actually occur, our business, operating results or financial condition could be adversely affected. In those cases, the trading price of our common stock could decline and you may lose all or part of your investment.
Our limited operating history makes it difficult for us to accurately forecast revenues and appropriately plan our expenses.
We were formed in October 1998 and have a limited operating history. As a result, it is difficult to accurately forecast our revenues and plan our operating expenses. We base our current and future expense levels on our operating forecasts and estimates of future revenues from restaurants, which pay us an installation fee for our Electronic Reservation Book, or ERB, a monthly subscription fee and a fee for each restaurant guest seated through online reservations. Revenues and operating results are difficult to forecast due to the uncertainty of the volume and timing of obtaining new restaurant customers and of diners seated through OpenTable reservations. Some of our expenses are fixed, and, as a result, we may be unable to adjust our spending in a timely manner to compensate for any unexpected shortfall in revenues. This inability could cause our net income in a given quarter to be lower than expected.
The impact of worldwide economic conditions, including the resulting effect on consumer spending, may adversely affect our business, operating results and financial condition.
Our performance is subject to worldwide economic conditions and their impact on levels of consumer spending, which may remain depressed, or be subject to further deterioration, for the foreseeable future. Some of the factors having an impact on discretionary consumer spending include general economic conditions, unemployment, consumer debt, reductions in net worth, residential real estate and mortgage markets, taxation, energy prices, interest rates, consumer confidence and other macroeconomic factors. Consumer purchases of discretionary items generally decline during recessionary periods and other periods in which disposable income is adversely affected. Because spending for restaurant dining is generally considered to be discretionary, declines in consumer spending may have a more negative effect on our business than on those businesses that sell products or services considered to be necessities. In particular, a significant majority of our restaurant customers are fine-dining restaurants which have been particularly affected by economic downturns such as the one we are currently experiencing.
Unfavorable changes in the above factors or in other business and economic conditions affecting our restaurant customers and diners could result in continued reduced traffic in some or all of the restaurants that use our solutions, result in fewer reservations made through our website or the websites of our partners or restaurant customers and lower our profit margins, cause our restaurant customers to go out of business, cause our restaurant customers to terminate their subscriptions to our solutions or default on their payment obligations to us and have a material adverse effect on our financial condition and operating results.
Moreover, the majority of our restaurant customers are located in major metropolitan areas like New York City and the San Francisco Bay Area, and to the extent any one of these geographic areas experiences any of the above described conditions to a greater extent than other geographic areas, the material adverse effect on our financial condition and operating results could be exacerbated.
13
We expect a number of factors to cause our operating results to fluctuate on a quarterly and annual basis, which may make it difficult to predict our future performance.
Our revenues and operating results could vary significantly from quarter to quarter and year to year because of a variety of factors, many of which are outside of our control. As a result, comparing our operating results on a period-to-period basis may not be meaningful. In addition to other risk factors discussed in this section, factors that may contribute to the variability of our quarterly and annual results include:
- •
- our ability to accurately forecast revenues and appropriately plan our expenses;
- •
- the impact of worldwide economic conditions, including the resulting effect on consumer spending;
- •
- our ability to maintain an adequate rate of growth;
- •
- our ability to effectively manage our growth;
- •
- our ability to attract new restaurant customers;
- •
- our ability to increase the number of visitors to our website and convert those visitors into diners who reserve a table
using our website and then dine with our restaurant customers;
- •
- our ability to retain existing restaurant customers and diners or encourage repeat reservations;
- •
- our ability to provide a high-quality customer experience through our website and ERB;
- •
- our ability to successfully enter new markets and manage our international expansion;
- •
- the impact of fluctuations in currency exchange rates;
- •
- the effects of increased competition in our business;
- •
- our ability to keep pace with changes in technology and our competitors;
- •
- our ability to successfully manage any acquisitions of businesses, solutions or technologies;
- •
- the success of our marketing efforts;
- •
- changes in consumer behavior and any related impact on the restaurant industry, especially in the geographic markets where
we operate;
- •
- seasonal patterns in restaurant dining;
- •
- interruptions in service and any related impact on our reputation;
- •
- the attraction and retention of qualified employees and key personnel;
- •
- our ability to protect our intellectual property, including our proprietary ERB;
- •
- costs associated with defending intellectual property infringement and other claims;
- •
- the effects of natural or man-made catastrophic events;
- •
- the effectiveness of our internal controls; and
- •
- changes in government regulation affecting our business.
As a result of these and other factors, the results of any prior quarterly or annual periods should not be relied upon as indications of our future operating performance. In addition, our operating results may not meet the expectations of investors or public market analysts who follow our company.
14
Our recent growth rate will likely not be sustainable and a failure to maintain an adequate growth rate will adversely affect our net income and our business.
Our revenues have grown rapidly, increasing from $27.2 million in 2006 to $41.1 million in 2007, to $55.8 million in 2008, to $68.6 million in 2009, representing a compound annual growth rate of 36%. We do not expect to sustain our recent growth rate in future periods, and you should not rely on the revenue growth of any prior quarterly or annual periods as an indication of our future performance. If we are unable to maintain adequate revenue growth, our net income will be adversely affected, and we may not have adequate resources to execute our business strategy.
Growth may place significant demands on our management and our infrastructure.
We have experienced substantial growth in our business. This growth has placed and may continue to place significant demands on our management and our operational and financial infrastructure. As our operations grow in size, scope and complexity, we will need to improve and upgrade our systems and infrastructure to offer an increasing number of customers enhanced solutions, features and functionality. The expansion of our systems and infrastructure will require us to commit substantial financial, operational and technical resources in advance of an increase in the volume of business, with no assurance that the volume of business will increase. Continued growth could also strain our ability to maintain reliable service levels for our customers, develop and improve our operational, financial and management controls, enhance our reporting systems and procedures and recruit, train and retain highly skilled personnel.
Managing our growth will require significant expenditures and allocation of valuable management resources. If we fail to achieve the necessary level of efficiency in our organization as it grows, our business, operating results and financial condition would be harmed.
If we fail to increase the number of our customers or retain existing customers, our revenues and our business will be harmed.
In the twelve months ended December 31, 2009 almost all of our revenues were generated by our restaurant customers, who pay us a one-time installation fee, a monthly subscription fee for our ERB and a fee for each restaurant guest seated through online reservations. Our growth depends in large part on increasing the number of our restaurant customers, increasing the number of visitors to our website and then converting those visitors into diners who use our website to make restaurant reservations. Either category of customers may decide not to continue to use our solutions in favor of other means of reserving tables or because of budgetary constraints or other reasons.
To grow our base of restaurant customers, we must convince prospective restaurant customers of the benefits of our ERB and related solutions and encourage them to forego the traditional pen-and-paper reservation book to which they are likely accustomed. Due to the fragmented nature of the restaurant industry, many prospective restaurant customers may not be familiar with our solutions and will generally favor using more traditional methods of taking reservations.
To increase the number of diners who use our website, we must convince them of the value of our solutions. Our ability to do so is driven in large part by increasing the number of restaurant listings available on our website and also by making the diner's visit to our website a convenient and user-friendly experience.
We cannot assure you that we will be successful in continuing to expand our restaurant customer base or in continuing to attract diners to make reservations on our website. Our future sales and marketing efforts may be ineffective. If diners choose not to use our solutions or decrease their use of our solutions or we are unable to attract new diners, listings on our website could be reduced, search activity on our website could decline, the usefulness of our solutions could be diminished and we could experience declining revenues.
15
We may be unable to successfully execute our business strategy if we fail to continue to provide our customers with a high-quality customer experience.
A critical component of our strategy is providing a high-quality customer experience for both restaurants and diners. Accordingly, the effective performance, reliability and availability of our ERB, website and network infrastructure are critical to our reputation and our ability to attract and retain customers. In order to provide a high-quality customer experience, we have invested and will continue to invest substantial resources in our ERB, website development and functionality and customer service operations. If we do not continue to make such investments and as a result, or due to other reasons, fail to provide a high-quality customer experience, we may lose restaurants and diners from our network, which could significantly decrease the value of our solutions to both groups. Moreover, failure to provide our customers with high-quality customer experiences for any reason could substantially harm our reputation and adversely affect our efforts to develop as a trusted website.
We may be unsuccessful in expanding our operations internationally, which could harm our business, operating results and financial condition.
In 2004, we established our European headquarters in London and expanded our North American presence in Canada. In 2006, we opened an office in Tokyo and further expanded our North American presence in Mexico. In 2007, we expanded our European presence with offices in France, Germany and Spain. Our ability to expand internationally involves various risks, including the need to invest significant resources in such expansion, the possibility that returns on such investments will not be achieved in the near future and competitive environments with which we are unfamiliar. Our international operations may not prove to be successful in certain markets. For example, in 2008, we decided to close our offices in France and Spain. In addition, we have incurred and expect to continue to incur significant expenses in advance of generating material revenues as we attempt to establish our presence in particular international markets. Our current and any future international expansion plans we choose to undertake will require management attention and resources and may be unsuccessful. We do not have substantial experience in selling our solutions in international markets or in conforming to the local cultures, standards or policies necessary to successfully compete in those markets, and we must invest significant resources in order to build a direct sales force and operational infrastructure in such markets. Furthermore, in many international markets we are not the first entrant and there exists greater competition with stronger brand names than we have faced in North American markets. Our ability to expand internationally will also be limited by the demand for our solutions and the adoption of the Internet in these markets. Different privacy, censorship and liability standards and regulations and different intellectual property laws in foreign countries may cause our business and operating results to suffer.
Any future international operations may also fail to succeed due to other risks inherent in foreign operations, including:
- •
- difficulties or delays in acquiring a network of restaurant customers in one or more international markets;
- •
- different restaurant preferences and dining patterns than those in North America;
- •
- varied, unfamiliar and unclear legal and regulatory restrictions;
- •
- unexpected changes in international regulatory requirements and tariffs;
- •
- legal, political or systemic restrictions on the ability of U.S. companies to market services or otherwise do business in
foreign countries;
- •
- less extensive adoption of the Internet as a commerce medium or information source and increased restriction on the content of websites;
16
- •
- difficulties in staffing and managing foreign operations;
- •
- greater difficulty in accounts receivable collection;
- •
- currency fluctuations;
- •
- potential adverse tax consequences;
- •
- lack of infrastructure to adequately conduct electronic commerce transactions; and
- •
- price controls or other restrictions on foreign currency.
As a result of these obstacles, we may find it impossible or prohibitively expensive to expand internationally or we may be unsuccessful in our attempt to do so, which could harm our business, operating results and financial condition.
We face risks associated with currency exchange rate fluctuations.
For the twelve months ended December 31, 2009, we incurred approximately 20% of our operating expenses in pounds sterling, euros, yen and other foreign currencies, while most of our revenues were denominated in U.S. dollars. Conducting business in currencies other than U.S. dollars subjects us to fluctuations in currency exchange rates that could have a negative impact on our reported operating results. Fluctuations in the value of the U.S. dollar relative to other currencies affect our revenues, costs and expenses, and operating margins, and result in foreign currency transaction gains and losses. To date, we have not engaged in exchange rate hedging activities. Even if we were to implement hedging strategies to mitigate this risk, these strategies might not eliminate our exposure to foreign exchange rate fluctuations and would involve costs and risks of their own, such as ongoing management time and expertise, external costs to implement the hedging activities and potential accounting implications.
The markets for our solutions in North America may become more competitive, and there can be no certainty that we will maintain our current restaurant customers and diners or attract new restaurants and diners or that our operating margins will not be affected by competition.
We expect that the competitive environment for our solutions may become more intense as additional companies enter our North American markets. Currently, our primary competitors in North America are the pen-and-paper reservation book used by most restaurants and the phone used by diners. Secondary competitors include companies who provide computerized reservation management systems with a variety of technologies, as well as allocation-based reservation-taking websites that offer diners the ability to book reservations for a limited selection of restaurant table inventory. These secondary competitors may enhance their technologies to be more competitive, and additional competitors may enter our markets in North America. Any new competitors could have greater name recognition among restaurants and diners and greater financial, technical and marketing resources. Greater financial resources and product development capabilities may allow these competitors to respond more quickly to new or emerging technologies and changes in restaurant and diner requirements that may render our solutions obsolete. These competitors could introduce new solutions with competitive price and performance characteristics or undertake more aggressive marketing campaigns than ours. If we lose existing restaurant customers and diners or fail to attract new restaurants and diners as a result of increased competition, our business, operating results and financial condition could be adversely affected.
Rapid technological changes may render our technology obsolete or decrease the attractiveness of our solutions to our customers.
To remain competitive, we must continue to enhance and improve the functionality and features of our website and ERB. The Internet and the online commerce industry are rapidly changing. If
17
competitors introduce new solutions embodying new technologies, or if new industry standards and practices emerge, our existing website, technology and ERB may become obsolete. Our future success will depend on our ability to:
- •
- enhance our existing solutions;
- •
- develop and potentially license new solutions and technologies that address the increasingly sophisticated and varied
needs of our prospective customers; and
- •
- respond to technological advances and emerging industry standards and practices on a cost-effective and timely basis.
Developing our ERB, website and other technology entails significant technical and business risks. We may use new technologies ineffectively, or we may fail to adapt our website, transaction processing systems and network infrastructure to consumer requirements or emerging industry standards. For example, our website functionality that allows searches and displays of reservation availability is a critical part of our service, and it may become out-of-date or insufficient from our customers' perspective or in relation to the search and display functionality of our competitors' websites. If we face material delays in introducing new or enhanced solutions, our customers may forego the use of our solutions in favor of those of our competitors.
Acquisitions could disrupt our business and harm our financial condition and operating results.
Our success will depend, in part, on our ability to expand our offerings and markets and grow our business in response to changing technologies, customer demands and competitive pressures. In some circumstances, we may determine to do so through the acquisition of complementary businesses, solutions or technologies rather than through internal development, including, for example, our acquisition in October 2009 of substantially all of the assets of GuestBridge, Inc., or GuestBridge, a provider of guest management solutions. The identification of suitable acquisition candidates can be difficult, time-consuming and costly, and we may not be able to successfully complete identified acquisitions. Furthermore, even if we successfully complete an acquisition, such as the GuestBridge asset acquisition, we may not be able to successfully assimilate and integrate the business, technologies, solutions, personnel or operations of the company that we acquired, particularly if key personnel of an acquired company decide not to work for us. In addition, we may issue equity securities to complete an acquisition, which would dilute our stockholders' ownership and could adversely affect the price of our common stock. Acquisitions may also involve the entry into geographic or business markets in which we have little or no prior experience. Consequently, we may not achieve anticipated benefits of the acquisitions which could harm our operating results.
We rely on our marketing efforts to attract new customers and must do so in a cost-effective manner; otherwise our operations will be harmed.
A significant component of our business strategy is the promotion of the OpenTable website and ERB. We believe that the attractiveness of our solutions to our current and potential customers, both restaurants and diners, will increase as new restaurants provide additional restaurant listings and diners increasingly use our website to conduct searches and make restaurant reservations. This is because an increase in the number of restaurant listings and the number of diners searching those listings increases the utility of our website and its associated search, listing and reservation services. If we do not continue to grow the use of our website and ERB, we may fail to build the critical mass of both restaurant customers and diners required to substantially increase our revenues.
While our marketing efforts do not currently involve significant expenditures, in the future we may find it necessary to invest more heavily in direct marketing or online or traditional advertising. If we are unable to effectively market our solutions to new customers or are unable to do so in a cost-effective manner, our operating results could be adversely affected.
18
System interruptions that impair access to our website would damage our reputation and brand and substantially harm our business and operating results.
The satisfactory performance, reliability and availability of our ERB, website and network infrastructure are critical to our reputation, our ability to attract and retain both restaurant customers and diners and our ability to maintain adequate customer service levels. Any systems interruption that results in the unavailability of our website or any restaurant connected to our website could result in negative publicity, damage our reputation and brand and cause our business and operating results to suffer. We may experience temporary system interruptions (either to our website or at our restaurant customer locations) for a variety of reasons, including network failures, power failures, software errors or an overwhelming number of visitors trying to reach our website during periods of strong demand. In addition, our primary data center is hosted by a third-party. Because we are dependent in part on third parties for the implementation and maintenance of certain aspects of our systems and because some of the causes of system interruptions may be outside of our control, we may not be able to remedy such interruptions in a timely manner, or at all.
We depend on key and highly skilled personnel to operate our business, and if we are unable to retain our current personnel or hire additional personnel our ability to develop and successfully market our business could be harmed.
We believe our future success will depend in large part upon our ability to attract and retain highly skilled managerial, technical, finance, creative and sales and marketing personnel. Moreover, we believe that our future success is highly dependent on the contributions of our named executive officers. All of our U.S. officers and other employees are at-will employees, which means they may terminate their employment relationship with us at any time, and their knowledge of our business and industry would be extremely difficult to replace. In addition, the loss of any key employees or the inability to attract or retain qualified personnel could delay the development and introduction of, and harm our ability to sell, our solutions and harm the market's perception of us. Competition for qualified personnel is particularly intense in the San Francisco Bay Area, where our headquarters are located. Further, our principal overseas operations are based in London and Tokyo, which are cities that, similar to our headquarters region, have high costs of living and consequently high compensation standards. Qualified individuals are in high demand, and we may incur significant costs to attract them. We may be unable to attract and retain suitably qualified individuals who are capable of meeting our growing sales, operational and managerial requirements, or may be required to pay increased compensation in order to do so. If we are unable to attract and retain the qualified personnel we need to succeed, our business will suffer.
Volatility or lack of performance in our stock price may also affect our ability to attract and retain our key employees. Our named executive officers have become, or will soon become, vested in a substantial amount of stock or stock options. Employees may be more likely to leave us if the shares they own or the shares underlying their options have significantly appreciated in value relative to the original purchase prices of the shares or the exercise prices of the options, or if the exercise prices of the options that they hold are significantly above the market price of our common stock. If we are unable to retain our employees, our business, operating results and financial condition will be harmed.
Failure to adequately protect our intellectual property could substantially harm our business and operating results.
Because our business is heavily dependent on our intellectual property, including our proprietary software, the protection of our intellectual property rights is crucial to the success of our business. We rely on a combination of patent, trademark, trade secret and copyright law and contractual restrictions to protect our intellectual property. These afford only limited protection. Despite our efforts to protect our proprietary rights, unauthorized parties may attempt to copy aspects of our website features, software and functionality or obtain and use information that we consider proprietary, such as the technology used to operate our website, our content and our trademarks. Moreover, policing our
19
proprietary rights is difficult and may not always be effective. In particular, because we sell our solutions internationally, we may need to enforce our rights under the laws of countries that do not protect proprietary rights to as great an extent as do the laws of the United States.
We have registered "OpenTable" and our other trademarks as trademarks in the United States and in certain other countries. Competitors may adopt service names similar to ours, thereby impeding our ability to build brand identity and possibly leading to customer confusion. In addition, there could be potential trade name or trademark infringement claims brought by owners of other registered trademarks or trademarks that incorporate variations of the term OpenTable or our other trademarks. From time to time, we have acquired Internet domain names held by others when such names were causing consumer confusion or had the potential to cause consumer confusion.
We currently hold the "OpenTable.com" Internet domain name and various other related domain names. Domain names generally are regulated by Internet regulatory bodies. If we lose the ability to use a domain name in a particular country, we would be forced to either incur significant additional expenses to market our solutions within that country, including the development of a new brand and the creation of new promotional materials, or elect not to sell solutions in that country. Either result could substantially harm our business and operating results. The regulation of domain names in the United States and in foreign countries is subject to change. Regulatory bodies could establish additional top-level domains, appoint additional domain name registrars or modify the requirements for holding domain names. As a result, we may not be able to acquire or maintain the domain names that utilize the name OpenTable in all of the countries in which we currently conduct or intend to conduct business.
Litigation or proceedings before the U.S. Patent and Trademark Office or other governmental authorities and administrative bodies in the United States and abroad may be necessary in the future to enforce our intellectual property rights, to protect our patent rights, trade secrets and domain names and to determine the validity and scope of the proprietary rights of others. Our efforts to enforce or protect our proprietary rights may be ineffective and could result in substantial costs and diversion of resources and could substantially harm our operating results.
Assertions by third parties of infringement by us of their intellectual property rights could result in significant costs and substantially harm our business and operating results.
Other parties have asserted, and may in the future assert, that we have infringed their intellectual property rights. Such litigation may involve patent holding companies or other adverse patent owners who have no relevant product revenue, and therefore our own issued and pending patents may provide little or no deterrence. For example, on May 12, 2009, Mount Hamilton Partners, LLC, or Mount Hamilton, filed a patent infringement lawsuit against us in the United States District Court for the Northern District of California, seeking, among other things, a judgment that we have infringed a certain patent held by Mount Hamilton, an injunctive order against the alleged infringing activities and an award for damages. If an injunction is granted, it could force us to stop or alter certain of our business activities, such as certain aspects of the OpenTable Dining Rewards program. We could also be required to pay damages in an unspecified amount. Neither the outcome of the litigation nor the amount and range of potential damages or exposure associated with the litigation can be assessed with certainty.
Furthermore, we cannot predict whether assertions of third-party intellectual property rights or claims arising from such assertions will substantially harm our business and operating results. We are currently involved in the defense of the alleged infringement claims of Mount Hamilton. The defense of these claims and any future infringement claims of Mount Hamilton or another party, whether they are with or without merit or are determined in our favor, may result in costly litigation and diversion of technical and management personnel. Furthermore, an adverse outcome of a dispute may require us to pay damages, potentially including treble damages and attorneys' fees, if we are found to have willfully infringed a party's patent or copyright rights; cease making, licensing or using solutions that are alleged to incorporate the intellectual property of others; expend additional development resources to redesign
20
our solutions; and enter into potentially unfavorable royalty or license agreements in order to obtain the right to use necessary technologies. Royalty or licensing agreements, if required, may be unavailable on terms acceptable to us, or at all. In any event, we may need to license intellectual property which would require us to pay royalties or make one-time payments.
We depend in part on licenses of technologies from third parties in order to deliver our solutions, and, as a result, our business is dependent in part on the availability of such licenses on commercially reasonable terms.
We currently, and will continue to, license certain technologies from third parties. We cannot be certain that these third-party content licenses will be available to us on commercially reasonable terms or that we will be able to successfully integrate the technology into our solutions. These third-party in-licenses may expose us to increased risk, including risks associated with the assimilation of new technology sufficient to offset associated acquisition and maintenance costs. The inability to obtain any of these licenses could result in delays in solution development until equivalent technology can be identified and integrated. Any such delays in services could cause our business, operating results and financial condition to suffer.
Confidentiality agreements with employees and others may not adequately prevent disclosure of trade secrets and other proprietary information.
We have devoted substantial resources to the development of our proprietary technology, including the proprietary software component of our ERB, and related processes. In order to protect our proprietary technology and processes, we rely in part on confidentiality agreements with our employees, licensees, independent contractors and other advisors. These agreements may not effectively prevent disclosure of confidential information and may not provide an adequate remedy in the event of unauthorized disclosure of confidential information. In addition, others may independently discover trade secrets and proprietary information, and in such cases we could not assert any trade secret rights against such parties. Costly and time-consuming litigation could be necessary to enforce and determine the scope of our proprietary rights, and failure to obtain or maintain trade secret protection could adversely affect our competitive business position.
Our failure to protect the confidential information of our customers and our network against security breaches could damage our reputation and brand and substantially harm our business and operating results.
Currently, some of our restaurant customers require that diners enter their credit card information to hold a reservation. We rely on encryption and authentication technology licensed from third parties to effect secure transmission of confidential information, including credit card numbers. Advances in computer capabilities, new discoveries in the field of cryptography or other developments may result in a compromise or breach of the technology used by us to protect customer transaction data. Any such compromise of our security could damage our reputation and brand and expose us to a risk of loss or litigation and possible liability which would substantially harm our business and operating results. We may need to expend significant resources to protect against security breaches or to address problems caused by breaches.
We rely on a third-party customer support service provider for the majority of our customer service calls. If this service provider experiences operational difficulties or disruptions, our business could be adversely affected.
We depend on a U.S.-based third-party customer support service provider to handle most of our routine support cases. While we have a small customer service center in our San Francisco headquarters, if our customer support service provider experienced operational difficulties, our ability to respond to customer service calls in a timely manner and the quality of our customer service would
21
be adversely affected, which in turn could affect our reputation and results of operations. While we have a contract with our customer support service provider, either party may terminate the contract for convenience by providing the other party at least 90 days prior notice of its intent to terminate. If for any reason our relationship with our customer support service provider were to end, it would require a significant amount of time to either scale up our San Francisco call center or to hire and train a new customer support service provider.
We outsource a portion of our software development to a third-party service provider located in India. Any interruption in our relationship with this service provider could adversely affect our business.
If for any reason our relationship with our third-party software development service provider were to end, it would require a significant amount of time to transition the software development work either in-house or to a new third-party service provider. Our contract with this software development service provider has a term ending on December 21, 2010. Either party may terminate the contract at any time by providing the other party at least 30 days prior notice of its intent to terminate. If our third-party software development service provider fails to perform its obligations in a timely manner or at satisfactory quality levels, our ability to bring solutions to market and our reputation could suffer. In addition, our third-party software development service provider is located in India and, as a result, may be subject to geopolitical uncertainty.
We may require additional capital to respond to business opportunities, challenges, acquisitions or unforeseen circumstances. If such capital is not available to us, our business, operating results and financial condition may be harmed.
We may require additional capital to expand our business. However, additional funds may not be available when we need them, on terms that are acceptable to us, or at all. For example, any debt financing secured by us in the future could involve restrictive covenants relating to our capital raising activities and other financial and operational matters, which may make it more difficult for us to obtain additional capital and to pursue business opportunities, including potential acquisitions. If we do not have funds available to enhance our solutions, maintain the competitiveness of our technology or pursue business opportunities, we may not be able to service our existing customers or acquire new customers. In addition, if we do not have funds available to make strategic acquisitions, we may not be able to expand our business. The inability to raise additional capital could have an adverse effect on our business, operating results and financial condition.
If we issue additional shares of common stock to raise capital, it may have a dilutive effect on your investment.
If we raise additional capital through further issuances of equity or convertible debt securities, our existing stockholders could suffer significant dilution in their percentage ownership of us. Moreover, any new equity securities we issue could have rights, preferences and privileges senior to those of holders of our common stock.
A further tightening of the credit markets may have an adverse effect on our ability to obtain short-term debt financing.
The recent deterioration of the global economy threatens to cause further tightening of the credit markets, more stringent lending standards and terms and higher volatility in interest rates. Persistence of these conditions could have a material adverse effect on our access to short-term debt and the terms and cost of that debt. As a result, we may not be able to secure additional financing in a timely manner, or at all, to meet our future capital needs which may have an adverse effect on our business, operating results and financial condition.
22
Our business is subject to the risks of earthquakes, fires, floods and other natural catastrophic events and to interruption by man-made problems such as computer viruses or terrorism.
Our systems and operations are vulnerable to damage or interruption from earthquakes, fires, floods, power losses, telecommunications failures, terrorist attacks, acts of war, human errors, break-ins and similar events. For example, a significant natural disaster, such as an earthquake, fire or flood, could have a material adverse impact on our business, operating results and financial condition, and our insurance coverage may be insufficient to compensate us for losses that may occur. Our U.S. corporate offices and the facility we lease to house our computer and telecommunications equipment are located in the San Francisco Bay Area, a region known for seismic activity. In addition, acts of terrorism, which may be targeted at metropolitan areas which have higher population density than rural areas, could cause disruptions in our or our restaurant customers' businesses or the economy as a whole. Our servers may also be vulnerable to computer viruses, break-ins and similar disruptions from unauthorized tampering with our computer systems, which could lead to interruptions, delays, loss of critical data or the unauthorized disclosure of confidential customer data. We may not have sufficient protection or recovery plans in certain circumstances, such as natural disasters affecting the San Francisco Bay Area, and our business interruption insurance may be insufficient to compensate us for losses that may occur. As we rely heavily on our servers, computer and communications systems and the Internet to conduct our business and provide high quality customer service, such disruptions could negatively impact our ability to run our business and either directly or indirectly disrupt our restaurant customers' businesses, which could have an adverse affect on our business, operating results and financial condition.
Outbreaks of pandemic or contagious diseases, such as H1N1 (swine) flu, avian flu and severe acute respiratory syndrome (SARS), may adversely affect our business, operating results and financial condition.
Our business and operations could be materially and adversely affected by the H1N1 (swine) flu, avian flu, severe acute respiratory syndrome, or SARS, or other similar adverse public health development that causes people to refrain, or prevents people, from dining at restaurants. From April 2009, there have been outbreaks of swine flu, caused by the H1N1 virus, in many regions of the world, including the United States and other countries in which we operate, which has affected the businesses of certain of our restaurant customers. For example, while it did not have a material effect on our business, in April 2009, all of the restaurants in Mexico City, including our restaurant customers there, were closed for a period of approximately two weeks due to the H1N1 (swine) flu. In addition, in recent years some Asian countries have experienced an outbreak of a highly contagious form of atypical pneumonia now known as SARS, and also encountered incidents of the H5N1 strain of influenza, or avian flu.
The H1N1 (swine) flu and any future outbreak of SARS, avian flu or other similar adverse public health development may, among other things, significantly disrupt our business. Furthermore, a prolonged recurrence of H1N1 (swine) flu, SARS, avian flu or another pandemic disease could result in a significant decline in demand for restaurant dining and materially and adversely affect our financial condition and results of operations by reducing traffic in some or all of the restaurants that use our solutions, reducing the number of reservations made through our website or the websites of our partners or restaurant customers, causing our restaurant customers to go out of business, or causing our restaurant customers to terminate their subscriptions to our solutions or default on their payment obligations to us.
As a public company, we incur significant increased costs which may adversely affect our operating results and financial condition.
As a public company, we incur significant accounting, legal and other expenses that we did not incur as a private company, including costs associated with our public company reporting requirements.
23
We have also incurred, and anticipate that we will continue to incur, costs associated with corporate governance requirements, including requirements under the Sarbanes-Oxley Act of 2002, as well as rules implemented by the SEC and The Nasdaq Stock Market. Furthermore, these laws and regulations could make it more difficult or more costly for us to obtain certain types of insurance, including director and officer liability insurance, and we may be forced to accept reduced policy limits and coverage or incur substantially higher costs to obtain the same or similar coverage. The impact of these requirements could also make it more difficult for us to attract and retain qualified persons to serve on our board of directors, our board committees or as executive officers.
New laws and regulations as well as changes to existing laws and regulations affecting public companies, including the provisions of the Sarbanes-Oxley Act of 2002 and rules adopted by the SEC and by The Nasdaq Stock Market, would likely result in increased costs to us as we respond to their requirements. We are investing resources to comply with evolving laws and regulations, and this investment may result in increased general and administrative expenses and a diversion of management's time and attention from revenue-generating activities to compliance activities.
Seasonality may cause fluctuations in our financial results.
We generally experience some effects of seasonality due to increases in restaurant dining tied to certain holidays and restaurant industry promotions. As a result, we typically experience higher sequential growth in diners seated during the first and fourth quarters, as compared with the second and third quarters. Although historically our revenue has increased in each quarter as we have added restaurant customers and diners, in the future this seasonality may cause fluctuations in our financial results. In addition, other seasonality trends may develop and the existing seasonality and consumer behavior that we experience may change.
If use of the Internet, particularly with respect to online restaurant reservations, does not continue to increase as rapidly as we anticipate, our business will be harmed.
Our future net profits are substantially dependent upon the continued use of the Internet as an effective medium of business and communication by our target customers. Internet use may not continue to develop at historical rates, and consumers may not continue to use the Internet and other online services as a medium for commerce. In addition, the Internet may not be accepted as a viable long-term marketplace or resource for a number of reasons, including:
- •
- actual or perceived lack of security of information or privacy protection;
- •
- possible disruptions, computer viruses or other damage to Internet servers or to users' computers; and
- •
- excessive governmental regulation.
Our success will depend, in large part, upon third parties maintaining the Internet infrastructure to provide a reliable network backbone with the speed, data capacity, security and hardware necessary for reliable Internet access and services. Our business, which relies on a contextually rich website that requires the transmission of substantial data, is also significantly dependent upon the availability and adoption of broadband Internet access and other high-speed Internet connectivity technologies.
Government regulation of the Internet is evolving, and unfavorable changes could substantially harm our business and operating results.
We are subject to general business regulations and laws as well as regulations and laws specifically governing the Internet. Existing and future laws and regulations may impede the growth of the Internet or other online services. These regulations and laws may cover taxation, tariffs, user privacy, data
24
protection, pricing, content, copyrights, distribution, electronic contracts and other communications, consumer protection, broadband residential Internet access and the characteristics and quality of services. It is not clear how existing laws governing issues such as property ownership, sales and other taxes, libel and personal privacy apply to the Internet. Unfavorable resolution of these issues may substantially harm our business and operating results.
Risks Related to Owning Our Common Stock
Our stock price may be volatile, and the value of an investment in our common stock may decline.
An active, liquid and orderly market for our common stock may not be sustained, which could depress the trading price of our common stock. The price of our common stock has been, and is likely to continue to be, volatile, which means that it could decline substantially within a short period of time. For example, since shares of our common stock were sold in our initial public offering in May 2009 at a price of $20.00 per share, our closing stock price has ranged from $24.66 to $37.01. The trading price of our common stock may be subject to wide fluctuations in response to various factors, some of which are beyond our control, including:
- •
- our operating performance and the operating performance of similar companies;
- •
- the overall performance of the equity markets;
- •
- the number of shares of our common stock publicly owned and available for trading;
- •
- threatened or actual litigation;
- •
- changes in laws or regulations relating to our solutions;
- •
- any major change in our board of directors or management;
- •
- publication of research reports about us or our industry or positive or negative recommendations or withdrawal of research
coverage by securities analysts;
- •
- large volumes of sales of our shares of common stock; and
- •
- general political and economic conditions.
In addition, the stock market in general, and the market for Internet-related companies in particular, has experienced extreme price and volume fluctuations that have often been unrelated or disproportionate to the operating performance of those companies. Securities class action litigation has often been instituted against companies following periods of volatility in the overall market and in the market price of a company's securities. This litigation, if instituted against us, could result in very substantial costs, divert our management's attention and resources and harm our business, operating results and financial condition.
Our directors, executive officers and principal stockholders have substantial control over us and could delay or prevent a change in corporate control.
As of December 31, 2009, our directors, executive officers and holders of more than 5% of our common stock, together with their affiliates, beneficially owned, in the aggregate, approximately 73.82% of our outstanding common stock. Moreover, an individual partner of Benchmark Capital Partners IV, L.P., which beneficially owned approximately 16.89% of our outstanding common stock as of December 31, 2009, serves on our board of directors.
These stockholders, acting together, have the ability to control, or have significant influence over, the outcome of matters submitted to our stockholders for approval, including the election of directors and any merger, consolidation or sale of all or substantially all of our assets. In addition, these stockholders, acting together, have the ability to control, or have significant influence over, the
25
management and affairs of our company. Accordingly, this concentration of ownership might harm the market price of our common stock by:
- •
- delaying, deferring or preventing a change in corporate control;
- •
- impeding a merger, consolidation, takeover or other business combination involving us; or
- •
- discouraging a potential acquirer from making a tender offer or otherwise attempting to obtain control of us.
If securities or industry analysts publish inaccurate or unfavorable research about our business, our stock price and trading volume could decline.
The trading market for our common stock depends in part on the research and reports that securities or industry analysts publish about us or our business. If one or more of the analysts who cover us downgrade our stock or publish inaccurate or unfavorable research about our business, our stock price would likely decline. If one or more of these analysts cease coverage of our company or fail to publish reports on us regularly, demand for our stock could decrease, which might cause our stock price and trading volume to decline.
Our management will continue to have broad discretion over the use of the proceeds we received in our initial public offering and might not apply the proceeds in ways that increase the value of your investment.
Our management will continue to have broad discretion to use the net proceeds we received in our initial public offering. Our management might not apply the net proceeds from the initial public offering in ways that increase the value of our common stock. To date we have not utilized any of our proceeds from the initial public offering. We expect to use the net proceeds to us from the initial public offering for working capital and other general corporate purposes, including the funding of our marketing activities and the costs of operating as a public company, as well as further investment in the development of our proprietary technologies. We may also use a portion of the net proceeds for the acquisition of businesses, solutions and technologies that we believe are complementary to our own. We have not allocated the net proceeds from our initial public offering for any specific purposes. Until we use the net proceeds to us from the initial public offering, we plan to invest them, and these investments may not yield a favorable rate of return. If we do not invest or apply the net proceeds from the initial offering in ways that enhance stockholder value, we may fail to achieve expected financial results, which could cause our stock price to decline.
Certain provisions in our charter documents and Delaware law could discourage takeover attempts and lead to management entrenchment.
Our certificate of incorporation and bylaws contain provisions that could have the effect of delaying or preventing changes in control or changes in our management without the consent of our board of directors. These provisions include:
- •
- a classified board of directors with three-year staggered terms, which may delay the ability of stockholders
to change the membership of a majority of our board of directors;
- •
- no cumulative voting in the election of directors, which limits the ability of minority stockholders to elect director
candidates;
- •
- the exclusive right of our board of directors to elect a director to fill a vacancy created by the expansion of the board of directors or the resignation, death or removal of a director, which prevents stockholders from being able to fill vacancies on our board of directors;
26
- •
- the ability of our board of directors to determine to issue shares of preferred stock and to determine the price and other
terms of those shares, including preferences and voting rights, without stockholder approval, which could be used to significantly dilute the ownership of a hostile acquirer;
- •
- a prohibition on stockholder action by written consent, which forces stockholder action to be taken at an annual or
special meeting of our stockholders;
- •
- the requirement that a special meeting of stockholders may be called only by the chairman of the board of directors, the
chief executive officer or the board of directors, which may delay the ability of our stockholders to force consideration of a proposal or to take action, including the removal of directors; and
- •
- advance notice procedures that stockholders must comply with in order to nominate candidates to our board of directors or to propose matters to be acted upon at a stockholders' meeting, which may discourage or deter a potential acquirer from conducting a solicitation of proxies to elect the acquirer's own slate of directors or otherwise attempting to obtain control of us.
We are also subject to certain anti-takeover provisions under Delaware law. Under Delaware law, a corporation may not, in general, engage in a business combination with any holder of 15% or more of its capital stock unless the holder has held the stock for three years or, among other things, the board of directors has approved the transaction.
Our principal executive offices are located in San Francisco, California, in a 34,236 square-foot facility, under a lease expiring on April 30, 2013. We also have regional offices in Chicago, Illinois; Frankfurt, Germany; New York, New York; London, England; Mexico City, Mexico; and Tokyo, Japan.
On May 12, 2009, a patent infringement lawsuit was filed against us by Mount Hamilton Partners, LLC ("Mount Hamilton") in the United States District Court for the Northern District of California, seeking, among other things, a judgment that we have infringed a certain patent held by Mount Hamilton, an injunctive order against the alleged infringing activities and an award for damages. If an injunction is granted, it could force us to stop or alter certain of our business activities, such as certain aspects of the OpenTable Dining Rewards Program. We have denied Mount Hamilton's allegations and asserted counterclaims seeking judicial declarations that the Mount Hamilton patent is not infringed, is unenforceable and is invalid. On October 6, 2009, we filed a petition for reexamination with the U.S. Patent and Trademark Office ("PTO"), asking the PTO to reexamine the patent in question and requesting that the claims of the Mount Hamilton patent be cancelled. On October 21, 2009, we also filed a motion in the district court asking the court to stay the current litigation pending the outcome of the requested reexamination proceeding. On December 7, 2009, the PTO granted our petition for re-examination, and in its first non-final office action, rejected all of the claims of the patent at issue. In addition, the district court has stayed all proceedings pending re-examination of the patent. While we believe that we have substantial and meritorious defenses to these claims and intend to vigorously defend our position, neither the outcome of the litigation nor the amount and range of potential damages or exposure associated with the litigation can be assessed with certainty.
We are also subject to various other legal proceedings and claims arising in the ordinary course of business. Although occasional adverse decisions or settlements may occur, management believes that the final disposition of such matters will not have a material adverse effect on our business, financial position, results of operations or cash flows.
27
ITEM 5. MARKET FOR REGISTRANT'S COMMON EQUITY, RELATED STOCKHOLDER MATTERS AND ISSUER PURCHASES OF EQUITY SECURITIES
Our common stock has been quoted on the Nasdaq Global Market under the symbol "OPEN" since our initial public offering on May 21, 2009. Prior to this time, there was no public market for our common stock. The following table shows the high and low sale prices per share of our common stock as reported on the Nasdaq Global Market for the periods indicated:
| |
High | Low | |||||
|---|---|---|---|---|---|---|---|
Second Quarter 2009 (beginning May 21, 2009) |
$ | 35.50 | $ | 24.50 | |||
Third Quarter 2009 |
$ | 32.94 | $ | 25.84 | |||
Fourth Quarter 2009 |
$ | 28.06 | $ | 24.66 | |||
On March 11, 2010, the closing price as reported on The NASDAQ Global Market of our common stock was $35.95 per share. As of February 28, 2010, we had approximately 198 holders of record of our common stock.
We have never declared or paid, and do not anticipate declaring or paying, any cash dividends on our common stock. Any future determination as to the declaration and payment of dividends, if any, will be at the discretion of our board of directors and will depend on then existing conditions, including our financial condition, operating results, contractual restrictions, capital requirements, business prospects and other factors our board of directors may deem relevant.
Our equity plan information required by this item is incorporated by reference to the information in Part III, Item 12 of this Form 10-K.
28
Performance Graph
This performance graph shall not be deemed "soliciting material" or to be "filed" with the Securities and Exchange Commission for purposes of Section 18 of the Securities Exchange Act of 1934, as amended, or the Exchange Act, or otherwise subject to the liabilities under that Section, and shall not be deemed to be incorporated by reference into any filing of OpenTable, Inc. under the Securities Act of 1933, as amended, or the Exchange Act.
The following graph shows a comparison from May 21, 2009 (the date our common stock commenced trading on The Nasdaq Global Market) through December 31, 2009 of cumulative total return for our common stock, the Nasdaq Composite Index and the Nasdaq-100 Technology Sector Index. Such returns are based on historical results and are not intended to suggest future performance. Data for the Nasdaq Composite Index and the Nasdaq-100 Technology Sector Index assume reinvestment of dividends.
COMPARISON OF EIGHT MONTH CUMULATIVE TOTAL RETURN*
Among OpenTable, Inc, the NASDAQ Composite Index
And the NASDAQ-100 Technology Sector Index
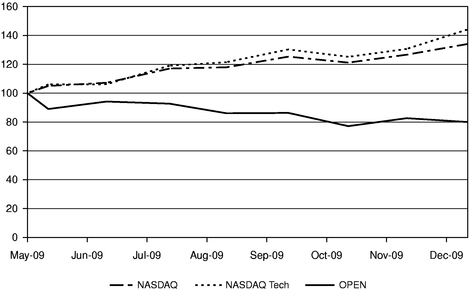
*$100 invested in stock on 5/21/09 in index—including reinvestment of dividends.
| |
05/21/09 | 05/31/09 | 06/30/09 | 07/31/09 | 08/31/09 | 09/30/09 | 10/31/09 | 11/30/09 | 12/31/09 | |||||||||||||||||||
|---|---|---|---|---|---|---|---|---|---|---|---|---|---|---|---|---|---|---|---|---|---|---|---|---|---|---|---|---|
|
||||||||||||||||||||||||||||
OpenTable, Inc. |
100 | 89 | 95 | 93 | 87 | 86 | 77 | 83 | 80 | |||||||||||||||||||
NASDAQ Composite Index |
100 | 105 | 108 | 117 | 119 | 125 | 121 | 127 | 134 | |||||||||||||||||||
NASDAQ-100 Technology Sector Index |
100 | 106 | 107 | 119 | 122 | 130 | 125 | 131 | 144 | |||||||||||||||||||
29
Recent Sales of Unregistered Securities
During the twelve months ended December 31, 2009, we granted options to purchase an aggregate of 150,979 shares of common stock at a weighted average exercise price of $26.31 per share to our employees.
Use of Proceeds
On May 21, 2009, our registration statement on Form S-1 (File No. 333-157034) was declared effective for our initial public offering, pursuant to which we registered the offering and sale of 1,572,684 shares of common stock by us and the associated sale of 1,427,316 shares of common stock by selling stockholders and the additional sale pursuant to the underwriters' over-allotment option for an additional 450,000 shares of common stock by us, at a public offering price of $20.00 per share. On May 27, 2009, we sold 2,022,684 shares of common stock, including 450,000 shares pursuant to the underwriters' over-allotment option, for an aggregate offering price of $40,453,680, and the selling stockholders sold 1,427,316 shares of common stock for an aggregate offering price of $28,546,320 and the offering terminated. The managing underwriter was Merrill Lynch & Co.
As a result of the offering, we received net proceeds of approximately $34.6 million, after deducting underwriting discounts and commissions reasonably estimated at $2.8 million and additional offering-related expenses reasonably estimated at $3 million, for total expenses reasonably estimated at $5.8 million. None of such payments were direct or indirect payments to any of our directors or officers or their associates or to persons owning 10 percent or more of our common stock or direct or indirect payments to others.
The net offering proceeds have been invested into short-term investment-grade securities and money market accounts.
There has been no material change in the planned use of proceeds from our initial public offering as described in our final prospectus filed with the SEC pursuant to Rule 424(b).
ITEM 6. SELECTED CONSOLIDATED FINANCIAL DATA
The data set forth below are qualified in their entirety by reference to, and should be read in conjunction with, "Management's Discussion and Analysis of Financial Condition and Results of Operations" and the consolidated financial statements, related notes and other financial information included elsewhere in this document. The consolidated statements of operations data for the years ended December 31, 2009, 2008 and 2007 and the consolidated balance sheets data as of December 31, 2009 and 2008 are derived from our audited consolidated financial statements included elsewhere in this report. The consolidated statements of operations data for the years ended December 31, 2006 and 2005 and the consolidated balance sheets data as of December 31, 2007, 2006 and 2005 are derived
30
from our audited consolidated financial statements not included in this report. Historical results are not necessarily indicative of the results to be expected in the future.
| |
Years Ended December 31, | |||||||||||||||||
|---|---|---|---|---|---|---|---|---|---|---|---|---|---|---|---|---|---|---|
| |
2009 | 2008 | 2007(2) | 2006(3) | 2005 | |||||||||||||
| |
(In thousands, except per share amounts) |
|||||||||||||||||
REVENUES |
$ | 68,596 | $ | 55,844 | $ | 41,148 | $ | 27,168 | $ | 16,715 | ||||||||
COSTS AND EXPENSES: |
||||||||||||||||||
Operations and support(1) |
20,736 | 17,760 | 12,603 | 9,548 | 8,016 | |||||||||||||
Sales and marketing(1) |
15,525 | 14,830 | 11,326 | 7,675 | 6,529 | |||||||||||||
Technology(1) |
10,043 | 9,511 | 5,863 | 4,024 | 2,969 | |||||||||||||
General and administrative(1) |
13,608 | 13,117 | 12,212 | 5,972 | 4,191 | |||||||||||||
Total costs and expenses |
59,912 | 55,218 | 42,004 | 27,219 | 21,705 | |||||||||||||
Income (loss) from operations |
8,684 | 626 | (856 | ) | (51 | ) | (4,990 | ) | ||||||||||
Other income, net |
346 | 468 | 951 | 421 | 323 | |||||||||||||
Income (loss) before taxes |
9,030 | 1,094 | 95 | 370 | (4,667 | ) | ||||||||||||
Income tax expense |
3,963 | 2,118 | (9,121 | ) | 176 | 0 | ||||||||||||
NET INCOME (LOSS) |
$ | 5,067 | $ | (1,024 | ) | $ | 9,216 | $ | 194 | $ | (4,667 | ) | ||||||
Net income (loss) per share: |
||||||||||||||||||
Basic |
$ | 0.28 | $ | (0.10 | ) | $ | 0.36 | $ | 0.00 | $ | (0.55 | ) | ||||||
Diluted |
$ | 0.22 | $ | (0.10 | ) | $ | 0.31 | $ | 0.00 | $ | (0.55 | ) | ||||||
Weighted average shares outstanding: |
||||||||||||||||||
Basic |
17,352 | 10,016 | 9,522 | 9,132 | 8,487 | |||||||||||||
Diluted |
22,467 | 10,016 | 10,943 | 9,132 | 8,487 | |||||||||||||
|
||||||||||||||||||
(1) Stock-based compensation included in above line items: |
||||||||||||||||||
Operations and support |
$ | 320 | $ | 339 | $ | 290 | $ | 58 | $ | 23 | ||||||||
Sales and marketing |
764 | 878 | 709 | 67 | 36 | |||||||||||||
Technology |
516 | 694 | 288 | 64 | 50 | |||||||||||||
General and administrative |
1,218 | 2,059 | 1,816 | 520 | 187 | |||||||||||||
|
$ | 2,818 | $ | 3,970 | $ | 3,103 | $ | 709 | $ | 296 | ||||||||
(2) Certain corrections have been made to previously reported Earnings Per Share amounts for the year ended December 31, 2007. See Note 2 of the accompanying notes to our consolidated financial statements. |
||||||||||||||||||
(3) Similar to the correction for the year ended December 31, 2007, certain corrections have been made to previously reported Earnings Per Share amounts for the year ended December 31, 2006. Basic and diluted net income per share for fiscal 2006 was previously reported as $0.02 and $0.01, respectively. |
||||||||||||||||||
Other Operational Data: |
||||||||||||||||||
Installed restaurants (at period end): |
||||||||||||||||||
North America |
10,850 | 9,295 | 7,391 | 5,583 | 3,873 | |||||||||||||
International |
1,501 | 1,040 | 470 | 204 | 71 | |||||||||||||
Total |
12,351 | 10,335 | 7,861 | 5,787 | 3,944 | |||||||||||||
Seated diners (in thousands): |
||||||||||||||||||
North America |
41,909 | 33,636 | 24,614 | 15,171 | 8,322 | |||||||||||||
International |
957 | 542 | 244 | 84 | 10 | |||||||||||||
Total |
42,866 | 34,178 | 24,858 | 15,255 | 8,332 | |||||||||||||
Headcount (at period end): |
||||||||||||||||||
North America |
256 | 238 | 192 | 152 | 143 | |||||||||||||
International |
63 | 59 | 34 | 16 | 9 | |||||||||||||
Total |
319 | 297 | 226 | 168 | 152 | |||||||||||||
Additional Financial Data: |
||||||||||||||||||
Revenues: |
||||||||||||||||||
North America |
$ | 64,751 | $ | 53,065 | $ | 39,601 | $ | 26,654 | $ | 16,618 | ||||||||
International |
3,845 | 2,779 | 1,547 | 514 | 97 | |||||||||||||
Total |
$ | 68,596 | $ | 55,844 | $ | 41,148 | $ | 27,168 | $ | 16,715 | ||||||||
Income (loss) from operations: |
||||||||||||||||||
North America |
$ | 14,591 | $ | 9,088 | $ | 4,974 | $ | 3,106 | $ | (3,373 | ) | |||||||
International |
(5,907 | ) | (8,462 | ) | (5,830 | ) | (3,157 | ) | (1,617 | ) | ||||||||
Total |
$ | 8,684 | $ | 626 | $ | (856 | ) | $ | (51 | ) | $ | (4,990 | ) | |||||
Depreciation and amortization: |
||||||||||||||||||
North America |
$ | 4,752 | $ | 4,026 | $ | 2,817 | $ | 2,029 | $ | 1,260 | ||||||||
International |
476 | 350 | 184 | 89 | 21 | |||||||||||||
Total |
$ | 5,228 | $ | 4,376 | $ | 3,001 | $ | 2,118 | $ | 1,281 | ||||||||
31
| |
December 31, | |||||||||||||||
|---|---|---|---|---|---|---|---|---|---|---|---|---|---|---|---|---|
| |
2009 | 2008 | 2007 | 2006 | 2005 | |||||||||||
| |
(In thousands) |
|||||||||||||||
Consolidated Balance Sheets Data: |
||||||||||||||||
Cash and cash equivalents |
$ | 19,807 | $ | 5,528 | $ | 21,661 | $ | 10,264 | $ | 8,076 | ||||||
Short-term investments |
50,221 | 17,259 | — | — | 504 | |||||||||||
Property and equipment, net |
11,516 | 11,125 | 8,378 | 6,019 | 4,619 | |||||||||||
Working capital |
61,788 | 14,745 | 9,759 | 5,655 | 5,389 | |||||||||||
Total assets |
100,331 | 50,883 | 45,814 | 21,124 | 17,248 | |||||||||||
Dining rewards payable |
11,611 | 8,462 | 5,836 | 3,499 | 2,021 | |||||||||||
Preferred stock |
— | 21,909 | 21,909 | 21,909 | 21,909 | |||||||||||
Total stockholders' equity |
73,405 | 26,684 | 22,485 | 8,907 | 8,324 | |||||||||||
32
ITEM 7. MANAGEMENT'S DISCUSSION AND ANALYSIS OF FINANCIAL CONDITION AND RESULTS OF OPERATIONS
You should read the following discussion of our financial condition and results of operations in conjunction with the financial statements and the notes thereto included elsewhere in this report. The following discussion contains forward-looking statements that reflect our plans, estimates and beliefs. Our actual results could differ materially from those discussed in the forward-looking statements. Factors that could cause or contribute to these differences include those discussed below and elsewhere in this report, particularly in "Risk Factors."
Overview
We provide solutions that form an online network connecting reservation-taking restaurants and people who dine at those restaurants. Our solutions include our proprietary Electronic Reservation Book, or ERB, for restaurant customers and www.opentable.com, a popular restaurant reservation website for diners. The OpenTable network includes approximately 12,000 OpenTable restaurant customers spanning all 50 states as well as select markets outside of the United States. Since our inception in 1998, we have seated approximately 130 million diners through OpenTable reservations; during the three months ended December 31, 2009, we seated an average of approximately four million diners per month. Restaurants pay us a one-time installation fee for onsite installation and training, a monthly subscription fee for the use of our software and hardware and a fee for each restaurant guest seated through online reservations. Our online restaurant reservation service is free to diners. For the twelve months ended December 31, 2009 and 2008, our net revenues were $68.6 million and $55.8 million, respectively. For the twelve months ended December 31, 2009 and 2008, our subscription revenues accounted for 52% and 54% of our total revenues, respectively, and our reservation revenues accounted for 43% and 41% of our total revenues, respectively.
In 2004, we began to selectively expand outside of North America into countries that are characterized by large numbers of online consumer transactions and reservation-taking restaurants. To date, we have concentrated our international efforts in Germany, Japan and the United Kingdom. Our revenues outside of North America for the twelve months ended December 31, 2009 and 2008, were $3.8 million and $2.8 million, respectively, or 6% and 5% of our total revenues, respectively. We intend to continue to incur substantial expenses in advance of recognizing material related revenues as we attempt to further penetrate our existing international markets and selectively enter new markets. Some international markets may fail to meet our expectations, and we may decide to realign our focus, as we did when we closed our offices in Spain and France in the fourth quarter of 2008.
Basis of Presentation
General
We report consolidated operations in U.S. dollars and operate in two geographic segments: North America and International. The North America segment is comprised of all of our operations in the United States, Canada and Mexico, and the International segment is comprised of all non-North America operations, which includes operations in Europe and Asia.
Revenues
We generate substantially all of our revenues from our restaurant customers; we do not charge any fees to diners. Our revenues include installation fees for our ERB (including training), monthly subscription fees and a fee for each restaurant guest seated through online reservations. Installation fees are recognized on a straight-line basis over an estimated customer life of approximately six years. Subscription revenues are recognized on a straight-line basis during the contractual period over which the service is delivered to our restaurant customers. Revenues from online reservations are recognized
33
on a transaction basis as the diners are seated by the restaurant. Revenues are shown net of redeemable Dining Points issued to diners as described in "Critical Accounting Policies and Estimates—Dining Rewards Loyalty Program" below.
Costs and Expenses
Operations and support. Our operations and support expenses consist primarily of payroll and related costs, including bonuses and stock-based compensation, for those employees associated with installation, support and maintenance for our restaurant customers, as well as costs related to our outsourced call center. Operations and support expenses also include restaurant equipment costs, such as depreciation of restaurant-related hardware, shipping costs related to restaurant equipment, restaurant equipment costs that do not meet the capitalization threshold, referral payments and website connectivity costs. Operations and support expenses also include amortization of capitalized website and development costs (see "Critical Accounting Policies and Estimates—Website and Software Development Costs" below). Also included in operations and support expenses are travel and related expenses incurred by the employees providing installation and support services for our restaurant customers, plus allocated facilities costs.
Sales and marketing. Our sales and marketing expenses consist primarily of salaries, benefits and incentive compensation for sales and marketing employees, including stock-based compensation. Also included are expenses for trade shows, public relations and other promotional and marketing activities, travel and entertainment expenses and allocated facilities costs.
Technology. Our technology expenses consist primarily of salaries and benefits, including bonuses and stock-based compensation, for employees and contractors engaged in the development and ongoing maintenance of our website, infrastructure and software, as well as allocated facilities costs.
General and administrative. Our general and administrative costs consist primarily of salaries and benefits, including stock-based compensation, for general and administrative employees and contractors involved in executive, finance, accounting, risk management, human resources and legal roles. In addition, general and administrative costs include consulting, legal, accounting and other professional fees. Bad debt, third-party payment processor, credit card, bank processing fees and allocated facilities costs are also included in general and administrative expenses.
Headcount consists of full-time equivalent employees, as well as full-time equivalent contractors, in all of the sections noted below.
Other Income, Net
Other income, net consists primarily of the interest income earned on our cash accounts. Foreign exchange gains and losses are also included in other income, net.
Income Taxes
We are subject to tax in the United States as well as other tax jurisdictions or countries in which we conduct business. Earnings from our non-U.S. activities are subject to local country income tax and may be subject to current U.S. income tax.
As of December 31, 2009, for federal and state tax purposes, we had $2.7 million of federal and $8.0 million of state net operating loss carryforwards available to reduce future taxable income. These net operating loss carryforwards begin to expire in 2025 and 2010 for federal and state tax purposes, respectively. Our ability to use our net operating loss carryforwards to offset any future taxable income will be subject to limitations attributable to equity transactions that resulted in a change of ownership as defined by Section 382 of the Internal Revenue Code of 1986, as amended, or the Internal Revenue Code. We have $15.0 million in unrecognized tax benefits primarily as a result of the limitations on our
34
net operating loss carryforwards. In the event that any unrecognized tax benefits are recognized, the effective tax rate will be affected. Approximately $14.3 million of the unrecognized tax benefit would impact the effective tax rate if recognized. Our policy is to classify interest accrued or penalties related to unrecognized tax benefits as a component of income tax expense.
Our net deferred tax assets consist primarily of net operating loss carryforwards generated before we achieved profitability and expenses related to our dining rewards points liability which are not deductible for income tax purposes until redeemed. During the fourth quarter of 2007, we concluded that it was more likely than not that we would be able to realize the benefit of these deferred tax assets in the future. Consequently, we recognized a net tax benefit of $9.4 million in the fourth quarter of 2007 resulting primarily from the release of substantially all of the net deferred tax valuation allowance. We based this conclusion on historical and projected operating performance, as well as our expectation that our operations will generate sufficient taxable income in future periods to be able to realize a portion of the tax benefits associated with the deferred tax assets. We will continue to assess the need for a valuation allowance on the deferred tax asset by evaluating both positive and negative evidence that may exist. Any adjustment to the deferred tax asset valuation allowance would be recorded in the income statement of the periods that the adjustment is determined to be required.
Critical Accounting Policies and Estimates
Our consolidated financial statements are prepared in accordance with U.S. Generally Accepted Accounting Principles (GAAP). The preparation of these consolidated financial statements requires us to make estimates and assumptions that affect the reported amounts of assets, liabilities, revenues, expenses and related disclosures. We evaluate our estimates and assumptions on an ongoing basis. Our estimates are based on historical experience and various other assumptions that we believe to be reasonable under the circumstances. Our actual results could differ from these estimates.
We believe that the assumptions and estimates associated with revenue recognition, the points-based loyalty program, website and software development costs, income taxes and stock-based compensation have the greatest potential impact on our consolidated financial statements. Therefore, we consider these to be our critical accounting policies and estimates. For further information on all of our significant accounting policies, please see Note 2 of the accompanying notes to our consolidated financial statements.
Revenue Recognition
Our revenues include installation fees for our ERB (including training), monthly subscription fees and a fee for each restaurant guest seated through online reservations. We provide our application as a service, and follow the provisions of Topic 605—Revenue Recognition (SEC Staff Accounting Bulletin No. 104, Revenue Recognition (SAB No. 104) and FASB Emerging Issues Task Force Issue No. 00-21, Revenue Arrangements with Multiple Deliverables (EITF No. 00-21)). We recognize revenue when all of the following conditions are met: there is persuasive evidence of an arrangement; the service has been provided to the customer; the collection of the fees is reasonably assured; and the amount of fees to be paid by the customer is fixed or determinable. Amounts paid by the customer include the right to use our hardware during the service period. Proportionate revenue related to the right to use our hardware accounts for less than 10% of revenues for the periods presented.
Revenues from the installation of our ERB are recognized on a straight-line basis over the estimated customer life, commencing with customer acceptance. The estimated customer life is approximately six years, based on historical restaurant customer termination activity. Estimates made by us may differ from actual customer lives. These differences may materially impact installation and other revenue by increasing or decreasing revenue, depending on whether the estimated customer life decreases or increases. A change in the estimated customer life by one year in either direction would have a minimal impact to total revenue of less than 1%. Subscription revenues are recognized on a
35
straight-line basis during the contractual period over which the service is delivered. Reservation revenues (or per seated diner fees) are recognized on a transaction-by-transaction basis as diners are seated by our restaurant customers. Amounts that have been invoiced are recorded in accounts receivable and in deferred revenues or revenues, depending on whether the revenue recognition criteria have been met. Revenues are shown net of redeemable Dining Points issued to diners (as described below).
Dining Rewards Loyalty Program
We provide a points-based loyalty program, OpenTable Dining Rewards, to registered diners who book and honor reservations through the OpenTable website. OpenTable Dining Rewards involves the issuance of "Dining Points," which can be accumulated and redeemed for "Dining Checks." The standard award is 100 points per reservation, but diners can earn 1,000 points for reservations during featured times under the OpenTable Dining Rewards program. When a diner accumulates a minimum of 2,000 points, he or she may redeem them for a $20 Dining Check. Every 100 Dining Points is equal to one dollar. Diners may present Dining Checks at any OpenTable restaurant and their bill is reduced by the check amount. The restaurant then deposits the Dining Check to its bank.
If a diner does not make a seated reservation within any 12-month period, then his or her account is considered inactive and the Dining Points balance is reset to zero. As is typical with points-based incentive programs, many Dining Points expire unused. In addition, some Dining Checks are never used. The recorded expense is an estimate of the eventual cash outlay related to the issued Dining Points and is booked at the time the points are earned by the diner (i.e., when the diner is "seated" by the restaurant). We estimate the cost of the issued Dining Points by analyzing historical patterns of redemption and check-cashing activity. These historical patterns are evaluated in light of any current or proposed program changes that may impact future point redemption. Actual redemption rates could differ from our estimates used in assessing the contra-revenue amounts and corresponding liability, particularly if participation in our premium listings programs, with higher point awards, increases. These differences could materially impact reservation revenues. For example, an increase of 10% in the redemption rate as of December 31, 2009 would result in a reduction in revenues of $2.2 million and an increase in the dining rewards payable liability of 19%.
We recognize the cost and a corresponding liability associated with Dining Points as contra-revenue in accordance with Topic 605-50—Revenue Recognition-Customer Payments and Incentives (EITF Issue No. 01-09, Accounting for Consideration Given by a Vendor to a Customer (Including a Reseller of the Vendor's Products) (EITF 01-09) and EITF Issue No. 00-22, Accounting for "Points" and Certain Other Time- or Volume-Based Sales Incentive Offers, and Offers for Free Products or Services to be Delivered in the Future (EITF 00-22))
Website and Software Development Costs
Costs related to website and internal-use software are accounted for in accordance with Topic 350—Intangibles-Goodwill and Other (American Institute of Certified Public Accountants Statement of Position 98-1, Accounting for the Costs of Computer Software Developed or Obtained for Internal Use (SOP 98-1) and EITF Issue No. 00-2, Accounting for Website Development Costs (EITF 00-2)). Such software is primarily related to our website, including support systems. In accordance with Topic 350, we capitalize our costs to develop software when preliminary development efforts are successfully completed, management has authorized and committed project funding and it is probable that the project will be completed and the software will be used as intended. Such costs are amortized on a straight-line basis over the estimated useful life of the related asset, generally estimated between two to four years. Costs incurred prior to meeting these criteria are expensed as incurred. Costs incurred for enhancements that are expected to result in additional features or functionality are capitalized and expensed over the estimated useful life of the enhancements.
36
We follow the guidance in Topic 985—Software (Statement of Financial Accounting Standard No. 86, Accounting for the Costs of Computer Software to Be Sold, Leased, or Otherwise Marketed (SFAS 86)) in accounting for costs incurred in connection with development of the software contained in the ERB used by all restaurant customers, and in a limited number of certain transactions we sell reservation systems that do not include our ongoing service. All costs incurred to establish the technological feasibility of a computer product to be sold, leased or otherwise marketed are expensed as incurred. Costs incurred subsequent to establishing technological feasibility and through general product release are capitalized and amortized over the estimated product life. The period between technological feasibility and general product release is extremely short for us, and the costs incurred during this stage are not considered to be material and are expensed as incurred.
Income Taxes
We record income taxes using the asset and liability method, which requires the recognition of deferred tax assets and liabilities for the expected future tax consequences of events that have been recognized in our financial statements or tax returns. In estimating future tax consequences, generally all expected future events other than enactments or changes in the tax law or rates are considered. Valuation allowances are provided when necessary to reduce deferred tax assets to the amount expected to be realized.
We operate in various tax jurisdictions and are subject to audit by various tax authorities. We provide for tax contingencies whenever it is deemed probable that a tax asset has been impaired or a tax liability has been incurred for events such as tax claims or changes in tax laws. Tax contingencies are based upon their technical merits, relevant tax law and the specific facts and circumstances as of each reporting period. Changes in facts and circumstances could result in material changes to the amounts recorded for such tax contingencies.
On January 1, 2007, we adopted Topic 740—Income Taxes ("Topic 740") (Financial Accounting Standards Board (FASB) Interpretation No. 48, Accounting for Uncertainty in Income Taxes—an interpretation of FASB Statement No. 109 (FIN 48)), which supplements FASB Statement No. 109 by defining the confidence level that a tax position must meet in order to be recognized in the financial statements. Topic 740 requires that the tax effects of a position be recognized only if it is "more likely than not" to be sustained based solely on its technical merits as of the reporting date. We consider many factors when evaluating and estimating our tax positions and tax benefits, which may require periodic adjustments and which may not accurately anticipate actual outcomes.
With the adoption of Topic 740, companies are required to adjust their financial statements to reflect only those tax positions that are more likely than not to be sustained. Any necessary adjustment would be recorded directly to retained earnings and reported as a change in accounting principle as of the date of adoption. Topic 740 prescribes a comprehensive model for the financial statement recognition, measurement, presentation and disclosure of uncertain tax positions taken or expected to be taken in income tax returns.
Stock-based Compensation
Effective January 1, 2006, we adopted Topic 718—Stock Compensation (SFAS No. 123R, Share-Based Payment (SFAS No. 123R)), which requires compensation expense related to share-based transactions, including employee stock options, to be measured and recognized in the financial statements based on fair value. We adopted Topic 718 using the modified prospective method. Under modified prospective application, Topic 718 applies to new awards and to awards modified, repurchased or cancelled after the required effective date. Additionally, compensation cost for the portion of awards for which the requisite service has not been rendered that are outstanding as of the required effective date are recognized as the requisite service is rendered on or after the required effective date. The compensation expense for that portion of awards is based on the grant-date fair value of those awards.
37
We are using the graded vesting attribution method prescribed by Topic 718, over the option vesting period, for all options granted on or after January 1, 2006. All options granted prior to 2006 are being amortized using a straight-line method.
Under Topic 718 the fair value of each option award is estimated on the date of grant using the Black-Scholes option pricing model. This model defines the securities' fair values as functions of the current fair value of the company and assumptions based on the securities' rights and preferences. As a result, the option-pricing method requires assumptions regarding the anticipated timing of a potential liquidity event, such as an initial public offering, and the estimated volatility of our equity securities. The anticipated timing of a liquidity event utilized in these valuations for grants made prior to our initial public offering was based on then current plans and estimates of our board of directors and management regarding an initial public offering. Estimates of the volatility of our stock were based on available information on the volatility of capital stock of comparable publicly traded companies.
Results of Operations
The following tables set forth our results of operations for the periods presented and as a percentage of our revenues for those periods. The period-to-period comparison of financial results is not necessarily indicative of future results.
| |
Years Ended December 31, | |||||||||||
|---|---|---|---|---|---|---|---|---|---|---|---|---|
| |
2009 | 2008 | 2007(2) | |||||||||
| |
(In thousands, except per share amounts) |
|||||||||||
REVENUES |
$ | 68,596 | $ | 55,844 | $ | 41,148 | ||||||
COSTS AND EXPENSES: |
||||||||||||
Operations and support(1) |
20,736 | 17,760 | 12,603 | |||||||||
Sales and marketing(1) |
15,525 | 14,830 | 11,326 | |||||||||
Technology(1) |
10,043 | 9,511 | 5,863 | |||||||||
General and administrative(1) |
13,608 | 13,117 | 12,212 | |||||||||
Total costs and expenses |
59,912 | 55,218 | 42,004 | |||||||||
Income (loss) from operations |
8,684 | 626 | (856 | ) | ||||||||
Other income, net |
346 | 468 | 951 | |||||||||
Income (loss) before taxes |
9,030 | 1,094 | 95 | |||||||||
Income tax expense |
3,963 | 2,118 | (9,121 | ) | ||||||||
NET INCOME (LOSS) |
$ | 5,067 | $ | (1,024 | ) | $ | 9,216 | |||||
Net income (loss) per share: |
||||||||||||
Basic |
$ | 0.28 | $ | (0.10 | ) | $ | 0.36 | |||||
Diluted |
$ | 0.22 | $ | (0.10 | ) | $ | 0.31 | |||||
Weighted average shares outstanding: |
||||||||||||
Basic |
17,352 | 10,016 | 9,522 | |||||||||
Diluted |
22,467 | 10,016 | 10,943 | |||||||||
- (1)
- Stock-based compensation included in above line items:
Operations and support |
$ | 320 | $ | 339 | $ | 290 | ||||||
Sales and marketing |
764 | 878 | 709 | |||||||||
Technology |
516 | 694 | 288 | |||||||||
General and administrative |
1,218 | 2,059 | 1,816 | |||||||||
|
$ | 2,818 | $ | 3,970 | $ | 3,103 | ||||||
- (2)
- Certain corrections have been made to previously reported Earnings Per Share amounts for the year ended December 31, 2007. See Note 2 of the accompanying notes to our consolidated financial statements.
38
| |
Years Ended December 31, | ||||||||||
|---|---|---|---|---|---|---|---|---|---|---|---|
| |
2009 | 2008 | 2007 | ||||||||
| |
(In thousands, except per share amounts) |
||||||||||
Other Operational Data: |
|||||||||||
Installed restaurants (at period end): |
|||||||||||
North America |
10,850 | 9,295 | 7,391 | ||||||||
International |
1,501 | 1,040 | 470 | ||||||||
Total |
12,351 | 10,335 | 7,861 | ||||||||
Seated diners (in thousands): |
|||||||||||
North America |
41,909 | 33,636 | 24,614 | ||||||||
International |
957 | 542 | 244 | ||||||||
Total |
42,866 | 34,178 | 24,858 | ||||||||
Headcount (at period end): |
|||||||||||
North America |
256 | 238 | 192 | ||||||||
International |
63 | 59 | 34 | ||||||||
Total |
319 | 297 | 226 | ||||||||
Additional Financial Data: |
|||||||||||
Revenues: |
|||||||||||
North America |
$ | 64,751 | $ | 53,065 | $ | 39,601 | |||||
International |
3,845 | 2,779 | 1,547 | ||||||||
Total |
$ | 68,596 | $ | 55,844 | $ | 41,148 | |||||
Income (loss) from operations: |
|||||||||||
North America |
$ | 14,591 | $ | 9,088 | $ | 4,974 | |||||
International |
(5,907 | ) | (8,462 | ) | (5,830 | ) | |||||
Total |
$ | 8,684 | $ | 626 | $ | (856 | ) | ||||
Depreciation and amortization: |
|||||||||||
North America |
$ | 4,752 | $ | 4,026 | $ | 2,817 | |||||
International |
476 | 350 | 184 | ||||||||
Total |
$ | 5,228 | $ | 4,376 | $ | 3,001 | |||||
| |
Years Ended December 31, | |||||||||||
|---|---|---|---|---|---|---|---|---|---|---|---|---|
| |
2009 | 2008 | 2007 | |||||||||
REVENUES |
100 | % | 100 | % | 100 | % | ||||||
COSTS AND EXPENSES: |
||||||||||||
Operations and support |
30 | % | 32 | % | 31 | % | ||||||
Sales and marketing |
23 | % | 27 | % | 27 | % | ||||||
Technology |
15 | % | 17 | % | 14 | % | ||||||
General and administrative |
20 | % | 23 | % | 30 | % | ||||||
Total costs and expenses |
88 | % | 99 | % | 102 | % | ||||||
Income (loss) from operations |
12 | % | 1 | % | (2 | )% | ||||||
Other income, net |
1 | % | 1 | % | 2 | % | ||||||
Income (loss) before taxes |
13 | % | 2 | % | 0 | % | ||||||
Income tax expense |
6 | % | 4 | % | (22 | )% | ||||||
NET INCOME (LOSS) |
7 | % | (2 | )% | 22 | % | ||||||
39
Years ended December 31, 2009, 2008 and 2007
Revenues
| |
Years Ended December 31, | |
|
||||||||||||||
|---|---|---|---|---|---|---|---|---|---|---|---|---|---|---|---|---|---|
| |
2008 to 2009 % Change |
2007 to 2008 % Change |
|||||||||||||||
| |
2009 | 2008 | 2007 | ||||||||||||||
| |
(Dollars in thousands) |
|
|
||||||||||||||
Installed restaurants (at period end): |
|||||||||||||||||
North America |
10,850 | 9,295 | 7,391 | 17 | % | 26 | % | ||||||||||
International |
1,501 | 1,040 | 470 | 44 | % | 121 | % | ||||||||||
Total |
12,351 | 10,335 | 7,861 | 20 | % | 31 | % | ||||||||||
Seated diners (in thousands): |
|||||||||||||||||
North America |
41,909 | 33,636 | 24,614 | 25 | % | 37 | % | ||||||||||
International |
957 | 542 | 244 | 77 | % | 122 | % | ||||||||||
Total |
42,866 | 34,178 | 24,858 | 25 | % | 37 | % | ||||||||||
Revenues by type: |
|||||||||||||||||
Subscription |
$ | 35,854 | $ | 30,293 | $ | 22,434 | 18 | % | 35 | % | |||||||
Reservation |
29,437 | 23,135 | 17,010 | 27 | % | 36 | % | ||||||||||
Installation and other |
3,305 | 2,416 | 1,704 | 37 | % | 42 | % | ||||||||||
Total |
$ | 68,596 | $ | 55,844 | $ | 41,148 | 23 | % | 36 | % | |||||||
Percentage of revenues by type: |
|||||||||||||||||
Subscription |
52 | % | 54 | % | 55 | % | |||||||||||
Reservation |
43 | % | 41 | % | 41 | % | |||||||||||
Installation and other |
5 | % | 5 | % | 4 | % | |||||||||||
Total |
100 | % | 100 | % | 100 | % | |||||||||||
Revenues by location: |
|||||||||||||||||
North America |
$ | 64,751 | $ | 53,065 | $ | 39,601 | 22 | % | 34 | % | |||||||
International |
3,845 | 2,779 | 1,547 | 38 | % | 80 | % | ||||||||||
Total |
$ | 68,596 | $ | 55,844 | $ | 41,148 | 23 | % | 36 | % | |||||||
Percentage of revenues by location: |
|||||||||||||||||
North America |
94 | % | 95 | % | 96 | % | |||||||||||
International |
6 | % | 5 | % | 4 | % | |||||||||||
Total |
100 | % | 100 | % | 100 | % | |||||||||||
2009 compared to 2008. Total revenues increased $12.8 million, or 23%, from the year ended December 31, 2008 to the year ended December 31, 2009. Subscription revenues increased to $35.9 million in the year ended December 31, 2009 from $30.3 million in the year ended December 31, 2008, an increase of $5.6 million, or 18%. Subscription revenues increased due to the increase in installed restaurants. Reservation revenues increased to $29.4 million in the year ended December 31, 2009 from $23.1 million in the year ended December 31, 2008, an increase of $6.3 million, or 27%. Reservation revenues increased as a result of an increase in seated diners.
2008 compared to 2007. Total revenues increased $14.7 million, or 36%, from the year ended December 31, 2007 to the year ended December 31, 2008. Subscription revenues increased to $30.3 million in the year ended December 31, 2008 from $22.4 million in the year ended December 31, 2007, an increase of $7.9 million, or 35%. Subscription revenues increased due to the increase in installed restaurants. Reservation revenues increased to $23.1 million in the year ended December 31,
40
2008 from $17.0 million in the year ended December 31, 2007, an increase of $6.1 million, or 36%. Reservation revenues increased as a result of an increase in seated diners.
Costs and Expenses
Operations and Support
| |
Years Ended December 31, | |
|
||||||||||||||
|---|---|---|---|---|---|---|---|---|---|---|---|---|---|---|---|---|---|
| |
2008 to 2009 % Change |
2007 to 2008 % Change |
|||||||||||||||
| |
2009 | 2008 | 2007 | ||||||||||||||
| |
(Dollars in thousands) |
|
|
||||||||||||||
Operations and support |
$ | 20,736 | $ | 17,760 | $ | 12,603 | 17 | % | 41 | % | |||||||
Headcount (at period end): |
|||||||||||||||||
North America |
76 | 78 | 63 | (3 | )% | 24 | % | ||||||||||
International |
25 | 28 | 16 | (11 | )% | 75 | % | ||||||||||
Total |
101 | 106 | 79 | (5 | )% | 34 | % | ||||||||||
2009 compared to 2008. Operations and support expenses for the year ended December 31, 2009 were $20.7 million compared to $17.8 million for the year ended December 31, 2008, an increase of $2.9 million, or 17%. The increase in operations and support expenses was primarily attributable to a $1.1 million increase in headcount-related expenses, including a $0.3 million increase in cost at our outsourced customer support center, plus a $1.5 million increase in restaurant equipment costs, including depreciation on restaurant hardware, and equipment and shipping costs in connection with the increase in the installed base of restaurants.
2008 compared to 2007. Operations and support expenses for the year ended December 31, 2008 were $17.8 million compared to $12.6 million for the year ended December 31, 2007, an increase of $5.2 million, or 41%. The increase in operations and support expenses was primarily attributable to a $1.9 million increase in headcount-related expenses, including a $0.4 million increase in cost at our outsourced customer support center, plus a $1.6 million increase in restaurant equipment costs, including depreciation on restaurant hardware and equipment and shipping costs in connection with the increase in the installed base of restaurants.
Sales and Marketing
| |
Years Ended December 31, | |
|
||||||||||||||
|---|---|---|---|---|---|---|---|---|---|---|---|---|---|---|---|---|---|
| |
2008 to 2009 % Change |
2007 to 2008 % Change |
|||||||||||||||
| |
2009 | 2008 | 2007 | ||||||||||||||
| |
(Dollars in thousands) |
|
|
||||||||||||||
Sales and marketing |
$ | 15,525 | $ | 14,830 | $ | 11,326 | 5 | % | 31 | % | |||||||
Headcount (at period end): |
|||||||||||||||||
North America |
62 | 50 | 40 | 24 | % | 25 | % | ||||||||||
International |
30 | 24 | 15 | 25 | % | 60 | % | ||||||||||
Total |
92 | 74 | 55 | 24 | % | 35 | % | ||||||||||
2009 compared to 2008. Sales and marketing expenses for the year ended December 31, 2009 were $15.5 million compared to $14.8 million for the year ended December 31, 2008, an increase of $0.7 million, or 5%. The increase in sales and marketing expenses was primarily attributable to a $0.8 million increase in headcount-related costs, consistent with the increase in headcount.
2008 compared to 2007. Sales and marketing expenses for the year ended December 31, 2008 were $14.8 million compared to $11.3 million for the year ended December 31, 2007, an increase of $3.5 million, or 31%. The increase in sales and marketing expenses was primarily attributable to a
41
$2.5 million increase in headcount-related costs, consistent with the increase in headcount. Also included in headcount and related costs was an increase in commissions of $0.3 million consistent with the increase in newly contracted restaurant customers compared to the prior year.
Technology
| |
Years Ended December 31, | |
|
||||||||||||||
|---|---|---|---|---|---|---|---|---|---|---|---|---|---|---|---|---|---|
| |
2008 to 2009 % Change |
2007 to 2008 % Change |
|||||||||||||||
| |
2009 | 2008 | 2007 | ||||||||||||||
| |
(Dollars in thousands) |
|
|
||||||||||||||
Technology |
$ | 10,043 | $ | 9,511 | $ | 5,863 | 6 | % | 62 | % | |||||||
Headcount (at period end): |
|||||||||||||||||
North America |
73 | 67 | 59 | 9 | % | 14 | % | ||||||||||
International |
0 | 0 | 0 | ||||||||||||||
Total |
73 | 67 | 59 | 9 | % | 14 | % | ||||||||||
2009 compared to 2008. Technology expenses for the year ended December 31, 2009 were $10.0 million compared to $9.5 million for the year ended December 31, 2008, an increase of $0.5 million, or 6%. The increase in technology expenses was primarily attributable to a $0.2 million increase in headcount-related costs, consistent with increases in headcount.
2008 compared to 2007. Technology expenses for the year ended December 31, 2008 were $9.5 million compared to $5.9 million for the year ended December 31, 2007, an increase of $3.6 million, or 62%. The increase in technology expenses was primarily attributable to a $3.2 million increase in headcount-related costs, consistent with the increase in headcount that began in the second half of 2007.
General and Administrative
| |
Years Ended December 31, | |
|
||||||||||||||
|---|---|---|---|---|---|---|---|---|---|---|---|---|---|---|---|---|---|
| |
2008 to 2009 % Change |
2007 to 2008 % Change |
|||||||||||||||
| |
2009 | 2008 | 2007 | ||||||||||||||
| |
(Dollars in thousands) |
|
|
||||||||||||||
General and administrative |
$ | 13,608 | $ | 13,117 | $ | 12,212 | 4 | % | 7 | % | |||||||
Headcount (at period end): |
|||||||||||||||||
North America |
45 | 43 | 30 | 5 | % | 43 | % | ||||||||||
International |
8 | 7 | 3 | 14 | % | 133 | % | ||||||||||
Total |
53 | 50 | 33 | 6 | % | 52 | % | ||||||||||
2009 compared to 2008. General and administrative expenses for the year ended December 31, 2009 were $13.6 million compared to $13.1 million for the year ended December 31, 2008, an increase of $0.5 million, or 4%. The increase in general and administrative expenses was primarily the result of an increase of $0.5 million in legal costs, primarily in connection with patent litigation, and a $0.5 million increase in bad debt expense. These amounts were partially offset by a decrease in headcount-related costs of $0.3 million which was the result of increase salary costs offset by lower stock-based compensation expense.
2008 compared to 2007. General and administrative expenses for the year ended December 31, 2008 were $13.1 million compared to $12.2 million for the year ended December 31, 2007, an increase of $0.9 million, or 7%. The increase in general and administrative expenses was primarily the result of an increase of $1.6 million in headcount-related costs and a $0.6 million increase in bad debt expense.
42
These amounts were partially offset by a one-time legal settlement in the amount of $1.6 million included in the 2007 period.
Other Income, Net
| |
Years Ended December 31, | |
|
|||||||||||||
|---|---|---|---|---|---|---|---|---|---|---|---|---|---|---|---|---|
| |
2008 to 2009 % Change |
2007 to 2008 % Change |
||||||||||||||
| |
2009 | 2008 | 2007 | |||||||||||||
| |
(Dollars in thousands) |
|
|
|||||||||||||
Other income, net |
$ | 346 | $ | 468 | $ | 951 | (26 | )% | (51 | )% | ||||||
2009 compared to 2008. Other income, net for the year ended December 31, 2009 was $0.3 million compared to $0.5 million for the year ended December 31, 2008, a decrease of $0.2 million, or 26%. The decrease in other income, net was primarily the result of a $0.2 million decrease in interest income earned on cash, cash equivalents and short-term investments as a result of experiencing lower short-term borrowing interest rates.
2008 compared to 2007. Other income, net for the year ended December 31, 2008 was $0.5 million compared to $1.0 million for the year ended December 31, 2007, a decrease of $0.5 million, or 51%. The decrease in other income, net was primarily the result of a $0.2 million decrease in interest income earned on cash, cash equivalents and short-term investments as a result of experiencing lower short-term borrowing interest rates, and a $0.3 million increase in foreign exchange transaction loss.
Income Taxes
| |
Years Ended December 31, | |
|
|||||||||||||
|---|---|---|---|---|---|---|---|---|---|---|---|---|---|---|---|---|
| |
2008 to 2009 % Change |
2007 to 2008 % Change |
||||||||||||||
| |
2009 | 2008 | 2007 | |||||||||||||
| |
(Dollars in thousands) |
|
|
|||||||||||||
Income tax expense (benefit) |
$ | 3,963 | $ | 2,118 | $ | (9,121 | ) | 87 | % | (123 | )% | |||||
2009 compared to 2008. Income tax expense for the year ended December 31, 2009 was $4.0 million compared to income tax expense of $2.1 million for the year ended December 31, 2008. Our effective income tax rate in 2009 was 43.9% down from 193.9% in 2008 due to a decrease in permanent differences, the largest of which was non-deductible stock-based compensation expense.
2008 compared to 2007. Income tax expense for the year ended December 31, 2008 was $2.1 million compared to an income tax benefit of $9.1 million for the year ended December 31, 2007. Our income tax expense in 2008 was higher than the amount using the expected statutory rate by $1.6 million due to permanent differences, the largest of which was non-deductible stock-based compensation. The income tax benefit in 2007 was primarily the result of releasing substantially all of the valuation allowance against our deferred tax asset.
Quarterly Results of Operations Data
The following tables set forth our unaudited quarterly consolidated statements of operations data for each of the eight quarters in the period ended December 31, 2009. We have prepared the quarterly data on a consistent basis with the audited consolidated financial statements included in this document.
43
The results of historical periods are not necessarily indicative of the results of operations for a full year or any future period.
| |
For the Three Months Ended, | ||||||||||||||||||||||||||
|---|---|---|---|---|---|---|---|---|---|---|---|---|---|---|---|---|---|---|---|---|---|---|---|---|---|---|---|
| |
Dec 31, 2009 |
Sep 30, 2009 |
Jun 30, 2009 |
Mar 31, 2009 |
Dec 31, 2008 |
Sep 30, 2008 |
Jun 30, 2008 |
Mar 31, 2008 |
|||||||||||||||||||
| |
(In thousands, except per share amounts) |
||||||||||||||||||||||||||
REVENUES |
$ | 19,169 | $ | 17,042 | $ | 16,390 | $ | 15,995 | $ | 14,542 | $ | 14,181 | $ | 13,858 | $ | 13,263 | |||||||||||
COSTS AND EXPENSES: |
|||||||||||||||||||||||||||
Operations and support |
5,541 | 5,077 | 5,012 | 5,106 | 4,835 | 4,580 | 4,333 | 4,012 | |||||||||||||||||||
Sales and marketing |
3,873 | 3,845 | 4,010 | 3,798 | 3,765 | 3,755 | 3,719 | 3,591 | |||||||||||||||||||
Technology |
2,354 | 2,378 | 2,599 | 2,712 | 2,465 | 2,467 | 2,404 | 2,175 | |||||||||||||||||||
General and administrative |
3,287 | 3,379 | 3,395 | 3,547 | 3,112 | 3,449 | 3,412 | 3,144 | |||||||||||||||||||
Total costs and expenses |
15,055 | 14,679 | 15,016 | 15,163 | 14,177 | 14,251 | 13,868 | 12,922 | |||||||||||||||||||
Income (loss) from operations |
4,114 | 2,363 | 1,374 | 832 | 365 | (70 | ) | (10 | ) | 341 | |||||||||||||||||
Other income, net |
90 | 111 | 91 | 55 | 28 | 117 | 143 | 180 | |||||||||||||||||||
Income (loss) before taxes |
4,204 | 2,474 | 1,465 | 887 | 393 | 47 | 133 | 521 | |||||||||||||||||||
Income tax expense |
1,091 | 1,578 | 773 | 521 | 1,268 | 337 | (95 | ) | 608 | ||||||||||||||||||
NET INCOME (LOSS) |
$ | 3,113 | $ | 896 | $ | 692 | $ | 366 | $ | (875 | ) | $ | (290 | ) | $ | 228 | $ | (87 | ) | ||||||||
Net income (loss) per share: |
|||||||||||||||||||||||||||
Basic |
$ | 0.14 | $ | 0.04 | $ | 0.05 | $ | 0.00 | $ | (0.09 | ) | $ | (0.03 | ) | $ | 0.00 | $ | (0.01 | ) | ||||||||
Diluted |
$ | 0.13 | $ | 0.04 | $ | 0.03 | $ | 0.00 | $ | (0.09 | ) | $ | (0.03 | ) | $ | 0.00 | $ | (0.01 | ) | ||||||||
Weighted average shares outstanding: |
|||||||||||||||||||||||||||
Basic |
21,968 | 21,640 | 15,327 | 10,276 | 10,178 | 10,071 | 9,963 | 9,850 | |||||||||||||||||||
Diluted |
23,467 | 23,713 | 22,247 | 10,276 | 10,178 | 10,071 | 9,963 | 9,850 | |||||||||||||||||||
Subsequent to the issuance of the Company's interim financial statements as of September 30, 2009, on Form 10-Q and in reviewing its 2009 disclosures, management of the Company determined that the quarter ended March 31, 2009 and June 30, 2008 basic and diluted net income per share were computed under the if-converted method rather than the required two-class method. In particular, the Company failed to subtract from net income the portion of current year earnings that the preferred shareholders would have been entitled to receive pursuant to their dividend rights had all of the year's earnings been distributed. Accordingly, corrections have been made herein to the previously reported net income per share amounts for the quarters ended March 31, 2009 and June 30, 2008. Basic and diluted net income per share for the quarter ended March 31, 2009 were previously reported as $0.04 and $0.02, respectively. Using the two-class method, basic and diluted net income per share amounts for the quarter ended March 31, 2009 are $0.00 and $0.00, respectively. Basic and diluted net income per share for the quarter ended June 30, 2008 were previously reported as $0.02 and $0.01, respectively. Using the two-class method, basic and diluted net income per share amounts for the quarter ended June 30, 2008 are $0.00 and $0.00, respectively. The corrections in the March 31, 2009 and June 30, 2008 quarterly net income per share calculation did not impact the total net income previously reported for the respective periods. The foregoing corrections are not considered material by the Company.
44
Liquidity and Capital Resources
| |
Years Ended December 31, | ||||||||||
|---|---|---|---|---|---|---|---|---|---|---|---|
| |
2009 | 2008 | 2007 | ||||||||
| |
(In thousands) |
|
|
||||||||
Consolidated Statements of Cash Flows Data: |
|||||||||||
Purchases of property and equipment |
$ | 5,996 | $ | 7,203 | $ | 5,449 | |||||
Depreciation and amortization |
|||||||||||
North America |
4,752 | 4,026 | 2,817 | ||||||||
International |
476 | 350 | 184 | ||||||||
Total depreciation and amortization |
5,228 | 4,376 | 3,001 | ||||||||
Cash flows from operating activities |
17,689 | 8,544 | 11,158 | ||||||||
Cash flows from investing activities |
(42,128 | ) | (24,330 | ) | (5,025 | ) | |||||
Cash flows from financing activities |
38,499 | (80 | ) | 5,269 | |||||||
As of December 31, 2009, we had cash and cash equivalents of $19.8 million and short-term investments of $50.2 million. Cash and cash equivalents consist of cash, money market accounts, certificates of deposit and commercial paper. Short-term investments consist of U.S. government agency securities, commercial paper and certificates of deposit. To date we have experienced no loss or lack of access to our invested cash or cash equivalents; however, we can provide no assurances that access to our invested cash, cash equivalents and short-term investments will not be impacted by adverse conditions in the financial markets.
Amounts deposited with third-party financial institutions exceed the Federal Deposit Insurance Corporation, or FDIC, and Securities Investor Protection Corporation, or SIPC, insurance limits, as applicable. These cash, cash equivalents and short-term investment balances could be impacted if the underlying financial institutions fail or are subjected to other adverse conditions in the financial markets. To date we have experienced no loss or lack of access to our cash, cash equivalents or short-term investments.
We have a $3.0 million line of credit to fund working capital under which we have no amounts drawn down as of December 31, 2009. This line of credit expires in July 2010.
Prior to 2005, we financed our operations and capital expenditures through operations, private sales of preferred stock, lease financing and the use of a bank-provided line of credit and operations. Since 2005, we have been able to finance our operations, including international expansion, through cash from operating activities and proceeds from the exercise of vested and unvested employee stock options. We had cash and cash equivalents of $19.8 million at December 31, 2009, which is an increase of $14.3 million from December 31, 2008, due to the receipt of net proceeds in the amount of approximately $34.6 million from our initial public offering in May 2009, offset by purchases of short-term investments. We believe we will have sufficient cash to support our operating activities and capital expenditures for at least the next twelve months.
Operating Activities
For the twelve months ended December 31, 2009, operating activities provided $17.7 million in cash, as a result of net income of $5.1 million, $5.2 million in depreciation and amortization, $1.8 million in provision for bad debts and $2.8 million in stock-based compensation. These amounts were partially offset by a cash usage of $3.1 million as a result of an increased accounts receivable balance.
For the twelve months ended December 31, 2008, operating activities provided $8.5 million in cash, as a result of a net loss of $1.0 million, offset by $4.4 million in depreciation and amortization and
45
$4.0 million in stock-based compensation. These amounts were partially offset by a cash usage of $2.2 million as a result of an increase in accounts receivable.
For the twelve months ended December 31, 2007, operating activities provided $11.2 million in cash as a result of net income of $9.2 million, depreciation and amortization amounts of $3.0 million and stock-based compensation amounts of $3.1 million, combined with sources of cash from a $2.8 million increase in accounts payable and accrued expenses, a $2.3 million increase in the Dining Points payable, and a $1.1 million increase from deferred revenues. These amounts were partially offset by an increase in deferred taxes of $9.4 million and a cash usage of $1.8 million resulting from the increase in accounts receivable.
Investing Activities
Our primary investing activities have consisted of purchases and sales of short-term investments and purchases of property and equipment. We expect to have ongoing capital expenditure requirements to support our growing restaurant installed base and other infrastructure needs. We expect to fund this investment with our existing cash, cash equivalents and short-term investments.
In addition to purchases of property and equipment, we purchased $33.1 million (net of sales) of short-term investments during the twelve months ended December 31, 2009 and $17.1 million (net of sales) during the twelve months ended December 31, 2008. Also in the twelve months ended December 31, 2009, we purchased substantially all of the assets of GuestBridge, Inc., or GuestBridge, for approximately $3.0 million in cash.
Financing Activities
With the exception of our initial public offering in May 2009, our financing activities in each of the periods presented in this Form 10-K have consisted entirely of proceeds from the issuance and repurchase of common stock pursuant to our equity incentive plans. During the twelve months ended December 31, 2009, we received approximately $34.6 million in proceeds, net of issuance costs, from the sale of common stock pursuant to our initial public offering which was completed on May 21, 2009.
Off Balance Sheet Arrangements
As of December 31, 2009, we did not have any off balance sheet arrangements.
Contractual Obligations
We lease our primary office space in San Francisco, California and other locations under various non-cancelable operating leases that expire in or prior to 2013. We have no debt obligations, other than a $3.0 million line of credit for working capital, under which we have not borrowed to date. This credit facility expires in July 2010. Additionally, all property and equipment have been purchased for cash, and accordingly we have no capital lease obligations. Finally, we have no material long-term purchase obligations outstanding with any vendors or third parties, or any other long-term liabilities. The
46
following table sets forth, as of December 31, 2009, payments due under our operating lease obligations.
| |
Payments Under Operating Leases | ||||
|---|---|---|---|---|---|
| |
(In thousands) |
||||
Year ending December 31: |
|||||
2010 |
$ | 1,688 | |||
2011 |
1,526 | ||||
2012 |
1,389 | ||||
2013 |
454 | ||||
Total |
$ | 5,057 | |||
As of December 31, 2009, we had approximately $0.2 million of tax liabilities, including interest and penalties, related to uncertain tax positions. Due to the high degree of uncertainty regarding the settlement of these liabilities, we are unable to estimate the years in which future cash outflows may occur other than the amount included in the table above.
Recent Accounting Pronouncements
In December 2007, the FASB issued Topic 805—Business Combinations (SFAS No. 141 (Revised 2007), Business Combinations) (. Topic 805—Business Combinations establishes principles and requirements for how the acquirer of a business recognizes and measures in its financial statements the identifiable assets acquired, the liabilities assumed and any noncontrolling interest in the acquiree. Topic 805—Business Combinations also provides guidance for recognizing and measuring the goodwill acquired in the business combination and determines what information to disclose to enable users of the financial statements to evaluate the nature and financial effects of the business combination. We adopted Topic 805—Business Combinations for the fiscal year beginning January 1, 2009. The adoption of Topic 805—Business Combinations did not have a material impact on our financial position or results of operations at the time of adoption.
In December 2007, the FASB issued Topic 810—Consolidation (SFAS No. 160, Non-controlling Interests in Consolidated Financial Statements which amends Accounting Research Bulletin No. 51, Consolidated Financial Statements), to establish accounting and reporting standards for the non-controlling interest in a subsidiary and for the deconsolidation of a subsidiary. It clarifies that a non-controlling interest in a subsidiary is an ownership interest in the consolidated entity that should be reported as equity separate and apart from the parent's equity in the consolidated financial statements. In addition to the amendments to Topic 810—Consolidation, this statement amends Topic 260—Earnings per Share (SFAS No. 128, Earnings Per Share), so that earnings per share data will continue to be calculated the same way those data were calculated before this statements was issued. Topic 810—Consolidation is effective for fiscal years, and interim periods within those fiscal years, beginning on or after December 15, 2008. The adoption of Topic 810—Consolidation did not have a material impact on our financial position or results of operations at the time of adoption.
In October 2009, the FASB issued Topic 605—Revenue Recognition (EITF 08-1, Multiple-Deliverable Revenue Arrangements, (amendments to FASB Topic 605, Revenue Recognition)) and Topic 985—Software (EITF 09-3, Certain Arrangements That Include Software Elements, (amendments to FASB Topic 985, Software)). Topic 605—Revenue Recognition requires entities to allocate revenue in an arrangement using estimated selling prices of the delivered goods and services based on a selling price hierarchy. The amendments eliminate the residual method of revenue allocation and require revenue to be allocated using the relative selling price method. Topic 985—Software removes tangible products from the scope of software revenue guidance and provides guidance on determining whether software deliverables in an arrangement that includes a tangible product are covered by the scope of the
47
software revenue guidance. Topic 605—Revenue Recognition and Topic 985—Software should be applied on a prospective basis for revenue arrangements entered into or materially modified in fiscal years beginning on or after June 15, 2010, with early adoption permitted. We are currently evaluating the impact of Topic 605—Revenue Recognition and Topic 985—Software on our consolidated financial statements.
In April 2009, the FASB issued additional requirements regarding interim disclosures about the fair value of financial instruments which were previously only disclosed on an annual basis, Topic 825-65 "Financial Instruments—Transition and Open Effective Date Information" (formerly FSP FAS 107-1 & APB 28-1, Interim Disclosures about Fair Value of Financial Instruments). Entities are now required to disclose the fair value of financial instruments which are not recorded at fair value in the financial statements in both their interim and annual financial statements. We adopted this guidance in our third quarter of fiscal 2009 and it did not have a significant impact on our consolidated financial position, results of operations and cash flows.
In April 2009, the FASB issued guidance on determining fair value when the volume and level of activity for an asset or liability has significantly decreased, and in identifying transactions that are not orderly, codified in Topic 820-10 Fair Value Measurements and Disclosures (formerly FSP FAS 157-4, Determining Fair Value When the Volume and Level of Activity for the Asset or Liability Have Significantly Decreased and Identifying Transactions That Are Not Orderly). This also includes guidance on identifying circumstances that indicate a transaction is not orderly. Based on the guidance, if an entity determines that the level of activity for an asset or liability has significantly decreased and that a transaction is not orderly, further analysis of transactions or quoted prices is needed, and a significant adjustment to the transaction or quoted prices may be necessary to estimate fair value. We adopted this guidance in our third quarter of fiscal 2009 and it did not have a significant impact on our consolidated financial position, results of operations and cash flows.
In June 2009, we adopted the new FASB authoritative guidance for subsequent events. This new guidance is intended to establish general standards for the accounting for and disclosure of events that occur after the balance sheet date but before financial statements are issued or are available to be issued. This new guidance became effective for interim or annual financial periods ending after June 15, 2009. Our adoption of this new guidance did not impact our consolidated results of operations or financial position.
In June 2009, the FASB issued the FASB Accounting Standards Codification (the "Codification"), the authoritative guidance for accounting principles generally accepted in the United States ("GAAP"). The Codification is now the single official source of authoritative GAAP (other than guidance issued by the SEC), superseding existing FASB, American Institute of Certified Public Accountants, and related literature. The Codification does not change GAAP. We adopted the Codification during the quarter ended September 30, 2009. Our adoption of the Codification did not have any substantive impact on our consolidated financial statements or related footnotes.
In January 2010, the FASB issued Accounting Standards Update No. 2010-06, Improving Disclosures about Fair Value Measurements ("ASU 2010-06"), which amends FASB Topic 820, Fair Value Measurements and Disclosures ("Topic 820") to require various additional disclosures regarding fair value measurements and also clarify certain existing disclosure requirements. Under ASU 2010-06, we will be required to: (1) disclose separately the amounts of significant transfers between Level 1 and Level 2 of the fair value hierarchy, (2) disclose activity in Level 3 fair value measurements including transfers into and out of Level 3 and the reasons for such transfers, and (3) present separately in its reconciliation of recurring Level 3 measurements information about purchases, sales, issuances and settlements on a gross basis. ASU 2010-06 does not change any accounting requirements, but is expected to have a significant effect on the disclosures of entities that measure assets and liabilities at fair value. The amendments prescribed by ASU 2010-06 will be effective for our fiscal quarter ending
48
March 31, 2010, except for the requirements described in item (3) above, which will be effective for our fiscal year beginning January 1, 2011. We currently do not expect the adoption of this ASU to have a material impact on our consolidated financial statements.
ITEM 7A. QUANTITATIVE AND QUALITATIVE DISCLOSURE ABOUT MARKET RISK
We are exposed to market risks in the ordinary course of our business. These risks include primarily interest rate, foreign exchange risks and inflation.
Interest Rate Fluctuation Risk
We do not have any long-term borrowings.
Our investments include cash, cash equivalents and short-term investments. Cash and cash equivalents consist of cash, certificates of deposit, commercial paper and money market accounts. Short-term investments consist of U.S. government agency securities, commercial paper and certificates of deposit. The primary objective of our investment activities is to preserve principal while maximizing income without significantly increasing risk. We do not enter into investments for trading or speculative purposes. Our investments are exposed to market risk due to a fluctuation in interest rates, which may affect our interest income and the fair market value of our investments. Due to the short-term nature of our investment portfolio, we do not believe an immediate 10% increase in interest rates would have a material effect on the fair market value of our portfolio, and therefore we do not expect our operating results or cash flows to be materially affected to any degree by a sudden change in market interest rates.
Foreign Currency Exchange Risk
We have foreign currency risks related to our revenues and operating expenses denominated in currencies other than the U.S. dollar, principally the British pound sterling, the euro, the Japanese yen, the Canadian dollar and the Mexican peso. We do not believe movements in the foreign currencies in which we transact will significantly affect future net earnings. Foreign currency risk can be quantified by estimating the change in cash flows resulting from a hypothetical 10% adverse change in foreign exchange rates. We believe such a change would not have a material impact on our results of operations.
Inflation Risk
We do not believe that inflation has had a material effect on our business, financial condition or results of operations. If our costs were to become subject to significant inflationary pressures, we may not be able to fully offset such higher costs through price increases. Our inability or failure to do so could harm our business, financial condition and results of operations.
49
ITEM 8. CONSOLIDATED FINANCIAL STATEMENTS AND SUPPLEMENTARY DATA
OPENTABLE, INC.
INDEX TO CONSOLIDATED FINANCIAL STATEMENTS
50
REPORT OF INDEPENDENT REGISTERED PUBLIC ACCOUNTING FIRM
To
the Board of Directors and Stockholders of
OpenTable, Inc.
San Francisco, California
We have audited the accompanying consolidated balance sheets of OpenTable, Inc. and subsidiaries (the "Company") as of December 31, 2009 and 2008, and the related consolidated statements of operations, stockholders' equity and comprehensive income (loss), and cash flows for each of the three years in the period ended December 31, 2009. These financial statements are the responsibility of the Company's management. Our responsibility is to express an opinion on these financial statements based on our audits.
We conducted our audits in accordance with the standards of the Public Company Accounting Oversight Board (United States). Those standards require that we plan and perform the audit to obtain reasonable assurance about whether the financial statements are free of material misstatement. The Company is not required to have, nor were we engaged to perform, an audit of its internal control over financial reporting. Our audits included consideration of internal control over financial reporting as a basis for designing audit procedures that are appropriate in the circumstances, but not for the purpose of expressing an opinion on the effectiveness of the Company's internal control over financial reporting. Accordingly, we express no such opinion. An audit also includes examining, on a test basis, evidence supporting the amounts and disclosures in the financial statements, assessing the accounting principles used and significant estimates made by management, as well as evaluating the overall financial statement presentation. We believe that our audits provide a reasonable basis for our opinion.
In our opinion, such consolidated financial statements present fairly, in all material respects, the financial position of the Company as of December 31, 2009 and 2008, and the results of its operations and its cash flows for each of the three years in the period ended December 31, 2009, in conformity with accounting principles generally accepted in the United States of America.
/s/ DELOITTE & TOUCHE LLP
San
Jose, California
March 10, 2010
51
OPENTABLE, INC.
CONSOLIDATED BALANCE SHEETS
| |
December 31, | ||||||||
|---|---|---|---|---|---|---|---|---|---|
| |
2009 | 2008 | |||||||
ASSETS |
|||||||||
CURRENT ASSETS: |
|||||||||
Cash and cash equivalents |
$ | 19,807,000 | $ | 5,528,000 | |||||
Short-term investments |
50,221,000 | 17,259,000 | |||||||
Accounts receivable, net of allowance for doubtful accounts of $590,000, and $543,000 at December 31, 2009 and 2008 |
7,617,000 | 6,331,000 | |||||||
Prepaid expenses and other current assets |
1,301,000 | 942,000 | |||||||
Deferred tax asset |
6,024,000 | 4,828,000 | |||||||
Restricted cash |
172,000 | 156,000 | |||||||
Total current assets |
85,142,000 | 35,044,000 | |||||||
Property and equipment, net |
11,516,000 |
11,125,000 |
|||||||
Goodwill |
1,805,000 | — | |||||||
Intangibles, net |
992,000 | — | |||||||
Deferred tax asset |
498,000 | 3,343,000 | |||||||
Other assets |
378,000 | 1,371,000 | |||||||
TOTAL ASSETS |
$ | 100,331,000 | $ | 50,883,000 | |||||
LIABILITIES AND STOCKHOLDERS' EQUITY |
|||||||||
CURRENT LIABILITIES: |
|||||||||
Accounts payable |
$ | 1,385,000 | $ | 881,000 | |||||
Accrued expenses |
5,827,000 | 6,974,000 | |||||||
Accrued compensation |
2,993,000 | 2,772,000 | |||||||
Deferred revenue |
1,538,000 | 1,210,000 | |||||||
Dining rewards payable |
11,611,000 | 8,462,000 | |||||||
Total current liabilities |
23,354,000 | 20,299,000 | |||||||
DEFERRED REVENUE—Less current portion |
3,572,000 |
3,900,000 |
|||||||
Total liabilities |
26,926,000 | 24,199,000 | |||||||
COMMITMENTS AND CONTINGENCIES (Note 7) |
|||||||||
STOCKHOLDERS' EQUITY: |
|||||||||
Convertible preferred stock, Series A , $0.0001 par value—0 and 7,040,000 shares authorized; 0 and 6,898,187 shares issued and outstanding at December 31, 2009 and 2008; aggregate liquidation preference of $7,000,000 at December 31, 2008 |
— | 6,925,000 | |||||||
Convertible preferred stock, Series B , $0.0001 par value—0 and 2,240,000 shares authorized; 0 and 2,177,550 shares issued and outstanding at December 31, 2009 and 2008; aggregate liquidation preference of $15,000,000 at December 31, 2008 |
— | 14,984,000 | |||||||
Preferred stock, $0.0001 par value—5,000,000 and 0 shares authorized; 0 shares issued and outstanding at December 31, 2009 and 2008 |
|||||||||
Common stock, $0.0001 par value—100,000,000 and 24,000,000 shares authorized; 22,652,716 and 11,154,668 shares issued, 22,442,469 and 10,944,421 shares outstanding at December 31, 2009 and 2008 |
2,000 | 1,000 | |||||||
Additional paid-in capital |
127,454,000 | 64,060,000 | |||||||
Treasury stock, at cost (210,247 shares at December 31, 2009 and 2008) |
(647,000 | ) | (647,000 | ) | |||||
Accumulated other comprehensive loss |
(128,000 | ) | (296,000 | ) | |||||
Accumulated deficit |
(53,276,000 | ) | (58,343,000 | ) | |||||
Total stockholders' equity |
73,405,000 | 26,684,000 | |||||||
TOTAL LIABILITIES AND STOCKHOLDERS' EQUITY |
$ | 100,331,000 | $ | 50,883,000 | |||||
See notes to consolidated financial statements.
52
OPENTABLE, INC.
CONSOLIDATED STATEMENTS OF OPERATIONS
| |
Year Ended December 31, | |||||||||||
|---|---|---|---|---|---|---|---|---|---|---|---|---|
| |
2009 | 2008 | 2007 | |||||||||
REVENUES |
$ | 68,596,000 | $ | 55,844,000 | $ | 41,148,000 | ||||||
COSTS AND EXPENSES: |
||||||||||||
Operations and support |
20,736,000 | 17,760,000 | 12,603,000 | |||||||||
Sales and marketing |
15,525,000 | 14,830,000 | 11,326,000 | |||||||||
Technology |
10,043,000 | 9,511,000 | 5,863,000 | |||||||||
General and administrative |
13,608,000 | 13,117,000 | 12,212,000 | |||||||||
Total costs and expenses |
59,912,000 | 55,218,000 | 42,004,000 | |||||||||
Income (loss) from operations |
8,684,000 | 626,000 | (856,000 | ) | ||||||||
Other income, net |
346,000 | 468,000 | 951,000 | |||||||||
Income before taxes |
9,030,000 | 1,094,000 | 95,000 | |||||||||
Income tax expense (benefit) |
3,963,000 | 2,118,000 | (9,121,000 | ) | ||||||||
NET INCOME (LOSS) |
$ | 5,067,000 | $ | (1,024,000 | ) | $ | 9,216,000 | |||||
Net income (loss) per share (see Note 2): |
||||||||||||
Basic |
$ | 0.28 | $ | (0.10 | ) | $ | 0.36 | |||||
Diluted |
$ | 0.22 | $ | (0.10 | ) | $ | 0.31 | |||||
Weighted average shares outstanding: |
||||||||||||
Basic |
17,352,000 | 10,016,000 | 9,522,000 | |||||||||
Diluted |
22,467,000 | 10,016,000 | 10,943,000 | |||||||||
See notes to consolidated financial statements.
53
CONSOLIDATED STATEMENTS OF STOCKHOLDERS' EQUITY AND COMPREHENSIVE INCOME (LOSS)
| |
Series A Convertible Preferred Stock |
Series B Convertible Preferred Stock |
|
|
|
|
|
|
|
|
|
|||||||||||||||||||||||||||||
|---|---|---|---|---|---|---|---|---|---|---|---|---|---|---|---|---|---|---|---|---|---|---|---|---|---|---|---|---|---|---|---|---|---|---|---|---|---|---|---|---|
| |
Common Stock | Treasury Stock | |
Accumulated Other Comprehensive Loss |
|
|
|
|||||||||||||||||||||||||||||||||
| |
Additional Paid-in Capital |
Accumulated Deficit |
|
Comprehensive Income (Loss) |
||||||||||||||||||||||||||||||||||||
| |
Shares | Amount | Shares | Amount | Shares | Amount | Shares | Amount | Total | |||||||||||||||||||||||||||||||
Balance at January 1, 2007 |
6,898,187 | $ | 6,925,000 | 2,177,550 | $ | 14,984,000 | 9,754,941 | $ | 1,000 | 207,047 | $ | (647,000 | ) | $ | 54,211,000 | $ | (32,000 | ) | $ | (66,535,000 | ) | $ | 8,907,000 | |||||||||||||||||
Issuance of common stock upon exercise of employee stock options |
1,178,095 | 1,276,000 | 1,276,000 | |||||||||||||||||||||||||||||||||||||
Stock-based compensation expense |
3,103,000 | 3,103,000 | ||||||||||||||||||||||||||||||||||||||
Income tax benefit from employee stock option exercise |
84,000 | 84,000 | ||||||||||||||||||||||||||||||||||||||
Repurchase of unvested common shares |
(42,593 | ) | (82,000 | ) | (82,000 | ) | ||||||||||||||||||||||||||||||||||
Repurchase of common shares |
(3,200 | ) | 3,200 | |||||||||||||||||||||||||||||||||||||
Foreign currency translation |
(19,000 | ) | (19,000 | ) | (19,000 | ) | ||||||||||||||||||||||||||||||||||
Net income |
9,216,000 | 9,216,000 | 9,216,000 | |||||||||||||||||||||||||||||||||||||
Comprehensive income |
$ | 9,197,000 | ||||||||||||||||||||||||||||||||||||||
Balance at December 31, 2007 |
6,898,187 | 6,925,000 | 2,177,550 | 14,984,000 | 10,887,243 | 1,000 | 210,247 | (647,000 | ) | 58,592,000 | (51,000 | ) | (57,319,000 | ) | 22,485,000 | |||||||||||||||||||||||||
Issuance of common stock upon exercise of employee stock options |
57,178 | 1,453,000 | 1,453,000 | |||||||||||||||||||||||||||||||||||||
Stock-based compensation expense |
4,015,000 | 4,015,000 | ||||||||||||||||||||||||||||||||||||||
Foreign currency translation |
(311,000 | ) | (311,000 | ) | (311,000 | ) | ||||||||||||||||||||||||||||||||||
Unrealized gain on investments |
66,000 | 66,000 | 66,000 | |||||||||||||||||||||||||||||||||||||
Net loss |
(1,024,000 | ) | (1,024,000 | ) | (1,024,000 | ) | ||||||||||||||||||||||||||||||||||
Comprehensive loss |
$ | (1,269,000 | ) | |||||||||||||||||||||||||||||||||||||
Balance at December 31, 2008 |
6,898,187 | 6,925,000 | 2,177,550 | 14,984,000 | 10,944,421 | 1,000 | 210,247 | (647,000 | ) | 64,060,000 | (296,000 | ) | (58,343,000 | ) | 26,684,000 | |||||||||||||||||||||||||
Conversion of preferred stock to common in connection with initial public offering |
(6,898,187 | ) | (6,925,000 | ) | (2,177,550 | ) | (14,984,000 | ) | 9,075,737 | 1,000 | 21,909,000 | 1,000 | ||||||||||||||||||||||||||||
Issuance of common stock in connection with initial public offering, net of issuance costs of $5,811,000 |
2,022,684 | 34,638,000 | 34,638,000 | |||||||||||||||||||||||||||||||||||||
Issuance of common stock in connection with cashless warrant exercise |
154,599 | |||||||||||||||||||||||||||||||||||||||
Issuance of common stock upon exercise of employee stock options |
245,028 | 2,223,000 | 2,223,000 | |||||||||||||||||||||||||||||||||||||
Tax benefit from disqualifying dispositions |
1,703,000 | 1,703,000 | ||||||||||||||||||||||||||||||||||||||
Stock-based compensation expense |
2,921,000 | 2,921,000 | ||||||||||||||||||||||||||||||||||||||
Foreign currency translation |
266,000 | 266,000 | 266,000 | |||||||||||||||||||||||||||||||||||||
Unrealized loss on investments |
(98,000 | ) | (98,000 | ) | (98,000 | ) | ||||||||||||||||||||||||||||||||||
Net income |
5,067,000 | 5,067,000 | 5,067,000 | |||||||||||||||||||||||||||||||||||||
Comprehensive income |
$ | 5,235,000 | ||||||||||||||||||||||||||||||||||||||
Balance at December 31, 2009 |
$ | 0 | $ | 0 | 22,442,469 | $ | 2,000 | 210,247 | $ | (647,000 | ) | $ | 127,454,000 | $ | (128,000 | ) | $ | (53,276,000 | ) | $ | 73,405,000 | |||||||||||||||||||
See notes to consolidated financial statements.
54
OPENTABLE, INC.
CONSOLIDATED STATEMENTS OF CASH FLOWS
| |
Year Ended December 31, | |||||||||||||
|---|---|---|---|---|---|---|---|---|---|---|---|---|---|---|
| |
2009 | 2008 | 2007 | |||||||||||
OPERATING ACTIVITIES: |
||||||||||||||
Net income (loss) |
$ | 5,067,000 | $ | (1,024,000 | ) | $ | 9,216,000 | |||||||
Adjustments to reconcile net income (loss) to net cash used in operating activities: |
||||||||||||||
Depreciation and amortization |
5,154,000 | 4,376,000 | 3,001,000 | |||||||||||
Amortization of intangibles |
74,000 | — | — | |||||||||||
Provision for doubtful accounts |
1,824,000 | 1,042,000 | 432,000 | |||||||||||
Stock-based compensation |
2,818,000 | 3,970,000 | 3,103,000 | |||||||||||
Write-off of property, equipment and software |
631,000 | 265,000 | 223,000 | |||||||||||
Deferred taxes |
3,007,000 | 1,284,000 | (9,455,000 | ) | ||||||||||
Excess tax benefit related to stock compensation |
(1,703,000 | ) | — | — | ||||||||||
Changes in operating assets and liabilities: |
||||||||||||||
Accounts receivable |
(3,059,000 | ) | (2,211,000 | ) | (1,877,000 | ) | ||||||||
Prepaid expenses and other current assets |
(267,000 | ) | (305,000 | ) | (435,000 | ) | ||||||||
Accounts payable & accrued expenses |
840,000 | (2,472,000 | ) | 2,839,000 | ||||||||||
Accrued compensation |
209,000 | 478,000 | 691,000 | |||||||||||
Deferred revenue |
(55,000 | ) | 515,000 | 1,083,000 | ||||||||||
Dining rewards payable |
3,149,000 | 2,626,000 | 2,337,000 | |||||||||||
Net cash provided by operating activities |
17,689,000 | 8,544,000 | 11,158,000 | |||||||||||
INVESTING ACTIVITIES: |
||||||||||||||
Purchases of property, equipment and software |
(5,996,000 | ) | (7,203,000 | ) | (5,449,000 | ) | ||||||||
Purchases of investments |
(83,545,000 | ) | (18,818,000 | ) | (787,000 | ) | ||||||||
Sales of investments |
50,413,000 | 1,700,000 | 787,000 | |||||||||||
Acquisition of business |
(3,000,000 | ) | — | — | ||||||||||
Change in restricted cash |
— | (9,000 | ) | 424,000 | ||||||||||
Net cash used in investing activities |
(42,128,000 | ) | (24,330,000 | ) | (5,025,000 | ) | ||||||||
FINANCING ACTIVITIES: |
||||||||||||||
Excess tax benefit related to stock compensation |
1,703,000 | — | — | |||||||||||
Proceeds from issuance of common stock upon exercise of employee stock options |
985,000 | 77,000 | 378,000 | |||||||||||
Repurchase of common shares |
— | — | (82,000 | ) | ||||||||||
Proceeds from early exercise of common stock |
— | 28,000 | 4,973,000 | |||||||||||
Cash overdrafts |
988,000 | — | — | |||||||||||
Proceeds from issuance of common stock in connection with initial public offering, net of offering costs |
34,823,000 | (185,000 | ) | — | ||||||||||
Net cash provided by (used in) financing activities |
38,499,000 | (80,000 | ) | 5,269,000 | ||||||||||
EFFECT OF EXCHANGE RATES ON CASH |
219,000 | (267,000 | ) | (5,000 | ) | |||||||||
NET INCREASE IN CASH AND CASH EQUIVALENTS |
14,279,000 | (16,133,000 | ) | 11,397,000 | ||||||||||
CASH AND CASH EQUIVALENTS—Beginning of year |
5,528,000 | 21,661,000 | 10,264,000 | |||||||||||
CASH AND CASH EQUIVALENTS—End of year |
$ | 19,807,000 | $ | 5,528,000 | $ | 21,661,000 | ||||||||
SUPPLEMENTAL DISCLOSURE OF OTHER CASH FLOW INFORMATION: |
||||||||||||||
Cash paid for income taxes |
$ | 1,137,000 | $ | 387,000 | $ | 382,000 | ||||||||
SUPPLEMENTAL DISCLOSURE OF NONCASH INVESTING AND FINANCING ACTIVITIES: |
||||||||||||||
Purchase of property and equipment recorded in accounts payable |
$ | 280,000 | $ | 232,000 | $ | 114,000 | ||||||||
Vesting of early exercised stock options |
$ | 1,239,000 | $ | 1,375,000 | $ | 898,000 | ||||||||
Accrued offering costs |
$ | — | $ | 998,000 | $ | — | ||||||||
Conversion of convertible preferred stock to common stock |
$ | 21,909,000 | $ | — | $ | — | ||||||||
See notes to consolidated financial statements.
55
OPENTABLE, INC.
NOTES TO CONSOLIDATED FINANCIAL STATEMENTS
YEARS ENDED DECEMBER 31, 2009, 2008 AND 2007
1. Organization and Description of Business
OpenTable, Inc. and subsidiaries (collectively, the "Company"), a Delaware corporation, was formed on October 13, 1998. The Company provides solutions that form an online network connecting reservation-taking restaurants and people who dine at those restaurants. For restaurant customers, the Company provides a proprietary Electronic Reservation Book, or ERB, which combines proprietary software and computer hardware to deliver a solution that computerizes restaurant host-stand operations and replaces traditional pen-and-paper reservation books. The OpenTable ERB streamlines and enhances a number of business-critical functions and processes for restaurants, including reservation management, table management, guest recognition and email marketing. For diners, the Company operates www.opentable.com, a popular restaurant reservation website. The OpenTable website enables diners to find, choose and book tables at restaurants on the OpenTable network in real time, overcoming the inefficiencies associated with the traditional process of reserving by phone.
Certain Significant Risks and Uncertainties
The Company operates in a dynamic industry, and accordingly, can be affected by a variety of factors. For example, management of the Company believes that changes in any of the following areas could have a significant negative effect on the Company in terms of its future financial position, results of operations or cash flows: the ability to maintain an adequate rate of growth; the impact of the current economic climate on its business; the ability to effectively manage its growth; the ability to attract new restaurant customers; the ability to increase the number of visitors to its website and convert those visitors into diners; and the ability to retain existing restaurant customers and diners or encourage repeat reservations.
2. Summary of Significant Accounting Policies
Principles of Consolidation
These consolidated financial statements include the accounts of OpenTable, Inc. and its wholly-owned subsidiaries. All intercompany accounts and transactions have been eliminated in consolidation.
Acquisition of GuestBridge
In September 2009, the Company entered into an agreement with GuestBridge, Inc. ("GuestBridge"), a provider of guest management solutions, to purchase substantially all of the assets and assume certain liabilities of GuestBridge for approximately $3,000,000 in cash. The Company recorded $1,805,000 of goodwill, $1,066,000 of identifiable intangible assets and $129,000 of tangible assets in connection with the acquisition. The Company has included the effects of the transaction within the results of operations, prospectively, from October 2009 the date of acquisition. Pro forma financial information for acquisition accounted for as a business combination has not been presented, as the effects were not material to the Company's historical consolidated financial statements.
Use of Estimates
The preparation of the Company's financial statements in conformity with accounting principles generally accepted in the United States of America ("GAAP") requires management to make estimates and assumptions that affect the reported amounts of assets and liabilities and disclosure of contingent
56
OPENTABLE, INC.
NOTES TO CONSOLIDATED FINANCIAL STATEMENTS (Continued)
YEARS ENDED DECEMBER 31, 2009, 2008 AND 2007
2. Summary of Significant Accounting Policies (Continued)
assets and liabilities at the date of the financial statements and the reported amounts of income and expenses during the reporting period. These estimates are based on information available as of the date of the financial statements; therefore, actual results could differ from those estimates.
Foreign Currency Translation
The Company's operations are conducted in various countries around the world and the financial statements of its foreign subsidiaries are reported in the applicable foreign currencies (functional currencies). Financial information is translated from the applicable functional currency to the U.S. dollar, the reporting currency, for inclusion in the Company's consolidated financial statements. Income, expenses and cash flows are translated at average exchange rates prevailing during the fiscal period, and assets and liabilities are translated at fiscal period-end exchange rates. Resulting translation adjustments are included as a component of accumulated other comprehensive loss, net, in stockholders' equity. Foreign exchange transaction gains and losses are included in Other Income, net in the accompanying condensed consolidated statements of operations. Exchange gains and losses on intercompany balances that are considered permanently invested are also included as a component of accumulated other comprehensive loss, in stockholders' equity.
Cash and Cash Equivalents
The Company considers all highly liquid short-term investments with original maturities of three months or less at the time of purchase to be cash equivalents. At December 31, 2009 and 2008, cash and cash equivalents consist of cash, money market accounts, commercial paper and certificates of deposit.
Restricted Cash
Restricted cash represents money market accounts and a certificate of deposit held at a financial institution principally as security for deposits maintained in connection with the Company's credit card processors.
Short-term Investments
Short-term investments consist mainly of U.S. government agency securities, commercial paper and certificates of deposit. The Company classifies its investments as available-for-sale securities. The Company has classified all available for sale securities with readily available markets as short term, even though the stated maturity may be one year or more beyond the current balance sheet date, because of the intent to sell those securities as necessary, prior to maturity to meet liquidity needs. Available-for-sale securities are carried at fair value with unrealized gains and losses reported as a component of accumulated other comprehensive income (loss), net, in stockholders' equity. For the twelve month periods ended December 31, 2009 and 2008, realized and unrealized gains and losses on investments were not material. An impairment charge is recorded in the consolidated statements of operations for declines in fair value below the cost of an individual investment that are deemed to be other than temporary. Management judges whether a decline in value is temporary based on the length of time that the fair market value has been below cost combined with the severity of the decline.
57
OPENTABLE, INC.
NOTES TO CONSOLIDATED FINANCIAL STATEMENTS (Continued)
YEARS ENDED DECEMBER 31, 2009, 2008 AND 2007
2. Summary of Significant Accounting Policies (Continued)
For debt securities in an unrealized loss position which are deemed to be other-than-temporary, the difference between the security's then-current amortized cost basis and fair value is separated into (i) the amount of the impairment related to the credit loss (i.e., the credit loss component) and (ii) the amount of the impairment related to all other factors (i.e., the non-credit loss component). The credit loss component is recognized in earnings. The non-credit loss component is recognized in accumulated other comprehensive loss.
Fair Value
The Company records its financial assets and liabilities at fair value. The accounting standard for fair value provides a framework for measuring fair value, clarifies the definition of fair value and expands disclosures regarding fair value measurements. Fair value is defined as the price that would be received to sell an asset or paid to transfer a liability (an exit price) in an orderly transaction between market participants at the reporting date. The accounting standard establishes a three-tier hierarchy, which prioritizes the inputs used in the valuation methodologies in measuring fair value:
- •
- Level 1—Quoted prices in active markets for identical
assets or liabilities
- •
- Level 2—Inputs other than Level 1 that are
observable, either directly or indirectly, such as quoted prices for similar assets or liabilities; quoted prices in markets that are not active; or other inputs that are observable or can be
corroborated by observable market data for substantially the full term of the assets or liabilities.
- •
- Level 3—Unobservable inputs that are supported by little or no market activity and that are significant to the fair value of the assets or liabilities.
Concentrations of Credit Risk
Financial instruments which potentially subject the Company to concentration of credit risk consist primarily of cash and cash equivalents, restricted cash, short-term investments and accounts receivable. The Company places its cash and cash equivalents, short-term investments and restricted cash with major financial institutions throughout the world, which management assesses to be of high credit quality, in order to limit the exposure of each investment.
Credit risk with respect to accounts receivable is dispersed due to the large number of customers. In addition, the Company's credit risk is mitigated by the relatively short collection period. Collateral is not required for accounts receivable. The Company maintains an allowance for doubtful accounts receivable balances. The allowance is based upon historical loss patterns, the number of days that billings are past due and an evaluation of the potential risk of loss associated with problem accounts. Accounts receivable written-off against the allowance for doubtful accounts were $1,777,000, $747,000, and $457,000 for the years ended December 31, 2009, 2008 and 2007, respectively.
Deferred Offering Costs
Deferred offering costs of $1,183,000 are included in other assets on the Company's consolidated balance sheet at December 31, 2008. Upon the consummation of the initial public offering in May
58
OPENTABLE, INC.
NOTES TO CONSOLIDATED FINANCIAL STATEMENTS (Continued)
YEARS ENDED DECEMBER 31, 2009, 2008 AND 2007
2. Summary of Significant Accounting Policies (Continued)
2009, these amounts were offset against the proceeds of the offering and included in stockholder's equity. There were no amounts capitalized as of December 31, 2009.
Property and Equipment, net
Property and equipment, net is stated at cost less accumulated depreciation and amortization. Depreciation is computed using the straight-line method over the estimated useful lives of the assets, which is four years for restaurant hardware and three years for all other asset categories except leasehold improvement, which are amortized over the shorter of the lease term or expected useful life of the improvements.
Goodwill and Intangible Assets
The Company accounts for intangible assets and goodwill in accordance with Topic 350 (Statement of Financial Accounting Standard No. 142, Goodwill and Other Intangible Assets). Goodwill and intangible assets with indefinite lives are not amortized but are tested for impairment on an annual or whenever events or changes in circumstances indicate that the carrying amount of these assets may not be recoverable. Intangible assets with finite useful lives are amortized using the straight-line method over their useful lives and are reviewed for impairment in accordance with Topic 360 (Statement of Financial Accounting Standard No. 144, Accounting for the Impairment or Disposal of Long-Lived Assets).
Intangible assets include customer relationships of $637,000, developed technology of $344,000 and trademarks of $11,000. Intangible assets are amortized on a straight-line basis over the estimated useful lives which range from one to four years. Based on the current amount of intangibles subject to amortization, the estimated amortization expense for the succeeding five years is as follows: 2010: $296,000; 2011: $284,000; 2012: $253,000; 2013: $159,000.
For the annual goodwill impairment analysis, goodwill is evaluated at the reporting unit level. The evaluation for impairment is performed by comparing the reporting units carrying amount, including goodwill, to the fair value of the reporting unit. If the carrying amounts exceed the reporting unit fair value, then the second step of the goodwill impairment test is performed to determine the amount of the impairment loss. The Company has defined its annual goodwill impairment date as of August 31, 2010. The Company will use this date for their annual impairment test on a go forward basis.
Website and Software Development Costs
Costs related to website and internal-use software development are accounted for in accordance with Topic 350—Intangibles-Goodwill and Other ("Topic 350") (American Institute of Certified Public Accountants Statement of Position 98-1, Accounting for the Costs of Computer Software Developed or Obtained for Internal Use (SOP 98-1) and Emerging Issues Task Force Issue No. 00-2, Accounting for Website Development Costs (EITF 00-2)). Such software is primarily related to the Company's website, including support systems. In accordance with Topic 350, the Company begins to capitalize its costs to develop software when preliminary development efforts are successfully completed, management has authorized and committed project funding, and it is probable that the project will be completed and the software will be used as intended. Such costs are amortized on a straight-line basis over the estimated
59
OPENTABLE, INC.
NOTES TO CONSOLIDATED FINANCIAL STATEMENTS (Continued)
YEARS ENDED DECEMBER 31, 2009, 2008 AND 2007
2. Summary of Significant Accounting Policies (Continued)
useful life of the related asset, generally estimated between two to four years. Costs incurred prior to meeting these criteria are expensed as incurred and recorded within Technology expenses within the accompanying consolidated statements of operations. Costs incurred for enhancements that are expected to result in additional features or functionality are capitalized and expensed over the estimated useful life of the enhancements, generally between two and three years.
The Company capitalized $1,505,000, $1,003,000 and $419,000 in website and internal-use software development costs during the years ended December 31, 2009, 2008 and 2007, respectively. Amortization expense totaled $685,000, $431,000 and $175,000 during the fiscal years ended December 31, 2009, 2008 and 2007, respectively. Such costs are recorded in Operations and Support within the accompanying consolidated statements of operations.
The Company follows the guidance in Topic 985—Software (Statement of Financial Accounting Standard No. 86, Accounting for the Costs of Computer Software to Be Sold, Leased, or Otherwise Marketed) in accounting for costs incurred in connection with development of the software contained in the ERB used by all restaurant customers, and in a limited number of certain transactions the Company sells reservation systems which do not include the Company's ongoing service. All costs incurred to establish the technological feasibility of a computer product to be sold, leased or otherwise marketed are expensed as incurred. Costs incurred subsequent to establishing technological feasibility and through general product release are capitalized and amortized over the estimated product life. The period between technological feasibility and general product release is extremely short and the costs incurred during this stage are not material for the fiscal years ended December 31, 2009, 2008 and 2007, and are expensed as incurred in Technology expense.
Impairment of Long-Lived Assets and Long-Lived Assets to be Disposed of
The Company evaluates its long-lived assets for impairment whenever events or changes in circumstances indicate that the carrying amount of such assets may not be recoverable. Recoverability of assets to be held and used is measured by a comparison of the carrying amount of an asset group to future undiscounted net cash flows expected to be generated by the asset group. If such assets are considered to be impaired, the impairment to be recognized is measured by the amount by which the carrying amount of the assets exceeds the fair value of the assets. Assets to be disposed of are reported at the lower of the carrying amount or fair value less costs to sell.
Revenue Recognition
The Company's revenues include installation fees for the Company's ERB (including training), monthly subscription fees and a per-seated diner fee for each diner seated through the Company's online reservation system. As the Company provides its application as a service, the Company follows Topic 605—Revenue Recognition (the provisions of Securities and Exchange Commission Staff Accounting Bulletin No. 104, Revenue Recognition and Emerging Issues Task Force Issue No. 00-21, Revenue Arrangements with Multiple Deliverables). The Company recognizes revenue when all of the following conditions are met: there is persuasive evidence of an arrangement; the service has been provided to the customer; the collection of the fees is reasonably assured; and the amount of fees to be paid by the customer is fixed or determinable. Amounts paid by the customer include the right to use
60
OPENTABLE, INC.
NOTES TO CONSOLIDATED FINANCIAL STATEMENTS (Continued)
YEARS ENDED DECEMBER 31, 2009, 2008 AND 2007
2. Summary of Significant Accounting Policies (Continued)
Company hardware during the service period. Proportionate revenue related to the right to use Company hardware accounts for less than 10% of revenue for all periods presented.
Revenue from the installation of the ERB is recognized on a straight-line basis over the estimated customer life, commencing with customer acceptance. As of December 31, 2009, the estimated customer life was approximately six years, based on historical restaurant customer termination activity. To date the impact of changes in the estimated customer life has not been material to the Company's results of operations or financial position. Subscription revenues are recognized on a straight-line basis during the contractual period over which the service is delivered. Reservation revenues (or per-seated diner fees) are recognized on a transaction-by-transaction basis, as diners are seated by restaurant customers. Amounts that have been invoiced are recorded in accounts receivable and in deferred revenue or revenues, depending on whether the revenue recognition criteria have been met. Revenues are shown net of $6,940,000, $5,184,000 and $4,032,000 for the fiscal years ended December 31, 2009, 2008 and 2007, respectively, related to redeemable Dining Points issued to diners during the respective periods.
Revenue is recognized net of any taxes collected from customers and subsequently remitted to governmental authorities.
Installation Costs
The incremental direct customer acquisition costs associated with on-site system installations, including direct compensation costs of technicians providing installation services, are expensed as incurred within operations and support.
Dining Point Loyalty Program
The Company provides a points-based loyalty program, "OpenTable Dining Rewards," to registered diners who book and honor reservations through the OpenTable website. OpenTable Dining Rewards involves the issuance of "Dining Points" which can be accumulated and redeemed for "Dining Checks." When a diner accumulates a defined minimum number of points, he or she may redeem them for a Dining Check. Diners may present Dining Checks at any OpenTable restaurant and their bill is reduced by the check amount. If a diner does not make a seated reservation within any 12-month period, then his or her account is considered inactive and the accumulated Dining Points for the diner are reset to zero.
The Company recognizes the cost associated with Dining Points as contra-revenue in accordance with Topic 605-50—Revenue Recognition-Customer Payments and Incentives (EITF No. 01-09, Accounting for Consideration Given by a Vendor to a Customer (Including a Reseller of the Vendor's Products), and EITF No. 00-22, Accounting for "Points" and Certain Other Time- or Volume-Based Sales Incentive Offers, and Offers for Free Products or Services to be Delivered in the Future).
The recorded contra-revenue is an estimate of the eventual cash outlay related to the issued Dining Points and is booked at the time the points are earned by the diner (when the diner is "seated" by the restaurant). The Company estimates the contra-revenue for the issued Dining Points by analyzing the historical patterns of redemption and check-cashing activity.
61
OPENTABLE, INC.
NOTES TO CONSOLIDATED FINANCIAL STATEMENTS (Continued)
YEARS ENDED DECEMBER 31, 2009, 2008 AND 2007
2. Summary of Significant Accounting Policies (Continued)
Technology
In the consolidated statement of operations, technology expense includes employee compensation associated with the development of new technologies.
Operations and Support
In the consolidated statements of operations, operations and support expense includes employee compensation associated with the installation, support and maintenance of customers, as well as costs associated with restaurant equipment and connectivity, referral payments and shipping costs associated with restaurant equipment. Operations and Support expenses also include amortization of capitalized website and development costs.
Advertising Expense
Advertising costs are expensed when incurred and are included in sales and marketing expense in the accompanying consolidated statements of operations. Advertising costs include direct-marketing costs such as email marketing, market research, printing, public relations and tradeshow expenses. The Company incurred $1,013,000, $1,355,000 and $1,072,000 of advertising costs during the fiscal years ended December 31, 2009, 2008 and 2007, respectively.
Stock-Based Compensation
The Company applies the provisions of Topic 718 (SFAS No. 123R, Share-Based Payment), which requires compensation expense related to share-based transactions, including employee stock options, to be measured and recognized in the financial statements based on fair value. The Company adopted Topic 718 using the modified prospective method. Under modified prospective application, Topic 718 applies to new awards and to awards modified, repurchased, or cancelled after the required effective date. Additionally, compensation cost for the portion of awards for which the requisite service has not been rendered that are outstanding as of the required effective date are recognized as the requisite service is rendered on or after the required effective date. The compensation expense for that portion of awards is based on the grant-date fair value of those awards. The compensation expense for awards with grant dates prior to January 1, 2006, are attributed to periods beginning on or after the effective date using the attribution method that was used under Topic 718, except that the method of recognizing forfeitures only as they occur is not continued.
The Company is using the graded vesting attribution method prescribed by Topic 718 over the option vesting period, for all options granted on or after January 1, 2006. All options granted prior to January 1, 2006 are being amortized using a straight-line method.
Net Income (Loss) Per Share
The Company calculates net loss per share in accordance with Topic 260—Earnings per Share (SFAS No. 128, Earnings Per Share). Basic and diluted net income per share attributable to common stockholders are presented in conformity with the "two-class method" required for participating securities. The Company's weighted average unvested shares subject to repurchase and settled in shares of common stock upon vesting have the non-forfeitable right to receive dividends on an equal basis
62
OPENTABLE, INC.
NOTES TO CONSOLIDATED FINANCIAL STATEMENTS (Continued)
YEARS ENDED DECEMBER 31, 2009, 2008 AND 2007
2. Summary of Significant Accounting Policies (Continued)
with common stock and therefore are considered participating securities that must be included in the calculation of net income per share using the two-class method. In addition, holders of Series A and Series B convertible preferred stock are each entitled to receive annual non-cumulative dividends of $0.10 and $0.69 per share for Series A and B, respectively, payable prior and in preference to holders of common stock. In the event a dividend is paid on common stock, Series A and Series B convertible preferred stockholders are entitled to a proportionate share of any such dividend as if they were holders of common shares (on an as-if converted basis). In May 2009, all of the Company's outstanding convertible preferred stock converted into common stock in connection with the Company's initial public offering.
For periods with net income that ended prior to such conversion of Series A and Series B convertible preferred stock, net income per share information is computed using the two-class method. Under the two-class method, basic net income per share attributable to common stockholders is computed by dividing the net income attributable to common stockholders by the weighted average number of common shares outstanding during the period. Basic net income attributable to common stockholders is computed by an adjustment to subtract from net income the portion of current year earnings that the preferred shareholders would have been entitled to receive pursuant to their dividend rights had all of the year's earnings been distributed as well as an adjustment to subtract the non-forfeitable right to receive dividends by holders of unvested shares subject to repurchase. No such adjustment to earnings is made during periods with a net loss, as the holders of the convertible preferred shares had no obligation to fund losses. Diluted net income (loss) per share is computed by using the weighted-average number of common shares outstanding, plus, for periods with net income attributable to common stock, the dilutive effects of stock options. Potential dilutive shares are composed of incremental common shares issuable upon the exercise of stock options and warrants, and unvested common shares subject to repurchase.
Non-vested performance-based awards are included in the diluted shares outstanding each period if established performance criteria have been met at the end of the respective periods. 281,000, 343,000 and 343,000 shares were excluded from the dilutive shares outstanding for the years ended December 31, 2009, 2008 and 2007, respectively, as the performance criteria had not been met as of the respective dates. Anti-dilutive shares in the amounts of 388,000, 11,669,000 and 667,000 were excluded from the dilutive shares outstanding for the fiscal years ended December 31, 2009, 2008 and 2007.
63
OPENTABLE, INC.
NOTES TO CONSOLIDATED FINANCIAL STATEMENTS (Continued)
YEARS ENDED DECEMBER 31, 2009, 2008 AND 2007
2. Summary of Significant Accounting Policies (Continued)
The following table sets forth the computation of basic and diluted net income (loss) per share for the periods indicated:
| |
Year Ended December 31, | ||||||||||
|---|---|---|---|---|---|---|---|---|---|---|---|
| |
2009 | 2008 | 2007 | ||||||||
Basic net income (loss) per common share calculation: |
|||||||||||
Net income (loss) |
$ | 5,067,000 | $ | (1,024,000 | ) | $ | 9,216,000 | ||||
Less: Undistributed earnings allocated to participating securities |
(154,000 | ) | — | (5,779,000 | ) | ||||||
Net income (loss) attributable to common shares—basic |
$ | 4,913,000 | $ | (1,024,000 | ) | $ | 3,437,000 | ||||
Basic weighted average common shares outstanding |
17,352,000 | 10,016,000 | 9,522,000 | ||||||||
Basic net income (loss) per share |
$ | 0.28 | $ | (0.10 | ) | $ | 0.36 | ||||
Diluted net income (loss) per common share calculation: |
|||||||||||
Net income (loss) |
$ | 5,067,000 | $ | (1,024,000 | ) | $ | 9,216,000 | ||||
Less: Undistributed earnings allocated to participating securities |
(88,000 | ) | — | (5,875,000 | ) | ||||||
Net income (loss) attributable to common shares—diluted |
$ | 4,979,000 | $ | (1,024,000 | ) | $ | 3,341,000 | ||||
Weighted average shares used to compute basic net |
|||||||||||
income (loss) per share |
17,352,000 | 10,016,000 | 9,522,000 | ||||||||
Effect of potentially dilutive securities: |
|||||||||||
Unvested common shares subject to repurchase |
391,000 | — | 659,000 | ||||||||
Warrants to purchase common stock |
17,000 | — | 24,000 | ||||||||
Warrants to purchase convertible preferred stock |
65,000 | — | 76,000 | ||||||||
Employee stock options |
1,151,000 | — | 662,000 | ||||||||
Convertible preferred stock |
3,491,000 | — | — | ||||||||
Weighted average shares used to compute diluted net income (loss) per share |
22,467,000 | 10,016,000 | 10,943,000 | ||||||||
Diluted net income (loss) per share |
$ | 0.22 | $ | (0.10 | ) | $ | 0.31 | ||||
Correction of Earnings Per Share—Subsequent to the issuance of the Company's consolidated financial statements for the year ended December 31, 2007, management of the Company determined that fiscal 2007 basic and diluted net income per share was computed under the if-converted method rather than the required two-class method. In particular, the Company failed to subtract from net income the portion of current year earnings that the preferred shareholders would have been entitled to receive pursuant to their dividend rights had all of the year's earnings been distributed. Accordingly, corrections have been made herein to the previously reported net income per share amounts for fiscal 2007. Basic and diluted net income per share for fiscal 2007 was previously reported as $0.97 and $0.46, respectively. Using the two-class method, basic and diluted net income per share amounts for fiscal 2007 are $0.36 and $0.31, respectively, a decrease in the per share amounts previously reported by $0.61 and $0.15, respectively. The corrections in the 2007 net income per share calculation did not impact the total net income previously reported. The foregoing corrections are not considered material by the Company.
64
OPENTABLE, INC.
NOTES TO CONSOLIDATED FINANCIAL STATEMENTS (Continued)
YEARS ENDED DECEMBER 31, 2009, 2008 AND 2007
2. Summary of Significant Accounting Policies (Continued)
Comprehensive Income (Loss)
In accordance with Topic 220—Comprehensive Income (SFAS No. 130, Reporting Comprehensive Income), the Company reports by major components and as a single total, the change in its net assets during the period from non-owner sources. Comprehensive income (loss) consists of net income and accumulated other comprehensive income (loss), which includes certain changes in equity that are excluded from net income. Specifically, it includes cumulative foreign currency translation and the unrealized gain (loss) from investments.
Accumulated other comprehensive loss of $128,000 as of December 31, 2009 was comprised of $32,000 of unrealized loss on investments and $96,000 of foreign currency translation losses. Accumulated other comprehensive loss of $296,000 as of December 31, 2008 was comprised of $66,000 of unrealized gain on investments and $362,000 of foreign currency translation losses.
Income Taxes
The Company records income taxes using the asset and liability method which requires the recognition of deferred tax assets and liabilities for the expected future tax consequences of events that have been recognized in the Company's financial statements or tax returns. In estimating future tax consequences, generally all expected future events other than enactments or changes in the tax law or rates are considered. Valuation allowances are provided when necessary to reduce deferred tax assets to the amount expected to be realized.
The Company operates in various tax jurisdictions and is subject to audit by various tax authorities. The Company provides for tax contingencies whenever it is deemed probable that a tax asset has been impaired or a tax liability has been incurred for events such as tax claims or changes in tax laws. Tax contingencies are based upon their technical merits, relative tax law, and the specific facts and circumstances as of each reporting period. Changes in facts and circumstances could result in material changes to the amounts recorded for such tax contingencies.
On January 1, 2007, the Company adopted Topic 740—Income Taxes ("Topic 740") (Financial Accounting Standards Board ("FASB") Interpretation No. 48, Accounting for Uncertainty in Income Taxes—an interpretation of FASB Statement No. 109 (FIN No. 48), which supplements SFAS No. 109, Accounting for Income Taxes), by defining the confidence level that a tax position must meet in order to be recognized in the financial statements. Topic 740 requires that the tax effects of a position be recognized only if it is "more-likely-than-not" to be sustained based solely on its technical merits as of the reporting date. The Company considers many factors when evaluating and estimating its tax positions and tax benefits, which may require periodic adjustments and which may not accurately anticipate actual outcomes.
With the adoption of Topic 740, companies are required to adjust their financial statements to reflect only those tax positions that are more-likely-than-not to be sustained. Any necessary adjustment would be recorded directly to retained earnings and reported as a change in accounting principle as of the date of adoption. Topic 740 prescribes a comprehensive model for the financial statement recognition, measurement, presentation and disclosure of uncertain tax positions taken or expected to be taken in income tax returns. The total amount of unrecognized tax benefits as of the adoption date was $14,879,000. The Company's policy is to recognize interest and penalties related to unrecognized
65
OPENTABLE, INC.
NOTES TO CONSOLIDATED FINANCIAL STATEMENTS (Continued)
YEARS ENDED DECEMBER 31, 2009, 2008 AND 2007
2. Summary of Significant Accounting Policies (Continued)
tax benefits in income tax expense. See Note 9 for additional information, including the effects of adoption on the Company's consolidated financial position, results of operations and cash flows.
Recently Issued Accounting Standards
In December 2007, the FASB issued Topic 805—Business Combinations (SFAS No. 141 (Revised 2007), Business Combinations). Topic 805—Business Combinations establishes principles and requirements for how the acquirer of a business recognizes and measures in its financial statements the identifiable assets acquired, the liabilities assumed and any noncontrolling interest in the acquiree. Topic 805—Business Combinations also provides guidance for recognizing and measuring the goodwill acquired in the business combination and determines what information to disclose to enable users of the financial statements to evaluate the nature and financial effects of the business combination. The Company adopted Topic 805—Business Combinations for the fiscal year beginning January 1, 2009. The adoption of Topic 805—Business Combinations did not have a material impact on the Company's financial position or results of operations at the time of adoption.
In December 2007, the FASB issued Topic 810—Consolidation (SFAS No. 160, Non-controlling Interests in Consolidated Financial Statements) which amends Topic 810—Consolidation (Accounting Research Bulletin No. 51, Consolidated Financial Statements), to establish accounting and reporting standards for the non-controlling interest in a subsidiary and for the deconsolidation of a subsidiary. It clarifies that a non-controlling interest in a subsidiary is an ownership interest in the consolidated entity that should be reported as equity separate and apart from the parent's equity in the consolidated financial statements. In addition to the amendments to Topic 810—Consolidation, this statement amends Topic 260—Earnings per Share (SFAS No. 128, Earnings Per Share), so that earnings per share data will continue to be calculated the same way those data were calculated before this statement was issued. Topic 810—Consolidation is effective for fiscal years, and interim periods within those fiscal years, beginning on or after December 15, 2008. The adoption of Topic 810—Consolidation did not have a material impact on the Company's financial position or results of operations at the time of adoption.
In October 2009, the FASB issued Topic 605—Revenue Recognition (EITF 08-1, Multiple-Deliverable Revenue Arrangements, (amendments to FASB Topic 605, Revenue Recognition))and Topic 985—Software (EITF 09-3, Certain Arrangements That Include Software Elements, (amendments to FASB Topic 985, Software)). Topic 605—Revenue Recognition requires entities to allocate revenue in an arrangement using estimated selling prices of the delivered goods and services based on a selling price hierarchy. The amendments eliminate the residual method of revenue allocation and require revenue to be allocated using the relative selling price method. Topic 985—Software removes tangible products from the scope of software revenue guidance and provides guidance on determining whether software deliverables in an arrangement that includes a tangible product are covered by the scope of the software revenue guidance. Topic 605—Revenue Recognition and Topic 985—Software should be applied on a prospective basis for revenue arrangements entered into or materially modified in fiscal years beginning on or after June 15, 2010, with early adoption permitted. The Company is currently evaluating the impact of Topic 605—Revenue Recognition and Topic 985—Software on its consolidated financial statements.
66
OPENTABLE, INC.
NOTES TO CONSOLIDATED FINANCIAL STATEMENTS (Continued)
YEARS ENDED DECEMBER 31, 2009, 2008 AND 2007
2. Summary of Significant Accounting Policies (Continued)
In April 2009, the FASB issued additional requirements regarding interim disclosures about the fair value of financial instruments which the Company previously only disclosed on an annual basis, Topic 825-65 "Financial Instruments—Transition and Open Effective Date Information" (formerly FSP FAS 107-1 & APB 28-1, Interim Disclosures about Fair Value of Financial Instruments). Entities are now required to disclose the fair value of financial instruments which are not recorded at fair value in the financial statements in both their interim and annual financial statements. The Company adopted this guidance in the third quarter of fiscal 2009 and it did not have a significant impact on the consolidated financial position, results of operations and cash flows.
In April 2009, the FASB issued guidance on determining fair value when the volume and level of activity for an asset or liability has significantly decreased, and in identifying transactions that are not orderly, codified in Topic 820-10 Fair Value Measurements and Disclosures (formerly FSP FAS 157-4, Determining Fair Value When the Volume and Level of Activity for the Asset or Liability Have Significantly Decreased and Identifying Transactions That Are Not Orderly). This also includes guidance on identifying circumstances that indicate a transaction is not orderly. Based on the guidance, if an entity determines that the level of activity for an asset or liability has significantly decreased and that a transaction is not orderly, further analysis of transactions or quoted prices is needed, and a significant adjustment to the transaction or quoted prices may be necessary to estimate fair value. The Company adopted this guidance in the third quarter of fiscal 2009 and it did not have a significant impact on the consolidated financial position, results of operations and cash flows.
In June 2009, the Company adopted the new FASB authoritative guidance for subsequent events. This new guidance is intended to establish general standards for the accounting for and disclosure of events that occur after the balance sheet date but before financial statements are issued or are available to be issued. This new guidance became effective for interim or annual financial periods ending after June 15, 2009. The Company's adoption of this new guidance did not impact the consolidated results of operations or financial position.
In June 2009, the FASB issued the FASB Accounting Standards Codification (the "Codification"), the authoritative guidance for accounting principles generally accepted in the United States ("GAAP"). The Codification is now the single official source of authoritative GAAP (other than guidance issued by the SEC), superseding existing FASB, American Institute of Certified Public Accountants, and related literature. The Codification does not change GAAP. The Company adopted the Codification during the quarter ended September 30, 2009. The Company's adoption of the Codification did not have any substantive impact on the consolidated financial statements or related footnotes.
In January 2010, the FASB issued Accounting Standards Update No. 2010-06, Improving Disclosures about Fair Value Measurements ("ASU 2010-06"), which amends FASB Topic 820, Fair Value Measurements and Disclosures ("Topic 820") to require various additional disclosures regarding fair value measurements and also clarify certain existing disclosure requirements. Under ASU 2010-06, the Company will be required to: (1) disclose separately the amounts of significant transfers between Level 1 and Level 2 of the fair value hierarchy, (2) disclose activity in Level 3 fair value measurements including transfers into and out of Level 3 and the reasons for such transfers, and (3) present separately in its reconciliation of recurring Level 3 measurements information about purchases, sales, issuances and settlements on a gross basis. ASU 2010-06 does not change any accounting requirements, but is expected to have a significant effect on the disclosures of entities that measure assets and
67
OPENTABLE, INC.
NOTES TO CONSOLIDATED FINANCIAL STATEMENTS (Continued)
YEARS ENDED DECEMBER 31, 2009, 2008 AND 2007
2. Summary of Significant Accounting Policies (Continued)
liabilities at fair value. The amendments prescribed by ASU 2010-06 will be effective for fiscal quarter ending March 31, 2010, except for the requirements described in item (3) above, which will be effective for fiscal year beginning January 1, 2011. The Company currently does not expect the adoption of this ASU to have a material impact on the consolidated financial statements.
3. Short-Term Investments and Fair Value Measurements
Short-term investments are summarized as follows:
| |
Amortized Cost |
Unrealized Gains |
Unrealized Losses |
Estimated Fair Market Value |
|||||||||
|---|---|---|---|---|---|---|---|---|---|---|---|---|---|
At December 31, 2009: |
|||||||||||||
Commercial paper |
$ | 2,400,000 | $ | — | $ | — | $ | 2,400,000 | |||||
U.S. government and agency securities |
20,722,000 | 6,000 | (7,000 | ) | 20,721,000 | ||||||||
Certificates of deposit |
27,131,000 | 7,000 | (38,000 | ) | 27,100,000 | ||||||||
Total |
$ | 50,253,000 | $ | 13,000 | $ | (45,000 | ) | $ | 50,221,000 | ||||
| |
Amortized Cost |
Unrealized Gains |
Unrealized Losses |
Estimated Fair Market Value |
|||||||||
|---|---|---|---|---|---|---|---|---|---|---|---|---|---|
At December 31, 2008: |
|||||||||||||
Commercial paper |
$ | 898,000 | $ | 1,000 | $ | — | $ | 899,000 | |||||
U.S. government and agency securities |
10,595,000 | 65,000 | — | 10,660,000 | |||||||||
Certificates of deposit |
5,700,000 | — | — | 5,700,000 | |||||||||
Total |
$ | 17,193,000 | $ | 66,000 | $ | — | $ | 17,259,000 | |||||
The contractual maturities of available-for-sale securities at December 31, 2009 are presented in the following table:
| |
Amortized Cost |
Estimated Fair Market Value |
|||||
|---|---|---|---|---|---|---|---|
Due in one year or less |
$ | 49,274,000 | $ | 49,245,000 | |||
Due between one to two years |
979,000 | 976,000 | |||||
Total |
$ | 50,253,000 | $ | 50,221,000 | |||
Investment instruments are classified within Level 1 or Level 2 of the fair value hierarchy because they are valued using quoted market prices, broker or dealer quotations, or alternative pricing sources with reasonable levels of price transparency. The types of instruments that are generally classified within Level 1 of the fair value hierarchy include money market securities and U.S. government and agency securities. The types of investments that are generally classified within Level 2 of the fair value hierarchy include corporate securities and certificates of deposit. The Company classifies items in Level 2 if the investments are valued using observable inputs to quoted market prices, or other inputs
68
OPENTABLE, INC.
NOTES TO CONSOLIDATED FINANCIAL STATEMENTS (Continued)
YEARS ENDED DECEMBER 31, 2009, 2008 AND 2007
3. Short-Term Investments and Fair Value Measurements (Continued)
that are observable or can be corroborated by observable market data. Investments are held by a custodian who obtains investment prices from a third party pricing provider that uses standard inputs to models which vary by asset class.
In accordance with Topic 820—Fair Value Measurements and Disclosures, the following table represents the Company's fair value hierarchy for its financial assets:
| |
December 31, 2009 | December 31, 2008 | |||||||||||||||||
|---|---|---|---|---|---|---|---|---|---|---|---|---|---|---|---|---|---|---|---|
| |
Aggregate Fair Value |
Level 1 | Level 2 | Aggregate Fair Value |
Level 1 | Level 2 | |||||||||||||
Commercial paper |
$ | 2,400,000 | $ | 2,400,000 | $ | — | $ | 899,000 | $ | 899,000 | $ | — | |||||||
U.S. government and agency securities |
20,721,000 | 20,721,000 | — | 10,660,000 | 10,660,000 | — | |||||||||||||
Certificates of deposit |
27,100,000 | — | 27,100,000 | 5,700,000 | — | 5,700,000 | |||||||||||||
Total short-term investments |
$ | 50,221,000 | $ | 23,121,000 | $ | 27,100,000 | $ | 17,259,000 | $ | 11,559,000 | $ | 5,700,000 | |||||||
The Company chose not to elect the fair value option as prescribed by Topic 825—Financial Instruments (SFAS No. 159) for its financial assets and liabilities that had not been previously carried at fair value. Therefore, financial assets and liabilities not carried at fair value, such as accounts payable, are still reported at their carrying values.
4. Property and Equipment
Property and equipment consists of the following:
| |
December 31, | |||||||
|---|---|---|---|---|---|---|---|---|
| |
2009 | 2008 | ||||||
Restaurant hardware |
$ | 16,160,000 | $ | 16,049,000 | ||||
Computer equipment |
2,317,000 | 2,140,000 | ||||||
Software |
1,135,000 | 824,000 | ||||||
Capitalized development |
3,314,000 | 1,809,000 | ||||||
Furniture and fixtures |
308,000 | 168,000 | ||||||
Total |
23,234,000 | 20,990,000 | ||||||
Accumulated depreciation |
(11,718,000 | ) | (9,865,000 | ) | ||||
Property and equipment, net |
$ | 11,516,000 | $ | 11,125,000 | ||||
5. Line of Credit
In August 2007, the Company entered into a $2,000,000 line of credit for working capital needs. In September 2008, the line of credit was increased to $3,000,000. This line of credit is available through July 2010 and no amounts were outstanding under this line of credit as of December 31, 2009 and 2008. This line of credit agreement requires the Company to comply with various financial and non-financial covenants, including a minimum revenue requirement, and precludes the payment of dividends to shareholders without the permission of the lender. The Company was in compliance with all financial covenants at December 31, 2009 and 2008.
69
OPENTABLE, INC.
NOTES TO CONSOLIDATED FINANCIAL STATEMENTS (Continued)
YEARS ENDED DECEMBER 31, 2009, 2008 AND 2007
6. Other Income, Net
Other income, net, consists of the following:
| |
Year Ended December 31, | |||||||||
|---|---|---|---|---|---|---|---|---|---|---|
| |
2009 | 2008 | 2007 | |||||||
Interest income |
$ | 351,000 | $ | 545,000 | $ | 785,000 | ||||
Interest expense |
(3,000 | ) | — | (1,000 | ) | |||||
Foreign exchange transaction gain (loss), net |
(31,000 | ) | (130,000 | ) | 120,000 | |||||
Other non-operating income (loss), net |
29,000 | 53,000 | 47,000 | |||||||
Total |
$ | 346,000 | $ | 468,000 | $ | 951,000 | ||||
7. Commitments and Contingencies
Office Facility Leases
The Company leases its office facilities under operating lease agreements that expire at various dates through 2013. The terms of the lease agreements provide for rental payments on a graduated basis. The Company recognizes rent expense on a straight-line basis over the lease period.
Rental expense, principally for leased office space under operating lease commitments, was $1,719,000, $1,420,000 and $710,000 for the years ended December 31, 2009, 2008 and 2007, respectively.
Aggregate Future Lease Commitments
The Company's minimum payments under non-cancelable operating leases for office space having initial terms in excess of one year are as follows at December 31, 2009:
| |
Operating Leases |
||||
|---|---|---|---|---|---|
Year ending December 31: |
|||||
2010 |
$ | 1,688,000 | |||
2011 |
1,526,000 | ||||
2012 |
1,389,000 | ||||
2013 |
$ | 454,000 | |||
Total minimum lease payments |
$ | 5,057,000 | |||
Litigation
In July 2007, a complaint was filed against the Company by Online Reservations LLC ("Online Reservations") alleging intellectual property rights infringement. Online Reservations sought damages and injunctive relief. On March 19, 2008 the Company reached a settlement with Online Reservations in the amount of $1,600,000. The settlement was recorded as general and administrative expense in the third quarter of fiscal year 2007.
70
OPENTABLE, INC.
NOTES TO CONSOLIDATED FINANCIAL STATEMENTS (Continued)
YEARS ENDED DECEMBER 31, 2009, 2008 AND 2007
7. Commitments and Contingencies (Continued)
On May 12, 2009, a patent infringement lawsuit was filed against the Company by Mount Hamilton Partners, LLC ("Mount Hamilton"). Mount Hamilton seeks damages and injunctive relief. If an injunction is granted, it could force the Company to stop or alter certain of its business activities, such as certain aspects of the OpenTable Dining Rewards Program. The Company believes it has substantial and meritorious defenses to these claims and intends to vigorously defend its position. On October 6, 2009, the Company filed a petition for re-examination with the U.S. Patent and Trademark Office ("PTO"), asking the PTO to reexamine the patent in question and requesting that the claims of the Mount Hamilton patent be rejected. In addition, on October 21, 2009, the Company filed a motion in the district court asking the court to stay the current litigation pending the outcome of the requested reexamination proceeding. On December 7, 2009, the PTO granted the Company's petition for re-examination, and in its first non-final office action, rejected all of the claims of the patent at issue. In addition, the district court has stayed all proceedings pending re-examination of the patent. The Company is not currently able to estimate the loss, if any, that may result from this claim.
The Company is also subject to various other legal proceedings and claims arising in the ordinary course of business. Although occasional adverse decisions or settlements may occur, management believes that the final disposition of such matters will not have a material adverse effect on the Company's business, financial position, results of operations or cash flows.
8. Stockholders' Equity
Stock Split
On May 1, 2009, the Board approved a 1-for-12.5 reverse stock split of the Company's common stock and preferred stock which became effective immediately prior to the effectiveness of the Company's initial public offering. All shares and per share information referenced throughout the consolidated financial statements have been retroactively adjusted to reflect this stock split.
Initial Public Offering of Common Stock
On May 21, 2009, the Company completed its initial public offering whereby the Company sold 2,022,684 shares of common stock for a price of $20.00 per share. As part of the offering 1,427,316 shares were also sold by existing shareholders at a price of $20.00 per share. The Company received $34,638,000 net of offering costs. Approximately $5,811,000 in offering costs were incurred and have been deducted from additional paid-in capital.
Common Stock
At December 31, 2009, there were 100,000,000 shares of common stock authorized, 22,652,716 shares issued and 22,442,469 shares outstanding. Holders of common stock are entitled to dividends if and when declared by the board of directors.
Common Stock Subject To Repurchase
Historically, the Company typically allowed employees to exercise options prior to vesting. However, beginning with May 2008, options granted did not contain an early exercise provision. The Company has the right to repurchase at the original purchase price any unvested (but issued) common
71
OPENTABLE, INC.
NOTES TO CONSOLIDATED FINANCIAL STATEMENTS (Continued)
YEARS ENDED DECEMBER 31, 2009, 2008 AND 2007
8. Stockholders' Equity (Continued)
shares upon termination of service of an employee. The consideration received for an exercise of an option is considered to be a deposit of the exercise price and the related dollar amount is recorded as a liability. The shares and liability are reclassified into equity on a ratable basis as the award vests. The Company recorded a liability in accrued expenses of $1,750,000, and $2,984,000 relating to 382,927, and 728,028 options that were exercised and are unvested at December 31, 2009 and 2008, respectively. These shares which are subject to a repurchase right held by the Company are included in issued and outstanding shares as of December 31, 2009 and 2008.
Treasury Stock
In May 2007, in connection with litigation against a former employee, 3,200 shares of common stock were transferred back to the Company. As part of the settlement, the Company was not required to pay any consideration in return for the shares. These shares have been accounted for as treasury stock.
Common Stock Reserved For Future Issuance
At December 31, 2009, the Company has reserved the following shares of common stock for future issuances in connection with:
Stock option plan: |
|||||
Options outstanding |
2,287,661 | ||||
Options available for future grants |
1,284,693 | ||||
Total |
3,572,354 | ||||
Preferred Stock
Prior to the initial public offering, the Company had outstanding 6,898,187 shares of Series A convertible preferred stock and 2,177,550 shares of Series B convertible preferred stock. Each share of preferred stock was convertible into one share of common stock. The conversion of all shares of preferred stock into 9,075,737 shares of common stock occurred automatically upon the completion of the Company's initial public offering on May 21, 2009. Upon completion of the initial public offering, the Company authorized 5,000,000 shares of undesignated preferred stock. No preferred stock shares are outstanding as of December 31, 2009.
Stock Based Compensation
Effective January 1, 2006, the Company adopted Topic 718, which requires compensation costs related to share-based transactions, including employee stock options, to be recognized in the financial statements based on fair value.
Under Topic 718, the fair value of each option award is estimated on the date of grant using the Black-Scholes option pricing model.
72
OPENTABLE, INC.
NOTES TO CONSOLIDATED FINANCIAL STATEMENTS (Continued)
YEARS ENDED DECEMBER 31, 2009, 2008 AND 2007
8. Stockholders' Equity (Continued)
The Company determined weighted average valuation assumptions as follows:
- •
- Volatility—As the Company does not have an extensive trading history for its common stock, the expected stock
price volatility for the Company's common stock was estimated by taking the median historic price volatility for industry peers based on daily price observations over a period equivalent to the
expected term of the stock option grants. Industry peers consist of several public companies in the technology industry similar in size, stage of life cycle and financial leverage. The Company did not
rely on implied volatilities of traded options in its industry peers' common stock because the volume of activity was relatively low.
- •
- Expected term—The expected term was estimated using the simplified method allowed under Topic 718 (Securities
and Exchange Commission Staff Accounting Bulletin No. 107, Share-Based Payment).
- •
- Risk free rate—The risk free interest rate is based on the yields of U.S. Treasury securities with maturities
similar to the expected term of the options for each option group.
- •
- Forfeiture rate—The Company estimated the forfeiture rate based on our historical experience with forfeitures.
The Company reviews the estimated forfeiture rates each period end and makes changes as factors affecting the forfeiture rate calculations and assumptions change.
- •
- Dividend yield—The Company has never declared or paid any cash dividends and does not presently plan to pay cash dividends in the foreseeable future. Consequently, the Company used an expected dividend yield of zero.
The following summarizes the assumptions relating to the Company's stock options for the years ended December 31, 2009, 2008 and 2007, as permitted under Topic 718:
| |
Year Ended December 31, | |||||||||
|---|---|---|---|---|---|---|---|---|---|---|
| |
2009 | 2008 | 2007 | |||||||
Dividend yield |
0% | 0% | 0% | |||||||
Volatility |
52% - 53% | 55% | 48% - 54% | |||||||
Risk free interest rate |
2.53% - 2.65% | 1.54% - 3.34% | 3.61% - 5.16% | |||||||
Expected term, in years |
6.02 - 6.08 | 5.92 - 6.53 | 5.27 - 6.65 | |||||||
Under Topic 718, the Company recorded net stock-based compensation expense of $2,818,000, $3,970,000 and $3,103,000 for the years ended December 31, 2009, 2008 and 2007, respectively. The Company capitalized $103,000, $45,000 and $0 of stock-based compensation for the years ended December 31, 2009, 2008 and 2007, respectively, in association with website and software development costs (see Note 2).
Topic 718 requires the benefits of tax deductions in excess of recognized compensation expense to be reported as a financing cash flow, rather than as an operating cash flow. This requirement will reduce net operating cash flows and increase net financing cash flows in periods after adoption. For the year ended December 31, 2009, the Company recorded $1,703,000, of excess tax benefits from stock-based compensation.
73
OPENTABLE, INC.
NOTES TO CONSOLIDATED FINANCIAL STATEMENTS (Continued)
YEARS ENDED DECEMBER 31, 2009, 2008 AND 2007
8. Stockholders' Equity (Continued)
Stock Option Plans
Under the 2009 Equity Incentive Award Plan (the "2009 Plan"), which the Company adopted in 2009, 1,284,693 shares of common stock as of December 31, 2009 are reserved for the issuance of restricted stock, restricted stock awards, restricted stock units, stock appreciation rights, performance awards, deferred stock, and options (incentive stock options ("ISOs") or nonstatutory stock options ("NSOs")) to eligible participants. The 2009 Plan provides that on the first day of each fiscal year the number of shares available for issuance shall increase by an amount equal to the lesser of 744,063 shares or 3% of the outstanding shares of common stock on the last day of the immediately preceding fiscal year or a lesser amount as may be determined by the Board of Directors. In January 2010, the Board of Directors increased the number of shares of common stock authorized for issuance under the 2009 Plan by an additional 673,274. To date, both ISOs and NSO's have been granted at a price per share not less than the fair market value at the date of grant. Options granted to date generally vest over a four-year period from the date of grant at a rate of 25% after one year, then monthly on a straight-line basis thereafter. Options granted are generally are exercisable up to 10 years.
Under the 1999 Stock Plan (the "Plan"), which expired in May 2009, 0 shares of common stock as of December 31, 2009 are reserved for the issuance of ISOs or NSOs to eligible participants. During fiscal year 2006 and through June 30, 2009, the Board of Directors increased the number of shares of common stock authorized for issuance under the Plan by an additional 2,568,000. The ISOs were granted at a price per share not less than the fair market value at the date of grant. The NSOs were granted at a price per share not less than 85% of the fair market value at the date of grant. Options granted under the Plan generally vested over a four-year period from the date of grant at a rate of 25% after one year, then monthly on a straight-line basis thereafter. Options granted generally were exercisable up to 10 years. Certain option holders were allowed to exercise unvested options to acquire restricted shares. Upon termination of service, the Company has the right to repurchase at the original purchase price any unvested (but issued) common shares. Common shares purchased under the Plan were subject to certain restrictions, including the right of first refusal by the Company for sale or transfer of these shares to outside parties. The Company's right of first refusal terminated upon completion of the initial public offering of common stock.
Under the Plan, the Company granted 342,574 performance-based stock options to two executives. The first option was granted in November 2005 for 244,974 shares at an exercise price of $1.50 per share. The second option was granted in July 2006 for 97,600 shares at an exercise price of $1.50 per share. Beginning January 1, 2006, the Company accounted for these stock options as a fixed award in accordance with Topic 718—Stock Compensation. The grant-date fair value for the first option, based on the Black-Scholes valuation model (using a 50% volatility factor, 6.11 years estimated life of the warrant, exercise price of $1.50, 0% dividend yield and 4.57% risk-free interest rate) was $380,000. The fair value is to be amortized over the period during which management has estimated the performance metrics will be achieved. Stock-based compensation expense in the amount of $68,000, $71,000, $88,000 was recognized in each of the years ended December 31, 2009, 2008 and 2007, respectively. The grant-date fair value for the second option, based on the Black-Scholes valuation model (using a 50% volatility factor, 6.26 estimated life of the warrant, exercise price of $1.50, 0% dividend yield and 5.05% risk-free interest rate) was $255,000. The fair value is to be amortized over the period during which management has estimated the performance metrics will be achieved by. Stock-based compensation
74
OPENTABLE, INC.
NOTES TO CONSOLIDATED FINANCIAL STATEMENTS (Continued)
YEARS ENDED DECEMBER 31, 2009, 2008 AND 2007
8. Stockholders' Equity (Continued)
expense, for the second option, in the amount of ($158,000), $48,000 and $65,000 was recognized in the years ended December 31, 2009, 2008 and 2007, respectively. As of December 31, 2009, there was no expectation of achievement of the performance metrics associated with the second option. As such, all prior expense associated with the second option, in the amount of $184,000, was reversed during the fourth quarter of 2009.
A summary of the Company's stock option activity follows:
| |
|
|
Weighted Average Remaining Contractual Term (In Years) |
|
|||||||||
|---|---|---|---|---|---|---|---|---|---|---|---|---|---|
| |
Options Outstanding | |
|||||||||||
| |
Number of Shares |
Weighted Average Exercise Price |
Aggregate Intrinsic Value |
||||||||||
Outstanding—January 1, 2007 |
1,254,738 | $ | 1.39 | ||||||||||
Granted (weighted average fair value of $3.38) |
2,260,644 | 7.78 | |||||||||||
Exercised |
(1,178,095 | ) | 4.47 | ||||||||||
Canceled or expired |
(340,048 | ) | 1.81 | ||||||||||
Outstanding—December 31, 2007 |
1,997,239 | $ | 6.74 | ||||||||||
Granted (weighted average fair value of $6.38) |
561,848 | 8.59 | |||||||||||
Exercised |
(57,178 | ) | 1.85 | ||||||||||
Canceled or expired |
(84,059 | ) | 6.03 | ||||||||||
Outstanding—December 31, 2008 |
2,417,850 | $ | 7.31 | ||||||||||
Granted (weighted average fair value of $13.66) |
150,979 | 26.31 | |||||||||||
Exercised |
(246,554 | ) | 4.03 | ||||||||||
Canceled or expired |
(34,614 | ) | 11.07 | ||||||||||
Balance, December 31, 2009 |
2,287,661 | $ | 8.84 | 7.30 | $ | 38,134,000 | |||||||
Available for grant—December 31, 2009 |
1,284,693 | ||||||||||||
Options vested and expected to vest as of December 31, 2009 |
2,159,709 | $ | 9.01 | 7.32 | $ | 35,630,000 | |||||||
Options Exercisable as of December 31, 2009 |
999,322 | $ | 8.34 | 7.02 | $ | 17,109,000 | |||||||
The Company has computed the aggregate intrinsic value amounts disclosed in the above table based on the difference between the original exercise price of the options and the fair value of the Company's common stock of $25.46 at December 31, 2009. The aggregate intrinsic value of awards exercised during the year ended December 31, 2009, 2008 and 2007 was $5,204,000, $502,000 and $6,220,000, respectively.
75
OPENTABLE, INC.
NOTES TO CONSOLIDATED FINANCIAL STATEMENTS (Continued)
YEARS ENDED DECEMBER 31, 2009, 2008 AND 2007
8. Stockholders' Equity (Continued)
The options outstanding and exercisable as of December 31, 2009 have been segregated into ranges for additional disclosure as follows:
| |
Options Outstanding | Options Vested and Exercisable | ||||||||||||||
|---|---|---|---|---|---|---|---|---|---|---|---|---|---|---|---|---|
Exercise Price
|
Number Outstanding |
Weighted Average Remaining Contractual Life (Years) |
Weighted Average Exercise Price |
Number Exercisable |
Weighted Average Exercise Price |
|||||||||||
$ 0.10 - $ 1.50 |
595,267 | 6.00 | $ | 1.45 | 282,605 | $ | 1.40 | |||||||||
$ 1.50 - $ 4.88 |
576,238 | 7.07 | 4.88 | 289,451 | 4.88 | |||||||||||
$ 4.88 - $ 7.75 |
508,998 | 7.89 | 7.16 | 181,143 | 6.89 | |||||||||||
$ 7.75 - $10.63 |
133,568 | 8.56 | 10.63 | 37,666 | 10.63 | |||||||||||
$10.63 - $23.38 |
329,011 | 7.52 | 23.38 | 205,631 | 23.38 | |||||||||||
$23.38 - $26.90 |
144,579 | 9.87 | 26.29 | 2,826 | 26.78 | |||||||||||
Total |
2,287,661 | 7.30 | $ | 8.84 | 999,322 | $ | 8.34 | |||||||||
As of December 31, 2009, total unrecognized compensation costs, adjusted for estimated forfeitures, related to non-vested stock options was $3,536,000, which is expected to be recognized over the next two years.
Warrants
In May 2000, the Company issued two warrants to purchase 14,455 fully paid and non-assessable shares of the Company's common stock at an exercise price of $3.75 per share in connection with executive recruitment. The warrants for 11,122 and 3,333, expired unexercised in May 2007 and October 2007, respectively.
In connection with an equipment lease agreement, during 2000 and 1999, the lessor received warrants from the Company to purchase shares of convertible preferred stock as follows:
- •
- In 1999, the Company issued to the lessor warrants to purchase 6,940 shares of Series B convertible preferred stock
at an exercise price of $8.75 per share and 1,202 shares of Series B preferred stock at an exercise price of $10.63 per share. The warrants were exercisable until August 2, 2009, or five
years from an initial public offering by the Company, whichever was earlier.
- •
- In 2000, the Company issued warrants to a lessor to purchase 11,764 shares of Series D redeemable convertible preferred stock at an exercise price of $10.63 per share and 11,851 shares of Series D redeemable convertible preferred stock at an exercise price of $33.75 per share. The warrants were exercisable until April 25, 2010, or five years from an initial public offering by the Company, whichever was shorter.
During 2003, all of these outstanding Series B convertible preferred stock warrants and Series D redeemable convertible preferred stock warrants were converted into common stock warrants to purchase 6,315, 1,094, 41,056 and 41,362 shares, respectively, of the Company's common stock, at prices
76
OPENTABLE, INC.
NOTES TO CONSOLIDATED FINANCIAL STATEMENTS (Continued)
YEARS ENDED DECEMBER 31, 2009, 2008 AND 2007
8. Stockholders' Equity (Continued)
of $9.63, $11.63, $3.00 and $9.63 per share, respectively. In June 2009, all four warrants were net exercised in full using a cashless exercise feature, for 69,116 shares of common stock.
During June 2003, in connection with a past financing agreement, the Company issued a warrant to purchase 88,691 shares of Series A convertible preferred stock with an exercise price of $1.00 per share. In connection with the Company's initial public offering, the warrant was converted into a warrant to purchase 88,691 shares of common stock and the expiration date of the warrant was automatically extended until May 2013. In October 2009, the warrant was net exercised in full using a cashless exercise feature, for 85,483 shares of common stock in the aggregate.
In March 2007, the Company issued a warrant to purchase 3,541 shares of common stock at an exercise price of $4.88 per share to a contractor. The warrant was exercisable through March 4, 2017, a liquidation event, or the consummation of an initial public offering by the Company, whichever is earlier. The fair value of the warrant based on the Black-Scholes valuation model (using a 50% volatility factor, 10 year expected life, exercise price of $4.88, 0% dividend yield and 4.51% risk-free interest rate) was $11,000 which was reflected as general and administrative expense in the year ended December 31, 2007. Upon the completion of the Company's initial public offering, this warrant expired unexercised.
9. Income Taxes
The Company accounts for income taxes under the asset and liability method provided by Topic 740, Income Taxes. Under this method, deferred tax assets and liabilities are determined based on differences between financial reporting and income tax bases of assets and liabilities, and are measured using the enacted tax rates and laws that will be in effect when the differences are expected to reverse.
The Company's geographical breakdown of its income (loss) before provision for income taxes is as follows:
| |
Year Ended December 31, | |||||||||
|---|---|---|---|---|---|---|---|---|---|---|
| |
2009 | 2008 | 2007 | |||||||
Domestic |
$ | 9,957,000 | $ | 603,000 | $ | (224,000 | ) | |||
Foreign |
(927,000 | ) | 491,000 | 319,000 | ||||||
Income (loss) before provision for income taxes |
$ | 9,030,000 | $ | 1,094,000 | $ | 95,000 | ||||
77
OPENTABLE, INC.
NOTES TO CONSOLIDATED FINANCIAL STATEMENTS (Continued)
YEARS ENDED DECEMBER 31, 2009, 2008 AND 2007
9. Income Taxes (Continued)
The Company's provisions for income taxes are as follows:
| |
Year Ended December 31, | ||||||||||
|---|---|---|---|---|---|---|---|---|---|---|---|
| |
2009 | 2008 | 2007 | ||||||||
Current Tax Expense: |
|||||||||||
Federal |
$ | 1,563,000 | $ | 161,000 | $ | 94,000 | |||||
State |
777,000 | 400,000 | 34,000 | ||||||||
Foreign |
(26,000 | ) | 273,000 | 121,000 | |||||||
Total Current Tax Expense |
2,314,000 | 834,000 | 249,000 | ||||||||
Deferred Tax Expense: |
|||||||||||
Federal |
1,685,000 | 1,496,000 | (7,876,000 | ) | |||||||
State |
(36,000 | ) | (212,000 | ) | (1,494,000 | ) | |||||
Foreign |
— | — | — | ||||||||
Total Deferred Tax Expense |
1,649,000 | 1,284,000 | (9,370,000 | ) | |||||||
Total Income Tax Provision |
$ | 3,963,000 | $ | 2,118,000 | $ | (9,121,000 | ) | ||||
The difference between the actual rate and the federal statutory rate was as follows:
| |
Year Ended December 31, | |||||||||
|---|---|---|---|---|---|---|---|---|---|---|
| |
2009 | 2008 | 2007 | |||||||
Tax at federal statutory rate |
34.0 | % | 34.0 | % | 34.0 | % | ||||
State tax, net of federal benefit |
5.4 | % | 11.2 | % | 145.7 | % | ||||
Foreign rate differential |
— | 1.4 | % | 12.4 | % | |||||
Stock-based compensation |
8.6 | % | 98.4 | % | 1,164.2 | % | ||||
Disqualifying dispositions |
(2.5 | )% | — | — | ||||||
Other |
(0.7 | )% | 32.2 | % | 28.4 | % | ||||
Valuation allowance |
(0.9 | )% | 16.7 | % | (12,643.6 | )% | ||||
Effective tax rate |
43.9 | % | 193.9 | % | (11,259.0 | )% | ||||
As of December 31, 2009 and 2008 the Company had net deferred tax assets before valuation allowance of approximately $8,874,000 and $8,484,000, respectively. Realization of the deferred tax assets is dependent upon future taxable income, if any, the amount and timing of which are uncertain. Management evaluates the recoverability of deferred tax assets and the level of the valuation allowance in light of this uncertainty and had established a valuation allowance in an amount equal to the deferred tax assets at December 31, 2006. During the fourth quarter of 2007, management determined that it is more likely than not that the deferred tax assets will be realizable, based on the Company's earnings history and its projected future U.S. taxable income, and therefore the valuation allowance was substantially removed. The net valuation allowance increased by approximately $2,039,000 and $182,000 during the years ended December 31, 2009 and 2008, respectively. The Company's valuation allowance increased during 2009 for the change in its foreign tax credit carryforwards and the recording of a foreign branch net operating loss.
78
OPENTABLE, INC.
NOTES TO CONSOLIDATED FINANCIAL STATEMENTS (Continued)
YEARS ENDED DECEMBER 31, 2009, 2008 AND 2007
9. Income Taxes (Continued)
The components of the Company's net deferred tax assets for federal and state income taxes at December 31 are as follows:
| |
2009 | 2008 | |||||||
|---|---|---|---|---|---|---|---|---|---|
Deferred tax assets: |
|||||||||
Net operating loss carryforwards |
$ | 3,730,000 | $ | 4,313,000 | |||||
Deferred revenue |
1,609,000 | 1,516,000 | |||||||
Dining rewards points |
3,091,000 | 1,736,000 | |||||||
Accruals and reserves not currently deductible |
1,739,000 | 1,715,000 | |||||||
Tax credits |
703,000 | 628,000 | |||||||
Other |
(1,000 | ) | (1,000 | ) | |||||
Total deferred tax assets |
10,871,000 | 9,907,000 | |||||||
Deferred tax liabilities: |
|||||||||
Basis difference in fixed assets |
(1,605,000 | ) | (968,000 | ) | |||||
State taxes |
(392,000 | ) | (455,000 | ) | |||||
Total deferred tax liabilities |
(1,997,000 | ) | (1,423,000 | ) | |||||
Net deferred tax assets before valuation allowance |
8,874,000 | 8,484,000 | |||||||
Valuation allowance |
(2,352,000 | ) | (313,000 | ) | |||||
Net deferred tax asset |
$ | 6,522,000 | $ | 8,171,000 | |||||
At December 31, 2009, the Company had federal and state net operating loss carryforwards of approximately $2,740,000 and $7,982,000, respectively. The federal net operating losses will begin to expire in 2025. The state net operating losses will begin to expire in 2010. Utilization of the net operating loss carryforwards are subject to limitation due to the ownership change limitations provided by the Internal Revenue Code of 1986, as amended and similar state provisions. The Company has performed detailed analyses for purposes of Section 382 and determined an ownership change occurred in February 2003. The Company has $15.0 million in unrecognized tax benefits primarily as a result of the limitations on its net operating loss carryforwards. Applicable limitations have been incorporated and some net operating losses will not be available. At December 31, 2009, the Company had federal minimum tax credits of $469,000 which have no expiration date. The Company also has foreign tax credits of approximately $234,000 which begin to expire in 2016. In addition, the Company also has net operating losses in the United Kingdom of approximately $7,563,000 which are available to offset future income in the foreign jurisdiction. The losses can be carried forward indefinitely. The Company has recorded a valuation allowance against these losses because the Company believes realization is not more likely than not. In addition, utilization of the Company's foreign tax credit carryforward is dependent on generating sufficient foreign source income. The Company has determined that the realization of the foreign tax credit carryforward is not more likely than not, and accordingly has recorded a full valuation allowance.
The Company has deferred calculating U.S. income tax on certain foreign earnings that are deemed to be permanently reinvested overseas. Determination of the unrecognized deferred tax liability is not currently practical and the amount is not expected to be material.
79
OPENTABLE, INC.
NOTES TO CONSOLIDATED FINANCIAL STATEMENTS (Continued)
YEARS ENDED DECEMBER 31, 2009, 2008 AND 2007
9. Income Taxes (Continued)
As required by Topic 740, Income Taxes, the Company recognizes the financial statement benefit of a tax position only after determining that the relevant tax authority would more likely than not sustain the tax position following an audit. For tax positions meeting the more-likely-than-not threshold, the amount recognized in the financial statements is the largest benefit that has a greater than 50 percent likelihood of being realized upon ultimate settlement with the relevant tax authority.
A reconciliation of the beginning and ending amounts of unrecognized income tax benefits during the twelve month periods ending December 31, 2009, 2008 and 2007 is as follows:
| |
2009 | 2008 | 2007 | ||||||||
|---|---|---|---|---|---|---|---|---|---|---|---|
Balance of unrecognized tax benefits at January 1 |
$ | 15,020,000 | $ | 14,879,000 | $ | 14,879,000 | |||||
Additions for tax positions related to current year |
— | 141,000 | — | ||||||||
Reductions for tax positions of prior years |
(57,000 | ) | — | — | |||||||
Balance of unrecognized tax benefits at December 31 |
$ | 14,963,000 | $ | 15,020,000 | $ | 14,879,000 | |||||
In the event that any unrecognized tax benefits are recognized, the effective tax rate will be affected. Approximately $14,270,000 and $14,327,000 unrecognized tax benefit would impact the effective tax rate at December 31, 2009 and 2008, respectively, if recognized. The Company's policy is to classify interest accrued or penalties related to unrecognized tax benefits as a component of income tax expense. The Company accrued approximately $32,000 and $39,000 of interest and penalties related to estimated obligations based upon the tax positions taken in our tax returns at December 31, 2009 and 2008, respectively.
All tax years remain open to examination by major taxing jurisdictions to which the Company is subject. The Company files a federal and many state returns. The Company does not anticipate significant changes to its uncertain tax positions through the next fiscal year.
10. Employee Benefit Plan
In 1999, the Company adopted a defined contribution plan that is intended to qualify under section 401(k) of the Internal Revenue Code. The 401(k) plan provides retirement benefits for eligible employees. The 401(k) plan stipulates that eligible employees may elect to contribute to it upon date of hire. The Company began matching employee contributions under the terms of the 401(k) plan in 2007. Matching contributions totaled $101,000, $99,000 and $82,000 for the years ended 2009, 2008 and 2007, respectively.
11. Related Party Transactions
The Company paid a total of $5,000 to three members of the board of directors for reimbursable expenses incurred during the year ended December 31, 2008. No such reimbursements were made in any other year presented.
80
OPENTABLE, INC.
NOTES TO CONSOLIDATED FINANCIAL STATEMENTS (Continued)
YEARS ENDED DECEMBER 31, 2009, 2008 AND 2007
12. Segment Information
The Company has concluded that it operates in one industry—online reservations and guest management solutions. The Company has two reportable segments: North America and International, as defined by Topic 280—Segment Reporting (SFAS No. 131, Disclosures about Segments of an Enterprise and Related Information). Reportable segments have been identified based on how management makes operating decisions, assesses performance and allocates resources. The chief executive officer acts as the chief operating decision maker on behalf of both segments. The Company does not allocate assets discretely by reportable segments, and reviews asset information on a global basis, not by segment.
Summarized financial information concerning the reportable segments is as follows:
| |
North America Segment(1) |
International Segment |
Total Consolidated | ||||||||
|---|---|---|---|---|---|---|---|---|---|---|---|
Year ended December 31, 2009 |
|||||||||||
Revenues—subscription |
$ | 32,739,000 | $ | 3,115,000 | $ | 35,854,000 | |||||
Revenues—reservations |
28,828,000 | 609,000 | 29,437,000 | ||||||||
Revenues—installation and other |
3,184,000 | 121,000 | 3,305,000 | ||||||||
Income (loss) from operations |
14,591,000 | (5,907,000 | ) | 8,684,000 | |||||||
Interest income |
351,000 | — | 351,000 | ||||||||
Depreciation and amortization expense |
4,752,000 | 476,000 | 5,228,000 | ||||||||
Purchases of property, equipment and software |
5,397,000 | 599,000 | 5,996,000 | ||||||||
Year ended December 31, 2008 |
|||||||||||
Revenues—subscription |
$ | 28,003,000 | $ | 2,290,000 | $ | 30,293,000 | |||||
Revenues—reservations |
22,745,000 | 390,000 | 23,135,000 | ||||||||
Revenues—installation and other |
2,317,000 | 99,000 | 2,416,000 | ||||||||
Income (loss) from operations |
9,088,000 | (8,462,000 | ) | 626,000 | |||||||
Interest income |
534,000 | 11,000 | 545,000 | ||||||||
Depreciation and amortization expense |
4,026,000 | 350,000 | 4,376,000 | ||||||||
Purchases of property, equipment and software |
6,301,000 | 902,000 | 7,203,000 | ||||||||
Year ended December 31, 2007 |
|||||||||||
Revenues—subscription |
$ | 21,147,000 | $ | 1,287,000 | $ | 22,434,000 | |||||
Revenues—reservations |
16,820,000 | 190,000 | 17,010,000 | ||||||||
Revenues—installation and other |
1,634,000 | 70,000 | 1,704,000 | ||||||||
Income (loss) from operations |
4,974,000 | (5,830,000 | ) | (856,000 | ) | ||||||
Interest income |
777,000 | 8,000 | 785,000 | ||||||||
Depreciation and amortization expense |
2,817,000 | 184,000 | 3,001,000 | ||||||||
Purchases of property, equipment and software |
4,885,000 | 564,000 | 5,449,000 | ||||||||
- (1)
- A significant majority of the Company's "Technology" costs are incurred in the United States and as such are allocated to the North America segment. There are no internal revenue transactions between the Company's reporting segments.
81
OPENTABLE, INC.
NOTES TO CONSOLIDATED FINANCIAL STATEMENTS (Continued)
YEARS ENDED DECEMBER 31, 2009, 2008 AND 2007
12. Segment Information (Continued)
Geographical Information
The Company is domiciled in the United States and has international operations in Canada, Germany, Japan, Mexico and the United Kingdom. Information regarding the Company's operations by geographic area is presented below:
| |
Years Ended December 31, | |||||||||||
|---|---|---|---|---|---|---|---|---|---|---|---|---|
| |
2009 | 2008 | 2007 | |||||||||
Revenues: |
||||||||||||
United States |
$ | 61,300,000 | $ | 50,296,000 | $ | 37,864,000 | ||||||
International—all other |
7,296,000 | 5,548,000 | 3,284,000 | |||||||||
Total revenues |
$ | 68,596,000 | $ | 55,844,000 | $ | 41,148,000 | ||||||
Long-lived assets(1): |
||||||||||||
United States |
$ | 9,872,000 | $ | 10,619,000 | $ | 7,319,000 | ||||||
International—all others |
2,022,000 | 1,877,000 | 1,272,000 | |||||||||
Total long-lived assets |
$ | 11,894,000 | $ | 12,496,000 | $ | 8,591,000 | ||||||
- (1)
- Includes all non-current assets except deferred tax assets, goodwill and intangible assets.
The Company has no customers that individually, or in the aggregate, which exceed 10% of revenues or accounts receivable as of and for any of the period presented above.
82
ITEM 9. CHANGES IN AND DISAGREEMENTS WITH ACCOUNTANTS ON ACCOUNTING AND FINANCIAL DISCLOSURE
None.
ITEM 9A(T). CONTROLS AND PROCEDURES
Evaluation of Disclosure Controls and Procedures
Our management, with the participation of our Chief Executive Officer and our Chief Financial Officer, evaluated the effectiveness of our disclosure controls and procedures as of December 31, 2009. The term "disclosure controls and procedures," as defined in Rules 13a-15(e) and 15d-15(e) under the Securities Exchange Act of 1934, as amended (the "Exchange Act"), means controls and other procedures of a company that are designed to ensure that information required to be disclosed by a company in the reports that it files or submits under the Exchange Act is recorded, processed, summarized and reported, within the time periods specified in the SEC's rules and forms. Disclosure controls and procedures include, without limitation, controls and procedures designed to ensure that information required to be disclosed by a company in the reports that it files or submits under the Exchange Act is accumulated and communicated to the company's management, including its principal executive and principal financial officers, as appropriate to allow timely decisions regarding required disclosure. Management recognizes that any controls and procedures, no matter how well designed and operated, can provide only reasonable assurance of achieving their objectives and management necessarily applies its judgment in evaluating the cost-benefit relationship of possible controls and procedures. Based on the evaluation of our disclosure controls and procedures as of December 31, 2009, our Chief Executive Officer and Chief Financial Officer concluded that, as of such date, our disclosure controls and procedures were effective at the reasonable assurance level.
Changes in Internal Control over Financial Reporting
There was no change in our internal control over financial reporting identified in connection with the evaluation required by Rule 13a-15(d) and 15d-15(d) of the Exchange Act that occurred during the three months ended December 31, 2009 that has materially affected, or is reasonably likely to materially affect, our internal control over financial reporting.
Exemption from Management's Report on Internal Control Over Financial Reporting for 2009
This annual report does not include a report of management's assessment regarding internal control over financial reporting or an attestation report of the company's registered public accounting firm due to a transition period established by rules of the SEC for newly public companies.
None.
83
ITEM 10. DIRECTORS, EXECUTIVE OFFICERS AND CORPORATE GOVERNANCE
The information required by this item will be contained in our definitive proxy statement to be filed with the Securities and Exchange Commission in connection with our 2010 annual meeting of stockholders (the "Proxy Statement"), which is expected to be filed not later than 120 days after the end of our fiscal year ended December 31, 2009, and is incorporated in this report by reference.
We have adopted a Code of Business Conduct and Ethics that applies to all of our directors, officers and employees, including our principal executive officer and principal financial officer. The Code of Business Conduct and Ethics is posted on our website at http://investors.opentable.com/governance.cfm.
We intend to satisfy the disclosure requirement under Item 5.05 of Form 8-K regarding an amendment to, or waiver from, a provision of this Code of Business Conduct and Ethics by posting such information on our website, at the address and location specified above and, to the extent required by the listing standards of The NASDAQ Stock Market, by filing a Current Report on Form 8-K with the SEC, disclosing such information.
ITEM 11. EXECUTIVE COMPENSATION
The information required by this item will be set forth in the Proxy Statement and is incorporated herein by reference.
ITEM 12. SECURITY OWNERSHIP OF CERTAIN BENEFICIAL OWNERS AND MANAGEMENT AND RELATED STOCKHOLDER MATTERS
The information required by this item will be set forth in the Proxy Statement and is incorporated herein by reference.
ITEM 13. CERTAIN RELATIONSHIPS AND RELATED TRANSACTIONS, AND DIRECTOR INDEPENDENCE
The information, if any, required by this item will be set forth in the Proxy Statement and is incorporated herein by reference.
ITEM 14. PRINCIPAL ACCOUNTANT FEES AND SERVICES
The information required by this item will be set forth in the Proxy Statement and is incorporated herein by reference.
84
ITEM 15. EXHIBITS AND FINANCIAL STATEMENT SCHEDULES
(a)(1) Financial Statements
The following are included in Item 8:
- •
- Report of Independent Registered Public Accounting Firm
- •
- Consolidated Balance Sheets as of December 31, 2009 and 2008
- •
- Consolidated Statements of Operations for the years ended December 31, 2009, 2008, and 2007
- •
- Consolidated Statements of Stockholders' Equity and Comprehensive Income (Loss) for the years ended December 31,
2009, 2008, and 2007
- •
- Consolidated Statements of Cash Flows for the years ended December 31, 2009, 2008, and 2007
- •
- Notes to Consolidated Financial Statements
(a)(2) Financial Statement Schedule
All schedules are omitted because they are not applicable or the required information is shown in the financial statements or notes thereto.
(a)(3) Exhibits
See Item 15(b) below. Each management contract or compensatory plan or arrangement required to be filed has been identified.
(b) Exhibits
| Exhibit No. |
Description of Exhibit | |
|---|---|---|
| 3.1(1) | Amended and Restated Certificate of Incorporation of OpenTable, Inc. | |
3.2(2) |
Amended and Restated Bylaws of OpenTable, Inc. |
|
4.1(3) |
Form of OpenTable, Inc.'s Common Stock Certificate. |
|
4.2(4) |
Amended and Restated Investor Rights Agreement, by and between OpenTable, Inc. and the investors listed on Exhibit A thereto, dated October 28, 2004. |
|
10.1(4)* |
OpenTable, Inc. 1999 Stock Plan. |
|
10.2(3)* |
OpenTable, Inc. 2009 Equity Incentive Award Plan. |
|
10.3(3)* |
Form of Indemnification Agreement made by and between OpenTable, Inc. and each of its directors, officers and some employees. |
|
10.4(4)* |
Amended and Restated Offer Letter, between OpenTable, Inc. and Jeffrey Jordan, dated October 15, 2008. |
|
10.5(4)* |
Offer Letter, between OpenTable, Inc. and Matthew Roberts, dated June 16, 2005. |
|
10.6(4)* |
Offer Letter, between OpenTable, Inc. and Joel Brown, dated November 7, 2001. |
|
10.7(4)* |
Offer Letter, between OpenTable, Inc. and Michael Dodson, dated March 2, 2002. |
|
10.8(4)* |
Offer Letter, between OpenTable, Inc. and Charlie McCullough, dated September 8, 2003. |
85
| Exhibit No. |
Description of Exhibit | |
|---|---|---|
| 10.9(4) | Loan and Security Agreement, between Comerica Bank and OpenTable, Inc., dated July 30, 2007, as amended September 18, 2008. | |
10.10(5) |
Office Lease, by and between OpenTable, Inc. and CFRI Market Street Corp., dated March 29, 2007, as amended May 22, 2008. |
|
10.11(3) |
OpenTable, Inc. Independent Director Equity Compensation Policy. |
|
10.12(6) |
Second Amendment to Loan and Security Agreement, dated as of June 23, 2009, by and between Comerica Bank and OpenTable, Inc. |
|
10.13(7) |
Purchase Agreement, dated September 22, 2009, by and among the Company, Merrill Lynch, Pierce, Fenner & Smith Incorporated, as the representative for the several underwriters, and the Selling Stockholders. |
|
21.1(4) |
List of subsidiaries. |
|
23.1 |
Consent of Deloitte & Touche LLP, independent registered public accounting firm. |
|
24.1 |
Power of Attorney (included on signature page to this Annual Report on Form 10-K). |
|
31.1 |
Certification of Chief Executive Officer Pursuant to Rule 13-14(a) of the Securities Exchange Act of 1934 as Adopted Pursuant to Section 302 of the Sarbanes-Oxley Act of 2002. |
|
31.2 |
Certification of Chief Financial Officer Pursuant to Rule 13-14(a) of the Securities Exchange Act of 1934 as Adopted Pursuant to Section 302 of the Sarbanes-Oxley Act of 2002. |
|
32.1 |
Certification of Chief Executive Officer Pursuant to 18 U.S.C. Section 1350, as Adopted Pursuant to Section 906 of the Sarbanes-Oxley Act of 2002. |
|
32.2 |
Certification of Chief Financial Officer Pursuant to 18 U.S.C. Section 1350, as Adopted Pursuant to Section 906 of the Sarbanes-Oxley Act of 2002. |
- (1)
- Incorporated
by reference to Exhibit 3.3 to OpenTable, Inc.'s Amendment No. 4 to Registration Statement on Form S-1
(SEC File No. 333-157034) filed on May 6, 2009.
- (2)
- Incorporated
by reference to Exhibit 3.5 to OpenTable, Inc.'s Amendment No. 4 to Registration Statement on Form S-1
(SEC File No. 333-157034) filed on May 6, 2009.
- (3)
- Incorporated
by reference to the same numbered exhibit to OpenTable, Inc.'s Amendment No. 4 to Registration Statement on
Form S-1 (SEC File No. 333-157034) filed on May 6, 2009.
- (4)
- Incorporated
by reference to the same numbered exhibit to OpenTable, Inc.'s Registration Statement on Form S-1 (SEC File
No. 333-157034) filed on January 30, 2009.
- (5)
- Incorporated
by reference to the same numbered exhibit to OpenTable, Inc.'s Amendment No. 1 to Registration Statement on
Form S-1 (SEC File No. 333-157034) filed on March 13, 2009.
- (6)
- Incorporated
by reference to Exhibit 10.1 to OpenTable, Inc.'s Form 8-K filed on June 24, 2009.
- (7)
- Incorporated
by reference to Exhibit 1.1 to OpenTable, Inc.'s Form 8-K filed on September 23, 2009.
- *
- Indicates management contract or compensatory plan, contract or arrangement.
(c) Financial Statement Schedules
Schedules have been omitted because the information required to be set forth therein is not applicable or is shown in the consolidated financial statements or notes thereto.
86
Pursuant to the requirements of Section 13 or 15(d) of the Securities Exchange Act of 1934, the registrant has duly caused this report to be signed on its behalf by the undersigned, thereunto duly authorized, as of March 11, 2010.
| OPENTABLE, INC. | ||||
By: |
/s/ JEFFREY JORDAN Jeffrey Jordan Chief Executive Officer |
|||
Each person whose individual signature appears below hereby authorizes and appoints Jeffrey Jordan and Matthew Roberts, and each of them, with full power of substitution and resubstitution and full power to act without the other, as his or her true and lawful attorney-in-fact and agent to act in his or her name, place and stead and to execute in the name and on behalf of each person, individually and in each capacity stated below, and to file any and all amendments to this Annual Report on Form 10-K, and to file the same, with all exhibits thereto, and other documents in connection therewith, with the Securities and Exchange Commission, granting unto said attorneys-in-fact and agents, and each of them, full power and authority to do and perform each and every act and thing, ratifying and confirming all that said attorneys-in-fact and agents or any of them or their or his substitute or substitutes may lawfully do or cause to be done by virtue thereof.
Pursuant to the requirements of the Securities Exchange Act of 1934, this report has been signed below by the following persons on behalf of the registrant and in the capacities as of March 11, 2010.
Signature
|
Title
|
Date
|
||
|---|---|---|---|---|
| /s/ JEFFREY JORDAN Jeffrey Jordan |
Chief Executive Officer and Director (principal executive officer) |
March 11, 2010 | ||
/s/ MATTHEW ROBERTS Matthew Roberts |
Chief Financial Officer (principal financial and accounting officer) |
March 11, 2010 |
||
/s/ A. GEORGE "SKIP" BATTLE A. George "Skip" Battle |
Director |
March 11, 2010 |
||
/s/ ADAM R. DELL Adam R. Dell |
Director |
March 11, 2010 |
||
/s/ J. WILLIAM GURLEY J. William Gurley |
Director |
March 11, 2010 |
87
Signature
|
Title
|
Date
|
||
|---|---|---|---|---|
| /s/ THOMAS H. LAYTON Thomas H. Layton |
Director | March 11, 2010 | ||
/s/ DANNY MEYER Danny Meyer |
Director |
March 11, 2010 |
||
/s/ MICHELLE PELUSO Michelle Peluso |
Director |
March 11, 2010 |
||
/s/ PAUL PRESSLER Paul Pressler |
Director |
March 11, 2010 |
88
| Exhibit No. |
Description of Exhibit | |
|---|---|---|
| 3.1(1) | Amended and Restated Certificate of Incorporation of OpenTable, Inc. | |
3.2(2) |
Amended and Restated Bylaws of OpenTable, Inc. |
|
4.1(3) |
Form of OpenTable, Inc.'s Common Stock Certificate. |
|
4.2(4) |
Amended and Restated Investor Rights Agreement, by and between OpenTable, Inc. and the investors listed on Exhibit A thereto, dated October 28, 2004. |
|
10.1(4)* |
OpenTable, Inc. 1999 Stock Plan. |
|
10.2(3)* |
OpenTable, Inc. 2009 Equity Incentive Award Plan. |
|
10.3(3)* |
Form of Indemnification Agreement made by and between OpenTable, Inc. and each of its directors, officers and some employees. |
|
10.4(4)* |
Amended and Restated Offer Letter, between OpenTable, Inc. and Jeffrey Jordan, dated October 15, 2008. |
|
10.5(4)* |
Offer Letter, between OpenTable, Inc. and Matthew Roberts, dated June 16, 2005. |
|
10.6(4)* |
Offer Letter, between OpenTable, Inc. and Joel Brown, dated November 7, 2001. |
|
10.7(4)* |
Offer Letter, between OpenTable, Inc. and Michael Dodson, dated March 2, 2002. |
|
10.8(4)* |
Offer Letter, between OpenTable, Inc. and Charlie McCullough, dated September 8, 2003. |
|
10.9(4) |
Loan and Security Agreement, between Comerica Bank and OpenTable, Inc., dated July 30, 2007, as amended September 18, 2008. |
|
10.10(5) |
Office Lease, by and between OpenTable, Inc. and CFRI Market Street Corp., dated March 29, 2007, as amended May 22, 2008. |
|
10.11(3) |
OpenTable, Inc. Independent Director Equity Compensation Policy. |
|
10.12(6) |
Second Amendment to Loan and Security Agreement, dated as of June 23, 2009, by and between Comerica Bank and OpenTable, Inc. |
|
10.13(7) |
Purchase Agreement, dated September 22, 2009, by and among the Company, Merrill Lynch, Pierce, Fenner & Smith Incorporated, as the representative for the several underwriters, and the Selling Stockholders. |
|
21.1(4) |
List of subsidiaries. |
|
23.1 |
Consent of Deloitte & Touche LLP, independent registered public accounting firm. |
|
24.1 |
Power of Attorney (included on signature page to this Annual Report on Form 10-K). |
|
31.1 |
Certification of Chief Executive Officer Pursuant to Rule 13-14(a) of the Securities Exchange Act of 1934 as Adopted Pursuant to Section 302 of the Sarbanes-Oxley Act of 2002. |
|
31.2 |
Certification of Chief Financial Officer Pursuant to Rule 13-14(a) of the Securities Exchange Act of 1934 as Adopted Pursuant to Section 302 of the Sarbanes-Oxley Act of 2002. |
|
32.1 |
Certification of Chief Executive Officer Pursuant to 18 U.S.C. Section 1350, as Adopted Pursuant to Section 906 of the Sarbanes-Oxley Act of 2002. |
89
| Exhibit No. |
Description of Exhibit | |
|---|---|---|
| 32.2 | Certification of Chief Financial Officer Pursuant to 18 U.S.C. Section 1350, as Adopted Pursuant to Section 906 of the Sarbanes-Oxley Act of 2002. |
- (1)
- Incorporated
by reference to Exhibit 3.3 to OpenTable, Inc.'s Amendment No. 4 to Registration Statement on Form S-1
(SEC File No. 333-157034) filed on May 6, 2009.
- (2)
- Incorporated
by reference to Exhibit 3.5 to OpenTable, Inc.'s Amendment No. 4 to Registration Statement on Form S-1
(SEC File No. 333-157034) filed on May 6, 2009.
- (3)
- Incorporated
by reference to the same numbered exhibit to OpenTable, Inc.'s Amendment No. 4 to Registration Statement on
Form S-1 (SEC File No. 333-157034) filed on May 6, 2009.
- (4)
- Incorporated
by reference to the same numbered exhibit to OpenTable, Inc.'s Registration Statement on Form S-1 (SEC File
No. 333-157034) filed on January 30, 2009.
- (5)
- Incorporated
by reference to the same numbered exhibit to OpenTable, Inc.'s Amendment No. 1 to Registration Statement on
Form S-1 (SEC File No. 333-157034) filed on March 13, 2009.
- (6)
- Incorporated
by reference to Exhibit 10.1 to OpenTable, Inc.'s Form 8-K filed on June 24, 2009.
- (7)
- Incorporated
by reference to Exhibit 1.1 to OpenTable, Inc.'s Form 8-K filed on September 23, 2009.
- *
- Indicates management contract or compensatory plan, contract or arrangement.
90