Attached files
| file | filename |
|---|---|
| EX-32.0 - SECTION 1350 CERTIFICATIONS - CFS BANCORP INC | exhibit32-0.htm |
| EX-23.0 - CONSENT OF BKD, LLP - CFS BANCORP INC | exhibit23-0.htm |
| EX-31.1 - RULE 13A-14(A) CERTIFICATION OF CHIEF EXECUTIVE OFFICER - CFS BANCORP INC | exhibit31-1.htm |
| EX-31.2 - RULE 13A-14(A) CERTIFICATION OF CHIEF FINANCIAL OFFICER - CFS BANCORP INC | exhibit31-2.htm |
| EX-21.1 - SUBSIDIARIES OF CFS BANCORP, INC. - CFS BANCORP INC | exhibit21-1.htm |
UNITED STATES SECURITIES AND EXCHANGE
COMMISSION
Washington, D.C. 20549
Washington, D.C. 20549
___________________________________
FORM 10-K
___________________________________
___________________________________
| þ | ANNUAL REPORT PURSUANT TO SECTION 13 OR 15(d) OF THE SECURITIES EXCHANGE ACT OF 1934 |
For the fiscal year ended: December 31,
2009
OR
| o | TRANSITION REPORT PURSUANT TO SECTION 13 OR 15(d) OF THE SECURITIES EXCHANGE ACT OF 1934 |
Commission File No.:
0-24611
CFS Bancorp, Inc.
(Exact name of registrant as specified in its charter)
(Exact name of registrant as specified in its charter)
| Indiana | 35-2042093 |
| (State or other jurisdiction | (I.R.S. Employer |
| of incorporation or organization) | Identification Number) |
| 707 Ridge Road | |
| Munster, Indiana | 46321 |
| (Address of Principal Executive Offices) | (Zip Code) |
Registrant’s telephone number, including area
code:
(219) 836-5500
(219) 836-5500
Securities registered pursuant to Section
12(b) of the Act:
Not Applicable
Not Applicable
Securities registered pursuant to Section
12(g) of the Act:
Common Stock (par value $0.01 per
share)
(Title of Class)
(Title of Class)
Indicate by check mark if the registrant is a
well-known seasoned issuer, as defined in Rule 405 of the Securities Act.
Yes o No þ
Indicate by check mark if the
registrant is not required to file reports pursuant to Section 13 or 15(d) of
the Act. Yes o No þ
Indicate by check mark whether the
registrant (1) has filed all reports required to be filed by Section 13 or 15(d)
of the Securities Exchange Act of 1934 during the preceding 12 months (or for
such shorter period that the registrant was required to file such reports), and
(2) has been subject to such filing requirements for the past 90 days. Yes
þ No o
Indicate by check mark whether the
registrant has submitted electronically and posted on its corporate website, if
any, every Interactive Data File required to be submitted and posted pursuant to
Rule 405 of Regulation S-T during the preceding 12 months (or for such shorter
period that the registrant was required to submit and post such files).
Yes o No o
Indicate by check mark if disclosure of
delinquent filers pursuant to Item 405 of Regulation S-K is not contained
herein, and will not be contained, to the best of registrant’s knowledge, in
definitive proxy or information statements incorporated by reference in Part III
of this Form 10-K or any amendment to this Form 10-K. o
Indicate by check mark whether the
registrant is a large accelerated filer, an accelerated filer, a non-accelerated
filer, or a smaller reporting company. See definition of “large accelerated
filer,” “accelerated filer,” and “smaller reporting company” in Rule 12b-2 of
the Exchange Act. (Check one):
| Large accelerated filer o | Accelerated filer o | Non-accelerated filer o | Smaller reporting company þ |
Indicate by check mark whether the
registrant is a shell company (as defined in Rule 12b-2 of the Act).
Yes o No þ
As of June 30, 2009, the aggregate
value of the 10,764,458 shares of Common Stock of the Registrant outstanding on
such date, which excludes 519,393 shares held by affiliates of the Registrant as
a group, was approximately $43.3 million. This figure is based on the closing
sale price of $4.23 per share of the Registrant’s Common Stock reported on the
NASDAQ Global Market on June 30, 2009.
Number of shares of Common Stock
outstanding as of March 1, 2010: 10,819,635
DOCUMENTS INCORPORATED BY
REFERENCE
Portions of the definitive proxy
statement for the 2010 Annual Meeting of Shareholders are incorporated by
reference into Part III.
CFS BANCORP, INC. AND
SUBSIDIARIES
FORM 10-K
INDEX
| Page | ||||
| PART I. | ||||
| Item 1. | Business | 3 | ||
| Item 1A. | Risk Factors | 19 | ||
| Item 1B. | Unresolved Staff Comments | 24 | ||
| Item 2. | Properties | 24 | ||
| Item 3. | Legal Proceedings | 24 | ||
| Item 4. | Reserved | 24 | ||
| PART II. | ||||
| Item 5. | Market for Registrant’s Common Equity, Related Shareholder Matters, and Issuer | |||
| Purchases of Equity Securities | 24 | |||
| Item 6. | Selected Financial Data | 26 | ||
| Item 7. | Management’s Discussion and Analysis of Financial Condition and Results of Operations | 27 | ||
| Item 7A. | Quantitative and Qualitative Disclosures about Market Risk | 58 | ||
| Item 8. | Financial Statements and Supplementary Data | 61 | ||
| Item 9. | Changes in and Disagreements with Accountants on Accounting and | |||
| Financial Disclosure | 95 | |||
| Item 9A(T). | Controls and Procedures | 95 | ||
| Item 9B. | Other Information | 96 | ||
| PART III. | ||||
| Item 10. | Directors, Executive Officers, and Corporate Governance | 96 | ||
| Item 11. | Executive Compensation | 96 | ||
| Item 12. | Security Ownership of Certain Beneficial Owners and Management and Related | |||
| Shareholder Matters | 96 | |||
| Item 13. | Certain Relationships and Related Transactions and Director Independence | 97 | ||
| Item 14. | Principal Accounting Fees and Services | 97 | ||
| PART IV. | ||||
| Item 15. | Exhibits and Financial Statement Schedules | 97 | ||
| Signature Page | 99 | |||
| Certifications for Principal Executive Officer and Principal Financial Officer | 102 | |||
Certain statements contained in this Annual Report on Form 10-K, in other
filings with the U.S. Securities and Exchange Commission (SEC), and in the
Company’s press releases or other shareholder communications are
“forward-looking statements,” within the meaning of the Private Securities
Litigation Reform Act of 1995. Generally, these statements relate to business
plans or strategies; projections involving anticipated revenues, earnings,
profitability, or other aspects of operating results; or other future
developments in our affairs or the industry in which we conduct business.
Forward-looking statements may be identified by reference to a future period or
periods or by the use of forward-looking terminology such as “anticipate,”
“believe,” “estimate,” “expect,” “indicate,” “intend,” “plan,” “should,” “would
be,” “will,” “intend to,” “project,” or similar expressions or the negative
thereof.
We wish to caution readers not to place undue reliance on any such
forward-looking statements, which speak only as of the date made. We also advise
readers that various factors, including regional and national economic
conditions, changes in levels of market interest rates, credit and other risks
which are inherent in our lending and investment activities, legislative
changes, changes in the cost of funds, demand for loan products and financial
services, changes in accounting principles, ability to realize deferred tax
assets, competitive and regulatory factors, and successful execution of our
strategy and our Strategic Growth and Diversification Plan could affect our
financial performance and could cause actual results for future periods to
differ materially from those anticipated or projected. For further discussion of
risks and uncertainties that could cause actual results and events to differ
materially from such forward-looking statements see “Item 1A. Risk Factors” of
this Annual Report on Form 10-K. Such forward-looking statements reflect our
current views with respect to future events and are subject to certain risks,
uncertainties, assumptions, and changes in circumstances. Forward-looking
statements are not guarantees of future performance or outcomes, and actual
results or events may differ materially from those included in these statements.
We do not undertake, and specifically disclaim any obligation, to update any
forward-looking statements to reflect occurrences, unanticipated events, or
circumstances after the date of such statements.
PART I.
ITEM 1. BUSINESS
GENERAL
CFS Bancorp, Inc. (the Company) is a
registered unitary savings and loan holding company incorporated under the laws
of the State of Indiana. We operate in one operating segment, community banking.
We were formed in March 1998 and operate one wholly-owned subsidiary, Citizens
Financial Bank (the Bank), and were formed to facilitate the Bank’s
July 1998 conversion from a federally-chartered mutual savings bank to a
federally-chartered stock savings bank (the Conversion). In
conjunction with the Conversion, we completed an initial public offering of our
common stock. Pursuant to shareholder approval, in 2005, the Company changed its
state of incorporation from Delaware to Indiana. The change was effectuated
through a merger of the Delaware corporation with a wholly-owned Indiana
subsidiary formed for that purpose. We are subject to the primary oversight and
examination by the Office of Thrift Supervision (OTS). See
“Regulation – Regulation of Savings and Loan Holding Companies” below in this
“Business” section.
We employed 312 full-time equivalent employees
at December 31, 2009. Our executive officers and those of the Bank are
substantially identical. We do not own or lease any property but instead use the
premises, equipment and furniture of the Bank. We do not employ any persons
other than officers who are also officers of the Bank. In addition, we utilize
the support staff of the Bank from time to time. We are responsible for the
overall conduct, direction, and performance of the Bank and provide various
services, establish company-wide policies and procedures, and provide other
resources as needed, including capital to the Bank.
The Bank was originally organized in 1934 and
currently conducts its business from its executive offices in Munster, Indiana,
as well as 23 banking centers located in Lake and Porter counties in northwest
Indiana and Cook, DuPage and Will counties in Illinois. The Bank also maintained
an Operations Center in Highland, Indiana which was dedicated to its Customer
Call Center and other back office operations. The lease for the Operations
Center expired on December 31, 2009 and was not renewed. Employees who formerly
worked at the Operations Center were transferred to other space currently owned
or leased by the Bank.
3
In recent years, we have transitioned our
business model from a traditional savings and loan engaged primarily in
one-to-four family residential mortgage lending to a more diversified consumer
and business banking model while retaining our emphasis on high-quality
personalized client service.
We offer a wide variety of checking, savings,
and other deposit accounts. We also offer investment services and securities
brokerage targeted to individuals, families, and small- to medium-sized
businesses in our primary market areas through a non-affiliated third-party
provider. We have increased our business product offerings over the past few
years to enhance our opportunity to serve the business segment and cash
management needs of our client base. These products include public fund
deposits, a full array of sweep products including repurchase sweep accounts,
zero balance accounts, remote deposit capture and merchant services, business
overdraft privilege, business on-line banking, and other cash management related
services.
Our 23 banking centers are responsible for the
delivery of retail and small business loan and deposit products and services in
the communities we serve. Banking Center Managers and their staffs utilize a
relationship focused, client centric approach in identifying opportunities and
meeting the needs and exceeding the expectations of our clients. By providing
high-quality personalized client service and solutions, the Banking Centers
enhance our ability to improve our market share.
Our Business Banking Group is primarily
responsible for developing relationships with small- to medium-sized businesses
within the communities we serve by providing various loan, deposit, and cash
management products and services. A seasoned team of Business Relationship
Managers and an experienced credit team analyze overall relationship
opportunities to ensure the proper assessment of inherent risks and utilize
various loan structures to appropriately manage those risks.
We periodically evaluate potential
acquisitions and de novo branching opportunities to strengthen our overall
market presence. We target areas that we believe are not yet fully served by
other banking organizations, offer an attractive deposit base or potential
business growth opportunities, and complement our existing market territory. We
opened a new banking center in St. John, Indiana in September 2009. The banking
center is a free-standing building built on land that is leased for 20 years and
is part of a new shopping center development. In addition, we are planning a
second free-standing full service banking facility in Crown Point, Indiana with
an anticipated opening date in late 2011 as well as relocating our existing
banking facility in Harvey, Illinois with an anticipated opening date in
mid-2010. Both of these facilities are to be built on land we currently own. We
also own land for a new banking center in Bolingbrook, Illinois, and intend to
relocate our existing banking center in Flossmoor, Illinois, to a free-standing
full service banking facility. At this time, due to deteriorating market
conditions, we have delayed construction on these two properties
indefinitely.
The Bank’s revenue is primarily derived from
interest on loans and investment securities and fee-based income. The Bank’s
operations are significantly impacted by current economic conditions, the
regulations of the OTS, the monetary policy of the federal government, including
the Board of Governors of the Federal Reserve System (FRB), and
governmental tax policies and budgetary matters. The Bank’s revenue is largely
dependent on net interest income, which is the difference between interest
earned on interest-earning assets and the interest expense paid on
interest-bearing liabilities.
AVAILABLE INFORMATION
We are a public company and file
annual, quarterly and other reports, proxy statements, and other information
with the Securities and Exchange Commission (SEC). We make
available our annual report on Form 10-K, quarterly reports on Form 10-Q,
current reports on Form 8-K, and any amendments to these reports filed or
furnished pursuant to Section 13(a) or 15(d) of the Exchange Act free of charge,
on our website, www.citz.com, under the “Investor Relations” section.
These documents are available as soon as reasonably practicable after they are
filed or furnished to the SEC.
CORPORATE GOVERNANCE
We have established certain
committees of our Board of Directors, specifically Executive, Audit,
Compensation, and Corporate Governance and Nominating Committees. The duties of
the Executive Committee are set forth in the Board resolution that authorized
the committee. The charters of the Audit, Compensation, and Corporate Governance
and Nominating Committees as well as our Code of Conduct and Ethics can be found
on our website listed above. The information is also available in printed form
to any shareholder who requests it by writing to us in care of our Vice
President – Corporate Secretary, 707 Ridge Road, Munster, Indiana
46321.
4
MARKET AREA AND
COMPETITION
We maintain 23 banking centers in Lake and
Porter counties in northwest Indiana and in Cook, DuPage, and Will counties in
Illinois. All areas served are part of the Chicago Metropolitan Statistical
Area.
We have historically concentrated our efforts
in the markets surrounding our offices. Prior to 2008, we had also invested in
areas outside of our market through the direct origination of commercial loans
and the purchase of commercial syndication and participation loans. Our market
area reflects diverse socio-economic factors. Historically, the market area in
northwest Indiana and the south-suburban areas of Chicago were heavily dependent
on manufacturing. While manufacturing is still an important component of the
local economies, service-related industries have become increasingly more
significant to the region in the last decade. The local economies are affected
by the interrelation with Chicago as well as suburban business centers in the
area.
We face significant competition both in making
loans and in attracting deposits. The Chicago metropolitan area is one of the
largest money centers and the market for deposit funds is one of the most
competitive in the United States. The competition for loans comes principally
from commercial banks, other savings banks, savings associations, and to a
lesser degree, mortgage-banking companies, conduit lenders, and insurance
companies. The most direct competition for deposits has historically come from
savings banks, commercial banks, and credit unions. We face additional
competition for deposits from short-term money market funds, other corporate and
government securities funds, and other non-depository financial institutions
such as brokerage firms and insurance companies.
LENDING ACTIVITIES
General
We originate commercial and retail loans.
Included in the commercial loan portfolio are commercial and industrial,
commercial real estate (owner occupied, non-owner occupied, and multifamily),
and construction and land development loans. The retail loan portfolio includes
one-to-four family residential mortgage, construction and lot, and consumer
loans including home equity loans, home equity lines of credit (HELOCs), auto
loans, and other consumer loans. See the loans receivable composition table in
“Loans” within “Item 7. Management’s Discussion and Analysis of Financial
Condition and Results of Operations” of this Annual Report on Form
10-K.
We have also invested, on a participating
basis, in loans originated by other lenders and loan syndications. We apply the
same underwriting guidelines applicable to loans we originate when considering
investing in these loans. At December 31, 2009, we had syndications and
purchased participations totaling $52.4 million, of which $17.3 million were to
borrowers located outside of our market area. See total participation and
syndication loans by state in “Loans” within “Item 7. Management’s Discussion
and Analysis of Financial Condition and Results of Operations” of this Annual
Report on Form 10-K. We have historically invested in syndications and
participations to supplement the direct origination of our commercial loan
portfolio. During 2007, we experienced margin contraction and detected credit
risks in excess of our risk tolerances in the opportunities being presented in
this portion of our loan portfolio. As a result, we stopped purchasing new
syndications and participations in the second quarter of 2007.
Our lending strategy seeks to diversify our
portfolio in an effort to limit risks associated with any particular loan type
or industry while building a quality loan portfolio. We have established
specific collateral concentration limits in a manner we believe will not hamper
our relationship managers in the pursuit of new business opportunities in a
variety of sectors. Our commercial loan underwriting focuses on the cash flow
from business operations, the financial strength of the borrower and guarantors,
and the underlying collateral. We have tested and implemented loan grading
matrices for commercial and industrial loans and commercial real estate loans.
The grading criteria is based on core credit attributes that emphasize cash
flow, trends, collateral, and guarantor liquidity and removes subjective
criteria and bias. We have made the use of these matrices a requirement for all
commercial loans.
We utilize secondary market standards for
underwriting one-to-four family residential mortgage loans which facilitate our
ability to sell these loans into the secondary market if deemed necessary in the
future. Secondary market requirements place limitations on debt-to-income ratios
and loan size among other factors. As part of the underwriting process, we
evaluate, among other things, the applicant’s credit history, income, employment
stability, repayment capacity, and collateral. Since 2008, we have retained the
one-to-four family residential mortgage loans we originated.
5
We utilize a risk-based lending approach for
underwriting our home equity products and other consumer loans. This approach
evaluates the applicant’s credit score, debt-to-income ratio, and the collateral
value and tiers the interest rates based upon the evaluation of these
attributes.
The types of loans that we may originate are
subject to federal and state laws and regulations. Interest rates charged on
loans are affected principally by the inherent risks involved, demand for such
loans, the supply of money available for lending purposes, and the rates offered
by our competitors on such loans. These factors are, in turn, affected by
current economic conditions, the monetary policy of the federal government,
including the FRB, and governmental tax policies and budgetary
matters.
Certain officers have been authorized by the
Board of Directors to approve loans up to specific designated amounts. The Loan
Committee meets weekly and reviews any loans that exceed individual loan
approval limits. As part of its monthly review, the Board of Directors reviews
the Loan Committee minutes.
A federal savings bank generally may not make
loans to one borrower and related entities in an amount which exceeds 15% of its
unimpaired capital and surplus (or approximately $15.8 million in our case at
December 31, 2009), although loans in an amount equal to an additional 10% of
unimpaired capital and surplus may be made to a borrower if the loans are fully
secured by readily marketable securities.
We are also required to monitor our aggregate
loans to corporate groups. These are loans that are made to individual entities
that have a similar ownership group but are not considered to be a common
enterprise. While the individual loans are secured by separate properties and
underwritten based on separate cash flows, the entities may all be owned or
controlled by one individual or a group of individuals. We are required by
regulation to limit our aggregate loans to any corporate group to 50% of Tier 1
capital. At December 31, 2009, Tier 1 capital was $95.1 million. Our two largest
corporate group relationships at December 31, 2009 equaled $22.0 million and
$14.8 million, respectively. Both of these relationships are well below the
group limit of $47.5 million and are performing in accordance with their
terms.
COMMERCIAL LENDING
General
Our commercial lending portfolio includes
commercial and industrial, commercial real estate (owner occupied, non-owner
occupied, and multifamily), and construction and land development loans. The
business banking group is responsible for growing our commercial loan portfolio
by generating small- to medium-sized business relationships, which includes
cross-selling all bank products and services. Our short-term and revolving
commercial loans generally have variable interest rates indexed to the Wall
Street Journal prime lending rate, the London Interbank Offered Rate
(LIBOR), the Federal Home Loan Bank of Indianapolis
(FHLB–IN) rate, or the three- or five-year U.S.
Treasury obligations. Our longer term amortizing loans generally have balloon
dates of three to five years, which allows us to reprice the loans based on
current market conditions and changes in the asset quality.
Commercial and Industrial
Loans
We continue our strategic focus to shift from
commercial real estate to commercial and industrial lending. Our focus is small-
and medium-sized business relationships, which are generally secured by business
assets including accounts receivable, inventory, and equipment and typically
include the personal guarantees of the principals of the business. On occasion,
these loans will include a borrowing base and/or additional real estate as
collateral to enhance our security as well as the borrower’s commitment to the
loan. The commercial and industrial loans undergo an underwriting process
similar to the other types of commercial lending we offer; however, these loans
tend to have different risks associated with them since repayment is generally
based on the cash flows generated from the borrower’s business cycle. As of
December 31, 2009, the average outstanding balance of commercial and industrial
loans was approximately $181,000.
6
Commercial Real Estate
The commercial loan portfolio also includes
loans secured by commercial real estate. As of December 31, 2007, the commercial
real estate portfolio was segmented into owner occupied, non-owner occupied, and
multifamily loans. The reclassification was completed to provide better
disclosure of the types of commercial real estate loan concentrations held
within our portfolio.
Commercial real estate loans generally have
three to ten year terms with an amortization period of 25 years or less. We
offer fixed interest rate loans and variable rate loans with fixed interest
rates for the initial three or five year period which then adjust at each three
or five year interval to a designated index, such as the prime lending rate,
LIBOR, FHLB–IN rate, or U.S. Treasury obligations, plus a stipulated margin for
the remainder of the term. Commercial real estate loans generally have shorter
terms to maturity and higher yields than our one-to-four family residential
mortgage loans. Upon closing, we usually receive fees between 0.25% and 1%
(subject to competitive conditions) of the principal loan balance. These loans
may be subject to prepayment penalties. We generally obtain personal guarantees
for commercial real estate loans from any principal owning 20% or more of the
business.
We evaluate various aspects of commercial real
estate loans in an effort to manage credit risk to an acceptable risk tolerance
level. In underwriting these loans, consideration is given to the stability of
the property’s cash flow, future operating projections, management experience,
current and projected occupancy, location, and physical condition. In addition,
we generally perform sensitivity analysis on cash flows utilizing various
occupancy and interest rate assumptions when underwriting the loans to determine
how different scenarios may impact the borrowers’ ability to repay the loans. We
have generally imposed a debt service coverage ratio (the ratio of net income
before interest, depreciation, and debt payments to debt service) of not less
than 110% for commercial real estate loans. The loan-to-value ratios are
generally less than 80% at time of origination. The underwriting analysis
includes a review of the financial condition of borrowers and guarantors as well
as cash flows from global resources. An appraisal report is prepared by an
independent appraiser commissioned by us to determine property values based upon
current market conditions. We review all appraisal reports and any necessary
environmental site assessments before the loan closes.
Commercial real estate lending entails
substantial risks because these loans often involve large loan balances to
single borrowers and the payment experience on these loans is typically
dependent on the successful operation of the project or business. These risks
can also be significantly affected by supply and demand conditions in the local
market for apartments, offices, warehouses, or other commercial space. We
attempt to mitigate our risk exposure by considering properties with existing
operating history that can be analyzed, requiring conservative debt coverage
ratios, and periodically monitoring the operation and physical condition of the
collateral as well as the business occupying the property.
Commercial real estate owner occupied loans
are generally a borrower purchased building where the borrower occupies at least
50% of the space with the primary source of repayment dependent on sources other
than the underlying collateral. These types of loans are secured by properties
housing the owner’s business such as light industrial/warehouses, restaurants,
single tenant office properties, multi-tenant office properties, and
professional office properties. At December 31, 2009, the average outstanding
balance of commercial real estate owner occupied loans approximated
$511,000.
Commercial real estate non-owner occupied
loans are generally loans collateralized by commercial income-producing
properties such as office buildings, retail shopping centers, mixed-use
commercial buildings, and properties used in the hospitality industry. We
generally obtain the personal guarantees of the borrower to help mitigate the
risk associated with this type of lending. At December 31, 2009, the average
outstanding balance of commercial real estate non-owner occupied loans
approximated $810,000.
Commercial real estate multifamily loans
include loans to purchase or refinance residential rental properties with five
or more units such as apartments, town homes, and nursing homes. In 2008, we
hired an experienced relationship manager to focus solely on growing the
multifamily loan portfolio. Our emphasis is to originate multifamily loans
collateralized by properties with 24 units or less. At December 31, 2009, the
average outstanding balance of commercial real estate multifamily loans
approximated $589,000.
7
Construction and Land Development
Loans
We provide construction loans for various
commercial real estate and multifamily residential projects. We also originate
loans to developers for the purpose of developing the land (e.g., roads, sewer,
and water) for sale. Due to the higher degree of risk and the current lack of
activity in the housing and land development markets, we began to reduce our
exposure to this type of lending during 2008 and expect this trend will
continue.
Construction and land development loans are
secured by a mortgage on the property which is generally limited to the lesser
of 80% of its appraised value or 85% of its cost less developer profit,
overhead, and interest reserves. This type of loan is typically made for a
period of up to three years. We require monthly interest payments during the
loan’s term. The principal balance of the loan is reduced as units are sold or
at maturity upon the borrower obtaining permanent financing. In addition, we
generally obtain personal guarantees from the borrower’s principals for
construction and land development loans.
The loan underwriting and processing
procedures require a property appraisal by an approved independent appraiser and
each construction and development loan is reviewed by independent architects,
engineers, or other qualified third parties for verification of costs.
Disbursements during the construction phase are based on regular on-site
inspections and approved certifications. In the case of construction loans on
commercial projects where we provide the permanent financing, we usually require
executed lease commitments on some portion of the property under construction
from qualified tenants. In addition, we primarily provide residential and
commercial construction lending within our market area.
Construction and land development financing is
generally considered to involve a higher degree of risk of loss than long-term
financing on improved, owner occupied real estate. The risk of loss on a
construction loan is dependent largely upon the accuracy of the initial estimate
of the property’s value at completion of construction or development, the
estimated cost (including interest) of construction, and the absorption rate of
unit sales utilized in the original appraisal report. If the estimate of
construction cost proves to be inaccurate, we typically require the borrower to
inject cash equity to cover any shortfall. If the borrower is unable to cover a
shortfall, we may then need to advance funds beyond the amount originally
committed to ensure completion of the development.
In evaluating any new originations of
construction and development loans, we generally consider evidence of the
availability of permanent financing or a takeout commitment to the borrower, the
reputation of the borrower and the contractor, the amount of the borrower’s
equity in the project, independent valuations and reviews of cost estimates,
pre-construction sale or leasing information, and cash flow projections of the
borrower. To reduce the inherent risks, we may require performance bonds in the
amount of the construction contract and generally obtain personal guarantees
from the principals of the borrower.
As of December 31, 2007, we reclassified
certain construction and lot loans where the loan was related to the
construction of a one-to-four family residence. These loans generally convert to
permanent mortgage loans upon the completion of the project. As a result of the
reclassification, these loans are included in our retail loan portfolio. At
December 31, 2009, the average outstanding balance of commercial construction
and land development loans was approximately $832,000.
RETAIL LENDING
General
The retail lending program includes
one-to-four family residential loans, home equity loans, HELOCs, one-to-four
family residential construction and lot loans, auto loans, and other consumer
loans. At the beginning of 2008, we shifted our strategic focus relating to the
origination of residential loans from commissioned originators focused on loan
originations to salaried senior personal bankers focused on relationship
development. We currently employ three senior personal bankers responsible for
the origination of retail loans within our geographic footprint as well as the
sale of other products and services. Previously, our primary focus was
originating fixed-rate loans and selling them in the secondary market and
retaining variable-rate retail products; however, we currently retain all of the
one-to-four family residential loans we originate.
8
One-to-Four Family Residential
Loans
All of our one-to-four family residential
mortgage loans consist of conventional loans. Conventional loans are neither
insured by the Federal Housing Administration (FHA) nor partially
guaranteed by the Department of Veterans Affairs (VA). The vast
majority of our one-to-four family residential mortgage loans are secured by
properties located in our market areas.
Our current maximum loan-to-value
(LTV) ratio for these loans is generally 80% of
the lesser of the secured property’s sales price or appraised value. We had
offered loans until September 2008 with a maximum LTV of 95% while generally
requiring private mortgage insurance on the portion of the principal amount that
exceeded 80% of the appraised value. We were not an active originator of
sub-prime or “Alt-A” loans and have not originated option adjustable-rate
mortgages or negative amortization loans.
Our residential mortgage loans have either
fixed interest rates or variable interest rates which adjust periodically during
the term of the loan. Fixed-rate loans generally have maturities between 10 and
30 years and are fully amortizing with monthly loan payments sufficient to repay
the total amount of the loan and interest by the maturity date. We do not
originate non-amortizing one-to-four family residential loans. Substantially all
of our one-to-four family residential mortgage loans contain due-on-sale
clauses, which permit us to declare the unpaid balance to be due and payable
upon the sale or transfer of any interest in the property securing the loan
without our prior approval. We enforce such due-on-sale clauses.
Our fixed-rate loans are generally originated
under terms, conditions, and documentation which permit them to be sold in the
secondary market if we should elect to do so. At December 31, 2009, $104.5
million, or 56.4%, of our one-to-four family residential mortgage loans were
fixed-rate loans.
The adjustable-rate one-to-four family
residential mortgage (ARM) loans
currently offered have interest rates which are fixed for the initial three- or
five-year period and then adjust annually to the corresponding constant maturity
(CMT) plus a stipulated margin. ARMs generally
have a cap of 2% on any increase or decrease in the interest rate at any
adjustment date and include a specified cap on the maximum interest rate
increases over the life of the loan. This cap is generally 6% above the initial
rate. ARMs require that any payment adjustment resulting from a change in the
interest rate of an adjustable-rate loan be sufficient to result in full
amortization of the loan by the end of the loan term and do not permit any of
the increased payment to be added to the principal amount of the loan, or
so-called negative amortization. We do not have any interest-only adjustable
rate one-to-four family residential loans in our portfolio. At December 31,
2009, $80.8 million, or 43.6%, of our one-to-four family residential mortgage
loans were adjustable-rate loans.
Home Equity Products
The majority of our home equity products are
HELOCs which are structured as a variable-rate line of credit with terms up to
20 years including a 10 year repayment period. We also offer home equity loans
with a 10 year term which have a fixed-rate through maturity. Our home equity
products are secured by the underlying equity in the borrower’s residence. These
products currently require LTV ratios of 80% or less after taking into
consideration any first mortgage loan if the borrower’s first mortgage loan is
also held with the Bank; if not, the LTV is limited to 70% or less. There is a
higher level of risk associated with this type of lending since these products
are typically secured by a second mortgage on the applicant’s residence. We look
to the borrower’s credit score and a verification of the borrower’s
debt-to-income ratio as an indication of the applicant’s ability to pay and a
factor in establishing the interest rate on the loan or line of
credit.
Retail Construction and Land
Development
Beginning December 31, 2007, we reclassified
our construction and lot loans for one-to-four family residences out of
commercial construction and land development. These loans are typically loans on
single lots for the construction of the borrower’s single family residence. Due
to the current economic conditions and lack of activity in the housing and land
development markets, we have reduced our exposure to this type of lending since
2008.
9
Other Loans
Other retail loans consist primarily of
consumer loans, loans secured by deposit accounts, and auto loans. We are not
actively marketing these types of loans and offer them primarily as an
accommodation to our existing relationship clients.
SECURITIES ACTIVITIES
Our investment policy, which has been approved
by our Board of Directors, prescribes authorized investments and outlines our
practices for managing risks involved with investment securities. Our
investments are managed to balance the following objectives:
- protecting net interest income from the impact of changes in market interest rates;
- providing liquidity for loan demand, deposit fluctuations, and other balance sheet changes;
- preserving principal;
- maximizing return on invested funds within acceptable risk guidelines; and
- meeting pledging and liquidity requirements.
Our investment policy permits investments in
various types of securities including obligations of the U.S. Treasury, federal
agencies, government sponsored enterprises (GSEs), corporate
obligations (AAA rated), pooled trust preferred securities, other equity
securities, commercial paper, certificates of deposit, and federal funds sold to
financial institutions approved by the Board of Directors. We currently do not
participate in hedging programs, interest rate swaps, or other activities
involving the use of off-balance-sheet derivative instruments.
We evaluate all securities on a quarterly
basis, and more frequently when economic conditions warrant additional
evaluations, for determining if an other-than-temporary impairment (OTTI) exists
pursuant to guidelines established in ASC 320-10, Investments – Debt and Equity Securities. In evaluating the possible impairment of
securities, consideration is given to the length of time and the extent to which
the fair value has been less than cost, the financial conditions and near-term
prospects of the issuer, and our ability and intent to retain our investment in
the issuer for a period of time sufficient to allow for any anticipated recovery
in fair value. In analyzing an issuer’s financial condition, we may consider
whether the securities are issued by the federal government or its agencies or
government sponsored agencies, whether downgrades by bond rating agencies have
occurred, and the results of reviews of the issuer’s financial
condition.
If we determine that an investment experienced
an OTTI, we must then determine the amount of the OTTI to be recognized in
earnings. If we do not intend to sell the security and it is more likely than
not that we will not be required to sell the security before recovery of its
amortized cost basis less any current period loss, the OTTI will be separated
into the amount representing the credit loss and the amount related to all other
factors. The amount of the OTTI related to the credit loss is determined based
on the present value of cash flows expected to be collected and is recognized in
earnings. The amount of the OTTI related to other factors will be recognized in
other comprehensive income, net of applicable taxes. The previous amortized cost
basis less the OTTI recognized in earnings will become the new amortized cost
basis of the investment. If we intend to sell the security or it is more likely
than not we will be required to sell the security before recovery of its
amortized cost basis less any current period credit loss, the OTTI will be
recognized in earnings equal to the entire difference between the investment’s
amortized cost basis and its fair value at the balance sheet date. Any
recoveries related to the value of these securities are recorded as an
unrealized gain (as other comprehensive income (loss) in shareholders’ equity)
and not recognized in income until the security is ultimately sold. From time to
time we may dispose of an impaired security in response to asset/liability
management decisions, future market movements, business plan changes, or if the
net proceeds can be reinvested at a rate of return that is expected to recover
the loss within a reasonable period of time.
10
SOURCE OF FUNDS
General
Deposits are the primary source of funds for
lending and other investment purposes. In addition to deposits, we derive funds
from loan principal repayments and borrowings. Loan repayments are historically
a relatively stable source of funds, while deposit inflows and outflows are
significantly influenced by general interest rates and money market conditions.
We have used borrowings in the past, primarily FHLB advances, to supplement our
deposits as a source of funds.
Deposits
Our deposit products include a broad selection
of deposit instruments, including checking accounts, money market accounts,
savings accounts, and certificates of deposit. We consider our checking, money
market, and savings accounts to be our core deposits. Deposit account terms may
vary with principal differences including: (i) the minimum balance required;
(ii) the time period the funds must remain on deposit; and (iii) the interest
rate paid on the account.
We utilize traditional marketing methods to
attract new clients and deposits. We do not advertise for deposits outside of
our market area and do not use the services of deposit brokers. We have
developed public deposit products attractive to local municipalities. Due to the
relatively large size of these balances and the cyclical nature of the
municipalities’ cash flows, total deposits can fluctuate as a result of changes
in these balances. At times, we have implemented initiatives to attract core
deposits in all of our markets by offering various limited-time promotions for
new deposit accounts. As the need for funds warrant, we may continue to use
deposit promotions in new and existing markets to build our client
base.
Borrowed Money
Although deposits are our primary source of
funds, our policy has been to also utilize borrowings, including advances from
the FHLB–IN. The advances from the FHLB–IN are secured by its capital stock, a
blanket pledge of certain of our mortgage loans, and FHLB–IN time deposits.
These advances are made in accordance with several different credit programs,
each of which has its own interest rate and range of maturities. We also utilize
short-term federal funds purchased and borrowings from the FRB as other sources
of funds when necessary. We also offer sales of securities under agreements to
repurchase (Repo Sweeps). These Repo Sweeps are treated as
financings, and the obligations to repurchase securities sold are reflected as
borrowed money in our consolidated statements of condition.
SUBSIDIARIES
During 2009, the Bank had one active,
wholly-owned subsidiary, CFS Holdings, Ltd. (CFS Holdings). This
subsidiary was approved by the OTS in January 2001 and began operations in June
2001. CFS Holdings is located in Hamilton, Bermuda. It was funded with
approximately $140.0 million of the Bank’s investment securities and performs a
significant amount of our securities investing activities. Certain of these
activities are performed by a resident agent in Hamilton in accordance with the
operating procedures and investment policy established for CFS Holdings.
Revenues of CFS Holdings were $5.0 million for the year ended December 31, 2009
compared to $4.5 million and $4.1 million for the years ended December 31, 2008
and 2007, respectively. Operating expenses of this subsidiary were $65,000 for
the year ended December 31, 2009 and $63,000 for the years ended December 31,
2008 and 2007.
REGULATION AND SUPERVISION OF THE COMPANY AND
THE BANK
General
The Company and the Bank are extensively
regulated under applicable federal and state laws and regulations. The Company,
as a savings and loan holding company, and the Bank, as a federally-chartered
savings association, are supervised, examined, and regulated by the OTS. As a
company with securities registered under Section 12 of the Securities Exchange
Act of 1934 (1934 Act), the Company also is subject to the
regulations of the SEC and the periodic reporting, proxy solicitation, and other
requirements under the 1934 Act. As an FDIC-insured institution, the Bank also
is subject to regulation by the Federal Deposit Insurance Corporation (FDIC).
11
The Bank is a member of the FHLB system, and
its deposits are insured by the Deposit Insurance Fund (DIF) of the FDIC.
The Bank must file reports with the OTS concerning its activities and financial
condition and obtain regulatory approval prior to entering into certain
transactions such as mergers with, or acquisitions of, other savings
associations. The OTS also conducts periodic examinations of the Company and the
Bank. The regulatory structure applicable to the Company and the Bank gives the
OTS extensive discretion in connection with its supervisory and enforcement
activities and examination policies, including policies with respect to the
classification of assets and the establishment of adequate allowances for loan
losses for regulatory purposes. The activities, growth, earnings, and dividends
of the Company and the Bank can be affected not only by management decisions and
general economic conditions but also by the statutes administered by, and the
regulations and policies of, various governmental regulatory
authorities.
Certain statutory and regulatory requirements
applicable to the Company and the Bank are summarized below or elsewhere in this
Annual Report on Form 10-K. These summaries do not purport to be complete
explanations of all statutes and regulations applicable to, and their effects
on, the Company and the Bank and are qualified in their entirety by reference to
the actual laws and regulations. In addition, these statutes and regulations may
change in the future, and we cannot predict what effect these changes, if
implemented, will have on our operations. The supervision, examination, and
regulation of the Company and the Bank by the bank regulatory agencies are
intended primarily for the protection of depositors and the DIF rather than the
shareholders of the Company and the Bank.
Holding Company Regulation
The Company is a unitary savings and loan
holding company. It is a legal entity separate and distinct from the Bank and
any other subsidiaries of the Company, and its principal source of funds are
dividends paid to it by the Bank.
The Home Owners’ Loan Act, as amended
(HOLA), and OTS regulations generally prohibit a
savings and loan holding company from engaging in any activities that would
constitute a serious risk to the safety and soundness of the Bank. Further, the
HOLA and the OTS prohibit a savings and loan holding company, without prior OTS
approval, from acquiring, directly or indirectly, the ownership or control, or
all, or substantially all, of the assets or more than 5% of the voting shares,
of any other savings association or savings and loan holding
company.
Depending upon the factors described below,
certain holding companies may operate without significant limitations on their
activities, while others are subject to significant restrictions. The
restrictions which apply will depend upon whether (i) the holding company is a
unitary or multiple savings and loan holding company, (ii) the holding company
came into existence or filed an application to become a savings and loan holding
company prior to May 4, 1999, and (iii) whether the subsidiary thrift meets the
Qualified Thrift Lender (QTL) status. The
Company presently operates as a unitary savings and loan holding company and has
been in existence prior to May 4, 1999. The Bank currently satisfies the QTL
test. Accordingly, the Company does not currently have significant limitations
on its activities. If the Company ceases to be a unitary savings and loan
holding company or to satisfy the QTL test, the activities of the Company and
its non-savings association subsidiaries would thereafter be subject to
substantial restrictions.
Federal Savings Association
Regulation
Business Activities. The Bank is a wholly-owned subsidiary of the
Company. The Bank’s lending, investment, and other activities are governed by
federal laws and regulations. Those laws and regulations delineate the nature
and extent of the business activities in which federal savings associations may
engage.
Regulatory Capital Requirements and Prompt Corrective Action.
OTS capital
regulations require savings associations to satisfy three minimum capital
standards: (i) a risk-based capital requirement, (ii) a leverage requirement,
and (iii) a tangible capital requirement.
12
Under the risk-based capital requirements of
the OTS, the Bank must have total capital (core capital plus supplementary
capital) equal to at least 8% of risk-weighted assets (which includes the credit
risk equivalents of certain off-balance-sheet items). In determining the amount
of risk-weighted assets, all assets are multiplied by a risk-weight factor
ranging from 0% to 100%, as assigned by the OTS capital regulations based on the
risks inherent in the type of asset. For purposes of the risk-based capital
requirement, supplementary capital may not exceed 100% of core capital. Under
the leverage requirement, the Bank is required to maintain Tier 1 (core) capital
equal to at least 4% of adjusted total assets (3% if the Bank has received the
highest composite rating under the Uniform Financial Institutions Ratings
System). Under the tangible capital requirement, the Bank is required to
maintain tangible capital equal to at least 1.5% of its adjusted total assets.
These capital requirements are viewed as minimum standards by the OTS, and most
institutions are expected to maintain capital levels above these
minimums.
The prompt corrective action regulations,
promulgated under the Federal Deposit Insurance Corporation Improvement Act of
1991 (FDIC Improvement Act of
1991), require certain
mandatory actions and authorize certain other discretionary actions to be taken
by the OTS and the FDIC against a savings association that falls within certain
undercapitalized capital categories specified in the regulations. The
regulations establish five categories of capital classification: “well
capitalized,” “adequately capitalized,” “undercapitalized,” “significantly
undercapitalized,” and “critically undercapitalized.” Under the regulations, the
ratios of total capital to risk-weighted assets and core capital to
risk-weighted assets and the leverage ratio are used to determine a savings
association’s capital classification.
The OTS and the FDIC may order savings
associations which have insufficient capital to take prompt corrective actions.
For example, a savings association that is not at least “adequately capitalized”
is required to submit a capital restoration plan to the regulators and may not,
among other restrictions, increase its assets, engage in certain activities,
make any capital distributions, establish a new branch, or acquire another
financial institution. In addition, a capital restoration plan of a savings
association controlled by a holding company must include a guarantee by the
holding company limited to the lesser of 5% of the association’s assets when it
failed to meet the “adequately capitalized” standard or the amount needed to
satisfy the plan. Additional and more stringent supervisory actions may be taken
depending on the financial condition of the savings association and other
circumstances, such as, for example, the removal and replacement of directors
and senior executive officers. Savings associations deemed to be “critically
undercapitalized” are subject to the appointment of a receiver or
conservator.
Savings associations that have a total
risk-based capital ratio of at least 10%, a leverage ratio of at least 5% and a
Tier 1 risk-based capital ratio of at least 6% and that are not subject to any
order or written directive to meet and maintain a specific capital level are
considered “well capitalized.” At December 31, 2009, the Bank had a total-risk
based capital ratio of 12.35%, a leverage ratio of 8.88% and a Tier 1 risk-based
capital ratio of 11.15%. As such, the Bank was considered “well capitalized” at
December 31, 2009. For further discussion related to our capital ratios see
“Note 12. Stockholders’ Equity and Regulatory Capital” in the notes to
consolidated financial statements included in “Item 8. Financial Statements and
Supplementary Data” of this Annual Report on Form 10-K.
Dividends and Capital Distributions. OTS regulations impose limitations upon all
capital distributions by a savings association. Capital distributions include
cash dividends, payments to repurchase or otherwise acquire the association’s
own stock, payments to shareholders of another institution in a cash-out merger,
and other distributions charged against capital. The regulations provide that an
association must submit an application to the OTS to receive approval of any
capital distribution if the association (i) is not eligible for expedited
treatment, (ii) proposes capital distributions for the applicable calendar year
that exceed in the aggregate its net income for that year to date plus its
retained income for the preceding two years, (iii) would not be at least
adequately capitalized following the distribution, or (iv) would violate a
prohibition contained in a statute, regulation or agreement between the
institution and the OTS by performing the capital distribution. Under any other
circumstances, the association is required to provide a written notice (rather
than an application) to the OTS prior to the capital distribution. Based on its
retained income for the preceding two years, the Bank is currently restricted
from making any capital distributions without prior written approval from the
OTS. During 2009, the Bank did not pay dividends to the Company. The Company
relies on dividends from the Bank as its primary source of funds, including the
funds needed to pay dividends, if any, to shareholders of the
Company.
Informal Regulatory Agreements. Effective March 20, 2009, the Company and the
Bank agreed to enter into informal agreements with the OTS to address certain
regulatory matters. Specifically, under the agreements the Company and the Bank
have submitted their capital and business plans to the OTS for its review and
comment as well as its review of the Bank’s efforts in monitoring and reducing
its nonperforming loans. In addition, under the agreements, both the Company and
the Bank have agreed to seek the OTS’ approval prior to the declaration of any
future dividends. The Company has also agreed not to repurchase or redeem any
shares of its common stock or incur or renew any debt without the OTS’ approval.
The Company does not currently have any debt outstanding. Compliance with the
terms of the agreements is not expected to have a material effect on the
financial condition or results of operations of the Company or the
Bank.
13
Insurance of Deposit Accounts. Due to the recent difficult economic
conditions in the U.S., deposit insurance per account owner has been increased
from $100,000 to $250,000 through December 31, 2013. Thereafter, regular deposit
accounts will be insured up to a maximum of $100,000 and self-directed
retirement accounts up to a maximum of $250,000.
In addition, the FDIC adopted an optional
Temporary Liquidity Guarantee Program (TLGP) by which, for
a fee, noninterest bearing transaction accounts receive unlimited FDIC insurance
coverage through June 30, 2010 and certain senior unsecured debt issued by
institutions and their holding companies would be guaranteed by the FDIC through
December 31, 2012. We have elected to participate in both the unlimited
noninterest bearing transaction account coverage and the unsecured debt
guarantee program. For further discussion related to the TLGP see “Recent
Legislative and Regulatory Initiatives to Address Financial and Economic Crises
in the United States” below.
The Bank’s deposits are insured up to the
applicable limits under the DIF. The DIF is the successor to the Bank Insurance
Fund (BIF) and the Savings Association Insurance Fund
(SAIF). The FDIC maintains the DIF by assessing
depository institutions an insurance premium. The FDIC annually sets the reserve
level of the DIF within a statutory range between 1.15% and 1.50% of insured
deposits. If the reserve level of the DIF falls below 1.15%, or is expected to
do so within six months, the FDIC must adopt a restoration plan that will
restore the DIF to a 1.15% ratio generally within five years. If the reserve
level exceeds 1.35%, the FDIC may return some of the excess in the form of
dividends to insured institutions.
Under the FDIC’s risk-based assessment system,
insured institutions are required to pay deposit insurance premiums based on the
risk that each institution poses to the DIF. An institution’s risk to the DIF is
measured by its regulatory capital levels, supervisory evaluations, and certain
other factors. An institution’s assessment rate depends upon the risk category
to which it is assigned. The FDIC has the authority to raise or lower assessment
rates on insured deposits, subject to limits, and to impose special assessments.
A significant increase in insurance premiums or the imposition of special
assessments would have an adverse effect on the operating expenses and results
of operations of the Bank.
Currently, assessments for FDIC deposit
insurance range from seven to seventy-seven basis points per $100 of assessable
deposits. On May 22, 2009, the FDIC imposed a special assessment of five basis
points on each institution’s assets minus Tier 1 capital as of June 30, 2009,
which was payable to the FDIC on September 30, 2009. The Bank paid a total of
$2.2 million in deposit insurance assessments in 2009 including $495,000 related
to the special assessment. No institution may pay a dividend if it is in default
on its federal deposit insurance assessment.
In 2009, the FDIC adopted a rule requiring
each insured institution to prepay on December 30, 2009 the estimated amount of
its quarterly assessments for the fourth quarter of 2009 and all quarters
through the end of 2012 (in addition to the regular quarterly assessment for the
third quarter which was due on December 30, 2009). The prepaid amount is
recorded as an asset with a zero risk weight and the institution will continue
to record quarterly expenses for deposit insurance. Collection of the prepayment
amount does not preclude the FDIC from changing assessment rates or revising the
risk-based assessment system in the future. If events cause actual assessments
during the prepayment period to vary from the prepaid amount, institutions will
pay excess assessments or receive a rebate of prepaid amounts not fully utilized
after the collection of assessments due in June 2013. The amount of the Bank’s
prepayment was $6.6 million.
In addition to the FDIC insurance premiums,
the Bank is required to make quarterly payments on bonds issued by the Financing
Corporation (FICO), an agency of the Federal government
established to recapitalize a predecessor deposit insurance fund. During 2009,
the Bank’s FICO assessment totaled $90,000. These assessments will continue
until the FICO bonds are repaid between 2017 and 2019.
Federal law also provided a one-time credit
for eligible institutions based on their assessment base as of December 31,
1996. Subject to certain limitations, credits could be used beginning in 2007 to
offset assessments until exhausted. The Bank’s remaining one-time credit was
$1.2 million which was fully utilized at December 31, 2009.
14
Termination of Deposit Insurance. The FDIC may terminate the deposit insurance
of any insured depository institution, including the Bank, if it determines
after a hearing that the institution has engaged or is engaging in unsafe or
unsound practices, is in an unsafe or unsound condition to continue operations
or has violated any applicable law, rule, regulation, order or condition imposed
by the FDIC. If insurance of accounts is terminated, the accounts at the
institution at the time of the termination, less subsequent withdrawals, will
continue to be insured for a period of six months to two years, as determined by
the FDIC. There are no pending proceedings to terminate the FDIC deposit
insurance of the Bank, and the management of the Bank does not know of any
practice, condition, or violation that might lead to termination of deposit
insurance.
Qualified Thrift Lender Test. Federal law requires OTS-regulated savings
associations to meet a QTL test to avoid certain restrictions on its operations.
A savings association satisfies the QTL test if the savings association’s
“qualified thrift investments” continue to equal or exceed 65% of the savings
association’s “portfolio assets” on a monthly average basis in nine out of every
twelve months. “Qualified thrift investments” generally means primarily
securities, mortgage loans, and other investments related to housing, home
equity loans, credit card loans, education loans, and other consumer loans up to
a certain percentage of assets. “Portfolio assets” generally means total assets
of a savings association less the sum of certain specified liquid assets,
goodwill and other intangible assets, and the value of property used in the
conduct of the savings association’s business.
A savings association may also satisfy the QTL
test by qualifying as a “domestic building and loan association” (DBLA) under the
Internal Revenue Code of 1986. To satisfy the DBLA test, a savings association
must meet a “business operations test” and a “60 percent of assets test.” The
business operations test requires the business of a DBLA to consist primarily of
acquiring the savings of the public and investing in loans. An institution meets
the public savings requirement when it meets one of two conditions: (i) the
institution acquires its savings in conformity with OTS rules and regulations,
and (ii) the general public holds more than 75% of its deposits, withdrawable
shares, and other obligations. An institution meets the investing in loans
requirement when more than 75% of its gross income consists of interest on loans
and government obligations, and various other specified types of operating
income that financial institutions ordinarily earn. The 60% of assets test
requires that at least 60% of a DBLA’s assets must consist of assets that
savings associations normally hold, except for consumer loans that are not
educational loans. The Bank met the requirements of the QTL test by maintaining
71.51% of its assets at December 31, 2009 in the foregoing asset
base.
A savings association which fails to meet
either test must either convert to a national bank or be subject to the
following: (i) it may not enter into any new activity except for those
permissible for both a national bank and for a savings association, (ii) its
branching activities will be limited to those of a national bank, and (iii) it
will be bound by regulations applicable to national banks respecting payment of
dividends. Within three years of failing the QTL test or DBLA test, the savings
association must dispose of any investment or activity not permissible for both
a national bank and a savings association. If such a savings association is
controlled by a savings and loan holding company, then the holding company must,
within a prescribed time period, become registered as a bank holding company
under the Bank Holding Company Act of 1956 (BHCA) and become
subject to all rules and regulations applicable to bank holding companies
(including restrictions as to the scope of permissible business
activities).
Loans to One Borrower. Federal law provides that savings associations
are generally subject to certain limits on loans to one borrower or a related
group of borrowers. Generally, subject to certain exceptions, a savings
association may not make a loan or extend credit on an unsecured basis to a
single borrower or related group of borrowers in excess of 15% of its unimpaired
capital and surplus. An additional amount may be loaned equal to 10% of
unimpaired capital and surplus, if the loan is secured by specified
readily-marketable collateral, which generally does not include real
estate.
Transactions with Affiliates. Transactions between a savings association and
its “affiliates” are subject to quantitative and qualitative restrictions under
Sections 23A and 23B of the Federal Reserve Act, the implementing regulations
contained in Regulation W and additional regulations adopted by the OTS.
Affiliates of a savings association include, among other entities, the savings
association’s holding company and companies that are under common control with
the savings association. In general, these restrictions limit the amount of the
transactions between a savings association and its affiliates, as well as the
aggregate amount of transactions between a savings association and all of its
affiliates, impose collateral requirements in some cases, and require
transactions with affiliates to be on the same terms comparable to those with
unaffiliated entities. In addition, a savings association may not lend to any
affiliate engaged in activities not permissible for a bank holding company or
acquire the securities of an affiliate. The OTS has the discretion to further
restrict transactions of a savings association with an affiliate on a
case-by-case basis.
15
Change of Control. Subject to certain limited exceptions, no company can acquire control of
a savings association without the prior approval of the OTS, and no individual
may acquire control of a savings association if the OTS objects. Any company
that acquires control of a savings association becomes a savings and loan
holding company is subject to regulation, examination, and supervision by the
OTS. Conclusive control exists, among other ways, when an acquiring party
acquires more than 25% of any class of voting stock of a savings association or
savings and loan holding company, or controls in any manner the election of a
majority of the directors of the company. In addition, a rebuttable presumption
of control exists if, among other things, a person acquires more than 10% of any
class of a savings association’s or savings and loan holding company’s voting
stock (or 25% of any class of stock) and, in either case, any of certain
additional control factors exist.
Companies subject to the BHCA that acquire or
own savings associations are no longer defined as savings and loan holding
companies under the HOLA and, therefore, are not generally subject to
supervision, examination, and regulation by the OTS. OTS approval is not
required for a bank holding company to acquire control of a savings association,
although the OTS has a consultative role with the FRB in examination,
enforcement, and acquisition matters. Holding companies that control both a bank
and a savings association, however, are subject to registration, supervision,
examination, and regulation under the BCHA and FRB regulations.
Safety and Soundness Guidelines. The OTS and the other federal banking
regulators have established guidelines for safety and soundness for insured
depository institutions. These standards relate to, among other matters,
internal controls, information systems, audit systems, loan documentation,
credit underwriting, interest rate exposure, compensation, and other operational
and managerial matters. Institutions failing to meet these standards are
required to submit compliance plans to their appropriate federal banking
regulator. If the deficiency persists, the OTS and the other federal banking
regulators may issue an order that requires the institution to correct the
deficiency and may take other statutorily-mandated or discretionary actions.
Enforcement Powers. The OTS and the other federal banking regulators have the authority to
assess civil and criminal penalties under certain circumstances against
depository institutions and certain “institution-affiliated parties,” including
controlling shareholders, directors, management, employees, and agents of a
financial institution, as well as independent contractors and consultants, such
as attorneys and accountants, and others who participate in the conduct of the
financial institution’s affairs. In addition, the OTS and the other federal
banking regulators have the authority to commence enforcement actions against
institutions and institution-affiliated parties. Possible enforcement actions
include, among others, issuance of capital directives, cease-and-desist orders,
removal of directors and officers, termination of deposit insurance, and placing
an institution into a receivership. A financial institution may also be ordered
to restrict its growth, dispose of certain assets, rescind agreements or
contracts, or take other actions as determined by the regulator to be
appropriate.
Community Reinvestment Act. Savings associations have a responsibility
under the Community Reinvestment Act (CRA) and related
regulations of the OTS to help meet the credit needs of their communities,
including low- and moderate-income neighborhoods, consistent with safe and sound
operations. The CRA requires the OTS to assess the Bank’s record of meeting the
credit needs of its community, to assign the Bank one of four CRA ratings, and
to take this record into account in the OTS’ evaluation of certain applications
of the Bank, such as an application relating to a merger or the establishment of
a branch. An unsatisfactory rating may be used as the basis for the denial of an
application by the OTS. The Bank received a satisfactory rating during its
latest CRA examination in 2008.
Consumer Protection Laws. We are subject to many federal consumer
protection statutes and regulations including the Equal Credit Opportunity Act
(Regulation B), the Fair Housing Act, the Truth in Lending Act (Regulation Z),
the Truth in Savings Act (Regulation DD), the Real Estate Settlement Procedures
Act, the Home Mortgage Disclosure Act (Regulation C), and the Fair and Accurate
Credit Transactions Act. Among other things, these statutes and
regulations:
- require lenders to disclose credit terms in meaningful and consistent ways;
- prohibit discrimination against an applicant in any consumer or business credit transaction;
- prohibit discrimination in housing-related lending activities;
- require certain lenders to collect and report applicant and borrower data regarding loans for home purchases or improvement projects;
- require lenders to provide borrowers with information regarding the nature and cost of real estate settlements;
- prohibit certain lending practices and limit escrow account amounts with respect to real estate transactions;
- require financial institutions to implement identity theft prevention programs and measures to protect the confidentiality of consumer financial information; and
- prescribe possible penalties for violations of the requirements of consumer protection statutes and regulations.
16
Other Laws. The Bank is subject to a variety of other federal laws that require it to
maintain certain programs or procedures and to file certain information with the
U.S. Government. For example, the Bank is subject to federal laws protecting the
confidentiality of consumer financial records and limiting the ability of the
Bank to share non-public personal information with third parties. In addition,
the Bank is subject to federal anti-money laundering requirements which provide
that the Bank must maintain, among other items, client identification and
anti-money laundering programs. These requirements also provide for information
sharing between the Bank and the U.S. government. Further, the Bank is required
to have systems in place to detect certain transactions. The Bank is generally
required to report cash transactions involving more than $10,000 to the U.S.
government and to file suspicious activity reports under certain circumstances
involving its clients and employees or others.
Federal Home Loan Bank
System
The Bank is a member of the FHLB system, which
consists of 12 regional banks. The Federal Housing Finance Board, an independent
federal agency, controls the FHLB system, including the FHLB-IN. The FHLB system
provides a central credit facility primarily for member institutions. As a
member of the FHLB-IN, the Bank is required to acquire and hold shares of
capital stock in the FHLB-IN in an amount at least equal to 1% of the aggregate
principal amount of its unpaid residential mortgage loans and similar
obligations at the beginning of each year, or 1/20 of its advances (borrowings)
from the FHLB-IN, whichever is greater. At December 31, 2009, we had advances
from the FHLB-IN with aggregate outstanding principal balances of $87.5 million,
and our investment in FHLB-IN stock of $23.9 million was $19.6 million in excess
of our minimum requirement. FHLB advances must be secured by specified types of
assets of the Bank and are available to member institutions primarily for the
purpose of providing funds for residential housing finance. The FHLB-IN has
certain requirements including a five year notice period pursuant to their
capital plan that must be met before they redeem their stock. We have requested
redemption of $15.5 million of our investment in FHLB-IN stock. The five year
notice period ends in 2011 on $12.4 million and in 2012 on $2.8 million of our
requested redemption.
Regulatory directives, capital requirements,
and net income of the FHLBs affect their ability to pay dividends on the FHLB
stock held by their members. In addition, FHLBs are required to provide funds to
cover certain obligations, to fund the resolution of insolvent thrifts, and to
contribute funds for affordable housing programs. These items could reduce the
amount of dividends that the FHLBs pay to their members and could also result in
the FHLBs imposing a higher rate of interest on advances to their
members.
Sarbanes-Oxley Act of 2002
The Company complies with the Sarbanes-Oxley
Act of 2002 (Sarbanes-Oxley Act). The Sarbanes-Oxley Act’s stated goals
include enhancing corporate responsibility, increasing penalties for accounting
and auditing improprieties at publicly traded companies such as the Company, and
protecting investors by improving the accuracy and reliability of corporate
disclosures under the federal securities laws.
Among other requirements, the Sarbanes-Oxley
Act established: (i) new requirements for audit committees of public companies,
including independence, expertise and responsibilities; (ii) new standards for
independent auditors and their audits of financial statements; (iii) a
requirement that the chief executive officers and chief financial officers of
public companies sign certifications relating to the financial statements and
other information contained in periodic reports filed with the SEC as well as
the Company’s internal control over financial reporting and disclosure controls
and procedures; (iv) increased and accelerated disclosure obligations for public
companies; and (v) new and increased civil and criminal penalties for violation
of the federal securities laws.
17
Recent Legislative and Regulatory Initiatives
to Address Financial and Economic Crises in the United States
On October 3, 2008, the Emergency Economic
Stabilization Act of 2008 (EESA) was signed
into law, giving the United States Department of the Treasury (Treasury Department) broad authority to address the recent deterioration of the U.S.
economy, to implement certain actions to help restore confidence, stability, and
liquidity to U.S. financial markets, and to encourage financial institutions to
increase their lending to clients and to each other. The EESA authorized the
Treasury Department to purchase from financial institutions and their holding
companies up to $700 billion in mortgage loans, mortgage-related securities, and
certain other financial instruments, including debt and equity securities issued
by financial institutions and their holding companies in a troubled asset relief
program (TARP). The Treasury Department allocated $250
billion to the Voluntary Capital Purchase Program (CPP) under the
TARP. The TARP also includes direct purchases or guarantees of troubled assets
of financial institutions by the U.S. government.
Under the CPP, the Treasury Department was
authorized to purchase debt or equity securities from participating financial
institutions. In connection therewith, each participating financial institution
issued to the Treasury Department a warrant to purchase a certain number of
shares of stock of the institution. During such time as the Treasury Department
holds securities issued under the CPP, the participating financial institutions
are required to comply with the Treasury Department’s standards for executive
compensation and will have limited ability to increase the amounts of dividends
paid on, or to repurchase, their common stock. The Company determined not to
participate in the CPP.
On October 14, 2008, the FDIC announced the
TLGP. The TLGP includes the Transaction Account Guarantee Program (TAGP), which
provided unlimited deposit insurance coverage through December 31, 2009 for
non-interest bearing transaction accounts (typically business checking accounts)
and certain funds swept into non-interest bearing savings accounts. Institutions
that participate in the TAGP pay a 10 basis points fee (annualized) on the
balance of each covered account in excess of $250,000, while the extra deposit
insurance is in place. The FDIC has authorized an extension of the TAGP through
June 30, 2010 for institutions participating in the original TAGP, unless an
institution opts out of the extension period. During the extension period, fees
increase to 15 to 25 basis points depending on an institution’s risk category
for deposit insurance purposes.
The TLGP also includes the Debt Guarantee
Program (DGP), under which the FDIC guarantees certain
senior unsecured debt issued by FDIC-insured institutions and their holding
companies. Under the DGP, upon a default by an issuer of FDIC-guaranteed debt,
the FDIC will continue to make scheduled principal and interest payments on the
debt. The unsecured debt must have been issued on or after October 14, 2008 and
not later than October 31, 2009, and the guarantee is effective through the
earlier of the maturity date (or mandatory conversion date) or December 31,
2012, although the debt may have a maturity date beyond December 31, 2012.
Depending on the maturity of the debt, the nonrefundable DGP guarantee fee
ranges from 50 to 100 basis points (annualized) for covered debt outstanding
until the earlier of maturity or December 31, 2012. The FDIC also established an
emergency debt guarantee facility through April 30, 2010 through which
institutions that are unable to issue non-guaranteed debt to replace maturing
senior unsecured debt because of market disruptions or other circumstances
beyond their control may apply on a case-by-case basis to issue FDIC-guaranteed
senior unsecured debt. The FDIC guarantee of any debt issued under this
emergency facility would be subject to an annualized assessment rate equal to a
minimum of 300 basis points.
The TAGP and DGP are in effect for all
eligible entities, unless the entity opted out on or before December 5, 2008.
The Company elected to participate in both the TAGP and the DGP and did not opt
out of the extension period for the TAGP.
On February 17, 2009, the American Recovery
and Reinvestment Act of 2009 (ARRA), more commonly known as the federal economic
stimulus or economic recovery package, went into effect. The ARRA includes a
wide variety of programs intended to stimulate the U. S. economy and provide for
extensive infrastructure, energy, health, and education needs. The ARRA also
imposes new executive compensation limits and corporate governance requirements
on participants in the CPP in addition to those previously announced by the
Treasury Department. Because the Company elected not to participate in the CPP,
these limits and requirements do not apply to the Company.
18
ITEM 1A. RISK FACTORS
Investments in CFS Bancorp, Inc. common stock
involve risk. The following discussion highlights risks management believes are
material for us, but does not necessarily include all risks that we may
face.
Failure to comply with the restrictions and
conditions in the informal regulatory agreements that the Company and the Bank
entered into with the Office of Thrift Supervision could result in additional
enforcement action against us.
Effective March 20, 2009, we entered
into informal agreements with the OTS to address certain regulatory matters.
Although we expect that these agreements will not have a material effect on our
financial condition or results of operations, if we fail to comply with the
terms and conditions of the agreements, the OTS could take additional
enforcement action against us, including the imposition of further operating
restrictions. Any additional action could harm our reputation and our ability to
retain or attract clients or employees and impact the trading price of our
common stock.
We operate in a highly regulated industry and
may be affected adversely by negative examination results and changes in laws,
regulations, and accounting industry pronouncements.
The Bank, like other Federal savings banks, is
subject to extensive regulation, supervision, and examination by the OTS, its
chartering authority, and by the FDIC, the insurer of its deposits. CFS, like
other thrift holding companies, is subject to regulation and supervision by the
OTS. This regulation and supervision governs the activities in which we may
engage and are intended primarily for the protection of the deposit insurance
fund administered by the FDIC and our depositors. Regulatory authorities have
extensive discretion in their supervisory and enforcement activities, including
the imposition of restrictions on our operations, the classification of our
assets, and determination of the level of our allowance for losses on
loans.
The current regulatory landscape in which
insured depository financial institutions operate is expected to change –
perhaps significantly – following a recent policy statement issued by the U.S.
Department of the Treasury calling for stronger capital and liquidity standards
for banking firms as well as the Obama Administration’s June 2009 financial
regulatory reform proposal. The proposed legislation contains several provisions
that would have a direct impact on us. Under the proposed legislation, the
federal savings association charter would be eliminated and the OTS would be
consolidated with the Comptroller of the Currency into a new regulator, the
National Bank Supervisor. The proposed legislation would also require the Bank
to convert to a national bank or a state-chartered institution. In addition, the
proposed legislation would eliminate the status of “savings and loan holding
company” and mandate that the Company register as a bank holding company.
Registration as a bank holding company would represent a significant change
because there are material differences between savings and loan holding company
and bank holding company supervision and regulation. For example, bank holding
companies above a specified asset size are subject to consolidated leverage and
risk-based capital requirements whereas savings and loan holding companies are
not subject to such requirements. The proposed legislation would also create the
Consumer Financial Protection Agency, a new federal agency dedicated to
administering and enforcing fair lending and consumer compliance laws with
respect to financial products and services, which would create new regulatory
requirements and increased regulatory compliance costs for us. If enacted, the
proposed legislation may have a material impact on our operations. However,
because any final legislation may differ significantly from the current
administration’s proposal, the specific effects of the legislation cannot be
evaluated at this time.
In addition, like all U.S. companies who
prepare their financial statements in accordance with U.S. Generally Accepted
Accounting Principles (U.S. GAAP), we are
subject to changes in accounting rules and interpretations. We cannot predict
what effect any presently contemplated or future changes in financial market
regulation or accounting rules and interpretations will have on us. Any such
changes may negatively affect our financial performance, our ability to expand
our products and services, and our ability to increase the value of our business
and, as a result, could be materially adverse to our shareholders. In addition,
like other federally insured depository institutions, CFS and the Bank prepare
and publicly report additional financial information under Regulatory Accounting
Principles (RAP) and are similarly subject to changes in
these rules and interpretations.
We may be required to pay significantly higher
FDIC premiums or special assessments that could adversely affect our
earnings.
Market developments have significantly
depleted the insurance fund of the FDIC and reduced the ratio of reserves to
insured deposits. As a result, depository institutions participating in the
insurance fund, including the Bank, may be required to pay significantly higher
premiums or additional special assessments that could adversely affect our
earnings. It is possible that the FDIC may impose additional special assessments
in the future as part of its restoration plan.
19
Our ability to pay dividends is
restricted.
Although we have been paying quarterly
dividends regularly since 1998, our ability to pay dividends to shareholders
depends upon the prior approval of the OTS pursuant to an informal regulatory
agreement with the OTS. Additionally, the Bank is subject to the same
restrictions on making dividends to the Company under its informal regulatory
agreement with the OTS. Accordingly, we may cease paying dividends to our
shareholders.
If economic conditions continue to
deteriorate, our results of operations and financial condition could be
adversely impacted as borrowers' ability to repay loans declines and the value
of the collateral securing our loans decreases.
Our financial results may be adversely
affected by changes in prevailing economic conditions, including decreases in
real estate values, changes in interest rates that cause a decrease in interest
rate spreads, adverse employment conditions, the monetary and fiscal policies of
the federal government, and other significant external events. In addition, we
have a significant amount of real estate loans. Accordingly, decreases in real
estate values could adversely affect the value of collateral securing our loans.
Adverse changes in the economy may also have a negative effect on the ability of
our borrowers to make timely repayments of their loans. These factors could
expose us to an increased risk of loan defaults and losses and have an adverse
impact on our earnings.
We are subject to lending risk and could
suffer losses in our loan portfolio despite our underwriting practices.
There are inherent risks associated with our
lending activities. There are risks inherent in making any loan, including those
related to dealing with individual borrowers, nonpayment, uncertainties as to
the future value of collateral, and changes in economic and industry conditions.
We attempt to closely manage our credit risk through prudent loan underwriting
and application approval procedures, careful monitoring of concentrations of our
loans within specific industries, and periodic independent reviews of
outstanding loans by third-party loan review specialists. We cannot assure that
such approval and monitoring procedures will reduce these credit risks to
acceptable tolerance levels.
Increases in interest rates and/or weakening
economic conditions could adversely impact the ability of borrowers to repay
their outstanding loans. In the past, we have focused on providing ARMs to
decrease the risk related to changes in the interest rate environment; however,
these types of loans also involve other risks. As interest rates rise, the
borrowers’ payments on an ARM also increase to the extent permitted by the loan
terms thereby increasing the potential for default. Also, when interest rates
decline substantially, borrowers tend to refinance into fixed-rate loans.
As of December 31, 2009, approximately 67% of
our loan portfolio consisted of commercial and industrial, commercial real
estate (owner occupied, non-owner occupied, and multifamily), and commercial
construction and land development loans. These types of loans involve increased
risks because the borrower’s ability to repay the loan typically depends on the
successful operation of the business or the property securing the loan.
Additionally, these loans are made to small- or medium-sized business clients
who may be more vulnerable to economic conditions and who may not have
experienced a complete business or economic cycle. These types of loans are also
typically larger than one-to-four family residential mortgage loans or consumer
loans. Because our loan portfolio contains a significant number of commercial
and industrial, commercial real estate (owner occupied, non-owner occupied, and
multifamily), and commercial construction and land development loans with
relatively large balances, the deterioration of one or a few of these loans
could cause a significant increase in non-performing loans. An increase in
non-performing loans would result in a reduction in interest income recognized
on loans and also could require us to increase the provision for losses on loans
and increase loan charge-offs, all of which would reduce our net income. All of
these could have a material adverse effect on our financial condition and
results of operations.
20
Our allowance for losses on loans may be
insufficient to cover actual losses on loans.
In keeping with industry practice, regulatory
guidelines, and U.S. GAAP, we maintain an allowance for losses on loans at a
level we believe adequate to absorb credit losses inherent in the loan
portfolio. The allowance for losses on loans is a reserve established through a
provision for losses on loans charged to expense that represents our estimate of
probable incurred losses within the loan portfolio at each statement of
condition date and is based on the review of available and relevant information.
The level of the allowance for losses on loans reflects our consideration of
historical charge-offs and recoveries; levels of and trends in delinquencies,
impaired loans, and other classified loans; concentrations of credit within the
commercial loan portfolio; volume and type of lending; and current and
anticipated economic conditions. The determination of the appropriate level of
the allowance for losses on loans inherently involves a high degree of
subjectivity and requires us to make significant estimates of current credit
risks and future trends, all of which may undergo material changes. Changes in
economic conditions affecting borrowers, new information regarding existing
loans, identification of additional problem loans, and other factors, both
within and outside of our control, may require an increase in the allowance for
losses on loans. Also, if charge-offs in future periods exceed the allowance for
losses on loans, we will need additional provisions to increase our allowance
for losses on loans. Any increases in the allowance for losses on loans will
result in a decrease in net income and possibly capital, and may have a material
adverse effect on our financial condition and results of
operations.
Declines in asset values may result in
impairment charges and adversely affect the value of our investments, financial
performance, and capital.
We maintain an investment portfolio that
includes, but is not limited to, government sponsored entity securities,
mortgage-backed securities, and pooled trust preferred securities. The market
value of investments in our portfolio has become increasingly volatile. The
market value of investments may be affected by factors other than the underlying
performance of the issuer or composition of the bonds themselves, such as
ratings downgrades, adverse changes in the business climate, and a lack of
liquidity for resales of certain investment securities, as well as specific
challenges which may arise in the secondary markets for such investments. We
periodically, but not less than quarterly, evaluate investments and other assets
for impairment indicators. We may be required to record additional impairment
charges if our investments suffer a decline in value that is considered
other-than-temporary. If we determine that a significant impairment has
occurred, we would be required to charge against earnings the credit-related
portion of the other-than-temporary impairment, which could have a material
adverse effect on our results of operations in the periods in which the
write-offs occur.
The requirement to record certain assets and
liabilities at fair value may adversely affect our financial results.
In accordance with U.S. GAAP, we report
certain assets, including investment securities, at fair value. Generally, for
assets that are reported at fair value we use quoted market prices or valuation
models that utilize market data inputs to estimate fair value. Because we carry
these assets on our books at their estimated fair value, we may incur losses
even if the asset in question presents minimal credit risk. Given the continued
disruption in the capital markets, we may be required to recognize
other-than-temporary impairments in future periods with respect to investment
securities in our portfolio. The amount and timing of any impairment recognized
will depend on the severity and duration of the decline in fair value of our
investment securities and our estimation of the anticipated recovery
period.
Unexpected losses in future reporting periods
may require us to establish a valuation allowance against our deferred tax
assets.
We evaluate our deferred tax assets for
recoverability based on all available evidence. This process involves
significant management judgment about assumptions that are subject to change
from period to period based on changes in tax laws or variances between our
future projected operating performance and our actual results. We are required
to establish a valuation allowance for deferred tax assets if we determine,
based on available evidence at the time the determination is made, that it is
more likely than not that some portion or all of the deferred tax assets will
not be realized. In determining the “more likely than not” criterion, we
evaluate all positive and negative available evidence as of the end of each
reporting period. Future adjustments to the deferred tax asset valuation
allowance, if any, will be determined based upon changes in the expected
realization of the net deferred tax assets. The realization of the deferred tax
assets ultimately depends on the existence of sufficient taxable income in
either the carryback or carryforward periods under applicable tax laws. Due to
significant estimates utilized in establishing the valuation allowance and the
potential for changes in facts and circumstances, it is reasonably possible that
we will be required to record adjustments to the valuation allowance in the near
term if estimates of future taxable income during the carryforward period are
reduced. Such a charge could have a material adverse effect on our results of
operations, financial condition, and capital position.
21
Our operations are subject to interest rate
risk and variations in interest rates may negatively affect financial
performance.
In addition to other factors, our earnings and
cash flows are dependent upon our net interest income. Net interest income is
the difference between interest income earned on interest-earning assets, such
as loans and securities, and interest expense paid on interest-bearing
liabilities, such as deposits and borrowed money. Changes in the general level
of interest rates may have an adverse effect on our business, financial
condition, and results of operations. Interest rates are highly sensitive to
many factors that are beyond our control, including general economic conditions
and policies of various governmental and regulatory agencies and, in particular,
the FRB. Changes in monetary policy, including changes in interest rates,
influence the amount of interest income that we receive on loans and securities
and the amount of interest that we pay on deposits and borrowings. Changes in
monetary policy and interest rates also can adversely affect:
- our ability to originate loans and obtain deposits;
- the fair value of our financial assets and liabilities; and
- the average duration of our securities portfolio.
If the interest rates paid on deposits and
other borrowings increase at a faster rate than the interest rates received on
loans and other investments, our net interest income, and therefore earnings,
could be adversely affected. Earnings could also be adversely affected if the
interest rates received on loans and other investments fall more quickly than
the interest rates paid on deposits and other borrowings.
Negative conditions in the general economy and
financial services industry may limit our access to additional funding and
adversely affect liquidity.
An inability to raise funds through deposits,
borrowings, and other sources could have a substantial negative effect on our
liquidity. Our access to funding sources in amounts adequate to finance our
activities could be impaired by factors that affect us specifically or the
financial services industry in general. General industry factors that could
detrimentally affect our access to liquidity sources include severe disruption
of the financial markets or negative news and expectations about the prospects
for the financial services industry as a whole, as evidenced by the turmoil in
the domestic and worldwide credit markets which occurred in late 2008 and early
2009. Our ability to borrow could also be impaired by factors that are specific
to us, such as a decrease in the level of our business activity due to a market
downturn or adverse regulatory action against us.
We operate in a highly competitive industry
and market area with other financial institutions offering products and services
similar to those we offer.
In our market area, we encounter significant
competition from other savings associations, commercial banks, credit unions,
mortgage banking firms, consumer finance companies, securities brokerage firms,
insurance companies, money market mutual funds, and other financial
intermediaries. Our competitors may have substantially greater resources and
lending limits than we do and may offer services that we do not or cannot
provide. Our profitability depends upon our continued ability to compete
successfully in our market area.
We may experience difficulties in managing our
growth, and our growth strategy involves risks that may negatively impact our
net income.
We may expand into additional communities or
attempt to strengthen our position in our current market and in surrounding
areas by opening new branches and acquiring existing branches of other financial
institutions. To the extent that we undertake additional branch openings and
acquisitions, we are likely to continue to experience the effects of higher
operating expenses relative to operating income from the new operations, which
may have an adverse effect on our levels of reported net income, return on
average equity, and return on average assets. Other effects of engaging in such
growth strategies may include potential diversion of management’s time and
attention from other aspects of our business and the general disruption to our
business.
22
We may elect or be compelled to seek
additional capital in the future, but that capital may not be available when it
is needed.
Like other savings and loan holding companies,
we are required by our regulatory authorities to maintain adequate levels of
capital to support our operations. In addition, we may elect to raise additional
capital to support the growth of our business or to finance acquisitions, if
any, or we may elect to raise additional capital for other reasons. In that
regard, a number of financial institutions have recently raised considerable
amounts of capital as a result of deterioration in their results of operations
and financial condition arising from the turmoil in the mortgage loan market,
deteriorating economic conditions, declines in real estate values, and other
factors. Should we elect, or be required by regulatory authorities to raise
additional capital, we may seek to do so through the issuance of, among other
things, our common stock or securities convertible into our common stock, which
could dilute your ownership interest in the Company. Although we remain “well
capitalized” at December 31, 2009 for regulatory purposes and have not had a
deterioration in our liquidity, the future cost and availability of capital may
be adversely affected by illiquid credit markets, economic conditions, and a
number of other factors, many of which lie outside of our control. Accordingly,
we cannot be assured of our ability to raise additional capital if needed or on
terms acceptable to us. If we cannot raise additional capital when needed or on
terms acceptable to us, it may have a material adverse effect on our financial
condition and results of operations.
We may not be able to attract and retain the
skilled employees necessary for our business.
Our success depends, in large part, on our
ability to attract and retain key employees. Competition for the best employees
in most of our business lines can be intense, and we may not be able to hire or
retain the necessary employees for meeting our business goals. The unexpected
loss of services of one or more of our key personnel could have a material
adverse impact on our business because of their skills, knowledge of our market,
years of industry experience, and the difficulty of promptly finding qualified
replacement personnel.
Our information systems may experience an
interruption or breach in security that could impact our operational
capabilities.
We rely heavily on communications and
information systems to conduct our business. Any failure, interruption, or
breach in security of these systems could result in failures or disruptions in
our client relationship management, general ledger, deposit, loan, and other
systems. While we have policies and procedures designed to prevent or limit the
effect of the failure, interruption, or security breach of our information
systems, there can be no assurance that any such failures, interruptions, or
security breaches will not occur or, if they do occur, that they will be
adequately addressed. The occurrences of any failures, interruptions, or
security breaches of our information systems could damage our reputation, result
in a loss of client business, subject us to additional regulatory scrutiny, or
expose us to civil litigation and possible financial liability, any of which
could have a material adverse effect on our financial condition and results of
operations.
The trading volume in our common stock has
been low, and the sale of a substantial number of shares of our common stock in
the public market could depress the price of our common stock and make it
difficult for you to sell your shares.
Our common stock is listed to trade on the
NASDAQ Global Market, but is thinly traded. As a result, you may not be able to
sell your shares of common stock on short notice. Additionally, thinly traded
stock can be more volatile than stock trading in an active public market. The
sale of a substantial number of shares of our common stock at one time could
temporarily depress the market price of our common stock, making it difficult
for you to sell your shares and impairing our ability to raise capital.
We may be subject to examinations by taxing
authorities which could adversely affect our results of operations.
Like other for-profit enterprises, in the
normal course of business, we may be subject to examinations from federal and
state taxing authorities regarding the amount of taxes due in connection with
investments we have made and the businesses in which we are engaged. Recently,
federal and state taxing authorities have become increasingly aggressive in
challenging tax positions taken by financial institutions. The challenges made
by taxing authorities may result in adjustments to the timing or amount of
taxable income or deductions or the allocation of income among tax
jurisdictions. If any such challenges are made and are not resolved in our
favor, they could have an adverse effect on our financial condition and results
of operations.
23
ITEM 1B. UNRESOLVED STAFF
COMMENTS
None.
ITEM 2. PROPERTIES
We conduct our business through our main
office and headquarters located at 707 Ridge Road, Munster, Indiana, 46321. In
addition, we operate 23 banking centers in Cook, DuPage, and Will counties in
Illinois and Lake and Porter counties in Indiana. We currently own 16
full-service banking centers and lease seven others. We intend to build future
full-service banking centers and own three vacant lots in Illinois and one in
Indiana. In addition, we maintain 37 automated teller machines (ATMs), 24 of which
are located at our branch offices. The net book value of our property and
leasehold improvements at December 31, 2009 totaled $17.2 million. See “Note 4.
Office Properties and Equipment” in the notes to consolidated financial
statements included in “Item 8. Financial Statements and Supplementary Data” of
this Annual Report on Form 10-K.
ITEM 3. LEGAL PROCEEDINGS
The Company is involved in routine legal
proceedings occurring in the ordinary course of its business, which, in the
aggregate, are believed to be immaterial to the financial condition of the
Company.
ITEM 4. RESERVED
PART II.
| ITEM 5. | MARKET FOR REGISTRANT’S COMMON EQUITY, RELATED SHAREHOLDER MATTERS, AND ISSUER PURCHASES OF EQUITY SECURITIES |
| (a) |
The Company’s
common stock is traded on the NASDAQ Global Market under the symbol
“CITZ.” As of December 31, 2009, there were 10,771,061 shares of common
stock outstanding which were held by 1,926 shareholders of record. The
following table sets forth the high and low closing sales price as
reported by NASDAQ and cash dividends paid per share during each quarter
of 2009 and 2008. See further information regarding the ability to pay
dividends in “Regulation” within “Item 1. Business” and also “Note 12.
Shareholders’ Equity and Regulatory Capital” in the notes to consolidated
financial statements included in “Item 8. Financial Statements and
Supplementary Data” of this Annual Report on Form 10-K.
|
|
| Cash | ||||||||
| Share Price | Dividend | |||||||
| High | Low | Paid | ||||||
| 2008 | ||||||||
| First Quarter | $ | 14.70 | $ | 13.33 | $ | 0.12 | ||
| Second Quarter | 14.93 | 11.42 | 0.12 | |||||
| Third Quarter | 11.84 | 8.10 | 0.12 | |||||
| Fourth Quarter | 10.31 | 3.50 | 0.04 | |||||
| 2009 | ||||||||
| First Quarter | $ | 4.80 | $ | 1.75 | $ | 0.01 | ||
| Second Quarter | 4.33 | 3.50 | 0.01 | |||||
| Third Quarter | 4.68 | 3.75 | 0.01 | |||||
| Fourth Quarter | 4.73 | 3.23 | 0.01 | |||||
The information for equity compensation plans
is incorporated by reference from “Item 12. Security Ownership of Certain
Beneficial Owners and Management and Related Shareholder Matters” of this Annual
Report on Form 10-K. There were no sales of unregistered shares of common stock
by the Company during the fourth quarter of 2009. Pursuant to informal
regulatory agreements with the OTS, we are prohibited from paying dividends
without prior approval from the OTS.
| (b) | Not applicable. | |
| (c) |
We did not
repurchase any shares of common stock during the quarter ended December
31, 2009. Under our repurchase plan publicly announced on March 20, 2008
for 530,000 shares, we have 448,612 shares that may yet be purchased. We
are currently prohibited from repurchasing our common stock without the
prior approval of the OTS pursuant to our informal regulatory agreement
with them.
|
|
24
PERFORMANCE GRAPH
The following graph compares the cumulative
total returns for common stock to the total returns for the Standard and Poor’s
500 Index (S&P 500) and the NASDAQ Bank Index. The graph assumes that $100
was invested on December 31, 2004 in our common stock, the S&P 500 Index,
and the NASDAQ Bank Index. The cumulative total return on each investment is as
of December 31 of each of the subsequent five years and assumes dividends are
reinvested.
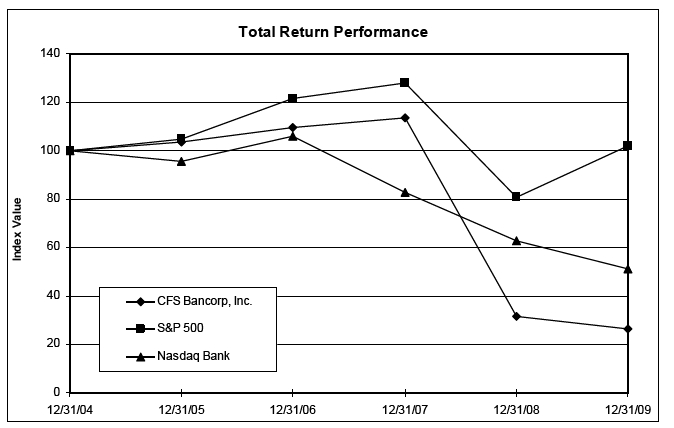
| Index | 12/31/04 | 12/31/05 | 12/31/06 | 12/31/07 | 12/31/08 | 12/31/09 | ||||||||||||
| CFS Bancorp, Inc. | $ | 100.00 | $ | 103.71 | $ | 109.78 | $ | 113.75 | $ | 31.43 | $ | 26.45 | ||||||
| S&P 500 | 100.00 | 104.91 | 121.48 | 128.16 | 80.74 | 102.11 | ||||||||||||
| NASDAQ Bank Index | 100.00 | 95.67 | 106.20 | 82.76 | 62.96 | 51.31 | ||||||||||||
25
ITEM 6. SELECTED FINANCIAL
DATA
| December 31, | |||||||||||||||||||
| 2009 | 2008 | 2007 | 2006 | 2005 | |||||||||||||||
| (Dollars in thousands except per share data) | |||||||||||||||||||
| Selected Financial Condition Data: | |||||||||||||||||||
| Total assets | $ | 1,081,515 | $ | 1,121,855 | $ | 1,150,278 | $ | 1,254,390 | $ | 1,242,888 | |||||||||
| Loans receivable | 762,386 | 749,973 | 793,136 | 802,383 | 917,405 | ||||||||||||||
| Allowance for losses on loans | 19,461 | 15,558 | 8,026 | 11,184 | 12,939 | ||||||||||||||
| Securities, available-for-sale | 188,781 | 251,270 | 224,594 | 298,925 | 218,550 | ||||||||||||||
| Securities, held-to-maturity | 5,000 | 6,940 | 3,940 | — | — | ||||||||||||||
| Deposits | 849,758 | 824,097 | 863,272 | 907,095 | 828,635 | ||||||||||||||
| Borrowed money | 111,808 | 172,937 | 135,459 | 202,275 | 257,326 | ||||||||||||||
| Shareholders’ equity | 110,373 | 111,809 | 130,414 | 131,806 | 142,367 | ||||||||||||||
| Book value per outstanding share | $ | 10.25 | $ | 10.47 | $ | 12.18 | $ | 11.84 | $ | 11.86 | |||||||||
| Average shareholders’ equity to average assets | 10.24 | % | 11.14 | % | 10.75 | % | 10.54 | % | 11.38 | % | |||||||||
| Non-performing assets to total assets | 6.31 | 5.16 | 2.67 | 2.22 | 1.74 | ||||||||||||||
| Allowance for losses on loans to non-performing loans | 32.98 | 28.44 | 27.11 | 40.64 | 61.49 | ||||||||||||||
| Allowance for losses on loans to total loans | 2.55 | 2.07 | 1.01 | 1.39 | 1.41 | ||||||||||||||
| December 31, | |||||||||||||||||||
| 2009 | 2008 | 2007 | 2006 | 2005 | |||||||||||||||
| (Dollars in thousands except per share data) | |||||||||||||||||||
| Selected Operations Data: | |||||||||||||||||||
| Interest income | $ | 51,308 | $ | 59,539 | $ | 72,241 | $ | 75,547 | $ | 69,464 | |||||||||
| Interest expense | 13,715 | 24,656 | 38,134 | 42,644 | 39,603 | ||||||||||||||
| Net interest income | 37,593 | 34,883 | 34,107 | 32,903 | 29,861 | ||||||||||||||
| Provision for losses on loans | 12,588 | 26,296 | 2,328 | 1,309 | 1,580 | ||||||||||||||
| Net interest income after provision for losses on loans | 25,005 | 8,587 | 31,779 | 31,594 | 28,281 | ||||||||||||||
| Non-interest income | 11,472 | 5,623 | 11,515 | 10,542 | 11,397 | ||||||||||||||
| Non-interest expense | 39,282 | 34,178 | 33,459 | 36,178 | 33,485 | ||||||||||||||
| Income (loss) before income taxes | (2,805 | ) | (19,968 | ) | 9,835 | 5,958 | 6,193 | ||||||||||||
| Income tax expense (benefit) | (2,262 | ) | (8,673 | ) | 2,310 | 618 | 1,176 | ||||||||||||
| Net income (loss) | $ | (543 | ) | $ | (11,295 | ) | $ | 7,525 | $ | 5,340 | $ | 5,017 | |||||||
| Earnings (loss) per share (basic) | $ | (0.05 | ) | $ | (1.10 | ) | $ | 0.71 | $ | 0.48 | $ | 0.43 | |||||||
| Earnings (loss) per share (diluted) | (0.05 | ) | (1.10 | ) | 0.69 | 0.47 | 0.42 | ||||||||||||
| Cash dividends declared per common share | 0.04 | 0.40 | 0.48 | 0.48 | 0.48 | ||||||||||||||
| Dividend payout ratio | NM | NM | 69.57 | % | 102.13 | % | 114.29 | % | |||||||||||
26
| Year Ended December 31, | ||||||||||||||||||||
| 2009 | 2008 | 2007 | 2006 | 2005 | ||||||||||||||||
| (Dollars in thousands except per share data) | ||||||||||||||||||||
| Selected Operating Ratios: | ||||||||||||||||||||
| Net interest margin | 3.72 | % | 3.32 | % | 3.02 | % | 2.73 | % | 2.48 | % | ||||||||||
| Average interest-earning assets to average interest-bearing liabilities | 112.56 | 113.07 | 113.27 | 113.03 | 113.44 | |||||||||||||||
| Ratio of non-interest expense to average total assets | 3.58 | 3.01 | 2.76 | 2.83 | 2.62 | |||||||||||||||
| Return (loss) on average assets | (0.05 | ) | (0.99 | ) | 0.62 | 0.42 | 0.39 | |||||||||||||
| Return (loss) on average equity | (0.48 | ) | (8.93 | ) | 5.78 | 3.96 | 3.45 | |||||||||||||
| Efficiency Ratio Calculations (1): | ||||||||||||||||||||
| Efficiency Ratio: | ||||||||||||||||||||
| Non-interest expense | $ | 39,282 | $ | 34,178 | $ | 33,459 | $ | 36,178 | $ | 33,485 | ||||||||||
| Net interest income plus non-interest income | $ | 49,065 | $ | 40,506 | $ | 45,622 | $ | 43,445 | $ | 41,258 | ||||||||||
| Efficiency ratio | 80.06 | % | 84.38 | % | 73.34 | % | 83.27 | % | 81.16 | % | ||||||||||
| Core Efficiency Ratio: | ||||||||||||||||||||
| Non-interest expense | $ | 39,282 | $ | 34,178 | $ | 33,459 | $ | 36,178 | $ | 33,485 | ||||||||||
| Adjustment for the special assessment – FDIC insurance | (495 | ) | — | — | — | — | ||||||||||||||
| Adjustment for the goodwill impairment | — | (1,185 | ) | — | — | — | ||||||||||||||
| Non-interest expense – as adjusted | $ | 38,787 | $ | 32,993 | $ | 33,459 | $ | 36,178 | $ | 33,485 | ||||||||||
| Net interest income plus non-interest income | $ | 49,065 | $ | 40,506 | $ | 45,622 | $ | 43,445 | $ | 41,258 | ||||||||||
| Adjustments: | ||||||||||||||||||||
| Net realized (gains) losses on sales of securities available-for-sale | (1,092 | ) | (69 | ) | (536 | ) | (750 | ) | 238 | |||||||||||
| Other-than-temporary impairment of securities available-for-sale | — | 4,334 | — | — | 240 | |||||||||||||||
| Net realized (gains) losses on sales of assets | 9 | (30 | ) | (22 | ) | 994 | (354 | ) | ||||||||||||
| Amortization of deferred premium on the early extinguishment of debt | 175 | 1,452 | 4,540 | 9,624 | 14,381 | |||||||||||||||
| Net interest income plus non-interest income – as adjusted | $ | 48,157 | $ | 46,193 | $ | 49,604 | $ | 53,313 | $ | 55,763 | ||||||||||
| Core efficiency ratio | 80.54 | % | 71.42 | % | 67.45 | % | 67.86 | % | 60.05 | % | ||||||||||
| (1) |
See “Results of
Operations – Non-Interest Expense” within “Item 7. Management’s Discussion
and Analysis of Financial Condition and Results of Operations” for further
discussions about non-U.S. GAAP efficiency ratio and core efficiency ratio
disclosures.
|
|
| ITEM 7. | MANAGEMENT’S DISCUSSION AND ANALYSIS OF FINANCIAL CONDITION AND RESULTS OF OPERATIONS |
OVERVIEW
The following discussion and analysis presents
the more significant factors affecting our financial condition as of December
31, 2009 and 2008 and results of operations for each of the years in the
three-year period ended December 31, 2009. This discussion and analysis should
be read in conjunction with our consolidated financial statements, notes
thereto, and other financial information appearing elsewhere in this report.
During 2009, we recorded a net loss of
$543,000, or $(0.05) per share. Economic conditions locally and throughout the
country continue to impact real estate values and have negatively impacted our
borrowers’ ability to repay their loans in accordance with their original terms
resulting in higher non-performing assets. Rapid declines in real estate values
necessitated a higher than normal provision for losses on loans and increased
valuation allowances on our other real estate owned properties. In addition,
higher professional fees related to a shareholder derivative demand and higher
FDIC insurance premiums negatively impacted earnings for the year. These factors
exceeded reductions in controllable overhead costs, increases in non-interest
income, and increases in net interest income attributable to higher net interest
margins. Our net interest margin, driven by our extremely low cost of funds,
increased for the sixth consecutive year.
Despite the challenges of the past two years,
our capital and liquidity positions remain strong. Our tangible common equity at
December 31, 2009 was $110.4 million, or 10.31% of tangible assets. The Bank’s
total capital to risk-weighted assets was 12.35%, exceeding the regulatory
requirement of 10% to be considered “well capitalized” and in excess of all
regulatory capital requirements set by the OTS.
27
We have made significant progress in
diversifying our loan portfolio by growing targeted segments and reducing loans
not meeting our current defined risk tolerance. Since December 31, 2008, we have
increased our portfolio of commercial and industrial, owner-occupied commercial
real estate, and multifamily loans by $51.1 million. These categories represent
47% of our commercial loan portfolio at December 31, 2009 compared to 39% a year
ago. This growth was partially offset by decreases in commercial construction
and land development, non-owner occupied commercial real estate, and one-to-four
family residential loans totaling $37.3 million. Our loans receivable increased
to $762.4 million at December 31, 2009 compared to $750.0 million at December
31, 2008.
The deposit environment has become more
favorable with consumer savings rates on the rise and overall pricing within the
industry being more rational than in the recent past. We continue to focus on
building new and deepening existing client relationships while remaining
disciplined in our pricing, particularly our certificates of deposit. At
December 31, 2009, our total core deposits increased $36.1 million, or 8.1%,
from December 31, 2008. Investments in our branch network, technological
infrastructure, human capital, and brand have enhanced our ability to translate
existing and new client relationships into deposit growth.
Progress on Strategic Growth and
Diversification Plan
Our Strategic Growth and Diversification Plan
is built around four core objectives: decreasing non-performing loans; ensuring
costs are appropriate given our targeted future asset base; growing while
diversifying by targeting small- and medium-sized business owners for
relationship-based banking opportunities; and expanding and deepening our
relationships with our clients by meeting a higher percentage of our clients’
financial service needs.
Progress on the Strategic Growth and
Diversification plan continues at a consistent pace, although a little slower
than we would otherwise have preferred as a result of the present economic
conditions. The uncertainty over future economic conditions and industry-wide
concerns over capital levels necessitates prudent capital management. During the
fourth quarter of 2009, the parent company elected to make a $1.75 million
capital infusion into the Bank in order to maintain internal capital ratio
targets.
Credit quality remains a major concern and our
number one priority in 2010. The decline in the real estate collateral values
supporting many of our non-performing loans and other real estate owned led to
increases in impairment reserves on loans, net charge-offs, and valuation
allowances on other real estate owned during 2009. These non-performing assets
impose negative pressure on earnings for a number of reasons, and we are
committed to addressing these problem assets in a conservative, yet prudent,
manner within the constraints of current and forecasted market
conditions.
We have continued to make progress in
attracting new business banking clients and deepening relationships with current
clients. Although we are doing a better job of controlling discretionary costs,
higher nondiscretionary costs, including increased FDIC assessments, credit
collection related costs, costs related to shareholder matters, and professional
fees have negated the overall financial impact of these controls. Growth remains
a strategic priority, but in the current environment, the Company is willing to
accept a more linear rate of loan growth by focusing on high credit-quality
borrowers and depositors.
In addition, in late October 2009, our Board
of Directors (Board) conducted its annual Strategic Retreat which
focused on three key themes:
- assessing our progress towards our current strategic goals and objectives;
- evaluating the economic and regulatory environment moving forward; and
- reviewing a wide variety of strategic alternatives for our future.
28
Our Board reiterated its vision of the Company and the Bank as a
community-oriented financial institution serving the needs of its core Northwest
Indiana and Southwest suburban Chicago markets. Our Board also reconfirmed its
intent that the Company pursue the current Strategic Growth and Diversification
Plan. Noting the current industry-wide expectations for a slow, gradual economic
recovery, increased regulatory scrutiny, and anticipated higher future capital
requirements for insured depository institutions, our Board articulated that the
operating environment over the next few years is likely to remain unforgiving
and characterized by both unforeseen threats and opportunities. In light of
this, our Board has elected to further examine a number of potential strategic
alternatives, such as:
- expanding the franchise;
- raising additional capital to further strengthen regulatory capital ratios and facilitate growth; and/or
- exploring business combinations with desirable strategic and financial attributes.
To assist our Board and management team in
this examination, we retained David D. Olson, a highly experienced strategic and
financial advisor who was formerly the co-head of Donaldson Lufkin &
Jenrette’s Financial Institutions Group and head of the firm’s Chicago
Investment Banking office. Mr. Olson has served as senior banker on a broad
range of Midwestern bank advisory and capital raising transactions. Our Board
and management team continues to work closely with Mr. Olson and these
initiatives.
CRITICAL ACCOUNTING
POLICIES
The consolidated financial statements are
prepared in accordance with U.S. generally accepted accounting principles
(U.S. GAAP), which
require us to establish various accounting policies. Certain of these accounting
policies require us to make estimates, judgments, or assumptions that could have
a material effect on the carrying value of certain assets and liabilities. The
estimates, judgments, and assumptions we used are based on historical
experience, projected results, internal cash flow modeling techniques, and other
factors which we believe are reasonable under the circumstances.
Significant accounting policies are presented
in “Note 1. Summary of Significant Accounting Policies” in the notes to
consolidated financial statements included in “Item 8. Financial Statements and
Supplementary Data” of this Annual Report on Form 10-K. These policies, along
with the disclosures presented in other financial statement notes and in this
management’s discussion and analysis, provide information on the methodology
used for the valuation of significant assets and liabilities in our financial
statements. We view critical accounting policies to be those that are highly
dependent on subjective or complex judgments, estimates, and assumptions, and
where changes in those estimates and assumptions could have a significant impact
on the financial statements. We currently view the determination of the
allowance for losses on loans, valuations and impairments of securities, and the
accounting for income taxes to be critical accounting policies.
Allowance for Losses on Loans. We maintain our allowance for losses on loans
at a level we believe is sufficient to absorb credit losses inherent in our loan
portfolio. The allowance for losses on loans represents our estimate of probable
incurred losses in our loan portfolio at each statement of condition date and is
based on our review of available and relevant information.
The first component of our allowance for
losses on loans contains allocations for probable incurred losses that we have
identified relating to impaired loans pursuant to ASC 310-10, Receivables. We
individually evaluate for impairment all loans over $1.0 million and classified
substandard. Loans are considered impaired when, based on current information
and events, it is probable that the borrower will not be able to fulfill its
obligation according to the contractual terms of the loan agreement. The
impairment loss, if any, is generally measured based on the present value of
expected cash flows discounted at the loan’s effective interest rate. As a
practical expedient, impairment may be measured based on the loan’s observable
market price, or the fair value of the collateral, if the loan is
collateral-dependent. A loan is considered collateral-dependent when the
repayment of the loan will be provided solely by the underlying collateral and
there are no other available and reliable sources of repayment. If we determine
a loan is collateral-dependent we will charge-off any identified collateral
short fall against the allowance for losses on loans.
If foreclosure is probable, we are required to
measure the impairment based on the fair value of the collateral. The fair value
of the collateral is generally obtained from appraisals or estimated using an
appraisal-like methodology. When current appraisals are not available,
management estimates the fair value of the collateral giving consideration to
several factors including the price at which individual unit(s) could be sold in
the current market, the period of time over which the unit(s) would be sold, the
estimated cost to complete the unit(s), the risks associated with completing and
selling the unit(s), the required return on the investment a potential acquirer
may have, and the current market interest rates. The analysis of each loan
involves a high degree of judgment in estimating the amount of the loss
associated with the loan, including the estimation of the amount and timing of
future cash flows and collateral values.
The second component of our allowance for
losses on loans contains allocations for probable incurred losses within various
pools of loans with similar characteristics pursuant to ASC 450-10, Contingencies. This
component is based in part on certain loss factors applied to various stratified
loan pools excluding loans evaluated individually for impairment. In determining
the appropriate loss factors for these loan pools, we consider historical
charge-offs and recoveries; levels of and trends in delinquencies, impaired
loans, and other classified loans; concentrations of credit within the
commercial loan portfolios; volume and type of lending; and current and
anticipated economic conditions.
29
Loan losses are charged off against the
allowance when the loan balance or a portion of the loan balance is no longer
covered by the paying capacity of the borrower based on an evaluation of
available cash resources and collateral value, while recoveries of amounts
previously charged off are credited to the allowance. We assess the adequacy of
the allowance for losses on loans on a quarterly basis and adjust the allowance
for losses on loans by recording a provision for losses on loans in an amount
sufficient to maintain the allowance at a level we deem appropriate. Our
evaluation of the adequacy of the allowance for losses on loans is inherently
subjective as it requires estimates that are susceptible to significant revision
as additional information becomes available or as future events occur. To the
extent that actual outcomes differ from our estimates, an additional provision
for losses on loans could be required which could adversely affect earnings or
our financial position in future periods. The OTS could require us to make
additional provisions for losses on loans.
Securities. Under
ASC 320-10, Investments – Debt and Equity
Securities, investment
securities must be classified as held-to-maturity, available-for-sale, or
trading. We determine the appropriate classification at the time of purchase.
The classification of securities is significant since it directly impacts the
accounting for unrealized gains and losses on securities. Debt securities are
classified as held-to-maturity and carried at amortized cost when we have the
positive intent and we have the ability to hold the securities to maturity.
Securities not classified as held-to-maturity are classified as
available-for-sale and are carried at fair value, with the unrealized holding
gains and losses, net of tax, reported in other comprehensive income and do not
affect earnings until realized.
The fair values of our securities are
generally determined by reference to quoted prices from reliable independent
sources utilizing observable inputs. Certain of the fair values of securities
are determined using models whose significant value drivers or assumptions are
unobservable and are significant to the fair value of the securities. These
models are utilized when quoted prices are not available for certain securities
or in markets where trading activity has slowed or ceased. When quoted prices
are not available and are not provided by third-party pricing services, our
judgment is necessary to determine fair value. As such, fair value is determined
using discounted cash flow analysis models, incorporating default rates,
estimation of prepayment characteristics, and implied volatilities.
We evaluate all securities on a quarterly
basis, and more frequently when economic conditions warrant additional
evaluations, for determining if an other-than-temporary impairment (OTTI) exists
pursuant to guidelines established in ASC 320-10, Investments – Debt and Equity Securities. In evaluating the possible impairment of
securities, consideration is given to the length of time and the extent to which
the fair value has been less than cost, the financial conditions and near-term
prospects of the issuer, and our ability and intent to retain our investment in
the issuer for a period of time sufficient to allow for any anticipated recovery
in fair value. In analyzing an issuer’s financial condition, we may consider
whether the securities are issued by the federal government or its agencies or
government sponsored agencies, whether downgrades by bond rating agencies have
occurred, and the results of reviews of the issuer’s financial
condition.
If we determine that an investment experienced
an OTTI, we must then determine the amount of the OTTI to be recognized in
earnings. If we do not intend to sell the security and it is more likely than
not that we will not be required to sell the security before recovery of its
amortized cost basis less any current period loss, the OTTI will be separated
into the amount representing the credit loss and the amount related to all other
factors. The amount of the OTTI related to the credit loss is determined based
on the present value of cash flows expected to be collected and is recognized in
earnings. The amount of the OTTI related to other factors will be recognized in
other comprehensive income, net of applicable taxes. The previous amortized cost
basis less the OTTI recognized in earnings will become the new amortized cost
basis of the investment. If we intend to sell the security or it is more likely
than not we will be required to sell the security before recovery of its
amortized cost basis less any current period credit loss, the OTTI will be
recognized in earnings equal to the entire difference between the investment’s
amortized cost basis and its fair value at the balance sheet date. Any
recoveries related to the value of these securities are recorded as an
unrealized gain (as other comprehensive income (loss) in shareholders’ equity)
and not recognized in income until the security is ultimately sold. From time to
time we may dispose of an impaired security in response to asset/liability
management decisions, future market movements, business plan changes, or if the
net proceeds can be reinvested at a rate of return that is expected to recover
the loss within a reasonable period of time.
30
Income Tax Accounting. We file a consolidated federal income tax return. The provision for
income taxes is based upon income in our consolidated financial statements,
rather than amounts reported on our income tax return. Deferred tax assets and
liabilities are recognized for the future tax consequences attributable to
differences between the financial statement carrying amounts of existing assets
and liabilities and their respective tax bases. Deferred tax assets and
liabilities are measured using enacted tax rates expected to apply to taxable
income in the years in which those temporary differences are expected to be
recovered or settled. The effect of a change in tax rates on our deferred tax
assets and liabilities is recognized as income or expense in the period that
includes the enactment date.
Under U.S. GAAP, a valuation allowance is
required to be recognized if it is more likely than not that a deferred tax
asset will not be realized. The determination of the realizability of the
deferred tax assets is highly subjective and dependent upon judgment concerning
our evaluation of both positive and negative evidence, our forecasts of future
income, applicable tax planning strategies, and assessments of current and
future economic and business conditions. Positive evidence includes the
existence of taxes paid in available carryback years as well as the probability
that taxable income will be generated in future periods, while negative evidence
includes any cumulative losses in the current year and prior two years and
general business and economic trends. At December 31, 2009 and December 31,
2008, we conducted an extensive analysis to determine if a valuation allowance
was required and concluded that a valuation allowance was not necessary, largely
based on available tax planning strategies and our projections of future taxable
income. Additional positive evidence considered in our analysis was our
long-term history of generating taxable income; the industry in which we operate
is cyclical in nature, as a result, recent losses are not expected to have a
significant long-term impact on our profitability; the fact that recent losses
were partly attributable to syndicated/participation lending which we stopped
investing in during the first quarter of 2007; our history of fully realizing
net operating losses most recently a federal net operating loss from a $45.0
million taxable loss in 2004; and the relatively long remaining tax loss
carryforward periods (nineteen years for federal income tax purposes, ten years
for the state of Indiana, and eight years for the state of Illinois). We
concluded that the aforementioned positive evidence outweighs the negative
evidence of cumulative losses over the past three years. Any reduction in
estimated future taxable income may require us to record a valuation allowance
against our deferred tax assets. Any required valuation allowance would result
in additional income tax expense in the period and could have a significant
impact on our future earnings.
Positions taken in our tax returns may be
subject to challenge by the taxing authorities upon examination. The benefit of
an uncertain tax position is initially recognized in the financial statements
only when it is more likely than not the position will be sustained upon
examination by the tax authorities. Such tax positions are both initially and
subsequently measured as the largest amount of tax benefit that is greater than
50% likely of being realized upon settlement with the tax authority, assuming
full knowledge of the position and all relevant facts. Differences between our
position and the position of tax authorities could result in a reduction of a
tax benefit or an increase to a tax liability, which could adversely affect our
future income tax expense.
We believe our tax policies and practices are
critical accounting policies because the determination of our tax provision and
current and deferred tax assets and liabilities have a material impact on our
net income and the carrying value of our assets. We believe our tax liabilities
and assets are adequate and are properly recorded in the consolidated financial
statements at December 31, 2009.
31
AVERAGE BALANCES, NET INTEREST INCOME, YIELDS
EARNED, AND RATES PAID
The following table provides information
regarding: (i) interest income recognized from interest-earning assets and their
related average yields; (ii) the amount of interest expense realized on
interest-bearing liabilities and their related average rates; (iii) net interest
income; (iv) interest rate spread; and (v) net interest margin. Information is
based on average daily balances during the periods indicated.
| Year Ended December 31, | |||||||||||||||||||||||||||
| 2009 | 2008 | 2007 | |||||||||||||||||||||||||
| Average | Average | Average | Average | Average | Average | ||||||||||||||||||||||
| Balance | Interest | Yield/Cost | Balance | Interest | Yield/Cost | Balance | Interest | Yield/Cost | |||||||||||||||||||
| (Dollars in thousands) | |||||||||||||||||||||||||||
| Interest-earning assets: | |||||||||||||||||||||||||||
| Loans receivable (1) | $ | 752,906 | $ | 39,277 | 5.22 | % | $ | 753,500 | $ | 45,213 | 6.00 | % | $ | 806,626 | $ | 56,678 | 7.03 | % | |||||||||
| Securities (2) | 227,999 | 11,334 | 4.90 | 251,785 | 12,673 | 4.95 | 265,116 | 12,684 | 4.72 | ||||||||||||||||||
| Other interest-earning assets (3) | 28,794 | 697 | 2.42 | 45,330 | 1,653 | 3.65 | 59,215 | 2,879 | 4.86 | ||||||||||||||||||
| Total interest-earning assets | 1,009,699 | 51,308 | 5.08 | 1,050,615 | 59,539 | 5.67 | 1,130,957 | 72,241 | 6.39 | ||||||||||||||||||
| Non-interest earning assets | 87,812 | 85,178 | 79,370 | ||||||||||||||||||||||||
| Total assets | $ | 1,097,511 | $ | 1,135,793 | $ | 1,210,327 | |||||||||||||||||||||
| Interest-bearing liabilities: | |||||||||||||||||||||||||||
| Deposits: | |||||||||||||||||||||||||||
| Checking accounts | $ | 128,037 | 346 | 0.27 | $ | 105,481 | 612 | 0.58 | $ | 100,781 | 955 | 0.95 | |||||||||||||||
| Money market accounts | 157,518 | 1,133 | 0.72 | 181,852 | 3,768 | 2.07 | 176,538 | 5,947 | 3.37 | ||||||||||||||||||
| Savings accounts | 117,539 | 399 | 0.34 | 121,920 | 589 | 0.48 | 142,018 | 941 | 0.66 | ||||||||||||||||||
| Certificates of deposit | 366,506 | 8,569 | 2.34 | 374,834 | 13,130 | 3.50 | 400,607 | 18,379 | 4.59 | ||||||||||||||||||
| Total deposits | 769,600 | 10,447 | 1.36 | 784,087 | 18,099 | 2.31 | 819,944 | 26,222 | 3.20 | ||||||||||||||||||
| Borrowings: | |||||||||||||||||||||||||||
| Other short-term borrowings (4) | 14,653 | 101 | 0.69 | 25,743 | 430 | 1.67 | 19,828 | 811 | 4.09 | ||||||||||||||||||
| FHLB borrowings (5)(6)(7) | 112,763 | 3,167 | 2.77 | 119,369 | 6,127 | 5.05 | 158,667 | 11,101 | 6.90 | ||||||||||||||||||
| Total borrowed money | 127,416 | 3,268 | 2.53 | 145,112 | 6,557 | 4.44 | 178,495 | 11,912 | 6.58 | ||||||||||||||||||
| Total interest-bearing liabilities | 897,016 | 13,715 | 1.53 | 929,199 | 24,656 | 2.65 | 998,439 | 38,134 | 3.82 | ||||||||||||||||||
| Non-interest bearing deposits | 72,968 | 63,276 | 64,315 | ||||||||||||||||||||||||
| Non-interest bearing liabilities | 15,169 | 16,779 | 17,475 | ||||||||||||||||||||||||
| Total liabilities | 985,153 | 1,009,254 | 1,080,229 | ||||||||||||||||||||||||
| Shareholders’ equity | 112,358 | 126,539 | 130,098 | ||||||||||||||||||||||||
| Total liabilities and shareholders’ equity | $ | 1,097,511 | $ | 1,135,793 | $ | 1,210,327 | |||||||||||||||||||||
| Net interest-earning assets | $ | 112,683 | $ | 121,416 | $ | 132,518 | |||||||||||||||||||||
| Net interest income/interest rate spread | $ | 37,593 | 3.55 | % | $ | 34,883 | 3.02 | % | $ | 34,107 | 2.57 | % | |||||||||||||||
| Net interest margin | 3.72 | % | 3.32 | % | 3.02 | % | |||||||||||||||||||||
| Ratio of average interest-earning assets to | |||||||||||||||||||||||||||
| average interest-bearing liabilities | 112.56 | % | 113.07 | % | 113.27 | % | |||||||||||||||||||||
| (1) |
The average
balance of loans receivable includes non-performing loans, interest on
which is recognized on a cash basis.
|
|
| (2) |
Average
balances of securities are based on amortized cost.
|
|
| (3) |
Includes FHLB
stock, money market accounts, federal funds sold, and interest-earning
bank deposits.
|
|
| (4) |
Includes
federal funds purchased, overnight borrowings from the Federal Reserve
Bank discount window, and repurchase agreements (Repo Sweeps).
|
|
| (5) |
The 2009 period
includes an average of $112.8 million of contractual FHLB borrowings
reduced by an average of $62,000 of unamortized deferred premium on the
early extinguishment of debt. Interest expense on borrowings for the 2009
period includes $175,000 of amortization of the deferred premium on the
early extinguishment of debt. The amortization of the deferred premium for
the 2009 period increased the average cost of borrowed money as reported
to 2.53% compared to an average contractual rate of
2.39%.
|
|
| (6) |
The 2008 period
includes an average of $120.1 million of contractual FHLB borrowings
reduced by an average of $763,000 of unamortized deferred premium on the
early extinguishment of debt. Interest expense on borrowings for the 2008
period includes $1.5 million of amortization of the deferred premium on
the early extinguishment of debt. The amortization of the deferred premium
for the 2008 period increased the average cost of borrowed money as
reported to 4.44% compared to an average contractual rate of
2.41%.
|
|
| (7) |
The 2007 period
includes an average of $162.4 million of contractual FHLB borrowings
reduced by an average of $3.7 million of unamortized deferred premium on
the early extinguishment of debt. Interest expense on borrowings for the
2007 period includes $4.5 million of amortization of the deferred premium
on the early extinguishment of debt. The amortization of the deferred
premium for the 2007 period increased the average cost of borrowed money
as reported to 6.58% compared to an average contractual rate of
4.14%.
|
|
32
RATE/VOLUME ANALYSIS
The following table details the effects of
changing rates and volumes on net interest income. Information is provided with
respect to: (i) effects on interest income attributable to changes in rate
(changes in rate multiplied by prior volume); (ii) effects on interest income
attributable to changes in volume (changes in volume multiplied by prior rate);
and (iii) changes in rate/volume (changes in rate multiplied by changes in
volume).
| Year Ended December 31, | ||||||||||||||||||||||||||||||||
| 2009 Compared to 2008 | 2008 Compared to 2007 | |||||||||||||||||||||||||||||||
| Increase (Decrease) Due to | Increase (Decrease) Due to | |||||||||||||||||||||||||||||||
| Rate/ | Total Net | Rate/ | Total Net | |||||||||||||||||||||||||||||
| Rate | Volume | Volume | Inc/(Dec) | Rate | Volume | Volume | Inc/(Dec) | |||||||||||||||||||||||||
| (Dollars in thousands) | ||||||||||||||||||||||||||||||||
| Interest-earning assets: | ||||||||||||||||||||||||||||||||
| Loans receivable | $ | (5,905 | ) | $ | (36 | ) | $ | 5 | $ | (5,936 | ) | $ | (8,277 | ) | $ | (3,733 | ) | $ | 545 | $ | (11,465 | ) | ||||||||||
| Securities | (157 | ) | (1,197 | ) | 15 | (1,339 | ) | 660 | (638 | ) | (33 | ) | (11 | ) | ||||||||||||||||||
| Other interest-earning assets | (556 | ) | (603 | ) | 203 | (956 | ) | (720 | ) | (675 | ) | 169 | (1,226 | ) | ||||||||||||||||||
| Total net change in income on interest- | ||||||||||||||||||||||||||||||||
| earning assets | (6,618 | ) | (1,836 | ) | 223 | (8,231 | ) | (8,337 | ) | (5,046 | ) | 681 | (12,702 | ) | ||||||||||||||||||
| Interest-bearing liabilities: | ||||||||||||||||||||||||||||||||
| Deposits: | ||||||||||||||||||||||||||||||||
| Checking accounts | (327 | ) | 131 | (70 | ) | (266 | ) | (371 | ) | 45 | (17 | ) | (343 | ) | ||||||||||||||||||
| Money market accounts | (2,460 | ) | (504 | ) | 329 | (2,635 | ) | (2,289 | ) | 179 | (69 | ) | (2,179 | ) | ||||||||||||||||||
| Savings accounts | (175 | ) | (21 | ) | 6 | (190 | ) | (255 | ) | (133 | ) | 36 | (352 | ) | ||||||||||||||||||
| Certificates of deposit | (4,366 | ) | (292 | ) | 97 | (4,561 | ) | (4,347 | ) | (1,182 | ) | 280 | (5,249 | ) | ||||||||||||||||||
| Total deposits | (7,328 | ) | (686 | ) | 362 | (7,652 | ) | (7,262 | ) | (1,091 | ) | 230 | (8,123 | ) | ||||||||||||||||||
| Borrowings: | ||||||||||||||||||||||||||||||||
| Other short-term borrowings | (253 | ) | (185 | ) | 109 | (329 | ) | (480 | ) | 242 | (143 | ) | (381 | ) | ||||||||||||||||||
| FHLB borrowings | (2,775 | ) | (339 | ) | 154 | (2,960 | ) | (2,957 | ) | (2,749 | ) | 732 | (4,974 | ) | ||||||||||||||||||
| Total borrowings | (3,028 | ) | (524 | ) | 263 | (3,289 | ) | (3,437 | ) | (2,507 | ) | 589 | (5,355 | ) | ||||||||||||||||||
| Total net change in expense on interest- | ||||||||||||||||||||||||||||||||
| bearing liabilities | (10,356 | ) | (1,210 | ) | 625 | (10,941 | ) | (10,699 | ) | (3,598 | ) | 819 | (13,478 | ) | ||||||||||||||||||
| Net change in net interest income | $ | 3,738 | $ | (626 | ) | $ | (402 | ) | $ | 2,710 | $ | 2,362 | $ | (1,448 | ) | $ | (138 | ) | $ | 776 | ||||||||||||
RESULTS OF OPERATIONS
Year Ended December 31, 2009 Compared to Year
Ended December 31, 2008
Net Income
We reported a net loss of $543,000, or $(0.05)
per share, for 2009 compared to a net loss of $11.3 million, or $(1.10) per
share, for 2008. Our 2009 results of operations were positively impacted by
increases in net interest income of $2.7 million and non-interest income of $5.8
million and a decrease in the provision for losses on loans of $13.7 million
from the 2008 period. Partially offsetting these favorable variances was an
increase in non-interest expense of $5.1 million from 2008.
Net Interest Income
Net interest income is the principal source of
earnings and consists of interest income received on loans and investment
securities less interest expense paid on deposits and borrowed money. Net
interest income totaled $37.6 million for 2009 compared to $34.9 million for
2008. Net interest margin (net interest income as a percentage of average
interest-earning assets) for 2009 improved 40 basis points to 3.72% from 3.32%
for 2008. The increases in net interest income and net interest margin were
primarily a result of a reduction in the average cost of deposits and borrowings
for 2009 when compared to 2008.
Interest Income
Interest income decreased to $51.3 million for
2009 from $59.5 million for 2008. The weighted-average yield on interest-earning
assets decreased 59 basis points to 5.08% for 2009 from 5.67% for the comparable
2008 period. The decrease was primarily due to lower market rates of interest
coupled with a $10.3 million increase in non-performing assets since December
31, 2008. Interest income was also impacted by a decrease in the average balance
of securities available-for-sale during 2009 as we elected to utilize excess
liquidity to further de-leverage the balance sheet as opposed to reinvesting
proceeds from maturities, paydowns, and sales of securities.
33
Interest Expense
Total interest expense decreased to $13.7
million for 2009 from $24.7 million for the 2008 period. The average cost of
interest-bearing liabilities decreased 112 basis points to 1.53% for 2009 from
2.65% for 2008. Interest expense on deposits was positively affected by
disciplined pricing on deposits, including certificates of deposit. In addition,
the amortization of the premium on the early extinguishment of FHLB debt
decreased by $1.3 million from 2008 and was fully amortized at December 31,
2009.
Interest expense on interest-bearing deposits
decreased to $10.4 million for 2009 from $18.1 million for 2008. The
weighted-average cost of deposits decreased 95 basis points to 1.36% from 2.31%
for 2008. This decrease was primarily as a result of disciplined pricing on
deposits, including certificates of deposit, as market interest rates were lower
in 2009 than 2008.
Interest expense on borrowed money decreased
to $3.3 million for 2009 from $6.6 million for 2008 primarily as a result of
lower rates on the repricing of FHLB debt. The average balances of FHLB debt
also decreased during 2009 as we sought to strengthen our balance sheet and
enhance our liquidity position by replacing this source of funding with core
deposits and de-leveraging our balance sheet. The amortization of the deferred
premium on the early extinguishment of debt (Premium Amortization) that was included in total interest expense on borrowings decreased to
$175,000 for 2009 from $1.5 million for 2008, which resulted in a decrease in
the cost of borrowings to 2.53% for 2009 from 4.44% for 2008. The interest
expense related to the Premium Amortization was $175,000 before taxes and fully
recognized as of December 31, 2009.
Interest expense on borrowings is
detailed in the table below for the periods indicated.
| Year Ended | ||||||||||||
| December 31, | ||||||||||||
| 2009 | 2008 | $ change | % change | |||||||||
| (Dollars in thousands) | ||||||||||||
| Interest expense on short-term borrowings at contractual rates | $ | 101 | $ | 430 | $ | (329 | ) | (76.5 | )% | |||
| Interest expense on FHLB borrowings at contractual rates | 2,992 | 4,675 | (1,683 | ) | (36.0 | ) | ||||||
| Amortization of deferred premium | 175 | 1,452 | (1,277 | ) | (87.9 | ) | ||||||
| Total interest expense on borrowings | $ | 3,268 | $ | 6,557 | $ | (3,289 | ) | (50.2 | ) | |||
Provision for Losses on Loans
The provision for losses on loans decreased to
$12.6 million for 2009 from $26.3 million in 2008. For more information, see
“Changes in Financial Condition – Allowance for Losses on Loans” below in this
“Management’s Discussion and Analysis of Financial Condition and Results of
Operations.”
34
Non-Interest Income
The following table identifies the changes in non-interest income for the
periods presented:
| Year Ended | |||||||||||||||
| December 31, | |||||||||||||||
| 2009 | 2008 | $ change | % change | ||||||||||||
| (Dollars in thousands) | |||||||||||||||
| Service charges and other fees | $ | 5,706 | $ | 6,051 | $ | (345 | ) | (5.7 | )% | ||||||
| Card-based fees | 1,664 | 1,600 | 64 | 4.0 | |||||||||||
| Commission income | 246 | 341 | (95 | ) | (27.9 | ) | |||||||||
| Subtotal fee based revenues | 7,616 | 7,992 | (376 | ) | (4.7 | ) | |||||||||
| Income from bank-owned life insurance | 2,183 | 1,300 | 883 | 67.9 | |||||||||||
| Other income | 590 | 566 | 24 | 4.2 | |||||||||||
| Subtotal | 10,389 | 9,858 | 531 | 5.4 | |||||||||||
| Securities gains, net | 1,092 | 69 | 1,023 | NM | |||||||||||
| Impairment on securities, available-for-sale | — | (4,334 | ) | 4,334 | NM | ||||||||||
| Other asset gains (losses), net | (9 | ) | 30 | (39 | ) | NM | |||||||||
| Total non-interest income | $ | 11,472 | $ | 5,623 | $ | 5,849 | 104.0 | % | |||||||
Non-interest income before securities and
other asset gains (losses) increased 5.4% for 2009 from 2008 primarily due to a
gain on our bank-owned life insurance policy as a result of the death of former
employees who were insured. This increase was partially offset by lower interest
crediting rates resulting from a reduction in general market interest rates.
Service charges and other fees decreased during 2009 from 2008 due to reduced
volume of non-sufficient funds transactions which is an industry trend that is
expected to continue, if not accelerate, due to recently passed legislation.
Commission income from our third-party service provider from the sale of
non-deposit investment products decreased due to decreased sales
activity.
During 2008, we recognized an
other-than-temporary impairment on our investments in Fannie Mae and Freddie Mac
preferred stock totaling $4.3 million. The market for investments in these
government sponsored enterprises deteriorated throughout the second half of 2008
when the Treasury Department and the Federal Housing Finance Authority placed
these enterprises into conservatorship.
35
Non-Interest Expense
During 2009, significant progress has been
made in managing controllable costs, which has been largely offset by increasing
nondiscretionary costs. The following table identifies the changes in
non-interest expense for the periods presented:
| Year Ended | |||||||||||||
| December 31, | |||||||||||||
| 2009 | 2008 | $ change | % change | ||||||||||
| (Dollars in thousands) | |||||||||||||
| Compensation and mandatory benefits | $ | 16,294 | $ | 15,160 | $ | 1,134 | 7.5 | % | |||||
| Retirement and stock related compensation | 968 | 783 | 185 | 23.6 | |||||||||
| Medical and life benefits | 1,582 | 1,450 | 132 | 9.1 | |||||||||
| Other employee benefits | 54 | 105 | (51 | ) | (48.6 | ) | |||||||
| Subtotal compensation and employee benefits | 18,898 | 17,498 | 1,400 | 8.0 | |||||||||
| Net occupancy expense | 3,022 | 3,175 | (153 | ) | (4.8 | ) | |||||||
| FDIC insurance premiums | 2,240 | 159 | 2,081 | NM | |||||||||
| Professional fees | 2,273 | 1,341 | 932 | 69.5 | |||||||||
| Furniture and equipment expense | 2,129 | 2,362 | (233 | ) | (9.9 | ) | |||||||
| Data processing | 1,670 | 1,749 | (79 | ) | (4.5 | ) | |||||||
| Marketing | 832 | 1,002 | (170 | ) | (17.0 | ) | |||||||
| Other real estate owned expenses | 2,978 | 263 | 2,715 | NM | |||||||||
| Loan collection expense | 1,077 | 655 | 422 | 64.4 | |||||||||
| Goodwill impairment | — | 1,185 | (1,185 | ) | NM | ||||||||
| Other general and administrative expenses | 4,163 | 4,789 | (626 | ) | (13.1 | ) | |||||||
| Total non-interest expense | $ | 39,282 | $ | 34,178 | $ | 5,104 | 14.9 | ||||||
Compensation and mandatory benefits expense
increased during 2009 due to a full year of compensation costs associated with
the mid-2008 hiring of Business Banking Relationship Managers and managers in
loan operations and retail branches.
Retirement and stock related compensation was
impacted by changes in costs related to our deferred compensation plans, pension
plan, and ESOP plan. During 2009, we amended our deferred compensation plan
agreements to eliminate the ability of plan participants to diversify out of our
common stock and to require distributions be made in our common stock. As a
result, changes in the price of our common stock on shares held within the plan
are no longer required to be recorded as compensation expense under U.S. GAAP.
Prior to the amendment, changes in the price of our common stock on shares held
within the plan were recorded as an adjustment to retirement and stock related
compensation. As such, retirement and stock related compensation increased
mainly due to the absence of a $1.4 million credit recorded in the 2008 period.
This increase was partially offset by a $779,000 decrease in pension expense
based on information we received from our plan administrator with respect to our
annual funding requirements. Our ESOP expense also decreased $618,000 during
2009 due to the Bank paying the remaining $1.2 million on the ESOP loan during
the first quarter of 2009. As such, the remaining 83,519 shares were allocated
to the ESOP participants in 2009.
Our FDIC insurance premiums increased $2.1
million during 2009 due to the adoption of the FDIC’s Restoration Plan. The
increase in our FDIC insurance premiums included the industry-wide rate
increases effective in 2009, the FDIC’s second quarter of 2009 special
assessment, and the absence of the utilization of certain FDIC insurance premium
credits in 2008. Our FDIC insurance premiums could increase in the near term due
to industry-wide increases in assessment rates.
Professional fees also increased $932,000
during 2009 compared to 2008 as a result of increased fees related to a
shareholder derivative demand made late in the first quarter of 2009, additional
regulatory compliance needs, supervisory examinations, and additional consulting
fees. During 2009, we incurred $771,000 in expenses directly related to the
shareholder derivative demand.
Costs related to other real estate owned
properties also increased $2.7 million during 2009 primarily due to increased
valuation allowances and required expenses on our properties. Of the increase,
$2.5 million was directly related to increases in the valuation reserves of
three out of market commercial real estate properties caused by the decline in
their net realizable value during the year.
36
Loan collection expense increased $422,000
during 2009 primarily due to increased non-performing assets. These types of
expenses include legal fees, appraisals, real estate tax payments, title
searches, and other costs to protect our interests in the loans.
Our efficiency ratio was 80.1% and 84.4%,
respectively, for 2009 and 2008. Our core efficiency ratio was 80.5% and 71.4%,
respectively, for 2009 and 2008. These ratios were negatively affected by
increased non-interest expense as discussed above. For the reconciliation of our
efficiency ratio and core efficiency ratio, see “Item 6. Selected Financial
Data” of this Annual Report on Form 10-K.
Management has historically used an efficiency
ratio that is a non-U.S. GAAP financial measure of operating expense control and
operating efficiency. The efficiency ratio is typically defined as the ratio of
non-interest expense to the sum of non-interest income and net interest income.
Many financial institutions, in calculating the efficiency ratio, adjust
non-interest income and expense (as calculated under U.S. GAAP) to exclude
certain component elements, such as gains or losses on sales of securities and
assets. Management follows this practice to calculate its core efficiency ratio
and utilizes this non-U.S. GAAP measure in its analysis of our performance. The
core efficiency ratio is different from the U.S. GAAP-based efficiency ratio.
The U.S. GAAP-based measure is calculated using non-interest expense, net
interest income, and non-interest income as presented in the condensed
consolidated statements of operations.
The core efficiency ratio is calculated as
non-interest expense less the FDIC special assessment divided by the sum of net
interest income, excluding the Premium Amortization, and non-interest income,
adjusted for gains or losses on the sale of securities and other assets, and
other-than-temporary impairments. Management believes that, when presented along
with the U.S. GAAP efficiency ratio, the core efficiency ratio enhances
investors’ understanding of our business and performance. The measure is also
believed to be useful in understanding our performance trends and to facilitate
comparisons with the performance of others in the financial services industry.
Management further believes the presentation of the core efficiency ratio
provides useful supplemental information, a clearer understanding of our
financial performance, and better reflects our core operating
activities.
The risks associated with utilizing operating
measures (such as the efficiency ratio) are that various persons might disagree
as to the appropriateness of items included or excluded in these measures and
that other companies might calculate these measures differently. Management
compensates for these limitations by providing detailed reconciliations between
U.S. GAAP information and our core efficiency ratio as noted above; however,
these disclosures should not be considered an alternative to U.S. GAAP.
Income Tax Expense
The income tax benefit totaled $2.3 million
for 2009 compared to $8.7 million for 2008. Our effective income tax rate
benefit was 80.6% for 2009 compared to 43.4% for 2008. The increase in our
income tax benefit rate was mainly the result of an increase in the percentage
of permanent tax items to pre-tax loss during 2009. The overall effective tax
rates continue to benefit from our investments in bank-owned life insurance and
the application of available tax credits.
Year Ended December 31, 2008 Compared to Year
Ended December 31, 2007
Net Income
We reported a net loss of $11.3 million, or
$(1.10) per share, for 2008 compared to net income of $7.5 million, or $0.69
diluted earnings per share, for 2007. Our 2008 earnings were impacted by
provisions for losses on loans totaling $26.3 million, other-than-temporary
impairments on our investments in Fannie Mae and Freddie Mac preferred stock
totaling $4.3 million, and a goodwill impairment of $1.2 million. Combined,
these charges reduced net income by $19.9 million and reduced diluted earnings
per share by $1.90.
Net Interest Income
Net interest income totaled $34.9 million for
2008 compared to $34.1 million for 2007. The net interest margin for 2008
improved 30 basis points to 3.32% from 3.02% for 2007. The increases in net
interest income and net interest margin were primarily a result of a reduction in the average cost of deposits and a
decrease in the average balance of borrowings for 2008 when compared to
2007.
37
Interest Income
Interest income was $59.5 million for 2008
compared to $72.2 million for 2007. The weighted-average yield on
interest-earning assets decreased 72 basis points to 5.67% for 2008 from 6.39%
for the comparable 2007 period.
The decrease in interest income was primarily
caused by a decrease in interest rates earned on loans receivable and a $53.1
million decrease in the average balance of loans receivable. Variable rate loans
totaled $449.8 million at December 31, 2008 and were negatively affected by the
decrease in current market rates throughout 2008. In addition, a $25.1 million
increase in non-performing loans negatively affected the interest income and
weighted-average yield recognized on loans receivable during 2008.
Interest Expense
Total interest expense decreased to $24.7
million for 2008 from $38.1 million for the 2007 period. The average cost of
interest-bearing liabilities decreased to 2.65% for 2008 when compared to 3.82%
for 2007 as a result of decreases in the average balance of deposits and
borrowings coupled with the positive affect of lower market interest rates
during 2008.
Interest expense on interest-bearing deposits
decreased to $18.1 million for 2008 from $26.2 million for 2007. The
weighted-average cost of deposits decreased 89 basis points due to disciplined
pricing on these products as market interest rates decreased throughout 2008. In
addition, the average balance on interest-bearing deposits decreased 4.4% from
2007 primarily due to a decrease in the balance of certificate of deposit
accounts. Tightening liquidity in the financial services sector has resulted in
increased interest rates paid by other institutions on certificates of deposit.
These balances are more vulnerable to above market rates paid by institutions
facing liquidity issues while we continue to be disciplined in pricing these
deposits.
Interest expense on borrowed money for 2008
decreased 45.0% to $6.6 million for 2008 from $11.9 million for 2007 primarily
as a result of lower rates on the repricing of FHLB debt. The average balances
of FHLB debt also decreased during 2008 as we were able to utilize our excess
liquidity to repay maturing advances. The Premium Amortization that was included
in total interest expense on borrowings decreased to $1.5 million for 2008 from
$4.5 million for 2007 which resulted in a decrease in cost of borrowings to
4.44% for 2008 from 6.58% for 2007. The Premium Amortization adversely affected
the net interest margin by 14 basis points in 2008 and 40 basis points in 2007.
Interest expense on borrowings is detailed in the table below for the periods
indicated.
| Year Ended | |||||||||||||
| December 31, | |||||||||||||
| 2008 | 2007 | $ change | % change | ||||||||||
| (Dollars in thousands) | |||||||||||||
| Interest expense on short-term borrowings at contractual rates | $ | 430 | $ | 811 | $ | (381 | ) | (47.0 | )% | ||||
| Interest expense on FHLB borrowings at contractual rates | 4,675 | 6,561 | (1,886 | ) | (28.7 | ) | |||||||
| Amortization of deferred premium | 1,452 | 4,540 | (3,088 | ) | (68.0 | ) | |||||||
| Total interest expense on borrowings | $ | 6,557 | $ | 11,912 | $ | (5,355 | ) | (45.0 | ) | ||||
Provision for Losses on Loans
The provision for losses on loans was $26.3
million for 2008 compared to $2.3 million in 2007 reflecting reduced collateral
valuations on impaired loans as well as an increase of $2.8 million in general
reserves in the allowance for losses on loans as determined by our quarterly
analysis of the adequacy of the allowance for losses on loans. For more
information, see “Changes in Financial Condition – Allowance for Losses on
Loans” below in this “Management’s Discussion and Analysis of Financial
Condition and Results of Operations.”
38
Non-Interest Income
The following table identifies the changes in non-interest income for the
periods presented:
| Year Ended | ||||||||||||||
| December 31, | ||||||||||||||
| 2008 | 2007 | $ change | % change | |||||||||||
| (Dollars in thousands) | ||||||||||||||
| Service charges and other fees | $ | 6,051 | $ | 6,795 | $ | (744 | ) | (10.9 | )% | |||||
| Card-based fees | 1,600 | 1,489 | 111 | 7.5 | ||||||||||
| Commission income | 341 | 147 | 194 | 132.0 | ||||||||||
| Subtotal fee based revenues | 7,992 | 8,431 | (439 | ) | (5.2 | ) | ||||||||
| Income from bank-owned life insurance | 1,300 | 1,634 | (334 | ) | (20.4 | ) | ||||||||
| Other income | 566 | 892 | (326 | ) | (36.5 | ) | ||||||||
| Subtotal | 9,858 | 10,957 | (1,099 | ) | (10.0 | ) | ||||||||
| Securities gains, net | 69 | 536 | (467 | ) | (87.1 | ) | ||||||||
| Impairment on securities, available-for-sale | (4,334 | ) | — | (4,334 | ) | NM | ||||||||
| Other asset gains, net | 30 | 22 | 8 | 36.4 | ||||||||||
| Total non-interest income | $ | 5,623 | $ | 11,515 | $ | (5,892 | ) | (51.2 | )% | |||||
Non-interest income before securities gains,
impairments, and other asset gains decreased 10.0% for 2008 from 2007 due to
decreases in the following:
- service charges and other fees from lower volume of non-sufficient funds items and lower fee income from letters of credit and credit enhancements;
- income from bank-owned life insurance due to other-than-temporary impairments on certain investments recognized by the underwriters and decreases in overall market rates on investments underlying the policy; and
- other income from a decrease in the profit earned on the sale of loans and the related loan servicing rights when we began retaining in 2008 the one-to-four family mortgage loans we originate.
We recognized an other-than-temporary
impairment on our investments in Fannie Mae and Freddie Mac preferred stock
totaling $4.3 million. The market for investments in these government sponsored
enterprises deteriorated throughout the second half of 2008 when the Treasury
Department and the Federal Housing Finance Authority placed these enterprises
into conservatorship.
39
Non-Interest Expense
The following table identifies the changes in non-interest expense for
the periods presented:
| Year Ended | |||||||||||||
| December 31, | |||||||||||||
| 2008 | 2007 | $ change | % change | ||||||||||
| (Dollars in thousands) | |||||||||||||
| Compensation and mandatory benefits | $ | 15,160 | $ | 16,236 | $ | (1,076 | ) | (6.6 | )% | ||||
| Retirement and stock related compensation | 783 | 1,054 | (271 | ) | (25.7 | ) | |||||||
| Medical and life benefits | 1,450 | 1,025 | 425 | 41.5 | |||||||||
| Other employee benefits | 105 | 91 | 14 | 15.4 | |||||||||
| Subtotal compensation and employee benefits | 17,498 | 18,406 | (908 | ) | (4.9 | ) | |||||||
| Net occupancy expense | 3,175 | 2,847 | 328 | 11.5 | |||||||||
| FDIC insurance premiums | 159 | 106 | 53 | 50.0 | |||||||||
| Professional fees | 1,341 | 1,540 | (199 | ) | (12.9 | ) | |||||||
| Furniture and equipment expense | 2,362 | 2,241 | 121 | 5.4 | |||||||||
| Data processing | 1,749 | 2,169 | (420 | ) | (19.4 | ) | |||||||
| Marketing | 1,002 | 842 | 160 | 19.0 | |||||||||
| Other real estate owned expense | 263 | 343 | (80 | ) | (23.3 | ) | |||||||
| Loan collection expense | 655 | 164 | 491 | 299.4 | |||||||||
| Goodwill impairment | 1,185 | — | 1,185 | NM | |||||||||
| Other general and administrative expenses | 4,789 | 4,801 | (12 | ) | (0.2 | ) | |||||||
| Total non-interest expense | $ | 34,178 | $ | 33,459 | $ | 719 | 2.1 | % | |||||
Non-interest expense for 2008 increased
when compared to 2007 due to increases in the following:
- medical and life benefits as the number of and the amount paid for medical claims increased;
- net occupancy expense as a result of vacating certain leased space and additional expenses relating to higher utility and snow removal costs; and
- other general and administrative expenses relating to loan collection expense for the workout of problem loans and an increase in recruiting expense related to the above mentioned new employees.
In
addition, the $1.2 million of goodwill we had acquired through our 2003
acquisition of a bank branch in Illinois was determined to be fully impaired
based on management’s goodwill impairment analysis at December 31, 2008. The
analysis was conducted pursuant to Accounting Standards Codification 350,
Intangibles - Goodwill and
Other, as a result of the
disruption in the public capital markets and our market capitalization falling
below its book value.
During 2008, compensation and mandatory
benefits decreased due to the absence of separation expenses from 2007 totaling
$625,000 which were related to the separation of two senior officers and the
consolidation of our retail lending operations during the fourth quarter of 2007
and the reduction in force of other employees during the first quarter of 2007.
We also incurred lower incentive costs as a result of not meeting our 2008
performance goals for key officers and employees.
Retirement and stock related benefits
decreased during 2008 due to a $1.4 million decrease in compensation for the
Rabbi Trust deferred compensation plans. The value of our common stock held in
these plans declined as a result of the change in the stock price of $3.90 at
December 31, 2008 compared to $14.69 at December 31, 2007. This decrease was
partially offset by a $417,000 increase in pension expense during 2008 based on
information received from our plan administrator with respect to our annual
funding requirements. During the fourth quarter of 2008, we also made a
principal prepayment of $2.8 million on our ESOP loan. The additional principal
payment was made to satisfy the 4.1% minimum funding requirement we agreed to
upon the modification of the ESOP loan in March 2007 and to minimize the impact
of this funding requirement in 2009. As a result of the principal payment, ESOP
expense in 2008 increased to $1.1 million from $288,000 in 2007.
The efficiency ratio was 84.4% and 73.3%,
respectively, for 2008 and 2007. The core efficiency ratio was 71.4% and 67.5%,
respectively, for 2008 and 2007. During 2008, the efficiency and core efficiency
ratios were impacted by the decreases in net interest income and non-interest
income and the increase in non-interest expense as discussed above. The core
efficiency ratio was negatively affected
by the increased non-interest expense coupled with lower revenues when compared
to the prior period. For the reconciliation of our efficiency ratio and core
efficiency ratio, see “Item 6. Selected Financial Data” of this Annual Report on
Form 10-K.
40
Income Tax Expense
The income tax benefit was $8.7 million for
2008 compared to income tax expense of $2.3 million for 2007. The effective
income tax rate was (43.4)% and 23.5%, respectively, for 2008 and 2007. The
significant change from income tax expense to an income tax benefit during 2008
was mainly a result of the pre-tax losses recognized during 2008. The overall
effective tax rates continue to benefit from our investment in bank-owned life
insurance and the application of available tax credits.
CHANGES IN FINANCIAL CONDITION FOR
2009
General
During 2009, total assets decreased by $40.3
million to $1.08 billion from $1.12 billion at December 31, 2008. Securities
available-for-sale decreased $62.5 million due to maturities, paydowns, and
sales activity during 2009. With market conditions demanding strong capital
positions through the year, we elected to utilize excess liquidity to further
de-leverage the balance sheet as opposed to reinvesting in our securities
portfolio.
Securities
We manage our securities portfolio to adjust
balance sheet interest rate sensitivity to insulate net interest income against
the impact of changes in market interest rates, to maximize the return on
invested funds within acceptable risk guidelines, and to meet pledging and
liquidity requirements.
We adjust the size and composition of our
securities portfolio according to a number of factors including expected loan
and deposit growth, the interest rate environment, and projected liquidity. The
amortized cost of available-for-sale securities and their fair values were as
follows for the dates indicated:
| December 31, | |||||||||||||||||||||||||||
| 2009 | 2008 | 2007 | |||||||||||||||||||||||||
| Par | Amortized | Fair | Par | Amortized | Fair | Par | Amortized | Fair | |||||||||||||||||||
| Value | Cost | Value | Value | Cost | Value | Value | Cost | Value | |||||||||||||||||||
| (Dollars in thousands) | |||||||||||||||||||||||||||
| Available-for-sale securities: | |||||||||||||||||||||||||||
| Government sponsored entity | |||||||||||||||||||||||||||
| securities (GSE) | $ | 40,450 | $ | 40,374 | $ | 41,457 | $ | 98,400 | $ | 97,987 | $ | 102,345 | $ | 141,300 | $ | 140,301 | $ | 143,146 | |||||||||
| Mortgage-backed securities | 9,527 | 9,426 | 9,835 | 10,881 | 10,774 | 10,856 | 12,545 | 12,587 | 12,563 | ||||||||||||||||||
| Collateralized mortgage | |||||||||||||||||||||||||||
| obligations | 67,307 | 66,413 | 66,768 | 78,276 | 76,506 | 75,543 | 57,635 | 56,672 | 57,180 | ||||||||||||||||||
| Commercial mortgage-backed | |||||||||||||||||||||||||||
| securities | 49,722 | 49,210 | 50,522 | 40,511 | 39,669 | 38,393 | — | — | — | ||||||||||||||||||
| Pooled trust preferred securities | 30,223 | 27,093 | 20,012 | 30,966 | 27,668 | 24,133 | 10,000 | 8,900 | 8,900 | ||||||||||||||||||
| Equity securities | 5,837 | — | 187 | 5,837 | — | — | 3,176 | 3,344 | 2,805 | ||||||||||||||||||
| $ | 203,066 | $ | 192,516 | $ | 188,781 | $ | 264,871 | $ | 252,604 | $ | 251,270 | $ | 224,656 | $ | 221,804 | $ | 224,594 | ||||||||||
Our held-to-maturity securities had an
amortized cost of $5.0 million and $6.9 million, respectively, at December 31,
2009 and 2008 with $179,000 and $161,000, respectively, of gross unrealized
holding gains.
At December 31, 2009, our collateralized
mortgage obligation portfolio totals $66.4 million with 90% of the portfolio
comprised of AAA-rated securities mainly backed by conventional residential
mortgages with 15-year, fixed-rate, prime loans originated prior to 2005; low
historical delinquencies; weighted-average credit scores in excess of 725; and
loan-to-values under 50%. The composition of this portfolio includes $20.4
million backed by Ginnie Mae, Fannie Mae, or Freddie Mac. The portfolio of
non-agency collateralized mortgage obligations has underlying collateral with a
weighted-average 90-day delinquency ratio of 0.8% and a weighted-average
loan-to-value of 39.0% when using valuations from the original appraisal. One
$2.5 million bond was downgraded in 2009
and now has two non-investment grade ratings. This bond was AAA-rated when we
purchased it at a 7.9% discount. One $79,000 bond was downgraded in 2009 and now
has two non-investment grade ratings. This bond was originally issued in 1998,
was AAA-rated when we purchased it, and is currently insured by
MBIA.
41
Our commercial mortgage-backed securities
portfolio consists mainly of short-term, senior tranches of seasoned issues with
extensive subordination and limited balloon risk. All bonds are AAA-rated. We
stress test all bonds in this sector on a monthly basis. Of this portfolio,
94.2% of the bonds can withstand a minimum annual default rate of 50% with
recoveries of 50 cents on the dollar and not experience any losses. One $2.8
million bond projects a 1.3% loss under this stress scenario. Bonds totaling
$2.4 million of the commercial mortgage-backed securities portfolio have
collateral that has been completely replaced with U.S. Treasury
obligations.
Our investments in pooled trust preferred
securities are all “Super Senior” and backed by senior securities issued mainly
by bank and thrift holding companies. All of our holdings were AAA-rated when we
purchased them at large discounts. In 2009, the market for pooled trust
preferred securities was severely impacted by the credit crisis leading to
increased deferral and defaults. Ratings were negatively affected in 2009 and
$20.6 million of these securities in our portfolio have at least one rating
below investment grade. One tranche totaling $7.8 million holds a rating of both
AAA and BB. We utilize extensive external and internal analysis on our pooled
trust preferred holdings. Stress tests are performed on all underlying issuers
in the pools to project probabilities of deferral or default. Both external and
internal analysis suggests default levels must increase by 275% to 775%
immediately before any par value of principal is at risk. Our internal stress
testing utilizes immediate defaults for all deferring collateral. Any collateral
that we believe may be at risk for deferring is defaulted immediately. Internal
stress testing also assumes no recoveries on defaulted collateral. All external
and internal stress testing currently project no losses of principal or interest
on any of our holdings. Due to the structure of the securities, as deferrals and
defaults on the underlying collateral increase, cash flows are increasingly
diverted from mezzanine and subordinate tranches to pay down principal on the
Super Senior tranches. Past defaults on underlying collateral ensure cash flows
will continue to be diverted to our Super Senior tranches to pay down principal
for several years.
We measure fair value according to ASC 820-10,
Fair Value Measurements and
Disclosures, which
establishes a fair value hierarchy that prioritizes the inputs used in valuation
techniques, but not the valuation techniques themselves. The fair value
hierarchy is designed to indicate the relative reliability of the fair value
measure. The highest priority is given to quoted prices in active markets and
the lowest to unobservable data such as our internal information. ASC 820-10
defines fair value as “the price that would be received to sell an asset or paid
to transfer a liability in an orderly transaction between market participants at
the measurement date.” There are three levels of inputs into the fair value
hierarchy (Level 1 being the highest priority and Level 3 being the lowest
priority):
Level 1 – Unadjusted quoted prices for identical instruments in active
markets;
Level 2 – Quoted prices for similar instruments in active markets; quoted
prices for identical or similar instruments in markets that are not active; and
model-derived valuations whose inputs are observable or whose significant value
drivers are observable; and
Level 3 – Instruments whose significant value drivers or assumptions are
unobservable and that are significant to the fair value of the assets or
liabilities.
A financial instrument’s level within the fair
value hierarchy is based on the lowest level of input that is significant to the
fair value measurement.
42
The following table sets forth our financial
assets by level within the fair value hierarchy that were measured at fair value
on a recurring basis during the dates indicated.
| Fair Value Measurements at December 31, 2009 | ||||||||||||
| Quoted Prices in | ||||||||||||
| Active Markets for | Significant Other | Significant | ||||||||||
| Identical Assets | Observable Inputs | Unobservable Inputs | ||||||||||
| Fair Value | (Level 1) | (Level 2) | (Level 3) | |||||||||
| (Dollars in thousands) | ||||||||||||
| Securities available-for-sale: | ||||||||||||
| Government sponsored entity (GSE) securities | $ | 41,457 | $ | — | $ | 41,457 | $ | — | ||||
| Mortgage-backed securities | 9,835 | — | 9,835 | — | ||||||||
| Collateralized mortgage obligations | 66,767 | — | 66,767 | — | ||||||||
| Commercial mortgage-backed securities | 50,522 | — | 50,522 | — | ||||||||
| Pooled trust preferred securities | 20,013 | — | — | 20,013 | ||||||||
| Equity securities | 187 | 187 | — | — | ||||||||
Securities available-for-sale are measured at
fair value on a recurring basis. Level 2 securities are valued by a third-party
pricing service commonly used in the banking industry utilizing observable
inputs. The pricing provider utilizes evaluated pricing models that vary based
on asset class. These models incorporate available market information including
quoted prices of securities with similar characteristics and, because many
fixed-income securities do not trade on a daily basis, apply available
information through processes such as benchmark curves, benchmarking of like
securities, sector groupings, and matrix pricing. In addition, model processes,
such as an option adjusted spread model, are used to develop prepayment and
interest rate scenarios for securities with prepayment features.
Level 3 models are utilized when quoted prices
are not available for certain securities or in markets where trading activity
has slowed or ceased. When quoted prices are not available and are not provided
by third-party pricing services, management judgment is necessary to determine
fair value. As such, fair value is determined using discounted cash flow
analysis models, incorporating default rates, estimation of prepayment
characteristics, and implied volatilities.
We determined that Level 3 pricing models
should be utilized for valuing our investments in pooled trust preferred
securities. The market for these securities at December 31, 2009 was not active
and markets for similar securities were also not active. There are very few
market participants who are willing and/or able to transact for these
securities. Given the limited number of observable transactions in the secondary
market and the absence of a new issue market, management determined an income
valuation approach (present value technique) that maximizes the use of relevant
observable inputs and minimizes the use of unobservable inputs will be equally
or more representative of fair value than the market approach valuation
technique.
For our Level 3 pricing model, we used
externally provided fair value rates that were no longer available in the third
quarter of 2009. As such, we discontinued our use of the internal model and
utilized the external fair values provided by the same third-party. The external
model uses deferral and default probabilities for underlying issuers, estimated
deferral periods, and recovery rates on defaults. In prior periods, the internal
model’s fair values were similar to the external model’s fair values. The
internal model we previously used assumed (i) any defaulted underlying issues
would not have any recovery and (ii) underlying issues that are currently
deferring or in receivership or conservatorship would eventually default and not
have any recovery. In addition, our internal model estimated cash flows to
maturity and assumed no early redemptions of principal due to call options or
successful auctions.
43
The following is a reconciliation of the
beginning and ending balances of recurring fair value measurements recognized in
the accompanying consolidated statement of condition using Level 3 inputs for
the years indicated:
| Available-for-sale Securities | ||||||||
| 2009 | 2008 | |||||||
| (Dollars in thousands) | ||||||||
| Beginning balance January 1 | $ | 24,133 | $ | — | ||||
| Total realized and unrealized gains and losses: | ||||||||
| Included in accumulated other comprehensive income | (3,546 | ) | (578 | ) | ||||
| Purchases, sales, issuances, and settlements, net | (575 | ) | (139 | ) | ||||
| Transfers in and/or out of Level 3 | — | 24,850 | ||||||
| Ending balance December 31 | $ | 20,012 | $ | 24,133 | ||||
On a quarterly basis, we evaluate securities
available-for-sale with significant declines in fair value to determine whether
they should be considered other-than-temporarily impaired. Current accounting
guidance generally provides that if a marketable security is in an unrealized
loss position, whether due to general market conditions or industry or
issuer-specific factors, the holder of the securities must assess whether the
impairment is other-than-temporary. At December 31, 2009, all of our securities
available-for-sale with an unrealized loss position were, in our belief,
primarily due to changes in market interest rates combined with an illiquid
fixed-income market and not due to credit quality or other issuer specific
factors. In addition, we do not have the intent to sell these securities, and it
is more likely than not these securities will not be sold prior to recovery of
amortized cost; however, we may from time to time dispose of an impaired
security in response to asset/liability management decisions, future market
movements, business plan changes, or if the net proceeds could be reinvested at
a rate of return that is expected to recover the loss within a reasonable period
of time. We concluded that the unrealized losses that existed at December 31,
2009, did not constitute other-than-temporary impairments.
The following table sets forth certain
information regarding the maturities and weighted-average yield of securities as
of December 31, 2009. The amounts and yields listed in the table are based on
amortized cost.
| Mortgage- | Collateralized | Commercial | Trust | State | ||||||||||||||||||||||||||||||||||||||
| Backed | Mortgage | Mortgage-Backed | Preferred | and | ||||||||||||||||||||||||||||||||||||||
| GSE Securities | Securities (1) | Obligations (1) | Securities (2) | Securities (3) | Municipal | Total | ||||||||||||||||||||||||||||||||||||
| Amount | Yield | Amount | Yield | Amount | Yield | Amount | Yield | Amount | Yield | Amount | Yield | Amount | Yield | |||||||||||||||||||||||||||||
| (Dollars in thousands) | ||||||||||||||||||||||||||||||||||||||||||
| Maturities: | ||||||||||||||||||||||||||||||||||||||||||
| Less than 1 year | $ | 33,582 | 5.05 | % | $ | — | — | % | $ | 10,693 | 6.02 | % | $ | 21,466 | 6.63 | % | $ | — | — | % | $ | 2,000 | 3.18 | % | $ | 67,741 | 5.65 | % | ||||||||||||||
| 1 to less than 5 years | 6,792 | 5.18 | 9,426 | 4.23 | 53,190 | 5.13 | 27,744 | 6.24 | — | — | 3,000 | 3.44 | 100,152 | 5.30 | ||||||||||||||||||||||||||||
| 5 to less than 10 years | — | — | — | — | 2,530 | 8.21 | — | — | — | — | — | — | 2,530 | 8.21 | ||||||||||||||||||||||||||||
| 10 years and over | — | — | — | — | — | — | — | — | 27,093 | 1.54 | — | — | 27,093 | 1.54 | ||||||||||||||||||||||||||||
| Total securities | $ | 40,374 | 5.07 | % | $ | 9,426 | 4.23 | % | $ | 66,413 | 5.39 | % | $ | 49,210 | 6.41 | % | $ | 27,093 | 1.54 | % | $ | 5,000 | 3.34 | % | $ | 197,516 | 4.94 | % | ||||||||||||||
| Average months to maturity | 7.4 | 33.6 | 29.6 | 16.6 | 245.9 | 18.6 | 51.4 | |||||||||||||||||||||||||||||||||||
| (1) | Our mortgage-backed securities and collateralized mortgage obligations are amortizing in nature. As such, the maturities presented in the table for these securities are based on historical and estimated prepayment rates for the underlying mortgage collateral and were calculated using prepayment speeds based on the trailing three-month CPR (Constant Prepayment Rate). The estimated average lives may differ from actual principal cash flows since cash flows include prepayments and scheduled principal amortization. | |
| (2) | Our commercial mortgage-backed securities are amortizing in nature. As such, the maturities presented in the table for these securities are based on contractual payment assumptions for the underlying collateral and were calculated using a prepayment speed of 0 CPY (Constant Prepayment Yield). | |
| (3) | Our pooled trust preferred securities have floating rates. The projected yields are calculated to the contractual maturity and are based on the coupon rates at December 31, 2009 and fourth quarter of 2009 prepayment rates. | |
44
LOANS
The following table sets forth the composition
of loans receivable and the percentage of loans by category as of the dates
indicated.
| 2009 | 2008 | 2007 | 2006 | 2005 | ||||||||||||||||||||||||||
| Percent | Percent | Percent | Percent | Percent | ||||||||||||||||||||||||||
| Amount | of Total | Amount | of Total | Amount | of Total | Amount | of Total | Percent | of Total | |||||||||||||||||||||
| (Dollars in thousands) | ||||||||||||||||||||||||||||||
| Commercial loans: | ||||||||||||||||||||||||||||||
| Commercial and industrial | $ | 78,600 | 10.3 | % | $ | 64,021 | 8.5 | % | $ | 60,398 | 7.6 | % | $ | 35,743 | 4.5 | % | $ | 61,956 | 6.8 | % | ||||||||||
| Commercial real estate – owner occupied | 99,559 | 13.1 | 85,565 | 11.4 | 82,382 | 10.4 | — | — | — | — | ||||||||||||||||||||
| Commercial real estate – non-owner occupied | 218,329 | 28.6 | 222,048 | 29.6 | 207,270 | 26.1 | 339,110 | 42.2 | 381,956 | 41.6 | ||||||||||||||||||||
| Commercial real estate – multifamily | 63,008 | 8.3 | 40,503 | 5.4 | 38,775 | 4.9 | — | — | — | — | ||||||||||||||||||||
| Commercial construction and land development | 55,733 | 7.3 | 70,848 | 9.5 | 117,453 | 14.8 | 128,529 | 16.0 | 136,558 | 14.9 | ||||||||||||||||||||
| Total commercial loans | 515,229 | 67.6 | 482,985 | 64.4 | 506,278 | 63.8 | 503,382 | 62.7 | 580,470 | 63.3 | ||||||||||||||||||||
| Retail loans: | ||||||||||||||||||||||||||||||
| One-to-four family residential | 185,293 | 24.3 | 203,797 | 27.2 | 212,598 | 26.8 | 225,007 | 28.1 | 235,359 | 25.7 | ||||||||||||||||||||
| Home equity lines of credit | 56,911 | 7.5 | 58,918 | 7.8 | 60,326 | 7.6 | 70,527 | 8.8 | 96,403 | 10.5 | ||||||||||||||||||||
| Retail construction and land development | 3,401 | 0.4 | 2,650 | 0.4 | 11,131 | 1.4 | — | — | — | — | ||||||||||||||||||||
| Other | 1,552 | 0.2 | 1,623 | 0.2 | 2,803 | 0.4 | 3,467 | 0.4 | 5,173 | 0.5 | ||||||||||||||||||||
| Total retail loans | 247,157 | 32.4 | 266,988 | 35.6 | 286,858 | 36.2 | 299,001 | 37.3 | 336,935 | 36.7 | ||||||||||||||||||||
| Total loans receivable, net of unearned fees | $ | 762,386 | 100.0 | % | $ | 749,973 | 100.0 | % | $ | 793,136 | 100.0 | % | $ | 802,383 | 100.0 | % | $ | 917,405 | 100.0 | % | ||||||||||
Loans receivable totaled $762.4 million at
December 31, 2009 compared to $750.0 million at December 31, 2008. Through the
execution of our Strategic Growth and Development Plan and our focus on lending
to small- to medium-sized businesses, we have made significant progress in
diversifying our loan portfolio and reducing loans not meeting our current
defined risk tolerance. In 2009, we increased commercial and industrial, owner
occupied commercial real estate, and multifamily loans by $52.0 million. This
growth was partially offset by decreases in commercial construction and land
development and non-owner occupied commercial real estate loans.
During the fourth quarter of 2008, we revised
our classification of commercial real estate loans to provide a better
understanding of the types of commercial real estate loans within our loan
portfolio. The method of presentation identifies commercial real estate loans
that are owner occupied, non-owner occupied, and multifamily loans. Loans to
owner occupied businesses are generally engaged in manufacturing, sales, and/or
services. We believe that these loans have a lower risk profile than non-owner
occupied commercial real estate loans since they are primarily dependent on the
borrower’s business-generated cash flows for repayment, not on the conversion of
real estate that may be pledged as collateral. Loans related to rental
income-producing properties, properties intended to be sold, and properties
collateralizing hospitality loans will continue to be classified as commercial
real estate – non-owner occupied loans. Loans related to residential rental
properties such as apartment complexes are now classified as commercial real
estate loans – multifamily. Completing these changes in presentation involved a
loan-by-loan review of our commercial real estate loans. The presentation
methodology was implemented as of December 31, 2007 and prospectively, as it was
impractical to apply it to data from 2006 and 2005. The classification of
construction and land development and one-to-four family residential loans was
also reviewed resulting in a reclassification of all one-to-four family
construction and lot loans as retail construction loans within the retail loan
category since these loans are typically loans on single lots for the
construction of the borrower’s primary residence. These loans were previously
identified in commercial construction and land development.
Historically we have invested, on a
participating basis, in loans originated by other lenders and loan syndications
to supplement the direct origination of our commercial and construction loan
portfolio. We stopped investing in these types of credits in the second quarter
of 2007 due to marginal pricing, increased credit risk, and decreasing
collateral values in this segment. We continue to reduce our exposure on these
types of loans. Participations and syndication loans outstanding at December 31,
2009 totaled $24.6 million in construction and land development loans, $27.5
million in loans secured by commercial real estate, and $273,000 in commercial
and industrial loans. Total participations and syndications by state are
presented in the following table for the dates indicated.
45
| December 31, 2009 | December 31, 2008 | ||||||||||||||
| Amount | % of Total | Amount | % of Total | % Change | |||||||||||
| (Dollars in thousands) | |||||||||||||||
| Illinois | $ | 21,964 | 41.9 | % | $ | 25,012 | 41.3 | % | (12.2 | )% | |||||
| Indiana | 13,149 | 25.1 | 13,215 | 21.8 | (0.5 | ) | |||||||||
| Ohio | 9,284 | 17.7 | 9,734 | 16.1 | (4.6 | ) | |||||||||
| Florida | 3,303 | 6.4 | 6,590 | 10.9 | (49.9 | ) | |||||||||
| Colorado | 2,514 | 4.8 | 3,103 | 5.1 | (19.0 | ) | |||||||||
| Texas | 1,660 | 3.2 | 1,732 | 2.9 | (4.2 | ) | |||||||||
| New York | 491 | 0.9 | 1,150 | 1.9 | (57.3 | ) | |||||||||
| Total participations and syndications | $ | 52,365 | 100.0 | % | $ | 60,536 | 100.0 | % | (13.5 | )% | |||||
Loan Concentrations
Loan concentrations are considered to exist
when there are amounts loaned to a multiple number of borrowers engaged in
similar activities which would cause them to be similarly impacted by economic
or other conditions. At December 31, 2009, we had a concentration of loans
secured by office and/or warehouse buildings totaling $218.2 million or 28.6% of
our total loan portfolio. Loans secured by these types of collateral involve
higher principal amounts. The repayment of these loans generally is dependent,
in large part, on the successful operation of the property securing the loan or
the business conducted on the property securing the loan. These loans may be
more adversely affected by general conditions in the real estate market or in
the economy. At December 31, 2009, we had no other concentrations of loans to
any industry exceeding 10% of our total loan portfolio.
Contractual Principal Repayments and Interest
Rates
The following table sets forth scheduled
contractual amortization of our commercial loans at December 31, 2009, as well
as the dollar amount of loans scheduled to mature after one year. Demand loans
and loans having no scheduled repayments and no stated maturity are reported as
due in one year or less.
| Total at | Principal Repayments Contractually Due | |||||||||||
| December 31, | in Year(s) Ended December 31, | |||||||||||
| 2009 (1) | 2010 | 2011-2013 (2) | Thereafter (2) | |||||||||
| (Dollars in thousands) | ||||||||||||
| Commercial loans: | ||||||||||||
| Commercial and industrial | $ | 78,393 | $ | 30,724 | $ | 27,031 | $ | 20,638 | ||||
| Commercial real estate – owner occupied | 99,552 | 8,907 | 31,435 | 59,210 | ||||||||
| Commercial real estate – non-owner occupied | 218,471 | 53,020 | 96,054 | 69,397 | ||||||||
| Commercial real estate – multifamily | 62,995 | 13,089 | 22,688 | 27,218 | ||||||||
| Commercial construction and land development | 55,728 | 48,706 | 5,288 | 1,734 | ||||||||
| Total commercial loans | $ | 515,139 | $ | 154,446 | $ | 182,496 | $ | 178,197 | ||||
| (1) | Gross loans receivable does not include deferred fees and costs of $90,000 as of December 31, 2009. | |
| (2) | Of the $360.7 million of loan principal repayments contractually due after December 31, 2010, $165.1 million have fixed interest rates and $195.6 million have variable interest rates which reprice from one month up to five years. | |
Scheduled contractual loan amortization does
not reflect the expected term of the loan portfolio. The average life of loans
is substantially less than their contractual terms because of prepayments. The
average life of mortgage loans tends to increase when current market rates of
interest for mortgage loans are higher than rates on existing mortgage loans
and, conversely, decrease when rates on existing mortgage loans are higher than
current market rates as borrowers refinance adjustable-rate and fixed-rate loans
at lower rates. Under the latter circumstance, the yield on loans decreases as
higher yielding loans are repaid or refinanced at lower rates.
46
ALLOWANCE FOR LOSSES ON
LOANS
We maintain our allowance for losses on loans
at a level that we believe is sufficient to absorb credit losses inherent in the
loan portfolio. Our allowance for losses on loans represents our estimate of
probable incurred losses existing in our loan portfolio that are both probable
and reasonable to estimate at each statement of condition date and is based on
our review of available and relevant information. Our quarterly evaluation of
the adequacy of the allowance is based in part on historical charge-offs and
recoveries; levels of and trends in delinquencies; impaired loans and other
classified loans; concentrations of credit within the commercial loan portfolio;
volume and type of lending; and current and anticipated economic conditions. In
addition, we consider expected losses resulting in specific credit allocations
for individual loans not considered above. Our analysis of each loan involves a
high degree of judgment in estimating the amount of the loss associated with the
loan, including the estimation of the amount and timing of future cash flows and
collateral values.
Loan losses are charged off against the
allowance for losses on loans when we believe that the loan balance or a portion
of the loan balance is no longer covered by the paying capacity of the borrower
based on an evaluation of available cash resources and collateral value.
Recoveries of amounts previously charged off are credited to the allowance. We
assess the adequacy of the allowance on a quarterly basis with adjustments made
by recording a provision for losses on loans in an amount sufficient to maintain
the allowance at a level we deem appropriate. While we believe the allowance was
adequate at December 31, 2009, it is possible that further deterioration in the
economy, devaluations of collateral held, or requirements from regulatory
agencies may require us to make future provisions to the allowance. See further
analysis in the “Critical Accounting Policies” previously discussed in this
“Management’s Discussion and Analysis of Financial Condition and Results of
Operations” as well as “Note 1. Summary of Significant Accounting Policies” in
the notes to consolidated financial statements included in “Item 8. Financial
Statements and Supplementary Data” of this Annual Report on Form 10-K.
47
The following table sets forth the activity in allowance for losses on
loans during the periods indicated:
| Year Ended December 31, | |||||||||||||||||||||
| 2009 | 2008 (1) | 2007 (1) | 2006 | 2005 | |||||||||||||||||
| (Dollars in thousands) | |||||||||||||||||||||
| Allowance at beginning of period | $ | 15,558 | $ | 8,026 | $ | 11,184 | $ | 12,939 | $ | 13,353 | |||||||||||
| Provision | 12,588 | 26,296 | 2,328 | 1,309 | 1,580 | ||||||||||||||||
| Charge-offs: | |||||||||||||||||||||
| Commercial loans: | |||||||||||||||||||||
| Commercial and industrial | (1,313 | ) | (74 | ) | (231 | ) | (241 | ) | (505 | ) | |||||||||||
|
Commercial real estate –
owner occupied
|
(53 | ) | (1,699 | ) | — | — | — | ||||||||||||||
|
Commercial real estate –
non-owner occupied
|
(1,699 | ) | (3,054 | ) | (4,260 | ) | (2,987 | ) | (877 | ) | |||||||||||
|
Commercial real estate –
multifamily
|
(61 | ) | — | — | — | — | |||||||||||||||
|
Commercial construction and
land development
|
(3,309 | ) | (13,255 | ) | (776 | ) | — | — | |||||||||||||
|
Total commercial
loans
|
(6,435 | ) | (18,082 | ) | (5,267 | ) | (3,228 | ) | (1,382 | ) | |||||||||||
| Retail loans: | |||||||||||||||||||||
|
One-to-four family
residential
|
(271 | ) | (376 | ) | (1 | ) | (109 | ) | (320 | ) | |||||||||||
|
Home equity lines of
credit
|
(2,156 | ) | (243 | ) | (208 | ) | (80 | ) | (201 | ) | |||||||||||
|
Retail construction and
land development
|
— | — | — | — | — | ||||||||||||||||
|
Other
|
(108 | ) | (197 | ) | (200 | ) | (211 | ) | (270 | ) | |||||||||||
|
Total retail
loans
|
(2,535 | ) | (816 | ) | (409 | ) | (400 | ) | (791 | ) | |||||||||||
| Total charge-offs | (8,970 | ) | (18,898 | ) | (5,676 | ) | (3,628 | ) | (2,173 | ) | |||||||||||
| Recoveries: | |||||||||||||||||||||
| Commercial loans: | |||||||||||||||||||||
|
Commercial and
industrial
|
121 | 10 | 9 | 110 | 2 | ||||||||||||||||
|
Commercial real estate –
owner occupied
|
80 | — | — | — | — | ||||||||||||||||
|
Commercial real estate –
non-owner occupied
|
40 | 14 | 102 | 318 | 21 | ||||||||||||||||
|
Commercial real estate –
multifamily
|
— | — | — | — | — | ||||||||||||||||
|
Commercial construction and
land development
|
13 | 61 | 18 | 43 | 73 | ||||||||||||||||
|
Total commercial
loans
|
254 | 85 | 129 | 471 | 96 | ||||||||||||||||
| Retail loans: | |||||||||||||||||||||
|
One-to-four family
residential
|
2 | 1 | — | 18 | 1 | ||||||||||||||||
|
Home equity lines of
credit
|
6 | 5 | 14 | 12 | 29 | ||||||||||||||||
|
Retail construction and
land development
|
— | — | — | — | — | ||||||||||||||||
|
Other
|
23 | 43 | 47 | 63 | 53 | ||||||||||||||||
|
Total retail
loans
|
31 | 49 | 61 | 93 | 83 | ||||||||||||||||
| Total recoveries | 285 | 134 | 190 | 564 | 179 | ||||||||||||||||
|
Net loans charged-off to
allowance for losses on loans
|
(8,685 | ) | (18,764 | ) | (5,486 | ) | (3,064 | ) | (1,994 | ) | |||||||||||
| Allowance at end of period | $ | 19,461 | $ | 15,558 | $ | 8,026 | $ | 11,184 | $ | 12,939 | |||||||||||
| Allowance for losses on loans to total non-performing loans at end of period | 32.98 | % | 28.44 | % | 27.11 | % | 40.64 | % | 61.49 | % | |||||||||||
| Allowance for losses on loans to total loans at end of period | 2.55 | 2.07 | 1.01 | 1.39 | 1.41 | ||||||||||||||||
| Ratio of net loans charged-off to average loans outstanding for the period | 1.15 | 2.49 | 0.68 | 0.36 | 0.21 | ||||||||||||||||
| (1) | At December 31, 2007, the Bank segmented its commercial real estate portfolio into owner occupied, non-owner occupied, and multifamily loans. The methodology was implemented only as of December 31, 2007 and prospectively, as it was impractical to apply it to data from 2006 and 2005. See further discussion in “Loans” within “Item 7. Management’s Discussion and Analysis of Financial Condition and Results of Operations” of this Annual Report on Form 10-K. |
Our allowance for losses on loans was $19.5
million at December 31, 2009 compared to $15.6 million at December 31, 2008. The
ratio of the allowance to total loans increased to 2.55% at December 31, 2009
compared to 2.07% at December 31, 2008. The provision for losses on loans
decreased to $12.6 million in 2009 from $26.3 million in 2008. Net charge-offs
for 2009 totaled $8.7 million, or 1.2% of average loans outstanding, compared to
$18.8 million, or 2.5% of average loans outstanding, for 2008.
Our provision for losses on loans and our net
charge-offs decreased during 2009 when compared to 2008. In 2008, we experienced
a higher level of charge-offs related to collateral valuations on
collateral-dependent non-performing loans. In addition, we increased our general
reserves in 2008 as a result of deteriorating market conditions, overall
declines in collateral values, and a lack of activity in residential housing and
land development.
During 2009, we charged-off $1.3 million of
commercial and industrial loans to six client relationships with loans that were
primarily collateralized by business assets and equipment.
48
Non-owner occupied commercial real estate
charge-offs totaled $1.7 million, of which $1.3 million were primarily related
multiple loans collateralized by single family and multifamily investment
properties to one client relationship that was considered impaired throughout
2009. These properties were transferred to other real estate owned through
in-substance foreclosure at their net realizable value during the fourth quarter
of 2009. The remaining charge-offs in this category were related to loans to
three separate client relationships.
Charge-offs for commercial construction and
land development totaled $3.3 million and represented partial charge-offs on
nine impaired commercial construction and land development client relationships.
At December 31, 2008, prior to the partial charge-offs, these relationships
totaled $17.9 million in the aggregate. During 2009, we transferred three of
these loans totaling $5.5 million to other real estate owned at their net
realizable value.
Charge-offs for home equity lines of credit
increased during 2009 to $2.2 million primarily as a result of the current
economic conditions combined with decreasing collateral values.
When we evaluate a non-performing
collateral-dependent loan and identify a collateral shortfall, we will
charge-off the collateral shortfall. As a result, we are not required to
maintain an allowance for losses on loans on these loans as the loan balance has
already been written down to its net realizable value (fair value less estimated
costs to sell the collateral). As such, the ratio of the allowance for losses on
loans to total loans, the reserve ratio, and the ratio of the allowance for
losses on loans to non-performing loans (the coverage ratio) have been affected
by partial charge-offs of $9.4 million on $21.3 million of collateral-dependent
non-performing loans through December 31, 2009 and impairment reserves totaling
$9.2 million on other non-performing loans at December 31, 2009.
Allocation of the Allowance for Losses on
Loans
We allocate our allowance for losses on loans
by loan category. Various percentages are assigned to the loan categories based
on their historical loss factors. These historical loss factors are adjusted for
various qualitative factors including trends in delinquencies and impaired
loans; charge-offs and recoveries; volume and terms of loans; underwriting
practices; lending management and staff; economic trends and conditions;
industry conditions; and credit concentrations. The allocation of the allowance
for losses on loans is reviewed and approved by our Asset Management Committee.
The following table shows the allocation of the allowance for losses on loans by
loan type for each of the last five years:
| December 31, | ||||||||||||||||||||||||||||||
| 2009 | 2008 | 2007 | 2006 | 2005 | ||||||||||||||||||||||||||
| Allowance | Allowance | Allowance | Allowance | Allowance | ||||||||||||||||||||||||||
| Allowance | as a % of | Allowance | as a % of | Allowance | as a % of | Allowance | as a % of | Allowance | as a % of | |||||||||||||||||||||
| Allocation | Category | Allocation | Category | Allocation | Category | Allocation | Category | Allocation | Category | |||||||||||||||||||||
| (Dollars in thousands) | ||||||||||||||||||||||||||||||
| Residential real estate: | ||||||||||||||||||||||||||||||
| One-to-four family | ||||||||||||||||||||||||||||||
| owner occupied | $ | 2,087 | 0.88 | % | $ | 1,744 | 0.68 | % | $ | 1,266 | 0.46 | % | $ | 1,395 | 0.47 | % | $ | 1,064 | 0.33 | % | ||||||||||
| One-to-four family | ||||||||||||||||||||||||||||||
| non-owner occupied | 248 | 0.85 | 186 | 0.59 | 127 | 0.46 | 129 | 0.47 | 88 | 0.33 | ||||||||||||||||||||
| Multifamily | 703 | 1.08 | 611 | 1.52 | 430 | 1.15 | 437 | 1.09 | 362 | 0.67 | ||||||||||||||||||||
| Business/Commercial | ||||||||||||||||||||||||||||||
| real estate | 14,208 | 4.56 | 10,894 | 3.75 | 3,944 | 1.33 | 7,437 | 2.53 | 9,711 | 2.45 | ||||||||||||||||||||
| Business/Commercial | ||||||||||||||||||||||||||||||
| non-real estate | 787 | 1.00 | 1,241 | 1.97 | 659 | 1.15 | 653 | 1.34 | 1,137 | 2.28 | ||||||||||||||||||||
| Developed Lots | 745 | 3.34 | 352 | 0.98 | 319 | 0.62 | 224 | 0.39 | 105 | 0.36 | ||||||||||||||||||||
| Land | 639 | 2.50 | 252 | 0.58 | 1,069 | 2.12 | 695 | 1.34 | 149 | 0.36 | ||||||||||||||||||||
| Consumer non-real estate | 44 | 5.62 | 278 | 4.60 | 212 | 4.35 | 214 | 3.90 | 323 | 3.89 | ||||||||||||||||||||
| Total allowance for losses | ||||||||||||||||||||||||||||||
| on loans | $ | 19,461 | $ | 15,558 | $ | 8,026 | $ | 11,184 | $ | 12,939 | ||||||||||||||||||||
ASSET QUALITY
General
All of our assets are subject to review under
our classification system. See discussion on “Potential Problem Assets” below.
Impaired loans are reviewed quarterly by our Asset Management Committee. The
Board of Directors reviews our classified assets (including impaired loans) on a quarterly basis. When a borrower
fails to make a required loan payment, we attempt to cure the deficiency by
contacting the borrower and seeking payment. Contacts are generally made prior
to 30 days after a payment is due. Late charges are generally assessed after 15
days with additional efforts being made to collect the past due payments. While
we generally prefer to work with borrowers to resolve delinquency problems, when
the account becomes 90 days delinquent, we may institute foreclosure or other
proceedings, as deemed necessary, to minimize any potential loss.
49
Loans are placed on non-accrual status when,
in the judgment of management, the probability of collection of interest is
deemed to be insufficient to warrant further accrual. All interest accrued but
not received for loans placed on non-accrual is reversed against interest
income. Interest subsequently received on non-accrual loans is accounted for by
using the cost-recovery basis for commercial loans and the cash-basis for retail
loans until qualifying for return to accrual. We generally do not accrue
interest on loans past due 90 days or more.
Real estate acquired through a foreclosure
proceeding or acceptance of a deed-in-lieu of foreclosure and loans identified
as in-substance foreclosures are classified as other real estate owned until
sold. A loan is classified as an in-substance foreclosure when we take
possession of the collateral regardless of whether formal foreclosure
proceedings have taken place. Other real estate owned is initially recorded at
net realizable values, with any resulting write-down charged to the allowance
for losses on loans. Valuations are periodically (but no less than annually)
performed by management, with any subsequent declines in estimated fair value
charged to expense. After acquisition, all costs incurred in maintaining the
property are expensed, and costs incurred for the improvement or development of
the property are capitalized up to the extent of its net realizable value.
Non-Performing Assets
The following table provides
information relating to our non-performing assets at the dates
presented.
| December 31, | ||||||||||||||||||||
| 2009 | 2008 (1) | 2007 (1) | 2006 | 2005 | ||||||||||||||||
| (Dollars in thousands) | ||||||||||||||||||||
| Non-accrual loans: | ||||||||||||||||||||
| Commercial loans: | ||||||||||||||||||||
|
Commercial and
industrial
|
$ | 1,399 | $ | 2,551 | $ | 281 | $ | 455 | $ | 94 | ||||||||||
|
Commercial real estate –
owner occupied
|
3,627 | 4,141 | 5,871 | — | — | |||||||||||||||
|
Commercial real estate –
non-owner occupied
|
22,103 | 22,337 | 3,506 | 15,863 | 17,492 | |||||||||||||||
|
Commercial real estate –
multifamily
|
623 | 342 | 229 | — | — | |||||||||||||||
|
Commercial construction and
land development
|
26,059 | 20,428 | 15,960 | 7,192 | 77 | |||||||||||||||
|
Total commercial
loans
|
53,811 | 49,799 | 25,847 | 23,510 | 17,663 | |||||||||||||||
| Retail loans: | ||||||||||||||||||||
|
One-to-four family
residential
|
4,519 | 3,048 | 2,706 | 3,177 | 2,929 | |||||||||||||||
|
Home equity lines of
credit
|
393 | 1,570 | 749 | 772 | 429 | |||||||||||||||
|
Retail construction and
land
|
279 | 279 | 279 | — | — | |||||||||||||||
|
Other
|
7 | 5 | 19 | 58 | 20 | |||||||||||||||
|
Total retail
loans
|
5,198 | 4,902 | 3,753 | 4,007 | 3,378 | |||||||||||||||
|
Total non-accrual
loans
|
59,009 | 54,701 | 29,600 | 27,517 | 21,041 | |||||||||||||||
| Other real estate owned, net | 9,242 | 3,242 | 1,162 | 321 | 540 | |||||||||||||||
| Total non-performing assets | $ | 68,251 | $ | 57,943 | $ | 30,762 | $ | 27,838 | $ | 21,581 | ||||||||||
| 90 days past due loans still accruing interest | 640 | 605 | — | — | — | |||||||||||||||
| Total non-performing assets plus 90 days past due | ||||||||||||||||||||
|
loans still accruing
interest
|
$ | 68,891 | $ | 58,548 | $ | 30,762 | $ | 27,838 | $ | 21,581 | ||||||||||
| Non-performing assets to total assets | 6.31 | % | 5.16 | % | 2.67 | % | 2.22 | % | 1.74 | % | ||||||||||
| Non-performing loans to total loans | 7.74 | 7.29 | 3.73 | 3.43 | 2.29 | |||||||||||||||
| (1) | At December 31, 2007, we segmented our commercial real estate portfolio into owner occupied, non-owner occupied, and multifamily loans. The methodology was implemented only as of December 31, 2007 and prospectively, as it was impractical to apply it to data from 2006 and 2005. See further discussion in “Loans” within “Item 7. Management’s Discussion and Analysis of Financial Condition and Results of Operations” of this Annual Report on Form 10-K. |
50
Due to the current economic conditions and the
lack of activity in the real estate and construction and land development
sectors, non-accrual loans increased $4.3 million to $59.0 million at December
31, 2009 from $54.7 million at December 31, 2008. Increases in non-performing
assets include the transfer to non-accrual status of:
- non-owner occupied commercial real estate loan relationships totaling $4.8 million;
- commercial construction and land development loan relationships totaling $14.7 million;
- one-to-four family loans totaling $4.9 million; and
- home equity lines of credit totaling $2.0 million.
The above increases
to non-performing assets were partially offset by the following:
- the sale of an owner occupied commercial real estate loan totaling $887,000;
- partial charge-offs totaling $1.6 million on non-owner occupied commercial real estate relationships;
- partial charge-offs totaling $3.3 million on commercial construction and land development relationships;
- the transfer to accruing status of $2.2 million of one-to-four family residential loans that were brought current;
- charge-offs totaling $1.3 million on commercial and industrial loans; and
- charge-offs totaling $2.2 million on home equity lines of credit.
During 2009, we transferred commercial
construction and land development loans totaling $5.5 million and non-owner
occupied commercial real estate loans totaling $2.8 million to other real estate
owned at their net realizable value. We also transferred $621,000 of one-to-four
family residential loans. During 2009, we sold other real estate owned
properties totaling $783,000. During 2009, we also recorded valuation allowances
totaling $2.6 million which were directly related to the increase in the
valuation reserves on our other real estate owned properties caused by the
declines in net realizable values.
The following table identifies our
other real estate owned properties based on the loan portfolio they relate to:
| December 31, | December 31, | ||||||||
| 2009 | 2008 | % change | |||||||
| (Dollars in thousands) | |||||||||
| Commercial real estate – non-owner occupied | $ | 2,819 | $ | — | NM | ||||
| Commercial construction and land development | 5,940 | 3,014 | 97.1 | % | |||||
| One-to-four family residential | 483 | 156 | 209.6 | ||||||
| Home equity lines of credit | — | 72 | (100.0 | ) | |||||
| Total other real estate owned | $ | 9,242 | $ | 3,242 | 185.1 | % | |||
Included in the above non-performing loan
totals are non-performing syndications and purchased participations as
identified by loan category in the following table.
| December 31, | December 31, | ||||||||||
| 2009 | 2008 | % change | |||||||||
| (Dollars in thousands) | |||||||||||
| Commercial real estate – non-owner occupied | $ | 10,158 | $ | 10,354 | (1.9 | )% | |||||
| Commercial construction and land development | 16,571 | 10,973 | 51.0 | ||||||||
| Total non-performing syndications and purchased participations | $ | 26,729 | $ | 21,327 | 25.3 | % | |||||
| Percentage of total non-performing loans | 45.3 | % | 39.0 | % | |||||||
| Percentage of total syndications and purchased participations | 51.0 | 35.2 | |||||||||
51
The following table provides the detail for
our non-accrual syndications and purchased participations by state as of the
dates indicated.
| December 31, | December 31, | ||||||||
| 2009 | 2008 | % change | |||||||
| (Dollars in thousands) | |||||||||
| Illinois | $ | 10,659 | $ | 12,261 | (13.1 | )% | |||
| Indiana | 12,767 | 5,423 | 135.4 | ||||||
| Florida | 3,303 | 3,643 | (9.3 | ) | |||||
| Total non-performing syndications and purchased | |||||||||
| participations | $ | 26,729 | $ | 21,327 | 25.3 | % | |||
We continue to explore ways to reduce our
overall exposure in these non-performing loans through various alternatives,
including the potential sale of certain of these non-performing assets. Any
future impact to the allowance for losses on loans in the event of such sales or
other similar actions cannot be reasonably determined at this time.
The interest income that would have been
recorded during 2009, if all of our non-performing loans at the end of the year
had been current in accordance with their terms during the year, was $3.1
million. The actual amount of interest recorded as income (on a cash basis) on
these loans during the year totaled $79,000.
The disclosure with respect to impaired loans
is contained in “Note 3. Loans Receivable” in the notes to consolidated
financial statements included in “Item 8. Financial Statements and Supplementary
Data” of this Annual Report on Form 10-K.
Potential Problem Assets
Federal regulations require that each insured
institution maintain an internal classification system as a means of reporting
problem and potential problem assets. Furthermore, in connection with
examinations of insured institutions, federal examiners have the authority to
identify problem assets and, if appropriate, classify them. There are three
adverse classifications for problem assets:
- Substandard assets have one or more defined weaknesses and are characterized by the distinct possibility that the insured institution will sustain some loss if the deficiencies are not corrected.
- Doubtful assets have the weaknesses of substandard assets with the additional characteristic that the weaknesses make collection or liquidation in full on the basis of currently existing facts, conditions, and values questionable, and there is a high probability of loss.
- Loss assets are considered uncollectible and of such little value that continuance as an asset of the institution is not warranted.
Federal examiners have designated another
category as “special mention” for assets which have some identified weaknesses
but do not currently expose an insured institution to a sufficient degree of
risk to warrant classification as substandard, doubtful or loss.
Our potential problem assets are defined as
loans classified as substandard, doubtful, or loss pursuant to our internal loan
grading system that do not meet the definition of a non-performing asset. These
loans are identified as potential problem assets due to the borrowers’ financial
operations or financial condition which caused management to question the
borrowers’ future ability to comply with their contractual repayment terms.
Management’s decision to include performing loans in potential problem assets
does not necessarily mean that it expects losses to occur but that it recognizes
potential problem assets carry a higher probability of default. Potential
problem assets totaled $5.6 million at December 31, 2009 and $6.1 million at
December 31, 2008. The decrease from 2008 was a result of a change in
classification of a $2.7 million multifamily commercial real estate loan and a
$121,000 one-to-four family loan brought current, both of which were previously
classified as potential problem assets and are removed from this classification.
We also identified two loans totaling $1.6 million to one client relationship as
potential problem assets which includes a $1.6 million owner occupied commercial
real estate loan and a $39,000 commercial and industrial loan. In addition, we
identified five one-to-four family loans totaling $712,000 as potential problem
assets.
52
DEPOSITS
The following table sets forth the dollar
amount of deposits and the percentage of total deposits in each deposit category
offered by the Bank at the dates indicated.
| December 31, | ||||||||||||||||||
| 2009 | 2008 | 2007 | ||||||||||||||||
| Amount | Percentage | Amount | Percentage | Amount | Percentage | |||||||||||||
| (Dollars in thousands) | ||||||||||||||||||
| Core Deposits: | ||||||||||||||||||
| Non-interest bearing checking accounts | $ | 89,261 | 10.5 | % | $ | 63,484 | 7.7 | % | $ | 61,278 | 7.1 | % | ||||||
| Interest-bearing checking accounts | 106,013 | 12.5 | 96,070 | 11.7 | 94,445 | 10.9 | ||||||||||||
| Money market accounts | 136,411 | 16.0 | 134,997 | 16.4 | 139,860 | 16.2 | ||||||||||||
| Savings accounts | 113,865 | 13.4 | 114,633 | 13.9 | 127,297 | 14.8 | ||||||||||||
| Subtotal core deposits | 445,550 | 52.4 | 409,184 | 49.7 | 422,880 | 49.0 | ||||||||||||
| Certificates of deposit | 354,401 | 41.7 | 356,227 | 43.2 | 377,929 | 43.8 | ||||||||||||
| Non-municipal deposits | 799,951 | 94.1 | 765,411 | 92.9 | 800,809 | 92.8 | ||||||||||||
| Municipal core deposits | 38,993 | 4.6 | 39,221 | 4.7 | 45,660 | 5.3 | ||||||||||||
| Municipal certificates of deposit | 10,814 | 1.3 | 19,465 | 2.4 | 16,803 | 1.9 | ||||||||||||
| Municipal deposits | 49,807 | 5.9 | 58,686 | 7.1 | 62,463 | 7.2 | ||||||||||||
| Total deposits | $ | 849,758 | 100.0 | % | $ | 824,097 | 100.0 | % | $ | 863,272 | 100.0 | % | ||||||
Total deposits increased $25.7 million to
$849.8 million at December 31, 2009 from $824.1 million at December 31, 2008
resulting from a $36.4 million increase in non-municipal core deposits.
Investments in our branch network, technological infrastructure, human capital,
and brand have enhanced our ability to translate existing and new client
relationships into deposit growth. Included in our non-municipal core deposits
is $29.3 million related to a single deposit relationship cultivated during the
latter half of 2009. Partially offsetting the increase in core deposits was a
$1.8 million decrease in non-municipal time deposits. Total municipal deposits
decreased $8.9 million since December 31, 2008. While we maintain strong
relationships with our municipal clients, and municipal deposits continue to
comprise an important funding source, we are lowering our reliance on such funds
in anticipation that municipal deposit levels could decrease as a result of the
recession’s impact on municipalities and other government-related
entities.
As of December 31, 2009, the aggregate amount
of outstanding time certificates of deposit in amounts greater than or equal to
$100,000 was $116.1 million. The following table presents the maturity of these
time certificates of deposit.
| December 31, 2009 | ||
| (Dollars in thousands) | ||
| 3 months or less | $ | 29,008 |
| Over 3 months through 6 months | 30,067 | |
| Over 6 months through 12 months | 37,094 | |
| Over 12 months | 19,882 | |
| $ | 116,051 | |
In addition, we offer a repurchase sweep
agreement (Repo Sweep) account which allows public entities and
other business depositors to earn interest with respect to checking and savings
deposit products offered. The depositor’s excess funds are swept from a deposit
account and are used to purchase an interest in securities that we own. The
swept funds are not recorded as deposits and instead are classified as other
short-term borrowed money which generally provides a lower-cost funding
alternative as compared to FHLB advances. At December 31, 2009, we had $15.7
million in Repo Sweeps. The Repo Sweeps are included in the borrowed money table
and are treated as financings, and the obligations to repurchase securities sold
are reflected as short term borrowings. The securities underlying these Repo
Sweeps continue to be reflected as assets.
53
BORROWED MONEY
Borrowed money consisted of the
following at the dates indicated:
| December 31, | ||||||||||||
| 2009 | 2008 | |||||||||||
| Weighted | Weighted | |||||||||||
| Average | Average | |||||||||||
| Contractual | Contractual | |||||||||||
| Rate | Amount | Rate | Amount | |||||||||
| (Dollars in thousands) | ||||||||||||
| Repo Sweeps | 0.50 | % | $ | 15,659 | 0.82 | % | $ | 17,512 | ||||
| Federal Reserve Bank discount window | 0.50 | 8,640 | — | — | ||||||||
| Overnight federal funds purchased | — | — | 0.45 | 10,800 | ||||||||
| FHLB – Indianapolis advances | 2.53 | 87,509 | 2.41 | 144,800 | ||||||||
| Less: deferred premium on early extinguishment of debt | — | (175 | ) | |||||||||
| Total borrowed money | 2.09 | $ | 111,808 | 2.13 | $ | 172,937 | ||||||
During 2009, we chose to utilize excess
liquidity to repay maturing FHLB advances where appropriate due to market
conditions and to strengthen our balance sheet and preserve capital.
FHLB advances were reduced by the deferred
premium on the early extinguishment of debt related to our 2004 FHLB debt
restructure. As a result of the restructuring, we paid $42.0 million of
prepayment penalties related to the restructured advances, a portion of which
was deferred over the life of the new borrowings. The deferred premium on the
early extinguishment of debt totaled $32.2 million and was amortized as a charge
to interest expense over the remaining life of the new borrowings. We internally
computed the effect of the amortization on interest expense over the life of
each of the new advances. For the years ended December 31, 2009 and 2008, the
Premium Amortization increased our interest expense by $175,000 and $1.5
million, respectively. The Premium Amortization was fully amortized at December
31, 2009.
CAPITAL RESOURCES
Shareholders’ equity at December 31, 2009 was
$110.4 million compared to $111.8 million at December 31, 2008 as a result of
the following:
- an increase in accumulated other comprehensive loss of $1.5 million;
- net loss of $543,000; and
- cash dividends declared during 2009 totaling $418,000.
These decreases were partially offset by an
increase related to the net distribution of rabbi trust shares of $544,000 and
in shares earned under the ESOP totaling $198,000.
During 2009, we did not repurchase shares of
our common stock. At December 31, 2009, we had 448,612 shares remaining to be
repurchased under our current repurchase program. Since our initial public
offering in 1998, we have repurchased an aggregate of 14,054,160 shares of our
common stock at an average price of $12.23 per share.
Under our informal regulatory agreements with
the OTS, both the Company and the Bank have agreed to seek the OTS’ approval
prior to the declaration of any future dividends. The Company has also agreed
not to repurchase or redeem any shares of its common stock or incur or renew any
debt with the OTS’ prior approval. In addition, our Board is considering raising
additional capital to further strengthen regulatory capital ratios and
facilitate growth.
At December 31, 2009, we were deemed to be
well capitalized based on our internal calculations with tangible and core
regulatory capital ratios of 8.88% and a risk-based capital ratio of 12.35%. For
further information on our regulatory capital see “Note 12. Shareholders’ Equity
and Regulatory Capital” in the notes to consolidated financial statements
included in “Item 8. Financial Statements and Supplementary Data” of this Annual
Report on Form 10-K.
54
LIQUIDITY AND COMMITMENTS
Liquidity, represented by cash and cash
equivalents, is a product of operating, investing, and financing activities. Our
primary sources of funds are:
- deposits and Repo Sweeps;
- scheduled payments of amortizing loans and mortgage-backed securities;
- prepayments and maturities of outstanding loans and mortgage-backed securities;
- maturities of investment securities and other short-term investments;
- funds provided from operations;
- federal funds lines of credit; and
- borrowings from the FHLB and FRB.
The Asset Liability Committee is responsible
for measuring and monitoring the liquidity profile. We manage our liquidity to
ensure stable, reliable, and cost-effective sources of funds to satisfy demand
for credit, deposit withdrawals, and investment opportunities. Our general
approach to managing liquidity involves preparing a monthly “funding gap” report
which forecasts cash inflows and cash outflows over various time horizons and
rate scenarios to identify potential cash imbalances. We supplement our funding
gap report with the monitoring of several liquidity ratios to assist in
identifying any trends that may have an effect on available liquidity in future
periods.
We maintain a liquidity contingency plan that
outlines the process for addressing a liquidity crisis. The plan assigns
specific roles and responsibilities for effectively managing liquidity through a
problem period.
Scheduled payments from the amortization of
loans, mortgage-backed securities, maturing investment securities, and
short-term investments are relatively predictable sources of funds, while
deposit flows and loan prepayments are greatly influenced by market interest
rates, economic conditions, and competitive rate offerings.
At December 31, 2009, we had cash and cash
equivalents of $24.4 million, an increase from $19.1 million at December 31,
2008. The increase was mainly the result of:
- increases in deposit accounts totaling $25.6 million;
- proceeds from sales, maturities, and paydowns of securities aggregating $106.8 million; and
- proceeds from FHLB advances totaling $161.0 million.
The above cash inflows were
partially offset by:
- purchases of available-for-sale securities totaling $42.3 million and
- repayment of FHLB advances totaling $218.3 million.
We use our sources of funds primarily to meet
our ongoing commitments, fund loan commitments, fund maturing certificates of
deposit and savings withdrawals, and maintain a securities portfolio. We
anticipate that we will continue to have sufficient funds to meet our current
commitments. During 2009, one of our $15.0 million unsecured overnight federal
funds line of credit was not renewed at the corresponding bank’s discretion.
Subsequently, we received approval to borrow from the FRB.
Our liquidity needs consist primarily of
operating expenses, dividend payments to shareholders, and stock repurchases.
The primary sources of liquidity are cash and cash equivalents and dividends
from the Bank. We are prohibited from incurring any debt at the parent company
without the prior approval of the OTS under our informal regulatory agreement
with them.
We are currently prohibited from paying
dividends without the prior approval of the OTS pursuant to our informal
regulatory agreement with them. Absent such restriction, under OTS regulations,
without prior approval, the dividends from the Bank are limited to the extent of
the Bank’s cumulative earnings for the year plus the net earnings (adjusted by
prior distributions) of the prior two calendar years. During 2009, the Bank did
not pay dividends to the parent company. At December 31, 2009, the parent
company had $3.8 million in cash and cash equivalents. The parent company had
$7,000 of securities available-for-sale at December 31, 2009. See also “Note 12.
Shareholders’ Equity and Regulatory Capital” in the consolidated financial
statements included in “Item 8. Financial Statements and Supplementary Data” of
this Annual Report on Form 10-K for a further discussion of the Bank’s ability
to pay dividends.
55
Contractual Obligations
The following table presents significant fixed
and determinable contractual obligations to third-parties by payment date as of
December 31, 2009.
| Payments Due by Period | |||||||||||||||
| Over One | Over Three | Over | |||||||||||||
| One Year | through | through | Five | ||||||||||||
| or Less | Three Years | Five Years | Years | Total | |||||||||||
| (Dollars in thousands) | |||||||||||||||
| Federal Home Loan Bank advances (1) | $ | 47,311 | $ | 15,689 | $ | 16,761 | $ | 7,748 | $ | 87,509 | |||||
| Short-term borrowings (2) | 24,299 | — | — | — | 24,299 | ||||||||||
| Service bureau contract | 1,548 | 3,096 | 3,096 | — | 7,740 | ||||||||||
| Operating leases | 437 | 480 | 293 | 2,129 | 3,339 | ||||||||||
| Dividends payable on common stock | 109 | — | — | — | 109 | ||||||||||
| $ | 73,704 | $ | 19,265 | $ | 20,150 | $ | 9,877 | $ | 122,996 | ||||||
| (1) | Does not include interest expense at the weighted-average contractual rate of 2.53% for the periods presented. | |
| (2) | Does not include interest expense at the weighted-average contractual rate of 0.50% for the periods presented. | |
See the “Borrowed Money” section for further
discussion surrounding FHLB advances. The operating lease obligations reflected
above include the future minimum rental payments, by year, required under the
lease terms for premises and equipment. Many of these leases contain renewal
options, and certain leases provide options to purchase the leased property
during or at the expiration of the lease period at specific prices. See also
“Note 4. Office Properties and Equipment” in the notes to consolidated financial
statements included in “Item 8. Financial Statements and Supplementary Data” of
this Annual Report on Form 10-K for further discussion related to the operating
leases.
We also have commitments to fund certificates
of deposit which are scheduled to mature within one year or less. These deposits
totaled $304.2 million at December 31, 2009. Based on historical experience and
the fact that these deposits are at current market rates, management believes
that a significant portion of the maturing deposits will remain here.
Off-Balance-Sheet
Obligations
We are party to financial instruments with
off-balance-sheet risk in the normal course of business to meet the financing
needs of our clients. These financial instruments involve, to varying degrees,
elements of credit risk in excess of the amount recognized in the statement of
condition. Our exposure to credit loss in the event of non-performance by the
third-party to the financial instrument for commitments to extend credit and
letters of credit is represented by the contractual notional amount of those
instruments. We use the same credit policies in making commitments and
conditional obligations as we do for on-balance sheet instruments.
56
The following table details the
amounts and expected maturities of significant commitments at December 31,
2009.
| Over One | Over Three | Over | |||||||||||||
| One Year | through | through | Five | ||||||||||||
| or Less | Three Years | Five Years | Years | Total | |||||||||||
| (Dollars in thousands) | |||||||||||||||
| Commitments to extend credit: | |||||||||||||||
| Commercial | $ | 4,520 | $ | — | $ | 199 | $ | — | $ | 4,719 | |||||
| Commercial real estate – non-owner occupied | 2,357 | — | — | — | 2,357 | ||||||||||
| Commercial real estate – owner occupied | 2,431 | — | — | 5 | 2,436 | ||||||||||
| Commercial real estate – multifamily | 6,320 | — | — | — | 6,320 | ||||||||||
| Commercial construction and land development | 2,777 | 175 | — | — | 2,952 | ||||||||||
| Retail | 1,556 | — | — | — | 1,556 | ||||||||||
| Commitments to fund unused construction loans | 5,612 | — | — | 275 | 5,887 | ||||||||||
| Commitments to fund unused lines of credit | 46,763 | 1,594 | 21 | 43,466 | 91,844 | ||||||||||
| Letters of credit | 8,415 | 200 | — | — | 8,615 | ||||||||||
| Credit enhancements | 14,805 | 5,416 | — | 9,603 | 29,824 | ||||||||||
| $ | 95,556 | $ | 7,385 | $ | 220 | $ | 53,349 | $ | 156,510 | ||||||
The commitments listed above do not
necessarily represent future cash requirements, in that these commitments often
expire without being drawn upon. Letters of credit expire at various times
through 2012. Credit enhancements expire at various times through 2018.
We also have commitments to fund community
investments through investments in various limited partnerships, which represent
future cash outlays for the construction and development of properties for
low-income housing, small business real estate, and historic tax credit projects
that qualify under the Community Reinvestment Act. These commitments include
$704,000 to be funded over five years. The timing and amounts of these
commitments are projected based upon the financing arrangements provided in each
project’s partnership agreement and could change due to variances in the
construction schedule, project revisions, or the cancellation of the project.
These commitments are not included in the commitment table above. See additional
disclosures in “Note 14. Variable Interest Entities” in the notes to
consolidated financial statements included in “Item 8. Financial Statements and
Supplementary Data” of this Annual Report on Form 10-K.
Credit enhancements are related to the
issuance by municipalities of taxable and nontaxable revenue bonds. The proceeds
from the sale of such bonds are loaned to for-profit and not-for-profit
companies for economic development projects. In order for the bonds to receive a
triple-A rating, which provides for a lower interest rate, the FHLB issues, in
favor of the bond trustee, an Irrevocable Direct Pay Letter of Credit
(IDPLOC) for the account. Since we, in accordance
with the terms and conditions of a Reimbursement Agreement between the FHLB and
the Bank, would be required to reimburse the FHLB for draws against the IDPLOC,
these facilities are analyzed, appraised, secured by real estate mortgages, and
monitored as if we had funded the project initially.
IMPACT OF INFLATION AND CHANGING
PRICES
The consolidated financial statements and
related financial data presented herein have been prepared in accordance with
U.S. GAAP, which require the measurement of financial position and operating
results generally in terms of historical dollars, without considering changes in
relative purchasing power over time due to inflation. Unlike most industrial
companies, virtually all of our assets and liabilities are monetary in nature.
Monetary items, such as cash, loans, and deposits, are those assets and
liabilities which are or will be converted into a fixed number of dollars
regardless of changes in prices. As a result, changes in interest rates
generally have a more significant impact on a financial institution’s
performance than general inflation. Over short periods of time, interest rates
may not necessarily move in the same direction or of the same magnitude as
inflation.
57
ITEM 7A. QUANTITATIVE AND QUALITATIVE
DISCLOSURES ABOUT MARKET RISK
We, like other financial institutions, are
subject to interest rate risk (IRR). This risk
relates to changes in market interest rates which could adversely affect net
interest income or the net portfolio value (NPV) of our assets,
liabilities, and off-balance-sheet contracts. IRR is primarily the result of
imbalances between the price sensitivity of our assets and our liabilities.
These imbalances can be caused by differences in the maturity, repricing, and
coupon characteristics of various assets and liabilities as well as options
(such as loan prepayment options).
We maintain a written Asset/Liability
Management Policy that establishes written guidelines for the asset/liability
management function, including the management of net interest margin, IRR, and
liquidity. The Asset/Liability Management Policy falls under the authority of
the Board of Directors which in turn assigns its formulation, revision, and
administration to the Asset/Liability Committee (ALCO). ALCO meets
monthly and consists of certain senior officers and one outside director. The
results of the monthly meetings are reported to the Board of Directors. The
primary duties of ALCO are to develop reports and establish procedures to
measure and monitor IRR; verify compliance with Board approved IRR tolerance
limits; take appropriate actions to mitigate those risks; monitor and discuss
the status and results of implemented strategies and tactics; monitor our
capital position; review the current and prospective liquidity positions; and
monitor alternative funding sources. The policy requires management to measure
overall IRR exposure using NPV analysis and earnings at risk
analysis.
NPV is defined as the net present value of
existing assets, liabilities, and off-balance-sheet contracts. NPV analysis
measures the sensitivity of NPV under current interest rates and for a range of
hypothetical interest rate scenarios. The hypothetical scenarios are represented
by immediate, permanent, parallel movements in interest rates of plus 100, 200,
and 300 basis points and minus 100 and 200 basis points. This rate-shock
approach is designed primarily to show the ability of the balance sheet to
absorb rate shocks on a “theoretical liquidation value” basis. The analysis does
not take into account non-rate related issues, which affect equity valuations,
such as franchise value or real estate values. This analysis is static and does
not consider potential adjustments of strategies by management on a dynamic
basis in a volatile rate environment in order to protect or conserve equity
values. As such, actual results may vary from the modeled results.
In the fourth quarter of 2009, the Bank
altered its methodology for generating cash flows on non-maturity deposits.
Prior methodology used analysis based on institution-specific data regarding
retention rates, historical rate changes, and expected future rate changes in
shocked scenarios. Current methodology uses a more conservative approach on
retention rates which more closely aligns with retention rates used by the OTS
in their NPV modeling. This change in retention rates results in significantly
lower durations and values on our non-maturity deposits. We estimate the effect
of this change in the base case scenario (zero basis point change) to be
approximately $41 million. The following durations for non-maturity deposits
were used in the base case:
| Duration (in years) | ||||
| At December 31, | ||||
| 2009 | 2008 | |||
| Deposit Category: | ||||
| Non-interest checking accounts | 3.1 | 8.0 | ||
| Business checking accounts | 3.0 | 6.2 | ||
| Interest checking accounts | 3.0 | 6.2 | ||
| High-yield checking accounts | 1.7 | 3.4 | ||
| Savings accounts | 3.2 | 6.7 | ||
| Money market accounts | 1.7 | 3.8 | ||
The following table presents, at December 31,
2009 and 2008, an analysis of IRR as measured by changes in NPV for immediate,
permanent, and parallel shifts in the yield curve in 100 basis point increments
up to 300 basis points and down 200 basis points in accordance with OTS
regulations.
58
| Net Portfolio Value | |||||||||||||||||||||
| At December 31, | |||||||||||||||||||||
| 2009 | 2008 | ||||||||||||||||||||
| $ Amount | $ Change | % Change | $ Amount | $ Change | % Change | ||||||||||||||||
| (Dollars in thousands) | |||||||||||||||||||||
| Assumed Change in Interest Rates | |||||||||||||||||||||
| (Basis Points) | |||||||||||||||||||||
| +300 | $ | 130,797 | $ | 2,065 | 1.6 | % | $ | 164,766 | $ | 9,082 | 5.8 | % | |||||||||
| +200 | 131,109 | 2,377 | 1.8 | 163,073 | 7,389 | 4.7 | |||||||||||||||
| +100 | 130,917 | 2,185 | 1.7 | 160,467 | 4,783 | 3.1 | |||||||||||||||
| 0 | 128,732 | — | — | 155,684 | — | — | |||||||||||||||
| -100 | 117,387 | (11,345 | ) | (8.8 | ) | 142,862 | (12,822 | ) | (8.2 | ) | |||||||||||
| -200 | 105,417 | (23,315 | ) | (18.1 | ) | 124,618 | (31,006 | ) | (20.0 | ) | |||||||||||
As illustrated in the table, NPV in the base
case (zero basis point change) decreased $27.0 million from $155.7 million at
December 31, 2008 to $128.7 million at December 31, 2009. The primary causes for
this decrease were changes in the composition of our assets and liabilities,
changes in interest rates, and the aforementioned methodology changes for
non-maturity deposits.
Earnings at risk analysis measures the
sensitivity of net interest income over a twelve month period to various
interest rate movements. The interest rate scenarios are used for analytical
purposes and do not necessarily represent management’s view of future market
movements. Rather, these scenarios are intended to provide a measure of the
degree of volatility interest rate movements may introduce into
earnings.
A key assumption we control for use in our
earnings at risk model is the assumed repricing sensitivity of our non-maturing
core deposit accounts. The following assumptions were used for the repricing of
non-maturity core deposit accounts.
| Percentage | ||||||
| of Deposits | ||||||
| Maturing In | ||||||
| First Year | ||||||
| At December 31, | ||||||
| 2009 | 2008 | |||||
| Deposit Category: | ||||||
| Business checking accounts | 20 | % | 20 | % | ||
| Interest checking accounts | 20 | 20 | ||||
| High-yield checking accounts | 95 | 95 | ||||
| Savings accounts | 30 | 30 | ||||
| Money market accounts | 50 | 50 | ||||
The following table presents the projected
changes in net interest income over a twelve month period for the various
interest rate change (rate shocks) scenarios at December 31, 2009 and
2008.
| Percentage Change in | |||||||
| Net Interest Income | |||||||
| Over a Twelve Month | |||||||
| Time Period | |||||||
| 2009 | 2008 | ||||||
| Assumed Change in Interest Rates | |||||||
| (Basis Points) | |||||||
| +300 | 0.1 | % | (3.3 | )% | |||
| +200 | 0.2 | (1.8 | ) | ||||
| +100 | 0.0 | (0.7 | ) | ||||
| -100 | 3.3 | 1.2 | |||||
| -200 | 1.5 | 1.6 | |||||
59
The earnings at risk analysis suggests we are
subject to higher IRR in a rising rate environment than in a falling rate
environment. The table above indicates that if interest rates were to move up
300 basis points, net interest income would be expected to increase 0.1% in year
one; and if interest rates were to move down 200 basis points, net interest
income would be expected to increase 1.5% in year one. The primary causes for
the changes in net interest income over the twelve month period were a result of
the changes in the composition of our assets and liabilities along with changes
in interest rates.
We manage our IRR position by holding assets
on the statement of condition with desired IRR characteristics, implementing
certain pricing strategies for loans and deposits, and implementing various
securities portfolio strategies. The Bank currently plans to reduce its exposure
to rising interest rates by increasing its core deposit balances, limiting the
duration of fixed-rate assets, and extending the duration of its liabilities. On
a quarterly basis, the ALCO reviews the calculations of all IRR measures for
compliance with the Board approved tolerance limits. At December 31, 2009, we
were in compliance with all of our tolerance limits.
The above IRR analyses include the assets and
liabilities of the Bank only. Inclusion of Company-only assets and liabilities
would have a non-material impact on the results presented.
60
ITEM 8. FINANCIAL STATEMENTS AND SUPPLEMENTARY
DATA
Report of Independent Registered Public
Accounting Firm
Audit Committee,
Board of Directors and Shareholders
CFS Bancorp, Inc.
Munster, Indiana
CFS Bancorp, Inc.
Munster, Indiana
We have audited the
accompanying consolidated statements of condition of CFS Bancorp, Inc. as of
December 31, 2009 and 2008, and the related consolidated statements of
operations, shareholders’ equity and cash flows for each of the years in the
three-year period ended December 31, 2009. The Company's management is
responsible for these financial statements. Our responsibility is to express an
opinion on these financial statements based on our audits.
We conducted our
audits in accordance with the standards of the Public Company Accounting
Oversight Board (United States). Those standards require that we plan and
perform the audits to obtain reasonable assurance about whether the financial
statements are free of material misstatement. Our audit included examining, on a
test basis, evidence supporting the amounts and disclosures in the financial
statements, assessing the accounting principles used and significant estimates
made by management and evaluating the overall financial statement presentation.
We believe that our audits provide a reasonable basis for our opinion.
In our opinion, the
consolidated financial statements referred to above present fairly, in all
material respects, the financial position of CFS Bancorp, Inc. as of December
31, 2009 and 2008, and the results of its operations and its cash flows for each
of the years in the three-year period ended December 31, 2009, in conformity
with accounting principles generally accepted in the United States of America.
/s/ BKD, LLP
Indianapolis,
Indiana
March 10, 2010
March 10, 2010
61
CFS BANCORP, INC.
Consolidated Statements of
Condition
| December 31, | ||||||||
| 2009 | 2008 | |||||||
| (Dollars in thousands | ||||||||
| except per share data) | ||||||||
| ASSETS | ||||||||
| Cash and amounts due from depository institutions | $ | 24,041 | $ | 15,714 | ||||
| Interest-bearing deposits | 387 | 3,133 | ||||||
| Federal funds sold | — | 259 | ||||||
| Cash and cash equivalents | 24,428 | 19,106 | ||||||
| Securities available-for-sale, at fair value | 188,781 | 251,270 | ||||||
| Securities held-to-maturity, at cost | 5,000 | 6,940 | ||||||
| Investment in Federal Home Loan Bank stock, at cost | 23,944 | 23,944 | ||||||
| Loans receivable | 762,386 | 749,973 | ||||||
| Allowance for losses on loans | (19,461 | ) | (15,558 | ) | ||||
|
Net loans
|
742,925 | 734,415 | ||||||
| Interest receivable | 3,469 | 4,325 | ||||||
| Other real estate owned | 9,242 | 3,242 | ||||||
| Office properties and equipment | 20,382 | 19,790 | ||||||
| Investment in bank-owned life insurance | 34,575 | 36,606 | ||||||
| Net deferred tax assets | 18,036 | 15,494 | ||||||
| Other assets | 10,733 | 6,723 | ||||||
|
Total
assets
|
$ | 1,081,515 | $ | 1,121,855 | ||||
| LIABILITIES AND SHAREHOLDERS’ EQUITY | ||||||||
| Deposits | $ | 849,758 | $ | 824,097 | ||||
| Borrowed money | 111,808 | 172,937 | ||||||
| Advance payments by borrowers for taxes and insurance | 4,322 | 4,320 | ||||||
| Other liabilities | 5,254 | 8,692 | ||||||
|
Total
liabilities
|
971,142 | 1,010,046 | ||||||
| Commitments and contingencies | ||||||||
| Shareholders’ equity: | ||||||||
| Preferred stock, $.01 par value; 15,000,000 shares authorized | — | — | ||||||
| Common stock, $.01 par value; 85,000,000 shares authorized; | ||||||||
|
23,423,306 shares issued;
10,771,061 and 10,674,511 shares outstanding
|
234 | 234 | ||||||
| Additional paid-in capital | 188,930 | 189,211 | ||||||
| Retained earnings | 80,564 | 81,525 | ||||||
| Treasury stock, at cost; 12,652,245 and 12,748,795 shares | (157,041 | ) | (157,466 | ) | ||||
| Unallocated common stock held by Employee Stock Ownership Plan | — | (832 | ) | |||||
| Accumulated other comprehensive loss, net of tax | (2,314 | ) | (863 | ) | ||||
|
Total shareholders’
equity
|
110,373 | 111,809 | ||||||
|
Total liabilities and
shareholders’ equity
|
$ | 1,081,515 | $ | 1,121,855 | ||||
See accompanying
notes.
62
CFS BANCORP, INC.
Consolidated Statements of Operations
| Year Ended December 31, | |||||||||||
| 2009 | 2008 | 2007 | |||||||||
| (Dollars in thousands except per share data) | |||||||||||
| Interest income: | |||||||||||
| Loans | $ | 39,277 | $ | 45,213 | $ | 56,678 | |||||
| Securities | 11,334 | 12,673 | 12,684 | ||||||||
| Other | 697 | 1,653 | 2,879 | ||||||||
| Total interest income | 51,308 | 59,539 | 72,241 | ||||||||
| Interest expense: | |||||||||||
| Deposits | 10,447 | 18,099 | 26,222 | ||||||||
| Borrowed money | 3,268 | 6,557 | 11,912 | ||||||||
| Total interest expense | 13,715 | 24,656 | 38,134 | ||||||||
| Net interest income | 37,593 | 34,883 | 34,107 | ||||||||
| Provision for losses on loans | 12,588 | 26,296 | 2,328 | ||||||||
| Net interest income after provision for losses on loans | 25,005 | 8,587 | 31,779 | ||||||||
| Non-interest income: | |||||||||||
| Service charges and other fees | 5,706 | 6,051 | 6,795 | ||||||||
| Card-based fees | 1,664 | 1,600 | 1,489 | ||||||||
| Commission income | 246 | 341 | 147 | ||||||||
| Security gains, net | 1,092 | 69 | 536 | ||||||||
| Other asset gains (losses), net | (9 | ) | 30 | 22 | |||||||
| Impairment on securities available-for-sale | — | (4,334 | ) | — | |||||||
| Income from bank-owned life insurance | 2,183 | 1,300 | 1,634 | ||||||||
| Other income | 590 | 566 | 892 | ||||||||
| Total non-interest income | 11,472 | 5,623 | 11,515 | ||||||||
| Non-interest expense: | |||||||||||
| Compensation and employee benefits | 18,898 | 17,498 | 18,406 | ||||||||
| Net occupancy expense | 3,022 | 3,175 | 2,847 | ||||||||
| FDIC insurance premiums | 2,240 | 159 | 106 | ||||||||
| Professional fees | 2,273 | 1,341 | 1,540 | ||||||||
| Furniture and equipment expense | 2,129 | 2,362 | 2,241 | ||||||||
| Data processing | 1,670 | 1,749 | 2,169 | ||||||||
| Marketing | 832 | 1,002 | 842 | ||||||||
| Other real estate owned expenses | 2,978 | 263 | 343 | ||||||||
| Loan collection expense | 1,077 | 655 | 164 | ||||||||
| Goodwill impairment | — | 1,185 | — | ||||||||
| Other general and administrative expenses | 4,163 | 4,789 | 4,801 | ||||||||
| Total non-interest expense | 39,282 | 34,178 | 33,459 | ||||||||
| Income (loss) before income taxes (benefit) | (2,805 | ) | (19,968 | ) | 9,835 | ||||||
| Income tax expense (benefit) | (2,262 | ) | (8,673 | ) | 2,310 | ||||||
| Net income (loss) | $ | (543 | ) | $ | (11,295 | ) | $ | 7,525 | |||
| Per share data: | |||||||||||
| Basic earnings (loss) per share | $ | (0.05 | ) | $ | (1.10 | ) | $ | 0.71 | |||
| Diluted earnings (loss) per share | (0.05 | ) | (1.10 | ) | 0.69 | ||||||
| Weighted-average shares outstanding | 10,574,623 | 10,307,879 | 10,547,853 | ||||||||
| Weighted-average diluted shares outstanding | 10,680,085 | 10,508,306 | 10,842,782 | ||||||||
See accompanying
notes.
63
CFS BANCORP, INC.
Consolidated Statements of Changes in
Shareholders’ Equity
| Unearned | |||||||||||||||||||||||||||
| Common | Accumulated | ||||||||||||||||||||||||||
| Additional | Stock | Other | |||||||||||||||||||||||||
| Common | Paid-In | Retained | Treasury | Acquired | Comprehensive | ||||||||||||||||||||||
| Stock | Capital | Earnings | Stock | by ESOP | Income (Loss) | Total | |||||||||||||||||||||
| (Dollars in Thousands) | |||||||||||||||||||||||||||
| Balance at January 1, 2007 | $ | 234 | $ | 190,825 | $ | 94,344 | $ | (149,735 | ) | $ | (3,564 | ) | $ | (298 | ) | $ | 131,806 | ||||||||||
| Net income for 2007 | — | — | 7,525 | — | — | — | 7,525 | ||||||||||||||||||||
| Comprehensive income: | |||||||||||||||||||||||||||
| Change in unrealized appreciation | |||||||||||||||||||||||||||
|
on available-for-sale
securities,
|
|||||||||||||||||||||||||||
|
net of reclassification and
tax
|
— | — | — | — | — | 2,074 | 2,074 | ||||||||||||||||||||
| Total comprehensive income | — | — | — | — | — | — | 9,599 | ||||||||||||||||||||
| Purchase of treasury stock | — | — | — | (9,751 | ) | — | — | (9,751 | ) | ||||||||||||||||||
| Net purchases of Rabbi Trust shares | — | — | — | (139 | ) | — | — | (139 | ) | ||||||||||||||||||
| Shares earned under ESOP | — | 202 | — | — | 438 | — | 640 | ||||||||||||||||||||
| Amortization of award under RRP | — | 48 | — | — | — | — | 48 | ||||||||||||||||||||
| Cumulative effect of change in | |||||||||||||||||||||||||||
| accounting principle upon the | |||||||||||||||||||||||||||
| adoption of FIN 48 | — | — | 240 | — | — | — | 240 | ||||||||||||||||||||
| Exercise of stock options | — | (201 | ) | — | 2,964 | — | — | 2,763 | |||||||||||||||||||
| Tax benefit related to stock options | |||||||||||||||||||||||||||
| exercised | — | 288 | — | — | — | — | 288 | ||||||||||||||||||||
| Dividends declared on common stock | |||||||||||||||||||||||||||
| ($0.48 per share) | — | — | (5,080 | ) | — | — | — | (5,080 | ) | ||||||||||||||||||
| Balance at December 31, 2007 | 234 | 191,162 | 97,029 | (156,661 | ) | (3,126 | ) | 1,776 | 130,414 | ||||||||||||||||||
| Net loss for 2008 | — | — | (11,295 | ) | — | — | — | (11,295 | ) | ||||||||||||||||||
| Comprehensive loss: | |||||||||||||||||||||||||||
| Change in unrealized appreciation | |||||||||||||||||||||||||||
|
on available-for-sale
securities,
|
|||||||||||||||||||||||||||
|
net of reclassification and
tax
|
— | — | — | — | — | (2,639 | ) | (2,639 | ) | ||||||||||||||||||
| Total comprehensive loss | — | — | — | — | — | — | (13,934 | ) | |||||||||||||||||||
| Purchase of treasury stock | — | — | — | (2,997 | ) | — | — | (2,997 | ) | ||||||||||||||||||
| Net purchases of Rabbi Trust shares | — | — | — | 41 | — | — | 41 | ||||||||||||||||||||
| Shares earned under ESOP | — | (1,165 | ) | — | — | 2,294 | — | 1,129 | |||||||||||||||||||
| Amortization of award under RRP | — | 38 | — | — | — | — | 38 | ||||||||||||||||||||
| Forfeiture of RRP award | — | 34 | — | (34 | ) | — | — | — | |||||||||||||||||||
| Unearned compensation restricted stock awards | — | (1,555 | ) | — | 1,555 | — | — | — | |||||||||||||||||||
| Exercise of stock options | — | 200 | — | 630 | — | — | 830 | ||||||||||||||||||||
| Tax benefit related to stock-based | |||||||||||||||||||||||||||
| benefit plans | — | 497 | — | — | — | — | 497 | ||||||||||||||||||||
| Dividends declared on common stock | |||||||||||||||||||||||||||
| ($0.40 per share) | — | — | (4,209 | ) | — | — | — | (4,209 | ) | ||||||||||||||||||
| Balance at December 31, 2008 | 234 | 189,211 | 81,525 | (157,466 | ) | (832 | ) | (863 | ) | 111,809 | |||||||||||||||||
| Net loss for 2009 | — | — | (543 | ) | — | — | — | (543 | ) | ||||||||||||||||||
| Comprehensive loss: | |||||||||||||||||||||||||||
| Change in unrealized appreciation | |||||||||||||||||||||||||||
|
on available-for-sale
securities,
|
|||||||||||||||||||||||||||
|
net of reclassification and
tax
|
— | — | — | — | — | (1,451 | ) | (1,451 | ) | ||||||||||||||||||
| Total comprehensive loss | — | — | — | — | — | — | (1,994 | ) | |||||||||||||||||||
| Net distributions of Rabbi Trust shares | — | (414 | ) | — | 958 | — | — | 544 | |||||||||||||||||||
| Shares earned under ESOP | — | (634 | ) | — | — | 832 | — | 198 | |||||||||||||||||||
| Amortization of award under RRP | — | 1 | — | — | — | — | 1 | ||||||||||||||||||||
| Forfeiture of restricted stock award | — | 906 | — | (906 | ) | — | — | — | |||||||||||||||||||
| Unearned compensation restricted stock awards | — | (373 | ) | — | 373 | — | — | — | |||||||||||||||||||
| Tax benefit related to stock-based | |||||||||||||||||||||||||||
| benefit plans | — | 233 | — | — | — | — | 233 | ||||||||||||||||||||
| Dividends declared on common stock | |||||||||||||||||||||||||||
| ($0.04 per share) | — | — | (418 | ) | — | — | — | (418 | ) | ||||||||||||||||||
| Balance at December 31, 2009 | $ | 234 | $ | 188,930 | $ | 80,564 | $ | (157,041 | ) | $ | — | $ | (2,314 | ) | $ | 110,373 | |||||||||||
See accompanying
notes.
64
CFS BANCORP, INC.
Consolidated Statements of Cash
Flows
| Year Ended December 31, | |||||||||||
| 2009 | 2008 | 2007 | |||||||||
| (Dollars in thousands) | |||||||||||
| OPERATING ACTIVITIES | |||||||||||
| Net income (loss) | $ | (543 | ) | $ | (11,295 | ) | $ | 7,525 | |||
| Adjustments to reconcile net income (loss) to net cash provided by operating activities: | |||||||||||
| Provision for losses on loans | 12,588 | 26,296 | 2,328 | ||||||||
| Depreciation and amortization | 1,587 | 1,720 | 1,704 | ||||||||
| Premium amortization on the early extinguishment of debt | 175 | 1,452 | 4,540 | ||||||||
| Net (discount accretion) premium amortization on securities available-for-sale | (1,382 | ) | (1,135 | ) | 447 | ||||||
| Impairment of securities available-for-sale | — | 4,334 | — | ||||||||
| Impairment of goodwill | — | 1,185 | — | ||||||||
| Deferred income tax expense (benefit) | (1,592 | ) | (8,735 | ) | 972 | ||||||
| Amortization of cost of stock benefit plans | 199 | 1,167 | 688 | ||||||||
| Tax benefit from stock-based benefits | (233 | ) | (497 | ) | (288 | ) | |||||
| Proceeds from sale of loans held-for-sale | — | 45 | 10,882 | ||||||||
| Origination of loans held-for-sale | — | — | (10,804 | ) | |||||||
| Net realized gains on sales of securities available-for-sale | (1,092 | ) | (69 | ) | (536 | ) | |||||
| Net realized (gains) losses on sales of other assets | 9 | (30 | ) | (22 | ) | ||||||
| Net increase in cash surrender value of bank-owned life insurance | (2,183 | ) | (1,300 | ) | (1,634 | ) | |||||
| Increase in other assets | (816 | ) | (1,113 | ) | (1,271 | ) | |||||
| Increase (decrease) in other liabilities | (3,071 | ) | (7,579 | ) | 10,866 | ||||||
| Net cash provided by operating activities | 3,646 | 4,446 | 25,397 | ||||||||
| INVESTING ACTIVITIES | |||||||||||
| Securities, available-for-sale: | |||||||||||
| Proceeds from sales | 21,707 | 1,992 | 109,945 | ||||||||
| Proceeds from maturities and paydowns | 83,195 | 66,988 | 88,706 | ||||||||
| Purchases | (42,339 | ) | (102,907 | ) | (120,986 | ) | |||||
| Securities, held-to-maturity: | |||||||||||
| Proceeds from maturities and paydowns | 1,940 | 940 | — | ||||||||
| Purchases | — | (3,940 | ) | (3,940 | ) | ||||||
| Net loan (fundings) principal payments received | (29,814 | ) | 22,232 | (10,714 | ) | ||||||
| Proceeds from sale of loans and loan participations | — | — | 13,188 | ||||||||
| Proceeds from sale of other real estate owned | 679 | 546 | 642 | ||||||||
| Proceeds from bank-owned life insurance | 4,214 | 1,169 | 1,035 | ||||||||
| Purchases of properties and equipment | (2,179 | ) | (2,135 | ) | (3,168 | ) | |||||
| Disposal of properties and equipment | — | — | 5 | ||||||||
| Net cash flows provided by (used in) investing activities | 37,403 | (15,115 | ) | 74,713 | |||||||
| FINANCING ACTIVITIES | |||||||||||
| Proceeds from exercise of stock options | — | 830 | 2,763 | ||||||||
| Tax benefit from stock-based benefits | 233 | 497 | 288 | ||||||||
| Dividends paid on common stock | (758 | ) | (5,192 | ) | (5,311 | ) | |||||
| Purchase of treasury stock | — | (2,997 | ) | (9,751 | ) | ||||||
| Net distributions (purchases) of Rabbi Trust shares | 544 | 41 | (139 | ) | |||||||
| Net increase (decrease) in deposit accounts | 25,556 | (39,318 | ) | (44,009 | ) | ||||||
| Net increase (decrease) in advance payments by borrowers for taxes and insurance | 2 | 979 | (853 | ) | |||||||
| Net (decrease) increase in short-term borrowings | (4,014 | ) | 4,297 | 897 | |||||||
| Proceeds from Federal Home Loan Bank debt | 161,000 | 311,000 | 37,000 | ||||||||
| Repayments of Federal Home Loan Bank debt | (218,290 | ) | (279,271 | ) | (109,253 | ) | |||||
| Net cash flows used in financing activities | (35,727 | ) | (9,134 | ) | (128,368 | ) | |||||
| Increase (decrease) in cash and cash equivalents | 5,322 | (19,803 | ) | (28,258 | ) | ||||||
| Cash and cash equivalents at beginning of year | 19,106 | 38,909 | 67,167 | ||||||||
| Cash and cash equivalents at end of year | $ | 24,428 | $ | 19,106 | $ | 38,909 | |||||
| Supplemental disclosures: | |||||||||||
| Loans transferred to other real estate owned | $ | 8,787 | $ | 2,635 | $ | 1,582 | |||||
| Cash paid for interest on deposits | 10,616 | 18,422 | 26,089 | ||||||||
| Cash paid for interest on borrowings | 3,154 | 5,167 | 7,500 | ||||||||
| Cash paid for taxes | 460 | 800 | 1,550 | ||||||||
See accompanying
notes.
65
CFS BANCORP, INC.
NOTES TO CONSOLIDATED FINANCIAL
STATEMENTS
December 31, 2009
December 31, 2009
1. SUMMARY OF SIGNIFICANT ACCOUNTING
POLICIES
Organization
CFS Bancorp, Inc. (including its consolidated
subsidiaries, the Company) incorporated in March 1998 for the purpose
of becoming the holding company for Citizens Financial Bank (the Bank), formerly
known as Citizens Financial Services, FSB. Pursuant to shareholder approval, in
2005, the Company changed its state of incorporation from Delaware to Indiana.
The change was effectuated through a merger of the Delaware corporation with a
wholly-owned Indiana subsidiary formed for that purpose. The Company is
headquartered in Munster, Indiana. The Bank is a federal savings bank offering a
full range of financial services to clients who are primarily located in
northwest Indiana and the south and southwest Chicagoland area. The Bank is
principally engaged in the business of attracting deposits from the general
public and using these deposits to originate consumer, residential, and
commercial loans, with commercial loans focused primarily on commercial and
industrial loans with closely held companies and owner occupied commercial real
estate.
The Company provides financial services
through its offices in northwest Indiana and the suburban areas south and
southwest of Chicago. Its primary deposit products are checking, savings, and
money market accounts as well as certificates of deposit. Its primary lending
products are commercial and retail loans. Substantially all loans are secured by
specific items of collateral including commercial and residential real estate,
business assets, and consumer assets. Commercial loans are expected to be repaid
from cash flow from business operations. The clients’ ability to repay their
loans is dependent on the general economic conditions in the area, cash flows
from the borrower or their operations, and the underlying collateral.
Principles of Consolidation
The consolidated financial statements include
the accounts and transactions of the Company and its wholly-owned subsidiary,
the Bank. The Bank has one active subsidiary, CFS Holdings, Ltd. All significant
intercompany accounts and transactions have been eliminated in consolidation.
Use of Estimates
The preparation of the consolidated financial
statements in conformity with U.S. generally accepted accounting principles
requires management to make estimates, judgments, or assumptions that could have
a material effect on the carrying value of certain assets and liabilities. These
estimates, judgments, and assumptions affect the amounts reported in the
consolidated financial statements and the disclosures provided. The
determination of the allowance for losses on loans, the accounting for income
tax expense, and the determination of fair values of financial instruments are
highly dependent on management’s estimates, judgments, and assumptions where
changes in any of those could have a significant impact on the financial
statements.
Cash Flows
Cash and cash equivalents include cash,
non-interest and interest-bearing deposits in other financial institutions with
terms of less than 90 days, and federal funds sold. Generally, federal funds
sold are purchased and sold for one-day periods. Net cash flows are reported for
client loan and deposit transactions, interest-bearing deposits in other
financial institutions and federal funds sold.
Effective October 3, 2008, the FDIC’s
insurance limits increased to $250,000. The increase in federally insured limits
is currently set to expire December 31, 2013. At December 31, 2009, the
Company’s interest-bearing accounts exceeded federally insured limits by
approximately $11.4 million.
The Company had approximately $370,000 on
deposit with the Federal Reserve Bank and the Federal Home Loan Bank at December
31, 2009. These amounts are not insured by the FDIC.
66
CFS BANCORP, INC.
NOTES TO CONSOLIDATED FINANCIAL STATEMENTS –
(Continued)
Securities
Under Accounting Standards Codification
(ASC) 320-10, Investments – Debt and Equity Securities (ASC 320-10)
investment securities must be classified as held-to-maturity, available-for-sale
or trading. Management determines the appropriate classification at the time of
purchase. Debt securities are classified as held-to-maturity and carried at
amortized cost when management has the positive intent and the Company has the
ability to hold the securities to maturity. Securities not classified as
held-to-maturity are classified as available-for-sale and are carried at fair
value, with the unrealized holding gains and losses, net of tax, reported in
other comprehensive income and not affecting earnings until realized. Other
securities, such as Federal Home Loan Bank stock, are carried at cost. The
Company has no trading account securities.
Interest income includes amortization of
purchase premiums or discounts. The amortized cost of debt securities is
adjusted for amortization of premiums and accretion of discounts to maturity, or
in the case of mortgage-related securities, over the estimated life of the
security using the level-yield method. Gains and losses on sales are recorded on
the trade date and determined using the specific identification method.
The fair values of the Company’s securities
are generally determined by reference to quoted prices from reliable independent
sources utilizing observable inputs. Certain of the fair values of securities
are determined using models whose significant value drivers or assumptions are
unobservable and are significant to the fair value of the securities. These
models are utilized when quoted prices are not available for certain securities
or in markets where trading activity has slowed or ceased. When quoted prices
are not available and are not provided by third-party pricing services,
management’s judgment is necessary to determine fair value. As such, fair value
is determined using discounted cash flow analysis models, incorporating default
rates, estimation of prepayment characteristics, and implied
volatilities.
The Company evaluates all securities on a
quarterly basis, and more frequently when economic conditions warrant additional
evaluations, for determining if an other-than-temporary impairment (OTTI) exists
pursuant to guidelines established in ASC 320-10. In evaluating the possible
impairment of securities, consideration is given to the length of time and the
extent to which the fair value has been less than cost, the financial conditions
and near-term prospects of the issuer, and the Company’s ability and intent to
retain its investment in the issuer for a period of time sufficient to allow for
any anticipated recovery in fair value. In analyzing an issuer’s financial
condition, the Company may consider whether the securities are issued by the
federal government or its agencies or government sponsored agencies, whether
downgrades by bond rating agencies have occurred, and the results of reviews of
the issuer’s financial condition.
If management determines that an investment
experienced an OTTI, management must then determine the amount of the OTTI to be
recognized in earnings. If management does not intend to sell the security and
it is more likely than not that the Company will not be required to sell the
security before recovery of its amortized cost basis less any current period
loss, the OTTI will be separated into the amount representing the credit loss
and the amount related to all other factors. The amount of the OTTI related to
the credit loss is determined based on the present value of cash flows expected
to be collected and is recognized in earnings. The amount of the OTTI related to
other factors will be recognized in other comprehensive income, net of
applicable taxes. The previous amortized cost basis less the OTTI recognized in
earnings will become the new amortized cost basis of the investment. If
management intends to sell the security or it is more likely than not the
Company will be required to sell the security before recovery of its amortized
cost basis less any current period credit loss, the OTTI will be recognized in
earnings equal to the entire difference between the investment’s amortized cost
basis and its fair value at the balance sheet date. Any recoveries related to
the value of these securities are recorded as an unrealized gain (as other
comprehensive income (loss) in shareholders’ equity) and not recognized in
income until the security is ultimately sold. From time to time management may
dispose of an impaired security in response to asset/liability management
decisions, future market movements, business plan changes, or if the net
proceeds can be reinvested at a rate of return that is expected to recover the
loss within a reasonable period of time.
67
CFS BANCORP, INC.
NOTES TO CONSOLIDATED FINANCIAL STATEMENTS –
(Continued)
Loans
Loans that management has the ability and
intent to hold for the foreseeable future or until maturity or payoff are
reported at the principal balance outstanding, net of deferred loan fees and
costs, and portions charged-off. Interest income on loans is accrued on the
active unpaid principal balance. Loans held-for-sale, if any, are carried at the
lower of aggregate cost or estimated market value.
Interest income is generally not accrued on
loans which are delinquent 90 days or more, or for loans which management
believes, after giving consideration to economic and business conditions and
collection efforts, collection of interest is doubtful. Past due status is based
on the contractual terms of the loan. In all cases, loans are placed on
non-accrual or charged-off at an earlier date if collection of principal or
interest is considered doubtful.
All interest accrued but not received for
loans placed on non-accrual is reversed against interest income. Interest
subsequently received on such loans is accounted for by using the cost-recovery
basis for commercial loans and the cash-basis for retail loans until qualifying
for return to accrual.
Loan Fees and Costs
Loan origination and commitment fees and
direct loan origination costs are deferred and amortized as an adjustment of the
related loan’s yield. The Company accretes these amounts over the contractual
life of the related loans. Remaining deferred loan fees and costs are reflected
in interest income upon sale or repayment of the loan.
Allowance for Losses on
Loans
The Company maintains an allowance for losses
on loans at a level management believes is sufficient to absorb credit losses
inherent in the loan portfolio. The allowance for losses on loans represents the
Company’s estimate of probable incurred losses in the loan portfolio at each
statement of condition date and is based on the review of available and relevant
information.
The first component of the allowance for
losses on loans contains allocations for probable incurred losses that have been
identified related to impaired loans pursuant to ASC 310-10, Receivables. The
Company individually evaluates for impairment all loans over $1.0 million that
are classified substandard. Loans are considered impaired when, based on current
information and events it is probable that the borrower will not be able to
fulfill its obligation according to the contractual terms of the loan agreement.
The impairment loss, if any, is generally measured based on the present value of
expected cash flows discounted at the loan’s effective interest rate. As a
practical expedient, impairment may be measured based on the loan’s observable
market price or the fair value of the collateral, if the loan is
collateral-dependent. A loan is considered collateral-dependent when the
repayment of the loan will be provided solely by the underlying collateral and
there are no other available and reliable sources of repayment. If management
determines a loan is collateral-dependent, management will charge-off any
identified collateral shortfall against the allowance for losses on loans.
If foreclosure is probable, the Company is
required to measure the impairment based on the fair value of the collateral.
The fair value of the collateral is generally obtained from appraisals or
estimated using an appraisal-like methodology. When current appraisals are not
available, management estimates the fair value of the collateral giving
consideration to several factors including the price at which individual unit(s)
could be sold in the current market, the period of time over which the unit(s)
would be sold, the estimated cost to complete the unit(s), the risks associated
with completing and selling the unit(s), the required return on the investment a
potential acquirer may have, and current market interest rates. The analysis on
each loan involves a high degree of judgment in estimating the amount of the
loss associated with the loan, including the estimation of the amount and timing
of future cash flows and collateral values.
The second component of the Company’s
allowance for losses on loans contains allocations for probable incurred losses
within various pools of loans with similar characteristics pursuant to ASC
450-10, Contingencies. This component is based in part on certain
loss factors applied to various stratified loan pools excluding loans evaluated
individually for impairment. In determining the appropriate loss factors for
these loan pools, management considers historical charge-offs and recoveries;
levels of and trends in delinquencies,
impaired loans, and other classified loans; concentrations of credit within the
commercial loan portfolios; volume and type of lending; and current and
anticipated economic conditions.
68
CFS BANCORP, INC.
NOTES TO CONSOLIDATED FINANCIAL STATEMENTS –
(Continued)
Loan losses are charged-off against the
allowance when the loan balance or a portion of the loan balance is no longer
covered by the paying capacity of the borrower based on an evaluation of
available cash resources and collateral value, while recoveries of amounts
previously charged-off are credited to the allowance. The Company assesses the
adequacy of the allowance for losses on loans on a quarterly basis and adjusts
the allowance for losses on loans by recording a provision for losses on loans
in an amount sufficient to maintain the allowance at a level deemed appropriate
by management. The evaluation of the adequacy of the allowance for losses on
loans is inherently subjective as it requires estimates that are susceptible to
significant revision as more information becomes available or as future events
occur. To the extent that actual outcomes differ from management estimates, an
additional provision for losses on loans could be required which could adversely
affect earnings or the Company’s financial position in future periods. The
Office of Thrift Supervision (OTS) could require
the Bank to make additional provisions for losses on loans.
Other Real Estate Owned
Other real estate owned is comprised of
property acquired through a foreclosure proceeding or acceptance of a
deed-in-lieu of foreclosure and loans identified as in-substance foreclosures. A
loan is classified as an in-substance foreclosure when the Company has taken
possession of the collateral regardless of whether formal foreclosure
proceedings have taken place. Other real estate owned is initially recorded at
fair value less estimated selling costs, with any resulting write-down charged
to the allowance for losses on loans. Valuations are periodically (but no less
than annually) performed by management, with any subsequent declines in
estimated fair value charged to expense.
Office Properties and
Equipment
Land is carried at cost. Office properties and
equipment are stated at cost less accumulated depreciation. Buildings and
related components are depreciated using the straight-line method with useful
lives ranging from 30 to 40 years. Furniture, fixtures, and equipment are
depreciated using the straight-line method with useful lives ranging from 3 to
15 years. Leasehold improvements are amortized over the life of the
lease.
Bank-Owned Life Insurance
The Bank has purchased life insurance policies
on certain of its employees. Bank-owned life insurance is recorded at its cash
surrender value, or the amount that can be realized.
Long-Term Assets
Office properties and equipment and other
long-term assets are reviewed for impairment when events indicate their carrying
amount may not be recoverable from future undiscounted cash flows. If impaired,
the assets are recorded at fair value with the loss recorded in other
non-interest expense.
Loan Commitments and Related Financial
Instruments
Financial instruments include
off-balance-sheet credit instruments, such as commitments to make loans and
commercial letters of credit issued to meet client financing needs. The face
amount for these items represents the exposure to loss, before considering the
client’s collateral or their ability to repay. These financial instruments are
recorded when they are funded.
69
CFS BANCORP, INC.
NOTES TO CONSOLIDATED FINANCIAL STATEMENTS –
(Continued)
Share-Based Compensation
The Company accounts for its share-based
compensation plans in accordance with ASC 718-10, Compensation – Stock Based Compensation. ASC 718-10 addresses all forms of
share-based payment awards, including shares under employee stock purchase
plans, stock options, restricted stock, and stock appreciation rights. ASC
718-10 requires all share-based payments to be recognized as expense, based upon
their fair values, in the financial statements over the vesting period of the
awards. For additional details on the Company’s share-based compensation plans
and related disclosures, see Note 9 to the consolidated financial
statements.
Income Taxes
Income tax expense is the total of the current
year income tax due or refundable and the change in deferred tax assets and
liabilities. Deferred tax assets and liabilities are the expected future tax
amounts for the temporary differences between carrying amounts and tax bases of
assets and liabilities, computed using enacted tax rates. Valuation allowances
are established when necessary to reduce deferred tax assets to an amount
expected to be realized. Deferred tax assets are recognized for net operating
losses that expire between 2016 and 2029 because the benefit is more likely than
not to be realized.
Employee Stock Ownership
Plan
The Bank sponsors the CFS Bancorp, Inc.
Employee Stock Ownership Plan (ESOP) which is
accounted for in accordance with ASC 718-40, Compensation – Employee Stock Ownership Plans. The cost of shares issued to the ESOP but
not yet allocated to participants is shown as a reduction of shareholders’
equity. Prior to 2009, contributions from the Bank and dividends on both
allocated and unallocated shares in the ESOP were used to service the ESOP’s
debt to the Company. Beginning in 2009, dividends are allocated to the
individual participants who can elect to either reinvest the dividends in
Company stock or receive cash payment at the end of each plan year. The number
of shares released was based on the amount of principal and interest paid to
service the ESOP loan. Compensation expense was recognized on shares committed
to be released from the Bank’s contributions and from shares released from
dividends on unallocated shares using the current market price of these shares.
ESOP shares not committed to be released were not considered outstanding for
purposes of computing earnings per share. During 2009, the Bank repaid the ESOP
loan in full so that it is no longer leveraged.
Earnings Per Share
Basic earnings per common share (EPS) is computed by
dividing net income by the weighted-average number of common shares outstanding
during the year. ESOP shares not committed to be released, restricted stock
shares which have not vested, and shares held in Rabbi Trust accounts are not
considered to be outstanding for purposes of calculating basic EPS. Diluted EPS
is computed by dividing net income by the average number of common shares
outstanding during the year and includes the dilutive effect of stock options,
unearned restricted stock awards, and treasury shares held in Rabbi Trust
accounts pursuant to deferred compensation plans. The dilutive common stock
equivalents are computed based on the treasury stock method using the average
market price for the year.
Comprehensive Income
(Loss)
Comprehensive income (loss) consists of net
income (loss) and other comprehensive income (loss). Other comprehensive income
(loss) includes unrealized gains and losses on securities available-for-sale
which are also recognized as separate components of equity.
Recent Accounting
Pronouncements
In June 2009, the Financial Accounting
Standards Board (FASB) approved the Financial Accounting Standards
Board Accounting Standards Codification (Codification) as
the single source for authoritative nongovernmental U.S. Generally Accepted
Accounting Principles (U.S. GAAP). The
Codification does not change current U.S. GAAP but is intended to simplify user
access to all authoritative U.S. GAAP by providing all the authoritative
literature related to a particular topic in one place. Rules and interpretative
releases of the Securities and Exchange Commission (SEC) under
authority of federal securities laws are also sources of authoritative U.S. GAAP
for SEC registrants. The Codification was effective for the Company during its
interim period ending September 30, 2009 and did not have a material impact on
its financial condition, results of operations, or its financial reporting
process.
70
CFS BANCORP, INC.
NOTES TO CONSOLIDATED FINANCIAL STATEMENTS –
(Continued)
On January 1, 2009, the Company adopted ASC
810-10, Consolidation. This standard establishes accounting and
reporting standards for the noncontrolling interest in a subsidiary and for the
deconsolidation of a subsidiary. The standard clarifies that a noncontrolling
interest in a subsidiary is an ownership interest in the consolidated entity
that should be reported as equity in the consolidated financial statements and
requires retroactive adoption of the presentation and disclosure requirements
for existing minority interests. All other requirements of the standard shall be
applied prospectively. The adoption of the standard did not have any effect on
the Company’s consolidated financial results.
In April 2009, the FASB issued ASC 820,
Fair Value Measurements and
Disclosures. This standard
provides additional guidance for estimating fair value in accordance with ASC
820 when the volume and level of market activity for the asset or liability have
significantly decreased. This standard also includes guidance on identifying
circumstances that indicate a transaction is not orderly. This standard
emphasizes that the notation of exit price in an orderly transaction (that is,
not a forced liquidation or distressed sale) between market participants at the
measurement date under current market conditions remains unchanged. The Company
adopted this standard as of June 30, 2009 with no significant change to the
Company’s financial condition or results of operations.
In April 2009, the FASB issued ASC
320, Investments – Debt and Equity
Securities. This standard
applies to debt securities and requires entities to separate an OTTI of a debt
security into two components when there are credit related losses associated
with the impaired debt security for which management asserts that it does not
have the intent to sell the security, and it is more likely than not that
management will not be required to sell the security before recovery of its cost
basis. The amount of the OTTI related to a credit loss is recognized in
earnings, and the amount of the OTTI related to other factors is recorded in
other comprehensive loss. This standard is to be applied prospectively with a
cumulative effect transition adjustment, if applicable, as of the beginning of
the period in which it is adopted. The Company adopted this standard as of June
30, 2009 with no significant change to the Company’s financial condition or
results of operations.
In April 2009, the FASB issued ASC 825,
Financial Instruments. This standard requires certain disclosures
about fair value of financial instruments in interim financial statements of
publicly traded companies as well as in annual financial statements. This
standard requires disclosures of the method(s) and significant assumptions used
to estimate the fair value of financial instruments and changes in method(s) and
significant assumptions, if any, during the period. This standard also amends
ASC 270, Interim Reporting, to require the related disclosures in all
interim financial statements. The standard requires an entity to disclose in the
body or in the accompanying footnotes of its interim financial statements and
its annual financial statements the fair value of all financial instruments,
whether recognized or not recognized in the consolidated balance sheet. The
standard also requires entities to disclose the methods and significant
assumptions used to estimate the fair value of financial instruments, and to
disclose significant changes in methods or assumptions used to estimate fair
values. The standard was effective for the Company beginning with the quarter
ended June 30, 2009. Since the provisions of the standard are disclosure
related, the Company’s adoption of this standard did not have an impact on its
financial condition or results of operations. See related disclosure in Note
15.
In May 2009, the FASB issued ASC 855,
Subsequent Events. This standard establishes general standards
of accounting for and disclosures of events that occur after the balance sheet
date but before financial statements are issued or are available to be issued.
It requires entities to disclose the date through which it has evaluated
subsequent events and the basis for that date. Management must perform its
assessment of subsequent events for both interim and annual financial reporting
periods. The standard was effective for the Company beginning with the quarter
ended June 30, 2009. The adoption of the standard did not have a significant
impact on our financial condition, results of operations, or
disclosures.
In June 2009, the FASB issued Statement No.
166, Accounting for Transfers of Financial Assets,
an Amendment of FASB Statement No. 140, (SFAS 166) which
pertains to securitizations. SFAS 166, which amends SFAS 140, will require more
information about transfers of financial assets, including securitization
transactions, and where entities have continued exposure to the risks related to
transferred assets. SFAS 166 is effective for the first fiscal year beginning
after November 15, 2009. The Company will adopt this standard effective January
1, 2010 and believes it will not have a material effect on its financial
position or results of operations.
71
CFS BANCORP, INC.
NOTES TO CONSOLIDATED FINANCIAL STATEMENTS –
(Continued)
In June 2009, the FASB issued Statement No.
167, Amendments to FASB Interpretation No.
46(R), (SFAS 167) which
pertains to special purpose entities. SFAS 167, which amends FASB Interpretation
46(R), replaces the quantitative-based risks and rewards calculation for
determining which enterprise, if any, has a controlling financial interest in a
variable interest entity with a qualitative approach focused on identifying
which enterprise has the power to direct the activities of a variable interest
entity. SFAS 167 is effective for the first fiscal year beginning after November
15, 2009. The Company will adopt this standard effective January 1, 2010. The
Company does not have any special purpose entities and believes the adoption of
this standard will not have a material effect on its financial position or
results of operations.
Loss Contingencies
Loss contingencies, including claims and legal
actions arising in the ordinary course of business, are recorded as liabilities
when the likelihood of loss is probable and an amount or range of loss can be
reasonably estimated. Management does not believe there are such matters that
will have a material effect on the financial statements.
Restrictions on Cash
Cash on hand or on deposit with the Federal
Reserve Bank of $791,000 and $759,000 was required to be maintained in order to
meet regulatory reserve and clearing requirements as of December 31, 2009 and
2008, respectively.
Fair Value of Financial
Instruments
Fair values of financial instruments are
estimated using relevant market information and other assumptions, as more fully
disclosed in Note 15 below. Fair value estimates involve uncertainties and
matters of significant judgment regarding interest rates, credit risk,
prepayments, and other factors, especially in the absence of broad markets for
particular items. Changes in assumptions or in market conditions could
significantly affect the estimates.
Segment Reporting
Operating segments are components of a
business about which separate financial information is available and that are
evaluated regularly by the chief operating decision-maker in deciding how to
allocate resources and assess performance. Public companies are required to
report certain financial information about operating segments in interim and
annual financial statements. Senior management evaluates the operations of the
Company as one operating segment, community banking, due to the materiality of
the banking operation to the Company’s financial condition and results of
operations, taken as a whole. As a result, separate segment disclosures are not
required. The Company offers the following products and services to its external
clients: deposits and loans as well as investment services through an outsource
partner. Revenues for significant products and services are disclosed separately
in the consolidated statements of operations.
Reclassifications
Some items in the prior year
financial statements were reclassified to conform to the current
presentation.
72
CFS BANCORP,
INC.
NOTES TO CONSOLIDATED FINANCIAL STATEMENTS –
(Continued)
2. SECURITIES
The amortized cost of
securities available-for-sale and their fair values are as follows:
| Gross | Gross | |||||||||||||||
| Par | Amortized | Unrealized | Unrealized | Fair | ||||||||||||
| Value | Cost | Gains | Losses | Value | ||||||||||||
| (Dollars in thousands) | ||||||||||||||||
| At December 31, 2009: | ||||||||||||||||
| Government sponsored entity (GSE) | ||||||||||||||||
| securities | $ | 40,450 | $ | 40,374 | $ | 1,083 | $ | — | $ | 41,457 | ||||||
| Mortgage-backed securities | 9,527 | 9,426 | 409 | — | 9,835 | |||||||||||
| Collateralized mortgage obligations | 67,307 | 66,413 | 1,336 | (981 | ) | 66,768 | ||||||||||
| Commercial mortgage-backed securities | 49,722 | 49,210 | 1,347 | (35 | ) | 50,522 | ||||||||||
| Pooled trust preferred securities | 30,223 | 27,093 | — | (7,081 | ) | 20,012 | ||||||||||
| Equity securities | 5,837 | — | 187 | — | 187 | |||||||||||
| $ | 203,066 | $ | 192,516 | $ | 4,362 | $ | (8,097 | ) | $ | 188,781 | ||||||
| Gross | Gross | |||||||||||||||
| Par | Amortized | Unrealized | Unrealized | Fair | ||||||||||||
| Value | Cost | Gains | Losses | Value | ||||||||||||
| (Dollars in thousands) | ||||||||||||||||
| At December 31, 2008: | ||||||||||||||||
| Government sponsored entity (GSE) | ||||||||||||||||
| securities | $ | 98,400 | $ | 97,987 | $ | 4,358 | $ | — | $ | 102,345 | ||||||
| Mortgage-backed securities | 10,881 | 10,774 | 83 | (1 | ) | 10,856 | ||||||||||
| Collateralized mortgage obligations | 78,276 | 76,506 | 919 | (1,882 | ) | 75,543 | ||||||||||
| Commercial mortgage-backed securities | 40,511 | 39,669 | 203 | (1,479 | ) | 38,393 | ||||||||||
| Pooled trust preferred securities | 30,966 | 27,668 | — | (3,535 | ) | 24,133 | ||||||||||
| Equity securities | 5,837 | — | — | — | — | |||||||||||
| $ | 264,871 | $ | 252,604 | $ | 5,563 | $ | (6,897 | ) | $ | 251,270 | ||||||
The Company’s
held-to-maturity securities had an amortized cost of $5.0 million and $6.9
million, respectively, at December 31, 2009 and 2008 with $179,000 and $161,000,
respectively, of gross unrealized holding gains.
Securities with
unrealized losses as of December 31, 2009 and 2008, aggregated by investment
category and length of time that individual securities have been in a continuous
unrealized loss position, are presented in the following tables.
| December 31, 2009 | |||||||||||||||||||||
| Less than 12 Months | 12 Months or More | Total | |||||||||||||||||||
| Fair | Unrealized | Fair | Unrealized | Fair | Unrealized | ||||||||||||||||
| Value | Losses | Value | Losses | Value | Losses | ||||||||||||||||
| (Dollars in thousands) | |||||||||||||||||||||
| Collateralized mortgage obligations | $ | 12,461 | $ | (201 | ) | $ | 14,764 | $ | (780 | ) | $ | 27,225 | $ | (981 | ) | ||||||
| Commercial mortgage-backed securities | 1,598 | (35 | ) | — | — | 1,598 | (35 | ) | |||||||||||||
| Pooled trust preferred securities | — | — | 20,012 | (7,081 | ) | 20,012 | (7,081 | ) | |||||||||||||
| $ | 14,059 | $ | (236 | ) | $ | 34,776 | $ | (7,861 | ) | $ | 48,835 | $ | (8,097 | ) | |||||||
73
CFS BANCORP,
INC.
NOTES TO CONSOLIDATED FINANCIAL STATEMENTS –
(Continued)
| December 31, 2008 | |||||||||||||||||||||
| Less than 12 Months | 12 Months or More | Total | |||||||||||||||||||
| Fair | Unrealized | Fair | Unrealized | Fair | Unrealized | ||||||||||||||||
| Value | Losses | Value | Losses | Value | Losses | ||||||||||||||||
| (Dollars in thousands) | |||||||||||||||||||||
| Mortgage-backed securities | $ | 927 | $ | (1 | ) | $ | — | $ | — | $ | 927 | $ | (1 | ) | |||||||
| Collateralized mortgage obligations | 43,096 | (1,868 | ) | 108 | (15 | ) | 43,204 | (1,883 | ) | ||||||||||||
| Commercial mortgage-backed securities | 31,792 | (1,478 | ) | — | — | 31,792 | (1,478 | ) | |||||||||||||
| Pooled trust preferred securities | 24,133 | (3,535 | ) | — | — | 24,133 | (3,535 | ) | |||||||||||||
| $ | 99,948 | $ | (6,882 | ) | $ | 108 | $ | (15 | ) | $ | 100,056 | $ | (6,897 | ) | |||||||
On a quarterly
basis, the Company evaluates securities available-for-sale with significant
declines in fair value to determine whether they should be considered
other-than-temporarily impaired. Current accounting guidance generally provides
that if a marketable security is in an unrealized loss position, whether due to
general market conditions or industry or issuer-specific factors, the holder of
the securities must assess whether the impairment is
other-than-temporary.
At December 31,
2009, the Company’s collateralized mortgage obligations consisted of both agency
and non-agency securities. In management’s belief, the unrealized loss position
on the collateralized mortgage obligations were due to changes in market
interest rates combined with an illiquid fixed-income market and not due to
credit quality or other issuer specific factors.
At December 31,
2009, the Company’s pooled trust securities consisted of “Super Senior”
securities backed by senior securities issued mainly by bank and thrift holding
companies. Due to the structure of the securities, as deferrals and defaults on
the underlying collateral increase, cash flows are increasingly diverted from
mezzanine and subordinate tranches to pay down principal on the “Super Senior”
tranches. In management’s belief, the unrealized loss position on the pooled
trust preferred securities were primarily due to changes in market interest
rates combined with an illiquid fixed-income market and not due to credit
quality or other issuer specific factors.
The Company does
not have the intent to sell these securities in an unrealized loss position, and
it is more likely than not these securities will not be sold prior to recovery
of amortized cost; however, the Company may from time to time dispose of an
impaired security in response to asset/liability management decisions, future
market movements, business plan changes, or if the net proceeds could be
reinvested at a rate of return that is expected to recover the loss within a
reasonable period of time. The Company concluded that the unrealized losses that
existed at December 31, 2009, did not constitute other-than-temporary
impairments.
The amortized cost
and fair value of securities at December 31, 2009, by contractual maturity, are
shown in the tables below. Expected maturities may differ from contractual
maturities because issuers may have the right to call or prepay obligations with
or without call or prepayment penalties. Securities not due at a single maturity
date are shown separately.
| Available-for-Sale | ||||||
| Amortized | ||||||
| Cost | Fair Value | |||||
| (Dollars in thousands) | ||||||
| GSE and callable GSE securities: | ||||||
| Due in one year or less | $ | 33,582 | $ | 34,288 | ||
| Due after one year through five years | 6,792 | 7,169 | ||||
| Mortgage-backed securities | 9,426 | 9,835 | ||||
| Collateralized mortgage obligations | 66,413 | 66,768 | ||||
| Commercial mortgage-backed securities | 49,210 | 50,522 | ||||
| Pooled trust preferred securities | 27,093 | 20,012 | ||||
| Equity securities | — | 187 | ||||
| $ | 192,516 | $ | 188,781 | |||
74
CFS BANCORP,
INC.
NOTES TO CONSOLIDATED FINANCIAL STATEMENTS –
(Continued)
| Held-to-Maturity | ||||||
| Amortized | ||||||
| Cost | Fair Value | |||||
| (Dollars in thousands) | ||||||
| State and municipal securities: | ||||||
| Due in one year or less | $ | 2,000 | $ | 2,036 | ||
| Due after one year through five years | 3,000 | 3,143 | ||||
| $ | 5,000 | $ | 5,179 | |||
The following
table provides information as to the amount of gross gains and losses realized
through the sales of available-for-sale securities:
| 2009 | 2008 | 2007 | |||||||||
| (Dollars in thousands) | |||||||||||
| Available-for-sale securities: | |||||||||||
| Gross realized gains | $ | 1,092 | $ | 69 | $ | 762 | |||||
| Gross realized losses | — | — | (226 | ) | |||||||
| Impairment losses | — | (4,334 | ) | — | |||||||
| Net realized gains (losses) | $ | 1,092 | $ | (4,265 | ) | $ | 536 | ||||
| Income tax expense (benefit) on realized gains (losses) | $ | 393 | $ | (1,594 | ) | $ | 200 | ||||
The impairment
losses in 2008 were recognized on the Company’s investment in Fannie Mae and
Freddie Mac preferred stock when the United States Treasury Department and the
Federal Housing Finance Authority placed Fannie Mae and Freddie Mac into
conservatorship.
The carrying value
of securities pledged as collateral to secure public deposits and for other
purposes was $58.8 million and $63.0 million, respectively, at December 31, 2009
and 2008. As of December 31, 2009 and 2008, there were no holdings of securities
of any one issuer, other than the U.S. Government, its agencies, and GSEs, in an
amount greater than 10% of shareholders’ equity.
3. LOANS RECEIVABLE
Loans receivable, net of unearned
fees, consist of the following:
| December 31, | ||||||
| 2009 | 2008 | |||||
| (Dollars in thousands) | ||||||
| Commercial loans: | ||||||
| Commercial and industrial | $ | 78,600 | $ | 64,021 | ||
| Commercial real estate – owner occupied | 99,559 | 85,565 | ||||
| Commercial real estate – non-owner occupied | 218,329 | 222,048 | ||||
| Commercial real estate – multifamily | 63,008 | 40,503 | ||||
| Commercial construction and land development | 55,733 | 70,848 | ||||
| Total commercial loans | 515,229 | 482,985 | ||||
| Retail loans: | ||||||
| One-to-four family residential | 185,293 | 203,797 | ||||
| Home equity lines of credit | 56,911 | 58,918 | ||||
| Retail construction and land development | 3,401 | 2,650 | ||||
| Other | 1,552 | 1,623 | ||||
| Total retail loans | 247,157 | 266,988 | ||||
| Total loans receivable, net of unearned fees | $ | 762,386 | $ | 749,973 | ||
75
CFS BANCORP, INC.
NOTES TO CONSOLIDATED FINANCIAL STATEMENTS –
(Continued)
The Bank’s lending activities have been
concentrated primarily within its market area as well as the mid-western United
States. At December 31, 2009, the Bank had a concentration of loans secured by
office and/or warehouse buildings totaling $218.2 million or 28.6% of its total
loan portfolio.
At December 31, 2009 and 2008, the
Company did not have any loans held for sale.
At December 31, 2009 and 2008, the Company
serviced $22.5 million and $22.9 million, respectively, of loans for others
including one-to-four family mortgages and commercial participations
sold.
Activity in the allowance for losses
on loans is summarized as follows:
| Year Ended December 31, | ||||||||||||
| 2009 | 2008 | 2007 | ||||||||||
| (Dollars in thousands) | ||||||||||||
| Balance at beginning of year | $ | 15,558 | $ | 8,026 | $ | 11,184 | ||||||
| Loans charged-off | (8,970 | ) | (18,898 | ) | (5,676 | ) | ||||||
| Recoveries of loans previously charged-off | 285 | 134 | 190 | |||||||||
| Net loans charged-off | (8,685 | ) | (18,764 | ) | (5,486 | ) | ||||||
| Provision for losses on loans | 12,588 | 26,296 | 2,328 | |||||||||
| Balance at end of year | $ | 19,461 | $ | 15,558 | $ | 8,026 | ||||||
Total non-accrual loans and loans 90
days past due and still accruing were as follows at the dates
indicated:
| December 31, | ||||||
| 2009 | 2008 | |||||
| (Dollars in thousands) | ||||||
| Total non-accrual loans | $ | 59,009 | $ | 54,701 | ||
| Loans past due 90 days and still accruing interest | $ | 640 | $ | 605 | ||
Impaired loans were as follows at
the dates indicated:
| December 31, | ||||||
| 2009 | 2008 | |||||
| (Dollars in thousands) | ||||||
| Impaired loans: | ||||||
| With a valuation reserve | $ | 17,200 | $ | 20,219 | ||
| With no valuation reserve required | 42,021 | 27,259 | ||||
| Total impaired loans | $ | 59,221 | $ | 47,478 | ||
| Valuation reserve relating to impaired loans | $ | 9,181 | $ | 5,930 | ||
| Average impaired loans during year | 48,547 | 32,676 | ||||
| Interest income recognized during impairment | — | 54 | ||||
| Cash-basis interest income recognized during impairment | — | 54 | ||||
At December 31, 2009, the Company had $10.2
million of loan modifications meeting the definition of a troubled debt
restructuring (TDR) that were
performing in accordance with their agreements and accruing interest that are
included above in our impaired loans with no valuation reserve required. The
modified loans include one commercial and industrial relationship totaling $5.7
million, one non-owner occupied commercial real estate relationship totaling
$2.9 million, and ten one-to-four family residential loans totaling $1.6
million. The loan modifications included short-term extensions of maturity,
interest only payments or payment modifications to better match the timing of
cash flows due under the modified terms with the cash flows from the borrowers’
operations.
76
CFS BANCORP, INC.
NOTES TO CONSOLIDATED FINANCIAL STATEMENTS –
(Continued)
4. OFFICE PROPERTIES AND
EQUIPMENT
Office properties and equipment are
summarized as follows:
| Estimated | December 31, | |||||||
| Useful Lives | 2009 | 2008 | ||||||
| (Dollars in thousands) | ||||||||
| Land | — | $ | 5,095 | $ | 5,095 | |||
| Buildings | 30-40 years | 20,876 | 19,640 | |||||
| Leasehold improvements | 1-5 years | 1,368 | 1,522 | |||||
| Furniture and equipment | 3-15 years | 13,246 | 13,880 | |||||
| Construction in progress | — | 858 | 756 | |||||
| 41,443 | 40,893 | |||||||
| Less: accumulated depreciation and amortization | 21,061 | 21,103 | ||||||
| $ | 20,382 | $ | 19,790 | |||||
Depreciation expense charged to operations for
the years ended 2009, 2008, and 2007, was $1.6 million, $1.7 million, and $1.6
million, respectively.
Operating Leases
At December 31, 2009, the Company was
obligated under certain noncancelable operating leases for premises and
equipment, which expire at various dates through the year 2029. Many of these
leases contain renewal options, and certain leases provide options to purchase
the leased property during or at the expiration of the lease period at specific
prices. Some leases contain escalation clauses calling for rentals to be
adjusted for increased real estate taxes and other operating expenses, or
proportionately adjusted for increases in the consumer or other price
indices.
The following summary reflects the future
minimum rental payments, by year, required under operating leases that, as of
December 31, 2009, have initial or remaining noncancelable lease terms in excess
of one year.
| (Dollars in thousands) | |||
| Year Ended December 31: | |||
| 2010 | $ | 437 | |
| 2011 | 262 | ||
| 2012 | 218 | ||
| 2013 | 171 | ||
| 2014 | 122 | ||
| Thereafter | 2,129 | ||
| $ | 3,339 | ||
Rental expense charged to operations in 2009,
2008, and 2007, totaled $557,000, $591,000, and $584,000, respectively,
including amounts paid under short-term cancelable leases.
5. GOODWILL AND INTANGIBLE
ASSETS
As of December 31, 2007, the Company had $1.2
million of goodwill which was acquired through the Company’s 2003 acquisition of
a bank branch in Illinois. Pursuant to ASC 350-20, Goodwill,
management recorded a non-cash impairment charge of $1.2 million equal to the
carrying value of the goodwill prior to the impairment charge at December 31,
2008.
77
CFS BANCORP, INC.
NOTES TO CONSOLIDATED FINANCIAL STATEMENTS –
(Continued)
The Company also acquired core deposit
intangibles in conjunction with the same bank branch acquisition. The intangible
assets acquired amounted to $325,000 in cost and were amortized over five years.
Amortization expense related to these intangibles totaled $49,000 and $65,000,
respectively, in 2008 and 2007. The intangibles were fully amortized in
2008.
6. DEPOSITS
Deposits and interest rate data are
summarized as follows:
| December 31, | ||||||||
| 2009 | 2008 | |||||||
| (Dollars in thousands) | ||||||||
| Checking accounts: | ||||||||
| Non-interest bearing | $ | 89,364 | $ | 64,809 | ||||
| Interest-bearing | 129,305 | 105,758 | ||||||
| Money market accounts | 152,009 | 163,205 | ||||||
| Savings accounts | 113,865 | 114,633 | ||||||
| Core deposits | 484,543 | 448,405 | ||||||
| Certificate of deposit accounts: | ||||||||
| One year or less | 304,163 | 325,225 | ||||||
| Over one to two years | 30,782 | 28,136 | ||||||
| Over two to three years | 15,100 | 10,151 | ||||||
| Over three to four years | 6,701 | 7,667 | ||||||
| Over four to five years | 7,680 | 3,453 | ||||||
| More than five years | 789 | 1,060 | ||||||
| Total time deposits | 365,215 | 375,692 | ||||||
| Total deposits | $ | 849,758 | $ | 824,097 | ||||
| Weighted-average cost of deposits | 1.10 | % | 1.85 | % | ||||
The aggregate amount of deposits in
denominations of $100,000 or more was $291.8 million and $268.8 million at
December 31, 2009 and 2008, respectively. The aggregate amount of deposits in
denominations of $250,000 or more was $132.9 million and $119.2 million at
December 31, 2009 and 2008, respectively.
78
CFS BANCORP,
INC.
NOTES TO CONSOLIDATED FINANCIAL STATEMENTS –
(Continued)
7. BORROWED MONEY
The Company’s borrowed money
included the following for the periods indicated:
| December 31, | |||||||||||||
| 2009 | 2008 | ||||||||||||
| Weighted | Weighted | ||||||||||||
| Average | Average | ||||||||||||
| Contractual | Contractual | ||||||||||||
| Rate | Amount | Rate | Amount | ||||||||||
| (Dollars in thousands) | |||||||||||||
| Short-term variable-rate borrowings: | |||||||||||||
| Repo Sweep accounts | 0.50 | % | $ | 15,659 | 0.82 | % | $ | 17,512 | |||||
| Federal Reserve Bank discount window | 0.50 | 8,640 | — | — | |||||||||
| Overnight Federal Funds purchased | — | — | 0.45 | 10,800 | |||||||||
| Secured advances from FHLB – Indianapolis: | |||||||||||||
| Maturing in 2009 — variable rate | — | — | 0.65 | 30,000 | |||||||||
| Maturing in 2009 — fixed rate | — | — | 2.14 | 74,000 | |||||||||
| Maturing in 2010 — variable rate | 0.47 | 6,000 | — | — | |||||||||
| Maturing in 2010 — fixed rate | 1.56 | 41,000 | 3.22 | 15,000 | |||||||||
| Maturing in 2011 — fixed rate | 3.75 | 15,000 | 3.75 | 15,000 | |||||||||
| Maturing in 2013 — fixed rate | 2.22 | 15,000 | — | — | |||||||||
| Maturing in 2014 — fixed rate (1) | 6.71 | 1,122 | 6.71 | 1,146 | |||||||||
| Maturing in 2018 — fixed rate (1) | 5.54 | 2,582 | 5.54 | 2,647 | |||||||||
| Maturing in 2019 — fixed rate (1) | 6.30 | 6,805 | 6.30 | 7,007 | |||||||||
| 87,509 | 144,800 | ||||||||||||
| Less: deferred premium on early extinguishment of debt | — | (175 | ) | ||||||||||
| Net FHLB – Indianapolis advances | 87,509 | 144,625 | |||||||||||
| Total borrowed money | 2.09 | % | $ | 111,808 | 2.13 | % | $ | 172,937 | |||||
| (1) |
These advances
are amortizing borrowings and are listed by their contractual
maturity.
|
Required principal payments of FHLB – Indianapolis (FHLB–IN) advances
are as follows:
| (Dollars in thousands) | |||
| Year Ended December 31: | |||
| 2010 | $ | 47,311 | |
| 2011 | 15,333 | ||
| 2012 | 356 | ||
| 2013 | 15,381 | ||
| 2014 | 1,380 | ||
| Thereafter | 7,748 | ||
| $ | 87,509 | ||
79
CFS BANCORP, INC.
NOTES TO CONSOLIDATED FINANCIAL STATEMENTS –
(Continued)
Pursuant to collateral agreements, FHLB–IN advances are secured by the
following assets:
| Description of Collateral | Amount Pledged | ||
| (Dollars in thousands) | |||
| FHLB-IN stock | $ | 23,944 | |
| Loans secured by residential first mortgage loans | 173,890 | ||
| Loans secured by commercial first mortgage loans | 83,949 | ||
| $ | 281,783 | ||
Repo Sweeps are treated as financings; the
obligation to repurchase securities sold is reflected as short-term borrowings.
The securities underlying these Repo Sweeps continue to be reflected as assets
of the Company. The maximum amount of Repo Sweeps outstanding during the years
ended December 31, 2009 and 2008 was $16.3 million and $36.4 million,
respectively, and the weighted-average rate paid was 0.70% and 1.55%,
respectively.
During 2004, the Company completed a
restructuring of its FHLB advances by prepaying $400.0 million of callable
fixed-rate advances with an average cost of 5.92% and an average remaining term
of 64.2 months. These prepaid advances were replaced with $325.0 million of new
non-callable FHLB advances. These new advances included an aggregate $271.0
million of non-callable fixed-rate FHLB advances with an average cost of 3.64%
and an average term of 34.3 months in a laddered portfolio with maturities
ranging from 21 to 60 months.
In conjunction with the FHLB debt
restructuring, the Company paid $42.0 million of prepayment penalties related to
the prepaid advances and recognized $9.8 million on the early extinguishment of
debt as a charge to non-interest expense during 2004. The remaining $32.2
million of prepayment penalties was deferred as an adjustment to the carrying
value of the borrowings and are recognized in interest expense as an adjustment
to the cost of the new borrowings over their remaining life. At December 31,
2009, deferred prepayment penalties relating to the 2004 FHLB debt restructure
were fully amortized.
Interest expense on borrowed money totaled
$3.3 million, $6.6 million, and $11.9 million for the years ended December 31,
2009, 2008, and 2007, respectively. Included in interest expense was $175,000,
$1.5 million, and $4.5 million, respectively, of amortization of the deferred
premium on the early extinguishment of debt for the years ended December 31,
2009, 2008, and 2007.
At December 31, 2009, the Bank had a line of
credit with a maximum of $15.0 million in secured overnight federal funds at the
federal funds market rate at the time of any borrowing. At December 31, 2009,
the Bank did not have an outstanding balance on this line. Prior to March 5,
2009, the Bank had an additional line of credit with a maximum of $15.0 million
in unsecured overnight federal funds. This line was discontinued at the
corresponding bank’s discretion. The maximum amount borrowed during the years
ended December 31, 2009 and 2008 pursuant to these lines was $21.8 million and
$19.6 million, respectively, and the weighted-average rate paid was 0.55% and
2.42%, respectively.
During the first quarter of 2009, the Bank
received approval to borrow from the Federal Reserve Bank (FRB). At December
31, 2009, the Bank had $8.6 million outstanding under this facility. During the
year ended December 31, 2009, the maximum amount borrowed from the FRB was $14.6
million and the weighted-average rate paid was 0.50%.
8. EMPLOYEE BENEFIT PLANS
The Company participates in an industry-wide,
multi-employer, defined benefit pension plan, which covers full-time employees
who have attained at least 21 years of age and completed one year of service.
Benefits were frozen under this plan effective March 1, 2003. In addition,
employees who would have been eligible after March 1, 2003 are not eligible to
enter the plan. No further benefits will accrue subsequent to the freeze and the
freeze does not reduce the benefits accrued to date.
80
CFS BANCORP, INC.
NOTES TO CONSOLIDATED FINANCIAL STATEMENTS –
(Continued)
Calculations to determine full-funding status
are made annually by the third-party plan administrator as of June 30. Pension
expense for the years ended December 31, 2009, 2008, and 2007 was $93,000,
$872,000, and $455,000, respectively. The decrease in the pension expense during
2009 was based on information the Company received from its plan administrator
with respect to its annual funding requirements. Plan specific asset and benefit
information is not available for participating associations on an individual
participant basis since each participant has an undivided interest in the plan
assets.
The Company also participates in a
single-employer defined contribution plan, which qualifies under Section 401(k)
of the Internal Revenue Code. Beginning in 2008, all employees who have attained
age 21 years are eligible to participate in this Plan after three months of
employment. Prior to 2008, employees also had to meet an eligibility requirement
of working 250 hours during a three month period.
Effective January 1, 2008, the Company matches
100% of the employee's contribution on the first 1% of the employee's
compensation, and 50% of the employee's contribution on the next 5% of the
employee's compensation. In addition, employees are able to defer up to 100% of
their compensation up to the limits imposed by the Internal Revenue Code.
Employees fully vest in the Company’s matching contribution after two years of
service. Plan expense for the years ended December 31, 2009 and 2008 was
$422,000 and $359,000, respectively. Prior to 2008, the 401(k) plan allowed for
employee contributions up to 12% of their compensation, which were then matched
equal to 50% of the first 6% of the compensation contributed. The Company’s
matching contribution for the 2007 Plan year was made to the 401(k) plan
directly in the form of a supplemental contribution during the first quarter of
2008. Plan expense for the year ended December 31, 2007 was
$267,000.
The Company provides supplemental retirement
benefits for certain senior officers. The plans provide benefits which
supplement those provided under the Company’s qualified benefit plans where an
executive’s benefit is affected by limits imposed by the Internal Revenue Code.
The Supplemental Pension Plan was frozen in 2003 along with the Company’s
qualified pension plan. There was no expense related to this plan in 2009, 2008,
and 2007.
9. SHARE-BASED
COMPENSATION
The Company accounts for its stock options in
accordance with ASC 718-10, Compensation – Stock Based Compensation (ASC 718-10). ASC
718-10 addresses all forms of share-based payment awards, including shares under
employee stock purchase plans, stock options, restricted stock, and stock
appreciation rights. ASC 718-10 requires all share-based payments to be
recognized as expense, based upon their fair values, in the financial statements
over the requisite service period of the awards.
Omnibus Equity Incentive
Plan
The Company’s 2008 Omnibus Equity Incentive
Plan (Equity Incentive Plan) authorized the issuance of 270,000 shares of
its common stock. In addition, there are 64,500 shares that had not yet been
issued or were forfeited, cancelled or unexercised at the end of the option term
under the 2003 Stock Option Plan that are available for any type of stock-based
awards in the future under the Equity Incentive Plan. No more than 25,000 shares
will be available for grant during any fiscal year to any one participant and no
more than 120,000 shares in the aggregate will be granted in any single year. At
December 31, 2009, 168,836 shares were available for future grants under the
Equity Incentive Plan.
Awards under the Equity Incentive Plan may be
subject to the achievement of performance goals based on specific business
criteria set forth in the Equity Incentive Plan. If the performance goals are
achieved, then continued service with the Company or one of its affiliates also
will generally be required before the award becomes fully vested. Awards that
are not subject to the achievement of performance goals will require continued
service with the Company or one of its affiliates for specific time periods
prior to full vesting of the award. The Compensation Committee of the Board of
Directors will determine whether an award will be subject to the achievement of
performance goals and, if so, which performance goals must be
achieved.
81
CFS BANCORP, INC.
NOTES TO CONSOLIDATED FINANCIAL STATEMENTS –
(Continued)
Restricted Stock
During 2008, the Compensation Committee
granted service- and performance-based awards under the Equity Incentive Plan. A
total of 110,926 shares of restricted stock were granted to officers, directors,
and key employees of the Company. The 2008 awards included 45,892 shares of
restricted stock as service-based awards to key employees and the Company’s
directors. The weighted-average fair market value of the restricted stock awards
granted during 2008 was $14.02 per share based on the fair market value on the
grant dates and totaled $1.6 million. The service-based 2008 restricted stock
awards vest 33%, 33%, and 34% on May 1, 2010, 2011, and 2012, respectively. The
2008 awards also included 65,034 shares of restricted stock as performance-based
awarded to officers and key employees. The performance-based awards were subject
to the Company’s achievement of its performance targets for the year ended
December 31, 2008 and were deemed unearned on January 26, 2009 by the
Compensation Committee due to the Company not meeting its performance targets
for the year ended December 31, 2008.
During 2009, the Compensation Committee
granted additional service- and performance-based awards under the Equity
Incentive Plan. A total of 119,772 shares of restricted stock were granted to
officers, directors, and key employees of the Company. The 2009 awards included
26,200 shares of service-based and 93,572 shares of performance-based awards
granted to key employees and the Company’s directors. The weighted-average fair
market value of the restricted stock awards granted during 2009 was $3.12 per
share based on the fair market value on the grant dates and totaled $373,000.
The 2009 service-based awards vest 33%, 33%, and 34% on May 1, 2011, 2012, and
2013, respectively, and the 2009 performance-based awards, if earned, will vest
in the same manner.
The expense for the restricted stock awards is
being recorded over their service period which is between 45 and 51 months from
the date of grant. The Company estimates the impact of forfeitures based on its
historical experience with previously granted restricted stock and will consider
the impact of the forfeitures when determining the amount of expense to record
for the restricted stock granted. The Company estimates the probable outcome of
achieving its performance target related to the performance-based awards and
revises the related expense accordingly. The Company reissued treasury shares to
satisfy the restricted stock awards.
The compensation expense related to restricted
stock for the years ended December 31, 2009, 2008, and 2007 totaled $192,000,
$109,000, and $35,000, respectively. At December 31, 2009, the remaining
unamortized cost of the restricted stock awards is reflected as a reduction in
additional paid-in capital and totaled $1.0 million. This cost is expected to be
recognized over a weighted-average period of 2.9 years.
The following table presents the
activity for restricted stock for the year ended December 31, 2009.
| Weighted-Average | ||||||
| Number of | Grant-Date | |||||
| Shares | Fair Value | |||||
| Unvested at December 31, 2008 | 109,452 | $ | 14.02 | |||
| Granted | 119,772 | 3.12 | ||||
| Vested | (105 | ) | 14.64 | |||
| Forfeited | (63,455 | ) | 14.27 | |||
| Unvested as of December 31, 2009 | 165,664 | $ | 6.04 | |||
Subsequent to December 31, 2009, 61,572 shares
of performance-based restricted stock granted on January 26, 2009 were deemed
unearned, and therefore, forfeited by the Compensation Committee due to the
Company meeting 32.7% of its performance targets for the year ended December 31,
2009. The Company recorded expense on the estimated earned portion of the
restricted stock shares during 2009.
On February 11, 2010, the Compensation
Committee granted awards under the Equity Incentive Plan. A total of 113,109
shares of restricted stock were granted to officers and key employees of the
Company. The grants included 71,070 shares of restricted stock as
performance-based awards to a total of 30 officers and key employees. These
awards are subject to the achievement of “core” diluted earnings per share
targets of the Company for the year ended December 31, 2010. The grants also
included 42,039 shares of restricted stock as service-based awards to 40
officers and key employees. Both the earned performance-based awards, if any,
and the service-based awards will vest as follows:
82
CFS BANCORP, INC.
NOTES TO CONSOLIDATED FINANCIAL STATEMENTS –
(Continued)
| Cumulative | |||||
| Date | Percent Vested | ||||
| May 1, 2012 | 33 | % | |||
| May 1, 2013 | 66 | ||||
| May 1, 2014 | 100 | ||||
Stock Options
The Company has stock option plans under which
shares of Company common stock are reserved for the grant of both incentive and
non-qualified stock options to directors, officers, and employees. These plans
were frozen in conjunction with the approval of the Equity Incentive Plan such
that no new awards will be made under either of these plans. The dates the stock
options are first exercisable and expire were determined by the Compensation
Committee of the Company’s Board of Directors at the time of the grant. The
exercise price of the stock options was equal to the fair market value of the
common stock on the grant date. All of the Company’s options are fully vested.
The following table presents the activity
related to options under the Company’s stock option plans for the year ended
December 31, 2009.
| Weighted- | ||||||
| Number of | Average | |||||
| Shares | Exercise Price | |||||
| Outstanding at beginning of year | 1,130,245 | $ | 12.15 | |||
| Granted | — | — | ||||
| Exercised | — | — | ||||
| Forfeited | (360,450 | ) | 10.17 | |||
| Outstanding at end of year | 769,795 | $ | 13.08 | |||
At December 31, 2009, all of the Company’s
outstanding stock options were out-of-the-money. At December 31, 2009, the
weighted-average contractual life of the Company’s outstanding stock options was
3.3 years.
There were no stock options granted
during 2009, 2008 or 2007.
There were no options exercised during 2009.
The aggregate intrinsic value of options exercised at the time of exercise
during the years ended December 31, 2008 and 2007 was $134,000 and $813,000,
respectively. Cash received from option exercises during the years ended
December 31, 2008 and 2007 totaled $830,000 and $2.8 million, respectively. The
actual tax benefit realized for the tax deduction from option exercises totaled
$46,000 and $288,000, respectively, for the years ended December 31, 2008 and
2007.
The Company reissues treasury shares
to satisfy option exercises.
Employee Stock Ownership
Plan
In 1998, the Company established the ESOP for
the employees of the Company and the Bank. The ESOP is a qualified benefit plan
under Internal Revenue Service guidelines. It covers all full-time employees who
have attained at least 21 years of age and completed one year of service. Upon
formation, the ESOP borrowed $14.3 million from the Company and purchased
1,428,300 shares of common stock. During March 2007, the Company renegotiated
the terms of the loan to the ESOP with the plan’s trustee which reduced the
interest rate from 8.50% to 4.64% and extended the term of the loan by an
additional eight years from 2009 to 2017. The modification also included event
protection if the ESOP is terminated before the new maturity date of the loan
due to a merger, sale or otherwise. In the event the ESOP is terminated due to
one of these events, employees become fully vested and any unallocated stock
will be distributed to the ESOP participants instead of being applied to the
repayment of the ESOP loan. In addition, the loan modification included a
minimum funding requirement in which the market value of Company shares released
from the ESOP suspense account must equal at least 4.1% of the aggregate
eligible compensation of ESOP participants for the plan year allocated.
83
CFS BANCORP, INC.
NOTES TO CONSOLIDATED FINANCIAL STATEMENTS –
(Continued)
The Bank made contributions to the ESOP in
order to pay down the outstanding loan totaling $1.2 million, $3.1 million, and
$514,000 during the years 2009, 2008, and 2007, respectively. During 2008, the
Company increased its contributions to pay down the outstanding ESOP loan to
satisfy the above mentioned minimum funding requirement and to minimize the
impact of this funding requirement in 2009. During 2009, the ESOP loan was paid
in full and the remaining 83,519 shares were allocated to the participants.
Compensation expense related to the Company’s ESOP was $235,000, $853,000, and
$288,000, respectively, for the years ended December 31, 2009, 2008, and 2007.
The following table summarizes shares of Company common stock held by the
ESOP:
| December 31, | ||||||
| 2009 | 2008 | |||||
| (Dollars in thousands) | ||||||
| Shares allocated to participants | 854,519 | 836,960 | ||||
| Unallocated and unearned shares | — | 83,519 | ||||
| 854,519 | 920,479 | |||||
| Fair value of unallocated and unearned ESOP shares | $ | — | $ | 326 | ||
The Company also provides nonqualified
deferred compensation for certain senior officers under the ESOP. This benefit
is also based on restrictions on contributions to the ESOP under Internal
Revenue Code limits. Compensation expense related to this supplemental plan for
the years ended December 31, 2009, 2008, and 2007, was $10,000, $2,000, and
$31,000, respectively.
10. INCOME TAXES
The total income tax provision
(benefit) was allocated as follows:
| Year Ended December 31, | ||||||||||||
| 2009 | 2008 | 2007 | ||||||||||
| (Dollars in thousands) | ||||||||||||
| Income (loss) from operations | $ | (2,262 | ) | $ | (8,673 | ) | $ | 2,310 | ||||
| Shareholders’ equity for compensation expense for | ||||||||||||
| tax purposes in excess of amounts recognized for | ||||||||||||
| financial reporting purposes | (233 | ) | (497 | ) | (288 | ) | ||||||
| $ | (2,495 | ) | $ | (9,170 | ) | $ | 2,022 | |||||
The income tax provision (benefit)
consists of the following:
| Year Ended December 31, | |||||||||||
| 2009 | 2008 | 2007 | |||||||||
| (Dollars in thousands) | |||||||||||
| Current tax expense: | |||||||||||
| Federal | $ | (670 | ) | $ | 62 | $ | 1,338 | ||||
| State | — | — | — | ||||||||
| Deferred tax expense (benefit): | |||||||||||
| Federal | (1,414 | ) | (7,413 | ) | 942 | ||||||
| State | (178 | ) | (1,322 | ) | 30 | ||||||
| $ | (2,262 | ) | $ | (8,673 | ) | $ | 2,310 | ||||
84
CFS BANCORP, INC.
NOTES TO CONSOLIDATED FINANCIAL STATEMENTS –
(Continued)
A reconciliation of the statutory
federal income tax rate to the effective income tax rate is as
follows:
| Year Ended December 31, | |||||||||
| 2009 | 2008 | 2007 | |||||||
| Statutory rate | (34.0 | )% | (34.0 | )% | 34.0 | % | |||
| State taxes | (4.2 | ) | (4.4 | ) | 0.2 | ||||
| Bank-owned life insurance | (26.5 | ) | (2.2 | ) | (5.7 | ) | |||
| Low-income housing tax credits | (13.0 | ) | (1.8 | ) | (4.0 | ) | |||
| Other | (2.9 | ) | (1.0 | ) | (1.0 | ) | |||
| Effective rate | (80.6 | )% | (43.4 | )% | 23.5 | % | |||
The Company’s effective tax rate benefit for
2009 was 80.6% compared to an effective tax benefit of 43.4% for 2008. The
significant change in the Company’s effective tax rate benefit was mainly the
result of an increase in the percentage of permanent tax items to pre-tax loss
during 2009. The overall effective tax rates continue to benefit from the
Company’s investment in bank-owned life insurance and the application of
available tax credits.
Significant components of deferred
tax assets and liabilities are as follows:
| December 31, | ||||||
| 2009 | 2008 | |||||
| (Dollars in thousands) | ||||||
| Deferred tax assets: | ||||||
| Allowance for losses on loans | $ | 7,160 | $ | 5,812 | ||
| Specific reserves on other real estate owned | 936 | 3 | ||||
| Deferred compensation | 163 | 222 | ||||
| Deferred loan fees | 255 | 401 | ||||
| Depreciation/amortization | 516 | 562 | ||||
| Net operating loss carryforwards | 1,328 | 4,529 | ||||
| Alternative minimum tax carryforwards | 1,789 | 821 | ||||
| General business tax credits | 2,986 | 1,763 | ||||
| Other-than-temporary impairments on available-for-sale securities | 1,683 | 1,709 | ||||
| Other | 1,185 | 632 | ||||
| 18,001 | 16,454 | |||||
| Deferred tax liabilities: | ||||||
| Unamortized deferred premium on early extinguishment of debt | — | 65 | ||||
| FHLB stock dividends | 1,014 | 1,030 | ||||
| Other | 372 | 336 | ||||
| 1,386 | 1,431 | |||||
| Net deferred tax asset | 16,615 | 15,023 | ||||
| Tax effect of adjustment related to unrealized depreciation on available-for-sale securities | 1,421 | 471 | ||||
| Net deferred tax assets including adjustments | $ | 18,036 | $ | 15,494 | ||
At December 31, 2009 and 2008, the Company
determined that it is more likely than not that the deferred tax assets will be
realized, largely based on available tax planning strategies and its projections
of future taxable income. Therefore, no valuation reserve was recorded at
December 31, 2009 or December 31, 2008. The determination of the realizability
of the deferred tax assets is highly subjective and dependent upon judgment
concerning our evaluation of both positive and negative evidence, our forecasts
of future income, applicable tax planning strategies, and assessments of current
and future economic and business conditions. Positive evidence includes the
existence of taxes paid in available carryback years as well as the probability
that taxable income will be generated in future periods, while negative evidence
includes any cumulative losses in the current year and prior two years and
general business and economic trends. Failure to achieve sufficient projected
taxable income might affect the ultimate realization of the net deferred tax
assets.
85
CFS BANCORP, INC.
NOTES TO CONSOLIDATED FINANCIAL STATEMENTS –
(Continued)
Prior to 1988, the Bank qualified as a bank
under provisions of the Internal Revenue Code which permitted it to deduct from
taxable income an allowance for bad debts, which differed from the provision for
such losses charged to income. Retained earnings at December 31, 2009 and 2008
included approximately $12.5 million for which no provision for income taxes has
been made. If in the future this portion of retained earnings is distributed, or
the Bank no longer qualifies as a bank for tax purposes, income taxes may be
imposed at the then applicable rates. The unrecorded deferred tax liability at
December 31, 2009 and 2008 would have been approximately $4.9 million.
At December 31, 2009, the Company had state
net operating losses of $23.9 million which are being carried forward to reduce
future taxable income. The carryforwards expire between 2016 and
2029.
11. RELATED PARTY
DISCLOSURES
The Company has no material related party
transactions which would require disclosure. In compliance with applicable
banking regulations, the Company may extend credit to certain officers and
directors of the Company and its subsidiaries in the ordinary course of business
under substantially the same terms as comparable third-party lending
arrangements.
12. SHAREHOLDERS’ EQUITY AND REGULATORY
CAPITAL
In March 2008, the Company announced a new
share repurchase plan for an additional 530,000 shares. During 2008, the Company
purchased a total of 81,388 shares at an average cost of $14.39 per share.
Pursuant to the Company’s informal regulatory agreement with the OTS, the
Company is prohibited from repurchasing shares without prior approval from the
OTS. As such, the Company did not repurchase any of its common stock during
2009. Total shares available for repurchase under this plan are 448,612 at
December 31, 2009.
OTS regulations impose limitations upon all
capital distributions by a savings institution if the institution would not be
“well capitalized” after the distributions. Capital distributions include cash
dividends, payments to repurchase or otherwise acquire its own stock, payments
to shareholders of another institution in a cash-out merger, and other
distributions charged against capital. The regulations provide that an
institution must submit an application to the OTS to receive approval of the
capital distributions if the institution (i) is not eligible for expedited
treatment; or (ii) for which its total amount of capital distributions for the
applicable calendar year exceeds its net income for that year to date plus its
retained income for the preceding two years; or (iii) would not be at least
adequately capitalized following the distribution; or (iv) would violate a
prohibition contained in a statute, regulation, or agreement between the
institution and the OTS by performing the capital distribution. Under any other
circumstances, the institution would be required to provide a written notice to
the OTS prior to the capital distribution. Based on its retained income for the
preceding two years, the Bank is currently restricted from making any capital
distributions without prior written approval from the OTS.
The principal sources of cash flow for the
Company are dividends from the Bank. Various federal banking regulations and
capital guidelines limit the amount of dividends that may be paid to the Company
by the Bank. Future payments of dividends by the Bank are largely dependent upon
individual regulatory capital requirements and levels of profitability.
The Bank is subject to various regulatory
capital requirements administered by the federal banking agencies. Failure to
meet minimum requirements can initiate certain mandatory and possible additional
discretionary actions by regulators that, if undertaken, could have a direct
material effect on the Company’s financial statements. Under capital adequacy
guidelines and the regulatory framework for prompt corrective action, the Bank
must meet specific capital guidelines that involve quantitative measures of the
Bank’s assets, liabilities, and certain off-balance-sheet items as calculated
under regulatory accounting practices. The Bank’s capital amounts and
classification are also subject to quantitative judgments by the regulators
about components, risk weightings, and other factors.
Quantitative measures established by
regulation to ensure capital adequacy require the Bank to maintain minimum
amounts and ratios as set forth in the below table of the total risk-based,
tangible, and core capital, as defined in the regulations. As of December 31,
2009, the Bank met all capital adequacy requirements to which it is
subject.
86
CFS BANCORP, INC.
NOTES TO CONSOLIDATED FINANCIAL STATEMENTS –
(Continued)
At December 31, 2009, the Bank was deemed to
be “well capitalized” and in excess of regulatory requirements set by the OTS.
The decreases in the Bank’s capital ratios from December 31, 2008 are a result
of a $8.7 million increase in the amount of estimated deferred tax assets not
included for regulatory capital purposes mainly due to a change in our estimate
during the third quarter of 2009 of deferred tax assets dependent on future
taxable income. The total amount of deferred tax assets not included for
regulatory capital purposes was $13.8 million and $5.1 million, respectively, at
December 31, 2009 and December 31, 2008. Determining the amount of deferred tax
assets included or excluded in periodic regulatory capital calculations requires
significant judgment when assessing a number of factors. In assessing the amount
of the deferred tax assets includable in capital, management considers a number
of relevant factors including the amount of deferred tax assets dependent on
future taxable income, the amount of taxes that could be recovered through loss
carrybacks, the reversal of temporary book tax differences, projected future
taxable income within one year, tax planning strategies, and OTS limitations.
Using all information available to management at each statement of condition
date, these factors are reviewed and can and do vary from period to period. The
decreases in the capital ratios were partially offset by a $1.75 million capital
infusion from the Company to the Bank during the fourth quarter of
2009.
The current regulatory capital requirements
and the actual capital levels of the Bank at December 31, 2009 and December 31,
2008 are provided below. There are no conditions or events since that date that
management believes have changed the Bank’s category. At December 31, 2009, the
Bank’s adjusted total assets were $1.1 billion and its risk-weighted assets were
$852.5 million.
| To Be Well Capitalized | ||||||||||||||||||
| For Capital Adequacy | Under Prompt Corrective | |||||||||||||||||
| Actual | Purposes | Action Provisions | ||||||||||||||||
| Amount | Ratio | Amount | Ratio | Amount | Ratio | |||||||||||||
| (Dollars in thousands) | ||||||||||||||||||
| As of December 31, 2009: | ||||||||||||||||||
| Total capital to risk-weighted assets | $ | 105,323 | 12.35 | % | $ | 68,200 | >8.00 | % | $ | 85,250 | >10.00 | % | ||||||
| Tier 1 (core) capital to risk-weighted assets | 95,078 | 11.15 | 34,100 | >4.00 | 51,150 | >6.00 | ||||||||||||
| Tier 1 (core) capital to adjusted total assets | 95,078 | 8.88 | 42,838 | >4.00 | 53,548 | >5.00 | ||||||||||||
| Tangible capital to adjusted total assets | 95,078 | 8.88 | 16,064 | >1.50 | 21,419 | >2.00 | ||||||||||||
| As of December 31, 2008: | ||||||||||||||||||
| Total capital to risk-weighted assets | $ | 111,941 | 13.21 | % | $ | 67,777 | >8.00 | % | $ | 84,722 | >10.00 | % | ||||||
| Tier 1 (core) capital to risk-weighted assets | 101,289 | 11.96 | 33,889 | >4.00 | 50,833 | >6.00 | ||||||||||||
| Tier 1 (core) capital to adjusted total assets | 101,289 | 9.07 | 44,683 | >4.00 | 55,854 | >5.00 | ||||||||||||
| Tangible capital to adjusted total assets | 101,289 | 9.07 | 16,756 | >1.50 | 22,341 | >2.00 | ||||||||||||
13. COMMITMENTS
| December 31, | ||||||||||||
| 2009 | 2008 | |||||||||||
| Fixed | Variable | Fixed | Variable | |||||||||
| Rate | Rate | Rate | Rate | |||||||||
| (Dollars in thousands) | ||||||||||||
| Commitments to originate loans: | ||||||||||||
|
Commercial and
industrial
|
$ | 1,100 | $ | 3,619 | $ | 5,856 | $ | 11,765 | ||||
|
Commercial real estate – owner
occupied
|
2,030 | 406 | 1,115 | 1,000 | ||||||||
|
Commercial real estate – non-owner
occupied
|
2,297 | 60 | 7,010 | 2,631 | ||||||||
|
Commercial real estate –
multifamily
|
6,160 | 160 | 1,350 | — | ||||||||
|
Commercial construction and land
development
|
— | 2,952 | 2,100 | 3,160 | ||||||||
|
Retail
|
1,449 | 107 | 2,569 | 760 | ||||||||
| Commitments to fund unused construction loans | 2,130 | 3,757 | 796 | 18,018 | ||||||||
| Commitments to fund unused lines of credit | 59 | 91,785 | 34 | 87,625 | ||||||||
| Letters of credit | — | 8,615 | — | 8,499 | ||||||||
| Credit enhancements | 29,824 | — | 30,525 | — | ||||||||
87
CFS BANCORP, INC.
NOTES TO CONSOLIDATED FINANCIAL STATEMENTS –
(Continued)
The commitments listed above do not
necessarily represent future cash requirements, in that these commitments often
expire without being drawn upon. The fixed loan commitments have interest rates
ranging from 4.75% to 9%. Letters of credit and credit enhancements expire at
various times through 2018.
The Company also has commitments to fund
community investments through investments in limited partnerships, which
represent future cash outlays for the construction and development of properties
for low-income housing, small business real estate, and historic tax credit
projects that qualify under the Community Reinvestment Act. These commitments
include $704,000 to be funded over five years. The timing and amounts of these
commitments are projected based upon the financing arrangements provided in each
project’s partnership agreement, and could change due to variances in the
construction schedule, project revisions, or the cancellation of the project.
These commitments are not included in the commitment table above. See additional
disclosures in Note 14.
Credit enhancements are related to the
issuance by municipalities of taxable and nontaxable revenue bonds. The proceeds
from the sale of such bonds are loaned to for-profit and not-for-profit
companies for economic development projects. In order for the bonds to receive a
triple-A rating, which provides for a lower interest rate, the FHLB issues, in
favor of the bond trustee, an Irrevocable Direct Pay Letter of Credit
(IDPLOC) for the account of the Bank. Since the Bank,
in accordance with the terms and conditions of a Reimbursement Agreement between
the FHLB and the Bank, would be required to reimburse the FHLB for draws against
the IDPLOC, these facilities are analyzed, appraised, secured by real estate
mortgages, and monitored as if the Bank had funded the project initially.
Management’s current lending strategy does not include the origination of new or
additional credit enhancements.
The letters of credit and credit enhancements
provided by the Company are considered financial guarantees under ASC 460-10,
Guarantees, and were carried
at a fair value of $123,000 in the aggregate as of December 31, 2009.
14. VARIABLE INTEREST
ENTITIES
The Company has investments in nine low-income
housing tax credit limited partnerships and one limited liability partnership
for the development of shopping centers, for-sale housing, and the restoration
of historic properties in low- and moderate income areas. Although these
partnerships generate operating losses, the Company realizes a return on its
investment through reductions in income tax expense that result from tax credits
and the deductibility of the entities’ operating losses. These investments were
acquired at various times between 1996 and 2004 and are accounted for under the
equity method. These entities are considered variable interest entities in
accordance with ASC 810-10, Consolidations.
Since the Company is not considered the primary beneficiary of these entities,
it is not required to consolidate these investments. The Company’s exposure is
limited to its current recorded investment of $1.8 million plus $704,000 that
the Company is obligated to pay over the next five years but has not yet funded.
15. FAIR VALUE OF FINANCIAL
INSTRUMENTS
The Company measures fair value according to
ASC 820-10, Fair Value Measurements and
Disclosures, which
establishes a fair value hierarchy that prioritizes the inputs used in valuation
techniques, but not the valuation techniques themselves. The fair value
hierarchy is designed to indicate the relative reliability of the fair value
measure. The highest priority is given to quoted prices in active markets and
the lowest to unobservable data such as the Company’s internal information. ASC
820-10 defines fair value as “the price that would be received to sell an asset
or paid to transfer a liability in an orderly transaction between market
participants at the measurement date.” There are three levels of inputs into the
fair value hierarchy (Level 1 being the highest priority and Level 3 being the
lowest priority):
Level 1 – Unadjusted quoted prices for identical instruments in active
markets;
Level 2 – Quoted prices for similar instruments in active markets; quoted
prices for identical or similar instruments in markets that are not active; and
model-derived valuations whose inputs are observable or whose significant value
drivers are observable; and
88
CFS BANCORP, INC.
NOTES TO CONSOLIDATED FINANCIAL STATEMENTS –
(Continued)
Level 3 – Instruments whose significant value drivers or assumptions are
unobservable and that are significant to the fair value of the assets or
liabilities.
A financial instrument’s level within the fair
value hierarchy is based on the lowest level of input that is significant to the
fair value measurement.
The following table sets forth the Company’s
financial assets by level within the fair value hierarchy that were measured at
fair value on a recurring basis during the dates indicated.
| Fair Value Measurements at December 31, 2009 | ||||||||||||
| Quoted Prices in | ||||||||||||
| Active Markets for | Significant Other | Significant | ||||||||||
| Identical Assets | Observable Inputs | Unobservable Inputs | ||||||||||
| Fair Value | (Level 1) | (Level 2) | (Level 3) | |||||||||
| (Dollars in thousands) | ||||||||||||
| Securities available-for-sale: | ||||||||||||
| Government sponsored entity (GSE) securities | $ | 41,457 | $ | — | $ | 41,457 | $ | — | ||||
| Mortgage-backed securities | 9,835 | — | 9,835 | — | ||||||||
| Collateralized mortgage obligations | 66,768 | — | 66,768 | — | ||||||||
| Commercial mortgage-backed securities | 50,522 | — | 50,522 | — | ||||||||
| Pooled trust preferred securities | 20,012 | — | — | 20,012 | ||||||||
| Equity securities | 187 | 187 | — | — | ||||||||
| Fair Value Measurements at December 31, 2008 | ||||||||||||
| Quoted Prices in | ||||||||||||
| Active Markets for | Significant Other | Significant | ||||||||||
| Identical Assets | Observable Inputs | Unobservable Inputs | ||||||||||
| Fair Value | (Level 1) | (Level 2) | (Level 3) | |||||||||
| (Dollars in thousands) | ||||||||||||
| Securities available-for-sale: | ||||||||||||
| Government sponsored entity (GSE) securities | $ | 102,345 | $ | — | $ | 102,345 | $ | — | ||||
| Mortgage-backed securities | 10,856 | — | 10,856 | — | ||||||||
| Collateralized mortgage obligations | 75,543 | — | 75,543 | — | ||||||||
| Commercial mortgage-backed securities | 38,393 | — | 38,393 | — | ||||||||
| Pooled trust preferred securities | 24,133 | — | — | 24,133 | ||||||||
Securities available-for-sale are measured at
fair value on a recurring basis. Level 2 securities are valued by a third-party
pricing service commonly used in the banking industry utilizing observable
inputs. The pricing provider utilizes evaluated pricing models that vary based
on asset class. These models incorporate available market information including
quoted prices of securities with similar characteristics and, because many
fixed-income securities do not trade on a daily basis, apply available
information through processes such as benchmark curves, benchmarking of like
securities, sector groupings, and matrix pricing. In addition, model processes,
such as an option adjusted spread model, are used to develop prepayment and
interest rate scenarios for securities with prepayment features.
Level 3 models are utilized when quoted prices
are not available for certain securities or in markets where trading activity
has slowed or ceased. When quoted prices are not available and are not provided
by third-party pricing services, management judgment is necessary to determine
fair value. As such, fair value is determined using discounted cash flow
analysis models, incorporating default rates, estimation of prepayment
characteristics, and implied volatilities.
89
CFS BANCORP, INC.
NOTES TO CONSOLIDATED FINANCIAL STATEMENTS –
(Continued)
The Company determined that Level 3 pricing
models should be utilized for valuing its investments in pooled trust preferred
securities. The market for these securities at December 31, 2009 was not active
and markets for similar securities were also not active. There are very few
market participants who are willing and/or able to transact for these
securities. Given the limited number of observable transactions in the secondary
market and the absence of a new issue market, management determined an income
valuation approach (present value technique) that maximizes the use of relevant
observable inputs and minimizes the use of unobservable inputs will be equally
or more representative of fair value than the market approach valuation
technique.
For its Level 3 pricing model, the Company
used externally provided fair value rates that were no longer available in the
third quarter of 2009. As such, the Company discontinued its use of the internal
model and utilized the external fair values provided by the same third-party.
The external model uses deferral and default probabilities for underlying
issuers, estimated deferral periods, and recovery rates on defaults. In prior
periods, the internal model’s fair values were similar to the external model’s
fair values. The internal model previously used by the Company assumed (i) any
defaulted underlying issues would not have any recovery and (ii) underlying
issues that are currently deferring or in receivership or conservatorship would
eventually default and not have any recovery. In addition, the Company’s
internal model estimated cash flows to maturity and assumed no early redemptions
of principal due to call options or successful auctions.
The following is a reconciliation of the
beginning and ending balances of recurring fair value measurements recognized in
the accompanying consolidated statement of condition using Level 3 inputs for
the years indicated:
| Available-for-sale Securities | ||||||||
| 2009 | 2008 | |||||||
| (Dollars in thousands) | ||||||||
| Beginning balance January 1 | $ | 24,133 | $ | — | ||||
| Total realized and unrealized gains and losses: | ||||||||
| Included in accumulated other comprehensive income | (3,546 | ) | (578 | ) | ||||
| Purchases, sales, issuances, and settlements, net | (575 | ) | (139 | ) | ||||
| Transfers in and/or out of Level 3 | — | 24,850 | ||||||
| Ending balance December 31 | $ | 20,012 | $ | 24,133 | ||||
The following table sets forth the Company’s
financial and non-financial assets by level within the fair value hierarchy that
were measured at fair value on a non-recurring basis during the dates
indicated.
| Fair Value Measurements at December 31, 2009 | ||||||||||||
| Quoted Prices in | ||||||||||||
| Active Markets for | Significant Other | Significant | ||||||||||
| Identical Assets | Observable Inputs | Unobservable Inputs | ||||||||||
| Fair Value | (Level 1) | (Level 2) | (Level 3) | |||||||||
| (Dollars in thousands) | ||||||||||||
| Impaired loans | $ | 29,411 | $ | — | $ | — | $ | 29,411 | ||||
| Other real estate owned | 1,740 | — | — | 1,740 | ||||||||
| Fair Value Measurements at December 31, 2008 | ||||||||||||
| Quoted Prices in | ||||||||||||
| Active Markets for | Significant Other | Significant | ||||||||||
| Identical Assets | Observable Inputs | Unobservable Inputs | ||||||||||
| Fair Value | (Level 1) | (Level 2) | (Level 3) | |||||||||
| (Dollars in thousands) | ||||||||||||
| Impaired loans | $ | 31,734 | $ | — | $ | — | $ | 31,734 | ||||
Loans for which it is probable that the Bank
will not collect all principal and interest due according to contractual terms
are measured for impairment. Allowable methods for determining the amount of
impairment include estimating fair value using the fair value of the collateral
for collateral-dependent loans. If the impaired loan is identified as
collateral-dependent, then the fair value method of measuring the amount of
impairment is utilized. This method requires obtaining a current independent
appraisal of the collateral and applying
a discount factor to the value. Impaired loans that are collateral-dependent are
classified within Level 3 of the fair value hierarchy when impairment is
determined using the fair value method.
90
CFS BANCORP, INC.
NOTES TO CONSOLIDATED FINANCIAL STATEMENTS –
(Continued)
Fair value measurements for impaired loans are
performed pursuant to ASC 310-10, Receivables, and
are measured on a non-recurring basis. Certain impaired loans were partially
charged-off or re-evaluated during the third quarter of 2009. These impaired
loans were carried at fair value as estimated using current and prior
appraisals, discounting factors, the borrowers’ financial results, estimated
cash flows generated from the property, and other factors. The change in fair
value of impaired loans that were valued based upon Level 3 inputs was
approximately $11.3 million and $24.5 million for the years ended December 31,
2009 and 2008, respectively. This loss is not recorded directly as an adjustment
to current earnings or comprehensive income, but rather as a component in
determining the overall adequacy of the allowance for losses on loans. These
adjustments to the estimated fair value of impaired loans may result in
increases or decreases to the provision for losses on loans recorded in future
earnings.
The fair value of the Company’s other real
estate owned is determined using Level 3 inputs which include current and prior
appraisals and estimated costs to sell. The change in fair value of other real
estate owned was $1.8 million for the year ended December 31, 2009 which was
recorded directly as an adjustment to current earnings through other real estate
owned expenses.
The Company may elect to measure financial
instruments and certain other assets and liabilities at fair value on an
instrument-by-instrument basis (the Fair Value Option)
according to ASC 825-10, Financial Instruments. The Company is not currently engaged in any hedging activities and, as
a result, did not elect to measure any financial instruments at fair value under
ASC 825-10.
Disclosure of fair value information about
financial instruments, whether or not recognized in the consolidated statement
of condition, for which it is practicable to estimate their value, is summarized
below. The aggregate fair value amounts presented do not represent the
underlying value of the Company.
The carrying amounts and fair values
of financial instruments consist of the following:
| December 31, | ||||||||||||
| 2009 | 2008 | |||||||||||
| Carrying | Fair | Carrying | Fair | |||||||||
| Amount | Value | Amount | Value | |||||||||
| (Dollars in thousands) | ||||||||||||
| Financial Assets | ||||||||||||
| Cash and cash equivalents | $ | 24,428 | $ | 24,428 | $ | 19,106 | $ | 19,106 | ||||
| Securities, available-for-sale | 188,781 | 188,781 | 251,270 | 251,270 | ||||||||
| Securities, held-to-maturity | 5,000 | 5,179 | 6,940 | 7,101 | ||||||||
| Federal Home Loan Bank stock | 23,944 | 23,944 | 23,944 | 23,944 | ||||||||
| Loans receivable, net of allowance for losses on loans | 742,925 | 745,594 | 734,415 | 741,440 | ||||||||
| Interest receivable | 3,469 | 3,469 | 4,325 | 4,325 | ||||||||
| Total financial assets | $ | 988,547 | $ | 991,395 | $ | 1,040,000 | $ | 1,047,186 | ||||
| Financial Liabilities | ||||||||||||
| Deposits | $ | 849,758 | $ | 850,894 | $ | 824,097 | $ | 827,389 | ||||
| Borrowed money | 111,808 | 113,379 | 172,937 | 177,087 | ||||||||
| Interest payable | 145 | 145 | 370 | 370 | ||||||||
| Total financial liabilities | $ | 961,711 | $ | 964,418 | $ | 997,404 | $ | 1,004,846 | ||||
The carrying amount is the estimated fair
value for cash and cash equivalents, Federal Home Loan Bank stock, and accrued
interest receivable and payable. Securities, held-to-maturity fair values are
based on quotes received from a third-party pricing source and discounted cash
flow analysis models. The fair values for variable-rate and fixed-rate loans are
estimated using discounted cash flow analyses. Cash flows are adjusted for
estimated prepayments where appropriate and are discounted using interest rates
currently being offered for loans with similar terms and collateral to borrowers
of similar credit quality.
91
CFS BANCORP, INC.
NOTES TO CONSOLIDATED FINANCIAL STATEMENTS –
(Continued)
The fair value of checking, savings, and money
market accounts is the amount payable on demand at the reporting date. The fair
value of fixed-maturity certificates of deposit is estimated by discounting the
future cash flows using the rates currently offered for deposits of similar
remaining maturities. The fair value of borrowed money is estimated based on
rates currently available to the Company for debt with similar terms and
remaining maturities. The fair value of the Company’s off-balance-sheet
instruments approximates their book value and is not included in the above
table.
16. EARNINGS PER SHARE
The following table sets forth the
computation of basic and diluted earnings per share:
| Year Ended December 31, | |||||||||||
| 2009 | 2008 | 2007 | |||||||||
| (Dollars in thousands except per share data) | |||||||||||
| Net income (loss) | $ | (543 | ) | $ | (11,295 | ) | $ | 7,525 | |||
| Weighted-average common shares outstanding | 10,574,623 | 10,307,879 | 10,547,853 | ||||||||
| Weighted-average common share equivalents (1) | 105,462 | 200,427 | 294,929 | ||||||||
| Weighted-average common shares and common share equivalents | |||||||||||
| outstanding | 10,680,085 | 10,508,306 | 10,842,782 | ||||||||
| Basic earnings (loss) per share | $ | (0.05 | ) | $ | (1.10 | ) | $ | 0.71 | |||
| Diluted earnings (loss) per share | (0.05 | ) | (1.10 | ) | 0.69 | ||||||
| Number of anti-dilutive stock options excluded from the diluted | |||||||||||
| earnings per share calculation | 866,302 | 657,100 | 105,000 | ||||||||
| Weighted-average exercise price of anti-dilutive option shares | $ | 12.77 | $ | 12.63 | $ | 14.66 | |||||
| (1) | Assumes exercise of dilutive stock options, a portion of the unearned restricted stock awards, and treasury shares held in Rabbi Trust accounts. |
17. OTHER COMPREHENSIVE INCOME
(LOSS)
The related income tax effect and
reclassification adjustments to the components of other comprehensive income for
the periods indicated are as follows:
| Year Ended December 31, | ||||||||||||
| 2009 | 2008 | 2007 | ||||||||||
| (Dollars in thousands) | ||||||||||||
| Unrealized holding gains (losses) arising during the period: | ||||||||||||
| Unrealized net gains (losses) | $ | (1,309 | ) | $ | (8,389 | ) | $ | 3,780 | ||||
| Related tax (expense) benefit | 557 | 3,078 | (1,370 | ) | ||||||||
| Net | (752 | ) | (5,311 | ) | 2,410 | |||||||
| Less: reclassification adjustment for net gains (losses) realized during the period: | ||||||||||||
| Realized net gains (losses) | 1,092 | (4,265 | ) | 536 | ||||||||
| Related tax (expense) benefit | (393 | ) | 1,593 | (200 | ) | |||||||
| Net | 699 | (2,672 | ) | 336 | ||||||||
| Total other comprehensive income (loss) | $ | (1,451 | ) | $ | (2,639 | ) | $ | 2,074 | ||||
92
CFS BANCORP, INC.
NOTES TO CONSOLIDATED FINANCIAL STATEMENTS –
(Continued)
18. LEGAL PROCEEDINGS
The Company is involved in routine legal
proceedings occurring in the ordinary course of its business, which, in the
aggregate, are believed to be immaterial to the financial condition of the
Company.
19. CONDENSED PARENT COMPANY FINANCIAL
STATEMENTS
The following tables represent the condensed
statement of condition as of December 31, 2009 and 2008 and condensed statements
of operations and cash flows for the three years ended December 31, 2009 for CFS
Bancorp, Inc., the parent company.
Condensed Statements of Condition
(Parent Company Only)
(Parent Company Only)
| December 31, | ||||||
| 2009 | 2008 | |||||
| (Dollars in thousands) | ||||||
| ASSETS | ||||||
| Cash on hand and in banks | $ | 3,753 | $ | 3,667 | ||
| Securities available-for-sale | 7 | — | ||||
| Investment in subsidiary | 107,351 | 106,275 | ||||
| Loan receivable from ESOP | — | 1,153 | ||||
| Other assets | 708 | 2,990 | ||||
| Total assets | $ | 111,819 | $ | 114,085 | ||
| LIABILITIES AND SHAREHOLDERS’ EQUITY | ||||||
| Liabilities: | ||||||
| Accrued taxes and other liabilities | $ | 1,446 | $ | 2,276 | ||
| Total shareholders’ equity | 110,373 | 111,809 | ||||
| Total liabilities and shareholders’ equity | $ | 111,819 | $ | 114,085 | ||
Condensed Statements of
Operations
(Parent Company Only)
(Parent Company Only)
| Year Ended December 31, | ||||||||||||
| 2009 | 2008 | 2007 | ||||||||||
| (Dollars in thousands) | ||||||||||||
| Dividends from subsidiary | $ | — | $ | 7,750 | $ | 9,000 | ||||||
| Interest income | 22 | 198 | 251 | |||||||||
| Net realized losses on the sale of available-for-sale investment securities | — | (168 | ) | — | ||||||||
| Non-interest expense | (1,430 | ) | (667 | ) | (636 | ) | ||||||
| Net income (loss) before income taxes and equity in earnings of subsidiary | (1,408 | ) | 7,113 | 8,615 | ||||||||
| Income tax benefit | 518 | 238 | 146 | |||||||||
| Net income (loss) before equity in undistributed earnings of subsidiary | (890 | ) | 7,351 | 8,761 | ||||||||
| Equity in undistributed earnings (loss) of subsidiary | 347 | (18,646 | ) | (1,236 | ) | |||||||
| Net income (loss) | $ | (543 | ) | $ | (11,295 | ) | $ | 7,525 | ||||
93
CFS BANCORP, INC.
NOTES TO CONSOLIDATED FINANCIAL STATEMENTS –
(Continued)
Condensed Statements of Cash Flows
(Parent Company Only)
(Parent Company Only)
| Year Ended December 31, | ||||||||||||
| 2009 | 2008 | 2007 | ||||||||||
| (Dollars in thousands) | ||||||||||||
| Operating activities: | ||||||||||||
| Net income (loss) | $ | (543 | ) | $ | (11,295 | ) | $ | 7,525 | ||||
| Adjustments to reconcile net income (loss) to net cash provided by operating activities: | ||||||||||||
| Impairment of securities | — | 168 | — | |||||||||
| Equity in undistributed (earnings) loss of subsidiary | (347 | ) | 18,646 | 1,236 | ||||||||
| (Increase) decrease in other assets | 2,282 | (2,818 | ) | 217 | ||||||||
| Increase (decrease) in other liabilities | (495 | ) | 127 | 593 | ||||||||
| Net cash provided by operating activities | 897 | 4,828 | 9,571 | |||||||||
| Investing activities: | ||||||||||||
| Principal payment on loan | 1,153 | 3,146 | 514 | |||||||||
| Capital contribution to subsidiary | (1,750 | ) | — | — | ||||||||
| Net cash provided by (used in) investing activities | (597 | ) | 3,146 | 514 | ||||||||
| Financing activities: | ||||||||||||
| Purchase of treasury stock | — | (2,997 | ) | (9,751 | ) | |||||||
| Net distributions (purchases) of Rabbi Trust shares | 544 | 41 | (139 | ) | ||||||||
| Proceeds from exercise of stock options | — | 830 | 2,763 | |||||||||
| Dividends paid on common stock | (758 | ) | (5,192 | ) | (5,311 | ) | ||||||
| Net cash used by financing activities | (214 | ) | (7,318 | ) | (12,438 | ) | ||||||
| Increase (decrease) in cash and cash equivalents | 86 | 656 | (2,353 | ) | ||||||||
| Cash and cash equivalents at beginning of year | 3,667 | 3,011 | 5,364 | |||||||||
| Cash and cash equivalents at end of year | $ | 3,753 | $ | 3,667 | $ | 3,011 | ||||||
20. QUARTERLY FINANCIAL DATA
(UNAUDITED)
The following table reflects
summarized quarterly data for the periods presented (unaudited):
| Net | Net | Earnings (Loss) | ||||||||||||||||
| Interest | Interest | Income | Per Share | |||||||||||||||
| Income | Income | (Loss) | Basic | Diluted | ||||||||||||||
| (Dollars in thousands except per share data) | ||||||||||||||||||
| 2009 | ||||||||||||||||||
| First quarter | $ | 13,231 | $ | 9,175 | $ | 1,461 | $ | 0.14 | $ | 0.14 | ||||||||
| Second quarter | 12,964 | 9,335 | 670 | 0.06 | 0.06 | |||||||||||||
| Third quarter | 12,585 | 9,396 | (4,671 | ) | (0.44 | ) | (0.44 | ) | ||||||||||
| Fourth quarter | 12,528 | 9,687 | 1,997 | 0.19 | 0.19 | |||||||||||||
| 2008 | ||||||||||||||||||
| First quarter | $ | 16,314 | $ | 8,565 | $ | 1,779 | $ | 0.17 | $ | 0.17 | ||||||||
| Second quarter | 15,032 | 8,697 | (2,295 | ) | (0.22 | ) | (0.22 | ) | ||||||||||
| Third quarter | 14,364 | 8,907 | (1,039 | ) | (0.10 | ) | (0.10 | ) | ||||||||||
| Fourth quarter | 13,829 | 8,714 | (9,740 | ) | (0.95 | ) | (0.95 | ) | ||||||||||
The significant decrease in net income for the
third quarter of 2009 was primarily a result of the additional expense related
to the Company’s provision for losses on loans and decreased valuations on the
Company’s other real estate owned properties.
94
|
ITEM
9.
|
CHANGES IN AND DISAGREEMENTS WITH
ACCOUNTANTS ON ACCOUNTING AND FINANCIAL
DISCLOSURES
|
None.
ITEM 9A(T). CONTROLS AND
PROCEDURES
EVALUATION OF DISCLOSURE CONTROLS AND
PROCEDURES
Management evaluated, with the participation
of the Company’s Chief Executive Officer and Chief Financial Officer, the
effectiveness of its disclosure controls and procedures (as defined in Rules
13a-15(e) or 15(d)-15(e) under the Securities Exchange Act of 1934, as amended)
as of the end of the period covered by this report. Based on such evaluation,
the Chief Executive Officer and Chief Financial Officer have concluded that the
Company’s disclosure controls and procedures are designed to ensure that
information required to be disclosed by the Company in the reports that it files
or submits under the Securities Exchange Act of 1934 is recorded, processed,
summarized, and reported within the time periods specified in the SEC’s rules
and regulations and are operating in an effective manner.
CHANGES IN INTERNAL CONTROL OVER FINANCIAL
REPORTING
No change in the Company’s internal control
over financial reporting (as defined in Rules 13a-15(f) or 15d-15(f) under the
Securities Exchange Act of 1934, as amended) occurred during the quarter ended
December 31, 2009 that has materially affected or is reasonable likely to
materially affect, the Company’s internal control over financial reporting.
MANAGEMENT’S REPORT ON INTERNAL CONTROL OVER
FINANCIAL REPORTING
The management of the Company is responsible
for establishing and maintaining adequate internal control over financial
reporting.
The Company’s internal control over financial
reporting is a process designed to provide reasonable assurance regarding the
reliability of financial reporting and the preparation of financial statements
in accordance with United States generally accepted accounting principles. The
Company’s internal control over financial reporting includes those policies and
procedures that (i) pertain to the maintenance of records that, in reasonable
detail, accurately and fairly reflect the transactions and dispositions of the
assets of the Company; (ii) provide reasonable assurance that transactions are
recorded as necessary to permit preparation of financial statements in
accordance with United States generally accepted accounting principles, and that
receipts and expenditures of the Company are being made in accordance with
authorizations of management and directors of the Company; and (iii) provide
reasonable assurance regarding prevention or timely detection of unauthorized
acquisition, use, or disposition of the Company’s assets that could have a
material effect on its financial statements.
Because of its inherent limitations, internal
control over financial reporting may not prevent or detect misstatements. All
internal control systems, no matter how well designed, have inherent
limitations, including the possibility of human error and the circumvention of
overriding controls. Accordingly, even effective internal control over financial
reporting can provide only reasonable assurance with respect to financial
statement preparation. Also, projections of any evaluation of effectiveness to
future periods are subject to the risk that controls may become inadequate
because of changes in conditions or that the degree of compliance with the
policies and procedures may deteriorate.
The Company’s management assessed its internal
control over financial reporting as of December 31, 2009. In making this
assessment management used the criteria for effective internal control over
financial reporting described in the Internal Control-Integrated Framework adopted by the Committee of
Sponsoring Organizations of the Treadway Commission (COSO). Based on this assessment, management
concludes that, as of December 31, 2009, the Company’s internal controls over
financial reporting are effective. The independent registered public accounting
firm that audited the financial statements included in the annual report has not
issued an attestation report on management’s assessment of the Company’s
internal control over financial reporting. Management’s report was not subject to attestation by the
Company’s independent registered public accounting firm pursuant to temporary
rules of the SEC that permit the Company to provide only management’s report in
the annual report.
95
ITEM 9B. OTHER INFORMATION
None.
PART III.
ITEM 10. DIRECTORS AND EXECUTIVE OFFICERS AND
CORPORATE GOVERNANCE
The information required herein is
incorporated by reference to the sections of the Registrant’s proxy statement
which will be filed not later than 120 days after December 31, 2009 (Proxy Statement) titled Proposal 1 — Election of Directors,
Director Nominees and Directors Continuing in Office, Section 16(a) Beneficial
Ownership Reporting Compliance, Audit Committee, and Report of the Audit
Committee. Information related to the Company’s Code of Conduct and
Ethics is incorporated by reference from the Proxy Statement under the
heading Corporate Governance
Guidelines and Code of Conduct and Ethics.
ITEM 11. EXECUTIVE
COMPENSATION
The information required herein is
incorporated by reference to the sections of the Registrant’s Proxy Statement
titled Executive Compensation,
Director Compensation, Compensation Committee Interlocks and Insider
Participation, and Report of the Compensation
Committee.
|
ITEM
12.
|
SECURITY OWNERSHIP OF CERTAIN BENEFICIAL
OWNERS AND MANAGEMENT AND RELATED SHAREHOLDER
MATTERS
|
The information required herein by Item 403 of
Regulation S-K is incorporated by reference to the section of the Registrant’s
Proxy Statement titled Beneficial Ownership of Common Stock by Certain
Shareholders.
Equity Compensation Plan Information. The following table sets forth certain
information for all equity compensation plans and individual compensation
arrangements (whether with employees or non-employees, such as directors), in
effect as of December 31, 2009.
| Number of Shares | ||||||||||
| Number of Shares to Be | Remaining Available | |||||||||
| Issued Upon the | Weighted-Average | for Future Issuance | ||||||||
| Exercise of Outstanding | Exercise Price of | (Excluding Shares | ||||||||
| Options, Warrants and | Outstanding | Reflected in the | ||||||||
| Plan Category | Rights | Options | First Column) | |||||||
| Equity Compensation Plans Approved by Security Holders | 935,459 | (1) | $ | 13.08 | (2) | 168,836 | (3) | |||
| Equity Compensation Plans Not Approved by Security Holders | — | — | — | |||||||
| Total | 935,459 | $ | 13.08 | 168,836 | ||||||
| ____________________ | ||||||||||
| (1) | This amount includes 769,795 shares issuable upon the exercise of outstanding stock options and 165,664 shares of restricted stock that have been issued but not yet earned or vested. | |
| (2) | Only outstanding stock options are included in this price. The outstanding restricted shares are not included in the weighted-average exercise price because these shares do not have an exercise price. | |
| (3) | This amount represents the total number of shares available for issuance in the future pursuant to stock options and other stock-based awards under the 2008 Omnibus Equity Incentive Plan. | |
96
| ITEM 13. |
CERTAIN RELATIONSHIPS AND RELATED
TRANSACTIONS AND DIRECTOR
INDEPENDENCE
|
The information required herein is
incorporated by reference to the sections of the Registrant’s Proxy Statement
titled Corporate Governance, Director Independence,
and Related Party Transactions.
ITEM 14. PRINCIPAL ACCOUNTING FEES AND
SERVICES
The information required herein is
incorporated by reference to the section of the Registrant’s Proxy Statement
titled Fees Paid to the Independent Registered Public
Accounting Firm.
PART IV.
ITEM 15. EXHIBITS AND FINANCIAL STATEMENT
SCHEDULES
(a) Documents filed as part of this
Report:
(1) The following consolidated
financial statements of the Company are filed with this Form 10-K under Item
8:
| Description | Page | ||
| Report of Independent Registered Public Accounting Firm | 61 | ||
| Consolidated Statements of Financial Condition at December 31, 2009 and 2008 | 62 | ||
| Consolidated Statements of Operations for the years ended December 31, 2009, 2008, and 2007 | 63 | ||
| Consolidated Statements of Changes in Shareholders’ Equity for the years ended December 31, 2009, 2008, and 2007 | 64 | ||
| Consolidated Statements of Cash Flows for the years ended December 31, 2009, 2008, and 2007 | 65 | ||
| Notes to Consolidated Financial Statements | 66 |
(2) All schedules for which
provision is made in the applicable accounting regulation of the SEC are omitted
because they are not applicable or the required information is included in the
Consolidated Financial Statements or notes thereto.
(3) The following exhibits are filed
with the SEC as part of this Form 10-K or are incorporated herein by reference,
and this list includes the Exhibit Index.
| 3.1 | Articles of Incorporation of CFS Bancorp, Inc. (1) | |
| 3.2 | Bylaws of CFS Bancorp, Inc. (2) | |
| 4.0 | Form of Stock Certificate of CFS Bancorp, Inc. (3) | |
| 10.1* | Employment Agreement entered into between Citizens Financial Bank and Thomas F. Prisby (4) | |
| 10.2* | Employment Agreement entered into between CFS Bancorp, Inc. and Thomas F. Prisby (4) | |
| 10.3* | CFS Bancorp, Inc. Amended and Restated 1998 Stock Option Plan (5) | |
| 10.4* | CFS Bancorp, Inc. Amended and Restated 1998 Recognition and Retention Plan and Trust Agreement (5) | |
| 10.5* | CFS Bancorp, Inc. 2003 Stock Option Plan (6) | |
| 10.6* | Employment Agreement entered into between CFS Bancorp, Inc., Citizens Financial Bank and Charles V. Cole (7) | |
| 10.8* | Amended and Restated Supplemental ESOP Benefit Plan of CFS Bancorp, Inc. and Citizens Financial Services, FSB (8) | |
| 10.9* | CFS Bancorp, Inc. Directors’ Deferred Compensation Plan (8) | |
| 10.10* | CFS Bancorp, Inc. 2008 Omnibus Equity Incentive Plan (9) | |
| 10.11* | Employment Agreement entered into between CFS Bancorp, Inc., Citizens Financial Bank and Daryl D. Pomranke (7) | |
| 10.12* | CFS Bancorp, Inc. 2009 Cash Incentive Compensation Program (10) | |
| 10.13* | CFS Bancorp, Inc. 2009 Service Retention Program Agreement (10) | |
| 10.14* | Form of Indemnification Agreement, dated June 15, 2009, by and between CFS Bancorp, Inc. and each of Gene Diamond and Frank D. Lester (11) |
97
| 10.15 | Indemnification Agreement, dated June 15, 2009, by and between CFS Bancorp, Inc. and Lawrence T. Toombs (11) | |
| 10.16* | Amendment to the Employment Agreement between Citizens Financial Bank and Thomas F. Prisby (7) | |
| 10.17* | Amendment to the Employment Agreement between CFS Bancorp, Inc. and Thomas F. Prisby (7) | |
| 21.1 | Subsidiaries of CFS Bancorp, Inc. | |
| 23.0 | Consent of BKD, LLP | |
| 31.1 | Rule 13a-14(a) Certification of Chief Executive Officer | |
| 31.2 | Rule 13a-14(a) Certification of Chief Financial Officer | |
| 32.0 | Section 1350 Certifications |
| (1) | Incorporated by Reference to the Company’s Definitive Proxy Statement from the Annual Meeting of Shareholders filed with the SEC on March 25, 2005 (File No. 000-24611.) | |
| (2) | Incorporated by Reference to the Company’s Form 8-K filed on July 31, 2009. | |
| (3) | Incorporated by Reference to the Company’s Annual Report on Form 10-K for the year ended December 31, 2006 filed with the SEC on March 15, 2007. | |
| (4) | Incorporated by Reference to the Company’s Quarterly Report on Form 10-Q for the quarter ended March 31, 2008 filed with the SEC on May 5, 2008. | |
| (5) | Incorporated by Reference to the Company’s Definitive Proxy Statement for the Annual Meeting of Shareholders filed with the SEC on March 23, 2001 (File No. 000-24611.) | |
| (6) | Incorporated by Reference to the Company’s Definitive Proxy Statement for the Annual Meeting of Shareholders filed with the SEC on March 31, 2003 (File No. 000-24611.) | |
| (7) | Incorporated by Reference to the Company’s Form 8-K filed with the SEC on December 23, 2009. | |
| (8) | Incorporated by Reference to the Company’s Annual Report on Form 10-K for the year ended December 31, 2004 filed with the SEC on March 16, 2005 (File No. 000-24611.) | |
| (9) | Incorporated by Reference to the Company’s Definitive Proxy Statement for the Annual Meeting of Shareholders filed with the SEC on March 17, 2008. | |
| (10) | Incorporated by Reference to the Company’s Quarterly Report on Form 10-Q for the quarter ended March 31, 2009 filed with the SEC on May 4, 2009. | |
| (11) | Incorporated by Reference to the Company’s Form 8-K filed with the SEC on June 19, 2009. | |
| * | Indicates management contract or compensatory plan or arrangement required to be filed as an exhibit to this report. | |
98
SIGNATURES
Pursuant to the requirements of Section 13 or
15(d) of the Securities Exchange Act of 1934, the Registrant has duly caused
this report to be signed on its behalf by the undersigned, thereunto duly
authorized.
| CFS BANCORP, INC. | |||
| Date: March 10, 2010 | By: | /s/ THOMAS F. PRISBY | |
| THOMAS F. PRISBY | |||
| Chairman of the Board and | |||
| Chief Executive Officer | |||
Pursuant to the requirements of the Securities
Exchange Act of 1934, this report has been signed below by the following persons
on behalf of the Registrant and in the capacities and on the dates
indicated.
| Name | Title | Date | ||
| /s/ THOMAS F. PRISBY | Chairman of the Board and Chief Executive Officer | |||
| THOMAS F. PRISBY | (principal executive officer) | March 10, 2010 | ||
| /s/ CHARLES V. COLE | Executive Vice President and Chief Financial Officer | |||
| CHARLES V. COLE | (principal financial and accounting officer) | March 10, 2010 | ||
| /s/ GREGORY W. BLAINE | Director | March 10, 2010 | ||
| GREGORY W. BLAINE | ||||
| /s/ GENE DIAMOND | Director | March 10, 2010 | ||
| GENE DIAMOND | ||||
| /s/ FRANK D. LESTER | Director | March 10, 2010 | ||
| FRANK D. LESTER | ||||
| /s/ ROBERT R. ROSS | Director | March 10, 2010 | ||
| ROBERT R. ROSS | ||||
| /s/ JOYCE M. SIMON | Director | March 10, 2010 | ||
| JOYCE M. SIMON | ||||
99