Attached files
| file | filename |
|---|---|
| 8-K - FORM 8-K - REGIONS FINANCIAL CORP | d8k.htm |
 Citi
Financial Services Conference March 10, 2010 Exhibit 99.1 |
| 2 The information contained in this presentation may include forward-looking statements which reflect
Regions' current views with respect to future events and financial performance. The Private
Securities Litigation Reform Act of 1995 (the “Act”) provides a “safe harbor” for forward-looking statements which are identified as such and are accompanied by the identification of important factors that could cause actual results to differ materially
from the forward-looking statements. For these statements, we, together with our
subsidiaries, claim the protection afforded by the safe harbor in the Act. Forward-looking statements are not based on historical information, but rather are related to future operations, strategies, financial results or other developments.
Forward-looking statements are based on management’s expectations as well as certain assumptions and estimates made by, and information available to, management at the time the statements are
made. Those statements are based on general assumptions and are subject to various risks,
uncertainties and other factors that may cause actual results to differ materially from the views, beliefs and projections expressed in such statements. These risks, uncertainties and other factors include, but are not limited to, those
described below: › In 2008 the Emergency Economic Stabilization Act of 2008 became law and in February 2009 the American
Recovery and Reinvestment Act of 2009 was signed into law. Additionally, the U.S. Treasury and
federal banking regulators are implementing a number of programs to address capital and liquidity issues in the banking system, and there are a number of pending legislative and tax proposals, all of which may have significant
effects on Regions and the financial services industry, the exact nature and extent of which
cannot be determined at this time. › The impact of compensation and other restrictions imposed under the Troubled Asset Relief Program
(“TARP”) until Regions is able to repay the outstanding preferred stock issued under
the TARP. › Possible additional loan losses and impairment of goodwill, other intangibles and valuation allowances on
deferred tax assets and the impact on earnings and capital. › Possible changes in interest rates may affect funding costs and reduce earning asset yields, thus reducing
margins. › Possible changes in general economic and business conditions in the United States in general and in the
communities Regions serves in particular. › Possible changes in the creditworthiness of customers and the possible impairment of the collectability of
loans. › Possible changes in trade, monetary and fiscal policies, and other activities of governments, agencies, and
similar organizations, including changes in accounting standards, may have an adverse effect on
business. › Possible changes to laws and regulations, including pending limitations on service charges, may have a
negative impact on non-interest income. › The current stresses in the financial and real estate markets, including possible continued deterioration
in property values. › Regions' ability to manage fluctuations in the value of assets and liabilities and off-balance sheet
exposure so as to maintain sufficient capital and liquidity to support Regions' business.
› Regions' ability to achieve the earnings expectations related to businesses that have been acquired or that
may be acquired in the future. › Regions' ability to expand into new markets and to maintain profit margins in the face of competitive
pressures. › Regions' ability to develop competitive new products and services in a timely manner and the acceptance of
such products and services by Regions' customers and potential customers. › Regions' ability to keep pace with technological changes. › Regions' ability to effectively manage credit risk, interest rate risk, market risk, operational risk,
legal risk, liquidity risk, and regulatory and compliance risk. › The cost and other effects of material contingencies, including litigation contingencies. › The effects of increased competition from both banks and non-banks. › The effects of geopolitical instability and risks such as terrorist attacks. › Possible changes in consumer and business spending and saving habits could affect Regions' ability to
increase assets and to attract deposits. › The effects of weather and natural disasters such as droughts and hurricanes. The foregoing list of factors is not exhaustive; for discussion of these and other risks that may cause
actual results to differ from expectations, please look under the captions
“Forward-Looking Statements” and “Risk Factors” in Regions’ Annual Report on Form 10-K for the year ended December 31, 2009, as on file with the Securities and Exchange Commission. The words "believe," "expect," "anticipate," "project," and similar
expressions often signify forward-looking statements. You should not place undue reliance on any forward- looking statements, which speak only as of the date made. We assume no obligation to update or revise any
forward-looking statements that are made from time to time. Forward Looking
Statements |
| › David Turner – Chief Financial Officer › David Edmonds – Chief Administrative Officer › Operating Committee Formed › Executive Council Members › Regional Presidents › Head of Finance of the Four Regions › CEO of Morgan Keegan › Head of Operations & Technology › Chief Marketing Officer › Head of Human Resources Recent Management and Organizational Changes 3 |
| Positioned for Return to Profitability with Strong Underlying Fundamentals › Improving Credit Trends › Solid Capital Position › Geographically Diversified Franchise › Focus on Returning to Profitability through Excellent Execution › Strategic Priorities 4 |
 Investor Real Estate
- $21.7bn 24% of Total Portfolio Investor Real Estate $21.7bn 24% › Reduced by $4.1 billion, or 16%, since 2006 › Land/Single Family/Condo down $6.6bn › Excluding Business and Community, portfolio comprises 20% of total portfolio › Our goal is to further reduce this segment to no more than 15% of total portfolio › Construction represents 26% of the Investor Real Estate portfolio at year-end versus 38% at year-end 2008. $3.1bn is Business and Community Banking which is based on borrower strength and performs more like our C&I portfolio. 4Q09 losses were 0.63%. Portfolio Characteristics Remaining Portfolio $69.0bn / 76% 0 5,000 10,000 15,000 20,000 25,000 30,000 <$1MM $1MM- 10MM $10MM- 25MM $25MM+ $800 Thousand Average Loan Balance 23,750 2,928 386 84 # of Loans 5 |
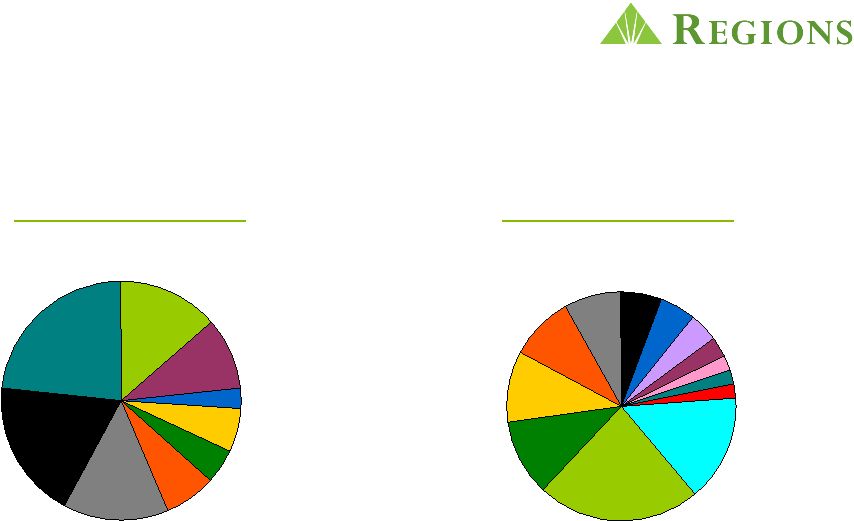 Investor Real Estate Portfolio is Diversified 24% of Total Portfolio* Other*** $3.3bn / 15% FL $5.0bn / 23% GA $2.4bn / 11% TX $2.2bn / 10% AL $1.9bn / 9% TN $1.7bn / 8% NC $1.3bn / 6% LA - $0.9bn / 5% SC - $0.8bn / 4% IL - $0.7bn / 3% AR - $0.5bn / 2% Product Geography** IN - $0.5bn / 2% VA - $0.5bn / 2% Land $3.0bn / 14% Single Family $2.1bn / 9% Condo - $0.6bn / 3% Hotel - $1.0bn / 5% Industrial - $1.5bn / 7% Office $3.1bn / 14% Retail $4.1bn / 19% Multi Family $5.0bn / 23% Other - $1.3bn / 6% 6 * 20% of Total Portfolio excluding Business and Community Banking ($3.1bn) which is based on borrower
strength and performs more like our C&I portfolio. ** By collateral location
*** Other includes states with exposure of less than 2% |
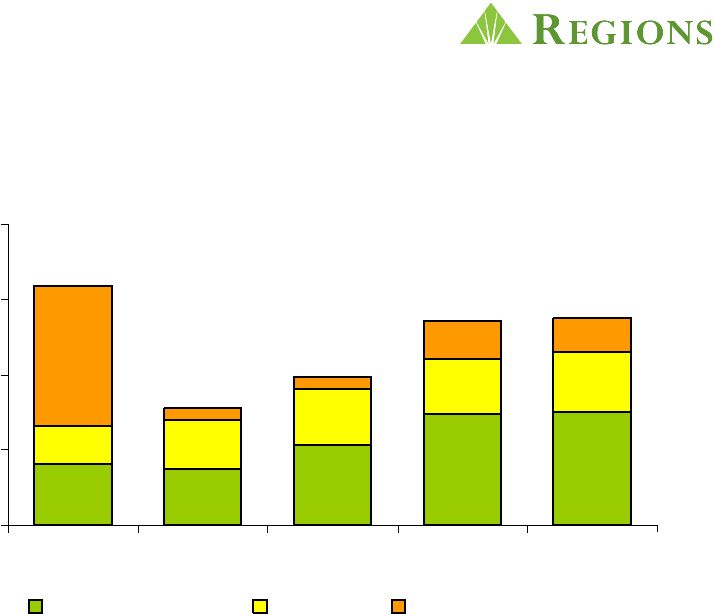 Charge-Offs Stabilizing but Remain Elevated $0 $250 $500 $750 $1,000 4Q08 1Q09 2Q09 3Q09 4Q09 Business Services Consumer Sales/Transfer to HFS $ millions $796 $390 $491 $680 $692 7 |
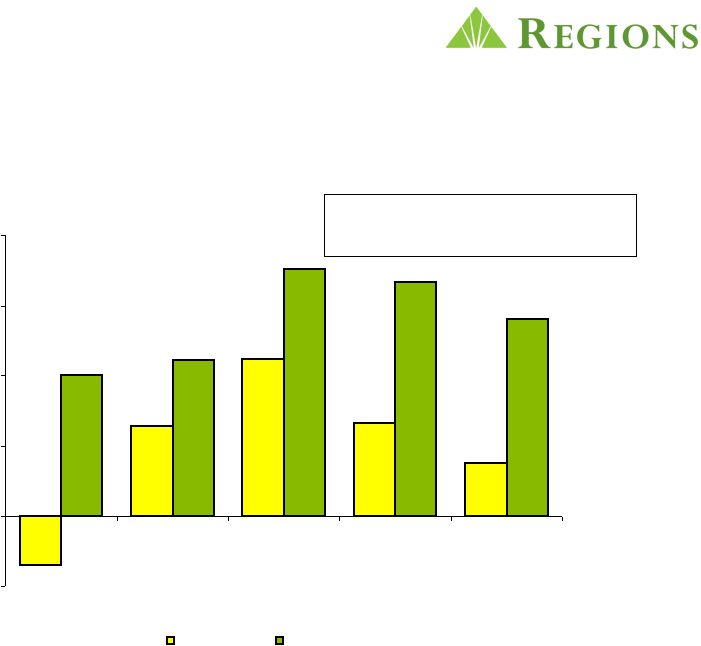 Gross
and Net NPA Migration Declining $ millions Net NPA* Change down 43% 3Q09 to 4Q09 * Excludes non-performing assets held for sale 8 -$500 $0 $500 $1,000 $1,500 $2,000 4Q08 1Q09 2Q09 3Q09 4Q09 Net NPA Change Gross NPA Additions |
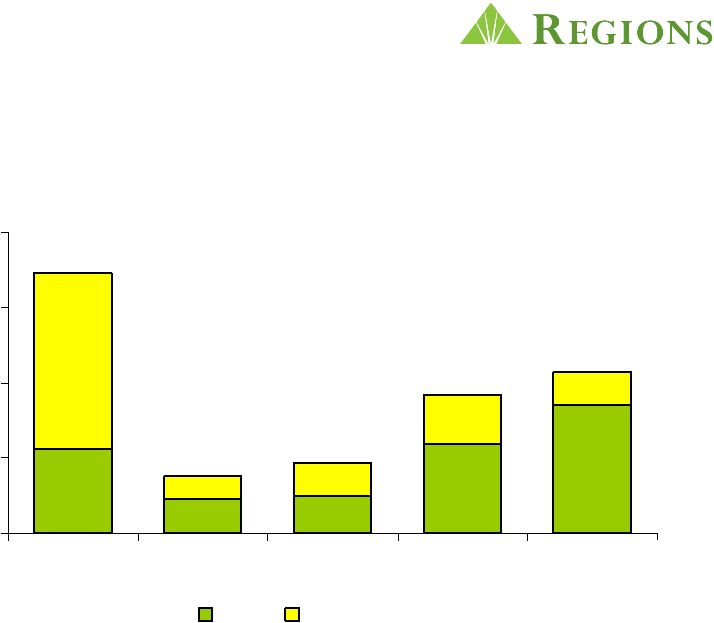
 Gross
NPA Migration Declining $0 $500 $1,000 $1,500 $2,000 1Q09 2Q09 3Q09 4Q09 Land/Condo/Single Family Income Producing CRE Business and Community Commercial Consumer $ millions $1.12B $1.76B $1.67B $1.40B › Non-Performing Asset migration continues to moderate from the 2 quarter high. Quarter over quarter, the gross migration was down 16% as a result of lower CRE
NPA inflow 9 nd |
 Disposed of $2.7 Billion in Problem Assets Over Past 15 Months $0 $300 $600 $900 $1,200 4Q08 1Q09 2Q09 3Q09 4Q09 Sales Transfer to HFS $ millions $228 $281 $554 $643 $1,039 Note: $2.7B of dispositions include loans sold or moved to held for sale. The 12/31/09 balance in held for sale was $317MM. 10 |
 Over
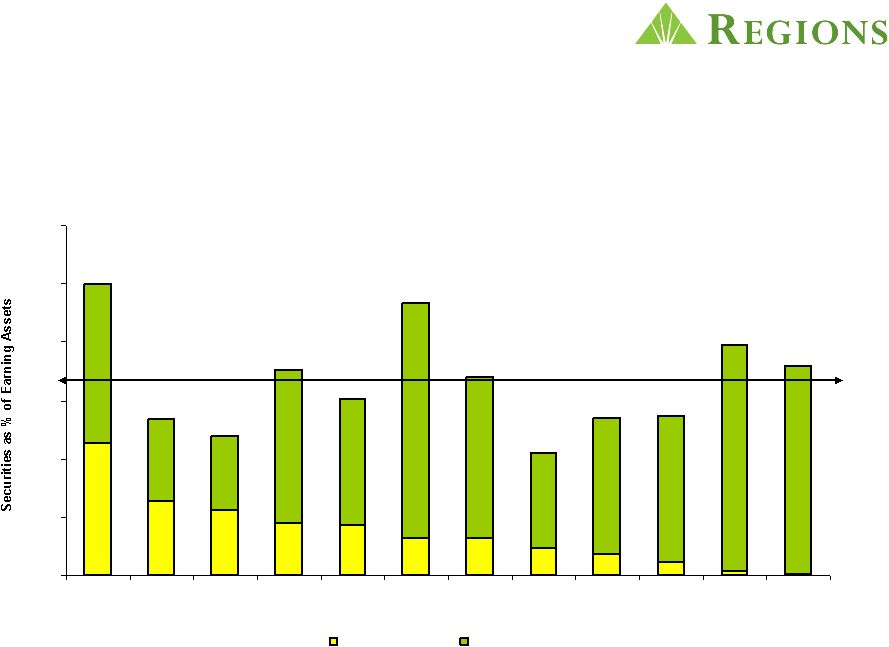
99% of Investment Portfolio is Agency Guaranteed 12/31/2009 0% 5% 10% 15% 20% 25% 30% RF % Non Agency % Agency Avg = 16.70% Sources: 12/31/09 Call Reports and Earnings Releases 11 Peers include: BAC, BBT, CMA, FITB, KEY, MI, PNC, STI, USB, WFC; MTB |
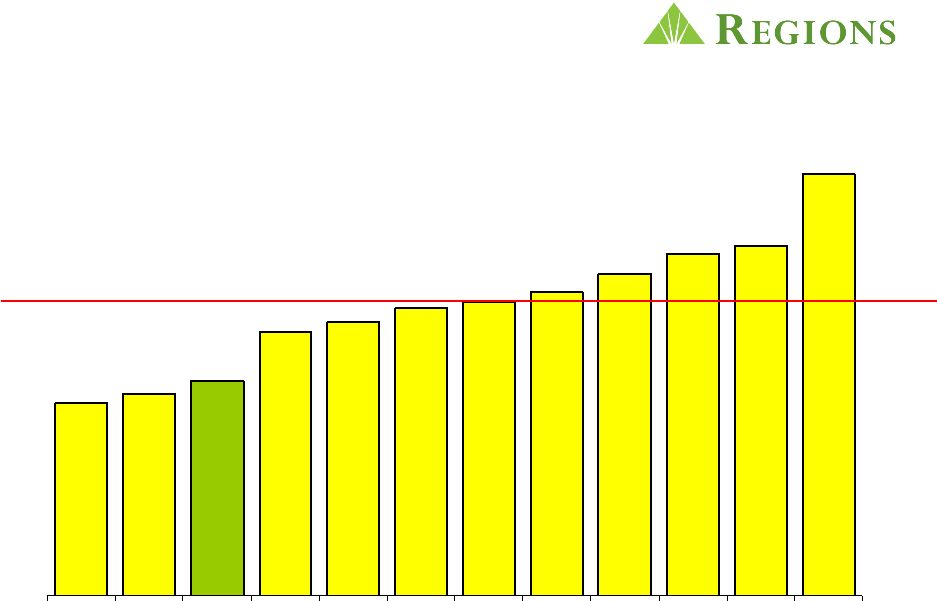 Q4
2009 Risk Weighted Assets/Total Assets Holding Company 69% 71% 73% 80% 82% 84% 85% 86% 89% 92% 93% 104% RF Peer Median 85% Source – FR Y-9 – 12/31/09 12 Peers include: BAC, BBT, CMA, FITB, KEY, MI, PNC, STI, USB, WFC; MTB |
| Capital Ratios Remain Strong 13 Total Risk-Based Capital 15.8% Tier 1 Capital 11.5% Tier 1 Common 7.2% As of December 31, 2009 |
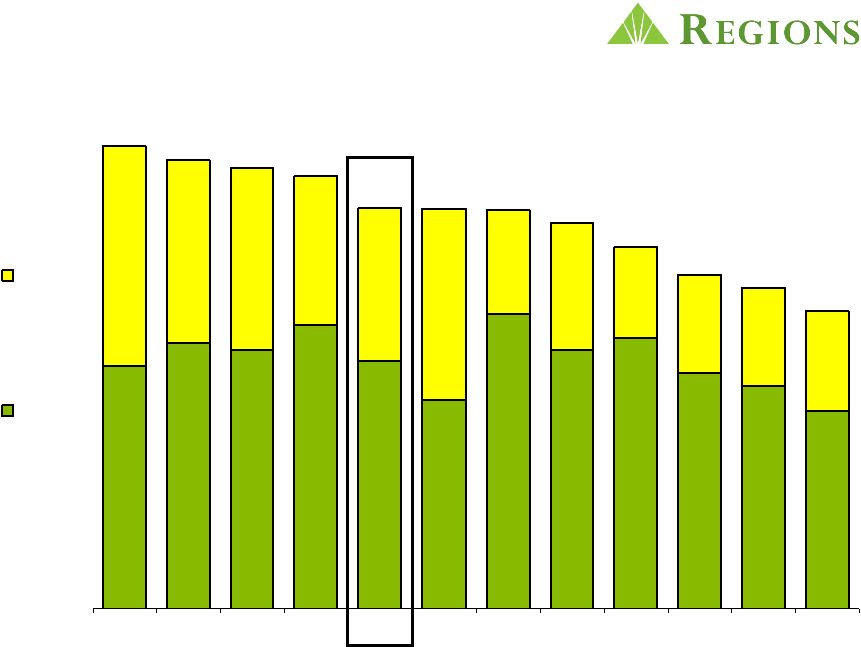 7.2 11.5 RF Tier 1 T1C Regions’ Capital Levels Strong and Comparable to Peers 14 Peers include: BAC, BBT, CMA, FITB, KEY, MI, PNC, STI, USB, WFC; MTB Capital ratios as of December 31, 2009 Source: SNL and Company Reports |
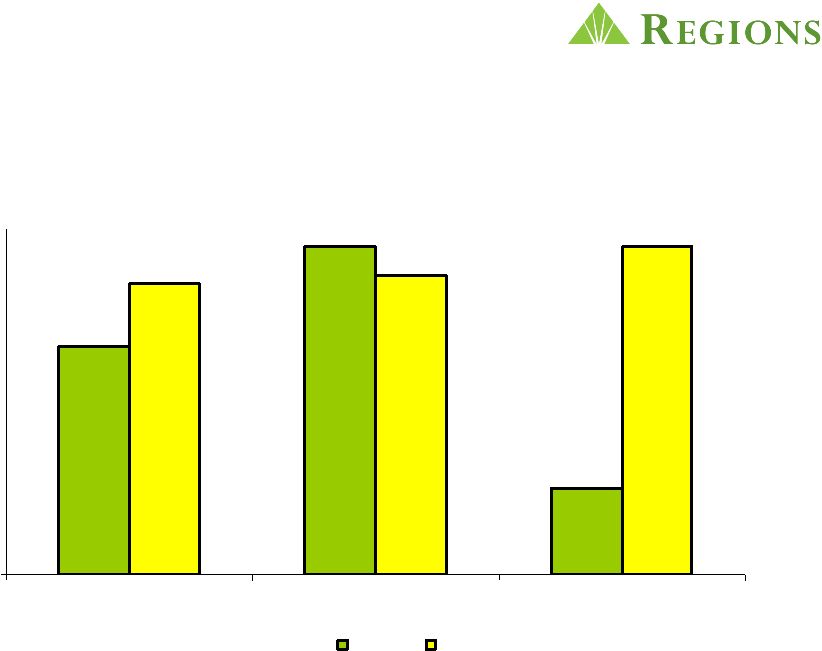 Superior Customer Satisfaction Drives Growth 1.6% 11.4% 794,236 1,008,106 6.1% 10.4% 0.000 New Checking Sales Attrition Household Growth 2008 2009 15 |
 Result = Increased Customer Deposits and Lower Cost › Opened a record 1,000,000+ new retail and business checking accounts in 2009 › Retention remains better than industry norms and at historical highs › Average customer deposits grew $1.6 billion linked quarter; over $8.4 billion year-over-year › Total deposit costs have declined 66 basis points in 2009 $80.0 $85.0 $90.0 $95.0 $100.0 Q408 Q109 Q209 Q309 Q409 1.00% 1.10% 1.20% 1.30% 1.40% 1.50% 1.60% 1.70% 1.80% 1.90% Customer Deposits Total Deposit Costs 10% year over year growth in average customer deposits 16 |
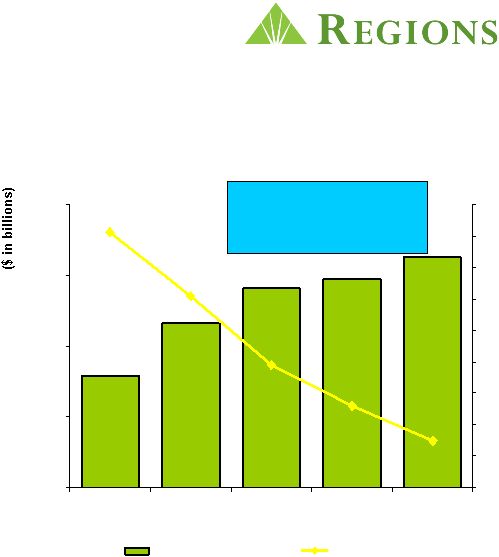
 Credit Available, but Demand Remains Soft › Commitment levels remain high › Utilization rates reflect weaker demand but stabilizing ($ in billions) Commercial 17 $25.0 $24.9 $24.5 $25.5 $24.9 48.9% 47.5% 45.4% 42.8% 41.2% $- $5.0 $10.0 $15.0 $20.0 $25.0 $30.0 Dec'08 Mar‘09 Jun‘09 Sept‘09 Dec'09 40% 42% 44% 46% 48% 50% 52% Commitments Utilization Rate |
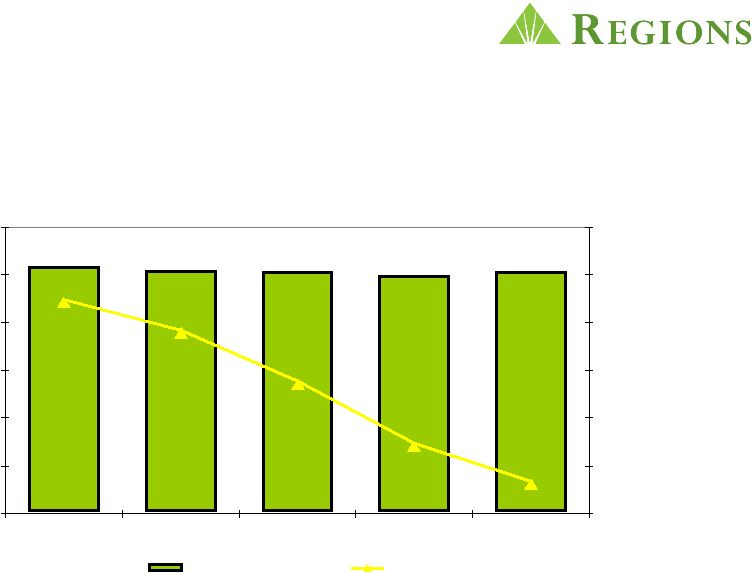
 Small Business Lending Stabilizing Small Business ($ in billions) 18 $4.6 $4.5 $4.4 $4.4 $4.5 $4.6 $4.5 $4.5 57.5% 57.6% 57.0% 57.3% 57.5% 56.9% 56.2% 57.1% $2.5 $3.0 $3.5 $4.0 $4.5 $5.0 Jun'09 July'09 Aug'09 Sept'09 Oct'09 Nov'09 Dec'09 Jan'10 50% 51% 52% 53% 54% 55% 56% 57% 58% 59% 60% Commitments Utilization Rate |
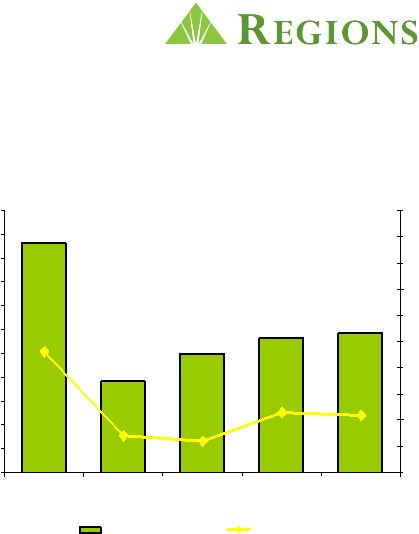
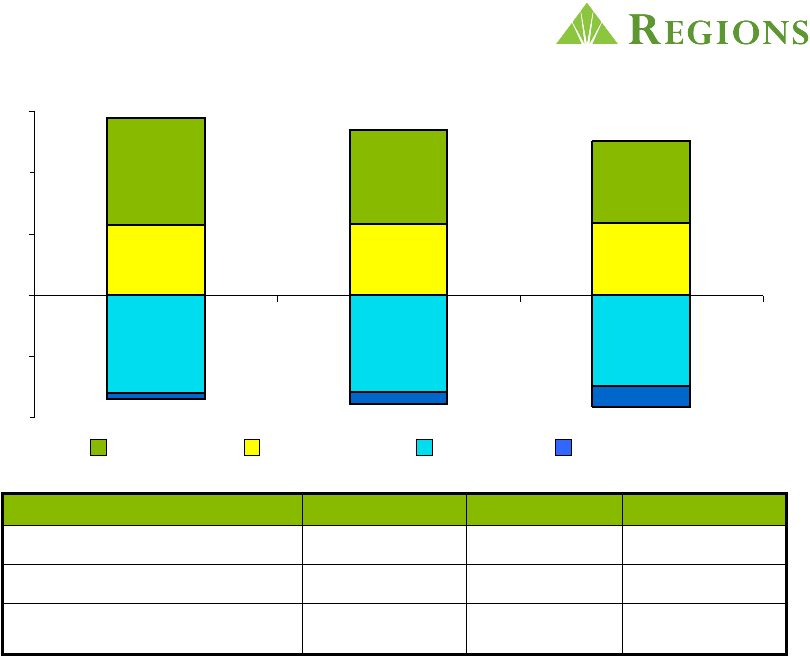 PPNR Trend 2,865 2,918 2,959 3,335 3,843 4,398 (3,704) (3,965) (3,991) (856) (483) (255) ($5,000) ($2,500) $0 $2,500 $5,000 $7,500 2007 2008 2009 $856 $483 $255 Recession-Related Expenses 19% 11% 6% Recession-Related Expenses as a % of Core Non-Interest Expense $1,734 $2,313 $3,017 Core PPNR 2009* 2008* 2007* ($ in millions) * Excludes Merger-related expenses, goodwill impairment, leveraged lease termination gains and other
items Net Interest Income Non-Interest Revenue Other Expenses Recession-Related Expenses 19 Millions |
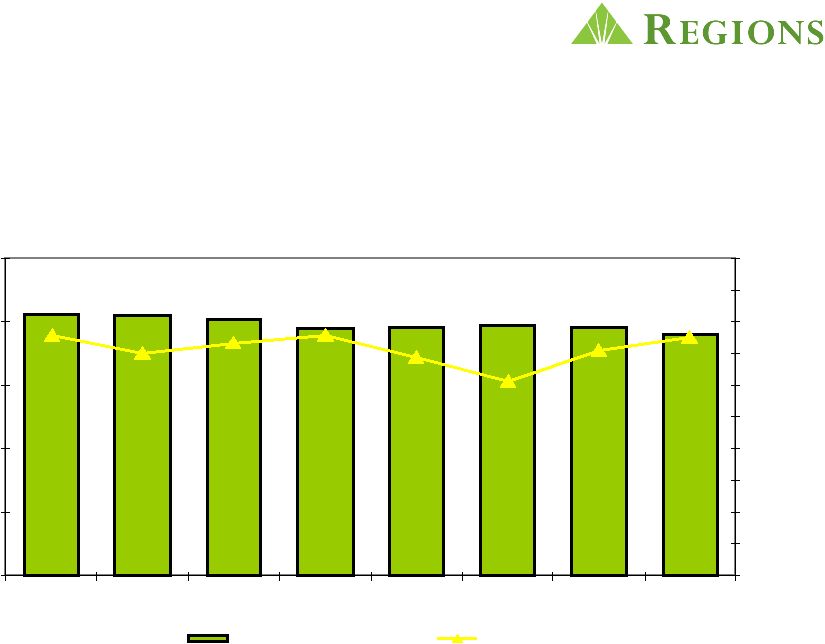
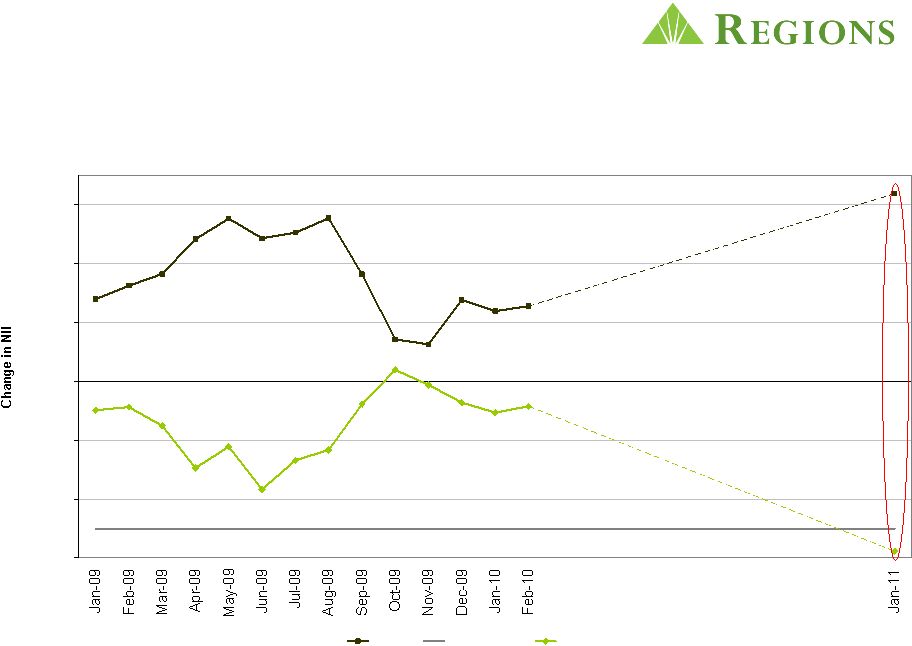
 Steady Net Interest Income and Resulting Margin; Expected to Rise throughout 2010 and Beyond › Stabilized Net Interest Margin; Expected to climb to 3.00% or higher by year-end 2010 › Consistent improvements in pricing of new and renewed loans › Ongoing improvement in deposit mix and pricing with substantial remaining repricing opportunity in maturing, higher cost CDs › Asset sensitive balance sheet well positioned for eventual rising rate environment 740 760 780 800 820 840 860 880 900 920 940 960 Q408 Q109 Q209 Q309 Q409 2.50% 2.60% 2.70% 2.80% 2.90% 3.00% 3.10% 3.20% 3.30% 3.40% 3.50% Net Interest Income Net Interest Margin 20 |
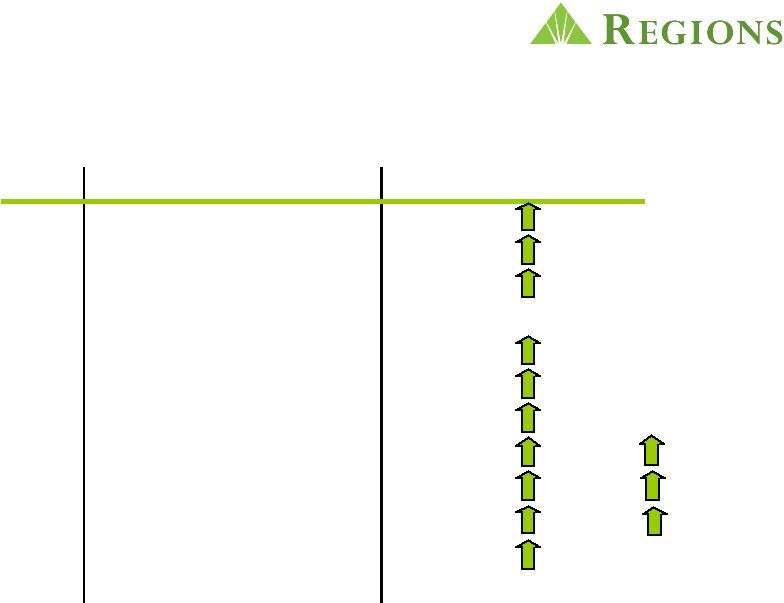
 -6.00% -4.00% -2.00% 0.00% 2.00% 4.00% 6.00% +100 Policy Limit -100 NII Sensitivity Timeline 21 |
| Non-interest Revenue Initiatives › Morgan Keegan › Checkcard / Merchant › Mortgage › Treasury Management › Capital Markets 22 |
| Focus
on Improving Efficiency and Effectiveness › Staffing › Occupancy › Branch Consolidation › Legal Fees › Telecom › Discretionary Spending 23 |
| Strategic Priorities Guiding Focus and Results › Keep Focused on the Customer › Protect the Future › Restore Financial Performance › Execute with Excellence 24 |
 |
| Appendix 26 |
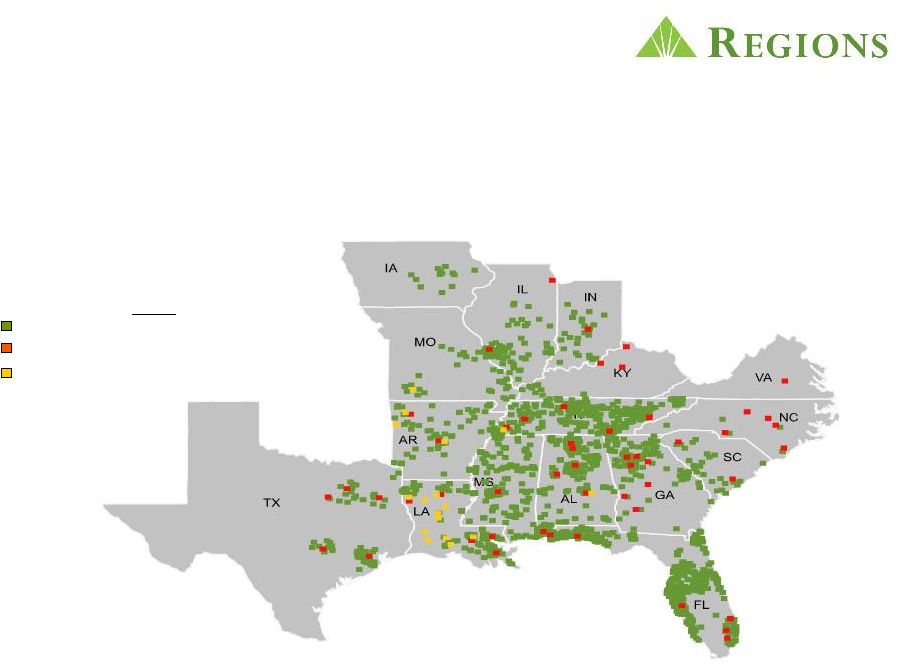 Diversified Southeastern Franchise › Strategically important position across a number of Southeastern markets Regions Morgan Keegan Insurance Offices 1,895 324 31 As of December 31, 2009 27 |
 Morgan Keegan - Leading Regional Retail Brokerage, Investment Banking and Financial Services Company Morgan Keegan Highlights › 1,267 Financial Advisors › 324 Offices in 19 States › $76 billion of customer assets › $70 billion of trust assets › $71 million assets per financial advisor › $4.2 billion of new brokerage assets added this year › Revenues of $1.3 billion in 2008 and 2009 Morgan Keegan Branches 28 |
 Strong and Improving Market Share Note: Based on June 30, 2009 FDIC data per SNL. Adjusted for brokered deposits in
MS and GA. 29 State Deposits ($B) Rank AL 18.9 20 % 23 % 1 FL 17.4 19 4 4 TN 17.3 18 16 1 LA 7.3 8 9 3 MS 7.0 7 16 1 GA 6.4 7 4 6 AR 4.6 5 9 2 TX 3.7 4 1 16 IL 2.7 3 1 24 MO 2.5 3 2 9 IN 2.4 3 3 9 Other 3.5 4 - - % of Total Mkt. Share |