Attached files
| file | filename |
|---|---|
| 8-K - FORM 8-K - EXELON GENERATION CO LLC | d8k.htm |
 Investor Meetings March 2010 Exhibit 99.1 |
 2 Forward-Looking Statements This presentation includes forward-looking statements within the meaning of the
Private Securities Litigation Reform Act of 1995, that are subject to risks
and uncertainties. The factors that could cause actual results to differ
materially from these forward-looking statements include those discussed
herein as well as those discussed in (1) Exelon’s 2009 Annual Report on
Form 10-K in (a) ITEM 1A. Risk Factors, (b) ITEM 7. Management’s
Discussion and Analysis of Financial Condition and Results of Operations and
(c) ITEM 8. Financial Statements and Supplementary Data: Note 18; and (2)
other factors discussed in filings with the Securities and Exchange Commission (SEC) by Exelon Corporation, Commonwealth Edison Company, PECO Energy Company and Exelon Generation Company, LLC (Companies). Readers are cautioned
not to place undue reliance on these forward-looking statements, which apply
only as of the date of this presentation. None of the Companies undertakes
any obligation to publicly release any revision to its forward-looking
statements to reflect events or circumstances after the date of this
presentation. This presentation includes references to adjusted
(non-GAAP) operating earnings and non-GAAP cash flows that exclude
the impact of certain factors. We believe that these adjusted operating
earnings and cash flows are representative of the underlying operational results of the Companies. Please refer to the appendix to this presentation
for a reconciliation of adjusted (non-GAAP) operating earnings to GAAP
earnings. Please refer to the footnotes of the following slides for a
reconciliation non-GAAP cash flows to GAAP cash flows.
|
 3 Leader in the U.S. Electric Power Industry Leading market cap in the sector at ~$30 billion, investment grade balance sheet Experienced management team with track record of creating and returning shareholder value • Exelon formed through combination of ComEd and PECO Energy in 2000 • Total shareholder return (1) of 108% since October 2000, compared to 58% for the Philadelphia Utility Index, and a negative 3% for the S&P 500 • ~4.5% dividend yield Largest, best operated merchant generator of electricity in the U.S. • Ownership interest in 19 operating nuclear reactors • Largest nuclear operator in U.S. with 18% of nuclear output; third largest in the
world • Industry-leading capacity factors and generating cost among nuclear fleets in the
U.S. • Geographically well-situated in competitive markets and part of PJM, the largest
RTO Two stable utility companies operating in large metropolitan markets
Best positioned in the industry for upside from carbon legislation or
regulation • In addition to positive leverage to upside from natural gas, coal and capacity
prices Exelon’s asset base, operational performance and presence in
competitive markets enable us to capture and create value (1) Total shareholder return from October 20, 2000 through March 5, 2010.
|
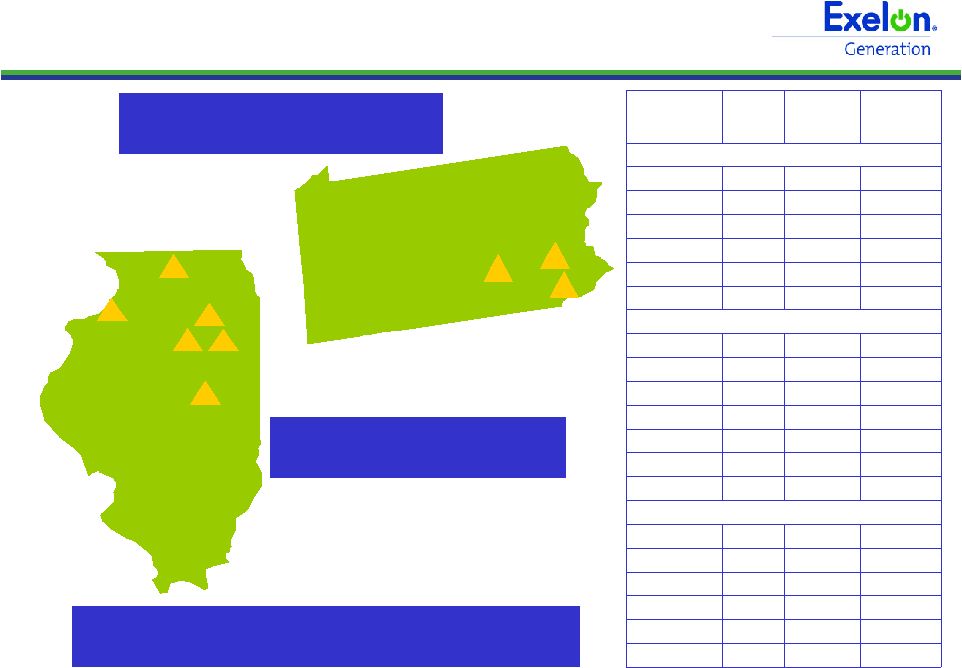
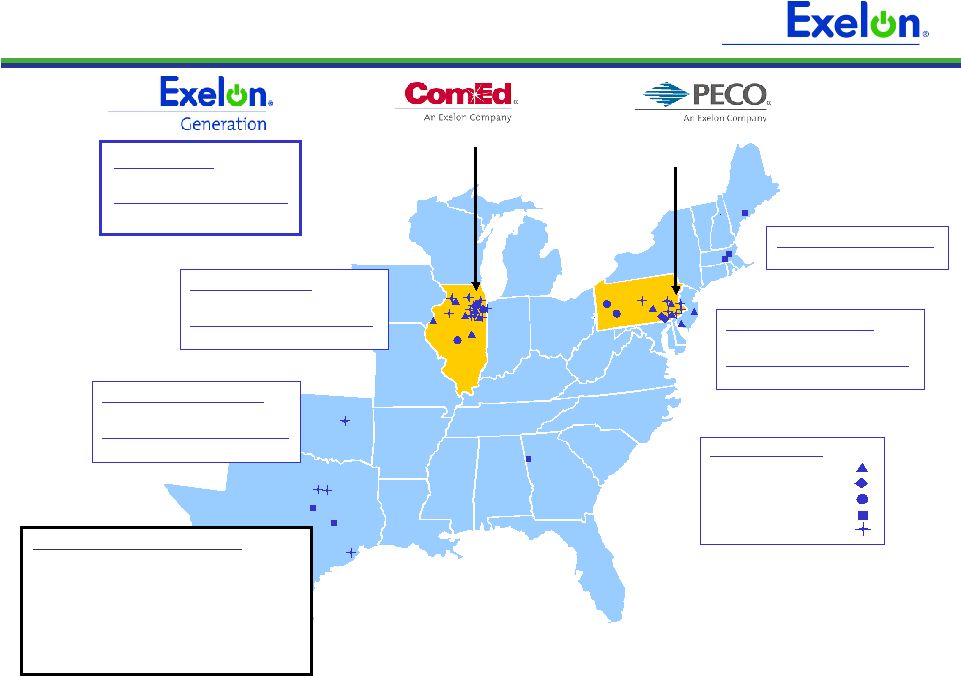 4 Multi-Regional, Diverse Company (1) Standard & Poor’s senior unsecured debt rating as of February 28,
2010. Note: Owned megawatts as of December 31, 2009 based on
Generation’s ownership, using annual mean ratings for nuclear units
(excluding Salem) and summer ratings for Salem and the fossil and hydro
units. Midwest Capacity Owned: 11,412 MW Contracted: 2,900 MW Total: 14,312 MW ERCOT/South Capacity Owned: 2,222 MW Contracted: 2,917 MW Total: 5,139 MW New England Capacity Owned: 182 MW Total Capacity Owned: 24,850 MW Contracted: 6,153 MW Total: 31,003 MW Electricity Customers: 1.6M Gas Customers: 0.5M Electricity Customers: 3.8M Generating
Plants Nuclear Hydro Coal/Oil/Gas Base-load Intermediate Peaker Mid-Atlantic Capacity Owned: 11,034 MW Contracted: 336 MW Total: 11,370 MW Exelon Financial Highlights 2009 Operating Earnings: $2.7B 2009 EPS: $4.12 Assets at
12/31/09: $49.2B Total Debt at 12/31/09: $12.6B Credit Rating: (1) BBB- |
 5 0 10 20 30 40 50 60 2000 2001 2002 2003 2004 2005 2006 2007 2008 2009 Industry (w/o Exelon) Exelon Note: Exelon data includes Salem. 2009 average includes 23 days of TMI
outage that extended into 2010 reflecting steam generator replacement.
Exelon Generation Consistently Delivers Top-Tier Results Exelon Generation has ability to replicate best practices on a large scale Source: Platts News Flashes and Company Press Releases, 11/3/09 Refueling Outage Duration • 93.6% capacity factor – the 7 consecutive year exceeding 93% • Clinton and Quad Cities 1 units established new continuous run records of 596 and 594 days, respectively • TMI 1 unit set a new PWR world record for a 705-day continuous run • Equipment upgrades and power uprates added 70 MW of nuclear capacity 0 200 400 600 800 Byron 1 Limerick 2 Byron 2 Braidwood 2 Quad Cities 1 Clinton Three Mile Island 1 Three Mile Island 1 Three Mile Island 1 LaSalle 1 Three Mile Island 1 Three Mile Island 1 Peach Bottom-3 Peach Bottom-3 LaSalle 2 LaSalle 1 (Days) th 2009 Nuclear Fleet Achievements Nuclear Reliability 30 Longest Continuous U.S. Runs |
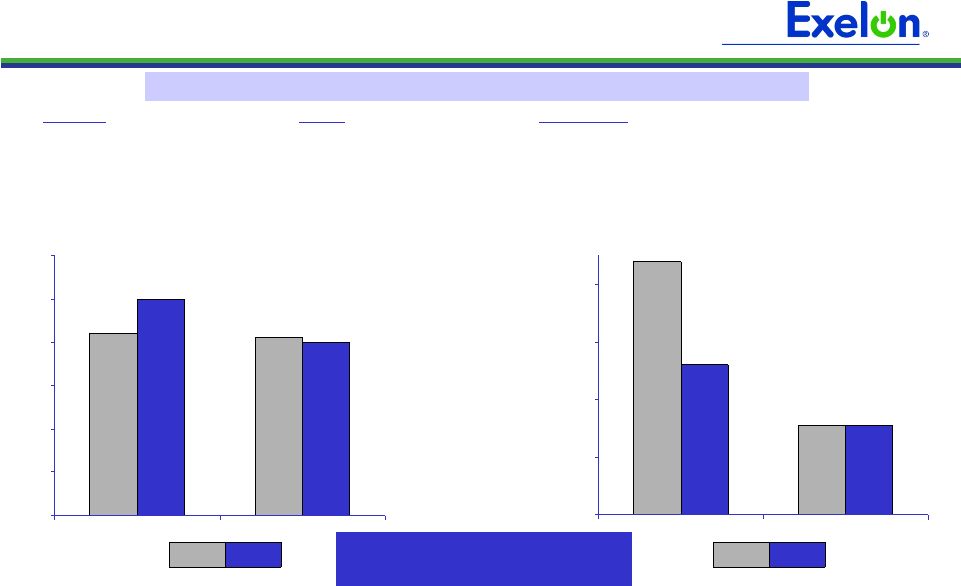
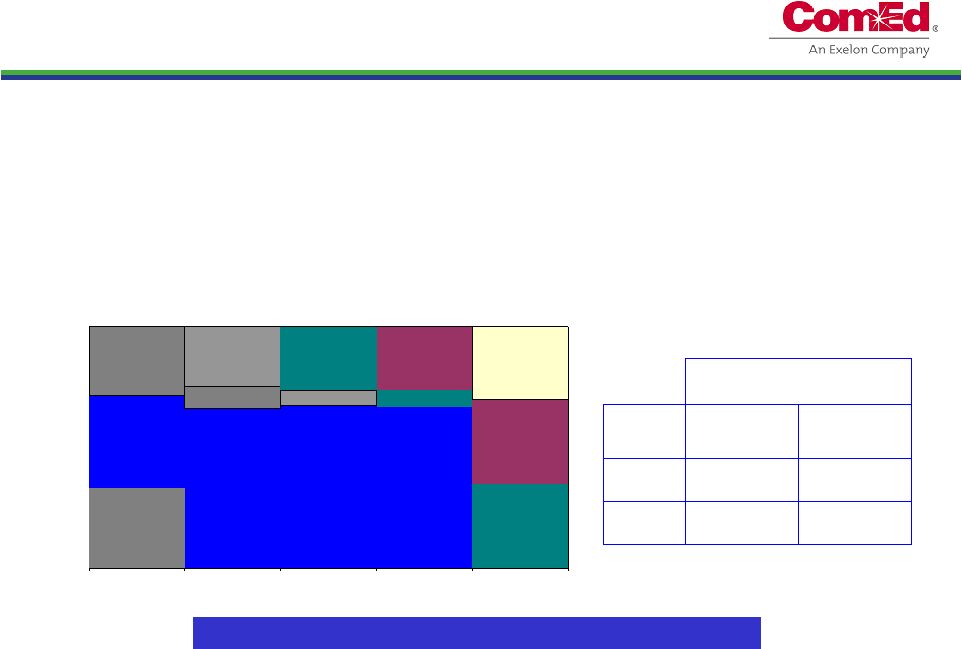
 6 6.1 6.9 2.0 2.0 7.3 6.4 2.0 2.2 Transmission Distribution ComEd Building Strength Producing Results with Regulatory Recovery Plan ~46% ~47% 8.5% 46.4% Earned ROE Equity (1) 5.5% 45.4% $8.1 $8.4 $9.4 2008 2009 2011 (Illustrative) (2) Average Annual Rate Base ($ in billions) (1) Equity based on definition provided in most recent Illinois Commerce Commission (ICC)
distribution rate case order (book equity less goodwill). (2) Provided solely to illustrate possible future outcomes that are based on a number of
different assumptions, including an ROE target, all of which are subject to uncertainties and should not be relied upon as a forecast of future results. Note: Amounts may not add due to rounding. 2010E $8.9 ComEd executing on regulatory recovery plan resulting in healthy increases in earned ROE 10% 10% • Significant improvement in earned ROE, from 5.5% in 2008 to 8.5% in 2009, targeting at least 10% in 2010 • Continued strong operational performance • Benefiting from regular transmission updates through a formula rate plan • Uncollectibles expense rider tariff approved by ICC in February 2010 • Anticipate electric distribution rate filing in 2010 • ICC approved Illinois Power Agency’s 2010 procurement plan order; annual procurement event expected to take place in Spring 2010 • ICC approved Smart Meter pilot program and rider • Standard & Poor’s raised credit ratings in 3Q09 and Fitch in 1Q10 |
 7 2.7 2.8 3.0 3.2 0.5 0.5 0.5 1.1 1.1 1.1 1.2 0.6 2.0 1.3 0.5 Gas Competitive Transition Charge (CTC) Electric Transmission Electric Distribution PECO Executing on Transition Plan Actively Engaged in Transition • Targeted earned ROE of ~11% in 2010; 9-11% post transition • Anticipate electric and gas rate filings by end of 1Q10 • Selected as 1 of 6 companies to receive maximum Federal stimulus award of $200 million for smart grid / smart meter investment • PA Public Utility Commission approval expected in 1Q10 to implement Smart Meter Plan of Pennsylvania Act 129 • Fixed price PPA with ExGen ends 12/31/10 • Two procurement events for electricity supply post-2010 were conducted, including 49% of 2011 residential load; next procurement in May 2010 ~9 – 11% Not applicable due to transition rate structure Rate Making ROE Equity ~50-53% $6.3 $5.7 $5.0 Average Annual Rate Base (1) ($ in billions) 2008 2009 2011 (Illustrative) (2) (1) Rate base as determined for rate-making purposes. (2) Provided solely to illustrate possible future outcomes that are based on a number of
different assumptions, all of which are subject to uncertainties and should not be relied upon as a forecast of future results. $5.1 2010E PECO is managing through its transition period and is positioned for continued strong financial performance post-2010 |
 8 Nuclear Uprates - 1,300–1,500 MW of new Exelon nuclear capacity by 2017, the equivalent of a new nuclear plant at roughly half the cost of a new plant and no incremental operating costs - Approximately $725 million in investments to build smart grid infrastructure over the coming years with a regulated return on investment - Lowest carbon intensity in the sector, significant upside if and when legislation enacted or regulations promulgated, and enhancing industry-leading position with Exelon 2020 - Positioned to benefit from increases in natural gas and coal prices, heat rates, and demand growth - Leveraging transmission expertise across the company and in developing Exelon Transmission Company with the goal of improving reliability, reducing congestion and moving renewable energy to population centers Deploying Capital for Shareholder Value Smart Grid Environmental Commodity Leveraged Transmission |
 9 Source: Ventyx Velocity Suite Database Bubble size represents carbon intensity, expressed in terms of metric tons of CO2 per MWh
generated 0 50 100 150 50 100 150 200 2008 Gross Generation (TWh) Exelon AEP Southern Duke TVA FPL Entergy Dominion Berkshire Hathaway Calpine NRG First Energy Xcel Ameren Progress 250 Lowest CO2 Intensity of Large Generators 15 Berkshire Hathaway 0.84 14 Ameren Corp 0.81 13 NRG Energy 0.78 12 AEP 0.77 11 Xcel Energy 0.74 10 Southern 0.69 9 Duke Energy 0.63 8 Progress Energy 0.61 7 TVA 0.60 6 FirstEnergy 0.55 5 Dominion 0.49 4 Calpine 0.39 3 FPL Group 0.33 2 Entergy 0.27 1 Exelon 0.06 (1) Exelon 2020 is Exelon’s comprehensive plan to reduce, displace or offset
15 million metric tons of greenhouse gas emissions each year by 2020. Exelon
2020 (1) will ensure that Exelon maintains and extends its position as the nation’s top low-carbon power generator Lowest Carbon Intensity of the Largest U.S. Generators CO2 Emissions of Largest U.S. Electricity Generators |
 10 Protect Today’s Value • Deliver superior operating performance • Advance competitive markets • Exercise financial discipline and maintain financial flexibility • Build healthy, self-sustaining delivery companies Grow Long-Term Value • Drive the organization to the next level of performance • Adapt and advance Exelon 2020 • Rigorously evaluate and pursue new growth opportunities in clean technologies and transmission • Build the premier, enduring competitive generation company + Exelon’s Strategic Direction Excel in managing the elements of our business we can control, while being strategic, thoughtful and disciplined with the elements we cannot control
|
 11 Appendix |
 12 The Exelon Companies ’09 Earnings: $2,092M ’09 EPS: $3.16 Total Debt: (1) $3.0B Credit Rating: (2) BBB Nuclear, Fossil, Hydro & Renewable Generation Power Marketing ‘09 Operating Earnings: $2.7B ‘09 EPS: $4.12 Assets: (1) $49.2B Total Debt: (1) $12.6B Credit Rating: (2) BBB- Note: All ’09 income numbers represent adjusted (Non-GAAP) Operating Earnings
and EPS. Refer to Appendix for reconciliation of adjusted (non-GAAP) operating EPS to GAAP EPS. (1) As of December 31, 2009. (2) Standard & Poor’s senior unsecured debt ratings for Exelon and Generation and
senior secured debt ratings for ComEd and PECO as of February 28, 2010. Pennsylvania Utility Illinois Utility ’09 Earnings: $356M $354M ’09 EPS: $0.54 $0.54 Total Debt: (1) $5.1B $2.8B Credit Ratings: (2) A- A- |
 13 2010 Events of Interest Q1 Q2 Q3 Q4 RPM Auction (May) Uncollectibles rider tariff (2/2) Illinois Power Agency RFP (spring) Illinois Primaries (2/2) Pennsylvania Primaries (5/18) Electric and gas distribution rate case filings (March) Procurement RFP (May, results in June) Procurement RFP (Sep., results in Oct.) Electric distribution rate case filing (TBD) Illinois Elections (11/2) Pennsylvania Elections (11/2) |
 14 O&M Cost Savings Initiative Inflation Pension/OPEB 2010 Operating Earnings Guidance (1) 2010E 2009A $0.54 $3.16 $4.12 (1) ComEd PECO Exelon Generation ComEd RNF PECO RNF Generation RNF Depreciation and Amortization 2010 Earnings Drivers ComEd PECO Exelon Generation Holdco Holdco Exelon $0.54 Exelon $3.60 - $4.00 (1) $0.60 - $0.70 $0.40 - $0.50 $2.55 - $2.80 (1) We reaffirmed 2010 earnings guidance on January 22, 2010, and we are not updating earnings guidance at this time. Earnings guidance is only reviewed in connection with our quarterly earnings announcements or if we expressly indicate that
we are updating the guidance. Refer to the Appendix for a reconciliation of adjusted (non-GAAP) operating earnings to GAAP earnings. Note: A = Actual; E = Estimate 2010 operating earnings guidance of $3.60 to $4.00/share – 1Q10 earnings expectations between $0.85 to $0.95/share (1) |
 15 Delivering on Cost Savings Commitments Holding O&M below 2008 levels for second consecutive year Committed to 2010 O&M target of $4.35 billion, offsetting inflation and $35 million
of higher pension and OPEB expense with additional cost savings • Reduced positions by 500 (400 in corporate support and 100 at ComEd) in 2009 • Freezing executive salaries and reducing other compensation benefits for 2010
Notes: The information on this slide is the same as disclosed on January 22, 2010
and has not been updated to reflect any changes that may have occurred
since that date. Data contained on this slide is rounded. ($ millions) $0.7 $0.6 PECO (1) $1.0 $1.0 ComEd (1) $2.7 $2.7 Generation 2010E 2009A $ billions (2) (2) (2) O&M Expense (1) $4,500 $4,300 $4,350 $450 $415 $245 2008A 2009A 2010E Total O&M Pension/OPEB Expense (1) Reflects operating O&M data and excludes decommissioning effect. ComEd and PECO operating O&M
exclude energy efficiency and smart meter costs recoverable under a rider. (2) Exelon Consolidated includes operating O&M expense from Holding Company.
|
 16 Cash Contributions $0 $100 $200 $300 $400 Pension OPEB Pension and OPEB Plans Key Metrics – 12/31/09E ($ in millions) Pension Assets $7,840 Obligations $11,480 2010E 2009 $210 $250 $205 $200 $440 $260 $155 $155 2010E 2009 (1) (2) (3) OPEB Assets $1,475 Obligations $3,660 Key Metrics 2009 asset return 21% 12/31/09 discount rate 5.83% Assumed long-term
EROA 8.50% Pension and OPEB expense is increasing by $35 million pre-tax Pension and OPEB Expense and Contributions Pre-Tax Expense (4) $0 $50 $100 $150 $200 $250 $300 Pension OPEB (1) Includes settlement charges. (2) Contributions reflect the application of recently issued U.S. Treasury Department guidance and cover both
the qualified and non-qualified plans. 2009 contributions include a $350 million
discretionary contribution. 2010 pension contributions are based on minimum regulatory requirements and additional amounts required to avoid benefit restrictions. Management may elect to make additional discretionary contributions. (3) Approximately $100 million of the 2009/2010 OPEB contributions is discretionary. Management has not
yet made a decision regarding its 2010 OPEB contributions. Contributions shown above include
amounts paid out of corporate assets. (4) Assumes an ~20% overall capitalization rate for pension and OPEB costs. Notes: OPEB = other postretirement benefits; EROA = expected return on assets. The information on
this slide is the same as disclosed on January 22, 2010 and has not been updated to reflect any
changes that may have occurred since that date. Data contained on this slide is rounded. |
 17 Capital Expenditures Expectations 1,975 1,925 1,825 1,950 1,950 775 900 850 1,125 1,150 200 50 375 550 675 50 25 100 150 75 300 300 275 225 200 $0 $750 $1,500 $2,250 $3,000 $3,750 $4,500 2008A 2009A 2010E 2011E 2012E Base CapEx Nuclear Fuel Nuclear Uprates and Solar Smart Grid New Business at Utilities Exelon $3,125 $3,275 $3,375 (1) $4,050 $4,150 Note: Data contained on this slide is rounded. $ millions (1) Does not include $85M increase in ComEd CapEx reflected in Exelon’s 2009
Annual Report on Form 10-K, of which approximately $65M related to
Smart Grid/Utility Growth. 2008A 2009A 2010E 2011E 2012E Exelon Generation Base CapEx 875 875 750 900 900 Nuclear Fuel 775 900 850 1,125 1,150 Nuclear Uprates 50 150 350 550 675 Solar - 50 25 - - Total ExGen 1,700 1,975 1,975 2,575 2,725 ComEd Base CapEx 675 650 625 625 625 Smart Grid/Meter 25 50 50 25 25 New Business 250 150 175 200 225 Total ComEd (1) 950 850 850 850 875 PECO Base CapEx 350 350 400 400 400 Smart Grid/Meter - - 50 125 50 New Business 50 50 50 75 75 Total PECO 400 400 500 600 525 Corporate 75 50 50 25 25 |
 18 2010 Projected Sources and Uses of Cash (325) n/a (100) (225) Utility Growth CapEx (5) ($ millions) Exelon (10) Beginning Cash Balance (1) $1,050 Cash Flow from Operations (1)(2) 1,025 900 2,325 4,250 CapEx (excluding Nuclear Fuel, Nuclear Uprates and Solar Project, Utility Growth CapEx) (3) (625) (400) (750) (1,825) Nuclear Fuel n/a n/a (850) (850) Dividend (4) (1,400) Nuclear Uprates and Solar Project n/a n/a (375) (375) Net Financing (excluding Dividend): Planned Debt Issuances (6,7) 250 -- 300 550 Planned Debt Retirements (8) (225) (400) -- (1,025) Other (9) 25 175 -- 125 Ending Cash Balance (1) $175 Note: The information on this slide is the same as disclosed on January 22, 2010 and has not been updated
to reflect any changes that may have occurred since that date. (1) Excludes counterparty collateral activity. (2) Cash Flow from Operations primarily includes net cash flows provided by operating activities and net cash
flows used in investing activities other than capital expenditures. Cash Flow from
Operations for PECO and Exelon includes $572 million for competitive transition charges. Net cash flow from operations includes $225 million of timing differences from 2009. (3) Does not include $20M increase in ComEd CapEx reflected in Exelon’s 2009 Annual Report on Form
10-K. (4) Assumes 2010 dividend of $2.10/share. Dividends are subject to declaration by the Board of Directors.
(5) Represents new business and smart grid/smart meter investment. Does not include $65M increase in
ComEd CapEx related to Smart Grid/Utility Growth reflected in Exelon’s 2009 Annual Report
on Form 10-K. (6) Excludes Exelon Generation’s $213 million and ComEd’s $191 million tax-exempt bonds that are
backed by letters of credit (LOCs). Excludes PECO’s $225 million Accounts Receivable
(A/R) Agreement with Bank of Tokyo. Assumes PECO’s A/R Agreement is extended in accordance with its terms beyond September 16, 2010. (7) Exelon Generation’s $300 million financing assumes a $50 million DOE loan for the City Solar Project
and $250 million of debt to refinance a portion of Exelon Corp’s $400 million maturity.
(8) PECO’s planned debt retirement of $400 million represents the final retirement of the PECO Energy
Transition Trust. (9) “Other” includes PECO Parent Receivable, proceeds from options and expected changes in
short-term debt. (10) Includes cash flow activity from Holding Company, eliminations, and other corporate entities.
|
 19 Sufficient Liquidity (1) Excludes previous commitment from Lehman Brothers Bank and commitments from
Exelon’s Community and Minority Bank Credit Facility. (2)
Available Capacity Under Facilities represents the unused bank commitments under the borrower’s credit agreements net of outstanding letters of credit and facility draws. The amount of commercial paper outstanding does not reduce the available
capacity under the credit agreements. (3) Includes other corporate
entities. (120) -- -- (120) Outstanding Facility Draws (439) (163) (10) (261) Outstanding Letters of Credit $7,317 $4,834 $574 $952 Aggregate Bank Commitments (1) 6,758 4,671 564 571 Available Capacity Under Facilities (2) (85) -- -- (85) Outstanding Commercial Paper $6,673 $4,671 $564 $486 Available Capacity Less Outstanding Commercial Paper Exelon (3) ($ millions) At February 28, 2010, Exelon had $6.8B of available capacity through its credit facilities and $85M of commercial paper outstanding Available Capacity Under Bank Facilities as of February 28, 2010
|
 20 $0 $200 $400 $600 $800 $1,000 $1,200 $1,400 2010 2012 2014 2016 2018 2020 2022 2024 2026 2028 2030 2032 2034 2036 2038 2040 2042 Exelon Corp Exelon Generation ComEd PECO Debt Maturity Profile Note: Balances shown exclude securitized debt and include capital leases. Refinancing in 3Q 2009 of Exelon Generation and Exelon 2011 maturities decreased average
cost of debt, extended average maturities and reduced refinancing
risk |
 21 Projected 2010 Key Credit Measures 13.8x 8.1x FFO / Interest Generation / Corp: 62% 34% FFO / Debt 53% 68% Rating Agency Debt Ratio BBB A- A- BBB- S&P Credit Ratings (3) BBB+ A BBB+ BBB+ Fitch Credit Ratings (3) A3 A2 Baa1 Baa1 Moody’s Credit Ratings (3) 3.7x 3.8x FFO / Interest ComEd: 18% 14% FFO / Debt 42% 49% Rating Agency Debt Ratio 5.2x 5.0x FFO / Interest PECO: 28% 23% FFO / Debt 46% 50% Rating Agency Debt Ratio 29% 47% Rating Agency Debt Ratio 87% 44% FFO / Debt 18.6x 9.9x FFO / Interest Generation: 46% 37% 7.2x Without PPA & Pension / OPEB (2) 57% Rating Agency Debt Ratio 25% FFO / Debt 6.0x FFO / Interest Exelon Consolidated: With PPA & Pension / OPEB (1) Notes: Exelon and PECO metrics exclude securitization debt. See following slide for FFO (Funds from Operations)/Interest, FFO/Debt and Adjusted Book Debt Ratio reconciliations to GAAP. (1) FFO/Debt metrics include the following standard adjustments: imputed debt and
interest related to purchased power agreements (PPA), unfunded pension and other postretirement benefits (OPEB) obligations, capital adequacy for energy trading, operating lease
obligations, and other off-balance sheet debt. Debt is imputed for estimated pension and OPEB obligations by operating company. (2) Excludes items listed in note (1) above. (3) Current senior unsecured ratings for Exelon and Exelon Generation and senior secured
ratings for ComEd and PECO as of February 28, 2010. |
 22 FFO Calculation and Ratios FFO Calculation = FFO - PECO Transition Bond Principal Paydown + Gain on Sale, Extraordinary Items and Other Non-Cash Items (3) + Change in Deferred Taxes + Depreciation, Amortization (including nucl fuel amortization), AFUDC/Cap. Interest Add back non-cash items: Net Income Adjusted Interest FFO + Adjusted Interest = Adjusted Interest + 7% of Present Value (PV) of Operating Leases + Interest on imputed debt related to PV of Purchased Power Agreements (PPA), unfunded Pension and Other Postretirement Benefits (OPEB) obligations, and Capital Adequacy for Energy Trading (2) , as applicable - PECO Transition Bond Interest Expense Net Interest Expense (Before AFUDC & Cap. Interest) FFO Interest Coverage + Capital Adequacy for Energy Trading (2) FFO = Adjusted Debt + PV of Operating Leases + 100% of PV of Purchased Power Agreements (2) + Unfunded Pension and OPEB obligations (2) + A/R Financing Add off-balance sheet debt equivalents: - PECO Transition Bond Principal Balance + STD + LTD Debt: Adjusted Debt (1) FFO Debt Coverage Rating Agency Capitalization Rating Agency Debt Total Adjusted Capitalization Adjusted Book Debt = Total Rating Agency Capitalization + Off-balance sheet debt equivalents (2) Total Adjusted Capitalization = Rating Agency Debt + ComEd Transition Bond Principal Balance + Off-balance sheet debt equivalents (2) Adjusted Book Debt = Total Adjusted Capitalization + Adjusted Book Debt + Preferred Securities of Subsidiaries + Total Shareholders' Equity Capitalization: = Adjusted Book Debt - Transition Bond Principal Balance + STD + LTD Debt: Debt to Total Cap (1) Uses current year-end adjusted debt balance. (2) Metrics are calculated in presentation unadjusted and adjusted for debt equivalents and
related interest for PPAs, unfunded Pension and OPEB obligations, and Capital Adequacy for Energy Trading. (3) Reflects depreciation adjustment for PPAs and decommissioning interest income and
contributions. |
 23 Value Return Framework Less Equals Maintenance Capital and Committed Dividends Cash Flow from Operations before Dividends and CapEx Strengthen Balance Sheet / Increase Financial Flexibility Invest in Growth Available Cash and Balance Sheet Capacity Return Value via Share Repurchases, Additional Dividends |
 24 Focusing on the Transmission Grid Across Exelon ComEd and PECO • Continued transmission investments focused in their service territories as required for reliability Exelon Transmission Company • Evaluating needed upgrades of the existing system to reduce constraints and improve power flow from our assets • Projects would include short-term modifications to existing infrastructure Exelon Generation • Invest in shovel ready projects with utilities • Pursue Extra High Voltage (EHV) development opportunities in and around our existing footprint including partnerships with Exelon utilities and regional developers • Expand focus beyond our footprint and evaluate partnering with renewable developers including merchant transmission |
 25 ************ *********** ************ ************ ************ ******** |
 26 • Large, low-cost, low-emissions, exceptionally well-run nuclear fleet • Complementary and flexible fossil and hydro fleet • Leveraged to improving power market fundamentals (commodity prices, heat rates, and capacity values) • Below-market contract in Pennsylvania ends at year-end 2010 • Potential carbon restrictions Value Proposition Exelon Generation Value Proposition • Continue to focus on operating excellence, cost management, and market discipline • Execute on power and fuel hedging programs • Support competitive markets • Pursue nuclear & hydro plant relicensing and strategic investment in material condition • Maintain industry-leading talent Protect Value • Pursuing 1,300-1,500 MW nuclear uprate plan • Rigorously evaluate generation development opportunities • Capture increased value of low-carbon generation portfolio Grow Value Exelon Generation is a premier unregulated generation company – positioned to capture market opportunities and manage risk |
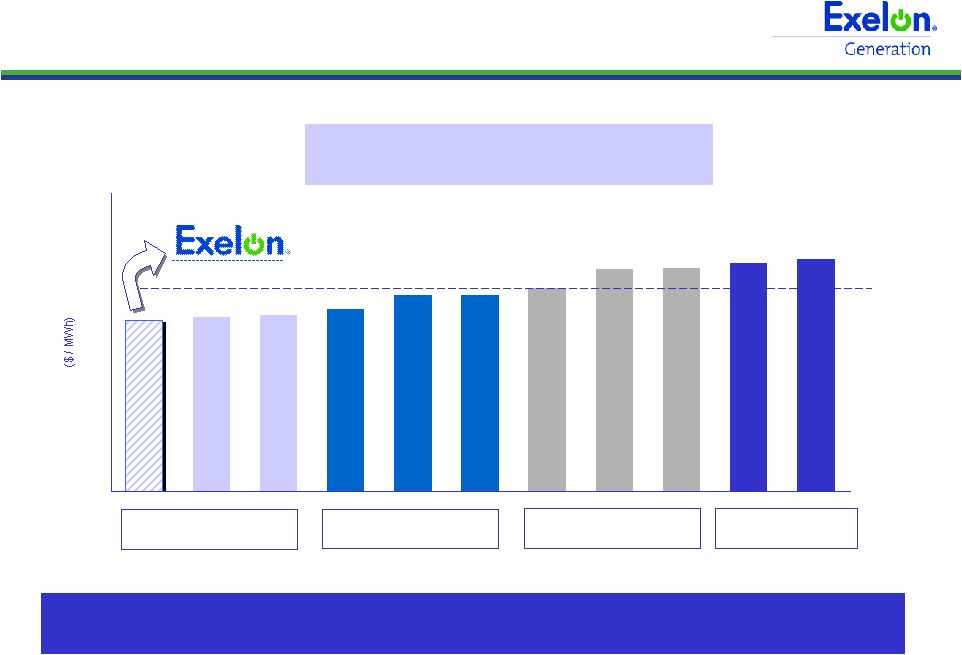 27 A Leading Nuclear Fleet Operator in Cost Among major nuclear plant fleet operators, Exelon is consistently one of the
lowest-cost producers of electricity in the nation 0 5 10 15 20 25 1 Quartile 2 Quartile 3 Quartile 4 Quartile 2004-2008 Average Production Cost for Major Nuclear Operators (1) Average (1) Source: 2008 Electric Utility Cost Group (EUCG) survey. Includes Fuel Cost plus Direct O&M divided by net generation. st nd rd th |
 28 Effectively Managing Nuclear Fuel Costs Components of Fuel Expense in 2009 Projected Total Nuclear Fuel Spend Projected Exelon Average Uranium Cost vs. Market Projected Exelon Uranium Demand Note: At Ownership. Excludes costs reimbursed under the settlement agreement
with the DOE. 2010–2012, 2014: 100% hedged in volume 2013: ~92% hedged in volume All charts exclude Salem 0.0 2.0 4.0 6.0 8.0 10.0 2009A 2010 2011 2012 2013 2014 0 200 400 600 800 1,000 1,200 1,400 2009A 2010 2011 2012 2013 2014 Nuclear Fuel Expense (Amortization + Spent Fuel) Nuclear Fuel Capex 0% 10% 20% 30% 40% 50% 60% 70% 80% 90% 100% 2009A 2010 2011 2012 2013 2014 Exelon Average Reload Price Projected Market Price (Spot) Enrichment 38% Fabrication 16% Nuclear Waste Fund 19% Tax/Interest 1% Conversion 3% Uranium 23% |
 29 Uranium Price Volatility Long-term equilibrium price expected to be $40-$60/lb Short-term Uranium Price Trend Long-term Uranium Price Trend Spring 2003 McArthur River flood December 2003 GNSS/Tenex termination; ConverDyn UF6 release and shutdown Early 2004 ERA / Ranger water problems Early 2006 First Cigar Lake flood; Cyclone Monica halts ERA / Ranger operations for approximately two weeks October 2006 Second Cigar Lake flood March 2007 ERA / Ranger flooding (cyclone George) 30 35 40 45 50 55 60 65 70 75 80 0 20 40 60 80 100 120 140 160 |
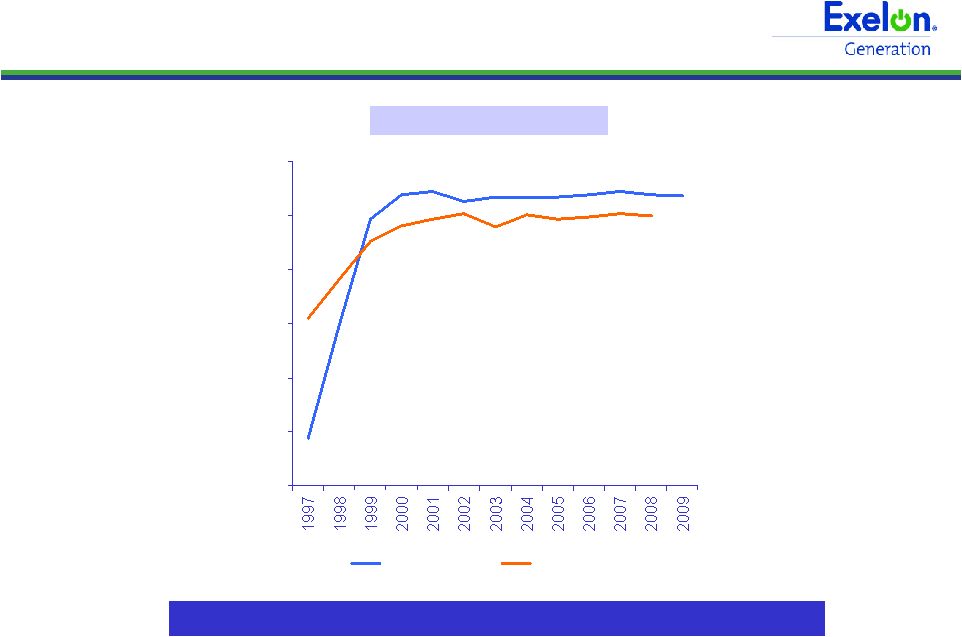 30 World-Class Nuclear Operator Average Capacity Factor Sustained production excellence 40% 50% 60% 70% 80% 90% 100% Exelon Industry Note: Exelon data prior to 2000 represent ComEd-only nuclear fleet. Sources: Platt’s, Nuclear News, Nuclear Energy Institute and Energy Information Administration
(Department of Energy). |
 31 0 10 20 30 40 50 60 2000 2001 2002 2003 2004 2005 2006 2007 2008 2009 Industry (w/o Exelon) Exelon Impact of Refueling Outages Notes: Data includes Salem. Net nuclear generation data based on ownership
interest. PWR = pressurized water reactor; BWR = boiling water reactor
• Every 18 months (most PWRs) or 24 months (BWRs & TMI) • Average outage duration: ~28 days (1) Nuclear Refueling Cycle • Based on the refueling cycle, we will conduct 10 refueling outages in 2010, the same number of refueling outages conducted in 2009 2010 Refueling Outage Impact • Output reflected TMI extended steam generator replacement outage • Based on the refueling cycle, we conducted 10 refueling outages in 2009, versus 12 in 2008 2009 Refueling Outage Impact (1) Average outage duration for refueling outages from 2008 – 2009, excluding Salem. 125 127 129 131 133 135 137 139 141 143 145 2004 2005 2006 2007 2008 2009 2010 2011 2012 2013 2014 7 8 9 10 11 12 13 Refueling Outage Duration Nuclear Output Actual Target # of Outages Note: Exelon data includes Salem. 2009 average includes 23 days of TMI
outage that extended into 2010 reflecting steam generator replacement.
|
 32 Nuclear Uprates Offer Sustainable Value Key component of Exelon 2020 low carbon roadmap Creates additional low-carbon generation capacity Capitalizes on Exelon’s proven track record of uprate execution Dedicated project management team Proven technology design No ongoing incremental O&M expense Creates long-term value over extended license lives Uprates equivalent in size to a new nuclear plant but significantly lower cost, shorter timeline, and more predictable spend Straightforward regulatory and environmental licenses, permits and approvals Potential for uprates to meet state alternative energy standards Uprate projects enable cost-effective growth and leverage Exelon’s operational excellence Strategic Value Grow Value Regulatory Feasibility Execution Feasibility |
 33 Three Major Categories of Exelon Uprates Uprates Overnight Cost (1) MUR (Measurement Uncertainty Recapture) • Through the use of advanced techniques and more precise instrumentation, reactor power can be more accurately calculated • Can achieve up to 1.7% additional output • Requires NRC approval 187–234 MW $300M 2 years 899–1,016 MW $2,400M EPU (Extended Power Uprate) • Through a combination of more sophisticated analysis and upgrades to plant equipment, uprates can increase output by as much as 20% of original licensed power level • Requires NRC approval 3 - 5 years 237–266 MW $800M Megawatt Recovery and Component Upgrades • Replacement of major components in the plant occur in the normal life cycle process – with newer technology, replacements result in increased efficiency • Equipment includes generators, turbines, motors and transformers • Megawatt Recovery and Component Upgrades must conform to NRC standards, but do not require additional NRC approval 2 - 3 years ~1,300–1,500 MW $3,500M Project Duration Exelon’s $2,200 – $2,500 / kW overnight cost for its MUR and EPU projects is an advantageous deployment of capital relative to other generation options (1) In 2007 Dollars. Overnight costs do not include financing costs or cost
escalation. Estimated Internal Rate of Return 12-15% 14-18% 9-12% |
 34 Phased Execution Lowers Risk • Safe, economical and proven methods to improve efficiency and output • Leverages Exelon’s substantial experience managing successful uprate projects over
the past 10 years Note: Data contained in this slide is rounded. Uprate program allows us to adjust timing to respond to market conditions EPUs MURs MW Recovery and Component Upgrades Maximum
Potential
MW Year Uprates Become Operational 1999- 2008 2009 2010 2011 2012 2013 2014 2015 2016 2017 2009- 2017 Exelon’s Uprate Plan 1,100 MW 1,300 – 1,500 MW Average Overnight Cost Estimate: $2,200 - 2,500/KW 0 200 400 600 800 1,000 1,200 1,400 1,600 Planned Capital Spend (1) $150 2017 $625 2013 $675 2012 $550 2011 $350 2010 $725 2015 $725 2014 $400 2016 $4,425 2008 - 2017 $225 2008 - 2009
(1) Dollars shown are nominal, reflecting 6% escalation, in millions.
|
 35 Multi-Regional Nuclear Uprate Program 2012 32 25 Peach Bottom 2011 110 95 Quad Cities 2014 15 12 TMI 2014 31 25 Dresden 2013 23 19 Quad Cities 2012 42 34 Byron 2012 42 34 Braidwood 2011 41 33 Limerick 2011 40 32 LaSalle 2014 3 3 Peach Bottom Measurement Uncertainty Recapture (MUR): 2013 6 6 Limerick 2013 110 103 Dresden 2012 5 5 Dresden Extended Power Uprate (EPU): MW Recovery & Component Upgrades: 2017 340 306 Limerick 172 336 17 148 3 Max Potential MW 2016 138 TMI 2016 303 LaSalle 2016 17 Clinton 2015 134 Peach Bottom 2010 2 Clinton Year of Operation Base Case MW Station Executing 1,300-1,500 MW of uprate projects across our geographically diverse nuclear fleet TMI Limerick Peach Bottom Total Midwest Uprates: 669-759 MW Total Mid-Atlantic Uprates: 657-757 MW Quad Cities Dresden Byron LaSalle Clinton Braidwood Notes: MW shown at ownership. Year of Operation indicates when the uprate project is planned to be completed. Uprates totaling approximately 50 MW are expected to come on line in 2010.
|
 36 Exelon Nuclear Fleet Overview Fleet also includes 4 shutdown units: Peach Bottom 1, Dresden 1, Zion 1 & 2. Average in-service time = 28 years 2011 42.6% Exelon, 57.4% PSEG In process (decision in 2011- 2012): 2016, 2020 503, 500 (2) W PWR 2 Salem, NJ 2025 100% Renewed: 2034 837 B&W PWR 1 TMI-1, PA Dry cask 100% Renewed: 2029 625 GE BWR 1 Oyster Creek, NJ Dry cask 50% Exelon, 50% PSEG Renewed: 2033, 2034 574, 571 (2) GE BWR 2 Peach Bottom, PA Dry cask 75% Exelon, 25% Mid- American Holdings Renewed: 2032 655, 662 (2) GE BWR 2 Quad Cities, IL Dry cask 100% Renewed: 2029, 2031 869, 871 GE BWR 2 Dresden, IL 2010 100% 2022, 2023 1138, 1150 GE BWR 2 LaSalle, IL Dry cask 100% 2024, 2029 1148, 1145 GE BWR 2 Limerick, PA 2018 2011 2013 Spent Fuel Storage/ Date to lose full core discharge capacity GE W W Vendor BWR PWR PWR Type 1 2 2 Units 100% 2026 1065 Clinton, IL 100% 2024, 2026 1183, 1153 Byron, IL 100% 2026, 2027 1194, 1166 Braidwood, IL Ownership License Status / Expiration (1) Net Annual Mean Rating MW 2009 Plant, Location (1) Operating license renewal process takes approximately 4-5 years from commencement
until completion of NRC review. (2) Capacity based on ownership interest. Uprates + license extensions = long-term value creation
|
 37 0.0 2.0 4.0 6.0 8.0 10.0 12.0 14.0 16.0 18.0 20.0 2000 2001 2002 2003 2004 2005 2006 2007 2008 Basics of Business Unchanged Nuclear remains one of the lowest cost options for electricity production Petroleum Gas Coal Nuclear 1.87 U.S. Electricity Production Costs (2000-2008) (1) (1) In 2008 cents per kilowatt-hour. Source: NEI, Ventyx Velocity Suite May 2009. Production Cost = O&M plus fuel. 2.75 8.09 17.26 |
 38 38 Total Portfolio Characteristics 104,400 102,441 39,800 39,897 5,500 16,830 22,700 13,897 0 50,000 100,000 150,000 200,000 2009A 2010E ComEd Swap IL Auction PECO Load Actual Forward Hedges & Open Position Expected Total Supply (GWh) Expected Total Sales (GWh) 91,804 91,600 47,866 48,100 29,840 27,400 3,555 5,300 0 50,000 100,000 150,000 200,000 2009A 2010E Forward / Spot Purchases Fossil & Hydro Mid-Atlantic Nuclear Midwest Nuclear 173,065 173,065 172,400 172,400 |
 39 Retiring Cromby Station and Eddystone Units 1&2 • Cromby Station – Placed in service in 1954-55 – 144 MW coal and 201 MW oil/gas • Eddystone Station Units 1&2 – Placed in service in 1960 – 588 MW of coal capacity at units 1&2 – Units 3&4 (760 MW oil/gas) and 4 peaking units (60 MW) will continue to operate • Retirements yield ~$165-200 million incremental NPV vs. continuing to operate the
units – Avoids ongoing operating and capital costs on aging units – Cromby and Eddystone have not cleared in the past two RPM capacity auctions (2011/12
and 2012/13) – Anticipates more stringent environmental regulations and avoids related capital
investment • Agreed to delay deactivation of two units to maintain reliability, provided receipt of
required environmental permits and adequate cost-based compensation
– Pursuing RMR to compensate for cost of maintaining and operating units beyond 5/31/11 – Maintaining scheduled retirement date of 5/31/11 for Cromby 1 and Eddystone 1; delaying
Cromby 2 to 5/31/12 and Eddystone 2 to 12/31/13 $80 $85 $40 Capital Expenditure Reduction $40 $18 $24 Incremental Pre-Tax Operating Income 45 22 0 Depreciation Savings 75 46 24 Operating O&M Savings $(80) $(50) $0 Revenue Net Fuel 2012 2011 2010 ($ in millions) Smaller, less efficient coal plants are challenged by economic and environmental considerations Ongoing Savings Impact Note: RMR = reliability must-run agreement |
 40 40 Reliability Pricing Model (RPM) Auction PJM RPM Auction ($/MW-day) Exelon Generation Participation within PJM Reliability Pricing Model (1) – next RPM auction in May 2010 Note: Data contained on this slide is rounded. (1) All generation values are approximate and not inclusive of wholesale transactions.
(2) All capacity values are in installed capacity terms (summer ratings) located in the
areas. (3) Obligation consists of load obligations from PECO. PECO PPA expires December 2010.
(4) Obligation represents the remainder of the ComEd auction load that ends in May
2010. (5) MAAC = Mid-Atlantic Area Council; APS = Allegheny Power System. (6) Elwood contract expires in 12/31/12 and Kincaid contract expires in 2/28/13. (7) Weighted average $/MW-Day would apply if all generation cleared in the highlighted
zones. 2009/2010 2010/2011 2011/2012 2012/2013 in MW Capacity (2) Obligation Capacity (2) Obligation Capacity (2) Capacity (2) RTO 12,800 3,800 - 4,100 (4) 23,900 9,300 - 9,400 (3) 23,200 12,100 (6) EMAAC 9,500 MAAC + APS 11,100 9,300 – 9,400 (3) MAAC 1,500 Avg ($/MW-Day) (7) $143.90 $174.29 $110.00 $74.75
40.80 197.67 111.91 148.80 102.04 191.32 174.29 110.00 16.46 133.37 139.73 2007/2008 2008/2009 2009/2010 2010/2011 2011/2012 2012/2013 RTO MAAC + APS MAAC Eastern MAAC Only shown if cleared at separate price and generation is located in that zone (5) |
 41 Estimated Build-Up of PECO Average Residential Full Requirements Price $91.60/MWh $28.50- $29.50 $50.50 - $51.50 Full Requirements Costs ($/MWh) Average Full
Requirements Retail Sales Price (1) Load Shape & Ancillary Services $7.50 Capacity $12.00 Transmission & Congestion $7.00 - $8.00 Renewable Energy Credits $1.00 Migration, Volumetric Risk & Other $1.00 ~$6.50 ~$5.50 (1) As provided by Exelon Generation. (2) On Oct 21, 2009 the Independent Evaluator (NERA) announced a wholesale winning bid
average price of $79.96/MWh for PECO’s Fall 2009 RFP (reflecting 17 & 29-month residential full requirements’ products with delivery beginning Jan 1, 2011). (1) As provided by Exelon Generation. (2) On Oct 21, 2009 the Independent Evaluator (NERA) announced a wholesale winning bid
average price of $79.96/MWh for PECO’s Fall 2009 RFP (reflecting 17 & 29-month residential full requirements’ products with delivery beginning Jan 1, 2011). Average Wholesale Energy Price $79.96 (2) 41 |
 42 42 Midwest Price Recovery Update 42 • Last fall, we saw approximately $5/MWh of upside over NiHub ATC forward prices
• Since then, we have seen an expansion in market implied heat rates, with NiHub prices
declining proportionally less than forward gas prices – We have also seen a reduction in the NiHub-ADHub spread • Holding natural gas prices at current levels, we expect some additional increase in
NiHub ATC forward prices as the economy/load recovers and transmission
enhancements are completed Exelon will benefit as Midwest prices increase,
moving closer to our fundamental view... 2012 gross margin increases by ~$275 million for a $5/MWh increase in NiHub ATC
|
 43 ************ *********** ************ ************ ************ *********** |
 44 -10.0% -7.5% -5.0% -2.5% 0.0% 2.5% 5.0% 7.5% 10.0% 1Q09 2Q09 3Q09 4Q09 1Q10E 2Q10E 3Q10E 4Q10E -10.0% -7.5% -5.0% -2.5% 0.0% 2.5% 5.0% 7.5% 10.0% All Customer Classes Large C&I Residential Gross Metro Product ComEd Load Trends Weather-Normalized Load Key Economic Indicators Note: The information on this slide is the same as disclosed on January 22, 2010 and
has not been updated to reflect any changes that may have occurred since
that date. C&I = Commercial & Industrial Weather-Normalized Load Year-over-Year (4) Chicago U.S. Unemployment rate (1) 10.9% 10.0% 2009 annualized growth in gross domestic/metro product (2) (3.1)% (2.5)% 10/09 Home price index (3) (10.1)% (7.3)% (1) Source: Illinois Dept. of Employment Security (November 2009) and U.S. Dept. of Labor (December 2009) (2) Source: Moody’s Economy.com (December 2009) (3) Source: S&P Case-Shiller Index (4) Not adjusted for leap year effect 4Q09 2009 (4) 2010E Customer Growth (0.5)% (0.4)% 0.1% Average Use-Per-Customer (1.1)% (1.0)% 0.0% Total Residential (1.6)% (1.4)% 0.0% Small C&I 0.1% (2.2)% 0.8% Large C&I (4.0)% (6.7)% 1.5% All Customer Classes (1.6)% (3.3)% 0.8% |
 45 ComEd Customer Usage Breakdown Customer Usage by Revenue Class Top 380 Customer Usage by Segment Other 2% Residential 31% Small C&I 36% 380 Large C&I 18% Other Large C&I 13% 3% Leisure & Hospitality 9% Trade, Transportation & Utilities 11% Finance, Professional & Business Services 12% Health & Educational Services 13% Government 52% Manufacturing ComEd’s territory is largely manufacturing focused, which is beginning to see increases in production due to improved economic conditions Note: The information on this slide is the same as disclosed on January 22, 2010 and has
not been updated to reflect any changes that may have occurred since that
date. |
 46 Illinois Power Agency (IPA) RFP Procurement • On December 28, 2009, the Illinois Commerce Commission approved the IPA’s
Updated Procurement Plan for the 2010/11 planning period, which includes the procurement of: – monthly peak and off-peak standard wholesale block energy products – 1,887,014 MWh of Renewable Energy Credits – 1,400,000 MWh/year of renewable energy and associated RECs through 20 year contracts beginning delivery in June 2012 Note: Chart is for illustrative purposes only. Data on this slide is
rounded. Next RFP expected in Spring 2010 2009 RFP 2009 RFP 2010 RFP 2010 RFP 2011 RFP 2011 RFP 2011 RFP 2012 RFP 2012 RFP 2013 RFP Financial Swap Auction Contract Jun 2009 Jun 2010 Jun 2011 Jun 2012 Jun 2013 Jun 2014 Delivery Period Peak Off-Peak June 2010 - May 2011 5,528 4,344 June 2011 - May 2012 1,980 549 Volume to be procured in the 2010 IPA Procurement Event (GWh) |
 47 Financial Swap Agreement with Exelon Generation 3,000 $53.48 January 1, 2013 - May 31, 2013 3,000 $52.37 January 1, 2012 - December 31, 2012 3,000 $51.26 January 1, 2011 - December 31, 2011 3,000 $50.15 June 1, 2010 - December 31, 2010 2,000 $50.15 January 1, 2010 - May 31, 2010 2,000 $49.04 June 1, 2009 - December 31, 2009 1,000 $49.04 January 1, 2009 - May 31, 2009 1,000 $47.93 June 1, 2008 - December 31, 2008 Notional Quantity (MW) Fixed Price ($/MWH) Portion of Term • Market-based contract for ATC baseload energy only – Does not include capacity, ancillary services, or congestion • Supplies ~67% of ComEd’s Residential/Small C&I load for 2010/11 • Represents long-term contract with stable pricing for ComEd’s customers
Note: C&I = Commercial & Industrial Financial swap increases to 3,000 MW on June 1, 2010 |
 48 Smart Meter/Smart Grid • Smart Meter Pilot (or Advanced Metering Infrastructure - AMI) – ICC approved on October 14, 2009 – 1-year pilot program for 131,000 smart meters and related programs – Expected to be implemented in early summer 2010 – over 80,000 smart meters installed to date – ~$70 million spend in 2009-2010 with recovery with regulated return for capital
investment through a rider • Smart Grid Solar Pilot Project – Negotiating with DOE to obtain $5 million in stimulus funds for Smart Grid Solar Pilot
– Pilot group of ~100 residential customers will receive roof-top solar systems and
be placed on real-time pricing and net metering programs – Solar systems will be deployed at customers within the smart meter pilot
footprint – Goals are (1) to study how photovoltaic panels and energy storage affect reliability of
the distribution system, (2) to evaluate consumer response to price signals
and (3) to assess customer acceptance of new technologies • Green Vehicle Fleet – $4 million in stimulus funding awarded to ComEd to expand Green Vehicle Fleet and Test
Impact on Electric Grid – Will add up to 14 new hybrid and plug-in electric vehicles to fleet – Will deploy vehicle smart charging stations and evaluate impacts of vehicle charging while managing the electric load ComEd is pursuing a number of smart grid investments with regulated returns and stimulus funding |
 49 ********* ********* *********** *********** ******** |
 50 PECO Load Trends Weather-Normalized Electric Load Key Economic Indicators Weather-Normalized Load Year-over-Year (3) Philadelphia U.S. Unemployment rate (1) 8.5%
10.0% 2009 annualized growth in gross domestic/metro product (2) (3.6)%
(2.5)% (1) Source: U.S. Dept. of Labor (PHL - November 2009, U.S. – December 2009) (2) Source: Moody’s Economy.com (December 2009) (3) Not adjusted for leap year effect -10.0% -7.5% -5.0% -2.5% 0.0% 2.5% 5.0% 7.5% 10.0% 1Q09 2Q09 3Q09 4Q09 1Q10E 2Q10E 3Q10E 4Q10E -10.0% -7.5% -5.0% -2.5% 0.0% 2.5% 5.0% 7.5% 10.0% All Customer Classes Large C&I Residential Gross Metro Product 4Q09 2009 (3) 2010E Customer Growth (0.4)% (0.2)% (0.1)% Average Use-Per-Customer 0.2% (2.1)% (1.2)% Total Residential (0.2)% (2.3)% (1.3)% Small C&I (2.5)% (2.7)% (0.7)% Large C&I (1.4)% (3.0)% (2.4)% All Customer Classes (1.3)% (2.6)% (1.5)% Note: The information on this slide is the same as disclosed on January 22, 2010 and
has not been updated to reflect any changes that may have occurred since
that date. C&I = Commercial & Industrial
|
 51 PECO Customer Usage Breakdown Other 3% Other Large C&I 24% 150 Large C&I 17% Small C&I 22% Residential 34% Customer Usage by Revenue Class Top 150 Customer Usage by Segment 7% Other 13% Transportation, Communication & Utilities 18% Health & Educational Services 18% Manufacturing 22% Petroleum 2% Retail Trade 9% Finance, Insurance & Real Estate 12% Pharmaceuticals PECO’s load is relatively diversified by customer class and industry, a slow recovery in the second half of 2010 is expected Note: The information on this slide is the same as disclosed on January 22, 2010 and has
not been updated to reflect any changes that may have occurred since that
date. |
 52 PECO Procurement Results PECO has completed two of the four procurements for the power needed to serve its
residential customers beginning in 2011 • On September 23, 2009, the PAPUC approved the bids from PECO’s second RFP
(1) See PECO Procurement website (http://www.pecoprocurement.com) for additional details
regarding PECO’s procurement plan and RFP results. (2) Wholesale prices; no Small/Medium Commercial products were procured in the June
RFP. Residential Sept RFP average price of $79.96/MWh (2) June RFP average price of $88.61/MWh (2) 49% of full requirements product procured 80 MW of block energy procured Small and Medium Commercial Sept RFP average blended price of $85.85/MWh (2) 24% of Small Commercial full requirements product procured 16% of Medium Commercial full requirements product procured 85% full requirements 15% full requirements spot Medium Commercial & Industrial (peak demand >100 kW but <= 500 kW) 100% full requirements spot Large Commercial & Industrial (peak demand >500 kW) 90% full requirements 10% full requirements spot 75% full requirements 20% block energy 5% energy only spot Products Small Commercial (peak demand <100 kW) Residential Customer Class PECO Procurement Plan (1) Total Procured (including June and September RFPs) Residential 23% of planned full requirements contracts (17 and 29-mo terms) 140 MW of baseload (24x7) block energy products (12, 24 and 60-mo duration) 40 MW of Jan-Feb 2011 on-peak block energy Small Commercial 36% of planned full requirements contracts (17 and 29-mo term) Medium Commercial & Industrial 42% of planned full requirements contracts (17-mo term) May 24, 2010 RFP |
 53 5.03 5.03 0.51 0.51 6.26 2.57 9.41 PECO Average Residential Electric Rates (1) Average of PECO’s residential rates. (2) Provided for illustration only. Represents 49% of PECO’s full requirements
residential procurement for 2011. (3) Average retail price for full requirements products. Full requirements product includes
load following energy, capacity, ancillary transmission services and Alternative Energy Portfolio Standard requirements. (4) Does not include energy efficiency or changes in distribution rates. 2011 2010 Energy / Capacity Competitive Transition Charge (CTC) Transmission Distribution 14.37¢ (1) Unit Rates (¢/kWh) Electric Restructuring Settlement ~4% (4) 14.95¢ (1) Assumptions Illustrative Rate Increase Based on PECO Residential Full Requirements Procurement Results (2) • 2011 illustrative residential rate based on a weighting of 26% on Spring 2009 Retail results, 23% on Fall 2009 Retail results, and future supply procurement estimated at Fall 2009 Results • Actual 2011 default service residential rate will reflect associated full requirements costs, block energy costs, and spot market purchases, all of which will be acquired through multiple procurements • Rates will vary by customer class • Retail rate components include line losses and gross receipts taxes Spring 2009 10.13¢/kWh PECO Residential Procurement Results (3) Effect of Spring and Fall 2009 Procurements Fall 2009 9.16¢/kWh Retail Results |
 54 PECO Smart Grid/Smart Meter • PECO intends to spend up to $650 million on its Smart Grid/Smart Meter Infrastructure (1) – $550 million Advanced Metering Infrastructure over 10 – 15 years – ~$300 million in 2010-2012 period – $100 million for Smart Grid over 3 years with stimulus funding • Awarded $200 million Federal Stimulus Grant on October 27, 2009 – Working with DOE to agree on terms and conditions • Smart Meter investment required by Act 129, which provides for recovery through
surcharge including a return on capital investment • Smart Grid investment to be recovered through transmission and distribution rates
2010-2012 Spend With Federal Stimulus Grant (2) : ($ millions pre-tax) 2010 2011 2012 Total Act 129 Smart Meter Expanded Initial Deployment (600K meters by 2012) (3) 40 $ 150 $ 100 $ 290 $ Smart Grid Stimulus Case 50 45 15 110 Total Stimulus Case 90 195 115 400 Stimulus Grant Request (45) (100) (55) (200) Total Expenditures net of Stimulus grant 45 $ 95 $ 60 $ 200 $ (1) Does not include $100 million for potential replacement of gas meters and
wind-down of legacy Automated Meter Reading system. (2) Assumes 100% of matching funds requested by DOE. (3) Includes approximately $10 million, $15 million, and $25 million of O&M in 2010-2012,
respectively. Data contained in this slide is rounded. |
 55 55 55 Exelon Generation Hedging Disclosures (As disclosed on January 22, 2010) |
 56 56 Important Information The following slides are intended to provide additional information regarding the hedging
program at Exelon Generation and to serve as an aid for the purposes of
modeling Exelon Generation’s gross margin (operating revenues less purchased power and fuel expense). The information on the following slides is not intended to represent earnings guidance or a forecast of future events. In fact, many of the factors that ultimately will determine Exelon
Generation’s actual gross margin are based upon highly variable market
factors outside of our control. The information on the following slides
is as of December 31, 2009. Going forward, we plan to update the information
on a quarterly basis. Certain information on the following slides is based upon
an internal simulation model that incorporates assumptions regarding future
market conditions, including power and commodity prices, heat rates, and
demand conditions, in addition to operating performance and dispatch characteristics of our generating fleet. Our simulation model and the assumptions
therein are subject to change. For example, actual market conditions and
the dispatch profile of our generation fleet in future periods will likely differ – and may differ significantly – from the assumptions underlying the simulation results included in the slides. In addition,
the forward- looking information included in the following slides will likely change over time due to continued refinement of our simulation model and changes in our views on future market
conditions. |
      57 57 Portfolio Management Objective Align Hedging Activities with Financial Commitments • Power Team utilizes several product types and channels to market • Wholesale and retail sales • Block products • Load-following products and load auctions • Put/call options • Exelon’s hedging program is designed to protect the long-term value of our generating fleet and maintain an investment-grade balance sheet • Hedge enough commodity risk to meet future cash requirements if prices drop • Consider: financing policy (credit rating objectives, capital structure, liquidity); spending (capital and O&M); shareholder value return policy • Consider market, credit, operational risk • Approach to managing volatility • Increase hedging as delivery approaches • Have enough supply to meet peak load • Purchase fossil fuels as power is sold • Choose hedging products based on generation portfolio – sell what we own • Heat rate options • Fuel products • Capacity • Renewable credits % Hedged High End of Profit Low End of Profit Open Generation with LT Contracts Portfolio Optimization Portfolio Management Portfolio Management Over Time |
 58 58 58 Percentage of Expected Generation Hedged • How many equivalent MW have been hedged at forward market prices; all hedge products used are converted to an equivalent average MW volume • Takes ALL hedges into account whether they are power sales or financial products Equivalent MWs Sold Expected Generation = • Our normal practice is to hedge commodity risk on a ratable basis over the three years leading to the spot market • Carry operational length into spot market to manage forced outage and
load-following risks • By using the appropriate product mix, expected generation hedged approaches the mid-90s percentile as the delivery period approaches • Participation in larger procurement events, such as utility auctions, and some
flexibility in the timing of hedging may mean the hedge program is not
strictly ratable from quarter to quarter Exelon Generation Hedging Program |
 59 59 59 2010 2011 2012 Estimated Open Gross Margin ($ millions) (1,2) $5,900 $5,800 $5,750 Open gross margin assumes all expected generation is sold at the Reference Prices listed below Reference Prices (1) Henry Hub Natural Gas ($/MMBtu) NI-Hub ATC Energy Price ($/MWh) PJM-W ATC Energy Price ($/MWh) ERCOT North ATC Spark Spread ($/MWh) (3) $5.79 $33.83 $48.04 $(0.53) $6.33 $34.75 $49.42 $(0.44) $6.53 $36.13 $50.43 $0.89 (1) Based on December 31, 2009 market conditions. (2) Gross margin is defined as operating revenues less fuel expense and purchased power
expense, excluding the impact of decommissioning and other incidental revenues. Open gross margin is estimated based upon an internal model that is developed by dispatching
our expected generation to current market power and fossil fuel prices. Open gross margin assumes there is no hedging in place other than fixed assumptions for capacity cleared in the RPM auctions and uranium costs for nuclear power plants. Open gross margin contains assumptions for other gross margin line items such as various ISO bill and
ancillary revenues and costs and PPA capacity revenues and payments. The estimation of open gross margin incorporates management discretion and modeling assumptions that are
subject to change. (3) ERCOT North ATC spark spread using Houston Ship Channel Gas, 7,200 heat rate, $2.50
variable O&M. Exelon Generation Open Gross Margin and Reference Prices |
 60 60 60 2010 2011 2012 Expected Generation (GWh) (1) 167,100 163,000 162,600 Midwest 99,000 98,400 97,400 Mid-Atlantic 59,600 57,200 56,600 South 8,500 7,400 8,600 Percentage of Expected Generation Hedged (2) 91-94% 69-72% 37-40% Midwest 89-92 71-74 43-46 Mid-Atlantic 93-96 65-68 25-28 South 97-100 66-69 39-42 Effective Realized Energy Price ($/MWh) (3) Midwest $46.50 $45.00 $46.00 Mid-Atlantic $35.50 $60.00 $53.50 ERCOT North ATC Spark Spread $(1.00) $(0.50) $(7.00) Generation Profile (1) Expected generation represents the amount of energy estimated to be generated or purchased through owned or
contracted for capacity. Expected generation is based upon a simulated dispatch model
that makes assumptions regarding future market conditions, which are calibrated to market quotes for power, fuel, load following products, and options. Expected generation assumes 10 refueling outages in 2010 and 11 refueling outages in 2011 and 2012 at
Exelon-operated nuclear plants and Salem. Expected generation assumes capacity
factors of 93.5%, 92.8% and 92.8% in 2010, 2011 and 2012 at Exelon-operated nuclear plants. These estimates of expected generation in 2011 and 2012 do not represent guidance or a forecast of future results as Exelon has not completed its planning or optimization processes
for those years. (2) Percent of expected generation hedged is the amount of equivalent sales divided by the expected
generation. Includes all hedging products, such as wholesale and retail sales of power,
options, and swaps. Uses expected value on options. Reflects decision to permanently retire Cromby Station and Eddystone Units 1&2 as of May 31, 2011, pending PJM approval. (3) Effective realized energy price is representative of an all-in hedged price, on a per MWh basis, at
which expected generation has been hedged. It is developed by considering the energy
revenues and costs associated with our hedges and by considering the fossil fuel that has been purchased to lock in margin. It excludes uranium costs and RPM capacity revenue, but includes the mark-to-market value of capacity contracted at prices other than RPM
clearing prices including our load obligations. It can be compared with the reference prices used to calculate open gross margin in order to determine the mark-to-market value of Exelon
Generation's energy hedges. |
 61 61 61 Gross Margin Sensitivities with Existing Hedges ($ millions) (1) Henry Hub Natural Gas + $1/MMBtu - $1/MMBtu NI-Hub ATC Energy Price +$5/MWH -$5/MWH PJM-W ATC Energy Price +$5/MWH -$5/MWH Nuclear Capacity Factor +1% / -1% 2010 $40 $(40) $30 $(25) $20 $(15) +/- $50 2011 $190 $(160) $165 $(155) $135 $(130) +/- $50 2012 $395 $(395) $275 $(270) $230 $(230) +/- $50 (1) Based on December 31, 2009 market conditions and hedged position. Gas price
sensitivities are based on an assumed gas-power relationship derived from an internal model that is updated periodically. Power prices sensitivities are derived by adjusting the power price assumption while keeping all other prices inputs constant. Due to correlation of the various assumptions, the hedged gross margin impact calculated by aggregating individual sensitivities may not be equal to the hedged gross margin impact calculated when correlations between the various assumptions
are also considered. Exelon Generation Gross Margin Sensitivities (with Existing Hedges) |
 62 62 62 95% case 5% case $6,500 $6,100 $4,800 $7,800 $6,200 $8,000 Exelon Generation Gross Margin Upside / Risk (with Existing Hedges) $3,000 $4,000 $5,000 $6,000 $7,000 $8,000 $9,000 2010 2011 2012 (1) Represents an approximate range of expected gross margin, taking into account hedges in place, between the 5th and 95th percent confidence levels assuming all unhedged supply is sold into the spot market. Approximate gross margin ranges are based upon an internal simulation model and are subject to change based upon market inputs, future transactions and potential modeling changes. These ranges of approximate gross margin in 2011 and 2012 do not represent earnings guidance or a forecast of future results as Exelon has not completed its planning or optimization processes for those years. The price distributions that generate this range are calibrated to market quotes for power, fuel, load following products, and options as of December 31, 2009. |
 63 63 63 Midwest Mid-Atlantic ERCOT Step 1 Start with fleetwide open gross margin $5.90 billion Step 2 Determine the mark-to-market value of energy hedges 99,000GWh * 90% * ($46.50/MWh-$33.83/MWh) = $1.13 billion 59,600GWh * 94% * ($35.50/MWh-$48.04/MWh) = $(0.70 billion) 8,500GWh * 98% * ($(1.00)/MWh- $(0.53)/MWh) = $0.00 billion Step 3 Estimate hedged gross margin by adding open gross margin to mark-to- market value of energy hedges Open gross
margin: $5.90 billion MTM value of energy
hedges: $1.13 billion + $(0.70 billion) + $0.00 billion Estimated hedged gross margin:
$6.33 billion Illustrative Example of Modeling Exelon Generation 2010 Gross Margin (with Existing Hedges) |
 64 64 64 64 64 64 64 50 55 60 65 70 75 80 85 90 3/09 4/09 5/09 6/09 7/09 8/09 9/09 10/09 11/09 12/09 1/10 2/10 20 25 30 35 40 45 50 55 3/09 4/09 5/09 6/09 7/09 8/09 9/09 10/09 11/09 12/09 1/10 2/10 35 40 45 50 55 60 65 70 75 80 85 3/09 4/09 5/09 6/09 7/09 8/09 9/09 10/09 11/09 12/09 1/10 2/10 5 5.5 6 6.5 7 7.5 8 8.5 9 3/09 4/09 5/09 6/09 7/09 8/09 9/09 10/09 11/09 12/09 1/10 2/10 64 Market Price Snapshot Forward NYMEX Natural Gas PJM-West and Ni-Hub On-Peak Forward Prices PJM-West and Ni-Hub Wrap Forward Prices 2011 $5.87 2012 $6.13 Rolling 12 months, as of February 26, 2010. Source: OTC quotes and electronic trading
system. Quotes are daily. Forward NYMEX Coal 2011 $70.26 2012 $74.15 2011 Ni-Hub $39.78 2012 Ni-Hub $40.88 2012 PJM-West $54.85 2011 PJM-West $53.70 2011 Ni-Hub $24.37 2012 Ni-Hub $25.63 2012 PJM-West $38.05 2011 PJM-West $37.51 |
 65 65 65 65 65 65 65 5.5 6.5 7.5 8.5 9.5 10.5 11.5 12.5 13.5 3/09 4/09 5/09 6/09 7/09 8/09 9/09 10/09 11/09 12/09 1/10 2/10 8 8.2 8.4 8.6 8.8 9 9.2 9.4 9.6 9.8 10 3/09 4/09 5/09 6/09 7/09 8/09 9/09 10/09 11/09 12/09 1/10 2/10 40 45 50 55 60 65 70 75 80 3/09 4/09 5/09 6/09 7/09 8/09 9/09 10/09 11/09 12/09 1/10 2/10 5 5.5 6 6.5 7 7.5 8 8.5 9 3/09 4/09 5/09 6/09 7/09 8/09 9/09 10/09 11/09 12/09 1/10 2/10 65 Market Price Snapshot 2012 $8.99 2011 $8.77 2011 $50.68 2012 $54.26 2011 $5.78 2012 $6.03 Houston Ship Channel Natural Gas Forward Prices ERCOT North On-Peak Forward Prices ERCOT North On-Peak v. Houston Ship Channel Implied Heat Rate 2011 $6.79 2012 $8.34 ERCOT North On Peak Spark Spread Assumes a 7.2 Heat Rate, $1.50 O&M, and $.15 adder Rolling 12 months, as of February 26, 2010. Source: OTC quotes and electronic trading
system. Quotes are daily. |
 66 Key Assumptions and GAAP Reconciliation |
 67 67 Key Assumptions for 2010 Earnings Guidance (1) 2008 Actual 2009 Actual 2010 Est. Nuclear Capacity Factor (%) (2) 93.9 93.6 93.5 Total Generation Sales Excluding Trading (GWh) 176,174 173,065 171,400 Total Generation Sales to PECO (GWh) 40,966 39,897 39,900 Total Generation Market and Retail Sales (GWh) (3) 135,208 133,168 131,500 Henry Hub Gas Price ($/mmBtu) 8.85 3.92 6.21 PJM West Hub ATC Price ($/MWh) 68.52 38.30 48.40 Tetco M3 Gas Price ($/mmBtu) 9.83 4.64 6.95 PJM West Hub Implied ATC Heat Rate (mmbtu/MWh) 6.97 8.25 6.96 NI Hub ATC Price ($/MWh) 49.00 28.85 32.57 Chicago City Gate Gas Price ($/mmBtu) 8.79 3.92 6.23 NI Hub Implied ATC Heat Rate (mmbtu/MWh) 5.57 7.36 5.22 PJM East Capacity Price ($/MW-day) 169.09 173.73 181.34 PJM West Capacity Price ($/MW-day) 82.39 106.13 144.40 Electric Delivery Growth (%) (4) PECO 0.6 (2.6) (1.3) ComEd (0.1) (3.3) 0.8 Effective Tax Rate (%) (5) 36.1 37.2 35.8 (1) Reflects assumptions used in original 2010 Earnings Guidance provided on November 2, 2009; 2010 prices reflect observable prices as of September 30, 2009. (2) Excludes Salem. . (3) Includes Illinois auction sales and ComEd swap. (4) Weather-normalized retail load growth. (5) Starting on January 1, 2011, effective tax rate is expected to increase to 37.1% due to
lower tax benefit related to the PECO PPA roll off. |
 68 2009 GAAP Reconciliation Note: Amounts may not add due to rounding. 110 - - - 110 Mark-to-market adjustments from economic hedging activities (34) - - - (34) Retirement of fossil generating units (5) - - (5) - City of Chicago settlement with ComEd (66) - - (4) (62) 2007 Illinois electric rate settlement (74) (30) - - (44) Costs associated with early debt retirements (135) - - - (135) Impairment of certain generating assets (22) (1) (1) (13) (7) 2009 restructuring charges 32 - - - 32 Decommissioning obligation reduction (20) (20) - - - NRG Energy, Inc. acquisition costs 132 - - - 132 Unrealized gains related to nuclear decommissioning trust funds 66 (12) - 40 38 Non-cash remeasurement of income tax uncertainties and reassessment of state deferred income taxes $2,707 $(142) $353 $374 $2,122 FY 2009 GAAP Earnings (Loss) $2,723 $(79) $354 $356 $2,092 2009 Adjusted (non-GAAP) Operating Earnings (Loss) Exelon Other PECO ComEd ExGen 2009 GAAP Reconciliation (in millions) |
 69 2009 GAAP EPS Reconciliation 0.16 - - - 0.16 Mark-to-market adjustments from economic hedging activities (0.05) - - - (0.05) Retirement of fossil generating units (0.01) - - (0.01) - City of Chicago settlement with ComEd (0.10) - - (0.01) (0.09) 2007 Illinois electric rate settlement (0.11) (0.04) - - (0.07) Costs associated with early debt retirements (0.20) - - - (0.20) Impairment of certain generating assets (0.03) - (0.00) (0.02) (0.01) 2009 restructuring charges 0.05 - - - 0.05 Decommissioning obligation reduction (0.03) (0.03) - - - NRG Energy, Inc. acquisition costs 0.19 - - - 0.19 Unrealized gains related to nuclear decommissioning trust funds 0.10 (0.02) - 0.06 0.06 Non-cash remeasurement of income tax uncertainties and reassessment of state deferred income taxes $4.09 $(0.21) $0.53 $0.56 $3.21 FY 2009 GAAP Earnings (Loss) Per Share $4.12 $(0.12) $0.54 $0.54 $3.16 2009 Adjusted (non-GAAP) Operating Earnings (Loss) Per Share Exelon Other PECO ComEd ExGen 2009 GAAP EPS Reconciliation (1) (1) All amounts shown are per Exelon share and represent contributions to Exelon's
EPS. Note: Amounts may not add due to rounding.
|
 70 2010 Earnings Outlook • Exelon’s 2010 adjusted (non-GAAP) operating earnings outlook excludes the earnings effects of the following: • Mark-to-market adjustments from economic hedging activities • Unrealized gains and losses from nuclear decommissioning trust fund investments
• Significant impairments of assets, including goodwill • Changes in decommissioning obligation estimates • Costs associated with the 2007 Illinois electric rate settlement agreement • Costs associated with ComEd’s 2007 settlement with the City of Chicago • Costs associated with the retirement of fossil generating units • Other unusual items • Significant future changes to GAAP • Operating earnings guidance assumes normal weather for the year
|
 71 Exelon Investor Relations Contacts Exelon Investor Relations 10 South Dearborn Street Chicago, Illinois 60603 312-394-2345 312-394-4082 (Fax) For copies of other presentations, annual/quarterly reports, or to be added to our email distribution list please contact: Martha Chavez, Executive Admin Coordinator 312-394-4069 Martha.Chavez@ExelonCorp.com Investor Relations Contacts: Karie Anderson, Vice President 312-394-4255 Karie.Anderson@ExelonCorp.com Stacie Frank, Director 312-394-3094 Stacie.Frank@ExelonCorp.com Paul Mountain, Manager 312-394-2407 Paul.Mountain@ExelonCorp.com Marybeth Flater, Manager 312-394-8354 Marybeth.Flater@ExelonCorp.com |