Attached files
| file | filename |
|---|---|
| 8-K - FORM 8-K - ZIONS BANCORPORATION, NATIONAL ASSOCIATION /UT/ | form8-k.htm |

1
2010
Citi Financial Services Conference
10th-11th March 2010 ■ New
York

2
Forward-Looking
Statements
This
presentation contains statements that relate to the projected performance of
Zions Bancorporation
and elements of or affecting such performance, including statements with respect to the beliefs, plans,
objectives, goals, guidelines, expectations, anticipations and estimates of management. These
statements constitute forward-looking information within the meaning of the Private Securities Litigation
Reform Act. Actual facts, determinations, results or achievements may differ materially from the
statements provided in this presentation since such statements involve significant known and unknown
risks and uncertainties. Factors that might cause such differences include, but are not limited to:
competitive pressures among financial institutions; economic, market and business conditions, either
nationally or locally in areas in which Zions Bancorporation conducts its operations, being less
favorable than expected; changes in the interest rate environment reducing expected interest margins;
changes in debt, equity and securities markets; adverse legislation or regulatory changes; and other
factors described in Zions Bancorporation’s most recent annual and quarterly reports. In addition, the
statements contained in this presentation are based on facts and circumstances as understood by
management of the company on the date of this presentation, which may change in the future. Zions
Bancorporation disclaims any obligation to update any statements or to publicly announce the result of
any revisions to any of the forward-looking statements included herein to reflect future events,
developments, determinations or understandings.
3
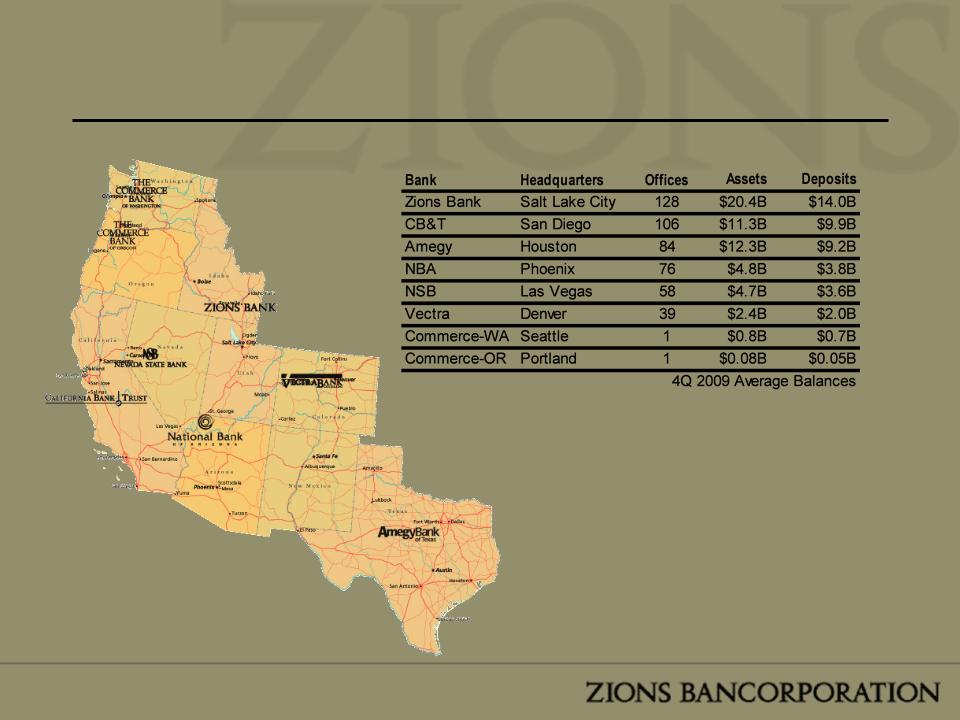
A
Collection of Great Banks

4
Strong
Focus on Business Banking - Loan Mix, Profit Mix
Consumer
22%
CRE
32%
*Includes FDIC
Supported Assets
*
Commercial Loans: 79%
*
Retail & Other Loans: 21%

5
Zions’
Strengths
• Annual
core pretax, pre-credit earnings range of $900 million to $950
million
million
– NIM: 3.81% in 4Q09,
ranked #2 of regional banks/peers*
– Best among peers*
for non-interest bearing deposits as a percent of earning assets
• Strong
allowance for credit loss: 4.3% of loans
• Low
original LTV ratios on term commercial real estate loans
• Markets
with nation’s strongest long term growth profile
– Leading SBA
Lender
– Superior Treasury
Management Products
• Competitive
operating cost structure
– Expense / Loan
ratio: Best quartile
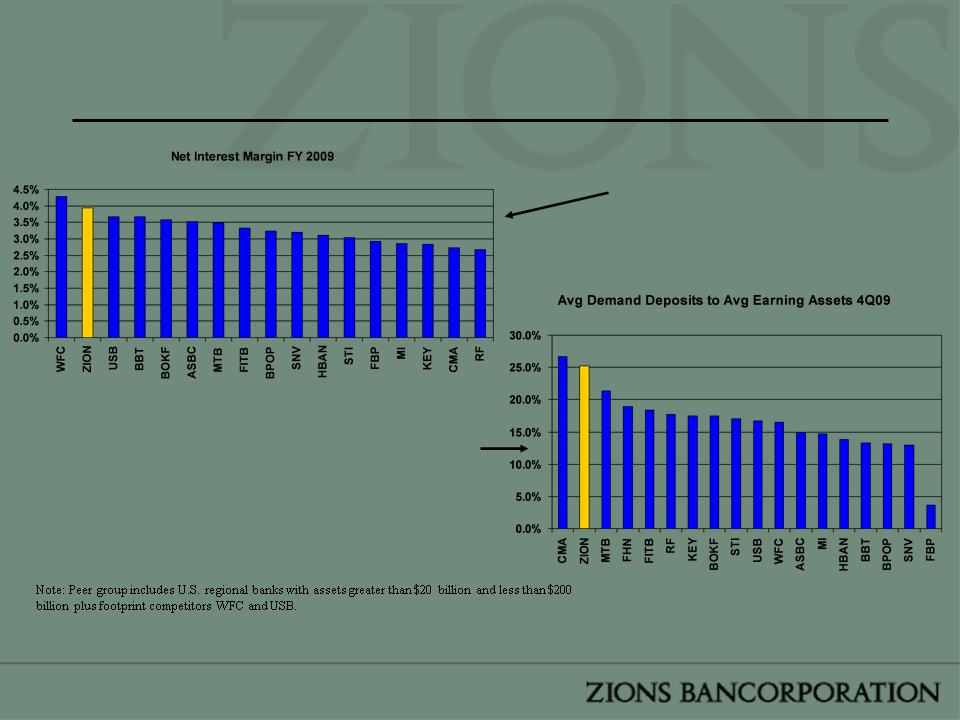
*Peer
group includes U.S. regional banks with assets greater than $20 billion
and
less than $200 billion plus footprint competitors WFC and USB.
less than $200 billion plus footprint competitors WFC and USB.

6
Zions’
Challenges
• Rising
NPAs, to 6.0% of loans from 5.4% in prior quarter (1)
– Total delinquent +
NPA declined by 1.2% in 4Q09 compared to the prior quarter
• 2009
net charge-off rate of 2.9% of loans; 4Q09 NCO rate: 3.0% (1)
• Continued
securities impairments (OTTI), primarily on
bank/insurance CDOs - $99.3 million in 4Q
bank/insurance CDOs - $99.3 million in 4Q
– Although OCI mark is
already reflected in GAAP capital ratios, the difference
between Amortized Cost (OTTI mark) and Carrying Value (OCI mark) is $620
million, representing a potential earnings impairment
between Amortized Cost (OTTI mark) and Carrying Value (OCI mark) is $620
million, representing a potential earnings impairment
(1)
Excludes FDIC supported assets
7
Agenda
|
Key Issues
Going Forward
–Net Interest
Margin
–Credit
Quality
–Term
CRE
–Securities
Portfolio
–Capital
Outlook
Summary
|
|
|
8
Net
Interest Margin
Source:
SNL (As Reported NIM - field not available for FHN)
Strong
NIM
Driven by
Strong Demand Deposits

9
Core
NIM Trends
Core
NIM Performance
• Due
to the
extinguishment/
reissuance of
subordinated debt in
June 2009, Zions
experiences non-cash
discount accretion,
which increases interest
expense, reducing GAAP
NIM
extinguishment/
reissuance of
subordinated debt in
June 2009, Zions
experiences non-cash
discount accretion,
which increases interest
expense, reducing GAAP
NIM
Core
NIM (excludes discount accretion) has been generally stable
• 1Q09
experienced a temporary dip due to an intentional build-up of excess
liquidity during the significant turmoil during late 2008/early 2009.
liquidity during the significant turmoil during late 2008/early 2009.
• Issuance
of senior notes in September 2009 had about 8 bps adverse impact
on the core NIM in 4Q09.
on the core NIM in 4Q09.

10
Agenda
|
Key Issues
Going Forward
–Net Interest
Margin
–Credit
Quality
–Term
CRE
–Securities
Portfolio
–Capital
Outlook
Summary
|
|
|

11
*Annualized
Zions
excludes FDIC supported assets
Note:
Peer group includes U.S. regional banks with assets greater than $20
billion and less than $200 billion plus footprint competitors WFC and USB.
billion and less than $200 billion plus footprint competitors WFC and USB.
Source:
SNL as of 2-11-10 (Peer Data)
•51%
of 2009 NCOs Attributable to Construction, Land & Development
NPAs
+ Greater than 90 Days
Delinquent / Loans + OREO
Delinquent / Loans + OREO
Net
Charge-offs as
a % of Loans*
a % of Loans*

12
Note:
Peer group includes U.S. regional banks with assets greater than $20
billion
and less than $200 billion plus footprint competitors WFC and USB.
and less than $200 billion plus footprint competitors WFC and USB.
Source:
SNL
Net
Charge Offs
- By Loan Type
(Regional Bank Peers)
(Regional Bank Peers)
Percentage
of Zions
Total Loans
Total Loans
Shaded
Portion Represents
Gaming Credits
Gaming Credits

13
Agenda
|
Key Issues
Going Forward
–Net Interest
Margin
–Credit
Quality
–Term
CRE
–Securities
Portfolio
–Capital
Outlook
Summary
|
|
|

14
Change
in CRE Loan Outstandings in $billions (4Q07 to 4Q09)
• A
decline in
construction has
been partially offset
by Term CRE loan
growth
construction has
been partially offset
by Term CRE loan
growth
• Commercial
construction loans
must qualify for
“pass grade”
underwriting in
order to move from
Construction to
Term CRE
construction loans
must qualify for
“pass grade”
underwriting in
order to move from
Construction to
Term CRE

15
Term
CRE Maturity Stratification

16
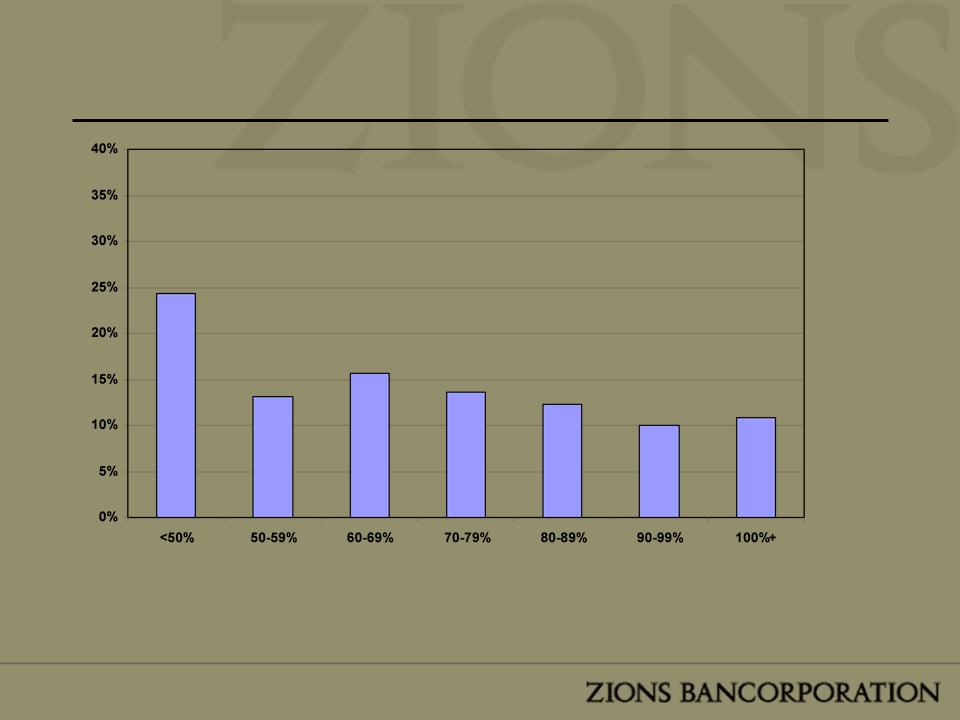
Term
CRE - LTV Stratification At Origination*
*Or most
recent appraisal; reappraisals are most frequently
conducted when a loan is downgraded to substandard
conducted when a loan is downgraded to substandard
|
Percentage
of Loans within each bucket that are Non-Accrual
|
||||||
|
2.9%
|
1.9%
|
1.6%
|
4.9%
|
17.4%
|
6.1%
|
1.2%
|
17
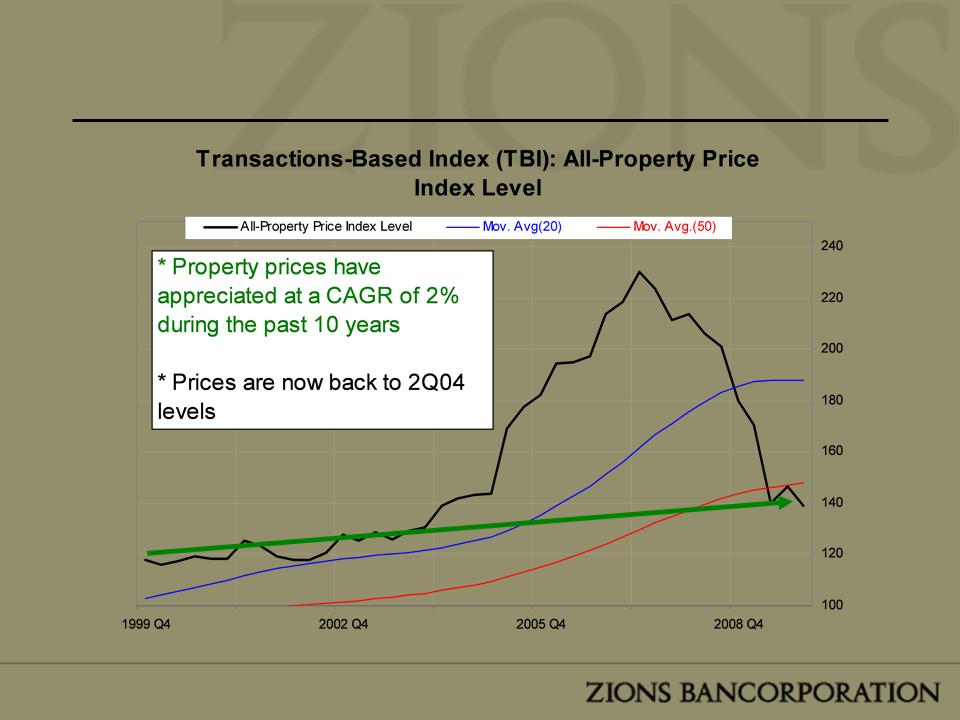
Macroeconomic
Data - MIT’s Transaction Based Index
18
Term
CRE - TBI* Adjusted LTV Stratification
*The MIT
Transaction Based Index is a national index that has
been applied to ZBC's mostly regional CRE Portfolio
been applied to ZBC's mostly regional CRE Portfolio
|
Percentage
of Loans within each bucket that are Non-Accrual
|
||||||
|
3.1%
|
1.5%
|
2.8%
|
3.1%
|
7.3%
|
4.1%
|
1.9%
|

19
Day
of Reckoning - or Not?
• Eighty
percent
of the industry’s CRE loans
maturing in 2014 are projected to be underwater
(LTV >100%).
maturing in 2014 are projected to be underwater
(LTV >100%).
• Based
on loans adjusted for price declines as
reflected in the 4Q09 MIT TBI, Zions would have
approximately 6% underwater.
reflected in the 4Q09 MIT TBI, Zions would have
approximately 6% underwater.
• Loans
Maturing in 2010 DO NOT include
approximately $92 MM of loans that have
matured, but are in workout
approximately $92 MM of loans that have
matured, but are in workout
Source:
American Banker, Foresight Analytics

20
Jan-10

21
C&I
Outstanding Balance vs. Non Accrual Loans - NAICS (12/31/2009)
|
Percentage
of Loans within each NAICS Category that are
Non-Accrual
|
|||||||||
|
Construction
|
Finance
|
Manufacturing
|
Oil
& Gas
|
Other
|
RE
Investment
& Dev. |
Retail
Trade
|
Service
|
Transport
|
Wholesale
Trade |
|
5.0%
|
2.0%
|
4.5%
|
5.2%
|
2.6%
|
4.0%
|
3.5%
|
3.9%
|
1.7%
|
5.9%
|
22
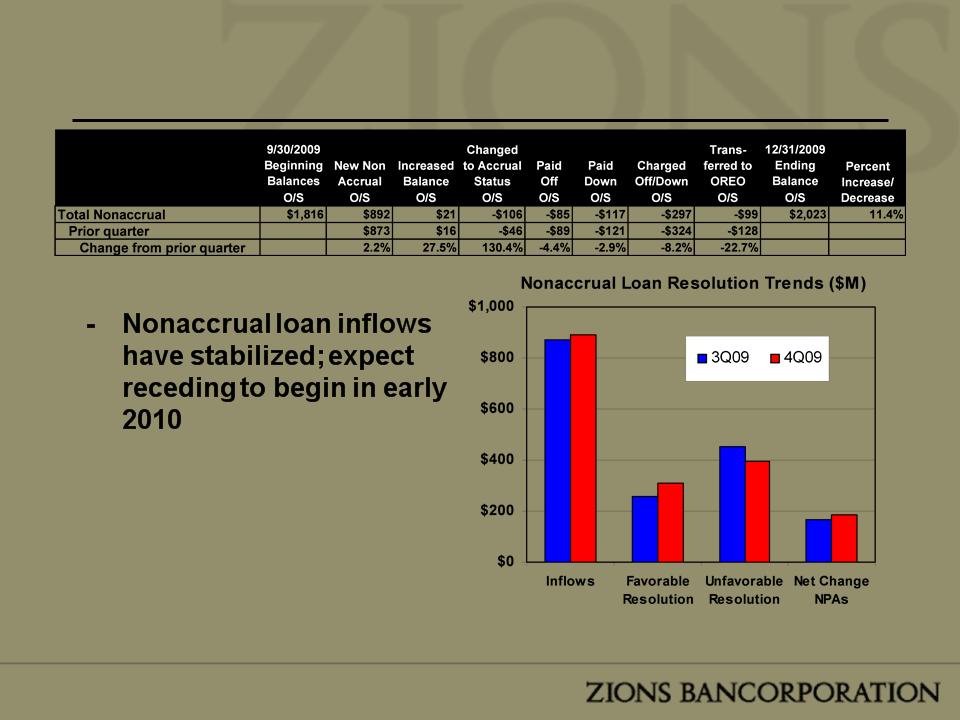
Nonaccrual
Loan Migration
- Favorable
resolutions
increased 21% vs. 3Q09
increased 21% vs. 3Q09
- Unfavorable
resolutions
declined 12% vs. 3Q09
declined 12% vs. 3Q09

23
Agenda
|
Key Issues
Going Forward
–Net Interest
Margin
–Credit
Quality
–Term
CRE
–Securities
Portfolio
–Capital
Outlook
Summary
|
|
|

24
CDO
Portfolio Summary
•Credit-related
OTTI losses $99.3 million in 4Q09
(approximately 95% of the impairment losses had been
previously recognized in OCI)
(approximately 95% of the impairment losses had been
previously recognized in OCI)
•Noncredit-related
losses on securities of $35.1 million in
4Q09 recognized in OCI
4Q09 recognized in OCI
*This
table includes $2.2 billion par value of CDOs that are
backed predominantly by bank trust preferred securities. The
par value of all Bank & Insurance backed CDOs is $2.7 billion
backed predominantly by bank trust preferred securities. The
par value of all Bank & Insurance backed CDOs is $2.7 billion

25
|
Model
Implied Bank Failures (1 year)
|
||
|
Scenario
@ 100%
|
Total
within Zions’ CDOs
|
Total
in Banking Universe
|
|
Actual
Bank Failures in 2009
|
57
|
133
|
|
Future
1 Year Failures Implied in 4Q09 Pricing
|
95
|
221
|
|
Moderate
Stress
|
117
|
272
|
|
Adverse
Stress
|
162
|
377
|
|
Extreme
Stress
|
218
|
507
|
• Under
various stress scenarios,
Zions’ modeling indicates that
OCI (accumulated other
comprehensive income) would
erode, although at a significantly
lower amount than OTTI (other
than temporary impairment)
Zions’ modeling indicates that
OCI (accumulated other
comprehensive income) would
erode, although at a significantly
lower amount than OTTI (other
than temporary impairment)
• OTTI:
Under the moderate stress
scenario at 100% greater PD,
OTTI incurred would be
approximately $111 million (after
tax).
scenario at 100% greater PD,
OTTI incurred would be
approximately $111 million (after
tax).
• OCI:
Under the same moderate
stress scenario at 100% greater
PD, OCI would deteriorate by
approximately $45 million (after
tax).
stress scenario at 100% greater
PD, OCI would deteriorate by
approximately $45 million (after
tax).
CDO
Stress Testing - OCI
26
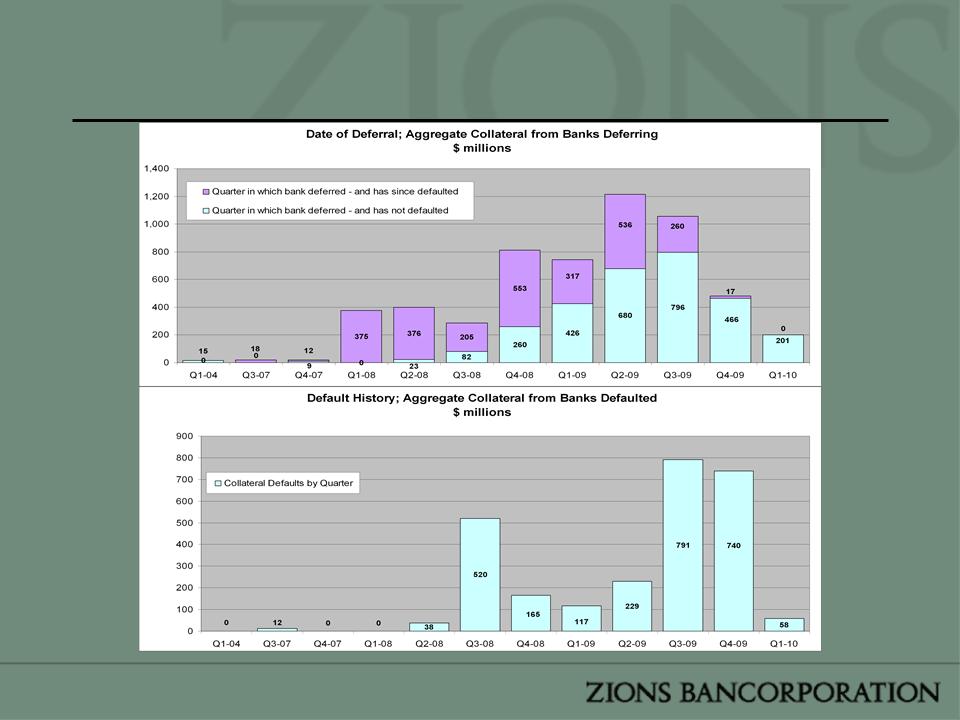
History
of Bank Deferrals & Defaults in Zions’ CDOs
As of
2-23-10

27
Agenda
|
Key Issues
Going Forward
–Net Interest
Margin
–Credit
Quality
–Term
CRE
–Securities
Portfolio
–Capital
Outlook
Summary
|
|
|

28
Where
We Are: Capital Ratios as of December 31, 2009
|
|
4Q08
|
3Q09
|
4Q09
|
|
Tangible
Common Equity (TCE)
|
5.89%
|
5.76%
|
6.12%
|
|
Tier 1
Common
|
6.28%
|
6.59%
|
6.73%
|
|
Tier 1 Risk
Based
|
10.22%
|
10.34%
|
10.53%
|
|
Total Risk
Based
|
14.32%
|
13.08%
|
13.28%
|
Sensitivity
to capital ratios based on announced transactions
• Up to $250 million
of common equity distribution announced in February 2010. Each
$100 million of common equity would add approximately 0.2% (20 bps) to the TCE and
Tier 1 capital ratios above.
$100 million of common equity would add approximately 0.2% (20 bps) to the TCE and
Tier 1 capital ratios above.
• Subordinated debt
tender offer announced in February 2010 ($190 million of debt
outstanding). Each incremental 25% participation rate would add approximately 0.1%
(10 bps) to the TCE and Tier 1 ratios above.
outstanding). Each incremental 25% participation rate would add approximately 0.1%
(10 bps) to the TCE and Tier 1 ratios above.

29
Where
We Are: Tier 1 + Reserves to Total Loans
-
12/31/09
Note:
Peer group includes U.S. regional banks with assets greater than $20 billion and
less than $200
billion plus footprint competitors WFC and USB.
billion plus footprint competitors WFC and USB.

30
Capital
Creation
- Zions’ equity raises less dilutive to shareholders
|
Equity
issuance
|
$709
|
|
$0
|
$986
|
$2,037
|
$0
|
$1,415
|
$1,136
|
$478
|
$571
|
|
Liability
management
|
$603
|
|
$0
|
$467
|
$1,345
|
$10
|
$24
|
$520
|
$0
|
$30
|
|
Other
strategic
|
$99
|
|
$18
|
$1,473
|
$176
|
$4
|
$0
|
$20
|
$0
|
$34
|
Source:
Credit Suisse

31
Zions’
Approach to Capital
• Maintain
and incrementally improve capital ratios
• Use
all available “levers” to minimize dilution
– Common equity
distribution programs
– Convertible
instruments
• Modified sub debt
converts to preferred (Tier 1)
– Reduce tangible
assets (loan demand remains weak)
– Reduce
risk-weightings of assets
– Preserve DTA - GAAP
and RAAP
• Raise
capital to repay TARP after credit
conditions and earnings outlook improve
conditions and earnings outlook improve
– Cost of capital
lower - common and preferred

32
Risks
to Approach
• Regulatory/political
pressure to take action not in
shareholders’ interest
shareholders’ interest
• Not
raising enough/markets deteriorate

33
|
|
|
|
|
|
|
▼
|
|
Loan
Growth & Total Assets
|
|
|
▲
|
|
Low-Cost
Deposit Growth
|
|
|
▼
|
|
Credit
Costs
|
|
|
▲
|
|
Net
Interest Margin
|
|
|
◄►
|
|
Core
Non-interest Expenses
|
|
|
◄
▼
|
|
OTTI
|
|
|
◄
▲
|
|
Capital
Ratios
|
Outlook
Summary

34
2010
Citi Financial Services Conference
10th - 11th March, 2010
New
York City

35
Appendix

36
Risk-adjusted
Net Interest Margin* (FY 2009)
*(Net
Interest Income - Net Charge-offs)/Average Earning Assets
Note: Peer
group includes U.S. regional banks with assets greater than $20 billion and less
than $200
billion plus footprint competitors WFC and USB.
billion plus footprint competitors WFC and USB.
Source:
SNL

37
Loan
Portfolio Performance
(12/31/2009)

38
ZION
vs. SCAP More
Adverse Stress
Loss Projections

39
Construction
loan overview
-
Resi Growth, NAL, NCO Trends
Residential
Construction

40
Construction
loan overview
- Commercial Growth, NAL, NCO Trends
Commercial
Construction

41
Term
CRE - Category Stratification

42
Term
CRE Credit Trends
- Effect of Gaming on Loss Rates
• Annualized
4Q09 NCOs Including Gaming:
3.1%
annualized
• Annualized
4Q09 NCOs Excluding Gaming:
1.7%
annualized
• Loss
trends much more stable excluding gaming; gaming Term
CRE credits remaining: $74 million.
CRE credits remaining: $74 million.

43
CDO
Stress Testing - OTTI
“Deterioration in
PDs %” means that the default
curve applied to the performing collateral of
each deal is made worse by the percentage
indicated. Thus a deal with a default curve of
5% stressed to a 25% “Deterioration in PDs %”
would have a 6.25% defaults applied to it, a
deal with 20% would go 25% and so forth.
Thus a “Deterioration in PDs %” stress of 100%
would double the PD curve being applied to a
deal's collateral.
•Moderate Stress
- The PD
curve that was
applied to the performing collateral of each
CDO deal in the 4Q09 pricing run is increased
by the % indicated and the resultant values
were used to estimate OTTI losses.
applied to the performing collateral of each
CDO deal in the 4Q09 pricing run is increased
by the % indicated and the resultant values
were used to estimate OTTI losses.
•Adverse Stress
- Incorporates
all of the
deterioration of PDs applied to the performing
collateral, but also stresses the PDs applied to
collateral in deferral by the same deterioration
percentages. PDs on deferring collateral are
used to estimate the value of the potential for
this collateral to cure in the future through
recovery or re-performance.
•Extreme Stress
- This is
a very
severe
stress
scenario that uses the “Moderate Stress”
assumptions for performing collateral, but also
immediately defaults all deferring collateral
instantly with no recovery and no probability to
re-perform in the future.
scenario that uses the “Moderate Stress”
assumptions for performing collateral, but also
immediately defaults all deferring collateral
instantly with no recovery and no probability to
re-perform in the future.

44
Small
Business Banking:
National
Awards:
• Overall
Satisfaction
• Relationship Manager
Performance
• Financial
Stability
• Overall Treasury
Management
Regional
Awards:
• Overall Satisfaction
- West
• Overall Satisfaction
- Treasury Management -
West
West
What
Others Say About Us
2009
Greenwich Excellence Awards
in
Small Business and Middle Market Banking
Middle
Market Banking
National
Awards:
• Overall
Satisfaction
• Personal
Banking
• Relationship Manager
Performance
• Credit
Policy
• Financial
Stability
• Overall Treasury
Management
• Accuracy of
Operations
• Customer
Service
• Treasury Product
Capabilities
Regional
Awards:
• Overall Satisfaction
- West
• Overall Satisfaction
- Treasury Management - West
45
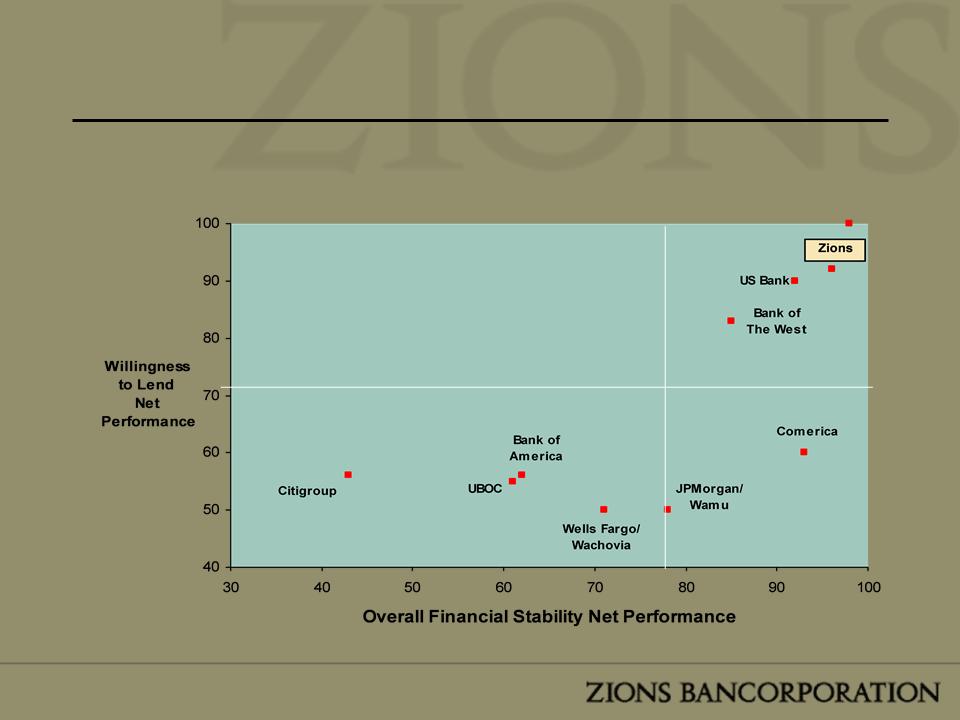
Frost
What
Others Say About Us
Overall
Financial Stability Compared to Willingness to Lend ($1 - $10
million)
Source:
Greenwich Associates, Commercial Banking Study Q2 2009 ($1-$10
million)

46
Asset
Sensitivity
Fixed-rate
loans:
– 27% of
portfolio
– Duration of about 1
year
Variable-rate
loans:
– 73% of
portfolio
– Floors on 46% of
variable-rate loans (79% of those loans are at the floor rate)
– Swaps: $760 million
(Pay Floating, Receive Fixed)
• Continual reduction
of interest rate swaps (increasing asset sensitivity)

47
Loans
with Floors (as of 12/31/09)

48