Attached files
| file | filename |
|---|---|
| EX-99.1 - KRATON PERFORMANCE POLYMERS, INC. TELECONFERENCE TRANSCRIPT - Kraton Corp | dex991.htm |
| 8-K - FORM 8-K - Kraton Corp | d8k.htm |
| CONFIDENTIAL March 4, 2010 Kraton Performance Polymers, Inc. 2009 Year-End Conference Call Exhibit 99.2 |
| CONFIDENTIAL 2 Disclaimers Forward-Looking Statements This presentation may include “forward-looking statements” that reflect our plans, beliefs, expectations and current views with respect to, among other things, future events and
financial performance. Forward-looking statements are often
characterized by the use of words such as “believes,” “estimates,” “expects,” “projects,” “may,” “intends,” “plans” or “anticipates,” or by discussions of strategy, plans or intentions. All forward-looking statements in this presentation are made based on management's current expectations and
estimates, which involve risks, uncertainties and other factors that could
cause actual results to differ materially from those expressed in
forward-looking statements. Readers are cautioned not to place undue
reliance on forward-looking statements. We assume no obligation to
update such information. Further information concerning issues that could materially affect financial performance related to forward looking statements can be
found in our periodic filings with the Securities and Exchange
Commission. GAAP Disclaimer This presentation includes the use of both GAAP (generally accepted accounting
principles) and non-GAAP financial measures. The non-GAAP financial
measures are EBITDA and Adjusted EBITDA. The most directly comparable GAAP
financial measure is net income/loss. A reconciliation of the non-GAAP
financial measures used in this presentation to the most directly comparable GAAP measure is included herein. We consider EBITDA and Adjusted EBITDA important supplemental measures of our performance and believe
they are frequently used by investors and other interested parties in the
evaluation of companies in our industry. EBITDA and Adjusted EBITDA have
limitations as analytical tools and should not be considered in isolation or as a substitute for analysis of our results under GAAP in the United States. |
 CONFIDENTIAL 2009 Highlights Volumes recovering – growth in Q4 2009 Expanded margins year-on-year Established sales and production records for IR Latex IPO of Kraton Performance Polymers, Inc. (NYSE:KRA); raising $138 million in net proceeds Reduced debt by $190 million Upsized and extended revolving credit facility to 2013 Completed SAP/ERP global migration Opened new Innovation Center in Houston Reorganized commercial team centering around innovation-led market development
priorities Achieved cost reductions of $17 million; $7 million above our target Shut down Pernis, The Netherlands IR plant saving $12 million beginning in 2010
3 Weathered economic downturn creating significant operating leverage!
|
 CONFIDENTIAL $(10) $13 $53 $35 Q1 09 Q2 09 Q3 09 Q4 09 2009 Financial Highlights $178 $234 $270 $238 Q1 09 Q2 09 Q3 09 Q4 09 Adhesives, Sealants & Coatings, Advanced Materials and Emerging Businesses each posted revenue growth in Q4 2009 versus Q4 2008 Sales Revenue (1) (US $ in Millions) (1) Excludes by-product revenue (2) Adjusted EBITDA is GAAP EBITDA excluding sponsor fees, restructuring and related charges, non-cash expenses, and the gain on extinguishment of debt Q3 momentum continued into Q4 Q4 volume of 61kt up 16% versus Q4 2008 2009 volume of 260 kilotons versus 313 kilotons in 2008 Volume (kt) 47 71 81 61 61% 76 % 90% Q1 09 Q2 09 Q3 09 Q4 09 116% % of 2008 Q4 2009 adjusted EBITDA was up 21% compared to $29 million in Q4 2008 Adjusted EBITDA margin percentage yields 170 basis point improvement versus Q4 2008 Adjusted EBITDA (2) (US $ in Millions) 4 |
 CONFIDENTIAL End Use Review 5 Advanced Materials Steady volume recovery in second half of year Demand from consumer electronics and personal care customers especially encouraging Renewed customer enthusiasm for innovation products also picking up in fourth quarter PVC replacement trend favorable FY 2009 vs. FY 2008 Q4 2009 vs. Q4 2008 (21)% 19% Paving and Roofing Paving customers tentative due to uncertainty around funding of government stimulus program Orders in early 2010 provide for some optimism but much uncertainty remains regarding demand Budget “stimulus” vs. Budget “replenishment” a constant tension FY 2009 vs. FY 2008 Q4 2009 vs. Q4 2008 (34)% (27)% Adhesives, Sealants and Coatings Demand improvement later in year in non- woven adhesive applications, and in commercial and specialty tapes Traditional fourth quarter destocking did not materialize (20)% 12% FY 2009 vs. FY 2008 Q4 2009 vs. Q4 2008 |
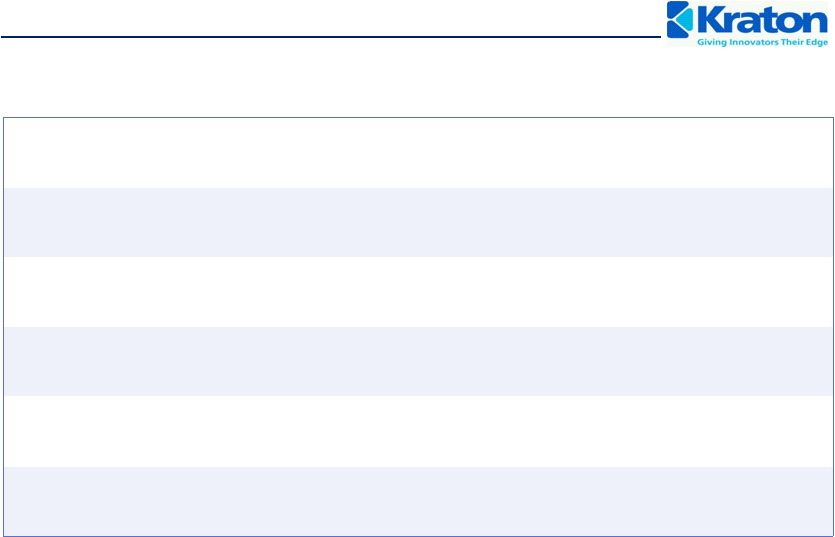
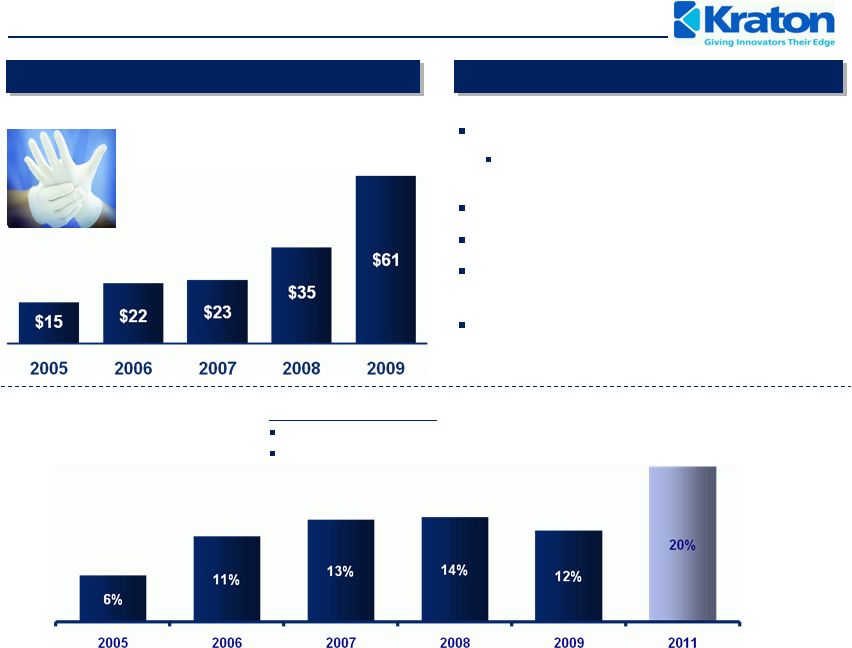 CONFIDENTIAL Innovation-led Top Line Growth Case Study: IR Latex Revenue Growth Key Attributes Tremendous growth Rapidly capture share from $2.2 billion natural rubber latex industry Margins well in excess of rest of business Kraton maintains 86% market share Challenging process technology to replicate for competitors and new entrants IPO proceeds will help fund IR Latex capacity expansion (US$ in millions) 20/20 Vision by 2011 20% of revenue from innovation 20% contribution margin premium 6 |
 CONFIDENTIAL Productivity Enhancements Executed $53 million capital plan flawlessly Global ERP project completed with seamless conversion from a customer perspective Completed Phase I of the Belpre control and system upgrade project Exceeded $10 million cost out target by $7 million Completed Pernis IR shut-down Will yield $12 million in savings in 2010 Cash cost to achieve of $10 million accrued in Q3 2009, of which $8 million will be spent in Q1 2010 7 |
 CONFIDENTIAL 2009 Financial Overview (1) Adjusted EBITDA is GAAP EBITDA excluding sponsor fees, restructuring and related charges,
non-cash expenses, and the gain on extinguishment of debt US $ in Millions 8 2009 2008 2009 2008 Sales Volume (kt) 61 53 260 313 Total Operating Revenues 250,708 $ 231,636 $ 968,004 $ 1,226,033 $ Cost of Goods Sold 189,840 182,665 792,472 971,283 Gross Profit 60,868 $ 48,971 $ 175,532 $ 254,750 $ Operating expenses Research and development 6,098 $
5,920 $
21,212 $ 27,049 $ Selling, general and administrative 22,919 27,853 79,504 101,431 Depreciation and amortization of identifiable intangibles 25,168 12,282 66,751 53,162 Gain on Extinguishment of Debt - - 23,831 - Equity in Earnings of Unconsolidated Joint Venture 98 123 403 437 Interest Expense, net 9,179 8,999 33,956 36,695 Income (Loss) Before Income Taxes (2,398) (5,960) (1,657) 36,850 Income Tax Expense (882) 1,035 (1,367) 8,431 Net Income (Loss) (1,516) $ (6,995) $ (290) $
28,419 $ Earnings (Loss) per common share - Diluted (0.07) $
(0.36) $
(0.01) $
1.46 $
Adjusted EBITDA (1) 35,043 $ 28,551 $ 91,359 $ 152,048 $ Fourth Quarter Full Year |
 CONFIDENTIAL Operating Revenue Walk Q4 2008 vs. Q4 2009 FY 2008 vs. 2009 US $ in millions 9 |
 CONFIDENTIAL Adjusted EBITDA (1) Walk Q4 2008 vs. Q4 2009 Full Year 2008 vs. 2009 US $ in millions (1) Adjusted EBITDA is GAAP EBITDA excluding sponsor fees, restructuring and related charges,
non-cash expenses, and the gain on extinguishment of debt 10 |
 CONFIDENTIAL Indebtedness and Liquidity Gross Debt Cash Net Debt December 31, 2008 $ 575 $ 101 $ 474 Bond buyback program (37) (13) (24) Proceeds from IPO (1) (100) 27 (127) Debt services, net (53) (46) (7) December 31, 2009 $ 385 $ 69 $ 316 Working capital produced $30 million cash flow Total liquidity (2) increased from $127 million to $149 million Revolver amended to increased availability from $75.5 million to $80.0 million and extended maturity to May 2013 (1) Proceeds from IPO excludes underwriters’ over-allotment option exercised in January 2010 yielding additional cash proceeds of $11 million (2) Total liquidity is cash on hand plus undrawn revolver availability 11 US $ in Millions |
 CONFIDENTIAL Outlook 2010 Capital spending $50 to $55 million Cash interest $20 to $22 million Cash pension contributions $4 to $5 million Cash restructuring $10 million Book tax rate 20% to 25% Cash tax rate 15% to 20% 12 |
 CONFIDENTIAL Kraton 2010 Business Priorities Innovation-led Top-line Growth Vision 20/20 Vitality index at or above 14% Demonstrate clear traction on step-out innovation projects Capital Investment Flawlessly execute $55 million investment plan PIR conversion to Belpre Paulinia IRL to 2,200 tons DCS Phase II Belpre Plan for semi works to increase innovation productivity Earnings Growth Return business to full year sustainable growth Leverage “smart” pricing to maintain target margins Continue focus on developing economies Capture stimulus spending opportunities Critical Capabilities Leverage enhanced market development capabilities Implement new sales and marketing incentive plan Utilize SAP full functionality Investor Relations 13 |
 CONFIDENTIAL March 4, 2010 Appendix |
 CONFIDENTIAL Reconciliation of Net Income/(Loss) to EBITDA and Adjusted EBITDA (1) The EBITDA measure is used by management to evaluate operating performance.
Management believes that EBITDA is useful to investors because it is
frequently used by investors and other interested parties in the evaluation of companies in our industry. EBITDA is not a recognized term under GAAP and does not purport to be an alternative to
net income (loss) as an indicator of operating performance or to cash flows from operating activities as a measure of liquidity. Since not all companies use identical calculations, this presentation of EBITDA may not be comparable to other similarly
titled measures of other companies. Additionally, EBITDA is not intended to
be a measure of free cash flow for management's discretionary use, as it does not consider certain cash requirements such as interest payments, tax payments and debt service
requirements. (2) Adjusted EBITDA is EBITDA excluding sponsor fees, restructuring and related charges, non-cash expenses, and the gain on extinguishment of debt. 15 3 months Ended 3 months Ended 12 months Ended 12 months Ended 12/31/2009 12/31/2008 12/31/2009 12/31/2008 Net Income (Loss) (1,516) $ (6,995) $ (290) $
28,419 $ Plus Interest Expense, net 9,179 8,999 33,956 36,695 Income tax expense (882) 1,035 (1,367) 8,431 Depreciation and amortization expenses 25,168 12,282 66,751 53,162 EBITDA (1) 31,949 $ 15,321 $ 99,050 $ 126,707 $ EBITDA (1) 31,949 $ 15,321 $ 99,050 $ 126,707 $ Add(deduct): Sponsor fees and expenses 500 500 2,000 2,000 Restructuring and related charges 2,144 4,189 9,677 13,671 Other non-cash expenses 450 8,541 4,463 9,670 Gain on extinguishment of debt - - (23,831) - Adjusted EBITDA (2) 35,043 $ 28,551 $ 91,359 $ 152,048 $ Restructuring and related detail: Cost of goods sold 440 355 6,747 355 Research and development - 129 - 2,430 Selling, general and administrative 1,704 3,705 2,930 10,886 Total restructuring and related charges 2,144 $ 4,189 $ 9,677 $
13,671 $
|
 CONFIDENTIAL March 4, 2010 Kraton Performance Polymers, Inc. 2009 Year-End Conference Call |