Attached files
| file | filename |
|---|---|
| 8-K - 8-K - EQT Corp | a10-5279_38k.htm |
Exhibit 99.1
|
|
Common Stock Offering Investor Presentation March 2010 |
|
|
Contact Us EQT Corporation (NYSE: EQT) EQT Plaza 625 Liberty Avenue, Suite 1700 Pittsburgh, PA 15222 Pat Kane ~ Chief Investor Relations Officer (412) 553-7833 The Securities and Exchange Commission (the "SEC") permits oil and gas companies, in their filings with the SEC, to disclose only proved, probable and possible reserves that a company anticipates at a given date to be economically and legally producible and deliverable by application of development projects to known accumulations. We use certain terms in this presentation, such as total resource potential, that the SEC's rules strictly prohibit us from including in filings with the SEC. We caution you that the SEC views such total resource potential estimates as inherently unreliable and these estimates may be misleading to investors unless the investor is an expert in the natural gas industry. We also note that the SEC strictly prohibits us from aggregating proved, probable and possible reserves in filings with the SEC due to the different levels of certainty associated with each reserve category. Disclosures in this presentation contain certain forward-looking statements. Statements that do not relate strictly to historical or current facts are forward-looking. Without limiting the generality of the foregoing, forward-looking statements contained in this presentation specifically include the expectations of plans, strategies, objectives and growth and anticipated financial and operational performance of the company and its subsidiaries, including guidance regarding the company’s drilling and infrastructure programs (including the Equitrans expansion project) and technology, the estimated number of acres to be held in the high-pressure Marcellus fairway following and the timing of the closing of the transaction described in the company’s Form 8-K dated March 2, 2010, the expected decline curve, total resource potential, production and sales volumes, reserves, estimated ultimate recoveries, F&D costs, reserve replacement ratio, capital commitments and capital expenditures, capital budget, financing plans (including number of shares to be sold in this offering), dividend rate, projected operating cash flows, hedging strategy, growth rate, rates of return, net asset value/share, and tax position (including tax refunds). These statements involve risks and uncertainties that could cause actual results to differ materially from projected results. Accordingly, investors should not place undue reliance on forward-looking statements as a prediction of actual results. The company has based these forward-looking statements on current expectations and assumptions about future events. While the company considers these expectations and assumptions to be reasonable, they are inherently subject to significant business, economic, competitive, regulatory and other risks and uncertainties, most of which are difficult to predict and many of which are beyond the company’s control. The risks and uncertainties that may affect the operations, performance and results of the company’s business and forward-looking statements include, but are not limited to, those set forth under Item 1A, “Risk Factors” of the company’s Form 10-K for the year ended December 31, 2009, as updated by any subsequent Form 10-Qs. Any forward-looking statement speaks only as of the date on which such statement is made and the company does not intend to correct or update any forward-looking statement, whether as a result of new information, future events or otherwise. |
|
|
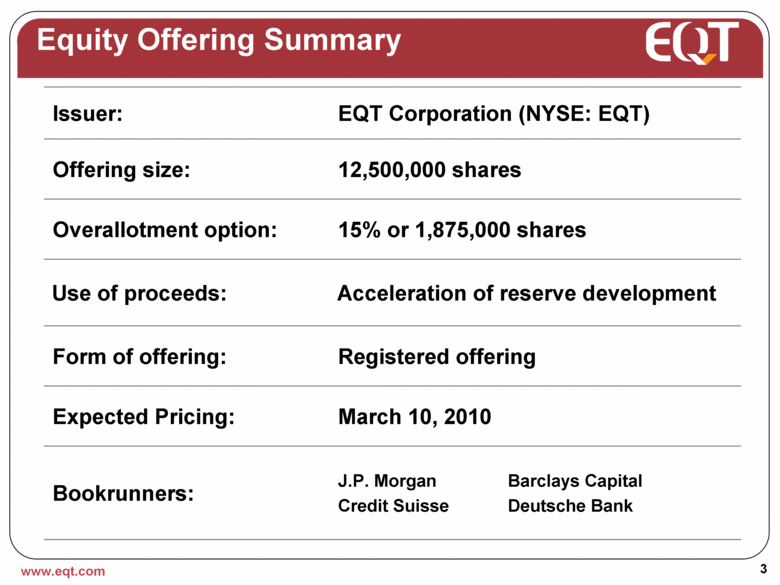
Equity Offering Summary Bookrunners: Expected Pricing: Form of offering: Use of proceeds: Overallotment option: Offering size: Issuer: J.P. Morgan Barclays Capital Credit Suisse Deutsche Bank March 10, 2010 Registered offering Acceleration of reserve development 15% or 1,875,000 shares 12,500,000 shares EQT Corporation (NYSE: EQT) |
|
|
EQT Presentation Team Murry Gerber – Chairman & CEO Dave Porges – President & Chief Operating Officer Phil Conti – Senior Vice President & Chief Financial Officer Pat Kane – Chief Investor Relations Officer |
|
|
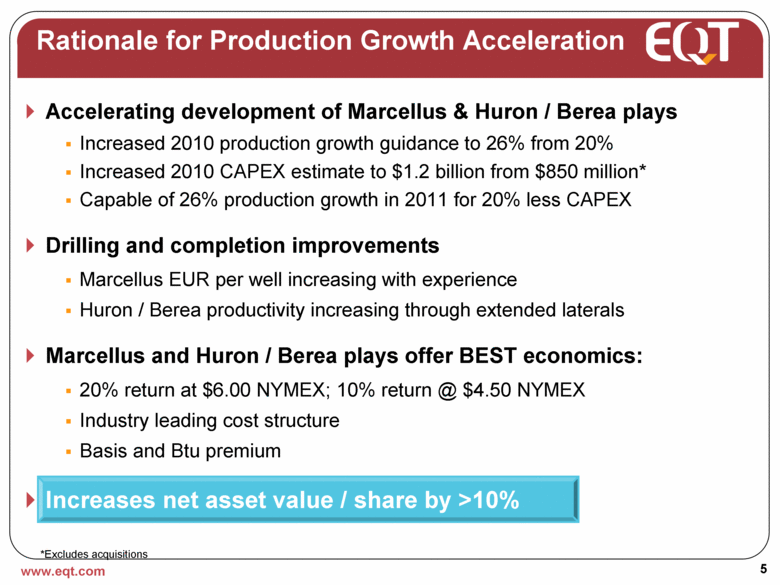
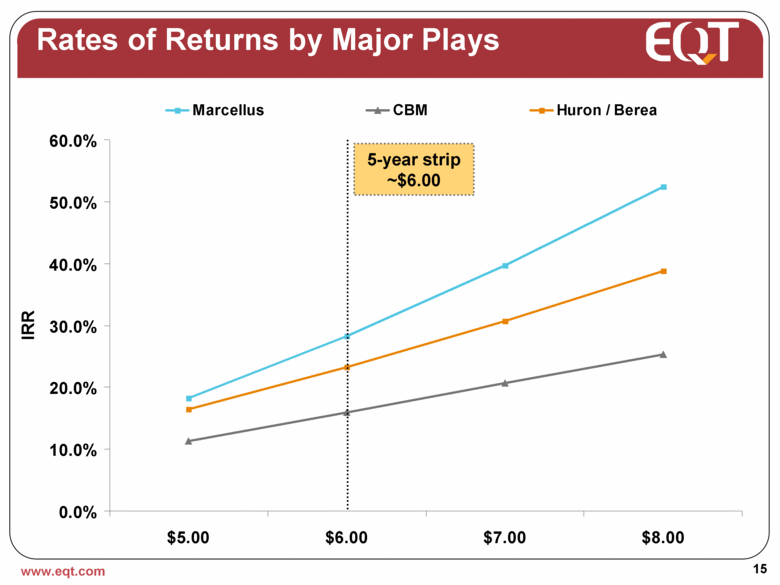
Accelerating development of Marcellus & Huron / Berea plays Increased 2010 production growth guidance to 26% from 20% Increased 2010 CAPEX estimate to $1.2 billion from $850 million* Capable of 26% production growth in 2011 for 20% less CAPEX Drilling and completion improvements Marcellus EUR per well increasing with experience Huron / Berea productivity increasing through extended laterals Marcellus and Huron / Berea plays offer BEST economics: 20% return at $6.00 NYMEX; 10% return @ $4.50 NYMEX Industry leading cost structure Basis and Btu premium Increases net asset value / share by >10% Rationale for Production Growth Acceleration *Excludes acquisitions |
|
|
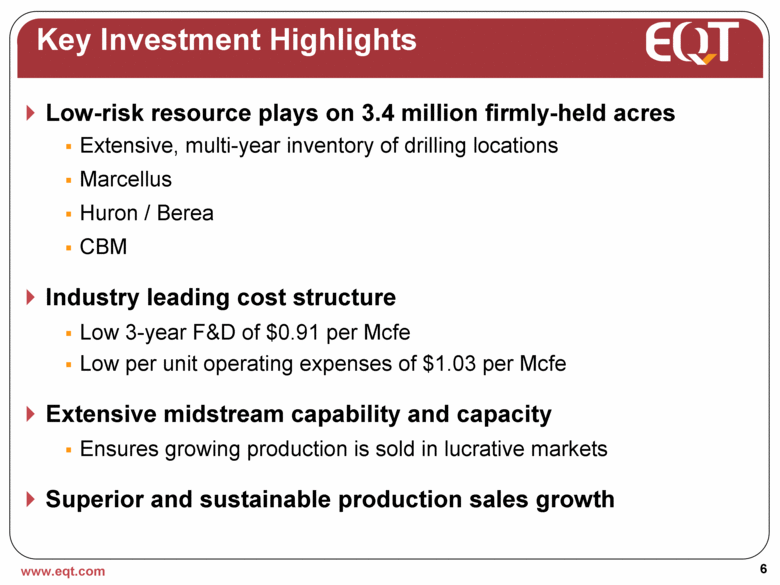
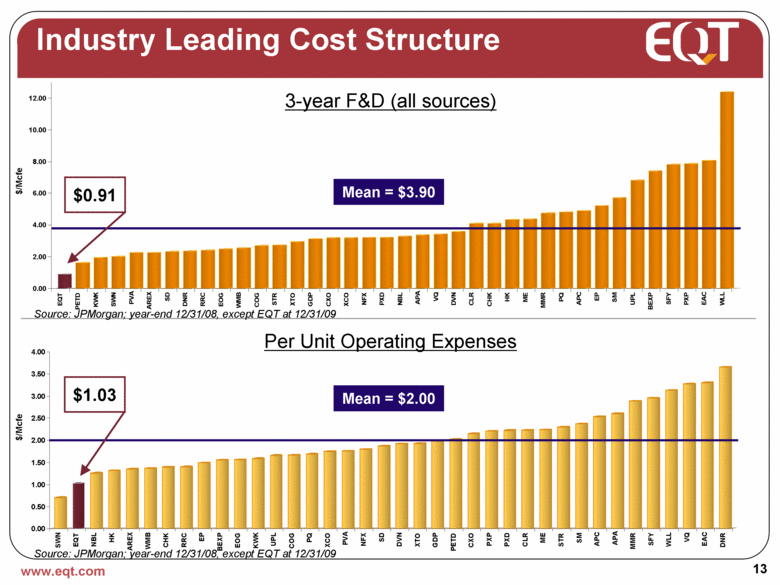
Key Investment Highlights Low-risk resource plays on 3.4 million firmly-held acres Extensive, multi-year inventory of drilling locations Marcellus Huron / Berea CBM Industry leading cost structure Low 3-year F&D of $0.91 per Mcfe Low per unit operating expenses of $1.03 per Mcfe Extensive midstream capability and capacity Ensures growing production is sold in lucrative markets Superior and sustainable production sales growth |
|
|
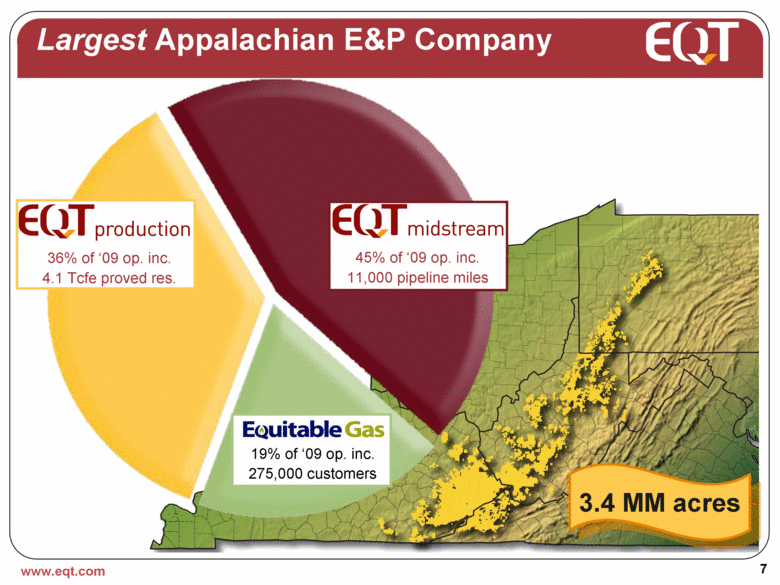
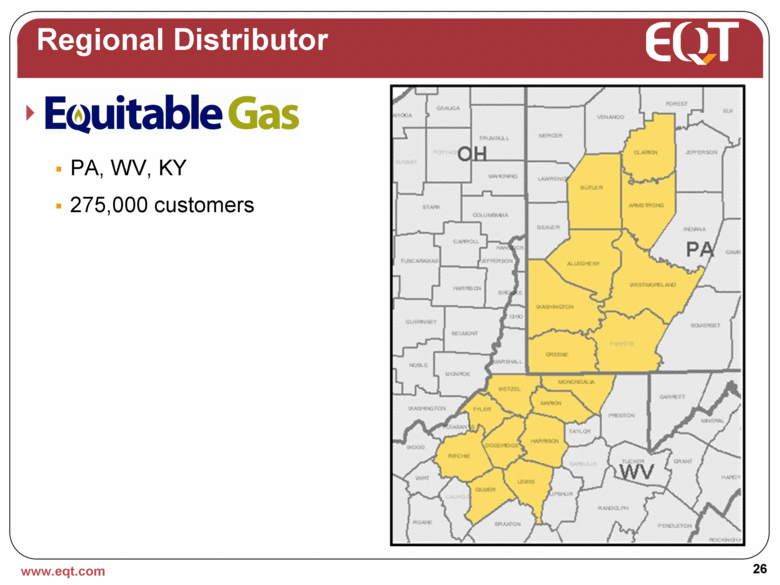
Largest Appalachian E&P Company 19% of ‘09 op. inc. 275,000 customers 3.4 MM acres 36% of ‘09 op. inc. 4.1 Tcfe proved res. 45% of ‘09 op. inc. 11,000 pipeline miles |
|
|
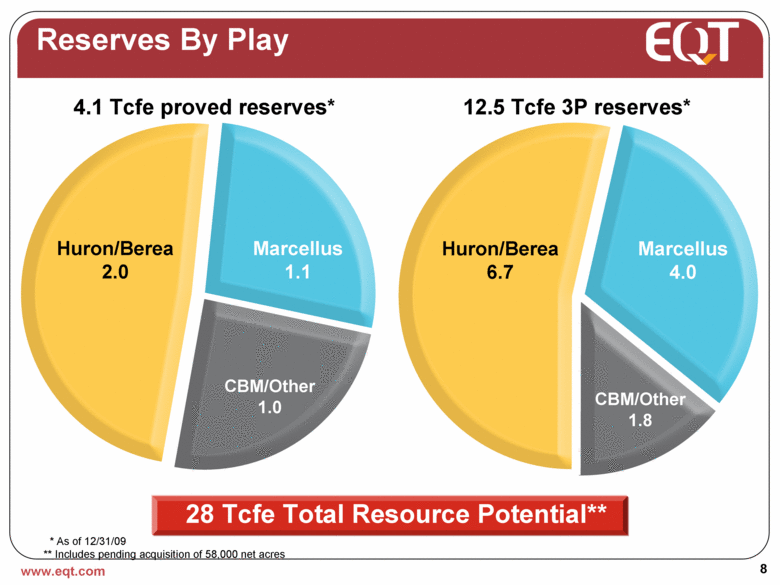
Reserves By Play 28 Tcfe Total Resource Potential** * As of 12/31/09 ** Includes pending acquisition of 58,000 net acres Huron/Berea 6.7 Marcellus 4.0 CBM/Other 1.8 Huron/Berea 2.0 Marcellus 1.1 CBM/Other 1.0 4.1 Tcfe proved reserves* 12.5 Tcfe 3P reserves* |
|
|
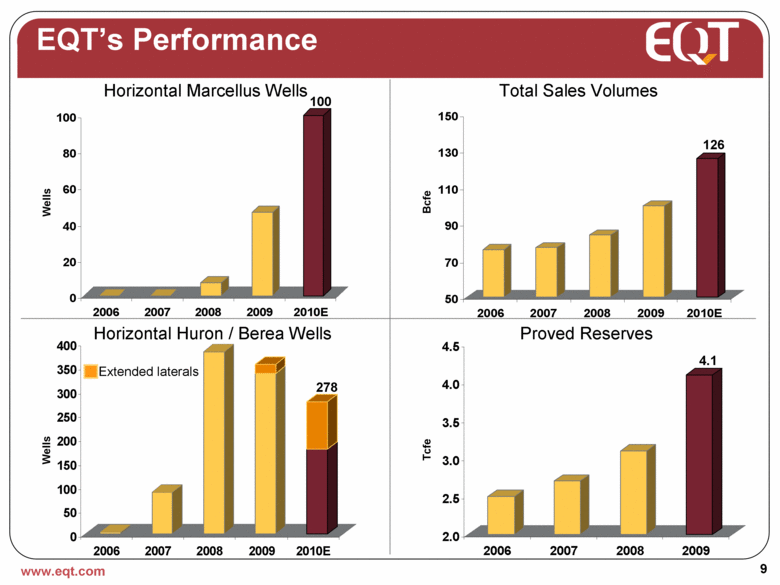
EQT’s Performance Horizontal Huron / Berea Wells Horizontal Marcellus Wells Total Sales Volumes Proved Reserves Bcfe Tcfe Wells Wells Extended laterals 278 100 126 4.1 |
|
|
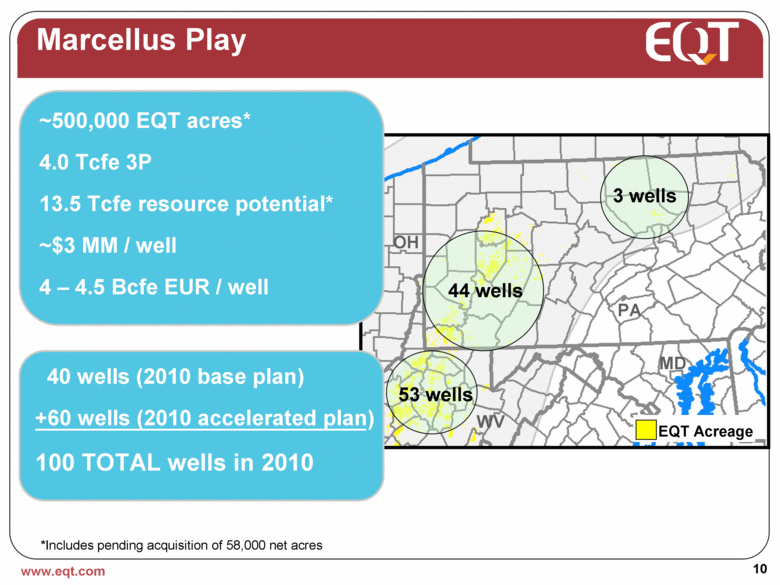
Marcellus Play 44 wells 53 wells 3 wells *Includes pending acquisition of 58,000 net acres ~500,000 EQT acres* 4.0 Tcfe 3P 13.5 Tcfe resource potential* ~$3 MM / well 4 – 4.5 Bcfe EUR / well EQT Acreage PA MD WV OH 40 wells (2010 base plan) +60 wells (2010 accelerated plan) 100 TOTAL wells in 2010 |
|
|
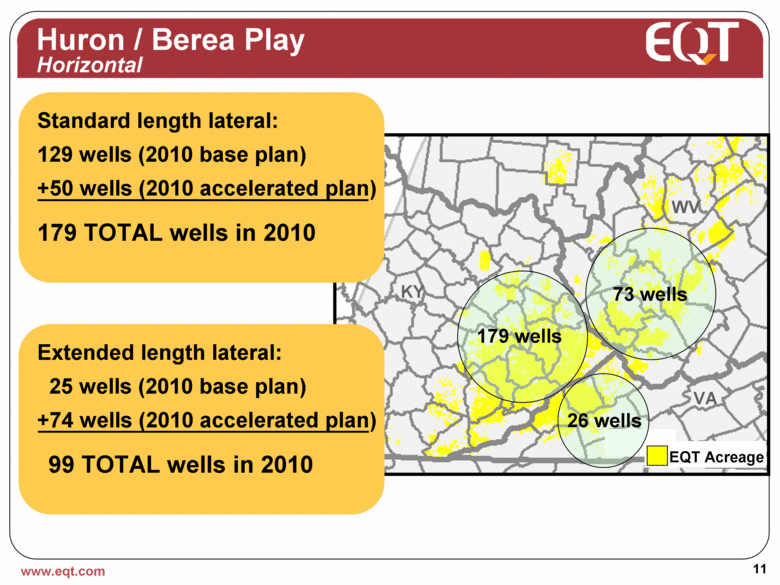
Huron / Berea Play Horizontal 179 wells 26 wells 73 wells Standard length lateral: 129 wells (2010 base plan) +50 wells (2010 accelerated plan) 179 TOTAL wells in 2010 EQT Acreage VA WV KY Extended length lateral: 25 wells (2010 base plan) +74 wells (2010 accelerated plan) 99 TOTAL wells in 2010 |
|
|
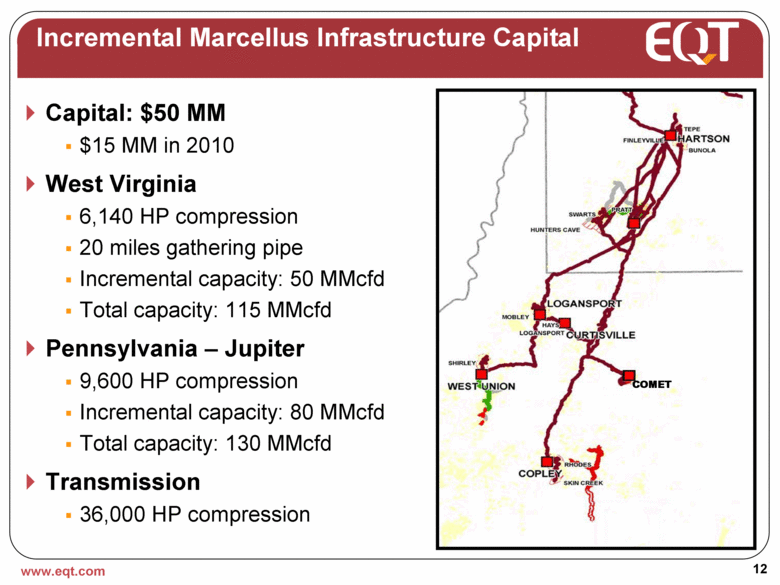
Incremental Marcellus Infrastructure Capital Capital: $50 MM $15 MM in 2010 West Virginia 6,140 HP compression 20 miles gathering pipe Incremental capacity: 50 MMcfd Total capacity: 115 MMcfd Pennsylvania – Jupiter 9,600 HP compression Incremental capacity: 80 MMcfd Total capacity: 130 MMcfd Transmission 36,000 HP compression PA WV COMET |
|
|
Industry Leading Cost Structure $/Mcfe $/Mcfe 3-year F&D (all sources) Per Unit Operating Expenses Mean = $2.00 Mean = $3.90 $0.91 $1.03 Source: JPMorgan; year-end 12/31/08, except EQT at 12/31/09 Source: JPMorgan; year-end 12/31/08, except EQT at 12/31/09 |
|
|
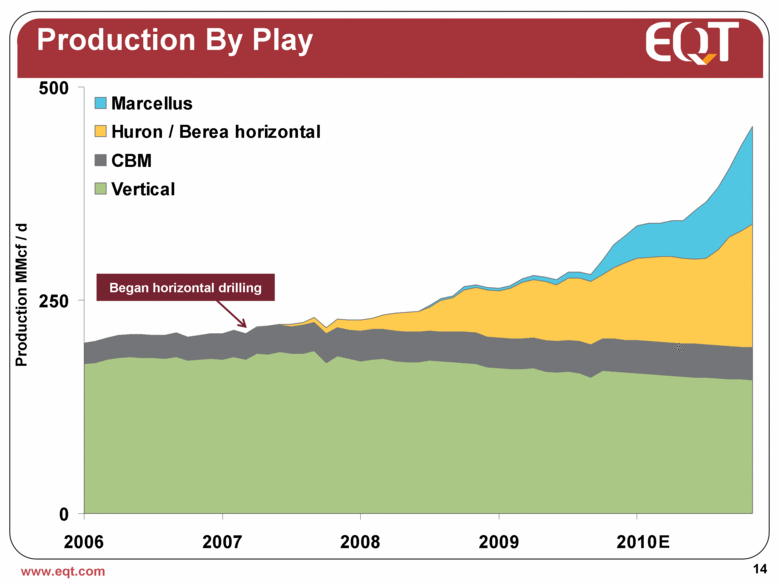
Production By Play Production MMcf / d Began horizontal drilling E |
|
|
Rates of Returns by Major Plays IRR 5-year strip ~$6.00 0.0% 10.0% 20.0% 30.0% 40.0% 50.0% 60.0% $5.00 $6.00 $7.00 $8.00 Marcellus CBM Huron / Berea |
|
|
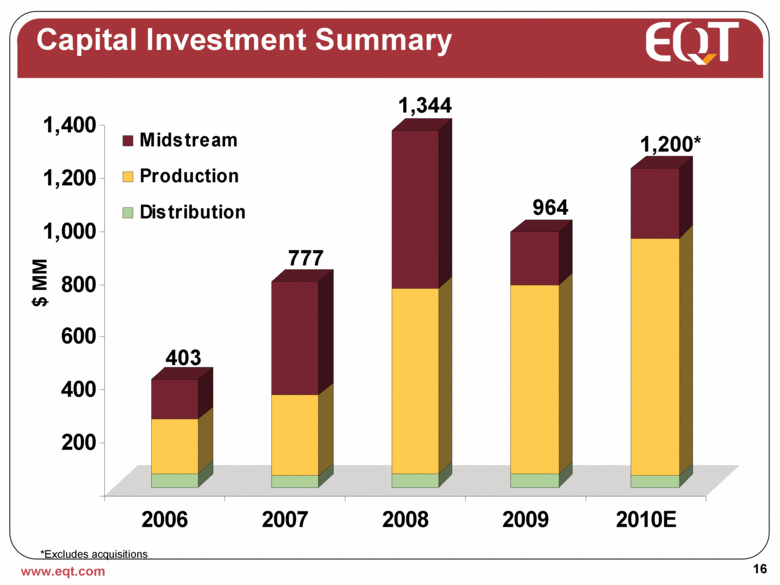
Capital Investment Summary *Excludes acquisitions 0 200 400 600 800 1,000 1,200 1,400 2006 2007 2008 2009 2010E Midstream Production Distribution $ MM 403 777 1,344 964 1,200* 0 200 400 600 800 1,000 1,200 1,400 2006 2007 2008 2009 2010E Midstream Production Distribution $ MM 403 777 1,344 964 1,200* |
|
|
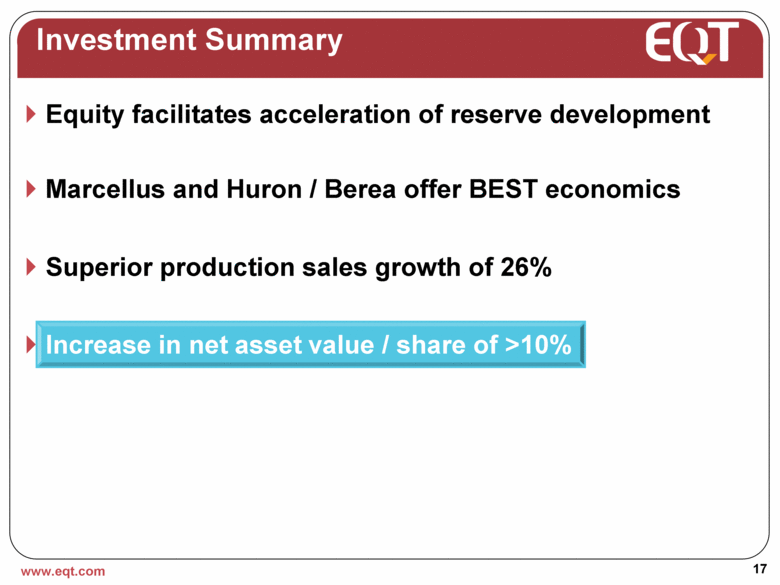
Investment Summary Equity facilitates acceleration of reserve development Marcellus and Huron / Berea offer BEST economics Superior production sales growth of 26% Increase in net asset value / share of >10% |
|
|
Appendix |
|
|
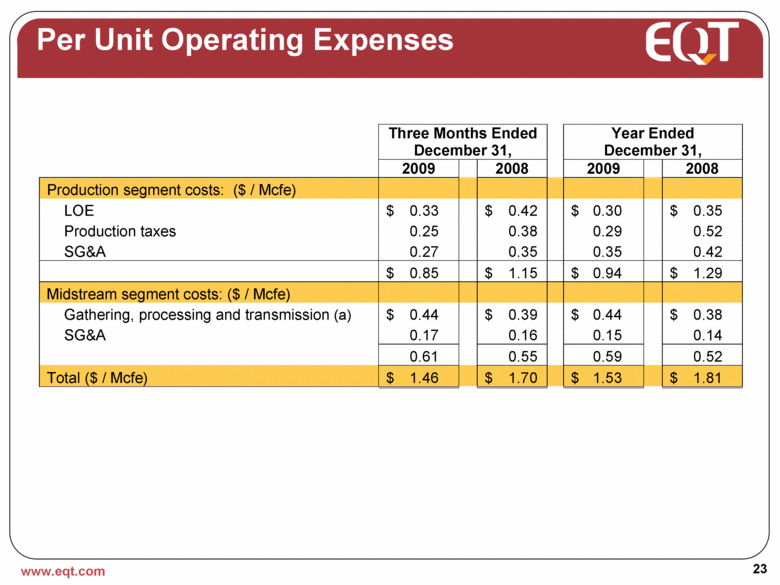
Finding and development costs (F&D costs) from all sources for peer companies presented in this presentation is calculated as the cost incurred, relating to natural gas and oil activities per the company’s Financial Accounting Standard’s Board Accounting Standards Codification 932 (ASC 932) disclosure, divided by the sum of extensions, discoveries and other additions; purchase of natural gas and oil in place; and revisions of previous estimates, as provided for years 2006 – 2008. EQT’s F&D costs from all sources is calculated in the same manner but for years 2007 – 2009. Per unit operating expense is calculated by dividing the sum of lease operating expenses, production taxes and the gathering, processing and transmission costs for equity gas, by production volumes for the same period. Per unit operating expenses for peer companies presented in the presentation are calculated as of December 31, 2008. EQT’s per unit operating expenses are calculated as of December 31, 2009. Calculations Within This Presentation |
|
|
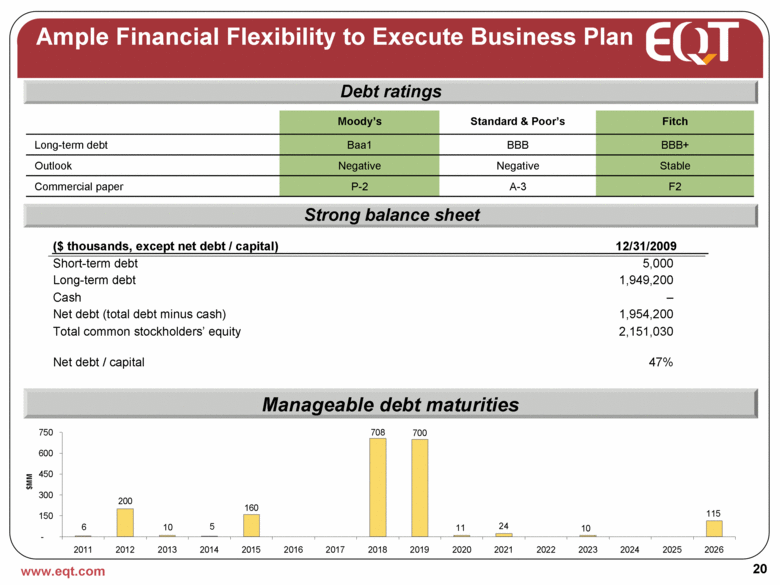
Ample Financial Flexibility to Execute Business Plan F2 A-3 P-2 Commercial paper Stable Negative Negative Outlook BBB+ BBB Baa1 Long-term debt Fitch Standard & Poor’s Moody’s Debt ratings Strong balance sheet Manageable debt maturities 115 10 24 700 11 708 160 5 200 6 10 - 150 300 450 600 750 2011 2012 2013 2014 2015 2016 2017 2018 2019 2020 2021 2022 2023 2024 2025 2026 $MM ( $ thousands , except net debt / capital ) 12/31/2009 Short - term debt 5,000 Long - term debt 1,949,200 Cash – Net debt (total debt minus cash) 1,954,200 Total common stockholders’ equity 2,151,030 Net debt / capital 47% |
|
|
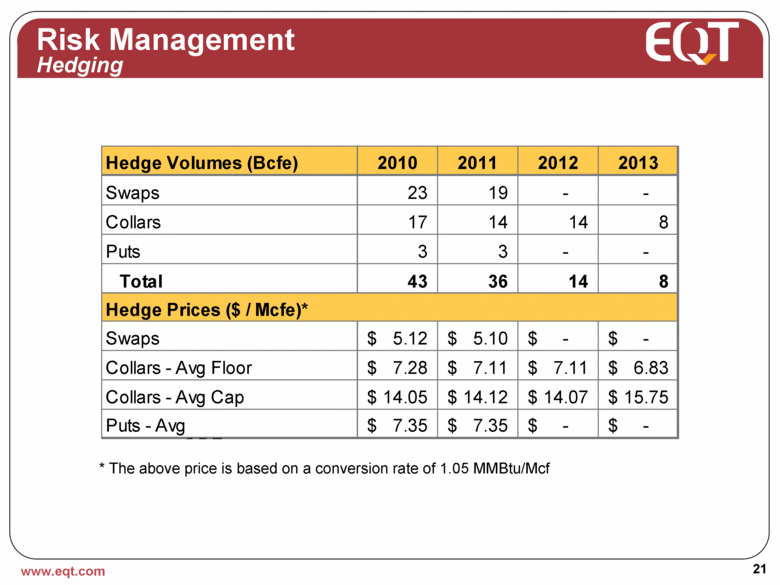
Risk Management Hedging * The above price is based on a conversion rate of 1.05 MMBtu/Mcf Hedge Volumes (Bcfe) 2010 2011 2012 2013 Swaps 23 19 - - Collars 17 14 14 8 Puts 3 3 - - Total 43 36 14 8 Swaps 5.12 $ 5.10 $ - $ - $ Collars - Avg Floor 7.28 $ 7.11 $ 7.11 $ 6.83 $ Collars - Avg Cap 14.05 $ 14.12 $ 14.07 $ 15.75 $ Puts - Avg 7.35 $ 7.35 $ - $ - $ Hedge Prices ($ / Mcfe)* 0 50 100 150 2010 2011 2012 2013 Bc fe Swaps #REF! |
|
|
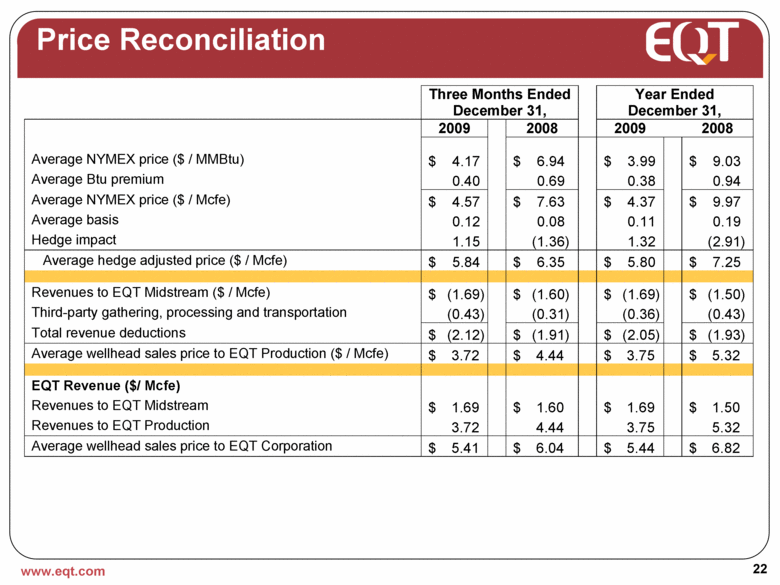
Price Reconciliation Three Months Ended December 31, Year Ended December 31, 2009 2008 2009 2008 Average NYMEX price ($ / MMBtu) $ 4.17 $ 6.94 $ 3.99 $ 9.03 Average Btu premium 0.40 0.69 0.38 0.94 Average NYMEX price ($ / Mcfe) $ 4.57 $ 7.63 $ 4.37 $ 9.97 Average basis 0.12 0.08 0.11 0.19 Hedge impact 1.1 5 (1.36) 1.32 (2.91) Average hedge adjusted price ($ / Mcfe) $ 5.84 $ 6.35 $ 5.80 $ 7.25 Revenues to EQT Midstream ($ / Mcfe) $ (1.69) $ (1.60) $ (1. 69) $ (1.50) Third - party gathering, processing and transportation (0.43) (0.31) (0.36) (0.43) Total revenue deductions $ (2.12) $ (1.91) $ (2.05) $ (1.93) Average wellhead sales price to EQT Production ($ / M cfe) $ 3.72 $ 4.44 $ 3.75 $ 5.32 EQT Revenue ($/ Mcfe) Revenues to EQT Midstream $ 1.69 $ 1.60 $ 1.69 $ 1.50 Revenues to EQT Production 3.72 4.44 3.75 5.32 Average wellhead sales price to EQT Corporation $ 5.41 $ 6.04 $ 5.44 $ 6.82 |
|
|
Per Unit Operating Expenses Three Months Ended December 31, Year Ended December 31, 2009 2008 2009 2008 Production segment costs: ($ / Mcfe) LOE $ 0.33 $ 0.42 $ 0.30 $ 0.35 Production taxes 0.25 0.38 0.29 0.52 SG&A 0.27 0.35 0.35 0.42 $ 0.85 $ 1.15 $ 0.94 $ 1.29 Midstream segment costs: ($ / Mcfe) Gathering, processing and transmission (a) $ 0.44 $ 0.39 $ 0.44 $ 0.38 SG&A 0.17 0.16 0.15 0.14 0.61 0.55 0.59 0.52 Tota l ($ / Mcfe) $ 1.46 $ 1.70 $ 1.53 $ 1.81 |
|
|
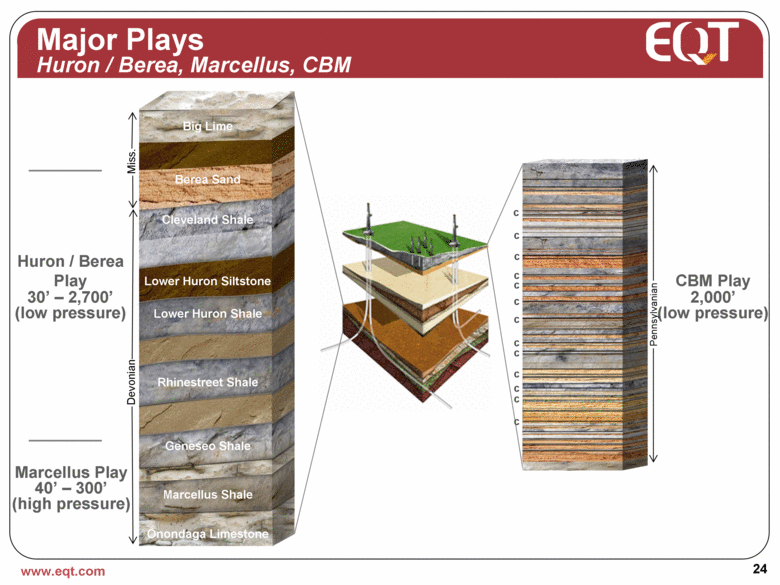
Major Plays Huron / Berea, Marcellus, CBM Devonian Miss. Huron / Berea Play 30’ – 2,700’ (low pressure) Marcellus Play 40’ – 300’ (high pressure) Big Lime Berea Sand Cleveland Shale Lower Huron Siltstone Lower Huron Shale Rhinestreet Shale Geneseo Shale Marcellus Shale Onondaga Limestone CBM Play 2,000’ (low pressure) c c c c c c c c c c c c c Pennsylvanian |
|
|
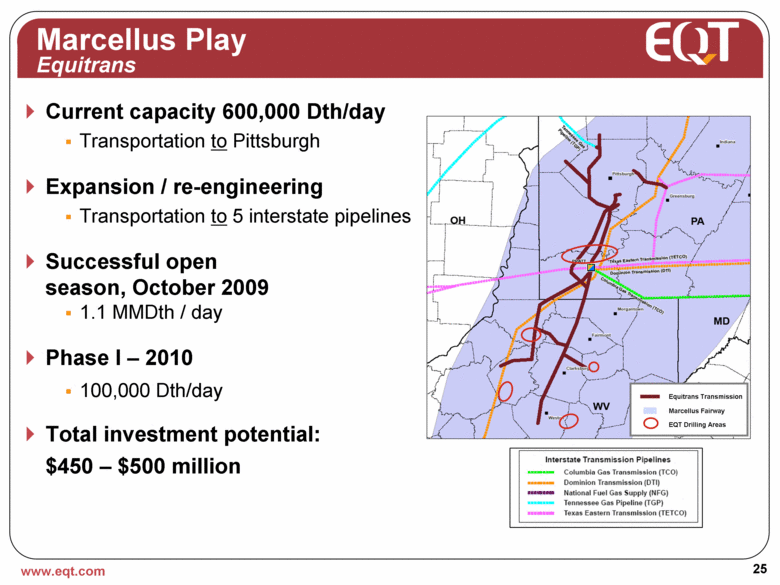
Marcellus Play Equitrans Current capacity 600,000 Dth/day Transportation to Pittsburgh Expansion / re-engineering Transportation to 5 interstate pipelines Successful open season, October 2009 1.1 MMDth / day Phase I – 2010 100,000 Dth/day Total investment potential: $450 – $500 million Equitrans Transmission Marcellus Fairway EQT Drilling Areas |
|
|
Regional Distributor PA, WV, KY 275,000 customers |
|
|
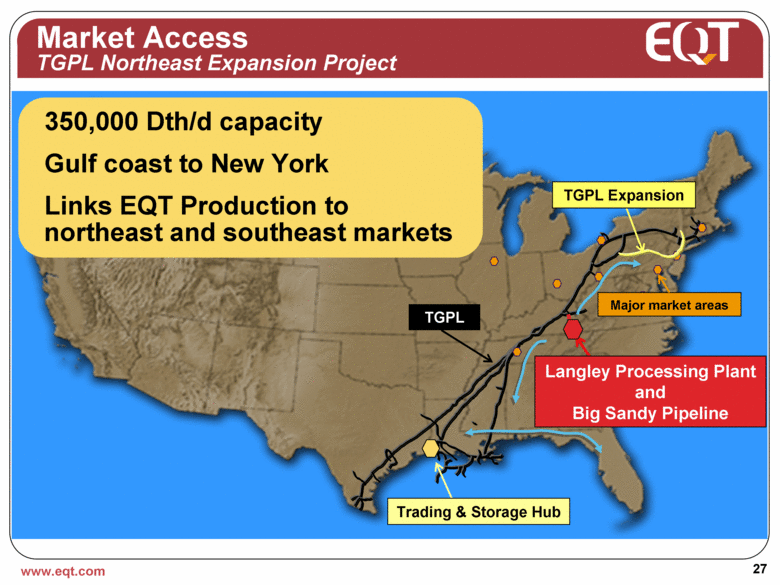
TGPL Major market areas Trading & Storage Hub TGPL Expansion Market Access TGPL Northeast Expansion Project 350,000 Dth/d capacity Gulf coast to New York Links EQT Production to northeast and southeast markets |

