Attached files
| file | filename |
|---|---|
| 8-K - FORM 8-K - SUNTRUST BANKS INC | d8k.htm |
 SunTrust Banks, Inc. Raymond James 31st Annual Institutional Investors Conference March 8, 2010 Bill Rogers President Exhibit 99.1 |
 1 Important Cautionary Statement About Forward-Looking Statements The following should be read in conjunction with the financial statements, notes and
other information contained in the Company’s 2009 Annual Report on Form 10-K and Current Reports on Form 8-K. This presentation includes non-GAAP financial measures to describe SunTrust’s
performance. The reconciliation of those measures to GAAP measures are provided within or in the appendix of this presentation. In this presentation, net interest income and net
interest margin are presented on a fully taxable-equivalent (“FTE”) basis, and ratios are presented on an annualized basis. The FTE basis adjusts for the tax-favored status of income from certain loans and investments. The Company believes this measure to be the preferred industry measurement of net interest income and provides relevant comparison between taxable and
non-taxable amounts. This presentation contains forward-looking
statements. Any statement that does not describe historical or current facts, including statements about beliefs and expectations, is a forward- looking statement. These statements often include the words “believes,” “expects,” “anticipates,” “estimates,” “intends,” “plans,” “goal,” “targets,” “initiatives,” “potentially,” “probably,” “projects,” “outlook” or similar expressions or future conditional verbs such as “may,” “will,” “should,” “would,” and “could.” Such statements are based upon the current beliefs and expectations of management and on information currently available to management. Our
forward looking statements speak as of the date hereof, and we do not assume any obligation to update these statements or the reasons why actual results could differ from those
contained in such statements in light of new information or future events. Forward-looking statements are subject to significant risks and uncertainties. Investors are cautioned against placing
undue reliance on such statements. Actual results may differ materially from those set forth in the forward-looking statements. Factors that could cause actual results to differ
materially from those described in the forward-looking statements can be found at Item 1A of our annual report on Form 10-K filed with the Securities and Exchange Commission and available at the
Securities and Exchange Commission’s internet site (http://www.sec.gov). Those factors include: difficult market conditions have adversely affected our industry; recent levels of
market volatility are unprecedented; the soundness of other financial institutions could adversely affect us; recently enacted legislation or legislation enacted in the future, and any proposed
federal programs, may subject us to increased regulation and may adversely affect us; we have not yet received permission to repay TARP funds; emergency measures designed to stabilize the
U.S. banking system are beginning to wind down; we are subject to credit risk; weakness in the economy and in the real estate market, especially including weakness within our
geographic footprint, has adversely affected us and may continue to adversely affect us; weakness in the real estate market, including the secondary residential mortgage loan markets, has adversely affected us and may continue to adversely affect us; as a financial services company, adverse changes in general business or economic conditions could have a material adverse effect
on our financial condition and results of operations; changes in market interest rates or capital markets could adversely affect our revenue and expense, the value of assets and
obligations, and the availability and cost of capital or liquidity; the fiscal and monetary policies of the federal government and its agencies could have a material adverse effect on our
earnings; we may be required to repurchase mortgage loans or indemnify mortgage loan purchasers as a result of breaches of representations and warranties, borrower fraud, or certain
borrower defaults, which could harm our liquidity, results of operations, and financial condition; we may continue to suffer increased losses in our loan portfolio despite enhancement of our
underwriting policies; depressed market values for our stock may require us to write down goodwill; clients could pursue alternatives to bank deposits, causing us to lose a relatively inexpensive source of funding; consumers may decide not to use banks to complete their financial transactions, which could affect net income; we have businesses other than banking which
subject us to a variety of risks; hurricanes and other natural disasters may adversely affect loan portfolios and operations and increase the cost of doing business; negative public
opinion could damage our reputation and adversely impact business and revenues; we rely on other companies to provide key components of our business infrastructure; we rely on our
systems, employees, and certain counterparties, and certain failures could materially adversely affect our operations; we depend on the accuracy and completeness of information about clients
and counterparties; regulation by federal and state agencies could adversely affect the business, revenue, and profit margins; competition in the financial services industry is intense
and could result in losing business or reducing margins; future legislation could harm our competitive position; maintaining or increasing market share depends on market acceptance and
regulatory approval of new products and services; we may not pay dividends on your common stock; our ability to receive dividends from our subsidiaries accounts for most of our revenue
and could affect our liquidity and ability to pay dividends; significant legal actions could subject us to substantial uninsured liabilities; recently declining values of real estate, increases
in unemployment, and the related effects on local economies may increase our credit losses, which would negatively affect our financial results; deteriorating credit quality, particularly in real estate loans, has adversely impacted us and may continue to adversely impact us; our allowance for loan losses may not be adequate to cover our eventual losses; we will realize future losses if the proceeds we receive upon liquidation of nonperforming assets are less than the carrying value of such assets; disruptions in our ability to access global capital markets may
negatively affect our capital resources and liquidity; credit rating agencies downgraded the credit ratings of SunTrust Bank and SunTrust Banks, Inc., and these downgrades and any subsequent
downgrades could adversely impact the price and liquidity of our securities and could have an impact on our businesses and results of operations; we have in the past and may in the
future pursue acquisitions, which could affect costs and from which we may not be able to realize anticipated benefits; we depend on the expertise of key personnel, and if these
individuals leave or change their roles without effective replacements, operations may suffer; we may not be able to hire or retain additional qualified personnel and recruiting and compensation
costs may increase as a result of turnover, both of which may increase costs and reduce profitability and may adversely impact our ability to implement our business strategy; our accounting
policies and processes are critical to how we report our financial condition and results of operations, and require management to make estimates about matters that are uncertain;
changes in our accounting policies or in accounting standards could materially affect how we report our financial results and condition; our stock price can be volatile; our
disclosure controls and procedures may not prevent or detect all errors or acts of fraud; our financial instruments carried at fair value expose us to certain market risks; and our revenues derived from our investment securities may be volatile and subject to a variety of risks. |
 2 I. LARGE DIVERSIFIED FRANCHISE II. SOLID CAPITAL STRUCTURE III. RELATIVE CREDIT STRENGTH IV. GROWTH INITIATIVES Table of Contents V. APPENDIX |
 3 • Generating profitable growth • Continuing to optimize balance sheet and business mix • Improving efficiency and productivity Investment Thesis Large Diversified Franchise • High market share in attractive growth markets • One of the nation’s largest banks • Diversified business mix Growth Initiatives Stable Base Provides Solid Foundation for Future Growth • Diversified loan portfolio • Improved credit trends • Conservative commercial real estate portfolio Solid Capital Structure Relative Credit Strength • Solid capital ratios increased • Common capital ratios compare favorably • Diversified funding with large, stable deposit base |
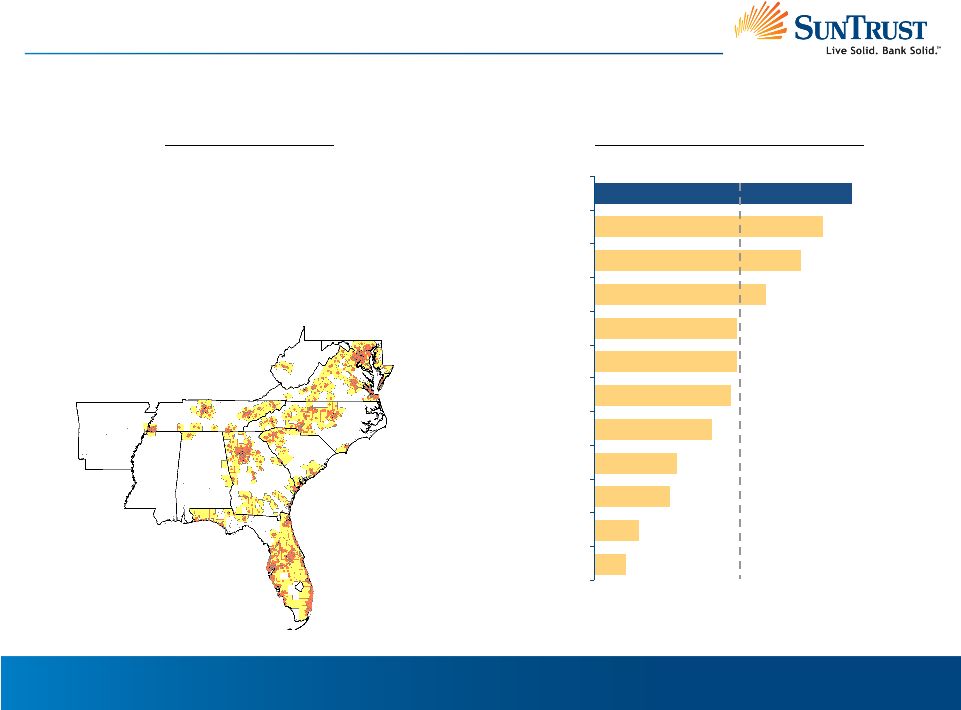 4 Best Footprint in Banking Projected Population Growth 4 1. Source: SNL Financial, as of June 30, 2009 based on MSAs 2. At 12/31/09 3. Source: SNL Financial---projected household income change, 2009-2014,
MSA + counties not in any MSA 4. Source: SNL Financial---five-year population growth, 2009-2014, MSA
+ counties not in any MSA SunTrust Footprint Attractive Geographic Profile In Higher Growth Markets 1.0% 1.4% 2.4% 2.6% 3.7% 4.3% 4.5% 4.5% 5.4% 6.5% 7.2% 8.1% MTB PNC CMA KEY FITB COF MI USB RF BBT WFC STI U.S. Average Growth: 4.6% • Ranked top 3 in 20 of the top 25 SunTrust markets 1 – Top 25 represents 85% of total MSA deposits – Top 25 average deposit market share is 14% • 1,683 branches serving communities with attractive overall growth prospects 2 • Projected household income growth is above the U.S. average 3 I. LARGE DIVERSIFIED FRANCHISE |
 5 166 BB&T 9 2,032 JPMorgan Chase 2 1,856 Citigroup 3 1,244 Wells Fargo 4 142 Regions 10 170 Capital One 8 174 SunTrust 7 270 PNC Financial 6 281 U.S. Bancorp 5 $2,223 Bank of America 1 $B Company U.S. Rank Source: SNL Financial, excludes custody/processor and non-traditional banks
1. As of March 4, 2010 2. As of December 31, 2009 Deposits Significant Scale Assets Branches 1,357 Fifth Third 9 6,124 Bank of America 2 5,182 JPMorgan Chase 3 3,079 U.S. Bancorp 4 1,052 Citigroup 10 1,683 SunTrust 8 1,840 BB&T 7 1,885 Regions 6 2,669 PNC Financial 5 6,764 Wells Fargo 1 # Company U.S. Rank SunTrust is a Top 10 U.S. Bank 183 U.S. Bancorp 6 99 Regions 10 938 JPMorgan Chase 2 836 Citigroup 3 824 Wells Fargo 4 115 BB&T 9 116 Capital One 8 122 SunTrust 7 187 PNC Financial 5 $992 Bank of America 1 $B Company U.S. Rank I. LARGE DIVERSIFIED FRANCHISE 1 2 2 |
 6 Household Lending Diversified Business Mix Retail & Commercial Corporate and Investment Banking Wealth & Investment Management Scope of Operations Market Focus - National - Full line of investment banking products and services - Middle
Market: $100MM-$750MM - Corporate Banking: >$750MM - Capital markets capabilities across the franchise - Asset based lending and leasing - National - Full array of private wealth management and institutional solutions including personal and institutional investment management - AUA = $205B - Individuals and families in need of private wealth management including banking, trust, brokerage and asset management solutions - Organizations in need of institutional administrative and investment solutions - National - Residential mortgages, consumer lending - Ranked #7 in total mortgage origination volume - Mortgage servicing portfolio of $179B - Prime-based platform; ~100% of 4Q 2009 originations for sale were agency - 53% of production in 4Q 2009 was retail originated 1. As of 12/31/09 2. Full-service branches 3. For the year ending December 31, 2009, Inside Mortgage Finance,
1/29/10 - SunTrust footprint - 1,683 branches 1,2 - 2,822 ATMs¹ - Over 800 Relationship Managers¹ - Retail clients in SunTrust footprint - Business clients in SunTrust footprint with revenues <$100MM - Government and not- for-profit enterprises - Commercial and residential developers & investors I. LARGE DIVERSIFIED FRANCHISE Well Diversified Business and Product Mix 1 3 1 |
 7 5.83% 5.82% 11.02% 8.02% 14.15% $46.03 $28.15 4Q 2009 3Q 2009 2Q 2009 1Q 2009 Capital Ratios Remained Solid Tier 1 Common Ratio Tangible Common Equity Ratio Tier 1 Capital Ratio Tier 1 Capital Ratio (Excl TARP) Total Capital Ratio Book Value per
Share Tangible Common Book Value per Share Capital Ratios II. SOLID CAPITAL 7.34% 6.86% 12.23% 9.11% 15.31% $36.16 $23.41 1. Please refer to the appendix to this presentation for a reconcilement to the most
directly comparable GAAP financial measure 2. TARP preferred included in Tier 1 ratio contributes an estimated 3.40% to the 12/31/09 Tier 1 capital ratio, 3.27% at 9/30/09, 3.12% at 6/30/09, and
3.00% at 3/31/09 7.49% 7.01% 12.58% 9.31% 15.92% $36.06 $23.35 7.67% 6.73% 12.96% 9.56% 16.43% $35.29 $22.59 1 2 1 |
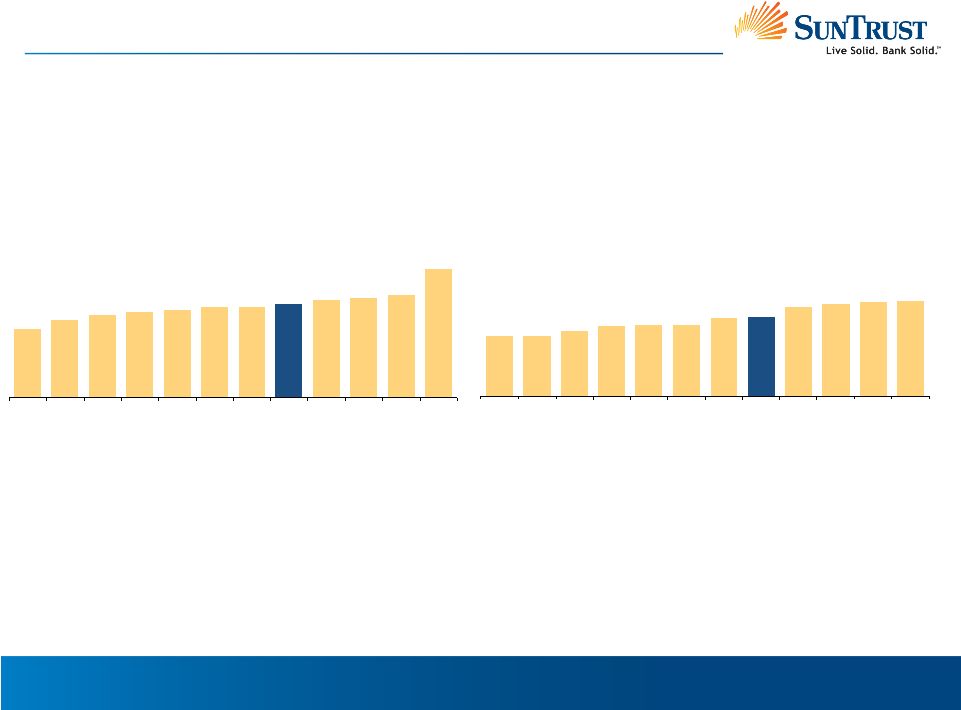 8 Capital Ratios 5.7% 6.4% 6.8% 7.0% 7.2% 7.5% 7.5% 7.7% 8.0% 8.2% 8.5% 10.6% MTB WFC USB FITB RF KEY MI STI PNC CMA BBT COF II. SOLID CAPITAL Common Capital Ratios Compare Favorably Source: SNL Financial and Company Reports, as of 12/31/09 1. PNC pro forma for 1Q 2010 equity offering 2. Please refer to the appendix to this presentation for a reconcilement to the most
directly comparable GAAP financial measure Tier 1 Common Ratio Tangible Common Equity Ratio 5.1% 5.1% 5.5% 5.9% 6.0% 6.0% 6.6% 6.7% 7.6% 7.8% 8.0% 8.1% MTB USB WFC PNC BBT RF FITB STI²
KEY COF CMA MI 1 1 |
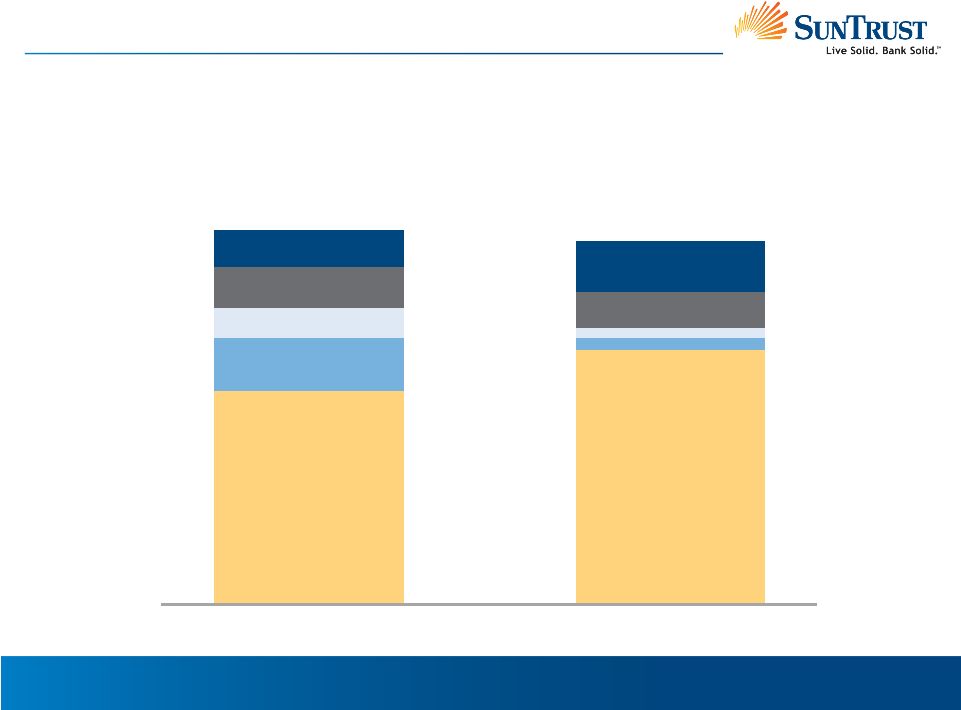 9 Funding Profile $175 Billion $167 Billion December 31, 2009 Core Deposits 70% Other Deposits 3% Short-Term Borrowings 3% Long-Term Borrowings 10% Capital 14% December 31, 2006 Core Deposits 57% Other Deposits 14% Short-Term Borrowings 8% Long-Term Borrowings 11% Capital 10% Large, Stable Deposit Base Primary Source of Liquidity 1. Includes Fed Funds, Repos, and other short-term borrowings Diversified Sources of Funding II. SOLID CAPITAL STRUCTURE 1 1 |
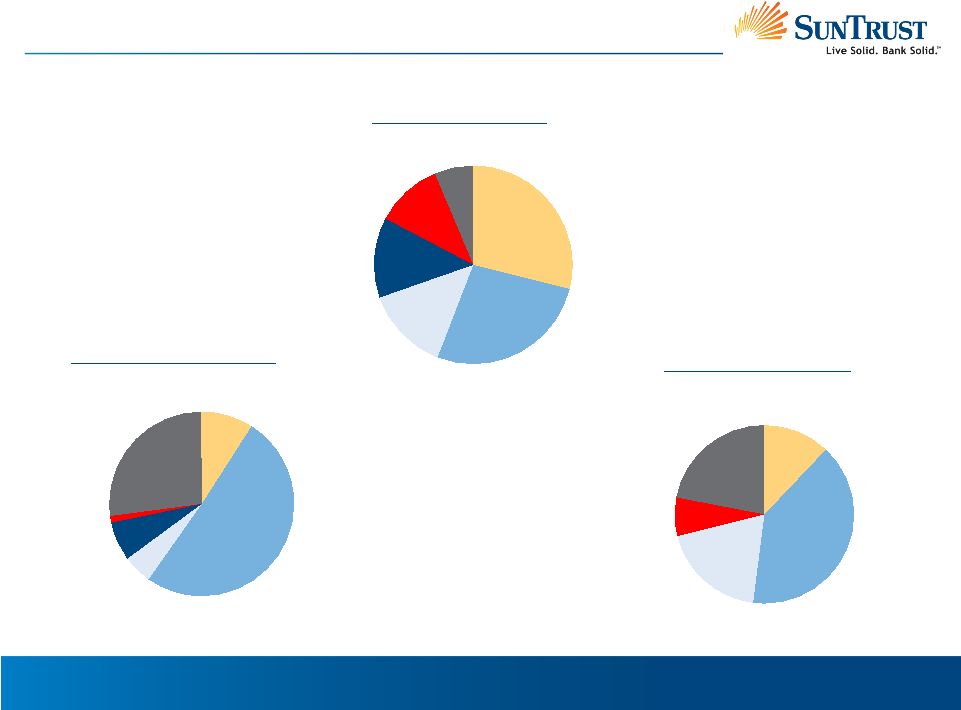 10 Consumer 11% Commercial 29% Residential Mortgages 27% Home Equity Lines 14% Commercial Real Estate 13% Construction 6% Home Equity Lines 19% Consumer 7% Residential Mortgages 40% Commercial 12% Construction 22% Diversified Credit Profile Residential Mortgages 50% Home Equity Lines 5% Commercial Real Estate 7% Consumer 1% Commercial 9% Construction 27% Nonaccrual Loans 12/31/09 4Q 2009 Net Charge-Offs Loan Portfolio 12/31/09 Asset Quality Issues Remain Concentrated in Residential Real Estate Related
Portfolios 1 1. Consumer includes credit card portfolio of $1.1 billion, with net charge-offs of $21 million III. RELATIVE CREDIT STRENGTH 1 |
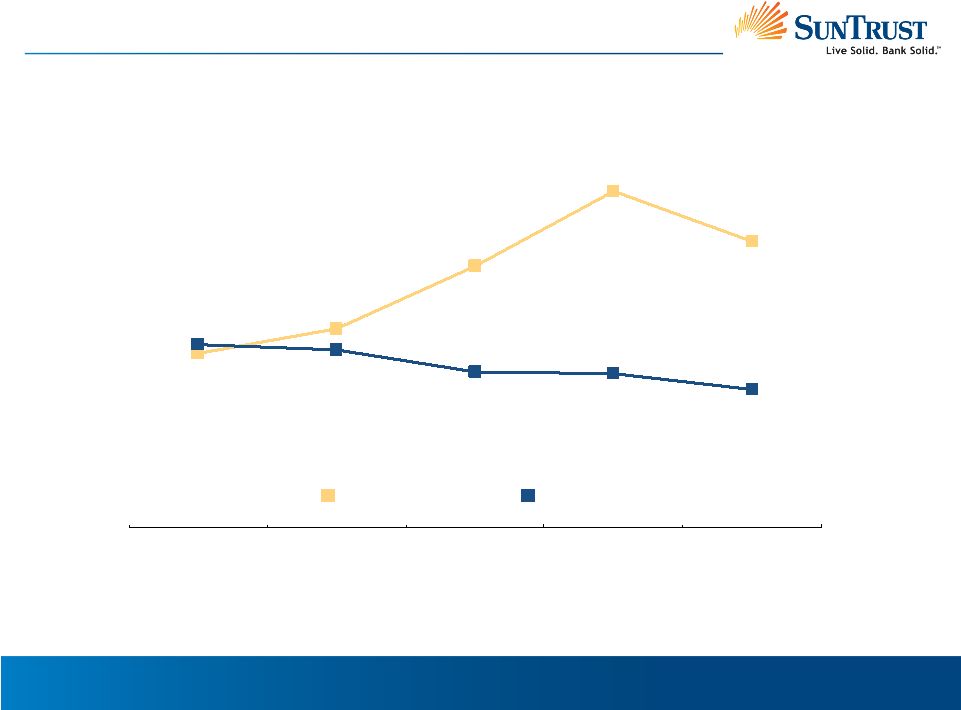 11 3.33% 2.59% 1.97% 1.72% 2.83% 1.37% 1.52% 1.54% 1.81% 1.76% 4Q 2008 1Q 2009 2Q 2009 3Q 2009 4Q 2009 III. RELATIVE CREDIT STRENGTH Credit Trends Four Quarter Trend of Declining Early Stage Delinquency Net Charge-Offs 30-89 Days Past Due |
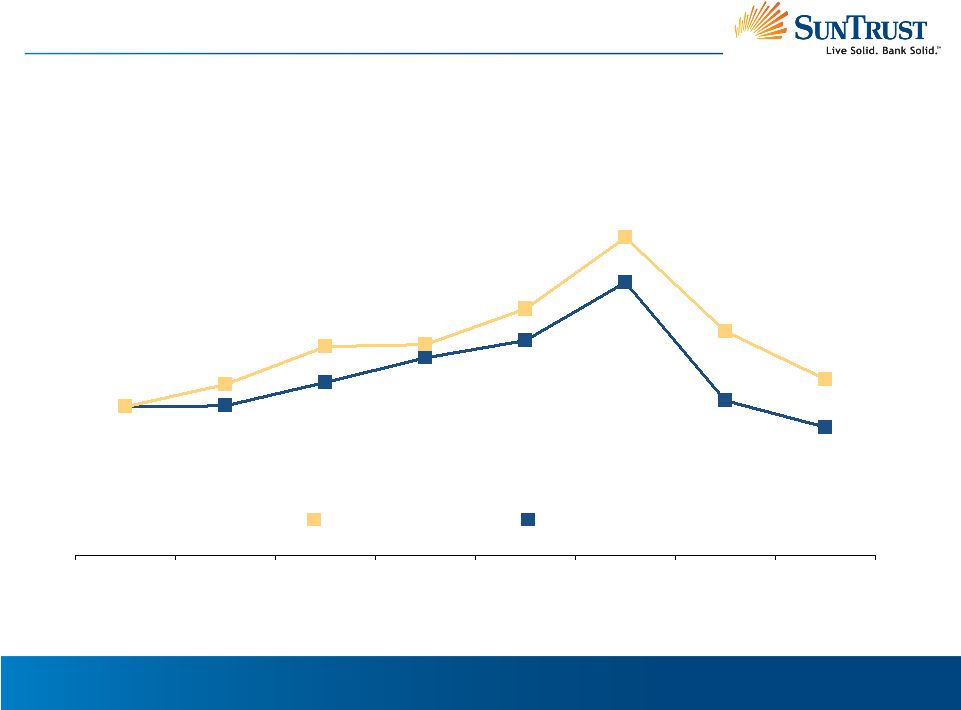
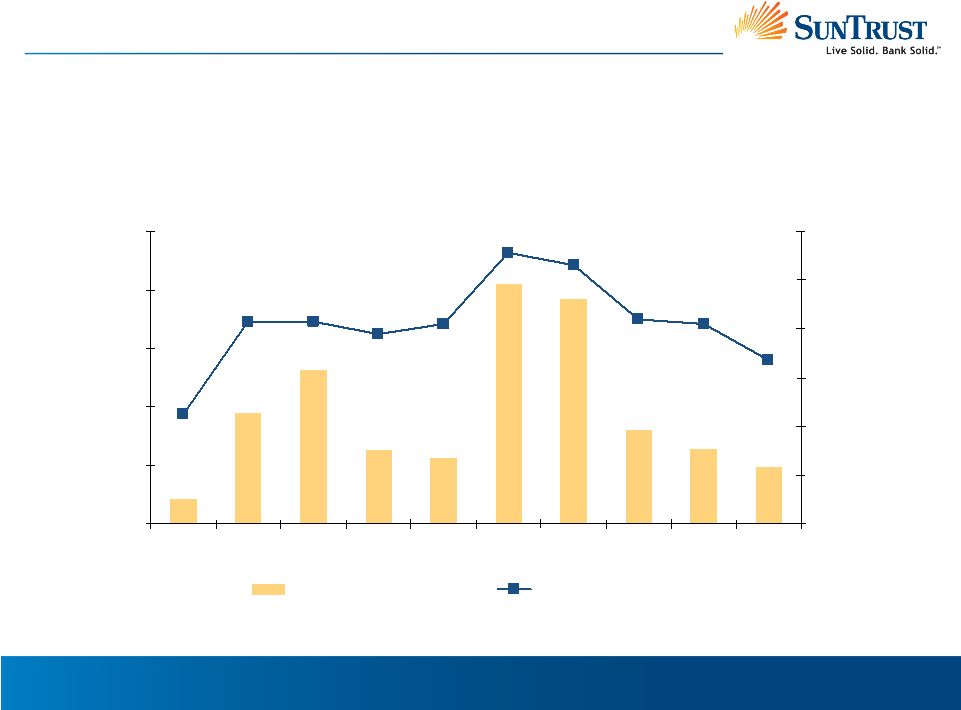 12 Reserve Building and Early Stage Delinquency Trends III. RELATIVE CREDIT STRENGTH ($ in millions) $0 $100 $200 $300 $400 $500 3Q 2007 4Q 2007 1Q 2008 2Q 2008 3Q 2008 4Q 2008 1Q 2009 2Q 2009 3Q 2009 4Q 2009 0.70% 0.90% 1.10% 1.30% 1.50% 1.70% 1.90% Net Additions to ALLL 30-89 Day Delinquency Additions to Reserve Declining Coincident with Delinquency |
 13 III. RELATIVE CREDIT STRENGTH Nonperforming Loan Trends 1. NPL formation is current quarter charge-offs plus sequential quarter change in
NPL’s, and NPL formation plus TDR is the same calculation plus the sequential quarter change in accruing restructured loans (TDR’s) Two Quarter Trend of Declining Problem Loan Formation¹ ($ in millions) 779 946 1,664 910 905 1,056 1,203 1,311 1,076 1,365 1,938 1,500 1,285 1,274 1,043 906 1Q 2008 2Q 2008 3Q 2008 4Q 2008 1Q 2009 2Q 2009 3Q 2009 4Q 2009 NPL Formation NPL + TDR Formation |
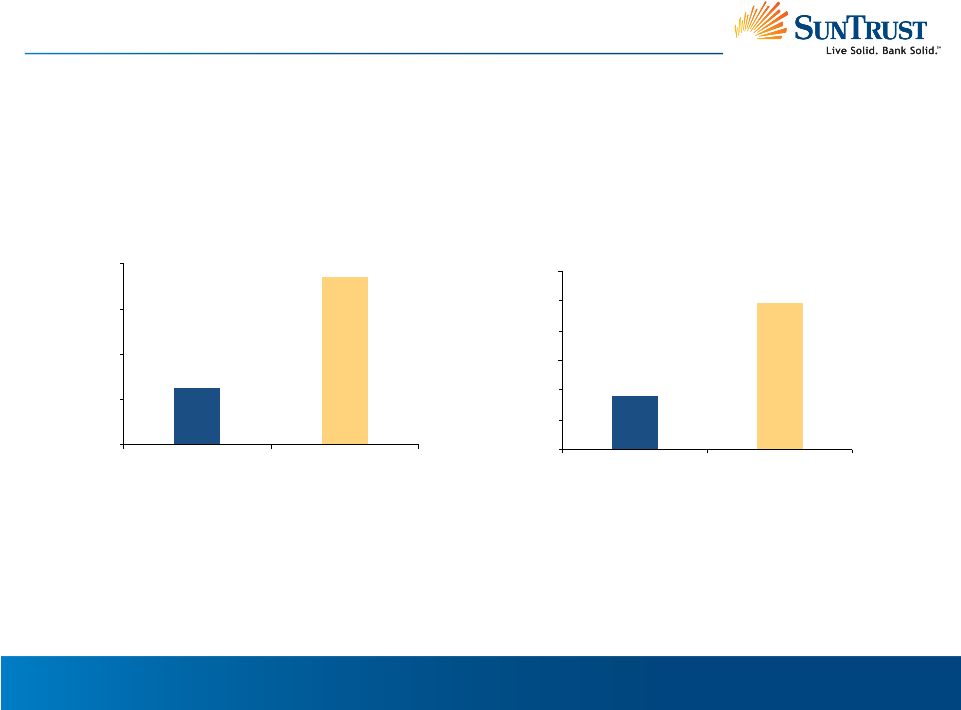
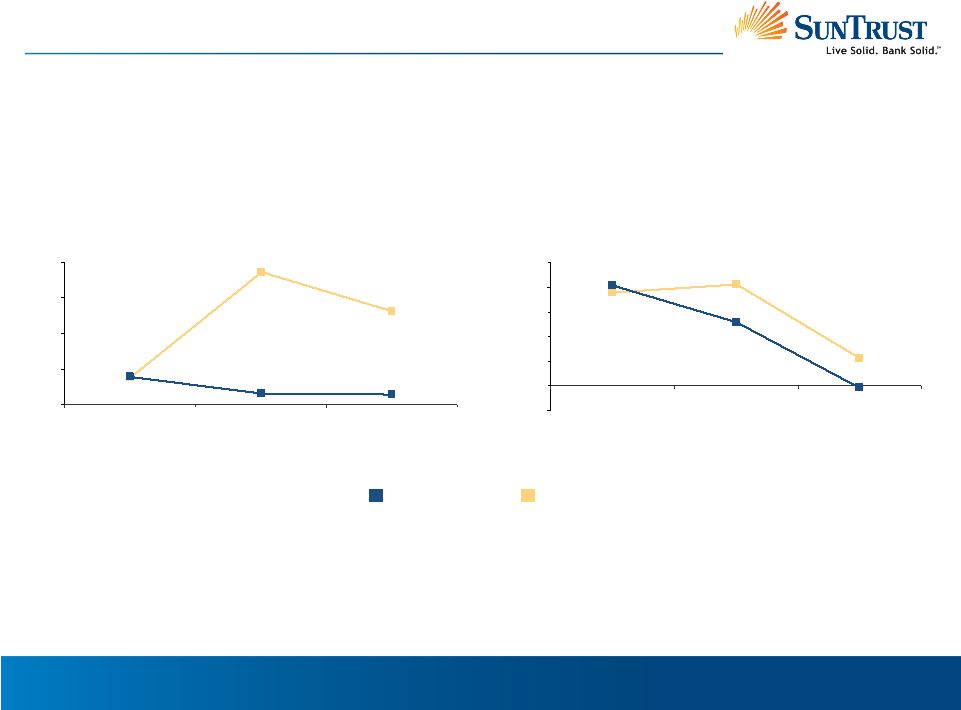 14 Commercial-Related Loan Growth Construction and Land Development 11.4% 38.1% 41.2% 40.8% 25.8% -0.8% -10.0% 0.0% 10.0% 20.0% 30.0% 40.0% 50.0% 2005 2006 2007 Source: SNL Financial Peer Group: BB&T, Capital One, Comerica, Fifth Third, KeyCorp, M&T, Marshall
& Ilsley, PNC, Regions, US Bancorp, and Wells Fargo III. RELATIVE CREDIT
STRENGTH Late-Cycle Annual Growth in CRE and Construction Is Well Below Peer
Group SunTrust Peer Group Commercial Real Estate 3.7% 13.1% 1.6% 1.3% 18.6% 3.9% 0.0% 5.0% 10.0% 15.0% 20.0% 2005 2006 2007 |
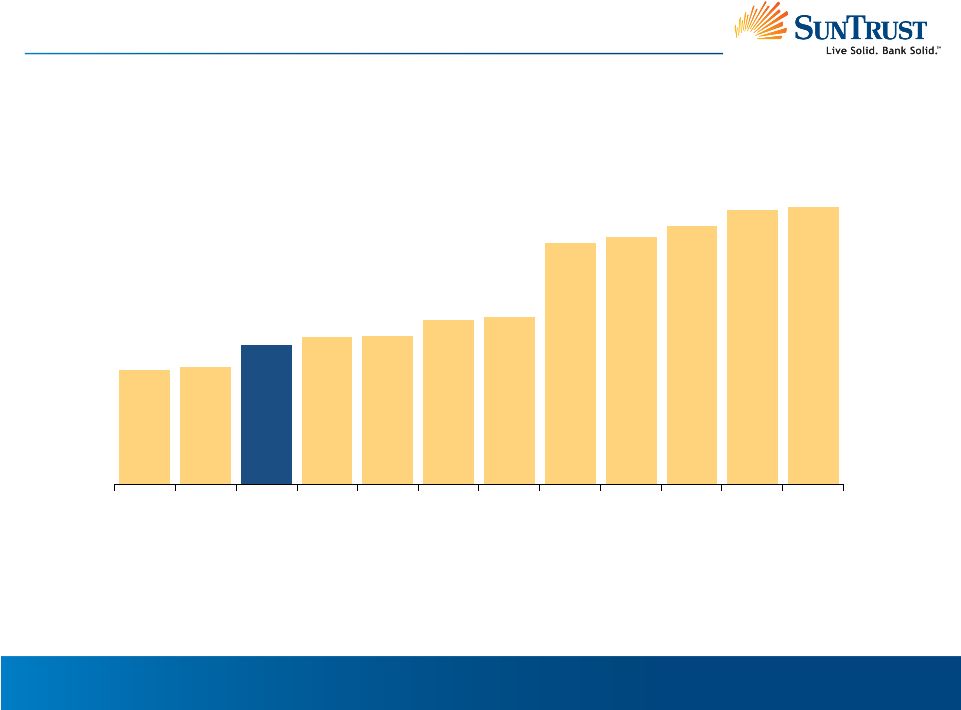 15 Commercial Real Estate Comparison III. RELATIVE CREDIT STRENGTH Relatively Lower Loan Concentration in Commercial Real Estate¹ Source: SNL Financial 1. Includes other nonfarm/nonres RE, 1-4 family construction, other construction,
land development and land loans as a percentage of loans as of 12/31/2009 14.9% 15.2% 19.2% 19.4% 21.3% 21.9% 31.4% 32.3% 33.5% 35.7% 36.1% 18.2% WFC COF STI PNC USB KEY FITB RF CMA MI BBT MTB |
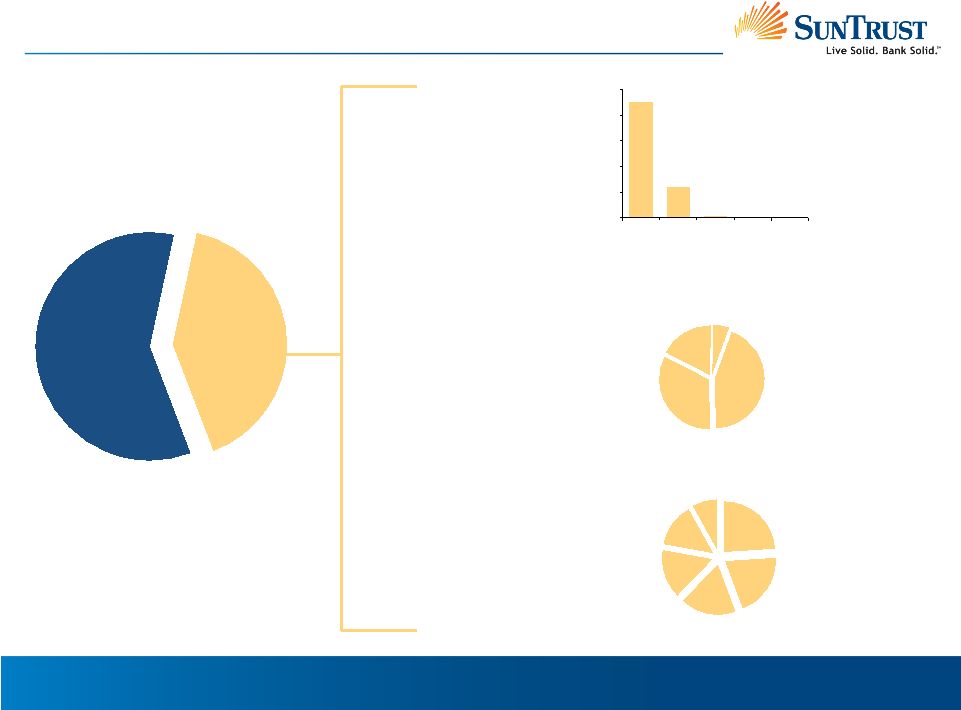 16 Central Group 32% Mid-Atlantic Group 43% National 6% Florida Group 19% Investor Owned 41% Owner Occupied 59% 41% Investor Owned Portfolio is Well Diversified Commercial Real Estate Portfolio Geography 18 12 4,547 1,208 59 0 1,000 2,000 3,000 4,000 5,000 <$1MM $1MM- 10MM $10MM- 20MM $20MM- 30MM >$30MM # of Loans $1.0 Million Avg Loan Size Granularity Retail 24% Office 21% Multifamily 18% Warehouse/ Industrial 15% Special Purpose Real Estate 14% Hotels/ Motels 8% Property Type III. RELATIVE CREDIT STRENGTH $8.9B $6.2B |
 17 Historical Net Charge-Off Ratio Commerical Real Estate 0.06% 0.18% 0.00% 0.05% 0.10% 0.15% 0.20% SunTrust Peer Average III. RELATIVE CREDIT STRENGTH SunTrust’s 10-Year Average Annual CRE and Construction NCO % Is Well Below Peer Average¹ 1. 10-year timeframe: 1999-2008 Source: SNL Peer Group: BB&T, Capital One, Comerica, Fifth Third, KeyCorp, M&T, Marshall
& Ilsley, PNC, Regions, US Bancorp, and Wells Fargo Construction and Land Development
0.18% 0.50% 0.00% 0.10% 0.20% 0.30% 0.40% 0.50% 0.60% SunTrust Peer Average |
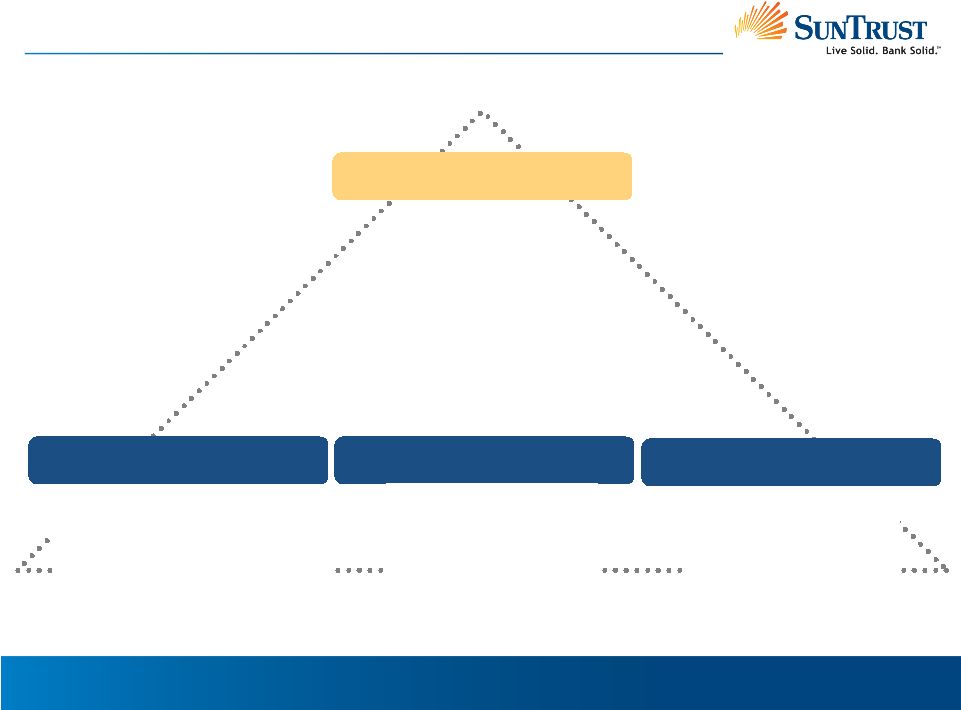 18 • Generating profitable growth • Continuing to optimize balance sheet and business mix • Improving efficiency and productivity Investment Thesis Large Diversified Franchise • High market share in attractive growth markets • One of the nation’s largest banks • Diversified business mix Growth Initiatives Stable Base Provides Solid Foundation for Future Growth • Diversified loan portfolio • Improved credit trends • Conservative commercial real estate portfolio • Solid capital ratios increased • Common capital ratios compare favorably • Diversified funding with large, stable deposit base Solid Capital Structure Relative Credit Strength |
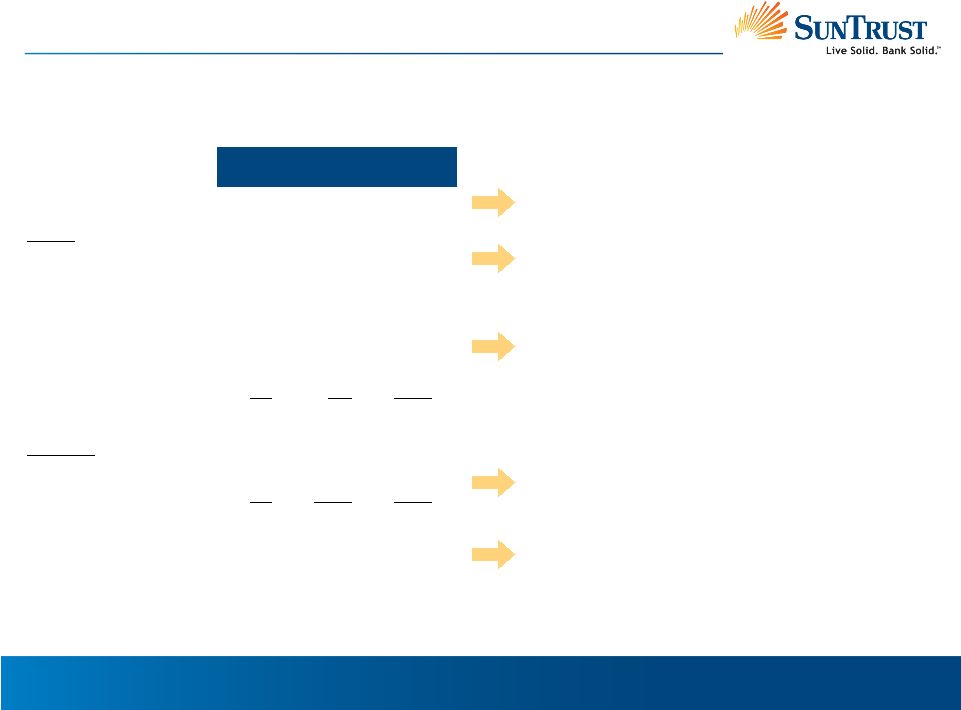 19 Continuing to Optimize Balance Sheet and Business Mix 1. Includes credit card portfolio comprised of consumer and commercial card balances
IV. GROWTH INITIATIVES • High quality securities portfolio increased due to strong liquidity and 4Q 2009 addition of $5 billion U.S. Treasury securities held for TARP repayment Securities Loans Commercial Mortgage Home Equity Commercial Real Estate Construction Consumer Direct¹ Consumer Indirect Loans Deposits Client Deposits Brokered and Foreign Total Deposits Long-Term Debt 4Q
2009 2009 2009
vs.2008 vs. 2006 $28.5 32.5 30.8 16.0 15.1 6.6 6.2 6.5 $113.7 $116.3 5.5 $121.8 $17.5 45% -21% -4% -3% 1% -33% 1% 0% -10% 10% -32% 7% -35% 14% -6% -9% 13% 20% -52% 37% -18% -6% 17% -77% -2% -8% ($ in billions, period end balances) Used Increased Liquidity to Reduce Higher Cost Funding and Temporarily Increase Securities
Portfolio • Commercial portfolio targeted for growth; lower
client line utilization in 2H09 drove a decrease in outstanding
balances • Construction loans decreased over 50% since 2006 • Increase in client deposits over 1 and 3 year timeframe enabled a decrease in brokered and foreign deposits • Repayment of over $7 billion in FHLB advances in 2009 however, |
 20 Improving Efficiency and Productivity Improving Efficiency and Productivity 1. Includes approximately 1,500 positions transitioned to a third party provider contracted
for certain check and related processing operations 2. Appendix includes reconciliation of non-GAAP numbers and details of adjustments and
cyclical expenses IV. GROWTH INITIATIVES Employees Total Expenses Expenses Excl. Adjustments² Cyclical Expenses² Expenses Excl. Adjustments and Cyclical² 2009
2008 2006 28,001 $6,562 $5,687 $1,083 $4,605 29,333 $5,879 $5,659 $966 $4,693 33,599 $4,867 $4,855 $247 $4,609 • Reduced FTEs by nearly 5,600, or 17%, since 2006¹ • 2009 expenses impacted by $751MM goodwill impairment • Cyclical expenses up over $800MM in 2009 vs. 2006 • Expenses flat vs. 2006 and down 2% vs. 2008 Delivered Over $600MM in Run-Rate Expense Savings, or 12% of 2006 Noninterest Expense
Base • Nonrecurring and cyclical expenses are masking decreased operating expenses ($ in millions) |
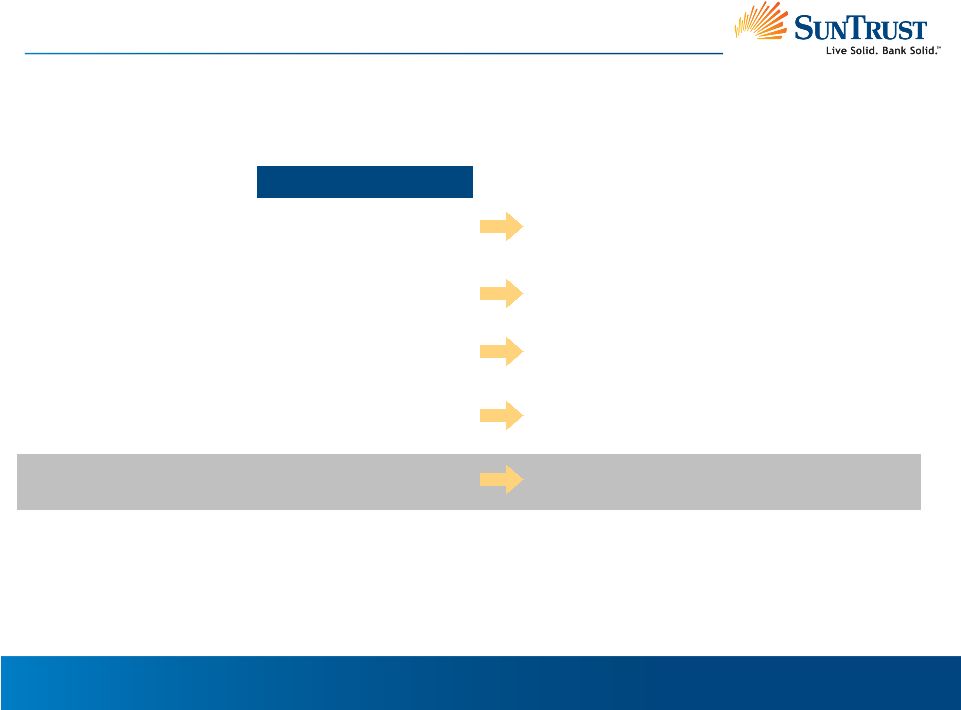
 21 Generating Profitable Growth IV. GROWTH INITIATIVES Client Acquisition Client Satisfaction Profitability • Increased deposit market share • Launched Delta Skymiles Debit Card and other deposit generating promotions and enhancements • Significant growth in lead relationships for loan syndications, fixed income and equity offerings • #3 in footprint for SBA loan production in 2009¹ • Ranked highest among banks in Forrester Customer Experience Index ranking • Won 9 Greenwich Excellence Awards for Small Business and Middle Market banking • Mortgage ranked #1 in O’Connor Customer Service Survey • Launched LiveSolid.com client website • Increasing commercial loan yields • Shifted client deposit mix; 24% increase in lower cost and 8% decrease in higher cost deposits² • ~30% of new in-footprint SunTrust mortgage households open a checking account • Over 20% of SunTrust households have a SunTrust Mortgage Delivering on Commitment to Improve Client Acquisition, Client Satisfaction, and
Profitability 1. Ranking calculated by SunTrust based on 2009 unit volume of SBA loan production in the
primary SunTrust footprint states. Data provided by National Association of Government Guaranteed Lenders and includes raw data compiled by the SBA reflecting 7(a) loan volume
during 2009 2. 4Q 2009 average balance compared to 4Q 2008 average balance. Lower cost includes
noninterest bearing, NOW, money market and savings, while higher cost includes consumer and other time deposits |
 22 SunTrust Banks, Inc. Raymond James 31st Annual Institutional Investors Conference March 8, 2010 Bill Rogers President |
 23 Appendix |
 24 V. APPENDIX ($ in thousands, except per share data) Reconciliation of Non GAAP Measures 1. SunTrust presents a tangible equity to tangible assets ratio that excludes the after-tax impact of
purchase accounting intangible assets. The Company believes this measure is useful to investors because by removing the effect of intangible assets that result from merger and acquisition activity (the level of which may vary from company to company) it allows investors to
more easily compare the Company's capital adequacy to other companies in the industry. This measure is used by management to analyze capital adequacy 2. SunTrust presents a tangible common equity to tangible asset ratio and a tangible book value per common
share that excludes the after-tax impact of purchase accounting intangible assets and also excludes preferred stock from tangible equity. The Company believes these measures are useful to investors because by removing the effect of intangible assets that
result from merger and acquisition activity as well as preferred stock (the level of which may vary from company to company) it allows investors to more easily compare the Company's capital adequacy and book value on common stock to other companies in the industry
Three Months Ended December 31 September 30 June 30 March 31 2009 2009 2009 2009 Total shareholders'
equity $22,530,855 $22,908,284 $22,953,158 $21,645,626 Goodwill, net of deferred
taxes (6,204,415) (6,204,954) (6,213,243) (6,224,610) Other intangible assets including MSRs, net of deferred taxes (1,671,055) (1,559,765) (1,468,209) (1,049,155) MSRs 1,539,382 1,422,716 1,322,322 894,797 Tangible
equity 16,194,767
16,566,281 16,594,028 15,266,658 Preferred stock (4,917,312)
(4,911,416)
(4,918,863)
(5,227,357) Tangible common equity $11,277,455 $11,654,865 $11,675,165 $10,039,301 Total
assets $174,164,735 $172,717,747 $176,734,971 $179,116,402 Goodwill
(6,319,078) (6,314,382) (6,314,382) (6,309,431) Other intangible assets including
MSRs (1,711,299) (1,604,136) (1,517,483) (1,103,333) MSRs 1,539,382 1,422,716 1,322,322 894,797 Tangible
assets $167,673,740 $166,221,945 $170,225,428 $172,598,435 Tangible equity to tangible assets 9.66 % 9.96 % 9.75 % 8.85 % Tangible common equity to tangible assets
6.73 % 7.01 % 6.86 % 5.82 % Tangible book value per common share $22.59 $23.35 $23.41 $28.15 2 2 1 |
 25 V. APPENDIX ($ in millions) Reconciliation of Non GAAP Measures 1. Adjusted expense is provided as the removal of certain items that are material and
potentially non-recurring is useful to investors and management in comparing among institutions and in evaluating expense trends 2. Expense Excluding Adjustments and Cyclical is provided as it removes expenses that are
cyclical in nature and is useful to investors and management in assessing the impact of the recession on non-interest expenses and earnings, and facilitates analysis of the
effectiveness of management in controlling expense growth 2009 2008 2006 2009 vs 2008 2009 vs 2008 2009 vs 2006 2009 vs 2006 Employees 28,001 29,333 33,599 (1,322) -5% (5,598) -17% Total Expenses $6,562 $5,879 $4,867 683 12% 1,695 35% Ajustment Items: Impairment 751 45 - (Gain)/Loss on Debt Retirement 39 12 12 Coke Charitable Contribution - 183 - Visa Litigation 7 (34) - Merger Expense - 13 - FDIC Special Assessment 78 - - Total Adjustments 875 220 12 Adjusted Expenses 1 5,687 5,659 4,855 28 0% 832 17% Cyclical Items: Regulatory Assessments 224 55 23 Credit & Collection Services 259 156 102 Other Real Estate 244 105 - Mortgage Reinsurance 115 180 - Operating Losses 100 446 45 Pension Expense 141 24 78 Total Cyclical Expenses 1,083 966 247 117 12% 836 338% Expenses Excl Adjustments & Cyclical 2 $4,605 $4,693 $4,609 (88) -2% (4) 0% |