Attached files
Table of Contents
UNITED STATES
SECURITIES AND EXCHANGE COMMISSION
Washington, D.C. 20549
FORM 10-K
| x | ANNUAL REPORT PURSUANT TO SECTION 13 OR 15(d) OF THE SECURITIES EXCHANGE ACT OF 1934 |
For the fiscal year ended December 26, 2009
or
| ¨ | TRANSITION REPORT PURSUANT TO SECTION 13 OR 15(d) OF THE SECURITIES EXCHANGE ACT OF 1934 |
Commission File Number 000-50845
MCCORMICK & SCHMICK’S SEAFOOD RESTAURANTS, INC.
(Exact Name of Registrant as Specified in its Charter)
| Delaware | 20-1193199 | |
| (State or other jurisdiction of incorporation or organization) |
(I.R.S Employer Identification No.) | |
| 1414 NW Northrup Street, Suite 700 Portland, Oregon | 97209 | |
| (Address of principal executive offices) | (Zip Code) | |
Registrant’s telephone number, including area code: (503) 226-3440
Securities registered pursuant to Section 12(b) of the Act: None
Securities registered pursuant to Section 12(g) of the Act:
Common Stock, par value $0.001 per share
Indicate by check mark whether the registrant is a well-known seasoned issuer, as defined in Rule 405 of the Securities Act. Yes ¨ No x
Indicate by check mark whether the registrant is not required to file reports pursuant to Section 13 or Section 15(d) of the Act. Yes ¨ No x
Indicate by check mark whether the registrant (1) has filed all reports required to be filed by Section 13 or 15(d) of the Securities Exchange Act of 1934 during the preceding 12 months (or for such shorter period that the registrant was required to file such reports), and (2) has been subject to such filing requirements for the past 90 days. Yes x No ¨
Indicate by check mark whether the registrant has submitted electronically and posted on its corporate Web site, if any, every Interactive Data File required to be submitted and posted pursuant to Rule 405 of Regulation S-T (§232.405 of this chapter) during the preceding 12 months (or for such shorter period that the registrant was required to submit and post such files). ¨ Yes ¨ No
Indicate by check mark if disclosure of delinquent filers pursuant to Item 405 of Regulation S-K (Section 229.405 of this chapter) is not contained herein, and will not be contained, to the best of registrant’s knowledge, in definitive proxy or information statements incorporated by reference in Part III of this Form 10-K or any amendment to this Form 10-K. x
Indicate by check mark whether the registrant is a large accelerated filer, an accelerated filer, a non-accelerated filer, or a smaller reporting company. See the definitions of “large accelerated filer,” “accelerated filer” and “smaller reporting company” in Rule 12b-2 of the Exchange Act. (Check one):
| Large accelerated filer ¨ | Accelerated filer x | |
| Non-accelerated filer ¨ (Do not check if a smaller reporting company) | Smaller reporting company ¨ |
Indicate by check mark whether the registrant is a shell company (as defined in Rule 12b-2 of the Act). Yes ¨ No x
The aggregate market value of the voting and non-voting common stock held by non-affiliates (based on the closing price on December 26, 2009 on The Nasdaq Stock Market Global Market) was $107,500,073. There were 14,849,922 shares of common stock outstanding as of March 1, 2010.
DOCUMENTS INCORPORATED BY REFERENCE
Part III of this Form 10-K incorporates by reference information from the registrant’s Proxy Statement for the 2010 Annual Meeting of Stockholders.
Table of Contents
| ITEM 1. | 1 | |||||
| ITEM 1A. | 12 | |||||
| ITEM 1B. | 20 | |||||
| ITEM 2. | 20 | |||||
| ITEM 3. | 20 | |||||
| ITEM 4. | 20 | |||||
| ITEM 4A. | 20 | |||||
| ITEM 5. | MARKET FOR THE REGISTRANT’S COMMON EQUITY AND RELATED STOCKHOLDER MATTERS |
22 | ||||
| ITEM 6. | 25 | |||||
| ITEM 7. | MANAGEMENT’S DISCUSSION AND ANALYSIS OF FINANCIAL CONDITION AND RESULTS OF OPERATIONS |
27 | ||||
| ITEM 7A. | 43 | |||||
| ITEM 8. | 44 | |||||
| ITEM 9. | CHANGES IN AND DISAGREEMENTS WITH ACCOUNTANTS ON ACCOUNTING AND FINANCIAL DISCLOSURE |
67 | ||||
| ITEM 9A. | 67 | |||||
| ITEM 9B. | 67 | |||||
| ITEM 10. | 68 | |||||
| ITEM 11. | 68 | |||||
| ITEM 12. | SECURITY OWNERSHIP OF CERTAIN BENEFICIAL OWNERS AND MANAGEMENT AND RELATED STOCKHOLDER MATTERS |
68 | ||||
| ITEM 13. | CERTAIN RELATIONSHIPS AND RELATED TRANSACTIONS, AND DIRECTOR INDEPENDENCE |
68 | ||||
| ITEM 14. | 68 | |||||
| ITEM 15. | 69 | |||||
| 70 | ||||||
| 71 | ||||||
i
Table of Contents
Forward Looking Statements
This Annual Report on Form 10-K contains forward-looking statements within the meaning of Section 27A of the Securities Act of 1933 and Section 21E of the Securities Exchange Act of 1934. Forward-looking statements represent our expectations or beliefs concerning future events, including the following: any statements regarding future sales, costs and expenses and gross profit percentages; any statements regarding the continuation of historical trends; any statements regarding the expected number of future restaurant openings and expected capital expenditures; and any statements regarding the sufficiency of our cash balances and cash generated from operating and financing activities for future liquidity and capital resource needs. In addition, the words “believes,” “anticipates,” “plans,” “expects,” “should,” “estimates” and similar expressions are intended to identify forward-looking statements. We have identified significant factors that could cause actual results to differ materially from those stated or implied in the forward-looking statements in Item 1A, “Risk Factors.”
Overview
McCormick & Schmick’s Seafood Restaurants, Inc. is a leading national seafood restaurant operator in the affordable upscale dining segment. We have successfully grown our business during the past 38 years by focusing on serving a broad selection of fresh seafood. As of December 26, 2009, we had 93 restaurants, including 87 restaurants in the United States, of which one is operated pursuant to a management agreement, and six restaurants in Canada under The Boathouse name.
Our daily-printed menu typically contains more than 80 made-to-order dishes, including an extensive selection of international, national, regional and local species of seafood. Our signature “Fresh List,” prominently displayed at the top of our daily-printed menu, features 20 to 30 varieties of fresh seafood, based on seasonality, product availability, price and guest preferences. We also offer alternatives to seafood, including high quality beef, creative salads and fresh pasta dishes.
Our restaurants are designed to capture the distinctive characteristics of each local market, positioning us to compete successfully in a sector comprised primarily of locally owned and operated seafood restaurants. We seek to create an inviting atmosphere which enables us to attract a diverse guest base of men and women, primarily ages 30 to 60, typically college-educated and in the middle to upper-middle income brackets. We believe the combination of our restaurant atmosphere, our extensive menu offerings, superior service and broad range of price points appeals to a diverse guest base from casual diners, families and tourists to business travelers and special occasion diners.
We believe we are the only high quality seafood restaurant that operates on a national scale, and that we have successfully differentiated ourselves from our competitors by focusing on the following core strengths.
Fresh Seafood
Our primary business focus for more than 38 years has been to consistently offer a broad selection of fresh seafood, which we believe commands strong loyalty from our guests. Our daily-printed menu typically contains more than 80 made-to-order dishes, including an extensive selection of nationally available species such as Atlantic lobster, Dungeness crab and Alaskan halibut, as well as seasonal products such as wild king salmon, Columbia River sturgeon, sashimi-grade tuna, exotic Hawaiian catches and an extensive variety of cold water oysters. The executive chef at the majority of our restaurants tailor the menu, at least once daily, based on the availability of different species of fresh seafood, price and guest preferences.
We believe we successfully differentiate our concept from both independent local seafood restaurants and national and regional seafood restaurant chains by including in our daily-printed menu our signature “Fresh List”
1
Table of Contents
of typically 20 to 30 fresh seafood varieties, sourced from throughout the United States and from select international locations. We are able to offer a wide variety of consistently fresh, high quality seafood through our close relationships with reputable local and national seafood vendors. We encourage our vendors to adopt preferred and sustainable fishing practices to guarantee the current and future quality and supply of our seafood. During our daily “fresh talk,” the executive chef at each of our restaurants educates our restaurant staff on the menu items of the day so we can effectively communicate the sourcing, freshness, quality and method of preparation of our products to our guests.
In 2009, we introduced enhancements to our menu offerings that included a diversified small plate section ranging in price from $5.95 to $9.95, a sushi selection, including five to seven traditional and unique offerings, and a seafood bar section that offers items by the piece so guests can build their own combinations.
Attraction of Our Full-Service Bar
We consider our bar operations to be an integral part of the “McCormick & Schmick’s” brand and central to our broad appeal. This philosophy dates back to our first restaurant, Jake’s Famous Crawfish, the success of which was largely driven by its bar operation, enhancing the dining room business by creating a social forum and building clientele. Our bar operation remains a cornerstone of our restaurant concept, showcasing our commitment to traditionalism and quality. We attract patrons to our bar as a final destination, where they can enjoy a broad selection of liquors, wines and beers in a traditional yet lively environment. Our cocktails are created using traditional methods and are hand-shaken, hand-poured and made with freshly squeezed juices, underlining our focus on product quality. We also offer value-priced food items in our bars during our happy hour, which tends to attract younger guests whom we aim to secure as regular restaurant guests.
As a result of our focus on our bar operations as an integral part of our business, our bars drive sales in our dining rooms. We run our bar operations as a profit center rather than a mere holding area for diners. In 2009, alcohol sales, predominantly from our bar, accounted for approximately 29.6% of our revenues and contributed higher gross margins than food sales. The higher gross margins we generate from bar sales allows us the flexibility to offer lower prices on some of our food menu items, helping us maintain our broad guest appeal.
Broad Appeal of Our Concept
We believe we appeal to a broad range of guests by providing an attractive price-value proposition, with prices that are generally more affordable than those of our upscale competitors. Additionally, we believe we offer service that is superior to that of most other restaurants. The price of a typical meal, including beverages, ranges from $16 to $33 for lunch and $36 to $61 for dinner, with an average of approximately $23 and $50, respectively. Over the past few years, we have enhanced our menu to offer our guests a more affordable dining option by including a selection of lower priced items on our menus for both lunch and dinner. For example, we offer a variety of dining room specials starting at $7.95 as well as our happy hour menu that is served in our bars with several options starting at $1.95. We believe even the price sensitive diner values our superior service, and we have received recognition from our guests and industry awards for our service quality.
The combination of our high quality seafood, pricing strategy and guest service enables us to attract a broad guest demographic. Most of our guests are 30 to 60 years old, primarily college-educated, in the middle to upper-middle income brackets. Our bar operations allow us to also capture the 25 to 35 year old professionals, positioning us to attract a younger clientele as dedicated restaurant guests.
In 2009, we launched a number of new initiatives to evolve our concept with the primary goals of broadening our connection to our guests, to include a younger audience, increasing our brand relevance, and improving our overall satisfaction ratings with our guests. This strategy involves rebranding our bar experience, expanding our culinary offerings, and synergizing our marketing efforts.
2
Table of Contents
Our broad appeal is supported by our catering and banquet services, which we offer both in our restaurants and at other locations as guests request. Our presence in and near hotels enables us to expand the reach of our banquet offerings. In 2009, banquets accounted for approximately 9% of our revenues.
Entrepreneurial Culture with Corporate Control
A key component of our success for more than 38 years has been our commitment to promoting and sustaining an entrepreneurial culture throughout our restaurants while maintaining strong corporate oversight and financial controls. Within this strong corporate infrastructure, each restaurant has profit and loss responsibility and a high degree of operating autonomy. The executive chef at each restaurant has the flexibility, within clearly defined corporate guidelines, to structure menus that cater to guest preferences in that restaurant’s market and respond to changes in product availability and market conditions. We offer quarterly and annual cash performance incentives to certain exempt employees at the restaurant level based on the restaurant’s revenues, costs and profitability, compliance with corporate administrative and payroll guidelines, and the success of other initiatives, such as local community involvement.
We believe our entrepreneurial culture helps us to attract and retain highly qualified and motivated individuals. Our average retention rate for our restaurant general managers and executive chefs is approximately 80%. We believe our decentralized, employee-oriented, entrepreneurial culture creates a sense of pride in our company and allows us to ensure quality service execution at the restaurant level. We believe the stability of our management team and operating personnel, coupled with our disciplined but entrepreneurial culture, positions us for the continued success and growth of our concept.
Portability of Our Brand
We have expanded the McCormick & Schmick’s seafood restaurant concept throughout the United States and have competed successfully with both national and regional restaurant chains and independent local operators, due in part to the flexibility of our real estate model and our nationwide infrastructure. As of December 26, 2009, we had 93 restaurants, including 87 restaurants in the United States, of which one is operated pursuant to a management agreement, and six restaurants in Canada operating under The Boathouse name.
Our restaurants are designed to have broad consumer appeal. We customize our restaurant design and appearance to appeal to local consumer affinities and preferences, and have many restaurants located in buildings that have local significance, including some historic buildings. We have a proven track record of successfully opening restaurants in a variety of sizes, typically ranging from 6,000 to 14,000 square feet and in a number of real estate formats, including both freestanding and in-line locations. The typical size for our current restaurant prototype is 8,000 square feet. We believe the flexibility of our real estate model is a competitive advantage, allowing us to cost-effectively and opportunistically open restaurants in attractive markets without being constrained by a standard prototype or other limiting real estate factors.
We compete on a restaurant-by-restaurant basis with independent local restaurant operators while leveraging the operating strengths of our national infrastructure. We believe the breadth and scale of our restaurant operations and our more than 38 years of experience in the business give us a competitive advantage in terms of the quality, sourcing and freshness of our menu offerings, and flexibility of price points, making our model difficult to replicate. This competitive advantage contributes to our brand’s reputation for quality and service in the affordable upscale dining sector, which we believe commands strong loyalty from our guests.
3
Table of Contents
Our Growth Strategy
We believe our flexible business model, combined with our fresh menu offerings, professional customer service and inviting restaurant environment, provide us with significant opportunities to further grow our business. Key elements of our growth strategy include the following:
Market Expansion
We remain focused on the disciplined growth of our McCormick & Schmick’s brand in our existing markets. We believe we have established the necessary market analysis and site selection procedures for identifying new restaurant opportunities in these markets. In particular, we will continue to evaluate opportunities in affluent suburban areas near existing restaurants in downtown areas to better diversify our presence in existing markets. This strategy enables us to achieve a higher degree of market penetration and brand awareness, resulting in increased repeat business from our broad and diverse customer base. Additionally, we intend to further leverage the economies of scale of our operations to enhance our competitive advantage against independent local competitors, principally in the areas of advertising, marketing, purchasing and distribution infrastructure.
In selecting new market opportunities, we continue to focus on downtown and affluent suburban areas that have large middle to upper-middle income populations, have high guest traffic from thriving businesses or retail markets, and that are convenient for and appealing to business and leisure travelers. We will continue to promote the McCormick & Schmick’s brand image and our broad appeal by opening new restaurants in prime real estate locations and by customizing each new restaurant to the local market.
We intend to open one new restaurant in an existing U.S. market in 2010 and one new restaurant in a new U.S. market in 2010. Based on capital availability and economic conditions, we may open additional restaurants in 2010.
The acquisition of The Boathouse restaurants marked our entry into the Canadian market through a well established brand known for its premier locations, broad appeal and operational excellence. We acquired five existing restaurants and one under construction, which we opened in October 2007, in the greater Vancouver B.C. area. Our acquisition of The Boathouse restaurants was our first significant expansion through acquisition. We continue to evaluate acquisition opportunities in new markets and existing markets as they arise, paying particular attention to how restaurants or restaurant groups would fit with our existing restaurants, culture and business plan.
Reinvestment in existing restaurants
Just as important as growth opportunities outside of our restaurant base is the opportunity to reinvest in our existing restaurants to expand the top line sales potential. During 2009, we selected several restaurants to receive upgrades in patio seating and/or restaurant décor which will be implemented in 2010. We also selected a total of twenty restaurants to receive upgrades in their audio-visual equipment. We feel these upgrades help to revitalize the look and feel of the restaurants, expand opportunities to attract new guests, as well as reconnecting with existing guests to build frequency.
Capture of Ancillary Business Opportunities
We will continue to pursue secondary opportunities that are complementary to our primary concept and further our growth objectives. We operate a collection of individually branded restaurants that include The Heathman Restaurant, McCormick & Kuleto’s Seafood Restaurant, William Douglas Steakhouse, Jake’s Famous Crawfish, Jake’s Grill and Spenger’s Fresh Fish Grotto. We also operate seven restaurants under the name M&S Grill and six restaurants in Canada under the name The Boathouse Restaurants. Our uniquely branded concepts offer an alternative menu to that of our McCormick and Schmick’s branded seafood restaurants. We will also continue to consider catering opportunities and management agreements with hotels. As of December 26, 2009, we operated one restaurant under a management agreement.
4
Table of Contents
Unit Level Economics
Our average cash investment per restaurant opened since 1997 has been approximately $3.0 million, including leasehold improvements, furniture, fixtures and equipment, net of landlord incentive allowances. We have reduced the size of our restaurant prototype to facilitate our entry into a greater variety of markets and provide us with increased flexibility with site selection. We anticipate that our average investment per restaurant will be between approximately $2.2 million and $3.2 million going forward. Due to the current economic downturn a number of restaurants have closed, presenting us with conversion opportunities, which on average range between $1.2 million and $2.2 million of investment per conversion.
The average annualized restaurant sales volume in 2009 for restaurants opened as of December 26, 2009 was approximately $3.9 million. Restaurants opened prior to 2003, were, on average, approximately 10,000 square feet each. Since 2002, we have added 58 company-owned restaurants (including the restaurants acquired in The Boathouse acquisition), which average approximately 8,000 square feet each.
Menu, Food Preparation, Quality Control and Purchasing
Most of our menu items are prepared from scratch daily at each restaurant and each order is assembled when the order is placed with the kitchen staff. Each restaurant has an executive chef responsible for overseeing kitchen operations, including planning the daily-printed menu and ordering necessary ingredients and supplies. At a typical McCormick and Schmick’s restaurant the executive chef is assisted by one to three sous chefs, who help to manage food preparation and service timing.
We maintain strict quality standards at all of our restaurants. We expect each of our employees to adhere to these standards, and it is the responsibility of the general manager and the executive chef at each restaurant to ensure these standards are upheld. We are committed to providing our guests with high quality, fresh products and superior service. We regularly hold regional management meetings designed to re-emphasize McCormick & Schmick’s philosophy, culture, standards of operation and culinary development.
At the restaurant level, purchasing is primarily directed by the executive chef, who is trained in our purchasing practices and philosophy and is supervised by an experienced regional chef. To provide the freshest ingredients and products and to improve operating efficiencies between purchase and use, each executive chef determines the daily requirements for food ingredients, products and supplies. The executive chef orders accordingly from local suppliers and regional and national distributors. Fresh seafood is sourced through multiple vendors in varying geographic regions and delivered daily to each restaurant. Through use of our standard training materials and our commitment to the hiring, development and training of chefs, we are able to maintain high standards and guidelines for our regularly purchased seafood species.
The majority of our restaurants primarily purchase seafood from a network of preferred vendors we have identified as consistently supplying seafood that meets our high standards. The identification and selection of seafood suppliers is reviewed regularly based on product quality, sanitation, fishing practices, pricing and customer service. We prefer suppliers who use day-boats rather than those who are at sea for multiple days because their product is typically fresher. We believe our national and regional presence allows us to achieve better quality and pricing terms for key products, such as fresh fin fish and shellfish, than most of our competitors. Other food products, such as high quality beef and dry goods, are sourced primarily from SYSCO Corporation, a national food distributor, while liquor, beer and wine are purchased from local distributors. SYSCO accounted for approximately 22% of our food purchases in 2009. No other vendor accounted for more than 10% of our purchases in 2009.
Restaurant Design and Atmosphere
Our restaurant designs and decor are intended to capture distinctive attributes of each local market, varying from traditional New England-style fish houses to contemporary dinner houses with waterfront views. Some of our restaurants are located in historic buildings, reinforcing our commitment to local design elements and further
5
Table of Contents
promoting the appeal and ambience of our restaurants. Whether “turn of the century,” classic art deco or traditional design with contemporary twists, our flexible approach to our restaurant designs contributes to the uniqueness of each restaurant and allows us to successfully compete in a sector comprised primarily of independent, locally-owned and operated seafood restaurants. Additionally, our interior decor fosters an inviting atmosphere that we believe is equally appealing to men and women.
Restaurant Locations, Lease Arrangements and Management Fee Arrangements
As of December 26, 2009 we operated 93 restaurants including 87 restaurants in the United States, of which one is operated pursuant to a management agreement, and six restaurants in Canada under The Boathouse name. We lease all but two of our restaurant sites, one we operate under a management agreement and one we own. Terms vary by restaurant, but we generally lease space for 10 to 20 years with one to three five-year renewal options.
The following is a schedule of restaurants we operated as of December 26, 2009:
| Restaurant Name |
City | Year Added | ||
| Alabama |
||||
| McCormick & Schmick’s Seafood Restaurant |
Birmingham | 2004 | ||
| Arizona |
||||
| McCormick & Schmick’s Seafood Restaurant |
Phoenix | 1999 | ||
| McCormick & Schmick’s Seafood Restaurant |
Scottsdale | 2008 | ||
| California |
||||
| McCormick & Schmick’s Seafood Restaurant |
Irvine | 1989 | ||
| McCormick & Kuleto’s Seafood Restaurant |
San Francisco | 1991 | ||
| McCormick & Schmick’s Seafood Restaurant |
Los Angeles | 1992 | ||
| McCormick & Schmick’s Seafood Restaurant |
Pasadena | 1993 | ||
| McCormick & Schmick’s a Pacific Seafood Grill |
Beverly Hills | 1994 | ||
| McCormick & Schmick’s Seafood Restaurant |
El Segundo | 1998 | ||
| Spenger’s Fresh Fish Grotto |
Berkeley | 1999 | ||
| McCormick & Schmick’s Seafood Restaurant |
San Jose | 2004 | ||
| McCormick & Schmick’s Seafood Restaurant* |
San Diego | 2004 | ||
| McCormick & Schmick’s Seafood Restaurant |
Burbank | 2006 | ||
| McCormick & Schmick’s Seafood Restaurant |
Sacramento | 2007 | ||
| McCormick & Schmick’s Seafood Restaurant |
Santa Ana | 2007 | ||
| McCormick & Schmick’s Seafood Restaurant |
Anaheim | 2008 | ||
| McCormick & Schmick’s Seafood Restaurant |
Roseville | 2009 | ||
| Colorado |
||||
| McCormick’s Fish House & Bar |
Denver | 1987 | ||
| McCormick & Schmick’s Seafood Restaurant |
Denver | 2004 | ||
| District of Columbia |
||||
| McCormick & Schmick’s Seafood Restaurant |
Washington | 1996 | ||
| M&S Grill |
Washington | 1998 | ||
| McCormick & Schmick’s Seafood Restaurant |
Washington | 2004 | ||
| Florida |
||||
| McCormick & Schmick’s Seafood Restaurant |
Orlando | 2002 | ||
| McCormick & Schmick’s Seafood Restaurant |
Boca Raton | 2006 | ||
| McCormick & Schmick’s Seafood Restaurant |
Naples | 2008 | ||
| Georgia |
||||
| McCormick & Schmick’s Seafood Restaurant |
Atlanta | 2000 | ||
| McCormick & Schmick’s Seafood Restaurant |
Atlanta | 2002 | ||
6
Table of Contents
| Restaurant Name |
City | Year Added | ||
| Illinois |
||||
| McCormick & Schmick’s Seafood Restaurant |
Chicago | 1998 | ||
| McCormick & Schmick’s Seafood Restaurant |
Chicago | 2006 | ||
| McCormick & Schmick’s Seafood Restaurant |
Schaumburg | 2007 | ||
| McCormick & Schmick’s Seafood Restaurant |
Oak Brook | 2007 | ||
| McCormick & Schmick’s Seafood Restaurant |
Skokie | 2007 | ||
| McCormick & Schmick’s Seafood Restaurant |
Rosemont | 2008 | ||
| Indiana |
||||
| McCormick & Schmick’s Seafood Restaurant |
Indianapolis | 2005 | ||
| Maryland |
||||
| McCormick & Schmick’s Seafood Restaurant |
Baltimore | 1998 | ||
| McCormick & Schmick’s Seafood Restaurant |
Bethesda | 1999 | ||
| M&S Grill |
Baltimore | 2003 | ||
| McCormick & Schmick’s Seafood Restaurant |
Annapolis | 2007 | ||
| McCormick & Schmick’s Seafood Restaurant |
National Harbor | 2008 | ||
| Massachusetts |
||||
| McCormick & Schmick’s Seafood Restaurant |
Boston | 2000 | ||
| McCormick & Schmick’s Seafood Restaurant |
Boston | 2001 | ||
| Michigan |
||||
| McCormick & Schmick’s Seafood Restaurant |
Troy | 2001 | ||
| Minnesota |
||||
| McCormick & Schmick’s Seafood Restaurant |
Minneapolis | 2000 | ||
| M&S Grill |
Minneapolis | 2006 | ||
| McCormick & Schmick’s Seafood Restaurant |
Edina | 2008 | ||
| Missouri |
||||
| McCormick & Schmick’s Seafood Restaurant |
Kansas City | 2000 | ||
| M&S Grill |
Kansas City | 2005 | ||
| McCormick & Schmick’s Seafood Restaurant |
St. Louis | 2009 | ||
| Nevada |
||||
| McCormick & Schmick’s Seafood Restaurant |
Las Vegas | 1998 | ||
| New Jersey |
||||
| McCormick & Schmick’s Seafood Restaurant |
Hackensack | 2002 | ||
| McCormick & Schmick’s Seafood Restaurant |
Bridgewater | 2003 | ||
| McCormick & Schmick’s Seafood Restaurant |
Atlantic City | 2008 | ||
| McCormick & Schmick’s Seafood Restaurant/William Douglas Steakhouse |
Cherry Hill | 2008 | ||
| New York |
||||
| McCormick & Schmick’s Seafood Restaurant |
New York | 2004 | ||
| North Carolina |
||||
| McCormick & Schmick’s Seafood Restaurant |
Charlotte | 2005 | ||
| McCormick & Schmick’s Seafood Restaurant |
Charlotte | 2005 | ||
| McCormick & Schmick’s Seafood Restaurant |
Raleigh | 2008 | ||
| Ohio |
||||
| McCormick & Schmick’s Seafood Restaurant |
Columbus | 2006 | ||
| McCormick & Schmick’s Seafood Restaurant |
Cincinnati | 2006 | ||
| McCormick & Schmick’s Seafood Restaurant |
Cleveland | 2007 | ||
| McCormick & Schmick’s Seafood Restaurant |
Dayton | 2007 | ||
| Oregon |
||||
| Jake’s Famous Crawfish |
Portland | 1972 | ||
7
Table of Contents
| Restaurant Name |
City | Year Added | ||
| McCormick’s Fish House & Bar |
Beaverton | 1981 | ||
| McCormick & Schmick’s Harborside at the Marina |
Portland | 1985 | ||
| Jake’s Grill/Jake’s Catering |
Portland | 1994 | ||
| The Heathman Restaurant |
Portland | 2000 | ||
| McCormick & Schmick’s Seafood Grill |
Tigard | 2005 | ||
| Pennsylvania |
||||
| McCormick & Schmick’s Seafood Restaurant |
Philadelphia | 2001 | ||
| McCormick & Schmick’s Seafood Restaurant |
Pittsburgh | 2005 | ||
| McCormick & Schmick’s Seafood Restaurant |
Pittsburgh | 2007 | ||
| Rhode Island |
||||
| McCormick & Schmick’s Seafood Restaurant |
Providence | 2004 | ||
| Texas |
||||
| McCormick & Schmick’s Seafood Restaurant |
Houston | 1999 | ||
| McCormick & Schmick’s Seafood Restaurant |
Dallas | 2003 | ||
| McCormick & Schmick’s Seafood Restaurant |
Austin | 2004 | ||
| McCormick & Schmick’s Seafood Restaurant |
Austin | 2007 | ||
| McCormick & Schmick’s Seafood Restaurant |
Houston | 2008 | ||
| Virginia |
||||
| McCormick & Schmick’s Seafood Restaurant |
Reston | 1997 | ||
| McCormick & Schmick’s Seafood Restaurant |
McLean | 2000 | ||
| M&S Grill |
Reston | 2004 | ||
| McCormick & Schmick’s Seafood Restaurant |
Arlington | 2004 | ||
| McCormick & Schmick’s Seafood Restaurant |
Virginia Beach | 2007 | ||
| Washington |
||||
| McCormick’s Fish House & Bar |
Seattle | 1977 | ||
| McCormick & Schmick’s Seafood Restaurant |
Seattle | 1984 | ||
| McCormick & Schmick’s Catering at the Museum of Flight in Seattle |
Seattle | 1994 | ||
| McCormick & Schmick’s Harborside on Lake Union |
Seattle | 1996 | ||
| McCormick & Schmick’s Seafood Restaurant |
Bellevue | 2005 | ||
| Wisconsin |
||||
| McCormick & Schmick’s Seafood Restaurant |
Milwaukee | 2008 | ||
| Canada |
||||
| The Boathouse Restaurant |
Vancouver, B.C. | 2007 | ||
| The Boathouse Restaurant |
New Westminster, B.C. | 2007 | ||
| The Boathouse Restaurant |
White Rock, B.C. | 2007 | ||
| The Boathouse Restaurant |
Richmond, B.C. | 2007 | ||
| The Boathouse Restaurant |
Horseshoe Bay, B.C. | 2007 | ||
| The Boathouse Restaurant |
Port Moody, B.C. | 2007 | ||
| * | Operated under a management agreement. |
Site Selection
We believe our site selection is critical to our growth strategy. We carefully consider potential markets and devote a substantial amount of time and effort to evaluate each potential restaurant site. We identify new restaurant opportunities through an established real estate broker network and developer relationships. Our site specifications are flexible. We believe this allows us to consider a broader range of possible locations than most of our regional and national competitors. The criteria we consider in developing our expansion plans and in selecting new restaurants include:
| • | population density, and income and educational level of the population; |
8
Table of Contents
| • | competitive conditions, presence of other retail or traffic generators and menu prices; |
| • | estimated return on investment; |
| • | available square footage and lease economics; |
| • | the proximity of hotels and office space and the density of pedestrian and vehicle traffic; |
| • | the suitability of the site for an affordable, upscale restaurant with a traditional ambience; |
| • | capacity expansion possibilities; and |
| • | management’s experience in the market and the proximity of any of our existing restaurants. |
A majority of our restaurants are located in high-traffic, metropolitan areas and several are located in historic buildings. We believe there are many additional markets both in the United States and internationally that meet our demographic and geographic profiles.
Of our 93 restaurants, including one we operate under a management agreement, 30, or 32%, were opened or acquired within the last three years and 43, or 46%, were opened or acquired within the last five years. We believe our expansion has been at a steady, controlled and prudent pace. In the past two years, economic conditions have caused us to slow our development. We opened two restaurants in 2009, and our plan for 2010 includes the opening of two restaurants. Based on capital availability and economic conditions, we may open additional restaurants in 2010. The typical lead-time from the selection of a new construction location to the opening of a restaurant is approximately twelve to fifteen months. In certain circumstances involving conversions of existing restaurants this time period could be shorter. We evaluate acquisition opportunities as they arise, paying particular attention to how restaurants or restaurant groups would fit with our existing restaurants and our business plan.
Marketing and Advertising
The goals of our marketing efforts are to:
| • | increase comparable restaurant sales by attracting new guests; |
| • | increase the frequency of visits by our current guests; |
| • | support new restaurant openings to achieve sales and profit goals; and |
| • | communicate and promote the uniqueness, appeal, quality and consistency of our brand. |
In 2009, our combined marketing and advertising expenditures were approximately 1% of revenues.
Local Marketing
From before a new restaurant opens to decades after one of our restaurants has been open for business, each property focuses on a variety of local marketing initiatives intended to further connect each restaurant to the local market.
For new restaurants, approximately 60 days before a scheduled restaurant opening, our local public relations firms collaborate with the local media to publicize our restaurant opening and, in new markets, to generate awareness of our brand. We typically host several social events in the local community to generate publicity and build relationships with key stakeholders and community leaders before the official opening of a restaurant. Post-opening, we maintain a strong relationship with our public relations firms and remain focused on our commitment to promoting our brand in the local market through various programs, such as cooking demonstrations by our chefs or discussions on seafood and related offerings on local news broadcasts.
Our restaurants actively sponsor community events and support charitable and non-profit organizations through both monetary and in-kind donations. We believe that, in addition to benefiting our local communities, these activities generate positive media attention and publicity for our brand and enhance our local public image.
9
Table of Contents
We advertise with local daily and weekly publications, key monthly magazines and some local business journals in most urban markets. We also periodically offer promotional certificates and maintain contact with organizations in the travel and convention industries, such as hotels, travel agents, convention centers and local retailers, to further enhance both brand and restaurant location awareness and to target specific guest groups.
We are able to utilize our e-marketing platform to communicate with our preferred guests at a local level to target marketing campaigns specific to their individual home restaurant or market.
National Advertising and Public Relations
Our national advertising program has focused on national periodicals such as major airlines’ in-flight magazines and WHERE Magazine. Additionally, we advertised across the national network of The Business Journal publications and in USA Today during 2009. We also work with a national public relations firm to deliver our restaurants’ core messages to a broad variety of print, broadcast and online media outlets and to create publicity programs to reinforce our brand image on a national scale. To reinforce our broad differentiation, we highlight the breadth and freshness of our seafood as well as our strong price-value proposition in both local and national advertising and public relations efforts.
We also utilize our e-marketing platform for communications on a national scale to both our preferred guests and e-club members to announce upcoming promotions in our restaurants.
Operations
Restaurant Management
Our U.S. restaurant operations are organized into three divisions (West Coast, Midwest, and East Coast), each with a vice president of operations overseeing all aspects of restaurant operations within the designated division, including financial performance, new restaurant openings, capital expenditure requests, management development and local marketing. Each of our vice presidents reports to our executive vice president of operations.
Twelve multi-restaurant managers, of whom seven are regional managers and five are regional chefs, are each typically responsible for eight to twenty restaurants and report to a vice president of operations. Both regional managers and regional chefs are responsible for overall restaurant operations, but have an increased focus on their respective areas of expertise. For example, regional chefs focus more heavily on negotiating food costs, ensuring high food quality, developing and nurturing executive and sous chefs and responding to kitchen staff needs. Regional managers focus primarily on revenues, profitability, front-of-house management and marketing activities.
Our typical restaurant management team consists of a general manager and an executive chef, one to three assistant managers, one to three sous chefs and, in some cases, a meeting planner/banquet coordinator. The remaining restaurant-level employees are hourly personnel varying in number based on restaurant size. Our typical restaurant employs 80 to 90 full-time and part-time employees. The general manager is responsible for all management functions, including purchasing (other than for food), hiring and terminations and oversight of restaurant-level bookkeeping and cash controls. The executive chef is responsible for managing all kitchen functions, including training, menu design and food purchasing, quality and presentation.
We emphasize frequent interaction between our vice presidents, regional managers and restaurant level management. As a result, neither vice presidents nor regional managers operate out of our corporate office and are routinely accessible to restaurant staff.
All management levels in operations, from vice presidents to assistant managers, participate in incentive bonus programs. These incentive programs are designed to establish specific goals and objectives and to ensure accountability and reward performance.
10
Table of Contents
Restaurant Operations
Our restaurants are generally open 365 days each year, serve lunch and dinner and are generally open from 11:00 a.m. to 11:00 p.m. Sunday through Thursday and 11:00 a.m. to 1:00 a.m. Friday and Saturday. In 2009, dinner comprised approximately 77% of revenues, while lunch comprised approximately 23% of revenues, and our restaurants served an average of 774 guests per week during lunch and 1,196 guests per week during dinner. To accommodate guests who have limited time available during lunch, we offer a 45-minute lunch guarantee.
Additionally, we offer catering and banquet services both in our restaurants and at other locations as guests’ request. Our presence in and near hotels enables us to expand the reach of our banquet offerings. In 2009, banquets accounted for approximately 9% of our revenues.
Employees
As of December 26, 2009 we employed 6,592 persons, of whom 662 were salaried and 5,930 were hourly personnel. None of our employees are represented by unions and, in general, we consider our relationship with our employees to be good. Our employees are summarized by major functional area in the table below.
| Functional Area |
Number of Employees | |
| VPs/regional managers/regional chefs |
20 | |
| General managers |
88 | |
| Assistant managers |
249 | |
| Executive chefs |
89 | |
| Sous chefs |
143 | |
| Non-salaried restaurant staff |
5,889 | |
| Corporate salaried |
73 | |
| Corporate non-salaried |
41 | |
| Total |
6,592 | |
Management Information Systems
All of our information processing is managed from our headquarters in Portland, Oregon. Point-of-sale terminals at each restaurant allow us to generate the daily reports needed to manage our restaurants and our business. These reports include, among other things, daily and weekly revenues, guest counts, meal period sales breakouts and food and liquor consumption. The data from the point-of-sale system is electronically transferred each night to a third party intranet provider, with the data then accessible by us through the Internet. Financial operating results are reviewed at the corporate office and studied by restaurant level and regional management. Variances from expectations are analyzed and addressed at frequent financial meetings.
Industry and Competition
Industry
We operate in a highly competitive industry that is affected by changes in consumer eating habits and dietary preferences, population trends and traffic patterns, and local and national economic conditions. Key competitive factors in the industry include the taste, quality and price of the food products offered, quality and speed of guest service, brand name identification, attractiveness of facilities, restaurant location, and overall dining experience. We believe we compete favorably with respect to each of these factors and have successfully overcome the following barriers often faced by seafood restaurants:
| • | developing and maintaining consistent, reliable sources of high quality, fresh seafood; |
11
Table of Contents
| • | difficulty in hedging against increases in seafood costs; |
| • | complications in preparing and handling seafood; and |
| • | regional variations in consumer tastes for seafood products vary. |
Competition
While we compete with a range of restaurant operators for consumers’ dining preferences and with both restaurants and retailers for site locations and personnel requirements, we feel we are uniquely positioned between the upscale casual restaurants and fine dining establishments, as such, we consider our principal competitors to include the following:
| • | independent, local seafood restaurants; |
| • | regional seafood restaurant concepts; |
| • | national upscale casual restaurants; and |
| • | upscale “steak and chop” restaurants. |
Available Information
We make available free of charge on or through our website at www.mccormickandschmicks.com our annual reports on Form 10-K, quarterly reports on Form 10-Q, current reports on Form 8-K and amendments to these reports filed or furnished pursuant to Section 13(a) or 15(d) of the Exchange Act as soon as reasonably practicable after we file these materials with the Securities and Exchange Commission. These materials are also available on the Security and Exchange Commission’s website at www.sec.gov.
Continued or worsening economic conditions and disruptions in the financial markets may adversely impact our business, results of operations, including potential impairment of the long-lived assets of our restaurants, and could increase our cost of borrowing.
The restaurant industry is being adversely affected by economic factors, including changes in national, regional, and local economic conditions, employment levels and consumer spending patterns. The increased concerns about the economy and financial markets have reduced consumer confidence and decreased restaurant traffic, particularly at upscale restaurants, which is harmful to our business and results of operations. If these conditions continue or worsen, deteriorating financial performance could affect the financial ratios and covenants under our credit agreement, which, in turn, could affect our ability to borrow, increase our cost of borrowing or result in accelerated payment of outstanding loans.
In addition, adverse general economic conditions have affected and are likely to continue to affect:
| • | Our vendors and suppliers, some of which are local or regional and may be less able to survive in a difficult economic environment than national suppliers; |
| • | Our guests, who may have less disposable income or who may decrease discretionary spending; and |
| • | Real estate developers, landlords and co-tenants, who may be unable to meet commitments to fill space in developments where our restaurants are located, which would decrease guest traffic to our restaurants. |
If our vendors, guests or service providers are adversely affected, our business and results of operations may also be adversely affected.
12
Table of Contents
Restaurant companies have been the target of class-actions and other lawsuits alleging, among other things, violation of federal and state law.
We are subject to a variety of claims arising in the ordinary course of our business brought by or on behalf of our guests or employees, including personal injury claims, contract claims, and employment-related claims. In recent years, a number of restaurant companies have been subject to lawsuits, including class-action lawsuits, alleging violations of federal and state law regarding workplace, employment and similar matters. A number of these lawsuits have resulted in the payment of substantial damages by the defendants. Similar lawsuits have been instituted against us from time to time. In 2007, we incurred a $2.2 million charge for a class action legal settlement relating to an employment claim. Regardless of whether any claims against us are valid or whether we are ultimately determined to be liable, claims may be expensive to defend and may divert time and money away from our operations and hurt our performance. A judgment significantly in excess of our insurance coverage for any claims could materially adversely affect our financial condition or results of operations, and adverse publicity resulting from these allegations may materially adversely affect our business. We may incur substantial damages and expenses resulting from lawsuits, which could have a material adverse effect on our business.
Failure of our existing or new restaurants to achieve predicted results could have a negative impact on our revenues and performance results.
The results achieved by our restaurants may not be indicative of longer term performance or the potential market acceptance of restaurants in other locations. New restaurants we open may not have operating results similar to those of previously opened restaurants. The failure of restaurants to perform as predicted could result in an impairment charge, which could negatively impact our results of operations.
Our ability to expand our restaurant base is influenced by factors beyond our control and therefore we may not be able to achieve our planned growth.
Our growth strategy depends in large part on our ability to open new restaurants and to operate these restaurants profitably. Delays or failures in opening new restaurants could impair our ability to meet our growth objectives. We have in the past experienced delays in restaurant openings and may experience similar delays in the future. Our ability to expand our business successfully will depend upon numerous factors, including:
| • | hiring, training and retaining skilled management, chefs and other qualified personnel to open, manage and operate new restaurants; |
| • | locating and securing a sufficient number of suitable new restaurant sites in new and existing markets on acceptable financial terms; |
| • | managing the length of time and construction and development costs associated with the opening of new restaurants; |
| • | obtaining adequate financing for the construction of new restaurants; |
| • | securing governmental approvals and permits required to open new restaurants in a timely manner, if at all; |
| • | Real estate developers, landlords and co-tenants, may be unable to meet commitments to fill space in developments where our restaurants are to be located, which would decrease guest traffic to our planned restaurants; |
| • | successfully promoting our new restaurants and competing in the markets in which our new restaurants are located; and |
| • | general economic conditions. |
Some of these factors are beyond our control. We may not be able to achieve our expansion goals and our new restaurants may not be able to achieve operating results similar to those of our existing restaurants. Due to the economic outlook, we opened two restaurants for 2009, which is fewer than in the last several years.
13
Table of Contents
Our operating results may fluctuate significantly and could fall below the expectations of securities analysts and investors due to seasonality and other factors, resulting in a decline in our stock price.
Our operating results may fluctuate significantly because of several factors, including:
| • | our ability to achieve and manage our planned expansion; |
| • | our ability to achieve market acceptance, particularly in new markets; |
| • | our ability to raise capital, or the availability of expansion capital generally; |
| • | changes in the availability and costs of food; |
| • | the loss of key management personnel; |
| • | the concentration of our restaurants in specific geographic areas; |
| • | our ability to protect our name and logo and other proprietary information; |
| • | changes in consumer preferences or discretionary spending; |
| • | fluctuations in the number of visitors or business travelers to our restaurants; |
| • | health concerns about seafood or other foods; |
| • | our ability to attract, motivate and retain qualified employees; |
| • | increases in labor costs; |
| • | the impact of federal, state or local government regulations relating to our employees or the sale or preparation of food and the sale of alcoholic beverages; |
| • | the impact of litigation; |
| • | the effect of competition in the restaurant industry; |
| • | the effect of widespread adverse weather conditions; |
| • | economic trends generally; |
| • | the ability of real estate developers, landlords and co-tenants, to meet commitments to fill space in developments where our restaurants are to be located, which would decrease guest traffic to our restaurants; and |
| • | reduced corporate expenditures on meetings and/or conventions may impact our private dining business. |
Our business also is subject to seasonal fluctuations. Historically, sales in most of our restaurants have been higher during the second and fourth quarter of each year. As a result, our quarterly and annual operating results and restaurant sales may fluctuate significantly as a result of seasonality and the factors discussed above. Accordingly, results for any one fiscal quarter are not necessarily indicative of results to be expected for any other quarter or for any year and comparable restaurant sales for any particular future period may decrease. Our operating results may be different than the expectations of securities analysts and investors. In that event, the price of our common stock may fluctuate.
Our operations are susceptible to changes in food availability and costs, which could adversely affect our operating results.
Our profitability depends significantly on our ability to anticipate and react to changes in food costs. We rely on local, regional and national suppliers to provide our seafood, produce, beef and other ingredients. Increases in distribution costs or sale prices or failure to perform by these suppliers could cause our food costs to increase. We could also experience significant short-term disruptions in our supply if a significant supplier failed to meet its obligations. The supply of seafood, produce and beef are more volatile than other types of food. The
14
Table of Contents
type, variety, quality and price of seafood, produce and beef are subject to factors beyond our control, including weather, governmental regulation, availability and seasonality, each of which may affect our food costs or cause a disruption in our supply. Some climatologists predict that the long-term effects of climate change may result in more severe, volatile weather. Changes in the price or availability of certain types of seafood and beef could affect our ability to offer a broad menu and price offering to guests and could materially adversely affect our profitability.
Low market acceptance could adversely affect the profitability of restaurants that we open in new markets.
Our growth strategy includes opening restaurants in markets where we have little or no operating experience and in which potential guests may not be familiar with our restaurants. The success of these new restaurants may be affected by different competitive conditions, consumer tastes and discretionary spending patterns, and our ability to generate market awareness and acceptance of the McCormick & Schmick’s brand and our other brands. As a result, we may incur costs related to the opening, operation and promotion of these new restaurants that are greater than those incurred in other areas. Even though we may incur substantial additional costs with these new restaurants, they may attract fewer guests than our more established restaurants in existing markets. Sales at restaurants we open in new markets may take longer to reach our average annual sales, if at all. As a result, the results of operations at our new restaurants may be inferior to those of our existing restaurants. We may not be able to profitably open restaurants in new markets.
Our growth may strain our infrastructure and resources, which could slow our development of new restaurants and adversely affect our ability to manage our existing restaurants.
We opened twelve company-owned restaurants and acquired five The Boathouse restaurants in 2007, and in 2008 we opened eleven company-owned restaurants. We opened two company-owned restaurants in 2009. Our future growth may strain our restaurant management systems and resources, financial controls and information systems. Those demands on our infrastructure and resources may also adversely affect our ability to manage our existing restaurants. If we fail to continue to improve our infrastructure or to manage other factors necessary for us to meet our expansion objectives, our operating results could be materially and adversely affected.
Any acquisition of new restaurants could strain our financial resources or result in dilution to our existing stockholders.
Future acquisitions of existing restaurants, which may be accomplished with cash or through the issuance of our equity securities, or a combination of both, could result in dilutive issuances of our equity securities and/or the incurrence of debt and contingent liabilities, either of which could harm our business, financial condition or results of operations.
A decline in visitors or business travelers to areas where our restaurants are located could negatively affect our restaurant sales.
We depend on both local residents and business travelers to frequent our locations. If the number of visitors to frequent our locations declines due to economic or other conditions, changes in consumer preferences, changes in discretionary consumer spending or for other reasons, our revenues could decline significantly and our results of operations could be adversely affected.
If we lose the services of any of our key management personnel our business could suffer.
We depend on the services of our key senior management personnel. If we lose the services of any members of our senior management or key personnel for any reason, we may be unable to replace them with qualified personnel, which could have a material adverse effect on our business and growth. We do not carry key person life insurance on any of our executive officers.
15
Table of Contents
Many of our restaurants are concentrated in local or regional areas and, as a result, we are sensitive to economic and other trends and developments in these areas.
As of December 26, 2009, we operated five restaurants in the Seattle, Washington area, six in the Portland, Oregon area, fourteen in California, and six in the greater Vancouver, British Columbia area; our East Coast restaurants are concentrated in and around Washington, D.C. and Baltimore. As a result, adverse economic conditions, weather and labor markets in any of these areas could have a material adverse effect on our overall results of operations.
In addition, given our geographic concentrations, negative publicity regarding any of our restaurants in these areas could have a material adverse effect on our business and operations, as could other regional occurrences such as local strikes, oil spills, terrorist attacks, energy shortages or increases in energy prices, droughts or earthquakes or other natural disasters.
Our success depends on our ability to protect our proprietary information. Failure to protect our trademarks, service marks or trade secrets could adversely affect our business.
Our business prospects depend in part on our ability to develop favorable consumer recognition of the McCormick & Schmick’s name. Although McCormick & Schmick’s Seafood Restaurants, M&S Grill, The Boathouse Restaurants, and other of our service marks are registered trademarks, our trademarks could be imitated in ways that we cannot prevent. In addition, we rely on trade secrets, proprietary know-how, concepts and recipes. Our methods of protecting this information may not be adequate, however, and others could independently develop similar know-how or obtain access to our trade secrets, know-how, concepts and recipes.
Moreover, we may face claims of misappropriation or infringement of third parties’ rights that could interfere with our use of our proprietary know-how, concepts, recipes or trade secrets. Defending these claims may be costly and, if unsuccessful, may prevent us from continuing to use this proprietary information in the future, and may result in a judgment or monetary damages.
We do not maintain confidentiality and non-competition agreements with all of our executives, key personnel or suppliers. If competitors independently develop or otherwise obtain access to our know-how, concepts, recipes or trade secrets, the appeal of our restaurants could be reduced and our business could be harmed.
Our insurance policies may not provide adequate levels of coverage against all claims.
We believe we maintain insurance coverage that is customary for businesses of our size and type. However, there are types of losses we may incur that cannot be insured against or that we believe are not commercially reasonable to insure. These losses, if they occur, could have a material and adverse effect on our business and results of operations. Our primary insurer in 2004 has informed us it believes we have exhausted our insurance coverage with respect to employment claims arising in our 2004 coverage year and that several claims arising in 2005 through 2008 coverage years are related to the 2004 coverage year. We disagree with this interpretation of our coverage, but we have taken this interpretation into account in connection with the charge we have taken related to our settlement of class action claims in California. See Item 3, “Legal Proceedings.” We may not succeed in our contest of our insurer’s conclusion. If we are unsuccessful, and if it is determined that other existing employment claims arose in 2004 and are therefore not covered, our resolution of those claims would be more expensive.
Expanding our restaurant base by opening new restaurants in existing markets could reduce the business of our existing restaurants.
Our growth strategy includes opening restaurants in markets in which we already have existing restaurants. We may be unable to attract enough guests to the new restaurants for them to operate at a profit. Even if we are
16
Table of Contents
able to attract enough guests to the new restaurants to operate them at a profit, those guests may be former guests of one of our existing restaurants in that market and the opening of new restaurants in the existing market could reduce the revenue of our existing restaurants in that market.
We may not be able to successfully integrate into our business the operations of restaurants that we acquire, which may adversely affect our business, financial condition and results of operations.
We may seek to selectively acquire existing restaurants and integrate them into our business operations. Achieving the expected benefits of any restaurants that we acquire will depend in large part on our ability to successfully integrate the operations of the acquired restaurants and personnel in a timely and efficient manner. The risks involved in such restaurant acquisitions and integration include:
| • | challenges and costs associated with the acquisition and integration of restaurant operations located in markets where we have limited or no experience; |
| • | possible disruption to our business as a result of the diversion of management’s attention from its normal operational responsibilities and duties; and |
| • | consolidation of the corporate, information technology, accounting and administrative infrastructure and resources of the acquired restaurants into our business. |
We may be unable to successfully integrate the operations, or realize the anticipated benefits, of any restaurants that we acquire. If we cannot overcome the challenges and risks that we face in integrating the operations of newly acquired restaurants, our business, financial condition and results of operations could be adversely affected.
Negative publicity concerning food quality, health and other issues and costs or liabilities resulting from litigation may have a material adverse effect on our results of operations.
We are sometimes the subject of complaints or litigation from guests alleging illness, injury or other food quality, health or operational concerns. Litigation or adverse publicity resulting from these allegations may materially and adversely affect us or our restaurants, regardless of whether the allegations are valid or whether we are liable. Further, these claims may divert our financial and management resources from revenue-generating activities and business operations.
Health concerns relating to the consumption of seafood or other foods could affect consumer preferences and could negatively impact our results of operations.
We may lose customers based on health concerns about the consumption of seafood or negative publicity concerning food quality, illness and injury generally, such as negative publicity concerning the accumulation of mercury or other carcinogens in seafood, e-coli, “mad cow” or “foot-and-mouth” disease, publication of government or industry findings about food products served by us, regulatory required disclosure of calorie or nutritional information or other health concerns or operating issues stemming from one of our restaurants. In addition, our operational controls and training may not be fully effective in preventing all food-borne illnesses. Some food-borne illness incidents could be caused by food suppliers and transporters and would be outside of our control. Any negative publicity, health concerns or specific outbreaks of food-borne illnesses attributed to one or more of our restaurants, or the perception of an outbreak, could result in a decrease in guest traffic to our restaurants and could have a material adverse effect on our business.
Federal legislation, and state and local legislation in areas where we operate restaurants, has been proposed in the past that would require us to provide nutritional information to our customers. Laws in several states and local jurisdictions require specific classes of restaurants to publish nutritional information on menus or to make that information available to customers. To the extent these laws are or become applicable to our restaurants, we would face significant compliance and litigation costs associated with nutritional labeling and other disclosure
17
Table of Contents
practices. These costs and risks could disproportionally impact us, compared to other restaurants, because our daily menu changes and because of variations in food preparation among our restaurants, where dishes are prepared from scratch.
Changes in consumer preferences or discretionary consumer spending could negatively impact our results of operations.
The restaurant industry is characterized by the introduction of new concepts and is subject to rapidly changing consumer preferences, tastes and purchasing habits. Our continued success depends in part upon the popularity of seafood and the style of dining we offer. Shifts in consumer preferences away from this cuisine or dining style could materially and adversely affect our operating results. Our success will depend in part on our ability to anticipate and respond to changing consumer preferences, tastes and purchasing habits, and to other factors affecting the restaurant industry, including new market entrants and demographic changes. If we change our concept and menu to respond to changes in consumer tastes or dining patterns, we may lose customers who do not like the new concept or menu, and may not be able to attract a sufficient new customer base to produce the revenue needed to make the restaurant profitable. Our success also depends to a significant extent on numerous factors affecting discretionary consumer spending, including economic conditions, disposable consumer income and consumer confidence. Changes in consumer discretionary spending could more dramatically affect upscale restaurant concepts than casual restaurant concepts. Adverse changes in these factors could reduce guest traffic or impose practical limits on pricing, either of which could harm our results of operations.
Labor shortages or increases in labor costs could slow our growth or harm our business.
Our success depends in part upon our ability to attract, motivate and retain a sufficient number of qualified employees, including regional operational managers and regional chefs, restaurant general managers and executive chefs, necessary to continue our operations and keep pace with our growth. Qualified individuals are in short supply and competition for these employees is intense. If we are unable to recruit and retain sufficient qualified individuals, our business and our growth could be adversely affected. Additionally, competition for qualified employees could require us to pay higher wages, which could result in higher labor costs. If our labor costs increase, our results of operations will be negatively affected.
We may incur costs or liabilities and lose revenue, and our growth strategy may be adversely impacted, as a result of government regulation.
Our restaurants are subject to various federal, state and local government regulations, including those relating to employees, the preparation and sale of food and the sale of alcoholic beverages. These regulations affect our restaurant operations and our ability to open new restaurants.
Each of our restaurants must obtain licenses from regulatory authorities to sell liquor, beer and wine, and each restaurant must obtain a food service license from local health authorities. Each liquor license must be renewed annually and may be revoked at any time for cause, including violation by us or our employees of any laws and regulations relating to the minimum drinking age, advertising, wholesale purchasing and inventory control. In certain jurisdictions where we operate the number of alcoholic beverage licenses available is limited and licenses are traded at market prices.
The failure to maintain our food and liquor licenses and other required licenses, permits and approvals could adversely affect our operating results. Difficulties or failure in obtaining the required licenses and approvals could delay or result in our decision to cancel the opening of new restaurants.
We are subject to “dram shop” statutes in some states. These statutes generally allow a person injured by an intoxicated person to recover damages from an establishment that wrongfully served alcoholic beverages to the intoxicated person. A judgment substantially in excess of our insurance coverage could harm our operating results and financial condition.
18
Table of Contents
Various federal and state labor laws govern our relationship with our employees and affect operating costs. These laws include minimum wage requirements, overtime pay, unemployment tax rates, workers’ compensation rates, and citizenship requirements. Additional government-imposed increases in minimum wages, overtime pay, paid leaves of absence and mandated health benefits, increased tax reporting and tax payment requirements for employees who receive gratuities, or a reduction in the number of states that allow tips to be credited toward minimum wage requirements would increase our labor costs and could harm our operating results and financial condition. We may be unable to increase our prices in order to pass these increased labor costs on to our guests, in which case our margins would be negatively affected. Because our labor costs are, as a percentage of revenues, higher than other industries, we may be significantly harmed by labor cost increases.
The Federal Americans with Disabilities Act prohibits discrimination on the basis of disability in public accommodations and employment. Although our restaurants are designed to be accessible to the disabled, we could be required to make modifications to our restaurants to provide service to, or make reasonable accommodations for, disabled persons.
Federal legislation, and state and local legislation in areas where we operate restaurants, has been proposed in the past that would require us to provide nutritional information to our customers. Laws in several states and local jurisdictions require specific classes of restaurants to publish nutritional information on menus or to make that information available to customers. To the extent these laws are or become applicable to our restaurants, we would face significant compliance and litigation costs associated with nutritional labeling and other disclosure practices. These costs and risks could disproportionally impact us, compared to other restaurants, because our daily menu changes and because of variations in food preparation among our restaurants, where dishes are prepared from scratch.
Our operations and profitability are susceptible to the effects of violence, war and economic trends.
Terrorist attacks and other acts of violence or war and U.S. military reactions to such attacks may negatively affect our operations and an investment in our shares of common stock. The terrorist attacks in New York and Washington, D.C. on September 11, 2001 led to a temporary interruption in deliveries from some of our suppliers and, we believe, contributed to the decline in average annual comparable restaurant sales in 2001 and 2002.
Future acts of violence or war could cause a decrease in travel and in consumer confidence, decrease consumer spending, result in increased volatility in the United States and worldwide financial markets and economy, or result in an economic recession in the United States or abroad. They could also impact consumer leisure habits, for example, by increasing time spent watching television news programs at home, and may reduce the number of times consumers dine out, which could adversely impact our revenue. Any of these occurrences could harm our business, financial condition or results of operations, and may result in the volatility of the market price for our securities and on the future price of our securities.
Terrorist attacks could also directly impact our physical facilities or those of our suppliers, and attacks or armed conflicts may make travel and the transportation of our supplies and products more difficult and more expensive and ultimately affect our revenues.
We may not be able to compete successfully with other restaurants, which could adversely affect our results of operations.
The restaurant industry is intensely competitive with respect to price, service, location, food quality, ambiance and the overall dining experience. Our competitors include a large and diverse group of restaurant chains and individual restaurants that range from independent local operators to well capitalized national restaurant companies. Some of our competitors have been in existence for a substantially longer period than we have and may be better established in the markets where our restaurants are or may be located. Some of our competitors may have substantially greater financial, marketing and other resources than we do. If our restaurants
19
Table of Contents
are unable to compete successfully with other restaurants in new and existing markets, our results of operations will be adversely affected. We also compete with other restaurants for experienced management personnel and hourly employees, and with other restaurants and retail establishments for quality restaurant sites.
ITEM 1B. UNRESOLVED STAFF COMMENTS
None.
Our corporate headquarters are located in Portland, Oregon. In January 2010, we moved the corporate headquarters to a new leased facility in Portland, Oregon. We occupy this facility under a lease that terminates in April 2017. We lease all of our restaurant facilities, except for one we own and one that we operate under a management agreement.
Occasionally, we are a defendant in litigation arising in the ordinary course of our business, including claims resulting from “slip and fall” accidents, employment related claims and claims from guests or employees alleging illness, injury or other food quality, health or operational concerns. These may include claims brought against us by private party plaintiffs and various government agencies, including federal, state and local agencies, various state and local health departments, and the Equal Employment Opportunity Commission and other employment related agencies, among others. In certain instances we may settle claims if management concludes that future costs to defend the suits outweigh the costs to settle the claims. We currently are a defendant in disputes that may be litigated in court.
We were named in a class action complaint regarding employment practices filed in the U.S. District Court for the Northern District of California. We have contested the claims and negotiated a settlement with the plaintiffs. We do not anticipate the changes to our hiring and employment practices we agreed to in connection with the settlement will significantly affect our operations. The settlement was approved by the court, and the settlement amount was paid, in April 2008.
Our primary insurer has informed us it believes we have exhausted our insurance coverage with respect to employment claims arising in our 2004 coverage year, which it believes includes the litigation in California and possibly similar future claims. Furthermore, the insurer has also taken the position that several claims arising in 2005-2008 are related to certain 2004 claims, and therefore not eligible for coverage. We disagree with this interpretation of the coverage, but have taken this interpretation into account in connection with the accounting for employment claims. In fiscal year 2008, we initiated litigation to contest the insurer’s conclusion.
ITEM 4A. EXECUTIVE OFFICERS AND OTHER KEY EMPLOYEES
William T. Freeman (age 50) joined McCormick and Schmick’s as the chief executive officer on January 12, 2009, and was elected a director on January 27, 2009. Mr. Freeman has more than 24 years of experience in the restaurant and entertainment industries, most recently as the founder, president and chief executive officer of B&B Restaurant Ventures, LLC, which operated Fox Sports Grill, where he was responsible for the creation, development, operation and growth of the concept from inception. The Fox Sports Grill restaurants were sold in a prepackaged Chapter 11 bankruptcy filed in July 2008 by B&B Restaurant Ventures. Mr. Freeman has also held senior management positions with Robert Redford’s Sundance Entertainment, where he was responsible for all operating divisions including the Sundance Channel, Sundance
20
Table of Contents
Resort and the development of the Sundance Film Centers; and Disney Regional Entertainment, where he developed, operated and grew the ESPN brand on a national basis through the development of retail, restaurant and live production venues. Mr. Freeman received his Bachelor of Science in accounting from Furman University and began his career as a certified public accountant at Ernst & Whinney.
Michelle M. Lantow (age 48) joined McCormick & Schmick’s as the chief financial officer on January 6, 2010. Ms. Lantow has more than 25 years of experience in corporate financial management and leadership, most recently as the President and Chief Financial Officer of Lucy Activewear, Inc. Lucy Activewear, Inc. is a wholly owned subsidiary of VF Corporation. Prior to joining Lucy Activewear, Inc., Ms. Lantow was the Vice President of Finance, Corporate Controller, and Vice President of Investor Relations for GAP, Inc. Ms. Lantow received her Bachelor of Arts in business economics from the University of California at Santa Barbara and began her career as a certified public accountant at Arthur Anderson and Co.
Michael B. Liedberg (age 47) joined McCormick & Schmick’s in January 2004 and was appointed executive vice president of operations in January 2007. From 2004 through 2006, he was a vice president of operations. Mr. Liedberg has over 20 years of management experience in the restaurant industry including service as the president and chief executive officer of Desert Moon Restaurants from December 2001 to January 2004. Before 2001, Mr. Liedberg held various positions for thirteen years with Avado Brands, Inc. Mr. Liedberg’s education includes a certificate from the Management Program at Georgia Institute of Technology and a Human Resources Certificate from the University of Georgia.
Jeffrey H. Skeele (age 55) has been a senior vice president of operations of McCormick & Schmick’s since January 2008, and from 1998 to 2007 he was a vice president of operations. He also has held the positions of senior manager (1991-1996) and general manager (1986-1988). From 1988 to 1991, Mr. Skeele was a vice president at West Group Partners.
Martin P. Gardner (age 49) has been our vice president of finance since January 2007 and our corporate controller since June 2007. Mr. Gardner joined us in 2004 and previously served as our director of finance. From 2000 to 2004, Mr. Gardner was corporate controller of Lexar, Inc. From 1995 to 2000, Mr. Gardner held various management positions, including corporate controller, for Mattson Technology, Inc. Mr. Gardner received his Bachelor of Science degree in accounting from San Jose State University, his Master of Science degree in finance from Golden Gate University and is a certified public accountant.
Kelly A.B. Gordon (age 52) joined McCormick & Schmick’s in 2007 as a vice president as part of The Boathouse Restaurants acquisition. Prior to joining McCormick & Schmick’s, he spent seven years as vice president of operations for The Spectra Group. Prior to that, Mr. Gordon was a partner with The Keg Steakhouse & Bar restaurants for eight years. Mr. Gordon received his Bachelors degree from Simon Fraser University, majoring in business and economics.
21
Table of Contents
| ITEM 5. | MARKET FOR THE REGISTRANT’S COMMON EQUITY AND RELATED STOCKHOLDER MATTERS |
Market Information
Our common stock is listed on the NASDAQ Global Stock Market under the symbol “MSSR”. The table below sets forth the high and low closing price for our common stock in the first, second, third and fourth quarters of fiscal 2009 and 2008, as reported by the NASDAQ Global Stock Market.
| Stock Price | ||||||
| High | Low | |||||
| 4th Quarter 2009 |
$ | 8.04 | $ | 5.63 | ||
| 3rd Quarter 2009 |
9.23 | 6.64 | ||||
| 2nd Quarter 2009 |
7.87 | 3.77 | ||||
| 1st Quarter 2009 |
4.95 | 1.46 | ||||
| 4th Quarter 2008 |
9.74 | 3.34 | ||||
| 3rd Quarter 2008 |
11.43 | 7.15 | ||||
| 2nd Quarter 2008 |
12.62 | 8.73 | ||||
| 1st Quarter 2008 |
14.40 | 9.72 | ||||
22
Table of Contents
Stock Performance Graph
The following graph compares the total return on an indexed basis of a $100 investment in our common stock, the Nasdaq Composite Index and the Dow Jones U.S. Restaurants and Bars Index. For comparison purposes, the data points of our common stock are as of December 23, 2004, December 30, 2005, December 29, 2006, December 28, 2007, December 26, 2008, and December 24, 2009, the last trading day in our fiscal years 2004, 2005, 2006, 2007, 2008, and 2009, respectively. The data points for both the NASDAQ Composite Index and the Dow Jones U.S. Restaurants & Bars Index are as of the last trading day in December 2004, 2005, 2006, 2007, 2008 and 2009. The historical stock performance presented below is not intended to and may not be indicative of future stock performance.
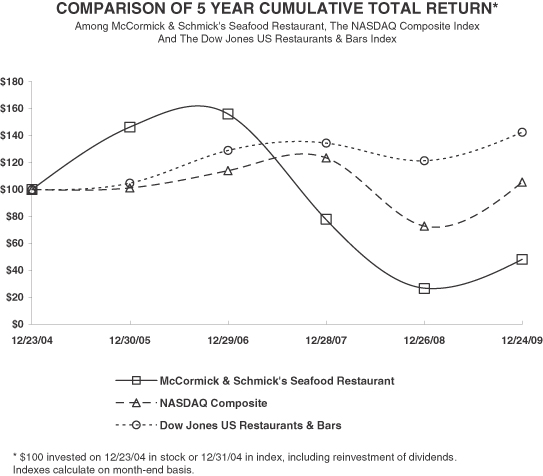
| 12/04 | 12/05 | 12/06 | 12/07 | 12/08 | 12/09 | |||||||||||||
| McCormick & Schmick’s Seafood Restaurants, Inc. |
$ | 100.00 | $ | 146.43 | $ | 156.10 | $ | 77.79 | $ | 27.01 | $ | 48.38 | ||||||
| NASDAQ Composite Index |
$ | 100.00 | $ | 101.33 | $ | 114.01 | $ | 123.71 | $ | 73.11 | $ | 105.61 | ||||||
| Dow Jones US Restaurants & Bars Index |
$ | 100.00 | $ | 104.84 | $ | 129.12 | $ | 134.64 | $ | 121.51 | $ | 142.61 | ||||||
23
Table of Contents
Holders of Record
As of March 1, 2010 there were approximately 57 holders of record of our common stock.
Dividend Policy
We expect to retain all of our earnings to finance the expansion and development of our business, including managing working capital and debt levels, and we have not paid dividends in the prior three fiscal years and have no plans to pay cash dividends to our stockholders for the foreseeable future. The payment of dividends is within the discretion of our board of directors and will depend upon our earnings, capital requirements and operating and financial condition, among other factors. Our revolving credit agreement restricts our ability to pay dividends.
Securities Authorized for Issuance Under Equity Compensation Plans
The following table provides information about compensation plans (including individual compensation arrangements) under which our equity securities are authorized for issuance to employees or non-employees (such as directors and consultants) at December 26, 2009.
| Number of securities to be issued upon exercise of outstanding options |
Weighted- average exercise price of outstanding options |
Number of restricted shares subject to forfeiture |
Number of securities remaining available for future issuance under equity compensation plans (excluding securities reflected in columns (a)) | ||||||
| (a) | (b) | (a) | (c) | ||||||
| Equity compensation plans approved by security holders: |
|||||||||
| 2004 Stock Incentive Plan |
543,547 | $ | 8.41 | 64,301 | 269,717 | ||||
Issuer Purchases of Equity Securities
In July 2008, our Board of Directors authorized the repurchase of up to $20.0 million of our common stock. As of December 26, 2009 we have not repurchased any of our equity securities.
24
Table of Contents
ITEM 6. SELECTED FINANCIAL DATA
The selected consolidated financial and operating data below is derived from our consolidated financial statements for the fiscal years 2005, 2006, 2007, 2008 and 2009, which have been audited by an independent registered public accounting firm.
The selected consolidated financial and operating data below represent portions of our financial statements, which should be read together with Part II—Item 7, “Management’s Discussion and Analysis of Financial Condition and Results of Operations” and our consolidated financial statements and the related notes included in Part II—Item 8, Financial Statements and Supplementary Data. Historical results are not necessarily indicative of future performance. Our fiscal year ends on the last Saturday in December. Each of the fiscal years 2005 through 2009 comprised 52 weeks, except for fiscal year 2005 which comprised 53 weeks.
| Year Ended | |||||||||||||||||||
| 2005 | 2006 | 2007 | 2008 | 2009 | |||||||||||||||
| (in thousands, except per share data) | |||||||||||||||||||
| Statement of Operations Data: |
|||||||||||||||||||
| Revenues |
$ | 278,813 | $ | 308,323 | $ | 358,647 | $ | 390,718 | $ | 360,129 | |||||||||
| Restaurant operating costs |
|||||||||||||||||||
| Food and beverage |
81,630 | 89,443 | 104,468 | 117,642 | 106,030 | ||||||||||||||
| Labor |
86,823 | 95,886 | 112,503 | 125,811 | 117,194 | ||||||||||||||
| Operating |
41,857 | 46,044 | 54,892 | 61,375 | 54,441 | ||||||||||||||
| Occupancy |
24,790 | 27,650 | 32,048 | 36,874 | 37,690 | ||||||||||||||
| Total restaurant operating costs |
235,100 | 259,023 | 303,911 | 341,702 | 315,355 | ||||||||||||||
| General and administrative expenses |
15,105 | 16,651 | 22,166 | 21,026 | 20,168 | ||||||||||||||
| Restaurant pre-opening costs |
2,496 | 2,892 | 4,527 | 4,428 | 1,101 | ||||||||||||||
| Depreciation and amortization |
9,608 | 10,640 | 11,940 | 15,043 | 16,789 | ||||||||||||||
| Impairment, restructuring and other charges |
— | — | 5,427 | 83,913 | 20,388 | ||||||||||||||
| Total costs and expenses |
262,309 | 289,206 | 347,971 | 466,112 | 373,801 | ||||||||||||||
| Operating income (loss) |
16,504 | 19,117 | 10,676 | (75,394 | ) | (13,672 | ) | ||||||||||||
| Interest expense (income), net |
550 | (228 | ) | (226 | ) | 1,173 | 1,752 | ||||||||||||
| Write off of loan transaction costs |
— | — | — | 376 | — | ||||||||||||||
| Other income, net |
— | — | — | (308 | ) | (53 | ) | ||||||||||||
| Income (loss) before income taxes |
15,954 | 19,345 | 10,902 | (76,635 | ) | (15,371 | ) | ||||||||||||
| Income tax expense (benefit) |
4,946 | 5,997 | 2,088 | (7,024 | ) | (656 | ) | ||||||||||||
| Net income (loss) |
$ | 11,008 | $ | 13,348 | $ | 8,814 | $ | (69,611 | ) | $ | (14,715 | ) | |||||||
| Net income (loss) per share |
|||||||||||||||||||
| Basic |
$ | 0.80 | $ | 0.94 | $ | 0.60 | $ | (4.73 | ) | $ | (1.00 | ) | |||||||
| Diluted |
$ | 0.78 | $ | 0.92 | $ | 0.60 | $ | (4.73 | ) | $ | (1.00 | ) | |||||||
| Shares used in computing net income (loss) per share |
|||||||||||||||||||
| Basic |
13,798 | 14,227 | 14,569 | 14,707 | 14,771 | ||||||||||||||
| Diluted |
14,047 | 14,521 | 14,769 | 14,707 | 14,771 | ||||||||||||||
25
Table of Contents
| Year End | ||||||||||||||||||||
| 2005 | 2006 | 2007 | 2008 | 2009 | ||||||||||||||||
| (in thousands) | ||||||||||||||||||||
| Balance Sheet Data: |
||||||||||||||||||||
| Cash and cash equivalents |
$ | 4,705 | $ | 10,553 | $ | 7,343 | $ | 4,428 | $ | 8,623 | ||||||||||
| Total assets |
204,160 | 228,420 | 285,643 | 217,519 | 191,022 | |||||||||||||||
| Long-term debt, revolving credit facility and obligations under capital leases, including current portion |
706 | 338 | 16,107 | 26,526 | 16,038 | |||||||||||||||
| Total stockholders’ equity |
143,453 | 160,230 | 178,797 | 105,795 | 93,135 | |||||||||||||||
| Year End | ||||||||||||||||||||
| 2005 | 2006 | 2007 | 2008 | 2009 | ||||||||||||||||
| (in thousands) | ||||||||||||||||||||
| Other Data: |
||||||||||||||||||||
| Restaurants open at end of period (including managed restaurants) |
59 | 66 | 82 | 92 | 93 | |||||||||||||||
| Net cash provided by operating activities |
$ | 30,158 | $ | 34,427 | $ | 35,231 | $ | 27,358 | $ | 22,740 | ||||||||||
| Net cash used in investing activities |
(21,416 | ) | (30,314 | ) | (56,001 | ) | (48,538 | ) | (8,401 | ) | ||||||||||
| Net cash provided by (used in) financing activities |
(4,488 | ) | 1,735 | 17,627 | 18,557 | (10,586 | ) | |||||||||||||
26
Table of Contents
| ITEM 7. | MANAGEMENT’S DISCUSSION AND ANALYSIS OF FINANCIAL CONDITION AND RESULTS OF OPERATIONS |
Overview
Our company was founded in 1972 with our acquisition of Jake’s Famous Crawfish in Portland, Oregon. As of December 26, 2009 we have expanded our restaurant base to 93 restaurants, including one restaurant operated pursuant to a management contract and six restaurants in Canada under The Boathouse name.
We have expanded our business by offering our guests a twice daily-printed menu in most of our locations, with a broad selection of affordable, quality fresh seafood in an upscale environment, serviced by knowledgeable and professional management and staff. Our revenues are generated by sales at our restaurants, including banquets. In 2009, food and non-alcoholic beverage sales accounted for approximately 70.4% of revenues and the remaining 29.6% of revenues was from the sale of alcoholic beverages. Included in our total sales for 2009, banquets accounted for approximately 9% of our revenues.
We utilize a broad-based marketing approach to drive guest traffic, which includes in-house marketing campaigns, including our preferred guest program and e-marketing programs. We have successfully grown our preferred guest program to over 100,000 primary members and over 74,000 secondary members since its inception in 2006 and our online marketing e-mail club database includes nearly 280,000 members.
We measure performance using key operating indicators such as comparable restaurant sales, comparable traffic counts, food and beverage costs, and restaurant operating expenses, with a focus on labor as a percentage of revenues, and total occupancy costs. We also track trends in average weekly revenues at both the restaurant level and on a consolidated basis as an indicator of our performance. The key financial measure used by management in evaluating our operating results is operating income. Operating income is calculated by deducting restaurant operating costs, general and administrative expenses, restaurant pre-opening costs, depreciation and amortization and other corporate costs from revenues. We monitor general and administrative expenses as a percentage of revenues against budgeted levels. Restaurant pre-opening costs are analyzed based on the number and timing of restaurant openings and by comparison to budgeted amounts, with an overall target of approximately $0.3 million to $0.4 million per restaurant opening.
Our most significant restaurant operating costs are food and beverage costs and labor and related employee benefits. We believe our national and regional presence allow us to achieve better quality and pricing on key products than most of our competitors. We closely monitor food and beverage costs and regularly review our selection of preferred vendors on the basis of several key metrics, including pricing. In addition, because we print our menu twice daily in most of our locations, we are able to adapt the seafood items we offer to changes in vendor pricing to optimize our revenue mix and mitigate the impact of cost increases in any particular seafood item by substituting a lower-cost alternative on our menu or by adjusting the price. Our employee benefits include health insurance, the cost of which continues to increase faster than the general rate of inflation. We monitor this cost and review strategies to effectively control increases but we are subject to the overall trend of increases in healthcare costs.
General and administrative expenses are controlled in absolute amounts and monitored as a percentage of revenues. We have incurred substantial training costs and made significant investments in infrastructure, including our information systems. We anticipate leveraging investments made in our people and systems, therefore we expect these expenses to decrease as a percentage of revenues over time as revenues increase.
Identification of appropriate new restaurant sites is essential to our growth strategy. We evaluate and invest in new restaurants based on site-specific projected returns on investment. We believe our restaurant model and flexible real estate strategy provide us with continued opportunities to find attractive real estate locations on favorable terms. We evaluate acquisition opportunities as they arise, paying particular attention to how restaurants or restaurant groups would fit with our existing restaurants and our business plan.
27
Table of Contents
Strategic Focus and Operating Outlook
Our primary business focus for more than 38 years has been to consistently offer a broad selection of high quality, fresh seafood, which we believe commands strong loyalty from our guests. We have successfully expanded our McCormick & Schmick’s seafood restaurant concept throughout the United States and have competed effectively with both national and regional restaurant chains as well as with local operators.
Our objective is to continue to prudently expand the McCormick & Schmick’s seafood restaurant base in existing and new markets. Our plan for 2010 includes the opening of two restaurants. Based on capital availability and depending on economic conditions, we may open additional restaurants in new or existing markets in 2010. In addition to new restaurant growth, we are committed to maximizing comparable restaurant sales and guest counts as well as restaurant level operating margins.
We continue to consider the possibility of expanding the Boathouse Restaurants concept in Canada, as well as the possibility of utilizing it as a complementary concept within the United States.
We believe we have the opportunity to build revenues through new restaurant development and building traffic at existing restaurants. We believe we have the opportunity to increase profitability through the opening of new restaurants, as well as operating existing restaurants more efficiently.
Results of Operations
Our operating results for the fiscal years 2007, 2008 and 2009 are expressed as a percentage of revenues below:
| 2007 | 2008 | 2009 | |||||||
| Revenues |
100.0 | % | 100.0 | % | 100.0 | % | |||
| Food and beverage |
29.1 | % | 30.1 | % | 29.4 | % | |||
| Labor |
31.4 | % | 32.2 | % | 32.5 | % | |||
| Operating |
15.3 | % | 15.7 | % | 15.1 | % | |||
| Occupancy |
8.9 | % | 9.4 | % | 10.5 | % | |||
| Total restaurant operating costs |
84.7 | % | 87.5 | % | 87.6 | % | |||
| General and administrative expenses |
6.2 | % | 5.4 | % | 5.6 | % | |||
| Restaurant pre-opening costs |
1.3 | % | 1.1 | % | 0.3 | % | |||
| Depreciation and amortization |
3.3 | % | 3.8 | % | 4.7 | % | |||
| Impairment, restructuring, and other charges |
1.5 | % | 21.5 | % | 5.7 | % | |||
| Total costs and expenses |
97.0 | % | 119.3 | % | 103.8 | % | |||
| Operating income (loss) |
3.0 | % | (19.3 | )% | (3.8 | )% | |||
| Interest expense (income), net |
(0.1 | )% | 0.3 | % | 0.5 | % | |||
| Write off of loan transaction costs |
— | 0.1 | % | — | |||||
| Other income, net |
— | (0.1 | )% | — | |||||
| Income (loss) before income taxes |
3.1 | % | (19.6 | )% | (4.3 | )% | |||
| Income tax expense (benefit) |
0.6 | % | (1.8 | )% | (0.2 | )% | |||
| Net income (loss) |
2.5 | % | (17.8 | )% | (4.1 | )% | |||
Description of Terms
Revenues consist of revenues from comparable restaurants, new restaurants and a management agreement. For purposes of comparable restaurant sales, a restaurant is included in the comparable restaurant base in the first full year following the eighteenth month of operations. New restaurant revenues include revenues from restaurants we opened during the period under discussion.
28
Table of Contents
Restaurant operating costs consist of:
| • | food and beverage costs; |
| • | labor costs, consisting of restaurant management salaries, hourly staff payroll and other payroll-related items including taxes and fringe benefits; |
| • | operating costs, consisting of advertising, maintenance, utilities, insurance, bank and credit card charges, and any other restaurant level expenses; and |
| • | occupancy costs, consisting of both fixed and variable portions of rent, common area maintenance charges, property insurance premiums, and real property taxes. |
General and administrative expenses consist of expenses associated with corporate administrative functions that support development and restaurant operations and provide an infrastructure to support future growth, including management and staff salaries, employee benefits, travel, legal and professional fees, technology and market research.
Restaurant pre-opening costs, which are expensed as incurred, consist of costs incurred prior to opening a new restaurant and are comprised principally of manager salaries and relocation, employee payroll and related training costs for new employees, including practice and rehearsal of service activities and local marketing costs. Restaurant pre-opening costs also include non-cash rent expense during the construction period.
Depreciation and amortization consists of depreciation of equipment and amortization of leasehold improvements and capitalized loan costs.
Impairment, restructuring, and other charges consist of impairments of long lived assets, impairments of goodwill and trademarks, restructuring charges, termination benefits paid to employees and cost incurred to exit restaurants.
Fiscal Year ends on the last Saturday in December. All of the fiscal years 2007, 2008 and 2009 were comprised of 52 weeks.
Financial Performance Overview
The following are highlights of our financial performance for fiscal 2009 compared to fiscal 2008:
| • | Revenues decreased 7.8% to $360.1 million from $390.7 million |
| • | Comparable restaurant sales decreased 15.7% |
| • | Comparable restaurant traffic decreased 14.0% |
| • | Operating loss of $13.7 million compared to operating loss of $75.4 million. Included in operating loss for 2009 were impairment, restructuring, and other charges of $20.4 million, including the impairment of long-lived assets at eight restaurants. In fiscal 2008, significant non-cash items in operating loss included impairment and restructuring charges of $83.9 million, for the impairment of trademarks and tradenames, goodwill, and long-lived assets at two restaurants. |
| • | Net loss of $14.7 million compared to net loss of $69.6 million |
| • | Diluted net loss per share of $1.00 compared to diluted net loss per share of $4.73 |
29
Table of Contents
Revenues and Restaurant Operating Costs
The following table sets forth revenues and restaurant operating costs, including food and beverage, labor, operating and occupancy costs from our consolidated statements of operations.
| Year Ended | Change | |||||||||||
| December 27, 2008 |
December 26, 2009 |
|||||||||||
| $ | % | |||||||||||
| (in thousands) | ||||||||||||
| Revenues |
$ | 390,718 | $ | 360,129 | (30,589 | ) | (7.8 | )% | ||||
| Restaurant operating costs |
||||||||||||
| Food and beverage |
$ | 117,642 | $ | 106,030 | (11,612 | ) | (9.9 | )% | ||||
| Labor |
125,811 | 117,194 | (8,617 | ) | (6.8 | )% | ||||||
| Operating |
61,375 | 54,441 | (6,934 | ) | (11.3 | )% | ||||||
| Occupancy |
36,874 | 37,690 | 816 | 2.2 | % | |||||||
| Total restaurant operating costs |
$ | 341,702 | $ | 315,355 | (26,347 | ) | (7.7 | )% | ||||
Revenues. Revenues decreased by $30.6 million, or 7.8%, to $360.1 million in 2009 from $390.7 million in 2008. This decrease was primarily attributable to a 15.7% decrease in comparable restaurant sales, which was partially offset by increased sales from restaurants not included in the comparable base and an increase in gift card breakage income. We had a total of 4,791 store operating weeks for 2009 compared to a total of 4,444 store operating weeks for 2008. We estimate that our 15.7% decrease in comparable sales was a result of a 14.0% decrease in traffic, which was coupled with a decrease in net pricing of 1.7%. The decrease in our net pricing and product mix is a result of our strategic initiative to increase the value proposition for our guests and drive traffic by decreasing our average check.
Food and Beverage Costs. Food and beverage costs decreased $11.6 million, or 9.9%, to $106.0 million from $117.6 million. This decrease was primarily due to lower restaurant sales. Food and beverage costs as a percentage of revenues decreased to 29.4% from 30.1%, primarily due to operating efficiencies related to food costs as a result of our increased menu management, careful operating practices, local buying and the benefit from more favorable commodity pricing. The decrease in food and beverage cost as a percentage of revenues was also impacted by the increase in gift card breakage income.
Labor Costs. Labor costs decreased $8.6 million, or 6.8%, to $117.2 million from $125.8 million. The decrease was primarily due to decreased staffing as a result of declines in guest traffic. Labor costs as a percentage of revenues increased to 32.5% from 32.2%, primarily due to the deleveraging of fixed labor costs. Deleveraging occurs when sales decline and fixed costs have a relatively larger impact as a percentage of revenues.
Operating Costs. Operating costs decreased $6.9 million, or 11.3%, to $54.4 million from $61.4 million. The decrease was primarily due to lower advertising costs, janitorial costs, and credit card fees. Operating costs as a percentage of revenues decreased to 15.1% from 15.7%, primarily due to decreases in advertising costs, janitorial costs and renewals cost, which includes the costs associated with the replenishment of glassware, dishware and silverware at our restaurants.
Occupancy Costs. Occupancy costs increased $0.8 million, or 2.2%, to $37.7 million from $36.9 million. The increase was primarily due to the net increase of the company-owned restaurants added since December 27, 2008. Occupancy costs as a percentage of revenues increased to 10.5% from 9.4%, primarily due to deleveraging of fixed costs at the comparable restaurants.
30
Table of Contents
General and Administrative Expenses, Restaurant Pre-Opening Costs, Depreciation and Amortization and Impairment, Restructuring, and Other Charges
The following table sets forth general and administrative, restaurant pre-opening, depreciation and amortization, and impairment, restructuring, and other charges from our consolidated statements of operations.
| Year Ended | Change | |||||||||||
| December 27, 2008 |
December 26, 2009 |
|||||||||||
| $ | % | |||||||||||
| (in thousands) | ||||||||||||
| General and administrative expenses |
$ | 21,026 | $ | 20,168 | (858 | ) | (4.1 | )% | ||||
| Restaurant pre-opening costs |
4,428 | 1,101 | (3,327 | ) | (75.1 | )% | ||||||
| Depreciation and amortization |
15,043 | 16,789 | 1,746 | 11.6 | % | |||||||
| Impairment, restructuring and other charges |
83,913 | 20,388 | (63,525 | ) | (75.7 | )% | ||||||
General and Administrative Expenses. General and administrative expenses decreased $0.9 million, or 4.1%, to $20.2 million from $21.0 million, primarily due to lower travel costs and share-based compensation, partially offset by higher legal fees, professional consultant fees, and wages. General and administrative expenses as a percentage of revenues increased to 5.6% from 5.4%, primarily due to deleveraging, coupled with increased legal fees, wages, and professional consultant fees, partially offset by decreased share-based compensation and travel costs as a percentage of revenues.
Restaurant Pre-Opening Costs. Restaurant pre-opening costs were $1.1 million compared to $4.4 million in the prior year, primarily due to a decrease in the number of new restaurants added, coupled with the timing of restaurants under construction.
Depreciation and Amortization. Depreciation and amortization increased $1.7 million, or 11.6%, primarily due to the two company-owned restaurants added since December 27, 2008. Depreciation and amortization expense as a percentage of revenues increased to 4.7% in 2009 from 3.8% in 2008, primarily due to the deleveraging, coupled with the two company-owned restaurants added since December 27, 2008. In fiscal 2010, we expect depreciation and amortization to decrease both in dollars and as a percentage of revenues as a result of the impairment charges incurred during fiscal 2009.
Impairment, Restructuring and Other Charges. Long-lived assets, such as property and equipment, and purchased intangibles subject to amortization, are reviewed for impairment whenever events or changes in circumstances indicate that the carrying amount of an asset may not be recoverable. Our assessment of recoverability of property and equipment is performed on a restaurant-by-restaurant basis. Recoverability of assets to be held and used is measured by a comparison of the carrying amount of an asset to the estimated undiscounted future cash flows expected to be generated by the asset. In evaluating long-lived restaurant assets for impairment, we consider a number of factors including a current period operating or cash flow loss combined with a history of operating or cash flow losses and an undiscounted cash flow projection associated with the use of the underlying long-lived asset. In these situations, we evaluate undiscounted cash flow projections in conjunction with qualitative factors and future operating plans. If the carrying amount of an asset exceeds the estimated undiscounted future cash flows, an impairment charge is recognized by the amount by which the carrying amount of the asset exceeds the fair value of the asset.
Our impairment assessment process requires the use of estimates and assumptions regarding future cash flows and operating outcomes, which are subject to a significant degree of judgment based on experience and knowledge. These estimates can be significantly impacted by changes in the economic environment, real estate market conditions and overall operating performance. Impairment charges could be triggered in the future if expected restaurant performance will not support the net book value of the underlying long-lived assets on a future undiscounted cash flow basis or if management decides to close that location.
31
Table of Contents
During the fourth quarter of 2009, we experienced a triggering event for an impairment evaluation for long-lived assets. The triggering event that resulted in the fourth quarter impairment evaluation was due to the continued decline in the economic environment which disproportionately affected certain restaurants, coupled with the shortfall in anticipated fourth quarter improvements for those restaurants, which ultimately led to the lowering of future anticipated results for the affected restaurants. We recorded impairment charges of $19.8 million including the impairment of fixtures, equipment, and leasehold improvements at eight of our restaurants. We used the market participant pricing approach to estimate the fair value of land, building, fixtures and equipment, and leasehold improvements, which estimates what a potential buyer would pay today. When available, current market information, like comparative sales price, was used to determine value. When market information was not readily available, the inputs were based on our understanding of market conditions and the experience of the management team. Actual results could differ significantly from the Company’s estimates.
Restructuring charges in the amount of $0.6 million were incurred related to severance and other termination benefits paid to employees during the first three quarters of 2009.
In 2008, we recorded impairment, restructuring, and other charges of $83.9 million related to the impairment of our trademarks and tradenames, goodwill, and fixtures, equipment, and leasehold improvements at two restaurants, we also incurred restructuring charges of $0.5 million.
A summary of impairment, restructuring and other charges incurred were as follows:
| Year Ended | ||||||
| December 27, 2008 |
December 26, 2009 | |||||
| (in millions) | ||||||
| Impairment of goodwill |
$ | 26.2 | $ | — | ||
| Impairment of long lived assets |
2.8 | 19.8 | ||||
| Impairment of trademarks and tradenames |
54.4 | — | ||||
| Restructuring and other charges |
0.5 | 0.6 | ||||
| Total impairment, restructuring and other charges |
$ | 83.9 | $ | 20.4 | ||
Interest Expense, net, Write Off of Loan Transaction Costs, Other Income, net, Income Tax Benefit and Net Loss
The following table sets forth interest expense, net, write off of loan transaction costs, other income, net, income tax benefit and net loss from our consolidated statements of operations.
| Year Ended | Change | ||||||||||||||
| December 27, 2008 |
December 26, 2009 |
||||||||||||||
| $ | % | ||||||||||||||
| (in thousands) | |||||||||||||||
| Interest expense, net |
$ | 1,173 | $ | 1,752 | $ | 579 | 49.4 | % | |||||||
| Write off of loan transaction costs |
376 | — | (376 | ) | (100.0 | )% | |||||||||
| Other income, net |
(308 | ) | (53 | ) | 255 | 82.8 | % | ||||||||
| Loss before income taxes |
(76,635 | ) | (15,371 | ) | 61,264 | 79.9 | % | ||||||||
| Income tax benefit |
(7,024 | ) | (656 | ) | 6,368 | 90.7 | % | ||||||||
| Net loss |
$ | (69,611 | ) | $ | (14,715 | ) | 54,896 | 78.9 | % | ||||||
Interest Expense, net. Interest expense, net was an expense of $1.8 million in 2009 compared to an expense of $1.2 million in 2008. The increase in the interest expense was primarily due to the decrease in capitalized interest as compared to the prior year of $0.4 million, due to fewer restaurants under construction in 2009, coupled with an increase in the interest rate margin fees under our amended revolving credit facility as compared to the interest rate margin fees under the revolving credit facility prior to the January 29, 2009 amendment.
32
Table of Contents
Write Off of Loan Transaction Costs. During 2008 we wrote off loan transaction costs in the amount of $0.4 million due to the amendment of our credit facility.
Other Income, Net. Other income, net was $0.1 million, compared to $0.3 million for the year ended December 27, 2008.
Income Tax Benefit. The provision for income taxes was a benefit of $0.7 million in 2009, compared to a benefit of $7.0 million in 2008. Our effective annualized tax rate in 2009 was 4.3% compared to 9.2% in 2008. The change in our effective annual tax rate was primarily a result of the deferred tax asset valuation allowance, since we are unable to record the tax benefit of increases to our gross deferred tax asset. Our effective tax rate is low due to modest cash taxes payable and minimal change to our net deferred tax accounts.
Net Loss. The change in net loss was $54.9 million, to a net loss of $14.7 million from net loss of $69.6 million, was primarily due to the decrease in asset impairment charges of $63.5 million and a decrease in restaurant pre-opening costs, which was partially offset by the decrease in revenues.
Financial Performance Overview
The following are highlights of our financial performance for fiscal 2008 compared to fiscal 2007:
| • | Revenues increased 8.9% to $390.7 million from $358.6 million |
| • | Comparable restaurant sales decreased 7.5% |
| • | Operating loss of $75.4 million compared to operating income of $10.7 million. Included in operating loss are impairment/restructuring charges of $83.9 million, and includes the impairment of goodwill, trademarks and long-lived assets at two restaurants, and a restructuring charge |
| • | Net loss of $69.6 million compared to net income of $8.8 million |
| • | Diluted net loss per share of $4.73 compared to diluted net income per share of $0.60 |
Revenues and Restaurant Operating Costs
The following table sets forth revenues and restaurant operating costs, including food and beverage, labor, operating and occupancy costs from our consolidated statements of operations.
| Year Ended | Change | ||||||||||
| December 29, 2007 |
December 27, 2008 |
||||||||||
| $ | % | ||||||||||
| (in thousands) | |||||||||||
| Revenues |
$ | 358,647 | $ | 390,718 | 32,071 | 8.9 | % | ||||
| Restaurant operating costs |
|||||||||||
| Food and beverage |
$ | 104,468 | $ | 117,642 | 13,174 | 12.6 | % | ||||
| Labor |
112,503 | 125,811 | 13,308 | 11.8 | % | ||||||
| Operating |
54,892 | 61,375 | 6,483 | 11.8 | % | ||||||
| Occupancy |
32,048 | 36,874 | 4,826 | 15.1 | % | ||||||
| Total restaurant operating costs |
$ | 303,911 | $ | 341,702 | 37,791 | 12.4 | % | ||||
Revenues. Revenues increased by $32.1 million, or 8.9%, to $390.7 million in 2008 from $358.6 million in 2007. This increase was primarily attributable to revenues of $26.8 million generated by the eleven company-owned restaurants added since December 29, 2007, and a $30.8 million increase in revenues in 2008 from the seventeen restaurants added in 2007, partially offset by a 7.5% decrease in comparable restaurant sales. We estimate that our 7.5% decrease in comparable sales was a result of a 9.9% decrease in traffic, which was partially offset by increased pricing of 1.7% and an increase of 0.7% due to changes in product mix.
33
Table of Contents
Food and Beverage Costs. Food and beverage costs increased $13.2 million, or 12.6%, primarily due to the eleven company-owned restaurants added since December 29, 2007. Food and beverage costs as a percentage of revenues increased to 30.1% from 29.1%, primarily due to the higher mix of new restaurants, which typically run higher food and beverage costs as a percentage of revenues during the first 18 months of operation, as well as an increase in input costs primarily due to inflation of commodity costs.
Labor Costs. Labor costs increased $13.3 million, or 11.8%, primarily due to the eleven company-owned restaurants added since December 29, 2007. Labor costs as a percentage of revenues increased to 32.2% from 31.4%, primarily due to the deleveraging of fixed labor costs at the comparable restaurants, coupled with higher mix of new restaurants, which typically run higher labor as a percentage of revenues. Deleveraging occurs when sales decline and fixed costs have a relatively larger impact as a percentage of revenues.
Operating Costs. Operating costs increased $6.5 million, or 11.8%, primarily due to the eleven company-owned restaurants added since December 29, 2007. Operating costs as a percentage of revenues increased to 15.7% from 15.3%, primarily due to increases in utilities and renewals cost, which includes the costs associated with the replenishment of glassware, dishware and silverware at our restaurants.
Occupancy Costs. Occupancy costs increased $4.8 million, or 15.1%, primarily due to the eleven company-owned restaurants added since December 29, 2007. Occupancy costs as a percentage of revenues increased to 9.4% from 8.9%, primarily due to deleveraging of fixed costs at the comparable restaurants.
General and Administrative Expenses, Restaurant Pre-Opening Cost, Depreciation and Amortization and Impairment/Restructuring Charges
The following table sets forth general and administrative, restaurant pre-opening, depreciation and amortization, and impairment/restructuring charges from our consolidated statements of operations.
| Year Ended | Change | |||||||||||
| December 29, 2007 |
December 27, 2008 |
|||||||||||
| $ | % | |||||||||||
| (in thousands) | ||||||||||||
| General and administrative expenses |
$ | 22,166 | $ | 21,026 | (1,140 | ) | (5.1 | )% | ||||
| Restaurant pre-opening costs |
4,527 | 4,428 | (99 | ) | (2.2 | )% | ||||||
| Depreciation and amortization |
11,940 | 15,043 | 3,103 | 26.0 | % | |||||||
| Impairment/restructuring charges |
5,427 | 83,913 | 78,486 | * | ||||||||
| * | Not meaningful |
General and Administrative Expenses. General and administrative expenses decreased $1.1 million, or 5.1%, to $21.0 million from $22.2 million, primarily due to lower legal fees and share-based compensation, partially offset by the increases in costs associated with the eleven company-owned restaurants added since December 29, 2007. General and administrative expenses as a percentage of revenues decreased to 5.4% from 6.2%, primarily due to decreased legal fees.
Restaurant Pre-Opening Costs. Restaurant pre-opening costs were $4.4 million compared to $4.5 million in the prior year, primarily due to the timing of restaurants opening and restaurants under construction.
Depreciation and Amortization. Depreciation and amortization increased $3.1 million, or 26.0%, primarily due to the eleven company-owned restaurants added since December 29, 2007. Depreciation and amortization expense as a percentage of revenues increased to 3.8% in 2008 from 3.3% in 2007, primarily due to the eleven company-owned restaurants added since December 29, 2007.
Impairment/Restructuring Charges. Long-lived assets, such as property and equipment, and purchased intangibles subject to amortization, are reviewed for impairment whenever events or changes in circumstances
34
Table of Contents
indicate that the carrying amount of an asset may not be recoverable. Our assessment of recoverability of property and equipment is performed on a restaurant-by-restaurant basis. Recoverability of assets to be held and used is measured by a comparison of the carrying amount of an asset to its estimated undiscounted future cash flows expected to be generated by the asset. If the carrying amount of an asset exceeds its estimated undiscounted future cash flows, an impairment charge is recognized by the amount by which the carrying amount of the asset exceeds the fair value of the asset.
In our most recent impairment evaluation for long-lived assets, we identified assets that were determined to be impaired as of December 27, 2008. We recorded an impairment charge of $2.8 million related to the impairment of fixtures, equipment, and leasehold improvements at two of our restaurants. A restructuring charge in the amount of $0.5 million was incurred related to the closure of one of our restaurants. The restructuring charge was related to exit costs, including the estimated liability on our operating lease that terminates in June, 2016. All of the leasehold improvements related to another restaurant were written off in conjunction with the impairment charge recorded in the year ended December 29, 2007.
In 2007, we recorded an impairment charge of $5.4 million related to the impairment of fixtures, equipment, and leasehold improvements at three restaurants.
We consider the relationship between our market capitalization and our book value, among other factors, when reviewing for indicators of impairment. Goodwill impairment tests are based on determining the fair value based on our judgments and assumptions using income and market valuation approaches to arrive at a conclusion. Goodwill represents the excess of the purchase price over the fair value of the net assets of the business acquired. Other intangible assets deemed to have indefinite lives include trademarks and tradenames used in the advertising and marketing of our restaurants. Other intangible assets deemed to have definite lives are amortized over their estimated useful lives.
The impairment evaluation for goodwill and indefinite lived intangible assets, which for us are trademarks and tradenames, is conducted during the fourth quarter of each year, or more frequently if events or changes in circumstances indicate that an asset might be impaired. The valuation approaches are subject to key judgments and assumptions that are sensitive to change such as judgments and assumptions about our appropriate revenue growth rates, operating margins, weighted average cost of capital (“WACC”), and comparable company market multiples. When developing these key judgments and assumptions, we consider economic, operational and market conditions that could impact our fair value. However, estimates are inherently uncertain and represent only our reasonable expectations regarding future developments.
We consider the relationship between our market capitalization and our book value, among other factors, when reviewing for indicators of impairment. We believe that the weakness in the U.S. residential housing and financial markets are principal factors in the prolonged decline in the stock markets, and as a result, the decline in our market capitalization as compared to our book value. As of December 27, 2008, our fair value was estimated to approximate our market capitalization plus a reasonable control premium. Our adjusted market capitalization is based the average closing stock price for the 15 days of trading prior to the year ended December 27, 2008. We believe the control premium represents the estimated amount an investor would pay for our equity securities to obtain a controlling interest. The criteria used to derive the control premium included calculated control premiums for recent transactions of companies within our peer group.
We completed our most recent impairment test on balances as of December 27, 2008, and determined that there was an impairment related to trademarks and tradenames of $54.4 million, and goodwill of $26.2 million, based primarily on the difference between our adjusted market capitalization and the carrying value of our assets. There were no impairments in 2007 related to goodwill, trademarks and tradenames.
35
Table of Contents
A summary of impairment/restructuring charges incurred were as follows:
| Year Ended | ||||||
| December 29, 2007 |
December 27, 2008 | |||||
| (in millions) | ||||||
| Impairment of goodwill |
$ | — | $ | 26.2 | ||
| Impairment of long lived assets |
5.4 | 2.8 | ||||
| Impairment of trademarks and tradenames |
— | 54.4 | ||||
| Restructuring charge |
— | 0.5 | ||||
| Total impairment/restructuring charges |
$ | 5.4 | $ | 83.9 | ||
Interest Income, net, Write Off of Loan Transaction Costs, Other Income, net, Income Tax Expense (Benefit) and Net Income (Loss)
The following table sets forth interest income, net, write off of loan transaction costs, other income, net, income tax expense (benefit) and net income (loss) from our consolidated statements of operations.
| Year Ended | Change | ||||||||||||||
| December 29, 2007 |
December 27, 2008 |
||||||||||||||
| $ | % | ||||||||||||||
| (in thousands) | |||||||||||||||
| Interest expense (income), net |
$ | (226 | ) | $ | 1,173 | $ | 1,399 | * | |||||||
| Write off of loan transaction costs |
— | 376 | 376 | 100.0 | % | ||||||||||
| Other income, net |
— | (308 | ) | (308 | ) | (100.0 | )% | ||||||||
| Income (loss) before income taxes |
$ | 10,902 | $ | (76,635 | ) | (87,537 | ) | * | |||||||
| Income tax expense (benefit) |
2,088 | (7,024 | ) | (9,112 | ) | * | |||||||||
| Net income (loss) |
$ | 8,814 | $ | (69,611 | ) | (78,425 | ) | * | |||||||
| * | Not meaningful |
Interest Expense (Income), net. Interest expense (income), net was an expense of $1.2 million in 2008 as compared to an income of $0.2 million in 2007. The increase in the interest expense was primarily due to the increase in the average outstanding balance on the revolving credit facility of $12.0 million compared to the average outstanding balance of the credit facility for the fifty-two weeks ended December 29, 2007 of $10.0 million, coupled with lower interest income.
Write Off of Loan Transaction Costs. A write off of loan transaction costs in the amount of $0.4 million was incurred in the fourth quarter due to the amendment of our credit facility which decreased our available borrowings.
Other Income, Net. Other income, net was $0.3 million due to business interruption insurance proceeds. The business interruption was caused by weather related damage to our location at the CNN Center in Atlanta, GA, which caused the restaurant to close briefly for repairs.
Income Tax Expense (Benefit). The provision for income tax was a benefit of $7.0 million in 2008, compared to tax expense of $2.1 million in 2007. Our effective annual tax rate in 2008 was 9.2% compared to 19.2% in 2007. The change in our effective annual tax rate was primarily a result of the deferred tax asset valuation allowance of $24.0 million recorded in 2008.
Net Income (Loss). The change in net income (loss) was $78.4 million, to a net loss of $69.7 million from net income of $8.8 million in the year ended December 27, 2008, primarily due to the asset impairment charges of $83.9 million.
36
Table of Contents
Potential Fluctuations in Quarterly Results and Seasonality
Our quarterly operating results may fluctuate significantly as a result of a variety of factors. See Item 1A, “Risk Factors.”
Our business is also subject to seasonal fluctuations. Historically, revenues in most of our restaurants have been higher during the spring months and winter holiday season. For the reasons and factors discussed above, our quarterly and annual operating results and comparable restaurant sales may fluctuate significantly. Accordingly, results for any one quarter are not necessarily indicative of results to be expected for any other quarter or for any year and comparable restaurant sales for any particular future period may decrease. In the future, operating results may fall below the expectations of securities analysts and investors. If this occurs, the price of our common stock would likely decrease.
37
Table of Contents
The following table sets forth quarterly unaudited operating results in each of the 2008 and 2009 fiscal quarters:
| 2008 | 2009 | |||||||||||||||||||||||||||||||
| Q1 | Q2 | Q3 | Q4 | Q1 | Q2 | Q3 | Q4 | |||||||||||||||||||||||||
| (in thousands, except per share data) | ||||||||||||||||||||||||||||||||
| Revenues |
$ | 92,337 | $ | 99,699 | $ | 99,897 | $ | 98,785 | $ | 91,894 | 92,742 | 86,312 | 89,181 | |||||||||||||||||||
| Restaurant operating costs |
||||||||||||||||||||||||||||||||
| Food and beverage |
28,071 | 30,038 | 30,117 | 29,416 | 27,696 | 27,517 | 25,053 | 25,764 | ||||||||||||||||||||||||
| Labor |
30,397 | 32,095 | 32,403 | 30,916 | 30,489 | 30,269 | 27,761 | 28,675 | ||||||||||||||||||||||||
| Operating |
14,501 | 15,384 | 15,674 | 15,816 | 14,340 | 14,158 | 13,131 | 12,812 | ||||||||||||||||||||||||
| Occupancy |
8,798 | 9,297 | 9,263 | 9,516 | 9,489 | 9,501 | 9,200 | 9,500 | ||||||||||||||||||||||||
| Total restaurant operating costs |
81,767 | 86,814 | 87,457 | 85,664 | 82,014 | 81,445 | 75,145 | 76,751 | ||||||||||||||||||||||||
| General and administrative expenses |
5,569 | 5,138 | 5,169 | 5,150 | 5,845 | 4,947 | 4,826 | 4,550 | ||||||||||||||||||||||||
| Restaurant pre-opening costs |
1,184 | 692 | 1,460 | 1,092 | 562 | 80 | 109 | 350 | ||||||||||||||||||||||||
| Depreciation and amortization |
3,394 | 3,652 | 3,932 | 4,065 | 4,080 | 4,293 | 4,241 | 4,175 | ||||||||||||||||||||||||
| Impairment, restructuring, and other charges |
— | 452 | — | 83,461 | 181 | 371 | 42 | 19,794 | ||||||||||||||||||||||||
| Total costs and expenses |
91,914 | 96,748 | 98,018 | 179,432 | 92,682 | 91,136 | 84,363 | 105,620 | ||||||||||||||||||||||||
| Operating income (loss) |
423 | 2,951 | 1,879 | (80,647 | ) | (788 | ) | 1,606 | 1,949 | (16,439 | ) | |||||||||||||||||||||
| Interest expense (income), net |
329 | 87 | 278 | 480 | 378 | 469 | 469 | 436 | ||||||||||||||||||||||||
| Write off of loan transaction costs |
— | — | — | 376 | — | — | — | — | ||||||||||||||||||||||||
| Other income, net |
(75 | ) | (184 | ) | (50 | ) | — | 14 | 13 | (37 | ) | (43 | ) | |||||||||||||||||||
| Income (loss) before income taxes |
169 | 3,048 | 1,651 | (81,503 | ) | (1,180 | ) | 1,124 | 1,517 | (16,832 | ) | |||||||||||||||||||||
| Income tax expense (benefit) |
51 | 691 | 291 | (8,057 | ) | (36 | ) | (64 | ) | 206 | (762 | ) | ||||||||||||||||||||
| Net income (loss) |
$ | 118 | $ | 2,357 | $ | 1,360 | $ | (73,446 | ) | $ | (1,144 | ) | 1,188 | 1,311 | (16,070 | ) | ||||||||||||||||
| Net income (loss) per share |
||||||||||||||||||||||||||||||||
| Basic |
$ | 0.01 | $ | 0.16 | $ | 0.09 | $ | (4.99 | ) | $ | (0.08 | ) | $ | 0.08 | $ | 0.09 | $ | (1.09 | ) | |||||||||||||
| Diluted |
$ | 0.01 | $ | 0.16 | $ | 0.09 | $ | (4.99 | ) | $ | (0.08 | ) | $ | 0.08 | $ | 0.09 | $ | (1.09 | ) | |||||||||||||
| Shares used in computing net income (loss) per share |
||||||||||||||||||||||||||||||||
| Basic |
14,685 | 14,699 | 14,716 | 14,721 | 14,728 | 14,773 | 14,785 | 14,785 | ||||||||||||||||||||||||
| Diluted |
14,685 | 14,699 | 14,721 | 14,721 | 14,728 | 14,807 | 14,848 | 14,785 | ||||||||||||||||||||||||
Liquidity and Capital Resources
Our primary sources of liquidity are cash provided by operations and borrowings under our credit facility. Historically, our need for capital resources has been driven by our construction of new restaurants.
38
Table of Contents
The following table sets forth our sources and uses of cash:
| Year Ended | ||||||||||||
| 2007 | 2008 | 2009 | ||||||||||
| (in thousands) | ||||||||||||
| Net cash provided by operating activities |
$ | 35,231 | $ | 27,358 | $ | 22,740 | ||||||
| Net cash used in investing activities |
(56,001 | ) | (48,538 | ) | (8,401 | ) | ||||||
| Net cash provided by (used in) financing activities |
17,627 | 18,557 | (10,586 | ) | ||||||||
| Effect of exchange rate changes on cash and cash equivalents |
(67 | ) | (292 | ) | 442 | |||||||
| Net increase (decrease) in cash and cash equivalents |
$ | (3,210 | ) | $ | (2,915 | ) | $ | 4,195 | ||||
Net cash provided by operating activities was $22.7 million in 2009, compared to $27.4 million in 2008 and $35.2 million in 2007. The decrease in net cash provided by operating activities in 2009 compared to 2008 was primarily due to the change in net loss excluding non-cash impairment/restructuring charges, coupled with changes in working capital. The decrease in net cash provided by operating activities in 2008 compared to 2007 was primarily due to the change in net income (loss) excluding non-cash impairment/restructuring charges, coupled with changes in working capital.
Net cash used in investing activities was $8.4 million in 2009, $48.5 million in 2008, and $56.0 million in 2007. We use cash primarily to purchase property and equipment to open new restaurants, to purchase restaurants, and to upgrade and add capacity to existing restaurants. Net cash used in investing activities varied in the periods presented based on the number of new restaurants opened and existing restaurant capacity expanded during the period. Our net cash used in investing activities in 2009 and 2008 reflects $8.4 and $48.5 million, respectively, of expenditures related to restaurant construction costs. In 2007, we purchased all of the assets of The Boathouse Restaurants in Vancouver B.C. for $14.5 million. Purchases of property and equipment also include purchases of information technology systems and expenditures relating to our corporate headquarters.
Net cash used in financing activities was $10.6 million in 2009. Net cash provided by financing activities was $18.6 million in 2008 and $17.6 million in 2007. Net cash used in financing activities in 2009 was primarily the result of payments, net of borrowings, of $11.0 million on our revolving credit facility. Net cash provided by financing activities in 2008 was primarily the result of borrowings, net of payments, of $11.0 million on our revolving credit facility, coupled with deemed landlord financing contributions of $8.3 million. Net cash provided by financing activities in 2007 was primarily the result of borrowings, net of payments, of $13.0 million on our revolving credit facility, coupled with proceeds from exercised stock options of $4.1 million.
As of December 26, 2009, the outstanding balance on our revolving credit facility was $13.0 million. On January 29, 2009, we amended our revolving credit facility. In conjunction with the amendment, the maximum availability under the facility was adjusted from $150.0 million to $90.0 million, with an additional $50.0 million available at our request if specified conditions are met. The amended facility also makes certain financial covenants less restrictive, including the minimum fixed charge ratio and the maximum adjusted leverage ratio. The interest rate on U.S. borrowings is based on the financial institution’s base rate plus a margin between 0.25% and 1.50% or the Eurodollar rate plus a margin of 1.25% to 2.50%, and the interest rate on Canadian borrowings is based on the Canadian Eurodollar Rate plus a margin of 1.35% to 2.60%, with margins determined by certain financial ratios.
Under the revolving credit facility, we are required to comply with certain financial covenants, including a maximum adjusted leverage ratio, a minimum fixed charge ratio and a maximum growth capital expenditure. We were in compliance with these covenants as of December 26, 2009. As of December 26, 2009, our effective interest rate on our borrowings was 3.20%.
Under our revolving credit facility agreement, loans are collateralized by the stock of the subsidiaries of the Company and are scheduled to mature on December 28, 2012. The revolving credit facility agreement also
39
Table of Contents
provides for bank guarantees under standby letter of credit arrangements in the normal course of business operations. As of December 26, 2009 the maximum exposure under these standby letters of credit was $3.0 million. At December 26, 2009 we had $74.0 million available under our $90.0 million revolving credit facility, subject to the terms of the agreement.
We believe the net cash provided by operating activities and funds available from our revolving credit facility will be sufficient to satisfy our working capital and capital expenditure requirements, including restaurant construction, pre-opening costs, and potential initial operating losses related to new restaurants, for at least the next 12 months.
Off-Balance Sheet Arrangements
As of December 26, 2009, we had no off-balance sheet arrangements, as defined in Item 303(a)(4) of the Securities and Exchange Commission Regulation S-K.
Contractual Obligations
Our contractual obligations consist of long-term debt, operating leases (primarily restaurant leases) and capital leases. We lease a majority of our restaurants and our corporate offices under non-cancelable operating leases. Most of our restaurants have an initial operating lease term of 10 to 20 years and one to three, five-year renewal options. Contractual obligations as of December 26, 2009 were as follows:
| Payments Due by Period | |||||||||||||||
| Total | Less than 1 year | 1-3 years | 4-5 years | More than 5 years | |||||||||||
| (in thousands) | |||||||||||||||
| Long-term debt |
$ | 13,000 | $ | — | $ | 13,000 | $ | — | $ | — | |||||
| Operating leases |
235,341 | 28,029 | 55,638 | 49,017 | 102,657 | ||||||||||
| Capital leases, including interest |
4,113 | 240 | 3,873 | — | — | ||||||||||
| Purchase obligations(1) |
2,232 | 1,957 | 275 | — | — | ||||||||||
| Total |
$ | 254,686 | $ | 30,226 | $ | 72,786 | $ | 49,017 | $ | 102,657 | |||||
| (1) | Purchase obligations include commitments related to the construction of new restaurants and other non-food supply and service agreements. |
The amounts presented in the table above may not necessarily reflect our actual future cash funding requirements, because the actual timing of the future payments made may vary from the stated contractual obligation. In addition, due to the uncertainty with respect to the timing of future cash flows associated with our unrecognized tax benefits at December 26, 2009, we are unable to make reasonably reliable estimates of the period of cash settlement with the respective taxing authority. Therefore, $304,000 of unrecognized tax benefits have been excluded from the contractual obligations table above. Related to the unrecognized tax benefits not included in the table above, the Company has also recorded a liability for potential interest of $26,000.
Critical Accounting Policies and Use of Estimates
Our significant accounting policies are those that we believe are both important to the portrayal of our financial condition and results and require our most difficult, subjective or complex judgments, often as a result of the need to make estimates about the effect of matters that are inherently uncertain. We believe our critical accounting policies and estimates used in the preparation of our consolidated financial statements are the following:
Property and Equipment
Property and equipment are stated at cost less accumulated depreciation and amortization. Equipment consists primarily of restaurant equipment, furniture, fixtures and smallwares. Depreciation is calculated using
40
Table of Contents
the straight-line method over the estimated useful lives of the related assets. Equipment under capitalized leases are amortized over the shorter of the useful life of the asset or the length of the related lease term. Leasehold improvements are amortized using the straight-line method over the shorter of the lease term, or the estimated useful life of the asset. The lease term includes any period covered by a renewal option where the renewal is reasonably assured because failure to renew the lease would impose an economic penalty to the lessee. Repairs and maintenance are expensed as incurred; renewals and betterments are capitalized. Estimated useful lives are generally as follows: equipment—3 to 10 years; furniture and fixtures—5 to 10 years; buildings—39 years; and leasehold improvements—7 to 30 years. Judgments and estimates made by us related to the expected useful lives of these assets are affected by factors such as changes in economic conditions and changes in operating performance. If these assumptions change in the future, we may be required to record impairment charges for these assets.
Impairment of Long-Lived Assets
Long-lived assets, such as property and equipment, and purchased intangibles subject to amortization, are reviewed for impairment whenever events or changes in circumstances indicate that the carrying amount of an asset may not be recoverable. Our assessment of recoverability of property and equipment is performed on a restaurant-by-restaurant basis. Recoverability of assets to be held and used is measured by a comparison of the carrying amount of an asset to the estimated undiscounted future cash flows expected to be generated by the asset. In evaluating long-lived restaurant assets for impairment, we consider a number of factors including a current period operating or cash flow loss combined with a history of operating or cash flow losses and an undiscounted cash flow projection associated with the use of the underlying long-lived asset. In these situations, we evaluate undiscounted cash flow projections in conjunction with qualitative factors and future operating plans. If the carrying amount of an asset exceeds the estimated undiscounted future cash flows, an impairment charge is recognized by the amount by which the carrying amount of the asset exceeds the fair value of the asset.
Our impairment assessment process requires the use of estimates and assumptions regarding future cash flows and operating outcomes, which are subject to a significant degree of judgment based on experience and knowledge. These estimates can be significantly impacted by changes in the economic environment, real estate market conditions and overall operating performance. Impairment charges could be triggered in the future if expected restaurant performance will not support the net book value of the underlying long-lived assets on a future undiscounted cash flow basis or if management decides to close that location.
Insurance Liability
We maintain various insurance policies including workers’ compensation, employee health, and general liability. Pursuant to those policies, we are responsible for losses up to certain limits and are required to estimate a liability that represents our exposure for aggregate losses below those limits. This liability is based on management’s estimates of the costs to be incurred to settle known claims and claims not reported as of the balance sheet date. Our estimated liability is not discounted and is based on a number of assumptions and factors, including historical trends, actuarial assumptions, and economic conditions. If actual trends differ from our estimates, our financial results could be impacted. In addition, we may exceed our insurance coverage for specified matters. Our previous insurer has informed us it believes we have exhausted our insurance coverage with respect to claims arising in our 2004 coverage year. We disagree with this interpretation of our coverage, but we have taken this interpretation into account in connection with the charge we have taken related to our settlement of class action claims in California. See Item 3, “Legal Proceedings.”
Income Taxes
We account for income taxes under the asset and liability method, which requires the recognition of deferred tax assets and liabilities for the expected future tax consequences of events that have been included in
41
Table of Contents
the financial statements. Under this method, deferred tax assets and liabilities are determined based on the differences between the financial statement and tax basis of assets and liabilities using enacted tax rates in effect for the year in which the differences are expected to reverse. The effect of a change in tax rates on deferred tax assets and liabilities is recognized in income in the period that includes the enactment date.
We record net deferred tax assets to the extent we believe these assets will more likely than not be realized. In making such determination, we consider all available positive and negative evidence, including scheduled reversals of deferred tax liabilities, projected future taxable income, tax planning strategies and recent financial operations. Deferred tax assets are reduced by a valuation allowance if, based on the weight of available evidence, it is more likely than not that some portion or all of the deferred tax assets will not be realized.
We recognize interest and penalties related to unrecognized tax benefits within income tax expense in our consolidated statement of operations. Accrued interest and penalties are included within the related tax liability in the consolidated balance sheet.
Operating Leases
We generally operate our restaurants in leased premises. We record the minimum base rents for our operating leases on a straight-line basis over the life of the lease term, including option periods which are reasonably assured of renewal due to the presence of certain economic penalties. For purposes of calculating straight-line rents, the lease term commences on the date the lessee obtains control of the property, which is normally when the property is ready for normal tenant improvements (build-out-period). For certain leases we only have the right to exercise our option for renewal if certain sales targets are achieved at or near the renewal date. These renewal option periods have been included in the lease term when we determine at lease inception or at the acquisition date of the restaurant, if later, that the sales targets are non-substantive and achievement of such sales targets is virtually certain. The difference between rent expense calculated on a straight-line basis and rent paid is recorded as deferred rent liability.
We receive certain tenant improvement allowances which are considered lease incentives and are amortized as a reduction of rent expense over the lease term. Accordingly, we have recorded a deferred rent liability including tenant improvement allowances for the straight lining of rents and lease incentives, which is included in other long-term liabilities of $23.7 million and $26.3 million as of December 27, 2008 and December 26, 2009, respectively. Certain other landlord tenant improvement allowances received, depending on the specifics of the leased space and the lease agreement for the amounts paid for structural components during the construction period are recorded as construction in progress and the landlord tenant improvement allowances received are recorded as a landlord financing liability. Upon completion of construction for those leases that meet the criteria and for those leases that do not qualify for sale leaseback treatment, the landlord financing liability is amortized under the effective interest rate method over the lease term based on the rent payments designated in the lease agreement.
Share-Based Compensation
We determine the fair value of share-based payment awards on the date of grant using the Black-Scholes option-pricing model. The model is affected by our stock price as well as our assumptions regarding a number of complex and subjective variables, including but not limited to our expected stock price volatility over the term of the awards, life of the option, expected term of the option, the estimated forfeiture rate, the risk-free interest rate and the expected dividend yield.
Recent Accounting Pronouncements
In May 2009, the FASB issued ASC 855-10-25-01, to establish general standards of accounting for disclosure of events that occur after the balance sheet date but before financial statements are issued or are
42
Table of Contents
available to be issued. The standard is effective for interim or annual financial periods ending after June 15, 2009. The Company adopted ASC 855-10-25-01 effective with the interim report for the period ended September 26, 2009. We have performed an evaluation of subsequent events. No non-recognized subsequent events were noted.
In January 2010, the FASB issued updated guidance related to fair value measurements and disclosures, which requires a reporting entity to disclose separately the amounts of significant transfers in and out of Level 1 and Level 2 fair value measurements and to describe the reasons for the transfers. In addition, in the reconciliation for fair value measurements using significant unobservable inputs, or Level 3, a reporting entity should disclose separately information about purchases, sales, issuances and settlements (that is, on a gross basis rather than one net number). The updated guidance also requires that an entity should provide fair value measurement disclosures for each class of assets and liabilities and disclosures about the valuation techniques and inputs used to measure fair value for both recurring and non-recurring fair value measurements for Level 2 and Level 3 fair value measurements. The updated guidance is effective for interim or annual financial reporting periods beginning after December 15, 2009, except for the disclosures about purchases, sales, issuances and settlements in the roll forward activity in Level 3 fair value measurements, which are effective for fiscal years beginning after December 15, 2010 and for interim periods within those fiscal years. We do not expect adoption of the updated guidance to have a material impact on our consolidated results of operations or financial condition.
Effect of Inflation
We do not believe inflation has had a significant effect on our operations during the past several years. We generally have been able to substantially offset increases in our restaurant and operating costs resulting from inflation by altering selected offerings and pricing on our twice daily printed menus.
ITEM 7A. QUANTITATIVE AND QUALITATIVE DISCLOSURES ABOUT MARKET RISK
We are exposed to various market risks, including changes in interest rates and foreign currency exchange rates. Our foreign exchange rate risk relates to operations in Canada of The Boathouse restaurants.
Our market risk exposure for changes in interest rates relates to our cash and cash equivalents and revolving credit facility. We invest any excess cash in highly liquid short-term investments with maturities of less than one year. These investments are not held for trading or other speculative purposes. Changes in interest rates affect the investment income we earn on our investments and, therefore, impact our cash flows and results of operations.
We are exposed to market risk from changes in interest rates on borrowings, which under the terms of our revolving credit facility at December 26, 2009, bear interest at the financial institution’s prime rate plus a margin of between 0.25% and 1.50% or the Eurodollar rate plus a margin of 1.25% to 2.50%, with margins determined by certain financial ratios. At our option, we may convert loans under our revolving credit facility from one type of rate to the other. The terms of the facility also allow us to borrow up to $10.0 million in Canadian dollars, with an interest rate based on the Canadian Eurodollar Rate plus a margin of 1.35% to 2.60%, with margins determined by certain financial ratios. At the end of 2009, there was an outstanding balance of $13.0 million under our revolving credit facility. A hypothetical 40 basis point change in our effective borrowing rate would not have a material effect on our results of operations.
A portion of our revenue is generated in Canada. As a result, we conduct some transactions in Canadian currency, which increases our exposure to fluctuations in foreign currency exchange rates relative to the U.S. dollar. In 2009 we incurred a $1.5 million currency translation adjustment, which is included in other comprehensive loss on the balance sheet. A hypothetical 10% change in the foreign exchange rate between the Canadian dollar and the U.S. dollar would have a material effect on our financial results.
43
Table of Contents
ITEM 8. FINANCIAL STATEMENTS AND SUPPLEMENTARY DATA
McCormick & Schmick’s Seafood Restaurants, Inc. and Subsidiaries
| Page | ||
| 45 | ||
| Consolidated Financial Statements: |
||
| 46 | ||
| 47 | ||
| Consolidated Statements of Stockholders’ Equity and Comprehensive Income (Loss) |
48 | |
| 49 | ||
| 50 | ||
44
Table of Contents
Report of Independent Registered Public Accounting Firm
To the Board of Directors and Stockholders of
McCormick and Schmick’s Seafood Restaurants, Inc.
In our opinion, the accompanying consolidated balance sheets and the related consolidated statements of operations, of stockholders’ equity and comprehensive income (loss) and of cash flows present fairly, in all material respects, the financial position of McCormick and Schmick’s Seafood Restaurants, Inc. and its subsidiaries at December 26, 2009 and December 27, 2008, and the results of their operations and their cash flows for each of the three years in the period ended December 26, 2009 in conformity with accounting principles generally accepted in the United States of America. Also in our opinion, the Company maintained, in all material respects, effective internal control over financial reporting as of December 26, 2009, based on criteria established in Internal Control—Integrated Framework issued by the Committee of Sponsoring Organizations of the Treadway Commission (COSO). The Company’s management is responsible for these financial statements, for maintaining effective internal control over financial reporting and for its assessment of the effectiveness of internal control over financial reporting, included in Report of Management on Internal Control Over Financial Reporting appearing under item 9A. Our responsibility is to express opinions on these financial statements and on the Company’s internal control over financial reporting based on our integrated audits. We conducted our audits in accordance with the standards of the Public Company Accounting Oversight Board (United States). Those standards require that we plan and perform the audits to obtain reasonable assurance about whether the financial statements are free of material misstatement and whether effective internal control over financial reporting was maintained in all material respects. Our audits of the financial statements included examining, on a test basis, evidence supporting the amounts and disclosures in the financial statements, assessing the accounting principles used and significant estimates made by management, and evaluating the overall financial statement presentation. Our audit of internal control over financial reporting included obtaining an understanding of internal control over financial reporting, assessing the risk that a material weakness exists, and testing and evaluating the design and operating effectiveness of internal control based on the assessed risk. Our audits also included performing such other procedures as we considered necessary in the circumstances. We believe that our audits provide a reasonable basis for our opinions.
As discussed in Note 9 to the consolidated financial statements, the Company changed the manner in which it accounts for uncertain tax positions in 2007.
A company’s internal control over financial reporting is a process designed to provide reasonable assurance regarding the reliability of financial reporting and the preparation of financial statements for external purposes in accordance with generally accepted accounting principles. A company’s internal control over financial reporting includes those policies and procedures that (i) pertain to the maintenance of records that, in reasonable detail, accurately and fairly reflect the transactions and dispositions of the assets of the company; (ii) provide reasonable assurance that transactions are recorded as necessary to permit preparation of financial statements in accordance with generally accepted accounting principles, and that receipts and expenditures of the company are being made only in accordance with authorizations of management and directors of the company; and (iii) provide reasonable assurance regarding prevention or timely detection of unauthorized acquisition, use, or disposition of the company’s assets that could have a material effect on the financial statements.
Because of its inherent limitations, internal control over financial reporting may not prevent or detect misstatements. Also, projections of any evaluation of effectiveness to future periods are subject to the risk that controls may become inadequate because of changes in conditions, or that the degree of compliance with the policies or procedures may deteriorate.
PricewaterhouseCoopers LLP
Portland, Oregon
March 8, 2010
45
Table of Contents
McCormick & Schmick’s Seafood Restaurants, Inc. and Subsidiaries
Consolidated Balance Sheets
(in thousands, except per share data)
| December 27, 2008 |
December 26, 2009 |
|||||||
| Assets |
||||||||
| Current assets |
||||||||
| Cash and cash equivalents |
$ | 4,428 | $ | 8,623 | ||||
| Trade accounts receivable, net |
9,283 | 10,462 | ||||||
| Tenant improvement allowance receivables |
2,344 | 496 | ||||||
| Income tax receivable |
3,789 | 937 | ||||||
| Inventories |
6,028 | 5,585 | ||||||
| Prepaid rent |
86 | 237 | ||||||
| Prepaid expenses and other current assets |
2,604 | 2,617 | ||||||
| Deferred income taxes |
97 | — | ||||||
| Total current assets |
28,659 | 28,957 | ||||||
| Property and equipment, net |
185,171 | 158,465 | ||||||
| Other assets |
3,689 | 3,600 | ||||||
| Total assets |
$ | 217,519 | $ | 191,022 | ||||
| Liabilities and Stockholders’ Equity |
||||||||
| Current liabilities |
||||||||
| Accounts payable |
$ | 18,919 | $ | 15,766 | ||||
| Accrued expenses |
31,361 | 28,639 | ||||||
| Deferred income taxes |
— | 278 | ||||||
| Total current liabilities |
50,280 | 44,683 | ||||||
| Other long-term liabilities |
33,158 | 35,532 | ||||||
| Revolving credit facility |
24,000 | 13,000 | ||||||
| Capital lease obligations |
2,526 | 3,038 | ||||||
| Deferred income taxes |
1,760 | 1,634 | ||||||
| Total liabilities |
111,724 | 97,887 | ||||||
| Commitments and Contingencies (Notes 12 and 15) |
||||||||
| Stockholders’ equity |
||||||||
| Common stock, $0.001 par value, 120,000 shares authorized, 14,721 shares issued and outstanding in 2008 and 14,785 shares issued and outstanding in 2009 |
15 | 15 | ||||||
| Additional paid in capital |
148,030 | 148,630 | ||||||
| Accumulated other comprehensive loss |
(1,675 | ) | (220 | ) | ||||
| Accumulated deficit |
(40,575 | ) | (55,290 | ) | ||||
| Total stockholders’ equity |
105,795 | 93,135 | ||||||
| Total liabilities and stockholders’ equity |
$ | 217,519 | $ | 191,022 | ||||
The accompanying notes are an integral part of these consolidated financial statements.
46
Table of Contents
McCormick & Schmick’s Seafood Restaurants, Inc. and Subsidiaries
Consolidated Statements of Operations
(in thousands, except per share data)
| Year Ended | ||||||||||||
| December 29, 2007 |
December 27, 2008 |
December 26, 2009 |
||||||||||
| Revenues |
$ | 358,647 | $ | 390,718 | $ | 360,129 | ||||||
| Restaurant operating costs |
||||||||||||
| Food and beverage |
104,468 | 117,642 | 106,030 | |||||||||
| Labor |
112,503 | 125,811 | 117,194 | |||||||||
| Operating |
54,892 | 61,375 | 54,441 | |||||||||
| Occupancy |
32,048 | 36,874 | 37,690 | |||||||||
| Total restaurant operating costs |
303,911 | 341,702 | 315,355 | |||||||||
| General and administrative expenses |
22,166 | 21,026 | 20,168 | |||||||||
| Restaurant pre-opening costs |
4,527 | 4,428 | 1,101 | |||||||||
| Depreciation and amortization |
11,940 | 15,043 | 16,789 | |||||||||
| Impairment, restructuring, and other charges |
5,427 | 83,913 | 20,388 | |||||||||
| Total costs and expenses |
347,971 | 466,112 | 373,801 | |||||||||
| Operating income (loss) |
10,676 | (75,394 | ) | (13,672 | ) | |||||||
| Interest expense (income), net |
(226 | ) | 1,173 | 1,752 | ||||||||
| Write off of loan transaction costs |
— | 376 | — | |||||||||
| Other income, net |
— | (308 | ) | (53 | ) | |||||||
| Income (loss) before income taxes |
10,902 | (76,635 | ) | (15,371 | ) | |||||||
| Income tax expense (benefit) |
2,088 | (7,024 | ) | (656 | ) | |||||||
| Net income (loss) |
$ | 8,814 | $ | (69,611 | ) | $ | (14,715 | ) | ||||
| Net income (loss) per share |
||||||||||||
| Basic |
$ | 0.60 | $ | (4.73 | ) | $ | (1.00 | ) | ||||
| Diluted |
$ | 0.60 | $ | (4.73 | ) | $ | (1.00 | ) | ||||
| Shares used in computing net income (loss) per share |
||||||||||||
| Basic |
14,569 | 14,707 | 14,771 | |||||||||
| Diluted |
14,769 | 14,707 | 14,771 | |||||||||
The accompanying notes are an integral part of these consolidated financial statements.
47
Table of Contents
McCormick & Schmick’s Seafood Restaurants, Inc. and Subsidiaries
Consolidated Statements of Stockholders’ Equity and Comprehensive Income (Loss)
(in thousands, except share data)
| Common Stock | Additional Paid-in Capital |
Retained Earnings (Accumulated Deficit) |
Accumulated Other Comprehensive Income (Loss) |
Total | ||||||||||||||||||
| Shares | Amount | |||||||||||||||||||||
| Balances at December 30, 2006 |
14,303,131 | $ | 14 | $ | 139,721 | $ | 20,495 | $ | — | $ | 160,230 | |||||||||||
| Cumulative effect of adoption of revised accounting guidance for uncertain tax positions |
— | — | — | (273 | ) | — | (273 | ) | ||||||||||||||
| Share based compensation |
— | — | 1,377 | — | — | 1,377 | ||||||||||||||||
| Exercise of stock options and vesting of restricted stock |
381,860 | 1 | 4,107 | — | — | 4,108 | ||||||||||||||||
| Tax effect of share based compensation |
— | — | 1,713 | — | — | 1,713 | ||||||||||||||||
| Cumulative currency translation adjustment |
— | — | — | — | 2,828 | 2,828 | ||||||||||||||||
| Net income |
— | — | — | 8,814 | — | 8,814 | ||||||||||||||||
| Total Comprehensive income |
— | — | — | 8,814 | 2,828 | 11,642 | ||||||||||||||||
| Balances at December 29, 2007 |
14,684,991 | 15 | 146,918 | 29,036 | 2,828 | 178,797 | ||||||||||||||||
| Share based compensation |
— | — | 1,117 | — | — | 1,117 | ||||||||||||||||
| Vesting of restricted stock |
36,056 | — | — | — | — | — | ||||||||||||||||
| Tax effect of share based compensation |
— | — | (5 | ) | — | — | (5 | ) | ||||||||||||||
| Cumulative currency translation adjustment |
— | — | — | — | (4,503 | ) | (4,503 | ) | ||||||||||||||
| Net loss |
— | — | — | (69,611 | ) | — | (69,611 | ) | ||||||||||||||
| Total Comprehensive loss |
— | — | — | (69,611 | ) | (4,503 | ) | (74,114 | ) | |||||||||||||
| Balances at December 27, 2008 |
14,721,047 | 15 | 148,030 | (40,575 | ) | (1,675 | ) | 105,795 | ||||||||||||||
| Share based compensation |
— | — | 628 | — | — | 628 | ||||||||||||||||
| Vesting of restricted stock |
71,195 | — | — | — | — | — | ||||||||||||||||
| Issuance of restricted stock |
— | — | 21 | — | — | 21 | ||||||||||||||||
| Surrender of stock as payment for liability |
(7,457 | ) | — | (48 | ) | — | — | (48 | ) | |||||||||||||
| Tax effect of share based compensation |
— | — | (1 | ) | — | — | (1 | ) | ||||||||||||||
| Cumulative currency translation adjustment |
— | — | — | — | 1,455 | 1,455 | ||||||||||||||||
| Net loss |
— | — | — | (14,715 | ) | — | (14,715 | ) | ||||||||||||||
| Total Comprehensive loss |
— | — | — | (14,715 | ) | 1,455 | (13,260 | ) | ||||||||||||||
| Balances at December 26, 2009 |
14,784,785 | $ | 15 | $ | 148,630 | $ | (55,290 | ) | $ | (220 | ) | $ | 93,135 | |||||||||
The accompanying notes are an integral part of these consolidated financial statements.
48
Table of Contents
McCormick & Schmick’s Seafood Restaurants, Inc. and Subsidiaries
Consolidated Statements of Cash Flows
(in thousands)
| Year Ended | ||||||||||||
| December 29, 2007 |
December 27, 2008 |
December 26, 2009 |
||||||||||
| Operating activities |
||||||||||||
| Net income (loss) |
$ | 8,814 | $ | (69,611 | ) | $ | (14,715 | ) | ||||
| Adjustments to reconcile net income (loss) to net cash provided by operating activities |
||||||||||||
| Depreciation and amortization |
11,940 | 15,043 | 16,789 | |||||||||
| Deferred income taxes |
(1,138 | ) | (4,638 | ) | 249 | |||||||
| Share based compensation |
1,377 | 1,117 | 627 | |||||||||
| Impairment/restructuring charges |
5,427 | 83,913 | 20,068 | |||||||||
| Write off of loan transaction costs |
— | 376 | — | |||||||||
| Changes in operating assets and liabilities |
||||||||||||
| Trade accounts receivable |
(3,692 | ) | 775 | (1,126 | ) | |||||||
| Tenant improvement allowance receivable |
(6,125 | ) | 5,319 | 1,848 | ||||||||
| Income tax receivable |
(1,736 | ) | (2,053 | ) | 2,852 | |||||||
| Inventories |
(1,229 | ) | (126 | ) | 488 | |||||||
| Prepaid expenses and other current assets |
(45 | ) | 1,213 | (149 | ) | |||||||
| Accounts payable |
8,396 | (4,821 | ) | (3,220 | ) | |||||||
| Accrued expenses |
10,761 | (2,716 | ) | (3,062 | ) | |||||||
| Other long-term liabilities |
2,481 | 3,567 | 2,091 | |||||||||
| Net cash provided by operating activities |
35,231 | 27,358 | 22,740 | |||||||||
| Investing activities |
||||||||||||
| Purchase of property and equipment |
(41,578 | ) | (48,245 | ) | (8,203 | ) | ||||||
| Acquisition of The Boathouse Restaurants of Canada, Inc. assets, net |
(14,481 | ) | — | — | ||||||||
| Other assets |
58 | (293 | ) | (198 | ) | |||||||
| Net cash used in investing activities |
(56,001 | ) | (48,538 | ) | (8,401 | ) | ||||||
| Financing activities |
||||||||||||
| Loan costs |
(799 | ) | (619 | ) | — | |||||||
| Borrowings made on revolving credit facility |
41,500 | 135,500 | 116,000 | |||||||||
| Payments made on revolving credit facility |
(28,500 | ) | (124,500 | ) | (127,000 | ) | ||||||
| Proceeds from stock options exercised |
4,108 | — | — | |||||||||
| Deemed landlord financing proceeds |
— | 8,315 | 675 | |||||||||
| Deemed landlord financing payments |
— | (100 | ) | (241 | ) | |||||||
| Payments on capital lease obligations |
(395 | ) | (34 | ) | (41 | ) | ||||||
| Issuance of restricted stock |
— | — | 21 | |||||||||
| Tax effect of share based compensation |
1,713 | (5 | ) | — | ||||||||
| Net cash provided by (used in) financing activities |
17,627 | 18,557 | (10,586 | ) | ||||||||
| Effect of exchange rate changes on cash and cash equivalents |
(67 | ) | (292 | ) | 442 | |||||||
| Net increase (decrease) in cash and cash equivalents |
(3,210 | ) | (2,915 | ) | 4,195 | |||||||
| Cash and cash equivalents, beginning of year |
10,553 | 7,343 | 4,428 | |||||||||
| Cash and cash equivalents, end of year |
$ | 7,343 | $ | 4,428 | $ | 8,623 | ||||||
| Supplemental disclosure of cash flow information |
||||||||||||
| Cash paid during the year |
||||||||||||
| Interest |
$ | 741 | $ | 1,305 | $ | 1,482 | ||||||
| Income taxes, net of refunds |
3,789 | (706 | ) | (2,768 | ) | |||||||
The accompanying notes are an integral part of these consolidated financial statements.
49
Table of Contents
McCormick & Schmick’s Seafood Restaurants, Inc. and Subsidiaries
Notes to Consolidated Financial Statements
1. The Business and Organization
McCormick and Schmick’s Seafood Restaurants, Inc. is a leading national seafood restaurant operator in the affordable upscale dinning segment and, as of December 26, 2009, operated 93 restaurants including 87 restaurants in 25 states throughout the United States including one pursuant to a management agreement, and six restaurants under The Boathouse name in the greater Vancouver, British Columbia area. The Company has aggregated its operations into one reportable segment.
2. Summary of Significant Accounting Policies
Principles of Consolidation
The consolidated financial statements include the assets, liabilities and results of operations of McCormick & Schmick’s Seafood Restaurants, Inc. and its subsidiaries. All intercompany balances and transactions have been eliminated upon consolidation.
Fiscal Year
The Company utilizes a 52 or 53 week accounting period that ends on the last Saturday in December. The fiscal years ended December 29, 2007, December 27, 2008 and December 26, 2009 were each comprised of 52 weeks. Approximately every six years a 53 week fiscal year occurs, and our next 53 week fiscal year will be 2011.
Management Estimates
The preparation of financial statements in conformity with accounting principles generally accepted in the United States of America requires management to make estimates and assumptions that affect the reported amounts of assets and liabilities and disclosure of contingent assets and liabilities at the date of the financial statements and the reported amounts of revenue and expenses during the reporting period. The Company bases its estimates on historical experience and on various assumptions that are believed to be reasonable under the circumstances at the time. Actual results could differ from those estimates under different assumptions or conditions.
Cash and Cash Equivalents
The Company considers all highly liquid investment instruments purchased with an initial maturity of three months or less to be cash equivalents. Cash consists of cash on hand in restaurant locations and deposits held at major banks that may at times exceed FDIC or CDIC insured limits.
Inventories
Inventories, which consist principally of restaurant food, beverages and supplies, are stated at the lower of cost or market using the first-in, first-out method.
Property and Equipment
Property and equipment are stated at cost less accumulated depreciation and amortization. Equipment consists primarily of restaurant equipment, furniture, fixtures and smallwares. Depreciation is calculated using the straight-line method over the estimated useful lives of the related assets. Equipment under capitalized leases is amortized over the shorter of the useful life of the asset or the length of the related lease term. Leasehold improvements are amortized using the straight-line method over the shorter of the lease term, including option periods which are reasonably assured of renewal, or the estimated useful life of the asset. Repairs and
50
Table of Contents
McCormick & Schmick’s Seafood Restaurants, Inc. and Subsidiaries
Notes to Consolidated Financial Statements—(Continued)
maintenance are expensed as incurred; renewals and betterments are capitalized. Upon disposal of equipment and leasehold improvements, the accounts are relieved of the costs and related accumulated depreciation or amortization, and resulting gains or losses are included in results of operations.
Estimated useful lives are generally as follows:
| Equipment |
3-10 years | |
| Furniture and fixtures |
5-10 years | |
| Leasehold improvements |
7-30 years | |
| Buildings |
39 years |
Impairment of Long-Lived Assets
Long-lived assets, such as property and equipment, and purchased intangibles subject to amortization, are reviewed for impairment whenever events or changes in circumstances indicate that the carrying amount of an asset may not be recoverable. The Company’s assessment of recoverability of property and equipment is performed on a restaurant-by-restaurant basis. Recoverability of assets to be held and used is measured by a comparison of the carrying amount of an asset to the estimated undiscounted future cash flows expected to be generated by the asset. In evaluating long-lived restaurant assets for impairment, the Company considers a number of factors including a current period operating or cash flow loss combined with a history of operating or cash flow losses and an undiscounted cash flow projection associated with the use of the underlying long-lived asset. In these situations, the Company evaluates undiscounted cash flow projections in conjunction with qualitative factors and future operating plans. If the carrying amount of an asset exceeds the estimated undiscounted future cash flows, an impairment charge is recognized by the amount by which the carrying amount of the asset exceeds the fair value of the asset.
The Company’s impairment assessment process requires the use of estimates and assumptions regarding future cash flows and operating outcomes, which are subject to a significant degree of judgment based on experience and knowledge. These estimates can be significantly impacted by changes in the economic environment, real estate market conditions and overall operating performance. Impairment charges could be triggered in the future if expected restaurant performance will not support the net book value of the underlying long-lived assets on a future undiscounted cash flow basis or if management decides to close that location.
Fair value is defined as the exchange price that would be received for an asset or paid to transfer a liability (an exit price) in the principal or most advantageous market for the asset or liability in an orderly transaction between market participants on the measurement date. The Company maximizes the use of observable inputs and minimize the use of unobservable inputs when measuring fair value. The hierarchy describes three levels of inputs that may be used to measure fair value.
| Level 1. | Quoted prices in active markets for identical assets or liabilities. Level 1 assets and liabilities include debt and equity securities and derivative contracts that are traded in an active exchange market. | |
| Level 2. | Observable inputs other than Level 1 prices, such as quoted prices for similar assets or liabilities; quoted prices in markets that are not active; or other inputs that are observable or can be corroborated by observable market data for substantially the full term of the assets or liabilities. Level 2 assets and liabilities include debt securities with quoted prices that are traded less frequently than exchange-traded instruments and derivative contracts whose value is determined using a pricing model with inputs that are observable in the market or can be derived principally from or corroborated by observable market data. | |
51
Table of Contents
McCormick & Schmick’s Seafood Restaurants, Inc. and Subsidiaries
Notes to Consolidated Financial Statements—(Continued)
| Level 3. | Unobservable inputs that are supported by little or no market activity and that are significant to the fair value of the assets or liabilities. Level 3 assets and liabilities include financial instruments whose value is determined using pricing models, discounted cash flow methodologies, or similar techniques, as well as instruments for which the determination of fair value requires significant management judgment or estimation using unobservable inputs. This category generally includes long-term derivative contracts, real estate and unconsolidated joint ventures. |
In conjunction with a review for impairment (as discussed in Note 13 to the financial statements), selected assets were adjusted to fair value and impairment charges were recorded.
Fair Value of Financial Instruments
The carrying amount of cash and cash equivalents, receivables, accounts payable, and accrued expenses approximate fair value because of the immediate or short-term maturity of these financial instruments. The fair value of long-term debt is determined using current applicable rates for similar instruments and collateral as of the balance sheet date and approximates the carrying value of such debt.
Income Taxes
Income taxes are provided for the tax effects of transactions reported in the financial statements and consist of taxes currently due plus deferred taxes. Deferred taxes are recognized for differences between the basis of assets and liabilities for financial statement and income tax purposes. The deferred tax assets and liabilities represent the future tax return consequences of these differences, which will either be taxable or deductible when the assets and liabilities are recovered or settled. Recognition of deferred tax assets is limited to amounts considered more likely than not to be realized in future periods. Deferred tax assets are reduced by a valuation allowance if, based on the weight of available evidence, it is more likely than not that some portion or all of the deferred tax assets will not be realized.
Revenue Recognition
Revenues are recognized at the point of delivery of products and services. The Company recognizes income from gift cards when the gift card is redeemed by the guest; or the likelihood of the gift card being redeemed by the guest is remote (gift card breakage) and the Company determines there is no legal obligation to remit the value of unredeemed gift cards to the relevant jurisdictions. The Company determines the gift card breakage rate based upon historical redemption patterns. Gift card income is included within revenues in the consolidated statements of operations. Revenues are presented net of sales tax and the related obligation is recorded as a liability until the taxes are remitted to the appropriate taxing authorities.
Share-Based Compensation Plan
Share-based compensation expense for the years ended December 29, 2007, December 27, 2008 and December 26, 2009 was $1.4 million, $1.1 million and $0.6 million, respectively, which consisted of share-based compensation expense related to employee stock options and restricted stock awards.
The Company determined the fair value of stock option awards on the date of grant using the Black-Scholes option-pricing model. The model is affected by the Company’s stock price as well as the Company’s assumptions regarding a number of complex and subjective variables, including but not limited to the Company’s expected stock price volatility over the term of the awards, life of the option, expected term of the option, the estimated
52
Table of Contents
McCormick & Schmick’s Seafood Restaurants, Inc. and Subsidiaries
Notes to Consolidated Financial Statements—(Continued)
forfeiture rate, the risk-free interest rate and the expected dividend yield. The Company’s expected stock price volatility was based on historical volatility of the Company’s stock price since the initial public offering in 2004. The option life was based on the contractual life of the option. The expected term of the option was based on an average of selected peer companies in the Company’s industry and our expectation of average time until exercise of the options by the grantees. The estimated forfeiture rate was based on historical data and estimated future terminations over the vesting period of the award. The risk-free interest rate was based on the implied yield available at the time of grant on U.S. Treasury zero-coupon issues. Dividend yield is based on management’s estimation of dividends to be paid in the future.
The fair value of the Company’s stock options was estimated using the following assumptions. The Company did not grant any options during fiscal year 2008.
| Year Ended | ||||||
| December 29, 2007 |
December 26, 2009 |
|||||
| Expected volatility |
24.8 | % | 51.1 | % | ||
| Option life |
10 years | 10 years | ||||
| Expected term |
5.5 years | 5.5 years | ||||
| Estimated forfeiture rate |
14 | % | 0 | % | ||
| Risk-free interest rate |
3.9 | % | 1.1 | % | ||
| Dividend yield |
0 | % | 0 | % | ||
On June 16, 2004, the Company adopted the 2004 Stock Incentive Plan (the “Plan”) under which 1,500,000 shares were reserved for issuance. Under the Plan, the Company may grant stock options, restricted stock and other awards to employees, directors, consultants, and to any parent or subsidiary of the Company.
Incentive stock options must have an exercise price that is at least equal to the fair market value of the common stock, or 110% of fair market value of the common stock for any greater than 10% owner of the Company’s common stock, on the date of grant. Vesting of awards under the Plan may vary. Each award granted under the Plan may, at the discretion of the board of directors of the Company, become fully exercisable or payable, as applicable, upon a change of control of the Company.
Each award shall expire on the date determined at the date of grant, however, the maximum term of options, stock appreciation rights (“SARs”) and other rights to acquire common stock under the Plan is 10 years after the initial date of the award, subject to provisions for further deferred payment in certain circumstances. These and other awards may also be issued solely or in part for services. Any shares subject to awards that are not paid or exercised before they expire or are terminated will become available for other award grants under the Plan. If not sooner terminated by the Company’s board of directors, the Plan will terminate on June 16, 2014.
Restaurant Pre-Opening Costs
Restaurant pre-opening costs consist primarily of wages and salaries, hourly employee recruiting, license fees, meals, local marketing, lodging and travel, and rent expenses during the construction period and through the opening of the restaurant.
Advertising Costs
Advertising costs are expensed as incurred and were $5.0 million, $5.5 million, and $3.9 million for the fiscal years ended December 29, 2007, December 27, 2008 and December 26, 2009, respectively.
53
Table of Contents
McCormick & Schmick’s Seafood Restaurants, Inc. and Subsidiaries
Notes to Consolidated Financial Statements—(Continued)
Insurance Liability
The Company maintains various insurance policies including workers’ compensation, employee health, and general liability. Pursuant to those policies, the Company is responsible for losses up to certain limits. The Company records a liability for the estimated exposure for aggregate losses below those limits. This liability is based on estimates of the ultimate costs to be incurred to settle known claims and claims not reported as of the balance sheet date. The estimated liability is not discounted and is based on a number of assumptions and factors, including historical trends, actuarial assumptions, and economic conditions.
Basic and Diluted Net Income per Share
Basic net income per share is computed using the weighted-average number of common shares outstanding during the period. Diluted net income per share is computed using the weighted-average number of common shares and dilutive potential common shares outstanding during the period. Dilutive potential common shares consist of employee stock options and restricted stock.
Employee equity share options, non-vested shares and similar equity instruments granted by the Company are treated as potential common shares outstanding in computing diluted earnings per share. Diluted shares outstanding include the dilutive effect of in-the-money options and is calculated based on the average share price for each fiscal period using the treasury stock method. Under the treasury stock method, assumed proceeds include the amount the employee must pay for exercising stock options, the purchase price the grantee pays for restricted stock, if any, the amount of compensation cost for future service that the Company has not yet recognized, and the amount of tax benefits, if any, that would be credited to additional paid-in capital upon the exercise of the options or vesting of the restricted stock.
Options to purchase 337,277, 319,311, and 543,547 shares of common stock were outstanding at December 29, 2007, December 27, 2008, and December 26, 2009, respectively. Shares of restricted stock outstanding were 73,322, 115,388, and 64,301 on December 29, 2007, December 27, 2008, and December 26, 2009, respectively. The dilutive weighted average number of shares calculation includes 199,805 shares subject to stock options or restricted stock grants for the year ended December 29, 2007. There were no dilutive shares for the years ended December 27, 2008 and December 26, 2009. For years ended December 27, 2008, and December 26, 2009, 321,223 and 319,200, respectively, of the Company’s shares were excluded from the calculation due to their anti-dilutive effect.
Operating Leases
The Company generally operates its restaurants in leased premises. The Company records the minimum base rents for its operating leases on a straight-line basis over the life of the lease term, including option periods when exercise of such option periods are reasonably assured of renewal due to the presence of certain economic penalties. For purposes of calculating straight-line rents, the lease term commences on the date the lessee obtains control of the property, which is normally when the property is ready for normal tenant improvements (build-out-period). For certain leases the Company only has the right to exercise its option for renewal if certain sales targets are achieved at or near the renewal date. These renewal option periods have been included in the lease term when the Company determines at lease inception or at the acquisition date of the restaurant, if later, that the sales targets are non-substantive and achievement of such sales targets is virtually certain. The difference between rent expense calculated on a straight-line basis and rent paid is recorded as deferred rent liability.
The Company receives certain tenant improvement allowances which are considered lease incentives and are amortized over the life of the lease term, as a reduction of rent expense over the lease term. Accordingly, the Company has recorded a deferred rent liability including tenant improvement allowances for the straight lining of
54
Table of Contents
McCormick & Schmick’s Seafood Restaurants, Inc. and Subsidiaries
Notes to Consolidated Financial Statements—(Continued)
rents and lease incentives, which is included in other long-term liabilities of $23.7 million and $26.3 million as of December 27, 2008 and December 26, 2009, respectively. Certain other landlord tenant improvement allowances received, depending on the specifics of the leased space and the lease agreement for the amounts paid for structural components during the construction period are recorded as construction in progress and the landlord tenant improvement allowances received are recorded as a landlord financing liability. Upon completion of construction for those leases that meet the criteria and for those leases that do not qualify for sale leaseback treatment, the landlord financing liability is amortized under the effective interest rate method over the lease term based on the rent payments designated in the lease agreement.
3. Property and Equipment
Property and Equipment and related accumulated depreciation and amortization consist of the following:
| December 27, 2008 |
December 26, 2009 |
|||||||
| (in thousands) | ||||||||
| Fixtures and equipment |
$ | 82,107 | $ | 78,417 | ||||
| Leasehold improvements |
157,840 | 149,781 | ||||||
| Construction in progress |
6,827 | 2,577 | ||||||
| Buildings |
4,008 | 1,845 | ||||||
| Buildings under capital lease |
2,825 | 3,279 | ||||||
| Land |
1,563 | 719 | ||||||
| 255,170 | 236,618 | |||||||
| Less: Accumulated depreciation and amortization |
(69,999 | ) | (78,153 | ) | ||||
| Property and equipment, net |
$ | 185,171 | $ | 158,465 | ||||
The Company capitalized $580,000 in interest costs for the year ended December 29, 2007, $449,000 for the year ended December 27, 2008, and $58,000 for the year ended December 26, 2009. Depreciation and amortization expense related to equipment and leasehold improvements for the years ended December 29, 2007, December 27, 2008 and December 26, 2009 was $11.9 million, $15.0 million and $16.8 million, respectively.
4. Other Assets
Other assets consist of the following:
| December 27, 2008 |
December 26, 2009 |
|||||||
| (in thousands) | ||||||||
| Loan costs |
$ | 1,892 | $ | 1,863 | ||||
| Liquor licenses |
2,054 | 2,261 | ||||||
| Notes receivable |
233 | 271 | ||||||
| Other |
302 | 301 | ||||||
| 4,481 | 4,696 | |||||||
| Less accumulated amortization of loan costs and liquor licenses |
(792 | ) | (1,096 | ) | ||||
| $ | 3,689 | $ | 3,600 | |||||
Amortization expense related to other assets (loan costs and liquor licenses) was $162,000, $235,000 and $265,000 for the years ended December 29, 2007, December 27, 2008 and December 26, 2009, respectively.
55
Table of Contents
McCormick & Schmick’s Seafood Restaurants, Inc. and Subsidiaries
Notes to Consolidated Financial Statements—(Continued)
5. Accrued Expenses
Accrued expenses consist of the following:
| December 27, 2008 |
December 26, 2009 | |||||
| (in thousands) | ||||||
| Accrued compensation and benefits |
$ | 13,727 | $ | 13,011 | ||
| Gift card liability |
10,365 | 9,986 | ||||
| Accrued sales tax |
2,008 | 2,134 | ||||
| Other |
5,261 | 3,508 | ||||
| $ | 31,361 | $ | 28,639 | |||
6. Long-Term Debt
As of December 26, 2009, the outstanding balance on the Company’s revolving credit facility was $13.0 million. On January 29, 2009 the existing revolving credit facility was amended. In conjunction with the amendment, the availably under the facility was adjusted from $150.0 million to $90.0 million, with an additional $50.0 million available at the Company’s request if specified conditions are met. The amended facility also makes certain financial covenants less restrictive, including the minimum fixed charge ratio and the maximum adjusted leverage ratio covenants. The interest rate on U.S. borrowings is based on the financial institution’s base rate plus a margin between 0.25% and 1.50% or the Eurodollar rate plus a margin of 1.25% to 2.50%, and the interest rate on Canadian borrowings is based on the Canadian Eurodollar Rate plus a margin of 1.35% to 2.60%, with margins determined by certain financial ratios.
Under the revolving credit facility, the Company is required to comply with certain financial covenants, including a maximum adjusted leverage ratio, a minimum fixed charge ratio and a maximum growth capital expenditures. The Company was in compliance with these covenants as of December 26, 2009. As of December 26, 2009, the Company’s effective interest rate on its borrowings was 3.20%, which was calculated using the financial institution’s base rates of 0.23% for LIBOR and 3.25% for Prime.
Under the Company’s revolving credit facility agreement, loans are collateralized by the stock of the subsidiaries of the Company and mature on December 28, 2012. The revolving credit facility agreement also provides for bank guarantee under standby letter of credit arrangements in the normal course of business operations. The Company’s commercial bank issues standby letters of credit to secure its obligations to pay or perform when required to do so pursuant to the requirements of an underlying agreement or the provision of goods and services. The standby letters of credit are cancelable only at the option of the beneficiary who is authorized to draw drafts on the issuing bank up to the face amount of the standby letter of credit in accordance with its terms. As of December 26, 2009 the maximum exposure under these standby letters of credit was $3.0 million. At December 26, 2009, the Company had $74.0 million available under its $90.0 million revolving credit facility, subject to the terms of the agreement.
56
Table of Contents
McCormick & Schmick’s Seafood Restaurants, Inc. and Subsidiaries
Notes to Consolidated Financial Statements—(Continued)
7. Other Long-Term Liabilities
Other long-term liabilities consist of the following:
| December 27, 2008 |
December 26, 2009 | |||||
| (in thousands) | ||||||
| Deferred rent |
$ | 17,674 | $ | 20,730 | ||
| Unamortized tenant improvement allowances |
5,747 | 5,537 | ||||
| Deemed landlord financing liability |
8,215 | 8,649 | ||||
| Other |
1,522 | 616 | ||||
| $ | 33,158 | $ | 35,532 | |||
8. Capital Leases
The Company leases its restaurant facilities in Port Moody, British Columbia. The Company has a purchase option, which upon exercise, gives the Company the right to acquire the building at a predetermined price. The purchase option expires October 1, 2011. The lessor has a put option, which upon exercise, would require the Company to purchase the property, at a predetermined price. The put option may only be exercised within 60 days of the fifth anniversary of the commencement date of the lease, October 1, 2012. The assets and related liabilities under capital leases are recorded at the fair value of the assets at the inception of the lease.
The building and related accumulated amortization recorded under capital lease is as follows:
| December 27, 2008 |
December 26, 2009 |
|||||||
| (in thousands) | ||||||||
| Building |
$ | 2,825 | $ | 3,279 | ||||
| Less: Accumulated amortization |
(88 | ) | (184 | ) | ||||
| Capital leases, net |
$ | 2,737 | $ | 3,095 | ||||
Minimum future lease payments under capital leases as of December 26, 2009 are as follows (in thousands):
| 2010 |
$ | 240 | ||
| 2011 |
240 | |||
| 2012 |
3,633 | |||
| Total minimum lease payments |
4,113 | |||
| Less: Amount representing interest |
(1,075 | ) | ||
| Present value of net minimum lease payments |
3,038 | |||
| Less: Current portion |
— | |||
| Long-term portion |
$ | 3,038 | ||
57
Table of Contents
McCormick & Schmick’s Seafood Restaurants, Inc. and Subsidiaries
Notes to Consolidated Financial Statements—(Continued)
9. Income Taxes
The provision for income taxes consists of:
| Year Ended | ||||||||||||
| December 29, 2007 |
December 27, 2008 |
December 26, 2009 |
||||||||||
| (in thousands) | ||||||||||||
| Income (loss) before income taxes |
||||||||||||
| United States |
$ | 9,726 | $ | (68,143 | ) | $ | (16,459 | ) | ||||
| Foreign |
1,176 | (8,492 | ) | 1,088 | ||||||||
| 10,902 | (76,635 | ) | (15,371 | ) | ||||||||
| Current tax expense (benefit) |
||||||||||||
| Federal |
2,355 | (2,688 | ) | (369 | ) | |||||||
| State and local |
692 | 34 | (431 | ) | ||||||||
| Foreign |
179 | 268 | (105 | ) | ||||||||
| 3,226 | (2,386 | ) | (905 | ) | ||||||||
| Deferred tax expense (benefit) |
||||||||||||
| Federal |
(1,283 | ) | (3,915 | ) | 219 | |||||||
| State and local |
(31 | ) | (543 | ) | 30 | |||||||
| Foreign |
176 | (180 | ) | — | ||||||||
| (1,138 | ) | (4,638 | ) | 249 | ||||||||
| Total tax expense (benefit) |
$ | 2,088 | $ | (7,024 | ) | $ | (656 | ) | ||||
The effective income tax rate differs from the federal statutory rate as follows:
| Year Ended | |||||||||
| December 29, 2007 |
December 27, 2008 |
December 26, 2009 |
|||||||
| Federal statutory rate |
35.0 | % | 35.0 | % | 35.0 | % | |||
| State and local taxes |
5.6 | % | 4.3 | % | 4.1 | % | |||
| Foreign rate differential |
(0.5 | )% | (0.5 | )% | 0.2 | % | |||
| Nondeductible expenses |
0.6 | % | (0.1 | )% | (0.5 | )% | |||
| FICA tip credits |
(17.6 | )% | 2.6 | % | 11.4 | % | |||
| Other |
(3.9 | )% | (0.4 | )% | 2.0 | % | |||
| U.S. valuation allowance |
— | (28.1 | )% | (50.8 | )% | ||||
| Foreign valuation allowance |
— | (3.6 | )% | 2.9 | % | ||||
| 19.2 | % | 9.2 | % | 4.3 | % | ||||
58
Table of Contents
McCormick & Schmick’s Seafood Restaurants, Inc. and Subsidiaries
Notes to Consolidated Financial Statements—(Continued)
The tax effects of temporary differences that give rise to deferred tax assets and liabilities are:
| December 27, 2008 |
December 26, 2009 |
|||||||
| (in thousands) | ||||||||
| Deferred tax assets: |
||||||||
| Accrued expenses |
$ | 1,034 | $ | 770 | ||||
| Deferred rent |
7,020 | 8,137 | ||||||
| Basis difference for intangible assets |
14,228 | 12,157 | ||||||
| Federal & state credits |
2,324 | 2,712 | ||||||
| FICA tip credits |
16,969 | 18,935 | ||||||
| Foreign deferred tax assets |
2,369 | 2,259 | ||||||
| Net operating loss |
388 | 581 | ||||||
| Other |
968 | 750 | ||||||
| Subtotal |
45,300 | 46,301 | ||||||
| Less valuation allowance |
(24,017 | ) | (31,520 | ) | ||||
| Total deferred tax assets |
21,283 | 14,781 | ||||||
| Deferred tax liabilities: |
||||||||
| Prepaid expenses |
(616 | ) | (573 | ) | ||||
| Basis difference for fixed assets |
(22,112 | ) | (15,903 | ) | ||||
| Other |
(218 | ) | (217 | ) | ||||
| Total deferred tax liabilities |
(22,946 | ) | (16,693 | ) | ||||
| Net deferred tax liability |
$ | (1,663 | ) | $ | (1,912 | ) | ||
U.S. income taxes have not been provided on the undistributed earnings of the Company’s Canadian subsidiary. It is not practicable to estimate the amount of tax that might be payable. The Company’s intention is to reinvest these earnings permanently or to repatriate the earnings only when it is tax effective to do so. The Company believes that any U.S. tax on repatriated earnings would be substantially offset by U.S. foreign tax credits.
As of December 26, 2009, for federal income tax purposes, the Company had FICA tip credit carryforwards of $18.9 million, various employment based credits of $1.2 million, and alternative minimum tax credit carryforwards of $1.0 million. As of December 26, 2009, for state and local income tax purposes, the Company had net operating loss carryforwards of $20.0 million and other miscellaneous state credits of $0.8 million. If not used to reduce taxable income in future periods, portions of the FICA tip credit carryforwards and employment based credits will expire between 2021 and 2029, and the state and local net operating loss carryforwards will expire between 2010 and 2029. The alternative minimum tax credits and other miscellaneous state credits have indefinite lives and do not expire.
As of December 27, 2008 and December 26, 2009, the Company has provided a valuation allowance of $24.0 million and $31.5 million, respectively, against a portion of the deferred tax assets. Deferred tax assets are reduced by a valuation allowance if, based on the weight of available evidence, it is more likely than not that some portion or all of the deferred tax assets will not be realized. Both positive and negative evidence are considered in forming our judgment as to whether a valuation allowance is appropriate, and more weight is given to evidence that can be objectively verified. The valuation allowance relates to net operating loss and credit carryforwards and temporary differences for which we believe that realization is uncertain. If recognized, the tax benefits relating to any reversal of the valuation allowance on deferred tax assets at December 26, 2009 will be recognized as a reduction of income tax expense.
59
Table of Contents
McCormick & Schmick’s Seafood Restaurants, Inc. and Subsidiaries
Notes to Consolidated Financial Statements—(Continued)
During the fiscal year 2007, the Company recorded a $500,000 increase in other long-term liabilities, representing accrued income taxes and interest, in the Company’s consolidated balance sheet for unrecognized tax benefits. This amount, net of a related increase of $230,000 to non-current deferred tax assets, was accounted for as a cumulative effect adjustment to the December 30, 2006 balance of retained earnings.
A reconciliation of the beginning and ending balances of the total amounts of gross unrecognized tax benefits is as follows:
| Gross unrecognized tax benefits at December 30, 2006 |
$ | 500,000 | ||
| Increases in tax positions for current year |
78,000 | |||
| Lapse in statute of limitations |
(22,000 | ) | ||
| Gross unrecognized tax benefits at December 29, 2007 |
556,000 | |||
| Increases in tax positions for current year |
77,000 | |||
| Increases in tax positions for prior years |
91,000 | |||
| Lapse in statute of limitations |
(11,000 | ) | ||
| Gross unrecognized tax benefits at December 27, 2008 |
713,000 | |||
| Increases in tax positions for current year |
73,000 | |||
| Decreases in tax positions for prior years |
(91,000 | ) | ||
| Lapse in statute of limitations |
(391,000 | ) | ||
| Gross unrecognized tax benefits at December 26, 2009 |
$ | 304,000 | ||
Included in the balance of unrecognized tax benefits at December 29, 2007, December 27, 2008 and December 26, 2009 are $539,000, $622,000 and $154,000, respectively, of tax benefits that, if recognized, would affect the effective tax rate. The Company recognizes interest and penalties related to uncertain tax positions in income tax expense. As of December 27, 2008 and December 26, 2009, the Company had accrued $169,000 and $26,000 of interest related to uncertain tax positions, respectively. The Company has accrued no penalties. The Company’s unrecognized tax benefits are largely related to certain state filing positions. The Company believes that it is reasonably possible that approximately $70,000 of its unrecognized tax benefits, primarily related to state tax filing positions, may be recognized by the end of 2010 as a result of a lapse of the statute of limitations. The Company does not expect any significant increase of its unrecognized tax benefits during 2010. As of December 27, 2008, the Company expected that it was reasonably possible that its unrecognized tax benefits would decrease by approximately $300,000 during the year ended December 26, 2009. During the year ended December 26, 2009 unrecognized tax benefits, related to current year state filing positions and prior year state tax filing positions, increased by $73,000 and decreased by $482,000, respectively.
The Company’s U.S. federal income tax returns for the 2006, 2007 and 2008 tax years are currently under examination by the Internal Revenue Service. The Company does not expect that the results of this examination will have a material effect on its financial position or results of operations. The Company is subject to U.S. federal tax, Canadian federal and provincial tax and income tax of multiple state and local jurisdictions. The Company’s operations in Canada began in 2007 and are not subject to examination prior to the 2007 tax year.
10. Related Party Transactions
The Company leases properties from landlords controlled by certain stockholders of the Company. Total rent paid to these landlords was $1.0 million for each of the years ended December 29, 2007, December 27, 2008 and December 26, 2009.
60
Table of Contents
McCormick & Schmick’s Seafood Restaurants, Inc. and Subsidiaries
Notes to Consolidated Financial Statements—(Continued)
11. Share-Based Compensation
Share-based compensation expense recognized for the fiscal years ended December 29, 2007, December 27, 2008 and December 26, 2009 was $1.4 million, $1.1 million, and $0.6 million respectively, which consisted of share-based compensation expense related to employee stock options and restricted stock.
On June 16, 2004, the Company adopted the 2004 Stock Incentive Plan (the “Plan”) under which 1,500,000 shares were reserved for issuance. Under the Plan, the Company may grant stock options, restricted stock and other awards to employees, directors, and consultants. As of December 26, 2009, options to purchase a total of 1,154,600 shares of the Company’s common stock have been granted under the Plan at a price equal to the fair market value of the stock on the date of grant. As of December 26, 2009, there were 543,547 options outstanding, of which 238,548 were exercisable. As of December 26, 2009 there were 64,301 shares of restricted stock outstanding. Additional awards granted under the Plan may be in the form of nonqualified stock options, incentive stock options, SARs, restricted stock, stock bonuses and performance-based awards.
Incentive stock options must have an exercise price that is at least equal to the fair market value of the common stock, or 110% of fair market value of the common stock for any greater than 10% owner of the Company’s common stock, on the date of grant. Vesting of awards under the Plan may vary. Each award granted under the Plan may, at the discretion of the board of directors of the Company, become fully exercisable or payable, as applicable, upon a change of control of the Company.
Each award shall expire on the date determined at the date of grant, however, the maximum term of options, SARs and other rights to acquire common stock under the Plan is 10 years after the initial date of the award, subject to provisions for further deferred payment in certain circumstances. These and other awards may also be issued solely or in part for services. Any shares subject to awards that are not paid or exercised before they expire or are terminated will become available for other award grants under the Plan. If not sooner terminated by the Company’s board of directors, the Plan will terminate on June 16, 2014.
In conjunction with the hiring of the Company’s Chief Executive Officer on January 12, 2009, the Company issued an option to purchase 250,000 shares to him at a price equal to $3.92 per share, the fair market value of the stock on the date of grant. One-third of the grant vests on each of the three anniversary dates following the grant date if the grantee is then employed by the Company.
In November 2009, the Company issued 27,955 shares of restricted stock to the non-employee members of the Board of Directors, the fair market value of the stock on the date of grant was $6.26 per share. The restricted stock granted vests nine months following the date of grant if the director is still serving the Company at that date.
61
Table of Contents
McCormick & Schmick’s Seafood Restaurants, Inc. and Subsidiaries
Notes to Consolidated Financial Statements—(Continued)
The table below summarizes the status of the Company’s stock based compensation plans, including stock options and restricted stock grants, as of December 26, 2009:
| Stock Options |
Weighted Average Exercise Price |
Restricted Stock |
Total Shares |
Aggregate Intrinsic Value | ||||||||
| Outstanding at December 30, 2006 |
700,691 | $ | 12.00 | 138,500 | 839,191 | |||||||
| Awards granted |
25,000 | 24.71 | — | 25,000 | ||||||||
| Awards exercised |
342,348 | 12.00 | 39,512 | 381,860 | ||||||||
| Awards forfeited |
46,066 | 12.00 | 25,666 | 71,732 | ||||||||
| Outstanding at December 29, 2007 |
337,277 | 12.94 | 73,322 | 410,599 | ||||||||
| Awards granted |
— | — | 85,620 | 85,620 | ||||||||
| Awards exercised |
— | — | 36,056 | 36,056 | ||||||||
| Awards forfeited |
17,966 | 18.68 | 7,498 | 25,464 | ||||||||
| Outstanding at December 27, 2008 |
319,311 | 12.62 | 115,388 | 434,699 | ||||||||
| Awards granted |
250,000 | 3.92 | 33,060 | 283,060 | $ | 1,128,797 | ||||||
| Awards exercised |
— | — | 71,195 | 71,195 | 359,184 | |||||||
| Awards forfeited |
25,764 | 16.93 | 12,952 | 38,716 | 96,492 | |||||||
| Outstanding at December 26, 2009 |
543,547 | 8.41 | 64,301 | 607,848 | 1,361,542 | |||||||
| Exercisable at December 26, 2009 |
238,548 | $ | 12.20 | — | 238,548 | $ | — | |||||
The table below summarizes information about stock options outstanding at December 26, 2009:
| Outstanding | Exercisable | |||||||||||
| Range of Exercise Prices |
Number of Options |
Weighted Average Remaining Years of Contractual Life |
Weighted Average Exercise Price |
Number of Options |
Weighted Average Exercise Price | |||||||
| $3.92 – $26.81 | 543,547 | 6.62 | $ | 8.41 | 238,548 | $ | 12.20 | |||||
As of December 27, 2008 and December 26, 2009, the unamortized compensation cost related to stock options and restricted stock granted to employees under the Company’s 2004 Stock Incentive Plan was $1.0 million.
The following table summarizes share-based compensation (in thousands):
| Year Ended | |||||||||
| December 29, 2007 |
December 27, 2008 |
December 26, 2009 | |||||||
| Labor |
$ | 42 | $ | 14 | $ | — | |||
| General and administrative expenses |
1,334 | 1,103 | 628 | ||||||
| Share-based compensation expense included in total costs and expenses |
1,376 | 1,117 | 628 | ||||||
| Income tax benefit related to share-based compensation |
420 | 417 | 234 | ||||||
| Share-based compensation expense related to employee stock options, net of tax |
$ | 956 | $ | 700 | $ | 394 | |||
62
Table of Contents
McCormick & Schmick’s Seafood Restaurants, Inc. and Subsidiaries
Notes to Consolidated Financial Statements—(Continued)
12. Commitments and Contingencies
Occasionally, the Company is a defendant in litigation arising in the ordinary course of its business, including claims resulting from “slip and fall” accidents, employment related claims and claims from guests or employees alleging illness, injury or other food quality, health or operational concerns. These may include claims brought against the Company by private party plaintiffs and various government agencies, including federal, state and local taxing agencies, various state and local health departments, and the Equal Employment Opportunity Commission and other employment related agencies, among others. In certain instances the Company may settle claims if management concludes that future costs to defend the suits outweigh the costs to settle the claims. The Company is currently a defendant in several disputes that may be litigated in court.
In 2006, the Company was named in a class action complaint regarding employment practices filed in the U.S. District Court for the Northern District of California. The Company has contested the claims and has negotiated a settlement with the plaintiffs. The Company does not anticipate the changes to its hiring and employment practices it agreed to in connection with the settlement will significantly affect its operations. The settlement was approved by the court, and the settlement amount was paid in April 2008.
The Company’s previous insurer has informed the Company it believes the Company has exhausted its insurance coverage with respect to claims arising in the Company’s 2004 coverage year. The Company disagrees with this interpretation of the coverage, but has taken this interpretation into account in connection with the charge taken related to the settlement of class action claims. The Company has initiated litigation to contest the insurer’s conclusion. If the Company is unsuccessful, and if the Company’s previous insurer determines that other existing employment claims arose in 2004 and are therefore not covered, the resolution of those claims could be more expensive.
13. Impairment, Restructuring, and Other Charges
Long-lived assets, such as property and equipment, and purchased intangibles subject to amortization, are reviewed for impairment whenever events or changes in circumstances indicate that the carrying amount of an asset may not be recoverable. The Company’s assessment of recoverability of property and equipment is performed on a restaurant-by-restaurant basis. Recoverability of assets to be held and used is measured by a comparison of the carrying amount of an asset to the estimated undiscounted future cash flows expected to be generated by the asset. In evaluating long-lived restaurant assets for impairment, the Company considers a number of factors including a current period operating or cash flow loss combined with a history of operating or cash flow losses and an undiscounted cash flow projection associated with the use of the underlying long-lived asset. In these situations, the Company evaluates undiscounted cash flow projections in conjunction with qualitative factors and future operating plans. If the carrying amount of an asset exceeds the estimated undiscounted future cash flows, an impairment charge is recognized by the amount by which the carrying amount of the asset exceeds the fair value of the asset.
The Company’s impairment assessment process requires the use of estimates and assumptions regarding future cash flows and operating outcomes, which are subject to a significant degree of judgment based on experience and knowledge. These estimates can be significantly impacted by changes in the economic environment, real estate market conditions and overall operating performance. Impairment charges could be triggered in the future if expected restaurant performance will not support the net book value of the underlying long-lived assets on a future undiscounted cash flow basis or if management decides to close that location.
In order to comply with the Company’s disclosure requirements related to fair value measurements, the designation of the level of inputs used in the fair value models must be determined. Inputs used in establishing estimated fair value for real estate assets generally fall within level three, which are characterized as requiring
63
Table of Contents
McCormick & Schmick’s Seafood Restaurants, Inc. and Subsidiaries
Notes to Consolidated Financial Statements—(Continued)
significant judgment as little or no current market activity may be available for validation. The main indicator used to establish the classification of the inputs was current market conditions that, in many instances, resulted in the use of significant unobservable inputs in establishing estimated fair value measurements.
A summary of the fair value measurements as of December 26, 2009 were as follows (in thousands):
| Level 1 | Level 2 | Level 3 | Totals | |||||||
| Land |
— | — | $ | 719 | $ | 719 | ||||
| Building |
— | — | 1,515 | 1,515 | ||||||
| Fixtures and equipment |
— | — | 102 | 102 | ||||||
| Leasehold improvements |
— | — | 89 | 89 | ||||||
| Total assets at fair value |
— | — | $ | 2,425 | $ | 2,425 | ||||
During the fourth quarter of 2009, the Company’s experienced a triggering event for an impairment evaluation for long-lived assets. The triggering event that resulted in the fourth quarter impairment evaluation was due to the continued decline in the economic environment which was disproportionately affecting certain restaurants, coupled with the shortfall of anticipated fourth quarter improvements for those restaurants, which ultimately led to the lowering of future anticipated results for the affected restaurants. The Company recorded impairment charges of $19.8 million including the impairment of fixtures, equipment, and leasehold improvements at eight restaurants. The Company used the market participant pricing approach to estimate the fair value of land, building, fixtures and equipment, and leasehold improvements, which estimates what a potential buyer would pay today. When available, current market information, like comparative sales price, was used to determine value. When market information was not readily available, the inputs were based on the Company’s understanding of market conditions and the experience of the management team. Actual results could differ significantly from the Company’s estimates.
During the second quarter of 2009, the Company incurred exit costs of $0.1 million associated with the closing of one restaurant, and a net credit of $0.2 million attributable to the sale of leasehold improvements and subleasing of another restaurant. Restructuring charges in the amount of $0.6 million were incurred related to severance and other termination benefits paid to employees during the first three quarters of 2009.
In 2008, the Company recorded an impairment charge of $2.8 million related to the impairment of fixtures, equipment, and leasehold improvements at two of its restaurants and a restructuring charge in the amount of $0.5 million related to the closure of one of its restaurants. The restructuring charge was related to exit costs, including the estimated liability on its operating lease that terminates in June 2016. The Company has sublet the property in order to minimize net costs incurred over the remaining term of the lease.
In 2008, the impairment evaluation for goodwill and indefinite lived intangible assets, which for the Company are trademarks and tradenames, was conducted during the fourth quarter. The valuation approach was subject to key judgments and assumptions that are sensitive to change such as judgments and assumptions about the Company’s appropriate revenue growth rates, operating margins, weighted average cost of capital (“WACC”), and comparable company market multiples. When developing these key judgments and assumptions, the Company considered economic, operational and market conditions that could impact the fair value of the Company. However, estimates are inherently uncertain and represent only management’s reasonable expectations regarding future developments.
The Company considered the relationship between its market capitalization and its book value, among other factors, when reviewing for indicators of impairment. The Company believed that the weakness in the U.S. residential housing and financial markets were principal factors in the prolonged decline in its market
64
Table of Contents
McCormick & Schmick’s Seafood Restaurants, Inc. and Subsidiaries
Notes to Consolidated Financial Statements—(Continued)
capitalization as compared to its book value. As of December 27, 2008, the fair value of the Company was estimated to approximate its market capitalization plus a reasonable control premium. The Company’s adjusted market capitalization is based the average closing stock price for the 15 days of trading prior to the year ended, December 27, 2008. The Company believed the control premium represented the estimated amount an investor would pay for its equity securities to obtain a controlling interest. The criteria used to derive the control premium included calculated control premiums for recent transactions of companies within our peer group.
The Company completed the impairment test on balances as of December 27, 2008, and determined that there was an impairment related to trademarks and tradenames, of $54.4 million, and goodwill, of $26.2 million, based primarily on the difference between its adjusted market capitalization and the carrying value of its assets.
In 2007, the Company recorded an impairment charge of $5.4 million related to the impairment of fixtures, equipment, and leasehold improvements at three restaurants.
A summary of impairment/restructuring charges incurred were as follows:
| Years Ended | |||||||||
| December 29, 2007 |
December 27, 2008 |
December 26, 2009 | |||||||
| (in millions) | |||||||||
| Impairment of goodwill |
$ | — | $ | 26.2 | $ | — | |||
| Impairment of long lived assets |
5.4 | 2.8 | 19.8 | ||||||
| Impairment of trademarks and tradenames |
— | 54.4 | — | ||||||
| Restructuring charge |
— | 0.5 | 0.6 | ||||||
| Total impairment/restructuring charges |
$ | 5.4 | $ | 83.9 | $ | 20.4 | |||
14. Employee Benefit Plans
The Company has a 401(k) contributory benefit plan for eligible employees, under which the Company may make discretionary contributions up to a maximum of 3% of the participant’s eligible compensation. For the years ended December 29, 2007 and December 27, 2008, Company matching contributions totaled approximately $0.4 million and $0.5 million. There were no matching contributions made for the year ended December 26, 2009.
15. Operating Leases
The Company generally operates its restaurants in leased premises. The typical restaurant premises lease is for an initial term between 10 and 20 years with one to three five-year renewal options. The leases generally require the Company to pay property taxes, utilities, and various other use and occupancy costs.
Minimum rent payments under lease commitments as of December 26, 2009 are as follows:
| (in thousands) | |||
| 2010 |
$ | 28,029 | |
| 2011 |
27,953 | ||
| 2012 |
27,685 | ||
| 2013 |
25,701 | ||
| 2014 |
23,316 | ||
| Thereafter |
102,657 | ||
| $ | 235,341 | ||
65
Table of Contents
McCormick & Schmick’s Seafood Restaurants, Inc. and Subsidiaries
Notes to Consolidated Financial Statements—(Continued)
Rent expense charged to operations under all operating leases is as follows:
| Year Ended | |||||||||
| December 29, 2007 |
December 27, 2008 |
December 26, 2009 | |||||||
| (in thousands) | |||||||||
| Fixed rent |
$ | 20,905 | $ | 24,930 | $ | 26,964 | |||
| Contingent rent, based on revenues |
2,975 | 2,386 | 1,462 | ||||||
| Non-cash rent |
2,403 | 2,102 | 1,701 | ||||||
| $ | 26,283 | $ | 29,418 | $ | 30,127 | ||||
16. Foreign Currency
The Canadian dollar is the functional currency of the Company’s subsidiary in Canada. All assets and liabilities of the subsidiary are translated at the prevailing exchange rate in effect at each applicable fiscal reporting period. Revenues and expenses are translated at the average rate of exchange for the applicable fiscal reporting period. Translation adjustments arising from the use of different exchange rates from period to period are included in other comprehensive income (loss) in stockholders’ equity. Gains and losses resulting from foreign currency transactions are included in the Company’s results of operations.
17. Recent Accounting Pronouncements
In May 2009, the FASB issued ASC 855-10-25-01, to establish general standards of accounting for disclosure of events that occur after the balance sheet date but before financial statements are issued or are available to be issued. The standard is effective for interim or annual financial periods ending after June 15, 2009. The Company adopted ASC 855-10-25-01 effective with the interim report for the period ended September 26, 2009. The Company has performed an evaluation of subsequent events. No non-recognized subsequent events were noted.
In January 2010, the FASB issued updated guidance related to fair value measurements and disclosures, which requires a reporting entity to disclose separately the amounts of significant transfers in and out of Level 1 and Level 2 fair value measurements and to describe the reasons for the transfers. In addition, in the reconciliation for fair value measurements using significant unobservable inputs, or Level 3, a reporting entity should disclose separately information about purchases, sales, issuances and settlements (that is, on a gross basis rather than one net number). The updated guidance also requires that an entity should provide fair value measurement disclosures for each class of assets and liabilities and disclosures about the valuation techniques and inputs used to measure fair value for both recurring and non-recurring fair value measurements for Level 2 and Level 3 fair value measurements. The updated guidance is effective for interim or annual financial reporting periods beginning after December 15, 2009, except for the disclosures about purchases, sales, issuances and settlements in the roll forward activity in Level 3 fair value measurements, which are effective for fiscal years beginning after December 15, 2010 and for interim periods within those fiscal years. The Company does not expect adoption of the updated guidance to have a material impact on its consolidated results of operations or financial condition.
66
Table of Contents
ITEM 9. CHANGES IN AND DISAGREEMENTS WITH ACCOUNTANTS ON ACCOUNTING AND FINANCIAL DISCLOSURE
None.
ITEM 9A. CONTROLS AND PROCEDURES
Evaluation of Disclosure Controls and Procedures
Our management has evaluated, under the supervision and with the participation of our chief executive officer and chief financial officer, the effectiveness of our disclosure controls and procedures as of the end of the period covered by this report pursuant to Rule 13a-15(b) under the Securities Exchange Act of 1934 (the “Exchange Act”). Based on that evaluation, our chief executive officer and chief financial officer have concluded that, as of the end of the period covered by this report, our disclosure controls and procedures are effective in ensuring that information required to be disclosed in our Exchange Act reports is (1) recorded, processed, summarized and reported within the time periods specified in the Securities and Exchange Commission’s rules and forms, and (2) accumulated and communicated to our management, including our chief executive officer and chief financial officer, as appropriate to allow timely decisions regarding required disclosure.
Report of Management on Internal Control Over Financial Reporting
Our management is responsible for establishing and maintaining adequate internal control over financial reporting, as defined in Rule 13a-15(f) under the Exchange Act.
Under the supervision and with the participation of our management, we assessed the effectiveness of internal controls over financial reporting as of December 26, 2009. In making this assessment, we used the criteria set forth by the Committee of Sponsoring Organizations of the Treadway Commission in Internal Control—Integrated Framework. Based on our assessment we determined that, as of December 26, 2009, our internal control over financial reporting is effective based on those criteria.
PricewaterhouseCoopers LLP, our independent registered public accounting firm, has issued an audit report on our management’s assessment of the effectiveness of our internal control over financial reporting as of December 26, 2009 which is included in the Report of Independent Registered Public Accounting Firm contained in Item 8.
Changes in Internal Control Over Financial Reporting
There has been no change in our internal control over financial reporting that occurred in our fiscal quarter ended December 26, 2009 that has materially affected, or is reasonably likely to materially affect, our internal control over financial reporting.
None.
67
Table of Contents
ITEM 10. DIRECTORS, EXECUTIVE OFFICERS AND CORPORATE GOVERNANCE
Information about our directors is incorporated by reference to our definitive proxy statement for our 2010 annual meeting of stockholders (the “2010 Proxy Statement”), under the caption “Proposal 1: Election of Directors,” to be filed pursuant to Regulation 14A under the Securities Exchange Act of 1934, which proxy statement we expect to file no later than 120 days after the end of our fiscal year ended December 26, 2009. Information with respect to our executive officers is included under Item 4A of Part I of this report.
Information regarding our audit committee and our audit committee financial expert is incorporated by reference to the 2010 Proxy Statement under the captions “Corporate Governance—Board Committees” and “Report of the Audit Committee”.
Information regarding the process by which shareholders may nominate directors is incorporated by reference to the 2010 Proxy Statement under the caption “Additional Information—Stockholder Nominations for Directors”.
Information regarding disclosure of compliance with Section 16(a) of the Securities Exchange Act of 1934 is incorporated by reference to the 2010 Proxy Statement.
We have adopted a Business and Ethics Code of Conduct for the guidance of our directors, officers, and employees, including our principal executive, financial and accounting officers and our controller. Our code of conduct, along with other corporate governance documents, is posted on our website at www.McCormickandSchmicks.com, Investors, Corporate Governance. Any waivers or amendments to our code of conduct will be posted on our website.
ITEM 11. EXECUTIVE COMPENSATION
Information regarding executive compensation is incorporated by reference to the 2010 Proxy Statement.
ITEM 12. SECURITY OWNERSHIP OF CERTAIN BENEFICIAL OWNERS AND MANAGEMENT AND RELATED STOCKHOLDER MATTERS
Information setting forth the security ownership of certain beneficial owners and management is incorporated by reference to our 2010 Proxy Statement under the caption “Security Ownership of Certain Beneficial Owners and Management”.
Information regarding our share based compensation plan is included in Item 5 of this Annual Report on Form 10-K.
ITEM 13. CERTAIN RELATIONSHIPS AND RELATED TRANSACTIONS, AND DIRECTOR INDEPENDENCE
Information regarding certain relationships and related transactions, and director independence is incorporated by reference to our 2010 Proxy Statement under the caption “Corporate Governance—Director Independence” and “Transactions with Related Persons, Promoters, and Certain Control Persons”.
ITEM 14. PRINCIPAL ACCOUNTANT FEES AND SERVICES
Information regarding principal accountant fees and services, appearing under the caption “Report of the Audit Committee—Fees Paid to Independent Registered Public Accounting Firm,” is incorporated by reference to our 2010 Proxy Statement.
68
Table of Contents
ITEM 15. EXHIBITS AND FINANCIAL STATEMENT SCHEDULES
(a)(1) and (a)(2) Financial Statements. The Financial Statements of the Company are filed in Part II—Item 8 of this Annual Report on Form 10-K. The Financial Statement schedules have been omitted because they are not required or because the information required to be set forth therein is included in the Consolidated Financial Statements or Notes thereto.
(a)(3) Exhibits. See Exhibit Index beginning on page 71 for a description of the documents that are filed as Exhibits to this Annual Report on Form 10-K or incorporated herein by reference.
69
Table of Contents
Pursuant to the requirements of Section 13 or 15(d) of the Securities Exchange Act of 1934, the registrant has duly caused this report to be signed on its behalf by the undersigned, thereunto duly authorized, as of March 8, 2010.
| MCCORMICK & SCHMICK’S SEAFOOD RESTAURANT, INC. | ||||
| By: | /s/ WILLIAM T. FREEMAN | |||
| William T. Freeman | ||||
| Chief Executive Officer (Principal Executive Officer) |
||||
| MCCORMICK & SCHMICK’S SEAFOOD RESTAURANT, INC. | ||||
| By: | /s/ MICHELLE M. LANTOW | |||
| Michelle M. Lantow | ||||
| Chief Financial Officer (Principal Financial and Accounting Officer) |
||||
Pursuant to the requirements of the Securities Exchange Act of 1934, this report has been signed by the following persons on behalf of the registrant and in the capacities indicated as of March 8, 2010.
| Signatures |
Title | |
| /s/ WILLIAM T. FREEMAN William T. Freeman |
Chief Executive Officer (Principal Executive Officer) | |
| /s/ MICHELLE M. LANTOW Michelle M. Lantow |
Chief Financial Officer (Principal Financial | |
| /s/ DOUGLAS L. SCHMICK Douglas L. Schmick |
Director (Chairman of the Board of Directors) | |
| /s/ J. RICE EDMONDS J. Rice Edmonds |
Director | |
| /s/ ELLIOTT H. JURGENSEN JR. Elliott H. Jurgensen Jr. |
Director | |
| /s/ JEFFREY D. KLEIN Jeffrey D. Klein |
Director | |
| /s/ JAMES R. PARISH James R. Parish |
Director | |
| /s/ DAVID B. PITTAWAY David B. Pittaway |
Director | |
70
Table of Contents
Items identified with an asterisk (*) are management contracts or compensatory plans or arrangements.
| 3.1 | Certificate of Incorporation of McCormick & Schmick’s Seafood Restaurants, Inc., as amended (incorporated by reference to Exhibit 3.1 to our registration statement on Form S-1, File No. 333-114977) | |
| 3.2 | Amended and Restated Bylaws of McCormick & Schmick’s Seafood Restaurants, Inc., as amended (incorporated by reference to Exhibit 3.1 to our current report on Form 8-K dated April 17, 2009) | |
| 10.1 | Amended and Restated Revolving Credit Agreement dated December 28, 2007 among McCormick & Schmick Acquisition Corp. and The Boathouse Restaurants of Canada, Inc., as borrowers, Bank of America, N.A., as administrative agent and collateral agent, Banc of America Securities LLC, as sole lead arranger, and other specified lenders (incorporated by reference to Exhibit 10.1 to our current report on Form 8-K filed January 2, 2008); Amendment No. 1 to Amended and Restated Credit Agreement dated March 7, 2008 (incorporated by reference to Exhibit 10.1 to our annual report on Form 10-K for the period ended December 27, 2008); Amendment No. 2 to Amended and Restated Credit Agreement dated January 29, 2009 (incorporated by reference to Exhibit 10.1 to our current report on Form 8-K filed January 30, 2009) | |
| 10.2 | Retail Lease Agreement, dated as of February 14, 1985, between Harborside Partners, LLC, as successor in interest to Cornerstone Development Company, and McCormick & Schmick Restaurant Corp., as successor in interest to the Cornerstone-McCormick Joint Venture dba Harborside Restaurant, and Amendments 4 and 5 thereto (incorporated by reference to Exhibit 10.10 to our registration statement on Form S-1, file No. 333-114977) | |
| 10.3 | Lease, dated June 18, 2004, between DLS Investments, LLC and McCormick & Schmick Restaurant Corp. (incorporated by reference to Exhibit 10.11 to our registration statement on Form S-1, file No. 333-114977) and Amendment to Lease dated November 23, 2005 between DLS Investments, LLC and the Company (incorporated by reference to Exhibit 10.2 to our current report on Form 8-K dated November 23, 2005) | |
| 10.4* | Form of Amended and Restated Executive Severance Agreement entered into by Douglas L. Schmick and McCormick & Schmick’s Seafood Restaurants, Inc. (incorporated by reference to Exhibit 10.4 to our annual report on Form 10-K for the fiscal year ended December 27, 2008) | |
| 10.5* | Employment Agreement between McCormick & Schmick’s Seafood Restaurants, Inc. and William T. Freeman dated November 13, 2008; Executive Severance and Non-Competition Agreement between McCormick & Schmick’s Seafood Restaurants, Inc. and William T. Freeman dated November 13, 2008 (incorporated by reference to Exhibit 10.5 to our annual report on Form 10-K for the fiscal year ended December 27, 2008) | |
| 10.6* | Employment Agreement between McCormick & Schmick’s Seafood Restaurants, Inc. and Michelle M. Lantow dated November 16, 2009; Executive Severance and Noncompetition Agreement between McCormick & Schmick’s Seafood Restaurants, Inc. and Michelle M. Lantow dated November 16, 2009 | |
| 10.7* | McCormick & Schmick’s Seafood Restaurants, Inc. 2004 Stock Incentive Plan (incorporated by reference to Exhibit 10.16 to our registration statement on Form S-1, file No. 333-114977) | |
| 10.8* | Form of McCormick & Schmick’s Seafood Restaurants, Inc. Incentive Stock Option Agreement; form of McCormick & Schmick’s Seafood Restaurants, Inc. Non-Statutory Stock Option Agreement (incorporated by reference to Exhibit 10.17 to our registration statement on Form S-1, file No. 333-114977) | |
| 10.9* | Form of Restricted Stock Agreement, as amended (incorporated by reference to Exhibit 10.1 to our quarterly report on Form 10-Q for the period ended July 1, 2006) | |
71
Table of Contents
| 10.10* | Form of Restricted Stock Agreement with Non-Employee Directors (incorporated by reference to Exhibit 10.1 to our quarterly report on Form 10-Q for the period ended March 29, 2008) | |
| 21.1 | Subsidiaries of McCormick & Schmick’s Seafood Restaurants, Inc. | |
| 23.1 | Consent of PricewaterhouseCoopers LLP | |
| 31.1 | Certification of the Chief Executive Officer pursuant to Rule 13a-14(a) of the Securities Exchange Act of 1934, as adopted pursuant to Section 302 of the Sarbanes-Oxley Act of 2002. | |
| 31.2 | Certification of the Chief Financial Officer pursuant to Rule 13a-14(a) of the Securities Exchange Act of 1934, as adopted pursuant to Section 302 of the Sarbanes-Oxley Act of 2002. | |
| 32.1 | Certification of the Chief Executive Officer pursuant to 18 U.S.C. Section 1350, as adopted pursuant to Section 906 of the Sarbanes-Oxley Act of 2002. | |
| 32.2 | Certification of the Chief Financial Officer pursuant to 18 U.S.C. Section 1350, as adopted pursuant to Section 906 of the Sarbanes-Oxley Act of 2002. | |
72