Attached files
| file | filename |
|---|---|
| 8-K - FORM 8-K - MOSAIC CO | d8k.htm |
 Credit Suisse Global Ag Productivity Conference Jim Prokopanko, President and Chief Executive Officer March 9, 2010 Exhibit 99.1 |
| 1 Good morning, everyone. I’m delighted to have the opportunity to speak with you
today about Mosaic, the outstanding long-term outlook for the crop
nutrient industry and our strong market position in both Potash and
Phosphates. We’d like to thank Elaine Yip for coverage of the sector and
sponsoring this conference. Following a year of challenging economic events and considerable uncertainty, I’m happy to say 2010 is beginning with greater clarity and direction in the markets we serve. We are
seeing encouraging signs of a return to confidence and optimism in the farm
sector with farmers prepared to invest in the coming planting season.
Mosaic is uniquely positioned as a leading supplier of both potash and phosphate products needed by grain and oilseed producers worldwide. This unique
paring of nutrients will benefit our customers and shareholders.
|
 Slide 2 Safe Harbor Statement This presentation contains forward-looking statements within the meaning of the
Private Securities Litigation Reform Act of 1995. Such statements
include, but are not limited to, statements about future financial and
operating results. Such statements are based upon the current beliefs
and expectations of The Mosaic Company’s management and are subject to significant risks and uncertainties. These risks and uncertainties include but are not limited to the predictability and volatility of, and customer expectations about, agriculture,
fertilizer, raw material, energy and transportation markets that are subject
to competitive and other pressures and the effects of the current
economic and financial turmoil; the level of inventories in the distribution
channels for crop nutrients; changes in foreign currency and exchange rates;
international trade risks; changes in government policy; changes in
environmental and other governmental regulation, including greenhouse gas
regulation; difficulties or delays in receiving, or increased costs of,
necessary governmental permits or approvals; the effectiveness of our
processes for managing our strategic priorities; adverse weather conditions
affecting operations in Central Florida or the Gulf Coast of the United States, including potential hurricanes or excess rainfall; actual costs of asset
retirement, environmental remediation, reclamation or other environmental
regulation differing from management’s current estimates; accidents and
other disruptions involving Mosaic’s operations, including brine
inflows at its Esterhazy, Saskatchewan potash mine and other potential mine
fires, floods, explosions, seismic events or releases of hazardous or volatile chemicals, as well as other risks and uncertainties reported from time to time in The
Mosaic Company’s reports filed with the Securities and Exchange
Commission. Actual results may differ from those set forth in the
forward-looking statements. |
| 2 Before I proceed, I need to remind you that our presentation contains forward-looking
statements. The remarks I make are based on information and
understandings we believe to be accurate as of today’s date, March 9,
2010. Actual results are likely to differ from those set forth in the
forward-looking statements. |
 Slide 3 Strategic Focus Deliver value for shareholders Focus on Potash and Phosphate • Grow Potash • Strengthen Phosphate Maintain a strong balance sheet |
| 3 At Mosaic, our focus is on shareholder value creation, driven by the unquestionable long-term demand for our products. As a global leader in nutrients, Mosaic will benefit from the
expanding worldwide need for food, feed and fuel. At the core of our strategy is a plan to solidify our resource base and invest in the
growth of both phosphate and potash. In Potash, we are pursuing brownfield expansions. In Phosphates, we are focusing on growing the value of our business and maintaining our position as one of the
lowest cost phosphate producers in the world. Our expansive global
distribution network, aligned with our North American production assets,
provides us access to the largest global markets, often on a counter seasonal basis. Over time, the combination of two strong product lines has produced great returns for
our shareholders. Compared to single nutrient focused companies, our
balanced portfolio in phosphates and potash gives us steadier sales volumes
and cash flow in periods where demand for one nutrient may be greater than for another. Both our Phosphates and Potash segments have generated robust results
over the past few years. Supported by our strong balance sheet, we have the financial flexibility required to
expand our global profile in potash and phosphates and are actively pursuing
opportunities to do so. |
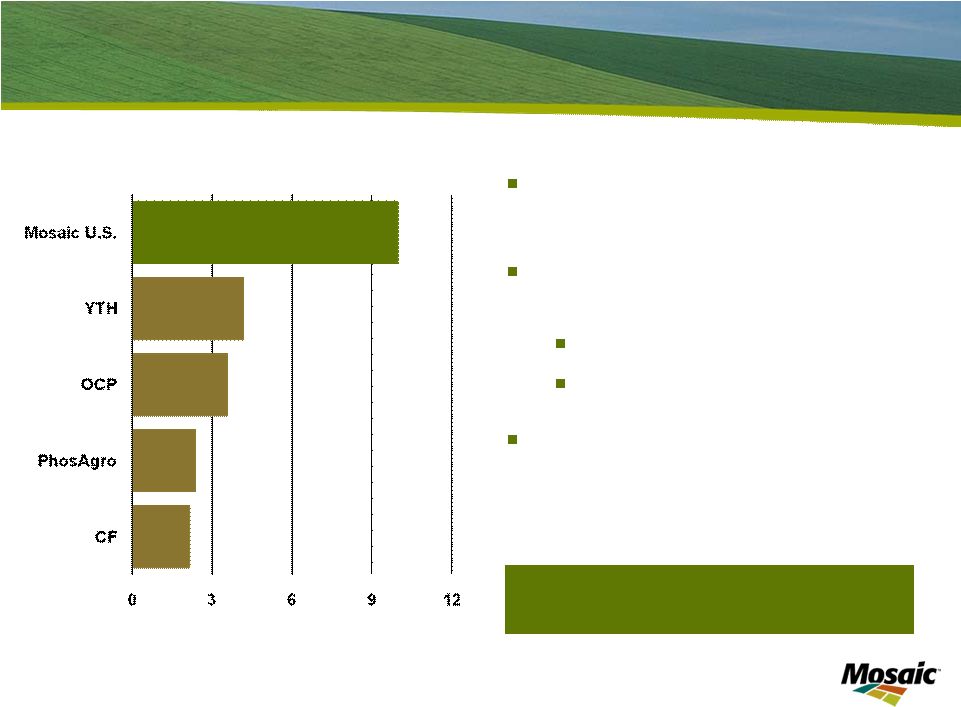
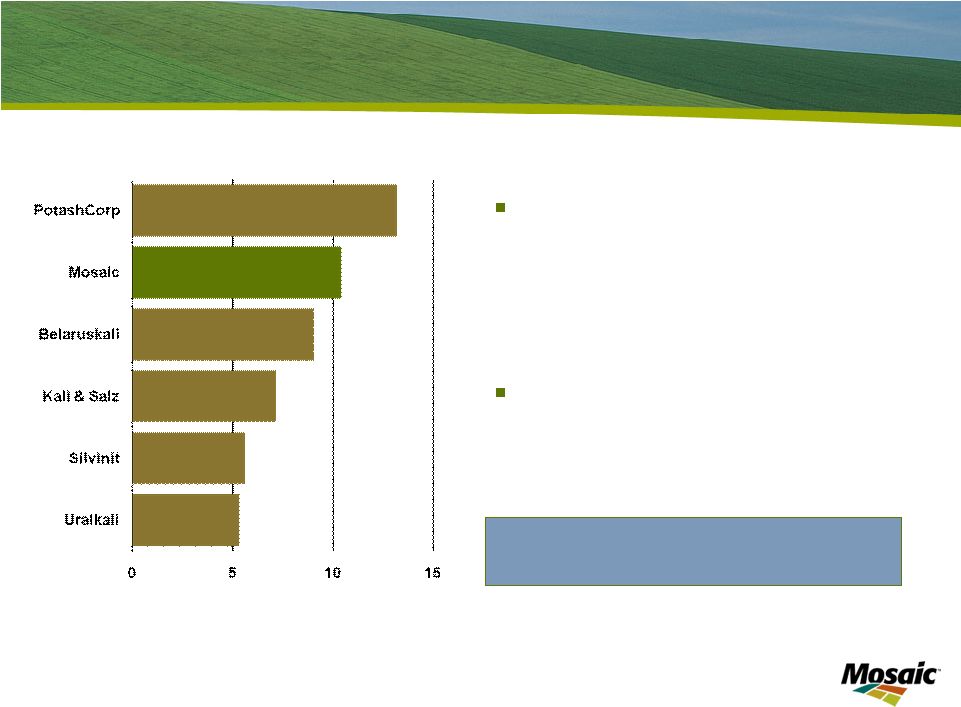 Slide 4 Leading Global Potash Producer Mosaic MOP production • 14% Global • 39% North America • Five mines Competitive industry position World capacity approximates 74 million tonnes (all potash products) Mil tonnes •Potash Fertilizer Capacity Source: Fertecon / Mosaic |
| 4 Let’s first talk about our Potash segment. Mosaic is one of the
world’s top producers of potash with an estimated 14% of global market
share. Potash is produced in only 12 countries in the world, and agricultural giants such as China, India and Brazil depend on imports.
|
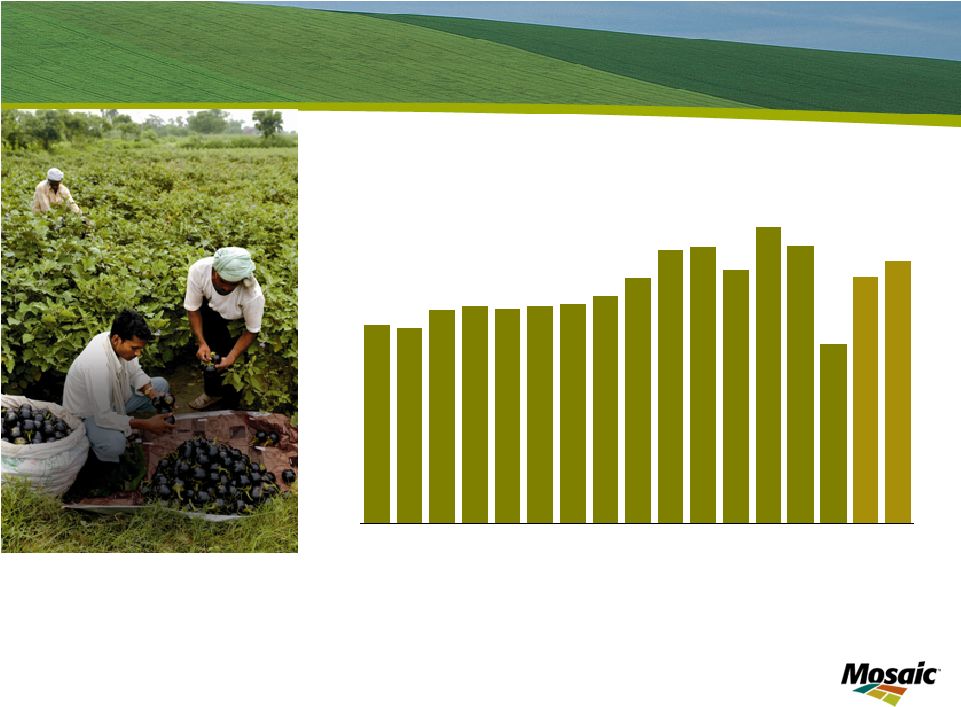 Slide 5 Rebounding Potash Demand World MOP Demand 0 10 20 30 40 50 60 95 96 97 98 99 00 01 02 03 04 05 06 07 08 09F Mil Tonnes Source: Mosaic 10F Low & High Range |
| 5 Following the well documented drop in potash demand last year, we believe potash demand
will rebound sharply in calendar 2010. The nutritional value of potash
is critical to optimize crop yields and increase food production and we
believe the nutrient has been under-applied historically. We project the
potash market to come into balance during the first half of calendar 2010 as the recent decline in potash prices unleashes significant pent-up demand from all corners of
the globe. We are starting to see this with a recent pickup in sales
activity in anticipation of the North American spring planting season. Elsewhere, a couple of weeks ago Canpotex announced the sale of 600 thousand tonnes of MOP to India for delivery in the second calendar quarter. We forecast that global MOP shipments will increase to 46 to 49 million tonnes in calendar 2010 compared to about 30 million tonnes in calendar 2009. The Fertilizer Institute reports that North American producer inventories have declined almost 800 thousand tonnes since the end of November. We project producer stocks to continue to trend downward and inventories likely will
drop to average or even below average levels by mid-year. Longer
term, we expect potash demand to grow between 3% and 3.5% annually.
|
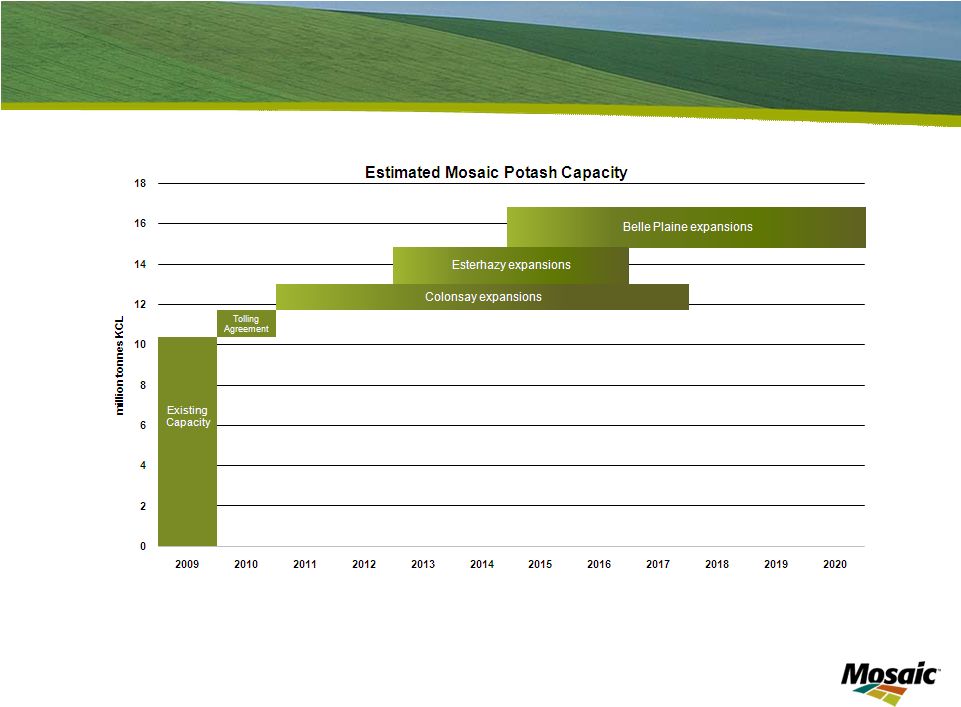 Slide 6 Growth Opportunities - Our Potash Expansions Note: The projected annual capacity includes approximately 1.3 million tonnes
that we currently produce under a third party tolling agreement at our
Esterhazy, Saskatchewan potash mine that will revert to us when the tolling agreement expires. |
| 6 Mosaic has the capacity to meet the increasing demands from the agricultural market.
We currently own enough mineral reserves to run our potash mines for over 100
years. In addition, our ongoing expansions are expected to increase annual
capacity by over five million tonnes by 2020, ensuring that we will maintain
our position as one of the premier potash companies in the world.
We are mindful of the threat of new entrants in this industry and we take
these threats seriously. Time will tell whether these threats become
reality. As a well established, large player in this industry, we believe we are well positioned to bring on new brownfield expansions more economically than greenfield capacity. We certainly know our markets and customers better than a new entrant
would. Notwithstanding the weak potash market of the past year or so, we are
proceeding with our expansion program, as we are confident in the long term
supply/demand outlook. Our expansion program consists of nearly a
dozen discrete, multi-year projects at our three Canadian mine sites, and we can adjust the pace of these projects in response to supply/demand dynamics. In addition, we produce 1.3 million tonnes annually for a competitor under a tolling agreement, which we expect to revert to Mosaic in the near future. When these tonnes revert to Mosaic, we will add 1.3 million tonnes of additional capacity at no additional cost. |
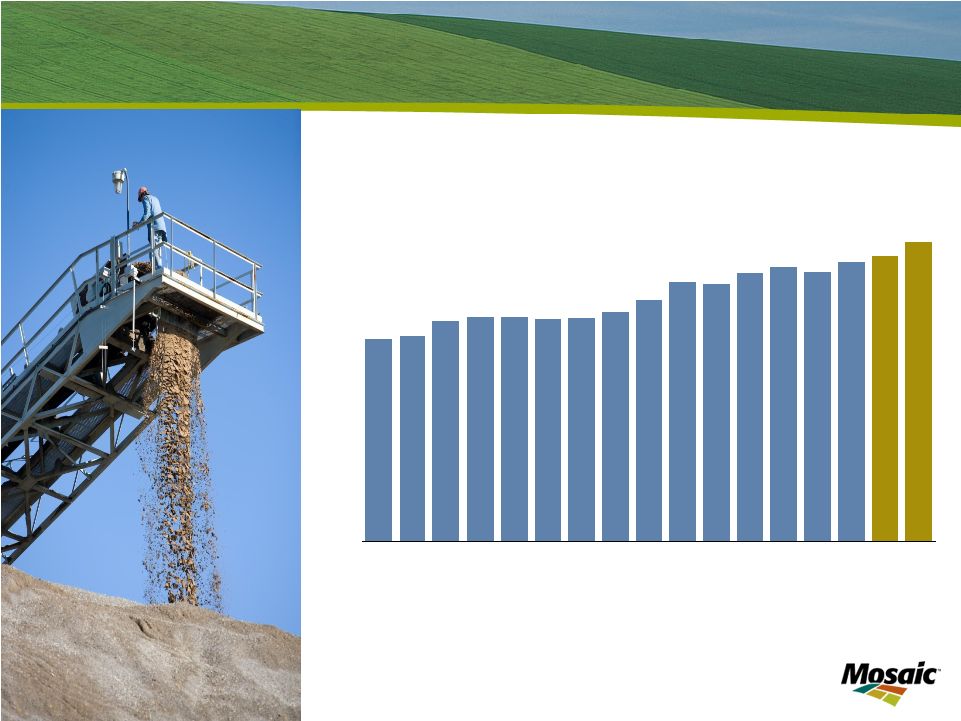
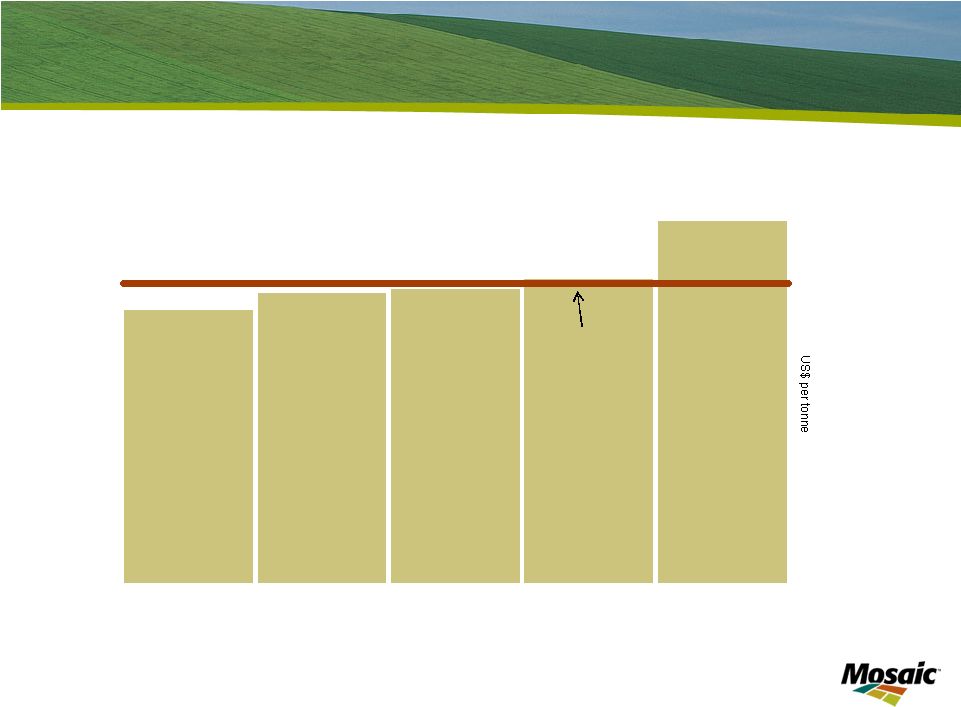 Slide 7 Expansions Improve Mosaic’s Cost Structure 0 10 20 30 40 50 60 Mil tonnes Industry Cost Curve MOP delivered US cornbelt weighted average cost as of June 30, 2009* * Excludes Canadian resource taxes and royalties for all Canadian potash
producers Source: Mosaic Mosaic Average |
| 7 The global potash industry has a relatively flat cost curve. This chart shows estimated cost per tonne for all major potash producers. Mosaic’s potash cost structure is competitive and
should improve as our expansions come on line. The expected increase in sales
and production volumes will leverage the existing assets at our three Canadian mines – thereby driving lower cost per tonne. Our industry leadership, together with our investments to expand capacity, places us in a strong competitive position to leverage the anticipated growth of this market.
|
 Slide 8 World’s Largest Integrated Phosphate Producer World’s largest capacity of finished phosphate fertilizer Mosaic U.S. phosphate production share 14% Globally 59% U.S. World scale & efficient operations World capacity approximates 76 million tonnes (DAP/MAP/TSP) •Phosphate Fertilizer Capacity Mil tonnes Source: Fertecon / Mosaic |
| 8 Now, let’s turn to our Phosphate segment. As a large, vertically integrated
producer, our Phosphate business possesses its own attractive set of
attributes. We have substantial company-owned rock reserves,
granulation capacity, and a worldwide supply chain and distribution network. We have the largest capacity of finished phosphate fertilizer in the world. Mosaic’s rock reserves provide a significant competitive advantage over
non-integrated producers, where rock input costs are significantly
higher than those of Mosaic. A strategic priority for our phosphates business is to secure additional rock sources outside of North America, to maintain this advantage. |
 Slide 9 Phosphate Demand Recovery World Processed Phosphate Demand 0 10 20 30 40 50 60 95 96 97 98 99 00 01 02 03 04 05 06 07 08 09F Mil Tonnes Source: Mosaic DAP, MAP and TSP 10F Low & High Range |
| 9 Demand and price momentum in phosphates had been strong until demand came to an abrupt
halt early last year. Raw material costs reset, lowering selling prices
and causing buyers to back away from the market. This is a story most
of you know well. Now, the phosphates market is recovering nicely. This began
during our fiscal second quarter, especially in Asia and the Americas, as distributors purchased crop nutrients to meet farmer demand. We continue to see good product movement for both application and distributor
inventory. Producer stocks are likely to remain at low levels at least
through May. Prices seem to have bottomed a few months ago, and continue on
an upward trend. As of last Friday, prevailing market DAP selling prices approximate $500 per tonne FOB Tampa. This compares with $380 in early January. |
 Slide 10 Industry Leading Cost Structure in Phosphate 0 5 10 15 20 25 30 Mil tonnes Industry Cost Curve DAP FOB plant/port weighted average cost as of June 30, 2009 Mosaic U.S. Average Source:Mosaic |
| 10 Unlike the potash industry, the phosphate industry cost curve is steeper – and you can see that Mosaic is one of the world’s low cost producers. We are working on a number of operational fronts to maintain that position, as I will discuss further. |
 Slide 11 Phosphate Strategic Priorities Strengthen our competitive position Leverage scale and location Low cost rock Cost advantaged sulfur, competitive ammonia Procurement leverage Operational excellence Maintenance practices Capital deployment Energy use and co-generation capacity Improve coordination of sales and operation planning Extend phosphate reserves |
| 11 In order to strengthen our competitive advantage, we focus on three strategic
priorities: First, we are working on several initiatives to leverage our scale
and geographic location. We have a strong competitive position
due to low rock, and conversion costs and geographic access to sulfur and ammonia. We are also working to better leverage our procurement processes. Next, we are focused on improving our operations. We are implementing
improved processes for maintenance, capital deployment, energy use and
co-generation capacity. In addition, our global sales and
operations teams are working closely to improve production planning. Finally,
we continue work to secure the mineral resource base for our U.S. operations and to obtain advantaged access to rock reserves elsewhere in the world. All of these initiatives are intended to drive stronger cash flow and returns on capital
from our Phosphates segment. |
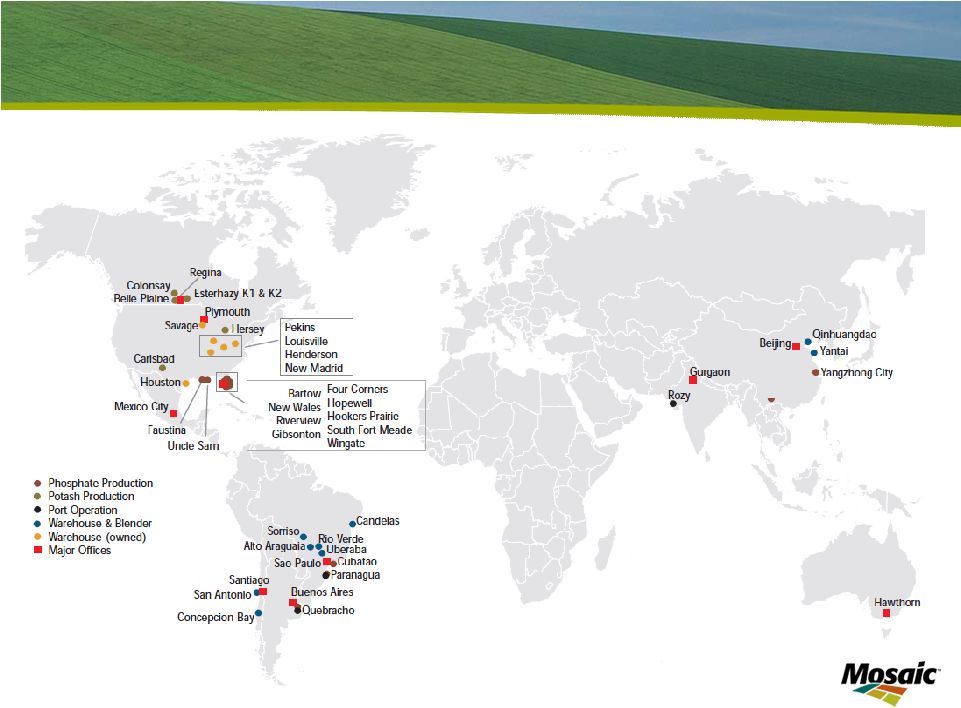 Slide 12 Distribution Assets Aligned with Global Demand |
| 12 Mosaic also has a distribution network without peer in our industry – allowing us to move our products where and when needed, efficiently and cost-effectively. Our industry leading North American distribution capabilities are bolstered by strong
networks in prime growth regions such as Asia and Latin America where we
combine production assets, blending and bagging facilities, ports and other
capabilities. This global network is especially valuable in balancing seasonal demand patterns. It allows us to run our North American production plants more efficiently as we can ship products to key
regions around the world as needed. We are also taking steps to further align our global distribution network with our North
American production assets. Last quarter, we realigned our business
segment reporting to more clearly reflect this strategic change.
Our strategic priorities in Phosphates focus on growing the value of our business
and maintaining our position as one of the lowest cost phosphate producers
in the world |
 Strong Financial Position Cash and Cash Equivalents Less Debt * * See appendix for reconciliation of Cash and Cash Equivalents
|
| 13 As we have discussed, our overall strategy is to capitalize on attractive long-term
agriculture fundamentals by investing in and reengineering our potash and
phosphate businesses. Through the ups and downs of the markets we
serve, we have created long term value through sound capital allocation
decisions. Our strong cash flow has allowed us to remain financially strong during the recent economic downturn. We have demonstrated our willingness and ability to make
investments, to divest non-strategic assets and to return cash to
shareholders, as appropriate. As was announced two weeks ago, the sale of our Fosfertil investment will further strengthen our balance sheet and enhance our flexibility. Expected to close in six to nine months, we expect net cash proceeds from this transaction in the range of $900 million. We are evaluating our strategic priorities and uses for these proceeds. |
 Business Outlook |
| 14 Now I will give a few thoughts on the outlook for the agricultural markets.
|
 Slide 15 Growing Global Affluence + Fuel |
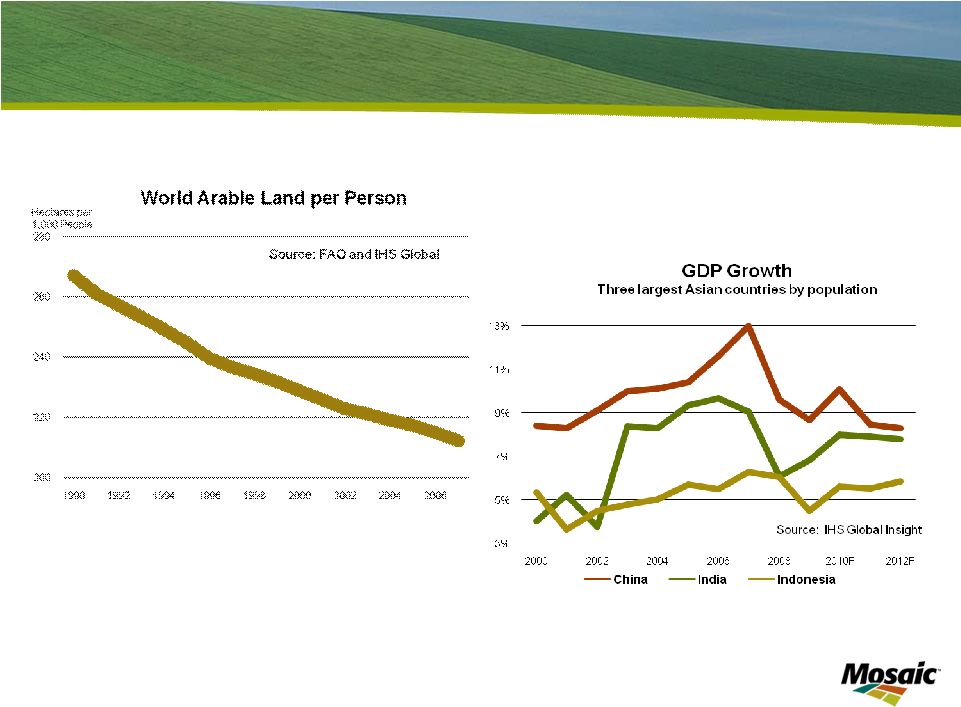
| 15 Long term agricultural fundamentals continue to look positive. We believe several
macro trends will continue to place increasing pressure on the global food
supply. Increasing population is stretching the world’s arable
land. On a per capita basis, arable land has been steadily
declining. In addition, continued economic development means a greater demand
for higher calorie, higher protein diets. The combination of less
arable land per capita and increasing demands for better quality food means
continual pressure on the agricultural sector. Biofuels are another factor placing significant stress on the food supply. In the US, the
ethanol mandate increases from 10.5 billion gallons in 2009 to 12 billion
gallons in 2010. Recent developments in policy indicate a bias for
continued support for corn based ethanol. To meet food and fuel demands,
grain production will need to increase substantially in the future. Improved farming practices, including proper application of crop nutrients, is vital to grow the food the world needs. |
 Slide 16 Growing Grain & Oilseed Use World Grain and Oilseed Production and Use 2.0 2.1 2.2 2.3 2.4 2.5 2.6 2.7 2.8 99/00 00/01 01/02 02/03 03/04 04/05 05/06 06/07 07/08 08/09 09/10 10/11 L 10/11 M 10/11 H Bil Tonnes Production Use Source: USDA and Mosaic 2010/11 Scenario Assumptions Low Medium High Harvested Area Change -0.5% -0.5% -0.5% Yield Deviation from 11-Year Trend Largest Negative 0 Largest Positve Demand Growth 1.5% 2.0% 2.5% |
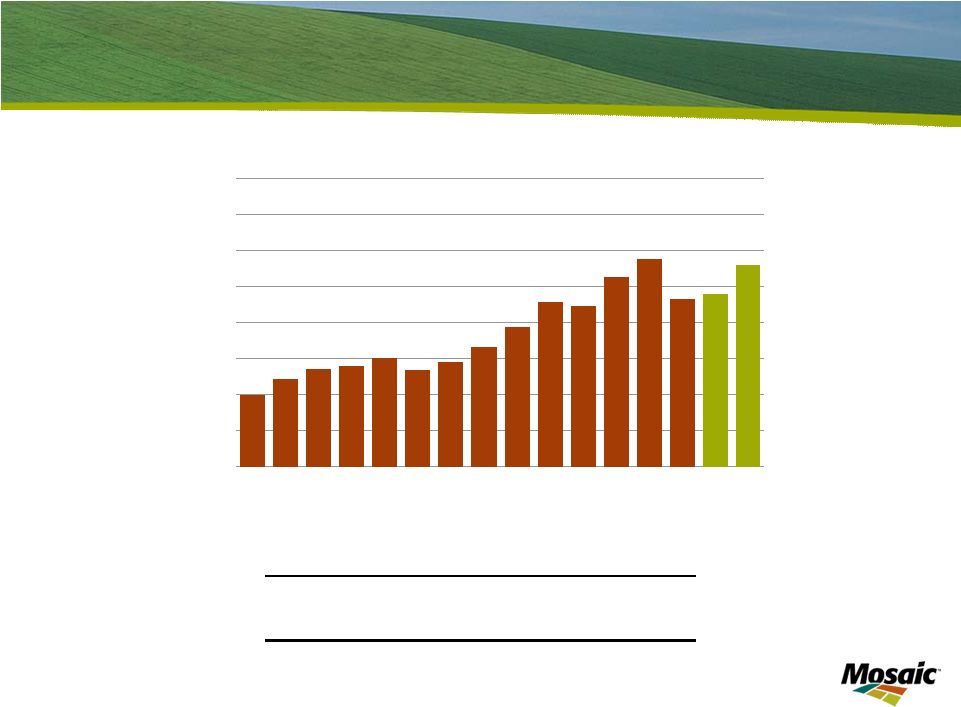
| 16 Here we show the increase in grain and oilseed production and use over the past
decade. As you can see, use has grown slowly, but consistently. History has proven that economic slowdowns don’t have a large negative impact on food consumption – people need to eat whatever the economic climate. On the production side, we have seen significant increases over the past two
years. This growth has come from increased harvested land and above
trend yields. However, as you can see, we need to continue this above
trend growth just to stay even with projected use. |
 Slide 17 More Cushion but Stocks Still Not at Secure Levels World Grain and Oilseed Stocks 250 300 350 400 450 500 550 600 650 99/00 00/01 01/02 02/03 03/04 04/05 05/06 06/07 07/08 08/09 09/10 10/11 L 10/11 M 10/11 H Mil Tonnes 40 50 60 70 80 90 100 110 120 Days of Use Stocks Days of Use Source: USDA and Mosaic 2010/11 Scenario Assumptions Low Medium High Harvested Area Change -0.5% -0.5% -0.5% Yield Deviation from 11-Year Trend Largest Negative 0 Largest Positve Demand Growth 1.5% 2.0% 2.5% |
| 17 Back-to-back bumper crops have built global grain and oilseed stocks and calmed agricultural markets. Supply has responded to higher prices and good weather. Our base forecast assumes a trend yield and a slight decrease in harvested area. We expect the stock to use ratio to remain at a relatively low level. We believe global grain and oilseed stocks still are not at a secure enough level to
withstand weather or other shocks over a period of time. Note that
most of the increase in stocks in the past year has come from wheat.
Stocks in many other commodities remain at low levels. Therefore, we will likely continue to see spikes in some commodity prices. Farmers cannot afford to take their foot off the food production accelerator. |
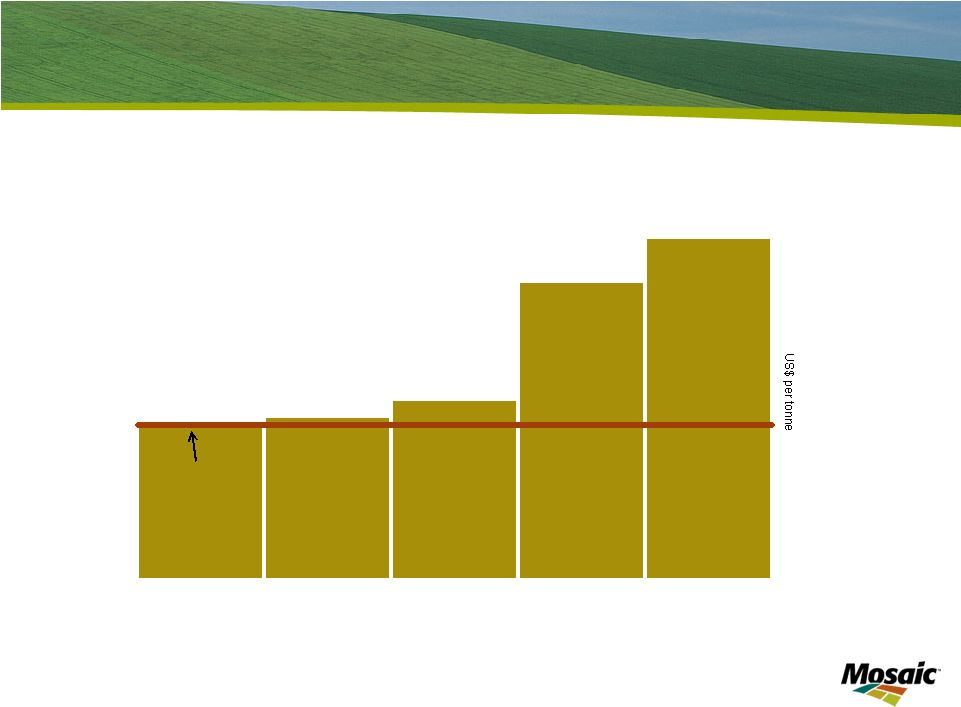
 Slide 18 Farm Economics Key assumptions ISU application rate recommendations 2009 and 2010 crops sold at CBOT closing prices on March 4, 2010 less basis
Fertilizer prices for 2003 - 2009 are from USDA. 2010 fertilizer prices are based on current spot wholesale prices |
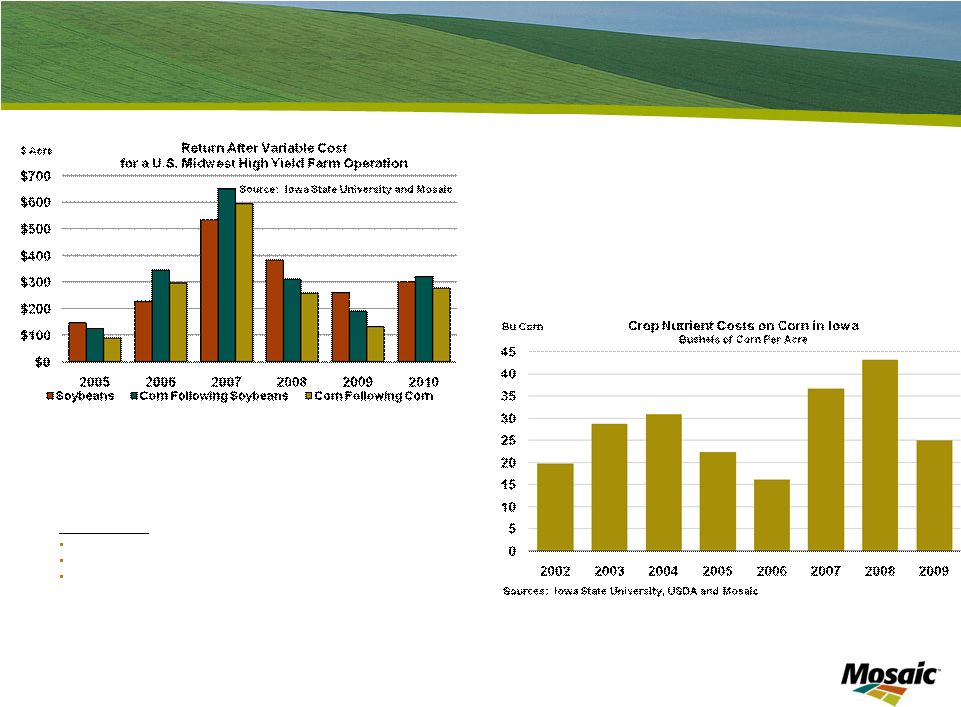
| 18 Farmer economics remain relatively strong despite the recent downward trend in grain
markets. The graph at the left shows farmer profitability. Grain prices
remain at relatively high levels as compared to historical prices. At
the same time, input prices have reset. This has allowed farmers to remain profitable. The graph on the right shows the number of bushels of corn that a farmer would have to
sell in order to pay for crop nutrients. This indicates that the cost
of crop nutrients has declined to the low end of the recent historical
range. |
 Slide 19 Growth Expected to Resume World Nutrient Use 110 120 130 140 150 160 170 180 190 95 96 97 98 99 00 01 02 03 04 05 06 07 08E 09F 10F Source: IFA November 2009 Mil Tonnes 2007/08 2008/09E 2009/10F 2010/11F Nitrogen 3.2% -1.5% 1.6% 2.6% Phosphate 0.1% -10.5% 3.0% 6.2% Potash 6.8% -19.8% -4.5% 13.5% Total 3.1% -6.7% 1.0% 4.9% Changes in World Fertilizer Consumption |
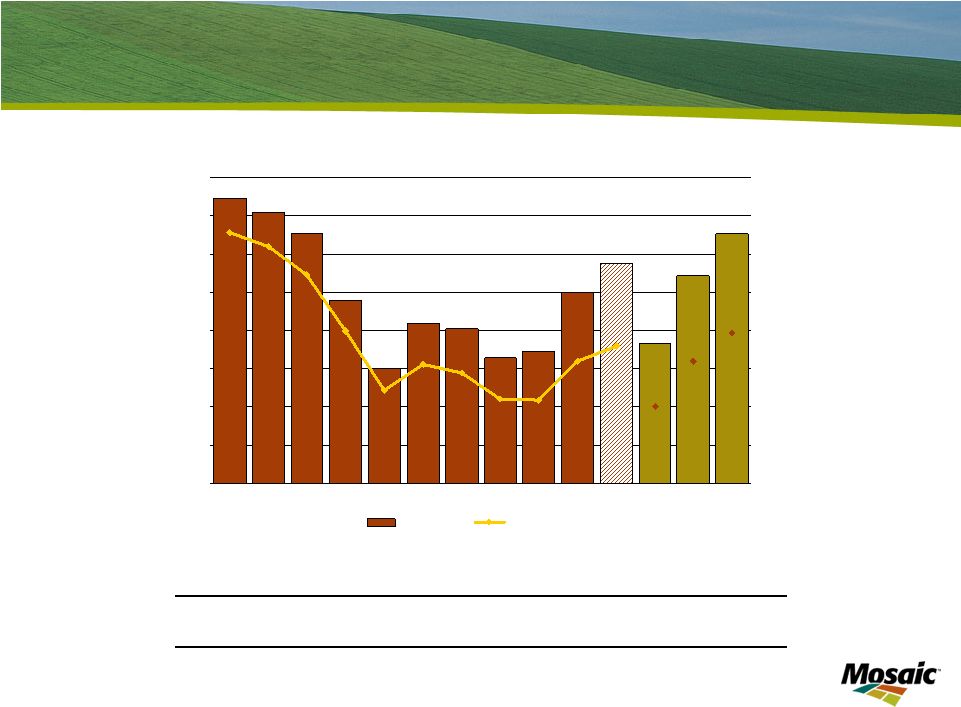
| 19 Following the drop in nutrient use in 2008 and 2009, we expect use to rebound
significantly beginning this year. Over the next several years, the
International Fertilizer Industry Association projects crop nutrient use to
increase 12% over the peak 2007 period. Agronomic science points to the need
for the replenishment of nutrients in the soil, a fact well- understood
by farmers as they plan for this year’s crop. Given favorable demand trends, lower input costs and growing confidence across the supply chain – it is not surprising that we are seeing signs of recovery. |
 Slide 20 Key Takeaways Focus on value creation Global leader with vertically integrated operations Potash growth projects at attractive capital costs Phosphate growth options in rock reserves and acquisitions Encouraging recent market trends |
| 20 In closing, I would like to emphasize several key points about Mosaic. First, we
have managed well through a challenging year while keeping a focus on long
term value creation. Second, we are an established industry leader with
vertically integrated operations, a strong balance sheet and a broad
international presence. Our global scale is unmatched due to our strength in both potash and phosphates. Next, we are making significant investments to grow our capacity in Potash at competitive costs. In addition, we are strengthening our Phosphates business by improving efficiencies at
our plants and mines and exploring opportunities to expand rock reserves
outside North America. Finally, signs suggest a recovery in demand for
nutrients is underway. We expect shipments and applications to return
to more normalized levels in calendar 2010. We remain confident in
Mosaic’s long-term outlook. Agricultural fundamentals remain positive because of continued global demand for food and fuel. We are seeing encouraging signs of a
return to confidence and optimism in the farm sector with farmers prepared to invest in the coming planting season. Mosaic is uniquely positioned as a leading supplier of both potash and
phosphate products needed by agricultural producers worldwide.
|
 Thank you! |
| 21 Thank you for your time this morning. I appreciate you listening to Mosaic’s
story and our outlook for the future. Now I’d be happy to take
questions. |
 Slide 22 Appendix: Cash and Cash Equivalents Less Debt Reconciliation $ in billions Period Ended Cash and Cash Equivalents Short-Term Debt Current Maturities Long-Term Debt Total Debt Net (Debt) Cash August 31, 2007 $ 0.60 $ 0.20 $ 0.50 $ 1.60 $ 2.20 $ (1.60) November 30, 2007 0.60 0.10 0.20 1.40 1.70 (1.00) February 29, 2008 1.10 0.20 - 1.40 1.70 (0.50) May 31, 2008 2.00 0.10 - 1.40 1.60 0.40 August 31, 2008 2.20 0.10 0.10 1.30 1.50 0.70 November 30, 2008 2.80 0.10 - 1.30 1.40 1.40 February 28, 2009 2.50 0.10 - 1.30 1.40 1.10 May 31, 2009 2.70 0.10 - 1.30 1.40 1.30 August 31, 2009 2.60 0.10 - 1.30 1.40 1.20 November 30, 2009 2.60 0.10 - 1.30 1.40 1.20 Source: Cash and cash equivalents from 10Q/10K as filed. Total debt includes Short
term debt, Current maturities of long-term debt, Long-term debt less
current maturities, Long-term debt due to Cargill Inc and affiliates. ********* ********* ******* ****** ****** ****** ****** ****** ****** ****** ****** ****** ****** ****** ****** ****** ****** ** |