Attached files
| file | filename |
|---|---|
| 8-K - COPANO ENERGY, L.L.C. FORM 8-K - Copano Energy, L.L.C. | form8-k.htm |

Copano
Energy
March
Investor Presentation
NASDAQ: CPNO
NASDAQ: CPNO
March
8, 2010

Copano
Energy
2
Disclaimer
Statements made by
representatives of Copano Energy, L.L.C. (“Copano”) during this
presentation will include “forward-looking statements,” as defined in the federal securities laws.
All statements that address activities, events or developments that Copano believes will or may
occur in the future are forward-looking statements. Underlying these statements are assumptions
made by Copano’s management based on their experience and perceptions of historical trends,
current conditions, expected future developments and other factors management believes are
appropriate under the circumstances.
Whether
future results and developments will conform to Copano’s expectations is subject
to a
number of risks and uncertainties, many of which are beyond Copano’s control. If one or more of
these risks or uncertainties materializes, or if underlying assumptions prove incorrect, then
Copano’s actual results may differ materially from those implied or expressed by forward-looking
statements made during this presentation. These risks and uncertainties include the volatility of
prices and market demand for natural gas and natural gas liquids; Copano’s ability to complete
any pending acquisitions and integrate any acquired assets or operations; Copano’s ability to
continue to obtain new sources of natural gas supply; the ability of key producers to continue to
drill and successfully complete and attach new natural gas supplies; Copano’s ability to retain key
customers; the availability of local, intrastate and interstate transportation systems and other
facilities to transport natural gas and natural gas liquids; Copano’s ability to access sources of
liquidity when needed and to obtain additional financing, if necessary, on acceptable terms; the
effectiveness of Copano’s hedging program; unanticipated environmental or other liability;
general economic conditions; the effects of government regulations and policies; and other
financial, operational and legal risks and uncertainties detailed from time to time in the Risk
Factors sections of Copano’s annual and quarterly reports filed with the Securities and Exchange
Commission.
Copano
undertakes no obligation to update any forward-looking statements, whether as a
result
of new information or future events.
of new information or future events.

Copano
Energy
3
Introduction to
Copano
• Independent
midstream company founded in 1992
– Best in class
service to customers
– Entrepreneurial
approach
– Focus on long-term
accretive growth
• Provides midstream
services in multiple producing areas
through three operating segments
through three operating segments
– Texas
• South Texas
conventional and Eagle Ford Shale
• North Texas Barnett
Shale Combo play
– Central and Eastern
Oklahoma
• Conventional, Hunton
De-Watering play and Woodford Shale
– Rocky
Mountains
• Powder River
Basin

Copano
Energy
4
Key
Metrics
• Service throughput
volumes
approximate 2 Bcf/d
of natural gas(1)
• Approximately 6,700
miles of active pipelines
• 7 natural gas
processing plants with over 1.1 Bcf/d of combined
processing capacity
processing capacity
• One NGL
fractionation facility with total capacity of 22,000 Bbls/d
(in-service expected end of Q1 2010)
(in-service expected end of Q1 2010)
• Equity market cap:
$1.5 billion(2)
• Enterprise value:
$2.3 billion(2)
(1) Based
on 4Q 2009 results. Includes
unconsolidated affiliates.
(2) As
of March 4, 2010. Reflects
March 2010 equity offering.
Copano
Energy
5
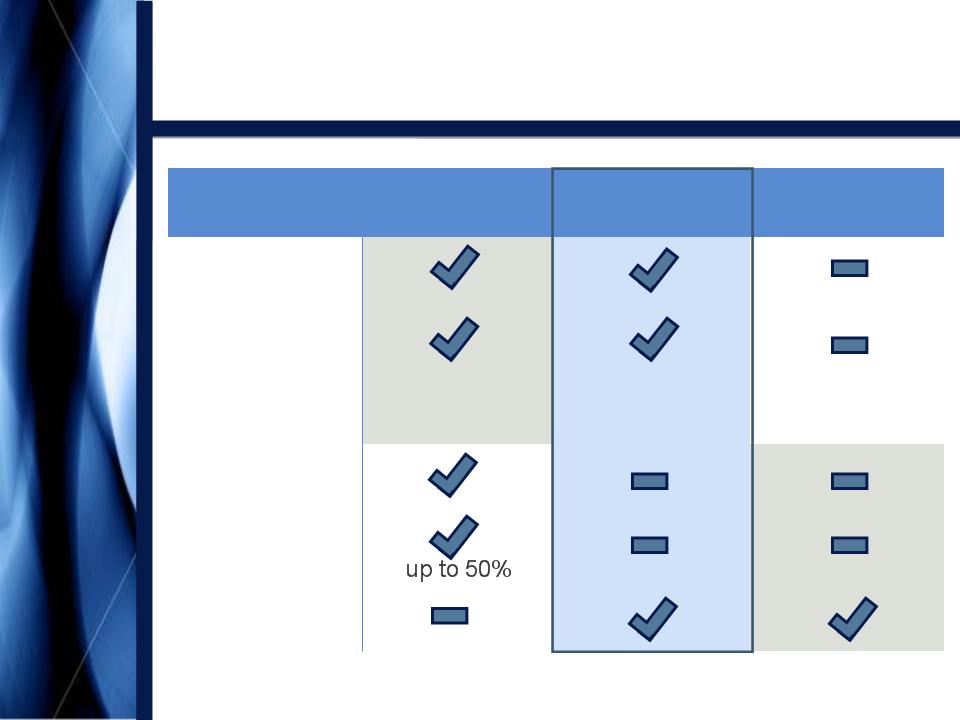
Copano’s LLC
Structure
|
Characteristic
|
Typical
MLP
|
Copano
Energy
|
Typical
Corporation |
|
Non-Taxable
Entity |
|
|
|
|
Tax Shield
on
Distributions |
|
|
|
|
Tax
Reporting
|
|
|
|
|
General
Partner
|
|
|
|
|
Incentive
Distribution Rights |
|
|
|
|
Voting
Rights
|
|
|
|
Schedule
K-1
Schedule
K-1
Form
1099

Copano
Energy
6
Agenda
2010
Regional
Outlook
Outlook
Commodity
Prices and
Margin
Sensitivities
Prices and
Margin
Sensitivities
Financing
and
Commodity Risk
Management
Commodity Risk
Management
Distribution
Outlook and
Conclusions
Outlook and
Conclusions

Copano
Energy
7
• Overall focus was
maintaining liquidity and watching costs - enabled
Copano to maintain distributions
Copano to maintain distributions
– 2009 total
distributable cash flow coverage averaged 107% - all
quarters in excess of 100% coverage
quarters in excess of 100% coverage
• Copano’s hedging
strategy supported 2009 cash flow
– Option-focused and
product-specific
– Strategy protects
downside, without the loss of upside
• Volumes - 2009 vs.
2008
– 2009 total service
throughput volumes(1)
declined 4%
• Most significant
declines seen in lower-margin third-party volumes in Texas
and Woodford Shale gas in Oklahoma
and Woodford Shale gas in Oklahoma
– NGL volumes(1) increased by
9%
• Volumes stabilized
as NGL pricing strengthened in 2009 relative to lows in
late 2008/early 2009
late 2008/early 2009
2009
Review
(1) Includes
unconsolidated affiliates.

Copano
Energy
8
• North
Texas
– Significant drilling
and development activity in the Barnett
Shale Combo play
Shale Combo play
• South
Texas
– Ramp up of Eagle
Ford Shale directed drilling
• Oklahoma
– Moderate drilling
activity behind both the Hunton De-Watering
and Woodford Shale plays
and Woodford Shale plays
• Rocky
Mountains
– Minimal new
drilling; flat volumes
2010
Outlook
Copano
Energy
9
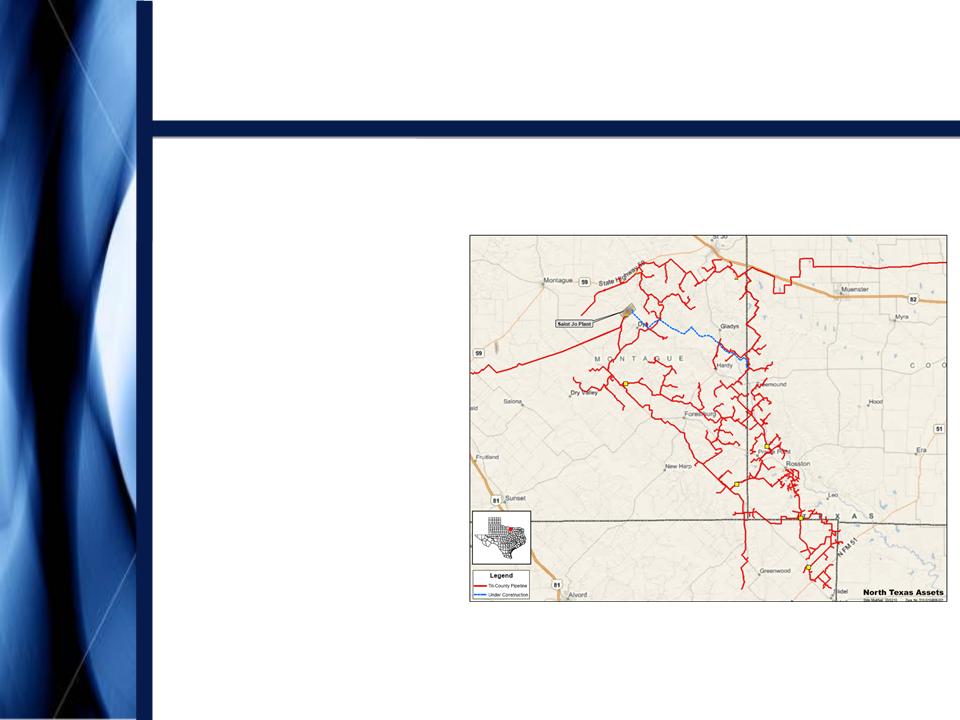
North
Texas Outlook
• 9 rigs running in
the
area with as many as 3
more anticipated later
this year
area with as many as 3
more anticipated later
this year
• Drilling economics
are
driven by associated
crude oil production
driven by associated
crude oil production
• Production from
this
area requires a full slate
of midstream services
area requires a full slate
of midstream services
• Based on
producer
drilling schedule, expect
steady increase in plant
inlet volumes in 2010
drilling schedule, expect
steady increase in plant
inlet volumes in 2010
Copano
Energy
10
North
Texas Recent Developments
• Recently executed
key producer
contract
contract
– Long-term gathering,
treating and
processing agreement
processing agreement
– Fee-for-service
contract
• No incremental
hedging costs
– Highly rated
producer
• Additional 50 MMcf/d
of compression
expected in service 4Q 2010, bringing
total plant capacity to 100 MMcf/d
expected in service 4Q 2010, bringing
total plant capacity to 100 MMcf/d
• Approximately $30
million in expansion
capex for 2010 (compression and
pipelines)
capex for 2010 (compression and
pipelines)
• $25 - $30 million in
fee-based cash flow
expected by year-end 2010 on an
annualized basis
expected by year-end 2010 on an
annualized basis

Copano
Energy
11
South
Texas Outlook
• In 4Q 2009,
announced plans for a joint venture with Kinder
Morgan to provide gathering, transportation and processing
services to gas producers in the Eagle Ford Shale. Producer
decisions to commit have been delayed by:
Morgan to provide gathering, transportation and processing
services to gas producers in the Eagle Ford Shale. Producer
decisions to commit have been delayed by:
– Gas quality
variability
– Desire to seek
capital partners (in case of small to mid-sized
producers)
producers)
• Connected a third
Eagle Ford Shale well in 1Q 2010, which IP’d
at 17 MMcf/d
at 17 MMcf/d
• 1Q 2010 pipeline
throughput volumes are expected to be higher
compared to 4Q 2009 due to recently connected Eagle Ford wells
and other drilling behind legacy systems
compared to 4Q 2009 due to recently connected Eagle Ford wells
and other drilling behind legacy systems
Copano
Energy
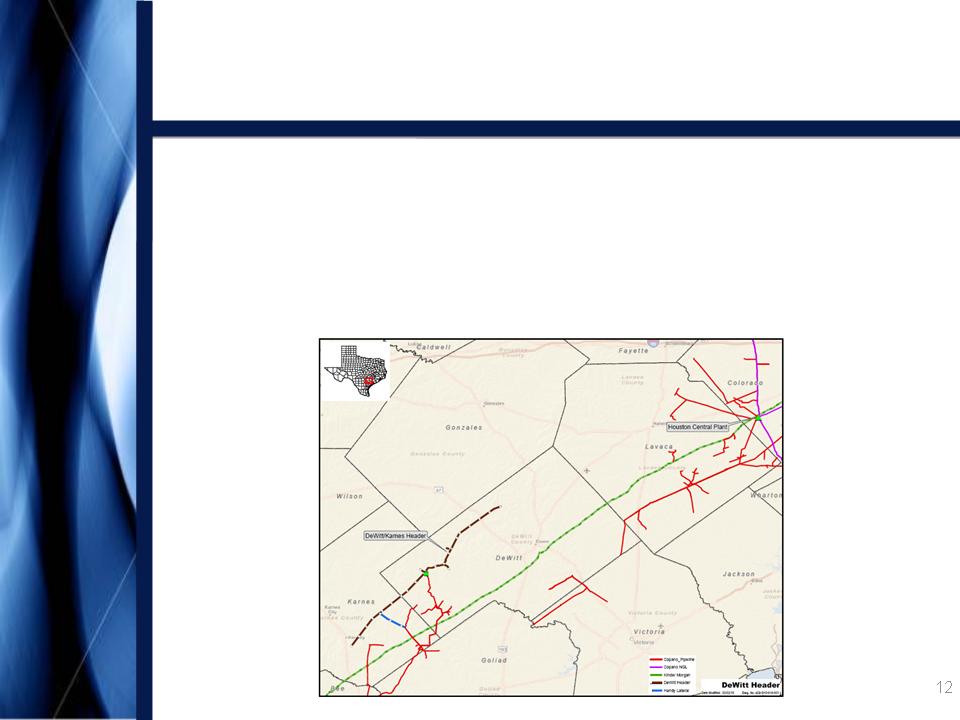
DeWitt-Karnes
Pipeline
• Recently announced
DeWitt-Karnes pipeline
– Targets rich Eagle
Ford Shale gas
– 38 miles of 24” pipe
- expected to be in service July 2010
– Anticipated 2010
capex - approximately $45 million
• Complements Houston
Central fractionation project

Copano
Energy
13
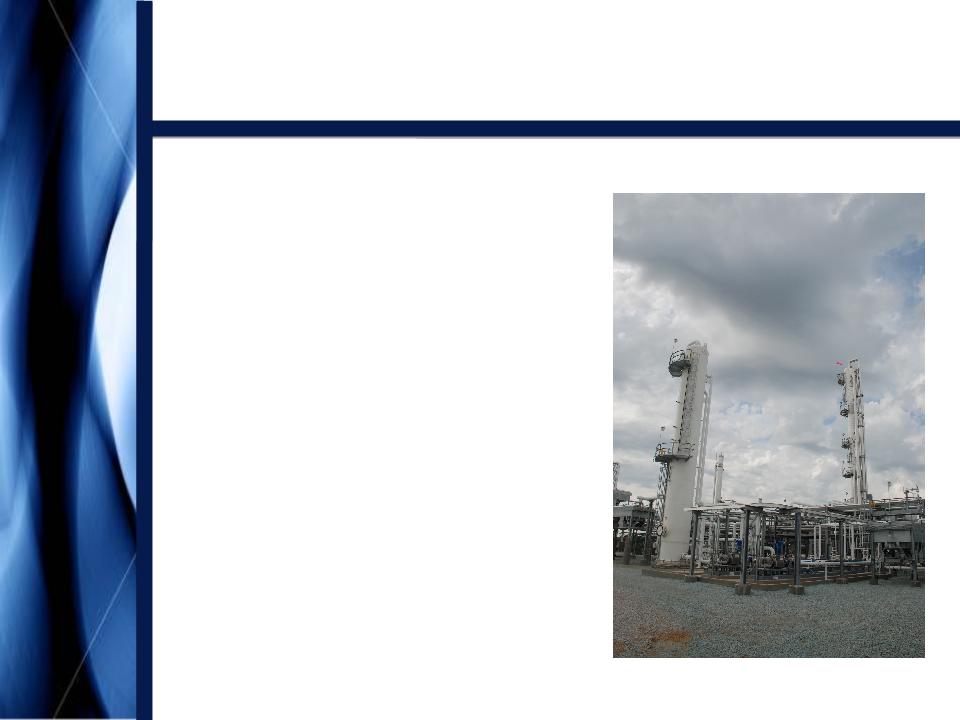
Texas
Fractionation Strategy
• Responding to NGL
transportation
and fractionation constraints along
the Texas Gulf Coast, Copano will
re-start its fractionator at Houston
Central
and fractionation constraints along
the Texas Gulf Coast, Copano will
re-start its fractionator at Houston
Central
• Utilizing Houston
Central’s
fractionation unit and extensive
tailgate NGL pipelines, Copano
plans to produce purity products
by April 1, 2010
fractionation unit and extensive
tailgate NGL pipelines, Copano
plans to produce purity products
by April 1, 2010
– Total capacity of
22,000 Bbls/d
– Approximate cost of
$15 million
– Estimated fee-based
cash flow
between $8 and $10 million on an
annualized basis
between $8 and $10 million on an
annualized basis

Copano
Energy
14
• Rich gas (primarily
Hunton De-Watering play)
– Drilling activity
remains steady
– 2 rigs currently
running in the Hunton and 8 rigs in other rich
gas areas
gas areas
– Attractive
processing upgrade and low geologic risk
– 1Q 2010 volumes
expected to be flat to slightly up vs. 4Q 2009
– Burbank processing
plant expected in service 2Q 2010 (10
MMcf/d capacity)
MMcf/d capacity)
• Lean gas (primarily
Woodford Shale and coalbed methane)
– Drilling activity
slightly increasing due to current commodity
prices and long-term price outlook
prices and long-term price outlook
– 8 rigs currently
running
– 1Q 2010 volumes
expected to be slightly up from 4Q 2009
Oklahoma
Outlook

Copano
Energy
Oklahoma Rich Gas
vs. Lean Gas
(1) Full
value prior to deduction of Copano’s margin. Excludes
value of condensate and crude oil recovered by the
producer at the wellhead.
producer at the wellhead.
(2) Implied
NGL prices are based on a six-year historical regression analysis.
(3) Assumes
9 GPM gas with a Btu factor of 1.375 processed at Copano’s cryogenic plant, and
field fuel of 6.25%.
(4) Assumes
unprocessed gas with a Btu factor of 1.0 and field fuel of 6%.
15
Prices
as of 3/2/10

Copano
Energy
16
Rocky
Mountains Outlook
• Drilling and
dewatering will be driven by commodity prices
and
producer economics
producer economics
• 1Q 2010 volumes
expected to be flat vs. 4Q 2009
• For Bighorn, 130
previously drilled wells can be connected with
minimal capital expenditures
minimal capital expenditures
– An additional 70
drilled wells can be connected with moderate capital
expenditures
expenditures
• 2010 Adjusted EBTIDA
expected to be flat vs. 2009
– Forward pricing
curve indicates drilling and dewatering activity should
resume this year and if this occurs, 2014 Adjusted EBITDA could
double from current levels
resume this year and if this occurs, 2014 Adjusted EBITDA could
double from current levels

Copano
Energy
17
Commodity Prices and
Margin
Sensitivities
Sensitivities
Commodity
Prices and
Margin
Sensitivities
Prices and
Margin
Sensitivities
Distribution
Outlook and
Conclusions
Outlook and
Conclusions
Financing
and
Commodity Risk
Management
Commodity Risk
Management
2010
Regional
Outlook
Outlook
Copano
Energy
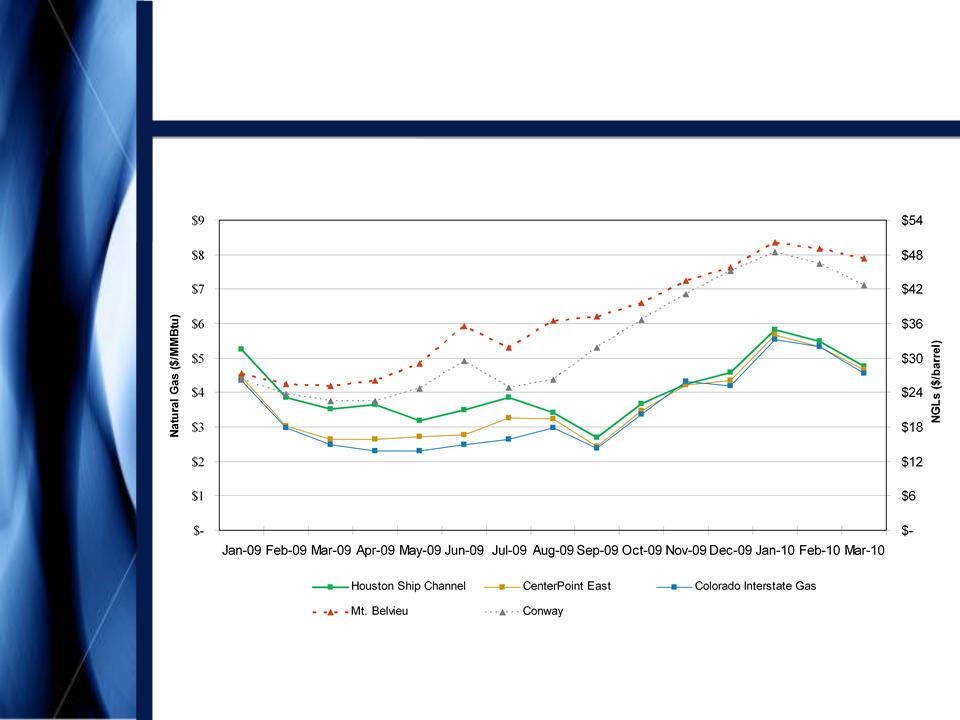
Historical Commodity
Prices
18
(1) NGL
prices are month-to-date through March 2, 2010.
(2) NGL
prices for Jan-09 through Dec-09 are calculated based on the weighted-average
product mix for the period
indicated. NGL prices for Jan-10 through Mar-10 are calculated based on the fourth quarter 2009 product mix.
indicated. NGL prices for Jan-10 through Mar-10 are calculated based on the fourth quarter 2009 product mix.
(1)
(2)
(2)
Copano
Energy
19
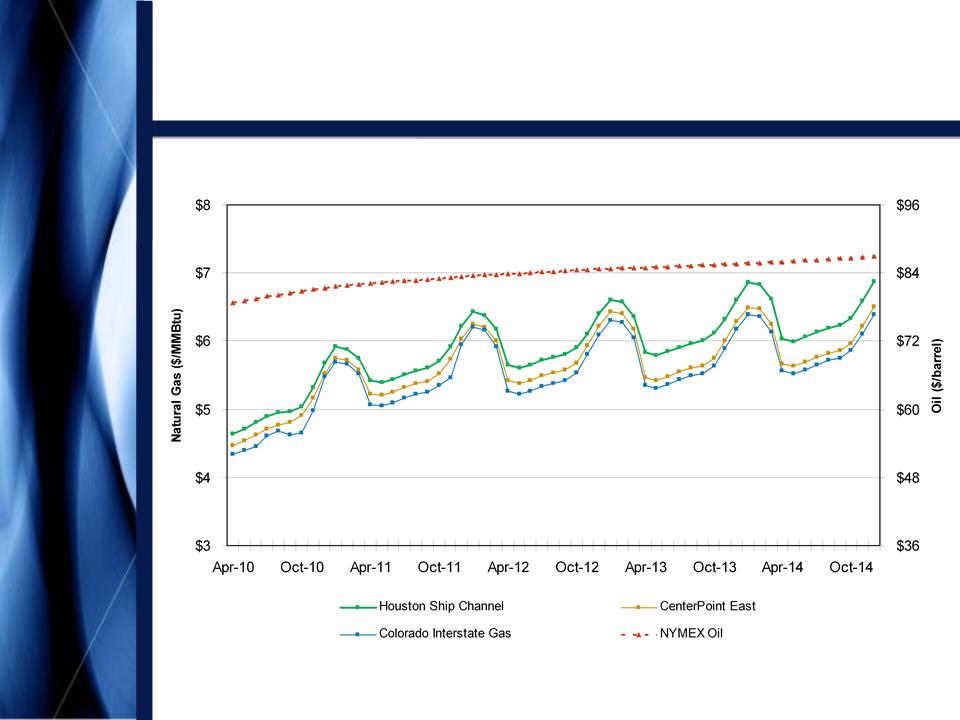
Note:
Forward prices as of March 2, 2010
Forward
Commodity Prices
Copano
Energy
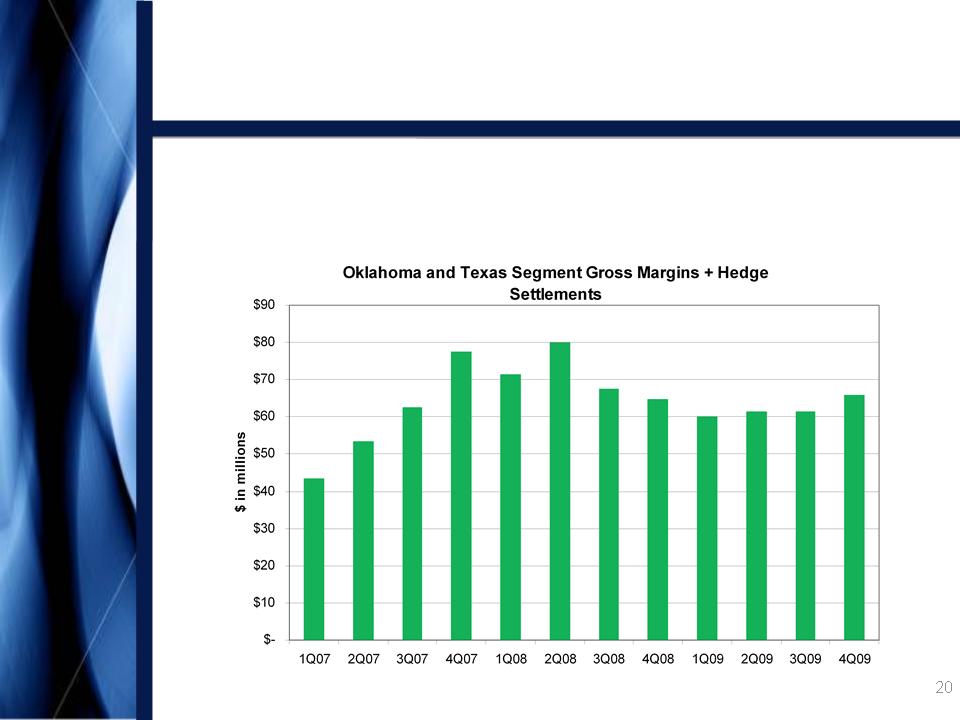
Combined
Commodity-Sensitive Segment Margins
and Hedging Settlements
and Hedging Settlements
• Copano’s hedge
portfolio supports cash flow stability based on
combined segment gross margins and cash hedging settlements
combined segment gross margins and cash hedging settlements
Copano
Energy
21
Commodity-Related
Margin
Sensitivities
Sensitivities
Note: Please
see Appendix for definitions of processing modes and additional
details.
• Matrix reflects 4Q
2009 wellhead and plant inlet volumes,
adjusted using Copano’s 2009 planning model
adjusted using Copano’s 2009 planning model
(1) Consists
of Texas and Oklahoma Segment gross margins.

Copano
Energy
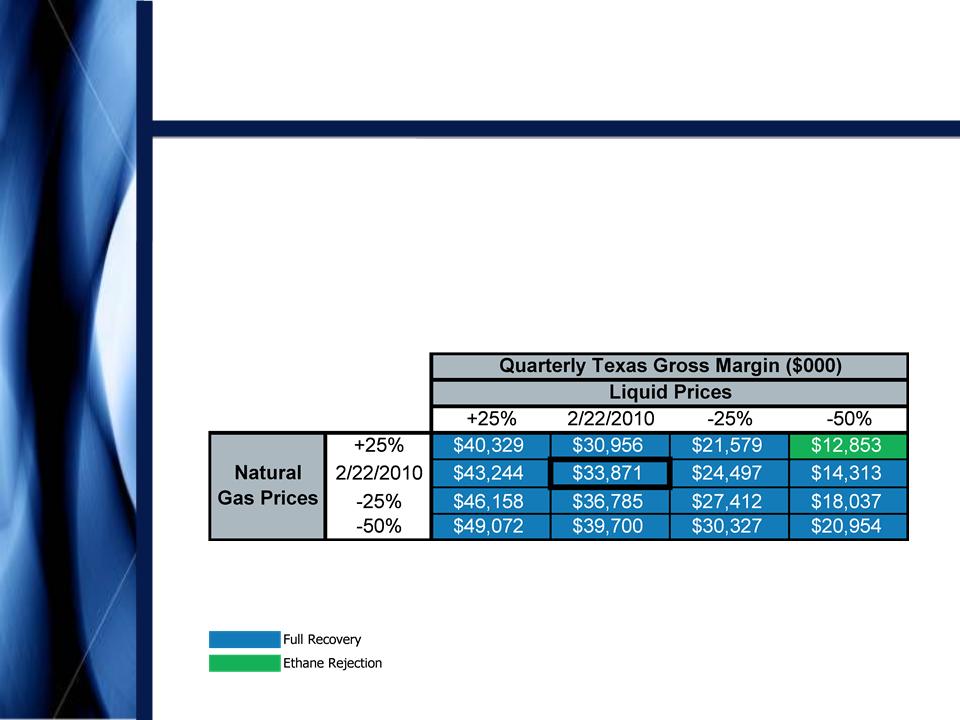
22
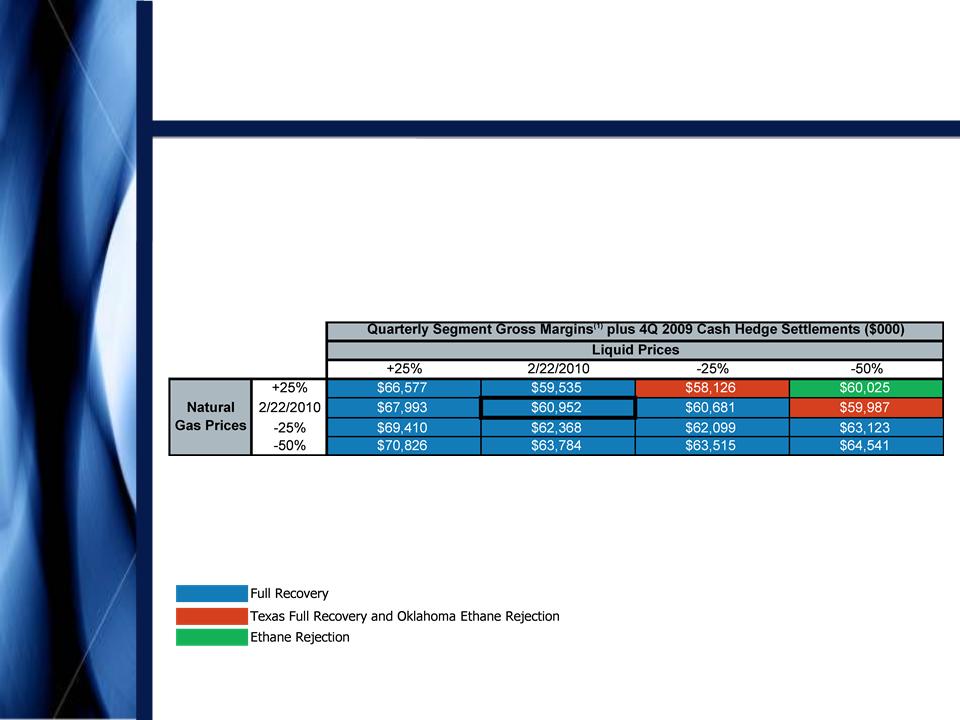
Combined
Commodity-Sensitive Segment Margins
and Hedging Settlements
and Hedging Settlements
Note:
Weighted
average NGL prices are based on Copano product mix for period
indicated.
(1) Does
not include non-cash expenses included in Corporate and Other for purposes of
calculating Total Segment
Gross Margin. See Appendix for reconciliation of Total Segment Gross Margin.
Gross Margin. See Appendix for reconciliation of Total Segment Gross Margin.
(2) Reflects
prices as of March 2, 2010.

Copano
Energy
23
Financing and
Commodity Risk
Management
Management
Financing
and
Commodity Risk
Management
Commodity Risk
Management
Distribution
Outlook and
Conclusions
Outlook and
Conclusions
Commodity
Prices and
Margin
Sensitivities
Prices and
Margin
Sensitivities
2010
Regional
Outlook
Outlook

Copano
Energy
24
2010
Expansion Capex
• Copano has
approximately $130 million(1) in approved
expansion capital projects for 2010. Major areas of focus
include:
expansion capital projects for 2010. Major areas of focus
include:
– Eagle Ford Shale and
Houston Central processing plant in
south Texas
south Texas
• DeWitt-Karnes
pipeline - recently upsized project from $20 million
to $45 million
to $45 million
– Saint Jo processing
plant and pipelines in north Texas
– Additional pipeline
and processing capacity in Oklahoma
– Expect capital to be
invested at a multiple of approximately 5x
• Financing to be
consistent with Copano’s historical policy -
balance of debt and equity
balance of debt and equity
(1) Includes
Copano’s net share for unconsolidated affiliates. Does not
include future potential acquisitions.

Copano
Energy
25
Recent
Equity Offering
• On March 3, 2010
Copano sold 6.475 million common units
in a public offering
in a public offering
– Approximately $143
million in net proceeds (excluding
greenshoe)
greenshoe)
– Proceeds used to
reduce revolver borrowings, which ultimately
will fund expansion capex
will fund expansion capex
– Demonstrated
commitment to raising capital and maintaining
liquidity
liquidity
• Enhances liquidity
available to fund expansion capex and
balance sheet
balance sheet
– At December 31,
2009, as adjusted for offering
• Total liquidity of
approximately $309 million
• Total debt to
defined EBTIDA(1)
reduced to 3.7x (compared to
4.4x prior to offering)
4.4x prior to offering)
(1) See
Appendix for reconciliation of defined EBITDA, which is referred to in our
credit facility as “Consolidated
EBITDA.”
EBITDA.”

Copano
Energy
26
Hedging
Strategy
• Option-based,
product-specific
• 2010 price exposed
volumes are well hedged
– Between 70% and 80%
of propane, butane, natural gasoline
and condensate price exposure is hedged
and condensate price exposure is hedged
– Approximately 40% of
ethane price exposure is hedged
– Expect $32 - $34
million of non-cash amortization expense in
2010 related to option component of hedge portfolio
2010 related to option component of hedge portfolio
• January 2010 -
announced addition of ethane and propane
hedges for 2012 (net cost of approximately $7.3 million)
hedges for 2012 (net cost of approximately $7.3 million)
– 2010 focus - adding
to 2012 hedging positions

Copano
Energy
27
Distribution Outlook
and
Conclusions
Conclusions
Distribution
Outlook and
Conclusions
Outlook and
Conclusions
Financing
and
Commodity Risk
Management
Commodity Risk
Management
Commodity
Prices and
Margin
Sensitivities
Prices and
Margin
Sensitivities
2010
Regional
Outlook
Outlook
Copano
Energy
28
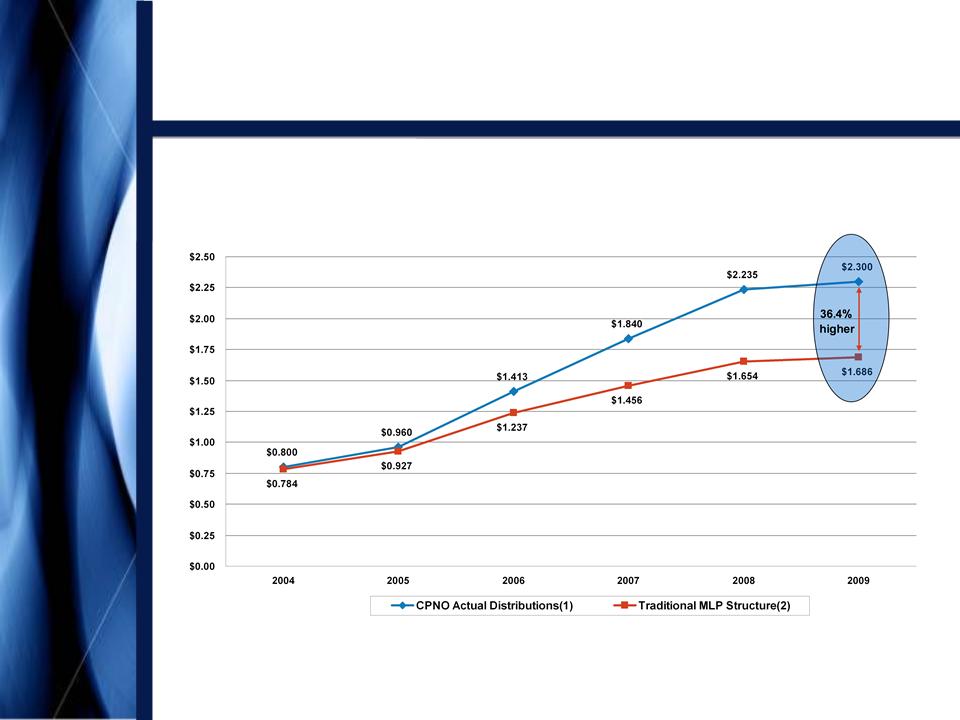
Distribution Track
Record
• On January 13, 2010,
Copano announced a cash distribution for
the fourth quarter of 2009 of $0.575 per common unit
the fourth quarter of 2009 of $0.575 per common unit
(3)(4)
(1) All
pre-1Q 2007 distributions are adjusted to reflect Copano’s 3/30/07 two-for-one
unit split.
(2) Assumes
generic MLP splits with 10%, 25% & 50% increases in distributable cash flow
to LP units resulting in
incremental 13%, 23% and 48% increases in the percentage of total distributable cash flow applicable to the GP.
incremental 13%, 23% and 48% increases in the percentage of total distributable cash flow applicable to the GP.
(3) Actual
$0.10 distribution per unit was for the period from November 15, 2004 through
December 31, 2004.
(4) 4Q
2004 annualized.
Copano
Energy
Distribution
Outlook

Copano
Energy
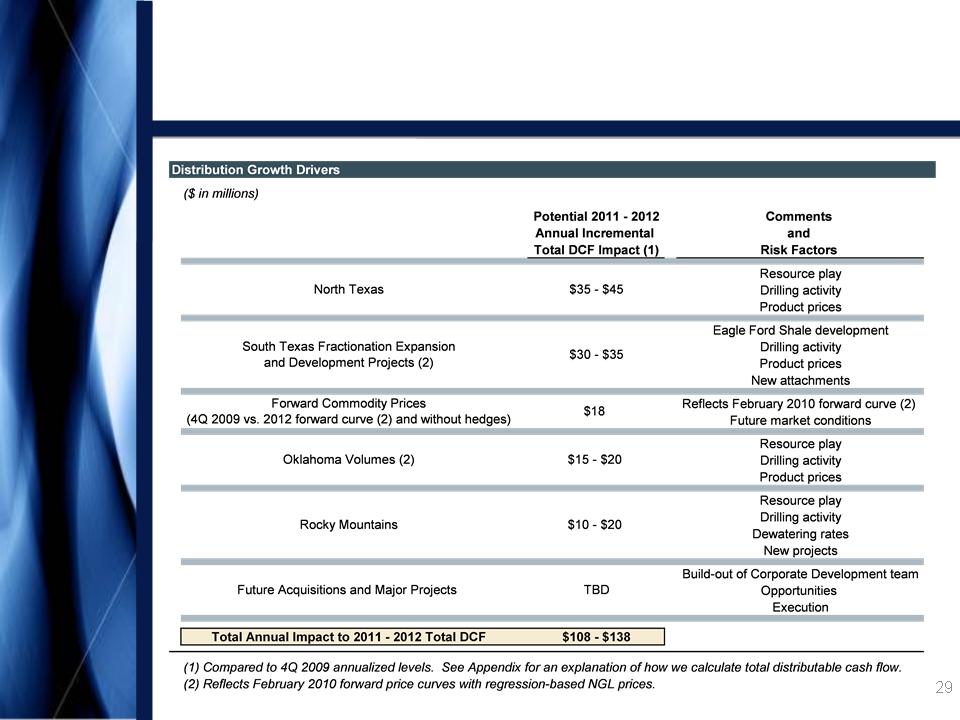
• Goal: to become a
diversified midstream company with
scale and stability of cash flows, above-average returns on
invested capital and “investment-grade quality distributions”
scale and stability of cash flows, above-average returns on
invested capital and “investment-grade quality distributions”
• Key tenets of growth
strategy:
– Execute on organic
growth opportunities around existing
assets
assets
– Explore
opportunities beyond traditional gathering and
processing
processing
• Be more proactive in
seeking assets and opportunities
– Reduce sensitivity
of cash flows to commodity price
fluctuations
fluctuations
• Hedging
program
• Contracts - increase
fee-for-service component
30
Growth
Strategy

Copano
Energy
31
Appendix
Copano
Energy
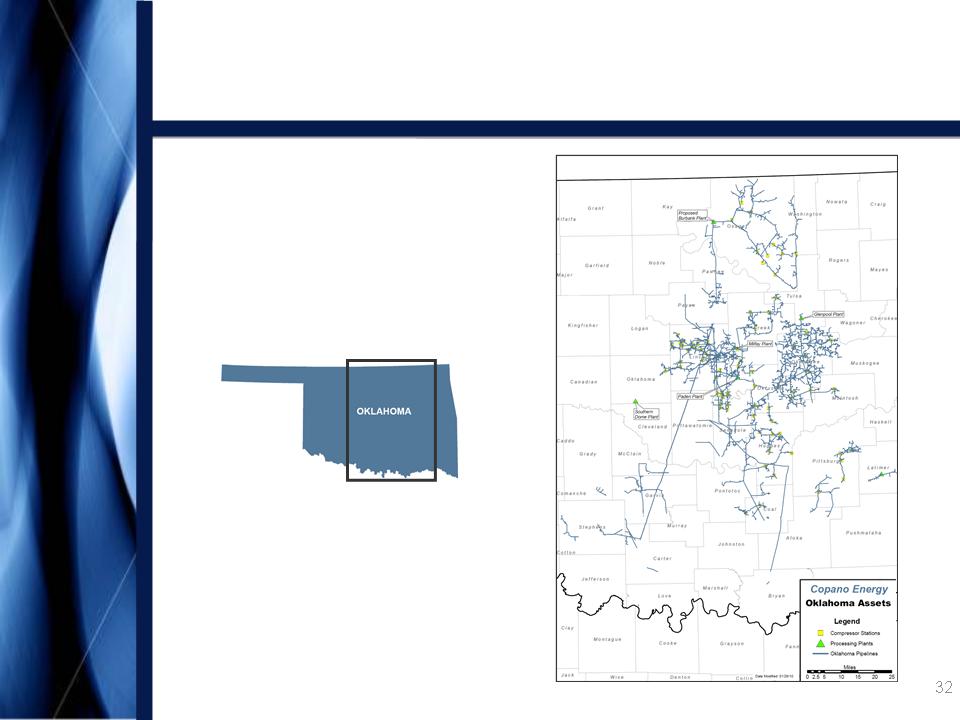
Oklahoma
Assets
Appendix
Copano
Energy
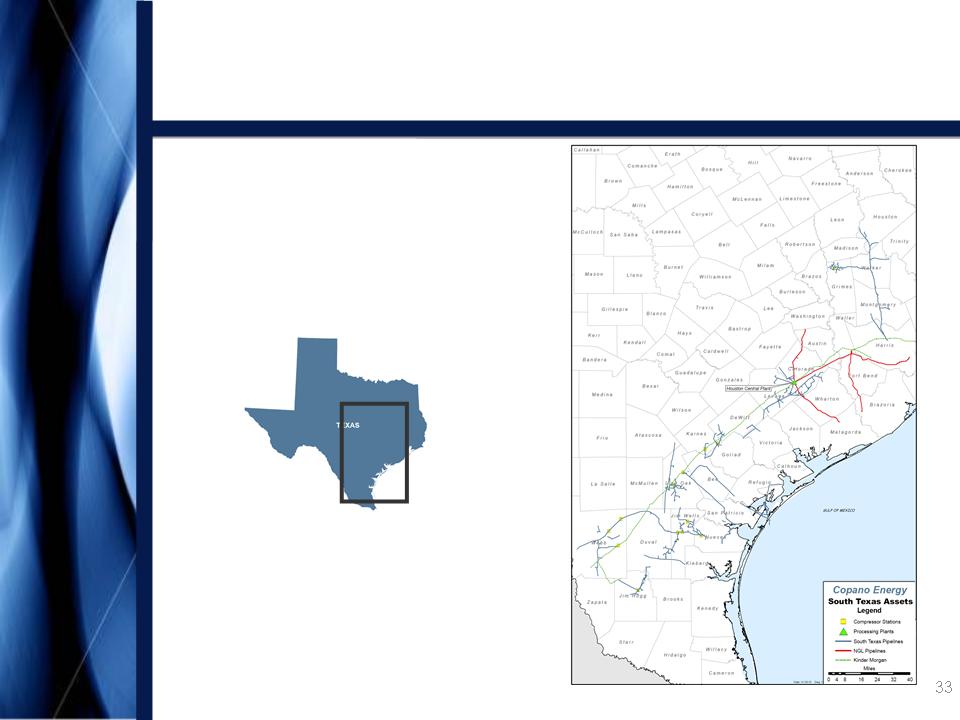
South
Texas Assets
Appendix

Copano
Energy
34
North
Texas Assets
Appendix

Copano
Energy
Rocky
Mountains Assets
Appendix

Copano
Energy
36
Processing
Modes
• Full
Recovery
• Ethane
Rejection
• Conditioning
Mode
→ Texas and Oklahoma -
If the value of
recovered NGLs exceeds the fuel and gas
shrinkage costs of recovering NGLs
recovered NGLs exceeds the fuel and gas
shrinkage costs of recovering NGLs
→ Texas - If the value
of recovered NGLs is less
than the fuel and gas shrinkage cost of
recovering NGLs (available at Houston
Central plant and at Saint Jo plant in North
Texas)
than the fuel and gas shrinkage cost of
recovering NGLs (available at Houston
Central plant and at Saint Jo plant in North
Texas)
→ Texas and Oklahoma -
If the value of ethane
is less than the fuel and shrinkage costs to
recover ethane (in Oklahoma, ethane
rejection at Paden plant is limited by nitrogen
rejection facilities)
is less than the fuel and shrinkage costs to
recover ethane (in Oklahoma, ethane
rejection at Paden plant is limited by nitrogen
rejection facilities)
Appendix
Copano
Energy
37
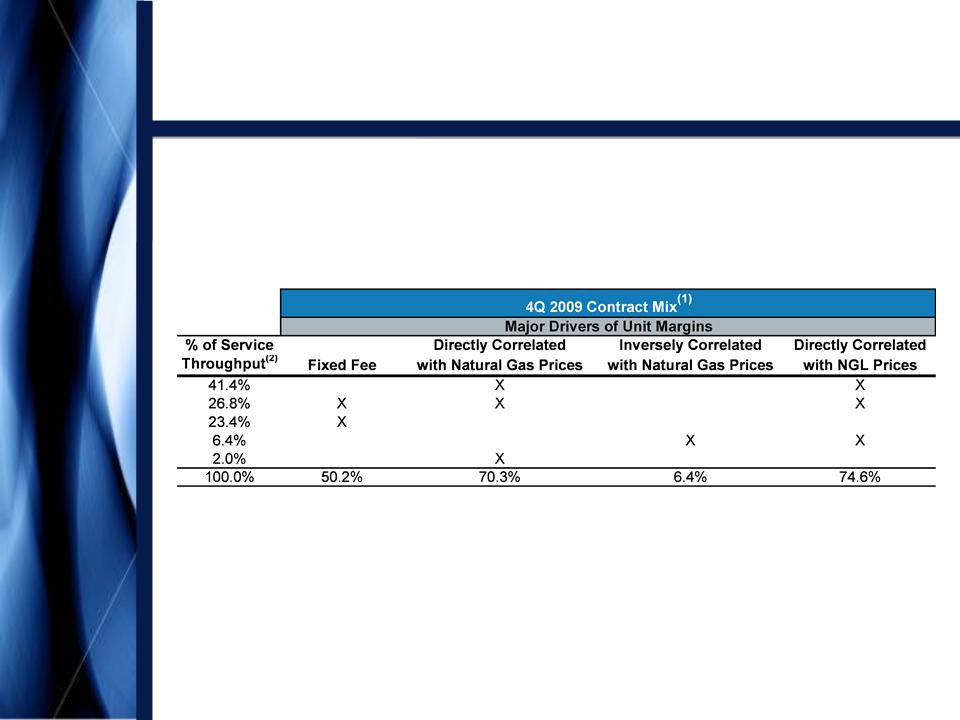
Oklahoma Contract
Mix
(1) Source:
Copano Energy internal financial planning models for consolidated
subsidiaries.
(2) Excludes
12,639 MMBtu/d service throughput for Southern Dome, a majority-owned
affiliate.
Appendix
Copano
Energy
38
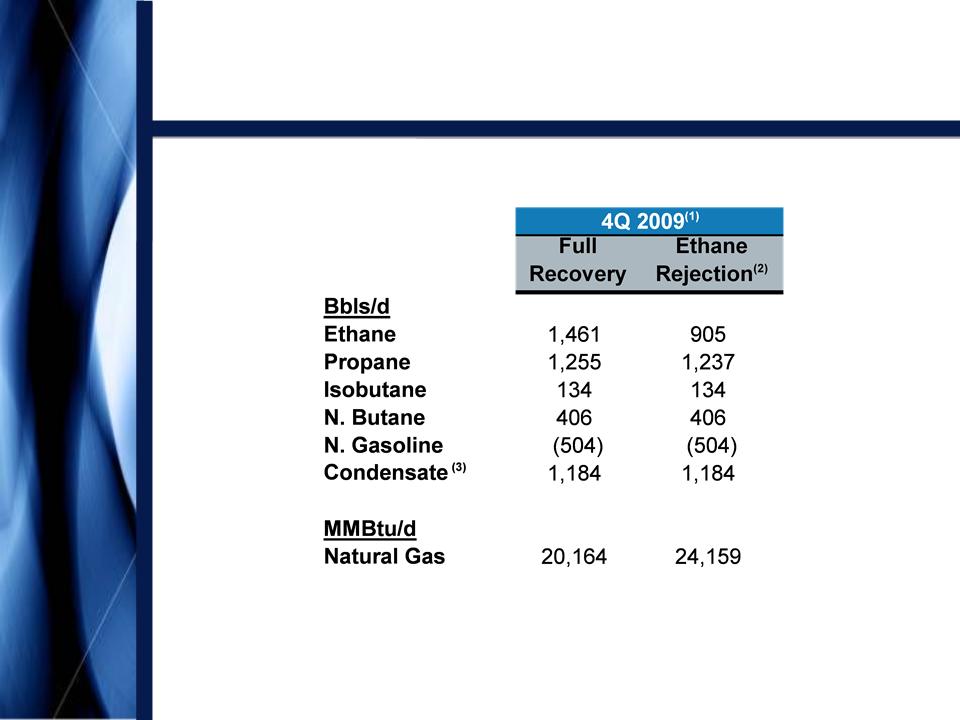
Oklahoma Net
Commodity
Exposure
Exposure
Note: See
explanation of processing modes in this Appendix. Values
reflect rounding.
(1) Source: Copano
Energy internal financial planning models for consolidated
subsidiaries.
(2) Ethane
rejection at Paden plant is limited by nitrogen rejection
facilities.
(3) Reflects
impact of producer delivery point allocations, offset by field condensate
collection and stabilization.
Appendix

Copano
Energy
39
Oklahoma Commodity
Price
Sensitivities
Sensitivities
• Oklahoma segment
gross margins excluding hedge
settlements
settlements
– Matrix reflects 4Q
2009 volumes, adjusted using Copano’s
2009 planning model
2009 planning model
Appendix
Copano
Energy
40
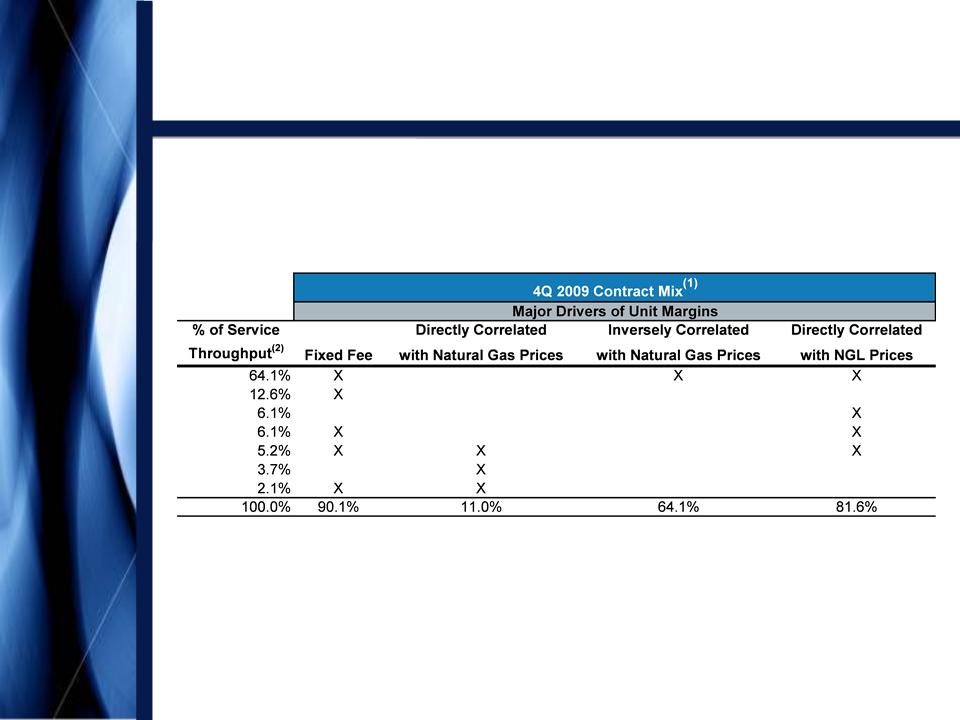
Texas
Contract Mix
Appendix
(1) Source: Copano
Energy internal financial planning models for consolidated
subsidiaries.
(2) Excludes
66,764 MMBtu/d service throughput for Webb Duval, a majority-owned
affiliate.
Copano
Energy
41
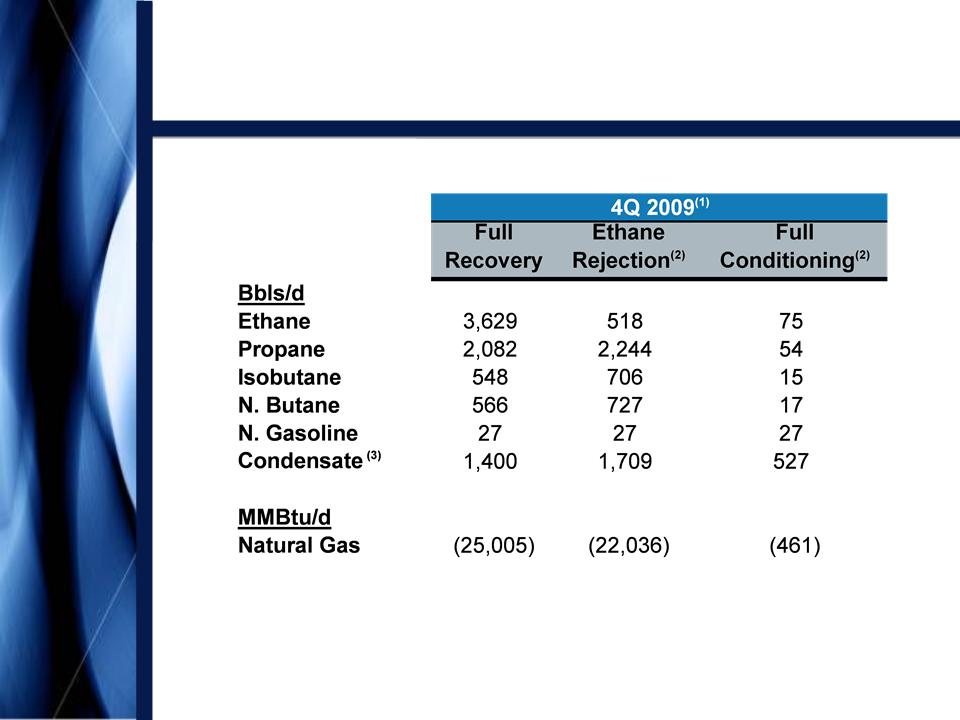
Texas
Net Commodity Exposure
Note: See
explanation of processing modes in this Appendix.
(1) Source: Copano
Energy internal financial planning models for consolidated subsidiaries. Based on
4Q 2009
daily wellhead/plant inlet volumes.
daily wellhead/plant inlet volumes.
(2) Fractionation
at Houston Central processing plant permits significant reductions in ethane
recoveries in ethane
rejection mode and full ethane rejection in conditioning mode. To optimize profitability, plant operations can
also be adjusted to partial recovery mode.
rejection mode and full ethane rejection in conditioning mode. To optimize profitability, plant operations can
also be adjusted to partial recovery mode.
(3) At
the Houston Central processing plant, pentanes+ may be sold as
condensate.
Appendix
Copano
Energy
42
Texas
Commodity Price
Sensitivities
Sensitivities
• Texas segment gross
margins excluding hedge settlements
– Matrix reflects 4Q
2009 volumes and operating conditions,
adjusted using Copano’s 2009 planning model
adjusted using Copano’s 2009 planning model
Appendix

Copano
Energy
43
Rocky
Mountains Sensitivities
Appendix
Note: See this
Appendix for reconciliation of Adjusted EBITDA. Values
reflect rounding.
(1) Impact
on Adjusted EBITDA based on Copano’s interest in the unconsolidated
affiliate.
• 4Q 2009
– Adjusted EBITDA
volume sensitivity (positive or negative impact)
• Consolidated
(producer services): 10,000 MMBtu/d = $26,000
• Unconsolidated
affiliates:
§ Bighorn: 10,000
MMBtu/d = $227,000(1)
§ Fort Union: 10,000
MMBtu/d = $70,000(1)

Copano
Energy
Hedging
Impact
of Commodity Price Sensitivities
of Commodity Price Sensitivities
• Commodity hedging
program supplements cash flow in 2010
through 2012 during less favorable commodity price periods
through 2012 during less favorable commodity price periods
Appendix

Copano
Energy
45
Liquidity and Debt
Facilities
• At December 31,
2009:
– Cash: $45
million
– $550 million
revolving credit facility
• Approximately $122
million available (limited by debt covenants) -
availability increased to approximately $264 million pro forma for March
2010 equity offering
availability increased to approximately $264 million pro forma for March
2010 equity offering
• Remaining term:
approximately 2.8 years
• LIBOR + 175
bps
– $582 million senior
notes
• $332,665,000 8 ⅛%
due 2016
• $249,525,000 7 ¾%
due 2018
• Weighted average
rate: 7.96%
• Weighted average
maturity: 7.1 years
Appendix
Note: See
slide titled “Recent Equity Offering” for adjusts related to March 2010 equity
offering.

Copano
Energy
• Senior Secured
Revolving Credit Facility
– $550 million
facility with $100 million accordion
– Maintenance
tests:
• 5x total debt to
defined EBITDA(1)
limitation
§ 4.39x at December
31, 2009 (3.67x pro forma for March 2010 equity
offering)
offering)
• Minimum required
interest coverage 2.5x defined EBITDA
§ 3.59x at December
31, 2009
• Defined EBITDA adds
back hedge amortization and other non-cash
expenses
expenses
– Following an
acquisition, Copano may increase total debt to defined
EBITDA limitation to 5.5x for three quarters
EBITDA limitation to 5.5x for three quarters
• Senior
Notes
– Incurrence
tests:
• Minimum defined
EBITDA to interest test of 2.00x for debt incurrence
• Minimum defined
EBITDA to interest test of 1.75x for restricted payments
• Defined EBITDA is
similar to that for credit facility
46
Key
Debt Terms and Covenants
(1) See
this Appendix for reconciliation of defined EBITDA, which is referred to in our
credit facility as
“Consolidated EBITDA.”
“Consolidated EBITDA.”
Appendix
Copano
Energy
47
Reconciliation of
Non-GAAP
Financial Measures
Financial Measures
Segment
Gross Margin and Total Segment Gross Margin
• We define segment
gross margin, with respect to a Copano operating segment, as segment revenue
less cost of sales. Cost of
sales includes the following:
cost of natural gas and NGLs purchased from third parties, cost of natural gas and NGLs purchased from affiliates, cost of crude oil purchased from third
parties, costs paid to third parties to transport volumes and costs paid to affiliates to transport volumes. Total segment gross margin is the sum of the
operating segment gross margins and the results of Copano’s risk management activities that are included in Corporate and other. We view total segment
gross margin as an important performance measure of the core profitability of our operations. Segment gross margin allows Copano’s senior management
to compare volume and price performance of the segments and to more easily identify operational or other issues within a segment. The GAAP measure
most directly comparable to total segment gross margin is operating income.
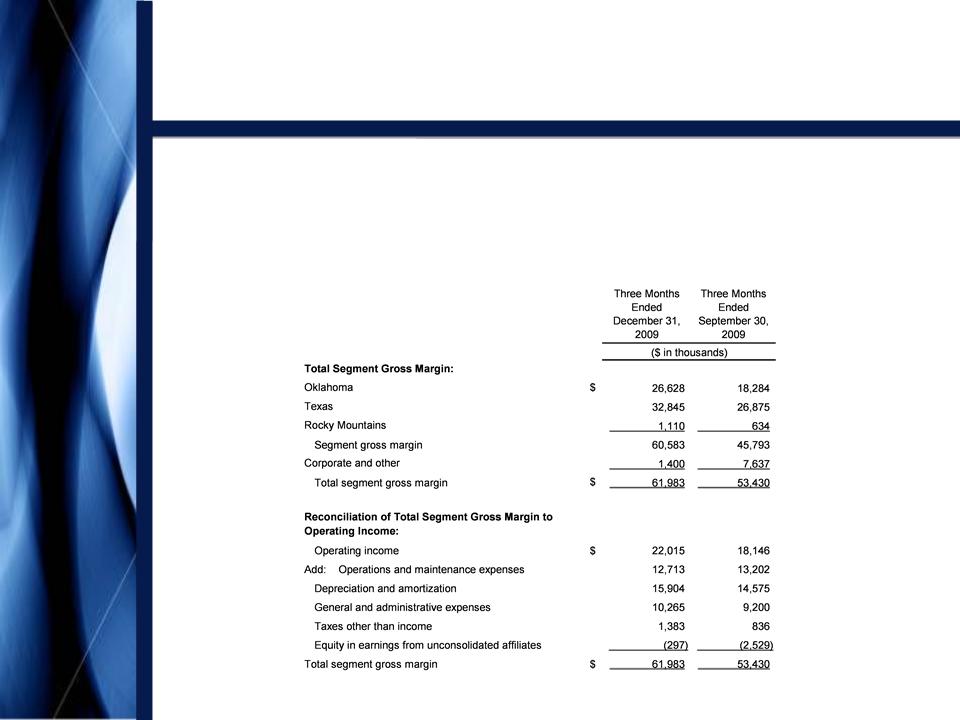
• The following table
presents total segment gross margin and a reconciliation of total segment gross
margin to the GAAP financial measure of operating
income:
income:
Appendix
Copano
Energy
48
Reconciliation of
Non-GAAP
Financial Measures
Financial Measures
Adjusted
EBITDA
• We define EBITDA as
net income (loss) plus interest expense, provision for income taxes and
depreciation and amortization expense. Because a portion of
our net income (loss) is attributable to equity in earnings (loss) from our equity investees (which include Bighorn, Fort Union, Webb Duval and Southern
Dome), our management also calculates Adjusted EBITDA to reflect the depreciation and amortization expense embedded in equity in earnings (loss) from
unconsolidated affiliates. Specifically, our management determines Adjusted EBITDA by adding to EBITDA (i) the amortization expense attributable to the
difference between our carried investment in each unconsolidated affiliate and the underlying equity in its net assets, (ii) the portion of each unconsolidated
affiliate’s depreciation and amortization expense, which is proportional to our ownership interest in that unconsolidated affiliate and (iii) the portion of each
unconsolidated affiliate’s interest and other financing costs, which is proportional to our ownership interest in that unconsolidated affiliate.
• External users of our
financial statements such as investors, commercial banks and research analysts
use EBITDA or Adjusted EBITDA, and our
management uses Adjusted EBITDA, as a supplemental financial measure to assess:
management uses Adjusted EBITDA, as a supplemental financial measure to assess:
– The financial
performance of our assets without regard to financing methods, capital structure
or historical cost basis;
– The ability of our
assets to generate cash sufficient to pay interest costs and support our
indebtedness;
– Our operating
performance and return on capital as compared to those of other companies in the
midstream energy sector, without regard to
financing or capital structure; and
financing or capital structure; and
– The viability of
acquisitions and capital expenditure projects and the overall rates of return on
alternative investment opportunities.
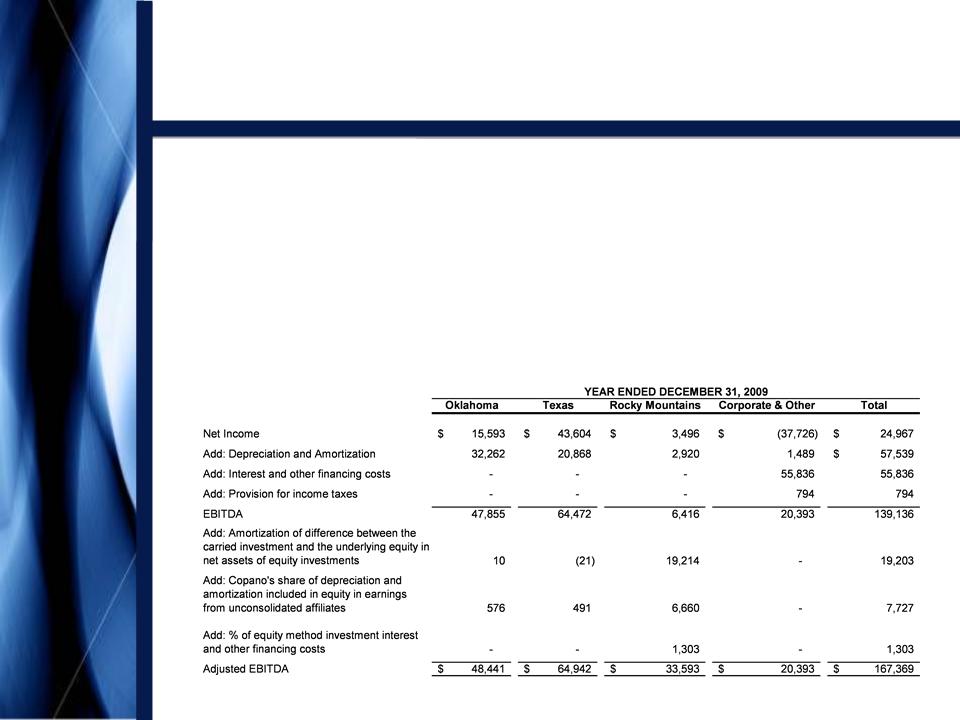
• The following table
presents a reconciliation of the portion of our EBITDA and Adjusted EBITDA
attributable to each of our segments to the GAAP financial
measure of net income (loss):
measure of net income (loss):
Appendix
Copano
Energy
49
Reconciliation of
Non-GAAP
Financial Measures
Financial Measures
Consolidated
EBITDA
§ EBITDA is also a
financial measure that, with negotiated pro forma adjustments relating to
acquisitions completed during the
period, is reported to our lenders as Consolidated EBITDA and is used to compute our financial covenants under our senior
secured revolving credit facility.
period, is reported to our lenders as Consolidated EBITDA and is used to compute our financial covenants under our senior
secured revolving credit facility.
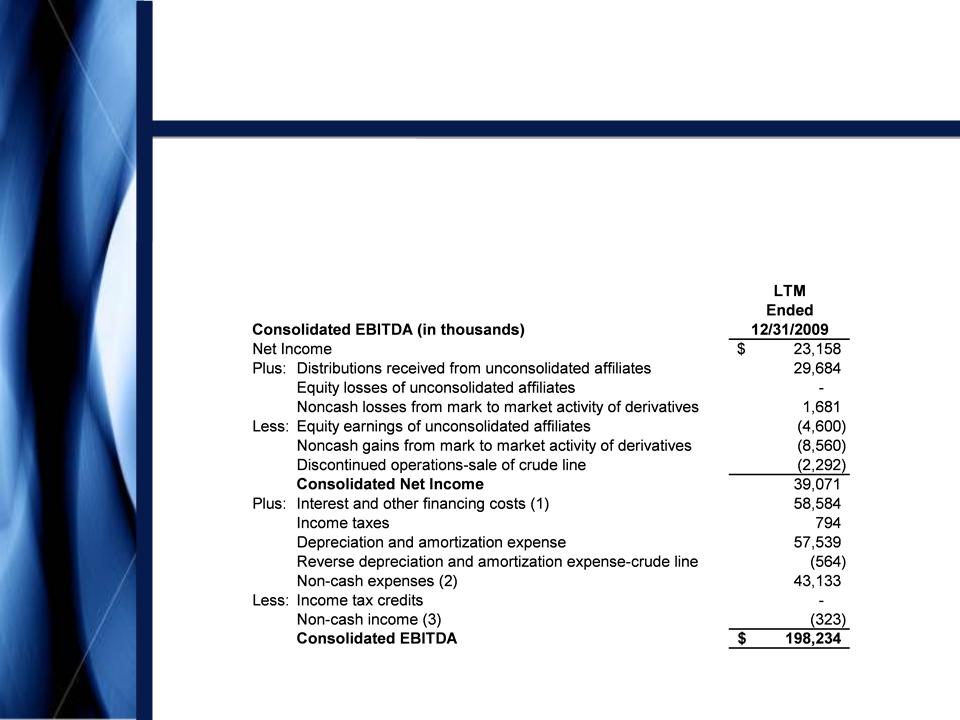
§ The following table
presents a reconciliation of the non-GAAP financial measure of Consolidated
EBITDA to the GAAP
financial measure of net income (loss):
financial measure of net income (loss):
Appendix

Copano
Energy
50
Definitions of
Non-GAAP
Financial Measures
Financial Measures
Total
Distributable Cash Flow
§ We define total
distributable cash flow as net income plus: (i) depreciation, amortization and
impairment expense (including
amortization expense relating to the option component of our risk management portfolio); (ii) cash distributions received from
investments in unconsolidated affiliates and equity losses from such unconsolidated affiliates; (iii) provision for deferred
income taxes; (iv) the subtraction of maintenance capital expenditures; (v) the subtraction of equity in earnings from
unconsolidated affiliates and (vi) the addition of losses or subtraction of gains relating to other miscellaneous non-cash
amounts affecting net income for the period, such as equity-based compensation, mark-to-market changes in derivative
instruments, and our line fill contributions to third-party pipelines and gas imbalances. Maintenance capital expenditures are
capital expenditures employed to replace partially or fully depreciated assets to maintain the existing operating capacity of
our assets and to extend their useful lives, or other capital expenditures that are incurred in maintaining existing system
volumes and related cash flows.
§ Total distributable
cash flow is a significant performance metric used by senior management to
compare basic cash flows
generated by us (prior to the establishment of any retained cash reserves by our Board of Directors) to the cash distributions
we expect to pay our unitholders, and it also correlates with the metrics of our existing debt covenants. Using total
distributable cash flow, management can quickly compute the coverage ratio of estimated cash flows to planned cash
distributions. Total distributable cash flow is also an important non-GAAP financial measure for our unitholders because it
serves as an indicator of our success in providing a cash return on investment — specifically, whether or not we are
generating cash flow at a level that can sustain or support an increase in our quarterly distribution rates. Total distributable
cash flow is also used by industry analysts with respect to publicly traded partnerships and limited liability companies
because the market value of such entities’ equity securities is significantly influenced by the amount of cash they can
distribute to unitholders.
Appendix

Copano
Energy
NASDAQ:
CPNO
March
2010