Attached files
| file | filename |
|---|---|
| 8-K - FORM 8-K - COMERICA INC /NEW/ | d8k.htm |
| EX-99.1 - PRESS RELEASE - COMERICA INC /NEW/ | dex991.htm |
 Comerica Incorporated Common Stock Offering March 8, 2010 Ralph Babb Chief Executive Officer Beth Acton Chief Financial Officer John Killian Chief Credit Officer Exhibit 99.2 |
 2 Safe Harbor Statement Any statements in this presentation that are not historical facts are
forward-looking statements as defined in the Private Securities Litigation Reform Act of 1995. Words such as "anticipates," "believes,"
"feels," "expects," "estimates," "seeks," "strives," "plans," "intends," "outlook," "forecast," "position,"
"target," "mission," "assume," "achievable," "potential," "strategy," "goal," "aspiration," "outcome," "continue," "remain," "maintain,"
"trend," "objective" and variations of such words and similar expressions, or future or conditional verbs such as "will," "would," "should,"
"could," "might," "can," "may" or similar expressions, as they relate to Comerica or its management, are intended to identify forward-looking statements. These
forward-looking statements are predicated on the beliefs and assumptions
of Comerica’s management based on information known to Comerica’s management as of the date of this presentation and do not purport to speak as of any other date. Forward-looking
statements may include descriptions of plans and objectives of
Comerica’s management for future or past operations, products or services, and forecasts of Comerica’s revenue, earnings or other measures of economic performance, including statements of
profitability, business segments and subsidiaries, estimates of credit trends and global stability. Such statements reflect the view of Comerica’s management as of this date with respect to future events and are subject to risks and uncertainties. Should one or more
of these risks materialize or should underlying beliefs or assumptions prove
incorrect, Comerica’s actual results could differ materially from those discussed. Factors that could cause or contribute to such differences are further economic downturns,
changes in the pace of an economic recovery and related changes in
employment levels, changes in real estate values, fuel prices, energy costs
or other events that could affect customer income levels or general economic
conditions, changes related to the headquarters relocation or to its underlying assumptions, the effects of recently enacted legislation, actions taken by or proposed
by the U.S. Department of Treasury, the Board of Governors of the Federal
Reserve System, the Texas Department of Banking and the Federal Deposit Insurance Corporation or other governmental entities, legislation enacted in the future, and the
expiration of such legislation and regulatory actions, the effects of war and other armed conflicts or acts of terrorism, the effects of natural disasters including, but not limited to, hurricanes, tornadoes, earthquakes, fires, droughts and floods, the disruption of private or public utilities, the implementation of Comerica’s strategies and business models, management’s ability to maintain and expand customer relationships, changes in customer borrowing, repayment, investment and deposit practices, management’s ability to retain key officers and employees, changes in the accounting treatment of any particular item, the impact of regulatory
examinations, declines or other changes in the businesses or industries in
which Comerica has a concentration of loans, including, but not limited to, the automotive production industry and the real estate business lines, the anticipated performance of any new
banking centers, the entry of new competitors in Comerica’s markets,
changes in the level of fee income, changes in applicable laws and regulations, including those concerning taxes, banking, securities and insurance, changes in trade, monetary and fiscal
policies, including the interest rate policies of the Board of Governors of
the Federal Reserve System, fluctuations in inflation or interest rates, changes in general economic, political or industry conditions and related credit and market conditions, the interdependence of financial service companies and adverse conditions in the stock market. Comerica cautions that the foregoing list of factors is not exclusive. For discussion of factors that may cause actual results to differ from expectations, please refer to our filings with
the Securities and Exchange Commission. Forward-looking statements speak
only as of the date they are made. Comerica does not undertake to update forward-looking statements to reflect facts, circumstances, assumptions or events that occur after the
date the forward-looking statements are made. For any
forward-looking statements made in this presentation or in any documents, Comerica claims the protection of the safe harbor for forward-looking statements contained in the Private Securities
Litigation Reform Act of 1995. |
 3 Common Stock Offering Summary Issuer Offering size Over-allotment option Stock price (3/5/2010) Shares outstanding (pre-offering as of 2/22/10) Market capitalization (3/5/2010) Use of proceeds Sole bookrunner Lock-up agreement Expected pricing $800 million 10% $36.74 151,174,236 $5,554 million General corporate purposes including Capital Purchase Program redemption, subject to regulatory approval J.P. Morgan Pre-market open March 9, 2010 90 days for CMA, 60 days for executives & directors Comerica Incorporated (NYSE: CMA) |
 4 Investment Highlights Differentiated business strategy • Three interrelated businesses with ample cross-selling opportunities • Focused on growing and maintaining long-term relationships • Wide array of products and services with community bank feel Solid capital base and liquidity position • Strong capital ratios; Proforma (12/31/09) for capital raise and preferred redemption Tier 1 Common of 9.3% 1 • High quality and liquid investment portfolio Proactive credit management • Broad-based improvement in fourth quarter credit metrics • Consistent credit standards and exposure limits • Relationship banking strategy: originate and hold • Credit metrics compare favorably to peers Well positioned for growth • Strong deposit growth in core non-interest bearing deposits • Asset sensitive balance sheet • Banking center expansion in high growth markets Disciplined expense management • Full-year 2009 noninterest expenses decreased 6% over 2008 Experienced management team Main Street Bank 1 See Supplemental Financial Data for reconcilements of Comerica’s non-GAAP
financial measures |
 5 Comerica: A Brief Overview Among the top 25 U.S. bank holding companies Largest bank with corporate headquarters in Texas $59 billion in assets Founded over 160 years ago Major lines of business: Major markets include: Continued investments in growth markets Strong capital position • California • Arizona • Michigan • Texas • Florida At December 31, 2009 • Business Bank • Retail Bank • Wealth & Institutional Management |
 6 Our Core Businesses Business Bank Wide spectrum of credit and non-credit financial products, cash management and international trade services Retail Bank Personalized financial products and services to consumers and small businesses Wealth & Institutional Management Serves the needs of affluent clients, foundations, organizations and corporations 2009 Revenues By Business Segment 1 2009 Average Loan Balances By Business Segment Business Bank $35.4B 77% Retail Bank $6.0B 13% Wealth & Institutional Management $4.8B 10% Business Bank $1,619MM Retail Bank $700MM Wealth & Institutional Management $430MM At December 31, 2009 1 2009 Revenues by Business Segment excludes Finance/Other ($124MM).
|
 7 Robust Capital Position Proforma Capital Raise & Preferred Redemption As Reported 14.54% 16.93% Total Capital 10.07% 12.46% Tier 1 Capital 9.27% 8.18% Tier 1 Common 9.36% 7.99% TCE/TA 12/31/09 12/31/09 Note: Assumes net proceeds on $800MM common equity issuance and $99MM discount
amortization related to intended TARP preferred redemption; does not
include impact of repurchase of related TARP warrant. See Supplemental
Financial Data for reconcilements of Comerica’s non-GAAP financial measures |
 8 0% 2% 4% 6% 8% 10% 12% 4Q08 1Q09 2Q09 3Q09 4Q09 Strong Capital Ratios Source: SNL Financial; 4Q2009 TCE / TA excludes PNC as that figure was not
reported Peer Group: BBT, FITB, HBAN, KEY, MI, MTB, PNC, RF, STI, USB,
ZION See Supplemental Financial Data for reconcilements of Comerica’s
non-GAAP financial measures Tier I Common 0% 2% 4% 6% 8% 10% 12% 4Q08 1Q09 2Q09 3Q09 4Q09 TCE / TA Peer Median Comerica Comerica Proforma |
 9 Other Markets $3.5B 8% Int'l $1.7B 4% Florida $1.6B 4% Midwest $15.8B 37% Western $13.3B 31% Texas $6.9B 16% Diverse Loan Portfolio 1 Specialty Businesses includes: Entertainment, Energy, Financial Services Division,
Leasing, Technology and Life Sciences, and Mortgage Banker Finance
Geography based on office of origination; Midwest: MI, OH, IL; Western: CA,
AZ, NV, CO, WA; Other Markets include markets not separately identified above in addition to businesses with a national perspective Average 4Q09: $42.8 billion Global Corp Banking $5.2B 12% Commercial Real Estate $5.7B 13% Middle Market $13.2B 31% Nat'l Dealer Services $3.1B 7% Specialty Businesses 1 $5.1B 12% Personal Banking $2.0B 5% Small Business Banking $3.8B 9% Private Banking $4.7B 11% |
 10 Fourth Quarter 2009 Credit Quality Net charge-offs declined from 3Q09, as expected • Commercial real estate charge-offs declined $29MM from 3Q09 Nonperforming assets declined by $13MM Inflow to nonaccrual slowed by $95MM Loans past due 90 days or more and still accruing decreased by $60MM Watch list loans decreased $520MM Provision for credit losses declined by $54MM Allowance for credit losses to total loans increased to 2.34% Expect net charge-offs between $775MM and $825MM in 2010, a modest improvement over 2009 Net charge-off and nonperforming asset metrics continue to be better than peer
averages Average carrying value of 56% (44% write-down) on nonaccrual loans reflects
current appraisals Analysis of 4Q09 compared to 3Q09. 1 Based on analysis of nonaccrual loans with book balances greater than $2mm 2 Watch list: generally consistent with regulatory defined special mention, substandard and doubtful loans 3 This outlook is provided as of February 25, 2010 1 3 2 Broad-based improvement in credit metrics |
 11 Credit Metrics Compare Favorably 1.0% 1.7% 1.7% 2.5% 3.2% 2.9% 1.3% 2.1% 2.1% 2.1% 0.00% 1.00% 2.00% 3.00% 4.00% 4Q08 1Q09 2Q09 3Q09 4Q09 Source: SNL Financial NPA: Nonperforming Assets; OREO: Other Real Estate Owned; NCO: Net Charge-offs
Peer Group: BBT, FITB, HBAN, KEY, MI, MTB, PNC, RF, STI, USB, ZION NCOs / Average Loans 55% 59% 64% 68% 85% 72% 76% 73% 76% 78% 0% 20% 40% 60% 80% 100% 4Q08 1Q09 2Q09 3Q09 4Q09 Reserves / NPAs 1.5% 4.2% 3.9% 2.9% 2.1% 1.5% 1.6% 2.2% 1.9% 2.2% 0% 1% 2% 3% 4% 5% 4Q08 1Q09 2Q09 3Q09 4Q09 NPAs / Total Assets 6.2% 5.5% 4.2% 3.0% 2.1% 1.9% 2.2% 2.6% 3.0% 3.1% 0% 2% 4% 6% 8% 4Q08 1Q09 2Q09 3Q09 4Q09 NPAs / Loans + OREO Comerica Peer Median |
 12 Key Credit Differentiators Did not loosen credit standards at peak of cycle Conservative exposure thresholds Long tenured relationships 88% of portfolio is secured 1 Personal guarantees are customary for bulk of portfolio Proactive problem resolution and restructuring Quarterly Credit Quality Reviews Portfolio migration closely monitored Established Special Handling Group as a precursor to Special Asset Group Tightened lending standards: • Energy • Technology and Life Sciences • Home equity Curtailed exposure to certain industry segments: • Automotive supplier • Commercial and Residential Construction • SBA Franchise lending Comerica followed its credit policies… …making enhancements to adapt to the changing economy 1 At December 31, 2009 |
 13 Growing Core Deposits 4Q09 average core deposits of $36.7B, a $935MM or 3% increase • Avg. noninterest-bearing deposits grew $1.2B or 9% • Money market and NOW deposits increased $1.0B Investing in deposit rich segments: • Small Business • Financial Services Division (FSD) • Health Care • Wealth Management • Municipalities Investing in deposit rich products: • Government Card Programs • Remote Deposit Capture Average Noninterest-Bearing Deposits $ in billions; 4Q09 vs 3Q09 1 Core deposits exclude Institutional CDs, Retail Brokered CDs and foreign office time deposits $3 $6 $9 $12 $15 Non FSD FSD 1 |
 14 2.53% 2.73% 2.68% 2.94% 0.13% 0.08% 0.08% 0.16% 2.81% 2.61% 3.07% 2.84% 2.00% 2.25% 2.50% 2.75% 3.00% 3.25% 1Q09 2Q09 3Q09 4Q09 2010 Forecast Reported Net Interest Margin Impact of Excess Liquidity Net Interest Margin Expanding 4Q09 net interest margin of
2.94% reflected: + Higher-cost time deposits matured + Noninterest-bearing deposit growth + Loan spread improvement + Lower excess liquidity Average Excess liquidity position of $2.5B resulted from strong deposit growth and weak loan demand 2010 Outlook of 3.15-3.25% Based on no increase in the Federal Funds rate Continued improvement in loan pricing, lower funding costs and a lower level of excess liquidity Excess liquidity represented by deposits held at the Federal Reserve Bank. 1 This outlook is provided as of February 25, 2010. 1 |
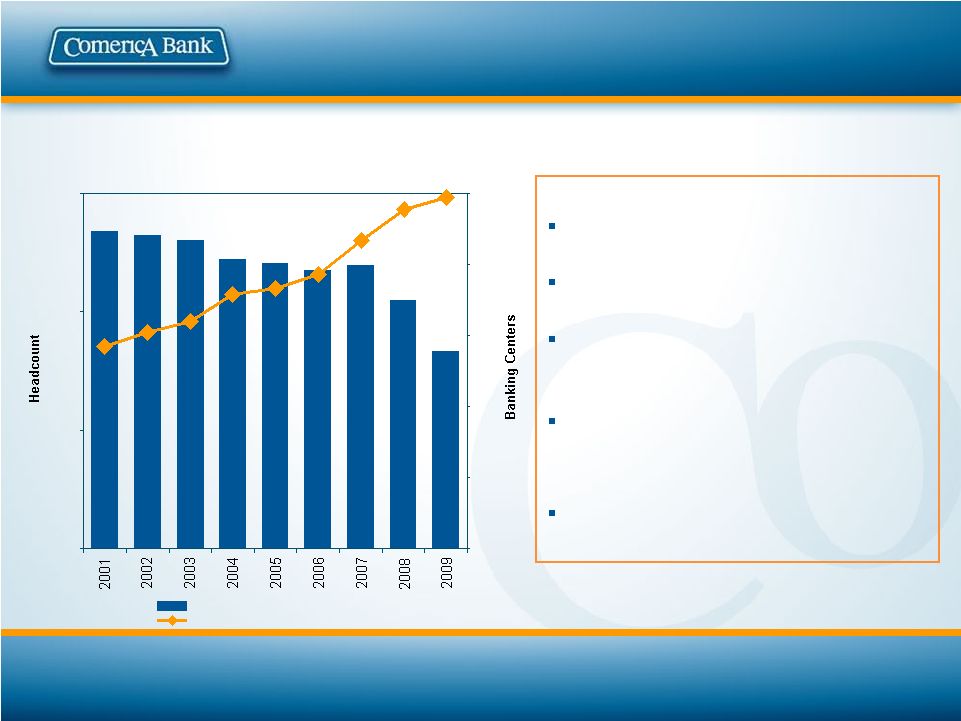 15 A Leaner, More Efficient Company Workforce reduced by about 850 Positions or 8% (12/31/09 vs. 12/31/08) Period-end figures 1 This outlook is provided as of February 25, 2010. 2010 noninterest expense: Expect low single-digit decrease compared to full-year 2009 1 Workforce reductions in 2009 will benefit 2010 Workforce reduction of 300 positions to be completed mid-year 2010 (severance expense taken in 4Q09) Expect reduced •Defined benefit pension expense •FDIC expense Continue to tightly control discretionary expenses 6,000 8,000 10,000 12,000 200 250 300 350 400 450 Full-time Equivalent Employees Banking Centers |
 16 2010 Full-Year Outlook Low single-digit period-end loan growth • Loan demand to lag economic recovery by several quarters • Investment securities portfolio to remain at year-end 2009 level Net interest margin between 3.15% and 3.25% • Based on no increase in the Federal Funds rate • Continued improvement in loan pricing, lower funding costs and a lower level of excess liquidity Net credit-related charge-offs between $775MM and $825MM • Provision for credit losses to be slightly in excess of net charge-offs Noninterest income flat, excluding $243MM of 2009 net securities gains Noninterest expenses, low single-digit decrease • Workforce reductions in 2009 will benefit 2010 • Expect reduced pension, FDIC and ORE expenses Income tax expense to approximate 35% of pre-tax income less approximately $60 million in annual tax benefits This outlook is provided as of February 25, 2010 Expectations based on a modestly improving economic environment
|
 17 “Normal” Operating Leverage Tight control of expenses Path to Normalized Returns Fee Income increases with economic & market activity Lower credit provision Risks: Regulatory Costs Opportunities: Re-accelerate banking center expansion Further leverage Texas headquarters Cross-sell WIM, Retail with Business Bank NIM Expansion Increased Loan Spreads Asset Sensitivity Loan Growth Middle Market Small Business CA & TX Today |
 18 Comerica: Poised for the Future Consistent strategy • Based on relationship banking model • Major lines of business: • Commercial Banking • Wealth & Institutional Management • Retail Banking Solid capital position and strong liquidity Dedicated workforce Investing to accelerate growth and balance • Banking center expansion in high growth markets • New and enhanced products and services Main Street Bank |
 19 Appendix |
 20 Supplemental Financial Data The Corporation believes these measurements are meaningful measures of capital adequacy
and used by investors, regulators, and others to evaluate the adequacy of
common equity and to compare against other companies in the industry. 1
Tier 1 capital and risk-weighted assets as defined by regulation 7.99% $59,091 $59,249 150 8 $4,720 $7,029 2,151 150 8 5,058 61,815 8.18% $7,704 2,151 495 $10,468 12/31/09 $10,774 $10,773 $10,724 $10,638 Total Regulatory Capital 7.21% $67,386 $67,548 150 12 $4,861 $7,152 2,129 150 12 5,181 73,207 7.08% $7,805 2,129 495 12/31/08 7.96% $59,432 $59,590 150 8 $4,732 $7,035 2,145 150 8 5,095 63,355 8.04% $7,735 2,145 495 9/30/09 7.55% $63,470 $63,630 150 10 $4,793 $7,093 2,140 150 10 5,139 67,124 7.66% $7,774 2,140 495 6/30/09 7.27% $67,209 $67,370 150 11 $4,888 $7,183 2,134 150 11 5,131 70,135 7.32% $7,760 2,134 495 3/31/09 Total shareholders’ equity Less: Fixed rate cumulative perpetual preferred stock Less: Goodwill Less: Other intangible assets Reconciliation of non-GAAP financial measures with financial measures defined by GAAP ($ in millions) Tangible common equity ratio Total assets Less: Goodwill Less: Other intangible assets Tangible common equity Tier 1 capital 1 Less: Fixed rate cumulative perpetual preferred stock Less: Trust preferred securities Tangible assets Tier 1 common capital Risk-weighted assets 1 Tier 1 common capital ratio |
 21 Supplemental Financial Data The Corporation believes these measurements are meaningful measures of capital adequacy
and used by investors, regulators, and others to evaluate the adequacy of
common equity and to compare against other companies in the industry. TCE/TA:
Tangible Common Equity to Tangible Assets Tier 1 capital and
risk-weighted assets as defined by regulation 150 8 150 8 Goodwill Other Intangibles 57,771 61,815 59,249 61,815 Total Assets Risk-Weighted Assets 5,393 57,613 4,720 59,091 Tangible Common Equity Tangible Assets 158 158 Intangible Assets 9.36% 9.27% 10.07% 14.54% 7.99% 8.18% 12.46% 16.93% TCE / TA Tier 1 Common Tier 1 Capital Total Capital 5,731 6,226 5,058 7,704 Tier 1 common Tier 1 capital 8,990 10,468 Total Capital 7,029 $4,878 2,151 As Reported 12/31/09 $5,551 0 Common Equity Preferred Equity 5,551 Proforma Capital Raise & Preferred Redemption 12/31/09 Total Equity |
 22 Comerica Incorporated Comerica Incorporated has filed a registration statement (including a prospectus) (File No. 333-163220) with the SEC for the offering to which this communication relates. Before you invest, you should read the prospectus in that registration statement and other documents Comerica has filed with the SEC for more complete information about Comerica and this offering. You may get these documents for free by visiting EDGAR on the SEC Web site at www.sec.gov. Alternatively, copies
of the prospectus may be obtained from J.P. Morgan Securities Inc.
toll free at (866) 430-0686. |
 |