Attached files
UNITED
STATES
SECURITIES
AND EXCHANGE COMMISSION
Washington, D.C.
20549
Form 10-K
|
(Mark
One)
|
||
|
x
|
ANNUAL
REPORT PURSUANT TO SECTION 13 OR 15(d) OF
THE
SECURITIES EXCHANGE ACT OF 1934
|
|
|
For
the fiscal year ended December 31,
2009
|
||
|
OR
|
||
|
o
|
TRANSITION
REPORT PURSUANT TO SECTION 13 OR 15(d) OF
THE
SECURITIES EXCHANGE ACT OF 1934
|
|
|
For
the transition period
from to .
|
Commission
File Number 001-33756
Vanguard
Natural Resources, LLC
(Exact
Name of Registrant as Specified in Its Charter)
|
Delaware
|
61-1521161
|
|
|
(State
or Other Jurisdiction of
Incorporation
or Organization)
|
(I.R.S.
Employer
Identification
No.)
|
|
|
7700
San Felipe, Suite 485
Houston,
Texas
|
77063
|
|
|
(Address
of Principal Executive Offices)
|
(Zip
Code)
|
Telephone
Number: (832) 327-2255
Securities
registered pursuant to Section 12(b) of the Act:
|
Title
of Each Class
|
Name
of Each Exchange
on
which Registered
|
|
|
Common
Units
|
New
York Stock Exchange
|
Securities
registered pursuant to Section 12(g) of the Act: None
Indicate
by check mark if the registrant is a well-known seasoned issuer, as defined in
Rule 405 of the Securities Act.
|
Yes o
|
No
x
|
Indicate
by check mark if the registrant is not required to file reports pursuant to
Section 13 or Section 15(d) of the Act.
|
Yes o
|
No
x
|
Indicate
by check mark whether the registrant (1) has filed all reports required to
be filed by Section 13 or 15(d) of the Securities Exchange Act of 1934
during the preceding 12 months (or for such shorter period that the
registrant was required to file such reports),
|
and
(2) has been subject to such filing requirements for the past
90 days.
|
Yes x
|
No
o
|
Indicate
by check mark whether the registrant has submitted electronically and posted on
its corporate Web site, if any, every Interactive Data File required to be
submitted and posted pursuant to Rule 405 of Regulation S-T (§ 232.405 of this
chapter) during the preceding 12 months (or for such shorter period that the
registrant was required to submit and post such files).
|
Yes o
|
No
o
|
Indicate
by check mark if disclosure of delinquent filers pursuant to Item 405 of
Regulation S-K is not contained herein, and will not be contained, to the
best of registrant’s knowledge, in definitive proxy or information statements
incorporated by reference in
|
Part III
of this Form 10-K or any amendment to this
Form 10-K.
|
o
|
Indicate
by check mark whether the registrant is a large accelerated filer, an
accelerated filer, a non-accelerated filer, or a smaller reporting company. See
definition of “large accelerated filer,” “accelerated filer” and “smaller
reporting company” in Rule 12b-2 of the Exchange Act.
|
Large
accelerated filero
|
Accelerated
filerx
|
|
|
Non-accelerated
filero
|
Smaller
reporting companyo
|
|
|
(Do
not check if smaller reporting company)
|
Indicate
by check mark whether the registrant is a shell company (as defined in
Rule 12b-2 of the Exchange Act).
|
Yes o
|
No x
|
The
aggregate market value of Vanguard Natural Resources, LLC common units held by
non-affiliates of the registrant as of June 30, 2009 was approximately
$102,762,900 based upon the New York Stock Exchange composite transaction
closing price.
As of
March 1, 2010, 18,416,173 of the registrant’s common units remained
outstanding.
Documents
Incorporated by Reference:
Portions of the registrant’s proxy
statement to be furnished to unitholders in connection with its 2010
Annual Meeting of Unitholders are incorporated by reference in
Part III— Items
10-14 of this annual report on Form 10-K for the year ending
December 31, 2009 (“this Annual Report”).
Vanguard
Natural Resources, LLC
TABLE
OF CONTENTS
|
Caption
|
Page
|
||
Forward
Looking Statements
The
statements contained in this report, other than statements of historical fact,
constitute forward-looking statements. Such statements include, without
limitation, all statements as to the production of natural gas and oil, product
price , natural gas and oil reserves, drilling and completion results, capital
expenditures and other such matters. These statements relate to events and/or
future financial performance and involve known and unknown risks, uncertainties
and other factors that may cause our actual results, levels of activity,
performance or achievements or the industry in which we operate to be materially
different from any future results, levels of activity, performance or
achievements expressed or implied by the forward-looking statements. These risks
and other factors include those listed under Item 1A “Risk Factors” and those
described elsewhere in this report.
In
some cases, you can identify forward-looking statements by our use of terms such
as “may,” “will,” “should,” “expects,” “plans,” “anticipates,” “believes,”
“estimates,” “intends,” “predicts,” “potential” or the negative of these terms
or other comparable terminology. These statements are only predictions. Actual
events or results may differ materially. In evaluating these statements, you
should specifically consider various factors, including the risks outlined under
“Risk Factors.” These factors may cause our actual results to differ materially
from any forward-looking statement. Factors that could affect our actual results
and could cause actual results to differ materially from those in
forward-looking statements include, but are not limited to, the
following:
|
|
·
the volatility of realized natural gas, natural gas liquids and oil
prices;
|
|
|
·
the potential for additional impairment due to future decreases in natural
gas, natural gas liquids and oil
prices;
|
|
|
·
uncertainties about the estimated quantities of natural gas, natural gas
liquids and oil reserves, including uncertainties about the effects
of the Securities and Exchange Commission’s (“SEC”) new rules governing
reserve
reporting;
|
|
|
|
|
|
·
the conditions of the capital markets, interest rates, availability of
credit facilities to support business requirements, liquidity and general
economic conditions;
|
|
|
|
|
|
·
the discovery, estimation, development and replacement of natural gas,
natural gas liquids and oil
reserves;
|
|
|
|
|
|
·
our business and financial
strategy;
|
|
|
|
|
|
·
our drilling locations;
|
|
|
|
|
|
·
technology;
|
|
|
|
|
|
·
our cash flow, liquidity and financial
position;
|
|
|
|
|
|
·
our production volumes;
|
|
|
|
|
|
·
our operating expenses, general and administrative costs, and finding and
development costs;
|
|
|
|
|
|
·
the availability of drilling and production equipment, labor and other
services;
|
|
|
|
|
|
·
our future operating results;
|
|
|
|
|
|
·
our prospect development and property
acquisitions;
|
|
|
|
|
|
·
the marketing of natural gas, natural gas liquids and
oil;
|
|
|
|
|
|
·
competition in the natural gas, natural gas liquids and oil
industry;
|
|
|
|
|
|
·
the impact of weather and the occurrence of natural disasters such as
fires, floods, hurricanes, earthquakes and other catastrophic events and
natural disasters;
|
|
|
|
|
|
·
governmental regulation of the natural gas and oil
industry;
|
|
|
|
|
|
·
environmental regulations;
|
|
|
· the
effect of legislation, regulatory initiatives and litigation related to
climate change;
|
|
|
|
|
|
·
developments in oil-producing and natural gas producing countries;
and
|
|
|
|
|
|
·
our strategic plans, objectives, expectations and intentions for future
operations.
|
|
|
|
Although
we believe that the expectations reflected in the forward-looking statements are
reasonable, we cannot guarantee future results, levels of activity, performance
or achievements. Moreover, neither we nor any other person assumes
responsibility for the accuracy and completeness of these forward-looking
statements. We do not intend to update any of the forward-looking statements
after the date of this report to conform prior statements to actual
results.
Below is
a list of terms that are common to our industry and used throughout this
document:
|
/day
|
=
per day
|
Mcf
|
=
thousand cubic feet
|
|||
|
Bbls
|
=
barrels
|
Mcfe
|
=
thousand cubic feet of natural gas equivalents
|
|||
|
Bcf
|
=
billion cubic feet
|
MGal
|
=
thousand gallons
|
|||
|
Bcfe
|
=
billion cubic feet equivalents
|
MMBtu
|
=
million British thermal units
|
|||
|
Btu
|
=
British thermal unit
|
MMcf
|
=
million cubic feet
|
|||
|
Gal
|
=
gallons
|
MMcfe
|
=
million cubic feet of natural gas equivalents
|
|||
|
MBbls
|
=
thousand barrels
|
NGL
|
=
natural gas liquids
|
When we
refer to natural gas, natural gas liquids and oil in “equivalents,” we are doing
so to compare quantities of natural gas liquids and oil with quantities of
natural gas or to express these different commodities in a common unit. In
calculating equivalents, we use a generally recognized standard in which 42
gallons is equal to one Bbl of oil or one Bbl of natural gas liquids and one Bbl
of oil or one Bbl of natural gas liquids is equal to six Mcf of natural gas.
Also, when we refer to cubic feet measurements, all measurements are at a
pressure of 14.73 pounds per square inch.
References
in this report to (1) “us,” “we,” “our,” “the Company,” “Vanguard” or “VNR” are
to Vanguard Natural Resources, LLC and its subsidiaries, including Vanguard
Natural Gas, LLC, Trust Energy Company, LLC (“TEC”), VNR Holdings, Inc.
(“VNRH”), Ariana Energy, LLC (“Ariana Energy”), Vanguard Permian, LLC (“Vanguard
Permian”) and VNR Finance Corp. (“VNRF”) and (2) “Vanguard Predecessor,”
“Predecessor,” “our operating subsidiary” or “VNG” are to Vanguard Natural Gas,
LLC.
|
|
Overview
|
|
|
|
We are a
publicly traded limited liability company focused on the acquisition and
development of mature, long-lived natural gas and oil properties in the United
States. Our primary business objective is to generate stable cash flows allowing
us to make quarterly cash distributions to our unitholders, and over time to
increase our quarterly cash distributions through the acquisition of new natural
gas and oil properties. Our properties are located in the southern portion of
the Appalachian Basin, primarily in southeast Kentucky and northeast Tennessee,
the Permian Basin, primarily in west Texas and southeastern New Mexico, and in
south Texas.
We
completed our initial public offering, or “IPO,” on October 29, 2007, and
our common units, representing limited liability company interests, are listed
on the New York Stock Exchange under the symbol “VNR.”
On
April 18, 2007 but effective January 5, 2007 our Predecessor was
separated into our operating subsidiary and Vinland Energy Eastern, LLC, or
“Vinland,” an affiliate of Mr. Majeed S. Nami or “Nami,” who together with
certain of his affiliates and related persons, is our largest unitholder. As
part of the separation, we retained all of our Predecessor’s proved producing
wells and associated reserves. We also retained 40% of our Predecessor’s working
interest in the known producing horizons in approximately 95,000 gross
undeveloped acres and a contract right to receive approximately 99% of the net
proceeds from the sale of production from certain producing natural gas and oil
wells. In the separation, Vinland was conveyed the remaining 60% of our
Predecessor’s working interest in the known producing horizons in this acreage,
and 100% of our Predecessor’s working interest in depths above and 100 feet
below our known producing horizons. Vinland acts as the operator of our existing
wells in Appalachia and all of the wells that we drill in this area. The
separation was effected to facilitate our formation, as we are a company focused
on lower risk production, development and acquisition opportunities, while
Vinland pursues higher capital intensive development, exploitation and
exploration opportunities. Our working interest in any particular well in our
drilling program will vary based on the lease or leases on which such well is
located and the participation of any minority owners in the drilling of such
wells.
On
December 21, 2007, we entered in to a Purchase and Sale Agreement with the
Apache Corporation for the purchase of certain natural gas and oil properties
located in ten separate fields in the Permian Basin of west Texas and
southeastern New Mexico, referred to as the “Permian Basin acquisition.” The
purchase price for said assets was $78.3 million with an effective date of
October 1, 2007. We completed this acquisition on January 31, 2008 for
an adjusted purchase price of $73.4 million, subject to customary post-closing
adjustments. The post-closing adjustments reduced the final purchase price to
$71.5 million which included a purchase price adjustment of $6.8 million for the
cash flow from the acquired properties for the period between the effective
date, October 1, 2007, and the final settlement date. This acquisition was
funded with borrowings under our reserve-based credit facility. Through this
acquisition, we acquired working interests in 390 gross wells (67 net wells), 56
gross wells (54 net wells) of which we operate. With respect to operations, we
established two district offices, one in Lovington, New Mexico and the other in
Christoval, Texas to manage these assets. Our operating focus has been on
maximizing existing production and looking for complementary acquisitions that
we can add to this operating platform. As of December 31, 2009, based on a
reserve report prepared by our independent reserve engineers, these acquired
properties have estimated proved reserves of 3.4 million barrels of oil
equivalent, 86% of which is oil and 89% of which is proved developed
producing.
On July
18, 2008, we entered into a Purchase and Sale Agreement with Segundo Navarro
Drilling, Ltd. (“Segundo”), a wholly-owned subsidiary of the Lewis Energy Group
(“Lewis”), for the acquisition of certain natural gas and oil properties located
in the Dos Hermanos Field in Webb County, Texas, referred to as the “Dos
Hermanos acquisition.” The purchase price for said assets was $53.4 million with
an effective date of June 1, 2008. We completed this acquisition on July 28,
2008 for an adjusted purchase price of $51.4 million. This acquisition was
funded with $30.0 million of borrowings under our reserve-based credit facility
and through the issuance of 1,350,873 common units of the Company. In this
purchase, we acquired an average of a 98% working interest in 90 producing wells
and an average 47.5% working interest in approximately 4,705 gross acres with 41
identified proved undeveloped locations. An affiliate of Lewis operates all the
properties and is contractually obligated to drill seven wells each year from
2010 through 2013 unless mutually agreed not to do so. Upon closing this
transaction, we assumed natural gas swaps and collars based on Houston Ship
Channel pricing for approximately 85% of the estimated gas production from
existing producing wells for the period beginning July 2008 through December
2011 which had a fair value of $3.6 million on July 28, 2008. As of December 31,
2009, based on a reserve report prepared by our independent reserve engineers,
these acquired properties have estimated proved reserves of 16.0 Bcfe, 99% of
which is natural gas and natural gas liquids and 59% of which is proved
developed producing.
1
On July
17, 2009, we entered into a Purchase and Sale Agreement with Segundo to acquire
certain natural gas and oil properties located in the Sun TSH Field in La Salle
County, Texas for $52.3 million, referred to as the “Sun TSH acquisition.” The
acquisition had a July 1, 2009 effective date and was completed on August 17,
2009 for an adjusted purchase price of $50.5 million, subject to customary
post-closing adjustments. An affiliate of Lewis operates all of the wells
acquired in this transaction. This acquisition was funded with borrowings under
our reserve-based credit facility and proceeds from the Company’s public equity
offering of 3.9 million common units completed on August 17, 2009. At closing,
we assumed natural gas puts and swaps based on NYMEX pricing for approximately
61% of the estimated gas production from then-existing producing wells in the
acquired properties for the period beginning August of 2009 through December of
2010, which had a fair value of $4.1 million on the closing date. In addition,
concurrent with the execution of the Purchase and Sale Agreement, we entered
into a collar for certain volumes in 2010 and a series of collars for a
substantial portion of the expected gas production for 2011 at prices above the
then-current market price with a total cost to the Company of $3.1 million,
which was financed through deferred premiums. As of December 31, 2009, based on
a reserve report prepared by our independent reserve engineers, these acquired
properties have estimated proved reserves of 35.7 Bcfe, 98% of which is natural
gas and natural gas liquids and 62% is proved developed producing.
On
November 27, 2009, we entered into a Purchase and Sale Agreement, Lease
Amendment and Lease Royalty Conveyance Agreement and a Conveyance Agreement to
acquire certain producing natural gas and oil properties located in Ward County,
Texas in the Permian Basin from private sellers, referred to as the “Ward County
acquisition.” This transaction had an effective date of October 1, 2009 and was
closed on December 2, 2009 for $55.0 million, subject to customary post-closing
adjustments. This acquisition was initially funded with borrowings under our
reserve-based credit facility with borrowings being reduced by $40.3 million
shortly thereafter with the proceeds from a 2.3 million common unit offering. We
will operate all but one of the ten wells acquired in this transaction. As of
December 31, 2009, based on a reserve report prepared by our independent reserve
engineers, these acquired properties have estimated proved reserves of 3.4
million barrels of oil equivalent, 81% of which is oil and 55% is proved
developed.
Based on
reserve reports prepared by our independent reserve engineers, Netherland,
Sewell & Associates, Inc., or “NSAI,” and DeGolyer and MacNaughton, or
“D&M,” our total estimated proved reserves at December 31, 2009 were
142.9 Bcfe, of which approximately 73% were natural gas and natural gas liquids
and 68% were classified as proved developed. At December 31, 2009, we owned
working interests in 2,011 gross (1,185 net) productive wells and our average
net production for the year ended December 31, 2009 was 20,010 Mcfe per
day. We also have a 40% working interest in approximately 109,500 gross
undeveloped acres surrounding or adjacent to our existing wells located in
southeast Kentucky and northeast Tennessee. As mentioned above, Vinland owns the
remaining 60% working interest in this acreage. Approximately 12%, or 16.7 Bcfe,
of our estimated proved reserves as of December 31, 2009 were attributable
to this 40% working interest. In addition, we own a contract right to receive
approximately 99% of the net proceeds from the sale of production from certain
oil and gas wells located in Bell and Knox Counties, Kentucky, which accounted
for approximately 1.7% of our estimated proved developed reserves as of
December 31, 2009. Our wells and undeveloped leasehold acreage in
Appalachia fall within an approximate 750,000 acre area, which we refer to in
this Annual Report as the “area of mutual interest,” or AMI. We have agreed with
Vinland until January 1, 2012 to offer the other the right to participate
in any acquisition and development opportunities that arise in the AMI, subject
however to Vinland’s right to consummate up to two acquisitions with a purchase
price of $5.0 million or less annually without a requirement to offer us the
right to participate in such acquisitions. In South Texas and the Permian Basin,
we own working interests ranging from 30-100% in approximately 16,130
undeveloped acres surrounding our existing wells.
Our
average proved reserves-to-production ratio, or average reserve life, is
approximately 20 years based on our proved reserves as of December 31, 2009
and our production for 2009. As of December 31, 2009, we have identified 470
proved undeveloped drilling locations and over 205 other drilling locations on
our leasehold acreage. Pursuant to a participation agreement that we have
entered into with Vinland, Vinland generally has control over our drilling
program in Appalachia and has the sole right to determine which wells are
drilled in Appalachia until January 1, 2011. During this period we will
meet with Vinland on a quarterly basis to review Vinland’s proposal to drill not
less than 25 nor more than 40 gross wells, in which we will own a 40% working
interest, in any quarter. Up to 20% of the proposed wells may be carried over
and added to the wells to be drilled in the subsequent quarter, provided that
Vinland is required to drill at least 100 gross wells per calendar year. If
Vinland proposes the drilling of less than 25 gross wells in any quarter, we
have the right to propose the drilling of up to a total of 14 net wells, in
which we will own a 100% working interest, in a given quarterly period. If
either party elects not to participate in the drilling of the proposed wells or
future operations with respect to drilled wells and such drilling or operations
are performed within the calendar quarter, as proposed, such party forfeits all
right, title and interest in the natural gas and oil production that may be
produced from such wells. Notwithstanding the foregoing, if both parties agree,
no drilling is required. We anticipate that, given existing market conditions,
neither party will propose or participate in drilling until favorable conditions
for drilling exist. The participation agreement will remain in place until
January 5, 2012 and shall continue thereafter on a year to year basis until such
time as either party elects to terminate the agreement. The obligations of the
parties with respect to the drilling program described above will expire January
5, 2011, after which we each will have the right to propose the drilling of
wells within the AMI and offer participation in such proposed drilling to the
other party and if either party elects not to participate in such proposed
drilling or future operations with respect to drilled wells, such party forfeits
all right, title and interest in the natural gas and oil production that may be
produced from such wells.
2
Disruption
to Functioning of Capital Markets
Multiple
events during 2008 and 2009 involving numerous financial institutions
effectively restricted liquidity within the capital markets throughout the
United States and around the world. While capital markets remain volatile,
efforts by treasury and banking regulators in the United States, Europe and
other nations around the world to provide liquidity to the financial sector
appears to have improved the situation. As evidenced by our recent successful
equity offerings, successful amendment of our reserve-based credit facility and
recent successful equity and debt offerings by our peers, we believe that our
access to capital has improved.
During
2009, our unit price increased from a closing low of $6.35 on January 2, 2009 to
a closing high of $22.07 on December 31, 2009. Also during 2009, we did not
drill any wells on our operated properties, and there was limited drilling on
non-operated properties. We intend to move forward with our development drilling
program when market conditions allow for an adequate return on the drilling
investment, and only when we have sufficient liquidity to do so. Maintaining
adequate liquidity may involve the issuance of debt and equity at less
attractive terms, could involve the sale of non-core assets and could require
reductions in our capital spending. In the near-term we will focus on
maximizing returns on existing assets by managing our costs, selectively
deploying capital to improve existing production and drilling a limited number
of wells which we believe will provide an adequate return on the
investment.
Business
Strategies
Our
primary business objective is to provide stable cash flows allowing us to make
quarterly cash distributions to our unitholders, and over the long-term to
increase the amount of our future distributions by executing the following
business strategies:
|
·
|
Manage
our natural gas and oil assets with a focus on maintaining production
levels and optimizing cash flows by monitoring lease operating
costs;
|
|
·
|
Replace
reserves either through the development of our extensive inventory of
proved undeveloped locations or make accretive acquisitions of natural gas
and oil properties in the known producing basins of the continental United
States characterized by a high percentage of producing reserves,
long-life, stable production and step-out development opportunities;
|
|
|
|
|
·
|
Maintain
a conservative capital structure to ensure financial flexibility for
opportunistic acquisitions; and
|
|
·
|
Use
derivative instruments to reduce the volatility in our revenues resulting
from changes in natural gas and oil
prices.
|
|
|
|
Natural
Gas, Natural Gas Liquids and Oil Prices
The
Appalachian Basin is a mature, producing region with well known geologic
characteristics. Reserves in the Appalachian Basin typically have a high degree
of step-out development success; that is, as development progresses, reserves
from newly completed wells are reclassified from the proved undeveloped to the
proved developed category, and additional adjacent locations are added to proved
undeveloped reserves. As a result, the cumulative amount of total proved
reserves tends to increase as development progresses. Wells in the Appalachian
Basin generally produce little or no water, contributing to a low cost of
operation. In addition, most wells produce dry natural gas, which does not
require processing. Natural gas produced in the Appalachian Basin typically
sells for a premium to New York Mercantile Exchange, or “NYMEX,” natural gas
prices due to the proximity to major consuming markets in the northeastern
United States. For the year ended December 31, 2009, the average premium
over NYMEX for natural gas delivered to our primary delivery points in the
Appalachian Basin on the Columbia Gas Transmission system was $0.18 per MMBtu.
In addition, most of our natural gas production has historically had a high Btu
content, resulting in an additional premium to NYMEX natural gas prices. For the
year ended December 31, 2009, our average realized natural gas prices in
Appalachia (before hedging), represented a $1.07 per Mcfe premium to NYMEX
natural gas prices, which accounts for both the basis differential and the Btu
adjustments.
In the
Permian Basin, most of our gas production is casinghead gas produced in
conjunction with our oil production. Casinghead gas typically has a high
Btu content and requires processing prior to sale to third parties. We have a
number of processing agreements in place with gatherers/processors of our
casinghead gas, and we share in the revenues associated with the sale of natural
gas liquids resulting from such processing, depending on the terms of the
various agreements. For the year ended December 31, 2009, the average
premium over NYMEX from the sale of casinghead gas plus our share of the
revenues from the sale of natural gas liquids was $0.13 per MMBtu.
3
In South
Texas, our natural gas production has a high Btu content and requires some
processing prior to sale to third parties. Through our relationship with the
operator of the Dos Hermanos and Sun TSH properties, an affiliate of Lewis, we
benefit from a processing agreement that was in place prior to our acquisition
of these natural gas properties. Our proportionate share of the gas volumes are
sold at the tailgate of the processing plant at the Houston Ship Channel Index
price which typically results in a discount to NYMEX prices; however, with our
share of the natural gas liquids associated with the processing of such gas, our
revenues on an Mcf basis are a premium to the NYMEX prices.
Our
oil production, both in Appalachia and the Permian Basin, is sold under
month-to-month sales contracts with purchasers that take delivery of the oil
volumes at the tank batteries adjacent to the producing wells. Our pricing for
oil sales is based on the monthly average of the West Texas Intermediate Price,
or “WTI,” as posted for the various regions and published by Plains Marketing,
LP, ConocoPhillips or a similar large purchaser of oil, less a transportation or
quality differential which corresponds to the field location or type of oil
being produced. During 2009, we received the average WTI price less $7.58 per
barrel in Appalachia and the average WTI price less $5.55 per barrel in the
Permian Basin.
We enter
into derivative transactions in the form of hedging arrangements to reduce the
impact of natural gas and oil price volatility on our cash flow from operations.
Currently, we use fixed-price swaps and NYMEX collars to hedge natural gas and
oil prices. By removing the price volatility from a significant portion of our
natural gas and oil production, we have mitigated for a period of time, but not
eliminated, the potential effects of fluctuation in natural gas and oil prices
on our cash flow from operations. For a description of our derivative positions,
please read “Item 7A—Quantitative and Qualitative Disclosures About Market
Risk.”
Natural
Gas, Natural Gas Liquids and Oil Data
In
December 2008, the SEC adopted new rules related to modernizing reserve
calculations and disclosure requirements for oil and natural gas companies,
which became effective prospectively for annual reporting periods ending on or
after December 31, 2009. The new rules expand the definition of oil and gas
producing activities to include the extraction of saleable hydrocarbons from oil
sands, shale, coal beds or other nonrenewable natural resources that are
intended to be upgraded into synthetic oil or gas, and activities undertaken
with a view to such extraction. The use of new technologies is now permitted in
the determination of proved reserves if those technologies have been
demonstrated empirically to lead to reliable conclusions about reserve volumes.
Other definitions and terms were revised, including the definition of proved
reserves, which was revised to indicate that entities must use the unweighted
arithmetic average of the first-day-of-the-month commodity price over the
preceding 12-month period (the “12-month average price”), rather than the
end-of-period price, when estimating whether reserve quantities are economical
to produce. Likewise, the 12-month average price is now used to calculate cost
center ceilings for impairment and to compute depreciation, depletion and
amortization. Another significant provision of the new rules is a general
requirement that, subject to limited exceptions, proved undeveloped reserves may
only be booked if they relate to wells scheduled to be drilled within five years
of the date of booking.
The
initial application of the new rules related to modernizing reserve calculations
and disclosure requirements resulted in a downward adjustment of 10.6 Bcfe to
our total proved reserves and a downward adjustment of $152.2 million to the
standardized measure of discounted future net cash flows as of December 31,
2009. Approximately 14.2 Bcfe of this downward adjustment is attributable to the
new requirement that 12-month average prices, instead of end-of-period prices,
are used in estimating our quantities of proved oil and natural gas reserves.
Additional proved undeveloped reserves of 3.6 Bcfe were added as a result of new
SEC rules that allow for additional drilling locations to be classified as
proved undeveloped reserves assuming such locations are supported by reliable
technologies. No proved undeveloped reserves were removed that exceeded the five
year development limitation on proved undeveloped reserves imposed by the new
rules. The downward adjustment of 10.6 Bcfe to our total proved reserves due to
the new SEC rules was more than offset by a 74.7 Bcfe increase in our reserves
due to acquisitions completed during the year ended December 31,
2009.
|
|
Proved
Reserves
|
The
following table presents our estimated net proved natural gas, natural gas
liquids and oil reserves and the present value of the estimated proved reserves
at December 31, 2009, based on reserve reports prepared by NSAI and
D&M. A copy of their summary reports are included as exhibits to this Annual
Report. The estimate of net proved reserves has not been filed with or included
in reports to any federal authority or agency. The Standardized Measure value
shown in the table is not intended to represent the current market value of our
estimated natural gas, natural gas liquids and oil reserves.
4
|
As
of
December
31,
2009
|
As
of
December
31,
2008
|
|||||||
|
Reserve
Data:
|
||||||||
|
Estimated
net proved reserves:
|
||||||||
|
Natural
gas (Bcf)
|
83.1 | 81.2 | ||||||
|
Natural
gas liquids (MBbls)
|
3,550 | — | ||||||
|
Crude
oil (MBbls)
|
6,413 | 4,547 | ||||||
|
Total
(Bcfe)
|
142.9 | 108.5 | ||||||
|
Proved
developed (Bcfe)
|
96.9 | 80.9 | ||||||
|
Proved
undeveloped (Bcfe)
|
46.0 | 27.6 | ||||||
|
Proved
developed reserves as % of total proved reserves
|
68 | % | 75 | % | ||||
|
Standardized
measure (in millions) (1)
|
$ | 178.7 | $ | 190.1 | ||||
|
Representative
Natural Gas and Oil Prices (2):
|
||||||||
|
Natural
gas—Henry Hub per MMBtu
|
$ | 3.87 | $ | 5.71 | ||||
|
Oil—WTI
per Bbl
|
$ | 61.04 | $ | 41.00 | ||||
|
|
(1) Does not
give effect to hedging transactions. For a description of our hedging
transactions, please read “Item 7A—Quantitative and Qualitative
Disclosures About Market Risk.”
|
|
|
(2) Natural
gas and oil prices are based on spot prices per MMBtu and Bbl,
respectively, calculated using the 12-month average price for January
through December 2009, with these representative prices adjusted by field
for quality, transportation fees and regional price differentials to
arrive at the appropriate net
price.
|
The data
in the above table represents estimates only. Natural gas, natural gas liquids
and oil reserve engineering is inherently a subjective process of estimating
underground accumulations of natural gas, natural gas liquids and oil that
cannot be measured in an exact manner, and the accuracy of any reserve estimate
is a function of the quality of available data and of engineering and geological
interpretation and judgment. The quantities of natural gas, natural gas liquids
and oil that are ultimately recovered, production and operating costs, the
amount and timing of future development expenditures and future sales prices may
differ from those assumed in these estimates. Please read “Item 1A—Risk
Factors.”
In
accordance with the guidelines of the SEC, our independent reserve engineers’
estimates of future net revenues from our properties, and the standardized
measure thereof, were determined to be economically producible under existing
economic conditions, which requires the use of the 12-month average price for
each product.
Future
prices received for production and costs may vary, perhaps significantly, from
the prices and costs assumed for purposes of these estimates. The standardized
measure shown should not be construed as the current market value of the
reserves. The 10% discount factor used to calculate present value, which is
required by Financial Accounting Standards Board’s (“FASB”) Accounting Standards
Codification (“ASC”), is not necessarily the most appropriate discount rate. The
present value, no matter what discount rate is used, is materially affected by
assumptions as to timing of future production, which may prove to be
inaccurate.
From time
to time, we engage NSAI to prepare a reserve and economic evaluation of
properties that we are considering purchasing. Neither NSAI nor any of their
respective employees have any interest in those properties and the compensation
for these engagements is not contingent on their estimates of reserves and
future net revenues for the subject properties. During 2009, we paid NSAI
approximately $33,000 for all reserve and economic evaluations.
Qualifications
of Technical Persons and Internal Controls over Reserves Estimation
Process
Our
proved reserve information as of December 31, 2009 included in this Annual
Report was estimated by our independent petroleum engineers, NSAI and D&M,
in accordance with generally accepted petroleum engineering and evaluation
principles and definitions and guidelines established by the SEC. The technical
persons responsible for preparing the reserves estimates presented herein meet
the requirements regarding qualifications, independence, objectivity and
confidentiality set forth in the Standards Pertaining to the Estimating and
Auditing of Oil and Gas Reserves Information promulgated by the Society of
Petroleum Engineers.
We
maintain an internal staff of petroleum engineers who work closely with our
independent petroleum engineers to ensure the integrity, accuracy and timeliness
of data furnished to NSAI and D&M in their reserves estimation process. In
the fourth quarter, our technical team meets on a regular basis with
representatives of NSAI and D&M to review properties and discuss methods and
assumptions used in NSAI and D&M’s preparation of the year-end reserves
estimates. While we have no formal committee specifically designated to review
reserves reporting and the reserves estimation process, the NSAI reserve report
and the D&M reserve report are reviewed by our senior management and
internal technical staff. Additionally, our senior management reviews and
approves any internally estimated significant changes to our proved reserves on
a quarterly basis.
5
Reserve
Technologies
Proved
reserves are those quantities of oil and natural gas, which, by analysis of
geoscience and engineering data, can be estimated with reasonable certainty to
be economically producible from a given date forward, from known reservoirs, and
under existing economic conditions, operating methods, and government
regulations. The term “reasonable certainty” implies a high degree of confidence
that the quantities of oil and/or natural gas actually recovered will equal or
exceed the estimate. To achieve reasonable certainty, NSAI and D&M each
employed technologies that have been demonstrated to yield results with
consistency and repeatability. The technical and economic data used in the
estimation of our proved reserves include, but are not limited to, well logs,
geologic maps, production data, seismic data, well test data, historical price
and cost information and property ownership interests.
Proved
Undeveloped Reserves
Our
proved undeveloped reserves at December 31, 2009, as estimated by our
independent petroleum engineers, were 46.0 Bcfe, consisting of 1.6 million
barrels of oil, 29.0 MMcf of natural gas and 1.2 million barrels of natural gas
liquids. In 2009, we developed approximately 0.5% of our total proved
undeveloped reserves booked as of December 31, 2008 through the drilling of one
gross (0.45 net) well at an aggregate capital cost of approximately $0.3
million. None of our proved undeveloped reserves at December 31, 2009 have
remained undeveloped for more than five years since the date of initial booking
as proved undeveloped reserves. At December 31, 2009, there are 18 locations
with 3.9 Bcfe of proved undeveloped reserves in South Texas that are scheduled
to be drilled on a date more than five years from the date the reserves were
initially booked as proved undeveloped since we have a contractual arrangement
with the operator to drill only 14 wells per year.
|
|
Production
and Price History
|
|
|
|
The
following table sets forth information regarding net production of natural gas,
natural gas liquids and oil and certain price and cost information for each of
the periods indicated:
|
Net
Production
|
Average Realized Sales Prices (2)
|
Production Cost
(3)
|
||||||||||||||||||||
|
Crude
Oil Bbls/day
|
Natural
Gas Mcf/day
|
NGLs
Gal/day
|
Crude
Oil Per Bbl
|
Natural
Gas Per Mcf
|
NGLs
Per Gal
|
Per
BOE
|
||||||||||||||||
|
Year Ended December 31, 2009
(1)
|
||||||||||||||||||||||
|
Sun
TSH Field
|
26
|
1,124
|
7,095
|
$
|
65.40
|
$
|
11.03
|
$
|
0.95
|
$
|
3.76
|
|||||||||||
|
Other
|
921
|
11,320
|
6,113
|
$
|
75.54
|
$
|
11.16
|
$
|
0.75
|
$
|
11.25
|
|||||||||||
|
Total
|
947
|
12,444
|
13,208
|
$
|
75.26
|
$
|
11.15
|
$
|
0.86
|
$
|
10.39
|
|||||||||||
|
Year Ended December 31, 2008
(4)
|
||||||||||||||||||||||
|
Total
other
|
715
|
11,450
|
3,271
|
$
|
85.69
|
$
|
10.49
|
$
|
1.18
|
$
|
11.24
|
|||||||||||
|
Year
Ended December 31, 2007
|
||||||||||||||||||||||
|
Total
other
|
84
|
11,080
|
—
|
$
|
66.08
|
$
|
8.92
|
$
|
—
|
$
|
7.17
|
|||||||||||
|
|
(1)
Average daily production for 2009 calculated based on 365 days including
production for the Sun TSH and Ward County acquisitions from the closing
dates of these acquisitions.
|
|
|
(2) Average
realized sales prices including hedges but excluding the non-cash
amortization of premiums paid and non-cash amortization of value on
derivative contracts acquired.
|
|
|
(3) Production costs include such
items as lease operating expenses, gathering and compression fees and
other customary charges and excludes production taxes (severance and ad
valorem taxes).
|
|
|
(4) Average
daily production for 2008 calculated based on 366 days including
production for the Permian Basin and Dos Hermanos acquisitions from the
closing dates of these
acquisitions.
|
6
|
|
Productive
Wells
|
|
|
|
The
following table sets forth information at December 31, 2009 relating to the
productive wells in which we owned a working interest as of that date.
Productive wells consist of producing wells and wells capable of production,
including natural gas wells awaiting pipeline connections to commence deliveries
and oil wells awaiting connection to production facilities. Gross wells are the
total number of producing wells in which we have an interest, and net wells are
the sum of our fractional working interests owned in gross wells.
|
Natural
Gas Wells
|
Oil
Wells
|
Total
|
||||||||||||||||||||||
|
Gross
|
Net
|
Gross
|
Net
|
Gross
|
Net
|
|||||||||||||||||||
|
Operated
|
5 | 5 | 60 | 58 | 65 | 63 | ||||||||||||||||||
|
Non-operated
|
1,228 | 1,087 | 718 | 35 | 1,946 | 1,122 | ||||||||||||||||||
|
Total
|
1,233 | 1,092 | 778 | 93 | 2,011 | 1,185 | ||||||||||||||||||
|
Developed
and Undeveloped Acreage
|
|
|
The
following table sets forth information as of December 31, 2009 relating to
our leasehold acreage.
|
Developed Acreage
(1)
|
Undeveloped
Acreage
(2)
|
Total Acreage
|
||||||||||||||||||||||
|
Gross
(3)
|
Net
(4)
|
Gross
(3)
|
Net
(4)
|
Gross
|
Net
|
|||||||||||||||||||
|
Operated
|
10,247 | 7,376 | 3,430 | 2,874 | 13,677 | 10,250 | ||||||||||||||||||
|
Non-operated
|
30,980 | 28,044 | 122,171 | 52,756 | 153,151 | 80,800 | ||||||||||||||||||
|
|
(1) Developed
acres are acres spaced or assigned to productive
wells.
|
|
|
|
|
|
(2) Undeveloped
acres are acres on which wells have not been drilled or completed to a
point that would permit the production of commercial quantities of natural
gas or oil, regardless of whether such acreage contains proved
reserves.
|
|
|
|
|
|
(3) A gross acre
is an acre in which a working interest is owned. The number of gross acres
is the total number of acres in which a working interest is
owned.
|
|
|
(4)
A net acre is deemed to exist when the sum of the fractional ownership
working interests in gross acres equals one. The number of net acres is
the sum of the fractional working interests owned in gross acres expressed
as whole numbers and fractions
thereof.
|
|
|
|
|
|
Drilling
Activity
|
|
|
|
In
Appalachia, most of our wells are drilled to depths ranging from 2,000’ to
4,500’. Many of our wells are completed to multiple producing zones
and production from these zones may be commingled. The average well
in Appalachia takes approximately 10 days to drill and most of our wells are
producing and connected to pipeline within 30 days after
completion. In general, our producing wells in Appalachia have stable
production profiles and long-lived production, often with total projected
economic lives in excess of 50 years. In 2009, we and our operating
partner, Vinland, decided not to drill any new wells until natural gas prices
improved. However, during 2009 we recompleted 12 wells to an oil zone
located less than 3,000 feet in depth. The data from these
recompletions has generated some additional oil drilling prospects. In 2010, we
intend to drill approximately 10 net wells in Appalachia.
In the
Permian Basin, we drilled no wells in 2009 on our operated properties and there
was limited drilling activity on our non-operated properties. In
December 2009, we acquired production and undeveloped acreage in Ward County,
Texas. In 2010, we intend to drill one oil well in Ward County in
which we will own a 100% working interest. This oil well will be
drilled horizontally in the Bone Springs sand to a vertical depth of
approximately 11,400’ and is designed to drill out 4,000’
laterally. This proposed oil well is offset on 3 sides with
successful horizontal oil wells and the reserves for the proposed well are
proved.
In South
Texas, most of our wells are drilled to depths ranging from 5,500’ to
7,800’. Most of the reserves are produced from Olmos gas
sands. We participated (50% working interest) in drilling one Olmos
sand gas well in Webb County in the fourth quarter of 2009. In August
2009, we acquired production and undeveloped acreage in the Sun TSH field in La
Salle County. In 2010, we and our operating partner, Lewis Petro
Properties, plan to drill up to 13 gross (6.5 net) Olmos wells in Webb and La
Salle Counties. One of the wells planned for 2010 is a horizontal
well in the Olmos sand.
During
2010, we intend to concentrate our drilling activity on lower risk, development
properties. The number and types of wells we drill will vary
depending on the amount of funds we have available for drilling, the cost of
each well, the size of the fractional working interests we acquire in each well
and the estimated recoverable reserves attributable to each well.
7
The
following table sets forth information with respect to wells completed during
the years ended December 31, 2009, 2008 and 2007. The information should
not be considered indicative of future performance, nor should it be assumed
that there is necessarily any correlation between the number of productive wells
drilled, quantities of reserves found or economic value. Productive wells are
those that produce commercial quantities of natural gas, regardless of whether
they produce a reasonable rate of return.
|
Year Ended December 31,
|
||||||||||||
|
2009
|
2008
|
2007
|
||||||||||
|
Gross
wells:
|
||||||||||||
|
Productive
|
1 | 86 | 82 | |||||||||
|
Dry
|
— | 1 | 1 | |||||||||
|
Total
|
1 | 87 | 83 | |||||||||
|
Net
Development wells:
|
||||||||||||
|
Productive
|
0.45 | 38 | 33 | |||||||||
|
Dry
|
— | 1 | — | |||||||||
|
Total
|
0.45 | 39 | 33 | |||||||||
|
Net
Exploratory wells:
|
||||||||||||
|
Productive
|
— | — | — | |||||||||
|
Dry
|
— | — | — | |||||||||
|
Total
|
— | — | — | |||||||||
|
|
Operations
|
|
|
Principal
Customers
|
|
|
|
For the
year ended December 31, 2009, sales of natural gas, natural gas liquids and
oil to Seminole Energy Services, Osram Sylvania, Inc., Plains
Marketing L.P., Sunoco Partners Marketing and Terminals, L.P. and
Occidental Energy Marketing, Inc. accounted for approximately 35%, 9%, 7%, 5%
and 2%, respectively, of our natural gas, natural gas liquids and oil revenues.
Our top five purchasers during the year ended December 31, 2009, therefore
accounted for 58% of our total revenues. To the extent these and other customers
reduce the volumes of natural gas, natural gas liquids and oil that they
purchase from us and they are not replaced in a timely manner with a new
customer, our revenues and cash available for distribution could decline.
However, if we were to lose a customer, we believe we could identify a
substitute purchaser in a timely manner.
|
|
Price
Risk Management Activities
|
|
|
|
We enter
into derivative contracts with respect to a portion of our projected natural gas
and oil production through various transactions that mitigate the volatility of
future prices received. These transactions may include price swaps whereby we
will receive a fixed-price for our production and pay a variable market price to
the contract counterparty. Additionally, we may enter into put options for which
we pay the counterparty an option premium, equal to the fair value of the option
at the purchase date. At the settlement date we receive the excess, if any, of
the fixed floor over the floating rate. Furthermore, we may enter into collars
where we pay the counterparty if the market price is above the ceiling price and
the counterparty pays us if the market price is below the floor price on a
notional quantity. These activities are intended to support our realized
commodity prices at targeted levels and to manage our exposure to natural gas
and oil price fluctuations. It is never management’s intention to hold or issue
derivative instruments for speculative trading purposes. Conditions sometimes
arise where actual production is less than estimated, which has, and could
result in overhedged volumes. The following table summarizes commodity
derivative contracts in place at December 31, 2009:
|
2010
|
2011
|
2012
|
2013
|
|||||||||||||
|
Gas
Positions:
|
||||||||||||||||
|
Fixed
Price Swaps:
|
||||||||||||||||
|
Notional
Volume (MMBtu)
|
4,731,040 | 3,328,312 | — | — | ||||||||||||
|
Fixed
Price ($/MMBtu)
|
$ | 8.66 | $ | 7.83 | $ | — | $ | — | ||||||||
|
Collars:
|
||||||||||||||||
|
Notional
Volume (MMBtu)
|
1,607,500 | 1,933,500 | — | — | ||||||||||||
|
Floor
Price ($/MMBtu)
|
$ | 7.73 | $ | 7.34 | $ | — | $ | — | ||||||||
|
Ceiling
Price ($/MMBtu)
|
$ | 8.92 | $ | 8.44 | $ | — | $ | — | ||||||||
|
Total:
|
||||||||||||||||
|
Notional
Volume (MMBtu)
|
6,338,540 | 5,261,812 | — | — | ||||||||||||
|
Oil
Positions:
|
||||||||||||||||
|
Fixed
Price Swaps:
|
||||||||||||||||
|
Notional
Volume (Bbls)
|
310,250 | 260,750 | 137,250 | 118,625 | ||||||||||||
|
Fixed
Price ($/Bbl)
|
$ | 85.93 | $ | 86.12 | $ | 88.13 | $ | 88.42 | ||||||||
|
Collars:
|
||||||||||||||||
|
Notional
Volume (Bbls)
|
— | — | 45,750 | 45,625 | ||||||||||||
|
Floor
Price ($/Bbl)
|
$ | — | $ | — | $ | 80.00 | $ | 80.00 | ||||||||
|
Ceiling
Price ($/Bbl)
|
$ | — | $ | — | $ | 100.25 | $ | 100.25 | ||||||||
|
Total:
|
||||||||||||||||
|
Notional
Volume (Bbls)
|
310,250 | 260,750 | 183,000 | 164,250 | ||||||||||||
8
We have
also entered into interest rate swaps, which require exchanges of cash flows
that serve to synthetically convert a portion of our variable interest rate
obligations to fixed interest rates.
The
following summarizes information concerning our positions in open interest rate
swaps at December 31, 2009.
|
Notional Amount
|
Fixed
Libor
Rates
|
||||||
|
Period:
|
|||||||
|
January
1, 2010 to December 18, 2010
|
$
|
10,000,000
|
1.50
|
%
|
|||
|
January
1, 2010 to December 20, 2010
|
$
|
10,000,000
|
1.85
|
%
|
|||
|
January
1, 2010 to January 31, 2011
|
$
|
20,000,000
|
3.00
|
%
|
(1)
|
||
|
January
1, 2010 to March 31, 2011
|
$
|
20,000,000
|
2.08
|
%
|
|||
|
January
1, 2010 to December 10, 2012
|
$
|
20,000,000
|
3.35
|
%
|
|||
|
January
1, 2010 to January 31, 2013
|
$
|
20,000,000
|
2.38
|
%
|
|||
|
(1)
|
In
February 2010, we extended the terms of the 3.00%, $20.0 million interest
rate swap for two additional years to January 31, 2013 and reduced the
rate from 3.00% to 2.66%.
|
|
Counterparty
Risk
|
|
|
At
December 31, 2009, based upon all of our open derivative contracts shown above
and their respective mark-to-market values, the Company had the following
current and long-term derivative assets and liabilities shown by counterparty
with their S&P financial strength rating in parentheses (in
thousands):
9
|
Citibank,
N.A.
(A+)
|
BNP
Paribas
(AA)
|
The
Bank of Nova Scotia
(AA-)
|
Wells
Fargo Bank N.A./Wachovia Bank, N.A.
(AA)
|
BBVA
Compass
(
A+)
|
Total
|
|||||||||||||||||||
|
Current
Assets
|
$ | 3,912 | $ | 10,641 | $ | — | $ | 1,570 | $ | 67 | $ | 16,190 | ||||||||||||
|
Current
Liabilities
|
$ | (92 | ) | $ | — | $ | (161 | ) | $ | — | $ | — | $ | (253 | ) | |||||||||
|
Long-Term
Assets
|
$ | 1,393 | $ | 3,745 | $ | 87 | $ | — | $ | — | $ | 5,225 | ||||||||||||
|
Long-Term
Liabilities
|
$ | — | $ | (1,040 | ) | $ | (592 | ) | $ | (402 | ) | $ | (2 | ) | $ | (2,036 | ) | |||||||
|
Total
Amount Due from/(Owed To) Counterparty
at
December 31, 2009
|
$ | 5,213 | $ | 13,346 | $ | (666 | ) | $ | 1,168 | $ | 65 | $ | 19,126 | |||||||||||
We net
derivative assets and liabilities for counterparties where we have a legal right
of offset.
|
|
Competition
|
The
natural gas and oil industry is highly competitive. We encounter strong
competition from other independent operators and from major oil companies in
acquiring properties, leasing acreage, contracting for drilling equipment and
securing trained personnel. Many of these competitors have financial and
technical resources and staff substantially larger than ours or a different
business model. As a result, our competitors may be able to pay more for
desirable leases, or to evaluate, bid for and purchase a greater number of
properties or prospects than our financial, technical or personnel resources
will permit.
We are
also affected by competition for drilling rigs and the availability of related
equipment. In the past, the natural gas and oil industry has experienced
shortages of drilling rigs, equipment, pipe and personnel, which has delayed
development drilling and has caused significant price increases. We are unable
to predict when, or if, such shortages may occur or how they would affect our
development program.
Competition
is also strong for attractive natural gas and oil producing properties,
undeveloped leases and drilling rights, and we cannot assure unitholders that we
will be able to compete satisfactorily when attempting to make further
acquisitions.
|
|
Title
to Properties
|
|
|
|
As is
customary in the natural gas and oil industry, we initially conduct only a
cursory review of the title to our properties on which we do not have proved
reserves. Prior to the commencement of drilling operations on those properties,
however, we conduct a thorough title examination and perform curative work with
respect to significant defects. To the extent title opinions or other
investigations reflect title defects on those properties, we are typically
responsible for curing any title defects at our expense. We will not commence
drilling operations on a property until we have cured any material title defects
on such property. Prior to completing an acquisition of producing natural gas
and oil leases, we perform title reviews on the most significant leases and,
depending on the materiality of properties, we may obtain a title opinion or
review previously obtained title opinions. As a result, we have obtained title
opinions on a significant portion of our natural gas and oil properties and
believe that we have satisfactory title to our producing properties in
accordance with standards generally accepted in the natural gas and oil
industry. Although title to these properties is subject to encumbrances in some
cases, such as customary interests generally retained in connection with
acquisition of real property, customary royalty interests, contract terms and
restrictions, liens under operating agreements, liens related to environmental
liabilities associated with historical operations, liens for taxes not yet
payable and other burdens, restrictions and minor encumbrances customary in the
natural gas and oil industry, we believe that none of these liens, restrictions,
easements, burdens and encumbrances will materially detract from the value of
these properties or from our interest in these properties, or will materially
interfere with our use of these properties in the operation of our
business.
10
|
|
Seasonal
Nature of Business
|
|
|
|
Seasonal
weather conditions and lease stipulations can limit our drilling and producing
activities and other operations in some of our operating areas, specifically the
Appalachian region and, as a result, we generally perform the majority of our
drilling in this area during the summer and fall months. These seasonal
anomalies can pose challenges for meeting our well drilling objectives and
increase competition for equipment, supplies and personnel during the spring and
summer months, which could lead to shortages and increase costs or delay our
operations. Generally, but not always, the demand for natural gas decreases
during the summer months and increases during the winter months. Seasonal
anomalies such as mild winters or hot summers sometimes lessen this fluctuation.
In addition, certain natural gas consumers utilize natural gas storage
facilities and purchase some of their anticipated winter requirements during the
summer. This can also lessen seasonal demand fluctuations.
|
|
Environmental
Matters and Regulation
|
|
|
|
General. Our
business involving the acquisition and development of natural gas and oil
properties is subject to extensive and stringent federal, state and local laws
and regulations governing the discharge of materials into the environment or
otherwise relating to conservation and environmental protection. These
operations are subject to the same environmental laws and regulations as other
similarly situated companies in the natural gas and oil industry. These laws and
regulations may:
|
·
|
require
the acquisition of various permits and bonds before drilling
commences;
|
|
|
·
|
require
the installation of expensive pollution control
equipment;
|
|
|
·
|
restrict
the types, quantities and concentration of various substances that can be
released into the environment in connection with drilling and production
activities;
|
|
|
·
|
limit
or prohibit drilling activities on lands lying within wilderness, wetlands
and other protected areas;
|
|
|
·
|
require
remedial measures to prevent pollution from historical and ongoing
operations, such as pit closure and plugging of abandoned
wells;
|
|
|
·
|
impose
substantial liabilities for pollution resulting from our operations;
and
|
|
|
·
|
with
respect to operations affecting federal lands or leases, require
preparation of a Resource Management Plan, an Environmental Assessment,
and/or an Environmental Impact
Statement.
|
|
|
|
These
laws and regulations may also restrict our ability to produce natural gas,
natural gas liquids and oil by, among other things, limiting the amount of
natural gas, natural gas liquids and oil we can produce from our wells, limiting
the number of wells we are allowed to drill or limiting the locations at which
we can conduct our drilling operations. The regulatory burden on the natural gas
and oil industry increases the cost of doing business in the industry and
consequently affects profitability. Additionally, changes in environmental laws
and regulations occur frequently, and any changes that result in more stringent
and costly waste handling, disposal and clean-up requirements for the natural
gas and oil industry could have a significant impact on our operating costs. We
believe that operation of our wells is in substantial compliance with all
current applicable environmental laws and regulations and that our continued
compliance with existing requirements will not have a material adverse impact on
our financial condition and results of operations. However, we cannot provide
any assurance on how future compliance with environmental laws and regulations
may impact our properties or the operations. For the year ended
December 31, 2009, we did not incur any material capital expenditures for
installation of remediation or pollution control equipment at any of our
facilities. As of the date of this Annual Report, we are not aware of any
environmental issues or claims that will require material capital expenditures
during 2010 or that will otherwise have a material impact on our financial
position or results of operations.
Environmental
laws and regulations that could have a material impact on our operations as well
as the natural gas and oil exploration and production industry in general
include the following:
National Environmental Policy
Act. Natural gas and oil exploitation and production
activities on federal lands are subject to the National Environmental Policy
Act, as amended, or “NEPA.” NEPA requires federal agencies, including the
Department of Interior, to evaluate major agency actions having the potential to
significantly impact the environment. In the course of such evaluations, an
agency will typically prepare an Environmental Assessment to assess the
potential direct, indirect and cumulative impacts of a proposed project and, if
necessary, will prepare a more detailed Environmental Impact Statement that may
be made available for public review and comment. Our current production
activities, as well as proposed development plans, on federal lands require
governmental permits or similar authorizations that are subject to the
requirements of NEPA. This process has the potential to delay, limit or add to
the cost of developing natural gas and oil projects.
11
Waste Handling.
The Resource Conservation and Recovery Act, as amended, or “RCRA,” and
comparable state laws, regulate the generation, transportation, treatment,
storage, disposal and cleanup of “hazardous wastes” as well as the disposal of
non-hazardous wastes. Under the auspices of the U.S. Environmental Protection
Agency, or “EPA,” individual states administer some or all of the provisions of
RCRA, sometimes in conjunction with their own, more stringent requirements.
While drilling fluids, produced waters, and many other wastes associated with
the exploitation, development, and production of crude oil, natural gas, or
geothermal energy constitute “solid wastes,” which are regulated under the less
stringent non-hazardous waste provisions of the RCRA, there is no assurance that
the EPA or individual states will not in the future adopt more stringent and
costly requirements for the handling of non-hazardous wastes or categorize some
non-hazardous wastes as hazardous. We believe that we are in substantial
compliance with the requirements of RCRA and related state and local laws and
regulations. Although we do not believe the current costs of managing wastes
generated by operation of our wells to be significant, any legislative or
regulatory reclassification of natural gas and oil exploitation and production
wastes could increase our costs to manage and dispose of such
wastes.
Hazardous Substance
Releases. The Comprehensive Environmental Response,
Compensation and Liability Act, as amended, also known as “CERCLA,” or
“Superfund,” and analogous state laws, impose, under certain circumstances,
joint and several liability, without regard to fault or legality of conduct, on
persons who are considered to be responsible for the release of a “hazardous
substance” into the environment. These persons include the owner or operator of
the site where the release occurred and companies that transported or disposed
or arranged for the transportation or disposal of the hazardous substance at the
site. Under CERCLA, such persons may be liable for the costs of cleaning up the
hazardous substances that have been released into the environment, for damages
to natural resources and for the costs of certain health studies. In addition,
it is not uncommon for neighboring landowners and other third parties to file
claims for personal injury and property damage allegedly caused by the hazardous
substances released into the environment. While materials are generated in the
course of operation of our wells that may be regulated as hazardous substances,
we have not received any pending notifications that we may be potentially
responsible for cleanup costs under CERCLA.
We
currently own, lease, or have a non-operating interest in numerous properties
that have been used for natural gas and oil production for many years. Although
we believe that operating and waste disposal practices have been used that were
standard in the industry at the time, hazardous substances, wastes, or petroleum
hydrocarbons have been released on or under the properties owned or leased by
us, or on or under other locations, including off-site locations, where such
substances have been taken for disposal. In addition, some of these properties
have been operated by third parties or by previous owners or operators whose
treatment and disposal of hazardous substances, wastes, or hydrocarbons was not
under our control. These properties and the substances disposed or released on
them may be subject to CERCLA, RCRA and analogous state laws. Under such laws,
we could be required to remove previously disposed substances and wastes,
remediate contaminated property, or perform remedial plugging or pit closure
operations to prevent future contamination.
Water Discharges.
The Federal Water Pollution Control Act, as amended, or “Clean Water Act,” and
analogous state laws impose restrictions and strict controls on the discharge of
pollutants, including produced waters and other natural gas and oil wastes, into
state waters as well as waters of the United States. The discharge of pollutants
into regulated waters is prohibited, except in accordance with the terms of a
permit issued by EPA or the relevant state. The Clean Water Act also prohibits
the discharge of dredge and fill material in regulated waters, including
wetlands, unless authorized by a permit issued by the U.S. Army Corps of
Engineers. Federal and state regulatory agencies can impose administrative,
civil and criminal penalties for non-compliance with discharge permits or other
requirements of the Clean Water Act and analogous state laws and regulations. We
believe that we are in substantial compliance with the requirements of the Clean
Water Act.
Air Emissions.
The Clean Air Act, as amended, and associated state laws and regulations,
regulate emissions of various air pollutants through the issuance of permits and
the imposition of other requirements. In addition, EPA has developed, and
continues to develop, stringent regulations governing emissions of toxic air
pollutants at specified sources. Some of our new facilities may be required to
obtain permits before work can begin, and existing facilities may be required to
incur capital costs in order to comply with new emission limitations. These
regulations may increase the costs of compliance for some facilities, and
federal and state regulatory agencies can impose administrative, civil and
criminal penalties for non-compliance. We believe that we are in substantial
compliance with the requirements of the Clean Air Act.
OSHA. We are
subject to the requirements of the federal Occupational Safety and Health Act,
as amended, or “OSHA,” and comparable state statutes. The OSHA hazard
communication standard, EPA community right-to-know regulations under the Title
III of CERCLA and similar state statutes require that we organize and/or
disclose information about hazardous materials used or produced in our
operations. We believe that we are in substantial compliance with the applicable
requirements of OSHA.
Climate Change. In
response to recent studies suggesting that emissions of certain gases, referred
to as “greenhouse gases” and including carbon dioxide and methane, may be
contributing to warming of the Earth’s atmosphere, the current administration
has expressed support for, and it is anticipated that the current session of the
U.S. Congress is considering climate change-related legislation to restrict
greenhouse gas emissions. In addition, at least one-third of the states,
either individually or through multi-state initiatives, have already taken legal
measures to reduce emissions of greenhouse gases, primarily through the planned
development of greenhouse gas emission inventories and/or greenhouse gas cap and
trade programs. Depending on the particular program, we could be required to
purchase and surrender allowances, for greenhouse gas emissions resulting from
our operations.
12
Also, as
a result of the U.S. Supreme Court’s decision in 2007 in Massachusetts, et al. v. EPA
and certain provisions of the Clean Air Act, the EPA may regulate carbon dioxide
and other greenhouse gas emissions from mobile sources such as cars and trucks,
even if Congress does not adopt new legislation specifically addressing
emissions of greenhouse gases. The Court’s holding in the Massachusetts decision that
greenhouse gases including carbon dioxide fall under the federal Clean Air Act’s
definition of “air pollutant” may also result in future regulation of carbon
dioxide and other greenhouse gas emissions from stationary sources under certain
CAA programs. In July 2008, EPA released an “Advance Notice of Proposed
Rulemaking” regarding possible future regulation of greenhouse gas emissions
under the Clean Air Act, in response to the Supreme Court's decision in Massachusetts. Although
the notice did not propose any specific, new regulatory requirements for
greenhouse gases, it indicates that federal regulation of greenhouse gas
emissions could occur in the near future even if Congress does not adopt new
legislation specifically addressing emissions of greenhouse gases. New federal,
regional or state laws requiring adoption of a stringent greenhouse gas control
program or imposing restrictions on emissions of carbon dioxide in areas of the
United States in which we conduct business could adversely affect our cost of
doing business and demand for the natural gas, natural gas liquids and oil we
produce.
|
|
Other
Regulation of the Natural Gas and Oil
Industry
|
|
|
|
The
natural gas and oil industry is extensively regulated by numerous federal, state
and local authorities. Legislation affecting the natural gas and oil industry is
under constant review for amendment or expansion, frequently increasing the
regulatory burden. Also, numerous departments and agencies, both federal and
state, are authorized by statute to issue rules and regulations binding on
the natural gas and oil industry and its individual members, some of which carry
substantial penalties for failure to comply. Although the regulatory burden on
the natural gas and oil industry increases our cost of doing business and,
consequently, affects our profitability, these burdens generally do not affect
us any differently or to any greater or lesser extent than they affect other
companies in the industry with similar types, quantities and locations of
production.
Legislation
continues to be introduced in Congress and development of regulations continues
in the Department of Homeland Security and other agencies concerning the
security of industrial facilities, including natural gas and oil facilities. Our
operations may be subject to such laws and regulations. If in the future one or
more of our facilities becomes subject to such legislation, then the cost to
comply with such law could be substantial.
Drilling and
Production. Our operations are subject to various types of
regulation at the federal, state and local levels. These types of regulation
include requiring permits for the drilling of wells, drilling bonds and reports
concerning operations. Most states, and some counties and municipalities, in
which we operate also regulate one or more of the following:
|
·
|
the
location of wells;
|
|
|
·
|
the
method of drilling and casing wells;
|
|
|
·
|
the
surface use and restoration of properties upon which wells are
drilled;
|
|
|
·
|
the
plugging and abandoning of wells; and
|
|
|
·
|
notice
to surface owners and other third
parties.
|
|
|
|
State
laws regulate the size and shape of drilling and spacing units or proration
units governing the pooling of natural gas and oil properties. Some states allow
forced pooling or integration of tracts to facilitate exploitation while other
states rely on voluntary pooling of lands and leases. In some instances, forced
pooling or unitization may be implemented by third parties and may reduce our
interest in the unitized properties. In addition, state conservation laws
establish maximum rates of production from natural gas and oil wells, generally
prohibit the venting or flaring of natural gas and impose requirements regarding
the ratability of production. These laws and regulations may limit the amount of
natural gas, natural gas liquids and oil we can produce from our wells or limit
the number of wells or the locations at which we can drill. Moreover, each state
generally imposes a production or severance tax with respect to the production
and sale of oil, natural gas and natural gas liquids within its
jurisdiction.
13
Regulation of Transportation
and Sales. The availability, terms and cost of transportation
significantly affect sales of natural gas, natural gas liquids and oil. The
interstate transportation of natural gas is subject to federal regulation
primarily by the Federal Energy Regulatory Commission, or “FERC” under the
Natural Gas Act of 1938, or the “NGA”. FERC regulates interstate
natural gas pipeline transportation rates and service conditions, which may
affect the marketing and sales of natural gas. FERC requires
interstate pipelines to offer available firm transportation capacity on an
open-access, non-discriminatory basis to all natural gas
shippers. FERC frequently reviews and modifies its regulations
regarding the transportation of natural gas with the stated goal of fostering
competition within all phases of the natural gas industry. State laws
and regulations generally govern the gathering and intrastate transportation of
natural gas. Natural gas gathering systems in the states in which we operate are
generally required to offer services on a non-discriminatory basis and are
subject to state ratable take and common purchaser statutes. Ratable
take statutes generally require gatherers to take, without undue discrimination,
natural gas production that may be tendered to the gatherer for
handling. Similarly, common purchaser statutes generally require
gatherers to purchase without discrimination in favor of one producer over
another producer or one source of supply over another source of
supply.
The
ability to transport oil and natural gas liquids is generally dependent on
pipelines whose rates, terms and conditions of service are subject to FERC
jurisdiction under the Interstate Commerce Act, or subject to regulation by the
particular state in which such transportation takes place. Laws and
regulation applicable to pipeline transportation of oil largely require
pipelines to charge just and reasonable rates published in agency-approved
tariffs and require pipelines to provide non-discriminatory access and terms and
conditions of service. The justness and reasonableness of interstate oil and
natural gas liquid pipeline rates can be challenged at FERC through a protest or
a complaint and, if such a protest or complaint results in a lower rate than
that on file, pipeline shippers may be eligible to receive refunds or, in the
case of a complaining shipper, reparations for the two-year period prior to the
filing of the complaint. Certain regulations imposed by FERC, by the United
States Department of Transportation and by other regulatory authorities on
pipeline transporters in recent years could result in an increase in the cost of
pipeline transportation service. We do not believe, however, that
these regulations affect us any differently than other producers.
Under the
Energy Policy Act of 2005, or “EPAct 2005,” Congress made it unlawful for any
entity, as defined in the EPAct 2005, including otherwise non-jurisdictional
producers such as us, to use any deceptive or manipulative device or contrivance
in connection with the purchase or sale of natural gas or the purchase or sale
of transportation services regulated by the FERC that violates the FERC’s rules.
FERC’s rules implementing EPAct 2005 make it unlawful for any
entity, directly or indirectly, to use or employ any device, scheme, or artifice
to defraud; to make any untrue statement of material fact or omit to make any
such statement necessary to make the statements made not misleading; or to
engage in any act or practice that operates as a fraud or deceit upon any person
in connection with the purchase or sale of natural gas subject to the
jurisdiction of the FERC, or the purchase or sale of transportation services
subject to the jurisdiction of the FERC. EPAct 2005 also gives the FERC
authority to impose civil penalties for violations of the NGA and the Natural
Gas Policy Act up to $1,000,000 per day per violation. Pursuant to authority
granted to FERC by EPAct 2005, FERC has also put in place additional regulations
intended to prevent market manipulation and to promote price
transparency. For example, FERC has imposed new rules discussed below
requiring wholesale purchasers and sellers of natural gas to report to FERC
certain aggregated volume and other purchase and sales data for the previous
calendar year. While EPAct 2005 reflects a significant expansion of the FERC’s
enforcement authority, we do not anticipate that we will be affected by EPAct
2005 any differently than energy industry participants.
In 2007,
FERC issued a final rule on the annual natural gas transaction reporting
requirements, as amended by subsequent orders on rehearing (“Order 704”). Under
Order 704, wholesale buyers and sellers of more than 2.2 million MMBtu of
physical natural gas in the previous calendar year, including interstate and
intrastate natural gas pipelines, natural gas gatherers, natural gas processors
and natural gas marketers are now required to report on Form No. 552, on May 1
of each year, aggregate volumes of natural gas purchased or sold at wholesale in
the prior calendar year to the extent such transactions utilize, contribute to,
or may contribute to the formation of price indices. It is the responsibility of
the reporting entity to determine which individual transactions should be
reported based on the guidance of Order 704. Pursuant to Order 704, we may be
required to annually report to FERC, starting May 1 information regarding
natural gas purchase and sale transactions depending on the volume of natural
gas transacted during the prior calendar year.
On August
6, 2009, the Federal Trade Commission, or “FTC”, issued a Final Rule prohibiting
manipulative and deceptive conduct in the wholesale petroleum markets. The Final
Rule applies to transactions in crude oil, gasoline, and petroleum distillates.
The FTC promulgated the Final Rule pursuant to Section 811 of the Energy
Independence and Security Act of 2007 (“EISA”), which makes it unlawful for
anyone, in connection with the wholesale purchase or sale of crude oil,
gasoline, or petroleum distillates, to use any “manipulative or deceptive device
or contrivance, in contravention of such rules and regulations as the Federal
Trade Commission may prescribe.” The Final Rule prohibits any person, directly
or indirectly, in connection with the purchase or sale of crude oil, gasoline,
or petroleum distillates at wholesale, from: a) knowingly engaging in any act,
practice, or course of business – including making any untrue statement of
material fact that operates or would operate as a fraud or deceit upon any
person; or b) intentionally failing to state a material fact that under the
circumstances renders a statement made by such person misleading, provided that
such omission distorts or is likely to distort market conditions for any such
product.
Additional
proposals and proceedings that might affect the natural gas industry are pending
before Congress, FERC and the courts. We cannot predict the ultimate impact of
these or the above regulatory changes to our natural gas operations. We do not
believe that we would be affected by any such FERC action materially differently
than other natural gas companies with whom we compete.
14
The price
at which we buy and sell natural gas is currently not subject to federal rate
regulation and, for the most part, is not subject to state regulation. Sales of
condensate and natural gas liquids are not currently regulated and are made at
market prices. However, with regard to our physical purchases and sales of these
energy commodities, and any related hedging activities that we undertake, we are
required to observe anti-market manipulation laws and related regulations
enforced by FERC and/or the Commodity Futures Trading Commission, or “CFTC”.
Should we violate the anti-market manipulation laws and regulations, we could
also be subject to related third party damage claims by, among others, market
participants, sellers, royalty owners and taxing authorities.
Although
natural gas prices are currently unregulated, Congress historically has been
active in the area of natural gas regulation. We cannot predict whether new
legislation to regulate natural gas might be proposed, what proposals, if any,
might actually be enacted by Congress or the various state legislatures, and
what effect, if any, the proposals might have on the operations of the
underlying properties.
The
various states regulate the drilling for, and the production, gathering and sale
of, natural gas, natural gas liquids and oil, including imposing severance and
other production related taxes and requirements for obtaining drilling permits.
For example, currently, a severance tax on natural gas, natural gas liquids and
oil production is imposed at a rate of 4.5%, 3.0% and 3.75% in Kentucky,
Tennessee and New Mexico, respectively. Texas currently imposes a 7.5% severance
tax on gas production and 4.6% severance tax on oil production. States also
regulate the method of developing new fields, the spacing and operation of wells
and the prevention of waste of natural gas resources. States may regulate rates
of production and may establish maximum daily production allowables from natural
gas and oil wells based on market demand or resource conservation, or both.
States do not currently regulate wellhead prices or engage in other similar
direct economic regulation, but there can be no assurance that they will not do
so in the future. The effect of these regulations may be to limit the amounts of
natural gas, natural gas liquids or oil that may be produced from our wells, to
increase our cost of production, to limit the number of wells or locations we
can drill and to limit the availability of pipeline capacity to bring our
products to market.
The
petroleum industry participants are also subject to compliance with various
other federal, state and local regulations and laws. Some of these regulations
and those laws relate to occupational safety, resource conservation and equal
employment opportunity. We do not believe that compliance with these regulations
and laws will have a material adverse effect upon the unitholders.
|
|
Employees
|
|
|
|
As of
December 31, 2009, we had twelve full time employees. Nine of our employees
work in our Houston office, two employees work in our office in Lovington, New
Mexico and one employee works in our office in Christoval, Texas. Under a
management services agreement with Vinland, we rely on Vinland’s employees to
operate our existing producing wells in Appalachia and coordinate our
development drilling program in Appalachia. In connection with the Permian
Basin, Dos Hermanos, Sun TSH and Ward County acquisitions, we outsource the
production accounting to a third party and operate 56 gross wells (54 net wells)
in the Permian Basin. With respect to the Dos Hermanos and Sun TSH properties,
an affiliate of Lewis manages the operations of all our wells and coordinates
any drilling operations that might be conducted on the jointly owned leasehold
interests. We also contract for the services of independent consultants involved
in land, regulatory, tax, accounting, financial and other disciplines as needed.
None of our employees are represented by labor unions or covered by any
collective bargaining agreement. We believe that our relations with our
employees are satisfactory.
|
|
Offices
|
We
entered into a new lease agreement in February 2010 for approximately 7,982
square feet of office space in Houston, Texas. The new lease for our Houston
office expires in February 2013.
|
|
Available
Information
|
Our
website address is www.vnrllc.com. We make our website content available for
information purposes only. It should not be relied upon for investment purposes,
nor is it incorporated by reference in this Form 10-K. We make available on
this website under "Investor Relations-SEC Filings," free of charge, our annual
reports on Form 10-K, quarterly reports on Form 10-Q, current reports
on Form 8-K and amendments to those reports as soon as reasonably
practicable after we electronically file those materials with, or furnish those
materials to, the SEC. The SEC also maintains a website at www.sec.gov that
contains reports, proxy statements and other information regarding SEC
registrants, including us.
15
You may
also find information related to our corporate governance, board committees and
company code of business conduct and ethics on our website. Among the
information you can find there is the following:
|
|
•
Audit Committee Charter;
|
|
|
•
Nominating and Corporate Governance Committee
Charter;
|
|
|
•
Compensation Committee Charter;
|
|
|
•
Conflicts Committee Charter;
|
|
|
• Code
of Business Conduct and Ethics, and
|
|
|
•
Corporate Governance Guidelines.
|
|
|
|
|
|
Risks
Related to Our Business
|
|
|
|
We
may not have sufficient cash from operations to pay quarterly distributions on
our common units following establishment of cash reserves and payment of
operating costs.
We may
not have sufficient cash flow from operations each quarter to pay
distributions. Under the terms of our limited liability company
agreement, the amount of cash otherwise available for distribution will be
reduced by our operating expenses and the amount of any cash reserve amounts
that our board of directors establishes to provide for future operations, future
capital expenditures, future debt service requirements and future cash
distributions to our unitholders. The amount of cash we can distribute on our
common units principally depends upon the amount of cash we generate from our
operations, which will fluctuate from quarter to quarter based on, among other
things:
|
·
|
the
amount of natural gas, natural gas liquids and oil we
produce;
|
|
·
|
the
price at which we are able to sell our natural gas, natural gas liquids
and oil production;
|
|
·
|
the
level of our operating costs;
|
|
·
|
the
level of our interest expense which depends on the amount of our
indebtedness and the interest payable thereon;
and
|
|
·
|
the
level of our capital expenditures.
|
In
addition, the actual amount of cash we will have available for distribution will
depend on other factors, some of which are beyond our control,
including:
|
·
|
the
level of our capital expenditures;
|
|
·
|
our
ability to make working capital borrowings under our credit facility to
pay distributions;
|
|
·
|
the
cost of acquisitions, if any;
|
|
·
|
our
debt service requirements;
|
|
·
|
fluctuations
in our working capital needs;
|
|
·
|
timing
and collectibility of receivables;
|
|
·
|
restrictions
on distributions contained in our credit
facility;
|
|
·
|
prevailing
economic conditions; and
|
|
·
|
the
amount of cash reserves established by our board of directors for the
proper conduct of our business.
|
As a
result of these factors, the amount of cash we distribute in any quarter to our
unitholders may fluctuate significantly from quarter to quarter. If we do not
achieve our expected operational results or cannot borrow the amounts needed, we
may not be able to pay the full, or any, amount of the quarterly distribution,
in which event the market price of our common units may decline
substantially.
16
Our
estimates of proved reserves have been prepared under new SEC rules which went
into effect for fiscal years ending on or after December 31, 2009, which may
make comparisons to prior periods difficult and could limit our ability to book
additional proved undeveloped reserves in the future.
This
report presents estimates of our proved reserves as of December 31, 2009, which
have been prepared and presented under new SEC rules. These new rules are
effective for fiscal years ending on or after December 31, 2009, and require SEC
reporting companies to prepare their reserves estimates using revised reserve
definitions and revised pricing based on the twelve-month average price. The
previous rules required that reserve estimates be calculated using last-day-of
the-year pricing. The pricing that was used for estimates of our reserves as of
December 31, 2009 was based on the 12-month average price for natural gas and
oil of $3.87 per
MMBtu for natural gas and $ 61.04 per barrel of crude oil, as compared to
$5.71 per MMBtu for natural gas and $41.00 per Bbl for oil as of
December 31, 2008. As a result of these changes, direct comparisons to our
previously-reported reserves amounts may be more difficult.
Another
impact of the new SEC rules is a general requirement that, subject to limited
exceptions, proved undeveloped reserves may only be booked if they relate to
wells scheduled to be drilled within five years of the date of booking. This new
rule has limited and may continue to limit our potential to book additional
proved undeveloped reserves as we pursue our drilling program, particularly as
we develop our significant acreage in the Permian Basin, South Texas and
Appalachia. Moreover, we may be required to write down our proved undeveloped
reserves if we do not drill on those reserves within the required five-year
timeframe.
The SEC
has not reviewed our or any reporting company’s reserve estimates under the new
rules and has released only limited interpretive guidance regarding reporting of
reserve estimates under the new rules and may not issue further interpretive
guidance on the new rules. Accordingly, while the estimates of our proved
reserves at December 31, 2009 included in this report have been prepared based
on what we and our independent reserve engineers believe to be reasonable
interpretations of the new SEC rules,
those
estimates could differ materially from any estimates we might prepare applying
more specific SEC interpretive guidance.
We
may not be able to obtain funding on acceptable terms or obtain funding under
our reserve-based credit facility because of the deterioration of the credit and
capital markets. This may hinder or prevent us from meeting our future capital
needs.
Global
financial markets and economic conditions have been, and continue to be,
disrupted and volatile. The debt and equity capital markets have been
exceedingly distressed. These issues, along with significant write-offs in the
financial services sector, the re-pricing of credit risk and the current weak
economic conditions have made, and will likely continue to make, it difficult to
obtain funding.
In
particular, the cost of raising money in the debt and equity capital markets has
increased substantially while the availability of funds from those markets
generally has diminished significantly. Also, as a result of concerns about the
stability of financial markets generally and the solvency of counterparties
specifically, the cost of obtaining money from the credit markets generally has
increased as many lenders and institutional investors have increased interest
rates, enacted tighter lending standards, refused to refinance existing debt at
maturity at all or on terms similar to our current debt and reduced and, in some
cases, ceased to provide funding to borrowers.
In
addition, we may be unable to obtain adequate funding under our reserve-based
credit facility because our lending counterparties may be unwilling or unable to
meet their funding obligations.
Due to
these factors, we cannot be certain that funding will be available if needed and
to the extent required, on acceptable terms. If funding is not available when
needed, or is available only on unfavorable terms, we may be unable to grow our
existing business, complete acquisitions or otherwise take advantage of business
opportunities or respond to competitive pressures, any of which could have a
material adverse effect on our revenues and results of operations.
Growing
the Company will require significant amounts of debt and equity financing, which
may not be available to us on acceptable terms, or at all.
We plan
to fund our growth through acquisitions with proceeds from sales of our debt and
equity securities and borrowings under our reserve-based credit facility;
however, we cannot be certain that we will be able to issue our debt and equity
securities on terms or in the proportions that we expect, or at all, and we may
be unable refinance our reserve-based credit facility when it
expires.
The cost
of raising money in the debt and equity capital markets has increased while the
availability of funds from those markets generally has diminished. Also, as a
result of concerns about the stability of financial markets generally and the
solvency of counterparties specifically, the cost of obtaining money from the
credit markets generally has increased as many lenders and institutional
investors have increased interest rates, imposed tighter lending standards,
refused to refinance existing debt at maturity at all or on terms similar to our
current debt and reduced and, in some cases, ceased to provide funding to
borrowers.
17
A
significant increase in our indebtedness, or an increase in our indebtedness
that is proportionately greater than our issuances of equity, as well as the
credit market and debt and equity capital market conditions discussed above
could negatively impact our ability to remain in compliance with the financial
covenants under our reserve-based credit facility which could have a material
adverse effect on our financial condition, results of operations and cash flows.
If we are unable to finance our growth as expected, we could be required to seek
alternative financing, the terms of which may not be attractive to us, or not
pursue growth opportunities.
Our
reserve-based credit facility has substantial restrictions and financial
covenants and we may have difficulty obtaining additional credit, which could
adversely affect our operations and our ability to pay distributions to our
unitholders.
We are
prohibited from borrowing under our reserve-based credit facility to pay
distributions to unitholders if the amount of borrowings outstanding under our
reserve-based credit facility reaches or exceeds 90% of the borrowing base. Our
borrowing base is the amount of money available for borrowing, as determined
semi-annually by our lenders in their sole discretion. The lenders will
re-determine the borrowing base based on an engineering report with respect to
our natural gas, natural gas liquids and oil reserves, which will take into
account the prevailing natural gas, natural gas liquids and oil prices at such
time. In the future, we may not be able to access adequate funding under our
reserve-based credit facility as a result of (i) a decrease in our
borrowing base due to the outcome of a subsequent borrowing base
redetermination, or (ii) an unwillingness or inability on the part of our
lending counterparties to meet their funding obligations. In December 2009, our
borrowing base was set at $195.0 million. Our next borrowing base
redetermination is scheduled for April 2010 utilizing our December 31, 2009
reserve report.
A future
decline in commodity prices could result in a redetermination lowering our
borrowing base in the future and, in such case, we could be required to repay
any indebtedness in excess of the borrowing base. We anticipate that if, at the
time of any distribution, our borrowings equal or exceed 90% of the
then-specified borrowing base, our ability to pay distributions to our
unitholders in any such quarter will be solely dependent on our ability to
generate sufficient cash from our operations.
The
lenders can unilaterally adjust the borrowing base and the borrowings permitted
to be outstanding under our reserve-based credit facility. Any increase in the
borrowing base requires the consent of all the lenders. Outstanding borrowings
in excess of the borrowing base must be repaid immediately, or we must pledge
other natural gas and oil properties as additional collateral. We do not
currently have any substantial unpledged properties, and we may not have the
financial resources in the future to make any mandatory principal prepayments
required under our reserve-based credit facility.
Natural
gas, natural gas liquids and oil prices are volatile. A decline in
natural gas, natural gas liquids and oil prices could adversely affect our
financial position, financial results, cash flow, access to capital and ability
to grow.
Our
future financial condition, revenues, results of operations, rate of growth and
the carrying value of our natural gas and oil properties depend primarily upon
the prices we receive for our natural gas, natural gas liquids and oil
production and the prices prevailing from time to time for natural gas, natural
gas liquids and oil. Prices also affect our cash flow available for capital
expenditures and our ability to access funds under our reserve-based credit
facility and through the capital markets. The amount available for borrowing
under our reserve-based credit facility is subject to a borrowing base, which is
determined by our lenders taking into account our estimated proved reserves and
is subject to semi-annual redeterminations based on pricing models determined by
the lenders at such time. The recent volatility in natural gas, natural gas
liquids and oil prices has impacted the value of our estimated proved reserves
and, in turn, the market values used by our lenders to determine our borrowing
base. Further, because we have elected to use the full-cost accounting method,
each quarter we must perform a “ceiling test” that is impacted by declining
prices. Significant price declines could cause us to take one or more ceiling
test write downs, which would be reflected as non-cash charges against current
earnings.
Natural
gas, natural gas liquids and oil prices historically have been volatile and are
likely to continue to be volatile in the future, especially given current
geopolitical and economic conditions. For example, the crude oil
spot price per barrel for the period between January 1, 2009 and December 31,
2009 ranged from a high of $81.03 to a low of $34.03 and the NYMEX natural gas
spot price per MMBtu for the period January 1, 2009 to December 31, 2009 ranged
from a high of $6.07 to a low of $2.51. As of February 23, 2010, the crude
oil spot price per barrel was $78.61 and the NYMEX natural gas spot price per
MMBtu was $4.78. This price volatility affects the amount of our cash flow we
have available for capital expenditures and our ability to borrow money or raise
additional capital. The prices for natural gas, natural gas liquids
and oil are subject to a variety of factors, including:
18
|
·
|
the
level of consumer demand for natural gas, natural gas liquids and
oil;
|
|
·
|
the
domestic and foreign supply of natural gas, natural gas liquids and
oil;
|
|
·
|
commodity
processing, gathering and transportation availability, and the
availability of refining capacity;
|
|
·
|
the
price and level of imports of foreign crude natural gas, natural gas
liquids and oil;
|
|
·
|
the
ability of the members of the Organization of Petroleum Exporting
Countries to agree to and to enforce crude oil price and production
controls;
|
|
·
|
domestic
and foreign governmental regulations and
taxes;
|
|
·
|
the
price and availability of alternative fuel
sources;
|
|
·
|
weather
conditions;
|
|
·
|
political
conditions or hostilities in oil and gas producing regions, including the
Middle East, Africa and South
America;
|
|
·
|
technological
advances affecting energy consumption;
and
|
|
·
|
worldwide
economic conditions.
|
Declines
in natural gas, natural gas liquids and oil prices would not only reduce our
revenue, but could reduce the amount of natural gas, natural gas liquids and oil
that we can produce economically and, as a result, could have a material adverse
effect on our financial condition, results of operations and
reserves. We recorded a non-cash
ceiling test impairment of natural gas and oil properties for the year ended
December 31, 2009 of $110.2 million. The impairment for the first quarter
2009 was $63.8 million as a result of a decline in natural gas prices at the
measurement date, March 31, 2009. This impairment was calculated based on prices
of $3.65 per MMBtu for natural gas and $49.64 per barrel of crude oil. The
Securities and Exchange Commission’s (“SEC”) Final Rule, “Modernization of Oil
and Gas Reporting,” which became effective December 31, 2009, changed the price
used to calculate oil and gas reserves to a 12-month average price rather than a
year-end price. As a
result of declines in natural gas and oil prices based upon the 12-month average
price, we recorded an impairment of $46.4 million in the fourth quarter of 2009.
This impairment was calculated using the 12-month average price for
natural gas and oil of $3.87 per MMBtu for
natural gas and $ 61.04 per barrel of crude oil. If the gas and oil
industry experiences significant price declines, we may, among other things, be
unable to maintain or increase our borrowing capacity, repay current or future
indebtedness or obtain additional capital on attractive terms, all of which can
affect the value of our units.
Unless
we replace our reserves, our existing reserves and production will decline,
which would adversely affect our cash flow from operations and our ability to
make distributions to our unitholders.
Producing
natural gas and oil wells extract hydrocarbons from underground structures
referred to as reservoirs. Reservoirs contain a finite volume of hydrocarbon
reserves referred to as reserves in place. Based on prevailing prices and
production technologies, only a fraction of reserves in place can be recovered
from a given reservoir. The volume of the reserves in place that is recoverable
from a particular reservoir is reduced as production from that well continues.
The reduction is referred to as depletion. Ultimately, the economically
recoverable reserves from a particular well will deplete entirely and the
producing well will cease to produce and will be plugged and abandoned. In that
event, we must replace our reserves. We do not intend to drill any development
wells until market conditions allow for an adequate return on the drilling
investment and only when we have sufficient liquidity to do so. As a result,
unless we are able over the long-term to replace the reserves that are produced,
investors in our units should consider the cash distributions that are paid on
the units not merely as a “yield” on the units, but as a combination of both a
return of capital and a return on investment. Investors in our units will have
to obtain the return of capital invested out of cash flow derived from their
investments in units during the period when reserves can be economically
recovered. Accordingly, we give no assurances that the distributions our
unitholders receive over the life of their investment will meet or exceed their
initial capital investment.
19
Future
price declines may result in a write down of our asset carrying
values.
Lower
natural gas, natural gas liquids and oil prices may not only decrease our
revenues, but also reduce the amount of natural gas, natural gas liquids and oil
that we can produce economically. This may result in our having to make
substantial downward adjustments to our estimated proved reserves. If this
occurs, or if our estimates of development costs increase, production data
factors change or drilling results deteriorate, accounting rules may
require us to write down, as a non-cash charge to earnings, the carrying value
of our natural gas properties for impairments. We are required to perform
impairment tests on our assets whenever events or changes in circumstances lead
to a reduction of the estimated useful life or estimated future cash flows that
would indicate that the carry amount may not be recoverable or whenever
management’s plans change with respect to those assets. We recorded a non-cash
ceiling test impairment of natural gas and oil properties for the year ended
December 31, 2009 of $110.2 million. The impairment for the first quarter
2009 was $63.8 million as a result of a decline in natural gas prices at the
measurement date, March 31, 2009. This impairment was calculated based on prices
of $3.65 per MMBtu for natural gas and $49.64 per barrel of crude oil. The SEC’s
Final Rule, “Modernization of Oil and Gas Reporting,” which became effective
December 31, 2009, changed the price used to calculate oil and gas reserves to a
12-month average price rather than a year-end price. As a result of declines in
natural gas and oil prices based upon the 12-month average price, we recorded an
impairment of $46.4 million in the fourth quarter of 2009. This impairment was
calculated using the 12-month average price for natural gas and oil of $3.87 per MMBtu for
natural gas and $ 61.04 per barrel of crude oil. We may incur additional
impairment charges in the future, which could have a material adverse effect on
our results of operations in the period taken and our ability to borrow funds
under our reserve-based credit facility, which may affect our ability to fund
our operations and acquire additional reserves, which may adversely affect our
ability to make cash distributions to our unitholders.
Lower
natural gas, natural gas liquids and oil prices and other factors have resulted,
and in the future may result, in ceiling test write downs and other impairments
of our asset carrying values.
We use
the full cost method of accounting to report our natural gas and oil properties.
Under this method, we capitalize the cost to acquire, explore for, and develop
natural gas and oil properties. Under full cost accounting rules, the net
capitalized costs of proved natural gas and oil properties may not exceed a
“ceiling limit,” which is based upon the present value of estimated future net
cash flows from proved reserves, discounted at 10%. If net capitalized costs of
proved natural gas and oil properties exceed the ceiling limit, we must charge
the amount of the excess to earnings. This is called a “ceiling test write
down.” Under the accounting rules, we are required to perform a ceiling test
each quarter. A ceiling test write down would not impact cash flow from
operating activities, but it would reduce our members’ equity.
The risk
that we will be required to write down the carrying value of our natural gas and
oil properties increases when oil and gas prices are low or volatile. In
addition, write downs may occur if we experience substantial downward
adjustments to our estimated proved reserves, or if estimated future development
costs increase. For example, natural gas, natural gas liquids and oil prices
were very volatile throughout 2009. We recorded a non-cash ceiling test
impairment of natural gas and oil properties for the year ended December 31,
2009 of $110.2 million. The impairment for the first quarter 2009 was
$63.8 million as a result of a decline in natural gas prices at the measurement
date, March 31, 2009. This impairment was calculated based on prices of $3.65
per MMBtu for natural gas and $49.64 per barrel of crude oil. The SEC’s Final
Rule, “Modernization of Oil and Gas Reporting,” which became effective December
31, 2009, changed the price used to calculate oil and gas reserves to a 12-month
average price rather than a year-end price. As a result of declines in
natural gas and oil prices based upon the 12-month average price, we recorded an
impairment of $46.4 million in the fourth quarter of 2009. This impairment was
calculated using the
12-month average price for natural gas and oilof $3.87 per MMBtu for
natural gas and $ 61.04 per barrel of crude oil. These and other factors could
cause us to record additional write downs of our oil and natural gas properties
and other assets in the future and incur additional charges against future
earnings. Based on the 12-month average natural gas and oil prices through
February 2010, we do not anticipate an impairment at March 31, 2010.
Our
acquisition activities will subject us to certain risks.
During
2008 and 2009, we expanded our operations into the Permian Basin of west Texas
and southeastern New Mexico and into south Texas. Any acquisition involves
potential risks, including, among other things: the validity of our assumptions
about reserves, future production, revenues and costs, including synergies; an
inability to integrate successfully the businesses we acquire; a decrease in our
liquidity by using a significant portion of our available cash or borrowing
capacity to finance acquisitions; a significant increase in our interest expense
or financial leverage if we incur additional debt to finance acquisitions; the
assumption of unknown liabilities, losses or costs for which we are not
indemnified or for which our indemnity is inadequate; the diversion of
management’s attention to other business concerns; an inability to hire, train
or retain qualified personnel to manage and operate our growing business and
assets; the incurrence of other significant charges, such as impairment of other
intangible assets, asset devaluation or restructuring charges; unforeseen
difficulties encountered in operating in new geographic areas; an increase in
our costs or a decrease in our revenues associated with any potential royalty
owner or landowner claims or disputes; and customer or key employee losses at
the acquired businesses.
Our
decision to acquire a property will depend in part on the evaluation of data
obtained from production reports and engineering studies, geophysical and
geological analyses and seismic and other information, the results of which are
often inconclusive and subject to various interpretations. Also, our reviews of
acquired properties are inherently incomplete because it generally is not
feasible to perform an in-depth review of the individual properties involved in
each acquisition. Even a detailed review of records and properties may not
necessarily reveal existing or potential problems, nor will it permit us to
become sufficiently familiar with the properties to assess fully their
deficiencies and potential. Inspections may not always be performed on every
well, and environmental problems, such as ground water contamination, are not
necessarily observable even when an inspection is undertaken.
If our
acquisitions do not generate increases in available cash per unit, our ability
to make cash distributions to our unitholders could materially
decrease.
20
We
rely on Vinland, an affiliate of our largest unitholder, to execute our drilling
program in Appalachia. If Vinland fails to or inadequately performs, our
operations will be disrupted and our costs could increase or our reserves may
not be developed, reducing our future levels of production and our cash from
operations, which could affect our ability to make cash distributions to our
unitholders.
Effective
as of January 5, 2007, we entered into various agreements with Vinland, an
affiliate of our largest unitholder, under which we rely on Vinland to operate
all of our existing producing wells and coordinate our development drilling
program in Appalachia. For example, pursuant to a participation agreement that
we have entered into with Vinland, Vinland generally has control over our
drilling program in Appalachia and has the sole right to determine which wells
are drilled until January 1, 2011. Under the agreements, Vinland will also
advise and consult with us regarding all aspects of our production and
development operations in Appalachia and provide us with administrative support
services as necessary or useful for the operation of our business. If Vinland
fails to or inadequately performs these functions, our operations in Appalachia
will be disrupted and our costs could increase or our reserves may not be
developed or properly developed, reducing our future levels of production and
our cash from operations, which could affect our ability to make cash
distributions to our unitholders.
Vinland
controls our drilling program in Appalachia. Should we ask them to, Vinland has
agreed to drill not less than 100 gross wells over the next year.
Pursuant
to a participation agreement that we have entered into with Vinland, Vinland
generally has control over our drilling program in Appalachia and has the sole
right to determine which wells are drilled until January 1, 2011. During
this period, when favorable conditions for drilling exists, we will meet with
Vinland on a quarterly basis to review Vinland’s proposal to drill not less than
25 nor more than 40 gross wells, in which we will own a 40% working interest, in
any quarter. Up to 20% of the proposed wells may be carried over and added to
the wells to be drilled in the subsequent quarter, provided that Vinland is
required to drill at least 100 gross wells per calendar year. If Vinland
proposes the drilling of less than 25 gross wells in any quarter, we have the
right to propose the drilling of up to a total of 14 net wells, in which we will
own a 100% working interest, in a given quarterly period. If Vinland drills its
minimum commitment, we do not have the ability to drill our own additional wells
in the AMI. If either party elects not to participate in the drilling of the
proposed wells or future operations with respect to drilled wells, such party
forfeits all right, title and interest in the natural gas, natural gas liquids
and oil production that may be produced from such wells. Notwithstanding the
foregoing, if both parties agree, no drilling is required.
We
could lose our interests in future wells if we fail to participate under our
operating agreement with Lewis in the drilling of these wells.
Under the
terms of our operating agreement with Lewis, we may elect to forego
participation in the future drilling of wells. Should we do so, we will become
obligated to transfer without compensation all of our right, title and interest
in those wells.
We
are exposed to the credit risk of Vinland and any material nonperformance by
Vinland could reduce our ability to make distributions to our
unitholders.
Effective
January 5, 2007, we entered into several agreements with Vinland pursuant
to which Vinland operates all of our existing producing wells in Appalachia and
coordinates our development drilling program in Appalachia. In addition, Vinland
generally has control over our drilling program in Appalachia and has the sole
right to determine which wells are drilled until January 1, 2011. In the
event Vinland becomes insolvent or declares bankruptcy, we would have to become
the operator of our wells in Appalachia and pursue our own drilling program
which would require additional employees and increased expenses. In addition,
there are no restrictions on Nami from selling his ownership in Vinland to a
third party that should, but may not perform under our agreements with Vinland.
Any material nonperformance under our agreements with Vinland could materially
and adversely impact our ability to operate and make distributions to our
unitholders.
The
amount of cash that we have available for distribution to our unitholders
depends primarily upon our cash flow and not our profitability.
The
amount of cash that we have available for distribution depends primarily on our
cash flow, including cash from reserves and working capital or other borrowings,
and not solely on our profitability, which is affected by non-cash items. As a
result, we may be unable to pay distributions even when we record net income,
and we may be able to pay distributions during periods when we incur net
losses.
21
Our
estimated reserves are based on many assumptions that may prove to be
inaccurate. Any material inaccuracies in these reserve estimates or underlying
assumptions will materially affect the quantities and present value of our
reserves.
No one
can measure underground accumulations of natural gas or oil in an exact way.
Natural gas and oil reserve engineering requires subjective estimates of
underground accumulations of natural gas and/or oil and assumptions concerning
future natural gas and oil prices, production levels, and operating and
development costs. As a result, estimated quantities of proved reserves and
projections of future production rates and the timing of development
expenditures may prove to be inaccurate. Independent petroleum engineers prepare
estimates of our proved reserves. Some of our reserve estimates are made without
the benefit of a lengthy production history, which are less reliable than
estimates based on a lengthy production history. Also, the calculation of
estimated reserves requires certain assumptions regarding future natural gas and
oil prices, production levels, and operating and development costs, any of which
assumptions may prove incorrect. Any significant variance from these assumptions
by actual figures could greatly affect our estimates of reserves, the
economically recoverable quantities of natural gas, natural gas liquids and oil
attributable to any particular group of properties, the classifications of
reserves based on risk of recovery, and estimates of the future net cash flows.
For example, if natural gas prices decline by $1.00 per MMBtu and oil prices
declined by $6.00 per barrel, the standardized measure of our proved reserves as
of December 31, 2009 would decrease from $178.7 million to $115.8 million,
based on price sensitivity generated from an internal evaluation. Our
standardized measure is calculated using unhedged natural gas and oil prices and
is determined in accordance with the rules and regulations of the SEC.
Numerous changes over time to the assumptions on which our reserve estimates are
based, as described above, often result in the actual quantities of natural gas,
natural gas liquids and oil we ultimately recover being different from our
reserve estimates.
The
present value of future net cash flows from our proved reserves is not
necessarily the same as the current market value of our estimated natural gas
reserves.
We base
the estimated discounted future net cash flows from our proved reserves using a
12-month average price and costs in effect on the day of the estimate. However,
actual future net cash flows from our natural gas and oil properties will be
affected by factors such as:
|
|
·
the volume, pricing and duration of our natural gas and oil hedging
contracts;
|
|
|
·
supply of and demand for natural gas, natural gas liquids and
oil;
|
|
|
|
|
|
·
actual prices we receive for natural gas, natural gas liquids and
oil;
|
|
|
|
|
|
·
our actual operating costs in producing natural gas, natural gas liquids
and oil;
|
|
|
|
|
|
·
the amount and timing of our capital
expenditures;
|
|
|
|
|
|
·
the amount and timing of actual production;
and
|
|
|
|
|
|
·
changes in governmental regulations or
taxation.
|
|
|
|
The
timing of both our production and our incurrence of expenses in connection with
the development and production of natural gas and oil properties will affect the
timing of actual future net cash flows from proved reserves, and thus their
actual present value. In addition, the 10% discount factor we use when
calculating discounted future net cash flows may not be the most appropriate
discount factor based on interest rates in effect from time to time and risks
associated with us or the natural gas and oil industry in general. Any material
inaccuracies in these reserve estimates or underlying assumptions will
materially affect the quantities and present value of our reserves, which could
adversely affect our business, results of operations, financial condition and
our ability to make cash distributions to unitholders.
Our
operations require substantial capital expenditures, which will reduce our cash
available for distribution. We may be unable to obtain needed capital or
financing on satisfactory terms, which could lead to a decline in our reserves
and adversely affect our ability to make distributions to our
unitholders.
The
natural gas and oil industry is capital intensive. We have made and ultimately
expect to continue to make substantial capital expenditures in our business for
the development, production and acquisition of natural gas, natural gas liquids
and oil reserves. These expenditures will reduce our cash available for
distribution. We intend to finance our future capital expenditures with cash
flow from operations and our financing arrangements. Our cash flow from
operations and access to capital are subject to a number of variables,
including:
22
|
|
·
our proved reserves;
|
|
|
|
|
|
·
the level of natural gas, natural gas liquids and oil we are able to
produce from existing wells;
|
|
|
|
|
|
·
the prices at which our natural gas, natural gas liquids and oil is sold;
and
|
|
|
|
|
|
·
our ability to acquire, locate and produce new
reserves.
|
|
|
|
If our
revenues or the borrowing base under our reserve-based credit facility decrease
as a result of lower natural gas, natural gas liquids and oil prices, operating
difficulties, declines in reserves or for any other reason, we may have limited
ability to obtain the capital necessary to sustain our operations at current
levels or to replace or add to our reserves. Our reserve-based credit facility
restricts our ability to obtain new debt financing. If additional capital is
needed, we may not be able to obtain debt or equity financing on terms favorable
to us, or at all. If cash generated by operations or available under our
reserve-based credit facility is not sufficient to meet our capital
requirements, the failure to obtain additional financing could result in a
curtailment of our operations relating to development of our prospects, which in
turn could lead to a possible decline in our reserves and production and a
reduction in our cash available for distribution.
Our
business depends on gathering and compression facilities owned by third parties
and transportation facilities owned by Delta Natural Gas, Columbia Gas
Transmission, Enterprise Products Partners, LP and other third-party
transporters and we rely on third parties to gather and deliver our
natural gas, natural gas liquids and oil to certain designated
interconnects with third-party transporters. Any limitation in the availability
of those facilities or delay in providing interconnections to newly drilled
wells would interfere with our ability to market the natural gas, natural gas
liquids and oil we produce and could reduce our revenues and cash
available for distribution.
The
marketability of our natural gas, natural gas liquids and oil production depends
in part on the availability, proximity and capacity of pipeline systems owned by
third parties in the respective operating areas. The amount of natural gas that
can be produced and sold is subject to curtailment in certain circumstances,
such as pipeline interruptions due to scheduled and unscheduled maintenance,
excessive pressure, physical damage to the gathering, compression or
transportation system, or lack of contracted capacity on such systems. The
curtailments arising from these and similar circumstances may last from a few
days to several months. In many cases, we are provided only with limited, if
any, notice as to when these circumstances will arise and their duration. In
addition, some of our wells are drilled in locations that are not serviced by
gathering and transportation pipelines, or the gathering and transportation
pipelines in the area may not have sufficient capacity to transport the
additional production. As a result, we may not be able to sell the natural gas
production from these wells until the necessary gathering and transportation
systems are constructed. Any significant curtailment in gathering system or
pipeline capacity, or significant delay in the construction of necessary
gathering, compression and transportation facilities, could reduce our revenues
and cash available for distribution.
Our
sales of natural gas, natural gas liquids, oil and other energy commodities, and
related hedging activities, expose us to potential regulatory
risks.
The FTC,
FERC and the CFTC hold statutory authority to monitor certain segments of the
physical and futures energy commodities markets. These agencies have imposed
broad regulations prohibiting fraud and manipulation of such markets. With
regard to our physical sales of natural gas, natural gas liquids, oil or other
energy commodities, and any related hedging activities that we undertake, we are
required to observe the market-related regulations enforced by these agencies,
which hold substantial enforcement authority. Our sales may also be subject to
certain reporting and other requirements. Failure to comply with such
regulations, as interpreted and enforced, could have a material adverse effect
on our business, results of operations, financial condition and our ability to
make cash distributions to our unitholders.
We are
subject to FERC requirements related to our use of capacity on natural gas
pipelines that are subject to FERC regulation. Any failure on our part to comply
with the FERC’s regulations and policies, or with an interstate pipeline’s
tariff, could result in the imposition of civil and criminal
penalties.
Climate
change legislation, regulatory initiatives and litigation may adversely affect
our operations, our cost structure, or the demand for oil and gas.
On April
17, 2009, the U.S. Environmental Protection Agency, or “EPA,” issued a notice of
its proposed finding and determination that emissions of carbon dioxide,
methane, and other greenhouse gases, or “GHGs,” presented an endangerment to
human health and the environment because emissions of such gases are, according
to EPA, contributing to warming of the earth’s atmosphere. Once finalized, EPA’s
finding and determination would allow it to begin regulating emissions of GHGs
under existing provisions of the federal Clean Air Act. Although it may take EPA
several years to adopt and impose regulations limiting emissions of GHGs, any
limitation on emissions of GHGs from our equipment and operations could require
us to incur costs to reduce emissions of GHGs associated with our operations. In
addition, on June 26, 2009, the U.S. House of Representatives passed House Bill
2454, also referred to as the “Waxman-Markey legislation” but formally named the
“American Clean Energy and Security Act of 2009,” which would establish an
economy-wide cap-and-trade program to reduce U.S. emissions of carbon dioxide
and other GHGs by 17 percent from 2005 levels by 2020 and just over 80 percent
by 2050. President Obama is encouraging the Senate to consider climate change
legislation during the fall of 2009. Further, on September 21, 2009 a U.S.
Federal appellate court reinstated a lawsuit filed by several state attorneys
general and others against five of the largest U.S. electric utility companies
alleging that those companies have created a public nuisance due to their
emissions of carbon dioxide. Although it is not possible at this time to predict
if and when the Senate may act on climate change legislation, how any bill
passed by the Senate would be reconciled with House Bill 2454 or what effect, if
any, the recent decision permitting a nuisance lawsuit to proceed against
certain utilities may have on the oil and gas industry, any future federal laws
or implementing regulations that may be adopted to address greenhouse gas
emissions, as well as future climate change litigation against us or our
customers for GHG emissions, could result in increased compliance costs or
additional operating restrictions, and could have an adverse effect on demand
for the natural gas, natural gas liquids and oil we produce.
23
The
adoption of derivatives legislation by Congress could have an adverse impact on
our ability to hedge risks associated with our business.
Congress
is currently considering legislation to impose restrictions on certain
transactions involving derivatives, which could affect the use of derivatives in
hedging transactions. ACESA contains provisions that would prohibit private
energy commodity derivative and hedging transactions. ACESA would expand the
power of the Commodity Futures Trading Commission, or CFTC, to regulate
derivative transactions related to energy commodities, including oil and natural
gas, and to mandate clearance of such derivative contracts through registered
derivative clearing organizations. Under ACESA, the CFTC’s expanded authority
over energy derivatives would terminate upon the adoption of general legislation
covering derivative regulatory reform. The CFTC is considering whether to set
limits on trading and positions in commodities with finite supply, particularly
energy commodities, such as crude oil, natural gas and other energy products.
The CFTC also is evaluating whether position limits should be applied
consistently across all markets and participants. Separately, the House of
Representatives adopted financial regulatory reform legislation on December 11,
2009,
that, among
other things,
would impose comprehensive regulation on the over-the-counter (OTC) derivatives
marketplace. This legislation would subject swap dealers and “major swap
participants” to substantial supervision and regulation, including capital
standards, margin requirements, business conduct standards, and recordkeeping
and reporting requirements. It also would require central clearing for
transactions entered into between swap dealers or major swap participants, and
would provide the CFTC with authority to impose position limits in the OTC
derivatives markets. A major swap participant generally would be someone other
than a dealer who maintains a “substantial” net position in outstanding swaps,
excluding swaps used for commercial hedging or for reducing or mitigating
commercial risk, or whose positions create substantial net counterparty exposure
that could have serious adverse effects on the financial stability of the US
banking system or financial markets. Although it is not possible at this time to
predict whether or when Congress may act on derivatives legislation or how any
climate change bill approved by the Senate would be reconciled with ACESA, any laws or
regulations that may be adopted that subject us to additional capital or margin
requirements relating to, or to additional restrictions on, our trading and
commodity positions could have an adverse effect on our ability to hedge risks
associated with our business or on the cost of our hedging activity.
We
depend on certain key customers for sales of our natural gas, natural gas
liquids and oil. To the extent these and other customers reduce the volumes of
natural gas, natural gas liquids and oil they purchase from us, or to
the extent these customers cease to be creditworthy, our revenues and cash
available for distribution could decline.
For the
year ended December 31, 2009, sales of natural gas, natural gas liquids and oil
to Seminole Energy Services, Osram Sylvania, Inc., Plains Marketing
L.P., Sunoco Partners Marketing and Terminals, L.P. and Occidental
Energy Marketing, Inc. accounted for approximately 35%, 9%, 7%, 5% and 2%,
respectively, of our natural gas, natural gas liquids and oil revenues. Our top
five purchasers during the year ended December 31, 2009, therefore
accounted for 58% of our total revenues. To the extent these and other customers
reduce the volumes of natural gas, natural gas liquids and oil that they
purchase from us and they are not replaced in a timely manner with a new
customer, our revenues and cash available for distribution could
decline.
Because
we handle natural gas and other petroleum products, we may incur significant
costs and liabilities in the future resulting from a failure to comply with new
or existing environmental regulations or an accidental release of hazardous
substances into the environment.
The
operations of our wells are subject to stringent and complex federal, state and
local environmental laws and regulations. These include, for
example:
|
|
·
the federal Clean Air Act and comparable state laws and regulations that
impose obligations related to air
emissions;
|
|
|
·
the federal Clean Water Act and comparable state laws and regulations that
impose obligations related to discharges of pollutants into regulated
bodies of water;
|
|
|
|
|
|
·
RCRA and comparable state laws that impose requirements for the handling
and disposal of waste from our facilities;
and
|
|
|
|
|
|
·
CERCLA and comparable state laws that regulate the cleanup of hazardous
substances that may have been released at properties currently or
previously owned or operated by us or at locations to which we have sent
hazardous substances for disposal.
|
|
|
|
24
Failure
to comply with these laws and regulations may trigger a variety of
administrative, civil and criminal enforcement measures, including the
assessment of monetary penalties, the imposition of remedial requirements, and
the issuance of orders enjoining future operations. Certain environmental
statutes, including the RCRA, CERCLA, the federal Oil Pollution Act and
analogous state laws and implementing regulations, impose strict, and under
certain circumstances, joint and several liability for costs required to clean
up and restore sites where hazardous substances or wastes have been disposed of
or otherwise released. Moreover, it is not uncommon for neighboring landowners
and other third parties to file claims for personal injury and property or
natural resource damage allegedly caused by the release of hazardous substances
or other waste products into the environment.
We may
incur significant environmental costs and liabilities due to the nature of our
business and the hazardous substances and wastes associated with operation of
the wells. For example, an accidental release of petroleum hydrocarbons from one
of our wells could subject us to substantial liabilities arising from
environmental cleanup and restoration costs, claims made by neighboring
landowners and other third parties for personal injury, property and natural
resource damage, and fines or penalties for related violations of environmental
laws or regulations. Moreover, the possibility exists that stricter laws,
regulations or enforcement policies could significantly increase our compliance
costs and the cost of any remediation that may become necessary. We may not be
able to recover some or any of these costs from insurance. Please read “Item
1—Business—Operations—Environmental Matters and Regulation.”
Our
future distributions and proved reserves will be dependent upon the success of
our efforts to prudently acquire, manage and develop natural gas and oil
properties that conform to the acquisition profile described in this Annual
Report.
In
addition to ownership of the properties currently owned by us, unless we acquire
properties in the future containing additional proved reserves or successfully
develop proved reserves on our existing properties, our proved reserves will
decline as the reserves attributable to the underlying properties are produced.
In addition, if the costs to develop or operate our properties increase, the
estimated proved reserves associated with properties will be reduced below the
level that would otherwise be estimated. We will manage and develop our
properties, and the ultimate value to us of such properties which we acquire
will be dependent upon the price we pay and our ability to prudently acquire,
manage and develop such properties. As a result, our future cash distributions
will be dependent to a substantial extent upon our ability to prudently acquire,
manage and develop such properties.
Suitable
acquisition candidates may not be available on terms and conditions that we find
acceptable, we may not be able to obtain financing for certain acquisitions, and
acquisitions pose substantial risks to our businesses, financial conditions and
results of operations. Even if future acquisitions are completed, the following
are some of the risks associated with acquisitions, which could reduce the
amount of cash available from the affected properties:
|
|
·
some of the acquired properties may not produce revenues, reserves,
earnings or cash flow at anticipated
levels;
|
|
|
|
|
|
·
we may assume liabilities that were not disclosed or that exceed their
estimates;
|
|
|
|
|
|
·
we may be unable to integrate acquired properties successfully and may not
realize anticipated economic, operational and other benefits in a timely
manner, which could result in substantial costs and delays or other
operational, technical or financial
problems;
|
|
|
|
|
|
·
acquisitions could disrupt our ongoing business, distract management,
divert resources and make it difficult to maintain our current business
standards, controls and procedures;
and
|
|
|
·
we may incur additional debt related to future
acquisitions.
|
|
|
|
Substantial
acquisitions or other transactions could require significant external capital
and could change our risk and property profile.
25
A
principal component of our business strategy is to grow our asset base and
production through the acquisition of natural gas and oil properties
characterized by long-lived, stable production. The character of newly acquired
properties may be substantially different in operating or geological
characteristics or geographic location than our existing properties. The changes
in the characteristics and risk profiles of such new properties will in turn
affect our risk profile, which may negatively affect our ability to issue equity
or debt securities in order to fund future acquisitions and may inhibit our
ability to renegotiate our existing credit facilities on favorable
terms.
Locations
that we or the operators of our properties decide to drill may not yield natural
gas or oil in commercially viable quantities.
The cost
of drilling, completing and operating a well is often uncertain, and cost
factors can adversely affect the economics of a well. Our efforts will be
uneconomical if we or the operators of our properties drill dry holes or wells
that are productive but do not produce enough to be commercially viable after
drilling, operating and other costs. If we or the operators of our properties
drill future wells that we identify as dry holes, our drilling success rate
would decline and may adversely affect our results of operations and our ability
to pay future cash distributions at expected levels.
Many
of our leases are in areas that have been partially depleted or drained by
offset wells.
Many
of our leases are in areas that have already been partially depleted or drained
by earlier offset drilling. This may inhibit our ability to find economically
recoverable quantities of natural gas or oil in these areas.
Our
identified drilling location inventories are scheduled out over several years,
making them susceptible to uncertainties that could materially alter the
occurrence or timing of their drilling, resulting in temporarily lower cash from
operations, which may impact our ability to pay distributions.
Our
management has specifically identified and scheduled drilling locations as an
estimation of our future multi-year drilling activities on our existing acreage.
As of December 31, 2009, we have identified 470 proved undeveloped drilling
locations and over 205 additional drilling locations. These identified drilling
locations represent a significant part of our strategy. We do not intend to
drill any development wells until market conditions allow for an adequate return
on the drilling investment and only when we have sufficient liquidity to do so.
Our ability to drill and develop these locations depends on a number of factors,
including the availability of capital, seasonal conditions, regulatory
approvals, natural gas prices, drilling and operating costs and drilling
results. In addition, NSAI and D&M have not assigned any proved reserves to
the over 205 unproved drilling locations we have identified and scheduled for
drilling and therefore there may exist greater uncertainty with respect to the
success of drilling wells at these drilling locations. Our final determination
on whether to drill any of these drilling locations will be dependent upon the
factors described above as well as, to some degree, the results of our drilling
activities with respect to our proved drilling locations. Because of these
uncertainties, we do not know if the numerous drilling locations we have
identified will be drilled within our expected timeframe or will ever be drilled
or if we will be able to produce natural gas or oil from these or any other
potential drilling locations. As such, our actual drilling activities may
materially differ from those presently identified, which could adversely affect
our business.
Drilling
for and producing natural gas, natural gas liquids and oil are high risk
activities with many uncertainties that could adversely affect our financial
condition or results of operations and, as a result, our ability to pay
distributions to our unitholders.
Our
drilling activities are subject to many risks, including the risk that we will
not discover commercially productive reservoirs. Drilling for natural gas or oil
can be uneconomical, not only from dry holes, but also from productive wells
that do not produce sufficient revenues to be commercially viable. In addition,
our drilling and producing operations may be curtailed, delayed or canceled as a
result of other factors, including:
|
·
|
the
high cost, shortages or delivery delays of equipment and
services;
|
|
|
·
|
unexpected
operational events;
|
|
|
·
|
adverse
weather conditions;
|
26
|
·
|
facility
or equipment malfunctions;
|
|
|
·
|
title
problems;
|
|
|
·
|
pipeline
ruptures or spills;
|
|
|
·
|
compliance
with environmental and other governmental requirements;
|
|
|
·
|
unusual
or unexpected geological formations;
|
|
|
·
|
loss
of drilling fluid circulation;
|
|
|
·
|
formations
with abnormal pressures;
|
|
|
·
|
fires;
|
|
|
·
|
blowouts,
craterings and explosions;
|
|
|
·
|
uncontrollable
flows of natural gas or well fluids; and
|
|
|
·
|
pipeline
capacity curtailments.
|
|
|
|
Any of
these events can cause substantial losses, including personal injury or loss of
life, damage to or destruction of property, natural resources and equipment,
pollution, environmental contamination, loss of wells and regulatory
penalties.
We
ordinarily maintain insurance against various losses and liabilities arising
from our operations; however, insurance against all operational risks is not
available to us. Additionally, we may elect not to obtain insurance if we
believe that the cost of available insurance is excessive relative to the
perceived risks presented. Losses could therefore occur for uninsurable or
uninsured risks or in amounts in excess of existing insurance coverage. The
occurrence of an event that is not fully covered by insurance could have a
material adverse impact on our business activities, financial condition and
results of operations.
We
may incur substantial additional debt in the future to enable us to pursue our
business plan and to pay distributions to our unitholders.
Our
business requires a significant amount of capital expenditures to maintain and
grow production levels. Commodity prices have historically been volatile, and we
cannot predict the prices we will be able to realize for our production in the
future. As a result, we may borrow, to the extent available, significant amounts
under our reserve-based credit facility in the future to enable us to pay
quarterly distributions. Significant declines in our production or significant
declines in realized natural gas, natural gas liquids and oil prices for
prolonged periods and resulting decreases in our borrowing base may force us to
reduce or suspend distributions to our unitholders.
If we
borrow to pay distributions, we are distributing more cash than we are
generating from our operations on a current basis. This means that we are using
a portion of our borrowing capacity under our reserve-based credit facility to
pay distributions rather than to maintain or expand our operations. If we use
borrowings under our reserve-based credit facility to pay distributions for an
extended period of time rather than toward funding capital expenditures and
other matters relating to our operations, we may be unable to support or grow
our business. Such a curtailment of our business activities, combined with our
payment of principal and interest on our future indebtedness to pay these
distributions, will reduce our cash available for distribution on our common
units. If we borrow to pay distributions during periods of low commodity prices
and commodity prices remain low, we may have to reduce or suspend our
distribution in order to avoid excessive leverage and debt covenant
violations.
Seasonal
weather conditions and lease stipulations adversely affect our ability to
conduct drilling activities in some of the areas where we operate.
Natural
gas operations in the Appalachian Basin are adversely affected by seasonal
weather conditions, primarily in the winter and spring. Many municipalities
impose weight restrictions on the paved roads that lead to our jobsites due to
the muddy conditions caused by spring thaws. This limits our access to these
jobsites and our ability to service wells in these areas.
Our
price risk management activities could result in financial losses or could
reduce our income, which may adversely affect our ability to pay distributions
to our unitholders.
We enter
into derivative contracts to reduce the impact of natural gas and oil price
volatility on our cash flow from operations. Currently, we use a combination of
fixed-price swaps and NYMEX collars to mitigate the volatility of future natural
gas and oil prices received. Please read “Item 1—Operations— Price Risk
Management Activities” and “Item 7A—Quantitative and Qualitative Disclosure
About Market Risk.”
27
Our
actual future production may be significantly higher or lower than we estimate
at the time we enter into derivative contracts for such period. If the actual
amount of production is higher than we estimate, we will have greater commodity
price exposure than we intended. If the actual amount of production is lower
than the notional amount that is subject to our derivative financial
instruments, we might be forced to satisfy all or a portion of our derivative
transactions without the benefit of the cash flow from our sale of the
underlying physical commodity, resulting in a substantial diminution of our
liquidity. As a result of these factors, our hedging activities may not be as
effective as we intend in reducing the volatility of our cash flows, and in
certain circumstances may actually increase the volatility of our cash flows. In
addition, our price risk management activities are subject to the following
risks:
|
|
·
a counterparty may not perform its obligation under the applicable
derivative instrument;
|
|
|
·
there may be a change in the expected differential between the underlying
commodity price in the derivative instrument and the actual price
received; and
|
|
|
·
the steps we take to monitor our derivative financial instruments may not
detect and prevent violations of our risk management policies and
procedures
|
|
|
|
If
the Asher lease is terminated or if Nami Resource LLC’s rights to production
under wells in which we have a contract right to receive proceeds from the sale
of production are adversely affected, we could lose our contract right to
receive proceeds from the sale of production or it could be adversely
affected.
|
|
|
Nami
Resources, LLC, a subsidiary of our Predecessor that was retained by our
founding unitholder, has been involved in an ongoing dispute with Asher Land and
Mineral Company, Ltd., (“Asher”), pursuant to which Asher claims that Nami
Resources Company, LLC did not correctly calculate the royalties paid to it and
that it failed to abide by certain terms of the leases relating to the
coordination of oil and gas development with coal development activities. As
part of our separation from Vinland, we received from Nami Resources Company,
LLC a contract right to receive approximately 99% of the net proceeds, after
deducting royalties paid to other parties, severance taxes, third-party
transportation costs, costs incurred in the operation of wells and overhead
costs, from the sale of production from certain producing oil and gas wells
located within the Asher lease, which accounted for 1.7% of our proved developed
reserves as of December 31, 2009. The Asher lease and the litigation
related thereto were retained by Nami Resources Company, LLC. If the Asher lease
is terminated or if Nami Resources Company, LLC rights to production under wells
in which we have a contract right to receive proceeds from the sale of
production are adversely affected, we could lose our contract right to receive
proceeds from the sale of production or it could be adversely
affected.
|
|
|
We
are exposed to trade credit risk in the ordinary course of our business
activities.
We are
exposed to risks of loss in the event of nonperformance by our vendors,
customers and by counterparties to our price risk management arrangements. Some
of our vendors, customers and counterparties may be highly leveraged and subject
to their own operating and regulatory risks. Many of our vendors, customers and
counterparties finance their activities through cash flow from operations, the
incurrence of debt or the issuance of equity. Recently, there has been a
significant decline in the credit markets and the availability of credit.
Additionally, many of our vendors’, customers’ and counterparties' equity values
have substantially declined. The combination of reduction of cash
flow resulting from declines in commodity prices and the lack of availability of
debt or equity financing may result in a significant reduction in our vendors’,
customers’ and counterparties' liquidity and ability to make payments or perform
on their obligations to us. Even if our credit review and analysis
mechanisms work properly, we may experience financial losses in our dealings
with other parties. Any increase in the nonpayment or nonperformance by our
vendors, customers and/or counterparties could reduce our ability to make
distributions to our unitholders.
We
depend on senior management personnel, each of whom would be difficult to
replace.
We
depend on the performance of Scott W. Smith, our President and Chief Executive
Officer, Richard A. Robert, our Executive Vice President and Chief Financial
Officer and Britt Pence, our Vice President of Engineering. We maintain no key
person insurance for either Mr. Smith, Mr. Robert or Mr. Pence.
The loss of any or all of Messrs. Smith, Robert and Pence could negatively
impact our ability to execute our strategy and our results of
operations.
28
We
may be unable to compete effectively with larger companies, which may adversely
affect our ability to generate sufficient revenue to allow us to pay
distributions to our unitholders.
The
natural gas and oil industry is intensely competitive, and we compete with other
companies that have greater resources. Our ability to acquire additional
properties and to discover reserves in the future will be dependent upon our
ability to evaluate and select suitable properties and to consummate
transactions in a highly competitive environment. Many of our larger competitors
not only drill for and produce natural gas, natural gas liquids and oil, but
also carry on refining operations and market petroleum and other products on a
regional, national or worldwide basis. These companies may be able to pay more
for natural gas and oil properties and evaluate, bid for and purchase a greater
number of properties than our financial or human resources permit. In addition,
these companies may have a greater ability to continue drilling activities
during periods of low natural gas, natural gas liquids and oil prices and to
absorb the burden of present and future federal, state, local and other laws and
regulations. Our inability to compete effectively with larger companies could
have a material adverse impact on our business activities, financial condition
and results of operations.
We
are subject to complex federal, state, local and other laws and regulations that
could adversely affect the cost, manner or feasibility of doing
business.
Our
operations are regulated extensively at the federal, state and local levels.
Environmental and other governmental laws and regulations have increased the
costs to plan, design, drill, install, operate and abandon natural gas and oil
wells. Under these laws and regulations, we could also be liable for personal
injuries, property and natural resource damage and other damages. Failure to
comply with these laws and regulations may result in the suspension or
termination of our operations and subject us to administrative, civil and
criminal penalties. Moreover, public interest in environmental protection has
increased in recent years, and environmental organizations have opposed, with
some success, certain drilling projects.
Part of
the regulatory environment in which we operate includes, in some cases, legal
requirements for obtaining environmental assessments, environmental impact
studies and/or plans of development before commencing drilling and production
activities. In addition, our activities are subject to the regulations regarding
conservation practices and protection of correlative rights. These regulations
affect our operations and limit the quantity of natural gas we may produce and
sell. A major risk inherent in our drilling plans is the need to obtain drilling
permits from state and local authorities. Delays in obtaining regulatory
approvals or drilling permits, the failure to obtain a drilling permit for a
well or the receipt of a permit with unreasonable conditions or costs could have
a material adverse effect on our ability to develop our properties.
Additionally, the natural gas and oil regulatory environment could change in
ways that might substantially increase the financial and managerial costs of
compliance with these laws and regulations and, consequently, adversely affect
our profitability. At this time, we cannot predict the effect of this increase
on our results of operations. Furthermore, we may be put at a competitive
disadvantage to larger companies in our industry that can spread these
additional costs over a greater number of wells and larger operating staff.
Please read “Item1—Business—Operations—Environmental Matters and Regulation” and
“Business—Operations—Other Regulation of the Natural Gas and Oil Industry” for a
description of the laws and regulations that affect us.
Shortages
of drilling rigs, supplies, oilfield services, equipment and crews could delay
our operations and reduce our cash available for distribution.
Higher
natural gas, natural gas liquids and oil prices generally increase the demand
for drilling rigs, supplies, services, equipment and crews, and can lead to
shortages of, and increasing costs for, drilling equipment, services and
personnel. In the past, we and other natural gas, natural gas liquids and oil
companies have experienced higher drilling and operating costs. Shortages of, or
increasing costs for, experienced drilling crews and equipment and services
could restrict our ability to drill the wells and conduct the operations that we
currently have planned. Sustained periods of lower natural gas, natural gas
liquids and oil prices could bring about the closure or downsizing of entities
providing drilling services, supplies, oil field services, equipment and crews.
Any delay in the drilling of new wells or significant increase in drilling costs
could reduce our revenues and cash available for distribution.
|
|
Risks
Related to Our Structure
|
|
|
|
Mr. Nami,
who together with certain of his affiliates and related persons, own
approximately 15.2% of our outstanding common units and may have conflicts of
interest with us. The ultimate resolution of any such conflict of interest may
result in favoring the interests of these other parties over our unitholders’
and may be to our detriment. Our limited liability company agreement limits the
remedies available to our unitholders in the event unitholders have a claim
relating to conflicts of interest.
Conflicts
of interest may arise between Nami and his affiliates, including Vinland, on the
one hand, and us and our unitholders, on the other hand. These potential
conflicts may relate to the divergent interests of these parties. Situations in
which the interests of Nami and his affiliates, including Vinland may differ
from interests of owners of units include, among others, the following
situations:
29
|
·
|
none
of our limited liability company agreement, management services agreement,
participation agreement nor any other agreement requires Nami or any
of his affiliates, including Vinland, to pursue a business strategy that
favors us. Directors and officers of Vinland and its subsidiaries have a
fiduciary duty while acting in the capacity as such director or officer of
Vinland or such subsidiary to make decisions in the best interests of the
members or stockholders of Vinland, which may be contrary to our best
interests;
|
|
·
|
we
rely on Vinland to operate and develop our properties in
Appalachia;
|
|
·
|
we
depend on Vinland to gather, compress, deliver and provide services
necessary for us to market our natural gas in Appalachia;
and
|
|
·
|
Nami
and his affiliates, including Vinland, are not prohibited from investing
or engaging in other businesses or activities that compete with
us.
|
|
|
|
If in
resolving conflicts of interest that exist or arise in the future our board of
directors or officers, as the case may be, satisfy the applicable standards set
forth in our limited liability company agreement for resolving conflicts of
interest, unitholders will not be able to assert that such resolution
constituted a breach of fiduciary duty owed to us or to unitholders by our board
of directors and officers.
We
may issue additional units without unitholder approval, which would dilute their
existing ownership interests.
We may
issue an unlimited number of limited liability company interests of any type,
including units, without the approval of our unitholders.
The
issuance of additional units or other equity securities may have the following
effects:
|
·
|
the
proportionate ownership interest of unitholders in us may
decrease;
|
|
·
|
the
amount of cash distributed on each unit may decrease;
|
|
·
|
the
relative voting strength of each previously outstanding unit may be
diminished; and
|
|
·
|
the
market price of the units may
decline.
|
Our
limited liability company agreement restricts the voting rights of unitholders
owning 20% or more of our units.
Our
limited liability company agreement restricts the voting rights of unitholders
by providing that any units held by a person that owns 20% or more of any class
of units then outstanding, other than our founding unitholder and his affiliates
or transferees and persons who acquire such units with the prior approval of the
board of directors, cannot vote on any matter. Our limited liability agreement
also contains provisions limiting the ability of unitholders to call meetings or
to acquire information about our operations, as well as other provisions
limiting unitholders’ ability to influence the manner or direction of
management.
Our
limited liability company agreement provides for a limited call right that may
require unitholders to sell their units at an undesirable time or
price.
If, at
any time, any person owns more than 90% of the units then outstanding, such
person has the right, but not the obligation, which it may assign to any of its
affiliates or to us, to acquire all, but not less than all, of the remaining
units then outstanding at a price not less than the then-current market price of
the units. As a result, unitholders may be required to sell their units at an
undesirable time or price and therefore may receive a lower or no return on
their investment. Unitholders may also incur tax liability upon a sale of their
units.
The
price of our common units could be subject to wide fluctuations, unitholders
could lose a significant part of their investment.
During
2009, our unit price increased from a closing low of $6.35 on January 2, 2009 to
a closing high of $22.07 on December 31, 2009. The market price of our common
units is subject to wide fluctuations in response to a number of factors, most
of which we cannot control, including:
30
|
·
|
fluctuations
in broader securities market prices and volumes, particularly among
securities of natural gas and oil companies and securities of publicly
traded limited partnerships and limited liability
companies;
|
|
·
|
changes
in general conditions in the U.S. economy, financial markets or the
natural gas and oil industry;
|
|
·
|
changes
in securities analysts’ recommendations and their estimates of our
financial performance;
|
|
·
|
the
public’s reaction to our press releases, announcements and our filings
with the SEC;
|
|
·
|
changes
in market valuations of similar companies;
|
|
·
|
departures
of key personnel;
|
|
·
|
commencement
of or involvement in litigation;
|
|
·
|
variations
in our quarterly results of operations or those of other natural gas and
oil companies;
|
|
·
|
variations
in the amount of our quarterly cash distributions; and
|
|
·
|
future
issuances and sales of our units.
|
|
|
|
In recent
years, the securities market has experienced extreme price and volume
fluctuations. This volatility has had a significant effect on the market price
of securities issued by many companies for reasons unrelated to the operating
performance of these companies. Future market fluctuations may result in a lower
price of our common units.
|
|
Unitholders
may have liability to repay
distributions.
|
|
|
|
Under
certain circumstances, unitholders may have to repay amounts wrongfully returned
or distributed to them. Under Section 18-607 of the Delaware Revised
Limited Liability Company Act, or the “Delaware Act,” we may not make a
distribution to unitholders if the distribution would cause our liabilities to
exceed the fair value of our assets. Delaware law provides that for a period of
three years from the date of an impermissible distribution, members or
unitholders who received the distribution and who knew at the time of the
distribution that it violated Delaware law will be liable to the limited
liability company for the distribution amount. A purchaser of common units who
becomes a member or unitholder is liable for the obligations of the transferring
member to make contributions to the limited liability company that are known to
such purchaser of units at the time it became a member and for unknown
obligations if the liabilities could be determined from our limited liability
company agreement.
|
|
An
increase in interest rates may cause the market price of our common units
to decline.
|
|
|
|
Like all
equity investments, an investment in our common units is subject to certain
risks. In exchange for accepting these risks, investors may expect to receive a
higher rate of return than would otherwise be obtainable from lower-risk
investments. Accordingly, as interest rates rise, the ability of investors to
obtain higher risk-adjusted rates of return by purchasing government-backed debt
securities may cause a corresponding decline in demand for riskier investments
generally, including yield-based equity investments such as publicly-traded
limited liability company interests. Reduced demand for our units resulting from
investors seeking other more favorable investment opportunities may cause the
trading price of our common units to decline.
|
|
Tax
Risks to Unitholders
|
|
|
|
Our
tax treatment depends on our status as a partnership for federal income tax
purposes, as well as our not being subject to a material amount of entity-level
taxation by individual states. If the IRS were to treat us as a corporation for
federal income tax purposes or we were to become subject to additional amounts
of entity-level taxation for state tax purposes, taxes paid, if any, would
reduce the amount of cash available for distribution to
unitholders.
The
anticipated after-tax economic benefit of an investment in our units depends
largely on our being treated as a partnership for federal income tax purposes.
We have not requested, and do not plan to request, a ruling from the IRS on this
or any other tax matter that affects us.
Despite
the fact that we are a limited liability company (LLC) under Delaware law, it is
possible in certain circumstances for an LLC such as ours to be treated as a
corporation for federal income tax purposes. Although we do not believe
based upon our current operations that we are so treated, a change in our
business (or a change in current law) could cause us to be treated as a
corporation for federal income tax purposes or otherwise subject us to taxation
as an entity.
31
If we
were treated as a corporation for federal income tax purposes, we would pay
federal income tax on our taxable income at the corporate tax rates, currently
at a maximum rate of 35%, and would likely pay state income tax at varying
rates. Distributions to unitholders would generally be taxed again as corporate
distributions, and no income, gain, loss, deduction or credit would flow through
to unitholders. Because a tax may be imposed on us as a corporation, our cash
available for distribution to our unitholders could be reduced. Therefore,
treatment of us as a corporation would result in a material reduction in the
anticipated cash flow and after-tax return to our unitholders, likely causing a
substantial reduction in the value of our common units.
Current
law or our business may change so as to cause us to be treated as a corporation
for federal income tax purposes or otherwise subject us to entity-level
taxation. At the federal level, legislation has been recently considered that
would have eliminated partnership tax treatment for certain publicly traded
LLCs. Although such legislation would not have appeared to have applied to
us as currently proposed, it could be reconsidered in a manner that would apply
to us. We are unable to predict whether any of these changes or other
proposals will be reintroduced or will ultimately be enacted. Moreover,
any modification to the federal income tax laws and interpretations thereof may
or may not be applied retroactively. Any such changes could negatively
impact the value of an investment in our units. At the state level,
because of widespread state budget deficits and other reasons, several states
are evaluating ways to subject partnerships and limited liability companies to
entity-level taxation through the imposition of state income, franchise or other
forms of taxation. For example, we are required to pay Texas
franchise tax which is assessed on Texas sourced taxable margin defined as the
lesser of (i) 70% of total revenue or (ii) total revenue less
(a) cost of goods sold or (b) compensation and benefits. If any
other state were to impose a tax upon us as an entity, the cash available for
distribution to unitholders would be reduced.
If
the IRS contests the federal income tax positions we take, the market for our
units may be adversely impacted and the costs of any IRS contest will reduce our
cash available for distribution.
We have
not requested a ruling from the IRS with respect to our treatment as a
partnership for federal income tax purposes or any other matter that affects us.
The IRS may adopt positions that differ from the positions we take. It may be
necessary to resort to administrative or court proceedings to sustain some or
all of the positions we take and a court may disagree with some or all of those
positions. Any contest with the IRS may materially and adversely impact the
market for our units and the price at which they trade. In addition, our costs
of any contest with the IRS will result in a reduction in cash available for
distribution to our unitholders and thus will be borne indirectly by our
unitholders.
|
|
Unitholders
may be required to pay taxes on income from us even if they do not receive
any cash distributions from us.
|
|
|
|
Because
our unitholders will be treated as partners to whom we will allocate taxable
income which could be different in amount than the cash we distribute,
unitholders will be required to pay federal income taxes and, in some cases,
state and local income taxes on their share of our taxable income, whether or
not they receive cash distributions from us. Unitholders may not receive cash
distributions from us equal to their share of our taxable income or even equal
to the actual tax liability that results from their share of our taxable
income.
|
|
Tax
gain or loss on disposition of our common units could be more or less than
expected.
|
|
|
|
If
unitholders sell their common units, they will recognize a gain or loss equal to
the difference between the amount realized and their tax basis in those common
units. Because distributions in excess of a unitholder’s allocable share of our
net taxable income decreases the tax basis in the unitholder’s common units, the
amount, if any, of such prior excess distributions with respect to the units
they sell will, in effect, become taxable income to them if they sell such units
at a price greater than their tax basis in those units, even if the price they
receive is less than their original cost. Furthermore, a substantial portion of
the amount realized, whether or not representing gain, may be taxed as ordinary
income due to potential recapture items, including depreciation recapture. In
addition, because the amount realized includes a unitholder’s share of our
nonrecourse liabilities, if a unitholders sells their units, they may incur a
tax liability in excess of the amount of cash they receive from the
sale.
Tax-exempt
entities and non-U.S. persons face unique tax issues from owning units that may
result in adverse tax consequences to them.
Investment
in units by tax-exempt entities, including employee benefit plans and individual
retirement accounts (known as IRAs), and non-U.S. persons raises issues unique
to them. For example, virtually all of our income allocated to organizations
exempt from federal income tax, including IRAs and other retirement plans, will
be unrelated business taxable income and will be taxable to such a unitholder.
Distributions to non-U.S. persons will be reduced by withholding taxes imposed
at the highest effective applicable tax rate, and non-U.S. persons will be
required to file United States federal income tax returns and pay tax on their
share of our taxable income. If you are a tax exempt entity or a non-U.S.
person, you should consult your tax advisor before investing in our
units.
32
We
treat each purchaser of our common units as having the same tax benefits without
regard to the actual units purchased. The IRS may challenge this treatment,
which could adversely affect the value of the common units.
Because
we cannot match transferors and transferees of common units and because of other
reasons, we will adopt depreciation and amortization positions that may not
conform with all aspects of existing Treasury Regulations. A successful IRS
challenge to those positions could adversely affect the amount of tax benefits
available to our unitholders. It also could affect the timing of these tax
benefits or the amount of gain on the sale of common units and could have a
negative impact on the value of our common units or result in audits of and
adjustments to our unitholders’ tax returns.
We
prorate our items of income, gain, loss and deduction between transferors and
transferees of our units each month based upon the ownership of our units on the
first day of each month, instead of on the basis of the date a particular unit
is transferred. The IRS may challenge this treatment, which could change the
allocation of items of income, gain, loss and deduction among our
unitholders.
We
prorate our items of income, gain, loss and deduction between transferors and
transferees of our units each month based upon the ownership of our units on the
first day of each month, instead of on the basis of the date a particular unit
is transferred. The use of this proration method may not be permitted under
existing Treasury Regulations. If the IRS were to challenge this method or new
Treasury Regulations were issued, we may be required to change the allocation of
items of income, gain, loss and deduction among our unitholders.
A
unitholder whose units are loaned to a “short seller” to cover a short sale of
units may be considered as having disposed of those units. If so, he would no
longer be treated for tax purposes as a partner with respect to those units
during the period of the loan and may recognize gain or loss from the
disposition.
Because a
unitholder whose units are loaned to a “short seller” to cover a short sale of
units may be considered as having disposed of the loaned units, he may no longer
be treated for tax purposes as a partner with respect to those units during the
period of the loan to the short seller and the unitholder may recognize gain or
loss from such disposition. Moreover, during the period of the loan to the short
seller, any of our income, gain, loss or deduction with respect to those units
may not be reportable by the unitholder and any cash distributions received by
the unitholder as to those units could be fully taxable as ordinary income.
Unitholders desiring to assure their status as partners and avoid the risk of
gain recognition from a loan to a short seller are urged to modify any
applicable brokerage account agreements to prohibit their brokers from borrowing
their units.
The
sale or exchange of 50% or more of our capital and profits interests during any
twelve-month period will result in the termination of our partnership for
federal income tax purposes.
We will
be considered to have terminated for federal income tax purposes if there is a
sale or exchange of 50% or more of the total interests in our capital and
profits within a twelve-month period. For purposes of determining whether the
50% threshold has been met, multiple sales of the same interest will be counted
only once. Our termination would, among other things, result in the closing of
our taxable year for all unitholders, which would result in us filing two tax
returns (and our unitholders could receive two Schedules K-1) for one fiscal
year and could result in a deferral of depreciation deductions allowable in
computing our taxable income. In the case of a unitholder reporting on a
taxable year other than a fiscal year ending December 31, the closing of
our taxable year may also result in more than twelve months of our taxable
income or loss being includable in his taxable income for the year of
termination. Our termination currently would not affect our classification
as a partnership for federal income tax purposes. If treated as a new
partnership, we must make new tax election and could be subject to penalties if
we are unable to determine that a termination occurred.
As
a result of investing in our common units, you may become subject to state and
local taxes and return filing requirements in jurisdictions where we operate or
own or acquire property.
In
addition to federal income taxes, you will likely be subject to other taxes,
including foreign, state and local taxes, unincorporated business taxes and
estate, inheritance or intangible taxes that are imposed by the various
jurisdictions in which we conduct business or own property now or in the future,
even if you do not live in any of those jurisdictions. You will likely be
required to file foreign, state and local income tax returns and pay state and
local income taxes in some or all of these various jurisdictions. Further,
you may be subject to penalties for failure to comply with those
requirements. We currently own property and conduct business in Kentucky,
New Mexico, Tennessee and Texas. Each of these states, other than Texas,
imposes an income tax on individuals. Most of these states also impose an
income tax on corporations and other entities. As we make acquisitions or
expand our business, we may own assets or conduct business in additional states
that impose a personal income tax. It is your responsibility to file all
United States federal, foreign, state and local tax returns.
33
None.
A
description of our properties is included in Part I— Item 1— Business,
and is incorporated herein by reference.
We
believe that we have satisfactory title to the properties owned and used in our
businesses, subject to liens for taxes not yet payable, liens incident to minor
encumbrances, liens for credit arrangements and easements and restrictions that
do not materially detract from the value of these properties, our interests in
these properties, or the use of these properties in our businesses. We believe
that our properties are adequate and suitable for the conduct of our business in
the future.
Although
we may, from time to time, be involved in litigation and claims arising out of
our operations in the normal course of business, we are not currently a party to
any material legal proceedings. In addition, we are not aware of any legal or
governmental proceedings against us, or contemplated to be brought against us,
under the various environmental protection statutes to which we are
subject.
Nami
Resources Company, LLC, a subsidiary of our Predecessor that was retained by our
founding unitholder in connection with the Restructuring, has been involved in
an ongoing dispute with Asher Land and Mineral Company, Ltd., or Asher, pursuant
to which Asher claims, among other things, that Nami Resources Company, LLC did
not correctly calculate the royalties paid to it and that it failed to abide by
certain terms of the leases relating to the coordination of oil and gas
development with coal development activities.
On
September 8, 2006, Asher filed a complaint in Kentucky state court
initiating an action styled
Asher Land and Mineral, Ltd. v. Nami Resources Company, LLC, Bell Circuit
Court, Civil Action No. 06-CI-00417. In that action, Asher sought monetary
damages and court-ordered rescission of the leases. Before a responsive pleading
was filed, Asher voluntarily withdrew its complaint and dismissed the case. On
December 15, 2006, Asher filed a new action styled Asher Land and Mineral, Ltd. v.
Nami Resources Company, LLC, Bell Circuit Court, Civil Action
No. 06-CI-00566. In that action, Asher has made the same allegations as in
the prior suit and added a claim for an undetermined amount of punitive damages.
The parties have exchanged limited initial discovery requests.
On
August 29, 2007, Asher filed a motion to add additional defendants to the
action cited above, including Vanguard Natural Resources, LLC, Vanguard Natural
Gas, LLC and Trust Energy Company, LLC. The Company has filed several motions to
be dismissed from this action but to date is still a named defendant in this
case. Since that time, no discovery has been sought from the Company by Asher.
We have retained separate counsel to represent us in this case as it progresses
and intend to continue to vigorously defend the action.
We
received a contract right to receive approximately 99% of the net proceeds from
the sale of production from certain producing oil and gas wells located within
the Asher lease, which accounted for approximately 1.7% of our estimated proved
developed reserves as of December 31, 2009. We did not receive an
assignment of any working interest in the Asher lease. The Asher lease and the
litigation related thereto were retained by Nami Resources Company, LLC. If the
Asher lease is terminated or if Nami Resources Company, LLC’s rights to
production under wells of which we have contract rights to receive proceeds are
adversely affected, we could lose our contract rights to receive such proceeds
or it could be adversely affected.
Nami
Resources Company, LLC and Vinland have agreed to indemnify us for all
liabilities, judgments and damages that may arise in connection with the
litigation referenced above as well as providing for the defense of any such
claims. The indemnities agreed to by Nami Resources Company, LLC and
Vinland will remain in place until the resolution of the Asher
litigation.
ITEM 5. MARKET FOR REGISTRANT’S
COMMON UNITS, RELATED STOCKHOLDER MATTERS AND ISSUER PURCHASES OF EQUITY
SECURITIES
34
Our
common units are traded on the New York Stock Exchange under the symbol “VNR.”
On March 1, 2010, there were 18,416,173 common units outstanding and
approximately twelve unitholders, which does not include beneficial owners whose
units are held by a clearing agency, such as a broker or a bank. On
March 1, 2010, the market price for our common units was $24.90 per unit,
resulting in an aggregate market value of units held by non-affiliates of
approximately $389,091,708. The following table presents the high and low
sales price for our common units during the periods indicated.
|
Common Units
|
||||||||
|
High
|
Low
|
|||||||
|
2009
|
||||||||
|
Fourth
Quarter
|
$ | 22.80 | $ | 14.47 | ||||
|
Third
Quarter
|
$ | 16.73 | $ | 11.97 | ||||
|
Second
Quarter
|
$ | 15.15 | $ | 9.88 | ||||
|
First
Quarter
|
$ | 11.24 | $ | 5.90 | ||||
|
2008
|
||||||||
|
Fourth
Quarter
|
$ | 12.00 | $ | 4.62 | ||||
|
Third
Quarter
|
$ | 16.75 | $ | 11.70 | ||||
|
Second
Quarter
|
$ | 18.55 | $ | 15.30 | ||||
|
First
Quarter
|
$ | 17.25 | $ | 13.55 | ||||
Stock Performance Graph. The
performance graph below compares total unitholder return on our units, with the
total return of the Standard & Poor’s 500 Index, or “S&P 500 Index”
and our Peer Group Index, a weighted composite of nine natural gas and oil
production publicly traded partnerships for 2007 and 2008. For 2009, the Peer
Group Index was a weighted composite of five natural gas and oil production
publicly traded partnerships, which were paying a distribution for all of 2009.
Total return includes the change in the market price, adjusted for reinvested
dividends or distributions, for the period shown on the performance graph and
assumes that $100 was invested in VNR at the last reported sale price of units
as reported by New York Stock Exchange ($18.94) on October 24, 2007 (the
day trading of units commenced), and in the S&P 500 Index and our peer group
index on the same date. The results shown in the graph below are not
necessarily indicative of future performance.
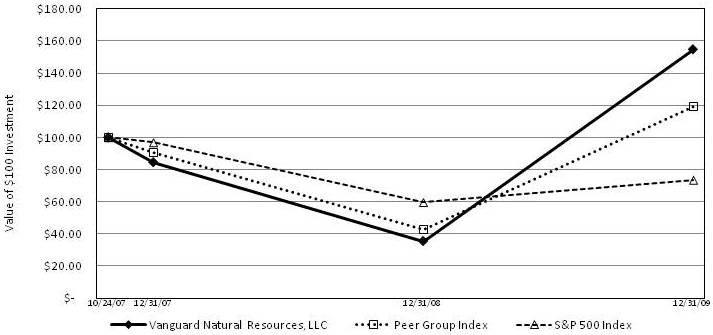
|
|
October 24, 2007
|
December 31, 2007
|
December 31, 2008
|
December 31, 2009
|
||||||||||||
|
Vanguard
Natural Resources, LLC
|
$
|
100
|
$
|
84.48
|
(1)
|
$
|
35.37
|
(1)
|
$
|
154.88
|
(1)
|
|||||
|
Peer
Group Index
|
$
|
100
|
$
|
90.76
|
$
|
42.75
|
$
|
119.50
|
||||||||
|
S&P
500 Index
|
$
|
100
|
$
|
96.87
|
$
|
59.59
|
$
|
73.56
|
||||||||
|
(1)
|
Based
on the last reported sale price of VNR units as reported by New York Stock
Exchange on December 31, 2007 ($16.00), 2008 ($5.90) and 2009
($22.07).
|
35
Distributions
Declared. The following table shows the amount per unit, record date
and payment date of the quarterly cash distributions we paid on each of our
common units for each period presented. Future distributions are at the
discretion of our board of directors and will depend on business conditions,
earnings, our cash requirements and other relevant factors.
|
Cash Distributions
|
||||||
|
Per Unit
|
Record Date
|
Payment Date
|
||||
|
2009
|
||||||
|
Fourth
Quarter
|
$
|
0.525
|
February
5, 2010
|
February
12, 2010
|
||
|
Third
Quarter
|
$
|
0.500
|
November 6,
2009
|
November
13, 2009
|
||
|
Second
Quarter
|
$
|
0.500
|
July
31, 2009
|
August
14, 2009
|
||
|
First
Quarter
|
$
|
0.500
|
April
30, 2009
|
May
15, 2009
|
||
|
2008
|
||||||
|
Fourth
Quarter
|
$
|
0.500
|
January
30, 2009
|
February
17, 2009
|
||
|
Third
Quarter
|
$
|
0.500
|
October
31, 2008
|
November
14, 2008
|
||
|
Second
Quarter
|
$
|
0.445
|
July
31, 2008
|
August
14, 2008
|
||
|
First
Quarter
|
$
|
0.445
|
April
30, 2008
|
May15,
2008
|
||
|
|
|
Our
limited liability company agreement requires that, within 45 days after the end
of each quarter, we distribute all of our available cash to unitholders of
record on the applicable record date. Available cash generally means, for any
quarter ending prior to liquidation:
|
|
(a) the
sum of:
|
|
|
|
|
(i)
|
all
our and our subsidiaries’ cash and cash equivalents (or our proportionate
share of cash and cash equivalents in the case of subsidiaries that are
not wholly-owned) on hand at the end of that quarter;
and
|
|
|
(ii)
|
all
our and our subsidiaries’ additional cash and cash equivalents (or our
proportionate share of cash and cash equivalents in the case of
subsidiaries that are not wholly-owned) on hand on the date of
determination of available cash for that quarter resulting from working
capital borrowings made subsequent to the end of such
quarter,
|
|
|
|
|
|
(b) less
the amount of any cash reserves established by the board of directors (or
our proportionate share of cash and cash equivalents in the case of
subsidiaries that are not wholly-owned)
to:
|
|
|
|
|
(i)
|
provide
for the proper conduct of our or our subsidiaries’ business (including
reserves for future capital expenditures, including drilling and
acquisitions, and for our and our subsidiaries’ anticipated future credit
needs);
|
|
|
(ii)
|
comply
with applicable law or any loan agreement, security agreement, mortgage,
debt instrument or other agreement or obligation to which we or any of our
subsidiaries is a party or by which we are bound or our assets are
subject; or
|
|
|
(iii)
|
provide
funds for distributions to our unitholders with respect to any one or more
of the next four quarters;
|
|
|
|
provided
that disbursements made by us or any of our subsidiaries or cash reserves
established, increased or reduced after the end of a quarter but on or before
the date of determination of available cash for that quarter shall be deemed to
have been made, established, increased or reduced, for purposes of determining
available cash, within that quarter if the board of directors so
determines.
Equity Compensation
Plans. See
Item 12— "Security Ownership of Certain Beneficial Owners and Management and
Related Stockholder Matters" for information regarding our equity compensation
plans as of December 31, 2009.
Unregistered
Sale of Equity Securities and Use of Proceeds. During the three
months ended December 31, 2009, one of our wholly-owned subsidiaries purchased
31,000 of our common units on the open market at the prevailing market price.
The following table summarizes the unit purchases that occurred during the three
months ended December 31, 2009:
36
|
Period
|
Number of common units
repurchased
|
Average price paid per common
unit
|
||||||
|
October
1, 2009 to October 31, 2009
|
10,000 | $ | 17.54 | |||||
|
November
1, 2009 to November 30, 2009
|
11,000 | $ | 17.15 | |||||
|
December
1, 2009 to December 31, 2009
|
10,000 | $ | 18.24 | |||||
|
Total
common units purchased
|
31,000 | $ | 17.63 | |||||
Set forth
below is our summary of our consolidated financial and operating data for the
periods indicated for Vanguard Natural Resources, LLC and our Predecessor. The
historical financial data for the years ended December 31, 2005 and 2006
and the balance sheet data as of December 31, 2005 and 2006 have been
derived from the audited financial statements of our Predecessor.
|
|
Comparability
of Our Financial Statements to Our
Predecessor
|
|
|
|
The
historical financial statements of our Predecessor included in this Annual
Report may not be comparable to our results of operations for the following
reasons:
|
·
|
On
April 18, 2007, but effective January 5, 2007, we conveyed to Vinland 60%
of our Predecessor’s working interest in the known producing horizons in
approximately 95,000 gross undeveloped acres in the AMI, 100% of our
Predecessor’s interest in an additional 125,000 undeveloped acres and
certain coalbed methane rights located in the Appalachian Basin, the
rights to any natural gas and oil located on our acreage at depths above
and 100 feet below our known producing horizons and all of our gathering
and compression assets. In addition, all of the employees except, our
President and Chief Executive Officer and Executive Vice-President and
Chief Financial Officer, were transferred to Vinland.
|
|
|
·
|
On
April 18, 2007, but effective January 5, 2007, we entered into a
management services agreement and a gathering and compression agreement
with Vinland which fixed a portion of our production costs for wells owned
in the area of mutual interest.
|
|
|
·
|
Our
Predecessor did not account for its derivative instruments as cash flow
hedges under ASC Topic 815 “Derivatives and Hedging” (“ASC Topic 815”) as
we did in 2007. Accordingly, the changes in the fair value of its
derivative instruments were reflected in earnings for all periods prior to
2007 and in other comprehensive income (loss) for the year ended
December 31, 2007. In 2008 and 2009, unrealized gains and losses were
recorded in earnings as all commodity and interest rate derivative
contracts were either de-designated as cash flow hedges or they failed to
meet the hedge documentation requirements for cash flow
hedges.
|
The
selected financial data should be read together with Part II— Item 7—
Management’s Discussion and Analysis of Financial Condition and Results of
Operations and Part II— Item 8— Financial Statements and Supplementary
Data included in this Annual Report.
The
following table presents a non-GAAP financial measure, adjusted EBITDA, which we
use in our business. This measure is not calculated or presented in accordance
with generally accepted accounting principles, or GAAP. We explain this measure
below and reconcile it to the most directly comparable financial measure
calculated and presented in accordance with GAAP in “Non-GAAP Financial
Measure.”
37
|
Year Ended December 31,
(6) (7) (8) (9)
|
||||||||||||||||||||
|
Vanguard
|
Vanguard
Predecessor
|
|||||||||||||||||||
|
(in thousands,
except per unit data)
|
2009
|
2008
|
2007
|
2006
|
2005
|
|||||||||||||||
|
Statement
of Operations Data:
|
||||||||||||||||||||
|
Revenues:
|
||||||||||||||||||||
|
Natural gas, natural gas liquids
and oil sales
|
$
|
46,035
|
$
|
68,850
|
$
|
34,541
|
$
|
38,184
|
$
|
40,299
|
||||||||||
|
Gain (loss) on commodity cash flow hedges (1)
|
(2,380
|
)
|
269
|
(702
|
)
|
—
|
—
|
|||||||||||||
|
Realized
gain (loss) on other commodity derivative contracts (1)
|
29,993
|
(6,552
|
)
|
—
|
(2,208
|
)
|
(10,024
|
)
|
||||||||||||
|
Unrealized gain (loss) on other
commodity derivative contracts (1)
|
(19,043
|
)
|
39,029
|
—
|
17,748
|
(18,779
|
)
|
|||||||||||||
|
Other
|
—
|
—
|
—
|
665
|
451
|
|||||||||||||||
|
Total
revenues
|
54,605
|
101,596
|
33,839
|
54,389
|
11,947
|
|||||||||||||||
|
Costs
and Expenses:
|
||||||||||||||||||||
|
Lease operating
expenses
|
12,652
|
11,112
|
5,066
|
4,896
|
4,607
|
|||||||||||||||
|
Depreciation, depletion, amortization and accretion
|
14,610
|
14,910
|
8,981
|
8,633
|
6,189
|
|||||||||||||||
|
Impairment of natural gas and
oil properties
|
110,154
|
58,887
|
—
|
—
|
—
|
|||||||||||||||
|
Selling, general and
administrative expenses
|
10,644
|
(2)
|
6,715
|
(2)
|
3,507
|
5,199
|
5,946
|
|||||||||||||
|
Bad debt expense
|
—
|
—
|
1,007
|
—
|
—
|
|||||||||||||||
|
Production and other
taxes
|
3,845
|
4,965
|
2,054
|
1,774
|
1,249
|
|||||||||||||||
|
Total costs and
expenses
|
151,905
|
96,589
|
20,615
|
20,502
|
17,991
|
|||||||||||||||
|
Income
(Loss) from Operations:
|
(97,300
|
)
|
5,007
|
13,224
|
33,887
|
(6,044
|
)
|
|||||||||||||
|
Other
Income and (Expenses):
|
||||||||||||||||||||
|
Interest
income
|
—
|
17
|
62
|
40
|
52
|
|||||||||||||||
|
Interest and financing
expenses
|
(4,276
|
)
|
(5,491
|
)
|
(8,135
|
)
|
(7,372
|
)
|
(4,566
|
)
|
||||||||||
|
Gain
on acquisition of natural gas and oil properties
|
6,981
|
—
|
—
|
—
|
—
|
|||||||||||||||
|
Realized loss on interest rate
derivative contracts
|
(1,903
|
)
|
(107
|
)
|
—
|
—
|
—
|
|||||||||||||
|
Unrealized
gain (loss) on interest rate derivative contracts
|
763
|
(3,178
|
)
|
—
|
—
|
—
|
||||||||||||||
|
Loss on extinguishment of debt
|
—
|
—
|
(2,502
|
)
|
—
|
—
|
||||||||||||||
|
Total other income
(expenses)
|
1,565
|
(8,759
|
)
|
(10,575
|
)
|
(7,332
|
)
|
(4,514
|
)
|
|||||||||||
|
Net
income (loss)
|
$
|
(95,735)
|
$
|
(3,752
|
)
|
$
|
2,649
|
$
|
26,555
|
$
|
(10,558
|
)
|
||||||||
|
Net
income (loss) per unit:
|
||||||||||||||||||||
|
Common and Class B units- basic & diluted
|
$
|
(6.74
|
)
|
$
|
(0.32
|
)
|
$
|
0.39
|
N/A (3)
|
N/A (3)
|
||||||||||
|
Distributions
declared per unit
|
$
|
2.00
|
$
|
1.77
|
(4)
|
$
|
0.425
|
(4)
|
N/A
(3)
|
N/A
(3)
|
||||||||||
|
Weighted
average common units outstanding
|
13,791
|
11,374
|
6,533
|
N/A (3)
|
N/A (3)
|
|||||||||||||||
|
Cash
Flow Data:
|
||||||||||||||||||||
|
Net cash provided by operating activities (1)
|
$
|
52,155
|
$
|
39,554
|
$
|
1,373
|
$
|
16,087
|
$
|
10,530
|
||||||||||
|
Net cash used in investing activities
|
(109,315
|
)
|
(119,539
|
)
|
(26,409
|
)
|
(37,383
|
)
|
(37,068
|
)
|
||||||||||
|
Net cash provided by financing activities
|
57,644
|
76,878
|
26,415
|
19,985
|
25,571
|
|||||||||||||||
|
Other
Financial Information:
|
||||||||||||||||||||
|
Adjusted EBITDA (5)
|
$
|
56,202
|
$
|
48,754
|
$
|
30,395
|
$
|
24,772
|
$
|
18,924
|
||||||||||
|
(1)
|
Natural
gas and oil derivative contracts were used to reduce our exposure to
changes in natural gas and oil prices. Prior to 2007, they were not
specifically designated as hedges under ASC Topic 815, thus the changes in
the fair value of commodity derivative contracts were marked to market in
our earnings. In 2007, we designated all commodity derivative contracts as
cash flow hedges; therefore, the changes in fair value in 2007 are
included in other comprehensive income (loss). In 2008, all commodity
derivative contracts were either de-designated as cash flow hedges or they
failed to meet the hedge documentation requirements for cash flow hedges.
As a result, (a) for the cash flow hedges that were settled in 2008 and
2009, the change in fair value through December 31, 2007 has been
reclassified to earnings from accumulated other comprehensive loss and is
classified as gain on commodity cash flow hedges and (b) the changes in
the fair value of other commodity derivative contracts are recorded in
earnings and classified as gain on other commodity derivative
contracts.
|
|
|
(2)
|
Includes
$2.9 million, $3.6 million and $2.1 million of non-cash unit-based
compensation expense in 2009, 2008 and 2007,
respectively.
|
|
|
(3)
|
No
dividends declared per unit and no calculations of earnings per unit and
weighted average units outstanding were made for the Vanguard Predecessor
as there was a single member interest prior to 2007.
|
|
|
(4)
|
Distributions
declared per unit for 2008 were calculated using total distributions to
members of $20.1 million over the weighted average common units for the
year. The 2007 distribution was pro-rated for the period from the closing
of the IPO on October 28, 2007 through December 31, 2007, resulting in a
distribution of $0.291 per unit for the period.
|
|
|
(5)
|
See
“Non-GAAP Financial Measure” below.
|
|
|
(6)
|
The
Permian acquisition closed on January 31, 2008 and, as such, only eleven
months of operations are included in the year ended December 31, 2008 and
were not included in the results of 2007, 2006 and
2005.
|
|
|
(7)
|
The
Dos Hermanos acquisition closed on July 28, 2008 and, as such, only five
months of operations are included in the year ended December 31, 2008 and
were not included in the results of 2007, 2006 and
2005.
|
|
|
(8)
|
The
Sun TSH acquisition closed on August 17, 2009 and, as such, only
approximately four and one half months of operations are included in the
year ended December 31, 2009 and were not included in the results of 2008,
2007, 2006 and 2005.
|
|
|
(9)
|
The
Ward County acquisition closed on December 2, 2009 and, as such, only one
month of operations is included in the year ended December 31, 2009 and no
operations are included in the results of 2008, 2007, 2006 and
2005.
|
|
38
|
As of December 31,
(1) (2)
|
||||||||||||||||||||
|
Vanguard
|
Vanguard
Predecessor
|
|||||||||||||||||||
|
(in thousands)
|
2009
|
2008
|
2007
|
2006
|
2005
|
|||||||||||||||
|
Balance
Sheet Data:
|
||||||||||||||||||||
|
Cash
and cash equivalents
|
$ | 487 | $ | 3 | $ | 3,110 | $ | 1,731 | $ | 3,041 | ||||||||||
|
Short-term
derivative assets
|
16,190 | 22,184 | 4,017 | — | — | |||||||||||||||
|
Other
current assets
|
11,566 | 9,691 | 4,826 | 20,438 | 19,598 | |||||||||||||||
|
Natural
gas and oil properties, net of accumulated depreciation, depletion,
amortization and accretion
|
172,525 | 182,269 | 106,983 | 104,684 | 83,513 | |||||||||||||||
|
Property,
plant and equipment, net of accumulated depreciation
|
174 | 184 | 166 | 11,873 | 4,104 | |||||||||||||||
|
Long-term
derivative assets
|
5,225 | 15,749 | 1,330 | — | — | |||||||||||||||
|
Other
assets
|
4,533 | 2,482 | 10,747 | — | — | |||||||||||||||
|
Total
Assets
|
$ | 210,700 | $ | 232,562 | $ | 131,179 | $ | 138,726 | $ | 110,256 | ||||||||||
|
Short-term
derivative liabilities
|
$ | 253 | $ | 486 | $ | — | $ | 2,022 | $ | 11,527 | ||||||||||
|
Other
current liabilities
|
12,166 | 7,278 | 5,355 | 11,505 | 12,033 | |||||||||||||||
|
Long-term
debt
|
129,800 | 135,000 | 37,400 | 94,068 | 72,708 | |||||||||||||||
|
Long-term
derivative liabilities
|
2,036 | 2,313 | 5,903 | — | 8,243 | |||||||||||||||
|
Other
long-term liabilities
|
6,159 | 2,134 | 190 | 418 | 212 | |||||||||||||||
|
Members’
equity
|
60,286 | 85,351 | 82,331 | 30,713 | 5,533 | |||||||||||||||
|
Total Liabilities and Members’ Equity
|
$ | 210,700 | $ | 232,562 | $ | 131,179 | $ | 138,726 | $ | 110,256 |
|
(1)
|
The
Permian acquisition closed on January 31, 2008 and the Dos Hermanos
acquisition closed on July 28, 2008.
|
|
|
(2)
|
The
Sun TSH acquisition closed on August 17, 2009 and the Ward County
acquisition closed on December 2,
2009.
|
Summary
Reserve and Operating Data
The
following tables show estimated net proved reserves based on a reserve report
prepared by our independent petroleum engineers, NSAI and D&M, and certain
summary unaudited information with respect to our production and sales of
natural gas, natural gas liquids and oil. You should refer to “Item 1A—Risk
Factors,” “Item 7—Management’s Discussion and Analysis of Financial Condition
and Results of Operations,” “Item 1—Business—Natural Gas, Natural Gas Liquids
and Oil Data—Proved Reserves” and “—Production and Price History” included in
this Annual Report in evaluating the material presented below.
39
|
As
of
December
31,
2009
|
As
of
December
31,
2008
|
|||||||
|
Reserve
Data:
|
||||||||
|
Estimated
net proved reserves:
|
||||||||
|
Natural
gas (Bcf)
|
83.1 | 81.2 | ||||||
|
Natural
gas liquids (MBbls)
|
3,550 | — | ||||||
|
Crude
oil (MBbls)
|
6,413 | 4,547 | ||||||
|
Total
(Bcfe)
|
142.9 | 108.5 | ||||||
|
Proved
developed (Bcfe)
|
96.9 | 80.9 | ||||||
|
Proved
undeveloped (Bcfe)
|
46.0 | 27.6 | ||||||
|
Proved
developed reserves as % of total proved reserves
|
68 | % | 75 | % | ||||
|
Standardized
measure (in millions) (1)
|
$ | 178.7 | $ | 190.1 | ||||
|
Representative
Natural Gas and Oil Prices (2):
|
||||||||
|
Natural
gas—Henry Hub per MMBtu
|
$ | 3.87 | $ | 5.71 | ||||
|
Oil—WTI
per Bbl
|
$ | 61.04 | $ | 41.00 | ||||
|
(1)
|
Standardized
Measure is the present value of estimated future net revenues to be
generated from the production of proved reserves, determined in accordance
with the rules and regulations of the SEC (using the 12-month average
price) without giving effect to non-property related expenses such as
selling, general and administrative expenses, debt service and future
income tax expenses or to depreciation, depletion, amortization and
accretion and discounted using an annual discount rate of 10%. Our
Standardized Measure does not include future income tax expenses because
we are not subject to income taxes and our reserves are owned by our
subsidiary Vanguard Natural Gas, LLC which is also not subject to income
taxes. Standardized Measure does not give effect to derivative
transactions. For a description of our derivative transactions, please
read “Item 1—Operations—Price Risk Management Activities” and “Item
7A—Quantitative and Qualitative Disclosures About Market
Risk.”
|
|
|
(2)
|
Natural
gas and oil prices are based on spot prices per MMBtu and Bbl,
respectively, calculated using the 12-month average price for January
through December 2009, with these representative prices adjusted by field
for quality, transportation fees and regional price differentials to
arrive at the appropriate net
price.
|
|
Net
Production
|
Average Realized Sales Prices (2)
|
Production Cost
(3)
|
||||||||||||||||||||
|
Crude
Oil Bbls/day
|
Natural
Gas Mcf/day
|
NGLs
Gal/day
|
Crude
Oil Per Bbl
|
Natural
Gas Per Mcf
|
NGLs
Per Gal
|
Per
BOE
|
||||||||||||||||
|
Year Ended December 31, 2009
(1)
|
||||||||||||||||||||||
|
Sun
TSH Field
|
26
|
1,124
|
7,095
|
$
|
65.40
|
$
|
11.03
|
$
|
0.95
|
$
|
3.76
|
|||||||||||
|
Other
|
921
|
11,320
|
6,113
|
$
|
75.54
|
$
|
11.16
|
$
|
0.75
|
$
|
11.25
|
|||||||||||
|
Total
|
947
|
12,444
|
13,208
|
$
|
75.26
|
$
|
11.15
|
$
|
0.86
|
$
|
10.39
|
|||||||||||
|
Year Ended December 31, 2008
(4)
|
||||||||||||||||||||||
|
Total
other
|
715
|
11,450
|
3,271
|
$
|
85.69
|
$
|
10.49
|
$
|
1.18
|
$
|
11.24
|
|||||||||||
|
Year
Ended December 31, 2007
|
||||||||||||||||||||||
|
Total
other
|
84
|
11,080
|
—
|
$
|
66.08
|
$
|
8.92
|
$
|
—
|
$
|
7.17
|
|||||||||||
|
|
(1)
Average daily production for 2009 calculated based on 365 days including
production for the Sun TSH and Ward County acquisitions from the closing
dates of these acquisitions.
|
|
|
(2) Average
realized sales prices including hedges but excluding the non-cash
amortization of premiums paid and non-cash amortization of value on
derivative contracts acquired.
|
|
|
(3) Production costs include such
items as lease operating expenses, gathering and compression fees and
other customary charges and excludes production taxes (severance and ad
valorem taxes).
|
|
|
(4) Average
daily production for 2008 calculated based on 366 days including
production for the Permian Basin and Dos Hermanos acquisitions from the
closing dates of these
acquisitions.
|
40
Non-GAAP
Financial Measure
|
|
Adjusted
EBITDA
|
We define
Adjusted EBITDA as net income (loss) plus:
|
·
|
Net
interest expense, including write-off of deferred financing fees and
realized gains and losses on interest rate derivative
contracts;
|
|
·
|
Loss
on extinguishment of debt;
|
|
·
|
Depreciation,
depletion and amortization (including accretion of asset retirement
obligations);
|
|
·
|
Impairment
of natural gas and oil properties;
|
|
·
|
Bad
debt expenses;
|
|
·
|
Amortization
of premiums paid on derivative contracts;
|
|
·
|
Amortization
of value on derivative contracts acquired;
|
|
·
|
Unrealized
gains and losses on other commodity and interest rate derivative
contracts;
|
|
·
|
Gains
and losses on acquisitions of natural gas and oil
properties;
|
|
·
|
Change
in fair value of derivative contracts;
|
|
·
|
Deferred
taxes;
|
|
·
|
Unit-based
compensation expense;
|
|
·
|
Realized
gains and losses on cancelled derivatives; and
|
|
·
|
Non-cash
portion of phantom unit expense granted to
officers.
|
|
|
|
Adjusted
EBITDA is a
significant performance metric used by management as a tool to measure
(prior to the establishment of any cash reserves by our board of directors, debt
service and capital expenditures) the cash distributions we could pay our
unitholders. Specifically, this financial measure indicates to investors whether
or not we are generating cash flow at a level that can sustain or support an
increase in our quarterly distribution rates. Adjusted EBITDA is also used as a
quantitative standard by our management and by external users of our financial
statements such as investors, research analysts and others to assess the
financial performance of our assets without regard to financing methods, capital
structure or historical cost basis; the ability of our assets to generate cash
sufficient to pay interest costs and support our indebtedness; and our operating
performance and return on capital as compared to those of other companies in our
industry.
Our
Adjusted EBITDA should not be considered as an alternative to net income,
operating income, cash flow from operating activities or any other measure of
financial performance or liquidity presented in accordance with GAAP. Our
Adjusted EBITDA excludes some, but not all, items that affect net income and
operating income and these measures may vary among other companies. Therefore,
our Adjusted EBITDA may not be comparable to similarly titled measures of other
companies.
The
following table presents a reconciliation of our consolidated net income (loss)
to adjusted EBITDA:
41
|
Year Ended December 31,
|
||||||||||||||||||||
|
(in thousands)
|
||||||||||||||||||||
|
Vanguard
|
Vanguard Predecessor
|
|||||||||||||||||||
|
(in thousands)
|
2009
|
2008
|
2007
|
2006
|
2005
|
|||||||||||||||
|
Net
Income (Loss)
|
$
|
(95,735
|
)
|
$
|
(3,752
|
)
|
$
|
2,649
|
$
|
26,555
|
$
|
(10,558
|
)
|
|||||||
|
Plus:
|
||||||||||||||||||||
|
Interest expense, including
realized losses on interest rate derivative
contracts
|
6,179
|
5,597
|
8,135
|
7,372
|
4,566
|
|||||||||||||||
|
Loss on extinguishment of
debt
|
—
|
—
|
2,502
|
—
|
—
|
|||||||||||||||
|
Depreciation, depletion,
amortization and accretion
|
14,610
|
14,910
|
8,981
|
8,633
|
6,189
|
|||||||||||||||
|
Impairment of natural gas and oil
properties
|
110,154
|
58,887
|
—
|
—
|
—
|
|||||||||||||||
|
Bad debt
expense
|
—
|
—
|
1,007
|
—
|
—
|
|||||||||||||||
|
Amortization of premiums paid on derivative
contracts
|
3,502
|
4,493
|
4,274
|
—
|
—
|
|||||||||||||||
|
Amortization of value on derivative contracts
acquired
|
3,619
|
733
|
—
|
—
|
—
|
|||||||||||||||
|
Unrealized (gains) losses on
other commodity and interest rate derivative contracts (1)
|
18,280
|
(35,851
|
)
|
—
|
(17,748
|
)
|
18,779
|
|||||||||||||
|
Gain on acquisitions of natural gas and oil
properties
|
(6,981
|
)
|
—
|
—
|
—
|
—
|
||||||||||||||
|
Deferred
taxes
|
(302
|
)
|
177
|
—
|
—
|
—
|
||||||||||||||
|
Unit-based compensation
expense
|
2,483
|
3,577
|
2,132
|
—
|
—
|
|||||||||||||||
|
Realized loss on cancelled
derivatives
|
—
|
—
|
777
|
—
|
—
|
|||||||||||||||
|
Fair value of phantom units granted to officers
|
4,299
|
—
|
—
|
—
|
—
|
|||||||||||||||
|
Cash settlement of phantom units granted to officers
|
(3,906
|
)
|
—
|
—
|
—
|
—
|
||||||||||||||
|
Less:
|
||||||||||||||||||||
|
Interest
income
|
—
|
17
|
62
|
40
|
52
|
|||||||||||||||
|
Adjusted
EBITDA
|
$
|
56,202
|
$
|
48,754
|
$
|
30,395
|
$
|
24,772
|
$
|
18,924
|
||||||||||
|
(1)
|
Natural
gas and oil derivative contracts were used to reduce our exposure to
changes in natural gas and oil prices. Prior to 2007, they were not
specifically designated as hedges under ASC Topic 815, thus the changes in
the fair value of commodity derivative contracts were marked to market in
our earnings and classified as gain (loss) on other commodity derivative
contracts. In 2007, we designated all commodity derivative contracts as
cash flow hedges. In 2008, all commodity derivative contracts were either
de-designated as cash flow hedges or they failed to meet the hedge
documentation requirements for cash flow hedges. As a result, the changes
in the fair value of other commodity derivative contracts are recorded in
earnings and classified as gain on other commodity derivative contracts.
The changes in fair value of interest rate derivative contracts is
recorded in earnings and classified as loss on interest rate derivative
contracts.
|
The following discussion and
analysis should be read in conjunction with “Item 6 – Selected Financial Data”
and the accompanying financial statements and related notes included elsewhere
in this Annual Report. The following discussion contains forward-looking
statements that reflect our future plans, estimates, forecasts, guidance,
beliefs and expected performance. The forward-looking statements are dependent
upon events, risks and uncertainties that may be outside our control. Our actual
results could differ materially from those discussed in these forward-looking
statements. Factors that could cause or contribute to such differences include,
but are not limited to, market prices for natural gas, production volumes,
estimates of proved reserves, capital expenditures, economic and competitive
conditions, regulatory changes and other uncertainties, as well as those factors
discussed below and elsewhere in this Annual Repor, particularly in “Item 1A
–Risk Factors” and “Forward Looking Statements,” all of which are difficult to
predict. In light of these risks, uncertainties and assumptions, the
forward-looking events discussed may not occur.
Overview
We are a
publicly traded limited liability company focused on the acquisition and
development of mature, long-lived natural gas and oil properties in the United
States. Our primary business objective is to generate stable cash flows allowing
us to make quarterly cash distributions to our unitholders and over time to
increase our quarterly cash distributions through the acquisition of new natural
gas and oil properties. As of December 31, 2009, our properties are located
in the southern portion of the Appalachian Basin, primarily in southeast
Kentucky and northeast Tennessee, the Permian Basin, primarily in west Texas and
southeastern New Mexico, and in south Texas.
42
At
December 31, 2009, we owned working interests in 2,011 gross (1,185 net)
productive wells. In addition to these productive wells, we own leasehold
acreage allowing us to drill new wells. As of December 31, 2009, we
had a 40% working interest in approximately 109,500 gross undeveloped acres
surrounding or adjacent to our existing wells located in the Appalachian Basin.
In South Texas and the Permian Basin we own working interests ranging from
30-100% in approximately 16,130 undeveloped acres surrounding our existing
wells. Approximately 32% or 46.0 Bcfe of our estimated proved reserves were
attributable to our working interests in undeveloped acreage.
Initial
Public Offering
In
October 2007, we completed our IPO of 5.25 million units representing
limited liability interests in VNR at $19.00 per unit for net proceeds of $92.8
million after deducting underwriting discounts and fees of $7.0 million. In
addition, we incurred offering costs of $2.8 million in connection with the IPO
.The proceeds were used to reduce indebtedness under our reserve-based credit
facility by $80.0 million and the balance was used for the payment of accrued
distributions to pre-IPO unitholders and the payment of a deferred swap
obligation.
Shelf
Registration Statement
During
the third quarter 2009, we filed a registration statement with the SEC which
registered offerings of up to $300.0 million of any combination of debt
securities, common units and guarantees of debt securities by our subsidiaries.
Net proceeds, terms and pricing of the offering of securities issued under the
shelf registration statement will be determined at the time of the offerings.
The shelf registration statement does not provide assurance that we will or
could sell any such securities. Our ability to utilize the shelf registration
statement for the purpose of issuing, from time to time, any combination of debt
securities or common units will depend upon, among other things, market
conditions and the existence of investors who wish to purchase our securities at
prices acceptable to us.
In August
2009, we completed an offering of 3.9 million of our common units. The units
were offered to the public at a price of $14.25 per unit. We received net
proceeds of approximately $53.2 million from the offering, after deducting
underwriting discounts of $2.4 million and offering costs of $0.5 million. In
December 2009, we completed an offering of 2.6 million of our common units. The
units were offered to the public at a price of $18.00 per unit. We received net
proceeds of approximately $44.4 million from the offering, after deducting
underwriting discounts of $2.0 million and offering costs of $0.1 million. We
paid $4.3 million of the proceeds from this offering to redeem 250,000 common
units from our largest unitholder.
As a
result of these offerings, we have approximately $197.4 million remaining
available under our 2009 shelf registration statement as of December 31,
2009.
Permian
Basin Acquisition
On
December 21, 2007, we entered in to a Purchase and Sale Agreement with the
Apache Corporation for the purchase of certain natural gas and oil properties
located in ten separate fields in the Permian Basin of west Texas and
southeastern New Mexico, referred to as the “Permian Basin acquisition.” The
purchase price for said assets was $78.3 million with an effective date of
October 1, 2007. We completed this acquisition on January 31, 2008 for
an adjusted purchase price of $73.4 million, subject to customary post-closing
adjustments. The post-closing adjustments reduced the final purchase price to
$71.5 million which included a purchase price adjustment of $6.8 million for the
cash flow from the acquired properties for the period between the effective
date, October 1, 2007, and the final settlement date. This acquisition was
funded with borrowings under our reserve-based credit facility. Through this
acquisition, we acquired working interests in 390 gross wells (67 net wells), 56
gross wells (54 net wells) of which we operate. With respect to operations, we
established two district offices, one in Lovington, New Mexico and the other in
Christoval, Texas to manage these assets. Our operating focus has been on
maximizing existing production and looking for complementary acquisitions that
we can add to this operating platform. As of December 31, 2009, based on a
reserve report prepared by our independent reserve engineers, these acquired
properties have estimated proved reserves of 3.4 million barrels of oil
equivalent, 86% of which is oil and 89% of which is proved developed
producing.
43
Dos
Hermanos Acquisition
On July
18, 2008, we entered into a Purchase and Sale Agreement with Segundo Navarro
Drilling, Ltd. (“Segundo”), a wholly-owned subsidiary of the Lewis Energy Group,
for the acquisition of certain natural gas and oil properties located in the Dos
Hermanos Field in Webb County, Texas, referred to as the “Dos Hermanos
acquisition.” The purchase price for said assets was $53.4 million with an
effective date of June 1, 2008. We completed this acquisition on July 28, 2008
for an adjusted purchase price of $51.4 million, subject to customary
post-closing adjustments. This acquisition was funded with $30.0 million of
borrowings under our reserve-based credit facility and through the issuance of
1,350,873 common units of the Company. In this purchase, we acquired an average
of a 98% working interest in 90 producing wells and an average 47.5% working
interest in approximately 4,705 gross acres with 41 identified proved
undeveloped locations. An affiliate of Lewis Energy Group operates all the
properties and is contractually obligated to drill seven wells each year from
2010 through 2013 unless mutually agreed not to do so. Upon closing this
transaction, we assumed natural gas swaps and collars based on Houston Ship
Channel pricing for approximately 85% of the estimated gas production from
existing producing wells for the period beginning July 2008 through December
2011 which had a fair value of $3.6 million on July 28, 2008. As of December 31,
2009, based on a reserve report prepared by our independent reserve engineers,
these acquired properties have estimated proved reserves of 16.0 Bcfe, 99% of
which is natural gas and natural gas liquids and 59% of which is proved
developed producing.
Sun
TSH Acquisition
On July
17, 2009, we entered into a Purchase and Sale Agreement to acquire certain
natural gas and oil properties located in the Sun TSH Field in La Salle County,
Texas for $52.3 million from Segundo, referred to as the “Sun TSH acquisition.”
The acquisition had a July 1, 2009 effective date and was completed on August
17, 2009 for an adjusted purchase price of $50.5 million, subject to customary
post-closing adjustments. An affiliate of Lewis operates all of the wells
acquired in this transaction. This acquisition was funded with borrowings under
our reserve-based credit facility and proceeds from the Company’s public equity
offering of 3.9 million common units completed on August 17, 2009. At closing,
we assumed natural gas puts and swaps based on NYMEX pricing for approximately
61% of the estimated gas production from existing producing wells in the
acquired properties for the period beginning August of 2009 through December of
2010, which had a fair value of $4.1 million on the closing date. In addition,
concurrent with the execution of the Purchase and Sale Agreement, we entered
into a collar for certain volumes in 2010 and a series of collars for a
substantial portion of the expected gas production for 2011 at prices above the
then current market with a total cost to the Company of $3.1 million which was
financed through deferred premiums. Inclusive of the hedges added, approximately
90% of the estimated gas production from existing producing wells in the
acquired properties is hedged through 2011. As of December 31, 2009, based on a
reserve report prepared by our independent reserve engineers, these acquired
properties have estimated proved reserves of 35.7 Bcfe, 98% of which is natural
gas and natural gas liquids and 62% is proved developed producing.
Ward
County Acquisition
On
November 27, 2009, we entered into a Purchase and Sale Agreement, Lease
Amendment and Lease Royalty Conveyance Agreement and a Conveyance Agreement to
acquire certain producing natural gas and oil properties located in Ward County,
Texas in the Permian Basin from private sellers, referred to as the “Ward County
acquisition.” This transaction had an effective date of October 1, 2009 and was
closed on December 2, 2009 for $55.0 million, subject to customary post-closing
adjustments. This acquisition was initially funded with borrowings under our
reserve-based credit facility with borrowings being reduced by $40.3 million
shortly thereafter with the proceeds from a 2.3 million common unit offering. We
will operate all but one of the ten wells acquired in this transaction. As of
December 31, 2009, based on a reserve report prepared by our independent reserve
engineers, these acquired properties have estimated proved reserves of 3.4
million barrels of oil equivalent, 81% of which is oil and 55% is proved
developed. In an effort to support stable cash flows from this transaction, we
entered into crude oil swaps based on NYMEX pricing for approximately 90% of the
estimated oil production from existing producing wells in the acquired
properties for the period beginning January 2010 through December
2013.
Disruption
to Functioning of Capital Markets
Multiple
events during 2008 and 2009 involving numerous financial institutions have
effectively restricted liquidity within the capital markets throughout the
United States and around the world. While capital markets remain volatile,
efforts by treasury and banking regulators in the United States, Europe and
other nations around the world to provide liquidity to the financial sector have
improved the situation. As evidenced by our recent successful equity offerings,
successful amendment of our reserve-based credit facility and recent successful
equity and debt offerings by our peers, we believe that our access to capital
has improved and we have been successful in improving our financial position to
date.
During
2009, our unit price increased from a closing low of $6.35 on January 2, 2009 to
a closing high of $22.07 on December 31, 2009. Also during 2009, we did not
drill any wells on our operated properties and there was limited drilling on
non-operated properties. We intend to move forward with our development drilling
program when market conditions allow for an adequate return on the drilling
investment and only when we have sufficient liquidity to do so. Maintaining
adequate liquidity may involve the issuance of debt and equity at less
attractive terms, could involve the sale of non-core assets and could require
reductions in our capital spending. In the near-term we will focus on
maximizing returns on existing assets by managing our costs, selectively
deploying capital to improve existing production and drilling a limited number
of wells which we believe will provide an adequate return on the
investment.
44
Our
Relationship with Vinland
On
April 18, 2007 but effective as of January 5, 2007, we entered into
various agreements with Vinland, under which we rely on Vinland to operate our
existing producing wells in Appalachia and coordinate our development drilling
program in Appalachia. We expect to benefit from the substantial development and
operational expertise of Vinland management in the Appalachian Basin. Under a
management services agreement, Vinland advises and consults with us regarding
all aspects of our production and development operations in Appalachia and
provides us with administrative support services as necessary for the operation
of our business. In addition, under a gathering and compression agreement that
we entered into with Vinland Energy Gathering, LLC (“VEG”), VEG gathers,
compresses, delivers and provides the services necessary for us to market our
natural gas production in the area of mutual interest, or AMI. VEG will deliver
our natural gas production to certain designated interconnects with third-party
transporters.
Restructuring
Plan
Prior to
the separation, our Predecessor owned all of the assets in Appalachia that are
currently owned by us and Vinland. As part of the separation of our operating
company and Vinland, effective January 5, 2007, we conveyed to Vinland 60%
of our Predecessor’s working interest in the known producing horizons in
approximately 95,000 gross undeveloped acres in the AMI, 100% of our
Predecessor’s interest in an additional 125,000 undeveloped acres and certain
coalbed methane rights located in the Appalachian Basin, the rights to any
natural gas and oil located on our acreage at depths above and 100 feet below
our known producing horizons, all of our gathering and compression assets and
all employees except, our President and Chief Executive Officer and our
Executive Vice President and Chief Financial Officer. We retained all of our
Predecessor’s proved producing wells and associated reserves. We also retained
40% of our Predecessor’s working interest in the known producing horizons in
approximately 95,000 gross undeveloped acres in the AMI and a contract right to
receive approximately 99% of the net proceeds, after deducting royalties paid to
other parties, severance taxes, third-party transportation costs, costs incurred
in the operation of wells and overhead costs, from the sale of production from
certain producing natural gas and oil wells, which accounted for approximately
1.7% of our estimated proved reserves as of December 31, 2009. In addition,
we changed the name of our operating company from Nami Holding Company, LLC to
Vanguard Natural Gas, LLC. Collectively, we refer to these events as the
“Restructuring.”
Private
Offering
In
April 2007, we completed a private equity offering pursuant to which we
issued 2,290,000 units to certain private
investors, which we collectively refer to as the Private Investors, for $41.2
million. We used the net proceeds of this private equity offering to make a
distribution to Majeed S. Nami, VNR’s largest unitholder, who used a portion of
these funds to capitalize Vinland and also paid us $3.9 million to reduce
outstanding accounts receivable from Vinland. We then used the $3.9 million
to repay borrowings and interest under our reserve-based credit facility, and
for general limited liability company purposes. Under the terms of the private
offering, all outstanding units accrued distributions at $1.75 annually from the
closing of the private offering to September 30, 2007 and then
distributions payable to the Private Investors only increased to $2.40 until the
completion of the IPO at which time all accrued distributions totaling $5.6
million were paid.
Reserve-Based
Credit Facility
On
January 3, 2007, we entered into a reserve-based credit facility which is
available for our general limited liability company purposes, including, without
limitation, capital expenditures and acquisitions. Our obligations under the
reserve-based credit facility are secured by substantially all of our assets.
Our initial borrowing base under the reserve-based credit facility was set at
$115.5 million. However, the borrowing base was subject to $1.0 million
reductions per month starting on July 1, 2007 through November 1,
2007, which resulted in a borrowing base of $110.5 million as reaffirmed in
November 2007 pursuant to a semi-annual borrowing base redetermination. We
applied $80.0 million of our net proceeds from our IPO in October 2007 to
reduce our indebtedness under our reserve-based credit facility. Additional
borrowings under our reserve-based credit facility were made in January 2008 in
connection with the acquisition of natural gas and oil properties in the Permian
Basin. In February 2008, our reserve-based credit facility was amended and
restated to extend the maturity from January 3, 2011 to March 31, 2011, increase
the maximum facility amount from $200.0 million to $400.0 million, increase our
borrowing base from $110.5 million to $150.0 million and add two additional
financial institutions as lenders, Wachovia Bank, N.A. and The Bank of Nova
Scotia. In May 2008, our reserve-based credit facility was amended in
anticipation of a potential acquisition that ultimately did not occur. As a
result, none of the provisions included in this amendment went into effect. In
July 2008 an additional $30.0 million was borrowed to fund a portion of the cash
consideration paid in the Dos Hermanos acquisition. In October 2008, we amended
our reserve-based credit facility which set our borrowing base under the
facility at $175.0 million pursuant to our semi-annual redetermination and added
a new lender, BBVA Compass Bank. In February 2009, a third amendment was entered
into which amended covenants to allow us to repurchase up to $5.0 million of our
own units. In May 2009, our borrowing base was set at $154.0 million pursuant to
our semi-annual redetermination. In June 2009, a fourth amendment to our
reserve-based credit facility was entered into which temporarily increased the
percentage of outstanding indebtedness for which interest rate derivatives could
be used. The percentage was increased from 75% to 85% but was to revert back to
75% in one year at June 2010. In August 2009, our reserve-based credit facility
was amended and restated to (1) extend the maturity from March 31, 2011 to
October 1, 2012, (2) increase our borrowing base from $154.0 million to $175.0
million, (3) increase our borrowing costs, (4) permanently allow 85% of our
outstanding indebtedness to be covered under interest rate derivatives, and (5)
add two financial institutions as lenders, Comerica Bank and Royal Bank of
Canada. On October 1, 2009, we entered into the First Amendment to our Second
Amended and Restated Credit Agreement, which reduced our borrowing base under
the reserve-based credit facility from $175.0 million to $170.0 million pursuant
to our semi-annual redetermination and changed the definition of majority
lenders from 75% to 66.67%. All other terms under the reserve-based credit
facility remained the same. In December 2009, our borrowing base was increased
from $170.0 million to $195.0 million pursuant to an interim redetermination
requested by the Company due the Ward County acquisition. Indebtedness under the
reserve-based credit facility totaled $129.8 million at December 31, 2009, and
the applicable margins and other fees increase as the utilization of the
borrowing base increases as follows:
45
|
Borrowing
Base Utilization Percentage
|
<50%
|
>50%
<75%
|
>75%
<90%
|
>90%
|
|||||
|
Eurodollar
Loans Margin
|
2.25%
|
2.50%
|
2.75%
|
3.00%
|
|||||
|
ABR
Loans Margin
|
1.25%
|
1.50%
|
1.75%
|
2.00%
|
|||||
|
Commitment
Fee Rate
|
0.50%
|
0.50%
|
0.50%
|
0.50%
|
|||||
|
Letter
of Credit Fee
|
2.25%
|
2.50%
|
2.75%
|
3.00%
|
Our next
borrowing base redetermination is scheduled for April 2010 utilizing our
December 31, 2009 reserve report. A decline in commodity prices could result in
a determination to lower the borrowing base in the future and, in such case, we
could be required to repay any indebtedness in excess of the borrowing base.
Until the redetermination occurs, the amount of the potential reduction is
uncertain; however, we do not anticipate that any reduction will be material to
the borrowing base as a whole and would not inhibit our ability to make
distributions to our unitholders.
Outlook
Our
revenue, cash flow from operations and future growth depend substantially on
factors beyond our control, such as access to capital, economic, political and
regulatory developments, and competition from other sources of energy. Multiple
events during 2008 and 2009 involving numerous financial institutions
effectively restricted liquidity within the capital markets throughout the
United States and around the world. While capital markets remain volatile,
efforts by treasury and banking regulators in the United States, Europe and
other nations around the world to provide liquidity to the financial sector
appears to have improved the situation. As evidenced by our recent successful
equity offering, successful amendment of our reserve-based credit facility and
recent successful equity and debt offerings by our peers, we believe that our
access to capital has improved and we have been successful in improving our
financial position to date.
During
2009, our unit price increased from a closing low of $6.35 on January 2, 2009 to
a closing high of $22.07 on December 31, 2009. Also during 2009, we did not
drill any wells on our operated properties and there was limited drilling on
non-operated properties. We intend to move forward with our development drilling
program when market conditions allow for an adequate return on the drilling
investment and only when we have sufficient liquidity to do so. Maintaining
adequate liquidity may involve the issuance of debt and equity at less
attractive terms, could involve the sale of non-core assets and could require
reductions in our capital spending. In the near-term we will focus on
maximizing returns on existing assets by managing our costs, selectively
deploying capital to improve existing production and drilling a limited number
of wells which we believe will provide an adequate return on the
investment.
Natural
gas, natural gas liquids and oil prices historically have been volatile and may
fluctuate widely in the future. Sustained periods of low prices for natural gas,
natural gas liquids or oil could materially and adversely affect our financial
position, our results of operations, the quantities of natural gas, natural gas
liquids and oil reserves that we can economically produce, our access to capital
and our ability to pay a distribution. We have mitigated the volatility on our
cash flows with natural gas price derivative contracts through 2011 and oil
price derivative contracts through 2013. These hedges are placed on a portion of
our proved producing and a portion of our total anticipated production during
this time frame. As natural gas, natural gas liquids and oil prices fluctuate,
we will recognize non-cash, unrealized gains and losses in our consolidated
statement of operations related to the change in fair value of our commodity
derivative contracts.
We face
the challenge of natural gas, natural gas liquids and oil production declines.
As a given well’s initial reservoir pressures are depleted, natural gas, natural
gas liquids and oil production decreases, thus reducing our total reserves. We
attempt to overcome this natural decline both by drilling on our properties and
acquiring additional reserves. We will maintain our focus on controlling costs
to add reserves through drilling and acquisitions, as well as controlling the
corresponding costs necessary to produce such reserves. During the year ended
December 31, 2009, we did not drill any wells on our operated properties and
there was limited drilling on non-operated properties. Our ability to add
reserves through drilling is dependent on our capital resources and can be
limited by many factors, including the ability to timely obtain drilling permits
and regulatory approvals and voluntary reductions in capital spending in a low
commodity price environment. Any delays in drilling, completion or connection to
gathering lines of our new wells will negatively impact the rate of our
production, which may have an adverse effect on our revenues and as a result,
cash available for distribution. In accordance with our business plan, we intend
to invest the capital necessary to maintain our production at existing levels
over the long-term provided that it is economical to do so based on the
commodity price environment. However, we cannot be certain that we will be able
to issue equity or debt securities on favorable terms, or at all, and we may be
unable to refinance our reserve-based credit facility when it expires.
Additionally, due to the significant decline in commodity prices, our borrowing
base under our reserve-based credit facility may be re-determined such that it
will not provide for the working capital necessary to fund our capital spending
program and could affect our ability to make distributions. The next scheduled
redetermination of our borrowing base is April 2010.
46
Results
of Operations
The
following table sets forth selected financial and operating data for the periods
indicated.
|
Year Ended December 31,
(1) (2) (3)
(4)
|
||||||||||||
|
2009
|
2008
|
2007
|
||||||||||
|
(in
thousands)
|
||||||||||||
|
Revenues:
|
||||||||||||
|
Gas
sales
|
$
|
21,966
|
$
|
43,502
|
$
|
32,517
|
||||||
|
Natural
gas liquids sales
|
4,129
|
1,418
|
—
|
|||||||||
|
Oil
sales
|
19,940
|
23,930
|
2,024
|
|||||||||
|
Natural
gas, natural gas liquids and oil sales
|
46,035
|
68,850
|
34,541
|
|||||||||
|
Gain
(loss) on commodity cash flow hedges
|
(2,380
|
)
|
269
|
(702
|
)
|
|||||||
|
Realized
gain (loss) on other commodity derivative contracts
|
29,993
|
(6,552
|
)
|
—
|
(5)
|
|||||||
|
Unrealized
gain (loss) on other commodity derivative contracts
|
(19,043
|
)
|
39,029
|
—
|
(5)
|
|||||||
|
Total
revenues
|
$
|
54,605
|
$
|
101,596
|
$
|
33,839
|
||||||
|
Costs
and expenses:
|
||||||||||||
|
Lease
operating expenses
|
$
|
12,652
|
$
|
11,112
|
$
|
5,066
|
||||||
|
Depreciation,
depletion, amortization and accretion
|
14,610
|
14,910
|
8,981
|
|||||||||
|
Impairment
of natural gas and oil properties
|
110,154
|
58,887
|
—
|
|||||||||
|
Selling,
general and administrative expenses
|
10,644
|
6,715
|
3,507
|
|||||||||
|
Bad
debt expense
|
—
|
—
|
1,007
|
|||||||||
|
Production
and other taxes
|
3,845
|
4,965
|
2,054
|
|||||||||
|
Total
costs and expenses
|
$
|
151,905
|
$
|
96,589
|
$
|
20,615
|
||||||
|
Other
income and expenses:
|
||||||||||||
|
Interest
expense, net
|
$
|
(4,276
|
)
|
$
|
(5,474
|
)
|
$
|
(8,073
|
)
|
|||
|
Gain
on acquisition of natural gas and oil properties
|
$
|
6,981
|
$
|
—
|
$
|
—
|
||||||
|
Realized
loss on interest rate derivative contracts
|
$
|
(1,903
|
)
|
$
|
(107
|
)
|
$
|
—
|
||||
|
Unrealized
gain (loss) on interest rate derivative contracts
|
$
|
763
|
$
|
(3,178
|
)
|
$
|
—
|
|||||
|
Loss
on extinguishment of debt
|
$
|
—
|
$
|
—
|
$
|
(2,502
|
)
|
|||||
|
(1)
|
The
Permian acquisition closed on January 31, 2008 and, as such, only eleven
months of operations are included in the year ended December 31, 2008 and
were not included in the results of 2007.
|
|
|
(2)
|
The
Dos Hermanos acquisition closed on July 28, 2008 and, as such, only five
months of operations are included in the year ended December 31, 2008 and
were not included in the results of 2007.
|
|
|
(3)
|
The
Sun TSH acquisition closed on August 17, 2009 and, as such, only
approximately four and one half months of operations are included in the
year ended December 31, 2009 and were not included in the results of 2008
and 2007.
|
|
|
(4)
|
The
Ward County acquisition closed on December 2, 2009 and, as such, only one
month of operations is included in the year ended December 31, 2009 and no
operations are included in the results of 2008 and
2007.
|
|
|
(5)
|
In
2007, we designated all commodity derivative contracts as cash flow
hedges; therefore, all unrealized gains or losses were deferred in
accumulated other comprehensive income (loss) in the equity section of the
consolidated balance sheet.
|
|
47
Year
Ended December 31, 2009 Compared to Year Ended December 31, 2008
Revenues
Natural
gas, natural gas liquids and oil sales decreased $22.8 million to $46.0 million
during the year ended December 31, 2009 as compared to the same period in 2008.
The key revenue measurements were as follows:
|
Year
Ended
December
31,
|
Percentage
Increase
(Decrease)
|
|||||||||
|
2009
|
2008
|
|||||||||
|
Net
Natural Gas Production:
|
||||||||||
|
Appalachian
gas (MMcf)
|
3,103
|
3,578
|
(13)
|
%
|
||||||
|
Permian
gas (MMcf)
|
225
|
(1)
|
185
|
(2)
|
22
|
%
|
||||
|
South
Texas gas (MMcf)
|
1,214
|
(3)
|
428
|
(4)
|
184
|
%
|
||||
|
Total
natural gas production (MMcf)
|
4,542
|
4,191
|
8
|
%
|
||||||
|
Average
Appalachian daily gas production (Mcf/day)
|
8,502
|
9,777
|
(13)
|
%
|
||||||
|
Average
Permian daily gas production (Mcf/day)
|
616
|
(1)
|
505
|
(2)
|
22
|
%
|
||||
|
Average
South Texas daily gas production (Mcf/day)
|
3,326
|
(3)
|
1,168
|
(4)
|
185
|
%
|
||||
|
Average
Vanguard daily gas production (Mcf/day)
|
12,444
|
11,450
|
9
|
%
|
||||||
|
Average
Natural Gas Sales Price per Mcf:
|
||||||||||
|
Net
realized gas price, including hedges
|
$11.15
|
(5)
|
$10.49
|
(5)
|
6
|
%
|
||||
|
Net
realized gas price, excluding hedges
|
$4.84
|
$10.38
|
(53)
|
%
|
||||||
|
Net
Oil Production:
|
||||||||||
|
Appalachian
oil (Bbls)
|
93,713
|
48,977
|
91
|
%
|
||||||
|
Permian
oil (Bbls)
|
242,301
|
(1)
|
212,599
|
(2)
|
14
|
%
|
||||
|
South
Texas oil (Bbls)
|
9,386
|
(3)
|
—
|
N/A
|
||||||
|
Total
oil production (Bbls)
|
345,400
|
261,576
|
32
|
%
|
||||||
|
Average
Appalachian daily oil production (Bbls/day)
|
257
|
134
|
92
|
%
|
||||||
|
Average
Permian daily oil production (Bbls/day)
|
664
|
(1)
|
581
|
(2)
|
14
|
%
|
||||
|
Average
South Texas daily oil production (Bbls/day)
|
26
|
(3)
|
—
|
N/A
|
||||||
|
Average
Vanguard daily oil production (Bbls/day)
|
947
|
715
|
32
|
%
|
||||||
|
Average
Oil Sales Price per Bbl:
|
||||||||||
|
Net
realized oil price, including hedges
|
$75.26
|
(5)
|
$85.69
|
(5)
|
(12)
|
%
|
||||
|
Net
realized oil price, excluding hedges
|
$57.73
|
$91.48
|
(37)
|
%
|
||||||
|
Net
Natural Gas Liquids Production:
|
||||||||||
|
Permian
natural gas liquids (Gal)
|
454,940
|
(1)
|
231,280
|
(2)
|
97
|
%
|
||||
|
South
Texas natural gas liquids (Gal)
|
4,366,016
|
(3)
|
965,718
|
(4)
|
352
|
%
|
||||
|
Total natural gas
liquids production
(Gal)
|
4,820,956
|
1,196,998
|
303
|
%
|
||||||
|
Average
Permian daily natural gas liquids production (Gal/day)
|
1,247
|
(1)
|
632
|
(2)
|
97
|
%
|
||||
|
Average
South Texas daily natural gas liquids production (Gal/day)
|
11,961
|
(3)
|
2,639
|
(4)
|
353
|
%
|
||||
|
Average Vanguard daily natural
gas liquids production
(Gal/day)
|
13,208
|
3,271
|
304
|
%
|
||||||
|
Average
Natural Gas Liquids Sales Price per Gal:
|
||||||||||
|
Net
realized natural gas liquids price
|
$0.86
|
$1.18
|
(27)
|
%
|
||||||
48
|
(1)
|
Includes
production from the Permian Basin and Ward County acquisitions. The Ward
County acquisition closed on December 2, 2009 and, as such, only
approximately one month of operations is included in the year ended
December 31, 2009. The average daily production above is calculated based
on the total number of days in the reported period regardless of how many
days an acquisition contributed production in the reported period. The
average daily production for the Ward County acquisition, based on the
actual number of days from the acquisition closing date to the end of the
reported period, was 309 Mcf/day of natural gas, 411 Bbls/day of oil and
3,330 Gal/day of natural gas liquids during 2009.
|
|
|
(2)
|
The
Permian Basin acquisition closed on January 31, 2008 and, as such, only
eleven months of operations are included in the year ended December 31,
2008. The average daily production above is calculated based on the total
number of days in the reported period regardless of how many days an
acquisition contributed production in the reported period. The average
daily production for the Permian Basin acquisition, based on the actual
number of days from the acquisition closing date to the end of the
reported period, was 552 Mcf/day of natural gas, 635 Bbls/day of oil and
690 Gal/day of natural gas liquids during 2008.
|
|
|
(3)
|
Includes
production from Dos Hermanos and Sun TSH acquisitions. The Sun TSH
acquisition closed on August 17, 2009 and, as such, only approximately
four and one half months of operations are included in the year ended
December 31, 2009. The average daily production above is calculated based
on the total number of days in the reported period regardless of how many
days an acquisition contributed production in the reported period. The
average daily production for the Sun TSH acquisition, based on the actual
number of days from the acquisition closing date to the end of the
reported period, was 2,995 Mcf/day of natural gas, 69 Bbls/day of oil and
18,904 Gal/day of natural gas liquids during 2009.
|
|
|
(4)
|
The
Dos Hermanos acquisition closed on July 28, 2008 and, as such, only five
months of operations are included in the year ended December 31, 2008. The
average daily production above is calculated based on the total number of
days in the reported period regardless of how many days an acquisition
contributed production in the reported period. The average daily
production for the Dos Hermanos acquisition, based on the actual number of
days from the acquisition closing date to the end of the reported period,
was 2,724 Mcf/day of natural gas and 6,151 Gal/day of natural gas liquids
during 2008.
|
|
|
(5)
|
Excludes
amortization of premiums paid and amortization of value on derivative
contracts acquired.
|
The
decrease in natural gas, natural gas liquids and oil sales during the year ended
December 31, 2009 compared to the same period in 2008 was due primarily to the
decreases in commodity prices. We experienced a 53% decrease in the average
realized natural gas sales price received (excluding hedges) and a 37% decrease
in the average realized oil price (excluding hedges). The decrease in commodity
prices was partially offset by a 23% increase in our total production on a Mcfe
basis. The increase in production for the year ended December 31, 2009 over the
comparable period in 2008, despite not drilling any new wells in 2009, was
primarily attributable to the impact from the Dos Hermanos, Sun TSH and Ward
County acquisitions completed in July 2008, August 2009 and December 2009,
respectively. In Appalachia, we experienced a 13% decrease in natural gas
production which was partially offset by a 91% increase in oil production during
year ended December 31, 2009 compared to the same period in 2008 for a net
production decline of 5% on a Mcfe basis. The decrease in natural gas production
is largely attributable to our decision to not drill wells in 2009 due to low
natural gas prices. The 91% increase in Appalachian oil production was primarily
due to our focus on completing to oil zones as oil prices increased during 2008
and recompleting to oil zones on existing natural gas wells in 2009, which also
adversely affected the amount of natural gas produced in 2009.
Hedging
and Price Risk Management Activities
During
the year ended December 31, 2009, the Company recognized $2.4 million
in losses on commodity cash flow hedges. These amounts relate to derivative
contracts that the Company entered into in order to mitigate commodity price
exposure on a portion of our expected production and designated as cash flow
hedges. The loss on commodity cash flow hedges for the year ended December 31,
2009 relates to the amount that settled in 2009 and has been reclassified to
earnings from accumulated other comprehensive loss. During the year ended
December 31, 2009, the Company recognized a $30.0 million realized
gain on other commodity derivative contracts related to the settlements
recognized during the period and a $19.0 million loss related to the change in
fair value of derivative contracts not meeting the criteria for cash flow hedge
accounting.
49
The
purpose of our hedging program is to mitigate the volatility in our operating
cash flow. Depending on the type of derivative contract used, hedging generally
achieves this by the counterparty paying us when commodity prices are below the
hedged price and we pay the counterparty when commodity prices are above the
hedged price. In either case, the impact on our operating cash flow is
approximately the same. However, because the majority of our hedges are not
designated as cash flow hedges, there can be a significant amount of volatility
in our earnings when we record the change in the fair value of all of our
derivative contracts. As commodity prices fluctuate, the fair value of those
contracts will fluctuate and the impact is reflected as a non-cash, unrealized
gain or loss in our consolidated statement of operations. However, these fair
value changes that are reflected in the consolidated statement of operations
only reflect the value of the derivative contracts to be settled in the future
and do not take into consideration the value of the underlying commodity. If the
fair value of the derivative contract goes down, it means that the value of the
commodity being hedged has gone up, and the net impact to our cash flow when the
contract settles and the commodity is sold in the market will be approximately
the same. Conversely, if the fair value of the derivative contract goes up, it
means the value of the commodity being hedged has gone down and again the net
impact to our operating cash flow when the contract settles and the commodity is
sold in the market will be approximately the same.
Costs
and Expenses
Lease
operating expenses include third-party transportation costs, gathering and
compression fees, field personnel, and other customary charges. Lease operating
expenses in Appalachia also historically included a $60 per well per month
administrative charge pursuant to a management services agreement with Vinland.
This fee was increased to $95 per well per month beginning March 1, 2009 through
December 31, 2009 pursuant to an agreement whereunder Vinland has agreed to
provide well-tending services on Vanguard owned wells under a turnkey pricing
contract. In addition, we historically have paid a $0.25 per Mcf and $0.55 per
Mcf gathering and compression charge for production from wells drilled pre and
post January 1, 2007, respectively, to Vinland pursuant to a gathering and
compression agreement with Vinland. This gathering and compression agreement was
amended for the period beginning March 1, 2009 through December 31, 2009 to
provide for a fee based upon the actual costs incurred by Vinland to provide
gathering and transportation services plus a $0.05 per Mcf margin. Lease
operating expenses increased by $1.5 million to $12.7 million for the year ended
December 31, 2009 as compared to the year ended December 31, 2008 of which $1.4
million related to the Dos Hermanos, Sun TSH and Ward County
acquisitions.
Depreciation,
depletion, amortization and accretion decreased to approximately $14.6 million
for the year ended December 31, 2009 from approximately $14.9 million for the
year ended December 31, 2008 due primarily to a lower unamortized cost of
natural gas and oil properties as a result of the impairments of these
properties recorded during the fourth quarter of 2008 and first quarter of 2009,
offset by additional depletion recorded on natural gas and oil properties
acquired in the Sun TSH and Ward County acquisitions.
An
impairment of natural gas and oil properties in the amount of $110.2 million was
recognized during the year ended December 31, 2009 as the unamortized cost of
natural gas and oil properties exceeded the sum of the estimated future net
revenues from proved properties using the 12-month average price of natural
gas and oil, discounted at 10% and the lower of cost or fair value of
unproved properties. The impairment for the
first quarter 2009 was $63.8 million as a result of a decline in natural
gas prices at the measurement date, March 31, 2009. This impairment was
calculated based on prices of $3.65 per MMBtu for natural gas and $49.64 per
barrel of crude oil. The SEC’s Final Rule, “Modernization of Oil and Gas
Reporting,” which became effective December 31, 2009, changed the price used to
calculate oil and gas reserves to a 12-month average price rather than a
year-end price. As a
result of declines in natural gas and oil prices based upon the 12-month average
price, we recorded an impairment of $46.4 million in the fourth quarter of 2009.
This impairment was calculated using the 12-month average price for
natural gas and oil of $3.87 per MMBtu for
natural gas and $ 61.04 per barrel of crude oil. The majority of the
fourth quarter impairment was incurred on properties that we acquired in the
last six months of 2009 when natural gas and oil prices were higher than the
12-month average price. We were able to lock in the higher prices at
the time of the acquisitions for a substantial portion of the expected
production through 2011 for natural gas and 2013 for crude oil by using
commodity derivative contracts. However, the impairment calculation
did not consider the positive impact of our commodity derivative positions as
generally accepted accounting principles only allow the inclusion of derivatives
designated as cash flow hedges.
Selling,
general and administrative expenses include the costs of our administrative
employees and executive officers, related benefits, office leases, professional
fees and other costs not directly associated with field operations. These
expenses for the year ended December 31, 2009 increased $3.9 million as compared
to the year ended December 31, 2008. For the years ended December 31, 2009 and
2008 these expenses included non-cash charges of $2.5 million and $3.6 million,
respectively, related to the grant of restricted Class B units to officers and
an employee and the grant of common units to board members during 2007, 2008 and
2009. Additionally, during the year ended December 31, 2009, these expenses
included a charge for the fair value of phantom units granted to officers of
$4.3 million. These phantom units were granted to two officers in amounts equal
to 1% of our units outstanding at January 1, 2009 and the amount paid in either
cash or units will equal the appreciation in value of the units, if any, from
the date of the grant until the determination date (December 31, 2009), plus
cash distributions paid on the units, less an 8% hurdle rate. There was no
appreciation in the fair value of phantom units granted to officers during the
year ended December 31, 2008. The remaining increase of $0.7 million
during the year ended December 31, 2009 as compared to the same period in 2008
is principally due to incremental costs associated with the company’s growth and
acquisitions.
50
Production
and other taxes include severance, ad valorem, and other taxes. Severance taxes
are a function of volumes and revenues generated from production. Ad valorem
taxes vary by state/county and are based on the value of our reserves.
Production and other taxes decreased by $1.1 million for the year ended December
31, 2009 as compared to the same period in 2008. Severance taxes decreased $1.2
million resulting from decreased natural gas, natural gas liquids and oil sales,
Texas margin tax decreased by $0.5 million and ad valorem taxes increased by
$0.6 million primarily due to the taxes in Appalachia being based on 2008
revenues.
Interest
expense declined to $4.3 million for the year ended December 31, 2009 compared
to $5.5 million for the year ended December 31, 2008 primarily due to lower
interest rates and lower average outstanding debt for the year ended December
31, 2009.
Year
Ended December 31, 2008 Compared to Year Ended December 31, 2007
Revenues
Natural
gas, natural gas liquids and oil sales increased $34.3 million to $68.8 million
during the year ended December 31, 2008 as compared to the same period in 2007.
The key revenue measurements were as follows:
|
Year Ended
December
31,
|
Percentage
Increase
(Decrease)
|
|||||||||
|
2008
|
2007
|
|||||||||
|
Net
Natural Gas Production:
|
||||||||||
|
Appalachian
gas (MMcf)
|
3,578
|
4,044
|
(12)
|
%
|
||||||
|
Permian
gas (MMcf)
|
185
|
(1)
|
—
|
N/A
|
||||||
|
South
Texas gas (MMcf)
|
428
|
(2)
|
—
|
N/A
|
||||||
|
Total
natural gas production (MMcf)
|
4,191
|
4,044
|
4
|
%
|
||||||
|
Average
Appalachian daily gas production (Mcf/day)
|
9,777
|
11,080
|
(12)
|
%
|
||||||
|
Average
Permian daily gas production (Mcf/day)
|
505
|
(1)
|
—
|
N/A
|
||||||
|
Average
South Texas daily gas production (Mcf/day)
|
1,168
|
(2)
|
—
|
N/A
|
||||||
|
Average
Vanguard daily gas production (Mcf/day)
|
11,450
|
11,080
|
3
|
%
|
||||||
|
Average
Natural Gas Sales Price per Mcf:
|
||||||||||
|
Net
realized gas price, including hedges
|
$10.49
|
(3)
|
$8.92
|
(3)
|
18
|
%
|
||||
|
Net
realized gas price, excluding hedges
|
$10.38
|
$8.04
|
29
|
%
|
||||||
|
Net
Oil Production:
|
||||||||||
|
Appalachian
oil (Bbls)
|
48,977
|
30,629
|
60
|
%
|
||||||
|
Permian
oil (Bbls)
|
212,599
|
(1)
|
—
|
N/A
|
||||||
|
Total
oil (Bbls)
|
261,576
|
30,629
|
754
|
%
|
||||||
|
Average
Appalachian daily oil production (Bbls/day)
|
134
|
84
|
60
|
%
|
||||||
|
Average
Permian daily oil production (Bbls/day)
|
581
|
(1)
|
—
|
N/A
|
||||||
|
Average Vanguard daily oil
production (Bbls/day)
|
715
|
84
|
751
|
%
|
||||||
|
Average
Oil Sales Price per Bbl:
|
||||||||||
|
Net
realized oil price, including hedges
|
$85.69
|
(3)
|
$66.08
|
(3)
|
30
|
%
|
||||
|
Net
realized oil price, excluding hedges
|
$91.48
|
$66.08
|
38
|
%
|
||||||
|
Net
Natural Gas Liquids Production:
|
||||||||||
|
Permian
natural gas liquids (Gal)
|
231,280
|
(1)
|
—
|
N/A
|
||||||
|
South
Texas natural gas liquids (Gal)
|
965,718
|
(2)
|
—
|
N/A
|
||||||
|
Total
natural gas liquids production (Gal)
|
1,196,998
|
—
|
N/A
|
|||||||
|
Average
Permian daily natural gas liquids production (Gal/day)
|
632
|
(1)
|
—
|
N/A
|
||||||
|
Average
South Texas daily natural gas liquids production (Gal/day)
|
2,639
|
(2)
|
—
|
N/A
|
||||||
|
Average
Vanguard daily natural gas liquids production (Gal/day)
|
3,271
|
—
|
N/A
|
|||||||
|
Average
Natural Gas Liquids Sales Price per Gal:
|
||||||||||
|
Net
realized natural gas liquids price
|
$1.18
|
—
|
N/A
|
|||||||
51
|
(1)
|
The
Permian acquisition closed on January 31, 2008 and, as such, only eleven
months of operations are included in the year ended December 31, 2008 and
were not included in the operations of 2007. The average daily production
above is calculated based on the total number of days in the reported
period regardless of how many days an acquisition contributed production
in the reported period. The average daily production for the Permian Basin
acquisition, based on the actual number of days from the acquisition
closing date to the end of the reported period, was 552 Mcf/day of natural
gas, 635 Bbls/day of oil and 690 Gal/day of natural gas liquids during
2008.
|
|
|
(2)
|
The
Dos Hermanos acquisition closed on July 28, 2008 and, as such, only five
months of operations are included in the year ended December 31, 2008 and
were not included in the operations of 2007. The average daily production
above is calculated based on the total number of days in the reported
period regardless of how many days an acquisition contributed production
in the reported period. The average daily production for the Dos Hermanos
acquisition, based on the actual number of days from the acquisition
closing date to the end of the reported period, was 2,724 Mcf/day of
natural gas and 6,151 Gal/day of natural gas liquids during
2008.
|
|
|
(3)
|
Excludes
amortization of premiums paid and amortization of value on derivative
contracts acquired.
|
The
increase in natural gas, natural gas liquids and oil sales was due primarily to
the impact of the Permian Basin acquisition completed on January 31, 2008, the
Dos Hermanos acquisition completed on July 28, 2008 and increases in commodity
prices during the first three quarters of 2008. Production from the Permian
Basin and Dos Hermanos acquisitions contributed $25.8 million of natural gas,
natural gas liquids and oil sales for the year ended December 31, 2008. In
Appalachia, a 12% decline in natural gas production was partially offset by a
60% increase in oil production for a net production decline of 9% on an Mcfe
basis. The 60% increase in oil production was primarily due to a greater focus
on the completion of oil zones as prices increased which conversely affected the
amount of natural gas produced. However, the negative impact of the natural gas
production decline was offset by a 29% increase in the average realized natural
gas sales price received (excluding hedges) and a 38% increase in the average
realized oil price (excluding hedges).
Hedging
and Price Risk Management Activities
During
the year ended December 31, 2008, the Company recognized $0.3 million
in gains on commodity cash flow hedges. These amounts relate to derivative
contracts that the Company entered into in order to mitigate commodity price
exposure on a portion of our expected production and designated as cash flow
hedges. On November 10, 2008, the Company concluded that since January 1, 2008
the contemporaneous formal documentation it had prepared to support its initial
hedge designations and subsequent assessments for ineffectiveness in connection
with the Company’s natural gas and oil hedging program in 2008 had not met the
technical requirements to qualify for cash flow hedge accounting treatment in
accordance with ASC Topic 815 and it discontinued hedge accounting effective
January 1, 2008. The gain on commodity cash flow hedges for the year ended
December 31, 2008 relates to the amount that settled in 2008 and has been
reclassified to earnings from accumulated other comprehensive loss. During the
year ended December 31, 2008, the Company recognized a$6.6 million
realized loss on other commodity derivative contracts related to the settlements
recognized during the period and a $39.0 million gain related to the change in
fair value of derivative contracts not meeting the criteria for cash flow hedge
accounting.
The
purpose of our hedging program is to mitigate the volatility in our operating
cash flow. Depending on the type of derivative contract used, hedging generally
achieves this by the counterparty paying us when commodity prices are below the
hedged price and we pay the counterparty when commodity prices are above the
hedged price. In either case, the impact on our operating cash flow is
approximately the same. However, because the majority of our hedges are not
designated as cash flow hedges, there can be a significant amount of volatility
in our earnings when we record the change in the fair value of all of our
derivative contracts. As commodity prices fluctuate, the fair value of those
contracts will fluctuate and the impact is reflected as a non-cash, unrealized
gain or loss in our consolidated statement of operations. However, these fair
value changes that are reflected in the consolidated statement of operations
only reflect the value of the derivative contracts to be settled in the future
and do not take into consideration the value of the underlying commodity. If the
fair value of the derivative contract goes down, it means that the value of the
commodity being hedged has gone up, and the net impact to our cash flow when the
contract settles and the commodity is sold in the market will be approximately
the same. Conversely, if the fair value of the derivative contract goes up, it
means the value of the commodity being hedged has gone down and again the net
impact to our operating cash flow when the contract settles and the commodity is
sold in the market will be approximately the same.
52
Costs
and Expenses
Lease
operating expenses include third-party transportation costs, gathering and
compression fees, field personnel, and other customary charges. Lease operating
expenses in Appalachia also included a $60 per month per well administrative
charge pursuant to a management services agreement with Vinland, a $0.25 per Mcf
and $0.55 per Mcf gathering and compression charge for production from wells
drilled pre and post January 1, 2007, respectively, paid to Vinland pursuant to
a gathering and compression agreement with Vinland. Lease operating expenses
increased by $6.0 million to $11.1 million for the year ended December 31, 2008
as compared to the year months ended December 31, 2007 of which $4.8 million
related to the Permian Basin and Dos Hermanos acquisitions.
Depreciation,
depletion, amortization and accretion increased to approximately $14.9 million
for the year ended December 31, 2008 from approximately $9.0 million for the
year ended December 31, 2007 due primarily to the additional depletion recorded
on the oil and gas properties acquired in the Permian Basin and Dos Hermanos
acquisitions.
An
impairment of natural gas and oil properties in the amount of $58.9 million was
recognized during the year ended December 31, 2008 as the unamortized cost of
natural gas and oil properties exceeded the sum of the estimated future net
revenues from proved properties using period-end prices, discounted at 10% and
the lower of cost or fair value of unproved properties as a result of a decline
in natural gas and oil prices at the measurement date. The impairment
calculation did not consider the positive impact of our commodity derivative
positions as GAAP only allows the inclusion of derivatives designated as cash
flow hedges.
Selling,
general and administrative expenses include the costs of our administrative
employees and executive officers, related benefits, office leases, professional
fees and other costs not directly associated with field operations. These
expenses for the year ended December 31, 2008 increased $3.2 million as compared
to the year ended December 31, 2007. For the years ended December 31, 2008 and
2007 these expenses included a $3.6 million and $2.1million non-cash
compensation charge related to the grant of restricted Class B units to officers
and an employee, the grant of unit options to management, and the grant of
common units to board members during 2007 and 2008. The remaining increase of
$1.7 million during the year ended December 31, 2008 as compared to the same
period in 2007 is principally due to incremental costs associated with being a
public company.
Production
and other taxes include severance, ad valorem, and other taxes. Severance taxes
are a function of volumes and revenues generated from production. Ad valorem
taxes vary by state/county and are based on the value of our reserves.
Production and other taxes increased by $2.9 million for the year ended December
31, 2008 as compared to the same period in 2007 of which $2.0 million related to
the Permian Basin and Dos Hermanos acquisitions, and the remaining increase is
attributable to higher severance taxes resulting from increased revenues in
Appalachia.
Interest
expense declined to $5.5 million for the year ended December 31, 2008 compared
to $8.1 million for the year ended December 31, 2007 primarily due to lower
interest rates which more than offset the higher average outstanding debt for
the year ended December 31, 2008. All of our Predecessor’s outstanding debt was
repaid with borrowings under our reserve-based credit facility in January 2007,
including an early prepayment penalty of $2.5 million.
|
|
Critical
Accounting Policies and Estimates
|
|
|
|
The
discussion and analysis of our financial condition and results of operations are
based upon the consolidated financial statements, which have been prepared in
accordance with accounting principles generally accepted in the United States.
The preparation of these financial statements requires us to make estimates and
assumptions that affect the reported amounts of assets, liabilities, revenues
and expenses, and related disclosure of contingent assets and liabilities.
Certain accounting policies involve judgments and uncertainties to such an
extent that there is reasonable likelihood that materially different amounts
could have been reported under different conditions, or if different assumptions
had been used. We evaluate our estimates and assumptions on a regular basis. We
base our estimates on historical experience and various other assumptions that
are believed to be reasonable under the circumstances, the results of which form
the basis for making judgments about the carrying values of assets and
liabilities that are not readily apparent from other sources. Actual results may
differ from these estimates and assumptions used in preparation of our financial
statements. Below, we have provided expanded discussion of our more significant
accounting policies, estimates and judgments. We have discussed the development,
selection and disclosure of each of these with our audit committee. We believe
these accounting policies reflect our more significant estimates and assumptions
used in preparation of our financial statements. Please read Note
1 to the Notes to the Consolidated Financial Statements
included in item 8 of this Annual Report for a discussion of additional
accounting policies and estimates made by management.
53
|
|
Full-Cost
Method of Accounting for Natural Gas and Oil
Properties
|
|
|
|
The
accounting for our business is subject to special accounting rules that are
unique to the natural gas and oil industry. There are two allowable methods of
accounting for gas and oil business activities: the successful-efforts method
and the full-cost method. There are several significant differences between
these methods. Under the successful-efforts method, costs such as geological and
geophysical (G&G), exploratory dry holes and delay rentals are expensed as
incurred, where under the full-cost method these types of charges would be
capitalized to the full-cost pool. In the measurement of impairment of gas and
oil properties, the successful-efforts method of accounting follows the guidance
provided in ASC Topic 360, “Property, Plant and Equipment,” where the first
measurement for impairment is to compare the net book value of the related asset
to its undiscounted future cash flows using commodity prices consistent with
management expectations. Under the full-cost method, the net book value
(full-cost pool) is compared to the future net cash flows discounted at 10%
using commodity prices based upon the 12-month
average price (ceiling limitation). If the full-cost pool is in excess of
the ceiling limitation, the excess amount is charged as an expense.
We have
elected to use the full-cost method to account for our investment in natural gas
and oil properties. Under this method, we capitalize all acquisition,
exploration and development costs for the purpose of finding natural gas,
natural gas liquids and oil reserves, including salaries, benefits and other
internal costs directly related to these finding activities. For the years ended
December 31, 2009 and 2008, there were no internal costs capitalized.
Although some of these costs will ultimately result in no additional reserves,
we expect the benefits of successful wells to more than offset the costs of any
unsuccessful ones. In addition, gains or losses on the sale or other disposition
of natural gas and oil properties are not recognized unless the gain or
loss would significantly alter the relationship between capitalized costs and
proved reserves. Our results of operations would have been different had we used
the successful-efforts method for our natural gas and oil investments.
Generally, the application of the full-cost method of accounting results in
higher capitalized costs and higher depletion rates compared to similar
companies applying the successful-efforts method of accounting.
|
|
Full-Cost
Ceiling Test
|
|
|
|
At the
end of each quarterly reporting period, the unamortized cost of natural gas and
oil properties is limited to the sum of the estimated future net revenues from
proved properties using natural gas and oil price
based upon the 12-month average price, after giving effect to cash flow
hedge positions, for which hedge accounting is applied, discounted at 10% and
the lower of cost or fair value of unproved properties (“Ceiling Test”). In 2009
and 2008, our hedges were not considered cash flow hedges for accounting
purposes and thus the value of our hedges were not considered in our ceiling
test calculation. Prior to the effective
date, December 31, 2009, of the SEC’s Final Rule, “Modernization of Oil and Gas
Reporting,” present value of future net revenue from proved properties was
calculated based on period end natural gas and oil prices. The Final Rule
requires that prices be based upon the 12-month average price rather than a
year-end price to calculate the present value.
The
calculation of the Ceiling Test and the provision for depletion and amortization
are based on estimates of proved reserves. There are numerous uncertainties
inherent in estimating quantities of proved reserves and in projecting the
future rates of production, timing, and plan of development as more fully
discussed in “Natural gas, natural gas liquids and oil Reserve Quantities”
below. Due to the imprecision in estimating natural gas, natural gas liquids and
oil reserves as well as the potential volatility in natural gas, natural gas
liquids and oil prices and their effect on the carrying value of our proved
natural gas, natural gas liquids and oil reserves, there can be no assurance
that additional Ceiling Test write downs in the future will not be required as a
result of factors that may negatively affect the present value of proved natural
gas and oil properties. These factors include declining natural gas, natural gas
liquids and oil prices, downward revisions in estimated proved natural gas,
natural gas liquids and oil reserve quantities and unsuccessful drilling
activities.
We recorded a non-cash
ceiling test impairment of natural gas and oil properties for the year ended
December 31, 2009 of $110.2 million. The impairment for the first quarter
2009 was $63.8 million as a result of a decline in natural gas prices at the
measurement date, March 31, 2009. This impairment was calculated based on prices
of $3.65 per MMBtu for natural gas and $49.64 per barrel of crude oil. The SEC’s
Final Rule, “Modernization of Oil and Gas Reporting,” which became effective
December 31, 2009, changed the price used to calculate oil and gas reserves to a
12-month average price rather than a year-end price. As a result of declines in
natural gas and oil prices based upon the 12-month average price, we recorded an
impairment of $46.4 million in the fourth quarter of 2009. This impairment was
calculated using the 12-month average price for natural gas and oil of $3.87 per MMBtu for
natural gas and $ 61.04 per barrel of crude oil. We recorded a non-cash
ceiling test impairment of natural gas and oil properties for the year ended
December 31, 2008 of $58.9 million as a result of a decline in natural gas and
oil prices at the measurement date. This impairment was calculated
based on prices of $5.71 per MMBtu for natural gas and $41.00 per barrel of
crude oil. No ceiling test impairment was required during
2007.
|
|
Asset
Retirement Obligation
|
54
|
|
We have obligations to remove tangible equipment and
restore land at the end of a natural gas or oil well’s life. Our removal and
restoration obligations are primarily associated with plugging and abandoning
wells. Estimating the future plugging and abandonment costs requires management
to make estimates and judgments inherent in the present value calculation of the
future obligation. These include ultimate plugging and abandonment costs,
inflation factors, credit adjusted discount rates, and timing of the obligation.
To the extent future revisions to these assumptions impact the present value of
the existing asset retirement obligation liability, a corresponding adjustment
is made to the natural gas and oil property balance.
|
|
Natural
Gas, Natural Gas Liquids and Oil Reserve
Quantities
|
|
|
|
Proved
reserves are defined by the SEC as those volumes of crude oil, condensate,
natural gas liquids and natural gas that geological and engineering data
demonstrate with reasonable certainty are recoverable from known reservoirs
under existing economic and operating conditions. Proved developed reserves are
volumes expected to be recovered through existing wells with existing equipment
and operating methods. Although our external engineers are knowledgeable of and
follow the guidelines for reserves as established by the SEC, the estimation of
reserves requires the engineers to make a significant number of assumptions
based on professional judgment. Estimated reserves are often subject to future
revision, certain of which could be substantial, based on the availability of
additional information, including: reservoir performance, new geological and
geophysical data, additional drilling, technological advancements, price changes
and other economic factors. Changes in oil and natural gas prices can lead to a
decision to start-up or shut-in production, which can lead to revisions to
reserve quantities. Reserve revisions inherently lead to adjustments of
depreciation rates used by us. We cannot predict the types of reserve revisions
that will be required in future periods.
In
addition, the SEC has not reviewed our or any reporting company’s reserve
estimates under the new rules and has released only limited interpretive
guidance regarding reporting of reserve estimates under the new rules and may
not issue further interpretive guidance on the new rules. Accordingly, while the
estimates of our proved reserves at December 31, 2009 included in this report
have been prepared based on what we and our independent reserve engineers
believe to be reasonable interpretations of the new SEC rules, those estimates
could differ materially from any estimates we might prepare applying more
specific SEC interpretive guidance.
|
|
Revenue
Recognition
|
|
|
|
Sales of
natural gas, natural gas liquids and oil are recognized when natural gas,
natural gas liquids and oil have been delivered to a custody transfer point,
persuasive evidence of a sales arrangement exists, the rights and responsibility
of ownership pass to the purchaser upon delivery, collection of revenue from the
sale is reasonably assured, and the sales price is fixed or determinable. We
sell natural gas, natural gas liquids and oil on a monthly basis. Virtually all
of our contracts’ pricing provisions are tied to a market index, with certain
adjustments based on, among other factors, whether a well delivers to a
gathering or transmission line, quality of the natural gas or oil, and
prevailing supply and demand conditions, so that the price of the natural gas,
natural gas liquids and oil fluctuates to remain competitive with other
available natural gas, natural gas liquids and oil supplies. As a result, our
revenues from the sale of natural gas, natural gas liquids and oil will suffer
if market prices decline and benefit if they increase without consideration of
hedging. We believe that the pricing provisions of our natural gas, natural gas
liquids and oil contracts are customary in the industry.
The
Company has elected the entitlements method to account for gas production
imbalances. Gas imbalances occur when we sell more or less than our entitled
ownership percentage of total gas production. Any amount received in excess of
our share is treated as a liability. If we receive less than our entitled share
the underproduction is recorded as a receivable. We did not have any significant
gas imbalance positions at December 31, 2009 or 2008.
|
|
Price
Risk Management Activities
|
|
|
|
We
periodically use derivative financial instruments to achieve a more predictable
cash flow from our natural gas and oil production by reducing our exposure to
price fluctuations. Currently, these derivative financial instruments include
fixed-price swaps and collars. The derivative instruments we established in 2007
were designated as hedges under ASC Topic 815. In connection with preparing its
quarterly report for third quarter 2008 and discussion with BDO Seidman, LLP,
the Company’s new independent registered public accounting firm, management of
the Company and the Audit Committee of its Board of Directors concluded that the
contemporaneous formal documentation it had prepared to support its initial
hedge designations and subsequent assessments for ineffectiveness in connection
with the Company’s natural gas and oil hedging program in 2008 did not meet the
technical requirements to qualify for cash flow hedge accounting treatment in
accordance with ASC Topic 815. The primary reasons for this determination were
that the formal hedge documentation lacked specificity of the hedged cash flow
and the quantitative subsequent assessments for ineffectiveness were
insufficient. Therefore, the cash flow designations failed to meet hedge
documentation requirements for cash flow hedge accounting treatment. In
addition, the natural gas derivative swap contracts entered into in 2007 were
de-designated as cash flow hedges in the first quarter of 2008 due to an
overhedged position in natural gas which made them ineffective.
55
Under ASC
Topic 815, the fair value of hedge contracts is recognized in the consolidated
balance sheets as an asset or liability, and the change in fair value of the
hedge contracts are reflected in earnings. If the hedge contracts
qualify for hedge accounting treatment, the fair value of the hedge contract is
recorded in “accumulated other comprehensive income,” and changes in the fair
value do not affect net income until the contract is settled. If the hedge
contract does not qualify for hedge accounting treatment, the change in the fair
value of the hedge contract is reflected in earnings during the period as gain
or loss on other commodity derivatives. Under the cash flow hedge accounting
treatment used by the Company in 2007, the fair values of the hedge contracts
were recognized in the consolidated balance sheets with the resulting unrealized
gain or loss recorded initially in accumulated other comprehensive income and
later reclassified through earnings when the hedged production affected
earnings. As a result of the determination that the documentation failed to meet
cash flow hedge accounting treatment, the unrealized gain or loss on other
commodity derivatives was recorded in the consolidated statements of operations
as a component of revenues in 2008. In addition, the net derivative loss at
December 31, 2007 related to the de-designated natural gas derivative contracts
entered into in 2007 is reported in accumulated other comprehensive income until
the month in which the transactions settle.
Our
Predecessor did not specifically designate the derivative instruments
established in 2006 as hedges under ASC Topic 815. In January 2007, we
terminated existing hedges at a cost of approximately $2.8 million, of which
$0.8 million is reflected as a realized loss on commodity cash flow hedges on
the statement of operations for the year ended December 31,
2007.
|
|
Stock
Based Compensation
|
|
|
|
We
account for Stock Based Compensation pursuant to ASC Topic 718
“Compensation-Stock Compensation” (“ASC Topic 718”). ASC Topic 718 requires an
entity to recognize the grant-date fair-value of stock options and other
equity-based compensation issued to employees in the income statement. It
establishes fair value as the measurement objective in accounting for
share-based payment arrangements and requires all companies to apply a
fair-value-based measurement method in accounting for generally all share-based
payment transactions with employees. On March 29, 2005, the SEC staff
issued SAB No. 107, Share-Based Payment, to express the views of the staff
regarding the interaction between ASC Topic 718 and certain SEC rules and
regulations and to provide the staff’s views regarding the valuation of
share-based payment arrangements for public companies.
In April
2007, the sole member at that time reserved 460,000 restricted Class B units in
VNR for issuance to employees. Certain members of management were granted
365,000 restricted Class B units in VNR in April 2007, which vested two years
from the date of grant. In addition, another 55,000 restricted VNR Class B units
were issued in August 2007 to two other employees that were hired in April and
May of 2007, which will vest after three years. The remaining 40,000 restricted
Class B units were not granted and are not expected to be granted in the future.
In October 2007 and February 2008, four board members were granted 5,000 common
units each of which vested after one year. Additionally, in October 2007, two
officers were granted options to purchase an aggregate of 175,000 units under
our long-term incentive plan with an exercise price equal to the initial public
offering price of $19.00 which vested immediately upon being granted and had a
fair value of $0.1 million on the date of grant. The grant date fair value for
these option awards was calculated in accordance with ASC Topic 718, by
calculating the Black-Scholes value of each option, using a volatility rate of
12.18%, an expected dividend yield of 8.95% and a discount rate of 5.12%, and
multiplying the Black-Scholes value by the number of options awarded. In
determining a volatility rate of 12.18%, the Company, due to a lack of
historical data regarding the Company’s common units, used the historical
volatility of the Citigroup MLP Index over the 365 day period prior to the date
of grant.
Furthermore,
on January 1, 2009 and March 27, 2008, in accordance with their previously
negotiated employment agreements, phantom units were granted to two officers in
amounts equal to 1% of our units outstanding at January 1, 2009 and 2008. The
2008 phantom units expired on December 31, 2008 and no liability or expense was
recognized as there was no appreciation in the value of the units. The amount in
connection with the 2009 phantom units was paid in cash and in units at the
election of the officers and is equal to the appreciation in value of the units
from the date of the grant (January 1, 2009) until the determination date
(December 31, 2009), plus cash distributions paid on the units, less an 8%
hurdle rate. At December 31, 2009, an accrued liability and unit-based
compensation expense of $4.3 million has been recognized in selling, general and
administrative line item in the consolidated statement of operations, of which
$0.4 million is non-cash compensation expense.
On
January 7, 2009, four board members were granted 5,000 common units each which
vested in January 2010 and on February 27, 2009, employees were granted a total
of 17,950 units which vested in February 2010.
In
February 2010, the Company and VNRH entered into second amended and restated
Executive Employment Agreements (the “Amended Agreements”) with Scott W, Smith,
our President and Chief Executive Officer, and Richard A. Robert, our Executive
Vice President and Chief Financial Officer. The Amended Agreements provide
for each executive to receive 15,000 restricted units granted pursuant to the
Vanguard Natural Resources, LLC Long-Term Incentive Plan (the “LTIP”), as well
as an annual grant of 15,000 phantom units granted pursuant to the LTIP. The
restricted units are subject to a vesting period of three years. One-third
of the aggregate number of the units will vest on each one-year anniversary of
the date of grant so long as the executive remains continuously employed with
the Company. The phantom units are also subject to a three year vesting
period, although the vesting is not pro-rata, but a one-time event which shall
occur on the three year anniversary of the date of grant so long as the
executive remains continuously employed with the Company during such time. The
phantom units are accompanied by dividend equivalent rights, which entitle the
executives to receive the value of any dividends made by the Company on its
units generally with respect to the number of phantom shares that executive
received pursuant to this grant.
56
These
common units, Class B units, options and phantom units were granted as partial
consideration for services to be performed under employment contracts and thus
are subject to accounting for these grants under ASC Topic 718. With respect to
the restricted Class B units granted to employees and the common units
granted to directors and employees, we expect to incur $0.7 million in non-cash
compensation expense for the year 2010. For the years ended December 31,
2009, 2008 and 2007, we recorded $2.5 million, $3.6 million and
$2.1 million of non-cash compensation expense, respectively.
|
|
Recently
Adopted Accounting Pronouncements
|
|
|
|
Effective
July 1, 2009, the FASB’s ASC became the single official source of authoritative,
nongovernmental GAAP in the United States. The historical GAAP hierarchy was
eliminated, and the ASC became the only level of authoritative GAAP, other than
guidance issued by the SEC. Our accounting policies were not affected by the
conversion to ASC. However, references to specific accounting standards in the
footnotes to our consolidated financial statements have been changed to refer to
the appropriate section of ASC.
In
September 2006, the FASB issued guidance which defines fair value, establishes
the framework for measuring fair value and expands disclosures about fair value
measurements. This guidance is contained in ASC Topic 820, “Fair
Value Measurements and Disclosures” (“ASC Topic 820”). In February 2008, the
FASB deferred the effective date applicable to us to January 1, 2009 for all
nonfinancial assets and liabilities, except for those that are recognized or
disclosed at fair value on a recurring basis (that is, at least
annually). On January 1, 2008, we adopted the provisions of ASC Topic
820, as it relates to financial assets and financial liabilities and we
determined that the impact of the additional assumptions on fair value
measurements did not have a material effect on our financial position or results
of operations. We adopted the deferred provisions of ASC Topic 820 on January 1,
2009, as it relates to nonfinancial assets and nonfinancial liabilities, and the
adoption did not have a material impact on our financial position or results of
operations. See Note 6 on Part II—Item 8—Notes to Consolidated Financial
Statements for further discussion.
In April
2009, the FASB issued additional guidance for estimating fair value in
accordance with ASC Topic 820. The additional guidance addresses determining
fair value when the volume and level of activity for an asset or liability have
significantly decreased and identifying transactions that are not orderly. We
adopted the provisions of this guidance on June 30, 2009 and the adoption did
not have a material impact on our consolidated financial
statements.
In
December 2007, the FASB issued guidance which established principles and
requirements for how an acquirer recognizes and measures in its financial
statements the identifiable assets acquired, the liabilities assumed, any
non-controlling interest in the acquiree and the goodwill acquired in the
business combination. This guidance is contained in ASC Topic 805, “Business
Combinations” (“ASC Topic 805”). This guidance also established disclosure
requirements that will enable users to evaluate the nature and financial effects
of the business combination. Effective January 1, 2009, we adopted the
provisions of ASC Topic 805 and applied the provisions to our acquisitions
completed in the third and fourth quarters of 2009. See Note 2 on Part II—Item
8—Notes to Consolidated Financial Statements for further
discussion.
In April
2009, the FASB issued additional guidance which amended the provisions related
to the initial recognition and measurement, subsequent measurement and
disclosure of assets and liabilities arising from contingencies in a business
combination under ASC Topic 805. The requirements of ASC Topic 805 were carried
forward for acquired contingencies, which would require that such contingencies
be recognized at fair value on the acquisition date if fair value can be
reasonably estimated during the allocation period. Otherwise, companies would
typically account for the acquired contingencies in accordance with ASC Topic
450, “Contingencies.” The adoption of the provisions in this additional guidance
did not affect our consolidated financial statements.
In March
2008, the FASB issued guidance intended to improve financial reporting about
derivative instruments and hedging activities by requiring enhanced disclosures
to enable investors to better understand their effects on an entity’s financial
position, financial performance, and cash flows. This guidance is contained in
ASC Topic 815, “Derivatives and Hedging” (“ASC Topic 815”). The guidance
achieves these improvements by requiring disclosure of the fair values of
derivative instruments and their gains and losses in a tabular format. It also
provides more information about an entity’s liquidity by requiring disclosure of
derivative features that are credit risk-related. Finally, it requires
cross-referencing within footnotes to enable financial statement users to locate
important information about derivative instruments. Effective January 1, 2009,
we adopted the provisions of ASC Topic 815, and the adoption did not have a
material impact on our consolidated financial statements. See Note 5 on Part
II—Item 8—Notes to Consolidated Financial Statements for further
discussion.
57
In April
2009, the FASB issued guidance which amends disclosures about fair values of
financial instruments and interim financial reporting to require disclosures
about fair value of financial instruments in interim financial statements. This
guidance is contained in ASC Topic 825, “Financial Instruments” (“ASC Topic
825”). We adopted the provisions of ASC Topic 825 on June 30, 2009 and the
adoption did not have a material impact on our consolidated financial
statements.
In May
2009, the FASB issued general standards of accounting for and disclosure of
events that occur after the balance sheet date but before financial statements
are issued or are available to be issued. This guidance is contained in ASC
Topic 855, “Subsequent Events” (“ASC Topic 855”). In particular, this guidance
sets forth: (1) the period after the balance sheet date during which management
of a reporting entity should evaluate events or transactions that may occur for
potential recognition or disclosure in the financial statements; (2) the
circumstances under which an entity should recognize events or transactions
occurring after the balance sheet date in its financial statements; and (3) the
disclosures that an entity should make about events or transactions that
occurred after the balance sheet date. In accordance with this guidance, an
entity should apply the requirements to interim or annual financial periods
ending after June 15, 2009. We adopted the provisions of ASC Topic 855 effective
June 30, 2009. In February 2010, the FASB issued Accounting Standards Update No.
2010-09 (“ASC Update 2010-09”), an update to ASC Topic 855. Among other
provisions, this update provides that an entity that is an SEC filer is not
required to disclose the date through which subsequent events have been
evaluated. We adopted the provisions of ASC Update 2010-09 on its effective
date, February 24, 2010. The adoption of the provisions of ASC Topic
855 and ASC Update 2010-09 did not have a material impact on our consolidated
financial statements. See Note 13 on Part II—Item 8—Notes to Consolidated
Financial Statements for discussion of subsequent events.
In
December 2008, the SEC published a Final Rule, “Modernization of Oil and
Gas Reporting.” The new rule permits the use of new technologies to determine
proved reserves if those technologies have been demonstrated to lead to reliable
conclusions about reserves volumes. The new requirements also allow companies to
disclose their probable and possible reserves to investors. In addition, the new
disclosure requirements require companies to: (1) report the independence and
qualifications of its reserves preparer or auditor, (2) file reports when a
third party is relied upon to prepare reserves estimates or to conduct a
reserves audit, and (3) report oil and gas reserves using the 12-month
unweighted average of first-day-of-the-month price (the “12-month average
price”) rather than the year-end price. The use of average prices as of December
31, 2009 affected our fourth quarter 2009 depletion and impairment calculations
and will affect future calculations. In January 2010, the FASB issued Accounting
Standards Update 2010-03, “Extractive Activities-Oil and Gas (Topic 932) Oil and
Gas Reserve Estimation and Disclosures” (“ASC Update 2010-3”), in order to align
the oil and gas reserve estimation and disclosures requirements of “Extractive
Activities-Oil and Gas (Topic 932)” with the requirements in the SEC’s Final
Rule. The main provisions of Update 2010-03, (1) expand the definition of
oil-and gas-producing activities to include the extraction of saleable
hydrocarbons, in the solid, liquid, or gaseous state, from oil sands, shale,
coalbeds, or other nonrenewable natural resources that are intended to be
upgraded into synthetic oil or gas, and activities undertaken with a view to
such extraction; (2) amend the definition of proved oil and gas reserves to
indicate that entities must use the 12-month average price covered by the report
rather than the year-end price when estimating whether reserve quantities are
economical to produce and when calculating the aggregate amount and change in
future cash inflows related to the standardize measure of discounted cash flows;
(3) require that an entity disclose separately information about reserve
quantities and financial statement amounts for geographic areas that
represent 15 percent or more of proved reserves; and (4) expand the disclosure
requirements for equity method investments. We adopted the Final Rule and the
amendments to Topic 932 on December 31, 2009 and the adoption increased our
fourth quarter 2009 depletion expense by $0.4 million and our impairment by
$46.4 million. The adoption also resulted in a downward adjustment of 10.6 Bcfe
to our total proved reserves and a downward adjustment of $152.2 million to the
standardized measure of discounted future net cash flows as of December 31,
2009.
In August
2009, the FASB issued Accounting Standards Update No. 2009-05 (“ASC Update
2009-05”), an update to ASC Topic 820. This update provides amendments to reduce
potential ambiguity in financial reporting when measuring the fair value of
liabilities. Among other provisions, this update provides clarification that in
circumstances in which a quoted price in an active market for the identical
liability is not available, a reporting entity is required to measure fair value
using one or more of the valuation techniques described in ASC Update 2009-05.
We adopted the provisions of ASC Update 2009-05 on its effective date, December
31, 2009 and the adoption did not have a material impact on our consolidated
financial statements.
|
New
Pronouncements Issued But Not Yet Adopted
|
|
|
|
In June
2009, the FASB issued guidance to change financial reporting by enterprises
involved with variable interest entities (“VIEs”). The standard replaces the
quantitative-based risks and rewards calculation for determining which
enterprise has a controlling financial interest in a VIE with an approach
focused on identifying which enterprise has the power to direct the activities
of a VIE and the obligation to absorb losses of the entity or the right to
receive the entity’s residual returns. This standard was effective for us on
January 1, 2010. We do not have any interests in variable interest entities;
therefore, this standard did not have any impact on our consolidated financial
statements.
58
In
January 2010, the FASB issued authoritative guidance intended to improve
disclosures about fair value measurements. The guidance requires entities to
disclose significant transfers in and out of fair value hierarchy levels and the
reasons for the transfers and to present information about purchases, sales,
issuances and settlements separately in the reconciliation of fair value
measurements using significant unobservable inputs (Level 3). Additionally, the
guidance clarifies that a reporting entity should provide fair value
measurements for each class of assets and liabilities and disclose the inputs
and valuation techniques used for fair value measurements using significant
other observable inputs (Level 2) and significant unobservable inputs (Level 3).
This guidance is effective for interim and annual periods beginning after
December 15, 2009 except for the disclosures about purchases, sales,
issuances and settlements in the Level 3 reconciliation, which will be effective
for interim and annual periods beginning after December 15, 2010. As this
guidance provides only disclosure requirements, the adoption of this standard
will not impact our results of operations, cash flows or financial
position.
|
|
Capital
Resources and Liquidity
|
|
|
|
Disruption
to Functioning of Capital Markets
Multiple
events during 2008 and 2009 involving numerous financial institutions
effectively restricted liquidity within the capital markets throughout the
United States and around the world. While capital markets remain volatile,
efforts by treasury and banking regulators in the United States, Europe and
other nations around the world to provide liquidity to the financial sector have
improved the situation. As evidenced by our recent successful equity offerings,
successful amendment of our reserve-based credit facility and recent successful
equity and debt offerings by our peers, we believe that our access to capital
has improved and we have been successful in improving our financial position to
date.
During
2009, our unit price increased from a closing low of $6.35 on January 2, 2009 to
a closing high of $22.07 on December 31, 2009. Also during 2009, we did not
drill any wells on our operated properties and there was limited drilling on
non-operated properties. We intend to move forward with our development drilling
program when market conditions allow for an adequate return on the drilling
investment and only when we have sufficient liquidity to do so. Maintaining
adequate liquidity may involve the issuance of debt and equity at less
attractive terms, could involve the sale of non-core assets and could require
reductions in our capital spending. In the near-term we will focus on
maximizing returns on existing assets by managing our costs, selectively
deploying capital to improve existing production and drilling a limited number
of wells which we believe will provide an adequate return on the
investment.
Overview
We have
utilized private equity, proceeds from bank borrowings, cash flow from
operations and more recently the public equity markets for capital resources and
liquidity. To date, the primary use of capital has been for the acquisition
and development of natural gas and oil properties; however, we expect to
distribute to unitholders a significant portion of our free cash flow. As
we execute our business strategy, we will continually monitor the capital
resources available to us to meet future financial obligations, planned capital
expenditures, acquisition capital and distributions to our unitholders. Our
future success in growing reserves, production and cash flow will be highly
dependent on the capital resources available to us and our success in drilling
for and acquiring additional reserves. We expect to fund our drilling
capital expenditures and distributions to unitholders with cash flow from
operations, while funding any acquisition capital expenditures that we might
incur with borrowings under our reserve-based credit facility and publicly
offered equity, depending on market conditions. As of March 5, 2010, we have
$58.3 million available to be borrowed under our reserve-based credit
facility.
The
borrowing base is subject to adjustment from time to time but not less than on a
semi-annual basis based on the projected discounted present value of estimated
future net cash flows (as determined by the bank’s petroleum engineers utilizing
the bank’s internal projection of future natural gas, natural gas liquids and
oil prices) from our proved natural gas, natural gas liquids and oil reserves.
In December 2009, our borrowing base was increased from $170.0 million to $195.0
million pursuant to an interim redetermination requested by the Company due to
the Ward County acquisition. If commodity prices decline and banks continue to
lower their internal projections of natural gas, natural gas liquids and oil
prices, it is possible that we will be subject to a decrease in our borrowing
base availability in the future. If our outstanding borrowings under the
reserve-based credit facility exceed 90% of the borrowing base, we would be
required to suspend distributions to our unitholders until we have reduced our
borrowings to below the 90% threshold. As a result, absent accretive
acquisitions, to the extent available after unitholder distributions, debt
service, and capital expenditures, it is our current intention to utilize our
excess cash flow during 2010 to reduce our borrowings under our reserve-based
credit facility. Based upon current expectations, we believe existing liquidity
and capital resources will be sufficient for the conduct of our business and
operations for the foreseeable future.
59
|
|
Cash
Flow from Operations
|
|
|
|
Net cash
provided by operating activities was $52.2 million during the year ended
December 31, 2009, compared to $39.6 million during the year ended December 31,
2008. The increase in cash provided by operating activities during the year
ended December 31, 2009 as compared to the same period in 2008 was substantially
generated from increased production volumes related to Dos Hermanos, Sun TSH and
Ward County acquisitions which had been hedged at favorable prices generating
significant realized gains on commodity derivative contracts. Changes in working
capital increased total cash flows by $1.2 million in 2009 compared to
decreasing total cash flows by $3.8 million in 2008. Contributing to the
increase in the level of cash provided by operating activities during 2009 was a
$4.7 million increase in accrued expenses that resulted primarily from the
timing effects of payments for amounts related to the phantom units granted to
officers. Offsetting this increase in cash flows from operating activities
during 2009 was a $1.9 million increase in accounts receivable related to the
timing of receipts from production from the acquisitions and a $1.2 million
decrease in payable to affiliates related to the timing of payments. Both
impairment charges and unrealized derivative gains and losses are accounted for
as non-cash items and therefore did not impact our liquidity or cash flows
provided by operating activities during the years ended December 31, 2009 or
2008.
Net cash
provided by operating activities was $39.6 million during the year ended
December 31, 2008, compared to $1.4 million during the year ended
December 31, 2007. The increase in cash provided by operating activities
during the year ended December 31, 2008 as compared to the same period in 2007
was substantially generated from increased production revenue related to the
Permian Basin and Dos Hermanos acquisitions and higher average realized prices
during 2008. Changes in working capital decreased total cash flows by $3.8
million in 2008 compared to decreasing total cash flows by $18.0 million in
2007. Contributing to the increase in the level of cash provided by operating
activities during 2008 was a $3.2 million increase in accounts payable and
accrued expenses that resulted from the timing effects of payments for amounts
related to the acquisitions. Offsetting this increase in cash flows from
operating activities during 2008 was a $2.2 million increase in accounts
receivable also related to the timing of receipts from production from the
acquisitions. Additionally, cash used in price risk management activities
decreased during the year ended December 31, 2008 as premiums paid on derivative
contracts during 2008 was $0.4 million compared to price risk management
activities in 2007, which included the termination of existing natural gas swaps
at a cost of approximately $2.8 million, the payment of $6.5 million for put
option derivative contracts and the payment of $7.5 million of premiums to reset
derivative strike prices at a higher value. The cash used in operating
activities during the year ended December 31, 2007 also included the cash paid
on early extinguishment of debt of approximately $2.5 million.
Our cash
flow from operations is subject to many variables, the most significant of which
is the volatility of natural gas, natural gas liquids and oil prices. Natural
gas, natural gas liquids and oil prices are determined primarily by prevailing
market conditions, which are dependent on regional and worldwide economic and
political activity, weather and other factors beyond our control. Future cash
flow from operations will depend on our ability to maintain and increase
production through our drilling program and acquisitions, as well as the prices
of natural gas, natural gas liquids and oil. We enter into derivative contracts
to reduce the impact of commodity price volatility on
operations. Currently, we use a combination of fixed-price swaps and NYMEX
collars to reduce our exposure to the volatility in natural gas and oil
prices. Please read “Item 1—Operations—Price Risk Management Activities”
and “Item 7A—Quantitative and Qualitative Disclosures About Market Risk” for
details about derivatives in place through 2013.
|
|
Investing
Activities—Acquisitions and Capital
Expenditures
|
Cash used
in investing activities was $109.3 million for the year ended December 31,
2009, and $119.5 million and $26.4 million for the years ended December 31,
2008 and 2007, respectively. The decrease in cash used in investing activities
was primarily attributable to $100.7 million used for the acquisition of natural
gas and oil properties in the Permian Basin and Dos Hermanos during the year
ended December 31, 2008 compared to $103.9 million used for the Sun TSH and Ward
acquisitions during the year ended December 31, 2009. In addition, the total for
the year ended December 31, 2008 includes $ 18.2 million for drilling and
development of natural gas and oil properties as compared to $5.0 million for
the year ended December 31, 2009 as a result of our decision to not drill wells
in 2009 due to low natural gas prices. The total for 2007 includes $3.6 million
for acquisitions of natural gas and oil properties, $12.8 million for drilling
and development of natural gas and oil properties and $9.8 million for deposits
on acquisition of and prepayments of natural gas and oil
properties.
Excluding
any potential acquisitions, we currently anticipate a capital budget for 2010 of
between $12.5 million and $13.5 million, which predominantly consists of
recompletions and workovers of existing wells and a limited amount of new
drilling in South Texas and the Permian Basin. This capital budget is expected
to be funded through cash from operations. As of March 5, 2010, we had
$58.3 million available for borrowing under our reserve-based credit facility.
Our current borrowing base is $195.0 million. Our next borrowing base
redetermination is scheduled for April 2010 utilizing our December 31, 2009
reserve report. If commodity prices decline and banks continue to
lower their internal projections of natural gas, natural gas liquids and oil
prices, it is possible that we will be subject to decreases in our borrowing
base availability in the future. We anticipate that our cash flow from
operations and available borrowing capacity under our reserve-based credit
facility will exceed our planned capital expenditures and other cash
requirements for the year ended December 31, 2010. However, future cash
flows are subject to a number of variables, including the level of natural gas
production and prices. There can be no assurance that operations and other
capital resources will provide cash in sufficient amounts to maintain planned
levels of capital expenditures.
60
|
|
Financing
Activities
|
|
|
|
Cash
provided by financing activities was approximately $57.6 million for year ended
December 31, 2009, compared to $76.9 million for the year ended December 31,
2008. During the year ended December 31, 2009, total net repayments under our
reserve-based credit facility were $5.2 million. Additionally, $27.1 million was
used for distributions to unitholders and $3.1 million was paid for financing
costs, compared to $20.1 million used for distribution to unitholders and $0.3
million paid for financing costs in the comparable period in 2008. Proceeds from
the equity offerings of 6.5 million common units completed in August 2009 and
December 2009 provided financing cash flows totaling $97.6 million, net of
offering costs of $0.6 million, during the year ended December 31, 2009.
Furthermore, $4.3 million was used to redeem common units held by our largest
unitholder.
Cash
provided by financing activities was approximately $76.9 million for the year
ended December 31, 2008, compared to $26.4 million for the year ended December
31, 2007. During the year ended December 31, 2008, total proceeds from
borrowings under our reserve-based credit facility, net of repayments were $97.6
million which were used to fund the Permian Basin and Dos Hermanos acquisitions.
During the year ended December 31, 2007, total proceeds from borrowings under
our reserve-based credit facility were $126.2 million, which were principally
used to pay off our Predecessor’s outstanding borrowings. Additionally, during
the year ended December 31, 2007, we completed our initial public offering which
contributed $89.9 million in financing cash flows. We also completed a private
equity offering for $41.2 million and used the net proceeds of this private
equity offering to make a distribution to VNR’s sole member at that
time.
|
|
Reserve-Based
Credit Facility
|
|
|
On
January 3, 2007, we entered into a reserve-based credit facility under which our
initial borrowing base was set at $115.5 million. Our reserve-based credit
facility was amended and restated in February 2008 to extend the maturity date
from January 2011 to March 2011, increase the maximum facility amount from
$200.0 million to $400.0 million, increase our borrowing base from $110.5
million to $150.0 million and add two additional financial institutions as
lenders, Wachovia Bank, N.A. and the Bank of Nova Scotia. The increase in the
borrowing base was principally the result of inclusion of the reserves related
to the Permian Basin acquisition in January 2008. In May 2008, our reserve-based
credit facility was amended in response to a potential acquisition that
ultimately did not occur. As a result, none of the provisions included in this
amendment went into effect. As of October 22, 2008, our reserve-based credit
facility was amended and restated to increase the borrowing base to $175.0
million and add one lender, BBVA Compass Bank. The increase in the borrowing
base was principally the result of inclusion of the reserves related to the Dos
Hermanos acquisition in July 2008. In February 2009, a third amendment was
entered into which amended covenants to allow us to repurchase up to $5.0
million of our own units. In June 2009, a fourth amendment to our reserve-based
credit facility was entered into which temporarily increased the percentage of
outstanding indebtedness for which interest rate derivatives could be used. The
percentage was increased from 75% to 85% but was to revert back to 75% in one
year at June 2010. In August 2009, our reserve-based credit facility was amended
and restated to (1) extend the maturity from March 31, 2011 to October 1, 2012,
(2) increase our borrowing base from $154.0 million to $175.0 million, (3)
increase our borrowing costs, (4) permanently allow 85% of our outstanding
indebtedness to be covered under interest rate derivatives, and (5) add two
financial institutions as lenders, Comerica Bank and Royal Bank of Canada. On
October 1, 2009, we entered into the First Amendment to our Second Amended and
Restated Credit Agreement, which reduced our borrowing base under the
reserve-based credit facility from $175.0 million to $170.0 million pursuant to
our semi-annual redetermination and changed the definition of majority lenders
from 75% to 66.67%. All other terms under the reserve-based credit facility
remained the same. In December 2009, our borrowing base was increased from
$170.0 million to $195.0 million pursuant to an interim redetermination
requested by the Company due to the Ward County acquisition. At December 31,
2009, we had $129.8 million outstanding under our reserve-based credit facility
and as of March 5, 2010, we have $58.3 million available to be borrowed
under our reserve-based credit facility.
The
borrowing base is subject to adjustment from time to time but not less than on a
semi-annual basis based on the projected discounted present value of estimated
future net cash flows (as determined by the bank’s petroleum engineers utilizing
the bank’s internal projection of future natural gas, natural gas liquids and
oil prices) from our proved natural gas, natural gas liquids and oil reserves.
In December 2009, our borrowing base was set at $195.0 million. Our next
borrowing base redetermination is scheduled for April 2010 utilizing our
December 31, 2009 reserve report. If commodity prices decline and
banks continue to lower their internal projections of natural gas, natural gas
liquids and oil prices, it is possible that we will be subject to decreases in
our borrowing base availability in the future. If our outstanding borrowings
under the reserve-based credit facility exceed 90% of the borrowing base, we
would be required to suspend distributions to our unitholders until we have
reduced our borrowings to below the 90% threshold. As a result, absent accretive
acquisitions, it is our current intention to utilize our excess cash flow during
2010 to reduce our borrowings under our reserve-based credit
facility.
61
Borrowings
under the reserve-based credit facility are available for development and
acquisition of natural gas and oil properties, working capital and general
limited liability company purposes. Our obligations under the reserve-based
credit facility are secured by substantially all of our assets.
At our
election, interest is determined by reference to:
|
·
|
the
London interbank offered rate, or LIBOR, plus an applicable margin between
2.25% and 3.00% per annum; or
|
|
·
|
a
domestic bank rate plus an applicable margin between 1.25% and 2.00% per
annum.
|
As of
December 31, 2009, we have elected for interest to be determined by reference to
the LIBOR method described above. Interest is generally payable quarterly for
domestic bank rate loans and at the applicable maturity date for LIBOR loans,
but not less frequently than quarterly.
The
reserve-based credit facility contains various covenants that limit our ability
to:
|
·
|
incur
indebtedness;
|
|
·
|
grant
certain liens;
|
|
·
|
make
certain loans, acquisitions, capital expenditures and
investments;
|
|
·
|
make
distributions;
|
|
·
|
merge
or consolidate; or
|
|
·
|
engage
in certain asset dispositions, including a sale of all or substantially
all of our assets.
|
The
reserve-based credit facility also contains covenants that, among other things,
require us to maintain specified ratios or conditions as follows:
|
·
|
consolidated
net income plus interest expense, income taxes, depreciation, depletion,
amortization, accretion, changes in fair value of derivative instruments
and other similar charges, minus all non-cash income added to consolidated
net income (which is equal to our Adjusted EBITDA), and giving pro forma
effect to any acquisitions or capital expenditures, to interest expense of
not less than 2.5 to 1.0;
|
|
·
|
consolidated
current assets, including the unused amount of the total commitments, to
consolidated current liabilities of not less than 1.0 to 1.0, excluding
non-cash assets and liabilities under ASC Topic 815, which includes the
current portion of derivative
contracts;
|
|
·
|
consolidated
debt to consolidated net income plus interest expense, income taxes,
depreciation, depletion, amortization, accretion, changes in fair value of
derivative instruments and other similar charges, minus all non-cash
income added to consolidated net income, and giving pro forma effect to
any acquisitions or capital expenditures of not more than 3.5 to
1.0.
|
We have
the ability to borrow under the reserve-based credit facility to pay
distributions to unitholders as long as there has not been a default or event of
default and if the amount of borrowings outstanding under our reserve-based
credit facility is less than 90% of the borrowing base.
We
believe that we are in compliance with the terms of our reserve-based credit
facility. If an event of default exists under the reserve-based credit
agreement, the lenders will be able to accelerate the maturity of the credit
agreement and exercise other rights and remedies. Each of the following will be
an event of default:
62
|
·
|
failure
to pay any principal when due or any interest, fees or other amount within
certain grace periods;
|
|
·
|
a
representation or warranty is proven to be incorrect when
made;
|
|
·
|
failure
to perform or otherwise comply with the covenants in the credit agreement
or other loan documents, subject, in certain instances, to certain grace
periods;
|
|
·
|
default
by us on the payment of any other indebtedness in excess of $2.0 million,
or any event occurs that permits or causes the acceleration of the
indebtedness;
|
|
·
|
bankruptcy
or insolvency events involving us or our
subsidiaries;
|
|
·
|
the
entry of, and failure to pay, one or more adverse judgments in excess of
$1.0 million or one or more non-monetary judgments that could reasonably
be expected to have a material adverse effect and for which enforcement
proceedings are brought or that are not stayed pending
appeal;
|
|
·
|
specified
events relating to our employee benefit plans that could reasonably be
expected to result in liabilities in excess of $1.0 million in any year;
and
|
|
·
|
a
change of control, which includes (1) an acquisition of ownership,
directly or indirectly, beneficially or of record, by any person or group
(within the meaning of the Securities Exchange Act of 1934 and the rules
of the SEC) of equity interests representing more than 25% of the
aggregate ordinary voting power represented by our issued and outstanding
equity interests other than by Majeed S. Nami or his affiliates, or (2)
the replacement of a majority of our directors by persons not approved by
our board of directors.
|
|
|
|
|
|
Off-Balance
Sheet Arrangements
|
|
|
We have
no guarantees or off-balance-sheet debt to third parties, and we maintain no
debt obligations that contain provisions requiring accelerated payment of the
related obligations in the event of specified levels of declines in credit
ratings.
|
|
Contingencies
|
|
|
The
Company regularly analyzes current information and accrues for probable
liabilities on the disposition of certain matters, as necessary. Liabilities for
loss contingencies arising from claims, assessments, litigation and other
sources are recorded when it is probable that a liability has been incurred and
the amount can be reasonably estimated. As of December 31, 2009, there were
no material loss contingencies.
|
|
Commitments
and Contractual Obligations
|
|
|
A summary
of our contractual obligations as of December 31, 2009 is provided in the
following table.
|
Payments Due by Year (in thousands)
|
||||||||||||||||||||||||||||
|
|
2010
|
2011
|
2012
|
2013
|
2014
|
After 2014
|
Total
|
|||||||||||||||||||||
|
Management
base salaries (1)
|
$ | 683 | $ | 570 | $ | 570 | $ | — | $ | — | $ | — | $ | 1,823 | ||||||||||||||
|
Asset
retirement obligations
|
— | 307 | 73 | 95 | 117 | 3,828 | 4,420 | |||||||||||||||||||||
|
Derivative
liabilities
|
6,399 | 7,945 | 882 | 401 | — | — | 15,627 | |||||||||||||||||||||
|
Long-term
debt (2)
|
— | — | 129,800 | — | — | — | 129,800 | |||||||||||||||||||||
|
Operating
leases (3)
|
117 | 122 | 130 | 33 | — | — | 402 | |||||||||||||||||||||
|
Total
|
$ | 7,199 | $ | 8,944 | $ | 131,455 | 529 | $ | 117 | $ | 3,828 | $ | 152,072 | |||||||||||||||
63
|
(1)
|
Includes
annual base salaries under second amended and restated executive
employment agreements entered into in February 2010.
|
|
|
(2)
|
This
table does not include interest to be paid on the principal balances shown
as the interest rates on the reserve-based credit facility are
variable.
|
|
|
(3)
|
Includes
lease agreement entered into in February 2010 which expires in
February 2013.
|
The
primary objective of the following information is to provide forward-looking
quantitative and qualitative information about our potential exposure to market
risks. The term “market risk” refers to the risk of loss arising from adverse
changes in natural gas, natural gas liquids and oil prices and interest rates.
The disclosures are not meant to be precise indicators of expected future
losses, but rather indicators of reasonably possible losses. This
forward-looking information provides indicators of how we view and manage our
ongoing market risk exposures. All of our market risk sensitive instruments were
entered into for purposes other than speculative trading. Conditions sometimes
arise where actual production is less than estimated, which has, and could
result in overhedged volumes.
|
|
Commodity Price
Risk
|
Our major market risk exposure is in the pricing applicable to our
natural gas, natural gas liquids and oil production. Realized pricing is
primarily driven by the Columbia Gas Appalachian Index (“TECO Index”), Henry Hub
and Houston Ship Channel prices for natural gas production and the West Texas
Intermediate Light Sweet price for oil production. Pricing for natural gas,
natural gas liquids and oil production has been volatile and unpredictable for
several years, and we expect this volatility to continue in the future. The
prices we receive for production depend on many factors outside our control. In
addition, the potential exists that if commodity prices decline to a certain
level, the borrowing base can be decreased at the borrowing base redetermination
date to an amount lower than the amount of debt currently outstanding and,
because it would be uneconomical, production could decline to levels below our
hedged volumes.
Furthermore,
the risk that we
will be required to write down the carrying value of our natural gas and oil
properties increases when oil and gas prices are low or volatile. In addition,
write downs may occur if we experience substantial downward adjustments to our
estimated proved reserves, or if estimated future development costs increase.
For example, natural gas, natural gas liquids and oil prices were very volatile
throughout 2009. We recorded a non-cash ceiling test impairment of natural gas
and oil properties for the year ended December 31, 2009 of $110.2 million. The
impairment for the first quarter 2009 was $63.8 million as a result of a
decline in natural gas prices at the measurement date, March 31, 2009. This
impairment was calculated based on prices of $3.65 per MMBtu for natural gas and
$49.64 per barrel of crude oil. The SEC’s Final Rule, “Modernization of Oil and
Gas Reporting,” which became effective December 31, 2009, changed the price used
to calculate oil and gas reserves to a 12-month average price rather than a
year-end price. As a
result of declines in natural gas and oil prices based upon the 12-month average
price, we recorded an impairment of $46.4 million in the fourth quarter of 2009.
This impairment was calculated using the 12-month average price for
natural gas and oil of $3.87 per MMBtu for
natural gas and $ 61.04 per barrel of crude oil. Additionally, if natural
gas prices decline by $1.00 per MMBtu and oil prices declined by $6.00 per
barrel, the standardized measure of our proved reserves as of December 31,
2009 would decrease from $178.7 million to $115.8 million, based on price
sensitivity generated from an internal evaluation. This sensitivity analysis is
calculated using a natural gas price of $2.87 per MMBTU ($3.87 year-end price
less $1.00 (or 26% )) and an oil price of $55.04 per barrel of crude oil ($61.04
year-end price less $6.00 (or 10%)).
We enter
into derivative contracts with respect to a portion of our projected natural gas
and oil production through various transactions that mitigate the volatility of
future prices received. These transactions may include price swaps whereby we
will receive a fixed-price for our production and pay a variable market price to
the contract counterparty. Additionally, we may acquire put options for which we
pay the counterparty an option premium, equal to the fair value of the option at
the purchase date. As each monthly contract settles, we receive the excess, if
any, of the fixed floor over the floating rate. Furthermore, we may enter into
collars where we pay the counterparty if the market price is above the ceiling
price and the counterparty pays us if the market price is below the floor on a
notional quantity. In deciding which type of derivative instrument to use, our
management considers the relative benefit of each type against any cost that
would be incurred, prevailing commodity market conditions and management’s view
on future commodity pricing. The amount of natural gas and oil production which
is hedged is determined by applying a percentage to the expected amount of
production in our most current reserve report in a given year. Typically,
management intends to hedge 75% to 95% of projected production for a three year
period. These activities are intended to support our realized commodity prices
at targeted levels and to manage our exposure to natural gas and oil price
fluctuations. It is never management’s intention to hold or issue derivative
instruments for speculative trading purposes. Management will consider
liquidating a derivative contract if they believe that they can take advantage
of an unusual market condition allowing them to realize a current gain and then
have the ability to enter into a new derivative contract in the future at or
above the commodity price of the contract that was
liquidated.
64
At
December 31, 2009, the fair value of commodity derivative contracts was an
asset of approximately $21.3 million, of which $16.2 million settle during the
next twelve months. A 10% increase in the gas and oil index price above the
December 31, 2009 price would result in a decrease in the fair value of all
of our commodity derivative contracts of approximately $14.5 million;
conversely, a 10% decrease in the gas and oil index price would result in an
increase of approximately $14.5 million. This sensitivity analysis measures the
current value of the Company’s commodity derivative contracts using forward
price curves and volatility surfaces under a proprietary system and then
increases or decreases, as applicable, the forward price curve to determine the
fair value of the commodity derivative contracts under the assumed natural gas
and oil price indexes.
The
following table summarizes commodity derivative contracts in place at
December 31, 2009:
|
2010
|
2011
|
2012
|
2013
|
|||||||||||||
|
Gas
Positions:
|
||||||||||||||||
|
Fixed
Price Swaps:
|
||||||||||||||||
|
Notional
Volume (MMBtu)
|
4,731,040 | 3,328,312 | — | — | ||||||||||||
|
Fixed
Price ($/MMBtu)
|
$ | 8.66 | $ | 7.83 | $ | — | $ | — | ||||||||
|
Collars:
|
||||||||||||||||
|
Notional
Volume (MMBtu)
|
1,607,500 | 1,933,500 | — | — | ||||||||||||
|
Floor
Price ($/MMBtu)
|
$ | 7.73 | $ | 7.34 | $ | — | $ | — | ||||||||
|
Ceiling
Price ($/MMBtu)
|
$ | 8.92 | $ | 8.44 | $ | — | $ | — | ||||||||
|
Total:
|
||||||||||||||||
|
Notional
Volume (MMBtu)
|
6,338,540 | 5,261,812 | — | — | ||||||||||||
|
Oil
Positions:
|
||||||||||||||||
|
Fixed
Price Swaps:
|
||||||||||||||||
|
Notional
Volume (Bbls)
|
310,250 | 260,750 | 137,250 | 118,625 | ||||||||||||
|
Fixed
Price ($/Bbl)
|
$ | 85.93 | $ | 86.12 | $ | 88.13 | $ | 88.42 | ||||||||
|
Collars:
|
||||||||||||||||
|
Notional
Volume (Bbls)
|
— | — | 45,750 | 45,625 | ||||||||||||
|
Floor
Price ($/Bbl)
|
$ | — | $ | — | $ | 80.00 | $ | 80.00 | ||||||||
|
Ceiling
Price ($/Bbl)
|
$ | — | $ | — | $ | 100.25 | $ | 100.25 | ||||||||
|
Total:
|
||||||||||||||||
|
Notional
Volume (Bbls)
|
310,250 | 260,750 | 183,000 | 164,250 | ||||||||||||
|
|
Interest
Rate Risks
|
|
|
|
At
December 31, 2009, we had debt outstanding of $129.8 million, which
incurred interest at floating rates based on LIBOR in accordance with our
reserve-based credit facility and if the debt remains the same, a 1% increase in
LIBOR would result in an estimated $0.3 million increase in annual interest
expense after consideration of the interest rate swaps discussed
below.
We enter
into interest rate swaps, which require exchanges of cash flows that serve to
synthetically convert a portion of our variable interest rate obligations to
fixed interest rates. The Company records changes in the fair value of its
interest rate derivatives in current earnings under unrealized gains (losses) on
interest rate derivative contracts. During 2008, the company chose to
de-designate its interest rate swaps as cash flow hedges as the terms of new
contracts entered into in August 2008 no longer matched the terms of the
original contracts, thus causing the interest rate hedges to be ineffective. The
net unrealized gain related to the de-designated cash flow hedges is reported in
accumulated other comprehensive income and later reclassified to earnings in the
month in which the transactions settle.
65
The
following summarizes information concerning our positions in open interest rate
swaps at December 31, 2009.
|
Notional
Amount
|
Fixed
Libor
Rates
|
||||||
|
Period:
|
|||||||
|
January
1, 2010 to December 18, 2010
|
$
|
10,000,000
|
1.50
|
%
|
|||
|
January
1, 2010 to December 20, 2010
|
$
|
10,000,000
|
1.85
|
%
|
|||
|
January
1, 2010 to January 31, 2011
|
$
|
20,000,000
|
3.00
|
%
|
(1)
|
||
|
January
1, 2010 to March 31, 2011
|
$
|
20,000,000
|
2.08
|
%
|
|||
|
January
1, 2010 to December 10, 2012
|
$
|
20,000,000
|
3.35
|
%
|
|||
|
January
1, 2010 to January 31, 2013
|
$
|
20,000,000
|
2.38
|
%
|
|||
|
(1)
|
In
February 2010, we extended the terms of the 3.00%, $20.0 million interest
rate swap for two additional years to January 31, 2013 and reduced the
rate from 3.00% to 2.66%.
|
66
Index
Below is
an index to the items contained in Part II— Item 8— Financial
Statements and Supplementary Data.
|
Page
|
|
All schedules are omitted as the
required information is not applicable or the information is presented in the
Consolidated Financial Statements and related notes.
67
Board of
Directors and Members
Vanguard
Natural Resources, LLC
Houston,
Texas
We have
audited the accompanying consolidated balance sheets of Vanguard Natural
Resources, LLC as of December 31, 2009 and 2008 and the related consolidated
statements of operations, comprehensive loss, members’ equity and cash flows for
the years then ended. These financial statements are the responsibility of the
Company’s management. Our responsibility is to express an opinion on
these financial statements based on our audits.
We
conducted our audits in accordance with the standards of the Public Company
Accounting Oversight Board (United States). Those standards require
that we plan and perform the audit to obtain reasonable assurance about whether
the financial statements are free of material misstatement. An audit
includes examining, on a test basis, evidence supporting the amounts and
disclosures in the financial statements, assessing the accounting principles
used and significant estimates made by management, as well as evaluating the
overall financial statement presentation. We believe that our audits
provide a reasonable basis for our opinion.
In our
opinion, the consolidated financial statements referred to above present fairly,
in all material respects, the financial position of Vanguard Natural Resources,
LLC at December 31, 2009 and 2008, and the results of its operations and its
cash flows for the years then ended, in conformity with
accounting principles generally accepted in the United States of
America.
As
discussed in Notes 1 and 2 to the consolidated financial statements, effective
January 1, 2009, the Company adopted the provisions of Accounting Standards
Codification Topic 805 “Business Combinations.” As discussed in Note 1 to the
consolidated financial statements, effective December 31, 2009, the Company
changed its reserve estimates and related disclosures as a result of adopting
new natural gas and oil reserve estimation and disclosure
requirements.
We also
have audited, in accordance with the standards of the Public Company Accounting
Oversight Board (United States), Vanguard Natural Resources, LLC's internal
control over financial reporting as of December 31, 2009, based on criteria
established in Internal
Control – Integrated Framework issued by the Committee of Sponsoring
Organizations of the Treadway Commission (COSO) and our report dated March 5,
2010 expressed an unqualified opinion thereon.
/s/ BDO
Seidman, LLP
Houston,
Texas
March 5,
2010
68
REPORT
OF INDEPENDENT REGISTERED PUBLIC ACCOUNTING FIRM
To the
Board of Directors and Unitholders of
Vanguard
Natural Resources, LLC
and
Subsidiaries
We have
audited the accompanying consolidated statements of operations, members’ equity,
cash flows and comprehensive loss of Vanguard Natural Resources, LLC (a Delaware
limited liability company) and subsidiaries (the “Company”) for the year ended
December 31, 2007. These consolidated financial statements are the
responsibility of the Company’s management. Our responsibility is to express an
opinion on these consolidated financial statements based on our
audit.
We
conducted our audit in accordance with the standards of the Public Company
Accounting Oversight Board (United States). Those standards require that we plan
and perform the audit to obtain reasonable assurance about whether the
consolidated financial statements are free of material misstatement. An audit
includes examining, on a test basis, evidence supporting the amounts and
disclosures in the consolidated financial statements. An audit also includes
assessing the accounting principles used and significant estimates made by
management, as well as evaluating the overall financial statement presentation.
We believe that our audit provides a reasonable basis for our
opinion.
In our
opinion, the consolidated financial statements referred to above present fairly,
in all material respects, the results of operations and cash flows of Vanguard
Natural Resources, LLC and subsidiaries for the year ended December 31,
2007, in conformity with accounting principles generally accepted in the United
States of America.
/s/ UHY
LLP
Houston,
Texas
March 31,
2008
69
(in
thousands, except per unit data)
|
2009
|
2008
|
2007
|
||||||||||
|
Revenues
|
||||||||||||
|
Natural gas, natural gas liquids
and oil sales
|
$
|
46,035
|
$
|
68,850
|
$
|
34,541
|
||||||
|
Gain (loss) on commodity cash
flow hedges
|
(2,380
|
)
|
269
|
(702
|
)
|
|||||||
|
Realized gain (loss) on other
commodity derivative contracts
|
29,993
|
(6,552
|
)
|
—
|
||||||||
|
Unrealized
gain (loss) on other commodity derivative contracts
|
(19,043
|
)
|
39,029
|
—
|
||||||||
|
Total
revenues
|
54,605
|
101,596
|
33,839
|
|||||||||
|
Costs
and expenses
|
||||||||||||
|
Lease operating
expenses
|
12,652
|
11,112
|
5,066
|
|||||||||
|
Depreciation, depletion,
amortization and accretion
|
14,610
|
14,910
|
8,981
|
|||||||||
|
Impairment of natural gas and oil
properties
|
110,154
|
58,887
|
—
|
|||||||||
|
Selling, general and
administrative expenses
|
10,644
|
6,715
|
3,507
|
|||||||||
|
Bad debt
expense
|
—
|
—
|
1,007
|
|||||||||
|
Production and other
taxes
|
3,845
|
4,965
|
2,054
|
|||||||||
|
Total costs and
expenses
|
151,905
|
96,589
|
20,615
|
|||||||||
|
Income
(loss) from operations
|
(97,300
|
)
|
5,007
|
13,224
|
||||||||
|
Other
income (expense)
|
||||||||||||
|
Interest
income
|
—
|
17
|
62
|
|||||||||
|
Interest
expense
|
(4,276
|
)
|
(5,491
|
)
|
(8,135
|
)
|
||||||
|
Gain
on acquisition of natural gas and oil properties
|
6,981
|
—
|
—
|
|||||||||
|
Realized loss on interest rate
derivative contracts
|
(1,903
|
)
|
(107
|
)
|
—
|
|||||||
|
Unrealized
gain (loss) on interest rate derivative contracts
|
763
|
(3,178
|
)
|
—
|
||||||||
|
Loss on extinguishment of
debt
|
—
|
—
|
(2,502
|
)
|
||||||||
|
Total other income
(expense)
|
1,565
|
(8,759
|
)
|
(10,575
|
)
|
|||||||
|
Net
income (loss)
|
$
|
(95,735
|
)
|
$
|
(3,752
|
)
|
$
|
2,649
|
||||
|
Net
income (loss) per Common and Class B units- basic &
diluted
|
$
|
(6.74
|
)
|
$
|
(0.32
|
)
|
$
|
0.39
|
||||
|
Weighted
average units outstanding:
|
||||||||||||
|
Common units – basic &
diluted
|
13,791
|
11,374
|
6,533
|
|||||||||
|
Class B units –
basic & diluted
|
420
|
420
|
279
|
|||||||||
See
accompanying notes to consolidated financial statements.
70
Consolidated
Balance Sheets
As
of December 31,
(in
thousands)
|
2009
|
2008
|
|||||||
|
Assets
|
||||||||
|
Current
assets
|
||||||||
|
Cash
and cash equivalents
|
$ | 487 | $ | 3 | ||||
|
Trade
accounts receivable, net
|
8,025 | 6,083 | ||||||
|
Derivative
assets
|
16,190 | 22,184 | ||||||
|
Other
receivables
|
2,224 | 2,763 | ||||||
|
Other
currents assets
|
1,317 | 845 | ||||||
|
Total
current assets
|
28,243 | 31,878 | ||||||
|
Natural
gas and oil properties, at cost
|
399,212 | 284,447 | ||||||
|
Accumulated
depletion, amortization and accretion
|
(226,687 | ) | (102,178 | ) | ||||
|
Natural
gas and oil properties evaluated, net – full cost method
|
172,525 | 182,269 | ||||||
|
Other
assets
|
||||||||
|
Derivative
assets
|
5,225 | 15,749 | ||||||
|
Deferred
financing costs
|
3,298 | 882 | ||||||
|
Other
assets
|
1,409 | 1,784 | ||||||
|
Total
assets
|
$ | 210,700 | $ | 232,562 | ||||
|
Liabilities
and members’ equity
|
||||||||
|
Current
liabilities
|
||||||||
|
Accounts
payable –
trade
|
$ | 766 | $ | 2,148 | ||||
|
Accounts
payable – natural
gas and oil
|
2,299 | 1,327 | ||||||
|
Payables
to affiliates
|
1,387 | 2,555 | ||||||
|
Deferred
swap premium liability
|
1,334 | — | ||||||
|
Derivative
liabilities
|
253 | 486 | ||||||
|
Phantom
unit compensation accrual
|
4,299 | — | ||||||
|
Accrued
ad valorem taxes
|
903 | 34 | ||||||
|
Accrued
expenses
|
1,178 | 1,214 | ||||||
|
Total
current liabilities
|
12,419 | 7,764 | ||||||
|
Long-term
debt
|
129,800 | 135,000 | ||||||
|
Derivative
liabilities
|
2,036 | 2,313 | ||||||
|
Deferred
swap premium liability
|
1,739 | — | ||||||
|
Asset
retirement obligations
|
4,420 | 2,134 | ||||||
|
Total
liabilities
|
150,414 | 147,211 | ||||||
|
Commitments
and contingencies (Note 9)
|
||||||||
|
Members’
equity
|
||||||||
|
Members’
capital, 18,416,173 and 12,145,873 common units issued and outstanding at
December 31, 2009 and 2008, respectively
|
59,873 | 88,550 | ||||||
|
Class B
units, 420,000 issued and outstanding at December 31, 2009 and
2008
|
5,930 | 4,606 | ||||||
|
Accumulated
other comprehensive loss
|
(5,517 | ) | (7,805 | ) | ||||
|
Total
members’ equity
|
60,286 | 85,351 | ||||||
|
Total
liabilities and members’ equity
|
$ | 210,700 | $ | 232,562 | ||||
See
accompanying notes to consolidated financial statements.
71
For
the Years Ended December 31, 2009, 2008 and 2007
(in
thousands, except per unit data)
|
Common
Units
|
Common
Units Amount
|
Class
B Units
|
Class
B Units Amount
|
Accumulated
Other Comprehensive Loss
|
Total
Members’ Equity
|
|||||||||||||||||||
|
Balance,
January 1, 2007
|
— | $ | — | — | $ | — | — | $ | — | |||||||||||||||
|
Initial
contribution
|
5,540 | 3,288 | — | — | — | 3,288 | ||||||||||||||||||
|
Sale
of private placement units
|
— | 41,220 | — | — | — | 41,220 | ||||||||||||||||||
|
Distributions
to member
|
— | (41,220 | ) | — | — | — | (41,220 | ) | ||||||||||||||||
|
Issuance
of common units, net of offering costs of $9,804
|
5,250 | 89,947 | — | — | — | 89,947 | ||||||||||||||||||
| Distributions to members | — | (5,626 | ) | — | — | — | (5,626 | ) | ||||||||||||||||
|
Unit-based
compensation
|
5 | — | 420 | 2,132 | — | 2,132 | ||||||||||||||||||
|
Net
income
|
— | 2,649 | — | — | — | 2,649 | ||||||||||||||||||
|
Settlement
of cash flow hedges in other comprehensive loss
|
— | — | — | — | (10,059 | ) | (10,059 | ) | ||||||||||||||||
|
Balance, December
31, 2007
|
10,795 | $ | 90,258 | 420 | $ | 2,132 | $ | (10,059 | ) | $ | 82,331 | |||||||||||||
|
Distributions
to members ($0.291, $0.445, $0.445 and $0.50 per unit to unitholders of
record February 7, 2008, April 30, 2008, July 31, 2008 and October 31,
2008, respectively)
|
— | (19,423 | ) | — | (706 | ) | — | (20,129 | ) | |||||||||||||||
|
Issuance
of common units for acquisition of natural gas and oil properties, net of
offering costs of $54
|
1,351 | 21,306 | — | — | — | 21,306 | ||||||||||||||||||
|
Unit-based
compensation
|
— | 161 | — | 3,180 | — | 3,341 | ||||||||||||||||||
|
Net
loss
|
— | (3,752 | ) | — | — | — | (3,752 | ) | ||||||||||||||||
|
Settlement
of cash flow hedges in other comprehensive income
|
— | — | — | — | 2,254 | 2,254 | ||||||||||||||||||
72
|
Balance at December 31,
2008
|
12,146 | $ | 88,550 | 420 | $ | 4,606 | $ | (7,805 | ) | $ | 85,351 | |||||||||||||
|
Distributions
to members ($0.50 per unit to unitholders of record January 30, 2009,
April 30, 2009, July 31, 2009 and November 6, 2009,
respectively)
|
— | (26,258 | ) | — | (840 | ) | — | (27,098 | ) | |||||||||||||||
|
Issuance
of common units, net of offering costs of $613
|
6,520 | 97,627 | — | — | — | 97,627 | ||||||||||||||||||
|
Redemption
of common units
|
(250 | ) | (4,305 | ) | — | — | — | (4,305 | ) | |||||||||||||||
|
Unit-based
compensation
|
— | (6 | ) | — | 2,164 | — | 2,158 | |||||||||||||||||
|
Net
loss
|
— | (95,735 | ) | — | — | — | (95,735 | ) | ||||||||||||||||
|
Settlement
of cash flow hedges in other comprehensive income
|
— | — | — | — | 2,288 | 2,288 | ||||||||||||||||||
|
Balance at December 31,
2009
|
18,416 | $ | 59,873 | 420 | $ | 5,930 | $ | (5,517 | ) | $ | 60,286 |
See
accompanying notes to consolidated financial statements.
73
For
the Years Ended December 31,
(in
thousands)
|
2009
|
2008
|
2007
|
||||||||
|
Operating
activities
|
||||||||||
|
Net
income (loss)
|
$
|
(95,735
|
)
|
$
|
(3,752
|
)
|
$
|
2,649
|
||
|
Adjustments
to reconcile net income (loss) to net cash provided by operating
activities:
|
||||||||||
|
Depreciation,
depletion, amortization and accretion
|
14,610
|
14,910
|
8,981
|
|||||||
|
Impairment
of natural gas and oil properties
|
110,154
|
58,887
|
—
|
|||||||
|
Amortization
of deferred financing costs
|
639
|
362
|
296
|
|||||||
|
Bad
debt expense
|
—
|
—
|
1,007
|
|||||||
|
Unit-based
compensation
|
2,483
|
3,577
|
2,132
|
|||||||
|
Non-cash
portion of phantom units granted to officers
|
393
|
—
|
—
|
|||||||
|
Amortization
of premiums paid on derivative contracts
|
3,502
|
4,493
|
4,274
|
|||||||
|
Amortization
of value on derivative contracts acquired
|
3,619
|
733
|
—
|
|||||||
|
Unrealized
(gains) losses on other commodity and interest rate derivative
contracts
|
18,280
|
(35,851
|
)
|
—
|
||||||
|
Gain
on acquisitions of natural gas and oil properties
|
(6,981
|
)
|
—
|
—
|
||||||
|
Changes
in operating assets and liabilities:
|
||||||||||
|
Trade
accounts receivable
|
(1,942
|
)
|
(2,208
|
)
|
(504
|
)
|
||||
|
Payables
to affiliates
|
(1,168
|
)
|
(1,850
|
)
|
(531
|
)
|
||||
|
Price
risk management activities, net
|
94
|
(343
|
)
|
(15,798
|
)
|
|||||
|
Other
receivables
|
539
|
(2,265
|
)
|
—
|
||||||
|
Other
current assets
|
(536
|
)
|
(345
|
)
|
(340
|
)
|
||||
|
Accounts
payable
|
(410
|
)
|
2,161
|
1,244
|
||||||
|
Accrued
expenses
|
4,739
|
1,045
|
(2,037
|
)
|
||||||
|
Other
assets
|
(125
|
)
|
—
|
—
|
||||||
|
Net
cash provided by operating activities
|
52,155
|
39,554
|
1,373
|
|||||||
|
Investing
activities
|
||||||||||
|
Additions
to property and equipment
|
(57
|
)
|
(74
|
)
|
(132
|
)
|
||||
|
Additions
to natural gas and oil properties
|
(4,960
|
)
|
(18,174
|
)
|
(12,821
|
)
|
||||
|
Acquisitions
of natural gas and oil properties
|
(103,923
|
)
|
(100,743
|
)
|
(3,650
|
)
|
||||
|
Deposits
and prepayments of natural gas and oil properties
|
(375
|
)
|
(548
|
)
|
(9,806
|
)
|
||||
|
Net
cash used in investing activities
|
(109,315
|
)
|
(119,539
|
)
|
(26,409
|
)
|
||||
|
Financing
activities
|
||||||||||
|
Proceeds
from borrowings
|
80,349
|
340,300
|
126,200
|
|||||||
|
Repayment
of debt
|
(85,549
|
)
|
(242,700
|
)
|
(182,868
|
)
|
||||
|
Proceeds
from equity offerings, net
|
97,627
|
(54
|
)
|
89,947
|
||||||
|
Redemption
of common units
|
(4,305
|
)
|
—
|
—
|
||||||
|
Proceeds
from private placement units
|
—
|
—
|
41,220
|
|||||||
|
Distributions
to members
|
(27,098
|
)
|
(20,129
|
)
|
(46,846
|
)
|
||||
|
Financing
costs
|
(3,055
|
)
|
(303
|
)
|
(1,238
|
)
|
||||
|
Purchases
of units for issuance as unit-based compensation
|
(325
|
)
|
(236
|
)
|
—
|
|||||
|
Net
cash provided by financing activities
|
57,644
|
76,878
|
26,415
|
|||||||
|
Net
increase (decrease) in cash and cash equivalents
|
484
|
(3,107
|
)
|
1,379
|
||||||
|
Cash and cash
equivalents, beginning of year
|
3
|
3,110
|
1,731
|
|||||||
|
Cash and cash
equivalents, end of year
|
$
|
487
|
$
|
3
|
$
|
3,110
|
||||
|
|
||||||||||
74
|
Supplemental
cash flow information:
|
||||||||||
|
Cash
paid for interest
|
$
|
3,894
|
$
|
5,040
|
$
|
8,839
|
||||
|
Non-cash
financing and investing activities:
|
||||||||||
|
Asset
retirement obligations
|
$
|
2,163
|
$
|
1,882
|
$
|
177
|
||||
|
Derivatives
assumed in acquisition of natural gas and oil properties
|
$
|
4,128
|
$
|
2,468
|
$
|
—
|
||||
|
Deferred
swap liability
|
$
|
3,072
|
$
|
—
|
$
|
—
|
||||
|
Non-monetary
exchange of natural gas and oil properties
|
$
|
2,660
|
$
|
—
|
$
|
—
|
||||
|
Initial
contribution of assets
|
$
|
—
|
$
|
—
|
$
|
3,288
|
||||
|
Issuance
of common units for acquisition of natural gas and oil
properties
|
$
|
—
|
$
|
21,360
|
$
|
—
|
||||
|
Transfer
of deposit for acquisition of natural gas and oil
properties
|
$
|
—
|
$
|
7,830
|
$
|
—
|
||||
See accompanying notes to
consolidated financial statements.
75
For
the Years Ended December 31,
(in
thousands)
|
2009
|
2008
|
2007
|
||||||||||
|
Net
income (loss)
|
$
|
(95,735
|
)
|
$
|
(3,752
|
)
|
$
|
2,649
|
||||
|
Net income (losses) from
derivative contracts:
|
||||||||||||
|
Unrealized mark-to-market gains
(losses) arising during the period
|
—
|
2,747
|
(9,644
|
)
|
||||||||
|
Reclassification adjustments for
settlements
|
2,288
|
(493
|
)
|
(415
|
)
|
|||||||
|
Other comprehensive income
(loss)
|
2,288
|
2,254
|
(10,059
|
)
|
||||||||
|
Comprehensive
loss
|
$
|
(93,447
|
)
|
$
|
(1,498
|
)
|
$
|
(7,410
|
)
|
|||
See
accompanying notes to consolidated financial statements.
76
Description of the
Business:
Vanguard
Natural Resources, LLC is a publicly traded limited liability company focused on
the acquisition and development of mature, long-lived natural gas and oil
properties in the United States. Through our operating subsidiaries, we own
properties in the southern portion of the Appalachian Basin, primarily in
southeast Kentucky and northeast Tennessee, in the Permian Basin, primarily in
west Texas and southeastern New Mexico, and in south Texas.
References
in this report to (1) “us,” “we,” “our,” “the Company,” “Vanguard” or “VNR”
are to Vanguard Natural Resources, LLC and its subsidiaries, including Vanguard
Natural Gas, LLC (“VNG”), Trust Energy Company, LLC (“TEC”), VNR Holdings, Inc.
(“VNRH”), Ariana Energy, LLC (“Ariana Energy”), Vanguard Permian, LLC (“Vanguard
Permian”) and VNR Finance Corp. (“VNRF”) and (2) “Vanguard Predecessor,”
“Predecessor,” “our operating subsidiary” or “VNG” are to Vanguard Natural Gas,
LLC.
We were
formed in October 2006 and effective January 5, 2007, Vanguard Natural
Gas, LLC (formerly Nami Holding Company, LLC) was separated into our operating
subsidiary and Vinland Energy Eastern, LLC (“Vinland”). As part of the
separation, we retained all of our Predecessor’s proved producing wells and
associated reserves. We also retained 40% of our Predecessor’s working interest
in the known producing horizons in approximately 95,000 gross undeveloped acres
and a contract right to receive approximately 99% of the net proceeds from the
sale of production from certain producing gas and oil wells. In the separation,
Vinland was conveyed the remaining 60% of our Predecessor’s working interest in
the known producing horizons in this acreage, and 100% of our Predecessor’s
working interest in depths above and 100 feet below our known producing
horizons. We refer to these events as the “Restructuring.” Vinland operates all
of our existing wells in Appalachia and all of the wells that we drilled in
Appalachia.
In
October 2007, we completed our initial public offering (“IPO”) of 5.25
million units representing limited liability interests in VNR at $19.00 per unit
for net proceeds of $92.8 million after deducting underwriting discounts and
fees of $7.0 million. In addition, we incurred offering costs of $2.8 million in
connection with the IPO. The proceeds were used to reduce indebtedness under our
reserve-based credit facility by $80.0 million and the balance was used for the
payment of accrued distributions to pre-IPO unitholders and the payment of a
deferred swap obligation.
1.
Summary of Significant Accounting Policies
|
(a)
|
Basis
of Presentation and Principles of
Consolidation:
|
The
consolidated financial statements as of and for the years ended
December 31, 2009, 2008 and 2007 include the accounts of VNR and its
wholly-owned subsidiaries.
Our
consolidated financial statements are prepared in accordance with
U.S. generally accepted accounting principles (“GAAP”) and include the
accounts of all subsidiaries after the elimination of all significant
intercompany accounts and transactions. Additionally, our financial
statements for prior periods include reclassifications that were made to conform
to the current period presentation. Those reclassifications did not impact our
reported net income or members’ equity.
|
(b)
|
Recently
Adopted Accounting Pronouncements:
|
Effective
July 1, 2009, the Financial Accounting Standards Board’s (“FASB”) Accounting
Standards Codification (“ASC”) became the single official source of
authoritative, nongovernmental GAAP in the United States. The historical GAAP
hierarchy was eliminated, and the ASC became the only level of authoritative
GAAP, other than guidance issued by the Securities and Exchange Commission
(“SEC”). Our accounting policies were not affected by the conversion to ASC.
However, references to specific accounting standards in the footnotes to our
consolidated financial statements have been changed to refer to the appropriate
section of ASC.
In
September 2006, the FASB issued guidance which defines fair value, establishes
the framework for measuring fair value and expands disclosures about fair value
measurements. This guidance is contained in ASC Topic 820, “Fair
Value Measurements and Disclosures” (“ASC Topic 820”). In February 2008, the
FASB deferred the effective date applicable to us to January 1, 2009 for all
nonfinancial assets and liabilities, except for those that are recognized or
disclosed at fair value on a recurring basis (that is, at least
annually). On January 1, 2008, we adopted the provisions of ASC Topic
820, as it relates to financial assets and financial liabilities and we
determined that the impact of the additional assumptions on fair value
measurements did not have a material effect on our financial position or results
of operations. We adopted the deferred provisions of ASC Topic 820 on January 1,
2009, as it relates to nonfinancial assets and nonfinancial liabilities, and the
adoption did not have a material impact on our financial position or results of
operations. See Note 6. Fair Value Measurements for further
discussion.
77
In April
2009, the FASB issued additional guidance for estimating fair value in
accordance with ASC Topic 820. The additional guidance addresses determining
fair value when the volume and level of activity for an asset or liability have
significantly decreased and identifying transactions that are not orderly. We
adopted the provisions of this guidance on June 30, 2009 and the adoption did
not have a material impact on our consolidated financial
statements.
In
December 2007, the FASB issued guidance which established principles and
requirements for how an acquirer recognizes and measures in its financial
statements the identifiable assets acquired, the liabilities assumed, any
non-controlling interest in the acquiree and the goodwill acquired in a business
combination. This guidance is contained in ASC Topic 805, “Business
Combinations” (“ASC Topic 805”). This guidance also established disclosure
requirements that will enable users to evaluate the nature and financial effects
of the business combination. Effective January 1, 2009, we adopted the
provisions of ASC Topic 805 and applied the provisions to our acquisitions
completed in the third and fourth quarters of 2009. See Note 2. Acquisitions for
further discussion.
In April
2009, the FASB issued additional guidance which amended the provisions related
to the initial recognition and measurement, subsequent measurement and
disclosure of assets and liabilities arising from contingencies in a business
combination under ASC Topic 805. The requirements of ASC Topic 805 were carried
forward for acquired contingencies, which would require that such contingencies
be recognized at fair value on the acquisition date if fair value can be
reasonably estimated during the allocation period. Otherwise, companies would
typically account for the acquired contingencies in accordance with ASC Topic
450, “Contingencies.” The adoption of the provisions in this additional guidance
did not affect our consolidated financial statements.
In March
2008, the FASB issued guidance intended to improve financial reporting about
derivative instruments and hedging activities by requiring enhanced disclosures
to enable investors to better understand their effects on an entity’s financial
position, financial performance, and cash flows. This guidance is contained in
ASC Topic 815, “Derivatives and Hedging” (“ASC Topic 815”). The guidance
achieves these improvements by requiring disclosure of the fair values of
derivative instruments and their gains and losses in a tabular format. It also
provides more information about an entity’s liquidity by requiring disclosure of
derivative features that are credit risk-related. Finally, it requires
cross-referencing within footnotes to enable financial statement users to locate
important information about derivative instruments. Effective January 1, 2009,
we adopted the provisions of ASC Topic 815, and the adoption did not have a
material impact on our consolidated financial statements. See Note 5. Price and
Interest Rate Risk Management Activities for further discussion.
In April
2009, the FASB issued guidance which amends disclosures about fair values of
financial instruments and interim financial reporting to require disclosures
about fair value of financial instruments in interim financial statements. This
guidance is contained in ASC Topic 825, “Financial Instruments” (“ASC Topic
825”). We adopted the provisions of ASC Topic 825 on June 30, 2009 and the
adoption did not have a material impact on our consolidated financial
statements.
In May
2009, the FASB issued general standards of accounting for and disclosure of
events that occur after the balance sheet date but before financial statements
are issued or are available to be issued. This guidance is contained in ASC
Topic 855, “Subsequent Events” (“ASC Topic 855”). In particular, this guidance
sets forth: (1) the period after the balance sheet date during which management
of a reporting entity should evaluate events or transactions that may occur for
potential recognition or disclosure in the financial statements; (2) the
circumstances under which an entity should recognize events or transactions
occurring after the balance sheet date in its financial statements; and (3) the
disclosures that an entity should make about events or transactions that
occurred after the balance sheet date. In accordance with this guidance, an
entity should apply the requirements to interim or annual financial periods
ending after June 15, 2009. We adopted the provisions of ASC Topic 855 effective
June 30, 2009. In February 2010, the FASB issued Accounting Standards Update No.
2010-09 (“ASC Update 2010-09”), an update to ASC Topic 855. Among other
provisions, this update provides that an entity that is an SEC filer is not
required to disclose the date through which subsequent events have been
evaluated. We adopted the provisions of ASC Update 2010-09 on its effective
date, February 24, 2010. The adoption of the provisions of ASC Topic
855 and ASC Update 2010-09 did not have a material impact on our consolidated
financial statements. See Note 13. Subsequent Events for discussion of
subsequent events.
In
December 2008, the SEC published a Final Rule, “Modernization of Oil and
Gas Reporting.” The new rule permits the use of new technologies to determine
proved reserves if those technologies have been demonstrated to lead to reliable
conclusions about reserves volumes. The new requirements also allow companies to
disclose their probable and possible reserves to investors. In addition, the new
disclosure requirements require companies to: (1) report the independence and
qualifications of its reserves preparer or auditor, (2) file reports when a
third party is relied upon to prepare reserves estimates or to conduct a
reserves audit, and (3) report oil and gas reserves using the 12-month
unweighted average of first-day-of-the-month price (the “12-month average
price”) rather than the year-end price. In January 2010, the FASB issued
Accounting Standards Update 2010-03, “Extractive Activities-Oil and Gas (Topic
932) Oil and Gas Reserve Estimation and Disclosures” (“ASC Update 2010-3”), in
order to align the oil and gas reserve estimation and disclosures requirements
of “Extractive Activities-Oil and Gas (Topic 932)” with the requirements in the
SEC’s Final Rule. The main provisions of Update 2010-03, (1) expand the
definition of oil-and gas-producing activities to include the extraction of
saleable hydrocarbons, in the solid, liquid, or gaseous state, from oil sands,
shale, coalbeds, or other nonrenewable natural resources that are intended to be
upgraded into synthetic oil or gas, and activities undertaken with a view to
such extraction; (2) amend the definition of proved oil and gas reserves to
indicate that entities must use the 12-month average price covered by the report
rather than the year-end price when estimating whether reserve quantities are
economical to produce and when calculating the aggregate amount and change in
future cash inflows related to the standardize measure of discounted cash flows;
(3) require that an entity disclose separately information about reserve
quantities and financial statement amounts for geographic areas that
represent 15 percent or more of proved reserves; and (4) expand the disclosure
requirements for equity method investments. We adopted the Final Rule and the
amendments to Topic 932 on December 31, 2009 and the adoption increased our
fourth quarter 2009 depletion expense by $0.4 million and our impairment by
$46.4 million. The adoption also resulted in adjustments to our total proved
reserves and to the standardized measure of discounted future net cash flows as
of December 31, 2009 presented in the accompanying unaudited supplemental
natural gas and oil information.
78
In August
2009, the FASB issued Accounting Standards Update No. 2009-05 (“ASC Update
2009-05”), an update to ASC Topic 820. This update provides amendments to reduce
potential ambiguity in financial reporting when measuring the fair value of
liabilities. Among other provisions, this update provides clarification that in
circumstances in which a quoted price in an active market for the identical
liability is not available, a reporting entity is required to measure fair value
using one or more of the valuation techniques described in ASC Update 2009-05.
We adopted the provisions of ASC Update 2009-05 on its effective date, December
31, 2009 and the adoption did not have a material impact on our consolidated
financial statements.
|
(c)
|
New
Pronouncements Issued But Not Yet
Adopted:
|
In June
2009, the FASB issued guidance to change financial reporting by enterprises
involved with variable interest entities (“VIEs”). The standard replaces the
quantitative-based risks and rewards calculation for determining which
enterprise has a controlling financial interest in a VIE with an approach
focused on identifying which enterprise has the power to direct the activities
of a VIE and the obligation to absorb losses of the entity or the right to
receive the entity’s residual returns. This standard was effective for us on
January 1, 2010. We do not have any interests in variable interest entities;
therefore, this standard is not expected to have any impact on our consolidated
financial statements.
In
January 2010, the FASB issued authoritative guidance intended to improve
disclosures about fair value measurements. The guidance requires entities to
disclose significant transfers in and out of fair value hierarchy levels and the
reasons for the transfers and to present information about purchases, sales,
issuances and settlements separately in the reconciliation of fair value
measurements using significant unobservable inputs (Level 3). Additionally, the
guidance clarifies that a reporting entity should provide fair value
measurements for each class of assets and liabilities and disclose the inputs
and valuation techniques used for fair value measurements using significant
other observable inputs (Level 2) and significant unobservable inputs (Level 3).
This guidance is effective for interim and annual periods beginning after
December 15, 2009 except for the disclosures about purchases, sales,
issuances and settlements in the Level 3 reconciliation, which will be effective
for interim and annual periods beginning after December 15, 2010. As this
guidance provides only disclosure requirements, the adoption of this standard
will not impact our results of operations, cash flows or financial
position.
|
(d)
|
Cash
Equivalents:
|
The
Company considers all highly liquid short-term investments with original
maturities of three months or less to be cash equivalents.
|
(e)
|
Accounts
Receivable and Allowance for Doubtful
Accounts:
|
Accounts
receivable are customer obligations due under normal trade terms and are
presented on the consolidated balance sheets net of allowances for doubtful
accounts. We establish provisions for losses on accounts receivable if we
determine that we will not collect all or part of the outstanding balance. We
regularly review collectibility and establish or adjust our allowance as
necessary using the specific identification method.
79
|
(f)
|
Inventory:
|
|
|
|
Materials,
supplies and commodity inventories are valued at the lower of cost or market.
The cost is determined using the first-in, first-out method. Inventories are
included in other current assets in the accompanying consolidated balance
sheets.
|
(g)
|
Natural
Gas and Oil Properties:
|
The full
cost method of accounting is used to account for natural gas and oil properties.
Under the full cost method, substantially all costs incurred in connection with
the acquisition, development and exploration of natural gas, natural gas liquids
and oil reserves are capitalized. These capitalized amounts include the costs of
unproved properties, internal costs directly related to acquisitions,
development and exploration activities, asset retirement costs and capitalized
interest. Under the full cost method, both dry hole costs and geological and
geophysical costs are capitalized into the full cost pool, which is subject to
amortization and subject to ceiling test limitations as discussed
below.
Capitalized
costs associated with proved reserves are amortized over the life of the
reserves using the unit of production method. Conversely, capitalized costs
associated with unproved properties are excluded from the amortizable base until
these properties are evaluated, which occurs on a quarterly basis. Specifically,
costs are transferred to the amortizable base when properties are determined to
have proved reserves. In addition, we transfer unproved property costs to the
amortizable base when unproved properties are evaluated as being impaired and as
exploratory wells are determined to be unsuccessful. Additionally, the
amortizable base includes estimated future development costs, dismantlement,
restoration and abandonment costs net of estimated salvage values and geological
and geophysical costs incurred that cannot be associated with unevaluated
properties or prospects in which we own a direct interest.
Capitalized
costs are limited to a ceiling based on the present value of future net revenues
using the 12-month average price, discounted at 10%, plus the lower of cost or
fair market value of unproved properties. If the ceiling is not greater than or
equal to the total capitalized costs, we are required to write down capitalized
costs to the ceiling. We perform this ceiling test calculation each quarter. Any
required write downs are included in the consolidated statements of operations
as an impairment charge. Ceiling test calculations include the effects of the
portion of natural gas and oil derivative contracts that have been recorded in
other comprehensive income. We recorded a non-cash
ceiling test impairment of natural gas and oil properties for the year ended
December 31, 2009 of $110.2 million. The impairment for the first quarter
2009 was $63.8 million as a result of a decline in natural gas prices at the
measurement date, March 31, 2009. This impairment was calculated based on prices
of $3.65 per MMBtu for natural gas and $49.64 per barrel of crude oil. The SEC’s
Final Rule, “Modernization of Oil and Gas Reporting,” which became effective
December 31, 2009, changed the price used to calculate oil and gas reserves to a
12-month average price rather than a year-end price. As a result of declines in
natural gas and oil prices based upon the 12-month average price, we recorded an
impairment of $46.4 million in the fourth quarter of 2009. This impairment was
calculated using the 12-month average price for natural gas and oil of $3.87 per MMBtu for
natural gas and $ 61.04 per barrel of crude oil. Additionally, we
recorded a non-cash ceiling test impairment of natural gas and oil properties
for the year ended December 31, 2008 of $58.9 million as a result of a decline
in natural gas and oil prices at the measurement date. This
impairment was calculated based on prices of $5.71 per MMBtu for natural gas and
$41.00 per barrel of crude oil. No ceiling test impairment was
required during 2007.
When we
sell or convey interests in natural gas and oil properties, we reduce natural
gas and oil reserves for the amount attributable to the sold or conveyed
interest. We do not recognize a gain or loss on sales of natural gas and oil
properties, unless those sales would significantly alter the relationship
between capitalized costs and proved reserves. Sales proceeds on insignificant
sales are treated as an adjustment to the cost of the properties.
|
(h)
|
Asset
Retirement Obligations:
|
We record
a liability for asset retirement obligations at fair value in the period in
which the liability is incurred if a reasonable estimate of fair value can be
made. The associated asset retirement cost is capitalized as part of the
carrying amount of the long-lived asset. Subsequently, the asset retirement cost
is allocated to expense using a systematic and rational method over the asset’s
useful life. Our recognized asset retirement obligation exclusively relates to
the plugging and abandonment of natural gas and oil wells. Management
periodically reviews the estimate of the timing of well abandonments as well as
the estimated plugging and abandonment costs, which are discounted at the credit
adjusted risk free rate. These retirement costs are recorded as a
long-term liability on the consolidated balance sheet with an offsetting
increase in natural gas and oil properties. An ongoing accretion expense is
recognized for changes in the value of the liability as a result of the passage
of time, which we record in depreciation, depletion, amortization and accretion
expense in the consolidated statements of operations.
80
|
(i)
|
Impairment
of Long-Lived Assets:
|
|
|
|
We
evaluate the carrying value of long-lived assets, other than investments in
natural gas and oil properties, when events or changes in circumstances indicate
that the carrying value of such assets may not be recoverable. For property and
equipment used in operations, the determination of impairment is based upon
expectations of undiscounted future cash flows, before interest, of the related
asset. If the carrying value of the asset exceeds the undiscounted future cash
flows, the impairment would be computed as the difference between the carrying
value of the asset and the fair value.
|
(j)
|
Revenue
Recognition and Gas Imbalances:
|
|
|
|
Sales of
natural gas, natural gas liquids and oil are recognized when natural gas,
natural gas liquids and oil have been delivered to a custody transfer point,
persuasive evidence of a sales arrangement exists, the rights and responsibility
of ownership pass to the purchaser upon delivery, collection of revenue from the
sale is reasonably assured, and the sales price is fixed or determinable. We
sell natural gas, natural gas liquids and oil on a monthly basis. Virtually all
of our contracts’ pricing provisions are tied to a market index, with certain
adjustments based on, among other factors, whether a well delivers to a
gathering or transmission line, quality of the natural gas, natural gas liquid
or oil, and prevailing supply and demand conditions, so that the price of the
natural gas, natural gas liquid and oil fluctuates to remain competitive with
other available natural gas, natural gas liquid and oil supplies.
The
Company has elected the entitlements method to account for gas production
imbalances. Gas imbalances occur when we sell more or less than our entitled
ownership percentage of total gas production. Any amount received in excess of
our share is treated as a liability. If we receive less than our entitled share
the underproduction is recorded as a receivable. The amounts of imbalances
were not material at December 31, 2009 and 2008.
|
(k)
|
Concentration
of Credit Risk:
|
|
|
|
Financial
instruments that potentially subject us to concentrations of credit risk consist
principally of cash and cash equivalents, accounts receivable and derivative
contracts. We control our exposure to credit risk associated with these
instruments by (i) placing our assets and other financial interests with
credit-worthy financial institutions, (ii) maintaining policies over credit
extension that include the evaluation of customers’ financial condition and
monitoring payment history, although we do not have collateral requirements and
(iii) netting derivative assets and liabilities for counterparties where we have
a legal right of offset.
At
December 31, 2009 and 2008, the cash and cash equivalents were
concentrated in three financial institutions. We periodically assess the
financial condition of these institutions and believe that any possible credit
risk is minimal.
The
following purchasers accounted for 10% or more of the Company’s natural gas,
natural gas liquids and oil sales for the years ended December 31:
|
2009
|
2008
|
2007
|
||||
|
Seminole
Energy Services
|
35%
|
52%
|
—
|
|||
|
North
American Energy Corporation
|
—
|
—
|
41%
|
|||
|
Osram
Sylvania, Inc.
|
9%
|
15%
|
16%
|
|||
|
BP
Energy Company
|
—
|
10%
|
11%
|
|||
|
Dominion
Field Services, Inc.
|
—
|
—
|
13%
|
|||
|
Eagle
Energy Partners, LLC
|
—
|
—
|
11%
|
This
concentration of customers may impact the overall exposure to credit risk in
that the customers are in the energy industry and they may be similarly affected
by changes in economic or other conditions.
|
(l)
|
Use
of Estimates:
|
|
|
|
The
preparation of financial statements in conformity with accounting principles
generally accepted in the Unites States of America requires management to make
estimates and assumptions that affect the reported amounts of assets and
liabilities and disclosure of contingent assets and liabilities at the date of
the financial statements and the reported amounts of revenues and expenses
during the reporting period. The most significant estimates pertain to proved
natural gas, natural gas liquids and oil reserves and related cash flow
estimates used in impairment tests of natural gas and oil properties, the fair
value of derivative contracts and asset retirement obligations, accrued natural
gas, natural gas liquids and oil revenues and expenses, as well as estimates of
expenses related to depreciation, depletion, amortization and accretion.
Actual results could differ from those estimates.
81
|
(m)
|
Price
and Interest Rate Risk Management
Activities:
|
|
|
|
We have
entered into derivative contracts with counterparties that are lenders under our
reserve-based credit facility, Citibank N.A., BNP Paribas, The Bank of Nova
Scotia, BBVA Compass Bank and Wells Fargo Bank, N.A. (also under the name
Wachovia Bank, N.A.), to hedge price risk associated with a portion of our
natural gas and oil production. While it is never management’s intention to hold
or issue derivative instruments for speculative trading purposes, conditions
sometimes arise where actual production is less than estimated which has, and
could, result in overhedged volumes. Under fixed-priced commodity swap
agreements, the Company receives a fixed price on a notional quantity in
exchange for paying a variable price based on a market index, such as the
Columbia Gas Appalachian Index (‘TECO Index”), Henry Hub or Houston Ship Channel
for natural gas production and the West Texas Intermediate Light Sweet for oil
production. Under put option agreements, we pay the counterparty an option
premium, equal to the fair value of the option at the purchase date. At
settlement date we receive the excess, if any, of the fixed floor over the
floating rate. Under collar contracts, we pay the counterparty if the market
price is above the ceiling price and the counterparty pays us if the market
price is below the floor price on a notional quantity. No payments are made if
the market price is between the floor price and the ceiling price. Put options
for natural gas are settled based on the NYMEX price for natural gas at Henry
Hub and collars are settled based on a market index selected by us at inception
of the contract. We also enter into fixed LIBOR interest rate swap agreements,
which require exchanges of cash flows that serve to synthetically convert a
portion of our variable interest rate obligations to fixed interest
rates.
Any
premiums paid on derivative contracts and the fair value of derivative contracts
acquired in connection with our acquisitions, are capitalized as part of the
derivative assets or derivative liabilities, as appropriate, at the time the
premiums are paid or the contracts are assumed. Over time, as the derivative
contracts settle, the premiums paid or fair value of contracts acquired are
amortized and recognized as a realized gain or loss on other commodity or
interest rate derivate contracts and reflected as non-cash adjustments to net
income or loss in our consolidated statement of cash flows.
Under ASC
Topic 815 “Derivatives and Hedging,” all derivative instruments are recorded on
the consolidated balance sheets at fair value as either short-term or long-term
assets or liabilities based on their anticipated settlement date. We
net derivative assets and liabilities for counterparties where we have a legal
right of offset. Changes in the derivatives’ fair value are
recognized currently in earnings unless specific hedge accounting criteria are
met. For qualifying cash flow hedges, the unrealized gain or loss on
the derivative is deferred in accumulated other comprehensive income (loss) in
the equity section of the consolidated balance sheets to the extent the hedge is
effective. Gains and losses on cash flow hedges included in accumulated other
comprehensive income (loss) are reclassified to gains (losses) on commodity cash
flow hedges or gains (losses) on interest rate derivative contracts in the
period that the related production is delivered or the contract settles. The
realized and unrealized gains (losses) on derivative contracts that do not
qualify for hedge accounting treatment are recorded as gains (losses) on other
commodity derivative contracts or gains (losses) on interest rate derivative
contracts in the consolidated statements of operations.
|
(n)
|
Income
Taxes:
|
|
|
|
The
Company is treated as a partnership for federal and state income tax
purposes. As such, it is not a taxable entity and does not directly pay
federal and state income tax. Its taxable income or loss, which may vary
substantially from the net income or net loss reported in the consolidated
statements of operations, is included in the federal and state income tax
returns of each unitholder. Accordingly, no recognition has been given to
federal and state income taxes for the operations of the Company. The
aggregate difference in the basis of net assets for financial and tax reporting
purposes cannot be readily determined as the Company does not have access to
information about each unitholders’ tax attributes in the Company. However with
respect to the Company, the Company’s book basis in its net assets exceeded the
Company’s net tax basis by $38.0 million and $54.7 million at December 31, 2009
and 2008, respectively.
Legal
entities that conduct business in Texas are subject to the Revised Texas
Franchise Tax, including previously non-taxable entities such as limited
partnerships and limited liability partnerships. The tax is assessed on Texas
sourced taxable margin which is defined as the lesser of (i) 70% of total
revenue or (ii) total revenue less (a) cost of goods sold or
(b) compensation and benefits. Although the Revised Texas Franchise Tax is
not an income tax, it has the characteristics of an income tax since it is
determined by applying a tax rate to a base that considers both revenues and
expenses. The Company recorded a current tax liability of $0.1 million during
each of the years ended December 31, 2009 and 2008, respectively and a deferred
tax asset of $0.1 million during the year ended December 31, 2009 and
a deferred tax liability of $0.2 million during the year ended December 31,
2008. A benefit of $0.2 million and a charge of $0.3 million are included in our
consolidated statements of operations for the years ended December 31, 2009
and 2008, respectively, as a component of production and other taxes. The
Company had no Texas sourced margin tax prior to 2008.
82
2.
Acquisitions
On
December 21, 2007, we entered into a Purchase and Sale Agreement with the Apache
Corporation for the purchase of certain oil and natural gas properties located
in ten separate fields in the Permian Basin of west Texas and southeastern New
Mexico. We refer to this acquisition as the “Permian Basin acquisition.” The
purchase price for said assets was $78.3 million with an effective date of
October 1, 2007. We completed this acquisition on January 31, 2008 for an
adjusted purchase price of $73.4 million, subject to customary post closing
adjustments. The post closing adjustments reduced the final purchase price to
$71.5 million which included a purchase price adjustment of $6.8 million for the
cash flow from the acquired properties for the period between the effective
date, October 1, 2007, and the final settlement date. As part of this
acquisition, we assumed fixed-price oil swaps covering approximately 90% of the
estimated proved developed producing oil reserves through 2011 at a weighted
average price of $87.29. The fair value of these fixed-price oil swaps was a
liability of $1.1 million at January 31, 2008. This acquisition was funded with
borrowings under our existing reserve-based credit facility.
On July
18, 2008, we entered into a Purchase and Sale Agreement with Segundo Navarro
Drilling, Ltd. (“Segundo”), a wholly- owned subsidiary of the Lewis Energy
Group, for the acquisition of certain natural gas and oil properties located in
the Dos Hermanos Field in Webb County, Texas. We refer to this acquisition as
the “Dos Hermanos acquisition.” The purchase price for said assets was $53.4
million with an effective date of June 1, 2008. We completed this acquisition on
July 28, 2008 for an adjusted purchase price of $51.4 million. This acquisition
was funded with $30.0 million of borrowings under our reserve-based credit
facility and through the issuance of 1,350,873 common units of the Company
valued at $21.4 million. Upon closing this transaction, we assumed natural gas
swaps and collars based on Houston Ship Channel pricing for approximately 85% of
the estimated gas production from existing producing wells in the acquired
properties for the period beginning July 2008 through December 2011 which had a
fair value of $3.6 million on July 28, 2008.
On July
17, 2009, we entered into a Purchase and Sale Agreement with Segundo for the
acquisition of certain natural gas and oil properties located in the Sun TSH
Field in La Salle County, Texas. We refer to this acquisition as the “Sun TSH
acquisition.” The purchase price for said assets was $52.3 million with an
effective date of July 1, 2009. We completed this acquisition on August 17, 2009
for an adjusted purchase price of $50.5 million, subject to customary
post-closing adjustments. The adjusted purchase price was $50.5 million after
consideration of preliminary purchase price adjustments of approximately $1.8
million, which included the settlement of a derivative contract for the latter
part of August 2009 in the amount of $0.3 million. This acquisition was funded
with borrowings under our reserve-based credit facility and proceeds from the
Company’s public equity offering of 3.9 million common units completed on August
17, 2009. Upon closing this transaction, we assumed natural gas puts and swaps
based on NYMEX pricing for approximately 61% of the estimated gas production
from existing producing wells in the acquired properties for the period
beginning August 2009 through December 2010, which had a fair value of $4.1
million on the closing date.
In
accordance with the guidance contained within ASC Topic 805, the measurement of
the fair value at acquisition date of the assets acquired in the Sun TSH
acquisition as compared to the fair value of consideration transferred, adjusted
for purchase price adjustments, resulted in a gain of $5.9 million, calculated
in the following table. The gain resulted from the changes in natural gas and
oil prices used to value the reserves and has been recognized in current period
earnings and classified in other income and expense in the consolidated
statements of operations.
|
(in
thousands)
|
||||
|
Fair
value of assets and liabilities acquired:
|
||||
|
Natural
gas and oil properties
|
$ | 54,942 | ||
|
Derivative
assets
|
4,128 | |||
|
Other
currents assets
|
187 | |||
|
Accrued
expenses
|
(298 | ) | ||
|
Asset
retirement obligations
|
(2,254 | ) | ||
|
Total
fair value of assets and liabilities acquired
|
56,705 | |||
|
Fair
value of consideration transferred
|
50,827 | |||
|
Gain
on acquisition of natural gas and oil properties
|
$ | 5,878 | ||
On
November 27, 2009, we entered into a Purchase and Sale Agreement, Lease
Amendment and Lease Royalty Conveyance Agreement and a Conveyance Agreement to
acquire certain producing natural gas and oil properties located in Ward County,
Texas in the Permian Basin from private sellers, referred to as the “Ward County
acquisition.” This transaction had an effective date of October 1, 2009 and was
closed on December 2, 2009 for $55.0 million, subject to customary post-closing
adjustments. This acquisition was initially funded with borrowings under our
reserve-based credit facility with borrowings being reduced by $40.3 million
shortly thereafter with the proceeds from a 2.6 million common unit offering. In
an effort to support stable cash flows from this transaction, we entered into
crude oil swaps based on NYMEX pricing for approximately 90% of the estimated
oil production from existing producing wells in the acquired properties for the
period beginning January 2010 through December 2013.
83
In
accordance with the guidance contained within ASC Topic 805, the measurement of
the fair value at acquisition date of the assets acquired in the Ward County
acquisitions as compared to the fair value of consideration transferred,
adjusted for purchase price adjustments, resulted in a gain of $1.1 million,
calculated in the following table. The gain resulted from the changes in natural
gas and oil prices used to value the reserves and has been recognized in current
period earnings and classified in other income and expense in the consolidated
statement of operations.
|
(in
thousands)
|
||||
|
Fair
value of assets and liabilities acquired:
|
||||
|
Natural
gas and oil properties
|
$ | 56,347 | ||
|
Other
currents assets
|
25 | |||
|
Asset
retirement obligations
|
(248 | ) | ||
|
Total
fair value of assets and liabilities acquired
|
56,124 | |||
|
Fair
value of consideration transferred
|
55,021 | |||
|
Gain
on acquisition of natural gas and oil properties
|
$ | 1,103 | ||
The
following unaudited pro forma results for the years ended December 31, 2009,
2008 and 2007 show the effect on our consolidated results of operations as if
the Sun TSH and Ward County acquisitions had occurred on January 1, 2009 and
2008, and the Permian Basin and the Dos Hermanos acquisitions had occurred on
January 1, 2008 and 2007. The pro forma results reflect the results of combining
our statement of operations with the revenues and direct operating expenses of
the oil and gas properties acquired adjusted for (1) assumption of asset
retirement obligations and accretion expense for the properties acquired, (2)
depletion expense applied to the adjusted basis of the properties acquired using
the acquisition method of accounting, (3) interest expense on additional
borrowings necessary to finance the acquisitions, (4) non-cash impairment
charge, (5) the impact of common units issued to partially finance the Dos
Hermanos acquisition, and (6) the impact of additional common units issued in
connection with the 2009 equity offerings completed at the time of
the Sun TSH and Ward County acquisitions. The pro forma information is based
upon these assumptions, and is not necessarily indicative of future results of
operations:
|
Year Ended December 31,
|
|||||||||
|
2009
Pro
forma
|
2008
Pro
forma
|
2007
Pro
forma
|
|||||||
|
(in thousands,
except per unit amounts)
|
|||||||||
|
(unaudited)
|
|||||||||
|
Total
revenues
|
$
|
72,544
|
$
|
151,956
|
$
|
60,774
|
|||
|
Net
income (loss)
|
$
|
(82,715
|
)
|
$
|
36,218
|
$
|
6,321
|
||
|
Net
income (loss) per unit:
|
|||||||||
|
Common &
Class B units – basic & diluted
|
$
|
(4.39
|
)
|
$
|
1.92
|
$
|
0.77
|
||
The
amount of revenue and excess of revenues over direct operating expenses included
in our consolidated statements of operations from the date of the closing
through year end for each of our acquisitions are as follows:
|
Year Ended December 31,
|
||||||||
|
2009
|
2008
|
|||||||
|
(in thousands)
|
||||||||
|
Permian
Basin
|
||||||||
|
Revenues
|
$ | 14,372 | $ | 21,833 | ||||
|
Excess of revenues over direct operating expenses
|
$ | 9,801 | $ | 15,869 | ||||
|
Dos
Hermanos
|
||||||||
|
Revenues
|
$ | 4,622 | $ | 3,999 | ||||
|
Excess
of revenues over direct operating expenses
|
$ | 1,586 | $ | 1,598 | ||||
|
Sun
TSH
|
||||||||
|
Revenues
|
$ | 4,739 | $ | — | ||||
|
Excess
of revenues over direct operating expenses
|
$ | 3,460 | $ | — | ||||
|
Ward
County
|
||||||||
|
Revenues
|
$ | 1,059 | $ | — | ||||
|
Excess
of revenues over direct operating expenses
|
$ | 640 | $ | — | ||||
84
3.
Accounts Receivable and Allowance for Doubtful Accounts
We
established an approximate $1.0 million provision for a loss on the entire
amount due from a customer which filed for protection under Chapter 11 of the
Bankruptcy Code in May 2007. The account receivable was due from oil
sales through December 2006 at which time we ceased selling oil to the
customer. As the amount of any potential recovery is uncertain, we elected to
reserve the entire balance and it is reflected as bad debt expense on our
consolidated statement of operations for the year ended December 31, 2007.
We began selling our oil production to a new customer beginning in
March 2007. As the accounts receivable was deemed uncollectible, we wrote
off the receivable against the allowance during the year ended December 31,
2009.
4.
Credit Facilities and Long-Term Debt
Our
credit facilities and long-term debt consisted of the following:
|
Amount
Outstanding
|
||||||||||
|
December
31,
|
||||||||||
|
Description
|
Interest Rate
|
Maturity Date
|
2009
|
2008
|
||||||
|
(in
thousands)
|
||||||||||
|
Senior
secured reserve-based credit facility
|
Variable
(1)
|
October
1, 2012
|
$ | 129,800 | $ | 135,000 | ||||
|
Total
|
$ | 129,800 | $ | 135,000 | ||||||
|
(1)
|
Variable
interest rate was 2.7% and 3.8% at December 31 2009 and 2008,
respectively.
|
Senior
Secured Reserve-Based Credit Facility
In
January 2007, the Company entered into a four-year revolving reserve-based
credit facility (“reserve-based credit facility”) with Citibank, N.A. and BNP
Paribas. All of our Predecessor’s outstanding debt was repaid with borrowings
under this reserve-based credit facility, including an early prepayment penalty
of $2.5 million. The available credit line (“borrowing base”) is subject to
adjustment from time to time but not less than on a semi-annual basis based on
the projected discounted present value (as determined by the bank’s petroleum
engineers) of estimated future net cash flows from certain proved natural gas,
natural gas liquids and oil reserves of the Company. The reserve-based credit
facility is secured by a first lien security interest in all of the Company’s
natural gas and oil properties. Additional borrowings were made in January 2008
pursuant to the acquisition of natural gas and oil properties in the Permian
Basin. In February 2008, our reserve-based credit facility was amended and
restated to extend the maturity from January 3, 2011 to March 31, 2011, increase
the maximum facility amount from $200.0 million to $400.0 million, increase our
borrowing base from $110.5 million to $150.0 million and add two additional
financial institutions as lenders, Wachovia Bank, N.A. and The Bank of Nova
Scotia. In May 2008, our reserve-based credit facility was amended in response
to a potential acquisition that ultimately did not occur. As a result, none of
the provisions included in this amendment went into effect. In July 2008 an
additional $30.0 million was borrowed to fund a portion of the cash
consideration paid in the Dos Hermanos acquisition and in October 2008, we
amended our reserve-based credit facility, which set our borrowing base under
the facility at $175.0 million pursuant to our semi-annual redetermination and
added a new lender, BBVA Compass Bank. In February 2009, our reserve-based
credit facility was amended to allow us to repurchase up to $5.0 million of our
own units. In May 2009, our borrowing base was set at $154.0 million pursuant to
our semi-annual redetermination. In June 2009, a fourth amendment to our
reserve-based credit facility was entered into which temporarily increased the
percentage of outstanding indebtedness for which interest rate derivatives could
be used. The percentage was increased from 75% to 85% but was to revert back to
75% in one year at June 2010. In August 2009, our reserve-based credit facility
was amended and restated to (1) extend the maturity from March 31, 2011 to
October 1, 2012, (2) increase our borrowing base from $154.0 million to $175.0
million, (3) increase our borrowing costs, (4) permanently allow 85% of our
outstanding indebtedness to be covered under interest rate derivatives, and (5)
add two financial institutions as lenders, Comerica Bank and Royal Bank of
Canada. On October 1, 2009, we entered into the First Amendment to our Second
Amended and Restated Credit Agreement, which reduced our borrowing base under
the reserve-based credit facility from $175.0 million to $170.0 million pursuant
to our semi-annual redetermination and changed the definition of majority
lenders from 75% to 66.67%. All other terms under the reserve-based credit
facility remained the same. In December 2009, our borrowing base was increased
from $170.0 million to $195.0 million pursuant to an interim redetermination
requested by the Company due to the Ward County acquisition. Indebtedness under
the reserve-based credit facility totaled $129.8 million at December 31,
2009.
85
Interest
rates under the reserve-based credit facility are based on Euro-Dollars (LIBOR)
or ABR (Prime) indications, plus a margin. Interest is generally payable
quarterly for ABR loans and at the applicable maturity date for LIBOR loans. At
December 31, 2009 the applicable margin and other fees increase as the
utilization of the borrowing base increases as follows:
Borrowing Base Utilization Grid
|
Borrowing
Base Utilization Percentage
|
<50%
|
>50%
<75%
|
>75%
<90%
|
>90%
|
|||||
|
Eurodollar
Loans Margin
|
2.25%
|
2.50%
|
2.75%
|
3.00%
|
|||||
|
ABR
Loans Margin
|
1.25%
|
1.50%
|
1.75%
|
2.00%
|
|||||
|
Commitment
Fee Rate
|
0.50%
|
0.50%
|
0.50%
|
0.50%
|
|||||
|
Letter
of Credit Fee
|
2.25%
|
2.50%
|
2.75%
|
3.00%
|
Our
reserve-based credit facility contains a number of customary covenants that
require us to maintain certain financial ratios, limit our ability to incur
indebtedness, enter into commodity and interest rate derivatives, grant certain
liens, make certain loans, acquisitions, capital expenditures and investments,
merge or consolidate, engage in certain asset dispositions, including a sale of
all or substantially all of the Company’s assets, or make distributions to our
unitholders when our outstanding borrowings exceed 90% of our borrowing base. At
December 31, 2009, we were in compliance with our debt
covenants.
Our
reserve-based credit facility required us to enter into a commodity price hedge
position establishing certain minimum fixed prices for anticipated future
production. See Note 5. Price
and Interest Rate Risk Management Activities for further
discussion.
5.
Price and Interest Rate Risk Management Activities
We have
entered into derivative contracts with counterparties that are lenders under our
reserve-based credit facility, Citibank N.A., BNP Paribas, The Bank of Nova
Scotia, BBVA Compass Bank and Wells Fargo Bank, N.A. (also under the name
Wachovia Bank, N.A.), to hedge price risk associated with a portion of our
natural gas and oil production. While it is never management’s intention to hold
or issue derivative instruments for speculative trading purposes, conditions
sometimes arise where actual production is less than estimated which has, and
could, result in overhedged volumes. Under fixed-priced commodity swap
agreements, the Company receives a fixed price on a notional quantity in
exchange for paying a variable price based on a market index, such as the
Columbia Gas Appalachian Index (“TECO Index”), Henry Hub or Houston Ship Channel
for natural gas production and the West Texas Intermediate Light Sweet for oil
production. Under put option agreements, we pay the counterparty an option
premium, equal to the fair value of the option at the purchase date. At
settlement date we receive the excess, if any, of the fixed floor over floating
rate. Under collar contracts, we pay the counterparty if the market price is
above the ceiling price and the counterparty pays us if the market price is
below the floor price on a notional quantity. Put options for natural gas are
settled based on the NYMEX price for natural gas at Henry Hub and collars are
settled based on a market index selected by us at inception of the contract. We
also enter into fixed LIBOR interest rate swap agreements, which require
exchanges of cash flows that serve to synthetically convert a portion of our
variable interest rate obligations to fixed interest rates.
Under ASC
Topic 815 “Derivatives and Hedging,” all derivative instruments are recorded on
the consolidated balance sheets at fair value as either short-term or long-term
assets or liabilities based on their anticipated settlement date. We
net derivative assets and liabilities for counterparties where we have a legal
right of offset. Changes in the derivatives’ fair value are recognized currently
in earnings unless specific hedge accounting criteria are met. For qualifying
cash flow hedges, the unrealized gain or loss on the derivative is deferred in
accumulated other comprehensive income (loss) in the equity section of the
consolidated balance sheets to the extent the hedge is
effective. Gains and losses on cash flow hedges included in
accumulated other comprehensive income (loss) are reclassified to gains (losses)
on commodity cash flow hedges or gains (losses) on interest rate derivative
contracts in the period that the related production is delivered or the contract
settles. The realized and unrealized gains (losses) on derivative
contracts that do not qualify for hedge accounting treatment are recorded as
gains (losses) on other commodity derivative contracts or gains (losses) on
interest rate derivative contracts in the consolidated statements of
operations.
86
On
January 3, 2007, our Predecessor’s natural gas price swaps were terminated,
which resulted in the Company incurring swap termination fees of $2.8 million
and an additional loss on derivative contracts of approximately $0.8 million
included in our consolidated statement of operations for the year ended December
31, 2007. New natural gas derivative contracts were put in place in conjunction
with entering into the reserve-based credit facility as described in Note 4.
Credit Facility and Long-Term
Debt. The Company paid $6.5 million for the put option contracts and
payments for the put option contracts and the swap termination fee were funded
with borrowings under the reserve-based credit facility. At our election, also
in January 2007, we entered into a NYMEX natural gas collar contract. In May
2007, we reset our 2007, 2008 and 2009 natural gas swaps at higher prices and
incurred a $7.3 million deferred swap payment obligation with the derivative
counterparty which accrued interest daily at 7.36% and was payable at the
earlier of five days after the closing of an equity issuance or November 1,
2007. The deferred swap obligation was paid in October 2007 using proceeds from
our IPO.
In
February 2008, as part of the Permian Basin acquisition, we assumed fixed-price
oil swaps covering approximately 90% of the estimated proved developed producing
oil production through 2011 at a weighted average price of $87.29. Also, in
February 2008, we sold calls (or set a ceiling price) which effectively collared
2,000,000 MMBtu of gas production in 2008 through 2009 which was previously only
subject to a put (or price floor), we reset the price on 2,387,640 MMBtu of
natural gas swaps settling in 2010 from $7.53 to $8.76 per MMBtu and we entered
into a 2012 fixed-price oil swap at $80.00 for 87% of our estimated proved
developed production. In April 2008, we reset the price on 800,000 MMBtu of
natural gas puts settling from May 1, 2008 to December 31, 2008 from $7.50 to
$9.00 per MMBtu at a cost to the Company of $0.3 million which was funded with
cash on hand. In July 2008, in connection with the Dos Hermanos acquisition, we
assumed natural gas swaps and collars based on Houston Ship Channel pricing for
approximately 85% of the estimated gas production from existing producing wells
for the period beginning July 2008 through December 2011.
In
February 2009, we liquidated our 2012 oil swap and entered into new 2010 and
2011 natural gas swap and collar transactions. Specifically, a fixed price NYMEX
natural gas swap for January through September 2010 and April through September
2011 at $8.04 and $7.85, respectively, was executed for 2,000 MMBtu/day. In
addition, a 2,000 MMBtu/day NYMEX natural gas collar with a floor price of $7.50
and a ceiling price of $9.00 for October 2010 through March 2011 and October
2011 through December 2011 was executed. These natural gas derivatives were
obtained at prices above the then current market by using the proceeds of the
liquidation of the 2012 oil swap.
In August
2009, in connection with the Sun TSH acquisition, we assumed natural gas puts
and swaps based on NYMEX pricing for approximately 61% of the estimated gas
production from existing producing wells in the acquired properties for the
period beginning August of 2009 through December 2010. In addition, concurrent
with the execution of the purchase and sale agreement, the Company entered into
a collar for certain volumes in 2010 and a series of collars for a substantial
portion of the expected gas production for 2011 at prices above the then current
market with a total cost to the Company of $3.1 million, which was financed
through deferred premiums.
In
December 2009, in an effort to support stable cash flows from the Ward County
acquisition, we entered into crude oil swaps based on NYMEX pricing for
approximately 90% of the estimated oil production from existing producing wells
in the acquired properties for the period beginning January 2010 through
December 2013. In addition, we entered into NYMEX oil swap and collar derivative
contracts for the period from January 1, 2012 through December 31, 2013 in order
to support the cash flow to be received from oil production in other
regions.
At
December 31, 2009, the Company had open commodity derivative contracts covering
our anticipated future production as follows:
Swap
Agreements
|
Gas
|
Oil
|
|||||||||
|
Contract
Period
|
MMBtu
|
Weighted
Average
Fixed
Price
|
Bbls
|
WTI
Price
|
||||||
|
2010
|
4,731,040
|
$
|
8.66
|
310,250
|
$
|
85.93
|
||||
|
2011
|
3,328,312
|
$
|
7.83
|
260,750
|
$
|
86.12
|
||||
|
2012
|
—
|
$
|
—
|
137,250
|
$
|
88.13
|
||||
|
2013
|
—
|
$
|
—
|
118,625
|
$
|
88.42
|
||||
87
Collars
|
|
Gas
|
Oil
|
||||||||||||||||||||||
|
Production
Period
|
MMBtu
|
Floor
|
Ceiling
|
Bbls
|
Floor
|
Ceiling
|
||||||||||||||||||
|
|
||||||||||||||||||||||||
|
2010
|
1,607,500 | $ | 7.73 | $ | 8.92 | — | $ | — | $ | — | ||||||||||||||
|
2011
|
1,933,500 | $ | 7.34 | $ | 8.44 | — | $ | — | $ | — | ||||||||||||||
|
2012
|
— | $ | — | $ | — | 45,750 | $ | 80.00 | $ | 100.25 | ||||||||||||||
|
2013
|
— | $ | — | $ | — | 45,625 | $ | 80.00 | $ | 100.25 | ||||||||||||||
Interest Rate
Swaps
We enter
into interest rate swap agreements, which require exchanges of cash flows that
serve to synthetically convert a portion of our variable interest rate
obligations to fixed interest rates.
From
December 2007 through March 2008, we entered into interest rate swap agreements
which effectively fixed the LIBOR rate at 2.66 % to 3.88% on $60.0 million of
borrowings. In August 2008, we entered into two interest rate basis swaps which
changed the reset option from three month LIBOR to one month LIBOR on the total
$60.0 million of outstanding interest rate swaps. By doing so, the company
reduced its borrowing cost by 14 basis points on $20.0 million of borrowings for
a one year period starting September 10, 2008 and 12 basis points on $40.0
million of borrowings for a one year period starting October 31, 2008. As a
result of these two basis swaps, the company chose to de-designate the interest
rate swaps as cash flow hedges as the terms of the new contracts no longer
matched the terms of the original contracts, thus causing the interest rate
hedges to be ineffective. Beginning in the third quarter of 2008, the Company
recorded changes in the fair value of its interest rate derivatives in current
earnings under gains (losses) on interest rate derivative contracts. The net
unrealized gain at June 30, 2008 related to the de-designated cash flow hedges
is reported in accumulated other comprehensive income and later reclassified to
earnings in the month in which the transactions settle. In December 2008, we
amended three existing interest rate swap agreements and entered into one new
agreement which fixed the LIBOR rate at 1.85% on $10.0 million of borrowings
through December 2010. The first amended agreement reduced the fixed LIBOR rate
from 3.88% to 3.35% on $20.0 million and the maturity was extended two
additional years to December 10, 2012. In addition, the second amended agreement
reset the notional amount on the March 31, 2011 swap from $10.0 million to $20.0
million and also reduced the rate from 2.66% to 2.08%. The third amended
agreement reset the notional amount on the January 31, 2011 swap from $10.0
million to $20.0 million, reduced the rate from 3.00% to 2.38% and also extended
the maturity two additional years to 2013.
At
December 31, 2009, the Company had open interest rate derivative contracts as
follows:
|
Notional Amount
|
Fixed
Libor
Rates
|
||||||
|
Period:
|
|||||||
|
January
1, 2010 to December 18, 2010
|
$
|
10,000,000
|
1.50
|
%
|
|||
|
January
1, 2010 to December 20, 2010
|
$
|
10,000,000
|
1.85
|
%
|
|||
|
January
1, 2010 to January 31, 2011
|
$
|
20,000,000
|
3.00
|
%
|
(1)
|
||
|
January
1, 2010 to March 31, 2011
|
$
|
20,000,000
|
2.08
|
%
|
|||
|
January
1, 2010 to December 10, 2012
|
$
|
20,000,000
|
3.35
|
%
|
|||
|
January
1, 2010 to January 31, 2013
|
$
|
20,000,000
|
2.38
|
%
|
|||
|
(1)
|
In
February 2010, we revised the terms on the 3.00%, $20.0 million interest
rate swap. See Note 13. Subsequent Events for
further discussion.
|
88
Balance Sheet
Presentation
Our
commodity derivatives and interest rate swap derivatives are presented on a net
basis in “derivative assets” and “derivative liabilities” on the consolidated
balance sheets. The following summarizes the fair value of derivatives
outstanding on a gross basis.
|
December
31,
|
||||||||
|
2009
|
2008
|
|||||||
|
(in
thousands)
|
||||||||
|
Assets:
|
||||||||
|
Commodity
derivatives
|
$ | 34,753 | $ | 39,875 | ||||
| $ | 34,753 | $ | 39,875 | |||||
|
Liabilities:
|
||||||||
|
Commodity
derivatives
|
$ | (13,405 | ) | $ | (1,942 | ) | ||
|
Interest
rate swaps
|
(2,222 | ) | (2,799 | ) | ||||
| $ | (15,627 | ) | $ | (4,741 | ) | |||
By using
derivative instruments to economically hedge exposures to changes in commodity
prices and interest rates, we expose ourselves to credit risk and market
risk. Credit risk is the failure of the counterparty to perform under the
terms of the derivative contract. When the fair value of a derivative
contract is positive, the counterparty owes us, which creates credit risk. Our
counterparties are participants in our reserve-based credit facility (See Note
4. Credit Facilities and
Long-Term Debt for further discussion) which is secured by our natural
gas and oil properties; therefore, we are not required to post any
collateral. The maximum amount of loss due to credit risk that we would
incur if our counterparties failed completely to perform according to the terms
of the contracts, based on the gross fair value of financial instruments, was
approximately $34.8 million at December 31, 2009.
We
minimize the credit risk in derivative instruments by: (i) entering into
derivative instruments only with counterparties that are also lenders in our
reserve-based credit facility and (ii) monitoring the creditworthiness of
our counterparties on an ongoing basis. In accordance with our standard
practice, our commodity and interest rate swap derivatives are subject to
counterparty netting under agreements governing such derivatives and therefore
the risk of such loss is somewhat mitigated as of December 31,
2009.
Gain (Loss) on
Derivatives
Realized
gains (losses) represent amounts related to the settlement of other commodity
and interest rate derivative contracts. Unrealized gains (losses) represent the
change in fair value of other commodity and interest rate derivative contracts
that will settle in the future and are non-cash items.
The
following presents our reported gains and losses on derivative instruments at
December 31,:
|
2009
|
2008
|
|||||||
|
(in
thousands)
|
||||||||
|
Realized
gains (losses):
|
||||||||
|
Other
commodity derivatives
|
$ | 29,993 | $ | (6,552 | ) | |||
|
Interest
rate swaps
|
(1,903 | ) | (107 | ) | ||||
| $ | 28,090 | $ | (6,659 | ) | ||||
|
Unrealized
gains (losses):
|
||||||||
|
Other
commodity derivatives
|
$ | (19,043 | ) | $ | 39,029 | |||
|
Interest
rate swaps
|
763 | (3,178 | ) | |||||
| $ | (18,280 | ) | $ | 35,851 | ||||
|
Total
gains (losses):
|
||||||||
|
Other
commodity derivatives
|
$ | 10,950 | $ | 32,477 | ||||
|
Interest
rate swaps
|
(1,140 | ) | (3,285 | ) | ||||
| $ | 9,810 | $ | 29,192 | |||||
There
were no reported gains of losses on other commodity derivative contracts or
interest rate derivative contracts during the year ended December 31, 2007 as
the Company was utilizing hedge accounting and the unrealized gain or loss on
derivatives was deferred in accumulated other comprehensive income (loss) in the
equity section of the consolidated balance sheets.
89
6.
Fair Value Measurements
As
discussed in Note 1. Summary of Significant Accounting Policies (b), we
adopted ASC Topic 820 for financial assets and financial liabilities as of
January 1, 2008 and for non-financial assets and liabilities as of January 1,
2009. ASC Topic 820 does not expand the use of fair value measurements, but
rather, provides a framework for consistent measurement of fair value for those
assets and liabilities already measured at fair value under other accounting
pronouncements. Certain specific fair value measurements, such as those related
to share-based compensation, are not included in the scope of ASC Topic 820.
Primarily, ASC Topic 820 is applicable to assets and liabilities related to
financial instruments, to some long-term investments and liabilities, to initial
valuations of assets and liabilities acquired in a business combination, and to
long-lived assets written down to fair value when they are impaired. It does not
apply to natural gas and oil properties accounted for under the full cost
method, which are subject to impairment based on SEC rules. ASC Topic 820
applies to assets and liabilities carried at fair value on the consolidated
balance sheet, as well as to supplemental fair value information about financial
instruments not carried at fair value.
The
estimated fair values of the Company’s financial instruments closely approximate
the carrying amounts as discussed below:
Cash and cash equivalents, accounts
receivable, other current assets, accounts payable, payables to affiliates,
phantom unit compensation accrual, accrued ad valorem taxes and accrued expense.
The carrying amounts approximate fair value due to the short maturity of
these instruments.
Long-term debt. The carrying
amount of our reserve-based credit facility approximates fair value because our
current borrowing rate does not materially differ from market rates for similar
bank borrowings.
We have
applied the provisions of ASC Topic 820 to assets and liabilities measured at
fair value on a recurring basis. This includes natural gas, oil and interest
rate derivatives contracts. ASC Topic 820 provides a definition of fair value
and a framework for measuring fair value, as well as expanding disclosures
regarding fair value measurements. The framework requires fair value measurement
techniques to include all significant assumptions that would be made by willing
participants in a market transaction. These assumptions include certain factors
not consistently provided for previously by those companies utilizing fair value
measurement; examples of such factors would include our own credit standing
(when valuing liabilities) and the buyer’s risk premium. In adopting ASC Topic
820, we determined that the impact of these additional assumptions on fair value
measurements did not have a material effect on our financial position or results
of operations.
ASC Topic
820 defines fair value as the exchange price that would be received for an asset
or paid to transfer a liability (an exit price) in the principal or most
advantageous market for the asset or liability in an orderly transaction between
market participants on the measurement date. ASC Topic 820 provides a hierarchy
of fair value measurements, based on the inputs to the fair value estimation
process. It requires disclosure of fair values classified according to the
“levels” described below. The hierarchy is based on the reliability of the
inputs used in estimating fair value and requires an entity to maximize the use
of observable inputs and minimize the use of unobservable inputs when measuring
fair value. The framework for fair value measurement assumes that transparent
“observable” (Level 1) inputs generally provide the most reliable evidence of
fair value and should be used to measure fair value whenever available. The
classification of a fair value measurement is determined based on the lowest
level (with Level 3 as lowest) of significant input to the fair value estimation
process.
The
standard describes three levels of inputs that may be used to measure fair
value:
|
Level
1
|
Quoted
prices for identical instruments in active markets.
|
|
|
Level
2
|
Quoted
market prices for similar instruments in active markets; quoted prices for
identical or similar instruments in markets that are not active; and
model-derived valuations in which all significant inputs and significant
value drivers are observable in active markets.
|
|
|
Level 3
|
Valuations
derived from valuation techniques in which one or more significant inputs
or significant value drivers are unobservable. Level 3 assets and
liabilities generally include financial instruments whose value is
determined using pricing models, discounted cash flow methodologies, or
similar techniques, as well as instruments for which the determination of
fair value requires significant management judgment or estimation or for
which there is a lack of external corroboration as to the inputs
used.
|
90
As
required by ASC Topic 820, financial assets and liabilities are classified based
on the lowest level of input that is significant to the fair value measurement.
Our assessment of the significance of a particular input to the fair value
measurement requires judgment and may affect the valuation of the fair value of
assets and liabilities and their placement within the fair value hierarchy
levels. Our commodity derivative instruments consist of swaps and collars. We
estimate the fair values of the swaps based on published forward commodity price
curves for the underlying commodities as of the date of the estimate. We
estimate the value of the collar contract floors and ceilings using an option
pricing model which takes into account market volatility, market prices and
contract parameters. The discount rate used in the discounted cash flow
projections is based on published LIBOR rates, Eurodollar futures rates and
interest swap rates. In order to estimate the fair value of our interest rate
swaps, we use a yield curve based on money market rates and interest rate swaps,
extrapolate a forecast of future interest rates, estimate each future cash flow,
derive discount factors to value the fixed and floating rate cash flows of each
swap, and then discount to present value all known (fixed) and forecasted
(floating) swap cash flows. Curve building and discounting techniques used to
establish the theoretical market value of interest bearing securities are based
on readily available money market rates and interest rate swap market data. To
extrapolate future cash flows, discount factors incorporating our
counterparties’ and our credit standing are used to discount future cash flows.
We have classified the fair values of all our derivative contracts as Level
2.
Financial
assets and financial liabilities measured at fair value on a recurring basis are
summarized below:
|
|
December
31, 2009
|
|||||||||||||||
|
|
Fair Value Measurements Using
|
Assets/Liabilities
|
||||||||||||||
|
|
Level
1
|
Level
2
|
Level
3
|
at Fair value
|
||||||||||||
|
(in
thousands)
|
||||||||||||||||
|
Assets:
|
||||||||||||||||
|
Commodity
price derivative contracts
|
$ | — | $ | 21,415 | $ | — | $ | 21,415 | ||||||||
|
Total
derivative instruments
|
$ | — | $ | 21,415 | $ | — | $ | 21,415 | ||||||||
|
Liabilities:
|
||||||||||||||||
|
Commodity
price derivative contracts
|
$ | — | $ | (67 | ) | $ | — | $ | (67 | ) | ||||||
|
Interest
rate derivative contracts
|
— | (2,222 | ) | — | (2,222 | ) | ||||||||||
|
Total
derivative instruments
|
$ | — | $ | (2,289 | ) | $ | — | $ | (2,289 | ) | ||||||
|
|
December 31, 2008
|
|||||||||||||||
|
|
Fair Value Measurements Using
|
Assets/Liabilities
|
||||||||||||||
|
|
Level
1
|
Level
2
|
Level
3
|
at Fair value
|
||||||||||||
|
(in
thousands)
|
||||||||||||||||
|
Assets:
|
||||||||||||||||
|
Commodity derivative contracts
|
$
|
—
|
$
|
37,933
|
$
|
—
|
$
|
37,933
|
||||||||
|
Total
derivative instruments
|
$
|
—
|
$
|
37,933
|
$
|
—
|
$
|
37,933
|
||||||||
|
Liabilities:
|
||||||||||||||||
|
Interest rate derivative contracts
|
$
|
—
|
$
|
(2,799
|
)
|
$
|
—
|
$
|
(2,799
|
)
|
||||||
|
Total derivative instruments
|
$
|
—
|
$
|
(2,799
|
)
|
$
|
—
|
$
|
(2,799
|
)
|
||||||
On
January 1, 2009, we adopted the previously-deferred provisions of ASC Topic 820
for nonfinancial assets and liabilities, which are comprised primarily of asset
retirement costs and obligations initially measured at fair value in accordance
with ASC Topic 410 Subtopic 20 “Asset Retirement Obligations” (“ASC Topic
410-20”). These assets and liabilities are recorded at fair value
when incurred but not re-measured at fair value in subsequent periods. We
classify such initial measurements as Level 3 since certain significant
unobservable inputs are utilized in their determination. A reconciliation of the
beginning and ending balance of our asset retirement obligations is presented in
Note 7, in accordance with ASC Topic 410-20. During the year ended
December 31, 2009, in connection with natural gas and oil properties acquired in
the Sun TSH and Ward County acquisitions, we incurred and recorded asset
retirement obligations totaling $2.5 million at fair value. The fair value of
additions to the asset retirement obligation liability is measured using
valuation techniques consistent with the income approach, converting future cash
flows to a single discounted amount. Inputs to the valuation include:
(1) estimated plug and abandonment cost per well based on our experience;
(2) estimated remaining life per well based on average reserve life per
field; (3) our credit-adjusted risk-free interest rate ranging between 2.4%
and 3.2%; and (4) the average inflation factor (2.4%). The adoption
of ASC Topic 820 on January 1, 2009, as it relates to nonfinancial assets and
nonfinancial liabilities, did not have a material impact on our financial
position or results of operations.
91
|
|
7.
Asset Retirement Obligations
|
|
|
|
The asset
retirement obligations as of December 31 reported on our consolidated
balance sheets and the changes in the asset retirement obligations for the year
ended December 31, were as follows:
|
2009
|
2008
|
|||||||
|
(in
thousands)
|
||||||||
|
Asset retirement obligation at January 1,
|
$ | 2,134 | $ | 190 | ||||
|
Liabilities
added during the current period
|
2,504 | 1,882 | ||||||
|
Accretion
expense
|
123 | 62 | ||||||
|
Revisions
of estimate
|
(341 | ) | — | |||||
|
Asset
retirement obligation at December 31,
|
$ | 4,420 | $ | 2,134 | ||||
Accretion
expense for the years ended December 31, 2009, 2008 and 2007 was $122,519, $61,683 and
$12,558, respectively.
|
|
8.
Related Party Transactions
|
|
|
|
In
Appalachia, we rely on Vinland to execute our drilling program, operate our
wells and gather our natural gas. Pursuant to amended agreements effective March
1, 2009, we reimburse Vinland $95 per well per month (in addition to normal
third party operating costs) for operating our current natural gas and oil
properties in Appalachia under a Management Services Agreement (“MSA”) which
costs are reflected in our lease operating expenses. Also, pursuant to amended
agreements effective March 1, 2009, Vinland receives a fee based upon the actual
costs incurred by Vinland to provide gathering and transportation services plus
a $0.05 per Mcf margin. This transportation fee only encompasses transporting
the natural gas to third party pipelines at which point additional
transportation fees to natural gas markets would apply. These transportation
fees are outlined under a Gathering and Compression Agreement (“GCA”) with
Vinland and are reflected in our lease operating expenses. For the years ended
December 31, 2009, 2008 and 2007, costs incurred under the MSA were $1.6
million, $0.6 million and $0.5 million, respectively and costs incurred under
the GCA were $1.2 million, $1.0 million and $1.2 million, respectively. A
payable of $1.4 million and $2.6 million, respectively, is reflected on our
December 31, 2009 and 2008 consolidated balance sheets in connection with these
agreements and direct expenses incurred by Vinland related to the drilling of
new wells and operations of all of our existing wells in
Appalachia.
In
September 2008, the Company acquired certain natural gas and oil properties in
Appalachia from Vinland for a total purchase price of $4.0 million. The
consideration included $3.1 million in cash and $0.9 million reduction in
amounts previously due to Vanguard. On April 1, 2009, we and our wholly-owned
subsidiary, TEC, exchanged several wells and lease interests (the
“Asset Exchange”) with Vinland, Appalachian Royalty Trust, LLC, and Nami
Resources Company, L.L.C. (collectively, the “Nami Companies”). Each of the Nami
Companies is beneficially owned by Majeed S. Nami, who, as of
December 31, 2009, beneficially owned 15.2% of our common units representing
limited liability company interests. In the Asset Exchange, we assigned
well, strata and leasehold interests with internal estimated future
cash flows of approximately $2.7 million discounted at ten percent, and received
well, strata, and leasehold interests with an approximately equal value;
therefore no gain or loss was recognized.
|
|
9. Commitments
and Contingencies
|
The
Company is a defendant in a legal proceeding arising in the normal course of our
business. While the outcome and impact of such legal proceedings on the Company
cannot be predicted with certainty, management does not believe that it is
probable that the outcome of any action will have a material adverse effect on
the Company’s consolidated financial position, results of operations or cash
flow.
Nami
Resources Company, LLC, a subsidiary of our Predecessor that was retained by our
founding unitholder in connection with the Restructuring, has been involved in
an ongoing dispute with Asher Land and Mineral Company, Ltd., or Asher, pursuant
to which Asher claims, among other things, that Nami Resources Company, LLC did
not correctly calculate the royalties paid to it and that it failed to abide by
certain terms of the leases relating to the coordination of oil and gas
development with coal development activities.
92
On
September 8, 2006, Asher filed a complaint in Kentucky state court
initiating an action styled
Asher Land and Mineral, Ltd. v. Nami Resources Company, LLC, Bell Circuit
Court, Civil Action No. 06-CI-00417. In that action, Asher sought monetary
damages and court-ordered rescission of the leases. Before a responsive pleading
was filed, Asher voluntarily withdrew its complaint and dismissed the case. On
December 15, 2006, Asher filed a new action styled Asher Land and Mineral, Ltd. v.
Nami Resources Company, LLC, Bell Circuit Court, Civil Action
No. 06-CI-00566. In that action, Asher has made the same allegations as in
the prior suit and added a claim for an undetermined amount of punitive damages.
The parties have exchanged limited initial discovery requests.
On
August 29, 2007, Asher filed a motion to add additional defendants to the
action cited above, including Vanguard Natural Resources, LLC, Vanguard Natural
Gas, LLC and Trust Energy Company, LLC. The Company has filed several motions to
be dismissed from this action but to date is still a named defendant in this
case. Since that time, no discovery has been sought from the Company by Asher.
We have retained separate counsel to represent us in this case as it progresses
and intend to continue to vigorously defend the action.
As part
of the separation of Nami Resources Company, LLC, we received a contract right
to receive approximately 99% of the net proceeds from the sale of production
from certain producing oil and gas wells located within the Asher lease, which
accounted for approximately 1.7% of our estimated proved reserves as of
December 31, 2009. We did not receive an assignment of any working interest
in the Asher lease. The Asher lease and the litigation related thereto were
retained by Nami Resources Company, LLC. If the Asher lease is terminated or if
Nami Resources Company, LLC’s rights to production under wells of which we have
contract rights to receive proceeds are adversely affected, we could lose our
contract rights to receive such proceeds or it could be adversely
affected.
Nami
Resources Company, LLC and Vinland have agreed to indemnify us for all
liabilities, judgments and damages that may arise in connection with the
litigation referenced above as well as providing for the defense of any such
claims. The indemnities agreed to by Nami Resources Company, LLC and
Vinland will remain in place until the resolution of the Asher
litigation.
10. Common Units and
Net Income (Loss) per Unit
Basic
earnings per unit is computed in accordance with ASC Topic 260 “Earnings Per
Share” (“ASC Topic 260”), by dividing net income (loss) attributable to
unitholders by the weighted average number of units outstanding during the
period. Diluted earnings per unit is computed by adjusting the average number of
units outstanding for the dilutive effect, if any, of unit equivalents. We
use the treasury stock method to determine the dilutive effect. As of
December 31, 2009, we have two classes of units outstanding:
(i) units representing limited liability company interests (“common units”)
listed on NYSE under the symbol VNR and (ii) Class B units, issued to
management and an employee as discussed in Note 11. Unit-Based Compensation. The
Class B units participate in distributions and no forfeiture is expected;
therefore, all Class B units were considered in the computation of basic
earnings per unit. The 175,000 options granted to officers under our long-term
incentive plan did not have a dilutive effect as the Company had a net loss for
the years ended December 31, 2009 and 2008 and the exercise price was higher
than the average market price for the years ended December 31, 2008 and 2007;
therefore, they have been excluded in the computation of diluted earnings per
unit. In addition, the phantom units granted to officers under our long-term
incentive plan did not have a dilutive effect as even though there is a
liability at December 31, 2009 and the officers have elected to have a portion
of the liability satisfied in units, the units issued to officers will be from
units held by VNRH in an investment account and no new units will be
issued.
In
accordance with ASC Topic 260, dual presentation of basic and diluted earnings
per unit has been presented in the consolidated statements of operations for the
years ended December 31, 2009, 2008 and 2007 including each class of units
issued and outstanding at that date: common units and Class B
units. Net income (loss) per unit is allocated to the common units and the
Class B units on an equal basis.
11.
Unit-Based Compensation
In April
2007, the sole member at that time reserved 460,000 restricted Class B units in
VNR for issuance to employees. Certain members of management were granted
365,000 restricted Class B units in VNR in April 2007, which vested two years
from the date of grant. In addition, another 55,000 restricted VNR Class B units
were issued in August 2007 to two other employees that were hired in April and
May of 2007, which will vest after three years. The remaining 40,000 restricted
Class B units were not granted and are not expected to be granted in the
future.
93
In
October 2007, one board member was granted 5,000 common units and in February
2008, three board members were granted 5,000 common units each of which vested
after one year. Additionally, in October 2007, two officers were granted options
to purchase an aggregate of 175,000 units under our long-term incentive plan
with an exercise price equal to the initial public offering price of $19.00
which vested immediately upon being granted and had a fair value of $0.1 million
on the date of grant. The grant date fair value for these option awards was
calculated in accordance with ASC Topic 718 “Compensation-Stock Compensation”
(“ASC Topic 718”), by calculating the Black-Scholes value of each option, using
a volatility rate of 12.18%, an expected dividend yield of 8.95% and a discount
rate of 5.12%, and multiplying the Black-Scholes value by the number of options
awarded. In determining a volatility rate of 12.18%, the Company, due to a lack
of historical data regarding the Company’s common units, used the historical
volatility of the Citigroup MLP Index over the 365 day period prior to the date
of grant.
On
January 1, 2009 and March 27, 2008, in accordance with their previously
negotiated employment agreements, phantom units were granted to two officers in
amounts equal to 1% of our units outstanding at January 1, 2009 and 2008. The
2008 phantom units expired on December 31, 2008 and no liability or expense was
recognized as there was no appreciation in the value of the units. The amount
paid in connection with the 2009 phantom units, was paid in cash and in units at
the election of the officers and is equal to the appreciation in value of the
units from the date of the grant until the determination date (December 31,
2009), plus cash distributions paid on the units, less an 8% hurdle rate. At
December 31, 2009, an accrued liability and unit-based compensation expense of
$4.3 million has been recognized in the selling, general and administrative
expense line item in the consolidated statement of operations, of which $0.4
million is non-cash compensation expense.
On
January 7, 2009, four board members were granted 5,000 common units each which
vested in January 2010 and on February 27, 2009, employees were granted 17,950
units which vested in February 2010.
These
common units, Class B units, options and phantom units were granted as partial
consideration for services to be performed under employment contracts and thus
will be subject to accounting for these grants under ASC Topic 718. The fair
value of restricted units issued is determined based on the fair market value of
common units on the date of the grant. This value is amortized over the vesting
period as referenced above. A summary of the status of the non-vested units as
of December 31, 2009 is presented below:
|
Number of
Non-vested Units
|
Weighted Average
Grant Date Fair Value
|
|||||||
|
|
|
|||||||
|
Non-vested
units at December 31, 2008
|
435,000 | $ | 18.52 | |||||
|
Granted
|
37,950 | $ | 8.07 | |||||
|
Vested
|
(380,000 | ) | $ | (17.95 | ) | |||
|
Non-vested
units at December 31, 2009
|
92,950 | $ | 14.54 | |||||
At
December 31, 2009, there was approximately $0.2 million of unrecognized
compensation cost related to non-vested restricted units. The cost is
expected to be recognized over an average period of approximately 0.2 years. Our
consolidated statements of operations reflects non-cash compensation of $2.5
million, $3.6 million and $2.1 million in the selling, general and
administrative expenses line item for the years ended December 31, 2009,
2008 and 2007, respectively.
Unit-based
awards were made in conjunction with new employment agreements with two
executives in February 2010. See Note 13. Subsequent Events for further
discussion.
12.
Shelf Registration Statement
During
the third quarter 2009, we filed a registration statement with the SEC which
registered offerings of up to $300.0 million of any combination of debt
securities, common units and guarantees of debt securities by our subsidiaries.
Net proceeds, terms and pricing of the offering of securities issued under the
shelf registration statement will be determined at the time of the offerings.
The shelf registration statement does not provide assurance that we will or
could sell any such securities. Our ability to utilize the shelf registration
statement for the purpose of issuing, from time to time, any combination of debt
securities or common units will depend upon, among other things, market
conditions and the existence of investors who wish to purchase our securities at
prices acceptable to us.
94
In August
2009, we completed an offering of 3.9 million of our common units. The units
were offered to the public at a price of $14.25 per unit. We received net
proceeds of approximately $53.2 million from the offering, after deducting
underwriting discounts of $2.4 million and offering costs of $0.5 million. In
December 2009, we completed an offering of 2.6 million of our common units. The
units were offered to the public at a price of $18.00 per unit. We received net
proceeds of approximately $44.4 million from the offering, after deducting
underwriting discounts of $2.0 million and offering costs of $0.1 million.We
paid $4.3 million of the proceeds from this offering to redeem 250,000 common
units from our largest unitholder.
As a
result of these offerings, we have approximately $197.4 million remaining
available under our 2009 shelf registration statement as of December 31,
2009.
13.
Subsequent Events
In
February 2010, we extended the terms of a $20.0 million interest rate swap for
two additional years to January 31, 2013 and reduced the rate from 3.00% to
2.66%.
In
February 2010, the Company and VNRH entered into second amended and restated
Executive Employment Agreements (the “Amended Agreements”) with two
executives. The Amended Agreements were effective January 1, 2010 and will
continue until January 1, 2013, with subsequent one year renewals in the event
that neither the Company, VNRH nor the executives have given notice to the other
parties that the agreements should not be extended. The Amended Agreements
provide for an annual base salary and include an annual bonus structure for the
executives. The annual bonus will be composed of two company performance
elements, absolute target distribution growth and relative unit performance to
peer group, as well as a third discretionary element to be determined by the
Company’s board of directors. Each of the three components will comprise an
equal one-third of each annual bonus. The annual bonus does not require a
minimum payout, although the maximum payout may not exceed two times the
respective executive’s annual base salary.
The
Amended Agreements also provide for each executive to receive 15,000 restricted
units granted pursuant to the Vanguard Natural Resources, LLC Long-Term
Incentive Plan (the “LTIP”), as well as an annual grant of 15,000 phantom units
granted pursuant to the LTIP. The restricted units are subject to a vesting
period of three years. One-third of the aggregate number of the units will
vest on each one-year anniversary of the date of grant so long as the executive
remains continuously employed with the Company. In the event the executives
are terminated without “Cause,” or the executive resigns for “Good Reason” (each
term of which is defined in the executive’s respective Amended Agreement), or
the executive is terminated due to his death or “Disability” (as such term is
defined in the Amended Agreement), all unvested outstanding restricted units
shall receive accelerated vesting. Where the executive is terminated for
“Cause,” all restricted units, whether vested or unvested, will be
forfeited. Upon the occurrence of a “Change of Control,” (as defined in the
LTIP), all unvested outstanding restricted units shall vest.
The
phantom units are also subject to a three year vesting period, although the
vesting is not pro-rata, but a one-time event which shall occur on the three
year anniversary of the date of grant so long as the executive remains
continuously employed with the Company during such time. The phantom units are
accompanied by dividend equivalent rights, which entitle the executives to
receive the value of any dividends made by the Company on its units generally
with respect to the number of phantom shares that executive received pursuant to
this grant. In the event the executive is terminated for “Cause” (as such
term is defined in the Amended Agreement), all phantom units, whether vested or
unvested, will be forfeited. The phantom units, once vested, shall be
settled upon the earlier to occur of (a) the occurrence of a “Change of
Control,” (as defined in the LTIP), or (b) the executive’s separation from
service.
95
Vanguard
Natural Resources, LLC and Subsidiaries
Notes
to Consolidated Financial Statements
December 31,
2009
Financial
information by quarter is summarized below.
|
Quarters Ended
|
||||||||||||||||||||
|
March 31
|
June 30
|
September
30
|
December 31
|
Total
|
||||||||||||||||
|
(in
thousands, except per unit amounts)
|
||||||||||||||||||||
|
2009
|
||||||||||||||||||||
|
Natural gas, natural gas
liquids and oil sales
|
$
|
9,202
|
$
|
9,404
|
$
|
11,324
|
$
|
16,105
|
$
|
46,035
|
||||||||||
|
Loss on commodity cash
flow hedges
|
(896
|
)
|
(378
|
)
|
(463
|
)
|
(643
|
)
|
(2,380
|
)
|
||||||||||
|
Realized gain (loss) on
other commodity derivative contracts
|
7,820
|
7,964
|
8,010
|
6,199
|
29,993
|
|||||||||||||||
|
Unrealized
gain (loss) on other commodity derivative contracts
|
9,829
|
(14,101
|
)
|
(12,220
|
)
|
(2,551
|
)
|
(19,043
|
)
|
|||||||||||
|
Total
revenues
|
25,955
|
2,889
|
6,651
|
19,110
|
54,605
|
|||||||||||||||
|
Impairment of natural
gas and oil properties
|
63,818
|
—
|
—
|
46,336
|
110,154
|
|||||||||||||||
|
Other costs and expenses
(1)
|
10,710
|
9,285
|
9,705
|
12,051
|
41,751
|
|||||||||||||||
|
Total costs and
expenses
|
74,528
|
9,285
|
9,705
|
58,387
|
151,905
|
|||||||||||||||
|
Gain
on acquisition of natural gas and oil properties
|
—
|
—
|
5,878
|
1,103
|
6,981
|
|||||||||||||||
|
Net income
(loss)
|
(49,965
|
)
|
(6,768
|
)
|
701
|
(39,703
|
)
|
(95,735
|
)
|
|||||||||||
|
Net income (loss) per
unit:
|
||||||||||||||||||||
|
Common &
Class B units – basic
|
$
|
(3.98
|
)
|
$
|
(0.54
|
)
|
$
|
0.05
|
$
|
(2.31
|
)
|
$
|
(6.74
|
)
|
||||||
|
Common &
Class B units – diluted
|
$
|
(3.98
|
)
|
$
|
(0.54
|
)
|
$
|
0.05
|
$
|
(2.31
|
)
|
$
|
(6.74
|
)
|
||||||
|
2008
|
||||||||||||||||||||
|
Natural gas, natural gas
liquids and oil sales
|
$
|
14,002
|
$
|
20,852
|
$
|
20,839
|
$
|
13,157
|
$
|
68,850
|
||||||||||
|
Gain (loss) on commodity
cash flow hedges
|
416
|
155
|
45
|
(347
|
)
|
269
|
||||||||||||||
|
Realized
gain (loss) on other commodity derivative contracts
|
(1,562
|
)
|
(5,859
|
)
|
(2,989
|
)
|
3,858
|
(6,552
|
)
|
|||||||||||
|
Unrealized
gain (loss) on other commodity derivative contracts
|
(20,210
|
)
|
(52,186
|
)
|
66,353
|
45,072
|
39,029
|
|||||||||||||
|
Total
revenues
|
(7,354
|
)
|
(37,038
|
)
|
84,248
|
61,740
|
101,596
|
|||||||||||||
|
Impairment
of natural gas and oil properties
|
—
|
—
|
—
|
58,887
|
58,887
|
|||||||||||||||
|
Other
costs and expenses (1)
|
7,451
|
8,696
|
10,495
|
11,060
|
37,702
|
|||||||||||||||
|
Total costs and
expenses
|
7,451
|
8,696
|
10,495
|
69,947
|
96,589
|
|||||||||||||||
|
Net income
(loss)
|
(15,932
|
)
|
(47,020
|
)
|
$
|
71,809
|
$
|
(12,609
|
)
|
$
|
(3,752
|
)
|
||||||||
|
Net income (loss) per
unit:
|
||||||||||||||||||||
|
Common &
Class B units – basic
|
$
|
(1.42
|
)
|
$
|
(4.19
|
)
|
$
|
5.90
|
$
|
(1.00
|
)
|
$
|
(0.32
|
)
|
||||||
|
Common &
Class B units – diluted
|
$
|
(1.42
|
)
|
$
|
(4.19
|
)
|
$
|
5.90
|
$
|
(1.00
|
)
|
$
|
(0.32
|
)
|
||||||
|
(1)
|
Includes
lease operating expenses, depreciation, depletion, amortization and
accretion, selling, general and administration expenses, bad debt expense
and production and other taxes.
|
96
We are a
publicly-traded limited liability company focused on the acquisition and
development of mature, long-lived natural gas and oil properties in the United
States.
Capitalized
costs related to natural gas, natural gas liquids and oil producing activities
and related accumulated depletion, amortization and accretion were as follows at
December 31:
|
2009
|
2008
|
|||||||
|
(in
thousands)
|
||||||||
|
Aggregate
capitalized costs relating to natural gas, natural gas liquids and oil
producing activities
|
$ | 399,212 | $ | 284,447 | ||||
|
Aggregate
accumulated depletion, amortization and accretion
|
(226,687 | ) | (102,178 | ) | ||||
|
Net
capitalized costs
|
$ | 172,525 | $ | 182,269 | ||||
|
ASC
Topic 410-20 asset retirement obligations
|
$ | 4,420 | $ | 2,134 | ||||
Costs
incurred in natural gas, natural gas liquids and oil producing activities,
whether capitalized or expensed, were as follows for the years ended
December 31:
|
2009
|
2008
|
2007
|
||||||||||
|
(in
thousands)
|
||||||||||||
|
Property acquisition costs
|
$ | 106,776 | $ | 128,324 | $ | 3,670 | ||||||
|
Development
costs
|
5,825 | 19,097 | 12,860 | |||||||||
|
Total
cost incurred
|
$ | 112,601 | $ | 147,421 | $ | 16,530 | ||||||
No
internal costs were capitalized in 2009, 2008 or 2007. Additionally, capitalized
interest of $58,960 and $75,672 for the years ended December 31, 2008 and
2007, respectively, are included in the table above. There was no capitalized
interest in 2009.
Net
quantities of proved developed and undeveloped reserves of natural gas and oil
and changes in these reserves at December 31, 2009, 2008 and 2007 are
presented below. Information in these tables is based on reserve reports
prepared by our independent petroleum engineers, Netherland, Sewell &
Associates, Inc. for 2009, 2008 and 2007 and DeGolyer and MacNaughton in
2009.
|
Gas (in Mcf)
|
Oil (in Bbls)
|
NGL (in Bbls)
|
||||||||||
|
Net
proved reserves
|
||||||||||||
|
January 1,
2007
|
94,184,665 | 342,968 | — | |||||||||
|
Revisions
of previous estimates
|
(2,073,103 | ) | 56,973 | — | ||||||||
|
Conveyance
of Reserves from Restructuring
|
(29,870,272 | ) | (56,175 | ) | — | |||||||
|
Extensions,
discoveries and other
|
4,544,443 | 16,725 | — | |||||||||
|
Purchases
of reserves in place
|
2,387,113 | 6,165 | — | |||||||||
|
Production
|
(4,044,380 | ) | (30,629 | ) | — | |||||||
|
December 31,
2007
|
65,128,466 | 336,027 | — | |||||||||
|
Revisions
of previous estimates
|
(5,475,099 | ) | 73,480 | — | ||||||||
|
Extensions,
discoveries and other
|
5,856,100 | 25,017 | — | |||||||||
|
Purchases
of reserves in place
|
20,089,537 | 4,374,410 | — | |||||||||
|
Production
|
(4,361,907 | ) | (261,575 | ) | — | |||||||
|
December 31,
2008
|
81,237,097 | 4,547,359 | — | |||||||||
|
Revisions
of previous estimates
|
(36,569,334 | ) | (764,361 | ) | 764,176 | |||||||
|
Extensions,
discoveries and other
|
3,190,928 | 66,227 | — | |||||||||
|
Purchases
of reserves in place
|
39,832,181 | 2,908,923 | 2,900,758 | |||||||||
|
Production
|
(4,542,374 | ) | (345,400 | ) | (114,784 | ) | ||||||
|
December 31,
2009
|
83,148,498 | 6,412,748 | 3,550,150 | |||||||||
|
Proved
developed reserves
|
||||||||||||
|
December 31,
2007
|
48,897,929 | 233,507 | — | |||||||||
|
December 31,
2008
|
58,315,899 | 3,766,394 | — | |||||||||
|
December 31,
2009
|
54,129,281 | 4,765,599 | 2,360,526 | |||||||||
|
Proved
undeveloped reserves
|
||||||||||||
|
December 31,
2007
|
16,230,537 | 102,520 | — | |||||||||
|
December 31,
2008
|
22,921,198 | 780,965 | — | |||||||||
|
December 31,
2009
|
29,019,217 | 1,647,149 | 1,189,624 | |||||||||
97
Revisions
of previous estimates of reserves are a result of changes in natural gas and oil
prices, production costs, well performance and the reservoir engineer’s
methodology. During 2007, natural gas and oil proved reserves were reduced by
29.8 Bcf and 56.1 Bbls, respectively, due to the value of the 60% interest in
proved undeveloped properties which was conveyed to Vinland in the
Restructuring. The initial application of the new rules related to modernizing
reserve calculations and disclosure requirements resulted in a downward
adjustment of 10.6 Bcfe to our total proved reserves and a downward adjustment
of $152.2 million to the standardized measure of discounted future net cash
flows as of December 31, 2009. Approximately 14.2 Bcfe of this downward
adjustment is attributable to the new requirement that 12-month average prices,
instead of end-of-period prices, are used in estimating our quantities of proved
oil and natural gas reserves. Additional proved undeveloped reserves of 3.6 Bcfe
were added as a result of new SEC rules that allow for additional drilling
locations to be classified as proved undeveloped reserves assuming such
locations are supported by reliable technologies. No proved undeveloped reserves
were removed that exceeded the five year development limitation on proved
undeveloped reserves imposed by the new rules. The downward adjustment of 10.6
Bcfe to our total proved reserves due to the new SEC rules was more than offset
by a 74.7 Bcfe increase in our reserves due to acquisitions completed during the
year ended December 31, 2009.
There are
numerous uncertainties inherent in estimating quantities of proved reserves,
projecting future rates of production and projecting the timing of development
expenditures, including many factors beyond our control. The reserve data
represents only estimates. Reservoir engineering is a subjective process of
estimating underground accumulations of natural gas and oil that cannot be
measured in an exact manner. The accuracy of any reserve estimate is a function
of the quality of available data and of engineering and geological
interpretations and judgment. All estimates of proved reserves are determined
according to the rules prescribed by the SEC. These rules indicate
that the standard of “reasonable certainty” be applied to proved reserve
estimates. This concept of reasonable certainty implies that as more technical
data becomes available, a positive, or upward, revision is more likely than a
negative, or downward, revision. Estimates are subject to revision based upon a
number of factors, including reservoir performance, prices, economic conditions
and government restrictions. In addition, results of drilling, testing and
production subsequent to the date of an estimate may justify revision of that
estimate. Reserve estimates are often different from the quantities of natural
gas and oil that are ultimately recovered. The meaningfulness of reserve
estimates is highly dependent on the accuracy of the assumptions on which they
were based. In general, the volume of production from natural gas and oil
properties we own declines as reserves are depleted. Except to the extent we
conduct successful development activities or acquire additional properties
containing proved reserves, or both, our proved reserves will decline as
reserves are produced. There have been no major discoveries or other events,
favorable or adverse, that may be considered to have caused a significant change
in the estimated proved reserves since December 31, 2009.
Our
proved undeveloped reserves at December 31, 2009, as estimated by our
independent petroleum engineers, were 46.0 Bcfe, consisting of 1.6 million
barrels of oil, 29.0 MMcf of natural gas and 1.2 million barrels of natural gas
liquids. In 2009, we developed approximately 0.5% of our total proved
undeveloped reserves booked as of December 31, 2008 through the drilling of one
gross (0.45 net) well at an aggregate capital cost of approximately $0.3
million. None of our proved undeveloped reserves at December 31, 2009 have
remained undeveloped for more than five years since the date of initial booking
as proved undeveloped reserves. At December 31, 2009, there are 18 locations
with 3.9 Bcfe of proved undeveloped reserves in South Texas that are scheduled
to be drilled on a date more than five years from the date the reserves were
initially booked as proved undeveloped since we have a contractual arrangement
with the operator to drill only 14 wells per year.
Results
of operations from producing activities were as follows for the years ended
December 31:
|
2009
|
2008
|
2007
|
||||||||||
|
(in
thousands)
|
||||||||||||
|
Production revenues
(1)
|
$ | 73,648 | $ | 62,543 | $ | 33,838 | ||||||
|
Production
costs (2)
|
(16,722 | ) | (15,800 | ) | (7,120 | ) | ||||||
|
Depreciation,
depletion and amortization
|
(14,440 | ) | (14,812 | ) | (8,960 | ) | ||||||
|
Impairment
of natural gas and oil properties
|
(110,154 | ) | (58,887 | ) | — | |||||||
|
Results
of operations from producing activities
|
$ | (67,668 | ) | $ | (26,956 | ) | $ | 17,758 | ||||
|
|
(1) Production
revenues include gains and losses on commodity cash flow hedges in 2009,
2008 and 2007 and realized gains and losses on other commodity derivative
contracts in 2009 and 2008.
|
|
|
(2) Production
cost includes lease operating expenses and production related taxes,
including ad valorem and severance
taxes.
|
|
|
|
98
The
standardized measure of discounted future net cash flows relating to our proved
natural gas and oil reserves at December 31 is as
follows:
|
2009
|
2008
|
2007
|
||||||||||
|
(in
thousands)
|
||||||||||||
|
Future cash inflows
|
$ | 846,196 | $ | 739,560 | $ | 587,639 | ||||||
|
Future
production costs
|
(362,386 | ) | (258,948 | ) | (173,485 | ) | ||||||
|
Future
development costs
|
(95,297 | ) | (50,268 | ) | (36,842 | ) | ||||||
|
Future
net cash flows
|
388,513 | 430,344 | 377,312 | |||||||||
|
10%
annual discount for estimated timing of cash flows
|
(209,840 | ) | (240,271 | ) | (226,315 | ) | ||||||
|
Standardized
measure of discounted future net cash flows
|
$ | 178,673 | $ | 190,073 | $ | 150,997 | ||||||
For the
December 31, 2009 calculations in the preceding table, estimated future
cash inflows from estimated future production of proved reserves were computed
using the average natural gas and oil price based upon the 12-month average
price of $3.87 per
MMBtu for natural gas and $ 61.04 per barrel of crude oil adjusted for
quality, transportation fees and a regional price differential. The effect of
this change in method decreased the standardized measure of discounted future
net cash flow by $152.2 million. We may receive amounts different than the
standardized measure of discounted cash flow for a number of reasons, including
price changes and the effects of our hedging activities.
The
following are the principal sources of change in our standardized measure of
discounted future net cash flows:
|
Year Ended December 31,
(1)
|
||||||||||||
|
2009
|
2008
|
2007
|
||||||||||
|
(in
thousands)
|
||||||||||||
|
Sales
and transfers, net of production costs
|
$ | (29,313 | ) | $ | (53,050 | ) | $ | (26,718 | ) | |||
|
Net
changes in prices and production costs
|
(21,697 | ) | (20,385 | ) | 52,625 | |||||||
|
Extensions
discoveries and improved recovery, less related costs
|
1,673 | 13,036 | 10,791 | |||||||||
|
Changes
in estimated future development costs
|
2,557 | (12,056 | ) | 18,045 | ||||||||
|
Previously
estimated development costs incurred during the period
|
5,825 | 19,956 | 16,531 | |||||||||
|
Revision
of previous quantity estimates
|
(64,155 | ) | (10,149 | ) | (75,071 | ) | ||||||
|
Accretion
of discount
|
19,007 | 15,100 | 14,882 | |||||||||
|
Purchases
of reserves in place
|
80,776 | 82,454 | 4,249 | |||||||||
|
Change
in production rates, timing and other
|
(6,073 | ) | 4,170 | (13,158 | ) | |||||||
|
Net
change
|
$ | (11,400 | ) | $ | 39,076 | $ | 2,176 | |||||
|
|
(1) This
disclosure reflects changes in the standardized measure calculation
excluding the effects of hedging
activities.
|
99
None.
|
(a)
|
Evaluation
of Disclosure Controls and
Procedures
|
Our
management has established and maintains a system of disclosure controls and
procedures to provide reasonable assurances that information required to be
disclosed by us in reports that we file or submit under the Exchange Act is
recorded, processed, summarized and reported within the time periods specified
in the SEC’s rules and forms, and that such information is accumulated and
communicated to our management, including our Chief Executive Officer and Chief
Financial Officer, as appropriate to allow timely decisions regarding required
disclosure.
We
carried out an evaluation in accordance with Exchange Act Rules 13a-15
under the supervision and with the participation of management, including our
Chief Executive Officer and our Chief Financial Officer, of the effectiveness of
our disclosure controls and procedures as of the end of the period covered by
this report. Based on that evaluation, our Chief Executive Officer and Chief
Financial Officer have concluded that the Company’s internal controls over
financial reporting were effective at the reasonable assurance level at December
31, 2009.
Our
management’s assessment of the effectiveness of our internal control over
financial reporting as of December 31, 2009, is set forth in Item 9A(b)
below.
BDO
Seidman, LLP, an independent registered public accounting firm, has made an
independent assessment of the effectiveness of our internal control over
financial reporting as of December 31, 2009, as stated in their report in
Item 9A(d) below.
|
(b)
|
Management’s
Annual Report on Internal Control Over Financial
Reporting
|
Our
management is responsible for establishing and maintaining effective internal
control over financial reporting, as defined by SEC rules adopted under the
Securities Exchange Act of 1934, as amended. Our internal control over financial
reporting is designed to provide reasonable assurance regarding the reliability
of financial reporting and the preparation of financial statements for external
purposes in accordance with generally accepted accounting principles. It
consists of policies and procedures that:
|
·
|
Pertain
to the maintenance of records that, in reasonable detail, accurately and
fairly reflect the transactions and dispositions of our
assets;
|
|
·
|
Provide
reasonable assurance that transactions are recorded as necessary to permit
preparation of the financial statements in accordance with generally
accepted accounting principles, and that our receipts and expenditures are
being made only in accordance with authorizations of our management and
directors; and
|
|
·
|
Provide
reasonable assurance regarding prevention or timely detection of
unauthorized acquisition, use or disposition of our assets that could have
a material effect on the financial
statements.
|
Because
of its inherent limitations, internal control over financial reporting may not
prevent or detect misstatements. Therefore, even those systems determined to be
effective can provide only reasonable assurance with respect to financial
statement preparation and presentation. Also, projections of any evaluation of
effectiveness to future periods are subject to the risk that controls may become
inadequate because of changes in conditions, or that the degree of compliance
with the policies and procedures may deteriorate.
Under the
supervision and with the participation of management, including the Chief
Executive Officer (CEO) and Chief Financial Officer (CFO), we made an assessment
of the effectiveness of our internal control over financial reporting as of
December 31, 2009. In making this assessment, we used the criteria established
in Internal Control —
Integrated Framework issued by the Committee of Sponsoring Organizations
of the Treadway Commission (COSO). Based on our evaluation, we concluded that
our internal control over financial reporting was effective as of December 31,
2009. The effectiveness of our internal control over financial reporting as of
December 31, 2009 has been audited by BDO Seidman, LLP, an independent
registered public accounting firm, as stated in their report included
herein.
100
|
(c)
|
Changes
in Internal Control over Financial
Reporting
|
There
were no changes in our internal control over financial reporting during the
fourth quarter of 2009 that have materially affected, or are reasonably likely
to materially affect, our internal control over financial
reporting.
|
(d)
|
Attestation
Report
|
Report
of Independent Registered Public Accounting Firm
on
Internal Control over Financial Reporting
Board of
Directors and Shareholders
Vanguard
Natural Resources, LLC
Houston,
Texas
We have
audited Vanguard Natural Resources, LLC’s internal control over financial
reporting as of December 31, 2009, based on criteria established in Internal Control – Integrated
Framework issued by the Committee of Sponsoring Organizations of the
Treadway Commission (the COSO criteria). Vanguard Natural Resources, LLC’s
management is responsible for maintaining effective internal control over
financial reporting and for its assessment of the effectiveness of internal
control over financial reporting, included in the accompanying “Item 9A,
Management’s Annual Report on Internal Control Over Financial Reporting.” Our
responsibility is to express an opinion on the Company’s internal control over
financial reporting based on our audit.
We
conducted our audit in accordance with the standards of the Public Company
Accounting Oversight Board (United States). Those standards require that we plan
and perform the audit to obtain reasonable assurance about whether effective
internal control over financial reporting was maintained in all material
respects. Our audit included obtaining an understanding of internal control over
financial reporting, assessing the risk that a material weakness exists, and
testing and evaluating the design and operating effectiveness of internal
control based on the assessed risk. Our audit also included performing such
other procedures as we considered necessary in the circumstances. We believe
that our audit provides a reasonable basis for our opinion.
A
company’s internal control over financial reporting is a process designed to
provide reasonable assurance regarding the reliability of financial reporting
and the preparation of financial statements for external purposes in accordance
with generally accepted accounting principles. A company’s internal control over
financial reporting includes those policies and procedures that (1) pertain to
the maintenance of records that, in reasonable detail, accurately and fairly
reflect the transactions and dispositions of the assets of the company; (2)
provide reasonable assurance that transactions are recorded as necessary to
permit preparation of financial statements in accordance with generally accepted
accounting principles, and that receipts and expenditures of the company are
being made only in accordance with authorizations of management and directors of
the company; and (3) provide reasonable assurance regarding prevention or timely
detection of unauthorized acquisition, use, or disposition of the company’s
assets that could have a material effect on the financial
statements.
Because
of its inherent limitations, internal control over financial reporting may not
prevent or detect misstatements. Also, projections of any evaluation of
effectiveness to future periods are subject to the risk that controls may become
inadequate because of changes in conditions, or that the degree of compliance
with the policies or procedures may deteriorate.
In our
opinion, Vanguard Natural Resources, LLC maintained, in all material respects,
effective internal control over financial reporting as of December 31, 2009,
based on the COSO criteria.
We also
have audited, in accordance with the standards of the Public Company Accounting
Oversight Board (United States), the consolidated balance sheets of Vanguard
Natural Resources LLC as of December 31, 2009 and 2008 and the related
consolidated statements of operations, comprehensive loss, members’ equity,
and cash flows for each of the years then ended and our report dated March 5,
2010 expressed an unqualified opinion thereon.
/s/ BDO
Seidman, LLP
Houston,
Texas
March 5,
2010
None.
101
|
DIRECTORS,
EXECUTIVE OFFICERS AND CORPORATE GOVERNANCE
|
Item 10
will be incorporated by reference pursuant to Regulation 14A under the
Securities Exchange Act of 1934. The Registrant expects to file a
definitive proxy statement with the Securities and Exchange Commission within
120 days after the close of the year ended December 31, 2009.
|
EXECUTIVE
COMPENSATION
|
Item 11
will be incorporated by reference pursuant to Regulation 14A under the
Securities Exchange Act of 1934. The Registrant expects to file a
definitive proxy statement with the Securities and Exchange Commission within
120 days after the close of the year ended December 31, 2009.
|
SECURITY
OWNERSHIP OF CERTAIN BENEFICIAL OWNERS AND MANAGEMENT AND RELATED
STOCKHOLDER MATTERS
|
Item 12
will be incorporated by reference pursuant to Regulation 14A under the
Securities Exchange Act of 1934. The Registrant expects to file a
definitive proxy statement with the Securities and Exchange Commission within
120 days after the close of the year ended December 31, 2009.
|
CERTAIN
RELATIONSHIPS AND RELATED TRANSACTIONS, AND DIRECTOR INDEPENDENCE
|
Item 13
will be incorporated by reference pursuant to Regulation 14A under the
Securities Exchange Act of 1934. The Registrant expects to file a
definitive proxy statement with the Securities and Exchange Commission within
120 days after the close of the year ended December 31, 2009.
|
PRINCIPAL
ACCOUNTANT FEES AND SERVICES
|
Item 14
will be incorporated by reference pursuant to Regulation 14A under the
Securities Exchange Act of 1934. The Registrant expects to file a
definitive proxy statement with the Securities and Exchange Commission within
120 days after the close of the year ended December 31, 2009.
102
ITEM 15. EXHIBITS AND FINANCIAL STATEMENT
SCHEDULES
(a) The
following documents are filed as a part of this report:
|
|
Financial
statements
|
|
|
|
The
following consolidated financial statements are included in Part II—
Item 8 of this report:
|
Page
|
|
|
|
(b)
Exhibits
|
The
following exhibits are incorporated by reference into the filing indicated or
are filed herewith.
|
Exhibit No.
|
Exhibit Title
|
Incorporated by Reference to the
Following
|
||
|
3.1
|
Certificate
of Formation of Vanguard Natural Resources, LLC
|
Form
S-1/A, filed April 25, 2007 (File No. 333-142363)
|
||
|
3.2
|
Second
Amended and Restated Limited Liability Company Agreement of Vanguard
Natural Resources, LLC (including specimen unit certificate for the
units)
|
Form
8-K, filed November 2, 2007 (File No. 001-33756)
|
||
|
10.1+
|
Vanguard
Natural Resources, LLC Long-Term Incentive Plan
|
Form
8-K, filed October 24, 2007 (File No. 001-33756)
|
||
|
10.2+
|
Form of
Vanguard Natural Resources, LLC Long-Term Incentive Plan Phantom Options
Grant Agreement
|
Form
S-1/A, filed April 25, 2007 (File No. 333-142363)
|
||
|
10.3+
|
Vanguard
Natural Resources, LLC Class B Unit Plan
|
Form
8-K, filed October 24, 2007 (File No. 001-33756)
|
||
|
10.4+
|
Form of
Vanguard Natural Resources, LLC Class B Unit Plan Restricted
Class B Unit Grant
|
Form
S-1/A, filed April 25, 2007 (File No. 333-142363)
|
||
|
10.5
|
Management
Services Agreement, effective January 5, 2007, by and between Vinland
Energy Operations, LLC, Vanguard Natural Gas, LLC, Trust Energy Company,
LLC and Ariana Energy, LLC
|
Form
S-1/A, filed April 25, 2007 (File No. 333-142363)
|
||
|
10.6
|
Participation
Agreement, effective January 5, 2007, by and between Vinland Energy
Eastern, LLC, Vanguard Natural Gas, LLC, Trust Energy Company, LLC and
Ariana Energy, LLC
|
Form
S-1/A, filed April 25, 2007 (File No. 333-142363)
|
||
|
10.7
|
Gathering
and Compression Agreement, effective January 5, 2007, by and between
Vinland Energy Gathering, LLC, Vinland Energy Eastern, LLC, Vanguard
Natural Gas, LLC and Ariana Energy, LLC
|
Form
S-1/A, filed April 25, 2007 (File No. 333-142363)
|
||
|
10.8
|
Gathering
and Compression Agreement, effective January 5, 2007, by and between
Vinland Energy Gathering, LLC, Vinland Energy Eastern, LLC, Vanguard
Natural Gas, LLC and Trust Energy Company
|
Form
S-1/A, filed April 25, 2007 (File No. 333-142363)
|
||
|
10.9
|
Gathering
and Compression Agreement, effective January 5, 2007, by and between
Vinland Energy Gathering, LLC and Nami Resources Company,
L.L.C.
|
Form
S-1/A, filed April 25, 2007 (File No. 333-142363)
|
||
|
10.10
|
Well
Services Agreement, effective January 5, 2007, by and between Vinland
Energy Operations, LLC, Vanguard Natural Gas, LLC and Ariana Energy,
LLC
|
Form
S-1/A, filed April 25, 2007 (File No. 333-142363)
|
||
|
10.11
|
Well
Services Agreement, effective January 5, 2007, by and between Vinland
Energy Operations, LLC, Vanguard Natural Gas, LLC and Trust Energy
Company, LLC
|
Form
S-1/A, filed April 25, 2007 (File No. 333-142363)
|
||
|
10.12
|
Well
Services Agreement, effective January 5, 2007, by and between Vinland
Energy Operations, LLC and Nami Resources Company, L.L.C.
|
Form
S-1/A, filed April 25, 2007 (File No.
333-142363)
|
103
|
10.13
|
Amended
and Restated Operating Agreement by and between Vinland Energy Operations,
LLC, Vinland Energy Eastern, LLC and Ariana Energy, LLC, dated October 2,
2007 and effective as of January 5, 2007
|
Form
S-1/A, filed October 22, 2007 (File No. 333-142363)
|
||
|
10.14
|
Operating
Agreement, effective January 5, 2007, by and between Vinland Energy
Operations, LLC, Vinland Energy Eastern, LLC and Trust Energy Company,
LLC
|
Form
S-1/A, filed April 25, 2007 (File No. 333-142363)
|
||
|
10.15
|
Amended
and Restated Indemnity Agreement by and between Nami Resources Company,
L.L.C., Vinland Energy Eastern, LLC, Trust Energy Company, LLC, Vanguard
Natural Gas, LLC and Vanguard Natural Resources, LLC, dated September 11,
2007
|
Form
S-1/A, filed September 18, 2007 (File No. 333-142363)
|
||
|
10.16
|
Revenue
Payment Agreement by and between Nami Resources Company, L.L.C. and Trust
Energy Company, dated April 18, 2007 and effective as of January 5,
2007
|
Form
S-1/A, filed August 21, 2007 (File No. 333-142363)
|
||
|
10.17
|
Gas
Supply Agreement, dated April 18, 2007, by and between Nami Resources
Company, L.L.C. and Trust Energy Company
|
Form
S-1/A, filed April 25, 2007 (File No. 333-142363)
|
||
|
10.18
|
Registration
Rights Agreement, dated April 18, 2007, between Vanguard Natural
Resources, LLC and the private investors named therein
|
Form
S-1/A, filed April 25, 2007 (File No. 333-142363)
|
||
|
10.19
|
Purchase
Agreement, dated April 18, 2007, between Vanguard Natural Resources,
LLC, Majeed S. Nami and the private investors named
therein
|
Form
S-1/A, filed April 25, 2007 (File No. 333-142363)
|
||
|
10.20
|
Omnibus
Agreement, dated October 29, 2007, among Majeed S. Nami, Vanguard Natural
Resources, LLC, Vanguard Natural Gas, LLC, Ariana Energy, LLC and Trust
Energy Company, LLC.
|
Form
8-K, filed November 2, 2007 (File No. 001-33756)
|
||
|
10.21+
|
Employment
Agreement, dated May 15, 2007, by and between Britt Pence, VNR Holdings,
LLC and Vanguard Natural Resources, LLC
|
Form
S-1/A, filed July 5, 2007 (File No. 333-142363)
|
||
|
10.22
|
Natural
Gas Contract, dated May 26, 2003, between Nami Resources Company,
Inc. and Osram Sylvania Products, Inc.
|
Form
S-1/A, filed August 21, 2007 (File No. 333-142363)
|
||
|
10.23
|
Natural
Gas Purchase Contract, dated December 16, 2004, between Nami
Resources Company, LLC and Dominion Field Services, Inc.
|
Form
S-1/A, filed August 21, 2007 (File No. 333-142363)
|
||
|
10.24
|
Natural
Gas Purchase Contract, dated December 28, 2004, between Nami
Resources Company, LLC and Dominion Field Services, Inc.
|
Form
S-1/A, filed August 21, 2007 (File No. 333-142363)
|
||
|
10.25+
|
Director
Compensation Agreement
|
Form
S-1/A, filed September 18, 2007 (File No. 333-142363)
|
||
|
10.26
|
Purchase
and Sale Agreement, dated December 21, 2007, among Vanguard Permian, LLC
and Apache Corporation
|
Form
8-K/A, filed February 13, 2008 (File No. 001-33756)
|
||
|
10.27
|
Amended
Purchase and Sale Agreement, dated January 31, 2008, among Vanguard
Permian, LLC and Apache Corporation
|
Form
8-K/A, filed February 4, 2008 (File No. 001-33756)
|
||
|
10.28
|
Amended
and Restated Credit Agreement, dated February 14, 2008, by and between
Nami Holding Company, LLC, Citibank, N.A., as administrative agent and L/C
issuer and the lenders party thereto
|
Previously
filed with our Form 10-K on March 31, 2008
|
||
|
10.29
|
Purchase
and Sale Agreement, dated July 18, 2008, among Vanguard Permian, LLC and
Segundo Navarro Drilling, Ltd.
|
Form
8-K, filed July 21, 2008 (File No. 001-33756)
|
||
|
10.30+
|
Form
of Indemnity Agreement dated August 7, 2008
|
Previously
filed with our Quarterly report on Form 10-Q on August 13,
2008
|
||
|
10.31
|
Second
Amendment to First Amended and Restated Credit Agreement, dated October
22, 2008, by and between Vanguard Natural Gas, LLC, BBVA Compass Bank, as
lender, and Citibank, N.A., as administrative agent
|
Previously
filed with our Quarterly report on Form 10-Q on November 14,
2008
|
||
|
10.32
|
First
Amendment to First Amended and Restated Credit Agreement, dated May 15,
2008, by and between Vanguard Natural Gas, LLC, lenders party thereto, and
Citibank, N.A., as administrative agent
|
Previously
filed with our Form 10-K on March 11, 2009
|
||
|
10.33
|
Third
Amendment to First Amended and Restated Credit Agreement, dated February
18, 2009, by and between Vanguard Natural Gas, LLC, lenders party thereto,
and Citibank, N.A., as administrative agent
|
Previously
filed with our Form 10-K on March 11, 2009
|
||
|
10.34
|
First
Amendment to Gathering and Compression Agreement, dated May 8, 2009,
effective March 1, 2009, by and between Vinland Energy Gathering, LLC,
Vinland Energy Eastern, LLC, Vanguard Natural Gas, LLC and Trust Energy
Company, LLC
|
Previously
filed with our Quarterly report on Form 10-Q on May 11,
2009
|
||
|
10.35
|
First
Amendment to Management Services Agreement, dated May 8, 2009, effective
March 1, 2009, by and between Vinland Energy Operations, LLC, Vanguard
Natural Gas, LLC, Trust Energy Company, LLC and Ariana Energy,
LLC
|
Previously
filed with our Quarterly report on Form 10-Q on May 11,
2009
|
||
|
10.36
|
Fourth
Amendment to First Amended and Restated Credit Agreement, dated June 26,
2009, by and between Vanguard Natural Gas, LLC, lenders party thereto, and
Citibank, N.A., as administrative agent
|
Previously
filed with our Quarterly report on Form 10-Q on July 31,
2009
|
||
|
10.37
|
Purchase
and Sale Agreement, dated July 17, 2009, among Vanguard Permian, LLC and
Segundo Navarro Drilling, Ltd.
|
Form
8-K, filed July 21, 2009 (File No. 001-33756)
|
||
|
10.38
|
Second
Amended and Restated Credit Agreement dated August 31, 2009, by and
between Vanguard Natural Gas, LLC, Citibank, N.A., as administrative agent
and the lenders party hereto
|
Form
8-K, filed September 1, 2009 (File No.
001-33756)
|
104
|
10.39
|
First
Amendment to Second Amended and Restated Credit Agreement dated October
14, 2009, by and between Vanguard Natural Gas, LLC, Citibank, N.A., as
administrative agent and the lenders party hereto
|
Previously
filed with our Quarterly report on Form 10-Q on November 4,
2009
|
||
|
10.40
|
Underwriting
Agreement dated December 1, 2009, by and among Vanguard Natural
Resources, LLC and Citigroup Global Markets Inc., Wells Fargo Securities,
LLC and RBC Capital Markets Corporation, as representatives of the several
underwriters named therein
|
Form
8-K, filed December 2, 2009 (File No. 001-33756)
|
||
|
10.41
|
Purchase
and Sale Agreement, Lease Amendment and Lease Royalty Conveyance Agreement
and Conveyance Agreement, dated November 27, 2009, among Vanguard Permian,
LLC and Fortson Production Company and Benco Energy, Inc.
|
Form
8-K, filed December 4, 2009 (File No. 001-33756)
|
||
|
10.42+
|
Second
Amended and Restated Employment Agreement, effective January 1, 2010, by
and between Scott W. Smith, VNR Holdings, LLC and Vanguard Natural
Resources, LLC
|
Form
8-K, filed February 8, 2010 (File No. 001-33756)
|
||
|
10.43+
|
Second
Amended and Restated Employment Agreement, effective January 1, 2010, by
and between Scott W. Smith, VNR Holdings, LLC and Vanguard Natural
Resources, LLC
|
Form
8-K, filed February 8, 2010 (File No. 001-33756)
|
||
|
10.44+
|
Restricted
Unit Award Agreement, by and between Vanguard Natural Resources, LLC, VNR
Holdings, LLC. and Scott W. Smith
|
Form
8-K, filed February 8, 2010 (File No. 001-33756)
|
||
|
10.45+
|
Restricted
Unit Award Agreement, by and between Vanguard Natural Resources, LLC, VNR
Holdings, LLC. and Richard A. Robert
|
Form
8-K, filed February 8, 2010 (File No. 001-33756)
|
||
|
10.46+
|
Phantom
Unit Award Agreement, by and between Vanguard Natural Resources, LLC, VNR
Holdings, LLC. and Scott W. Smith
|
Form
8-K, filed February 8, 2010 (File No. 001-33756)
|
||
|
10.47+
|
Phantom
Unit Award Agreement, by and between Vanguard Natural Resources, LLC, VNR
Holdings, LLC. and Richard A. Robert
|
Form
8-K, filed February 8, 2010 (File No. 001-33756)
|
||
|
16.1
|
Letter
re change in certifying accountant
|
Form
8-K, filed on September 2, 2008 (File No. 001-33756)
|
||
|
21.1
|
List
of subsidiaries of Vanguard Natural Resources, LLC
|
Filed
herewith
|
||
|
23.1
|
Consent
of BDO Seidman, LLP, Independent Registered Public Accounting
Firm
|
Filed
herewith
|
||
|
23.2
|
Consent
of UHY LLP, Independent Registered Public Accounting Firm
|
Filed
herewith
|
||
|
23.3
|
Consent
of Netherland, Sewell & Associates, Inc., Independent Petroleum
Engineers and Geologists
|
Filed
herewith
|
||
|
23.4
|
Consent
of DeGolyer and MacNaughton, Independent Petroleum Engineers and
Geologists
|
Filed
herewith
|
||
|
24.1
|
Power
of Attorney (included on signature page hereto)
|
Filed
herewith
|
||
|
31.1
|
Certification
of Chief Executive Officer Pursuant to Rule 13a — 14 of the
Securities and Exchange Act of 1934, as Adopted Pursuant to
Section 302 of the Sarbanes-Oxley Act of 2002
|
Filed
herewith
|
||
|
31.2
|
Certification
of Chief Financial Officer Pursuant to Rule 13a — 14 of the
Securities and Exchange Act of 1934, as Adopted Pursuant to
Section 302 of the Sarbanes-Oxley Act of 2002
|
Filed
herewith
|
||
|
32.1
|
Certification
of Chief Executive Officer Pursuant to 18 U.S.C. Section 1350,
as Adopted Pursuant to Section 906 of the Sarbanes-Oxley Act of
2002
|
Filed
herewith
|
||
|
32.2
|
Certification
of Chief Financial Officer Pursuant to 18 U.S.C. Section 1350,
as Adopted Pursuant to Section 906 of the Sarbanes-Oxley Act of
2002
|
Filed
herewith
|
||
|
99.1
|
Report
of Netherland, Sewell & Associates, Inc., Independent Petroleum
Engineers and Geologists
|
Filed
herewith
|
||
|
99.2
|
Report
of DeGolyer and MacNaughton, Independent Petroleum Engineers and
Geologists
|
Filed
herewith
|
||
|
+
Management Contract or Compensatory Plan or Arrangement required to be
filed as an exhibit hereto pursuant to item 601 of Regulation
S-K.
|
||||
105
Pursuant
to the requirements of Section 13 or 15(d) of the Securities Exchange
Act of 1934, Vanguard Natural Resources, LLC has duly caused this report to be
signed on its behalf by the undersigned, thereunto duly authorized on the 5th day
of March, 2010.
|
VANGUARD
NATURAL RESOURCES, LLC
|
||||||||||
|
By
|
/s/
Scott W. Smith
|
|||||||||
|
Scott
W. Smith
|
||||||||||
|
President
and Chief Executive Officer
|
||||||||||
KNOW ALL
MEN BY THESE PRESENTS, that each person whose signature appears below
constitutes and appoints Scott W. Smith and Richard A. Robert, and each of them
severally, his true and lawful attorney or attorneys-in-fact and agents, with
full power to act with or without the others and with full power of substitution
and resubstitution, to execute in his name, place and stead, in any and all
capacities, any or all amendments to this Annual Report on Form 10-K, with
all exhibits thereto, and other documents in connection therewith, with the
Securities and Exchange Commission, granting unto said attorneys-in-fact and
agents and each of them, full power and authority to do and perform in the name
of on behalf of the undersigned, in any and all capacities, each and every act
and thing necessary or desirable to be done in and about the premises, to all
intents and purposes and as fully as they might or could do in person, hereby
ratifying, approving and confirming all that said attorneys-in-fact and agents
or their substitutes may lawfully do or cause to be done by virtue
hereof.
Pursuant
to the requirements of the Securities Exchange Act of 1934, this report has been
signed below by the following persons on behalf of the registrant and in the
capacities and on the dates indicated.
|
March 5,
2010
|
/s/
Scott W. Smith
|
|
Scott
W. Smith
|
|
|
President,
Chief Executive Officer and Director
|
|
|
(Principal
Executive Officer)
|
|
|
March 5,
2010
|
/s/
Richard A. Robert
|
|
Richard
A. Robert
|
|
|
Executive
Vice President and Chief Financial Officer
|
|
|
(Principal
Financial Officer and Principal Accounting Officer)
|
|
|
March 5,
2010
|
/s/
W. Richard Anderson
|
|
W.
Richard Anderson
|
|
|
Director
|
|
|
March 5,
2010
|
/s/
Bruce W. McCullough
|
|
Bruce
W. McCullough
|
|
|
Director
|
|
|
March 5,
2010
|
/s/
John R. McGoldrick
|
|
John
R. McGoldrick
|
|
|
Director
|
|
|
March 5,
2010
|
/s/
Loren Singletary
|
|
Loren
Singletary
|
|
|
Director
|
|
|
March 5,
2010
|
/s/
Lasse Wagene
|
|
Lasse
Wagene
|
|
|
Director
|
106