Attached files
Table of Contents
UNITED STATES
SECURITIES AND EXCHANGE COMMISSION
Washington, D.C. 20549
FORM 10-K
| x | Annual Report pursuant to Section 13 or 15(d) of the Securities Exchange Act of 1934 |
For the fiscal year ended December 31, 2009 or
| ¨ | Transition Report pursuant to Section 13 or 15(d) of the Securities Exchange Act of 1934 |
For the transition period from to
Commission File Number 000-19289

STATE AUTO FINANCIAL CORPORATION
(Exact name of Registrant as specified in its charter)
| Ohio | 31-1324304 | |
| (State or other jurisdiction of incorporation or organization) |
(I.R.S. Employer Identification No.) | |
| 518 East Broad Street, Columbus, Ohio | 43215-3976 | |
| (Address of principal executive offices) | (Zip Code) | |
Registrant’s telephone number, including area code:
(614) 464-5000
Securities registered pursuant to Section 12(b) of the Act: None
Securities registered pursuant to Section 12(g) of the Act:
Common Shares, without par value
Indicate by check mark if the Registrant is a well-known seasoned issuer, as defined in Rule 405 of the Securities Act. Yes ¨ No x
Indicate by check mark if the Registrant is not required to file reports pursuant to Section 13 or Section 15(d) of the Act. Yes ¨ No x
Indicate by check mark whether the Registrant (1) has filed all reports required to be filed by Section 13 or 15(d) of the Securities Exchange Act of 1934 during the preceding 12 months (or for such shorter period that the Registrant was required to file such reports), and (2) has been subject to such filing requirements for the past 90 days. Yes x No ¨
Indicate by check mark whether the Registrant has submitted electronically and posted on its corporate Web site, if any, every Interactive Data File required to be submitted and posted pursuant to Rule 405 of Regulation S-T during the preceding 12 months (or for such shorter period that the Registrant was required to submit and post such files). Yes ¨ No ¨
Indicate by check mark if disclosure of delinquent filers pursuant to Item 405 of Regulation S-K is not contained herein, and will not be contained, to the best of Registrant’s knowledge, in definitive proxy or information statements incorporated by reference in Part III of this Form 10-K or any amendment to this Form 10-K. ¨
Indicate by check mark whether the Registrant is a large accelerated filer, an accelerated filer, or a non-accelerated filer, or a smaller reporting company. See the definitions of “large accelerated filer”, “accelerated filer” and “smaller reporting company” in Rule 12b-2 of the Exchange Act.
| Large accelerated filer ¨ |
Accelerated filer x | |
| Non-accelerated filer ¨ (Do not check if a smaller reporting company) |
Smaller reporting company ¨ |
Indicate by check mark whether the Registrant is a shell company (as defined in Rule 12b-2 of the Act). Yes ¨ No x
As of June 30, 2009, the last business day of the Registrant’s most recently completed second fiscal quarter, the aggregate market value (based on the closing sales price on that date) of the voting stock held by non-affiliates of the Registrant was $251,721,820.
On February 26, 2010, the Registrant had 39,871,374 Common Shares outstanding.
DOCUMENTS INCORPORATED BY REFERENCE
Portions of the Registrant’s Proxy Statement relating to the annual meeting of stockholders to be held May 7, 2010 (the “2010 Proxy Statement”), which will be filed within 120 days of December 31, 2009, are incorporated by reference into Part III of this Form 10-K.
Table of Contents
Index to Annual Report on Form 10-K for the year ended December 31, 2009
| Form 10-K |
Item | Description |
Page | |||
| Part I |
1 | 2 | ||||
| 11 | ||||||
| 1A | 12 | |||||
| 1B | 24 | |||||
| 2 | 24 | |||||
| 3 | 24 | |||||
| 4 | 24 | |||||
| Part II |
5 | 25 | ||||
| 6 | 27 | |||||
| 7 | Management’s Discussion and Analysis of Financial Condition and Results of Operations |
28 | ||||
| 7A | 88 | |||||
| 8 | 89 | |||||
| 89 | ||||||
| 9 | Changes in and Disagreements with Accountants on Accounting and Financial Disclosures |
138 | ||||
| 9A | 138 | |||||
| 9B | 138 | |||||
| Part III |
10 | 139 | ||||
| 11 | 139 | |||||
| 12 | Security Ownership of Certain Beneficial Owners and Management and Related Stockholder Matters |
139 | ||||
| 13 | Certain Relationships and Related Transactions, and Director Independence |
140 | ||||
| 14 | 140 | |||||
| Part IV |
15 | 140 | ||||
| 154 | ||||||
Table of Contents
IMPORTANT INFORMATION REGARDING FORWARD-LOOKING STATEMENTS
All statements, other than statements of historical facts, included in this Annual Report on Form 10-K (this “Form 10-K”) of State Auto Financial Corporation (“State Auto Financial” or “STFC”) or incorporated herein by reference, including, without limitation, statements regarding State Auto Financial’s future financial position, business strategy, budgets, projected costs, goals and plans and objectives of management for future operations, are forward-looking statements within the meaning of the Private Securities Litigation Reform Act of 1995. Forward-looking statements generally can be identified by the use of forward-looking terminology such as “may,” “will,” “expect,” “intend,” “estimate,” “anticipate,” “project,” “believe” or “continue” or the negative thereof or variations thereon or similar terminology. Forward-looking statements speak only as the date the statements were made. Although State Auto Financial believes that the expectations reflected in forward-looking statements have a reasonable basis, it can give no assurance that these expectations will prove to be correct. Forward-looking statements are subject to risks and uncertainties that could cause actual events or results to differ materially from those expressed in or implied by the statements. For a discussion of the most significant risks and uncertainties that could cause State Auto Financial’s actual results to differ materially from those projected, see “Risk Factors” in Item 1A of this Form 10-K. Except to the limited extent required by applicable law, State Auto Financial undertakes no obligation to update or revise any forward-looking statements, whether as a result of new information, future events or otherwise.
IMPORTANT DEFINED TERMS USED IN THIS FORM 10-K
As used in this Form 10-K, the following terms have the meanings ascribed below:
| • | “State Auto Financial” or “STFC” refers to State Auto Financial Corporation; |
| • | “We,” “us,” “our” or the “Company” refers to STFC and its consolidated subsidiaries, namely State Auto Property & Casualty Insurance Company (“State Auto P&C”), Milbank Insurance Company (“Milbank”), Farmers Casualty Insurance Company (“Farmers”), State Auto Insurance Company of Ohio (“SA Ohio”), State Auto National Insurance Company (“SA National”), and Stateco Financial Services, Inc. (“Stateco”); |
| • | “State Auto Mutual” or “our parent company” refers to State Automobile Mutual Insurance Company, which owns approximately 63.5% of STFC’s outstanding common shares; |
| • | The “Pooled Companies” or “our Pooled Companies” refer to State Auto P&C, Milbank, Farmers, SA Ohio, effective January 1, 2010 SA National (referred to as the “STFC Pooled Companies”), State Auto Mutual, and certain subsidiaries and affiliates of State Auto Mutual, namely State Auto Florida Insurance Company (“SA Florida”), State Auto Insurance Company of Wisconsin (“SA Wisconsin”), Meridian Security Insurance Company (“Meridian Security”) Meridian Citizens Mutual Insurance Company (“Meridian Citizens Mutual”), Beacon National Insurance Company (“Beacon National”), Patrons Mutual Insurance Company of Connecticut (“Patrons Mutual”), and Litchfield Mutual Fire Insurance Company (“Litchfield”) (State Auto Mutual, SA Florida, SA Wisconsin, Meridian Security, Meridian Citizens Mutual, Beacon National, Patrons Mutual and Litchfield are referred to as the “Mutual Pooled Companies”); |
| • | The “MIGI Insurers” refer to Meridian Security and Meridian Citizens Mutual, and the “MIGI Companies” refer to the MIGI Insurers and Meridian Insurance Group, Inc. (“MIGI”); |
| • | The “Beacon Insurance Group” or “Beacon Group” refers to Beacon National and Beacon Lloyds Insurance Company (“Beacon Lloyds”); |
| • | The “Patrons Insurance Group” or “Patrons Group” refers to Patrons Mutual and Litchfield; |
| • | The “Rockhill Insurance Group” refers to Rockhill Holding Company, its insurance subsidiaries, namely Rockhill Insurance Company, Plaza Insurance Company, American Compensation Insurance Company and Bloomington Compensation Insurance Company, its subsidiary Risk Evaluation & Design, LLC (“RED”), which acts as a managing general underwriter, and its other non-insurance subsidiaries; and |
| • | The “State Auto Group” refers to the Pooled Companies, SA National and Beacon Lloyds. |
1
Table of Contents
Item 1. Business
(a) General Development of Business
State Auto Financial is an Ohio domiciled super-regional property and casualty insurance holding company incorporated in 1990. We are primarily engaged in writing both personal and business lines of insurance. State Auto Financial owns 100% of State Auto P&C, Milbank, Farmers, SA Ohio, and SA National, each of which is a property and casualty insurance company, and Stateco, which provides investment management services to affiliated insurance companies. Our operations are headquartered in Columbus, Ohio.
Our parent company is State Auto Mutual, an Ohio domiciled super-regional mutual property and casualty insurance company organized in 1921. It owns approximately 63.5% of State Auto Financial’s outstanding common shares. State Auto Mutual also owns 100% of SA Florida and SA Wisconsin, each of which is a property and casualty insurance company, and 100% of MIGI, a holding company which owns 100% of Meridian Security, a property and casualty insurance company. MIGI is a party to an affiliation agreement with Meridian Citizens Mutual, a mutual property and casualty insurance company. In 2007, MIGI acquired 100% of the Beacon Insurance Group and State Auto Mutual affiliated with the Patrons Insurance Group. All of the companies in the Beacon Insurance Group and Patrons Insurance Group are property and casualty insurers.
The State Auto Group markets a broad line of property and casualty insurance products through independent insurance agencies primarily in the Midwestern, Southern, Southwestern, and Eastern states. Our products include standard personal and commercial automobile, nonstandard personal automobile, homeowners and farmowners, commercial multi-peril, workers’ compensation, commercial general liability and property insurance. Our Pooled Companies and SA National are rated A+ (Superior) by the A.M. Best Company.
(b) Financial Information about Segments
Our reportable segments are personal insurance, business insurance (the “insurance segments”), and investment operations. The three segments reflect the manner in which we manage our business and report our results internally to our principal operating decision makers. See detailed discussion regarding our segments at Item 7 of this Form 10-K “Management’s Discussion and Analysis of Financial Condition and Results of Operations—Overview” and Note 16 to our Consolidated Financial Statements included in Item 8 of this Form 10-K.
(c) Narrative Description of Business
Property and Casualty Insurance
Pooling Arrangement
Our Pooled Companies are parties to a quota share reinsurance agreement which we refer to as the “Pooling Arrangement.” In general, under the Pooling Arrangement, State Auto Mutual assumes premiums, losses and expenses from each of the remaining Pooled Companies and in turn cedes to each of the Pooled Companies a specified portion of premiums, losses and expenses based on each of the Pooled Companies’ respective pooling percentages. State Auto Mutual then retains the balance of the pooled business. The participation percentage for the STFC Pooled Companies has remained at 80% since 2001. See the detailed discussion of our Pooling Arrangement at Item 7 of this Form 10-K, “Management’s Discussion and Analysis of Financial Condition and Results of Operations—Pooling Arrangement.”
Management Agreement
Through various management and cost sharing agreements, State Auto P&C provides the employees to perform all organizational, operational and management functions for the State Auto Group while State Auto Mutual provides certain operating facilities, including our corporate headquarters.
2
Table of Contents
Our primary management agreement, which we refer to as the 2005 Management Agreement, has a ten year term and renews for an additional ten-year period unless terminated sooner in accordance with its terms. If the 2005 Management Agreement was terminated for any reason, we would have to relocate our facilities to continue our operations. However, we do not currently anticipate the termination of the 2005 Management Agreement. See “Properties” included in Item 2 of this Form 10-K.
Marketing
As of January 1, 2010, the State Auto Group marketed its products in 34 states and the District of Columbia through independent insurance agencies. Other than a managing general underwriting arrangement with our affiliate RED, none of the companies in the State Auto Group has any contracts with managing general agencies. See Item 7 of this Form 10-K, “Management’s Discussion and Analysis of Financial Condition and Results of Operations—Overview.”
We view our independent insurance agents as our primary customers, because they are in a position to recommend either our insurance products or those of a competitor to their customers. We strongly support the independent agency system and believe its maintenance is essential to our present and future success. As such, we continually develop programs and procedures to enhance our agency relationships, including the following: regular travel by senior management and regional office staff to meet with agents, in person, in their home states; training opportunities; and incentives related to profit and growth. In addition, we share the cost of approved advertising with selected agencies.
We actively help our agencies develop the professional sales skills of their staffs. Our training programs include both products and sales training conducted in our home office. Further, our training programs include disciplined follow-up and coaching for an extended time. Other targeted training sessions are held in our regional office locations from time to time, as well as in our agents’ offices.
We provide our agents with defined travel and cash incentives if they achieve certain sales and underwriting profit levels. Further, we recognize our very top agencies—measured by consistent profitability, achievement of written premium thresholds and growth—as Inner Circle Agencies. Inner Circle Agencies are rewarded with additional trip and financial incentives.
We have made continuing efforts to use technology to make it easier for our agents to do business with us. We offer internet-based (i) rating, (ii) policy application submission, (iii) execution of changes to policies for certain products and (iv) claims submission. In addition, we provide our agents with the opportunity to maintain policyholder records electronically, avoiding the expense of preparing and storing paper records. We believe that, since agents and their customers realize better service and efficiency through automation, they value their relationship with us. Automation can make it easier for an agent to do business with us, which attracts prospective agents and enhances existing agencies’ relationships with us.
During 2009, STFC received premiums on products marketed in Alabama, Arizona, Arkansas, Colorado, Connecticut, Delaware, District of Columbia, Florida, Georgia, Illinois, Indiana, Iowa, Kansas, Kentucky, Maryland, Massachusetts, Michigan, Minnesota, Mississippi, Missouri, North Carolina, North Dakota, Ohio, Oklahoma, Pennsylvania, Rhode Island, South Carolina, South Dakota, Tennessee, Texas, Utah, Vermont, Virginia, West Virginia and Wisconsin. During 2009, the ten states that contributed the greatest percentage of our direct premiums written were as follows: Ohio (15.8%), Kentucky (9.5%), Indiana (6.4%), Tennessee (6.3%), Texas (5.1%), Pennsylvania (4.6%), Minnesota (4.5%), Maryland (4.3%), Arkansas (4.1%) and West Virginia (3.7%).
Claims
Our claims division emphasizes timely investigation of claims, settlement of meritorious claims for equitable amounts, maintenance of adequate case reserves for claims, and control of external claims adjustment expenses. Achievement of these goals supports our marketing efforts by providing agents and policyholders with prompt and effective service.
3
Table of Contents
Claim settlement authority levels are established for each adjuster, supervisor and manager based on his or her level of expertise and experience. Our claims division is responsible for reviewing the claim, obtaining necessary documentation and establishing loss and expense reserves of certain claims. Generally, property or casualty claims estimated to reach $100,000 or above are sent to our home office to be supervised by claims division specialists. Regions with low volumes of large claims are assigned a lower dollar threshold for referring claims to the home office. In territories in which there is not sufficient volume to justify having full-time adjusters, we use independent appraisers and adjusters to evaluate and settle claims under the supervision of claims division personnel. See Item 7 of this Form 10-K, “Management’s Discussion and Analysis of Financial Condition and Results of Operations—Acquisition and Operating Expenses.”
We attempt to minimize claims adjusting costs by settling as many claims as possible through our internal claims staff and, if possible, by settling disputes regarding automobile physical damage and property insurance claims (first party claims) through arbitration. In addition, selected agents have authority to settle small first party claims, which improves claims service.
Our claim representatives use third party, proprietary bodily injury evaluation software to help them value bodily injury claims, except for the most severe injury cases. Our Claims Contact Centers allow us to improve claims efficiency and economy by concentrating the handling of smaller, less complex claims in a centralized environment. We provide claim service 24 hours a day, seven days a week, either through associates in our Claims Contact Centers, which are located in Des Moines, Iowa and Columbus, Ohio, or for a few overnight hours, through a third party service provider.
Reserves
Loss reserves are management’s best estimate at a given point in time of what we expect to pay to settle all losses incurred as of the end of the accounting period, based on facts, circumstances and historical trends then known. During the loss settlement period, additional facts regarding individual claims may become known, and consequently it often becomes necessary to revise the estimates of liability. The results of our operations and financial condition could be impacted, perhaps significantly, in the future if the ultimate payments required to settle claims vary from the liability currently recorded.
We maintain reserves for the eventual payment of losses and loss expenses for both reported claims and incurred claims that have not yet been reported. Loss expense reserves are intended to cover the ultimate costs of settling all losses, including investigation, litigation and in-house claims processing costs associated with such losses.
Reserves for reported losses are initially established on either a case-by-case or formula basis depending on the type and circumstances of the loss. The case-by-case reserve amounts are determined based on our reserving practices, which take into account the type of risk, the circumstances surrounding each claim and applicable policy provisions. The formula reserves are based on historical paid loss data for similar claims with provisions for trend changes caused by inflation. Loss and loss expense reserves for incurred claims that have not yet been reported are estimated based on many variables including historical and statistical information, changes in exposure units, inflation, legal developments, storm loss estimates and economic conditions. Case and formula basis loss reserves are reviewed on a regular basis. As new data becomes available, estimates are updated resulting in adjustments to loss reserves. Generally, reported losses initially reserved on a formula basis which have not settled after six months, are case reserved at that time. Although our management uses many resources to calculate reserves, there is no precise method for determining the ultimate liability. We do not discount loss reserves for financial statement purposes. For additional information regarding our reserves, see Item 7 of this Form 10-K, “Management’s Discussion and Analysis of Financial Condition and Results of Operations—Loss and LAE.”
4
Table of Contents
The following table presents our one-year development information on changes in the reserve for loss and loss expenses for each of the three years in the period ended December 31:
| ($ millions) | Year Ended December 31 | |||||||||
| 2009 | 2008 | 2007 | ||||||||
| Beginning of Year: |
||||||||||
| Loss and loss expenses payable |
$ | 791.2 | 658.3 | 674.5 | ||||||
| Less: Reinsurance recoverable on losses and loss expenses payable(1) |
21.2 | 11.2 | 13.5 | |||||||
| Net losses and loss expenses payable(2) |
770.0 | 647.1 | 661.0 | |||||||
| Impact of pooling change, January 1, 2008 |
— | 51.3 | — | |||||||
| Provision for losses and loss expenses occurring: |
||||||||||
| Current year |
899.5 | 874.0 | 645.5 | |||||||
| Prior years(3) |
(56.2 | ) | (27.3 | ) | (54.7 | ) | ||||
| Total |
843.3 | 846.7 | 590.8 | |||||||
| Loss and loss expense payments for claims occurring during: |
||||||||||
| Current year |
524.8 | 518.7 | 368.7 | |||||||
| Prior years |
269.1 | 256.4 | 236.0 | |||||||
| Total |
793.9 | 775.1 | 604.7 | |||||||
| End of Year: |
||||||||||
| Net losses and loss expenses payable |
819.4 | 770.0 | 647.1 | |||||||
| Add: Reinsurance recoverable on losses and loss expenses payable(4) |
20.8 | 21.2 | 11.2 | |||||||
| Losses and loss expenses payable(5) |
$ | 840.2 | 791.2 | 658.3 | ||||||
| (1) | Includes amounts due from affiliates of $0.6 million, $1.2 million, and $2.7 million at beginning of year 2009, 2008, and 2007, respectively. |
| (2) | Includes net amounts assumed from affiliates of $343.0 million, $257.2 million, and $281.7 million at beginning of year 2009, 2008, and 2007, respectively. |
| (3) | This line item shows decreases in the current calendar year in the provision for losses and loss expenses attributable to claims occurring in prior years. See discussion regarding the calendar year developments at Item 7 of this Form 10-K Management’s Discussion and Analysis section at “2009 Compared to 2008—Loss and LAE” and “2008 Compared to 2007—Loss and LAE.” |
| (4) | Includes amounts due from affiliates of $0.1 million, $0.6 million, and $1.2 million at end of year 2009, 2008, and 2007, respectively. |
| (5) | Includes net amounts assumed from affiliates of $346.2 million, $343.0 million, and $257.2 million at end of year 2009, 2008, and 2007, respectively. |
The following table sets forth our development of reserves for losses and loss expenses from 1999 through 2009. “Net liability for losses and loss expenses payable” sets forth the estimated liability for unpaid losses and loss expenses recorded at the balance sheet date, net of reinsurance recoverable, for each year shown. This liability represents the estimated amount of losses and loss expenses for claims incurred during the current year or incurred during prior years that are unpaid at the balance sheet date, including losses incurred but not reported to us.
The upper section of the table shows the cumulative amounts paid with respect to the previously reported reserve as of the end of each succeeding year. For example, through December 31, 2009, we have paid 110.8% of the losses and loss expenses that had been incurred but not paid, as estimated at December 31, 1999.
The lower portion of the table shows the current estimate of the previously reported reserve based on experience as of the end of each succeeding year. The estimate is increased or decreased as more information becomes known about the claims incurred.
The amounts on the “cumulative redundancy (deficiency)” line represent the aggregate change in the estimates over all prior years. For example, the year end 1999 reserve has developed $67.0 million or 30.2%
5
Table of Contents
deficient through December 31, 2009. This $67.0 million amount has been included in operating results over the ten years and did not have a significant effect on income in any one year.
In evaluating the information in the table, it should be noted that each amount includes the effects of all changes in amounts for prior periods. For example, the amount of the redundancy or deficiency evaluated at December 31, 2001, on claims incurred in 1999 includes the cumulative redundancy or deficiency for years 1999, 2000 and 2001. Conditions and trends that have affected the development of the liability in the past may not necessarily occur in the future. Accordingly, it may not be appropriate to extrapolate future redundancies or deficiencies based on this table.
In 1999, 2000 and 2001, the Pooling Arrangement was amended to increase our share of premiums, losses and expenses. An amount of assets equal to the increase in net liabilities was transferred to us from our parent company in 1999, 2000 and 2001 in conjunction with each year’s respective pooling change. In 2005, the MIGI Insurers were added to the pool and our share of their net liabilities and assets were transferred to us from them. In 2008, Beacon National, the Patrons Insurance Group, State Auto middle market business and voluntary assumed reinsurance from parties affiliated with State Auto Mutual were added to the pool and accordingly net assets equal to the increase in net liabilities were transferred to us from them. The amount of the assets transferred on the reserve liabilities assumed in 1999, 2000, 2001, 2005 and 2008 has been netted against and has reduced the cumulative amounts paid for years prior to 1999, 2000, 2001, 2005 and 2008, respectively.
6
Table of Contents
| ($ millions) | Years Ended December 31 | ||||||||||||||||||||||||||||||||||||||||||
| 1999 | 2000 | 2001 | 2002 | 2003 | 2004 | 2005 | 2006 | 2007 | 2008 | 2009 | |||||||||||||||||||||||||||||||||
| Net liability for losses and loss expenses payable |
$ | 221.7 | $ | 236.7 | $ | 509.9 | $ | 592.1 | $ | 628.8 | $ | 655.9 | $ | 711.3 | $ | 661.0 | $ | 647.1 | $ | 770.0 | $ | 819.4 | |||||||||||||||||||||
| Paid (cumulative) as of: |
|||||||||||||||||||||||||||||||||||||||||||
| One year later |
41.8 | % | 5.9 | % | 43.4 | % | 41.2 | % | 36.7 | % | 31.6 | % | 34.9 | % | 34.9 | % | 31.7 | % | 34.9 | % | — | ||||||||||||||||||||||
| Two years later |
43.0 | % | 52.7 | % | 65.3 | % | 60.8 | % | 53.2 | % | 48.4 | % | 51.1 | % | 50.5 | % | 49.4 | % | |||||||||||||||||||||||||
| Three years later |
71.9 | % | 79.9 | % | 78.4 | % | 71.4 | % | 63.3 | % | 59.6 | % | 60.9 | % | 60.4 | % | |||||||||||||||||||||||||||
| Four years later |
86.9 | % | 95.5 | % | 84.4 | % | 77.3 | % | 70.6 | % | 66.1 | % | 66.0 | % | |||||||||||||||||||||||||||||
| Five years later |
96.1 | % | 101.6 | % | 88.5 | % | 82.3 | % | 74.3 | % | 69.2 | % | |||||||||||||||||||||||||||||||
| Six years later |
99.0 | % | 107.0 | % | 92.3 | % | 85.1 | % | 76.0 | % | |||||||||||||||||||||||||||||||||
| Seven years later |
102.4 | % | 112.2 | % | 94.7 | % | 86.4 | % | |||||||||||||||||||||||||||||||||||
| Eight years later |
106.0 | % | 116.4 | % | 95.9 | % | |||||||||||||||||||||||||||||||||||||
| Nine years later |
109.3 | % | 117.9 | % | |||||||||||||||||||||||||||||||||||||||
| Ten years later |
110.8 | % | |||||||||||||||||||||||||||||||||||||||||
| Net liability re-estimate as of: |
|||||||||||||||||||||||||||||||||||||||||||
| One year later |
97.5 | % | 125.7 | % | 102.4 | % | 99.7 | % | 96.5 | % | 93.3 | % | 89.9 | % | 91.7 | % | 95.8 | % | 92.7 | % | — | ||||||||||||||||||||||
| Two years later |
119.1 | % | 129.1 | % | 105.1 | % | 100.6 | % | 93.2 | % | 87.6 | % | 86.4 | % | 90.5 | % | 93.7 | % | |||||||||||||||||||||||||
| Three years later |
120.3 | % | 133.1 | % | 106.9 | % | 98.8 | % | 91.0 | % | 86.9 | % | 85.6 | % | 88.8 | % | |||||||||||||||||||||||||||
| Four years later |
123.2 | % | 136.1 | % | 106.2 | % | 98.5 | % | 90.6 | % | 86.2 | % | 85.3 | % | |||||||||||||||||||||||||||||
| Five years later |
126.7 | % | 135.6 | % | 107.1 | % | 98.8 | % | 89.8 | % | 85.5 | % | |||||||||||||||||||||||||||||||
| Six years later |
127.9 | % | 138.2 | % | 107.7 | % | 98.4 | % | 89.7 | % | |||||||||||||||||||||||||||||||||
| Seven years later |
128.9 | % | 140.1 | % | 107.4 | % | 98.6 | % | |||||||||||||||||||||||||||||||||||
| Eight years later |
131.1 | % | 139.5 | % | 107.6 | % | |||||||||||||||||||||||||||||||||||||
| Nine years later |
130.6 | % | 139.6 | % | |||||||||||||||||||||||||||||||||||||||
| Ten years later |
130.2 | % | |||||||||||||||||||||||||||||||||||||||||
| Cumulative redundancy (deficiency) |
$ | (67.0 | ) | $ | (93.7 | ) | $ | (38.9 | ) | $ | 8.5 | $ | 64.5 | $ | 95.0 | $ | 104.9 | $ | 73.8 | $ | 40.7 | $ | 56.2 | — | |||||||||||||||||||
| Cumulative redundancy (deficiency) |
(30.2 | %) | (39.6 | %) | (7.6 | %) | 1.4 | % | 10.3 | % | 14.5 | % | 14.5 | % | 11.2 | % | 6.3 | % | 7.3 | % | — | ||||||||||||||||||||||
| Gross* liability—end of year |
$ | 438.8 | $ | 457.2 | $ | 743.7 | $ | 862.4 | $ | 934.0 | $ | 1,006.4 | $ | 1,111.1 | $ | 1,032.7 | $ | 1,029.9 | $ | 1,198.6 | $ | 1,293.2 | |||||||||||||||||||||
| Reinsurance recoverable |
$ | 217.1 | $ | 220.5 | $ | 233.8 | $ | 270.3 | $ | 305.2 | $ | 350.5 | $ | 399.8 | $ | 371.7 | $ | 382.8 | $ | 428.6 | $ | 473.8 | |||||||||||||||||||||
| Net liability—end of year |
$ | 221.7 | $ | 236.7 | $ | 509.9 | $ | 592.1 | $ | 628.8 | $ | 655.9 | $ | 711.3 | $ | 661.0 | $ | 647.1 | $ | 770.0 | $ | 819.4 | |||||||||||||||||||||
| Gross liability re-estimated—latest |
118.3 | % | 125.1 | % | 107.7 | % | 99.4 | % | 92.6 | % | 89.3 | % | 88.4 | % | 91.5 | % | 96.1 | % | 94.5 | % | — | ||||||||||||||||||||||
| Reinsurance recoverable re-estimated—latest |
106.2 | % | 109.5 | % | 108.8 | % | 101.3 | % | 98.6 | % | 96.2 | % | 94.0 | % | 96.2 | % | 100.1 | % | 97.7 | % | — | ||||||||||||||||||||||
| Net liability re-estimated—latest |
130.2 | % | 139.6 | % | 107.6 | % | 98.6 | % | 89.8 | % | 85.5 | % | 85.3 | % | 88.8 | % | 93.7 | % | 92.7 | % | — | ||||||||||||||||||||||
| * | Gross liability includes: Direct and assumed losses and loss expenses payable. |
As the Pooling Arrangement provides for the right of offset, we have reported losses and loss expenses payable ceded to our parent company as assets only in situations when net amounts ceded to our parent company exceed that assumed. The following table provides a reconciliation of the reinsurance recoverable to the amount reported in our consolidated financial statements at each balance sheet date:
| Reinsurance recoverable |
$ | 217.1 | $ | 220.5 | $ | 233.8 | $ | 270.3 | $ | 305.2 | $ | 350.5 | $ | 399.8 | $ | 371.7 | $ | 382.8 | $ | 428.6 | $ | 473.8 | |||||||||||
| Amount netted against assumed from State Auto Mutual |
$ | 206.3 | $ | 212.6 | $ | 219.9 | $ | 261.5 | $ | 291.0 | $ | 324.6 | $ | 382.4 | $ | 358.2 | $ | 371.6 | $ | 407.4 | $ | 453.0 | |||||||||||
| Net reinsurance recoverable |
$ | 10.8 | $ | 7.9 | $ | 13.9 | $ | 8.8 | $ | 14.2 | $ | 25.9 | $ | 17.4 | $ | 13.5 | $ | 11.2 | $ | 21.2 | $ | 20.8 | |||||||||||
Reinsurance
Members of the State Auto Group follow the customary industry practice of reinsuring a portion of their exposures and paying to the reinsurers a portion of the premiums received. Insurance is ceded principally to reduce net liability on individual risks or for individual loss occurrences, including catastrophic losses. Although reinsurance does not legally discharge the individual members of the State Auto Group from primary liability for the full amount of limits applicable under their policies, it does make the assuming reinsurer liable to the extent of the reinsurance ceded. See the detailed discussion of our reinsurance arrangements at Item 7 of this
7
Table of Contents
Form 10-K, “Management’s Discussion and Analysis of Financial Condition and Liquidity and Capital Resources—Reinsurance Arrangements.”
See “Narrative Description of Business—Regulation” of this Item 1 for a discussion of applicable terrorism acts.
Regulation
Most states, including all the domiciliary states of the State Auto Group, have enacted legislation that regulates insurance holding company systems. Each insurance company in our holding company system is required to register with the insurance supervisory agency of its state of domicile and furnish information concerning the operations of companies within our holding company system that may materially affect the operations, management or financial condition of the insurers within the system. Pursuant to these laws, the respective insurance departments may examine any members of the State Auto Group, at any time, require disclosure of material transactions involving insurer members of our holding company system, and require prior notice and an opportunity to disapprove of certain “extraordinary” transactions, including, but not limited to, extraordinary dividends to stockholders. Pursuant to these laws, all transactions within our holding company system affecting any insurance subsidiary within the State Auto Group must be fair and equitable. In addition, approval of the applicable state insurance commissioner is required prior to the consummation of transactions affecting the control of an insurer. The insurance laws of all the domiciliary states of the State Auto Group provide that no person may acquire direct or indirect control of a domestic insurer without obtaining the prior written approval of the state insurance commissioner for such acquisition.
In addition to being regulated by the insurance department of its state of domicile, each of our insurance companies is subject to supervision and regulation in the states in which we transact business. Such supervision and regulation relate to numerous aspects of an insurance company’s business operations and financial condition. The primary purpose of such supervision and regulation is to ensure financial stability of insurance companies for the protection of policyholders. The laws of the various states establish insurance departments with broad regulatory powers relative to granting and revoking licenses to transact business, regulating trade practices, licensing agents, approving policy forms, setting reserve requirements, determining the form and content of required statutory financial statements, prescribing the types and amount of investments permitted and requiring minimum levels of statutory capital and surplus. Although premium rate regulation varies among states and lines of insurance, such regulations generally require approval of the regulatory authority prior to any changes in rates. In addition, all of the states in which the State Auto Group transacts business have enacted laws which restrict these companies’ underwriting discretion. Examples of these laws include restrictions on policy terminations, restrictions on agency terminations and laws requiring companies to accept any applicant for automobile insurance. These laws may adversely affect the ability of the insurers in the State Auto Group to earn a profit on their underwriting operations.
We are required to file detailed annual reports with the supervisory agencies in each of the states in which we do business, and our business and accounts are subject to examination by such agencies at any time.
There can be no assurance that such regulatory requirements will not become more stringent in the future and have an adverse effect on the operations of the State Auto Group.
Dividends. Our insurance subsidiaries generally are restricted by the insurance laws of our respective states of domicile as to the amount of dividends we may pay without the prior approval of our respective state regulatory authorities. Generally, the maximum dividend that may be paid by an insurance subsidiary during any year without prior regulatory approval is limited to the greater of a stated percentage of that subsidiary’s statutory surplus as of a certain date, or adjusted net income of the subsidiary for the preceding year. Under current law at December 31, 2009, adjusted for dividend payments made in the previous twelve-month period, a total of $68.2 million is available in 2010 for payment as a dividend from our insurance subsidiaries to STFC without prior approval from our respective domiciliary state insurance departments. STFC received dividends of $11.5 million, $39.0 million, and $50.0 million in 2009, 2008, and 2007, respectively, from its insurance subsidiaries.
8
Table of Contents
Rates and Related Regulation. Except as discussed below, we are not aware of the adoption of any adverse legislation or regulation in any state in which we conducted business during 2009 which would materially impact our business.
Many of the states in which we operate have passed or are considering legislation restricting or banning the use of “credit scoring” in the rating and risk selection process. The Fair and Accurate Credit Transactions Act, passed by the U.S. Congress in 2003, directed the Federal Trade Commission (“FTC”) to consult with the Office of Fair Housing and Equal Opportunity on, among other things, how the use of credit information may affect the availability and affordability of property/casualty insurance, and whether the use of certain factors by credit scoring systems could have a disparate impact on minorities. In July of 2007, the FTC released a report on credit scoring and its impact on automobile insurance. The FTC concluded that credit-based scoring is an effective predictor of risk with respect to the issuance of automobile insurance policies to consumers, but has little effect as an indicator of racial or ethnic status of consumers. Despite the FTC’s conclusions, some consumer groups and certain regulatory and legislative entities continue to resist the use of credit scoring in the rating and risk selection process. In 2008, the FTC asked nine of the nation’s largest homeowners insurance companies to provide information that the FTC says will allow it to determine how consumer credit data is used by the companies in underwriting and rate setting in this line of business. We understand that the results of this data intensive study are tentatively expected in late 2010, though no specific release date has been published by the FTC. Upon release, the results of the study could affect the future use of credit scoring. Banning or restricting this practice or data mining would limit our ability, and the ability of other carriers, to take advantage of the predictive value of this information.
In an attempt to make capital and surplus requirements more accurately reflect the underwriting risk of different lines of insurance, as well as investment risks that attend insurers’ operations, the National Association of Insurance Commissioners (“NAIC”) annually tests insurers’ risk-based capital requirements. As of December 31, 2009, each insurer affiliated with us had adequate levels of capital as defined by the NAIC with its respective risk-based capital requirements.
The property and casualty insurance industry is also affected by court decisions. In general, premium rates are actuarially determined to enable an insurance company to generate an underwriting profit. These rates contemplate a certain level of risk. The courts may modify, in a number of ways, the level of risk which insurers had expected to assume, including eliminating exclusions, expanding the terms of the contract, multiplying limits of coverage, creating rights for policyholders not intended to be included in the contract and interpreting applicable statutes expansively to create obligations on insurers not originally considered when the statute was passed. Courts have also undone legal reforms passed by legislatures, which reforms were intended to reduce a litigant’s rights of action or amounts recoverable and so reduce the costs borne by the insurance mechanism. These court decisions can adversely affect an insurer’s profitability. They also create pressure on rates charged for coverages adversely affected, and this can cause a legislative response resulting in rate suppression that can unfavorably impact an insurer.
The Terrorism Risk Insurance Act of 2002 and its successor, the Terrorism Risk Insurance Extension Act of 2005 (collectively, the “Terrorism Acts”) require the federal government and the insurance industry to share in insured losses up to $100 billion per year resulting from future terrorist attacks within the United States. Under the Terrorism Acts, commercial property and casualty insurers must offer their commercial policyholders coverage against certified acts of terrorism, but the policyholders may choose to reject this coverage. If the policyholder rejects coverage for certified acts of terrorism, we intend, subject to the approval of the state regulators, to cover only such acts of terrorism that are not certified acts under the Terrorism Acts and that do not arise out of nuclear, biological or chemical agents. In December 2007, the United States Congress extended the Terrorism Acts through December 31, 2014. At the same time, Congress made modest changes to the Terrorism Acts—for example, deleting the distinction between certified and non-certified (essentially foreign and domestic) acts of terrorism. Lines of business covered, as well as certain important coverage features (such as loss triggers, company deductibles and industry retentions) were not changed. Our current property reinsurance treaties exclude certified acts of terrorism.
9
Table of Contents
Investments
Our investment portfolio is managed to provide growth of statutory surplus to facilitate increased premium writings over the long term while maintaining the ability to fund current insurance operations. The primary objectives are to generate income, preserve capital and maintain liquidity. Our investment portfolio is managed separately from that of our parent company and its subsidiaries, and investment results are not shared by our Pooled Companies through the Pooling Arrangement. Stateco performs investment management services for us and our parent company and its subsidiaries, although investment policies implemented by Stateco continue to be set for each company through the Investment Committee of its respective Board of Directors.
For additional discussion regarding our investments, including the market risks related to our investment portfolio, see Item 7 of this Form 10-K, “Management’s Discussion and Analysis of Financial Condition and Results of Operations—Investment Operations Segment.”
Competition
The property and casualty insurance industry is highly competitive. We compete with numerous insurance companies, many of which are substantially larger and have considerably greater financial resources. In addition, because our products are marketed exclusively through independent insurance agencies, most of which represent more than one company, we face competition within each agency. See “Narrative Description of Business—Marketing” in Item 1 and “Distribution System” and “Competition” in Item 1A of this Form 10-K. We compete through underwriting criteria, appropriate pricing, quality service to our policyholders and our agents, and a fully developed agency relations program.
Employees
As of February 26, 2010, we had 2,226 employees. Our employees are not covered by any collective bargaining agreement. We consider the relationship with our employees to be very good.
Available Information
Our website address is www.StateAuto.com. Through this website (found by clicking the “Investors” link, then the “All SEC Filings” link), we make available, free of charge, our Annual Report on Form 10-K, Quarterly Reports on Form 10-Q, Current Reports on Form 8-K, proxy and information statements and all amendments to those reports filed or furnished pursuant to Section 13(a) or 15(d) of the Securities Exchange Act of 1934 (the “Exchange Act”), as soon as reasonably practicable after we electronically file such material with the Securities and Exchange Commission (the “SEC”). Also available on our website is information pertaining to our corporate governance, including the charters of each of our standing committees of our Board of Directors, our corporate governance guidelines, our employees’ code of business conduct and our directors’ ethical principles.
Any of the materials we file with the SEC may also be read and copied at the SEC’s Public Reference Room at 100 F Street, NE, Washington, DC 20549. Information on the operation of the SEC’s Public Reference Room may be obtained by calling the SEC at 1-800-SEC-0330. The SEC maintains a website that contains reports, proxy and information statements, and other information regarding issuers that file electronically with the SEC at www.sec.gov.
10
Table of Contents
Executive Officers of the Registrant
| Name of Executive Officer and Position(s) with Company |
Age(1) | Principal Occupation(s) During the Past Five Years |
An Executive Officer of the Company Since(2) | |||
| Robert P. Restrepo, Jr., Chairman, President and Chief Executive Officer |
59 | Chairman of the Board and Chief Executive Officer of STFC and State Auto Mutual, 2/06 to present; President of STFC and State Auto Mutual, 3/06 to present; Senior Vice President, Insurance Operations, of Main Street America Group, a property and casualty insurance company, 4/05 – 2/06; President and Chief Executive Officer for two property and casualty insurance subsidiaries of Allmerica Financial Corporation (now known as Hanover Insurance Group), 1998 – 2003. |
2006 | |||
| Mark A. Blackburn, Executive Vice President and Chief Operating Officer |
58 | Executive Vice President and Chief Operating Officer of STFC and State Auto Mutual, 11/06 to present; Senior Vice President of STFC and State Auto Mutual, 03/01 to 11/06. |
1999 | |||
| Steven E. English, Vice President and Chief Financial Officer |
49 | Vice President of STFC and State Auto Mutual, 05/06 to present; Chief Financial Officer of STFC and State Auto Mutual, 12/06 to present; Assistant Vice President of State Auto Mutual, 06/01 to 05/06. |
2006 | |||
| James E. Duemey, Vice President and Investment Officer |
63 | Vice President and Investment Officer of State Auto Mutual, 5/91 to present. |
1991 | |||
| Clyde H. Fitch, Jr., Senior Vice President and Chief Sales Officer |
59 | Senior Vice President and Chief Sales Officer of STFC and State Auto Mutual, 11/07 to present. Senior Vice President of Travelers Companies, Inc. for more than five years prior to 11/07. |
2007 | |||
| Cynthia A. Powell, Vice President and Treasurer |
49 | Treasurer of STFC and State Auto Mutual, 06/06 to present; Vice President of State Auto Mutual, 3/00 to present; Vice President of STFC, 5/00 to present. |
2000 | |||
| Lorraine M. Siegworth, Vice President |
42 | Vice President of STFC and State Auto Mutual, 11/06 to present; Vice President of Nationwide Insurance or its affiliates, 09/00 to 03/06, most recently serving as Vice President of Corporate HR of Nationwide Insurance. |
2006 | |||
| James A. Yano, Vice President, Secretary and General Counsel |
58 | Vice President, Secretary and General Counsel of STFC and State Auto Mutual, 4/07 to present; Senior Vice President, Secretary and General Counsel of Abercrombie & Fitch Co. 5/05 to 3/07; Partner, law firm of Vorys, Sater, Seymour and Pease LLP for more than five years prior. |
2007 | |||
| (1) | Age is as of March 5, 2010. |
| (2) | Each of the foregoing officers has been designated by our Board of Directors as an executive officer for purposes of Section 16 of the Exchange Act. |
11
Table of Contents
Statements contained in this Form 10-K may be “forward-looking” within the meaning of the Section 21E of the Exchange Act. Such forward-looking statements are subject to certain risks and uncertainties that could cause our operating results to differ materially from those projected. The following factors, among others, in some cases have affected, and in the future could affect, our actual financial performance.
RESERVES
If our estimated liability for losses and loss expenses is incorrect, our reserves may be inadequate to cover our ultimate liability for losses and loss expenses and may have to be increased.
We establish and carry, as a liability, reserves based on actuarial estimates of the amount to be paid in the future to settle all claims incurred as of the end of the accounting period. We maintain loss reserves to cover our estimated ultimate unpaid liability for losses and loss expenses with respect to reported and unreported claims incurred as of the end of each accounting period. Reserves do not represent an exact calculation of liability, but instead represent estimates, generally using actuarial projection techniques at a given accounting date. These reserve estimates are expectations of what the ultimate settlement and administration of claims will cost based on our assessment of facts and circumstances then known, historical settlement patterns, estimates of trends in claims severity and frequency, legal theories of liability and other factors. Variables in the reserve estimation process can be affected by both internal and external events, such as changes in claims handling procedures, trends in loss costs, economic inflation, legal developments and legislative changes. Many of these items are not directly quantifiable, particularly on a prospective basis. Additionally, there may be a significant reporting lag between the occurrence of an insured event and the time a claim is actually reported to the insurer. We refine reserve estimates in a regular ongoing process as historical loss experience develops and additional claims are reported and settled. We record adjustments to reserves in the results of operations for the periods in which the estimates are changed. In establishing reserves, we take into account estimated recoveries for reinsurance and salvage and subrogation.
Because estimating reserves is an inherently uncertain process, currently established reserves may not be adequate. If we conclude the estimates are incorrect and our reserves are inadequate, we are obligated to increase our reserves. An increase in reserves results in an increase in losses, reducing our net income for the period in which the deficiency in reserves is identified. Accordingly, an increase in reserves could have a material adverse effect on our results of operations, liquidity and financial condition.
CATASTROPHE LOSSES AND GEOGRAPHIC CONCENTRATIONS
The occurrence of catastrophic events could cause volatility in our results of operations and could materially reduce our level of profitability.
Our insurance operations expose us to claims arising out of catastrophic events. We have experienced, and will in the future experience, catastrophe losses that may cause substantial volatility in our financial results for any fiscal quarter or year and could materially reduce our level of profitability or harm our financial condition, which in turn could adversely affect our ability to write new business. Catastrophes can be caused by various natural events, including hurricanes, hailstorms, tornadoes, windstorms, earthquakes, severe winter weather and fires, none of which are within our control. Catastrophe losses can vary widely and could significantly impact our results. The frequency and severity of catastrophes are inherently unpredictable. Additionally, catastrophe losses incurred by residual markets or pooling mechanisms (such as wind pools) in certain states could trigger assessments to the Company. Such assessments could be material and may not be recoupable, depending on the applicable state mechanism.
The magnitude of loss from a catastrophe is a function of the severity of the event and the total amount of insured exposure in the affected area. Accordingly, we can sustain significant losses from less severe
12
Table of Contents
catastrophes, such as localized windstorms, when they affect areas where our insured exposure is concentrated. Although catastrophes can cause losses in a variety of our property and casualty lines, most of our catastrophe claims in the past have related to homeowners, allied lines and commercial multi-peril coverages. The geographic distribution of our business subjects us to catastrophe exposure from tornadoes, hailstorms and earthquakes in the Midwest as well as catastrophe exposure from hurricanes affecting the Gulf Coast and Atlantic coast areas. In the last three years, the largest catastrophe or series of catastrophes affecting STFC’s results of operations in any one year were as follows: 2009 with losses from two winter storms in the South and Midwest resulting in approximately $41.1 million in pre-tax losses; 2008 with losses from Hurricane Ike as it travelled through the Midwest resulting in approximately $44.1 million in pre-tax losses; and 2007 with losses from a hail storm in early June causing $10.8 million in pre-tax losses.
We believe that increases in the value and geographic concentration of insured properties and the effects of inflation could increase the severity of claims from catastrophic events in the future. In addition, states have from time to time passed legislation that limits the ability of insurers to manage catastrophe risk, such as legislation prohibiting insurers from withdrawing from catastrophe-prone areas. Although we attempt to reduce the impact of catastrophes on our business by controlling concentrations of exposures in catastrophe prone areas and through the purchase of reinsurance covering various categories of catastrophes, reinsurance may prove inadequate if a major catastrophic loss exceeds the reinsurance limit, or an insurance subsidiary incurs a number of smaller catastrophes that, individually, fall below the reinsurance retention level.
Along with others in the industry, we utilize catastrophe models developed by third party vendors to help assess and manage our exposure to catastrophe losses. Such models assume various conditions and probability scenarios and use historical information about catastrophic events, along with detailed information about our business. There are limitations to the usefulness of such models and they do not necessarily accurately predict future losses. Climate change, to the extent it affects changes in weather patterns, could impact the frequency or severity of weather events. Our ongoing catastrophe management efforts could negatively impact growth to the extent constraints on property exposures are deemed necessary in certain territories.
UNDERWRITING AND PRICING
Our financial results depend primarily on our ability to underwrite risks effectively and to charge adequate rates to policyholders.
Our financial condition, cash flows and results of operations depend on our ability to underwrite and set rates accurately for a full spectrum of risks, across a number of lines of insurance. Rate adequacy is necessary to generate sufficient premium to pay losses, loss adjustment expenses and underwriting expenses and to earn a profit.
Our ability to underwrite and set rates effectively is subject to a number of risks and uncertainties, including, without limitation:
| • | the availability of sufficient, reliable data; |
| • | our ability to conduct a complete and accurate analysis of available data; |
| • | our ability to timely recognize changes in trends and to project both the severity and frequency of losses with reasonable accuracy; |
| • | uncertainties which are generally inherent in estimates and assumptions; |
| • | our ability to project changes in certain operating expense levels with reasonable certainty; |
| • | the development, selection and application of appropriate rating formulae or other pricing methodologies; |
| • | our use of modeling tools to assist with correctly and consistently achieving the intended results in underwriting and pricing; |
13
Table of Contents
| • | our ability to establish and consistently follow appropriate underwriting guidelines; |
| • | our ability to innovate with new pricing strategies, and the success of those innovations on implementation; |
| • | our ability to secure regulatory approval of premium rates on an adequate and timely basis; |
| • | our ability to predict policyholder retention accurately; |
| • | unanticipated court decisions, legislation or regulatory action; |
| • | unanticipated changes or execution problems in our claim settlement practices; |
| • | changing driving patterns for auto exposures; changing weather patterns (including those which may be related to climate change) for property exposures; |
| • | changes in the medical sector of the economy; |
| • | unanticipated changes in auto repair costs, auto parts prices and used car prices; |
| • | impact of inflation and other factors on cost of construction materials, labor and other expenditures; |
| • | our ability to monitor property concentration in catastrophe prone areas, such as hurricane, earthquake and wind/hail regions; and |
| • | the general state of the economy in the states in which we operate. |
Such risks may result in our rates being based on inadequate or inaccurate data or inappropriate assumptions or methodologies, and may cause our estimates of future changes in the frequency or severity of claims to be incorrect. As a result, we could under price risks, which would negatively affect our margins, or we could overprice risks, which could reduce our volume and competitiveness. In either event, our operating results, financial condition and cash flows could be materially adversely affected.
REINSURANCE
Reinsurance may not be available or adequate to protect us against losses.
We use reinsurance to help manage our exposure to insurance risks. The availability and cost of reinsurance are subject to prevailing market conditions, which can affect our business volume and profitability. Although the reinsurer is liable to us to the extent of the ceded reinsurance, we remain liable as the direct insurer on all risks reinsured. Ceded reinsurance arrangements do not eliminate our obligation to pay claims. As a result, we are subject to counterparty risk with respect to our ability to recover amounts due from reinsurers. Reinsurance may not be adequate to protect us against losses and may not be available to us in the future at commercially reasonable rates. In addition, the magnitude of losses in the reinsurance industry resulting from catastrophes may adversely affect the financial strength of certain reinsurers, which may result in our inability to collect or recover reinsurance. Reinsurers also may reserve their right to dispute coverage with respect to specific claims. With respect to catastrophic or other loss, if we experience difficulty collecting from reinsurers or obtaining additional reinsurance in the future, we will bear a greater portion of the total financial responsibility for such loss, which could materially reduce our profitability or harm our financial condition.
CYCLICAL NATURE OF THE INDUSTRY
The property and casualty insurance industry is highly cyclical, which may cause fluctuations in our operating results.
The property and casualty insurance industry, particularly business insurance, has been historically characterized by periods of intense price competition due to excess underwriting capacity, as well as periods of shortages of underwriting capacity that result in higher prices and more restrictive contract and/or coverage
14
Table of Contents
terms. The periods of intense price competition may adversely affect our operating results, and the overall cyclicality of the industry may cause fluctuations in our operating results. While we may adjust prices during periods of intense competition, it remains our strategy to allow for acceptable profit levels and to decline coverage in situations where pricing or risk would not result in acceptable returns. Accordingly, our commercial lines business tends to contract during periods of severe competition and price declines and expand when market pricing allows an acceptable return.
The personal lines businesses are characterized by an auto underwriting cycle of loss cost trends. Driving patterns, inflation in the cost of auto repairs and medical care and increasing litigation of liability claims are some of the more important factors that affect loss cost trends. Inflation in the cost of building materials and labor costs and demand caused by weather-related catastrophic events affect personal lines homeowners loss cost trends. Our Company and other personal lines insurers may be unable to increase premiums at the same pace as coverage costs increase. Accordingly, profit margins generally decline in periods of increasing loss costs.
ECONOMIC CONDITIONS
The current and future difficult economic conditions can adversely affect our business, results of operations and financial condition.
Current economic conditions and any further economic declines in future reporting periods could adversely impact our business and results of operations. While the volatility of the current economic climate makes it difficult for us to predict the complete impact of economic slowdowns on our business and results of operations, our business may be impacted in a variety of ways.
The economy has caused a number of consumers and businesses to decrease their spending, which may impact the demand for our insurance products. For example, declining automotive sales and weaknesses in the housing market generally impact the purchase of our personal auto and homeowners insurance products by consumers and business insurance products by businesses involved in these industries. As unemployment rates rise, there may be a tendency for the number of workers’ compensation claims to increase, as laid-off and unemployed workers may seek workers’ compensation benefits to replace their lost health care benefits. Similarly, uninsured and underinsured motorist claims may rise. Vacated homes and business properties pose increased insurance industry risk.
Volatility and weakness in the financial and capital markets may negatively impact the value of our investment portfolio.
We may be adversely affected by business difficulties, bankruptcies and impairments of other parties with whom we do business, such as independent agents, key vendors and suppliers, reinsurers or banks, which increases our credit risk and other counterparty risks. Bankruptcies among our current business insurance customers can negatively affect our retention. Reductions in new business start-ups may negatively affect the number of future potential business insurance customers.
In addition, departments of insurance, taxing authorities and other state and local agencies may seek to impose or increase taxes, assessments and other revenue-generating fees in response to funding reductions caused by economic downturns. These actions may increase the cost of doing business in these states. Economic strains on states and municipalities could result in downgrades or defaults of certain municipal obligations.
In response to economic conditions, the United States federal government and other governmental and regulatory bodies have taken action and are considering taking additional actions to address such conditions. There can be no assurance as to what impact such actions or future actions will have on the financial markets, economic conditions or our Company.
15
Table of Contents
In addition, the current stimulus spending and monetary policies or other factors may cause the rate of inflation to increase in the future. Inflation can have a significant negative impact on property and casualty insurers because premium rates are established before the amount of losses and loss expenses are known. When establishing rates, we attempt to anticipate increases from inflation subject to the limitations of modeling economic variables. Premium rates may prove to be inadequate due to low trend assumptions arising from the use of historical data. Even when general inflation is relatively modest, price inflation on the goods and services purchased by insurance companies in settling claims can steadily increase. Reserves may develop adversely and become inadequate. Retentions and deductibles may be exhausted more quickly. Interest rate increases in an inflationary environment could cause the values of our fixed income investments to decline.
Adverse capital and credit market conditions may negatively affect our ability to meet unexpected liquidity needs or to obtain credit on acceptable terms.
The capital and credit markets have been experiencing significant volatility and disruption. In some cases, the markets have negatively affected the availability of liquidity and credit capacity. In the event that we need access to additional capital to pay our operating expenses, make payments on our indebtedness, pay for capital expenditures or fund acquisitions, our ability to obtain such capital may be constrained and the cost of any such capital may be significant. Our ability to obtain additional financing will depend on numerous factors, such as market conditions, the general availability of credit, the overall availability of credit to our industry, our credit ratings and credit capacity, as well as lenders’ perception of our long- or short-term financial prospects. Our access to funds may also be constrained if regulatory authorities or rating agencies take negative actions. If certain factors were to occur, our internal sources of liquidity may prove to be insufficient and we may not be able to successfully obtain additional financing on satisfactory terms.
DIVIDENDS
Although we have a history of paying cash dividends, there can be no assurance that we will continue or be able to pay cash dividends in the future.
We have a history of consistently paying cash dividends to our shareholders. However, the future payment of cash dividends will depend upon a variety of factors, such as our results of operations, financial condition and cash requirements, as well as the ability of our insurance subsidiaries to make distributions to STFC. State insurance laws restrict the payment of dividends by insurance companies to their shareholders. In addition, competitive pressures generally require insurance companies to maintain insurance financial strength ratings. Such restrictions and other requirements and factors affect the ability of our insurance subsidiaries to make dividend payments to STFC. Limits on the ability of our insurance subsidiaries to pay dividends could adversely affect our liquidity, including our ability to pay cash dividends to shareholders.
DISTRIBUTION SYSTEM
The independent agency system is the primary distribution system for our products. Use of this distribution system may constrain our ability to grow at a comparable pace to our competitors that utilize multiple distribution channels. In addition, consumers may prefer to purchase insurance products through alternative channels, such as through the internet, rather than through agents.
We market our insurance products through independent, non-exclusive insurance agents, whereas some of our competitors sell their insurance products through direct marketing techniques, the internet or “captive” insurance agents who sell products exclusively for one insurance company. The State Auto Group has supported the independent agency system as our sole distribution channel for the past 88 years. However, we recognize that although the number of distribution locations has expanded, the number of independent agencies in the industry has dramatically shrunk over the past decade due to agency purchases, consolidations, bankruptcies and agent retirements. We also recognize that it will be progressively more difficult to expand the number of independent
16
Table of Contents
agencies representing us. If we are unsuccessful in maintaining and increasing the number of agencies in our independent agency distribution system, our sales and results of operations could be adversely affected.
The agents that market and sell our products also sell products of our competitors. These agents may recommend our competitors’ products over our products or may stop selling our products altogether. Our strategy of not pursuing market share at prices that are not expected to produce an underwriting profit can have the effect of making top line growth more difficult. When price competition is intense, this effect is exaggerated by the fact our independent agent distribution force has products to sell from other carriers that may be more willing to lower prices to grow top line sales. Consequently, we must remain focused on attracting and retaining productive agents to market and sell our products. We compete for productive agents primarily on the basis of our financial position, support services, ease of doing business, compensation and product features. Although we make efforts to ensure we have strong relationships with our independent agents and to persuade them to promote and sell our products, we may not be successful in executing these efforts. If we are unsuccessful in attracting and retaining these agents, our sales and results of operations could be adversely affected.
In addition, consumers are increasingly using the internet and other alternative channels to purchase insurance products. While our website provides a significant amount of information about our insurance products, consumers cannot purchase insurance through our website. Instead, consumers must contact one of our independent agents in order to purchase any of our insurance products or make changes to their existing policies. This sole distribution system may place us at a disadvantage with consumers who prefer to purchase insurance products online or through other alternative distribution channels.
REGULATION
Our business is heavily regulated, and changes in regulation may reduce our profitability and limit our growth.
We are subject to extensive regulation in the states in which we conduct business. This regulation is generally designed to protect the interests of policyholders, as opposed to stockholders and other investors, and relates to authorization for lines of business, capital and surplus requirements, investment limitations, underwriting limitations, transactions with affiliates, dividend limitations (see “Narrative Description of Business-Regulation-Dividends” in Item 1) changes in control, premium rates and a variety of other financial and non-financial components of an insurance company’s business. The NAIC and state insurance regulators are constantly reexamining existing laws and regulations, generally focusing on modifications to holding company regulations, interpretations of existing laws and the development of new laws.
From time to time, some states in which we conduct business have considered or enacted laws that may alter or increase state authority to regulate insurance companies and insurance holding companies. In other situations, states in which we conduct business have considered or enacted laws that impact the competitive environment and marketplace for property and casualty insurance.
Nearly all states require licensed insurers to participate in guaranty funds through assessments covering a portion of insurance claims against impaired or insolvent insurers. An increase in the magnitude of impaired companies could result in an increase in our share of such assessments. Residual market or pooling arrangements exist in many states to provide certain types of insurance coverage to those that are otherwise unable to find private insurers willing to insure them. Licensed insurers voluntarily writing such coverage are required to participate in these residual markets or pooling mechanisms. Such participation exposes the Company to possible assessments, some of which could be material to our results of operations. The potential availability of recoupments or premium rate increases, if applicable, may not offset such assessments in the financial statements nor do so in the same fiscal periods.
Many of the states in which we operate have passed or are considering legislation restricting or banning the use of credit scoring in rating and/or risk selection in personal lines of business. Similarly, several states are
17
Table of Contents
considering restricting insurers’ rights to use loss history information maintained in various databases by insurance support organizations. These tools help us price our products more fairly and enhance our ability to compete for business that we believe will be profitable. Such regulations would limit our ability, as well as the ability of all other insurance carriers operating in any affected jurisdiction, to take advantage of these tools.
Currently the federal government does not directly regulate the insurance business. However, in recent years the state insurance regulatory framework has come under increased federal scrutiny. Congress and some federal agencies from time to time investigate the current condition of insurance regulation in the United States to determine whether to impose federal regulation or to allow an optional federal charter, similar to banks. In addition, changes in federal legislation and administrative policies in several areas, including changes in the Gramm-Leach-Bliley Act, financial services regulation and federal taxation, or repeal of McCarran-Ferguson Act (which largely exempts the insurance industry from the federal antitrust laws), could significantly impact the insurance industry and us.
We cannot predict with certainty the effect any enacted, proposed or future state or federal legislation or NAIC initiatives may have on the conduct of our business. Furthermore, there can be no assurance that the regulatory requirements applicable to our business will not become more stringent in the future or result in materially higher costs than current requirements. For example, concerns over climate change may prompt federal, state or local laws intended to protect the environment. Changes in the regulation of our business may reduce our profitability, limit our growth or otherwise adversely affect our operations.
We could be adversely affected if our controls designed to assure compliance with guidelines, policies, and legal and regulatory standards are ineffective. Our business is dependent on our ability to regularly engage in a large number of insurance underwriting, claim processing, personnel and human resources, and investment activities, many of which are complex. These activities often are subject to internal guidelines and policies, as well as legal and regulatory requirements. No matter how well designed and executed, control systems provide only reasonable assurance that the system objectives will be met. If our controls are not effective, it could lead to financial loss, unexpected risk exposures or damage to our reputation.
Tax legislation initiatives or challenges to our tax positions could adversely affect our results of operations and financial condition.
We are subject to the tax laws and regulations of the U.S. federal, state and local governments. From time to time, various legislative initiatives may be proposed that could adversely affect our tax positions. There can be no assurance that our effective tax rate or tax payments will not be adversely affected by these initiatives. In addition, U.S. federal, state and local tax laws and regulations are extremely complex and subject to varying interpretations. There can be no assurance that our tax positions will not be challenged by relevant tax authorities or that we would be successful in any such challenge.
REALIZATION OF DEFERRED INCOME TAX ASSETS
If some or all of our deferred tax assets will not be realized, we will be required to establish a valuation allowance against the deferred income tax asset, which could have a material adverse effect on our results of operations and financial condition.
Deferred tax assets and liabilities represent the tax effect of the differences between the financial statement carrying value of existing assets and liabilities and their respective tax basis. At December 31, 2009, we have net deferred federal income tax assets of $75.9 million, consisting of deferred tax assets of $150.7 million and deferred tax liabilities of $74.7 million. Deferred tax assets are reduced by a valuation allowance if, based on the weight of available evidence, it is more likely than not that some or all of the deferred tax assets will not be realized. At December 31, 2009, we held no valuation allowance on our net deferred tax assets.
18
Table of Contents
The determination of the valuation allowance for deferred tax assets requires us to make certain judgments and assumptions. In evaluating the ability to recover deferred tax assets, we consider all available evidence in determining the realizability of the net deferred tax assets including loss carryback potential, past operating results, existence of cumulative losses in the most recent years, projected performance of the business, future taxable income, including the ability to generate capital gains, and prudent and feasible tax planning strategies. In the event we determine that we most likely would not be able to realize all or part of our deferred tax assets in the future, we would be required to establish a valuation allowance with a charge to earnings and/or other comprehensive income in the period such determination is made. Our judgment and assumptions are subject to change given the inherent uncertainty in predicting future performance or realizing tax planning strategies, which is impacted by such things as severity and frequency of catastrophe losses, current premium rate environment, investment market conditions, and planned loss and expense control initiatives that might not be realized.
CLAIM AND COVERAGE DEVELOPMENTS
Developing claim and coverage issues in our industry are uncertain and may adversely affect our insurance operations.
As industry practices and legislative, judicial and regulatory conditions change, unexpected and unintended issues related to claims and coverage may develop. These issues could have an adverse effect on our business by either extending coverage beyond our underwriting intent or by increasing the frequency or severity of claims. The premiums we charge for our insurance products are based upon certain risk expectations. When legislative, judicial or regulatory authorities expand the burden of risk beyond our expectations, the premiums we previously charged or collected may no longer be sufficient to cover the risk, and we do not have the ability to retroactively modify premium amounts. Furthermore, our reserve estimates do not take into consideration a major retroactive expansion of coverage through legislative or regulatory actions or judicial interpretations.
In particular, court decisions have had, and are expected to continue to have, significant impact on the property and casualty insurance industry. Court decisions may increase the level of risk which insurers are expected to assume in a number of ways, such as by eliminating exclusions, increasing limits of coverage, creating rights in claimants not intended by the insurer and interpreting applicable statutes expansively to create obligations on insurers not originally considered when the statute was passed. In some cases, court decisions have been applied retroactively. Court decisions have also negated legal reforms passed by state legislatures.
There is also a growing trend of plaintiffs targeting property and casualty insurers, including us, in purported class action litigation relating to claim-handling and other practices, particularly with respect to the handling of personal lines auto and homeowners claims.
There are concerns that the focus on climate change and global warming could effect court decisions or result in litigation, including potential matters arising from federal, state or local laws intended to protect the environment.
Many of these issues are beyond our control. The effects of these and other unforeseen claims and coverage issues are extremely hard to predict and could materially harm our business and results of operations.
TERRORISM
Terrorist attacks, and the threat of terrorist attacks, and ensuing events could have an adverse effect on us.
Terrorism, both within the United States and abroad, and military and other actions and heightened security measures in response to these types of threats, may cause loss of life, property damage, reduced economic activity, and additional disruptions to commerce. Actual terrorist attacks could cause losses from insurance
19
Table of Contents
claims related to the property and casualty insurance operations of the State Auto Group, as well as a decrease in our stockholders’ equity, net income and/or revenue. The Terrorism Acts require the federal government and the insurance industry to share in insured losses up to $100 billion per year resulting from certain future terrorist attacks within the United States. Under the Terrorism Acts, we must offer our commercial policyholders coverage against certified acts of terrorism. In December 2007, the United States Congress extended the Terrorism Acts through December 31, 2014, and made some modest changes to the Terrorism Acts. We are evaluating these changes to the Terrorism Act and are taking actions to comply. See “Narrative Description of Business-Regulation” of this Item 1 for a discussion of the Terrorism Acts.
In addition, some of the assets in our investment portfolio may be adversely affected by declines in the equity markets and economic activity caused by the continued threat of terrorism, ongoing military and other actions and heightened security measures. We cannot predict at this time whether and the extent to which industry sectors in which we maintain investments may suffer losses as a result of potentially decreased commercial and economic activity, or how any such decrease might impact the ability of companies within the affected industry sectors to pay interest or principal on their securities, or how the value of any underlying collateral might be affected.
TECHNOLOGY AND AUTOMATION
Our business success and profitability depend, in part, on effective information technology systems and facilities. If we are unable to keep pace with the rapidly developing technological advancements in the insurance industry, our ability to compete effectively could be impaired.
We depend in large part on our technology systems and facilities for conducting business and processing claims. Our business success is dependent on maintaining the effectiveness of existing technology systems and facilities and on continuing to develop and enhance technology systems and facilities that support our business processes and strategic initiatives in a cost effective manner. An ongoing challenge during system development and enhancement is the effective and efficient utilization of today’s technology in face of a constantly changing technological landscape. There can be no assurance that the development of today’s technology for tomorrow’s use will not result in our being competitively disadvantaged, especially among those carriers that have greater resources than we. If we are unable to keep pace with the advancements being made in technology, our ability to compete with other insurance companies who have advanced technological capabilities will be negatively affected. Further, if we are unable to effectively execute and update or replace our key legacy systems and facilities as they become obsolete or as emerging technology renders them competitively inefficient, our competitive position and/or cost structure could be adversely affected.
INVESTMENTS
The performance of our investment portfolios is subject to investment risks.
Like other property and casualty insurance companies, we depend on income from our investment portfolio for a portion of our revenues and earnings and are therefore subject to market risk and the risk that we will incur losses due to adverse changes in equity, interest, commodity or foreign currency exchange rates and prices. Our primary market risk exposures are to changes in interest rates and equity prices. Future increases in interest rates could cause the values of our fixed income portfolios to decline, with the magnitude of the decline depending on the duration of our portfolio. Individual securities in our fixed-income portfolio are subject to credit risk and default. Downgrades in the credit ratings of fixed maturities can have a significant negative effect on the market valuation of such securities.
If the fixed-income or equity portfolios, or both, were to be impaired by market, sector or issuer-specific conditions to a substantial degree, our liquidity, financial position and financial results could be materially adversely affected. Under these circumstances, our income from these investments could be materially reduced,
20
Table of Contents
and declines in the value of certain securities could further reduce our reported earnings and capital levels. A decrease in value of our investment portfolio could also put our insurance subsidiaries at risk of failing to satisfy regulatory minimum capital requirements. If we were not at that time able to supplement our subsidiaries’ capital from STFC or by issuing debt or equity securities on acceptable terms, our business could be materially adversely affected. Also, a decline in market rates of fixed income securities or a decline in the fair value of equity securities could cause the investments in our pension plans to decrease below the accumulated benefit obligation, resulting in additional expense and increasing required contributions to the pension plan.
In addition, our investments are subject to risks inherent in the nation’s and world’s capital markets. The functioning of those markets, the values of the investments held by us and our ability to liquidate investments on favorable terms or short notice may be adversely affected if those markets are disrupted or otherwise affected by local, national or international events, such as power outages, system failures, wars or terrorist attacks or by recessions or depressions, a significant change in inflation expectations, a significant devaluation of governmental or private sector credit, currencies or financial markets and other factors or events.
Changes in tax laws impacting marginal tax rates and/or the preferred tax treatment of municipal obligations under current law, could adversely affect the market value of municipal obligations. Since a majority of our investment portfolio is invested in tax-exempt municipal obligations, any such changes in tax law could adversely affect the value of the investment portfolio. Additionally, any such changes in tax law could reduce the difference between tax-exempt interest rates and taxable rates.
EMPLOYEES
Our ability to attract, develop and retain talented employees, managers and executives, and to maintain appropriate staffing levels, is critical to our success.
Our success depends on our ability to attract, train, develop and retain talented, diverse employees, including executives and other key managers in a specialized industry. Our loss of certain key officers and employees or the failure to attract and develop talented new executives and managers could have a materially adverse effect on our business.
In addition, we must forecast the changing business environments (for multiple business units and in many geographic markets) with reasonable accuracy and adjust hiring programs and/or employment levels accordingly. Our failure to recognize the need for such adjustments, or the failure or inability to react appropriately on a timely basis, could lead either to over-staffing (which would adversely affect our cost structure) or under-staffing (impairing our ability to execute and effectively service our ongoing and new business) in one or more business units or locations. In either event, our financial results could be materially adversely affected.
BUSINESS CONTINUITY
Our business depends on the uninterrupted operation of our facilities, systems and business functions, including our information technology and other business systems.
Our business is highly dependent upon our ability to execute, in an efficient and uninterrupted fashion, necessary business functions, such as Internet support and 24-hour claims contact centers, processing new and renewal business, and processing and paying claims. A shut-down of or inability to access one or more of our facilities, a power outage, a pandemic, or a failure of one or more of our information technology, telecommunications or other systems could significantly impair our ability to perform such functions on a timely basis. In addition, because our information technology and telecommunications systems interface with and depend on third party systems, we could experience service denials if demand for such service exceeds capacity or a third party system fails or experiences an interruption. If sustained or repeated, such a business interruption, systems failure or service denial could result in a deterioration of our ability to write and process new and
21
Table of Contents
renewal business, provide customer service, pay claims in a timely manner or perform other necessary corporate functions. This could result in a materially adverse effect on our business results and liquidity.
A security breach of our computer systems could also interrupt or damage our operations or harm our reputation. In addition, we could be subject to liability if confidential customer information is misappropriated from our computer systems. Despite the implementation of security measures, including hiring an independent firm to perform intrusion vulnerability testing of our computer infrastructure, these systems may be vulnerable to physical break-ins, computer viruses, programming errors, attacks by third parties or similar disruptive problems. Any well-publicized compromise of security could deter people from entering into transactions that involve transmitting confidential information to our systems, which could have a material adverse effect on our business.
We have established a business continuity plan in an effort to ensure the continuation of core business operations in the event that normal business operations could not be performed due to a catastrophic event. While we continue to test and assess our business continuity plan to ensure it meets the needs of our core business operations and addresses multiple business interruption events, there is no assurance that core business operations could be performed upon the occurrence of such an event.
ACQUISITIONS
Acquisitions subject us to a number of financial and operational risks.
Since going public in 1991, we and our parent State Auto Mutual have acquired or affiliated with other insurance companies, most recently the 2009 acquisition of the Rockhill Insurance Group by State Auto Mutual. It is anticipated that we and State Auto Mutual will continue to pursue acquisitions or affiliations of other insurance companies in the future.
Insurance company acquisitions and affiliations involving State Auto Mutual generally do not have a material financial impact on State Auto Financial unless and until the target insurers are added to our Pooling Arrangement.
Acquisitions and affiliations involve numerous risks and uncertainties, such as:
| • | obtaining necessary regulatory approvals may prove to be more difficult than anticipated; |
| • | integrating the business may prove to be more costly than anticipated; |
| • | integrating the business without material disruption to existing operations may prove to be more difficult than anticipated; |
| • | anticipated cost savings may not be fully realized (or not realized within the anticipated time frame); |
| • | loss results of the acquired or affiliated company or business may be worse than expected; |
| • | losses may develop differently than what we expected them to; and |
| • | retaining key employees of the acquired company or business may prove to be more difficult than anticipated. |
In addition, other companies in the insurance industry have similar acquisition and affiliation strategies. Competition for target companies or businesses may intensify or we may not be able to complete such acquisitions or affiliations on terms and conditions acceptable to us. There is no assurance that any businesses acquired in the future will be successfully integrated. Ineffective integration may adversely affect our results and our ability to compete. Also, the acquired business may not perform as projected and anticipated cost savings and other synergies may not be realized.
22
Table of Contents
FINANCIAL STRENGTH RATINGS
A downgrade in our financial strength ratings may negatively affect our business.
Insurance companies are subject to financial strength ratings produced by external rating agencies. Higher ratings generally indicate financial stability and a strong ability to pay claims. Ratings are assigned by rating agencies to insurers based upon factors that they believe are relevant to policyholders and creditors. Ratings are important to maintaining public confidence in our Company and in our ability to market our products. A downgrade in our financial strength ratings could, among other things, negatively affect our ability to sell certain insurance products, our relationships with agents and our ability to compete.
Although other agencies cover the property and casualty industry, we believe our ability to write business is most influenced by our rating from A.M. Best. According to A.M. Best, its ratings are designed to assess an insurer’s financial strength and ability to meet ongoing obligations to policyholders. Our Pooled Companies and SA National currently have a rating from A.M. Best Company of A+ (Superior) (the second highest of A.M. Best’s 15 ratings). We may not be able to maintain our current A.M. Best ratings.
CONTROL BY OUR PARENT COMPANY
Our parent company owns a significant interest in us and may exercise its control in a manner detrimental to your interests.
As of December 31, 2009, our parent company owned approximately 63.5% of the voting power of our Company. Therefore, State Auto Mutual has the power to direct our affairs and is able to determine the outcome of substantially all matters required to be submitted to stockholders for approval, including the election of all our directors. State Auto Mutual could exercise its control over us in a manner detrimental to the interests of other STFC stockholders.
COMPETITION
Our industry is highly competitive, which could adversely affect our sales and profitability.
The property and casualty insurance business is highly competitive, and we compete with a large number of other insurers. Many of our competitors have well-established national reputations, and substantially greater financial, technical and operating resources and market share than we. We may not be able to effectively compete, which could adversely affect our sales or profitability. We believe that competition in our lines of business is based primarily on price, service, commission structure, product features, financial strength ratings, reputation and name or brand recognition. Our competitors sell through various distribution channels, including independent agents, captive agents and directly to the consumer. We compete not only for business insurance customers and personal insurance customers, but also for independent agents to market and sell our products. Some of our competitors offer a broader array of products, have more competitive pricing or have higher claims paying ability ratings. In addition, other financial institutions are now able to offer services similar to our own as a result of the Gramm-Leach-Bliley Act.
The increased transparency that arises from information available from the use of tools such as comparative rater software, could work to our disadvantage. We may have difficulty differentiating our products or becoming among the lowest cost providers. Expense efficiencies are important to maintaining and increasing our growth and profitability. If we are unable to efficiently execute and realize future expense efficiencies, it could affect our ability to establish competitive pricing and could have a negative effect on new business growth and retention of existing policyholders.
23
Table of Contents
VOLATILITY OF OUR COMMON STOCK
The price of our common stock could be volatile.
The trading price of our common stock may fluctuate substantially due to a variety of factors, some of which may not be related to our operating performance and are beyond our control. Such factors include, but are not limited to, the following: variations in our actual or anticipated operating results or changes in the expectations of financial market analysts; investor perceptions of our Company and/or the property and casualty industry; market conditions in the insurance industry and any significant volatility in the market; and major catastrophic events.
Item 1B. Unresolved Staff Comments
None.
We share our operating facilities with State Auto Mutual pursuant to the terms of the 2005 Management Agreement. Our corporate headquarters are located in Columbus, Ohio, in buildings owned by State Auto Mutual that contain approximately 280,000 square feet of office space. Our Company and State Auto Mutual also own and lease other office facilities in numerous locations throughout the State Auto Group’s geographical areas of operation.
We are a party to a number of legal proceedings arising in the ordinary course of our insurance business. Our Management believes that the ultimate resolution of these proceedings will not, individually or in the aggregate, have a material, adverse effect on our financial condition.
24
Table of Contents
Item 5. Market for the Registrant’s Common Equity, Related Shareholder Matters, and Issuer Purchases of Equity Securities
Market Information; Holders of Record
Our common shares are traded on the NASDAQ Global Select Market under the symbol STFC. As of February 26, 2010, there were 1,384 stockholders of record of our common shares.
Market Price Ranges and Dividends Declared on Common Shares
Initial Public Offering—June 28, 1991 – $2.25(1). The following table provides information with respect to the high and low sale prices of our common shares for each quarterly period for the past two years as reported by NASDAQ, along with the amount of cash dividends declared by us with respect to our common shares for each quarterly period for the past two years:
| 2009 | High | Low | Dividend | ||||||
| First Quarter |
$ | 30.25 | $ | 14.29 | $ | 0.15 | |||
| Second Quarter |
18.64 | 14.75 | 0.15 | ||||||
| Third Quarter |
18.56 | 15.62 | 0.15 | ||||||
| Fourth Quarter |
18.92 | 15.54 | 0.15 | ||||||
| 2008 | High | Low | Dividend | ||||||
| First Quarter |
$ | 30.08 | $ | 23.29 | $ | 0.15 | |||
| Second Quarter |
30.00 | 23.91 | 0.15 | ||||||
| Third Quarter |
37.08 | 21.83 | 0.15 | ||||||
| Fourth Quarter |
32.00 | 17.38 | 0.15 | ||||||
| (1) | Adjusted for stock splits. |
On March 5, 2010, the Board of Directors of State Auto Financial declared a cash dividend of $0.15 per share. The dividend is payable on March 31, 2010, to shareholders of record on March 15, 2010. Additionally, see Item 7 of this Form 10-K, “Management’s Discussion and Analysis of Financial Condition and Results of Operations—Liquidity and Capital Resources—Regulatory Considerations,” for additional information regarding regulatory restrictions on the payment of dividends to State Auto Financial by its insurance subsidiaries.
Purchases of Common Shares by the Company
On August 17, 2007, State Auto Financial announced that its board of directors had authorized the repurchase, from time to time, of up to 4.0 million of its common shares, or approximately 10% of State Auto Financial’s outstanding shares. Under this program, which ended on December 31, 2009, State Auto Financial repurchased 2,028,116 common shares at an average purchase price of $27.26 per share for a total of $55.3 million. These shares were purchased from the public and from State Auto Mutual in amounts that were proportional to its ownership percentage in the Company, which was approximately 64%.
25
Table of Contents
Performance Graph
The line graph below compares the total return on $100 invested on December 31, 2004, in STFC’s shares, the CRSP Total Return Index for the NASDAQ Stock Market (“NASDAQ Index”), and the CRSP Total Return Index for NASDAQ insurance stocks (“NASDAQ Ins. Index”), with dividends reinvested.
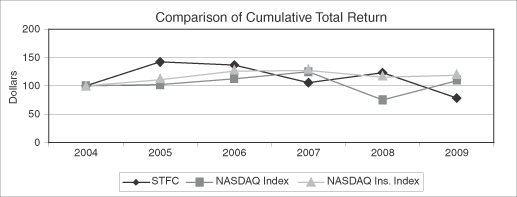
| 12/31/2004 | 12/31/2005 | 12/31/2006 | 12/31/2007 | 12/31/2008 | 12/31/2009 | |||||||
| STFC |
100.000 | 142.089 | 136.633 | 105.587 | 123.091 | 78.471 | ||||||
| NASDAQ Index |
100.000 | 102.090 | 112.640 | 124.613 | 75.018 | 109.046 | ||||||
| NASDAQ Ins. Index |
100.000 | 110.873 | 126.092 | 127.199 | 115.023 | 118.865 | ||||||
26
Table of Contents
Item 6. Selected Consolidated Financial Data
| (dollars and shares in millions, except per share data) | Year ended December 31: | ||||||||||||||
| 2009 | 2008* | 2007 | 2006 | 2005* | |||||||||||
| Statement of Income Data— |
|||||||||||||||
| Earned premiums |
$ | 1,176.5 | 1,126.0 | 1,011.6 | 1,023.8 | 1,050.3 | |||||||||
| Net investment income |
$ | 82.1 | 87.4 | 84.7 | 83.1 | 78.7 | |||||||||
| Total revenues |
$ | 1,256.9 | 1,181.9 | 1,113.4 | 1,117.4 | 1,139.5 | |||||||||
| Net income (loss) |
$ | 10.2 | (31.1 | ) | 119.1 | 120.4 | 125.9 | ||||||||
| Earned premium growth |
4.5 | % | 11.3 | (1.2 | ) | (2.5 | ) | 4.3 | |||||||
| Return on average invested assets(1) |
3.9 | % | 4.1 | 4.3 | 4.4 | 4.3 | |||||||||
| Balance Sheet Data— |
|||||||||||||||
| Total investments |
$ | 2,179.1 | 1,941.3 | 2,021.2 | 1,937.9 | 1,879.9 | |||||||||
| Total assets |
$ | 2,564.5 | 2,443.6 | 2,337.9 | 2,255.1 | 2,274.9 | |||||||||
| Total notes payable |
$ | 117.2 | 117.6 | 118.0 | 118.4 | 118.7 | |||||||||
| Total stockholders’ equity |
$ | 849.4 | 761.0 | 935.5 | 834.2 | 763.5 | |||||||||
| Common shares outstanding |
39.8 | 39.5 | 40.5 | 41.0 | 40.5 | ||||||||||
| Return on average equity(2) |
1.3 | % | (3.7 | ) | 13.5 | 15.1 | 17.7 | ||||||||
| Debt to capital ratio |
12.1 | % | 13.4 | 11.2 | 12.4 | 13.5 | |||||||||
| Per Common Share Data— |
|||||||||||||||
| Basic EPS |
$ | 0.26 | (0.78 | ) | 2.90 | 2.95 | 3.12 | ||||||||
| Diluted EPS |
$ | 0.25 | (0.78 | ) | 2.86 | 2.90 | 3.06 | ||||||||
| Cash dividends per share |
$ | 0.60 | 0.60 | 0.50 | 0.38 | 0.27 | |||||||||
| Book value per share |
$ | 21.33 | 19.23 | 23.10 | 20.32 | 18.86 | |||||||||
| Common Share Price: |
|||||||||||||||
| High |
$ | 30.25 | 37.08 | 35.22 | 39.94 | 38.15 | |||||||||
| Low |
$ | 14.29 | 17.38 | 23.99 | 28.40 | 24.30 | |||||||||
| Close at December 31 |
$ | 18.50 | 30.06 | 26.30 | 34.68 | 36.46 | |||||||||
| Close price to basic EPS |
71.15 | (38.54 | ) | 9.07 | 11.76 | 11.69 | |||||||||
| Close price to book value per share |
0.87 | 1.56 | 1.14 | 1.71 | 1.93 | ||||||||||
| GAAP Ratios:(3) |
|||||||||||||||
| Loss and LAE ratio |
71.7 | % | 75.2 | 58.4 | 57.4 | 58.4 | |||||||||
| Expense ratio |
34.1 | % | 34.6 | 34.4 | 34.0 | 31.7 | |||||||||
| Combined ratio |
105.8 | % | 109.8 | 92.8 | 91.4 | 90.1 | |||||||||
| Statutory Ratios:(3) |
|||||||||||||||
| Loss and LAE ratio |
71.3 | % | 74.8 | 57.9 | 56.8 | 58.4 | |||||||||
| Expense ratio |
33.5 | % | 33.1 | 33.2 | 32.9 | 31.6 | |||||||||
| Combined ratio |
104.8 | % | 107.9 | 91.1 | 89.7 | 90.0 | |||||||||
| Net premiums written to surplus(4) |
1.5 | 1.6 | 1.1 | 1.2 | 1.5 | ||||||||||
| (1) | Invested assets include investments and cash equivalents. |
| (2) | Net income (loss) divided by average common stockholders’ equity. |
| (3) | GAAP ratios are computed using earned premiums for both the Loss and LAE ratio and the expense ratio, and include the effect of eliminations in consolidation. The statutory expense ratio is computed using net written premiums. We use the statutory combined ratio to compare our results to the industry statutory combined ratio as there is no industry GAAP combined ratio available. |
| (4) | We use the statutory net premiums written to surplus ratio as there is no comparable GAAP measure. This ratio, also called the leverage ratio, measures our statutory surplus available to absorb losses. |
| * | Reflects changes in Pooling Arrangements, effective January 1, 2008 and 2005. |
27
Table of Contents
Item 7. Management’s Discussion and Analysis of Financial Condition and Results of Operations
Capitalized terms used in this Item 7 and not otherwise defined have the meanings ascribed to such terms under the caption “Important Defined Terms Used in this Form 10-K” which immediately precedes Part I of this Form 10-K. This discussion should be read in conjunction with the consolidated financial statements and notes thereto included in Item 8 of this Form 10-K, and the “Narrative Description of Business” contained in Item 1 of this Form 10-K.
OVERVIEW
State Auto Financial is a property and casualty insurance holding company. Our insurance subsidiaries are part of the State Auto Group and Pooling Arrangement described below. State Auto Mutual owns approximately 63.5% of State Auto Financial’s outstanding common shares. Our Pooled Companies and SA National (which joined the Pooling Arrangement on January 1, 2010) write personal and business insurance through independent agencies primarily in Midwestern, Southern, Southwestern, and Eastern states. Our Pooled Companies and SA National are rated A+ (Superior) by the A.M. Best Company.
State Auto Financial’s principal subsidiaries are State Auto P&C, Milbank, Farmers, SA Ohio and SA National, each of which is a property and casualty insurance company, and Stateco, which provides investment management services to affiliated insurance companies.
Our reportable segments are personal insurance, business insurance (collectively the “insurance segments” or “our insurance segments”) and investment operations. These segments reflect the manner in which we manage our business and report our results internally to our principal operating decision makers. The personal insurance segment provides primarily personal auto (standard and nonstandard) and homeowners to the personal insurance market. The business insurance segment provides primarily commercial auto, commercial multi-peril, fire & allied lines, other & product liability and workers’ compensation insurance to small to medium sized businesses within the commercial insurance market. The investment operations segment, managed by Stateco, provides investment services for our invested assets.
We evaluate the performance of our insurance segments using industry financial measurements determined based on Statutory Accounting Principles (“SAP”), and certain measures determined under Generally Accepted Accounting Principles (“GAAP”). We evaluate our investment operations segment based on investment returns of assets managed. Financial information about our segments is set forth in this Item 7 and in Note 16 to our Consolidated Financial Statements included in Item 8 of this Form 10-K.
Rockhill Insurance Group
In February 2009, State Auto Mutual completed its acquisition of the Rockhill Insurance Group. The insurers in the Rockhill Insurance Group write specialty property and casualty insurance, with key product lines that include commercial property, general liability for residential construction, commercial umbrella, surety, program, professional and environmental. In addition, its subsidiary RED acts as a managing general underwriter for a variety of property and casualty coverages in the alternative risk transfer market.
In 2010, the State Auto Group will write new commercial specialty business through RED, which will allow the State Auto Group to offer insurance coverages for the alternative risk transfer market for business products such as general liability, auto liability, workers’ compensation, property, inland marine, auto physical damage and miscellaneous professional. The insurance coverages written by our Pooled Companies through RED are subject to the Pooling Arrangement.
28
Table of Contents
EXECUTIVE SUMMARY
The results of our operations from year-to-year and quarter-to-quarter are primarily driven by our ability to generate revenue through selecting and pricing risks in a manner that permits premium growth without adversely affecting underwriting profits and disciplined investment strategy. We also recognize that our results will be periodically impacted, sometimes significantly, by the occurrence of catastrophic events.
| • | Premium Growth/Underwriting Profitability: The property and casualty insurance industry is highly cyclical. Our industry has been historically characterized by periods of intense price competition due to excess underwriting capacity, as well as periods of shortages of underwriting capacity that result in increased prices and more favorable underwriting terms. During periods of excess underwriting capacity, some property and casualty insurers attempt to generate additional top line growth by setting their prices at levels inappropriate for the risk underwritten. While in the short term this may result in additional revenues, this action compromises their long term underwriting profitability. Our strategy is to insure personal and small-to-medium business risks while adhering to disciplined and consistent underwriting principles through all market cycles. In the current cycle, it appears that business exposures are contracting due to reduced payrolls and inventories, resulting in price pressure. For personal lines, it appears that rising claim costs are resulting in opportunities to establish more favorable underwriting terms. We have been monitoring this situation for each of our lines of business and have responded in ways consistent with our goals not to compromise underwriting profitability and to protect the interests of our stakeholders. |
Our underwriting principles include insistence on selecting and retaining business based on the merits of each account and a dedication to cost-based pricing, where each line of business is priced to generate a profit. It is our intention to set pricing levels so that no line of business, or classification within major lines, subsidizes another line or classification. We are committed to achieving an underwriting profit through all market cycles, even at the expense of periodic slowdowns in written and earned premiums. We will not compromise underwriting profitability for top line growth. We believe that we can implement periodic rate changes in most states and remain an attractive market to our policyholders and independent agents by stressing the strengths we bring to the marketplace. These strengths include stability, financial soundness, prompt and fair claims service, and technology which make it easier for the agent to do business with the State Auto Group and provide substantial value to our customers. We carefully monitor writing insurance in states that we believe present difficult legislative, judicial and/or regulatory environments for the insurance industry.
| • | Investment Strategy: We have a disciplined approach to our investment strategy that emphasizes the quality of our fixed maturity portfolio, which comprised 83.8% of our total portfolio at fair value at December 31, 2009, and includes primarily investment grade securities. The majority of our fixed maturity portfolio is invested in municipal bonds to recognize the tax advantages available from municipal bond income. In addition, we believe that our credit risk exposure is reduced by investing in high quality municipal bonds that are diversified by issuer and state. We regularly monitor the duration of our fixed maturity portfolio. In our monitoring process we take into account market expectations regarding future interest rates and inflation. Our internally managed equity portfolio, which comprised 8.6% of our total portfolio at fair value at December 31, 2009, emphasizes large-cap, dividend-paying companies selected based upon their potential for appreciation as well as ability to continue paying dividends. Since 2007, we have diversified our equity portfolio and utilized outside managers to invest in U.S. small-cap equities and international equity funds. Diversifying our portfolio into small-cap equities and international equity funds was designed to achieve a greater total return with reduced volatility. In 2008, almost all asset classes experienced a decline in fair value, and our portfolio was not immune to this broad-based decline. During 2009, as the stock market recovered above its 2008 level, the fair value of our equity portfolio improved. We believe that in most market cycles diversification of our portfolio will be beneficial to us and we plan to continue to maintain a diversified portfolio. |
29
Table of Contents
| • | Loss Reserves: We maintain reserves for the eventual payment of losses and loss expenses for both reported claims and incurred claims that have not yet been reported. Loss reserves are management’s best estimate at a given point in time of what we expect to pay to settle all claims incurred as of the end of the accounting period, based on facts, circumstances and historical trends then known. Although management uses many resources to calculate reserves, there is no precise method for determining the ultimate liability. We do not discount loss reserves for financial statement purposes. Our objective is to set reserves that are adequate such that the amounts originally recorded as reserves reasonably approximate the ultimate liability for insured losses and loss expenses. We regularly review and adjust loss reserves as appropriate. |
| • | Catastrophic Events: We are exposed to claims arising out of catastrophic events. Catastrophe losses can and do cause substantial volatility in our financial results for any fiscal quarter or year. Catastrophes can be caused by various natural events, including hurricanes, hailstorms, tornadoes, windstorms, earthquakes, severe winter weather and fires, none of which are within our control. The frequency and severity of catastrophes are inherently unpredictable. The magnitude of loss from a catastrophe is a function of the severity of the event and the total amount of insured exposure in the affected area. Catastrophes, to which we are exposed, including hurricanes, earthquakes and other perils, may be severe and produce significant loss. We are also exposed to significant loss from less severe catastrophes when they affect large geographic areas or areas that are heavily populated. Although catastrophes can cause losses in a variety of our property and casualty lines, most of our catastrophe claims in the past have related to homeowners, allied lines and commercial multiple peril coverages. We deploy specific strategies designed to mitigate our exposure to catastrophe losses, which include obtaining reinsurance and applying mandatory specific peril deductibles for some states. We continually seek to diversify our business on a geographic basis. The number of states we actively operate in has increased from 27 states in 2003 to 34 states and the District of Columbia as of December 31, 2009. As we begin 2010, the concentration of our direct written premiums for our property and casualty operations in our largest five states has decreased from 48% for the year ended December 31, 2003, to approximately 43% at December 31, 2009. Our management strategies are designed to mitigate our exposure to catastrophes. |
In addition to adherence to our cost-based pricing, investment and catastrophe risk mitigation strategies discussed above, our management focuses on several other key areas with the intention of continually improving the results of our operations and financial results, including the following:
| • | Claims Service: We believe an important element of our success is our focus on claims service. We expect our claim service to be fair, fast and friendly. The role of the claims division is to deliver the promise that we and the independent agent made to the insured. We have the capability of receiving claims 24 hours a day, seven days a week. Claims may be reported to our Claims Contact Center, to the policyholder’s independent agent or via the Internet at www.StateAuto.com. We make a pledge to our policyholders to contact them within two hours of a claim being assigned to a claims handler (except in catastrophe loss situations). To enhance our response to policyholders in catastrophe loss situations, we establish internal claims catastrophe teams. |
| • | Independent Insurance Agent Network: We believe the success of our independent insurance agent network, which is our primary distribution channel, grows out of our commitment to promote and foster close working relationships with our agents. We seek relationships with agencies where we will be one of their top three insurers, measured on the basis of direct premiums written, for the type of business we desire. Our agents’ compensation package includes competitive commission rates and other sales inducements designed to maintain and enhance relationships with existing independent agents as well as to attract new independent agents. We provide our agents with a co-operative advertising program, sales training programs, contingent commissions, travel incentives and agency recognition. We continually monitor our agencies for compatibility with us, taking into account factors such as loss ratio, premium volume, business profiles and relationship history. This allows us to be proactive in helping our agents grow their book of business with us profitably and, thus, enhance the |
30
Table of Contents
| long-term value of our relationship. Our senior management meets frequently with agents to encourage mutual growth and demonstrate our commitment. We believe each of these elements creates a relationship that has resulted in our independent insurance agents placing quality insurance business with us. |
| • | Technology: Our technology efforts are focused on making us as efficient and effective as possible. During 2009, we continued our personal lines strategy of integrating external data directly into our netXpressSM portal by significantly expanding the portfolio of third parties with whom we can extract data. We also have taken advantage of industry-wide data standards and commonly used agent systems to provide enhanced functionality to our agents, who have rewarded us with increased quote opportunities and submissions. We also completed the production of a new homeowners product which will be rolled out state by state in 2010 and 2011. |
In 2009, our business insurance segment technology teams delivered a more sophisticated businessowners product to the marketplace. This new product will be rolled out to the majority of our states in 2010. We also made further developments in our predictive modeling technology and integrated these into our standard business flows so that we can use this new functionality when underwriting the majority of our new and renewal business.
Project management and quality assurance efforts continue to mature and provide value. Investments in enterprise architecture were also made to aid Information Technology Governance and to support our ability to reach efficiency goals set by us. Construction of a new data center by State Auto Mutual was completed in December 2009. This state of the art facility provides the State Auto Group a reliable infrastructure designed to scale with the future business requirements of our Company. Migration of computing activities to this facility will commence in 2010.
| • | Innovate SA: In 2008, we launched a formal company-wide plan called Innovate SA, which is intended to reduce expenses, enhance revenues and improve margins. Innovate SA is comprised of various initiatives, including changes to our field structure, business processes and product changes. Innovate SA began with an idea generation phase that involved our 2000+ associates and was followed by an evaluation phase that was led by senior managers in our business units. The idea generation and evaluation phases were completed for the most part in the fourth quarter of 2008, and 480 separate actions were approved for implementation. The implementation of these actions began in 2009 and is expected to continue through 2011. |
CRITICAL ACCOUNTING POLICIES
Our significant accounting policies are more fully described in Note 1 of the Notes to our Consolidated Financial Statements included in Item 8 of this Form 10-K. In preparing the consolidated financial statements, management is required to make estimates and assumptions that affect the reported amounts of assets and liabilities as of the date of the balance sheet, revenues and expenses for the period then ended and the financial entries in the accompanying notes to the financial statements. Such estimates and assumptions could change in the future, as more information becomes known which could impact the amounts reported and disclosed in this Item 7. We have identified the policies and estimates described below as critical to our business operations and the understanding of the results of our operations.
Investments
Our fixed maturity, equity security and certain other invested asset investments are classified as available-for-sale and carried at fair value. The unrealized holding gains or losses, net of applicable deferred taxes, are shown as a separate component of stockholders’ equity in accumulated other comprehensive income (loss), and as such are not included in the determination of net income. Investment income is recognized when earned, and capital gains and losses are recognized when investments are sold.
31
Table of Contents
We regularly monitor our investment portfolio for declines in value that are other-than-temporary impaired (“OTTI”), an assessment that requires significant management judgment regarding the evidence known. Such judgments could change in the future as more information becomes known which could negatively impact the amounts reported herein. We consider the following factors when assessing our equity securities and other invested assets for OTTI: (1) the length of time and/or the significance of decline below cost; (2) our ability and intent to hold these securities through their recovery periods; (3) the current financial condition of the issuer and its future business prospects; and (4) the ability of the market value to recover to cost in the near term. We recognize OTTI charges on our externally managed small-cap equity portfolio and a segment of our large-cap portfolio, as we are unable to make the assertion regarding our intent to hold these securities that are currently valued below cost until recovery in the near term. When an equity security or other invested asset has been determined to have a decline in fair value that is other-than-temporary, we adjust the cost basis of the security to fair value. This results in a charge to earnings as a realized loss, which is not reversed for subsequent recoveries in fair value. Future increases or decreases in fair value, if not other-than-temporary, are included in accumulated other comprehensive income (loss).
We also consider the following factors when assessing our fixed maturities investments for OTTI: (1) the financial condition of the issuer including receipt of scheduled principal and interest cash flows; (2) our intent to sell; and (3) if it is more likely than not that we will be required to sell the investments before recovery. When a fixed maturity has been determined to have an other-than-temporary impairment, the impairment charge is separated into an amount representing the credit loss, which is recognized in earnings as a realized loss, and the amount related to non-credit factors, which is recognized in accumulated other comprehensive income (loss). Future increases or decreases in fair value, if not other-than-temporary, are included in accumulated other comprehensive income (loss).
Deferred Acquisition Costs
Acquisition costs, consisting of commissions, premium taxes and certain underwriting expenses relating to the production of property and casualty business, are deferred and amortized over the same period in which the related premiums are earned. The method followed for computing the acquisition costs limits the amount of such deferred costs to their estimated realizable value. In determining estimated realizable value, the computation gives effect to the premium to be earned, losses and loss expenses expected to be incurred, and certain other costs expected to be incurred as premium is earned. Future changes in estimates, the most significant of which is expected losses and loss adjustment expenses, that indicate a reduction in expected future profitability may result in unrecoverable deferred policy acquisition costs. We have not recorded any significant changes in estimates for the years ended December 31, 2009, 2008 and 2007, respectively.
Losses and Loss Expenses Payable
Our loss and loss expense payables are reserves which reflect all unpaid amounts for claims that have been reported, as well as for claims that have been incurred but not reported (“IBNR”). Our loss and loss expense reserves are not discounted to present value.
Losses and allocated loss expense reserves (“Loss and ALAE Reserve”) are management’s best estimates (“MBE”) at a given point in time of what we expect to pay to settle all claims incurred as of that date based on known facts, circumstances and historical trends. Reserves for reported losses are established on either a case-by-case or formula basis depending on the type and circumstances of the loss. The case-by-case reserve amounts are determined by claims adjusters based on our reserving practices, which take into account the type of risk, the circumstances surrounding each claim and applicable policy provisions. The formula reserves are based on historical data for similar claims with provision for trend changes caused by inflation. Case and formula basis loss reserves are reviewed on a regular basis, and as new data becomes available, estimates are updated resulting in adjustments to loss reserves. Generally, reported losses initially reserved on a formula basis and not settled after six months are case reserved at that time. The process for calculating the IBNR component of the Loss and
32
Table of Contents
ALAE Reserve is to develop an estimate of the ultimate losses and allocated loss expenses incurred, and subtract all amounts already paid or held as case or formula reserves.
The ultimate determination of MBE integrates information and analysis provided by several disciplines within our Company, including claims, actuarial and accounting. This assessment requires considerable judgment in understanding how claims mature, which lines of business are the most volatile, and how trends change over time. Loss and ALAE Reserves represent an estimate at a given point in time based on many variables including historical and statistical information, inflation, legal developments, storm loss estimates and economic conditions. Although we consider many different sources of information, as well as a number of actuarial methodologies to estimate our Loss and ALAE Reserve, there is no single method for determining the exact ultimate liability.
Our internal actuarial staff conducts quarterly reviews of projected loss development information to assist management in making estimates of ultimate losses and loss expenses. Several factors are considered in estimating ultimate liabilities including consistency in relative case reserve adequacy, consistency in claims settlement practices, recent legal developments, historical data, actuarial projections, accounting projections, exposure growth, current business conditions, catastrophe developments and late reported claims. In addition, reasonableness tests are performed on many of the assumptions underlying each reserving methodology, such as claim frequency, claim severity and loss ratios. Nonetheless, changes which are not contemplated do occur over time, and those changes are incorporated in subsequent valuations of the loss reserves.
We use a number of different methodologies to estimate the IBNR component of the Loss and ALAE Reserves. Our reserves include amounts related to short tail and long tail lines of business. “Tail” refers to the time period between the occurrence of a loss and the settlement of the claim. In general, the longer the time span between the incidence of a loss and the settlement of the claim, the more the ultimate settlement amount can vary. The reserving methods and strengths and weaknesses of each are described below.
Short-Tail Business: For short-tail business, claims are typically settled within five years, and the most common actuarial estimates are based on techniques using link ratio projections of incurred losses, paid losses, claim counts and claim severities. Each of these methods is described below in detail. Separate projections are made for catastrophes that are in the very early stages of development based on specific information known through the reporting date.
Incurred Loss Development Method: The Incurred Loss Development Method is probably the most common actuarial method used in projecting indicated IBNR reserves. This method uses paid loss experience as well as the outstanding estimates (formula and case reserves) for claims that have been reported and are still open. The underlying assumption of the Incurred Loss Development Method is that case reserve adequacy remains consistent over time. This method’s advantage is its responsiveness to changes in reported losses, which is particularly valuable in the less mature accident years. The disadvantage of the Incurred Loss Development Method is that case reserve adequacy changes will distort the IBNR projections.
Paid Loss Development Method: The Paid Loss Development Method uses calculations that are very similar to the Incurred Loss Development Method. The key difference is that the data used in the paid method exclude case reserve estimates, so only paid losses are utilized. With this method, a payment pattern is estimated to project ultimate settlement values for each accident year, with the underlying assumption that claims are settled at a consistent rate over time. Neither case reserves nor the rate at which claims are reported (except to the extent that the reporting pattern influences the payment pattern) is relevant to the results of this method. This method’s advantage is the estimates of ultimate loss are independent of case reserve adequacy and are unaffected by company changes in case reserving philosophy. The disadvantages are that the paid method does not use all of the available information, and in some cases the liability payment patterns require the application of very large development factors to relatively small payments in less mature accident years.
33
Table of Contents
Claim Counts and Severities Method: The Counts and Severities Method calculations are very similar to the other methods. The incurred claim counts reported to date are projected to an ultimate number. Similarly, the incurred loss severities are projected to an ultimate value. The ultimate incurred count is multiplied by the ultimate incurred severity, for each accident year, to arrive at the ultimate incurred loss. Finally, as with the other loss development methods, an estimate of the IBNR reserve is calculated by subtracting the reported losses from the estimated ultimate losses.
Long-Tail Business: Reserve estimates for long-tail business use the same methods listed above along with several other methods as determined by the actuary. For example, premium-based methods may be used in developing ultimate loss estimates, including the Expected Loss Ratio, Bornhuetter-Ferguson, and Least-Squares techniques as described below. We also use statistical models when the historical patterns can be reasonably approximated.
Expected Loss Ratio Method: The Expected Loss Ratio Method generates indicated IBNR by multiplying an expected loss ratio by earned premium, then subtracting incurred-to-date losses. For slower reporting lines of business, new products, or data that is very immature, the actual claim data is often too limited or too volatile for other projection methods. With this method the premiums are used as a measure of loss exposure, and the loss ratios can be derived from pricing expectations.
Bornhuetter-Ferguson Method: The Bornhuetter-Ferguson Method is a weighted average of the Expected Loss Ratio Method and the Incurred Loss Development Method, using the percentage of losses reported as the weight. This method is particularly useful where there is a low volume of data in the current accident period, or where the experience is volatile. In general, this method produces estimates that are very similar to the Incurred Loss Development Method.
Least Square Loss Development Method: In the Least Squares Loss Development Method the statistical technique of least squares regression is applied to a triangle of reported loss ratios to project the ultimate loss ratio in each accident year. Using historical loss ratios puts the data for each time period on a more consistent exposure basis, because premium levels are generally correlated with insured exposures. A by-product of the regression function is an estimate of credibility for each stage of development. In cases where the regression parameters fall outside of a reasonable range, the projection defaults to the incurred loss method.
Selection Process: In determining which reserving method to use for a particular line of business or accident year, diagnostic tests of loss ratios and severity trends are considered, as well as the historic case reserve adequacy and claim settlement rate. In general, the Incurred Loss Development Method is used if the projections are stable, the data is credible, historic case reserve adequacy is consistent, and the loss ratios and loss severities are reasonable. Other reserving methods are considered as well for particular lines of business or accident years, along with supplemental information such as open claim counts and prior period development. For example, if more than one method provides a reasonable projection, the actuary may select an average of those methods. There is considerable judgment applied in the analysis of the historical patterns and in applying business knowledge of our underwriting and claims functions.
Reserve ranges provide a quantification of the variability in the reserve projections. The primary determinant in estimating the reserve range boundaries are the variances measured within the historical reserving data for the various lines of business. MBE of loss reserves considers the expected variation to establish an appropriate position within a range. MBE Loss and ALAE Reserves for SA National and the STFC Pooled Companies’ share of the Pooled Companies’ reserves at December 31, 2009, was $882.5 million, within an estimated range of $812.6 million to $901.5 million. (These values presented are on a direct basis, gross of salvage and subrogation recoverable, and before reinsurance, except for the STFC Pooled Companies’ participation in the inter-company Pooling Arrangement. Therefore, these values cannot be compared to other loss and loss expenses payable tables included elsewhere within this Form 10-K.)
34
Table of Contents
The potential impact of the reserve variability on net income can be illustrated using the range end points and carried reserve amounts listed above. For example, if ultimate losses reach a level corresponding to the high point of the range, $901.5 million, the reserve increase of $19.0 million corresponds to an after-tax decrease of $12.4 million in net income. Likewise, should ultimate losses decline to a level corresponding to the low point of the range, $812.6 million, the $69.9 million reserve decrease would add $45.4 million of after-tax net income. The reserve range noted above represents a range of reasonably likely reserves, not a range of all possible reserves. Therefore, the ultimate losses could reach levels corresponding to reserve amounts outside the range provided.
An important assumption underlying the reserve estimation methods for the major casualty lines is that the loss cost trends implicitly built into the loss and ALAE patterns will continue into the future. To estimate the sensitivity of reserves to an unexpected change in inflation, projected calendar year payment patterns were applied to the December 31, 2009, other & product liability Loss and ALAE Reserve to generate estimated annual incremental loss and ALAE payments for each subsequent calendar year. Then, for purposes of sensitivity testing, an additional annual loss cost trend of 10% was added to the trend implicitly embedded in the estimated payment pattern, and revised incremental loss and ALAE payments were calculated. This type of inflationary increase could arise from a variety of sources including tort law changes, development of new medical procedures, social inflation, and other inflationary changes in costs beyond assumed levels.
The estimated cumulative impact that this additional, unexpected 10% increase in the loss cost trend would have on our results of operations over the lifetime of the underlying claims in other & product liability is an increase of $68.8 million on reserves, or a $44.7 million reduction to net income, assuming a tax rate of 35%. Inflation changes have much more impact on the longer tail commercial lines like other & product liability and workers’ compensation, and much less impact on the shorter tail personal lines’ reserves.
In addition to establishing Loss and ALAE Reserves, as described above, we establish reserves for loss adjustment expenses related to functions and costs that are not attributable to a specific claim, which is called Unallocated Loss Adjustment Expense (“ULAE”). Historical patterns of paid ULAE relative to paid loss are analyzed along with historical claim counts including claims opened, claims closed, and claims remaining open. The product of this analysis is an estimate of the relationship, or ratio, between ULAE and loss underlying the current loss reserves. This ratio is applied to the current outstanding loss reserves to estimate the required ULAE reserve. Consequently, this component of the loss expense reserve has a proportional relationship to the overall claim inventory and held loss reserves. The method assumes that the underlying claims process and mix of business do not change materially over time.
35
Table of Contents
The following table provides a reconciliation of MBE of our direct Loss and ALAE Reserve to our net loss and loss expenses payable at December 31, 2009 and 2008, respectively. The STFC Pooled Companies net additional share of transactions assumed from State Auto Mutual through the Pooling Arrangement for the years ended December 31, 2009 and 2008, respectively, has been reflected in the table below as assumed by STFC Pooled Companies:
| ($ millions) | 2009 | 2008 | |||||
| Direct Loss and ALAE Reserve: |
|||||||
| STFC Pooled Companies and SA National |
$ | 488.0 | 440.5 | ||||
| Assumed by STFC Pooled Companies |
394.5 | 411.3 | |||||
| Total direct Loss and ALAE Reserve |
882.5 | 851.8 | |||||
| Direct ULAE: |
|||||||
| STFC Pooled Companies and SA National |
26.6 | 24.9 | |||||
| Assumed by STFC Pooled Companies |
24.5 | 24.3 | |||||
| Total direct ULAE |
51.1 | 49.2 | |||||
| Direct salvage and subrogation recoverable: |
|||||||
| STFC Pooled Companies and SA National |
(25.0 | ) | (22.0 | ) | |||
| Assumed by STFC Pooled Companies |
(8.3 | ) | (9.5 | ) | |||
| Total direct salvage and subrogation recoverable |
(33.3 | ) | (31.5 | ) | |||
| Reinsurance recoverable |
(20.8 | ) | (21.2 | ) | |||
| Assumed reinsurance |
4.4 | 4.8 | |||||
| Reinsurance assumed by STFC Pooled Companies |
(64.5 | ) | (83.1 | ) | |||
| Total losses and loss expenses payable, net of reinsurance recoverable on losses and loss expenses payable of $20.8 in 2009 and $21.2 in 2008 |
$ | 819.4 | 770.0 | ||||
The following tables present the loss and loss expenses payable by major line of business at December 31, 2009 and 2008, respectively:
| ($ in millions) |
Ending Loss & Case & |
Ending Loss & IBNR |
Ending ULAE Bulk |
Total Reserves | |||||
| December 31, 2009 |
|||||||||
| Personal insurance segment: |
|||||||||
| Standard auto |
$ | 149.8 | 54.3 | 12.2 | 216.3 | ||||
| Nonstandard auto |
15.5 | 3.2 | 1.5 | 20.2 | |||||
| Homeowners |
45.3 | 27.9 | 2.5 | 75.7 | |||||
| Other personal |
9.8 | 3.3 | 0.3 | 13.4 | |||||
| Total personal |
220.4 | 88.7 | 16.5 | 325.6 | |||||
| Business insurance segment: |
|||||||||
| Commercial auto |
45.4 | 43.5 | 4.8 | 93.7 | |||||
| Commercial multi-peril |
35.1 | 49.1 | 5.1 | 89.3 | |||||
| Fire & allied lines |
28.1 | 4.7 | 1.0 | 33.8 | |||||
| Other & product liability |
57.6 | 94.1 | 15.4 | 167.1 | |||||
| Workers’ compensation |
48.5 | 47.4 | 7.9 | 103.8 | |||||
| Other business |
3.5 | 2.2 | 0.4 | 6.1 | |||||
| Total business |
218.2 | 241.0 | 34.6 | 493.8 | |||||
| Total losses and loss expenses payable net of reinsurance recoverable on losses and loss expenses payable |
$ | 438.6 | 329.7 | 51.1 | 819.4 | ||||
36
Table of Contents
See discussion in “Results of Operations 2009 Compared to 2008-Loss and LAE” section included in this Item 7.
| ($ in millions) |
Ending Loss & Case & |
Ending Loss & IBNR |
Ending ULAE Bulk |
Total Reserves | |||||
| December 31, 2008 |
|||||||||
| Personal insurance segment: |
|||||||||
| Standard auto |
$ | 133.5 | 44.2 | 10.8 | 188.5 | ||||
| Nonstandard auto |
15.1 | 3.0 | 1.5 | 19.6 | |||||
| Homeowners |
44.0 | 21.9 | 2.7 | 68.6 | |||||
| Other personal |
9.7 | 4.4 | 0.5 | 14.6 | |||||
| Total personal |
202.3 | 73.5 | 15.5 | 291.3 | |||||
| Business insurance segment: |
|||||||||
| Commercial auto |
49.4 | 39.3 | 4.8 | 93.5 | |||||
| Commercial multi-peril |
40.4 | 45.4 | 5.7 | 91.5 | |||||
| Fire & allied lines |
33.0 | 4.4 | 1.1 | 38.5 | |||||
| Other & product liability |
54.7 | 84.1 | 13.6 | 152.4 | |||||
| Workers’ compensation |
43.3 | 45.7 | 8.1 | 97.1 | |||||
| Other business |
3.1 | 2.2 | 0.4 | 5.7 | |||||
| Total business |
223.9 | 221.1 | 33.7 | 478.7 | |||||
| Total losses and loss expenses payable net of reinsurance recoverable on losses and loss expenses payable |
$ | 426.2 | 294.6 | 49.2 | 770.0 | ||||
See discussion in “Results of Operations 2008 Compared to 2007-Loss and LAE” section included in this Item 7.
The property and casualty industry has experienced significant loss from claims related to asbestos, environmental remediation, product liability, mold and other mass torts. Asbestos reserves are $2.0 million, and environmental reserves are $8.6 million, for a total of $10.6 million, or 1.3% of net losses and loss expenses payable. Asbestos reserves decreased $1.4 million and environmental reserves increased $0.9 million from 2008. Because we have insured primarily product retailers and distributors, we do not expect to incur the same level of liability, particularly related to asbestos, as companies that have insured manufacturing risks.
The risks and uncertainties inherent in the loss and loss expense reserve estimates include, but are not limited to, actual settlement experience being different from historical data and trends, changes in business and economic conditions, court decisions creating unanticipated liabilities, ongoing interpretation of policy provisions by the courts, inconsistent decisions in lawsuits regarding coverage and additional information discovered before settlement of claims. Our results of operations and financial condition could be impacted, perhaps significantly, in the future if the ultimate payments required to settle claims vary from the liability currently recorded.
Pension and Postretirement Benefit Obligations
Pension and postretirement benefit obligations are long term in nature and require management’s judgment in estimating the factors used to determine these amounts. We review these factors annually, including the discount rate and expected long term rate of return on plan assets. Because these obligations are based on estimates which could change, the ultimate benefit obligation could be different from the amount estimated.
37
Table of Contents
The State Auto Group has a defined benefit pension plan and a postretirement health care plan covering substantially all employees (collectively “the benefit plans”). Several factors, which attempt to anticipate future events, are used in calculating the expense and liability related to the benefit plans. Key factors include assumptions about the expected rates of return on plan assets, discount rates, and health care cost trend rates. We consider market conditions, including changes in investment returns and interest rates, in making these assumptions. The actuarial assumptions used by us in determining benefit obligations may differ materially from actual results due to changing market and economic conditions, higher or lower turnover and retirement rates or longer or shorter life spans of participants. While we believe that the assumptions used are appropriate, differences in actual experience or changes in assumptions may materially affect our financial position or results of operations.
To calculate the State Auto Group’s December 31, 2009 benefit obligation for each of the benefit plans, we used a discount rate of 6.00% based on an evaluation of the expected future benefit cash flows of our benefit plans used in conjunction with the Citigroup Pension Discount Curve at the measurement date. A lower discount rate results in, all else being equal, a higher present value of the benefit obligation. To calculate our benefit obligation at December 31, 2009 and net periodic benefit cost for the year ended December 31, 2010, a discount rate of 6.00% and an expected long-term rate of return on plan assets of 8.00% were used. We selected an expected long-term rate of return on our plan assets by considering the mix of investments and stability of investment portfolio along with actual investment experience during the lifetime of the plans. Our assumptions regarding the discount rate and expected return on plan assets could have an effect on the amounts related to our benefit obligations and net periodic benefit cost depending on the degree of change between reporting periods. The table below provides an illustration of variability with respect to the discount rate on our December 31, 2009, benefit obligation and 2010 expected net periodic benefit cost, along with the variability of the expected return on plan assets to our 2010 expected net periodic benefit cost.
Holding all other assumptions constant, sensitivity to changes in any one of our key assumptions are as follows:
| ($ millions) | Pension | Postretirement | ||||||||||||
| Discount rate | Discount rate | |||||||||||||
| -0.25% | 6.00% | +0.25% | -0.25% | 6.00% | +0.25% | |||||||||
| Benefit obligation |
$ | 259.3 | 250.0 | 241.3 | $ | 99.2 | 95.4 | 91.8 | ||||||
| Net periodic benefit cost |
13.8 | 12.7 | 11.7 | 6.9 | 6.6 | 6.4 | ||||||||
| Expected return on plan assets | Expected return on plan assets | |||||||||||||
| -0.25% | 8.00% | +0.25% | -0.25% | 8.00% | +0.25% | |||||||||
| Net periodic benefit cost |
$ | 13.3 | 12.7 | 12.2 | $ | 6.7 | 6.6 | 6.6 | ||||||
The accumulated benefit obligation (“ABO”) of a defined benefit pension plan represents the actuarial present value of benefits attributed by the pension benefit formula to employee service rendered prior to the measurement date and based on current and past compensation levels, while the projected benefit obligation (“PBO”) is the ABO plus a factor for future compensation levels. The ABO, which considers current compensations level only, provides information about the obligation an employer would have if the plan were discontinued at the measurement date. At December 31, 2009, the ABO and PBO were $225.4 million and $250.0 million, respectively. At December 31, 2009 the fair value of the assets of our defined benefit pension plan was $197.9 million, which resulted in an underfunded status within our balance sheet of $52.1 million. On a cash flow basis, we target an annual contribution level that meets at least the targeted normal cost of the plan, as defined by ERISA. Currently, we expect to make a cash contribution to the pension plan up to $15.0 million in 2010.
Our unfunded status on our pension plan decreased from $73.2 million at December 31, 2008, to $52.1 million at December 31, 2009. The factors influencing this decrease are as follows: (1) actual return on our plan
38
Table of Contents
assets was a gain of $26.3 million compared to an expected return of $18.4 million for a net decrease to our obligation and unrecognized actuarial loss of approximately $7.9 million; and (2) our field and claim restructuring in 2009 (discussed below) resulted in a plan curtailment gain which reduced our obligation and unrecognized actuarial loss by approximately $2.2 million. Unrecognized gains and losses arise from additional factors including expected to actual demographic changes, such as retirement age, mortality, turnover, and rate of compensation increases. The cumulative unrecognized actuarial loss is systematically recognized as an increase in net periodic cost over the average future service period of active participants.
Our unfunded status on our postretirement medical plan (“retiree med plan”) decreased from $109.1 million at December 31, 2008 to $92.8 million at December 31, 2009. The factors influencing this decrease are as follows: (1) a $5.9 million curtailment gain due to our field and claim restructuring which reduced our obligation and unrecognized actuarial loss; and (2) additional unrecognized net actuarial gains and loss adjustments arising from demographic changes and expected to actual claims experience, which at December 31, 2009 had the effect of decreasing our obligation and unrecognized actuarial loss.
See “2009 Compared to 2008—Acquisition and Operating Expenses” included in this Item 7 for a discussion regarding the field and claim restructuring and Note 10, “Pension and Postretirement Benefit Plans” to our Consolidated Financial Statements included in Item 8 of this Form 10-K for further disclosures regarding our pension and postretirement benefit plans.
In November 2009, we announced to our employees a one-time election to select between two retirement benefit options: to either continue participation in the existing pension plan with no changes; or to choose a new “enhanced 401(k)” in which we will contribute 5% of the employee’s annual income to his/her 401(k) automatically. Under the enhanced 401(k) option, the employee’s existing accrued pension benefit would become frozen as of June 30, 2010. Employees hired on, or after January 1, 2010, will not be eligible to participate in the pension or postretirement health care benefit plans.
Deferred Income Taxes
Deferred income tax assets and liabilities represent the tax effect of the differences between the financial statement carrying value of existing assets and liabilities and their respective tax basis. Deferred tax assets are evaluated periodically by management to determine if they are realizable, requiring us to make certain judgments and assumptions. In evaluating the ability to recover deferred tax assets, we consider all available evidence, including loss carryback potential, past operating results, existence of cumulative losses in the most recent years, projected performance of the business, future taxable income, including the ability to generate capital gains, and prudent and feasible tax planning strategies. If, based on available information, it is more likely than not that the deferred income tax asset will not be realized, then a valuation allowance must be established with a corresponding charge to net income and/or accumulated comprehensive income. No valuation allowance was held by us at December 31, 2009.
Other
Other items that could have a significant impact on the financial statements include the risks and uncertainties listed in Item 1A of this Form 10-K under “Risk Factors.” Actual results could differ materially using different estimates and assumptions, or if conditions are significantly different in the future.
POOLING ARRANGEMENT
The STFC Pooled Companies and the Mutual Pooled Companies, referred to as the “Pooled Companies,” participate in a quota share reinsurance pooling arrangement referred to as the “Pooling Arrangement.” Under the Pooling Arrangement, State Auto Mutual assumes premiums, losses and expenses from each of the remaining Pooled Companies and in turn cedes to each of the Pooled Companies a specified portion of premiums, losses
39
Table of Contents
and expenses based on each of the Pooled Companies’ respective pooling percentages. State Auto Mutual then retains the balance of the pooled business. The participation percentage for the STFC Pooled Companies has remained at 80% since 2001.
Prior to 2008, the Pooling Arrangement covered all property and casualty insurance written by the Pooled Companies except State Auto Mutual’s voluntary assumed reinsurance, middle market business insurance written by State Auto Mutual and Meridian Security and intercompany catastrophe reinsurance written by State Auto P&C.
In 2008, we made the following changes to the Pooling Arrangement (the “2008 pooling changes”):
| • | Added Beacon National to the pool with a participation percentage of 0.0%; |
| • | Added Patrons Mutual and Litchfield to the pool with participation percentages of 0.4% and 0.1%, respectively; |
| • | Reduced State Auto Mutual’s participation percentage from 19.5% to 19.0% to accommodate the participation percentages allocated to Patrons Mutual and Litchfield; |
| • | Included State Auto middle market business insurance written by State Auto Mutual and Meridian Security; and |
| • | Included voluntary assumed reinsurance from parties affiliated with State Auto Mutual. |
In 2010, we made the following changes to the Pooling Arrangement (the “2010 pooling changes”):
| • | Added SA National to the pool with a participation percentage of 0.0%; and |
| • | Included voluntary assumed reinsurance from third parties unaffiliated with the Pooled Companies that was assumed on or after January 1, 2009 by State Auto Mutual. |
In conjunction with the 2010 pooling changes, the STFC Pooled Companies will receive approximately $5.1 million in cash and/or investment securities from State Auto Mutual and its subsidiaries and affiliates, for net insurance assets transferred on January 1, 2010. The following table presents the impact on our balance sheet on January 1, 2010, relating to the 2010 pooling changes:
| ($ millions) | ||||
| Losses and loss expenses payable |
$ | (4.0 | ) | |
| Unearned premiums |
(1.4 | ) | ||
| Less: |
||||
| Deferred policy acquisition costs |
(0.2 | ) | ||
| Other assets |
(10.3 | ) | ||
| Net cash and/or investment securities to be received |
$ | 5.1 | ||
40
Table of Contents
The following table sets forth a chronology of the participants and their participation percentages in the Pooling Arrangement since January 1, 2005:
| 2005 – 2007 | 2008 – 2009 | 2010 | |||||||
| STFC Pooled Companies: |
|||||||||
| State Auto P&C |
59.0 | % | 59.0 | % | 59.0 | % | |||
| Milbank |
17.0 | 17.0 | 17.0 | ||||||
| Farmers |
3.0 | 3.0 | 3.0 | ||||||
| SA Ohio |
1.0 | 1.0 | 1.0 | ||||||
| SA National |
N/A | N/A | 0.0 | ||||||
| Total STFC Pooled Companies |
80.0 | 80.0 | 80.0 | ||||||
| State Auto Mutual Pooled Companies: |
|||||||||
| State Auto Mutual |
19.5 | 19.0 | 19.0 | ||||||
| SA Wisconsin |
0.0 | 0.0 | 0.0 | ||||||
| SA Florida |
0.0 | 0.0 | 0.0 | ||||||
| Meridian Security |
0.0 | 0.0 | 0.0 | ||||||
| Meridian Citizens Mutual |
0.5 | 0.5 | 0.5 | ||||||
| Beacon National |
N/A | 0.0 | 0.0 | ||||||
| Patrons Mutual |
N/A | 0.4 | 0.4 | ||||||
| Litchfield |
N/A | 0.1 | 0.1 | ||||||
| Total State Auto Mutual Pooled Companies |
20.0 | 20.0 | 20.0 | ||||||
It is not management’s intention to recommend an adjustment to the STFC Pooled Companies’ 80% participation level in the foreseeable future. Under applicable governance procedures, if the Pooling Arrangement were to be amended, management would make recommendations to the independent committees of the Board of Directors of both State Auto Mutual and STFC. The independent committees review and evaluate such factors as they deem relevant and recommend any appropriate pooling change to the Board of Directors of both State Auto Mutual and STFC. The Pooling Arrangement is terminable by any of our Pooled Companies at any time by any party by giving twelve months notice to the other parties and their respective domiciliary insurance departments. None of our Pooled Companies currently intends to terminate the Pooling Arrangement.
Under the terms of the Pooling Arrangement, all subject premiums, incurred losses, loss expenses and other underwriting expenses are prorated among our Pooled Companies on the basis of their participation in the pool. By spreading the underwriting risk the Pooling Arrangement is designed to produce more uniform and stable underwriting results for each of our Pooled Companies than any one company would experience individually. This has the effect of providing each of our Pooled Companies with a similar mix of pooled property and casualty insurance business on a net basis.
Prior to July 1, 2008, the Pooling Arrangement excluded catastrophic losses and loss adjustment expenses that were reinsured under our Catastrophe Assumption Agreement (defined below), as well as the premium for such exposures. State Auto P&C reinsured each insurer in the State Auto Group for this layer of reinsurance in the amount of $100.0 million in excess of $135.0 million. No losses were paid by State Auto P&C under the Catastrophe Assumption Agreement in 2008 or 2007. The State Auto Group did not renew the Catastrophe Assumption Agreement upon its expiration on July 1, 2008.
41
Table of Contents
RESULTS OF OPERATIONS
Summary
The following table summarizes certain key performance indicators used to manage our operations for the years ended December 31, 2009, 2008 and 2007, respectively:
| ($ millions, except per share data) | 2009 | 2008 | 2007 | |||||||
| GAAP Basis: |
||||||||||
| Total revenues |
$ | 1,256.9 | 1,181.9 | 1,113.4 | ||||||
| Net income (loss) |
$ | 10.2 | (31.1 | ) | 119.1 | |||||
| Stockholders’ equity |
$ | 849.4 | 761.0 | 935.5 | ||||||
| Book value per share |
$ | 21.33 | 19.23 | 23.10 | ||||||
| Return on average equity(2) |
1.3 | (3.7 | ) | 13.5 | ||||||
| Debt to capital ratio |
12.1 | 13.4 | 11.2 | |||||||
| Loss and LAE ratio(1) |
71.7 | 75.2 | 58.4 | |||||||
| Expense ratio(1) |
34.1 | 34.6 | 34.4 | |||||||
| Combined ratio |
105.8 | 109.8 | 92.8 | |||||||
| Catastrophe Loss and LAE points(1) |
7.7 | % | 13.9 | 3.7 | ||||||
| Premium written growth(3) |
5.1 | % | 18.2 | 0.0 | ||||||
| Premium earned growth |
4.5 | % | 11.3 | (1.2 | ) | |||||
| Investment yield |
3.9 | % | 4.1 | 4.3 | ||||||
| SAP Basis: |
||||||||||
| Loss and LAE ratio(4) |
71.3 | 74.8 | 57.9 | |||||||
| Expense ratio(4) |
33.5 | 33.1 | 33.2 | |||||||
| Combined ratio(4) |
104.8 | 107.9 | 91.1 | |||||||
| Net premiums written to surplus(5) |
1.5 | 1.6 | 1.1 | |||||||
| (1) | See “2009 Compared to 2008” section below for definitions. |
| (2) | Net income (loss) divided by average common stockholders’ equity. |
| (3) | 5.3 points of the increase for 2008 is related to the one-time $53.6 million transfer of unearned premium to us on January 1, 2008, in conjunction with the 2008 pooling changes. |
| (4) | The “SAP Loss and LAE ratio” is losses and loss expenses as a percentage of net earned premiums. The “SAP expense ratio” is statutory underwriting expenses and miscellaneous expenses offset by miscellaneous income (“underwriting expenses”) as a percentage of net written premiums. The “SAP combined ratio” is the sum of the SAP Loss and LAE ratio and the SAP expense ratio. |
| (5) | We use the statutory net premiums written to surplus ratio because there is no comparable GAAP measure. This ratio, also called the leverage ratio, measures our statutory surplus available to absorb losses. |
2009 Compared to 2008
For 2009, we reported a pre-tax loss of $12.8 million compared to a pre-tax loss of $75.1 million for 2008. Revenues increased to $1,256.9 million in 2009 from $1,181.9 million in 2008 while expenses increased to $1,269.7 million in 2009 from $1,257.0 million in 2008. The following are significant factors that impacted 2009 results compared to 2008:
| • | Earned premiums in 2009 were $1,176.5 million compared to $1,126.0 million in 2008. This growth was driven by personal lines. |
| • | During 2009, we recognized $9.0 million of OTTI on our investment portfolio compared to $39.3 million in 2008. See the “Investment Operations Segment” section included in this Item 7. |
| • | Catastrophe losses for 2009 were $90.3 million or 7.7 loss ratio points compared to $156.1 million or 13.9 loss ratio points for the same 2008 period. In 2008 Hurricane Ike delivered tropical storm force |
42
Table of Contents
| winds to Texas and three of our largest states—Ohio, Kentucky and Indiana, accounting for $44.1 million of catastrophe losses or 3.9 loss ratio points. See the “Loss and LAE” section included in this Item 7. |
| • | Our non-catastrophe losses for 2009 were $753.0 million, or 64.0 loss ratio points, compared to $690.6 million, or 61.3 loss ratio points, for the same 2008 period. Several lines of business contributed to this increase. See the “Loss and LAE” section included in this Item 7. |
Insurance Segments
Insurance industry regulators require our insurance subsidiaries to report their financial condition and results of operations using SAP. We use SAP financial results, along with industry standard financial measures determined on a SAP basis and certain measures determined on a GAAP basis, to internally monitor the performance of our insurance segments and reward our employees. The more common financial measures used are Loss and LAE ratio, underwriting expense ratio, combined ratio, net premiums written and net premiums earned. The combined ratio is the sum of the Loss and LAE ratio and the underwriting expense ratio. When the combined ratio is less than 100%, the insurer is operating at an underwriting gain and when it is greater than 100%, the insurer is operating at an underwriting loss. Underwriting gain (loss) is determined by subtracting from net earned premiums, losses and loss expenses and underwriting expenses.
One of the more significant differences between GAAP and SAP is that SAP requires all underwriting expenses to be expensed immediately and not deferred over the same period that the premium is earned. In converting SAP underwriting results to GAAP underwriting results, acquisition costs are deferred and amortized over the periods the related written premiums are earned. For a discussion of deferred policy acquisition costs, see “Critical Accounting Policies—Deferred Acquisition Costs” section included in this Item 7. The “GAAP combined ratio” is defined as the sum of the “GAAP Loss and LAE ratio” (loss and loss expenses as a percentage of earned premiums) plus “GAAP expense ratio” (acquisition and operating expenses as a percentage of earned premiums).
Charges related to the restructuring of our field and claims operations, as well as those recorded due to the North Carolina Beach Plan write-off, contributed to the difference between our GAAP expense ratio and our SAP expense ratio. The restructuring differences relate mainly to the timing of the recognition of employee termination benefits. SAP requires us to estimate and immediately recognize the entire estimated costs related to severance, while GAAP requires similar estimated costs to be recognized ratably over the remaining service period of the employees impacted. The write-off related to the North Carolina Beach Plan was included in the other expense line item in the accompanying consolidated statements of income, and was therefore not included in the computation of the GAAP expense ratio.
43
Table of Contents
All references to financial measures or components thereof in this discussion are calculated on a GAAP basis, unless otherwise noted. The following tables provide a summary of our insurance segments’ SAP underwriting loss and SAP combined ratio for the years ended December 31, 2009 and 2008:
| ($ millions) | 2009 | |||||||||||||||||
| Personal | % Ratio |
Business | % Ratio |
Total | % Ratio | |||||||||||||
| Written premiums |
$ | 775.1 | $ | 435.3 | $ | 1,210.4 | ||||||||||||
| Earned premiums |
732.8 | 443.7 | 1,176.5 | |||||||||||||||
| Losses and loss expenses |
554.8 | 75.7 | 283.7 | 64.0 | 838.5 | 71.3 | ||||||||||||
| Underwriting expenses |
237.5 | 30.6 | 168.4 | 38.7 | 405.9 | 33.5 | ||||||||||||
| SAP underwriting loss and SAP combined ratio |
$ | (59.5 | ) | 106.3 | $ | (8.4 | ) | 102.7 | $ | (67.9 | ) | 104.8 | ||||||
| ($ millions) | 2008 | |||||||||||||||||
| Personal | % Ratio |
Business | % Ratio |
Total | % Ratio | |||||||||||||
| Written premiums(1) |
$ | 715.6 | $ | 489.3 | $ | 1,204.9 | ||||||||||||
| Earned premiums |
670.9 | 455.1 | 1,126.0 | |||||||||||||||
| Losses and loss expenses |
520.3 | 77.6 | 322.1 | 70.8 | 842.4 | 74.8 | ||||||||||||
| Underwriting expenses |
206.8 | 28.9 | 191.5 | 39.1 | 398.3 | 33.1 | ||||||||||||
| SAP underwriting loss and SAP combined ratio |
$ | (56.2 | ) | 106.5 | $ | (58.5 | ) | 109.9 | $ | (114.7 | ) | 107.9 | ||||||
| (1) | Includes the one-time transfer of $53.6 million of unearned premium to us on January 1, 2008, in conjunction with the 2008 pooling changes ($24.8 million for our personal insurance segment and $28.8 million for our business insurance segment). |
Revenue
We measure our top-line growth for our insurance segments based on net written premiums, which represent the premiums on the policies we have issued for a period, net of reinsurance. Net written premiums provide us with an indication of how well we are doing in terms of revenue growth before it is actually earned. Our policies provide a fixed amount of coverage for a stated period of time, often referred to as “the policy term.” As such, our written premiums are recognized as earned ratably over the policy term. The unearned portion of written premiums, called unearned premiums, is reflected on our balance sheet as a liability and represents our obligation to provide coverage for the unexpired terms of the policy.
44
Table of Contents
The following table shows the reconciliation of the one-time impact on net written premiums for the year ended December 31, 2008, of the unearned premiums transferred to us on January 1, 2008, in conjunction with the 2008 pooling changes.
| ($ millions) | Net Written Premiums Reconciliation Table | ||||||||
| Including Pooling Change |
Pooling Change Impact |
Excluding Pooling Change | |||||||
| Personal insurance segment: |
|||||||||
| Standard auto |
$ | 406.7 | $ | 7.9 | $ | 398.8 | |||
| Nonstandard auto |
42.2 | — | 42.2 | ||||||
| Homeowners |
234.2 | 14.4 | 219.8 | ||||||
| Other personal |
32.5 | 2.5 | 30.0 | ||||||
| Total personal |
715.6 | 24.8 | 690.8 | ||||||
| Business insurance segment: |
|||||||||
| Commercial auto |
120.0 | 10.0 | 110.0 | ||||||
| Commercial multi-peril |
105.1 | 6.1 | 99.0 | ||||||
| Fire & allied lines |
102.5 | 5.7 | 96.8 | ||||||
| Other & product liability |
84.4 | 3.9 | 80.5 | ||||||
| Workers’ compensation |
47.5 | 2.0 | 45.5 | ||||||
| Other commercial |
29.8 | 1.1 | 28.7 | ||||||
| Total business |
489.3 | 28.8 | 460.5 | ||||||
| Total personal & business |
$ | 1,204.9 | $ | 53.6 | $ | 1,151.3 | |||
Personal Insurance Segment Revenue
Our personal insurance segment consists primarily of auto (standard and nonstandard) and homeowners’ products, with personal auto representing 41% and 38% of our total consolidated net written premium in 2009 and 2008, respectively. Our strategy to grow our personal lines business includes introducing new products, enhanced systems and easier-to-use technologies into all states. Since 2008, we have introduced personal lines products into four new states.
During 2009, we continued to enhance our personal lines point of sale portal, netXpress. The additional integration with the systems commonly used by our independent agents has resulted in an increase in the number of quotes for personal auto and homeowners. In 2009, the State Auto Group received over 1.3 million personal lines quotes through comparative raters, bridging solutions and our own proprietary rating system. This compares favorably to less than 1.0 million quotes received in 2008.
45
Table of Contents
The following table provides a summary of written and earned premium, net of reinsurance, by major product line of business for our personal insurance segment for the years ended December 31, 2009 and 2008. The one-time impact of the 2008 pooling changes has been excluded from 2008 to present net written premiums on a comparative basis (see Net Written Premium Reconciliation Table above):
| ($ millions) | 2009 | 2008 | % Change |
||||||
| Personal Insurance Segment: |
|||||||||
| Net Written Premium |
|||||||||
| Standard auto |
$ | 460.4 | $ | 398.8 | 15.4 | ||||
| Nonstandard auto |
37.7 | 42.2 | (10.7 | ) | |||||
| Homeowners |
245.2 | 219.8 | 11.6 | ||||||
| Other personal |
31.8 | 30.0 | 6.0 | ||||||
| Total personal |
$ | 775.1 | $ | 690.8 | 12.2 | ||||
| Net Earned Premium |
|||||||||
| Standard auto |
$ | 433.2 | $ | 384.3 | 12.7 | ||||
| Nonstandard auto |
38.7 | 42.6 | (9.2 | ) | |||||
| Homeowners |
230.0 | 215.4 | 6.8 | ||||||
| Other personal |
30.9 | 28.6 | 8.0 | ||||||
| Total personal |
$ | 732.8 | $ | 670.9 | 9.2 | ||||
Standard personal auto net written premiums for the year ended December 31, 2009 increased 15.4% from 2008. The State Auto Group’s expansion of its operations within four of our newer states, Texas, Colorado, Arizona and Connecticut, has contributed approximately 5% to our premium growth in standard personal auto. Recent rate increases have also contributed to premium growth in 2009. We believe our new products and advanced technology have strengthened our position with our independent agencies and make us attractive to prospective policyholders looking for greater value in their insurance products. Our auto product, CustomFitSM, coupled with easier quote capabilities, has resulted in a significant increase in new business quotes in 2009. While the number of new business quotes is higher, our issue to quote ratio has remained relatively consistent with prior years.
We believe independent agents value ease of doing business and make it an important factor in their choice of insurance companies when quoting personal auto products to their customers. In early 2007, we began implementing comparative rating tools which allow agents to receive rate quotes from multiple insurance companies by entering the rating information only one time. To date, we have implemented over 200 different integration points to our personal lines rating engine thus eliminating duplicate entry for agents. We believe agents will quote and write more personal standard and nonstandard auto and homeowners insurance with us as a result of a more efficient quoting process combined with more competitive rates resulting from our new auto product, CustomFit, for standard auto and refined pricing for nonstandard auto.
Nonstandard auto net written premium for the year ended December 31, 2009, decreased 10.7% from 2008. In 2008, we began increasing rates and tightening underwriting controls, and in 2009, we continued increasing rates and began terminating certain agencies that failed to consistently perform to our expectations. These actions coupled with the impact of general economic conditions have resulted in a reduction of nonstandard new business.
Homeowners net written premiums for the year ended December 31, 2009, increased 11.6% from 2008. Approximately one-third of this premium growth was from rate increases, one-third was due to the expansion of new business in Texas, Colorado, Arizona and Connecticut; and the remaining one-third was due to expansion in our other states. We continue to aggressively address our rate needs in this line of business, and we are seeking higher rates in 2010.
46
Table of Contents
Business Insurance Segment Revenue
We focus our business insurance sales on small to medium sized exposures and offer a broad range of both property and liability coverages. The following table provides a summary of written and earned premium, net of reinsurance, by major product line of business for our business insurance segment for the years ended December 31, 2009 and 2008. The one-time impact of the 2008 pooling changes has been excluded from 2008 to present net written premiums on a comparative basis (see Net Written Premiums Reconciliation Table above):
| ($ millions) | 2009 | 2008 | % Change |
||||||
| Business Insurance Segment: |
|||||||||
| Net Written Premium |
|||||||||
| Commercial auto |
$ | 100.3 | $ | 110.0 | (8.8 | ) | |||
| Commercial multi-peril |
94.5 | 99.0 | (4.5 | ) | |||||
| Fire & allied lines |
99.3 | 96.8 | 2.6 | ||||||
| Other & product liability |
72.4 | 80.5 | (10.1 | ) | |||||
| Workers’ compensation |
43.3 | 45.5 | (4.8 | ) | |||||
| Other commercial |
25.5 | 28.7 | (11.1 | ) | |||||
| Total business |
$ | 435.3 | $ | 460.5 | (5.5 | ) | |||
| Net Earned Premium |
|||||||||
| Commercial auto |
$ | 106.2 | $ | 110.5 | (3.9 | ) | |||
| Commercial multi-peril |
95.2 | 97.9 | (2.8 | ) | |||||
| Fire & allied lines |
97.6 | 94.7 | 3.1 | ||||||
| Other & product liability |
74.8 | 79.9 | (6.4 | ) | |||||
| Workers’ compensation |
43.2 | 43.4 | (0.5 | ) | |||||
| Other commercial |
26.7 | 28.7 | (7.0 | ) | |||||
| Total business |
$ | 443.7 | $ | 455.1 | (2.5 | ) | |||
The business insurance segment net written premium decreased 5.5% for the year ended December 31, 2009, from 2008. Business insurance continues to be impacted by rate competition and general economic conditions, as well as ease of doing business issues. Despite these factors, we strengthened our premium per exposure in the second half of 2009 by re-evaluating and adjusting the application of debits and credits on our renewal policies. We believe it will be difficult to generate measurable growth given the impact of the economy on premium bases such as payrolls, sales and number of vehicles. However, we are seeking to balance our traditional underwriting discipline with new products and pricing tools that support the production of profitable new business.
We continue to invest in products, processes and systems that we believe will increase our business insurance writings. For our property and liability business, we have implemented a pricing process that we believe will help us price risks at appropriate levels and improve account retention; we are pursuing the same for our commercial auto and workers’ compensation lines of business. In addition, we have broadened our property, liability, auto and workers’ compensation pricing ranges to improve our ability to recognize the spectrum of risks within our markets.
We continue to enhance our insurance policy administration system to make it easier for our agents to quote and submit business insurance policies to us. Our system now allows transactions to be processed throughout the day using real-time and straight-through processing rather than in large batch cycles at night. We have leveraged this functionality with bizXpressSM., our web-based quote system, to give agents the ability to quote businessowners and commercial auto risks on-line.
47
Table of Contents
We are working to expand the scope of bizXpress to add new products and lines of business, including workers’ compensation. We believe this technology investment should better position us for revenue growth opportunities in the future and start to drive efficiencies into our business model much like we have seen in personal insurance. The majority of all transactions in business insurance utilize the straight-through processing technology. This has resulted in faster delivery of policies to our agents and their insureds for new business and endorsements.
We are also expanding the eligibility of our businessowners product to facilitate businesses with greater liability exposures, such as artisan contractors, auto service garages, manufacturers and restaurants. While we regularly insure these types of businesses through other insurance products, offering them in our businessowners program leverages our bizXpress technology, simplifies agents’ rating and submission processes, and offers broader base coverages for these types of risks. In late 2009, we implemented our enhanced businessowners product in Utah and plan to introduce this product enhancement to other states within the first six months of 2010.
Similar to our personal lines segment, we are expanding our product offerings in our newer states of operations. We are leveraging our relationship with the agency distribution channel as a result of State Auto Mutual’s affiliation with the Patrons Insurance Group. We introduced our commercial package, auto and workers’ compensation products in Connecticut in the first quarter of 2009. In the second quarter 2009, we made these products available for risks with District of Columbia and Delaware locations.
Loss and LAE
Our GAAP Loss and LAE ratio was 71.7% in 2009 compared to 75.2% in 2008. The decrease in the GAAP Loss and LAE ratio was due to a reduction in catastrophe storm losses offset partially by an increase in non-catastrophe losses. Our catastrophe losses, which primarily impacted our property lines of business, accounted for 7.7 points of the Loss and LAE ratio in 2009 compared to 13.9 points in 2008. Our non-catastrophe Loss and LAE ratio was 64.0% in 2009 compared to 61.3% in 2008. The increase in our non-catastrophe Loss and LAE ratio was driven mostly by personal lines auto and homeowners business.
Losses and loss expenses for a calendar year represent the combined estimated ultimate liability for claims occurring in the current calendar year along with any change in estimated ultimate liability for claims occurring in prior years. The following table presents the provision for losses and loss expenses for those claims occurring in 2009 and prior years, along with the GAAP Loss and LAE ratio for the years 2009 and 2008, respectively:
| ($ millions) | 2009 | % GAAP Loss and LAE |
2008 | % GAAP Loss and LAE |
||||||||||
| Provision for losses and loss expenses occurring: |
||||||||||||||
| Current year |
$ | 899.5 | 76.5 | $ | 874.0 | 77.6 | ||||||||
| Prior years |
(56.2 | ) | (4.8 | ) | (27.3 | ) | (2.4 | ) | ||||||
| Total losses and loss expenses |
$ | 843.3 | 71.7 | $ | 846.7 | 75.2 | ||||||||
48
Table of Contents
As shown above, the 2009 loss and loss expenses attributable to prior years totaled $(56.2) million. This corresponded to a decrease, or favorable development, in the estimated ultimate liability for prior years’ claims. A tabular presentation of the favorable development in 2009 by accident year is shown below.
| ($ millions)
Accident Year |
Current Year Development of Ultimate Liability |
|||
| Redundancy / (Deficiency) | ||||
| 1999 and prior |
$ | 0.8 | ||
| 2000 |
(1.0 | ) | ||
| 2001 |
(1.1 | ) | ||
| 2002 |
0.6 | |||
| 2003 |
1.4 | |||
| 2004 |
3.6 | |||
| 2005 |
(1.6 | ) | ||
| 2006 |
8.0 | |||
| 2007 |
3.1 | |||
| 2008 |
42.4 | |||
| Total |
$ | 56.2 | ||
Emergence by accident year includes normal fluctuations due to the uncertainty associated with loss reserve development and claim settlement. The favorable development in 2009 came primarily from accident year 2008. The more notable items contributing to the 2009 favorable development were:
| • | Unallocated loss adjustment expenses (“ULAE”) were $10.9 million lower than anticipated in the reserves at December 31, 2008, with approximately 75% being attributable to the 2008 accident year. ULAE are those expenses or costs incurred in settling claims, such as in-house processing costs, which cannot be associated with a specific claim. |
| • | Favorable catastrophe loss development of $10.9 million was primarily associated with the 2008 accident year. This development occurred primarily within our homeowners, fire & allied and commercial multi-peril lines of business. |
| • | Non-catastrophe reserves for the auto liability lines and other & product liability developed lower than anticipated. Standard, nonstandard and commercial auto liability reserves developed $9.5 million lower and other & product liability developed $8.3 million lower than anticipated. This favorable development, which was primarily associated with the 2008 accident year, was driven by lower than anticipated tabular loss severity, as well as lower than anticipated loss frequency for other & product liability. |
See discussion regarding the 2008 calendar year development at “2008 Compared to 2007—Loss and LAE” section included in this Item 7. See additional discussion regarding loss and loss expense reserves at the “Critical Accounting Policies—Losses and Loss Expenses Payable” section included in this Item 7.
Catastrophe losses for 2009 totaled $90.3 million (7.7 loss ratio points) compared to $156.1 million (13.9 loss ratio points) for 2008. Our losses include those which have been designated as such by ISO’s Property Claim Services (“PCS”) unit, a nationally recognized industry service. PCS defines catastrophes as events resulting in $25.0 million or more in insured losses industry wide and affecting significant numbers of insureds and insurers. During 2009, we were impacted by losses from 27 of the 28 storms that were classified as numbered catastrophes by PCS as compared to 35 of the 37 PCS classified storms in 2008, one of which was Hurricane Ike. The losses from these catastrophes have had a significant impact on both our personal and business insurance property lines.
49
Table of Contents
As of January 1, 2009, members of the State Auto Group entered into a property catastrophe net aggregate excess of loss reinsurance agreement (“Catastrophe Aggregate Agreement”). Events covered by the Catastrophe Aggregate Agreement must be PCS numbered catastrophes, excluding earthquakes and named storms such as hurricanes and tropical storms. Individual occurrences are capped at $55.0 million and are subject to a $5.0 million franchise deductible. Subject to these limitations, qualifying losses from individual occurrences are then aggregated over the course of the reinsurance term, January 1, 2009 through December 31, 2009. On an aggregate basis, the members of the State Auto Group retain the first $80.0 million of the covered losses, with a 25% co-participation with the reinsurer on the next $30.0 million of covered loss. The reinsurer is responsible for 75% of the excess over $80.0 million up to $110.0 million of covered loss on an aggregate basis. We experienced six catastrophes during 2009 that met the minimum $5.0 million requirement and in aggregate exceeded the State Auto Group’s $80.0 million retention level. STFC’s share of recoveries under the Catastrophe Aggregate Agreement for the year ended December 31, 2009, was $8.2 million, benefitting our loss ratio by 0.7 points.
The following tables provide our insurance segments’ SAP Loss and LAE ratios (“loss ratios”) by major lines of business for 2009 and 2008 with the catastrophe (“cat”) and non-catastrophe (“non-cat”) impact shown separately:
| ($ millions)
2009 Statutory Loss and LAE Ratios |
Earned Premium |
Cat Loss & LAE |
Non-Cat Loss & LAE |
Statutory Loss & |
Cat Ratio |
Non-Cat Ratio |
Total Loss Ratio | |||||||||||
| Personal insurance segment: |
||||||||||||||||||
| Standard auto |
$ | 433.2 | $ | 4.5 | $ | 297.8 | $ | 302.3 | 1.0 | 68.8 | 69.8 | |||||||
| Nonstandard auto |
38.7 | 0.3 | 29.1 | 29.4 | 0.5 | 75.3 | 75.8 | |||||||||||
| Homeowners |
230.0 | 64.9 | 144.9 | 209.8 | 28.3 | 62.9 | 91.2 | |||||||||||
| Other personal |
30.9 | 2.6 | 10.7 | 13.3 | 8.1 | 34.8 | 42.9 | |||||||||||
| Total personal |
732.8 | 72.3 | 482.5 | 554.8 | 9.9 | 65.8 | 75.7 | |||||||||||
| Business insurance segment: |
||||||||||||||||||
| Commercial auto |
106.2 | 0.5 | 59.2 | 59.7 | 0.5 | 55.6 | 56.1 | |||||||||||
| Commercial multi-peril |
95.2 | 5.1 | 51.3 | 56.4 | 5.4 | 53.9 | 59.3 | |||||||||||
| Fire & allied lines |
97.6 | 12.2 | 58.3 | 70.5 | 12.5 | 59.7 | 72.2 | |||||||||||
| Other & product liability |
74.8 | — | 52.4 | 52.4 | — | 70.1 | 70.1 | |||||||||||
| Workers’ compensation |
43.2 | — | 34.6 | 34.6 | — | 80.1 | 80.1 | |||||||||||
| Other commercial |
26.7 | 0.2 | 9.9 | 10.1 | 0.5 | 37.9 | 38.4 | |||||||||||
| Total business |
443.7 | 18.0 | 265.7 | 283.7 | 4.1 | 59.9 | 64.0 | |||||||||||
| Total SAP personal and business |
$ | 1,176.5 | $ | 90.3 | $ | 748.2 | $ | 838.5 | 7.7 | 63.6 | 71.3 | |||||||
50
Table of Contents
| ($ millions)
2008 Statutory Loss and LAE Ratios |
Earned Premium |
Cat Loss & LAE |
Non-Cat Loss & LAE |
Statutory Loss & |
Cat Ratio |
Non-Cat Ratio |
Total Loss Ratio | |||||||||||
| Personal insurance segment: |
||||||||||||||||||
| Standard auto |
$ | 384.3 | $ | 8.2 | $ | 254.4 | $ | 262.6 | 2.1 | 66.2 | 68.3 | |||||||
| Nonstandard auto |
42.6 | 0.3 | 31.5 | 31.8 | 0.7 | 74.0 | 74.7 | |||||||||||
| Homeowners |
215.4 | 91.5 | 113.0 | 204.5 | 42.5 | 52.5 | 95.0 | |||||||||||
| Other personal |
28.6 | 5.8 | 15.6 | 21.4 | 20.6 | 54.1 | 74.7 | |||||||||||
| Total personal |
670.9 | 105.8 | 414.5 | 520.3 | 15.8 | 61.7 | 77.5 | |||||||||||
| Business insurance segment: |
||||||||||||||||||
| Commercial auto |
110.5 | 0.8 | 67.6 | 68.4 | 0.7 | 61.2 | 61.9 | |||||||||||
| Commercial multi-peril |
97.9 | 16.5 | 56.5 | 73.0 | 16.8 | 57.8 | 74.6 | |||||||||||
| Fire & allied lines |
94.7 | 32.0 | 52.7 | 84.7 | 33.8 | 55.7 | 89.5 | |||||||||||
| Other & product liability |
79.9 | — | 51.6 | 51.6 | — | 64.6 | 64.6 | |||||||||||
| Workers’ compensation |
43.4 | — | 35.0 | 35.0 | — | 80.7 | 80.7 | |||||||||||
| Other commercial |
28.7 | 1.0 | 8.4 | 9.4 | 3.4 | 29.3 | 32.7 | |||||||||||
| Total business |
455.1 | 50.3 | 271.8 | 322.1 | 11.0 | 59.8 | 70.8 | |||||||||||
| Total SAP personal and business |
$ | 1,126.0 | $ | 156.1 | $ | 686.3 | $ | 842.4 | 13.9 | 60.9 | 74.8 | |||||||
The personal insurance segment non-cat loss ratio was 4.1 points higher in 2009 than in 2008. Standard auto’s non-cat loss ratio increase was driven by an increase in frequency of physical damage, comprehensive and collision coverage claims, while the nonstandard auto increase was caused by a rise in the overall severity of claims. Previously, the intense price competition in the personal lines market had impeded our ability to take appropriate rate increases. However, we believe price competition in the personal lines market is becoming less intense, which has allowed us to recently implement rate increases, contributing some to our 2009 growth. We intend to continue to seek price increases in the mid single-digit range in 2010. The increase in the non-cat homeowners loss ratio was due primarily to experiencing more large fire losses and settling one threatened class action claim. Settlement of the one class action claim increased the 2009 non-cat homeowners loss ratio by 3.2 points. We continue to seek homeowners rate increases in various states as appropriate for that state. However, there is no assurance that the regulatory authorities will grant our requested rate increases. In addition to pricing actions and the Aggregate Treaty implemented earlier this year, we have implemented mandatory wind and hail deductibles in approximately one-third of our operating states and are in the process of strengthening our insurance-to-value program. In addition, we introduced our new homeowner by-peril rated product in the fourth quarter of 2009 and we will continue state by state deployment of this product throughout 2010 and 2011.
In total, the business insurance segment’s non-cat loss ratio for 2009 was comparable to 2008. However, commercial auto and commercial multi-peril loss ratios decreased primarily due to a reduction in the number and size of large losses when compared to 2008. The increase in the fire & allied lines loss ratio was the result of more large fires in 2009. The increase in other & product liability was due primarily to an increase in the estimate of internal claim handling expenses. Intense competition in the business insurance segment continues to impact our ability to implement price increases where needed.
51
Table of Contents
Loss and loss expenses payable by major line of business as of December 31, 2009 and 2008, respectively, are shown in the following table:
| ($ millions) | December 31, 2009 |
December 31, 2008 |
$ Change |
||||||
| Personal insurance segment: |
|||||||||
| Standard auto |
$ | 216.3 | $ | 188.5 | 27.8 | ||||
| Nonstandard auto |
20.2 | 19.6 | 0.6 | ||||||
| Homeowners |
75.7 | 68.6 | 7.1 | ||||||
| Other personal |
13.4 | 14.6 | (1.2 | ) | |||||
| Total personal |
325.6 | 291.3 | 34.3 | ||||||
| Business insurance segment: |
|||||||||
| Commercial auto |
93.7 | 93.5 | 0.2 | ||||||
| Commercial multi-peril |
89.3 | 91.5 | (2.2 | ) | |||||
| Fire & allied lines |
33.8 | 38.6 | (4.8 | ) | |||||
| Other & product liability |
167.1 | 152.3 | 14.8 | ||||||
| Workers’ compensation |
103.8 | 97.1 | 6.7 | ||||||
| Other business |
6.1 | 5.7 | 0.4 | ||||||
| Total business |
493.8 | 478.7 | 15.1 | ||||||
| Total losses and loss expenses payable, net of reinsurance recoverable on losses and loss expenses payable |
$ | 819.4 | $ | 770.0 | 49.4 | ||||
As shown in the table above, there was a $49.4 million increase in total loss and loss expense reserves during 2009. The increase, driven by the personal insurance segment, was primarily due to growth in exposures in our standard auto and homeowners business. We conduct quarterly reviews of loss development reports and make judgments in determining the reserves for ultimate losses and loss expenses payable. Several factors are considered by us when estimating ultimate liabilities including consistency in relative case reserve adequacy, consistency in claims settlement practices, recent legal developments, historical data, actuarial projections, accounting projections, exposure changes, anticipated inflation, current business conditions, catastrophe developments, late reported claims, and other reasonableness tests.
The risks and uncertainties inherent in our estimates include, but are not limited to, actual settlement experience different from historical data, trends, changes in business and economic conditions, court decisions creating unanticipated liabilities, ongoing interpretation of policy provisions by the courts, inconsistent decisions in lawsuits regarding coverage and additional information discovered before settlement of claims. Our results of operations and financial condition could be impacted, perhaps significantly, in the future if the ultimate payments required to settle claims vary from the liability currently recorded.
Acquisition and Operating Expenses
Our GAAP expense ratio was 34.1% in 2009 compared to 34.6% in 2008. The decrease in the expense ratio can be attributed principally to expenses being applied to a larger premium base in 2009 as compared to 2008, and the inclusion of costs associated with launching our ISA initiative in 2008.
As a result of Innovate SA, in the second quarter of 2009, we initiated a plan to reorganize our field and claims operations. We anticipate that reorganizing our field and claims operations will allow us to improve service, streamline workflows and better deploy new technology solutions. Under our reorganization plan, the existing field regions will be merged into five new regions, each with a regional headquarters, which we believe will allow us to be more responsive to our agents. Each region will support personal insurance sales and business
52
Table of Contents
insurance sales, underwriting, processing and administrative functions. Personal insurance underwriting, processing and administrative functions will be consolidated into two operation centers.
As part of the reorganization of our claims operations, we will expand our dedicated catastrophe team to address both the urgency and special needs of catastrophe claim handling. Many large property losses, which have been generally sent out to independent adjusters, will be handled in-house by large property specialist adjusters strategically placed throughout our operating states. New contact center property claim teams will be organized with redefined responsibilities including adjusting contents claims for larger fire losses and supporting the dedicated catastrophe team. In addition, we expect to hire additional automobile and property appraisers to rely less on outside property and auto appraisers. We believe this will allow us to take advantage of current technology by having many of our property and auto appraisers work from their homes, providing better access to policyholders. Casualty claims will continue to be handled in-house in fewer, larger units. We believe that having more people in fewer locations will allow us to better train new casualty claim handlers, staff more flexibly, and provide closer supervision on longer tail, third party claims.
Total restructuring charges, including employee termination benefits, benefit plan curtailment impact, relocation packages, and costs associated with ceasing to use leased properties, are estimated to be approximately $6.5 million through the fourth quarter 2010, the expected completion date for the reorganization. We recognized restructuring costs totaling $4.8 million during the year ended December 31, 2009, which increased our GAAP Loss and LAE and expense ratios 0.2 points each. See Note 9, “Restructuring Costs” to our Consolidated Financial Statements included in Item 8 of this Form 10-K.
Investment Operations Segment
Our investment portfolio and the investment portfolios of other members of the State Auto Group are managed by our subsidiary, Stateco. Stateco utilizes outside investment managers to invest in small-cap equities and international funds. The Investment Committee (the “Committee”) of the Board of Directors establishes the investment policies to be followed by Stateco. Our primary investment objectives are to generate income, preserve capital and maintain adequate liquidity for the payment of claims and expenses. Our current investment strategy does not rely on the use of derivative financial instruments.
Our decision to make a specific investment is influenced primarily by the following factors: (a) investment risks; (b) general market conditions; (c) relative valuations of investment vehicles; (d) general market interest rates; (e) our liquidity requirements at any given time; and (f) our current federal income tax position and relative spread between after tax yields on tax-exempt and taxable fixed maturity investments.
We have investment policy guidelines with respect to purchasing fixed maturity investments for our insurance subsidiaries which preclude investments in bonds that are rated below investment grade by a recognized rating service. For the insurance subsidiaries, the maximum investment in any single note or bond is limited to 5.0% or less of statutory assets, other than obligations of the U.S. government or government agencies, for which there is no limit. Our fixed maturity portfolio is composed of high quality, investment grade issues, comprised almost entirely of debt issues rated AAA or AA. At December 31, 2009, there were no fixed maturity investments rated below investment grade in our available-for-sale investment portfolio. At December 31, 2009 and 2008, our only investments in asset-backed securities were in federal agency pools (Fannie Mae and Freddie Mac) and government guaranteed pools (Ginnie Mae).
Our internally managed equity portfolio invests in U.S. large-cap, dividend-paying companies across many different industries selected based upon their potential for appreciation as well as ability to continue paying dividends. This diversification across companies and industries reduces volatility in the value of the large-cap equity portfolio. In addition, our investment policy guidelines limit the purchase of a specific stock to no more than 2% of the market value of the stock at the time of purchase, and no single equity holding should exceed 5% of the total equity portfolio.
53
Table of Contents
Our externally managed equity portfolios invest in U.S. small-cap equities and international funds. These managers are permitted to manage the portfolios according to their own respective portfolio objectives. In selecting our outside investment managers we confirm that their portfolio objectives, including risk tolerance, are acceptable to us. However, there may be slight differences in their objectives with respect to dividend payments and other constraints that we apply to our large-cap equity holdings.
Diversifying our portfolio into small-cap equities and international equity funds was designed to achieve a greater total return with reduced volatility. We believe that in most market cycles, diversification of the portfolio will be beneficial to us, and we plan to continue to maintain a diversified portfolio.
At December 31, 2009, our investments in fixed maturities, equity securities and certain other invested assets were held as available-for-sale and carried at fair value. The unrealized holding gains or losses, net of applicable deferred taxes, are included as a separate component of stockholders’ equity as accumulated other comprehensive loss and as such are not included in the determination of net income (loss).
Composition of Investment Portfolio
The following table provides the composition of our investment portfolio at carrying value at December 31:
| ($ millions) | December 31, 2009 |
% of Total |
December 31, 2008 |
% of Total | ||||||
| Cash and cash equivalents |
$ | 90.3 | 4.0 | $ | 150.5 | 7.2 | ||||
| Fixed maturities, at fair value: |
||||||||||
| Fixed maturities |
1,691.8 | 74.5 | 1,694.9 | 81.0 | ||||||
| Treasury inflation protected securities |
140.0 | 6.2 | 75.8 | 3.7 | ||||||
| Total fixed maturities |
1,831.8 | 80.7 | 1,770.7 | 84.7 | ||||||
| Notes receivable from affiliate |
70.0 | 3.1 | — | — | ||||||
| Equities, at fair value: |
||||||||||
| Large-cap equities |
196.1 | 8.6 | 130.2 | 6.2 | ||||||
| Small-cap equities |
28.0 | 1.2 | 7.3 | 0.3 | ||||||
| Total equities |
224.1 | 9.8 | 137.5 | 6.5 | ||||||
| Other invested assets, at fair value: |
||||||||||
| International instruments |
48.3 | 2.1 | 28.8 | 1.4 | ||||||
| Other invested assets |
4.0 | 0.2 | 2.9 | 0.1 | ||||||
| Total other invested assets, at fair value |
52.3 | 2.3 | 31.7 | 1.5 | ||||||
| Other invested assets, at cost |
0.9 | 0.1 | 1.4 | 0.1 | ||||||
| Total portfolio |
$ | 2,269.4 | 100.0 | $ | 2,091.8 | 100.0 | ||||
In May 2009, two of State Auto Financial’s subsidiaries, State Auto P&C and Milbank, entered into separate Credit Agreements with State Auto Mutual. Under these Credit Agreements, State Auto Mutual borrowed a total of $70.0 million from State Auto P&C and Milbank ($50.0 million and $20.0 million, respectively) on an unsecured basis. Interest is payable semi-annually at a fixed annual interest rate of 7.00%. Principal is payable May 2019.
54
Table of Contents
The amortized cost and fair value of unaffiliated fixed maturities at December 31, 2009, by contractual maturity, were as follows:
| ($ millions) | Amortized Cost |
Fair Value | ||||
| Due in 1 year or less |
$ | 17.2 | $ | 17.4 | ||
| Due after 1 year through 5 years |
263.2 | 268.9 | ||||
| Due after 5 years through 10 years |
506.5 | 523.7 | ||||
| Due after 10 years |
705.8 | 721.2 | ||||
| U.S. government agencies residential mortgage-backed securities |
295.4 | 300.6 | ||||
| Total |
$ | 1,788.1 | $ | 1,831.8 | ||
Expected maturities may differ from contractual maturities as issuers may have the right to call or prepay the obligations with or without call or prepayment penalties.
At December 31, 2009, our equity portfolio consisted of approximately 67 different large-cap stocks and 76 small-cap stocks. The largest single position was 2.9% of the equity portfolio based on fair value and the top ten positions account for 22.6% of the equity portfolio. Since our equity portfolio consists primarily of large-cap value-oriented stocks, with a small allocation to small-cap equities, when large-cap stocks and/or value-oriented stocks perform well our equity portfolio typically performs well compared to benchmarks. Conversely, when growth stocks outperform value and/or small- to mid-cap stocks outperform large-cap stocks, our equity portfolio does not perform as well compared to benchmarks.
Market Risk
Our primary market risk exposures are to changes in market prices for equity securities and changes in interest rates and credit ratings for fixed maturity securities. Our fixed maturity securities are subject to interest rate risk whereby the value of the securities varies as market interest rates change. We manage this risk by closely monitoring the duration of the fixed maturity portfolio. The duration of the fixed maturity portfolio was approximately 4.99 and 6.26 as of December 31, 2009 and 2008, respectively. The table below summarizes our interest rate risk and shows the effects of a parallel change in interest rates on the fair value of the fixed maturity portfolio (excluding other debt securities) as of December 31, 2009:
| ($ millions) | Fair Value | ||||||||||||||
| Description of securities | -200 bps Change |
-100 bps Change |
Actual | +100 bps Change |
+200 bps Change | ||||||||||
| Fixed maturities: |
|||||||||||||||
| U.S. treasury securities and obligations of U.S. government agencies |
$ | 372.5 | $ | 363.4 | $ | 352.9 | $ | 341.2 | $ | 329.6 | |||||
| Obligations of states and political subdivisions |
1,197.2 | 1,141.6 | 1,078.6 | 1,010.7 | 945.0 | ||||||||||
| Corporate securities |
110.6 | 104.9 | 99.7 | 94.5 | 89.9 | ||||||||||
| U.S. government agencies residential mortgage-backed securities |
313.4 | 308.6 | 300.6 | 289.7 | 277.2 | ||||||||||
| Balance as of December 31, 2009 |
$ | 1,993.7 | $ | 1,918.5 | $ | 1,831.8 | $ | 1,736.1 | $ | 1,641.7 | |||||
This table summarizes only the effects that a parallel change in interest rates could have on the fixed maturity portfolio. This change in rates would also change the value of our liabilities and possibly other financial assets. We caution the reader that this analysis does not take into account nonparallel changes in interest rates. It
55
Table of Contents
is likely that some rates would increase or decrease more than others depending upon market conditions at the time of the change. This nonparallel change would alter the value of the fixed maturity portfolio. The analysis is also limited in that it does not take into account any actions that might be taken by us in response to these changes. As a result, the actual impact of a change in interest rates and the resulting fixed maturity values may differ significantly from what is shown in the table.
We believe that the fixed maturity portfolio’s exposure to credit risk is minimal as approximately 94% of the bonds we own are rated AA or better. We do not intend to change our investment policy on the quality of our fixed maturity investments. The fixed maturity portfolio is managed in a laddered-maturity style and considers business mix and liability payout patterns to ensure adequate cash flow to meet claims as they are presented. We also manage liquidity risk by maintaining sufficient cash balances, owning some agency and U.S. Treasury securities at all times, purchasing bonds of major issuers, and purchasing bonds that are part of a medium or large issue. The fixed maturity portfolio does not have any direct exposure to either exchange rate risk or commodity risk. We do not rely on the use of derivative financial instruments. To provide us greater flexibility in order to manage our market risk exposures, we categorize our fixed maturities as available-for-sale. We do not maintain a trading portfolio.
We have no asset-backed securities in our fixed maturity portfolio which may be labeled sub-prime mortgage-backed securities. We invest only in conventional mortgage backed securities issued by a federal agency or that are U.S. Government guaranteed. Specifically, approximately $300.6 million or 14.3% of our available-for-sale investment portfolio as of December 31, 2009, were in either Ginnie Mae pools, which are guaranteed by the full faith and credit of the U.S. Government, or Fannie Mae or Freddie Mac pools. In 2008 both Fannie Mae and Freddie Mac received additional U.S. Government backing when they were placed into conservatorship.
Our fixed maturity investment portfolio at December 31, 2009 included obligations of states and political subdivisions with a total carrying value of $1,078.6 million. $531.3 million of these securities, or 49.3% of our municipal securities portfolio (“Muni Portfolio”), were enhanced by third-party monoline insurers (a “Credit Enhancement”) for the payment of principal and interest in the event of an issuer default. A Credit Enhancement is not a primary consideration to us when purchasing a municipal security, as we consider the underlying credit quality of the security as the primary rating factor in our evaluation process. Of the total $1,078.6 million of municipal securities in our investment portfolio at December 31, 2009, 89.6% were rated AA or better, without the benefit of a Credit Enhancement. We do not believe that a loss of a Credit Enhancement would have a material adverse impact on our results of operations, financial position or liquidity, due to the underlying strength of the issuers of the securities, as well as our ability and intent to hold the securities. In addition, as of December 31, 2009, we had no direct investment in any guarantor including any bond insurer.
The following table details the credit ratings of our municipal securities, excluding Credit Enhancements, based on ratings by nationally recognized rating agencies.
| ($ millions)
Rating |
Total fair value |
% | |||
| AAA* |
$ | 330.6 | 30.6 | ||
| AA |
636.3 | 59.0 | |||
| A |
108.5 | 10.1 | |||
| Other |
3.2 | 0.3 | |||
| Total |
$ | 1,078.6 | 100.0 | ||
| * | Our AAA rating category includes securities which have been either pre-funded or escrowed to maturity. |
56
Table of Contents
The following table shows the composition of the insurers providing Credit Enhancements at December 31, 2009, along with the corresponding underlying credit rating of the issuer of the security.
| ($ millions)
Monoline Insurer / Underlying Rating |
Total fair value | ||
| Assured Guaranty Municipal Corp. (formerly FSA): |
|||
| AAA |
$ | 27.8 | |
| AA |
193.3 | ||
| A |
28.4 | ||
| Other |
1.1 | ||
| 250.6 | |||
| AMBAC: |
|||
| AAA |
7.7 | ||
| AA |
80.5 | ||
| A |
42.8 | ||
| Other |
2.1 | ||
| 133.1 | |||
| FGIC: |
|||
| AAA |
26.5 | ||
| AA |
3.5 | ||
| 30.0 | |||
| National Public Finance Guarantee (formerly MBIA): |
|||
| AAA |
13.4 | ||
| AA |
87.8 | ||
| A |
7.5 | ||
| 108.7 | |||
| XLCA: |
|||
| A |
8.9 | ||
| Total municipal securities enhanced by third-party monoline insurers |
$ | 531.3 | |
We believe our Muni Portfolio is well diversified by issuer and state. We have 18.5% invested in securities which have been either pre-refunded or escrowed to maturity bonds. Within the non pre-refunded and escrowed to maturity portfolio, no single issuer comprises more than 5% of the portfolio and no more than 10% of the portfolio is concentrated in any one state. We believe our Muni Portfolio is invested within the strongest sectors of the municipal bond market. 41.1% of our municipal bonds are general obligation bonds or other tax-backed bonds. The majority of the remaining Muni Portfolio consists of revenue bonds. Our credit research is an important part of our investment management process, and we continually monitor all holdings for any signs of deterioration. We believe that our municipal holdings will maintain their high credit quality and that the issuers will be able to make all principal and interest payments as they come due.
As of December 31, 2009, our large-cap equity portfolio had a beta of 0.96 using the S&P 500 Index as a benchmark. Beta estimates the degree the portfolio’s price will fluctuate based on a given movement in the market index. The table below reflects what changes might occur in the value of the large-cap equity portfolio given a change in the S&P 500 Index:
| Fair value ($ millions) |
$ | 233.6 | $ | 214.8 | $ | 196.1 | $ | 177.2 | $ | 158.4 | ||||||||||
| Change in S&P 500 Index |
+20 | % | +10 | % | 0 | -10 | % | -20 | % | |||||||||||
| Value as % of original value |
119 | % | 110 | % | 100 | % | 90 | % | 81 | % |
57
Table of Contents
The above analysis is limited in that it does not take into account any actions that might be taken by us in response to these changes. As a result, the actual impact of a change in equity market prices and the resulting equity values may differ significantly from what is shown in the table. By investing in mostly large-cap issues we hope to limit liquidity risk in the equity portfolio. The large-cap equity portfolio does not have any direct exposure to exchange rate risk since we do not directly hold any foreign stocks. We constantly monitor the equity portfolio holdings for any credit risk issues that may arise. We do not invest in any commodity futures or commodity oriented mutual funds.
At December 31, 2009, we have two international funds, Fund 1 and Fund 2, which are included in other invested assets available-for-sale. Fund 1 and Fund 2 had betas of 0.684 and 0.849, respectively, using the MSCI EAFE Index as a benchmark. Beta estimates the degree the portfolio’s price will fluctuate based on a given movement in the index. The tables below reflect what changes might occur in the values of Funds 1 and 2 given a change in the MSCI EAFE Index:
| Fund 1 |
||||||||||||||||||||
| Fair value ($ millions) |
$ | 29.0 | $ | 27.2 | $ | 25.5 | $ | 23.8 | $ | 22.0 | ||||||||||
| Change in MSCI EAFE Index |
+20 | % | +10 | % | 0 | -10 | % | -20 | % | |||||||||||
| Value as % of original value |
114 | % | 107 | % | 100 | % | 93 | % | 86 | % | ||||||||||
| Fund 2 |
||||||||||||||||||||
| Fair value ($ millions) |
$ | 26.7 | $ | 24.7 | $ | 22.8 | $ | 20.9 | $ | 18.9 | ||||||||||
| Change in MSCI EAFE Index |
+20 | % | +10 | % | 0 | -10 | % | -20 | % | |||||||||||
| Value as % of original value |
117 | % | 108 | % | 100 | % | 92 | % | 83 | % | ||||||||||
The above analysis does not take into account any actions that might be taken by the portfolio managers in response to these changes. As a result, the actual impact of a change in international equity market prices and the resulting international equity values may differ significantly from what is shown in the tables above.
Investment Operations Revenue
Net investment income for 2009 was $82.1 million compared to $87.4 million in 2008. The decline in net investment income is attributed to a reduction in the average invested assets and the investment yield. Average invested assets decreased from $2,127.6 million at December 31, 2008 to $2,117.0 million at December 31, 2009. Our investment yield declined to 3.9% in 2009 from 4.1% in 2008 due to the following factors.
| • | Our Treasury Inflation Protection Securities (“TIPS”) holdings, at amortized cost, increased to $137.0 million from $77.9 million, respectively. The income earned on our TIPS securities, which is dependent on changes in the CPI Index, declined compared to 2008. |
| • | We held fewer large-cap dividend paying stocks in 2009 than in 2008. |
| • | Dividend payouts were reduced on certain equity holdings. |
| • | On average, we held higher levels of cash balances, which earned lower yields. Average short-term yields were 240 basis points lower in 2009 than in 2008. |
58
Table of Contents
| ($ millions) | Year Ended December 31 | |||||||
| 2009 | 2008 | |||||||
| Gross investment income: |
||||||||
| Fixed maturities |
$ | 75.7 | $ | 79.4 | ||||
| Equity securities |
3.5 | 5.0 | ||||||
| Other |
4.9 | 5.1 | ||||||
| Total gross investment income |
84.1 | 89.5 | ||||||
| Less: Investment expenses |
2.0 | 2.1 | ||||||
| Net investment income |
$ | 82.1 | $ | 87.4 | ||||
| Average invested assets (at cost) |
$ | 2,117.0 | $ | 2,127.6 | ||||
| Annualized investment yield |
3.9 | % | 4.1 | % | ||||
| Annualized investment yield, after tax |
3.3 | % | 3.6 | % | ||||
| Net investment income, after tax |
$ | 70.5 | $ | 76.6 | ||||
| Effective tax rate |
14.1 | 12.4 | ||||||
Realized gains and losses on investments for the years ended December 31, 2009 and 2008, respectively, are summarized as follows:
| ($ millions) | 2009 | 2008 | ||||||||||||||
| Realized gains |
Proceeds received on sale |
Realized gains (losses) |
Proceeds received on sale | |||||||||||||
| Realized gains: |
||||||||||||||||
| Fixed maturities |
$ | 5.9 | $ | 322.2 | $ | 2.7 | $ | 164.6 | ||||||||
| Equity securities |
4.8 | 19.2 | 9.6 | 41.0 | ||||||||||||
| Other invested assets |
— | — | — | — | ||||||||||||
| Total realized gains |
10.7 | 341.4 | 12.3 | 205.6 | ||||||||||||
| Realized losses: |
||||||||||||||||
| Fixed maturities—Sales |
— | 1.6 | — | — | ||||||||||||
| Equity securities: |
||||||||||||||||
| Sales |
(6.9 | ) | 14.8 | (9.4 | ) | 26.0 | ||||||||||
| OTTI |
(9.0 | ) | — | (28.3 | ) | — | ||||||||||
| Other invested assets—OTTI |
— | — | (11.0 | ) | — | |||||||||||
| Total realized losses |
(15.9 | ) | 16.4 | (48.7 | ) | 26.0 | ||||||||||
| Net realized gain (loss) on investments |
$ | (5.2 | ) | $ | 357.8 | $ | (36.4 | ) | $ | 231.6 | ||||||
During 2009, we sold fixed maturities, which resulted in realized gains on certain municipal bonds, and replaced them with taxable bonds. Equity sales were executed for various reasons in 2009, including the achievement of our price target. We recognized realized losses on the sale of certain equity securities in response to negative earnings or negative outlook announcements and changes in business conditions which in our opinion diminished their future business prospects.
When a fixed maturity has been determined to have a decline in fair value, the impairment charge is separated into an amount representing the credit loss, which is recognized in earnings, and the amount related to non-credit factors, which is recognized in accumulated other comprehensive income (loss). See “Critical Accounting Policies—Investments” included in this Item 7 for OTTI impairment indicators. Future increases or decreases in fair value, if not other-than-temporary, are included in accumulated other comprehensive income (loss). We did not recognize OTTI on our fixed maturity portfolio during 2009. In 2008, we recognized realized losses that were less than $0.1 million.
59
Table of Contents
When an equity security or other invested asset has been determined to have a decline in fair value that is other-than-temporary, we adjust the cost basis of the security to fair value. See “Critical Accounting Policies – Investments” included in this Item 7 for OTTI impairment indicators. This results in a charge to earnings as a realized loss, which is not reversed for subsequent recoveries in fair value. Future increases or decreases in fair value, if not other-than-temporary, are included in accumulated other comprehensive income (loss).
The following table provides a detailed breakdown by security type for the 2009 OTTI charges.
| ($ millions) | Number of |
Total impairment | |||
| Equity Securities: |
|||||
| Large-cap equities |
12 | $ | 7.8 | ||
| Small-cap equities |
267 | 1.2 | |||
| Total OTTI |
279 | $ | 9.0 | ||
Gross Unrealized Investment Gains and Losses
Based upon our review of our investment portfolio at December 31, 2009, we determined that there were no individual investments with an unrealized holding loss that had a fair value significantly below cost continually for more than one year. The following table provides detailed information on our available-for-sale investment portfolio by lot at fair value for our gross unrealized gains and losses at December 31, 2009.
| ($ millions, except number of positions)
|
Cost or amortized cost |
Gross unrealized holding gains |
Number of gain positions |
Gross unrealized holding losses |
Number of loss positions |
Fair value | |||||||||||
| Fixed Maturities: |
|||||||||||||||||
| U.S. treasury securities and obligations of U.S. government agencies |
$ | 348.4 | $ | 5.9 | 58 | $ | (1.4 | ) | 53 | $ | 352.9 | ||||||
| Obligations of state and political subdivisions |
1,046.9 | 33.2 | 428 | (1.5 | ) | 48 | 1,078.6 | ||||||||||
| Corporate securities |
97.4 | 2.4 | 46 | (0.1 | ) | 10 | 99.7 | ||||||||||
| U.S. government agencies residential mortgage-backed securities |
295.4 | 6.4 | 82 | (1.2 | ) | 25 | 300.6 | ||||||||||
| Total fixed maturities |
1,788.1 | 47.9 | 614 | (4.2 | ) | 136 | 1,831.8 | ||||||||||
| Equity Securities: |
|||||||||||||||||
| Large-cap equity securities |
164.7 | 31.6 | 60 | (0.2 | ) | 6 | 196.1 | ||||||||||
| Small-cap equity securities |
25.0 | 3.0 | 67 | — | — | 28.0 | |||||||||||
| Total equity securities |
189.7 | 34.6 | 127 | (0.2 | ) | 6 | 224.1 | ||||||||||
| Other invested assets |
44.1 | 8.2 | 4 | — | — | 52.3 | |||||||||||
| Total available-for-sale investments |
$ | 2,021.9 | $ | 90.7 | 745 | $ | (4.4 | ) | 142 | $ | 2,108.2 | ||||||
60
Table of Contents
The following table presents a summary of our unrealized gains (losses) by investment type, net of deferred tax that was included as a component of accumulated comprehensive loss at December 31, 2009 and 2008, respectively, and the change in unrealized gains (losses), net of deferred tax, for the year ended December 31, 2009:
| ($ millions) | December 31, 2009 |
December 31, 2008 |
$ Change |
|||||||||
| Available-for-sale investments |
||||||||||||
| Unrealized gains (losses): |
||||||||||||
| Fixed maturities |
$ | 43.7 | $ | (10.4 | ) | $ | 54.1 | |||||
| Equities |
34.4 | (6.8 | ) | 41.2 | ||||||||
| Other invested assets |
8.2 | (0.7 | ) | 8.9 | ||||||||
| Unrealized gains (losses) |
86.3 | (17.9 | ) | 104.2 | ||||||||
| Deferred federal income tax (liability) asset |
(30.2 | ) | 6.3 | (36.5 | ) | |||||||
| Valuation allowance |
— | (2.6 | ) | 2.6 | ||||||||
| Unrealized gains (losses), net of tax |
$ | 56.1 | $ | (14.2 | ) | $ | 70.3 | |||||
At December 31, 2009, we determined a valuation allowance against our capital deferred tax items was not needed because our unrealized losses at December 31, 2008, had shifted to an unrealized gain. In the first quarter of 2009, we reversed the $3.1 million valuation allowance that we established at December 31, 2008, benefitting accumulated other comprehensive loss by $2.6 million and deferred tax expense by $0.5 million.
Fair Value Measurements
We primarily use one independent nationally recognized pricing service in developing fair value estimates. We obtain one price per security, and our processes and control procedures are designed to ensure the value is accurately recorded on an unadjusted basis. Through discussions with the pricing service, we gain an understanding of the methodologies used to price the different types of securities, that the data and the valuation methods utilized are appropriate and consistently applied, and that the assumptions are reasonable and representative of fair value. To validate the reasonableness of the valuations obtained from the pricing service, we compare to other fair value pricing information gathered from other independent pricing sources. See Note 3, “Fair Value of Financial Instruments” to our Consolidated Financial Statements included in Item 8 of this Form 10-K for a presentation of our available-for-sale investments within the fair value hierarchy at December 31, 2009.
As of December 31, 2009, Level 3 assets as a percentage of total assets were 0.1%, which we have determined to be insignificant.
Other Income Statement Items
Included in other expenses was a $6.5 million charge related to a write-off of our equity interest in the accumulated surplus of the North Carolina Beach Plan, a mandatory reinsurance underwriting association. This charge was the result of recent legislation intended to reform the funding mechanism of the North Carolina Beach Plan which called into question our rights to the equity interest either in form of future distributions or credits.
The effective tax rate for 2009 was a benefit of 180.0% compared to a benefit of 58.6% for 2008. Included in our 2009 and 2008 loss before federal income taxes were tax-exempt earnings related to our investment portfolio, which significantly contributed to the difference between the actual rates of 180.0% and 58.6%,
61
Table of Contents
respectively, and the expected statutory rate of 35.0%. See Note 8, “Federal Income Taxes” to our Consolidated Financial Statements included in Item 8 of this Form 10-K for a reconciliation between our actual federal income tax benefit and the amount computed at the indicated statutory rate for the years ended December 31, 2009 and 2008.
2008 Compared to 2007
For 2008, we reported a pre-tax loss of $75.1 million compared to pre-tax income of $155.3 million for 2007. Our 2008 pre-tax loss was primarily driven by the following factors:
| • | Catastrophe losses for 2008 were $156.1 million or 13.9 loss ratio points compared to $37.1 million or 3.7 loss ratio points for the same 2007 period. Hurricane Ike delivered tropical storm force winds to Texas and three of our largest states-Ohio, Kentucky and Indiana, accounting for $44.1 million of catastrophe losses or 3.9 loss ratio points. See the “Loss and LAE” section included in this Item 7. |
| • | Our non-catastrophe losses for 2008 were $686.3 or 60.9 loss ratio points compared to $548.5 or 54.2 loss ratio points for the same 2007 period. All of our lines of business have contributed to this increase. See the “Loss and LAE” section included in this Item 7. |
| • | During 2008, we recognized $39.3 million of OTTI on our investment portfolio compared to $1.9 million in 2007. See the “Investment Operations Segment” section included in this Item 7. |
Insurance Segments
The following tables provide a summary of our insurance segments’ SAP underwriting (loss) gain and SAP combined ratio for the years ended December 31, 2008 and 2007:
| ($ millions) | 2008 | |||||||||||||||||
| Personal | % Ratio |
Business | % Ratio |
Total | % Ratio | |||||||||||||
| Written premiums |
$ | 715.6 | $ | 489.3 | $ | 1,204.9 | ||||||||||||
| Earned premiums |
670.9 | 455.1 | 1,126.0 | |||||||||||||||
| Losses and loss expenses |
520.3 | 77.6 | 322.1 | 70.8 | 842.4 | 74.8 | ||||||||||||
| Underwriting expenses |
206.8 | 28.9 | 191.5 | 39.1 | 398.3 | 33.1 | ||||||||||||
| SAP underwriting loss and SAP combined ratio |
$ | (56.2 | ) | 106.5 | $ | (58.5 | ) | 109.9 | $ | (114.7 | ) | 107.9 | ||||||
| ($ millions) | 2007 | ||||||||||||||
| Personal | % Ratio |
Business | % Ratio |
Total | % Ratio | ||||||||||
| Written premiums |
$ | 615.1 | $ | 404.7 | $ | 1,019.8 | |||||||||
| Earned premiums |
609.6 | 402.0 | 1,011.6 | ||||||||||||
| Losses and loss expenses |
378.4 | 62.1 | 207.2 | 51.5 | 585.6 | 57.9 | |||||||||
| Underwriting expenses |
183.9 | 29.9 | 154.2 | 38.1 | 338.1 | 33.2 | |||||||||
| SAP underwriting gain and SAP combined ratio |
$ | 47.3 | 92.0 | $ | 40.6 | 89.6 | $ | 87.9 | 91.1 | ||||||
62
Table of Contents
Revenue
The following table shows the reconciliation of the one-time impact on net written premiums for the year ended December 31, 2008 with respect to the unearned premiums transferred to us on January 1, 2008, in conjunction with the 2008 pooling changes.
| ($ millions) | Net Written Premiums Reconciliation Table | ||||||||
| Including Pooling Change |
Pooling Change Impact |
Excluding Pooling Change | |||||||
| Personal insurance segment: |
|||||||||
| Standard auto |
$ | 406.7 | $ | 7.9 | $ | 398.8 | |||
| Nonstandard auto |
42.2 | — | 42.2 | ||||||
| Homeowners |
234.2 | 14.4 | 219.8 | ||||||
| Other personal |
32.5 | 2.5 | 30.0 | ||||||
| Total personal |
715.6 | 24.8 | 690.8 | ||||||
| Business insurance segment: |
|||||||||
| Commercial auto |
120.0 | 10.0 | 110.0 | ||||||
| Commercial multi-peril |
105.1 | 6.1 | 99.0 | ||||||
| Fire & allied lines |
102.5 | 5.7 | 96.8 | ||||||
| Other & product liability |
84.4 | 3.9 | 80.5 | ||||||
| Workers’ compensation |
47.5 | 2.0 | 45.5 | ||||||
| Other business |
29.8 | 1.1 | 28.7 | ||||||
| Total business |
489.3 | 28.8 | 460.5 | ||||||
| Total personal & business |
$ | 1,204.9 | $ | 53.6 | $ | 1,151.3 | |||
Impacting both our written and earned premiums in 2008 were the following:
| • | As of July 1, 2008, we terminated our State Auto P&C intercompany catastrophe reinsurance agreement, which resulted in $1.4 million less net written and earned premiums within our property lines for 2008 when compared to the same 2007 period. |
| • | Our third party excess of loss catastrophe reinsurance program, which renewed July 1, 2008 (coverage period July 1, 2008 through June 30, 2009), incorporates a reinstatement provision should a loss occurrence exceed our retention. Under this provision, our original reinsurance coverage limits are automatically restored in consideration of an additional reinstatement premium (“Reinstatement Premium”). The estimated direct ultimate loss resulting from Hurricane Ike exceeded our retention, thereby causing two premium transactions to occur: 1) an acceleration of the recognition of the original annual premium to the date of loss occurrence in proportion to the reinsurance coverage exhausted and 2) the recognition of the Reinstatement Premium from the date of the loss occurrence to the end of the coverage period (June 30, 2009). Additionally, during the 2008 fourth quarter we entered into a separate property catastrophe excess of loss reinsurance agreement (“Third Event Agreement”), which provides additional coverage in excess of our retention through our remaining coverage period (June 30, 2009). The incremental impact of the acceleration of the original annual premium plus the recognition Reinstatement Premium plus the premium paid in connection with the Third Event Agreement resulted in $3.5 million less net written and earned premiums within our property lines when compared to the same 2007 period. The incremental impact has the most significant effect on our property lines. See detailed discussion of our reinsurance programs in the “Liquidity and Capital Resources—Reinsurance Arrangements” section included in this Item 7. |
63
Table of Contents
Personal Insurance Segment Revenue
Our personal insurance segment consists primarily of auto (standard and nonstandard) and homeowners’ products, with personal auto representing 38.3% of our total consolidated net written premium in 2008 and 2007. Our strategy to grow our personal lines business includes introducing our products, enhanced systems and easier-to-use technologies into new states. During 2008, we began introducing our personal lines products and technologies into Texas through the independent agent distribution channel as a result of State Auto Mutual’s acquisition of the Beacon Insurance Group in early 2007. In addition, future plans include leveraging our relationship with the Patrons Insurance Group distribution channel to add upgraded product lines and technologies into Connecticut.
During 2008, we continued to enhance our personal lines point of sale portal, netXpress. The additional integration with the systems commonly used by our independent agents has resulted in an increase in the number of quotes for personal auto and homeowners. In 2008, for the State Auto Group 840,000 quotes were handled on netXpress with 196,000 of those quotes initiated from the integration mentioned above. In 2007, a total of 542,000 quotes were handled on netXpress.
We have also focused on improving our policyholders’ ease of doing business with respect to bill payment and claim reporting and settlement. Utilization of the electronic “Pay Now” functionality via www.StateAuto.com increased significantly. During 2008 for the State Auto Group, 310,000 payments representing $117.0 million of premiums were made as compared to 189,000 payments and $76.0 million of premium payments recorded in 2007.
The following table provides a summary of written and earned premium, net of reinsurance, by major product line of business for our personal insurance segment for the years ended December 31, 2008 and 2007. The one-time impact of the 2008 pooling changes has been excluded from 2008 to present net written premiums on a comparative basis (see Net Written Premium Reconciliation Table above):
| ($ millions) | 2008 | 2007 | % Change |
||||||
| Personal Insurance Segment: |
|||||||||
| Net Written Premium |
|||||||||
| Standard auto |
$ | 398.8 | $ | 361.5 | 10.3 | ||||
| Nonstandard auto |
42.2 | 42.7 | (1.2 | ) | |||||
| Homeowners |
219.8 | 187.7 | 17.1 | ||||||
| Other personal |
30.0 | 23.2 | 29.3 | ||||||
| Total personal |
$ | 690.8 | $ | 615.1 | 12.3 | ||||
| Net Earned Premium |
|||||||||
| Standard auto |
$ | 384.3 | $ | 357.3 | 7.6 | ||||
| Nonstandard auto |
42.6 | 42.9 | (0.7 | ) | |||||
| Homeowners |
215.4 | 186.5 | 15.5 | ||||||
| Other personal |
28.6 | 22.9 | 24.9 | ||||||
| Total personal |
$ | 670.9 | $ | 609.6 | 10.1 | ||||
In total, the personal insurance segment net written premium increased from 2007 by 12.3%, with 6.8% of this increase attributed to the New Pool Business and 5.5% of this attributed to “Organic Growth.” We define Organic Growth in this Form 10-K as premium growth excluding premium growth related to the New Pool Business. Our Organic Growth for net written premiums has been impacted by our decision in 2007 to withdraw our personal insurance products from Florida beginning January 1, 2008. The net written premium loss from this action was $12.5 million for 2008.
64
Table of Contents
Standard personal auto net written premiums increased 10.3% from 2007. The New Pool Business contributed 3.9% for 2008, while Organic Growth increased 6.4% from 2007. The primary product contributing to our increase in Organic Growth in standard personal auto is our CustomFitSM product which uses a multivariate rating approach that broadens the underwriting and eligibility guidelines for new and existing customers. Since introducing the first generation of the CustomFit product in 2005, we now offer this product in most of our operating states and have seen significant improvement in our net written premiums production trends for new business in these states. In late 2007, we began introducing the second generation of CustomFit and during 2008 we continued migrating CustomFit states to the second generation product which increases the number of pricing points significantly.
We believe independent agents value ease of doing business and make it an important factor in their choice of insurance companies when quoting personal auto products to their customers. To assist in this area, in early 2007, we began implementing comparative rating tools which allow agents to receive rate quotes from multiple insurance companies by entering the rating information only one time. To date, we have implemented 65 different integration points to our personal lines rating engine thus eliminating duplicate entry for agents. We believe agents will quote and write more personal standard and nonstandard auto and homeowners insurance with us as a result of a more efficient quoting process combined with more competitive rates resulting from the ongoing introduction of CustomFit for standard auto and refined pricing for nonstandard auto.
Nonstandard auto net written premium decreased 1.2% from 2007. This decrease was due to tightening underwriting controls and aggressive rate actions which contributed to a decline in our new business writings. These actions were taken to drive an improvement in our underwriting results. See SAP Loss and LAE Ratios Table in the “Losses and LAE” section included in this Item 7.
Homeowners net written premium increased 17.1% from 2007. The New Pool Business contributed 12.4% while Organic Growth increased 4.7% from 2007. We have undertaken new homeowners pricing and product initiatives, such as various new home discounts that complement our CustomFit automobile rollout, in order to improve our premium growth. During 2008, we experienced premium growth in most of our states.
Other personal net written premium increased 29.3% from 2007, with 11.2% coming from Organic Growth and 18.1% from New Pool Business. Other personal includes primarily our farmowners line of business where we expanded into four new states, which accounts for much of the Organic Growth in this line.
65
Table of Contents
Business Insurance Segment Revenue
We focus our business insurance sales on small to medium sized exposures and offer a broad range of both property and liability coverages such as commercial auto, commercial multi-peril, fire & allied lines, other & product liability and workers’ compensation. The following table provides a summary of written and earned premium, net of reinsurance, by major product line of business for our business insurance segment for the years ended December 31, 2008 and 2007. The one-time impact of the 2008 pooling changes has been excluded from 2008 to present net written premiums on a comparative basis (see Net Written Premium Reconciliation Table above):
| ($ millions) | 2008 | 2007 | % Change | |||||
| Business Insurance Segment: |
||||||||
| Net Written Premium |
||||||||
| Commercial auto |
$ | 110.0 | $ | 95.8 | 14.8 | |||
| Commercial multi-peril |
99.0 | 86.6 | 14.3 | |||||
| Fire & allied lines |
96.8 | 84.0 | 15.2 | |||||
| Other & product liability |
80.5 | 75.6 | 6.5 | |||||
| Workers’ compensation |
45.5 | 36.1 | 26.0 | |||||
| Other commercial |
28.7 | 26.6 | 7.9 | |||||
| Total business |
$ | 460.5 | $ | 404.7 | 13.8 | |||
| Net Earned Premium |
||||||||
| Commercial auto |
$ | 110.5 | $ | 96.9 | 14.0 | |||
| Commercial multi-peril |
97.9 | 86.8 | 12.8 | |||||
| Fire & allied lines |
94.7 | 83.4 | 13.5 | |||||
| Other & product liability |
79.9 | 75.5 | 5.8 | |||||
| Workers’ compensation |
43.4 | 33.4 | 29.9 | |||||
| Other commercial |
28.7 | 26.0 | 10.4 | |||||
| Total business |
$ | 455.1 | $ | 402.0 | 13.2 | |||
The business insurance segment net written premium increased 13.8% from 2007. The New Pool Business contributed 12.8%, while Organic Growth increased 1.0% from 2007. Business insurance continues to be impacted by rate competition as well as ease of doing business issues. We are seeking to balance our traditional underwriting discipline with new products and pricing tools that support the production of profitable new business.
We continue to invest in products, processes and systems that we believe will increase our business insurance writings. We have expanded our marketability by introducing new products, enhancing existing products and broadening eligibility. For our property and liability business, we have also implemented a more granular pricing process that we believe will help us price risks more accurately and improve account retention. We are pursuing the same for our commercial auto and workers’ compensation lines of business. In addition, we have broadened our property, liability, auto and workers’ compensation pricing ranges to better recognize the spectrum of risks within our markets. This year, we introduced an enhanced Employment Practices Liability product to agents in all states and added enhanced functionality for agents to perform more detailed loss analysis on their existing book of business insurance policies. In addition, we introduced our workers’ compensation products into West Virginia, which opened this market to private insurers after operating for years as a “monopolistic” workers’ compensation state.
66
Table of Contents
We also continue to improve our back office systems, such as enhancements to our insurance policy administration system, to make it easier for agents to quote and submit business insurance policies to us. Our system now allows transactions to be processed throughout the day using real-time and straight through processing rather than in a large batch at night. In addition to the efficiency gains we have achieved for internal employees, we have leveraged this real-time and straight through processing functionality with bizXpress. In 2008, we expanded our bizXpress functionality by giving agents the ability to quote business auto policies as well as businessowners policies, a capability which we introduced to them in 2007.
We are working to expand the scope of this technology for new products and additional lines of business including workers’ compensation. We believe this technology investment should better position us for revenue growth opportunities in the future and start to drive efficiencies into our business model much like we have seen in personal insurance. The majority of all transactions in business insurance utilize the straight through processing technology. This has resulted in faster delivery of policies to our agents and their insureds for new business and endorsements.
Similar to our personal lines segment, we are leveraging our relationship with the agency distribution channel as a result of State Auto Mutual’s acquisition of Beacon National in early 2007. During the fourth quarter of 2007 we introduced our business product portfolio in Texas. In the fourth quarter of 2008, we began to leverage our relationship with the Patrons Mutual and Litchfield agency distribution channel by completing all filing and systems work to support the introduction of commercial property, liability, auto and workers’ compensation products, which we introduced to Connecticut agents early in 2009.
Loss and LAE
Our GAAP Loss and LAE ratio was 75.2% in 2008 compared to 58.4% in 2007. The increase in the GAAP Loss and LAE ratio was largely due to an increase in catastrophe storm losses. Our catastrophe losses, which primarily impacted our property lines of business, accounted for 13.9 points of the Loss and LAE ratio in 2008 compared to only 3.7 points in 2007. Our non-catastrophe Loss and LAE ratio was 60.9% in 2008 compared to 54.2% in 2007. The increase in our non-catastrophe Loss and LAE ratio was driven mostly by bodily injury claim severity in the personal and commercial auto lines. With auto lines representing a significant portion of our earned premiums, this line of business contributed roughly 50% of the increase in our non-catastrophe ratio.
Losses and loss expenses for a calendar year represent the combined estimated ultimate liability for claims occurring in the current calendar year along with any change in estimated ultimate liability for claims occurring in prior years. The following table presents the provision for losses and loss expenses for those claims occurring in 2008 and prior years, along with the GAAP Loss and LAE ratio for the years 2008 and 2007, respectively:
| ($ millions) | 2008 | % GAAP Loss and LAE |
2007 | % GAAP Loss and LAE |
||||||||||
| Provision for losses and loss expenses occurring: |
||||||||||||||
| Current year |
$ | 874.0 | 77.6 | $ | 645.5 | 62.7 | ||||||||
| Prior years |
(27.3 | ) | (2.4 | ) | (54.7 | ) | (4.3 | ) | ||||||
| Total losses and loss expenses |
$ | 846.7 | 75.2 | $ | 590.8 | 58.4 | ||||||||
67
Table of Contents
As shown above, the 2008 loss and loss expenses attributable to prior years totaled ($27.3) million. This corresponded to a decrease, or favorable development, in the estimated ultimate liability for prior years’ claims. A tabular presentation of the $27.3 million favorable development in 2008 by accident year is shown below.
| ($ millions)
Accident Year |
Current Year Development of Ultimate Liability |
|||
| Redundancy /(Deficiency) | ||||
| 1998 and prior |
$ | 0.7 | ||
| 1999 |
0.3 | |||
| 2000 |
0.5 | |||
| 2001 |
(0.1 | ) | ||
| 2002 |
0.7 | |||
| 2003 |
2.6 | |||
| 2004 |
(0.2 | ) | ||
| 2005 |
0.8 | |||
| 2006 |
3.1 | |||
| 2007 |
18.9 | |||
| Total |
$ | 27.3 | ||
Emergence by accident year includes normal fluctuations due to the uncertainty associated with loss reserve development and claim settlement. The favorable development of $27.3 million in 2008 came primarily from accident year 2007. The more notable items contributing to the 2008 favorable development were:
| • | Unallocated loss adjustment expenses (“ULAE”) were $13.7 million lower than anticipated in the reserves at December 31, 2007. ULAE are those expenses or costs incurred in settling claims, such as in-house processing costs, which cannot be associated with a specific claim. |
| • | Favorable catastrophe loss development of $6.4 million was primarily associated with the 2007 accident year. This development occurred primarily within our homeowners, fire & allied and commercial multi-peril lines of business. |
| • | Non-catastrophe homeowners reserves developed $4.9 million lower than anticipated. Current loss projections using more mature claim data resulted in lower expected average claim severity than prior projections, primarily from losses occurring in 2007. |
See additional discussion regarding loss and loss expense reserves at the “Critical Accounting Policies – Losses and Loss Expenses Payable” section included in this Item 7.
Catastrophe losses for 2008 totaled $156.1 million (13.9 loss ratio points) compared to $37.1 million (3.7 loss ratio points) for 2007. The discussion of catastrophe losses includes those which have been designated as such by ISO’s Property Claim Services (“PCS”) unit, a nationally recognized industry service. PCS defines catastrophes as events resulting in $25.0 million or more in insured losses industry wide and affecting significant numbers of insureds and insurers. During 2008, we were impacted by losses from 35 of the 37 storms that were classified as numbered catastrophes by PCS as compared to 18 of the 26 PCS 2007 classified storms. The losses from these catastrophes have had a significant impact on both our personal and business insurance property lines.
68
Table of Contents
The following tables provide our insurance segments’ SAP Loss and LAE ratios (“loss ratios”) by major lines of business for 2008 and 2007 with the catastrophe (“cat”) and non-catastrophe (“non-cat”) impact shown separately:
| ($ millions)
2008 Statutory Loss and LAE Ratios |
Earned Premium |
Cat Loss & LAE |
Non-Cat Loss & LAE |
Statutory Loss & |
Cat Ratio |
Non-Cat Ratio |
Total Loss Ratio | |||||||||||
| Personal insurance segment: |
||||||||||||||||||
| Standard auto |
$ | 384.3 | $ | 8.2 | $ | 254.4 | $ | 262.6 | 2.1 | 66.2 | 68.3 | |||||||
| Nonstandard auto |
42.6 | 0.3 | 31.5 | 31.8 | 0.7 | 74.0 | 74.7 | |||||||||||
| Homeowners |
215.4 | 91.5 | 113.0 | 204.5 | 42.5 | 52.5 | 95.0 | |||||||||||
| Other personal |
28.6 | 5.8 | 15.6 | 21.4 | 20.6 | 54.1 | 74.7 | |||||||||||
| Total personal |
670.9 | 105.8 | 414.5 | 520.3 | 15.8 | 61.7 | 77.5 | |||||||||||
| Business insurance segment: |
||||||||||||||||||
| Commercial auto |
110.5 | 0.8 | 67.6 | 68.4 | 0.7 | 61.2 | 61.9 | |||||||||||
| Commercial multi-peril |
97.9 | 16.5 | 56.5 | 73.0 | 16.8 | 57.8 | 74.6 | |||||||||||
| Fire & allied lines |
94.7 | 32.0 | 52.7 | 84.7 | 33.8 | 55.7 | 89.5 | |||||||||||
| Other & product liability |
79.9 | — | 51.6 | 51.6 | — | 64.6 | 64.6 | |||||||||||
| Workers’ compensation |
43.4 | — | 35.0 | 35.0 | — | 80.7 | 80.7 | |||||||||||
| Other commercial |
28.7 | 1.0 | 8.4 | 9.4 | 3.4 | 29.3 | 32.7 | |||||||||||
| Total business |
455.1 | 50.3 | 271.8 | 322.1 | 11.0 | 59.8 | 70.8 | |||||||||||
| Total SAP personal and business |
$ | 1,126.0 | $ | 156.1 | $ | 686.3 | $ | 842.4 | 13.9 | 60.9 | 74.8 | |||||||
| ($ millions)
2007 Statutory Loss and LAE Ratios |
Earned Premium |
Cat Loss & LAE |
Non-Cat Loss & LAE |
Statutory Loss & |
Cat Ratio |
Non-Cat Ratio |
Total Loss Ratio | |||||||||||
| Personal insurance segment: |
||||||||||||||||||
| Standard auto |
$ | 357.3 | $ | 2.3 | $ | 217.5 | $ | 219.8 | 0.7 | 60.8 | 61.5 | |||||||
| Nonstandard auto |
42.9 | — | 27.1 | 27.1 | — | 63.2 | 63.2 | |||||||||||
| Homeowners |
186.5 | 26.5 | 94.0 | 120.5 | 14.2 | 50.4 | 64.6 | |||||||||||
| Other personal |
22.9 | 1.9 | 9.1 | 11.0 | 7.9 | 40.3 | 48.2 | |||||||||||
| Total personal |
609.6 | 30.7 | 347.7 | 378.4 | 5.0 | 57.1 | 62.1 | |||||||||||
| Business insurance segment: |
||||||||||||||||||
| Commercial auto |
96.9 | — | 50.6 | 50.6 | — | 52.2 | 52.2 | |||||||||||
| Commercial multi-peril |
86.8 | 1.5 | 50.0 | 51.5 | 1.7 | 57.6 | 59.3 | |||||||||||
| Fire & allied lines |
83.4 | 4.9 | 36.0 | 40.9 | 5.9 | 43.2 | 49.1 | |||||||||||
| Other & product liability |
75.5 | — | 32.8 | 32.8 | — | 43.5 | 43.5 | |||||||||||
| Workers’ compensation |
33.4 | — | 24.9 | 24.9 | — | 74.6 | 74.6 | |||||||||||
| Other commercial |
26.0 | — | 6.5 | 6.5 | — | 24.8 | 24.8 | |||||||||||
| Total business |
402.0 | 6.4 | 200.8 | 207.2 | 1.6 | 49.9 | 51.5 | |||||||||||
| Total SAP personal and business |
$ | 1,011.6 | $ | 37.1 | $ | 548.5 | $ | 585.6 | 3.7 | 54.2 | 57.9 | |||||||
The personal insurance segment non-cat loss ratio was 4.6 points higher in 2008 than in 2007. Standard and non-standard auto’s SAP Loss and LAE ratio increases were attributed primarily to an increase in the severity of bodily injury claims and uninsured motorists’ claims as well as to an increase in claim frequency for these lines of business. In addition, in 2008, competitive market conditions limited our ability to obtain price increases in standard auto. As mentioned above, rate actions taken in our non-standard line of business in early 2008 will not be fully realized until 2009. The non-cat ratio for homeowners remained relatively flat when compared to 2007.
69
Table of Contents
The business insurance segment’s non-cat loss ratio for 2008 was 9.9 points higher than in 2007. The intense competition in the business insurance segment continues to impact our ability to implement price increases, and contributed significantly to the increase in our non-cat loss ratio. For commercial auto, rate decreases were the primary drivers of the increase in our non-cat loss ratio. For other & product liability, the increase in loss ratio was driven by development of losses from prior accident years and, to a lesser extent, rate decreases. For fire & allied lines and workers’ compensation, the increase in loss ratio was primarily due to an increase in the severity of current year claims.
Loss and loss expenses payable by major line of business as of December 31, 2008 and 2007 and at January 1, 2008 as a result of the 2008 pooling changes, are shown in the following table:
| ($ millions) | December 31, 2008 |
December 31, 2007 |
January 1, 2008(1) |
$ Change(2) | |||||||
| Personal insurance segment: |
|||||||||||
| Standard auto |
$ | 188.5 | $ | 169.1 | $ | 177.9 | 10.6 | ||||
| Nonstandard auto |
19.6 | 18.3 | 18.3 | 1.3 | |||||||
| Homeowners |
68.6 | 53.4 | 62.5 | 6.1 | |||||||
| Other personal |
14.6 | 8.9 | 9.7 | 4.9 | |||||||
| Total personal |
291.3 | 249.7 | 268.4 | 22.9 | |||||||
| Business insurance segment: |
|||||||||||
| Commercial auto |
93.5 | 77.8 | 89.1 | 4.4 | |||||||
| Commercial multi-peril |
91.5 | 78.8 | 85.9 | 5.6 | |||||||
| Fire & allied lines |
38.6 | 20.3 | 21.9 | 16.7 | |||||||
| Other & product liability |
152.3 | 130.1 | 139.0 | 13.3 | |||||||
| Workers’ compensation |
97.1 | 85.5 | 88.7 | 8.4 | |||||||
| Other business |
5.7 | 4.9 | 5.4 | 0.3 | |||||||
| Total business |
478.7 | 397.4 | 430.0 | 48.7 | |||||||
| Total losses and loss expenses payable, net of reinsurance recoverable on losses and loss expenses payable |
$ | 770.0 | $ | 647.1 | $ | 698.4 | 71.6 | ||||
| (1) | The December 31, 2007 loss and loss expenses payable balance has been adjusted for comparative purposes to reflect the loss and loss expenses payable assumed by us on January 1, 2008 from the 2008 pooling changes. |
| (2) | Calculated based on December 31, 2008 change from January 1, 2008. |
As shown in the table above, there was a $71.6 million increase in total loss and loss expense reserves during 2008. The increase relates primarily to higher levels of reserves for catastrophe losses largely related to Hurricane Ike and an increase in reserves corresponding to our Organic Growth. We conduct periodic reviews of loss development reports and make judgments in determining the reserves for ultimate losses and loss expenses payable. Several factors are considered by us when estimating ultimate liabilities including consistency in relative case reserve adequacy, consistency in claims settlement practices, recent legal developments, historical data, actuarial projections, accounting projections, exposure changes, anticipated inflation, current business conditions, catastrophe developments, late reported claims and other reasonableness tests.
The risks and uncertainties inherent in our estimates include, but are not limited to, actual settlement experience different from historical data, trends, changes in business and economic conditions, court decisions creating unanticipated liabilities, ongoing interpretation of policy provisions by the courts, inconsistent decisions in lawsuits regarding coverage and additional information discovered before settlement of claims. Our results of operations and financial condition could be impacted, perhaps significantly, in the future if the ultimate payments required to settle claims vary from the liability currently recorded.
70
Table of Contents
Acquisition and Operating Expenses
Our GAAP expense ratio was 34.6% in 2008 compared to 34.4% in 2007. The 2008 GAAP expense ratio was negatively impacted by approximately 0.7 points related to our launching of Innovate SA, previously discussed, and the actions we took to reduce headcount. In addition, during the 2008 fourth quarter we offered eligible associates an early retirement option as well as reducing staff by almost 50 people. Combining the early retirement option, 2008 reduction in staff and not replacing open positions, we plan to reduce our headcount by approximately 150 positions by the end of the 2009 second quarter. The 2008 GAAP expense ratio was positively impacted from 2007 by a decrease in our variable compensation programs for both our associates and agents. These programs are directly related to our loss experience which, as previously discussed, was worse in 2008 when compared to 2007.
Investment Operations Segment
Our investment portfolio and the investment portfolios of other members of the State Auto Group are managed by our subsidiary, Stateco. The Investment Committee (the “Committee”) of the Board of Directors establishes the investment policies to be followed by Stateco.
At December 31, 2008, our investments in fixed maturities, equity securities and certain other invested assets were held as available-for-sale and carried at fair value. The unrealized holding gains or losses, net of applicable deferred taxes, are included as a separate component of stockholders’ equity as “accumulated other comprehensive loss” and as such are not included in the determination of net income (loss).
Our primary investment objectives are to generate income, preserve capital and maintain adequate liquidity for the payment of claims and expenses. Our current investment strategy does not rely on the use of derivative financial instruments.
We have investment policy guidelines with respect to purchasing fixed maturity investments for our insurance subsidiaries which preclude investments in bonds that are rated below investment grade by a recognized rating service. For the insurance subsidiaries, the maximum investment in any single note or bond is limited to 5.0% or less of statutory assets, other than obligations of the U.S. government or government agencies, for which there is no limit. Our fixed maturity portfolio is composed of high quality, investment grade issues, comprised almost entirely of debt issues rated AAA or AA. At December 31, 2008, fixed maturity investments rated below investment grade accounted for less than 0.1% of our total available-for-sale investment portfolio. At December 31, 2008 and 2007, our only investments in asset-backed securities were in federal agency pools (Fannie Mae and Freddie Mac) and government guaranteed pools (Ginnie Mae).
Our internally managed equity portfolio invests in U.S. large-cap, dividend-paying companies across many different industries selected based upon their potential for appreciation as well as ability to continue paying dividends. This diversification across companies and industries reduces volatility in the value of the large-cap equity portfolio. In addition, our investment policy guidelines limit the purchase of a specific stock to no more than 2% of the market value of the stock at the time of purchase, and no single equity holding should exceed 5% of the total equity portfolio.
Our externally managed equity portfolios invest in U.S. small-cap equities and international funds. These managers are permitted to manage the portfolios according to their own respective portfolio objectives. In selecting our outside investment managers we confirm that their portfolio objectives, including risk tolerance, are acceptable to us. However, there may be slight differences in their objectives with respect to dividend payments and other constraints that we apply to our large cap equity holdings.
Diversifying our portfolio into small-cap equities and international funds was designed to achieve a greater total return with reduced volatility. In 2008 almost all asset classes experienced a decline in value and our portfolio was not immune to this broad-based decline. We believe that in most market cycles, diversification of the portfolio will be beneficial to us and we plan to continue to maintain a diversified portfolio.
71
Table of Contents
The following table indicates our target asset allocation as approved by the Committee:
| Cash and cash equivalents |
3.5 | % | |
| Core fixed maturities |
69.0 | ||
| Treasury inflation protected securities |
10.0 | ||
| Large-cap equities |
10.5 | ||
| Small-cap equities |
3.0 | ||
| International funds |
4.0 | ||
| Total portfolio |
100.0 | % | |
Composition of Investment Portfolio
As funds become available, either through cash flow from operations, maturities or sales of investments, our objective is to allocate funds to help us achieve our targeted asset allocations over the long term. The following table provides a breakdown of our investment portfolio relative to our targeted allocated percentages at December 31, 2008. As concerns began to arise in the market place in the last half of 2008 we took a more conservative approach to preserve higher cash balances than our targeted allocation. As we observed markets weakening, we began holding higher cash balances to avoid selling assets at depressed prices for any cash needs that might arise in the course of business, which included settling the claim activity associated with the catastrophes previously discussed. Consequently, cash balances at year-end were somewhat higher than the target. Additionally, approximately $22.3 million is held at the holding company level for State Auto Financial obligations and will remain in short-term funds. See “Liquidity and Capital Resources” included in this Item 7. We measure our investment portfolio allocation with fixed maturities at amortized cost and equities and other invested assets at fair value.
| ($ millions) | % of Total | ||||
| Cash and cash equivalents |
$ | 150.5 | 7.2 | ||
| Fixed maturities: |
|||||
| Core fixed maturities |
1,703.2 | 81.1 | |||
| Treasury inflation protected securities |
77.9 | 3.7 | |||
| Total fixed maturities |
1,781.1 | 84.8 | |||
| Equities: |
|||||
| Large-cap equities |
130.2 | 6.2 | |||
| Small-cap equities |
7.3 | 0.3 | |||
| Total equities |
137.5 | 6.5 | |||
| Other invested assets: |
|||||
| International funds |
28.8 | 1.4 | |||
| Other invested assets |
2.9 | 0.1 | |||
| Total other invested assets |
31.7 | 1.5 | |||
| Total portfolio |
$ | 2,100.8 | 100.0 | ||
72
Table of Contents
The following table provides the composition of our available-for-sale investment portfolio at fair value at December 31:
| ($ millions) | 2008 | 2007 | ||||||||||
| Fixed maturities |
$ | 1,770.7 | 91.3 | $ | 1,745.4 | 86.4 | ||||||
| Equity securities |
137.5 | 7.1 | 254.2 | 12.6 | ||||||||
| Other invested assets |
31.7 | 1.6 | 19.8 | 1.0 | ||||||||
| Total investments, at fair value |
$ | 1,939.9 | 100.0 | % | $ | 2,019.4 | 100.0 | % | ||||
The amortized cost and fair value of fixed maturities at December 31, 2008, by contractual maturity, were as follows:
| ($ millions) | Amortized cost |
Fair value | |||
| Due in 1 year or less |
$ | 2.5 | 2.5 | ||
| Due after 1 year through 5 years |
107.6 | 111.2 | |||
| Due after 5 years through 10 years |
469.0 | 482.5 | |||
| Due after 10 years |
1,023.5 | 994.2 | |||
| U.S. government agencies residential mortgage-backed securities |
178.5 | 180.3 | |||
| Total |
$ | 1,781.1 | 1,770.7 | ||
Expected maturities may differ from contractual maturities as issuers may have the right to call or prepay the obligations with or without call or prepayment penalties.
At December 31, 2008, our equity portfolio consisted of approximately 71 different large-cap stocks and 335 small-cap stocks. The largest single position was 3.8% of the equity portfolio based on fair value and the top ten positions account for 29.8% of the equity portfolio.
Since our equity portfolio consists primarily of large-cap value-oriented stocks, with a small allocation to small-cap equities, when large-cap stocks and/or value-oriented stocks perform well our equity portfolio typically performs well compared to benchmarks. Conversely, when growth stocks outperform value and/or small- to mid-cap stocks outperform large-cap stocks, our equity portfolio does not perform as well compared to benchmarks.
The chart below shows the industry sector breakdown of our large-cap equity portfolio versus the S&P 500 Index based on fair value as of December 31, 2008.
| Industry sector | Equity portfolio % of fair value |
S&P 500 index % of fair value | ||
| Basic materials |
2.2 | 2.9 | ||
| Communications |
4.1 | 3.8 | ||
| Consumer cyclical |
18.4 | 8.4 | ||
| Consumer non-cyclical |
14.9 | 13.0 | ||
| Energy |
6.6 | 13.4 | ||
| Financial |
9.4 | 13.1 | ||
| Health care |
5.1 | 14.9 | ||
| Industrial |
23.8 | 11.0 | ||
| Technology |
15.5 | 15.3 | ||
| Utilities |
— | 4.2 | ||
| Total |
100.0 | 100.0 | ||
73
Table of Contents
Investment Operations Revenue
Net investment income for 2008 was $87.4 million compared to $84.7 million in 2007. The growth in net investment income is attributed to an increase in average invested assets, from $1,987.1 million at December 31, 2007 to $2,127.6 million at December 31, 2008, primarily due to the January 1, 2008 $92.0 million in cash received in conjunction with the 2008 pooling changes.
| ($ millions) | Year Ended December 31 | ||||||
| 2008 | 2007 | ||||||
| Gross investment income: |
|||||||
| Fixed maturities |
$ | 79.1 | $ | 75.3 | |||
| Equity securities |
5.5 | 5.7 | |||||
| Other |
4.9 | 5.5 | |||||
| Total gross investment income |
89.5 | 86.5 | |||||
| Less: Investment expenses |
2.1 | 1.8 | |||||
| Net investment income |
$ | 87.4 | $ | 84.7 | |||
| Average invested assets (at cost) |
$ | 2,127.6 | $ | 1,987.1 | |||
| Annualized investment yield |
4.1 | % | 4.3 | ||||
| Annualized investment yield, after tax |
3.6 | % | 3.7 | ||||
| Net investment income, after tax |
$ | 76.6 | $ | 73.6 | |||
| Effective tax rate |
12.4 | 13.2 | |||||
Our investment yield declined to 4.1% in 2008 from 4.3% in 2007 due to the following factors: we held fewer large cap dividend paying stocks as we diversified into small cap stocks and international funds; and as the financial markets began to weaken in the last half of 2008, we held higher levels of cash balances which earned lower yields than in 2007.
Realized gains and losses on investments for the years ended December 31, 2008 and 2007, respectively, are summarized as follows:
| ($ millions) | 2008 | 2007 | ||||||||||||||
| Realized gains |
Proceeds received on sale |
Realized gains (losses) |
Proceeds received on sale | |||||||||||||
| Realized gains: |
||||||||||||||||
| Fixed maturities |
$ | 2.7 | $ | 164.6 | $ | 0.8 | $ | 82.5 | ||||||||
| Equity securities |
9.6 | 41.0 | 19.7 | 76.2 | ||||||||||||
| Other invested assets |
— | — | — | — | ||||||||||||
| Total realized gains |
12.3 | 205.6 | 20.5 | 158.7 | ||||||||||||
| Realized losses: |
||||||||||||||||
| Fixed maturities—Sales |
— | — | (1.3 | ) | 72.7 | |||||||||||
| Equity securities: |
||||||||||||||||
| Sales |
(9.4 | ) | 26.0 | (5.2 | ) | 30.8 | ||||||||||
| OTTI |
(28.3 | ) | — | (1.9 | ) | — | ||||||||||
| Other invested assets—OTTI |
(11.0 | ) | — | — | — | |||||||||||
| Total realized losses |
(48.7 | ) | 26.0 | (8.4 | ) | 103.5 | ||||||||||
| Net realized gain (loss) on investments |
$ | (36.4 | ) | $ | 231.6 | $ | 12.1 | $ | 262.2 | |||||||
74
Table of Contents
Equity sales were executed for various reasons in 2008, including the achievement of our price target and generated $9.6 million in gains for that period. The $48.7 million of realized losses for 2008 include the recognition of realized losses from sales activity of $9.4 million. We recognized realized losses on the sale of certain equity positions within the consumer, manufacturing and financial services sectors due to announced changes in business conditions which, in our opinion, greatly diminished future business prospects.
When an equity security or other invested asset has been determined to have a decline in fair value that is other-than-temporary, we adjust the cost basis of the security to fair value. See “Critical Accounting Policies—Investments” included in this Item 7 for OTTI impairment indicators. This results in a charge to earnings as a realized loss, which is not reversed for subsequent recoveries in fair value. Future increases or decreases in fair value, if not other-than-temporary, are included in accumulated other comprehensive income (loss).
When a fixed maturity has been determined to have a decline in fair value, the impairment charge is separated into an amount representing the credit loss, which is recognized in earnings, and the amount related to non-credit factors, which is recognized in accumulated other comprehensive income (loss). See “Critical Accounting Policies—Investments” included in this Item 7 for OTTI impairment indicators. Future increases or decreases in fair value, if not other-than-temporary, are included in accumulated other comprehensive income (loss). In 2008, we recognized realized losses that were less than $0.1 million.
The $48.7 million of realized losses for 2008 include the recognition of OTTI in our available-for-sale investment portfolio of $39.3 million. The following table provides a detailed breakdown by security type (and by sector for the large cap portfolio) for the 2008 OTTI charges.
| ($ millions) | Number of positions |
Total impairment |
||||
| Equity Securities: |
||||||
| Large-cap securities |
26 | (24.2 | ) | |||
| Small-cap securities |
530 | (4.1 | ) | |||
| Total equity securities |
556 | (28.3 | ) | |||
| Other invested assets: |
||||||
| International funds |
2 | (11.0 | ) | |||
| Total OTTI |
558 | $ | (39.3 | ) | ||
Gross Unrealized Investment Gains and Losses
A review of our investment portfolio at December 31, 2008, determined that there were no individual investments with an unrealized holding loss that had a fair value significantly below cost continually for more than one year.
75
Table of Contents
The following table provides detailed information on our available-for-sale investment portfolio at fair value for our gross unrealized gains and losses at December 31, 2008.
| ($ millions, except number of positions)
Investment Category: |
Cost or amortized cost |
Gross unrealized holding gains |
Number of gain positions |
Gross unrealized holding losses |
Number of loss positions |
Fair Value | |||||||||||
| Fixed maturities: |
|||||||||||||||||
| U.S. treasury securities |
$ | 127.6 | $ | 4.2 | 42 | $ | (4.2 | ) | 29 | $ | 127.6 | ||||||
| States and political subdivisions |
1,463.1 | 21.4 | 288 | (33.5 | ) | 357 | 1,451.0 | ||||||||||
| Corporate securities |
11.9 | 0.1 | 7 | (0.2 | ) | 7 | 11.8 | ||||||||||
| U.S. government agencies residential mortgage-backed securities |
178.5 | 4.0 | 42 | (2.2 | ) | 29 | 180.3 | ||||||||||
| Total fixed maturities |
1,781.1 | 29.7 | 379 | (40.1 | ) | 422 | 1,770.7 | ||||||||||
| Equity securities: |
|||||||||||||||||
| Large-cap securities |
137.5 | 6.1 | 32 | (13.4 | ) | 41 | 130.2 | ||||||||||
| Small-cap securities |
6.8 | 0.5 | 333 | — | — | 7.3 | |||||||||||
| Total equity securities |
144.3 | 6.6 | 365 | (13.4 | ) | 41 | 137.5 | ||||||||||
| Other invested assets |
32.4 | — | — | (0.7 | ) | 2 | 31.7 | ||||||||||
| Total investments |
$ | 1,957.8 | $ | 36.3 | 744 | $ | (54.2 | ) | 465 | $ | 1,939.9 | ||||||
The following table presents a summary of our cumulative unrealized holding (loss) gain by investment type, net of deferred taxes that were included as a component of accumulated comprehensive loss at December 31, 2008 and December 31, 2007, respectively, and the change in unrealized holding gain (loss), net of deferred tax, for the year ended December 31, 2008:
| ($ millions) | December 31, 2008 |
December 31, 2007 |
$ Change |
|||||||||
| Available-for-sale investments |
||||||||||||
| Cumulative unrealized holding (loss) gain: |
||||||||||||
| Fixed maturities |
$ | (10.4 | ) | $ | 22.5 | $ | (32.9 | ) | ||||
| Equities |
(6.8 | ) | 44.0 | (50.8 | ) | |||||||
| Other invested assets |
(0.7 | ) | 0.3 | (1.0 | ) | |||||||
| Cumulative unrealized holding (loss) gain |
(17.9 | ) | 66.8 | (84.7 | ) | |||||||
| Deferred federal income tax asset (liability) |
6.3 | (23.4 | ) | 29.7 | ||||||||
| Valuation allowance |
(2.6 | ) | — | (2.6 | ) | |||||||
| Cumulative unrealized holding (loss) gain, net of tax |
$ | (14.2 | ) | $ | 43.4 | $ | (57.6 | ) | ||||
Fair Value Measurements
We primarily use one independent nationally recognized pricing service in developing fair value estimates. We obtain one price per security, and our processes and control procedures are designed to ensure the value is accurately recorded on an unadjusted basis. Through discussions with the pricing service, we gain an understanding of the methodologies used to price the different types of securities, that the data and the valuation methods utilized are appropriate and consistently applied, and that the assumptions are reasonable and representative of fair value. To validate the reasonableness of the valuations obtained from the pricing service,
76
Table of Contents
we compare to other fair value pricing information gathered from other independent pricing sources. See Note 3, “Fair Value of Financial Instruments” to our Consolidated Financial Statements included in Item 8 of this Form 10-K for a presentation of our available-for-sale investments within the fair value hierarchy at December 31, 2008.
As of December 31, 2008, Level 3 assets as a percentage of total assets were 1.3%, which we have determined to be insignificant.
Other Income Statement Items
The effective tax rate for 2008 was a benefit of 58.6% compared to an expense rate of 23.3% for 2007. Included in our 2008 loss before federal income taxes are tax-exempt earnings related to our investment portfolio which is the significant contributing differential between the actual 58.6% and the expected statutory rate of 35.0%.
In 2008, a $3.1 million valuation allowance was established against our deferred tax asset to the extent we could not demonstrate recoverability of the asset. The valuation allowance was allocated $0.5 million to deferred tax expense associated with our OTTI realized investment losses recognized in the income statement and $2.6 million against the unrealized holding losses on equity securities recognized through accumulated other comprehensive loss, a component of equity. In the opinion of management, it is more likely than not that we will realize the benefit of our net deferred tax asset. The $0.5 million portion of the valuation allowance reflected in the income statement had the effect of decreasing the effective tax rate benefit by 0.7 percent. No valuation allowance was held at December 31, 2007.
LIQUIDITY AND CAPITAL RESOURCES
General
Liquidity refers to our ability to generate adequate amounts of cash to meet our short and long term needs. Our primary sources of cash are premiums, investment income, investment sales and the maturity of fixed income security investments. The significant outflows of cash are payments of claims, commissions, premium taxes, operating expenses, income taxes, dividends, interest and principal payments on debt and investment purchases. The cash outflows may vary due to uncertainties regarding settlement of large losses or catastrophe events. As a result, we continually monitor our investment and reinsurance programs to ensure they are appropriately structured to enable the insurance subsidiaries to meet anticipated short and long-term cash requirements without the need to sell investments to meet fluctuations in claim payments.
We maintain a portion of our investment portfolio in relatively short-term and highly liquid investments to ensure the immediate availability of funds to pay claims and expenses. At December 31, 2009 and 2008, we had $90.3 million and $150.5 million, respectively, in cash and cash equivalents, and $2,108.2 million and $1,939.9 million, respectively, of total available-for-sale investments at fair value. Included in our fixed maturities available-for-sale at fair value are $56.9 million and $56.0 million of securities on deposit with insurance regulators as required by law at December 31, 2009 and 2008, respectively. In addition, substantially all of our fixed maturity and equity securities are traded on public markets. For a further discussion regarding investments, see “Investments Operations Segment” included in this Item 7.
Our insurance subsidiaries must have adequate liquidity to ensure that their cash obligations are met. However, because the STFC Pooled Companies participate in the Pooling Arrangement, they do not have the daily liquidity concerns normally associated with an insurance company. This is because under the terms of the Pooling Arrangement, State Auto Mutual receives all premiums and pays all losses and expenses associated with the insurance business produced by the pool participants and then settles the intercompany balances generated by these transactions with the participating companies within 45 days following each quarter end.
77
Table of Contents
When settling the intercompany balances, State Auto Mutual provides the pool participants with full credit for the premiums written and net losses paid during the quarter and retains all receivable amounts from insureds and agents and reinsurance recoverable on paid losses from unaffiliated reinsurers. Any receivable amounts that are ultimately deemed to be uncollectible are charged-off by State Auto Mutual and allocated to the pool member on the basis of pool participation. As a result, we have an off-balance sheet credit–risk related to the balances due to State Auto Mutual from insureds, agents and reinsurers, which are offset by the unearned premium from the respective policies. While the total amount due to State Auto Mutual from policyholders and agents is significant, the individual amounts due are relatively small at the policyholder and agency level. Based on historical data, this credit-risk exposure is not considered to be material to our financial position, though the impact to income on a quarterly basis may be material. The State Auto Group mitigates its exposure to this credit risk through its in-house collections unit for both personal and commercial accounts which is supplemented by third party collection service providers. The amounts deemed uncollectible by State Auto Mutual and allocated to the STFC Pooled Companies are included in Other Expenses in the accompanying consolidated Statements of Income.
The State Auto Group’s reliance on ceded reinsurance is not significant in comparison to the State Auto Group’s total statutory surplus or our total financial position. To minimize the risk of reinsurer default, the State Auto Group cedes only to third-party reinsurers who are rated A- or better by A.M. Best and also utilizes both domestic and international markets to diversify its credit risk. We utilize reinsurance to limit our loss exposure and contribute to our liquidity and capital resources. For a discussion of our reinsurance arrangements, see “Reinsurance Arrangements” included in this Item 7.
Net cash provided by operating activities was $110.5 million, $183.5 million and $121.6 million for 2009, 2008 and 2007, respectively. Net cash from operations may vary from year to year if there are significant changes in underwriting results from the previous four quarters, investment income or federal income taxes. Below are the primary factors that contributed to the variance in operating cash flows for these years:
| • | Each quarter we settle our intercompany account from the previous quarter with State Auto Mutual, who acts as our cash administrator. We receive our premiums and pay our losses and expenses through this account. In quarters where premiums exceed losses and expenses, we receive money. In quarters where losses and expenses exceed premiums, we pay money. We received $0.3 million, $24.7 million and $82.9 million through this account for the years ended December 31, 2009, 2008 and 2007, respectively. The variability between years was primarily driven by the level of catastrophe losses and the timing of their settlement; |
| • | We received a federal income tax refund of $38.1 million in 2009 compared to federal income tax payments of $18.2 million and $42.3 million in 2008 and 2007, respectively; and |
| • | Cash from operations in 2008 included $92.0 million due to the 2008 pooling change. |
We generally manage our cash flows through current operational activity and maturing investments, without a need to liquidate any of our other investments. However, should our written premium decline or paid losses increase significantly, or a combination thereof, our cash flows from operations could be impacted requiring us to liquidate investments at losses. This action was not necessary in 2009 or 2008 despite the increased level of catastrophe losses.
During 2009, 2008 and 2007, as permitted by regulations of the Internal Revenue Service, we made cash contributions of $15.0 million, $12.0 million and $11.5 million, respectively, to our defined benefit pension plan on behalf of our employees. The actuarially determined contribution to our defined benefit pension plan ranges from the minimum amount we would be required to contribute to the maximum amount that would be tax deductible. Amounts contributed in excess of the minimum are deemed voluntary while amounts in excess of the maximum would be subject to an excise tax and may not be deductible for tax purposes. Amounts paid in each of these three years were within the minimum and maximum funding amounts that would be deductible for tax purposes. The actuarially determined funding amount to the plan is generally not determined until the second
78
Table of Contents
quarter with respect to the contribution year, though we currently expect to make a minimum cash contribution to our defined benefit pension plan up to approximately $15.0 million during 2010. For a further discussion regarding our defined benefit pension plan, see “Other—Employee Benefit Plans” included in this Item 7.
Net cash used in investing activities was $150.2 million, $51.5 million and $86.1 million for 2009, 2008 and 2007, respectively. The following contributed to the fluctuations between those years:
| • | In the last half of 2008, as markets began to weaken, we took a conservative approach to investing. We maintained higher cash balances to avoid selling assets at depressed prices for any cash needs, such as paying the claims associated with the high level of catastrophes occurring during the second half of the year. During 2009, as markets improved and claim activity settled into lower levels than 2008, we began reinvesting as opportunities arose. |
| • | The decline in cash used in investing activities in 2008 versus 2007 was primarily the result of an increase in the accumulation of cash for future claims settlements and intercompany payments to affiliates and to pay shareholder dividends. |
Our financing activities for 2009, 2008 and 2007 produced net cash outflows of $20.5 million, $52.4 million, and $38.0 million, respectively. The following contributed to the fluctuations between those years:
| • | Dividends paid to shareholders totaled $23.8 million, $23.9 million and $20.5 million for 2009, 2008 and 2007, respectively. The increase in dividends paid between 2008 and 2007 was due to increasing the amount of dividends paid per common share. Dividends paid per common share were $0.60 in 2009, $0.60 in 2008 and $0.50 in 2007. |
| • | Cash used to repurchase common shares under our stock repurchase program was $33.2 million and $22.1 million for 2008 and 2007, respectively. No shares were repurchased in 2009. See “Other Capital Transactions” below. |
Other Capital Transactions
On August 17, 2007, State Auto Financial’s board of directors authorized the repurchase, from time to time, of up to 4.0 million of its common shares, or approximately 10% of the Company’s outstanding shares. This program ended on December 31, 2009. State Auto Financial repurchased shares from State Auto Mutual in amounts that were proportional to its ownership percentages of State Auto Mutual, which was approximately 64%, and other shareholders. There were no shares repurchased for the year ended December 31, 2009. For the year ended December 31, 2008 a total of 1,214,586 of common shares were purchased under this program at an average repurchase price of $27.25 per share for a total of $33.2 million. For the lifetime of the program, a total of 2,028,116 common shares were purchased at an average purchase price of $27.26 per share for a total of $55.3 million.
On November 6, 2009, the Board of Directors of State Auto Financial declared a cash dividend of $0.15 per share. The dividend was payable on December 31, 2009, to shareholders of record on December 14, 2009. On March 5, 2010, the Board of Directors of State Auto Financial declared a cash dividend of $0.15 per share. The dividend is payable on March 31, 2010, to shareholders of record on March 15, 2010. This is the 75th consecutive quarterly cash dividend declared by State Auto Financial’s Board since we had our initial public offering of common stock on June 28, 1991.
To fund capital transactions and provide working capital to State Auto Financial, in 2009 Stateco, SA National and State Auto P&C declared cash dividends of $5.0 million, $6.5 million and $5.0 million, respectively. The cash transfers of dividends were completed in 2009. The dividends from SA National and State Auto P&C were paid from unassigned statutory surplus and were not considered to be extraordinary for regulatory purposes.
79
Table of Contents
Borrowing Arrangements
Credit Agreement
State Auto Financial has a credit facility (the “Credit Facility”) with a syndicate of financial institutions. The Credit Facility provides for a $100.0 million unsecured revolving credit facility maturing in July 2012. The Credit Facility is available for general corporate purposes. The Credit Facility provides for interest-only payments during its term, with principal and interest due in full at maturity. Interest is based on a London interbank market rate or a base rate plus a calculated margin amount. The Credit Facility includes certain covenants, including financial covenants that require State Auto Financial to maintain a minimum net worth and not exceed a certain debt to capitalization ratio. As of December 31, 2009, State Auto Financial had not made any borrowings and was in compliance with all covenants related to the Credit Facility.
Senior Notes
State Auto Financial has outstanding $100.0 million of unsecured Senior Notes due November 2013. The Senior Notes bear interest at a fixed rate of 6.25% per annum, which is payable each May 15 and November 15. The Senior Notes are general unsecured obligations ranking senior to all existing and future subordinated indebtedness and equal with all existing and future senior indebtedness. The Senior Notes are not guaranteed by any of State Auto Financial’s subsidiaries and thereby are effectively subordinated to all State Auto Financial’s subsidiaries’ existing and future indebtedness.
Subordinated Debentures
State Auto Financial’s Delaware business trust subsidiary (the “Capital Trust”) has outstanding $15.0 million liquidation amount of capital securities, due 2033. In connection with the Capital Trust’s issuance of the capital securities and the related purchase by State Auto Financial of all of the Capital Trust’s common securities (liquidation amount of $0.5 million), State Auto Financial has issued to the Capital Trust $15.5 million aggregate principal amount of unsecured Floating Rate Junior Subordinated Debt Securities due 2033 (the “Subordinated Debentures”). The sole assets of the Capital Trust are the Subordinated Debentures and any interest accrued thereon. Interest on the Capital Trust’s capital and common securities is payable quarterly at a rate equal to the three-month LIBOR rate plus 4.20%, adjusted quarterly. The applicable interest rates for December 31, 2009 and 2008 were 4.46% and 6.38%, respectively.
Notes Payable Summary
The following summarized our notes payable at December 31, 2009:
| ($ millions) | Carrying Value |
Fair Value |
Interest Rate |
||||||
| Senior Notes due 2013: issued $100.0 million, November 2003 with fixed interest |
$ | 101.7 | $ | 101.8 | 6.25 | % | |||
| Subordinated Debentures due 2033: issued $15.5 million, May 2003 with variable interest adjusting quarterly |
15.5 | 15.5 | 4.46 | % | |||||
| Total Notes Payable |
$ | 117.2 | $ | 117.3 | |||||
Related to our notes payable, our primary market risk exposure is to the change in interest rates and our credit rating. For a discussion regarding our credit ratings see “Credit and Financial Strength Ratings” included in this Item 7. Based upon the notes payable carrying value at December 31, 2009, we had $15.5 million notes payable with variable interest and $101.7 million notes payable with interest fixed at 6.25%, which equated to approximately 13.2% variable interest debt and 86.8% fixed interest debt. Our decision to obtain fixed versus
80
Table of Contents
variable interest rate debt is influenced primarily by the following factors: (a) current market interest rates (b) anticipated future market interest rates (c) availability of fixed versus variable interest instruments and (d) our currently existing notes payable fixed and variable interest rate position. See our contractual obligations table included in “Contractual Obligations”.
Reinsurance Arrangements
Members of the State Auto Group follow the customary industry practice of reinsuring a portion of their exposures and paying to the reinsurers a portion of the premiums received. Insurance is ceded principally to reduce net liability on individual risks or for individual loss occurrences, including catastrophic losses. Although reinsurance does not legally discharge the individual members of the State Auto Group from primary liability for the full amount of limits applicable under their policies, it does make the assuming reinsurer liable to the extent of the reinsurance ceded.
Each member of the State Auto Group is party to working reinsurance treaties for casualty, workers’ compensation and property lines with several reinsurers arranged through a reinsurance intermediary. These agreements are described in more detail below. We have also secured other reinsurance to limit the net cost of large loss events for certain types of coverage written in certain companies, including reinsurance covering umbrella liability losses up to a limit of $10.0 million with a maximum of $0.6 million retention. The State Auto Group also makes use of facultative reinsurance for unique risk situations. Facultative reinsurance provides for a separate reinsurance agreement covering a particular risk or insurance policy. The State Auto Group also participates in state insurance pools and associations. In general, these pools and associations are state sponsored and/or operated, impose mandatory participation by insurers doing business in that state, and offer coverage for hard-to-place risks at premium rates established by the state sponsor or operator, thereby transferring risk of loss to the participating insurers in exchange for premiums which may not be commensurate with the risk assumed.
The casualty excess of loss reinsurance agreement provides that each company in the State Auto Group is responsible for the first $2.0 million of a covered loss. The reinsurers are responsible for 100% of the excess over $2.0 million up to $5.0 million of covered loss. Also, certain unusual claim situations involving bodily injury liability, property damage, uninsured motorist and personal injury protection are covered by an arrangement that provides for $10.0 million of coverage in excess of $5.0 million retention for each loss occurrence. This layer of reinsurance sits above the $3.0 million excess of $2.0 million arrangement. The rates for this reinsurance are negotiated annually.
The workers’ compensation excess of loss reinsurance agreement provides that each company in the State Auto Group is responsible for the first $2.0 million of covered loss. The reinsurers are responsible for 100% of the excess over $2.0 million up to $10.0 million of covered loss. Net retentions under this agreement may be submitted to the casualty excess of loss agreement, subject to a limit of $2.0 million per loss occurrence. The rates for this reinsurance are negotiated annually.
In addition to the workers’ compensation reinsurance described above, each company in the State Auto Group is party to an agreement which provides an additional layer of reinsurance for workers’ compensation losses involving multiple workers. Subject to $10.0 million of retention, reinsurers are responsible for 100% of the excess over $10.0 million up to $20.0 million of covered loss. This coverage is subject to a “Maximum Any One Life” limitation of $10.0 million. This limitation means that losses associated with each worker may contribute no more than $10.0 million to covered loss under this agreement. The rates for this reinsurance are negotiated annually.
The property per risk excess of loss reinsurance agreement provides that each company in the State Auto Group is responsible for the first $3.0 million of each covered loss, as well as an additional $2.0 million in aggregate retention per treaty year. The reinsurers are responsible for 100% of the excess over $3.0 million up to $20.0 million of covered loss. The rates for this reinsurance are negotiated annually.
81
Table of Contents
Members of the State Auto Group maintain a property catastrophe excess of loss reinsurance agreement covering catastrophe related events affecting at least two risks. On a combined basis, the members of the State Auto Group retain the first $55.0 million of catastrophe loss, each occurrence, with a 5% co-participation on the next $100 million of covered loss, each occurrence. The reinsurers are responsible for 95% of the excess over $55.0 million up to $155.0 million of covered losses, each occurrence. Our companies are responsible for losses above $155.0 million. The rates for this reinsurance are negotiated annually.
Members of the State Auto Group also maintain a property catastrophe net aggregate excess of loss reinsurance agreement (the “Catastrophe Aggregate Agreement”). The agreement, which was reviewed and renewed as of January 1, 2010, provides reinsurance coverage on an annual basis for certain qualifying catastrophic events, including certain events falling below the $55.0 million retention under the property catastrophe excess of loss reinsurance agreement previously described. Events covered by the Catastrophe Aggregate Agreement must be PCS numbered catastrophes, excluding earthquakes and named storms such as hurricanes and tropical storms. Individual occurrences are capped at $55.0 million and are subject to a $5.0 million franchise deductible, meaning occurrences producing losses totaling less than $5.0 million are excluded. Subject to these limitations, qualifying losses from individual occurrences are then aggregated over the course of the reinsurance term, January 1, 2010 through December 31, 2010. On an aggregate basis the members of the State Auto Group combined retain the first $90.0 million of covered loss, with a 25% co-participation on the next $30.0 million of covered loss. The reinsurer is responsible for 75% of the excess over $90.0 million up to $120.0 million of covered loss on an aggregate basis. The rates for this reinsurance are negotiated annually. Prior to January 1, 2010 the aggregate retention under this agreement was $80.0 million.
Contractual Obligations
Our significant contractual obligations as of December 31, 2009, were as follows:
| ($ millions) | Total | Due 1 year or less |
Due 1-3 years |
Due 3-5 years |
Due after 5 | ||||||||||
| Direct Loss and ALAE Reserves(1) |
$ | 882.5 | $ | 357.0 | $ | 300.4 | $ | 107.9 | $ | 117.2 | |||||
| Notes payable(2): |
|||||||||||||||
| Senior Notes due 2013: |
$ | 100.0 | $ | — | $ | — | $ | 100.0 | $ | — | |||||
| Subordinated Debentures due 2033: |
15.5 | — | — | — | 15.5 | ||||||||||
| Total notes payable |
$ | 115.5 | $ | — | $ | — | $ | 100.0 | $ | 15.5 | |||||
| Interest payable(2): |
|||||||||||||||
| Senior Notes due 2013: |
$ | 25.1 | $ | 6.3 | $ | 12.5 | $ | 6.3 | $ | — | |||||
| Subordinated Debentures due 2033: |
16.2 | 0.7 | 1.4 | 1.4 | 12.7 | ||||||||||
| Total interest payable |
$ | 41.3 | $ | 7.0 | $ | 13.9 | $ | 7.7 | $ | 12.7 | |||||
| Postretirement benefits |
$ | 46.8 | $ | 3.7 | $ | 7.7 | $ | 8.3 | $ | 27.1 | |||||
| Pension funding(5) |
$ | 113.1 | $ | — | $ | 41.0 | $ | 38.8 | $ | 33.3 | |||||
| Total |
$ | 1,199.2 | $ | 367.7 | $ | 363.0 | $ | 262.7 | $ | 205.8 | |||||
| (1) | We derived expected payment patterns separately for the direct Loss and ALAE Reserves. Amounts included the STFC Pooled Companies net additional share of transactions assumed from State Auto Mutual through the Pooling Arrangement. For a |
82
Table of Contents
| reconciliation of management’s best estimate, see “Loss and Loss Expense Reserves” included in this Item 7. These patterns were applied to the December 31, 2009, loss and ALAE payable to generate estimated annual incremental loss and ALAE payments for each subsequent calendar year. These amounts are based on historical payment patterns and do not represent actual contractual obligations. The actual payment amounts and the related timing of those payments could differ significantly from these estimates. |
| (2) | For a discussion of these debt instruments, see “Liquidity and Capital Resources—Borrowing Arrangements” included in this Item 7. |
| (3) | The Senior Notes bear interest at a fixed rate of 6.25% per annum, which is payable each May 15 and November 15. |
| (4) | Interest on the subordinated debentures was calculated using an interest rate equal to the three-month LIBOR rate at December 31, 2009 of 0.2506% plus 4.20%, or 4.4506%. |
| (5) | These amounts are estimates of ERISA minimum funding levels based on adjustments to prior year assumptions for our defined benefit pension plan and do not represent an estimate of our expected contributions. Funding levels generally are not determined until later in the year with respect to the contribution year. See Note 10, “Pension and Postretirement Benefits Plans” to our Consolidated Financial Statements included in Item 8 of this Form 10-K for a tabular presentation of expected benefit payments from the State Auto Group’s defined benefit pension plan. |
Lease and other purchase obligations of State Auto Mutual are allocated to us through the Pooling Arrangement.
Regulatory Considerations
At December 31, 2009, 2008 and 2007, each of our insurance subsidiaries was in compliance with statutory requirements relating to capital adequacy.
The National Association of Insurance Commissioners (“NAIC”) utilizes a collection of analytical tools designed to assist state insurance departments with an integrated approach to screening and analyzing the financial condition of insurance companies operating in their respective states. One such set of analytical tools is 12 key financial ratios that are known in the insurance industry as the “IRIS” ratios. IRIS ratios are derived from financial statements prepared on a statutory accounting basis, which are accounting practices prescribed or permitted by the insurance department with regulatory authority over our insurance subsidiaries. A “defined range” of results for each ratio has been established by the NAIC for solvency monitoring. While management utilizes each of these IRIS ratios in monitoring our insurance companies’ operating performance on a statutory accounting basis (each of our insurance subsidiaries operates within the defined range for the other measures), the net written premium to statutory surplus ratio (the “leverage ratio”) is monitored to ensure that each of our insurance subsidiaries continue to operate within the “defined range” of 3.0 to 1.0. The higher the leverage ratio, the more risk a company bears in relation to statutory surplus available to absorb losses. In considering this range, management also considers the distribution of net premiums between property and liability lines of business. A company with a larger portion of net premiums from liability lines should generally maintain a lower leverage ratio.
The leverage ratios decreased slightly in 2009. While premiums grew 5.1%, surplus increased 8.0%. The increase in surplus was driven by unrealized holding gains on investments and net investment income. The statutory leverage ratios for our insurance subsidiaries at December 31, 2009, 2008 and 2007 were as follows:
| Statutory Leverage Ratios(1) | 2009 | 2008(2) | 2007 | |||
| State Auto P&C |
1.6 | 1.7 | 1.2 | |||
| Milbank |
1.6 | 1.6 | 1.2 | |||
| Farmers |
1.4 | 1.4 | 1.0 | |||
| SA Ohio |
1.1 | 1.1 | 1.0 | |||
| SA National |
0.6 | 0.6 | 0.6 | |||
| Weighted Average |
1.5 | 1.6 | 1.1 | |||
| (1) | We use the statutory leverage ratio as there is no comparable GAAP measure. |
| (2) | Table excludes the one-time impact on net written premiums of $53.6 million that occurred in conjunction with the 2008 pooling changes. |
83
Table of Contents
Our insurance subsidiaries pay dividends to State Auto Financial which in turn may be used by State Auto Financial to pay dividends to stockholders or to make principal and interest payments on debt. Individual states limit the amount of dividends that our insurance subsidiaries domiciled in those states can pay without prior approval. Under current law, at December 31, 2009 $68.2 million is available in 2010 for payment as a dividend from our insurance subsidiaries to State Auto Financial, without prior approval from our respective domiciliary state insurance departments. In 2009, 2008 and 2007, State Auto Financial received $11.5 million, $39.0 million and $50.0 million, respectively in dividends from its insurance subsidiaries. We are required to notify the insurance subsidiaries’ applicable state insurance commissioner within five business days after declaration of all such dividends and at least ten days prior to payment. Additionally, the domiciliary state commissioner of each insurance subsidiary has the authority to limit a dividend when the commissioner determines, based on factors set forth in the law, that an insurer’s surplus is not reasonable in relation to the insurer’s outstanding liabilities and adequate to meet its financial needs. Such restrictions are not expected to limit the capacity of State Auto Financial to meet its cash obligations.
State Auto Financial’s insurance subsidiaries are subject to regulation and supervision by the states in which they do business. The NAIC has developed Risk-Based Capital (“RBC”) requirements. RBC attempts to relate an individual insurance company’s statutory surplus to the risk inherent in its overall operations. RBC requires the calculation of a ratio of total adjusted statutory capital to authorized control level. Insurers with a ratio below 200% are subject to different levels of regulatory intervention and action. At December 31, 2009, the ratio of total adjusted statutory capital to authorized control level of State Auto Financial’s insurance subsidiaries ranged from 707% to 2,265%.
Credit and Financial Strength Ratings
The following table summarizes our credit and insurance company financial strength ratings as of February 25, 2010:
| A.M. Best | Moody’s | Standard & Poor’s | ||||
| STFC (credit rating) |
a- | Baa2 | BBB | |||
| STFC Pooled Companies (financial strength) |
A+ | A2 | A | |||
| SA National (financial strength) |
A+ | n/a | A | |||
We are reviewed regularly by the independent rating agencies listed in the table above. Ratings provide a meaningful way for policyholders, agents, creditors and stockholders to compare us to our competitors. The published credit ratings on State Auto Financial Senior Notes discussed above are opinions as to the ability of State Auto Financial to meet its ongoing obligations under the terms of the Senior Notes. Generally, credit ratings affect the cost, type and availability of debt financing. Higher rated securities receive more favorable pricing and terms relative to lower rated securities at the time of issue. State Auto Financial’s Senior Notes have been rated investment grade by each agency.
In February 2009 Moody’s lowered our credit rating from Baa1 to Baa2 due to Moody’s belief that the debt incurred by State Auto Mutual in connection with its acquisition of Rockhill Holding Company will reduce the ability of State Auto Mutual to offer contingent support to us. Contingent support had been the rationale for narrower notching between our credit rating and insurance financial strength rating (two notches instead of the customary three for U.S. insurance holding companies).
The published financial strength ratings on the insurance company subsidiaries of State Auto Financial are opinions as to the ability of those companies to meet their ongoing obligations to their policyholders. The A.M. Best financial strength ratings influence our ability to write insurance business as agents and policyholders generally prefer higher rated companies. Lower rated companies may be required to compete for agents and policyholders by offering higher commissions or lower premiums and expanded coverage, or a combination
84
Table of Contents
thereof. State Auto Mutual has received A.M. Best’s A+ or higher rating every year since 1954. The STFC Pooled Companies and the Mutual Pooled Companies are collectively assigned a pool rating by A.M. Best while SA National is rated by A. M. Best as a part of the total group.
Our ratings are influenced by many factors including operating and financial performance, asset quality, liquidity, financial leverage, exposure to catastrophe risks and operating leverage. Presently, our A.M. Best, Moody’s and Standard & Poor’s ratings are assigned stable outlooks.
OTHER
Impact of Inflation
Inflation can have a significant impact on property and casualty insurers because premium rates are established before the amount of losses and loss expenses are known. When establishing rates, we attempt to anticipate increases from inflation subject to the limitations of modeling economic variables. Even when general inflation, as measured by the Consumer Price Index, is relatively modest, as has been the case over the last several years, price inflation on the goods and services purchased by insurance companies in settling claims can steadily increase. For example, medical care costs have risen at a higher rate than general inflation over the last few years. Costs for building materials typically rise dramatically following substantial widespread natural catastrophes, such as the industry experienced in Florida and other states in 2004 in Mississippi and Alabama in 2005, and more recently with Hurricane Katrina in 2006. We continue to adjust our pricing projections to reflect current and anticipated changes in costs in all lines of business.
We consider inflation when estimating liabilities for losses and loss expenses, particularly for claims having a long period between occurrence and final settlement. The liabilities for losses and loss expenses are management’s best estimates of the ultimate net cost of underlying claims and expenses and are not discounted for the time value of money. In times of high inflation, the normally higher yields on investment income may partially offset potentially higher claims and expenses.
New Accounting Standards:
Adoption of Recent Accounting Pronouncements
Fair Value Measurements and Disclosures—Investments in Certain Entities That Calculate Net Asset Value per Share
In September 2009, the Financial Accounting Standards Board (“FASB”) issued new guidance on the fair value measurements and disclosures of investments in certain entities that calculate net asset value per share (or its equivalent). The new guidance, which is now part of the FASB Accounting Standards Codification (“ASC”) Topic Fair Value Measurements and Disclosures, permits, as a practical expedient, a reporting entity to estimate the fair value of an investment within its scope using net asset value per share of the investment (or its equivalent) without adjustment, as long as the net asset value is calculated as of the reporting entity’s measurement date in a manner consistent with the measurement principles of FASB ASC Topic Financial Services—Investment Companies. The new guidance also requires certain disclosures about the attributes of investments measured at net asset value, such as the nature of any restrictions on the investor’s ability to redeem its investment at the measurement date or any unfunded capital commitments. The new guidance was effective on a prospective basis for the first reporting period, including interim periods, ending after December 15, 2009. The adoption of this new guidance effective December 31, 2009 had no effect on our consolidated financial statements. The disclosures required by this new guidance are provided in Note 3 of the accompanying financial statements.
85
Table of Contents
Employers’ Disclosures about Postretirement Benefit Plan Assets
In December 2008, the FASB issued new guidance on the disclosure of pension or other postretirement benefit plan assets. The new guidance, which is now part of the FASB ASC Topic Compensation—Retirement Benefits, requires an employer to provide certain disclosures about plan assets of its defined benefit pension or other postretirement plans. The required disclosures include the investment policies and strategies of the plans, the fair value of the major categories of plan assets, the inputs and valuation techniques used to develop fair value measurements and a description of significant concentrations of risk in plan assets. The new guidance was effective on a prospective basis for fiscal years ending after December 15, 2009, and the required disclosures are provided in Note 10 of the accompanying financial statements.
Accounting Standards Codification
In June 2009, the FASB issued Statement of Financial Accounting Standards (“SFAS”) No. 168, The FASB Accounting Standards Codification and the Hierarchy of Generally Accepted Accounting Principles—a replacement of FASB Statement No. 162 (“the Codification”). The Codification reorganized existing U.S. accounting and reporting standards issued by the FASB and other related private sector standard setters into a single source of authoritative accounting principles arranged by topic. The Codification supersedes all existing U.S. accounting standards; all other accounting literature not included in the Codification (other than Securities and Exchange Commission guidance for publicly-traded companies) is considered non-authoritative. The Codification was effective on a prospective basis for interim and annual reporting periods ending after September 15, 2009. The adoption of the Codification changed our references to U.S. GAAP accounting standards but did not impact our consolidated financial statements.
Subsequent Events
In May 2009, the FASB issued new guidance for accounting for subsequent events. The new guidance, which is now part of the FASB ASC Topic Subsequent Events, establishes general standards of accounting for and disclosure of events that occur after the balance sheet date but before financial statements are issued or are available to be issued. Specifically, the new guidance sets forth the period after the balance sheet date during which management of a reporting entity should evaluate events or transactions that may occur for potential recognition or disclosure in the financial statements. The new guidance was effective on a prospective basis for interim or annual periods ending after June 15, 2009. The adoption of this new guidance effective June 30, 2009 had no effect on our consolidated financial statements. The disclosures required by this new guidance are provided in Note 19 of the accompanying financial statements.
Other-Than-Temporary Impairments
In April 2009, the FASB issued new guidance for the accounting for other-than-temporary impairments. Under the new guidance, which is now part of the FASB ASC Topic Investments—Debt and Equity Securities, the indicators used in considering an impairment of a debt security to be other-than-temporary have been modified, from management asserting it has both the intent and the ability to hold an impaired security for a period of time sufficient for anticipated recovery in fair value to management asserting that (a) it does not have the intent to sell the security and (b) it is more likely than not it will not have to sell the security before recovery. Additionally, this new guidance requires that other-than-temporary impairments on debt securities due to credit be recognized in earnings while non-credit other-than-temporary impairments be recognized in other comprehensive income. This new guidance also requires companies to disclose major security types for both debt and equity securities and to provide meaningful disclosure about individually significant unrealized losses and all such disclosures are required to be included in both interim and annual periods. This new guidance was effective for interim and annual reporting periods ending after June 15, 2009. The adoption of this new guidance effective April 1, 2009 did not have a material effect on our consolidated financial statements. The disclosures required by this new guidance are provided in Note 2 of the accompanying financial statements.
86
Table of Contents
Additional Fair Value Measurement Guidance
In April 2009, the FASB issued new guidance for determining when a transaction is not orderly and for estimating fair value when there has been a significant decrease in the volume and level of activity for an asset or liability. The new guidance, which is now part of the FASB ASC Topic Fair Value Measurements and Disclosures, requires disclosure of the inputs and valuation techniques used, as well as any changes in valuation techniques and inputs used during the period, to measure fair value in interim and annual periods. In addition, the presentation of the fair value hierarchy is required to be presented by major security type as described in the FASB ASC Topic Investments—Debt and Equity Securities. The provisions of the new guidance were effective for interim periods ending after June 15, 2009. The adoption of this new guidance effective April 1, 2009 did not have a material effect on our consolidated financial statements. The disclosures required by this new guidance are provided in Note 3 of the accompanying financial statements.
Disclosures about Fair Value of Financial Instruments
In April 2009, the FASB issued new guidance related to the disclosure of the fair value of financial instruments. The new guidance, which is now part of the FASB ASC Topic Financial Instruments, requires disclosure of the fair value of financial instruments whether recognized or not recognized on the balance sheet in interim and annual financial statements. The provisions of the new guidance were effective for interim periods ending after June 15, 2009. We adopted this new guidance effective April 1, 2009. The disclosures required by this new guidance are provided in Notes 6 and 7 of the accompanying financial statements.
Pending Adoption of Accounting Pronouncements
Amendments to Accounting for Variable Interest Entities
In June 2009, the FASB issued revised guidance on the accounting for variable interest entities. The revised guidance, which was issued as SFAS No. 167, Amendments to FASB Interpretation No. 46(R), has not yet been adopted into the Codification. The revised guidance reflects the elimination of the concept of a qualifying special-purpose entity and replaces the quantitative-based risks and rewards calculation of the previous guidance for determining which company, if any, has a controlling financial interest in a variable interest entity. The revised guidance requires an analysis of whether a company has: (1) the power to direct the activities of a variable interest entity that most significantly impact the entity’s economic performance and (2) the obligation to absorb the losses that could potentially be significant to the entity or the right to receive benefits from the entity that could potentially be significant to the entity. An entity is required to be re-evaluated as a variable interest entity when the holders of the equity investment at risk, as a group, lose the power from voting rights or similar rights to direct the activities that most significantly impact the entity’s economic performance. Additional disclosures are required about a company’s involvement in variable interest entities and an ongoing assessment of whether a company is the primary beneficiary. The new guidance is effective on a prospective basis at the start of our first fiscal year beginning after November 15, 2009. The provisions of the new guidance are not expected to have a material impact on our consolidated financial statements.
Improving Disclosures about Fair Value Measurements
In January 2010, the FASB issued guidance to improve the disclosures related to fair value measurements. The new guidance requires expanded fair value disclosures, including the reasons for significant transfers between Level 1 and Level 2 and the amount of significant transfers into each level disclosed separately from transfers out of each level. For Level 3 fair value measurements, information in the reconciliation of recurring Level 3 measurements about purchases, sales, issuances and settlements shall be presented separately on a gross basis, rather than as one net number. In addition, clarification is provided about existing disclosure requirements, such as presenting fair value measurement disclosures for each class of assets and liabilities that are determined based on their nature and risk characteristics and their placement in the fair value hierarchy (that is, Level 1, 2, or 3), as opposed to each major category of assets and liabilities, as required in the previous
87
Table of Contents
guidance. Disclosures about the valuation techniques and inputs used to measure fair value for both recurring and nonrecurring fair value measurements will be required for fair value measurement that fall in either Level 2 or Level 3. The new guidance is effective for interim and annual reporting periods beginning after December 15, 2009. The expanded disclosures will be included in our Quarterly Report on Form 10-Q for the quarter ended March 31, 2010.
Item 7A. Qualitative and Quantitative Disclosures about Market Risk
Qualitative and Quantitative Disclosures about Market Risk are included in Item 7 of this Form 10-K under “2009 Compared to 2008—Investment Operations Segment—Market Risk.”
88
Table of Contents
Item 8. Financial Statements and Supplementary Data
The Consolidated Financial Statements, including the Notes to Consolidated Financial Statements and the Reports of Independent Registered Public Accounting Firm are as follows:
Report of Independent Registered Public Accounting Firm
The Board of Directors and Stockholders of
State Auto Financial Corporation
We have audited the accompanying consolidated balance sheets of State Auto Financial Corporation and subsidiaries as of December 31, 2009 and 2008, and the related consolidated statements of income, stockholders’ equity, and cash flows for each of the three years in the period ended December 31, 2009. Our audits also included the financial statement schedules listed in the Index at Item 15(a)(2). These financial statements and schedules are the responsibility of the Company’s management. Our responsibility is to express an opinion on these financial statements and schedules based on our audits.
We conducted our audits in accordance with the standards of the Public Company Accounting Oversight Board (United States). Those standards require that we plan and perform the audit to obtain reasonable assurance about whether the financial statements are free of material misstatement. An audit includes examining, on a test basis, evidence supporting the amounts and disclosures in the financial statements. An audit also includes assessing the accounting principles used and significant estimates made by management, as well as evaluating the overall financial statement presentation. We believe that our audits provide a reasonable basis for our opinion.
In our opinion, the financial statements referred to above present fairly, in all material respects, the consolidated financial position of State Auto Financial Corporation and subsidiaries at December 31, 2009 and 2008, and the consolidated results of their operations and their cash flows for each of the three years in the period ended December 31, 2009, in conformity with U.S. generally accepted accounting principles. Also, in our opinion, the related financial statement schedules, when considered in relation to the basic financial statements taken as a whole, present fairly in all material respects the information set forth therein.
As discussed in Note 1 to the consolidated financial statements, the Company changed its method of accounting for other-than-temporary impairments of investments in fixed maturity securities in 2009.
We also have audited, in accordance with the standards of the Public Company Accounting Oversight Board (United States), State Auto Financial Corporation and subsidiaries’ internal control over financial reporting as of December 31, 2009, based on criteria established in Internal Control—Integrated Framework issued by the Committee of Sponsoring Organizations of the Treadway Commission and our report dated March 5, 2010, expressed an unqualified opinion thereon.
/s/ Ernst & Young LLP
Columbus, Ohio
March 5, 2010
89
Table of Contents
Report of Independent Registered Public Accounting Firm on Internal Control over Financial Reporting
The Board of Directors and Stockholders of
State Auto Financial Corporation
We have audited State Auto Financial Corporation and subsidiaries’ internal control over financial reporting as of December 31, 2009, based on criteria established in Internal Control—Integrated Framework issued by the Committee of Sponsoring Organizations of the Treadway Commission (the COSO criteria). State Auto Financial Corporation’s management is responsible for maintaining effective internal control over financial reporting, and for its assessment of the effectiveness of internal control over financial reporting included in the accompanying Management’s Annual Report on Internal Control over Financial Reporting. Our responsibility is to express an opinion on the Company’s internal control over financial reporting based on our audit.
We conducted our audit in accordance with the standards of the Public Company Accounting Oversight Board (United States). Those standards require that we plan and perform the audit to obtain reasonable assurance about whether effective internal control over financial reporting was maintained in all material respects. Our audit included obtaining an understanding of internal control over financial reporting, assessing the risk that a material weakness exists, testing and evaluating the design and operating effectiveness of internal control based on the assessed risk, and performing such other procedures as we considered necessary in the circumstances. We believe that our audit provides a reasonable basis for our opinion.
A company’s internal control over financial reporting is a process designed to provide reasonable assurance regarding the reliability of financial reporting and the preparation of financial statements for external purposes in accordance with generally accepted accounting principles. A company’s internal control over financial reporting includes those policies and procedures that (1) pertain to the maintenance of records that, in reasonable detail, accurately and fairly reflect the transactions and dispositions of the assets of the company; (2) provide reasonable assurance that transactions are recorded as necessary to permit preparation of financial statements in accordance with generally accepted accounting principles, and that receipts and expenditures of the company are being made only in accordance with authorizations of management and directors of the company; and (3) provide reasonable assurance regarding prevention or timely detection of unauthorized acquisition, use or disposition of the company’s assets that could have a material effect on the financial statements.
Because of its inherent limitations, internal control over financial reporting may not prevent or detect misstatements. Also, projections of any evaluation of effectiveness to future periods are subject to the risk that controls may become inadequate because of changes in conditions, or that the degree of compliance with the policies or procedures may deteriorate.
In our opinion, State Auto Financial Corporation and subsidiaries maintained, in all material respects, effective internal control over financial reporting as of December 31, 2009, based on the COSO criteria.
We also have audited, in accordance with the standards of the Public Company Accounting Oversight Board (United States), the consolidated balance sheets of State Auto Financial Corporation and subsidiaries as of December 31, 2009 and 2008, and the related consolidated statements of income, stockholders’ equity, and cash flows for each of the three years in the period ended December 31, 2009, and our report dated March 5, 2010, expressed an unqualified opinion thereon.
/s/ Ernst & Young LLP
Columbus, Ohio
March 5, 2010
90
Table of Contents
STATE AUTO FINANCIAL CORPORATION AND SUBSIDIARIES
(a majority-owned subsidiary of State Automobile Mutual Insurance Company)
Consolidated Balance Sheets
| (in millions, except per share amounts) | December 31 | ||||||
| 2009 | 2008 | ||||||
| Assets |
|||||||
| Fixed maturities, available-for-sale, at fair value (amortized cost $1,788.1 and $1,781.1, respectively) |
$ | 1,831.8 | 1,770.7 | ||||
| Equity securities, available-for-sale, at fair value (cost $189.7 and $144.3, respectively) |
224.1 | 137.5 | |||||
| Other invested assets, available-for-sale, at fair value (cost $44.1 and $32.4, respectively) |
52.3 | 31.7 | |||||
| Other invested assets |
0.9 | 1.4 | |||||
| Notes receivable from affiliate |
70.0 | — | |||||
| Total investments |
2,179.1 | 1,941.3 | |||||
| Cash and cash equivalents |
90.3 | 150.5 | |||||
| Accrued investment income and other assets |
35.1 | 40.2 | |||||
| Deferred policy acquisition costs |
127.3 | 122.3 | |||||
| Reinsurance recoverable on losses and loss expenses payable (affiliates $0.1 and $0.6, respectively) |
20.8 | 21.2 | |||||
| Prepaid reinsurance premiums (affiliates none) |
7.2 | 7.0 | |||||
| Due from affiliate |
7.7 | — | |||||
| Current federal income taxes |
9.1 | 37.6 | |||||
| Net deferred federal income taxes |
75.9 | 111.0 | |||||
| Property and equipment, at cost, (net of accumulated depreciation of $6.7 and $6.2, respectively) |
12.0 | 12.5 | |||||
| Total assets |
$ | 2,564.5 | 2,443.6 | ||||
| Liabilities and Stockholders’ Equity |
|||||||
| Losses and loss expenses payable (affiliates $346.2 and $343.0, respectively) |
$ | 840.2 | 791.2 | ||||
| Unearned premiums (affiliates $180.7 and $175.0, respectively) |
547.0 | 515.1 | |||||
| Notes payable (affiliates $15.5 and $15.5, respectively) |
117.2 | 117.6 | |||||
| Postretirement and pension benefits |
150.4 | 187.7 | |||||
| Due to affiliate |
— | 15.9 | |||||
| Other liabilities |
60.3 | 55.1 | |||||
| Total liabilities |
1,715.1 | 1,682.6 | |||||
| Stockholders’ equity: |
|||||||
| Class A Preferred stock (nonvoting), without par value. Authorized 2.5 shares; none issued |
— | — | |||||
| Class B Preferred stock, without par value. Authorized 2.5 shares; none issued |
— | — | |||||
| Common stock, without par value. Authorized 100.0 shares; 46.6 and 46.3 shares issued, respectively, at stated value of $2.50 per share |
116.6 | 115.9 | |||||
| Treasury stock, 6.8 and 6.8 shares, respectively, at cost |
(115.7 | ) | (115.5 | ) | |||
| Additional paid-in capital |
115.8 | 109.0 | |||||
| Accumulated other comprehensive loss |
(2.9 | ) | (97.6 | ) | |||
| Retained earnings |
735.6 | 749.2 | |||||
| Total stockholders’ equity |
849.4 | 761.0 | |||||
| Total liabilities and stockholders’ equity |
$ | 2,564.5 | 2,443.6 | ||||
See accompanying notes to consolidated financial statements.
91
Table of Contents
STATE AUTO FINANCIAL CORPORATION AND SUBSIDIARIES
(a majority-owned subsidiary of State Automobile Mutual Insurance Company)
Consolidated Statements of Income
| ($ millions, except per share amounts) | Year ended December 31 | |||||||||
| 2009 | 2008 | 2007 | ||||||||
| Earned premiums (ceded to affiliate $742.6, $700.9 and $695.7, respectively) |
$ | 1,176.5 | 1,126.0 | 1,011.6 | ||||||
| Net investment income (affiliate $3.1 in 2009) |
82.1 | 87.4 | 84.7 | |||||||
| Net realized (loss) gain on investments: |
||||||||||
| Total other-than-temporary impairment losses |
(9.0 | ) | (39.3 | ) | (1.9 | ) | ||||
| Portion of loss recognized in other comprehensive income |
— | — | — | |||||||
| Other net realized investment gains |
3.8 | 2.9 | 14.0 | |||||||
| Total net realized (loss) gain on investments |
(5.2 | ) | (36.4 | ) | 12.1 | |||||
| Other income (affiliates $2.2, $3.1 and $3.3, respectively) |
3.5 | 4.9 | 5.0 | |||||||
| Total revenues |
1,256.9 | 1,181.9 | 1,113.4 | |||||||
| Losses and loss expenses (ceded to affiliate $544.9, $514.6 and $405.0, respectively) |
843.3 | 846.7 | 590.8 | |||||||
| Acquisition and operating expenses |
400.9 | 389.8 | 347.9 | |||||||
| Interest expense (affiliates $0.8, $1.2 and $1.5, respectively) |
7.6 | 7.3 | 7.6 | |||||||
| Other expenses |
17.9 | 13.2 | 11.8 | |||||||
| Total expenses |
1,269.7 | 1,257.0 | 958.1 | |||||||
| (Loss) income before federal income taxes |
(12.8 | ) | (75.1 | ) | 155.3 | |||||
| Federal income tax (benefit) expense: |
||||||||||
| Current |
(9.5 | ) | (26.4 | ) | 43.5 | |||||
| Deferred |
(13.5 | ) | (17.6 | ) | (7.3 | ) | ||||
| Total federal income tax (benefit) expense |
(23.0 | ) | (44.0 | ) | 36.2 | |||||
| Net income (loss) |
$ | 10.2 | (31.1 | ) | 119.1 | |||||
| Earnings (loss) per common share: |
||||||||||
| Basic |
$ | 0.26 | (0.78 | ) | 2.90 | |||||
| Diluted |
$ | 0.25 | (0.78 | ) | 2.86 | |||||
| Dividends paid per common share |
$ | 0.60 | 0.60 | 0.50 | ||||||
See accompanying notes to consolidated financial statements.
92
Table of Contents
STATE AUTO FINANCIAL CORPORATION AND SUBSIDIARIES
(a majority-owned subsidiary of State Automobile Mutual Insurance Company)
Consolidated Statements of Stockholders’ Equity
| (in millions) | Year ended December 31 | |||||||||
| 2009 | 2008 | 2007 | ||||||||
| Common shares: |
||||||||||
| Balance at beginning of year |
46.3 | 46.0 | 45.7 | |||||||
| Issuance of shares |
0.3 | 0.3 | 0.3 | |||||||
| Balance at end of year |
46.6 | 46.3 | 46.0 | |||||||
| Treasury shares: |
||||||||||
| Balance at beginning of year |
(6.8 | ) | (5.5 | ) | (4.7 | ) | ||||
| Shares acquired on stock option exercises |
— | (0.1 | ) | — | ||||||
| Shares acquired under repurchase program |
— | (1.2 | ) | (0.8 | ) | |||||
| Balance at end of year |
(6.8 | ) | (6.8 | ) | (5.5 | ) | ||||
| Common stock: |
||||||||||
| Balance at beginning of year |
$ | 115.9 | 115.0 | 114.3 | ||||||
| Issuance of shares |
0.7 | 0.9 | 0.7 | |||||||
| Balance at end of year |
116.6 | 115.9 | 115.0 | |||||||
| Treasury stock: |
||||||||||
| Balance at beginning of year |
$ | (115.5 | ) | (81.0 | ) | (58.1 | ) | |||
| Shares acquired on stock option exercises |
(0.2 | ) | (1.3 | ) | (0.8 | ) | ||||
| Shares acquired under repurchase program |
— | (33.2 | ) | (22.1 | ) | |||||
| Balance at end of year |
(115.7 | ) | (115.5 | ) | (81.0 | ) | ||||
| Additional paid-in capital: |
||||||||||
| Balance at beginning of year |
$ | 109.0 | 98.2 | 87.3 | ||||||
| Issuance of common stock |
2.8 | 4.9 | 4.4 | |||||||
| Tax benefit from stock options exercises |
0.2 | 0.8 | 0.7 | |||||||
| Stock options granted |
3.8 | 5.1 | 5.8 | |||||||
| Balance at end of year |
115.8 | 109.0 | 98.2 | |||||||
| Accumulated other comprehensive (loss) income: |
||||||||||
| Balance at beginning of year |
$ | (97.6 | ) | (3.3 | ) | (17.3 | ) | |||
| Effect of changing benefit plan obligation measurement date, net of tax |
— | 3.5 | — | |||||||
| Balance at beginning of year, as adjusted |
(97.6 | ) | 0.2 | (17.3 | ) | |||||
| Change in unrealized gains (losses) on investments, net of tax and reclassification adjustment |
70.3 | (57.6 | ) | (2.6 | ) | |||||
| Amortization of gain on derivative used in cash flow hedge |
(0.1 | ) | (0.1 | ) | (0.1 | ) | ||||
| Change in unrecognized benefit plan obligations, net of tax and reclassification adjustment |
24.5 | (40.1 | ) | 16.7 | ||||||
| Balance at end of year |
(2.9 | ) | (97.6 | ) | (3.3 | ) | ||||
| Retained earnings: |
||||||||||
| Balance at beginning of year |
$ | 749.2 | 806.6 | 708.0 | ||||||
| Effect of changing benefit plan obligation measurement date, net of tax |
— | (2.4 | ) | — | ||||||
| Balance at beginning of year, as adjusted |
749.2 | 804.2 | 708.0 | |||||||
| Net income (loss) |
10.2 | (31.1 | ) | 119.1 | ||||||
| Cash dividends paid (affiliates $15.2, $15.3 and $13.2, respectively) |
(23.8 | ) | (23.9 | ) | (20.5 | ) | ||||
| Balance at end of year |
735.6 | 749.2 | 806.6 | |||||||
| Total stockholders’ equity at end of year |
$ | 849.4 | 761.0 | 935.5 | ||||||
See accompanying notes to consolidated financial statements.
93
Table of Contents
STATE AUTO FINANCIAL CORPORATION AND SUBSIDIARIES
(a majority-owned subsidiary of State Automobile Mutual Insurance Company)
Consolidated Statements of Cash Flows
| ($ millions) | Year ended December 31 | |||||||||
| 2009 | 2008 | 2007 | ||||||||
| Cash flows from operating activities: |
||||||||||
| Net income (loss) |
$ | 10.2 | (31.1 | ) | 119.1 | |||||
| Adjustments to reconcile net income (loss) to net cash provided by operating activities: |
||||||||||
| Depreciation and amortization, net |
11.8 | 10.6 | 11.0 | |||||||
| Share-based compensation |
3.7 | 5.5 | 6.0 | |||||||
| Net realized loss (gain) on investments |
5.2 | 36.4 | (12.1 | ) | ||||||
| Changes in operating assets and liabilities: |
||||||||||
| Deferred policy acquisition costs |
(5.0 | ) | (3.7 | ) | (1.7 | ) | ||||
| Accrued investment income and other assets |
4.7 | 1.1 | 1.0 | |||||||
| Postretirement and pension benefits |
1.8 | 7.3 | 7.3 | |||||||
| Reinsurance recoverable on losses and loss expenses payable and prepaid reinsurance premiums |
0.3 | (11.0 | ) | 2.3 | ||||||
| Other liabilities and due to/from affiliates, net |
(18.2 | ) | 33.2 | 4.0 | ||||||
| Losses and loss expenses payable |
49.0 | 81.6 | (16.2 | ) | ||||||
| Unearned premiums |
31.9 | 25.5 | 7.2 | |||||||
| Excess tax benefits on share-based awards |
0.1 | 0.4 | 0.4 | |||||||
| Federal income taxes |
15.0 | (64.3 | ) | (6.7 | ) | |||||
| Cash provided from pooling change, January 1, 2008 (Note 6a) |
— | 92.0 | — | |||||||
| Net cash provided by operating activities |
110.5 | 183.5 | 121.6 | |||||||
| Cash flows from investing activities: |
||||||||||
| Purchases of fixed maturities—available-for-sale |
(494.7 | ) | (288.5 | ) | (331.6 | ) | ||||
| Purchases of equity securities—available-for-sale |
(90.4 | ) | (29.2 | ) | (73.7 | ) | ||||
| Purchases of other invested assets |
(13.0 | ) | (24.7 | ) | (17.1 | ) | ||||
| Maturities, calls and pay downs of fixed maturities—available-for-sale |
159.0 | 58.7 | 73.1 | |||||||
| Sales of fixed maturities—available-for-sale |
323.8 | 164.6 | 155.2 | |||||||
| Sales of equity securities—available-for-sale |
34.0 | 67.0 | 107.0 | |||||||
| Sales of other invested assets |
1.2 | 1.1 | 1.8 | |||||||
| Note to affiliate |
(70.0 | ) | — | — | ||||||
| Net additions of property and equipment |
(0.1 | ) | (0.5 | ) | (0.8 | ) | ||||
| Net cash used in investing activities |
(150.2 | ) | (51.5 | ) | (86.1 | ) | ||||
| Cash flows from financing activities: |
||||||||||
| Proceeds from issuance of common stock |
3.3 | 4.4 | 4.3 | |||||||
| Payments to acquire treasury shares |
— | (33.2 | ) | (22.1 | ) | |||||
| Excess tax benefits on share-based awards |
— | 0.3 | 0.3 | |||||||
| Payments of dividends (affiliates $15.2, $15.3 and $13.2, respectively) |
(23.8 | ) | (23.9 | ) | (20.5 | ) | ||||
| Net cash used in financing activities |
(20.5 | ) | (52.4 | ) | (38.0 | ) | ||||
| Net (decrease) increase in cash and cash equivalents |
(60.2 | ) | 79.6 | (2.5 | ) | |||||
| Cash and cash equivalents at beginning of year |
150.5 | 70.9 | 73.4 | |||||||
| Cash and cash equivalents at end of year |
$ | 90.3 | 150.5 | 70.9 | ||||||
| Supplemental disclosures: |
||||||||||
| Interest paid (affiliates $0.8, $1.2 and $1.5, respectively) |
$ | 7.1 | 7.5 | 7.8 | ||||||
| Federal income taxes (received) paid |
$ | (38.1 | ) | 18.2 | 42.3 | |||||
See accompanying notes to consolidated financial statements.
94
Table of Contents
STATE AUTO FINANCIAL CORPORATION AND SUBSIDIARIES
(a majority-owned subsidiary of State Automobile Mutual Insurance Company)
Notes to Consolidated Financial Statements
1. Summary of Significant Accounting Policies
a. Principles of Consolidation
The consolidated financial statements include State Auto Financial Corporation (“State Auto Financial”) and its wholly-owned subsidiaries:
| • | State Auto Property and Casualty Insurance Company (“State Auto P&C”), an Iowa corporation |
| • | Milbank Insurance Company (“Milbank”), a South Dakota corporation |
| • | Farmers Casualty Insurance Company (“Farmers”), an Iowa corporation |
| • | State Auto Insurance Company of Ohio (“SA Ohio”), an Ohio corporation |
| • | State Auto National Insurance Company (“SA National”), an Ohio corporation |
| • | Stateco Financial Services, Inc. (“Stateco”), an Ohio corporation |
The financial statements include the operations and financial position of 518 Property Management and Leasing, LLC (“518 PML”), whose members are State Auto P&C and Stateco.
State Auto Financial, an Ohio corporation, is a majority-owned subsidiary of State Automobile Mutual Insurance Company (“State Auto Mutual”), an Ohio corporation. State Auto Financial and subsidiaries are referred to herein as the “Companies” or the “Company.” All significant intercompany balances and transactions have been eliminated in consolidation.
b. Description of Business
The Company, through State Auto P&C, Milbank, Farmers and SA Ohio, provides standard personal and business insurance to its policyholders. The Company’s principal lines of insurance include personal and commercial automobile, homeowners, commercial multi-peril, workers’ compensation, general liability and fire insurance. SA National provides nonstandard automobile insurance. State Auto P&C, Milbank, Farmers, SA Ohio and SA National operate primarily in the central and eastern United States, excluding New York and New Jersey, through an independent insurance agency system. State Auto P&C, Milbank, Farmers, SA Ohio and SA National are chartered and licensed property and casualty insurers. As such, they are subject to the regulations of the applicable Departments of Insurance of their respective states of domicile (the “Departments”) and the regulations of each state in which they operate. These property and casualty insurance companies undergo periodic financial examination by the Departments and insurance regulatory agencies of the states that choose to participate. A large portion of the Company’s revenues are derived from a reinsurance pooling agreement with State Auto Mutual and its affiliates. The nature of the underlying policies and geographical distribution of State Auto Mutual’s and its affiliates’ underwriting activity is similar to the Company.
Through State Auto P&C, the Company provides management and operation services under management agreements for all insurance and non-insurance affiliates.
Through Stateco, the Company provides investment management services to affiliated companies.
During 2009, the assets of Strategic Insurance Software, Inc., a wholly-owned subsidiary of State Auto Financial and a developer and seller of insurance-related software, were sold to a third party. The assets and operation of this subsidiary were not material to the Company’s total operations.
95
Table of Contents
STATE AUTO FINANCIAL CORPORATION AND SUBSIDIARIES
(a majority-owned subsidiary of State Automobile Mutual Insurance Company)
Notes to Consolidated Financial Statements, Continued
518 PML, an Ohio limited liability company, was formed to engage in the business of owning and leasing property to the Company’s affiliates.
c. Basis of Presentation
The consolidated financial statements have been prepared in conformity with U.S. generally accepted accounting principles (“GAAP”), which vary in certain respects from statutory-basis accounting principles (“SAP”) followed by State Auto P&C, Milbank, Farmers, SA Ohio and SA National that are prescribed or permitted by the Departments.
In preparing the consolidated financial statements, management is required to make estimates and assumptions that affect the reported amounts of assets and liabilities as of the date of the balance sheet, revenues and expenses for the periods then ended, and the accompanying notes to the financial statements. Such estimates and assumptions could change in the future as more information becomes known which could impact the amounts reported and disclosed herein.
Material estimates that are particularly susceptible to significant change in the near term relate to the determination of losses and loss expenses payable. In connection with the determination of this estimate, management uses historical data, current business conditions and assumptions about future conditions to formulate estimates of the ultimate cost to settle claims. These estimates by their nature are subject to uncertainties for various reasons. The Company’s results of operations and financial condition could be materially impacted in future periods should the ultimate payments required to settle claims vary from the amount of the liability currently provided.
d. Investments
Investments in fixed maturities, equity securities and certain other invested assets are classified as available-for-sale and, therefore, are carried at fair value. The unrealized holding gains and losses, net of applicable deferred income taxes, are shown as a separate component of stockholders’ equity as a part of accumulated other comprehensive loss and, as such, are not included in the determination of net income (loss). Realized gains and losses on the sales of investments are computed using the first-in, first-out method.
The Company regularly monitors its investments that have fair values less than cost or amortized cost for signs of other-than-temporary impairment, an assessment that requires significant management judgment regarding the evidence known. Such judgments could change in the future as more information becomes known, which could negatively impact the amounts reported. Among the factors that management considers for fixed maturity securities are the financial condition of the issuer including receipt of scheduled principal and interest cash flows, intent to sell, and if it is more likely than not that the Company will be required to sell the investments before recovery. When a fixed maturity has been determined to have an other-than-temporary impairment, the impairment charge is separated into an amount representing the credit loss, which is recognized in earnings as a realized loss, and the amount related to non-credit factors, which is recognized in accumulated other comprehensive loss. Future increases or decreases in fair value, if not other-than-temporary, are included in accumulated other comprehensive loss.
Among the factors that management considers for equity securities and other invested assets are the length of time and/or the significance of decline below cost, the Company’s ability and intent to hold these securities through their recovery periods, the current financial condition of the issuer and its future business prospects, and
96
Table of Contents
STATE AUTO FINANCIAL CORPORATION AND SUBSIDIARIES
(a majority-owned subsidiary of State Automobile Mutual Insurance Company)
Notes to Consolidated Financial Statements, Continued
the ability of the market value to recover to cost in the near term. When an equity security or other invested asset has been determined to have a decline in fair value that is other-than-temporary, the cost basis of the security is adjusted to fair value. This results in a charge to earnings as a realized loss, which is not reversed for subsequent recoveries in fair value. Future increases or decreases in fair value, if not other-than-temporary, are included in accumulated other comprehensive loss.
e. Cash Equivalents
The Company considers all liquid debt instruments with a maturity of three months or less to be cash equivalents. The carrying amounts reported approximate their fair value.
f. Deferred Policy Acquisition Costs
Acquisition costs, consisting of commissions, premium taxes and certain underwriting expenses relating to the production of property and casualty business, are deferred and amortized over the same period in which the related premiums are earned. The method followed for computing the acquisition costs limits the amount of such deferred costs to their estimated realizable value. In determining estimated realizable value, the computation gives effect to the premium to be earned, losses and loss expenses expected to be incurred, and certain other costs expected to be incurred as premium is earned. Future changes in estimates, the most significant of which is expected losses and loss adjustment expenses, that indicate a reduction in expected future profitability may result in unrecoverable deferred policy acquisition costs. The Company has not recorded any significant changes in estimates for the years ended December 31, 2009, 2008 and 2007, respectively.
Net deferred policy acquisition costs for the years ended December 31 are:
| ($ millions) | 2009 | 2008 | 2007 | |||||||
| Balance, beginning of year |
$ | 122.3 | 105.8 | 104.0 | ||||||
| Effect of January 1, 2008 pooling change (Note 6) |
— | 12.9 | — | |||||||
| Acquisition costs deferred |
282.5 | 260.8 | 244.5 | |||||||
| Acquisition costs amortized to expense |
(277.5 | ) | (257.2 | ) | (242.7 | ) | ||||
| Balance, end of year |
$ | 127.3 | 122.3 | 105.8 | ||||||
g. Federal Income Taxes
The Company files a consolidated federal income tax return, and pursuant to a written tax sharing agreement, each entity within the consolidated group pays or receives its share of federal income taxes based on separate return calculations.
The Company recognizes deferred income tax assets and liabilities for the expected future tax effects attributable to temporary differences between the financial statement and tax return bases of assets and liabilities, based on enacted tax rates and other provisions of the tax law. The effect of a change in tax laws or rates on deferred tax assets and liabilities is recognized in income in the period in which such change is enacted. Deferred tax assets and liabilities include provisions for unrealized investment gains and losses as well as the net funded status of pension and other postretirement benefit obligations with the changes for each period included in the respective components of accumulated other comprehensive income (loss) in stockholders’ equity. Deferred tax
97
Table of Contents
STATE AUTO FINANCIAL CORPORATION AND SUBSIDIARIES
(a majority-owned subsidiary of State Automobile Mutual Insurance Company)
Notes to Consolidated Financial Statements, Continued
assets are reduced by a valuation allowance if it is more likely than not that all or some portion of the deferred tax assets will not be realized.
Interest and penalties related to uncertain tax positions are recorded in the balance sheet as other liabilities, and recognized in the income statement as other expenses.
h. Losses and Loss Expenses Payable
Losses and loss expenses payable are based on formula and case-basis estimates for reported claims and on estimates, based on experience and perceived trends, for unreported claims and loss expenses. The liability for unpaid losses and loss expenses, net of estimated salvage and subrogation recoverable of $33.3 million and $31.5 million at December 31, 2009 and 2008, respectively, has been established to cover the estimated ultimate cost to settle insured losses. The amounts are based on estimates of future rates of inflation and other factors, and accordingly, there can be no assurance that the ultimate liability will not vary materially from such estimates. The estimates are continually reviewed and adjusted as necessary; such adjustments are included in current operations (see Note 4). Anticipated salvage and subrogation is estimated using historical experience. As such, losses and loss expenses payable represent management’s best estimate of the ultimate liability related to reported and unreported claims.
i. Premiums
Premiums are recognized as earned in proportion to the insurance protection provided using the monthly pro rata method over the contract period. Unearned premiums represent the portion of premiums written relative to the unexpired terms of coverage.
j. Comprehensive Income (Loss)
Comprehensive income (loss) is defined as all changes in an enterprise’s equity during a period other than those resulting from investments by owners and distributions to owners. Comprehensive income (loss) includes net income (loss) and other comprehensive income (loss). Other comprehensive income (loss) includes all other non-owner related changes to equity and includes net unrealized gains and losses on available-for-sale investments, derivative instruments and unrecognized benefit plan obligations, adjusted for deferred federal income taxes.
k. New Accounting Standards
Adoption of Recent Accounting Pronouncements
Fair Value Measurements and Disclosures—Investments in Certain Entities That Calculate Net Asset Value per Share
In September 2009, the Financial Accounting Standards Board (“FASB”) issued new guidance on the fair value measurements and disclosures of investments in certain entities that calculate net asset value per share (or its equivalent). The new guidance, which is now part of the FASB Accounting Standards Codification (“ASC”) Topic Fair Value Measurements and Disclosures, permits, as a practical expedient, a reporting entity to estimate the fair value of an investment within its scope using net asset value per share of the investment (or its equivalent) without adjustment, as long as the net asset value is calculated as of the reporting entity’s measurement date in a manner consistent with the measurement principles of FASB ASC Topic Financial
98
Table of Contents
STATE AUTO FINANCIAL CORPORATION AND SUBSIDIARIES
(a majority-owned subsidiary of State Automobile Mutual Insurance Company)
Notes to Consolidated Financial Statements, Continued
Services—Investment Companies. The new guidance also requires certain disclosures about the attributes of investments measured at net asset value, such as the nature of any restrictions on the investor’s ability to redeem its investment at the measurement date or any unfunded capital commitments. The new guidance was effective on a prospective basis for the first reporting period, including interim periods, ending after December 15, 2009. The Company adopted this new guidance effective December 31, 2009, and determined it had no effect on the Company’s consolidated financial statements. The disclosures required by this new guidance are provided in Note 3.
Employers’ Disclosures about Postretirement Benefit Plan Assets
In December 2008, the FASB issued new guidance on the disclosure of pension or other postretirement benefit plan assets. The new guidance, which is now part of the FASB ASC Topic Compensation—Retirement Benefits, requires an employer to provide certain disclosures about plan assets of its defined benefit pension or other postretirement plans. The required disclosures include the investment policies and strategies of the plans, the fair value of the major categories of plan assets, the inputs and valuation techniques used to develop fair value measurements and a description of significant concentrations of risk in plan assets. The new guidance was effective on a prospective basis for fiscal years ending after December 15, 2009. The Company adopted this new guidance effective December 31, 2009, and the required disclosures are provided in Note 10.
Accounting Standards Codification
In June 2009, the FASB issued Statement of Financial Accounting Standards (“SFAS”) No. 168, The FASB Accounting Standards Codification and the Hierarchy of Generally Accepted Accounting Principles—a replacement of FASB Statement No. 162 (“the Codification”). The Codification reorganized existing U.S. accounting and reporting standards issued by the FASB and other related private sector standard setters into a single source of authoritative accounting principles arranged by topic. The Codification supersedes all existing U.S. accounting standards; all other accounting literature not included in the Codification (other than Securities and Exchange Commission guidance for publicly-traded companies) is considered non-authoritative. The Codification was effective on a prospective basis for interim and annual reporting periods ending after September 15, 2009. The adoption of the Codification changed the Company’s references to U.S. GAAP accounting standards but did not impact the Company’s consolidated financial statements.
Subsequent Events
In May 2009, the FASB issued new guidance for accounting for subsequent events. The new guidance, which is now part of the FASB ASC Topic Subsequent Events, establishes general standards of accounting for and disclosure of events that occur after the balance sheet date but before financial statements are issued or are available to be issued. Specifically, the new guidance sets forth the period after the balance sheet date during which management of a reporting entity should evaluate events or transactions that may occur for potential recognition or disclosure in the financial statements. The new guidance was effective on a prospective basis for interim or annual periods ending after June 15, 2009. The Company adopted this new guidance effective June 30, 2009, and determined it had no effect on the Company’s consolidated financial statements. The disclosures required by this new guidance are provided in Note 19.
Other-Than-Temporary Impairments
In April 2009, the FASB issued new guidance for the accounting for other-than-temporary impairments. Under the new guidance, which is now part of the FASB ASC Topic Investments—Debt and Equity Securities,
99
Table of Contents
STATE AUTO FINANCIAL CORPORATION AND SUBSIDIARIES
(a majority-owned subsidiary of State Automobile Mutual Insurance Company)
Notes to Consolidated Financial Statements, Continued
the indicators used in considering an impairment of a debt security to be other-than-temporary have been modified, from management asserting it has both the intent and the ability to hold an impaired security for a period of time sufficient for anticipated recovery in fair value to management asserting that (a) it does not have the intent to sell the security and (b) it is more likely than not it will not have to sell the security before recovery. Additionally, this new guidance requires that other-than-temporary impairments on debt securities due to credit be recognized in earnings while non-credit other-than-temporary impairments be recognized in other comprehensive income. This new guidance also requires companies to disclose major security types for both debt and equity securities and to provide meaningful disclosure about individually significant unrealized losses and all such disclosures are required to be included in both interim and annual periods. This new guidance was effective for interim and annual reporting periods ending after June 15, 2009. The Company adopted this new guidance effective April 1, 2009, and determined it did not have a material effect on the Company’s consolidated financial statements. The disclosures required by this new guidance are provided in Note 2.
Additional Fair Value Measurement Guidance
In April 2009, the FASB issued new guidance for determining when a transaction is not orderly and for estimating fair value when there has been a significant decrease in the volume and level of activity for an asset or liability. The new guidance, which is now part of the FASB ASC Topic Fair Value Measurements and Disclosures, requires disclosure of the inputs and valuation techniques used, as well as any changes in valuation techniques and inputs used during the period, to measure fair value in interim and annual periods. In addition, the presentation of the fair value hierarchy is required to be presented by major security type as described in the FASB ASC Topic Investments – Debt and Equity Securities. The provisions of the new guidance were effective for interim periods ending after June 15, 2009. The Company adopted this new guidance effective April 1, 2009, and determined it did not have a material effect on the Company’s consolidated financial statements. The disclosures required by this new guidance are provided in Note 3.
Disclosures about Fair Value of Financial Instruments
In April 2009, the FASB issued new guidance related to the disclosure of the fair value of financial instruments. The new guidance, which is now part of the FASB ASC Topic Financial Instruments, requires disclosure of the fair value of financial instruments whether recognized or not recognized on the balance sheet in interim and annual financial statements. The provisions of the new guidance were effective for interim periods ending after June 15, 2009. The Company adopted this new guidance effective April 1, 2009. The disclosures required by this new guidance are provided in Notes 6 and 7.
Pending Adoption of Accounting Pronouncements
Amendments to Accounting for Variable Interest Entities
In June 2009, the FASB issued revised guidance on the accounting for variable interest entities. The revised guidance, which was issued as SFAS No. 167, Amendments to FASB Interpretation No. 46(R), has not yet been adopted into the Codification. The revised guidance reflects the elimination of the concept of a qualifying special-purpose entity and replaces the quantitative-based risks and rewards calculation of the previous guidance for determining which company, if any, has a controlling financial interest in a variable interest entity. The revised guidance requires an analysis of whether a company has: (1) the power to direct the activities of a variable interest entity that most significantly impact the entity’s economic performance and (2) the obligation to absorb the losses that could potentially be significant to the entity or the right to receive benefits from the entity
100
Table of Contents
STATE AUTO FINANCIAL CORPORATION AND SUBSIDIARIES
(a majority-owned subsidiary of State Automobile Mutual Insurance Company)
Notes to Consolidated Financial Statements, Continued
that could potentially be significant to the entity. An entity is required to be re-evaluated as a variable interest entity when the holders of the equity investment at risk, as a group, lose the power from voting rights or similar rights to direct the activities that most significantly impact the entity’s economic performance. Additional disclosures are required about a company’s involvement in variable interest entities and an ongoing assessment of whether a company is the primary beneficiary. The new guidance is effective on a prospective basis at the start of the Company’s first fiscal year beginning after November 15, 2009. The provisions of the new guidance are not expected to have a material impact on the Company’s consolidated financial statements.
Improving Disclosures about Fair Value Measurements
In January 2010, the FASB issued guidance to improve the disclosures related to fair value measurements. The new guidance requires expanded fair value disclosures, including the reasons for significant transfers between Level 1 and Level 2 and the amount of significant transfers into each level disclosed separately from transfers out of each level. For Level 3 fair value measurements, information in the reconciliation of recurring Level 3 measurements about purchases, sales, issuances and settlements shall be presented separately on a gross basis, rather than as one net number. In addition, clarification is provided about existing disclosure requirements, such as presenting fair value measurement disclosures for each class of assets and liabilities that are determined based on their nature and risk characteristics and their placement in the fair value hierarchy (that is, Level 1, 2, or 3), as opposed to each major category of assets and liabilities, as required in the previous guidance. Disclosures about the valuation techniques and inputs used to measure fair value for both recurring and nonrecurring fair value measurements will be required for fair value measurement that fall in either Level 2 or Level 3. The new guidance is effective for interim and annual reporting periods beginning after December 15, 2009. The expanded disclosures will be included in the Company’s Quarterly Report on Form 10-Q for the quarter ended March 31, 2010
2. Investments
The following tables summarize the cost or amortized cost and fair value of available-for-sale securities by lot at December 31, 2009 and 2008:
| ($ millions)
At December 31, 2009: |
Cost or amortized cost |
Gross gains |
Gross unrealized holding losses |
Fair value | |||||||||
| Fixed maturities: |
|||||||||||||
| U.S. treasury securities and obligations of U.S. government agencies |
$ | 348.4 | $ | 5.9 | $ | (1.4 | ) | $ | 352.9 | ||||
| Obligations of states and political subdivisions |
1,046.9 | 33.2 | (1.5 | ) | 1,078.6 | ||||||||
| Corporate securities |
97.4 | 2.4 | (0.1 | ) | 99.7 | ||||||||
| U.S. government agencies residential mortgage-backed securities |
295.4 | 6.4 | (1.2 | ) | 300.6 | ||||||||
| Total fixed maturities |
1,788.1 | 47.9 | (4.2 | ) | 1,831.8 | ||||||||
| Equity securities: |
|||||||||||||
| Large-cap equity securities |
164.7 | 31.6 | (0.2 | ) | 196.1 | ||||||||
| Small-cap equity securities |
25.0 | 3.0 | — | 28.0 | |||||||||
| Total equity securities |
189.7 | 34.6 | (0.2 | ) | 224.1 | ||||||||
| Other invested assets |
44.1 | 8.2 | — | 52.3 | |||||||||
| Total available-for-sale securities |
$ | 2,021.9 | $ | 90.7 | $ | (4.4 | ) | $ | 2,108.2 | ||||
101
Table of Contents
STATE AUTO FINANCIAL CORPORATION AND SUBSIDIARIES
(a majority-owned subsidiary of State Automobile Mutual Insurance Company)
Notes to Consolidated Financial Statements, Continued
| ($ millions)
At December 31, 2008: |
Cost or amortized cost |
Gross gains |
Gross unrealized holding losses |
Fair value | ||||||
| Fixed maturities: |
||||||||||
| U.S. treasury securities and obligations of U.S. government agencies |
$ | 127.6 | 4.2 | (4.2 | ) | 127.6 | ||||
| Obligations of states and political subdivisions |
1,463.1 | 21.4 | (33.5 | ) | 1,451.0 | |||||
| Corporate securities |
11.9 | 0.1 | (0.2 | ) | 11.8 | |||||
| U.S. government agencies residential mortgage-backed securities |
178.5 | 4.0 | (2.2 | ) | 180.3 | |||||
| Total fixed maturities |
1,781.1 | 29.7 | (40.1 | ) | 1,770.7 | |||||
| Equity securities: |
||||||||||
| Large-cap equity securities |
137.5 | 6.1 | (13.4 | ) | 130.2 | |||||
| Small-cap equity securities |
6.8 | 0.5 | — | 7.3 | ||||||
| Total equity securities |
144.3 | 6.6 | (13.4 | ) | 137.5 | |||||
| Other invested assets |
32.4 | — | (0.7 | ) | 31.7 | |||||
| Total available-for-sale securities |
$ | 1,957.8 | 36.3 | (54.2 | ) | 1,939.9 | ||||
The following tables reflect the Company’s gross unrealized losses and fair value on its investments by lot, aggregated by investment category and length of time for individual securities that have been in a continuous unrealized loss position at December 31, 2009 and 2008:
| ($ millions, except # of positions) |
Less than 12 months | 12 months or more | Total | ||||||||||||||||||||||||
| At December 31, 2009: | Fair value |
Unrealized losses |
Number of positions |
Fair value |
Unrealized losses |
Number of positions |
Fair value |
Unrealized losses |
Number of positions | ||||||||||||||||||
| Fixed maturities: |
|||||||||||||||||||||||||||
| U.S. treasury securities and obligations of U.S. government agencies |
$ | 121.9 | $ | (1.4 | ) | 53 | $ | — | $ | — | — | $ | 121.9 | $ | (1.4 | ) | 53 | ||||||||||
| Obligations of states and political subdivisions |
92.6 | (1.0 | ) | 39 | 26.0 | (0.5 | ) | 9 | 118.6 | (1.5 | ) | 48 | |||||||||||||||
| Corporate securities |
15.5 | (0.1 | ) | 10 | — | — | — | 15.5 | (0.1 | ) | 10 | ||||||||||||||||
| U.S. government agencies residential mortgage-backed securities |
52.8 | (0.4 | ) | 14 | 22.0 | (0.8 | ) | 11 | 74.8 | (1.2 | ) | 25 | |||||||||||||||
| Total fixed maturities |
282.8 | (2.9 | ) | 116 | 48.0 | (1.3 | ) | 20 | 330.8 | (4.2 | ) | 136 | |||||||||||||||
| Large-cap equity securities |
14.9 | (0.2 | ) | 6 | — | — | — | 14.9 | (0.2 | ) | 6 | ||||||||||||||||
| Total temporarily impaired securities |
$ | 297.7 | $ | (3.1 | ) | 122 | $ | 48.0 | $ | (1.3 | ) | 20 | $ | 345.7 | $ | (4.4 | ) | 142 | |||||||||
102
Table of Contents
STATE AUTO FINANCIAL CORPORATION AND SUBSIDIARIES
(a majority-owned subsidiary of State Automobile Mutual Insurance Company)
Notes to Consolidated Financial Statements, Continued
| ($ millions, except # of positions) |
Less than 12 months | 12 months or more | Total | ||||||||||||||||||||||||
| At December 31, 2008: |
Fair value |
Unrealized losses |
Number of positions |
Fair value |
Unrealized losses |
Number of positions |
Fair value |
Unrealized losses |
Number of positions | ||||||||||||||||||
| Fixed maturities: |
|||||||||||||||||||||||||||
| U.S. treasury securities and obligations of U.S. government agencies |
$ | 69.4 | $ | (4.2 | ) | 14 | $ | — | $ | — | — | $ | 69.4 | $ | (4.2 | ) | 14 | ||||||||||
| Obligations of states and political subdivisions |
613.6 | (18.0 | ) | 263 | 266.8 | (15.5 | ) | 103 | 880.4 | (33.5 | ) | 366 | |||||||||||||||
| Corporate securities |
4.3 | (0.2 | ) | 5 | 1.0 | — | 1 | 5.3 | (0.2 | ) | 6 | ||||||||||||||||
| U.S. government agencies residential mortgage-backed securities |
35.8 | (1.1 | ) | 13 | 30.5 | (1.1 | ) | 16 | 66.3 | (2.2 | ) | 29 | |||||||||||||||
| Total fixed maturities |
723.1 | (23.5 | ) | 295 | 298.3 | (16.6 | ) | 120 | 1,021.4 | (40.1 | ) | 415 | |||||||||||||||
| Large-cap equity securities |
62.6 | (12.0 | ) | 40 | 3.1 | (1.4 | ) | 4 | 65.7 | (13.4 | ) | 44 | |||||||||||||||
| Other invested assets |
31.7 | (0.7 | ) | 3 | — | — | — | 31.7 | (0.7 | ) | 3 | ||||||||||||||||
| Total temporarily impaired securities |
$ | 817.4 | $ | (36.2 | ) | 338 | $ | 301.4 | $ | (18.0 | ) | 124 | $ | 1,118.8 | $ | (54.2 | ) | 462 | |||||||||
Realized losses recognized for the year ended December 31 related to other-than-temporary impairments on the Company’s investment portfolio are summarized as follows:
| ($ millions) | 2009 | 2008 | 2007 | ||||
| Equity securities: |
|||||||
| Large-cap securities |
$ | 7.8 | 24.2 | 1.1 | |||
| Small-cap securities |
1.2 | 4.1 | 0.8 | ||||
| Other invested assets |
— | 11.0 | — | ||||
| Total other-than-temporary impairments |
$ | 9.0 | 39.3 | 1.9 | |||
The Company did not recognize other-than-temporary impairments on its fixed maturity securities in 2009 or 2007, and the realized losses related to other-than-temporary impairments of fixed maturity securities in 2008 were less than $0.1 million. The Company reviewed its investments at December 31, 2009, and determined no additional other-than-temporary impairment exists in the gross unrealized holding losses.
103
Table of Contents
STATE AUTO FINANCIAL CORPORATION AND SUBSIDIARIES
(a majority-owned subsidiary of State Automobile Mutual Insurance Company)
Notes to Consolidated Financial Statements, Continued
The amortized cost and fair value of available-for-sale fixed maturities at December 31, 2009, by contractual maturity, are summarized as follows:
| ($ millions) | Amortized cost |
Fair value | |||
| Due in 1 year or less |
$ | 17.2 | 17.4 | ||
| Due after 1 year through 5 years |
263.2 | 268.9 | |||
| Due after 5 years through 10 years |
506.5 | 523.7 | |||
| Due after 10 years |
705.8 | 721.2 | |||
| U.S. government agencies residential mortgage-backed securities |
295.4 | 300.6 | |||
| Total |
$ | 1,788.1 | 1,831.8 | ||
Expected maturities may differ from contractual maturities because issuers may have the right to call or prepay the obligations with or without call or prepayment penalties.
Fixed maturities with fair values of approximately $56.9 million and $56.0 million were on deposit with insurance regulators as required by law at December 31, 2009 and 2008, respectively.
Components of net investment income for the year ended December 31 are summarized as follows:
| ($ millions) | 2009 | 2008 | 2007 | ||||
| Fixed maturities |
$ | 75.7 | 79.4 | 75.2 | |||
| Equity securities |
3.5 | 5.0 | 5.8 | ||||
| Cash and cash equivalents, and other |
4.9 | 5.1 | 5.5 | ||||
| Investment income |
84.1 | 89.5 | 86.5 | ||||
| Investment expenses |
2.0 | 2.1 | 1.8 | ||||
| Net investment income |
$ | 82.1 | 87.4 | 84.7 | |||
The Company’s current investment strategy does not rely on the use of derivative financial instruments.
Proceeds on sales of available-for-sale securities in 2009, 2008 and 2007 were $357.8 million, $231.6 million and $262.2 million, respectively.
104
Table of Contents
STATE AUTO FINANCIAL CORPORATION AND SUBSIDIARIES
(a majority-owned subsidiary of State Automobile Mutual Insurance Company)
Notes to Consolidated Financial Statements, Continued
Realized and unrealized holding gains and losses for the years ended December 31 are summarized as follows:
| ($ millions) | 2009 | 2008 | 2007 | |||||||
| Realized gains: |
||||||||||
| Fixed maturities |
$ | 5.9 | 2.7 | 0.8 | ||||||
| Equity securities |
4.8 | 9.6 | 19.7 | |||||||
| Other invested assets |
— | — | — | |||||||
| Total realized gains |
10.7 | 12.3 | 20.5 | |||||||
| Realized losses: |
||||||||||
| Fixed maturities |
— | — | (1.3 | ) | ||||||
| Equity securities |
(15.9 | ) | (37.7 | ) | (7.1 | ) | ||||
| Other invested assets |
— | (11.0 | ) | — | ||||||
| Total realized losses |
(15.9 | ) | (48.7 | ) | (8.4 | ) | ||||
| Net realized gain (loss) on investments |
$ | (5.2 | ) | (36.4 | ) | 12.1 | ||||
| Change in unrealized holding gains (losses): |
||||||||||
| Fixed maturities |
$ | 54.1 | (32.9 | ) | 5.7 | |||||
| Equity securities |
41.2 | (50.8 | ) | (9.4 | ) | |||||
| Other invested assets |
8.9 | (0.9 | ) | (0.3 | ) | |||||
| Deferred federal income tax (liability) asset thereon |
(36.5 | ) | 29.6 | 1.4 | ||||||
| Valuation allowance |
2.6 | (2.6 | ) | — | ||||||
| Change in net unrealized holding gains (losses) |
$ | 70.3 | (57.6 | ) | (2.6 | ) | ||||
There was a deferred federal income tax liability on the net unrealized holding gains at December 31, 2009, of $30.2 million. There was a net deferred federal income tax asset on the net unrealized holding losses at December 31, 2008, of $3.7 million, net of a valuation allowance of $2.6 million.
3. Fair Value of Financial Instruments
Below is the fair value hierarchy that categorizes into three levels the inputs to valuation techniques that are used to measure fair value:
| • | Level 1 includes observable inputs which reflect quoted prices for identical assets or liabilities in active markets at the measurement date. |
| • | Level 2 includes observable inputs for assets or liabilities other than quoted prices included in Level 1, and it includes valuation techniques which use prices for similar assets and liabilities. |
| • | Level 3 includes unobservable inputs which reflect the reporting entity’s estimates of the assumptions that market participants would use in pricing the asset or liability (including assumptions about risk). |
The Company utilizes one nationally recognized pricing service to estimate the majority of its available for sale investment portfolio’s fair value. The Company obtains one price per security and the processes and control procedures employed by the Company are designed to ensure the value is accurately recorded on an unadjusted basis. Through discussions with the pricing service, the Company gains an understanding of the methodologies
105
Table of Contents
STATE AUTO FINANCIAL CORPORATION AND SUBSIDIARIES
(a majority-owned subsidiary of State Automobile Mutual Insurance Company)
Notes to Consolidated Financial Statements, Continued
used to price the different types of securities, that the data and the valuation methods utilized are appropriate and consistently applied, and that the assumptions are reasonable and representative of fair value. To validate the reasonableness of the valuations obtained from the pricing service, the Company compares to other fair value pricing information gathered from other independent pricing sources. At December 31, 2009, the Company did not adjust any of the prices received from the pricing service.
The following sections describe the valuation methods used by the Company for each type of financial instrument it holds that are carried at fair value:
Fixed Maturities
The Company utilizes a pricing service to estimate fair value measurements for approximately 99.9% of its fixed maturities. The fair value estimate of the Company’s fixed maturity investments are determined by evaluations that are based on observable market information rather than market quotes. Inputs to the evaluations include, but are not limited to, market prices from recently completed transactions and transactions of comparable securities, interest rate yield curves, credit spreads, and other market-observable information. All unadjusted estimates of fair value for fixed maturities priced by the pricing service are included in the amounts disclosed in Level 2 of the hierarchy. At December 31, 2009, the pricing service provided all valuations for the fixed maturity securities, except for one fixed maturity security discussed below.
The Company holds one fixed maturity security for which the Company estimates the fair value of this security using the present value of the future cash flows. Due to the limited amount of observable market information, the Company includes the fair value estimates for this security in Level 3.
Equities
The fair value of each equity security is based on an observable market price for an identical asset in an active market and is priced by the same pricing service discussed above. All equity securities are recorded using unadjusted market prices and have been disclosed in Level 1.
Other Invested Assets
Included in other invested assets are two international private equity funds (“the funds”) that invest in equity securities of foreign issuers and are managed by third party investment managers. The funds have a fair value of $48.3 million at December 31, 2009, which has been determined using the net asset value per share of the investments. The Company employs procedures to assess the reasonableness of the fair value of the funds including obtaining and reviewing each fund’s audited financial statements. There are no unfunded commitments related to the funds. The Company may not sell its investment in the funds; however, the Company may redeem all or a portion of its investment in the funds at net asset value per share with the appropriate prior written notice. As of October 1, 2009, the Company adopted the FASB’s new guidance related to fair value measurements and disclosures of investments in certain entities that calculate net asset value per share (or its equivalent). This new guidance classifies the fair value measurements of the funds as a Level 2 within the hierarchy due to the Company’s ability to redeem its investment in the funds at net asset value per share at the measurement date. The funds, which have historically been classified as a Level 3, were transferred out of Level 3 and into Level 2 as of October 1, 2009.
The remainder of the Company’s other invested assets consist primarily of holdings in publicly-traded mutual funds. The Company believes that its prices for these publicly-traded mutual funds based on an
106
Table of Contents
STATE AUTO FINANCIAL CORPORATION AND SUBSIDIARIES
(a majority-owned subsidiary of State Automobile Mutual Insurance Company)
Notes to Consolidated Financial Statements, Continued
observable market price for an identical asset in an active market reflect their fair values and consequently these securities have been disclosed in Level 1.
The following tables reflect the Company’s available-for-sale investments within the fair value hierarchy at December 31, 2009 and 2008:
| ($ millions)
At December 31, 2009: |
Total | Quoted prices in active markets for identical assets (Level 1) |
Significant other observable inputs (Level 2) |
Significant unobservable inputs (Level 3) | |||||
| Fixed maturities: |
|||||||||
| U.S. treasury securities and obligations of U.S. government agencies |
$ | 352.9 | — | 352.9 | — | ||||
| Obligations of states and political subdivisions |
1,078.6 | — | 1,078.6 | — | |||||
| Corporate securities |
99.7 | — | 97.4 | 2.3 | |||||
| U.S. government agencies residential mortgage-backed securities |
300.6 | — | 300.6 | — | |||||
| Total fixed maturities |
1,831.8 | — | 1,829.5 | 2.3 | |||||
| Equity securities: |
|||||||||
| Large-cap equity securities |
196.1 | 196.1 | — | — | |||||
| Small-cap equity securities |
28.0 | 28.0 | — | — | |||||
| Total equity securities |
224.1 | 224.1 | — | — | |||||
| Other invested assets |
52.3 | 4.0 | 48.3 | — | |||||
| Total available-for-sale investments |
$ | 2,108.2 | 228.1 | 1,877.8 | 2.3 | ||||
| ($ millions)
At December 31, 2008: |
Total | Quoted prices in active markets for identical assets (Level 1) |
Significant other observable inputs (Level 2) |
Significant unobservable inputs (Level 3) | |||||
| Fixed maturities: |
|||||||||
| U.S. treasury securities and obligations of U.S. government agencies |
$ | 127.6 | — | 127.6 | — | ||||
| Obligations of states and political subdivisions |
1,451.0 | — | 1,451.0 | — | |||||
| Corporate securities |
11.8 | — | 9.5 | 2.3 | |||||
| U.S. government agencies residential mortgage-backed securities |
180.3 | — | 180.3 | — | |||||
| Total fixed maturities |
1,770.7 | — | 1,768.4 | 2.3 | |||||
| Equity securities: |
|||||||||
| Large-cap equity securities |
130.2 | 130.2 | — | — | |||||
| Small-cap equity securities |
7.3 | 7.3 | — | — | |||||
| Total equity securities |
137.5 | 137.5 | — | — | |||||
| Other invested assets |
31.7 | 2.9 | — | 28.8 | |||||
| Total available-for-sale investments |
$ | 1,939.9 | 140.4 | 1,768.4 | 31.1 | ||||
107
Table of Contents
STATE AUTO FINANCIAL CORPORATION AND SUBSIDIARIES
(a majority-owned subsidiary of State Automobile Mutual Insurance Company)
Notes to Consolidated Financial Statements, Continued
For assets measured at fair value on a recurring basis using significant unobservable inputs (Level 3), a reconciliation of the beginning and ending balances for 2009 and 2008, separately for each major category of assets, is as follows:
| ($ millions) | Fixed maturities |
Other invested assets |
||||
| Balance at January 1, 2009 |
$ | 2.3 | 28.8 | |||
| Total realized gains and losses |
— | 5.7 | ||||
| Included in other comprehensive loss—total gains or losses unrealized |
— | 0.9 | ||||
| Purchases, issuances, and settlements |
— | 1.9 | ||||
| Transfers in and/or (out) of Level 3 |
— | (37.3 | ) | |||
| Balance at December 31, 2009 |
$ | 2.3 | — | |||
| ($ millions) | Fixed maturities |
Other invested assets |
||||
| Balance at January 1, 2008 |
$ | 2.1 | 15.8 | |||
| Total realized gains and losses |
— | (11.0 | ) | |||
| Included in other comprehensive loss—total gains or losses unrealized |
0.2 | — | ||||
| Purchases, issuances, and settlements |
— | 24.0 | ||||
| Transfers in and/or (out) of Level 3 |
— | — | ||||
| Balance at December 31, 2008 |
$ | 2.3 | 28.8 | |||
Below is a summary of the carrying value and fair value of financial instruments at December 31, 2009:
| ($ millions) | Carrying value |
Fair value |
Reference | |||||
| Assets: |
||||||||
| Fixed maturities, available-for-sale, at fair value |
$ | 1,831.8 | $ | 1,831.8 | See above | |||
| Equity securities, available-for-sale, at fair value |
224.1 | 224.1 | See above | |||||
| Other invested assets, available-for-sale, at fair value |
52.3 | 52.3 | See above | |||||
| Notes receivable from affiliate |
70.0 | 69.9 | See Note 6 | |||||
| Liabilities: |
||||||||
| Notes payable |
117.2 | 117.3 | See Note 7 | |||||
| Pension plan assets |
See Note 10 | |||||||
| Postretirement plan assets |
See Note 10 | |||||||
108
Table of Contents
STATE AUTO FINANCIAL CORPORATION AND SUBSIDIARIES
(a majority-owned subsidiary of State Automobile Mutual Insurance Company)
Notes to Consolidated Financial Statements, Continued
4. Losses and Loss Expenses Payable
Activity in the liability for losses and loss expenses for the year ended December 31 is summarized as follows:
| ($ millions) | 2009 | 2008 | 2007 | |||||||
| Losses and loss expenses payable, at beginning of year |
$ | 791.2 | 658.3 | 674.5 | ||||||
| Less: reinsurance recoverable on losses and loss expenses payable |
21.2 | 11.2 | 13.5 | |||||||
| Net balance at beginning of year |
770.0 | 647.1 | 661.0 | |||||||
| Impact of pooling change, January 1, 2008 (Note 6a) |
— | 51.3 | — | |||||||
| Incurred related to: |
||||||||||
| Current year |
899.5 | 874.0 | 645.5 | |||||||
| Prior years |
(56.2 | ) | (27.3 | ) | (54.7 | ) | ||||
| Total incurred |
843.3 | 846.7 | 590.8 | |||||||
| Paid related to: |
||||||||||
| Current year |
524.8 | 518.7 | 368.7 | |||||||
| Prior years |
269.1 | 256.4 | 236.0 | |||||||
| Total paid |
793.9 | 775.1 | 604.7 | |||||||
| Net balance at end of year |
819.4 | 770.0 | 647.1 | |||||||
| Plus: reinsurance recoverable on losses and loss expenses payable |
20.8 | 21.2 | 11.2 | |||||||
| Losses and loss expenses payable, at end of year (affiliate $346.2, $343.0 and $257.2, respectively) |
$ | 840.2 | 791.2 | 658.3 | ||||||
The Company recorded favorable loss and loss expense reserve development in 2009, 2008, and 2007 of $56.2 million, $27.3 million and $54.7 million, respectively. The favorable development in 2009 is the result of subsequent reserve reviews using more mature claim data. Favorable development in 2009 of loss adjustment expense and catastrophe losses contributed approximately $10.9 million each. Of the remaining favorable development in 2009, $9.5 million and $8.3 million is attributable to auto liability, both personal and commercial, and other & product liability, respectively. The favorable development in those lines is driven by emergence of lower than anticipated claim severity, as well as lower than anticipated claim frequency for other & product liability. Approximately half of the 2008 favorable development is attributable to loss adjustment expense being lower than anticipated. The remainder is primarily attributable to favorable emergence of catastrophe losses as well as non-catastrophe homeowners losses, where claims severity emerged lower than anticipated. The favorable development in 2007 was primarily due to auto liability and other liability losses being approximately $23.5 million less than anticipated as revised loss projections using more mature claim data resulted in lower claim severity than in past projections, loss adjustment expenses being approximately $11.8 million lower than anticipated in proportion to losses and ceded losses being above previously anticipated levels by approximately $10.0 million.
5. Reinsurance
In the ordinary course of business, the Company assumes and cedes reinsurance with other insurers and reinsurers and is a member in various pools and associations. See Note 6a for discussion of reinsurance with affiliates. The voluntary arrangements provide greater diversification of business and limit the maximum net loss
109
Table of Contents
STATE AUTO FINANCIAL CORPORATION AND SUBSIDIARIES
(a majority-owned subsidiary of State Automobile Mutual Insurance Company)
Notes to Consolidated Financial Statements, Continued
potential arising from large risks and catastrophes. Most of the ceded reinsurance is effected under reinsurance contracts known as treaties; the remainder is by negotiation on individual risks. Although the ceding of reinsurance does not discharge the original insurer from its primary liability to its policyholder, the insurance company that assumes the coverage assumes the related liability.
Amounts recoverable from reinsurers are estimated in a manner consistent with the claim liability associated with the reinsured business. The recoverability of these assets depends on the reinsurers’ ability to perform under the reinsurance agreements. The Company evaluates and monitors the financial condition and concentrations of credit risk associated with its reinsurers under voluntary reinsurance arrangements to minimize its exposure to significant losses from reinsurer insolvencies. The Company has reported ceded losses and loss expenses payable and prepaid reinsurance premiums with other insurers and reinsurers as assets. All reinsurance contracts provide for indemnification against loss or liability relating to insurance risk and have been accounted for as reinsurance.
Prior to the reinsurance transaction with State Auto Mutual under the Pooling Arrangement, as discussed in Note 6a, the effect of the Company’s external reinsurance on its balance sheets and income statements is summarized as follows:
| ($ millions) | December 31 | ||||||
| 2009 | 2008 | ||||||
| Losses and loss expenses payable: |
|||||||
| Direct |
$ | 489.6 | 443.3 | ||||
| Assumed |
4.4 | 4.8 | |||||
| Ceded |
(20.8 | ) | (20.6 | ) | |||
| Net losses and loss expenses payable |
$ | 473.2 | 427.5 | ||||
| Unearned premiums: |
|||||||
| Direct |
$ | 365.3 | 339.0 | ||||
| Assumed |
1.0 | 1.1 | |||||
| Ceded |
(7.2 | ) | (7.0 | ) | |||
| Net unearned premiums |
$ | 359.1 | 333.1 | ||||
110
Table of Contents
STATE AUTO FINANCIAL CORPORATION AND SUBSIDIARIES
(a majority-owned subsidiary of State Automobile Mutual Insurance Company)
Notes to Consolidated Financial Statements, Continued
| ($ millions) | Year ended December 31 | |||||||||
| 2009 | 2008 | 2007 | ||||||||
| Written premiums: |
||||||||||
| Direct |
$ | 830.3 | 784.1 | 757.4 | ||||||
| Assumed |
4.9 | 5.5 | 6.5 | |||||||
| Ceded |
(26.7 | ) | (22.5 | ) | (18.8 | ) | ||||
| Net written premiums |
$ | 808.5 | 767.1 | 745.1 | ||||||
| Earned premiums: |
||||||||||
| Direct |
$ | 802.8 | 759.4 | 751.0 | ||||||
| Assumed |
5.0 | 5.6 | 6.5 | |||||||
| Ceded |
(26.5 | ) | (21.5 | ) | (18.8 | ) | ||||
| Net earned premiums |
$ | 781.3 | 743.5 | 738.7 | ||||||
| Losses and loss expenses incurred: |
||||||||||
| Direct |
$ | 587.0 | 563.8 | 438.5 | ||||||
| Assumed |
2.7 | 2.7 | 2.0 | |||||||
| Ceded |
(10.7 | ) | (15.8 | ) | (2.9 | ) | ||||
| Net losses and loss expenses incurred |
$ | 579.0 | 550.7 | 437.6 | ||||||
6. Transactions with Affiliates
a. Reinsurance
Prior to 2008, State Auto P&C, Milbank, Farmers, and SA Ohio (“the STFC Pooled Companies”) participated in a quota share reinsurance pooling arrangement (“the Pooling Arrangement”) with State Auto Mutual and its subsidiaries and affiliates, State Auto Insurance Company of Wisconsin (“SA Wisconsin”), State Auto Florida Insurance Company (“SA Florida”), Meridian Citizens Mutual Insurance Company (“Meridian Citizens Mutual”) and Meridian Security Insurance Company (“Meridian Security”). Effective January 1, 2008, the Pooling Arrangement was amended to add Beacon National Insurance Company (“Beacon National”), Patrons Mutual Insurance Company of Connecticut (“Patrons Mutual”), Litchfield Mutual Fire Insurance Company (“Litchfield”) and the middle market business written by State Auto Mutual and Meridian Security.
In conjunction with the January 1, 2008 Pooling Arrangement amendment, the STFC Pooled Companies received $92.0 million in cash, for additional net insurance liabilities assumed on January 1, 2008. The following table presents the impact on the Company’s balance sheet on January 1, 2008, relative to the additional net insurance liabilities assumed on this date.
| ($ millions) | ||||
| Losses and loss expenses payable |
$ | 51.3 | ||
| Unearned premiums |
53.6 | |||
| Deferred policy acquisition costs |
(12.9 | ) | ||
| Net cash received |
$ | 92.0 | ||
111
Table of Contents
STATE AUTO FINANCIAL CORPORATION AND SUBSIDIARIES
(a majority-owned subsidiary of State Automobile Mutual Insurance Company)
Notes to Consolidated Financial Statements, Continued
In general, under the Pooling Arrangement, the STFC Pooled Companies, SA Wisconsin, SA Florida, Meridian Citizens Mutual, Meridian Security, Beacon National, Patrons Mutual and Litchfield cede to State Auto Mutual all of their insurance business and assume from State Auto Mutual an amount equal to their respective participation percentages in the Pooling Arrangement. The STFC Pooled Companies’ pooling participation percentage remained at 80% under the amended Pooling Arrangement effective January 1, 2008. All premiums, losses and loss expenses and underwriting expenses are allocated among the participants on the basis of each Company’s participation percentage in the Pooling Arrangement. The Pooling Arrangement provides indemnification against loss or liability relating to insurance risk and has been accounted for as reinsurance.
The Pooling Arrangement does not relieve each individual pooled subsidiary of its primary liability as the originating insurer; consequently, there is a concentration of credit risk arising from business ceded to State Auto Mutual. As the Pooling Arrangement provides for the right of offset, the Company has reported losses and loss expenses payable and prepaid reinsurance premiums to State Auto Mutual as assets only in situations when net amounts ceded to State Auto Mutual exceed net amounts assumed. All parties that participate in the Pooling Arrangement have an A.M. Best rating of A+ (Superior).
The following provides a summary of the reinsurance transactions on the Company’s balance sheets and income statements for the Pooling Arrangement between the STFC Pooled Companies and State Auto Mutual:
| ($ millions) | December 31 | ||||||
| 2009 | 2008 | ||||||
| Losses and loss expenses payable: |
|||||||
| Ceded |
$ | (453.0 | ) | (407.3 | ) | ||
| Assumed |
799.2 | 750.3 | |||||
| Net assumed |
$ | 346.2 | 343.0 | ||||
| Unearned premiums: |
|||||||
| Ceded |
$ | (348.7 | ) | (321.6 | ) | ||
| Assumed |
529.4 | 496.6 | |||||
| Net assumed |
$ | 180.7 | 175.0 | ||||
| ($ millions) | Year ended December 31 | |||||||||
| 2009 | 2008 | 2007 | ||||||||
| Written premiums: |
||||||||||
| Ceded |
$ | (770.8 | ) | (724.9 | ) | (702.3 | ) | |||
| Assumed |
1,172.7 | 1,107.4 | 973.9 | |||||||
| Earned premiums: |
||||||||||
| Ceded |
$ | (742.6 | ) | (700.9 | ) | (695.7 | ) | |||
| Assumed |
1,137.8 | 1,081.7 | 965.5 | |||||||
| Losses and loss expenses incurred: |
||||||||||
| Ceded |
$ | (545.0 | ) | (514.6 | ) | (405.6 | ) | |||
| Assumed |
809.2 | 810.6 | 558.2 | |||||||
112
Table of Contents
STATE AUTO FINANCIAL CORPORATION AND SUBSIDIARIES
(a majority-owned subsidiary of State Automobile Mutual Insurance Company)
Notes to Consolidated Financial Statements, Continued
The pool participants, SA National and Beacon Lloyds Insurance Company (“Beacon Lloyds”) are collectively referred to as the “State Auto Group.”
Until June 30, 2008, State Auto P&C assumed catastrophe reinsurance from the State Auto Group in the amount of $100.0 million excess of $135.0 million in exchange for a premium paid by each reinsured company. Under this agreement, the Company had assumed from State Auto Mutual and its affiliates premiums written and earned of $1.7 million and $3.1 million for 2008 and 2007, respectively. There have been no losses assumed under this agreement. The catastrophe reinsurance program with State Auto P&C had been excluded from the Pooling Arrangement.
Ceded losses and loss expenses payable related to the terminated reinsurance agreement that is in run-off between SA National and State Auto Mutual were $0.1 million and $0.5 million at December 31, 2009 and 2008, respectively. Ceded losses and loss expenses incurred related to the terminated reinsurance agreement were $0.1 million and $0.6 million for 2009 and 2007, respectively. There was no impact to the 2008 income statement.
Intercompany Balances
Pursuant to the Pooling Arrangement, State Auto Mutual receives all premiums and pays all losses and expenses associated with the insurance business produced by the pool participants and then settles the intercompany balances generated by these transactions with the participating companies on a quarterly basis within 45 days following each quarter end. No interest is paid on this balance. When settling the intercompany balances, State Auto Mutual provides the pool participants with full credit for the premiums written and net losses paid during the quarter and retains all receivable amounts from insureds and agents and reinsurance recoverable on paid losses from unaffiliated reinsurers. Any receivable amounts that are ultimately deemed to be uncollectible are charged-off by State Auto Mutual and allocated to the pool members on the basis of pool participation. As a result, the Company has an off-balance sheet credit–risk related to the balances due to State Auto Mutual from insurers, agents and reinsurers, which are offset by the unearned premium from the respective policies. The Company’s share of the premium balances due to State Auto Mutual from agents and insureds at December 31, 2009 and 2008 is approximately $320.2 million and $296.8 million, respectively.
b. Notes Payable
In May 2003, State Auto Financial formed a Delaware business trust (the “Capital Trust”) that issued $15.0 million mandatorily redeemable preferred capital securities to a third party and $0.5 million of its common securities representing all outstanding common securities to State Auto Financial (collectively, the capital and common securities are referred to as the “Trust Securities”). The Capital Trust loaned $15.5 million in proceeds from the issuance of its Trust Securities to State Auto Financial in the form of a Floating Rate Junior Subordinated Debt Securities due in 2033 (the “Subordinated Debentures”). The Subordinated Debentures are the Capital Trust’s only assets along with any interest accrued thereon. Interest on the Trust Securities are payable quarterly at a rate equal to the three-month LIBOR rate plus 4.20% adjusted quarterly (total 4.46% at December 31, 2009). Prior to May 2008, the interest rate could not exceed 12.5% per annum. The interest rate and interest payment dates on the Subordinated Debentures are the same as the interest rate and interest payment dates on the Trust Securities, thereby payments from the Subordinated Debentures finance the distributions paid on the Trust Securities. State Auto Financial has the right to redeem the Subordinated Debentures, in whole or in part, on or after May 23, 2008. In accordance with the Consolidation Topic of the FASB ASC, State Auto Financial determined that the business trust is a variable interest entity for which it is not the primary beneficiary and therefore, does not consolidate the Capital Trust with the Company. State Auto Financial has unconditionally
113
Table of Contents
STATE AUTO FINANCIAL CORPORATION AND SUBSIDIARIES
(a majority-owned subsidiary of State Automobile Mutual Insurance Company)
Notes to Consolidated Financial Statements, Continued
and irrevocably guaranteed payment of any required distributions on the capital securities, the redemption price when the capital securities are redeemed, and any amounts due if the Capital Trust is liquidated or terminated. State Auto Financial’s equity interest in the Capital Trust is included in other invested assets.
c. Notes Receivable
In May 2009, State Auto Financial’s subsidiaries State Auto P&C and Milbank entered into separate credit agreements with State Auto Mutual, in which $70.0 million ($50.0 million and $20.0 million, respectively) was loaned to State Auto Mutual for ten years. Interest is due semi-annually at a fixed annual interest rate of 7.00%, with the principal due May 2019. There is no prepayment penalty, and there was no collateral given in exchange for the notes.
Under these agreements, State Auto Financial earned interest of $3.1 million for the year December 31, 2009. Interest income is included in net investment income on the condensed consolidated statements of income.
The Company estimates the fair value of the notes receivable from affiliate using market quotations for U.S. treasury securities with similar maturity dates and applies an appropriate credit spread. Notes receivable at December 31, 2009, consisted of the following:
| ($ millions, except interest rate) | Carrying value |
Fair value |
Interest rate |
||||||
| Notes receivable from affiliate |
$ | 70.0 | $ | 69.9 | 7.00 | % | |||
d. Management Services
Stateco provides State Auto Mutual and its affiliates investment management services. Investment management income is recognized quarterly based on a percentage of the average fair value of investable assets and the equity portfolio performance of each company managed. Revenue related to these services amounted to $1.6 million, $2.5 million and $2.8 million in 2009, 2008 and 2007, respectively, and is included in other income (affiliates).
7. Notes Payable and Credit Facility
In 2003, State Auto Financial issued $100.0 million of unsecured Senior Notes due November 2013. The Senior Notes bear interest at a fixed rate of 6.25% per annum, which is payable each May 15 and November 15. The Senior Notes are general unsecured obligations ranking senior to all existing and future subordinated indebtedness and equal with all existing and future senior indebtedness. The Senior Notes are not guaranteed by any of State Auto Financial’s subsidiaries and thereby are effectively subordinated to all subsidiaries’ existing and future indebtedness. State Auto Financial incurred $1.5 million in issuance costs related to the Senior Notes, which is recorded in other assets and is being amortized into interest expense ($0.1 million each for 2009, 2008 and 2007) as the underlying interest expense is recognized on the Senior Notes.
State Auto Financial has a credit facility (the “Credit Facility”) with a syndicate of financial institutions. On April 1, 2009, the Credit Facility was amended as follows:
| • | The maximum amount which may be borrowed by State Auto Financial was reduced from $200.0 million to $100.0 million; |
114
Table of Contents
STATE AUTO FINANCIAL CORPORATION AND SUBSIDIARIES
(a majority-owned subsidiary of State Automobile Mutual Insurance Company)
Notes to Consolidated Financial Statements, Continued
| • | The amount of loans that may be advanced from State Auto Financial and its subsidiaries to State Auto Mutual and its subsidiaries (that are not State Auto Financial or its subsidiaries) was increased from $50.0 million to $75.0 million; |
| • | The definition of net worth was modified to exclude accumulated other comprehensive income (loss); and |
| • | State Auto Financial’s minimum net worth covenant was modified. |
As amended, the Credit Facility provides for a $100.0 million unsecured revolving credit facility maturing in July 2012. The Credit Facility is available for general corporate purposes. The Credit Facility provides for interest-only payments during its term, with principal due in full at maturity. Interest is based on a London interbank market rate or a base rate plus a calculated margin amount. The Credit Facility includes certain covenants, including financial covenants that require the Company to maintain a minimum net worth and not exceed a certain debt to capitalization ratio. As of December 31, 2009, the Company had not made any borrowings and was in compliance with all covenants related to the Credit Facility. State Auto Financial incurred $0.5 million in issuance costs related to the Credit Facility, which is recorded in other assets and is being amortized into expense ($0.1 million for 2009, 2008 and 2007) over the life of the Credit Facility.
See discussion of affiliate notes payable at Note 6b. The carrying amount of the Subordinated Debentures in the consolidated balance sheets approximates its fair value as the interest rate adjusts quarterly. The fair value of the Senior Notes is based on the quoted market price at December 31, 2009 and 2008, respectively. Notes payable at December 31 consisted of the following:
| ($ millions, except interest rates) | 2009 | 2008 | ||||||||||||||||
| Carrying value |
Fair value |
Interest rate |
Carrying value |
Fair value |
Interest rate |
|||||||||||||
| Senior Notes due 2013: issued $100.0, November 2003 with fixed interest |
$ | 101.7 | $ | 101.8 | 6.25 | % | $ | 102.1 | $ | 86.9 | 6.25 | % | ||||||
| Affiliate Subordinated Debentures due 2033: issued $15.5, May 2003 with variable interest |
15.5 | 15.5 | 4.46 | 15.5 | 15.5 | 6.38 | ||||||||||||
| Total notes payable |
$ | 117.2 | $ | 117.3 | $ | 117.6 | $ | 102.4 | ||||||||||
8. Federal Income Taxes
The reconciliation between actual federal income tax expense (benefit) and the amount computed at the indicated statutory rate for the year ended December 31 is summarized as follows:
| ($ millions) | 2009 | % | 2008 | % | 2007 | % | ||||||||||||||
| Amount at statutory rate |
$ | (4.5 | ) | 35 | $ | (26.3 | ) | 35 | $ | 54.4 | 35 | |||||||||
| Tax-free interest and dividends received deduction |
(16.9 | ) | 133 | (19.7 | ) | 26 | (18.5 | ) | (12 | ) | ||||||||||
| Other, net |
(1.1 | ) | 8 | 1.5 | (2 | ) | 0.3 | — | ||||||||||||
| Valuation allowance |
(0.5 | ) | 4 | 0.5 | (1 | ) | — | — | ||||||||||||
| Federal income tax (benefit) expense and effective rate |
$ | (23.0 | ) | 180 | $ | (44.0 | ) | 58 | $ | 36.2 | 23 | |||||||||
115
Table of Contents
STATE AUTO FINANCIAL CORPORATION AND SUBSIDIARIES
(a majority-owned subsidiary of State Automobile Mutual Insurance Company)
Notes to Consolidated Financial Statements, Continued
The tax effects of temporary differences that give rise to significant portions of deferred tax assets and deferred tax liabilities as of December 31 are presented below:
| ($ millions) | 2009 | 2008 | ||||
| Deferred tax assets: |
||||||
| Unearned premiums not currently deductible |
$ | 37.9 | 35.3 | |||
| Losses and loss expenses payable discounting |
23.7 | 22.0 | ||||
| Postretirement and pension benefits |
52.5 | 64.2 | ||||
| Unrealized holding losses on investments |
— | 6.3 | ||||
| Realized loss on other-than-temporary impairment |
14.4 | 14.9 | ||||
| Employee compensation and benefits |
5.1 | 2.1 | ||||
| Asset valuation allowance |
3.5 | 1.0 | ||||
| Other |
13.5 | 11.1 | ||||
| Deferred tax assets |
150.6 | 156.9 | ||||
| Valuation allowance |
— | (3.1 | ) | |||
| Total deferred tax assets |
150.6 | 153.8 | ||||
| Deferred tax liabilities: |
||||||
| Deferral of policy acquisition costs |
44.5 | 42.8 | ||||
| Unrealized holding gains on investments |
30.2 | — | ||||
| Total deferred tax liabilities |
74.7 | 42.8 | ||||
| Net deferred federal income taxes |
$ | 75.9 | 111.0 | |||
If the Company determines it is more likely than not that any of its deferred tax assets will not result in future tax benefits, a valuation allowance must be established for the portion of these assets that are not expected to be realized. Although realization of deferred tax assets is not assured, based upon a review of all available evidence, both positive and negative, including the Company’s historical and anticipated future taxable income, the Company’s management concluded that it is more likely than not that the net deferred income tax assets will be realized. No valuation allowance was held at December 31, 2009. At December 31, 2008, the Company established a valuation allowance of $3.1 million for the portion of the deferred tax asset that management believed would not be realized. The valuation allowance was allocated $0.5 million to deferred tax expense associated with realized investment losses recognized in the income statement and $2.6 million against the unrealized holding losses on equity securities recognized through accumulated other comprehensive loss, a component of equity.
At December 31, 2009, the Company carried no balance for uncertain tax positions.
The Company had no accrual for the payment of interest and penalties at December 31, 2009 or 2008.
The Company files a consolidated U.S. federal income tax return. The Company and its subsidiaries also file in various state jurisdictions. The Company is no longer subject to U.S. federal or state and local income tax examinations by tax authorities for years before 2006. The Internal Revenue Service commenced a limited scope examination of the Company’s U.S. income tax return for 2008 in the first quarter of 2010 that is anticipated to be completed by the end of 2010.
116
Table of Contents
STATE AUTO FINANCIAL CORPORATION AND SUBSIDIARIES
(a majority-owned subsidiary of State Automobile Mutual Insurance Company)
Notes to Consolidated Financial Statements, Continued
9. Restructuring Costs
In June 2009, the Company initiated a plan to restructure its field and claims operations. Restructuring charges, including employee termination benefits, relocation packages, and costs associated with ceasing to use leased properties, related to this reorganization have been recognized in accordance with the Exit or Disposal Cost Obligations Topic of the FASB ASC. Consideration of this restructuring resulted in a curtailment of the Company’s pension and postretirement benefit plans as of June 30, 2009, due to the elimination of expected years of future services of those impacted employees. The Company recognized restructuring costs totaling $4.8 million during the year ended December 31, 2009, and anticipates additional charges of approximately $1.7 million through the fourth quarter 2010, the expected completion date of the restructuring. These charges are included in losses and loss expenses and acquisition and operating expenses on the condensed consolidated statements of income.
Total cumulative estimated costs to be incurred and costs incurred through December 31, 2009, are as follows:
| ($ millions) | Total cumulative estimated costs to be incurred |
Costs incurred through December 31, 2009 |
|||||
| Employee termination benefits |
$ | 6.3 | 4.5 | ||||
| Relocation costs |
2.7 | 1.4 | |||||
| Lease termination |
0.4 | 0.2 | |||||
| Benefit plan curtailment |
(2.9 | ) | (1.3 | ) | |||
| Total |
$ | 6.5 | 4.8 | ||||
These costs are allocated to the Company’s insurance segments as follows:
| ($ millions) | Total cumulative estimated costs to be incurred |
Costs incurred through December 31, 2009 | |||
| Personal insurance |
$ | 3.1 | 2.5 | ||
| Business insurance |
3.4 | 2.3 | |||
| Total |
$ | 6.5 | 4.8 | ||
Activity for the year ended December 31, 2009, was as follows:
| ($ millions) | Balance of liability at December 31, 2008 |
Costs incurred |
Amounts paid |
Balance of liability at December 31, 2009 | ||||||
| Employee termination benefits |
$ | — | 4.5 | 0.6 | 3.9 | |||||
| Relocation costs |
— | 1.4 | 1.4 | — | ||||||
| Lease termination |
— | 0.2 | 0.1 | 0.1 | ||||||
| Benefit plan curtailment (non-cash item) |
— | (1.3 | ) | — | — | |||||
| Total |
$ | — | 4.8 | 2.1 | 4.0 | |||||
117
Table of Contents
STATE AUTO FINANCIAL CORPORATION AND SUBSIDIARIES
(a majority-owned subsidiary of State Automobile Mutual Insurance Company)
Notes to Consolidated Financial Statements, Continued
10. Pension and Postretirement Benefit Plans
The Company, through its employees of State Auto P&C, provides management and operation services under management agreements for all insurance and non-insurance affiliates. The annual periodic costs related to the Company’s benefit plans are allocated to affiliated companies based on allocations pursuant to intercompany management agreements.
The Company provides a defined benefit pension plan for its eligible employees. Substantially all Company employees become eligible to participate the year after becoming 20 years of age and vest with 5 years of credited service or attained age 65. The Company’s policy is to fund pension costs in accordance with the requirements of the Employee Retirement Income Security Act of 1974. Benefits are determined by applying factors specified in the plan to a participant’s defined average annual compensation.
In addition to the defined benefit pension plan, the Company provides a postretirement benefit plan including certain health care and life insurance benefits for its eligible retired employees. Substantially all of the Company’s employees may become eligible for these postretirement benefits if they retire between age 55 and 65 with 15 years or more of service or if they retire at age 65 or later with 5 years or more of service. The defined benefit pension and postretirement benefit plans are referred to herein as “the benefit plans.”
Effective January 1, 2008, the Company adopted the measurement date requirement under transition alternative method one, as defined in SFAS No. 158 (codified in the Compensation—Retirement Benefits Topic of the FASB ASC), moving from a September 30 measurement date to a December 31 date for measuring its benefit plan obligations. This transition method resulted in a one-time adjustment that decreased beginning retained earnings by $2.4 million, net of tax. The combined impact of the measurement date transition and re-measurement of plan assets and obligations on January 1, 2008, increased beginning accumulated comprehensive income by $3.5 million, net of tax.
118
Table of Contents
STATE AUTO FINANCIAL CORPORATION AND SUBSIDIARIES
(a majority-owned subsidiary of State Automobile Mutual Insurance Company)
Notes to Consolidated Financial Statements, Continued
Information regarding the Company’s pension and postretirement benefit plans’ change in benefit obligation, plan assets and funded status as of December 31 are as follows:
| ($ millions) | Pension | Postretirement | |||||||||||
| 2009 | 2008 | 2009 | 2008 | ||||||||||
| Change in benefit obligation: |
|||||||||||||
| Benefit obligation at beginning of year |
$ | 245.9 | 217.3 | 111.6 | 123.0 | ||||||||
| Business combination |
3.5 | — | — | — | |||||||||
| Curtailment |
(2.2 | ) | — | (5.9 | ) | — | |||||||
| Plan amendments |
— | — | (0.9 | ) | (28.1 | ) | |||||||
| SFAS No. 158 measurement date transition |
— | (4.7 | ) | — | (2.4 | ) | |||||||
| Special termination benefits |
— | 2.0 | — | 0.4 | |||||||||
| Service cost |
10.2 | 8.9 | 4.9 | 4.8 | |||||||||
| Interest cost |
14.5 | 13.5 | 6.5 | 7.3 | |||||||||
| Actuarial (gain) loss |
(1.9 | ) | 24.5 | (18.3 | ) | 9.3 | |||||||
| Benefits paid |
(20.0 | ) | (15.6 | ) | (2.5 | ) | (2.7 | ) | |||||
| Benefit obligation at end of year |
$ | 250.0 | 245.9 | 95.4 | 111.6 | ||||||||
| Change in plan assets: |
|||||||||||||
| Fair value of plan assets at beginning of year |
$ | 172.7 | 220.0 | 2.5 | 2.3 | ||||||||
| Business combination |
3.9 | — | — | — | |||||||||
| SFAS No. 158 measurement date transition |
— | (5.4 | ) | — | 0.1 | ||||||||
| Employer contribution |
15.0 | 12.0 | — | — | |||||||||
| Actual return on plan assets |
26.3 | (38.3 | ) | 0.1 | 0.1 | ||||||||
| Benefits paid |
(20.0 | ) | (15.6 | ) | — | — | |||||||
| Fair value of plan assets at end of year |
$ | 197.9 | 172.7 | 2.6 | 2.5 | ||||||||
| Supplemental executive retirement plan |
— | — | (5.5 | ) | (5.4 | ) | |||||||
| Funded status at end of year |
$ | (52.1 | ) | (73.2 | ) | (98.3 | ) | (114.5 | ) | ||||
| Accumulated benefit obligation—end of year |
$ | 225.4 | 215.2 | ||||||||||
No assets are expected to be returned during the fiscal year-ended December 31, 2010.
In October 2008, the Company announced a substantive change to increase retiree cost sharing within the postretirement medical plan, effective January 1, 2009. This change reduced the Company’s postretirement benefit obligation by $28.1 million as of December 31, 2008.
119
Table of Contents
STATE AUTO FINANCIAL CORPORATION AND SUBSIDIARIES
(a majority-owned subsidiary of State Automobile Mutual Insurance Company)
Notes to Consolidated Financial Statements, Continued
Included in accumulated other comprehensive losses are the following amounts that have not been recognized in net periodic cost:
| ($ millions) | December 31 | ||||||
| 2009 | 2008 | ||||||
| Transition asset |
$ | (0.9 | ) | (1.6 | ) | ||
| Prior service benefit |
(21.1 | ) | (22.9 | ) | |||
| Net actuarial loss |
117.6 | 159.0 | |||||
| Total |
$ | 95.6 | 134.5 | ||||
The amount of amortization expected to be recognized during the fiscal year ending December 31, 2010 for the State Auto Group is as follows:
| ($ millions) | 2010 | |||
| Transition asset |
$ | (0.6 | ) | |
| Prior service benefit |
(1.3 | ) | ||
| Net actuarial loss |
5.7 | |||
| Total |
$ | 3.8 | ||
Information regarding the State Auto Group’s pension and postretirement benefit plans’ components of net periodic cost for the year ended December 31 is as follows:
| ($ millions) |
Pension | Postretirement | |||||||||||||||||
| 2009 | 2008 | 2007 | 2009 | 2008 | 2007 | ||||||||||||||
| Components of net periodic cost: |
|||||||||||||||||||
| Service cost |
$ | 10.2 | 8.9 | 9.0 | 4.9 | 4.8 | 5.6 | ||||||||||||
| Interest cost |
14.5 | 13.5 | 12.5 | 6.5 | 7.3 | 7.3 | |||||||||||||
| Expected return on plan assets |
(18.4 | ) | (19.4 | ) | (17.8 | ) | (0.2 | ) | (0.2 | ) | (0.2 | ) | |||||||
| Amortization of transition asset |
(0.7 | ) | (0.6 | ) | (0.6 | ) | — | — | — | ||||||||||
| Amortization of prior service cost (benefit) |
0.4 | 0.4 | 0.4 | (1.6 | ) | (0.1 | ) | 0.5 | |||||||||||
| Amortization of net actuarial loss |
5.1 | 2.7 | 3.9 | 0.1 | — | 0.8 | |||||||||||||
| Net periodic cost |
11.1 | 5.5 | 7.4 | 9.7 | 11.8 | 14.0 | |||||||||||||
| Cost of special termination benefit |
— | 2.0 | — | — | 0.3 | — | |||||||||||||
| Curtailment loss (gain) |
0.3 | — | — | (1.7 | ) | — | — | ||||||||||||
| Net periodic cost |
$ | 11.4 | 7.5 | 7.4 | 8.0 | 12.1 | 14.0 | ||||||||||||
120
Table of Contents
STATE AUTO FINANCIAL CORPORATION AND SUBSIDIARIES
(a majority-owned subsidiary of State Automobile Mutual Insurance Company)
Notes to Consolidated Financial Statements, Continued
The following benefit payments, which reflect expected future service, are expected to be paid:
| ($ millions) | Pension | Postretirement | ||||
| 2010 |
$ | 10.2 | $ | 3.7 | ||
| 2011 |
10.6 | 3.8 | ||||
| 2012 |
11.6 | 3.9 | ||||
| 2013 |
12.6 | 4.0 | ||||
| 2014 |
13.5 | 4.3 | ||||
| 2015 – 2019 |
85.7 | 27.1 | ||||
The Company’s share of the 2009, 2008 and 2007 net periodic costs for the defined benefit plan were $11.4 million, $7.4 million, and $7.4 million, respectively. For postretirement benefits other than pensions, the Company’s share of the 2009, 2008 and 2007 net periodic costs were $5.5 million, $11.3 million and $11.6 million, respectively. The Company’s gross benefit payments for 2009 postretirement benefits were $2.8 million, including the prescription drug benefits. The Company’s subsidy related to Medicare Prescription Drug Improvement and Modernization Act of 2003 was $0.3 million for 2009 and estimates future annual subsidies to be approximately $0.4 million.
Summarized in the following table are the weighted average assumptions used to determine the Company’s benefit obligations for the year ended December 31:
| Pension | Postretirement | |||||||||||
| 2009 | 2008 | 2009 | 2008 | |||||||||
| Benefit obligations weighted-average assumptions: |
||||||||||||
| Discount rate |
6.00 | % | 6.00 | % | 6.00 | % | 6.00 | % | ||||
| Rates of increase in compensation levels |
4.00 | 4.00 | — | — | ||||||||
Summarized in the following table are the weighted average assumptions used to determine the Company’s net periodic cost:
| Pension | Postretirement | |||||||||||||||||
| 2009 | 2008 | 2007 | 2009 | 2008 | 2007 | |||||||||||||
| Weighted-average assumptions: |
||||||||||||||||||
| Discount rate |
6.00 6.25 |
%/ %* |
6.50 | % | 6.00 | % | 6.00 6.25 |
%/ %* |
6.50 | % | 6.00 | % | ||||||
| Expected long-term rate of return on assets |
9.00 8.00 |
/ * |
9.00 | 9.00 | 9.00 8.00 |
/ * |
9.00 | 9.00 | ||||||||||
| Rates of increase in compensation levels |
4.00 | 4.00 | 4.00 | — | — | — | ||||||||||||
| * | Due to the curtailment resulting from the restructuring, the expense was remeasured at June 30, 2009, using discount rate of 6.25% and expected long-term rate of return on assets of 8.00%. |
The Company’s benefit plan obligations are long-term in nature and consequently the investment strategies have a long-term time horizon. In establishing the long-term rate of return assumption on plan assets,
121
Table of Contents
STATE AUTO FINANCIAL CORPORATION AND SUBSIDIARIES
(a majority-owned subsidiary of State Automobile Mutual Insurance Company)
Notes to Consolidated Financial Statements, Continued
management, along with its pension consulting actuary, reviews the historical performance of the plan assets and the stability in the mix of the investment portfolio. The expected inflation rate and expected real rates of return of applicable asset classes are then determined to assist in setting appropriate assumptions.
The assumed health care cost trend rates used for the year ended December 31 are as follows:
| Postretirement | |||||||||
| 2009 | 2008 | 2007 | |||||||
| Assumed health care cost trend rates: |
|||||||||
| Health care cost trend rate assumed for the next year |
10.00 | % | 10.00 | % | 10.00 | % | |||
| Rate to which the cost trend rate is assumed to decline (the ultimate trend rate) |
5.00 | % | 5.00 | % | 5.00 | % | |||
| Year that the rate reaches the ultimate trend rate |
2014 | 2013 | 2012 | ||||||
The assumed health care cost trend rates have a significant effect on the amounts reported for the postretirement plan. A one percentage point change in assumed health care cost trend rates would have the following effects for the year ended December 31, 2010:
| ($ millions) | Postretirement | ||||||
| Increase | (Decrease) | ||||||
| One percentage point change: |
|||||||
| Effect on total service and interest cost |
$ | 2.1 | $ | (1.7 | ) | ||
| Effect on accumulated postretirement benefit obligation |
16.4 | (13.2 | ) | ||||
The benefit plans’ investment policy objective is to preserve the investment principal while generating income and appreciation in fair value to meet the benefit plans’ obligations. The benefit plans’ investment strategy and risk tolerance is balanced between meeting cash obligation requirements and a long term relatively high risk tolerance. Since the nature and timing of the benefit plans’ liabilities and cash requirements are predictable, the liquidity requirements are somewhat moderate. During 2007, the following asset allocation targets, as a percentage of total fair value, were approved. Management is in the process of moving towards these allocation targets as funds become available. One of the goals of diversifying the benefit plans’ portfolio among different asset classes is the elimination of concentration of risk in one asset class. Management has investment policy guidelines with respect to limiting the ownership in any single debt or equity issuer, and the international private equity investments are composed of numerous securities to reduce our exposure to a single issuer.
| Asset allocation target (0 to 100%) | ||
| Asset Category: |
||
| Fixed maturity |
23 | |
| U.S. large-cap equity |
43 | |
| U.S. small/mid-cap equity |
14 | |
| Treasury inflation protected securities |
10 | |
| International |
10 | |
122
Table of Contents
STATE AUTO FINANCIAL CORPORATION AND SUBSIDIARIES
(a majority-owned subsidiary of State Automobile Mutual Insurance Company)
Notes to Consolidated Financial Statements, Continued
See Note 3 for the valuation methods used by the Company for each type of financial instrument the plans hold that are carried at fair value.
The table below reflects the pension plan’s assets within the fair value hierarchy at December 31, 2009:
| ($ millions)
|
Total | Quoted (Level 1) |
Significant other observable inputs (Level 2) |
Significant (Level 3) | |||||
| Fixed maturities: |
|||||||||
| U.S. treasury securities and obligations of U.S. government agencies |
$ | 35.0 | — | 35.0 | — | ||||
| Corporate securities |
12.8 | — | 12.8 | — | |||||
| U.S. government agencies mortgage-backed securities: |
28.2 | — | 28.2 | — | |||||
| Total fixed maturities |
76.0 | — | 76.0 | — | |||||
| Equity securities: |
|||||||||
| Large-cap equity securities |
68.6 | 68.6 | — | — | |||||
| Small-cap equity securities |
24.9 | 24.9 | — | — | |||||
| Mutual fund—other |
0.2 | — | — | 0.2 | |||||
| Total equity securities |
93.7 | 93.5 | — | 0.2 | |||||
| International instruments |
23.3 | — | 23.3 | — | |||||
| Short-term money market funds |
3.0 | 3.0 | — | — | |||||
| Total pension plan investments |
$ | 196.0 | 96.5 | 99.3 | 0.2 | ||||
For assets measured at fair value on a recurring basis using significant unobservable inputs (Level 3), a reconciliation of the beginning and ending balances, separately for each major category of assets, is as follows:
| ($ millions) | Mutual fund – other |
International instruments |
|||||
| Beginning balance, January 1, 2009 |
$ | — | 22.5 | ||||
| Actual return on plan assets: |
|||||||
| Relating to assets still held at December 31, 2009 |
(0.1 | ) | 4.2 | ||||
| Relating to assets sold during 2009 |
— | 1.6 | |||||
| Purchases, sales, issuances and settlements |
0.3 | (5.0 | ) | ||||
| Transfers in and/or out of Level 3 |
— | (23.3 | ) | ||||
| Ending balance, December 31, 2009 |
$ | 0.2 | — | ||||
123
Table of Contents
STATE AUTO FINANCIAL CORPORATION AND SUBSIDIARIES
(a majority-owned subsidiary of State Automobile Mutual Insurance Company)
Notes to Consolidated Financial Statements, Continued
The table below reflects the postretirement plan’s assets within the fair value hierarchy at December 31, 2009:
| ($ millions)
|
Total | Quoted (Level 1) |
Significant other observable inputs (Level 2) |
Significant unobservable inputs (Level 3) | |||||
| Fixed maturities: |
|||||||||
| U.S. treasury securities and obligations of U.S. government agencies |
$ | 2.1 | — | 2.1 | — | ||||
| Corporate securities |
0.3 | — | 0.3 | — | |||||
| Total fixed maturities |
2.4 | — | 2.4 | — | |||||
| Short-term money market funds |
0.2 | 0.2 | — | — | |||||
| Total postretirement plan investments |
$ | 2.6 | 0.2 | 2.4 | — | ||||
The actuarially prepared funding amount to the pension plan ranges from the minimum amount the Company would be required to contribute to the maximum amount that would be deductible for tax purposes. Contributed amounts in excess of the minimum amounts are deemed voluntary. Amounts in excess of the maximum amount would be subject to an excise tax and may not be deductible for tax purposes. This range is generally not determined until the second quarter with respect to the contribution year. The Company expects to contribute up to $15.0 million during 2010 to its pension plan, depending on the actuarially calculated funding requirements of such plan. Postretirement and SERP plan payments are deductible for tax purposes when paid.
The Company maintains a defined contribution plan that covers substantially all employees of the Company. Effective January 1, 2008, the Company matches the first 1% of contributions of participants’ salary at the rate of one dollar for each dollar contributed. Participant contributions of 2% to 6% are matched at a rate of 50 cents for each dollar contributed. Prior to January 1, 2008, the Company matched the first 2% of contributions of participants’ salary at the rate of 75 cents for each dollar contributed. Participant contributions of 3% to 6% were matched at a rate of 50 cents for each dollar contributed. The Company’s share of the expense under the plan totaled $3.3 million, $3.1 million and $2.6 million for the years 2009, 2008 and 2007, respectively.
11. Stockholders’ Equity
a. Treasury Shares
On August 17, 2007, State Auto Financial’s board of directors authorized a plan to repurchase, from time to time, up to 4.0 million of its common shares, or approximately 10% of State Auto Financial’s outstanding shares (the “Repurchase Plan”). This program ended on December 31, 2009. Under the Repurchase Plan, State Auto Financial repurchased shares from State Auto Mutual in amounts that were proportional to the respective current ownership percentages of State Auto Mutual, which was approximately 64%, and other shareholders. State Auto Financial did not repurchase any shares in 2009 and had total share repurchase activity in 2008 of approximately 1.2 million common shares. For the lifetime of the Repurchase Plan, approximately 2.0 million common shares were purchased at an average repurchase price of $27.26 per share for a total cost of $55.3 million.
124
Table of Contents
STATE AUTO FINANCIAL CORPORATION AND SUBSIDIARIES
(a majority-owned subsidiary of State Automobile Mutual Insurance Company)
Notes to Consolidated Financial Statements, Continued
b. Dividend Restrictions and Statutory Financial Information
State Auto P&C, Milbank, Farmers, SA Ohio and SA National are subject to regulations and restrictions under which payment of dividends from statutory earned surplus can be made to State Auto Financial during the year without prior approval of regulatory authorities. Pursuant to these rules, at December 31, 2009, adjusted for dividend payments made in the previous twelve-month period, approximately $68.2 million is available for payment to State Auto Financial from its insurance subsidiaries in 2010 without prior approval. In 2009 State Auto Financial received dividends of $11.5 million from its insurance subsidiaries, $39.0 million in 2008, and $50.0 million in 2007.
Reconciliations of statutory capital and surplus and net income, as determined using SAP, to the amounts included in the accompanying consolidated financial statements as of December 31 are as follows:
| ($ millions) | 2009 | 2008 | |||||
| Statutory capital and surplus of insurance subsidiaries |
$ | 796.7 | 738.0 | ||||
| Net liabilities of non-insurance parent and affiliates |
(82.1 | ) | (73.1 | ) | |||
| 714.6 | 664.9 | ||||||
| Increases (decreases): |
|||||||
| Deferred policy acquisition costs |
127.3 | 122.3 | |||||
| Postretirement and pension benefits |
(14.6 | ) | (23.9 | ) | |||
| Deferred federal income taxes |
(26.6 | ) | 2.3 | ||||
| Fixed maturities at fair value |
43.6 | (11.3 | ) | ||||
| Other, net |
5.1 | 6.7 | |||||
| Stockholders’ equity per accompanying consolidated financial statements |
$ | 849.4 | 761.0 | ||||
| ($ millions) | Year ended December 31 | |||||||||
| 2009 | 2008 | 2007 | ||||||||
| Statutory net income (loss) of insurance subsidiaries |
$ | 9.2 | (49.8 | ) | 129.5 | |||||
| Net (loss) income of non-insurance parent and affiliates |
(0.5 | ) | (0.6 | ) | 0.5 | |||||
| 8.7 | (50.4 | ) | 130.0 | |||||||
| Increases (decreases): |
||||||||||
| Deferred policy acquisition costs |
5.0 | 16.5 | 1.7 | |||||||
| Postretirement and pension benefits |
(12.0 | ) | (10.3 | ) | (12.0 | ) | ||||
| Deferred federal income taxes |
12.5 | 16.1 | 5.4 | |||||||
| Share-based compensation expense |
(3.5 | ) | (4.6 | ) | (5.5 | ) | ||||
| Other, net |
(0.5 | ) | 1.6 | (0.5 | ) | |||||
| Net income (loss) per accompanying consolidated financial statements |
$ | 10.2 | (31.1 | ) | 119.1 | |||||
12. Preferred Stock
State Auto Financial has authorized two classes of preferred stock. For both classes, upon issuance, the Board of Directors has authority to fix and determine the significant features of the shares issued, including, among other things, the dividend rate, redemption price, redemption rights, conversion features and liquidation price payable in the event of any liquidation, dissolution, or winding up of the affairs of State Auto Financial.
125
Table of Contents
STATE AUTO FINANCIAL CORPORATION AND SUBSIDIARIES
(a majority-owned subsidiary of State Automobile Mutual Insurance Company)
Notes to Consolidated Financial Statements, Continued
The Class A preferred stock is not entitled to voting rights until, for any period, dividends are in arrears in the amount of six or more quarterly dividends.
13. Share-Based Compensation
The Company maintains share-based compensation plans for key employees and outside, or non-employee, directors. The share-based compensation plan for key employees is the State Auto Financial Corporation 2009 Equity Compensation Plan (the “Equity Plan”). This plan replaced the previous equity plan which was due to expire on July 1, 2010. The stock-based compensation plan for outside directors is the Outside Directors Restricted Share Unit Plan (the “RSU Plan”).
The Company’s share-based compensation plans authorize the granting of various equity-based incentives including stock options, restricted stock and restricted share units to employees and non-employee directors and agents. The expense for these equity-based incentives is based on their fair value at date of grant and amortized over their vesting period. The fair value of each stock option is estimated on the date of grant using the Black-Scholes closed-form pricing model. The pricing model requires assumptions such as the expected life of the option and expected volatility of the Company’s stock over the expected life of the option, which significantly impacts the assumed fair value. The Company uses historical data to determine these assumptions and if these assumptions change significantly for future grants, share-based compensation expense will fluctuate in future periods.
Equity Plan
The Equity Plan provides for the award of qualified and nonqualified stock options, restricted shares, performance shares, performance units and other stock-based awards. The Company has reserved 2.0 million common shares under the Equity Plan. As of December 31, 2009, a total of 2.0 million common shares are available for issuance under the Equity Plan. The Equity Plan provides that (i) no more than 33% of the common shares authorized for issuance under the Equity Plan may be granted in the form of awards other than stock options, (ii) the maximum number of common shares subject to awards of stock options, restricted shares and performance shares that may be granted in any calendar year is equal to 1.5% of the total number of common shares of the Company outstanding as of December 31 of the prior year, and (iii) the maximum number of common shares subject to awards of stock options, restricted shares and performance shares that may be granted in any calendar year to any one individual is 250,000 shares. The Equity Plan automatically terminates on May 8, 2019.
The Equity Plan provides that qualified stock options may be granted at an option price not less than the fair market value of the common shares at the date of grant and that nonqualified stock options may be granted at any price determined by the Compensation Committee of the Board of Directors. Options granted generally vest over a three-year period, with one-third of the options vesting on each anniversary of the grant date, and must be exercised no later than ten years from the date of grant. Stock options granted under the Equity Plan for 2009, 2008 and 2007 were 0.4 million, 0.4 million and 0.4 million, respectively.
The Equity Plan provides for the granting of restricted shares subject to a vesting schedule based on the employee’s continued employment (“Restriction Period”), for which vesting is generally on the third anniversary after the date of grant. The Company recognizes compensation expense based on the number of restricted shares granted at the then grant date fair value over the Restriction Period.
126
Table of Contents
STATE AUTO FINANCIAL CORPORATION AND SUBSIDIARIES
(a majority-owned subsidiary of State Automobile Mutual Insurance Company)
Notes to Consolidated Financial Statements, Continued
A summary of the status of the Company’s non-vested and vested restricted shares and changes for the year ended December 31 is as follows:
| 2009 | 2008 | 2007 | ||||||||||||||
| Shares | Weighted Average Grant Date Fair Value |
Shares | Weighted Average Grant Date Fair Value |
Shares | Weighted Average Grant Date Fair Value | |||||||||||
| Outstanding, beginning of year |
42,500 | $ | 30.46 | 42,500 | $ | 30.46 | 10,500 | $ | 31.94 | |||||||
| Granted |
— | — | — | — | 32,000 | 29.98 | ||||||||||
| Vested |
(10,500 | ) | 31.94 | — | — | — | — | |||||||||
| Outstanding, end of year |
32,000 | $ | 29.98 | 42,500 | $ | 30.46 | 42,500 | $ | 30.46 | |||||||
As of December 31, 2009, there was $0.2 million of total unrecognized compensation cost related to non-vested restricted share compensation arrangements. The remaining cost is expected to be recognized over a period of 0.75 years.
Employee Stock Purchase Plan
The Company also has a broad-based employee stock purchase plan, under which employees of the Company may choose at two different specified time intervals each year to have up to 6% of their annual base earnings withheld to purchase the Company’s common shares. The purchase price of the common shares is 85% of the lower of its beginning-of-interval or end-of-interval market price. The Company has reserved 3.4 million common shares under this plan. As of December 31, 2009, a total of 2.6 million common shares have been purchased under this plan. This plan remains in effect until terminated by the board of directors.
Outside Directors Plan
The RSU Plan is an unfunded deferred compensation plan which provides each outside director with an award of 1,400 restricted share units (the “RSU award”) following each annual meeting of shareholders, however, the amount of the award may change from year to year, based on the provision described below. The RSU awards are fully vested upon grant. RSU awards are not common shares of the Company and, as such, no participant has any rights as a holder of common shares under the RSU Plan. RSU awards represent the right to receive an amount, payable in cash or common shares of the Company, as previously elected by the outside director, equal to the value of a specified number of common shares of the Company at the end of the restricted period. Such election may be changed within the constraints set forth in the RSU Plan. The restricted period for the RSU awards begins on the date of grant and expires on the date the outside director retires from or otherwise terminates service as a director of the Company. During the restricted period, outside directors are credited with dividends, equivalent in value to those declared and paid on the Company’s common shares, on all RSU awards granted to them. At the end of the restricted period, outside directors receive distributions of their RSU awards either (i) in a single lump sum payment, or (ii) in annual installment payments over a five- or ten-year period, as previously elected by the outside director. The administrative committee for the RSU Plan (currently the Company’s Compensation Committee) retains the right to increase the annual number of RSU awards granted to each outside director to as many as 5,000 or to decrease such annual number to not less than 500, without seeking shareholder approval, if such increase or decrease is deemed appropriate by the administrative committee to
127
Table of Contents
STATE AUTO FINANCIAL CORPORATION AND SUBSIDIARIES
(a majority-owned subsidiary of State Automobile Mutual Insurance Company)
Notes to Consolidated Financial Statements, Continued
maintain director compensation at appropriate levels. The RSU Plan automatically terminates on May 31, 2015. The Company accounts for the RSU Plan as a liability plan. There were 14,800 RSUs granted in 2009 and 11,200 RSUs granted in both 2008 and 2007.
During 2009 and 2008, common shares valued at approximately $5,300 and $87,000, respectively, were distributed by the Company under the RSU Plan.
Agent Stock Option Plan
The Company had a stock option incentive plan for certain designated independent insurance agencies (“Agent Stock Option Plan”) that represent the Company and its affiliates. The Agent Stock Option Plan expired May 2008. The plan provided that the options become exercisable on the first day of the calendar year following the agency’s achievement of specific production and profitability requirements over a period not greater than two calendar years from the date of grant or a portion thereof in the first calendar year in which an agency commences participation under the plan. Options granted under this plan have a ten-year term. Options granted for the years 2008 and 2007 were 15,208 and 15,862, respectively.
Stock Options
The fair value of each stock option granted is estimated on the date of grant using the Black-Scholes closed-form pricing model. The following tables present the weighted-average assumptions used in the option pricing model for options granted to employees and non-employees (independent insurance agencies) during 2009, 2008, and 2007. The expected life of the options for employees represents the period of time the options are expected to be outstanding and is based on historical trends. For non-employees the expected life of the option approximates the remaining contractual term of the option. The expected stock price volatility is based on the historical volatility of the Company’s stock for a period approximating the expected life and the expected dividend yield is based on the Company’s most recent period’s dividend payout. The risk-free interest rate is based on the U.S. Treasury yield curve in effect at the time of grant and has a term approximating the expected life of the option.
The fair value of the options granted under the Agent Stock Option Plan was estimated at the reporting date or vesting date using the Black-Scholes option-pricing model. The weighted average fair value and related assumptions are as follows:
| 2008 | 2007 | |||||||
| Fair value per share |
$ | 10.54 | $ | 7.10 | ||||
| Dividend yield |
2.00 | % | 2.28 | % | ||||
| Risk free interest rate |
2.3 | % | 3.9 | % | ||||
| Expected volatility factor |
37.3 | % | 33.8 | % | ||||
| Expected life in years |
8.5 | 8.5 | ||||||
128
Table of Contents
STATE AUTO FINANCIAL CORPORATION AND SUBSIDIARIES
(a majority-owned subsidiary of State Automobile Mutual Insurance Company)
Notes to Consolidated Financial Statements, Continued
The fair value of share-based awards granted to employees was estimated at the date of grant using the Black-Scholes option-pricing model. The weighted average fair values and related assumptions for options granted were as follows:
| 2009 | 2008 | 2007 | ||||||||
| Fair value per share |
$ | 4.56 | 7.92 | 10.82 | ||||||
| Expected dividend yield |
3.84 | % | 2.31 | % | 1.46 | % | ||||
| Risk free interest rate |
2.0 | % | 3.1 | % | 4.5 | % | ||||
| Expected volatility factor |
42.6 | % | 33.2 | % | 33.4 | % | ||||
| Expected life in years |
6.0 | 6.9 | 6.4 | |||||||
A summary of the Company’s total stock option activity and related information for these plans for the years ended December 31, follows:
| (millions, except per share amounts) | 2009 | 2008 | 2007 | |||||||||||||||
| Options | Weighted- Exercise |
Options | Weighted- Exercise |
Options | Weighted- Exercise | |||||||||||||
| Outstanding, beginning of year |
2.8 | $ | 24.84 | 2.7 | $ | 23.78 | 2.4 | $ | 22.09 | |||||||||
| Granted |
0.4 | 14.65 | 0.4 | 25.80 | 0.4 | 29.55 | ||||||||||||
| Exercised |
(0.1 | ) | 13.68 | (0.3 | ) | 15.13 | (0.1 | ) | 15.48 | |||||||||
| Canceled |
— | 25.38 | — | 29.37 | — | 31.91 | ||||||||||||
| Outstanding, end of year |
3.1 | $ | 24.02 | 2.8 | $ | 24.84 | 2.7 | $ | 23.78 | |||||||||
Intrinsic value for stock options is defined as the difference between the current market value and the grant price. For the years ended December 31, 2009, 2008 and 2007, the total intrinsic value of stock options exercised was $0.6 million, $3.3 million and $2.6 million, respectively. The tax benefit for tax deductions from share-based awards totaled $0.2 million, $0.8 million and $0.7 million for the years ended December 31, 2009, 2008 and 2007, respectively.
A summary of information pertaining to the total options outstanding and exercisable as of December 31, 2009 follows:
| (Options in millions) | Options Outstanding | Options Exercisable | ||||||||||
| Number | Weighted- Contractual Life |
Weighted- Exercise |
Number | Weighted- Exercise | ||||||||
| Range of Exercise Prices: |
||||||||||||
| $10.01 – $20.00 |
1.1 | 4.4 | $ | 15.70 | 0.8 | $ | 16.14 | |||||
| $20.01 – $30.00 |
1.2 | 6.8 | 27.21 | 0.8 | 27.34 | |||||||
| Greater than $30.01 |
0.8 | 5.1 | 31.72 | 0.7 | 32.10 | |||||||
| 3.1 | 5.5 | $ | 24.02 | 2.3 | $ | 24.98 | ||||||
129
Table of Contents
STATE AUTO FINANCIAL CORPORATION AND SUBSIDIARIES
(a majority-owned subsidiary of State Automobile Mutual Insurance Company)
Notes to Consolidated Financial Statements, Continued
Aggregate intrinsic value for total options outstanding at December 31, 2009, is $5.4 million. Aggregate intrinsic value for total options exercisable at December 31, 2009, is $2.4 million.
Compensation expense recognized during 2009, 2008 and 2007 was $3.7 million, $5.5 million and $6.0 million, respectively. Share-based compensation is recognized as a component of loss and loss adjustment expense and acquisition and operating expense in a manner consistent with other employee compensation. As of December 31, 2009, there was $2.5 million of total unrecognized compensation cost related to option-based compensation arrangements granted under the plans. The remaining cost is expected to be recognized over a period of three years.
14. Net Earnings (Loss) Per Common Share
The following table sets forth the compilation of basic and diluted net earnings (loss) per common share for the year ended December 31:
| (millions, except per share amounts) | 2009 | 2008 | 2007 | |||||
| Numerator: |
||||||||
| Net earnings (loss) for basic net earnings per common share |
$ | 10.2 | (31.1 | ) | 119.1 | |||
| Effect of dilutive share-based awards |
— | — | 0.1 | |||||
| Adjusted net earnings (loss) for dilutive net earnings (loss) per common share |
$ | 10.2 | (31.1 | ) | 119.2 | |||
| Denominator: |
||||||||
| Weighted average shares for basic net earnings per common share |
39.7 | 39.7 | 41.0 | |||||
| Effect of dilutive share-based awards |
0.1 | — | 0.6 | |||||
| Adjusted weighted average shares for diluted net earnings (loss) per common share |
39.8 | 39.7 | 41.6 | |||||
| Basic net earnings (loss) per common share |
$ | 0.26 | (0.78 | ) | 2.90 | |||
| Diluted net earnings (loss) per common share |
$ | 0.25 | (0.78 | ) | 2.86 | |||
The following options to purchase shares of common stock were not included in the computation of diluted earnings per share because the exercise price of the options was greater than the average market price or their inclusion would have been antidilutive for the year ended December 31:
| (in millions) | 2009 | 2008 | 2007 | |||
| Number of options |
2.1 | 1.5 | 0.7 | |||
130
Table of Contents
STATE AUTO FINANCIAL CORPORATION AND SUBSIDIARIES
(a majority-owned subsidiary of State Automobile Mutual Insurance Company)
Notes to Consolidated Financial Statements, Continued
15. Comprehensive Income (Loss)
A reconciliation of each component of comprehensive income (loss) and the related federal income tax effect for the year ended December 31 is as follows:
| ($ millions) | Before-Tax Amount |
Tax or Benefit |
Net-of-Tax Amount |
|||||||
| 2009: |
||||||||||
| Net income |
$ | (12.8 | ) | 23.0 | 10.2 | |||||
| Other comprehensive income: |
||||||||||
| Net unrealized holding gains on investments: |
||||||||||
| Unrealized holding gains arising during the year |
99.0 | (32.1 | ) | 66.9 | ||||||
| Reclassification adjustments for gains realized in net income |
5.2 | (1.8 | ) | 3.4 | ||||||
| 104.2 | (33.9 | ) | 70.3 | |||||||
| Amortization of gain on derivative used in cash flow hedge |
(0.1 | ) | — | (0.1 | ) | |||||
| Net unrecognized benefit plan obligations: |
||||||||||
| Net actuarial gain arising during period |
37.3 | (13.8 | ) | 23.5 | ||||||
| Reclassification adjustments for amortization to net income: |
||||||||||
| Transition asset |
(0.7 | ) | 0.2 | (0.5 | ) | |||||
| Net actuarial loss |
5.2 | (2.1 | ) | 3.1 | ||||||
| Prior service cost |
(2.7 | ) | 1.1 | (1.6 | ) | |||||
| 39.1 | (14.6 | ) | 24.5 | |||||||
| Other comprehensive income |
143.2 | (48.5 | ) | 94.7 | ||||||
| Comprehensive income |
$ | 130.4 | (25.5 | ) | 104.9 | |||||
131
Table of Contents
STATE AUTO FINANCIAL CORPORATION AND SUBSIDIARIES
(a majority-owned subsidiary of State Automobile Mutual Insurance Company)
Notes to Consolidated Financial Statements, Continued
| Before-Tax Amount |
Tax or Benefit |
Net-of-Tax Amount |
||||||||
| 2008: |
||||||||||
| Net loss |
$ | (75.1 | ) | 44.0 | (31.1 | ) | ||||
| Other comprehensive loss: |
||||||||||
| Net unrealized holding losses on investments: |
||||||||||
| Unrealized holding losses arising during the year |
(121.0 | ) | 39.8 | (81.2 | ) | |||||
| Reclassification adjustments for gains realized in net loss |
36.4 | (12.8 | ) | 23.6 | ||||||
| (84.6 | ) | 27.0 | (57.6 | ) | ||||||
| Amortization of gain on derivative used in cash flow hedge |
(0.1 | ) | — | (0.1 | ) | |||||
| Net unrecognized benefit plan obligations: |
||||||||||
| Net actuarial loss arising during period |
(63.6 | ) | 22.0 | (41.6 | ) | |||||
| Reclassification adjustments for amortization to net loss: |
||||||||||
| Transition asset |
(0.6 | ) | 0.2 | (0.4 | ) | |||||
| Net actuarial loss |
2.7 | (1.0 | ) | 1.7 | ||||||
| Prior service cost |
0.3 | (0.1 | ) | 0.2 | ||||||
| (61.2 | ) | 21.1 | (40.1 | ) | ||||||
| Other comprehensive loss |
(145.9 | ) | 48.1 | (97.8 | ) | |||||
| Comprehensive loss |
$ | (221.0 | ) | 92.1 | (128.9 | ) | ||||
| 2007: |
||||||||||
| Net income |
$ | 155.3 | (36.2 | ) | 119.1 | |||||
| Other comprehensive income: |
||||||||||
| Net unrealized holding losses on investments: |
||||||||||
| Unrealized holding gain arising during the year |
8.1 | (2.8 | ) | 5.3 | ||||||
| Reclassification adjustments for losses realized in net income |
(12.1 | ) | 4.2 | (7.9 | ) | |||||
| (4.0 | ) | 1.4 | (2.6 | ) | ||||||
| Amortization of gain on derivative used in cash flow hedge |
(0.1 | ) | — | (0.1 | ) | |||||
| Net unrecognized benefit plan obligations: |
||||||||||
| Net actuarial gain arising during period |
20.6 | (6.9 | ) | 13.7 | ||||||
| Reclassification adjustments for amortization to net income: |
||||||||||
| Transition asset |
(0.6 | ) | 0.2 | (0.4 | ) | |||||
| Net actuarial loss |
4.7 | (1.9 | ) | 2.8 | ||||||
| Prior service cost |
0.9 | (0.3 | ) | 0.6 | ||||||
| 25.6 | (8.9 | ) | 16.7 | |||||||
| Other comprehensive income |
21.5 | (7.5 | ) | 14.0 | ||||||
| Comprehensive income |
$ | 176.8 | (43.7 | ) | 133.1 | |||||
132
Table of Contents
STATE AUTO FINANCIAL CORPORATION AND SUBSIDIARIES
(a majority-owned subsidiary of State Automobile Mutual Insurance Company)
Notes to Consolidated Financial Statements, Continued
16. Reportable Segments
The Company has three reportable segments: personal insurance, business insurance, and investment operations. The reportable insurance segments are business units managed separately because of the differences in the type of customers they serve or products they provide or services they offer. The insurance segments operate primarily in the Midwestern, Southern, Southwestern, and Eastern states, excluding New York and New Jersey, distributing products through the independent insurance agency system. The personal insurance segment provides primarily personal auto (standard and nonstandard) and homeowners to the personal insurance market. The business insurance segment provides primarily commercial auto, commercial multi-peril, fire & allied lines, other & product liability and workers’ compensation insurance to small-to-medium sized businesses within the commercial insurance market. The investment operations segment, managed by Stateco, provides investment services.
The Company evaluates the performance of its insurance segments using industry financial measurements based on SAP, which include loss and loss adjustment expense ratios, underwriting expense ratios, combined ratios, statutory underwriting gain (loss), net premiums earned and net written premiums. One of the most significant differences between SAP and GAAP is that SAP requires all underwriting expenses to be expensed immediately and not deferred and amortized over the same period the premium is earned. The investment operations segment is evaluated based on investment returns of assets managed by Stateco.
Asset information by segment is not reported for the insurance segments because the Company does not produce such information internally.
133
Table of Contents
STATE AUTO FINANCIAL CORPORATION AND SUBSIDIARIES
(a majority-owned subsidiary of State Automobile Mutual Insurance Company)
Notes to Consolidated Financial Statements, Continued
The following provides financial information regarding the Company’s reportable segments for the year ended December 31:
| ($ millions) | 2009 | 2008 | 2007 | |||||||
| Revenues from external sources: |
||||||||||
| Insurance segments |
||||||||||
| Personal insurance |
$ | 732.8 | 670.9 | 609.6 | ||||||
| Business insurance |
443.7 | 455.1 | 402.0 | |||||||
| Total insurance segments |
1,176.5 | 1,126.0 | 1,011.6 | |||||||
| Investment operations segment |
||||||||||
| Net investment income |
82.1 | 87.4 | 84.7 | |||||||
| Net realized (loss) gain on investments |
(5.2 | ) | (36.4 | ) | 12.1 | |||||
| Total investment operations segment |
76.9 | 51.0 | 96.8 | |||||||
| Total revenue from reportable segments |
1,253.4 | 1,177.0 | 1,108.4 | |||||||
| All other |
3.5 | 4.9 | 5.0 | |||||||
| Total revenues from external sources |
1,256.9 | 1,181.9 | 1,113.4 | |||||||
| Intersegment revenues: |
9.6 | 9.7 | 9.4 | |||||||
| Total revenues |
1,266.5 | 1,191.6 | 1,122.8 | |||||||
| Reconciling items: |
||||||||||
| Eliminate intersegment revenues |
(9.6 | ) | (9.7 | ) | (9.4 | ) | ||||
| Total consolidated revenue |
$ | 1,256.9 | 1,181.9 | 1,113.4 | ||||||
| Segment (loss) income before federal income tax: |
||||||||||
| Insurance segments: |
||||||||||
| Personal insurance SAP underwriting (loss) gain |
$ | (59.5 | ) | (56.1 | ) | 47.3 | ||||
| Business insurance SAP underwriting (loss) gain |
(8.4 | ) | (58.5 | ) | 40.6 | |||||
| Total insurance segments |
(67.9 | ) | (114.6 | ) | 87.9 | |||||
| Investment operations segment: |
||||||||||
| Net investment income |
82.1 | 87.4 | 84.7 | |||||||
| Net realized (loss) gain on investments |
(5.2 | ) | (36.4 | ) | 12.1 | |||||
| Total investment operations segment |
76.9 | 51.0 | 96.8 | |||||||
| All other segments (loss) |
(1.1 | ) | (1.9 | ) | (2.6 | ) | ||||
| Reconciling items: |
||||||||||
| GAAP adjustments |
(11.5 | ) | (0.1 | ) | (17.3 | ) | ||||
| Interest expense on corporate debt |
(7.6 | ) | (7.3 | ) | (7.6 | ) | ||||
| Corporate expenses |
(1.6 | ) | (2.2 | ) | (1.9 | ) | ||||
| Total consolidated (loss) income before federal income taxes |
$ | (12.8 | ) | (75.1 | ) | 155.3 | ||||
134
Table of Contents
STATE AUTO FINANCIAL CORPORATION AND SUBSIDIARIES
(a majority-owned subsidiary of State Automobile Mutual Insurance Company)
Notes to Consolidated Financial Statements, Continued
| ($ millions) | December 31 | |||||
| 2009 | 2008 | |||||
| Segment assets: |
||||||
| Investment operations segment |
$ | 2,269.4 | $ | 2,091.8 | ||
| Total segment assets |
2,269.4 | 2,091.8 | ||||
| Reconciling items: |
||||||
| Corporate assets |
295.1 | 351.8 | ||||
| Total consolidated assets |
$ | 2,564.5 | $ | 2,443.6 | ||
Assets attributed to the investment operations segment include the total investments and cash and cash equivalent categories from the balance sheet. All other assets are corporate assets and are not assigned to a segment.
Revenues from external sources for reportable segments include the following products and services for the year ended December 31:
| ($ millions) | 2009 | 2008 | 2007 | ||||||
| Earned premiums: |
|||||||||
| Personal insurance: |
|||||||||
| Standard auto |
$ | 433.2 | 384.3 | 357.3 | |||||
| Nonstandard auto |
38.7 | 42.6 | 42.9 | ||||||
| Homeowners |
230.0 | 215.4 | 186.5 | ||||||
| Other personal |
30.9 | 28.6 | 22.9 | ||||||
| Total personal insurance earned premiums |
732.8 | 670.9 | 609.6 | ||||||
| Business insurance: |
|||||||||
| Commercial auto |
106.2 | 110.5 | 96.9 | ||||||
| Commercial multi-peril |
95.2 | 97.9 | 86.8 | ||||||
| Fire & allied lines |
97.6 | 94.7 | 83.4 | ||||||
| Other & product liability |
74.8 | 79.9 | 75.5 | ||||||
| Workers’ compensation |
43.2 | 43.4 | 33.4 | ||||||
| Other commercial |
26.7 | 28.7 | 26.0 | ||||||
| Total business insurance earned premiums |
443.7 | 455.1 | 402.0 | ||||||
| Total earned premiums |
1,176.5 | 1,126.0 | 1,011.6 | ||||||
| Investment operations: |
|||||||||
| Net investment income |
82.1 | 87.4 | 84.7 | ||||||
| Net realized (loss) gain on investments |
(5.2 | ) | (36.4 | ) | 12.1 | ||||
| Total investment operations |
76.9 | 51.0 | 96.8 | ||||||
| Total revenues from reportable segments |
$ | 1,253.4 | 1,177.0 | 1,108.4 | |||||
135
Table of Contents
STATE AUTO FINANCIAL CORPORATION AND SUBSIDIARIES
(a majority-owned subsidiary of State Automobile Mutual Insurance Company)
Notes to Consolidated Financial Statements, Continued
17. Quarterly Financial Data (unaudited)
| ($ millions, except per share amounts) | 2009 | ||||||||||||
| For three months ended | |||||||||||||
| March 31 | June 30 | September 30 | December 31 | ||||||||||
| Total revenues |
$ | 294.0 | 316.9 | 324.5 | 321.5 | ||||||||
| (Loss) income before federal income taxes |
(30.9 | ) | (11.7 | ) | 13.7 | 16.1 | |||||||
| Net (loss) income |
(14.0 | ) | (3.2 | ) | 13.0 | 14.4 | |||||||
| (Loss) earnings per common share: |
|||||||||||||
| Basic |
$ | (0.35 | ) | (0.08 | ) | 0.33 | 0.36 | ||||||
| Diluted |
$ | (0.35 | ) | (0.08 | ) | 0.33 | 0.36 | ||||||
| 2008 | |||||||||||||
| For three months ended | |||||||||||||
| March 31 | June 30 | September 30 | December 31 | ||||||||||
| Total revenues |
$ | 301.0 | 307.0 | 300.6 | 273.3 | ||||||||
| (Loss) before federal income taxes |
(15.0 | ) | (24.2 | ) | (30.2 | ) | (5.7 | ) | |||||
| Net (loss) |
(12.5 | ) | (3.3 | ) | (14.7 | ) | (0.6 | ) | |||||
| (Loss) per common share: |
|||||||||||||
| Basic |
$ | (0.31 | ) | (0.08 | ) | (0.37 | ) | (0.02 | ) | ||||
| Diluted |
$ | (0.31 | ) | (0.08 | ) | (0.37 | ) | (0.02 | ) | ||||
18. Contingencies
The Company’s insurance subsidiaries are involved in a number of lawsuits, and may become involved in other potential litigation, arising in the ordinary course of business. Generally, the involvement of an insurance subsidiary in a lawsuit involves defending third-party claims brought against its insureds (in its role as liability insurer) or as a principal of surety bonds and defending policy coverage claims brought against the insurance subsidiary. All lawsuits relating to such insurance claims are considered by the Company in establishing the Company’s loss and loss adjustment expense reserves.
In accordance with the Contingencies Topic of the FASB ASC, the Company accrues for a litigation-related liability other than insurance claims when it is probable that such a liability has been incurred and the amount of the loss can be reasonably estimated. Based on currently available information known to the Company, the Company believes that its reserves for these litigation-related liabilities are reasonable and that the ultimate outcomes of any pending matters are not likely to have a material adverse effect on its consolidated financial position or results of operations.
Additionally, the insurance subsidiaries may be impacted by adverse regulatory actions and adverse court decisions where insurance coverages are expanded beyond the scope originally contemplated in their insurance policies. The Company believes that the effects, if any, of such regulatory actions and published court decisions are not likely to have a material adverse effect on its financial position or results from operations.
136
Table of Contents
STATE AUTO FINANCIAL CORPORATION AND SUBSIDIARIES
(a majority-owned subsidiary of State Automobile Mutual Insurance Company)
Notes to Consolidated Financial Statements, Continued
19. Subsequent Events
Effective January 1, 2010, the Pooling Arrangement, described in Note 6a, was further amended to add SA National to the pool with a participation percentage of 0.0% and to include voluntary assumed reinsurance from third parties unaffiliated with the Pooled Companies that was assumed on or after January 1, 2009.
In conjunction with the January 1, 2010, Pooling Arrangement amendment, the STFC Pooled Companies will receive approximately $5.1 million in cash and/or investment securities from State Auto Mutual and its subsidiaries and affiliates, for net insurance assets transferred on January 1, 2010. The following table presents an estimate of the impact on the Company’s balance sheet at January 1, 2010, relating to the Pooling Arrangement amendment:
| ($ millions) | ||||
| Losses and loss expenses payable |
$ | (4.0 | ) | |
| Unearned premiums |
(1.4 | ) | ||
| Less: |
||||
| Deferred policy acquisition costs |
(0.2 | ) | ||
| Other assets |
(10.3 | ) | ||
| Net cash and/or investment securities to be received |
$ | 5.1 | ||
137
Table of Contents
Item 9. Changes in and Disagreements with Accountants on Accounting and Financial Disclosure
None.
Item 9A. Controls and Procedures
Management’s Annual Report on Internal Control Over Financial Reporting
Our management’s annual report on internal control over financial reporting as of December 31, 2009, required by Item 308(a) of Regulation S-K follows. The attestation report of our independent registered public accounting firm required by Item 308(b) of Regulation S-K is found under the caption “Report of the Independent Registered Public Accounting Firm on Internal Control over Financial Reporting” in Item 8 of this Form 10-K.
The following report is provided by our management on the Company’s internal control over financial reporting (as defined in Rule 13a-15(f) of the Exchange Act):
| 1. | Our management is responsible for establishing and maintaining adequate internal control over financial reporting for the Company. |
| 2. | Our management has used the Committee Of Sponsoring Organizations of the Treadway Commission (COSO) framework to evaluate the effectiveness of our internal control over financial reporting. Our management believes that the COSO framework is a suitable framework for its evaluation of our internal control over financial reporting because it is free from bias, permits reasonably qualitative and quantitative measurements of our internal controls, is sufficiently complete so that those relevant factors that would alter a conclusion about the effectiveness of our internal controls are not omitted and is relevant to an evaluation of internal control over financial reporting. |
| 3. | All internal control systems, no matter how well designed, have inherent limitations. Therefore, even those systems determined to be effective can only provide reasonable assurance with respect to financial reporting. |
| 4. | Our management has assessed the effectiveness of our internal control over financial reporting as of December 31, 2009, and has concluded that such internal control over financial reporting was effective. |
| 5. | Ernst & Young LLP, the independent registered public accounting firm that audited the consolidated financial statements included in this Form 10-K, has issued their attestation on the Company’s internal control over financial reporting, which is included herein. |
Disclosure Controls and Procedures
We carried out an evaluation, under the supervision and with the participation of our management, including our Chief Executive Officer and Chief Financial Officer, of the effectiveness of the design and operation of our disclosure controls and procedures (as defined in Exchange Act Rule 13a-15(e)). Based upon that evaluation, our Chief Executive Officer and Chief Financial Officer concluded that, as of the end of the period covered by this report, our disclosure controls and procedures were effective in timely alerting them to material information relating to the Company (including its consolidated subsidiaries) required to be included in the Company’s periodic filings with the Securities and Exchange Commission.
Changes in Internal Control over Financial Reporting
There have been no changes in our internal control over financial reporting that occurred during our most recent fiscal quarter that has materially affected, or is reasonably likely to materially affect, our internal control over financial reporting.
None.
138
Table of Contents
Item 10. Directors, Executive Officers and Corporate Governance
Information regarding our directors required by Items 401(a) and (d)-(f) of Regulation S-K will be found under the caption “Proposal One: Election of Directors” in our 2010 Proxy Statement, which information is incorporated herein by reference. Information regarding our executive officers required by Items 401(b) and (d)-(f) of Regulation S-K is found under the caption “Executive Officers of the Registrant” at the end of Item 1 of our Form 10-K, which information is also incorporated by reference into this Item 10.
We have a separately-designated standing Audit Committee established in accordance with Section 3(a)(58)(A) of the Exchange Act. As of March 5, 2010, the members of our Audit Committee were Richard K. Smith, David J. D’Antoni, David R. Meuse, Thomas E. Markert and Paul S. Williams. Mr. Smith is Chairman of our Audit Committee. Our Board of Directors has determined that Mr. Smith is an “audit committee financial expert,” as that term is defined in Item 407(d)(5) of Regulation S-K, and “independent,” as that term is defined in Rule 10A-3 of the Exchange Act.
Information regarding the filing of reports of ownership under Section 16(a) of the Exchange Act by our officers and directors and persons owning more than 10% of a registered class of our equity securities required by Item 405 of Regulation S-K will be found under the caption “Section 16(a) Beneficial Ownership Reporting Compliance” in our 2010 Proxy Statement, which information is incorporated herein by reference.
Information concerning the procedures by which shareholders may recommend nominees to our Board of Directors will be found under the caption “Corporate Governance—Nomination of Directors” in our 2010 Proxy Statement. There has been no material change to the nomination procedures previously disclosed in the proxy statement for our 2009 annual meeting of shareholders.
Our Board of Directors has adopted a code of ethics that applies to our principal executive officer, principal financial officer, principal accounting officer, controller, and persons performing similar functions. This code of ethics has been posted on our website at www.StateAuto.com under “Investor Relations” then “Corporate Governance.” Any amendment (other than any technical, administrative or other non-substantive amendment) to, or waiver from, a provision of this code will be posted on our website described above within four business days following its occurrence.
Item 11. Executive Compensation
Our 2010 Proxy Statement will contain information regarding the following matters: information regarding executive compensation required by Item 402 of Regulation S-K will be found under the captions “Board of Directors and Board Committees—Compensation of Outside Directors and Outside Director Compensation Table” and “Compensation Discussion and Analysis”; information required by Item 407(e)(4) of Regulation S-K will be found under the caption “Compensation Committee Interlocks and Insider Participation”; information required by Item 407(e)(5) of Regulation S-K will be found under the caption “Compensation Committee Report”. This information is incorporated herein by reference.
| Item 12. | Security Ownership of Certain Beneficial Owners and Management and Related Stockholder Matters |
Information regarding security ownership of certain beneficial owners and management required by Item 403 of Regulation S-K will be found under the caption “Proposal One: Election of Directors” and “Principal Holders of Voting Securities” in our 2010 Proxy Statement, which information is incorporated herein by reference.
Information regarding equity compensation plan information required by Item 201(d) of Regulation S-K will be found under the caption “Equity Compensation Plan Information” in our 2010 Proxy Statement, which information is incorporated herein by reference.
139
Table of Contents
Item 13. Certain Relationships and Related Transactions, and Director Independence
Information regarding certain relationships and related transactions required by Item 404 of Regulation S-K will be found under the caption “Related Party Transactions” in our 2010 Proxy Statement, which information is incorporated herein by reference.
Information regarding the independence of our directors required by Item 407(a) of Regulation S-K will be found under the caption “Corporate Governance—Director Independence” in our 2010 Proxy Statement, which is incorporated herein by reference.
Item 14. Principal Accountant Fees and Services
Information regarding principal accountant fees and services required by Item 9(e) of Schedule 14A will be found under the caption “Independent Registered Public Accounting Firm” in our 2010 Proxy Statement, which information is incorporated herein by reference.
Item 15. Exhibits and Financial Statement Schedules
(a)(1) LISTING OF FINANCIAL STATEMENTS
The following consolidated financial statements of the Company are filed as part of this Form 10-K and are included in Item 8:
Reports of Independent Registered Public Accounting Firm
Consolidated Balance Sheets as of December 31, 2009 and 2008
Consolidated Statements of Income for each of the three years in the period ended December 31, 2009
Consolidated Statements of Stockholders’ Equity for each of the three years in the period ended December 31, 2009
Consolidated Statements of Cash Flows for each of the three years in the period ended December 31, 2009
Notes to Consolidated Financial Statements
(a)(2) LISTING OF FINANCIAL STATEMENT SCHEDULES
The following financial statement schedules of the Company for the years 2009, 2008 and 2007 are included in Item 14(d) following the signatures and should be read in conjunction with our consolidated financial statements contained in our Form 10-K.
| Schedule Number |
Schedule | |
| I. | Summary of Investments—Other Than Investments in Related Parties | |
| II. | Condensed Financial Information of Registrant | |
| III. | Supplementary Insurance Information | |
| IV. | Reinsurance | |
All other schedules and footnotes are omitted because they are not applicable or the required information is included in the consolidated financial statements or notes thereto.
140
Table of Contents
(a)(3) LISTING OF EXHIBITS
| Exhibit No. |
Description of Exhibit | If incorporated by reference document with which Exhibit was previously filed with SEC | ||
| 3.01 | State Auto Financial Corporation’s Amended and Restated Articles of Incorporation |
1933 Act Registration Statement No. 33-40643 on Form S-1 (see Exhibit 3(a) therein) | ||
| 3.02 | State Auto Financial Corporation’s Amendment to the Amended and Restated Articles of Incorporation |
1933 Act Registration Statement No. 33-89400 on Form S-8 (see Exhibit 4(b) therein) | ||
| 3.03 | State Auto Financial Corporation Certificate of Amendment to the Amended and Restated Articles of Incorporation as of June 2, 1998 |
Form 10-K Annual Report for the year ended December 31, 1998 (see Exhibit 3(A)(3) therein) | ||
| 3.04 | State Auto Financial Corporation’s Amended and Restated Code of Regulations |
1933 Act Registration Statement No. 33-40643 on Form S-1 (see Exhibit 3(b) therein) | ||
| 10.01 | Guaranty Agreement between State Automobile Mutual Insurance Company and State Auto Property and Casualty Insurance Company dated as of May 16, 1991 |
1933 Act Registration Statement No. 33-40643 on Form S-1 (see Exhibit 10 (d) therein) | ||
| 10.02 | Form of Indemnification Agreement between State Auto Financial Corporation and each of its directors |
Form 8-K Current Report filed on November 20, 2008 (see Exhibit 99.1 therein) | ||
| 10.03* | Indemnification Agreement dated as of November 14, 2008, between State Auto Financial Corporation and Robert P. Restrepo, Jr. |
Form 8-K Current Report filed on May 13, 2009 (see Exhibit 10.2 therein) | ||
| 10.04* | Officer Indemnification Agreement dated as of May 8, 2009, between State Auto Financial Corporation and Steven E. English |
Form 8-K Current Report filed on May 13, 2009 (see Exhibit 10.3 therein) | ||
| 10.05* | Indemnification Agreement dated as of November 14, 2008, between State Automobile Mutual Insurance Company and Mark A. Blackburn |
Form 8-K Current Report filed on May 13, 2009 (see Exhibit 10.4 therein) | ||
| 10.06* | Officer Indemnification Agreement dated as of May 8, 2009, between State Auto Financial Corporation and Clyde H. Fitch, Jr. |
Form 8-K Current Report filed on May 13, 2009 (see Exhibit 10.5 therein) | ||
| 10.07* | Officer Indemnification Agreement dated as of May 8, 2009, between State Auto Financial Corporation and James A. Yano |
Form 8-K Current Report filed on May 13, 2009 (see Exhibit 10.6 therein) | ||
| 10.08* | 1991 Stock Option Plan of State Auto Financial Corporation |
1933 Act Registration Statement No. 33-40643 on Form S-1 (see Exhibit 10 (h) therein) | ||
| 10.09* | Amendment Number 1 to the 1991 Stock Option Plan of State Auto Financial Corporation |
1933 Act Registration Statement No. 33-89400 on Form S-8 (see Exhibit 4 (a) therein) | ||
| 10.10* | Amendment Number 2 to the 1991 Stock Option Plan of State Auto Financial Corporation |
Form 10-K Annual Report for the year ended December 31, 1996 (see Exhibit 10(DD) therein) | ||
141
Table of Contents
| Exhibit No. |
Description of Exhibit | If incorporated by reference document with which Exhibit was previously filed with SEC | ||
| 10.11* | Amendment Number 3 to 1991 Stock Option Plan (effective January 1, 2001) of State Auto Financial Corporation |
Form 10-Q Quarterly Report for the period ended September 30, 2003 (see Exhibit 10.01 therein) | ||
| 10.12* | Amendment Number 4 to 1991 Stock Option Plan (effective March 7, 2008) of State Auto Financial Corporation |
Form 8-K Current Report filed on March 13, 2008 (see Exhibit 10.1 therein) | ||
| 10.13* | 1991 Directors’ Stock Option Plan of State Auto Financial Corporation |
1933 Act Registration Statement No. 33-40643 on Form S-1 (see Exhibit 10 (i) therein) | ||
| 10.14* | Amendment Number 1 to the 1991 Directors’ Stock Option Plan of State Auto Financial Corporation |
Form 10-K Annual Report for the year ended December 31, 1996 (see Exhibit 10(EE) therein) | ||
| 10.15* | Second Amendment to 1991 Directors’ Stock Option Plan of State Auto Financial Corporation |
Form 10-Q Quarterly Report for the period ended September 30, 2001 (see Exhibit 10(JJ) therein) | ||
| 10.16* | Third Amendment to the 1991 Directors’ Stock Option Plan (effective March 7, 2008) of State Auto Financial Corporation |
Form 8-K Current Report filed on March 13, 2008 (see Exhibit 10.2 therein) | ||
| 10.17* | 2000 Directors Stock Option Plan of State Auto Financial Corporation |
Definitive Proxy Statement on Form DEF 14A, File No. 000-19289, for Annual Meeting of Shareholders held on May 26, 2000 (see Appendix B therein) | ||
| 10.18* | First Amendment to 2000 Directors Stock Option Plan of State Auto Financial Corporation |
Form 10-Q Quarterly Report for the period ended March 31, 2001 (see Exhibit 10(HH) therein) | ||
| 10.19* | Second Amendment to 2000 Directors Stock Option Plan of State Auto Financial Corporation |
Form 10-Q Quarterly Report for the period ended September 30, 2001 (see Exhibit 10(KK) therein) | ||
| 10.20* | Third Amendment to 2000 Directors Stock Option Plan of State Auto Financial Corporation |
Form 10-K Annual Report for the year ended December 31, 2001 (see Exhibit 10(EE) therein) | ||
| 10.21* | Fourth Amendment to 2000 Directors Stock Option Plan of State Auto Financial Corporation |
Form 10-K Annual Report for year ended December 31, 2002 (see Exhibit 10(UU) therein) | ||
| 10.22* | Fifth Amendment to 2000 Directors Stock Option Plan of State Auto Financial Corporation |
Form 10-Q Quarterly Report for the period ended June 30, 2005 (see Exhibit 10.66 therein) | ||
| 10.23* | Sixth Amendment to the 2000 Directors Stock Option Plan (effective March 7, 2008) of State Auto Financial Corporation |
Form 8-K Current Report filed on March 13, 2008 (see Exhibit 10.3 therein) | ||
| 10.24 | Investment Management Agreement between Stateco Financial Services, Inc. and State Automobile Mutual Insurance Company, effective April 1, 1993 |
Form 10-K Annual Report for the year ended December 31, 1992 (see Exhibit 10 (N) therein) | ||
| 10.25 | Investment Management Agreement between Stateco Financial Services, Inc. and Meridian Security Insurance Company, effective June 1, 2001 |
Form 10-K Annual Report for the year ended December 31, 2005 (see Exhibit 10.17 therein) | ||
142
Table of Contents
| Exhibit No. |
Description of Exhibit | If incorporated by reference document with which Exhibit was previously filed with SEC | ||
| 10.26 | Investment Management Agreement between Stateco Financial Services, Inc. and State Auto Florida Insurance Company effective April 1, 2002 |
Form 10-K Annual Report for the year ended December 31, 2005 (see Exhibit 10.18 therein) | ||
| 10.27 | Investment Management Agreement between Stateco Financial Services, Inc. and Midwest Security Insurance Company effective January 1, 1997 |
Form 10-K Annual Report for the year ended December 31, 2005 (see Exhibit 10.19 therein) | ||
| 10.28 | Investment Management Agreement between Stateco Financial Services, Inc. and Meridian Citizens Mutual Insurance Company effective June 1, 2001 |
Form 10-K Annual Report for the year ended December 31, 2005 (see Exhibit 10.20 therein) | ||
| 10.29 | Investment Management Agreement dated March 29, 2007, between Stateco Financial Services, Inc. and Beacon National Insurance Company, First Preferred Insurance Company, Petrolia Insurance Company and Beacon Lloyds Insurance Company |
Form 10-Q Quarterly Report for the period ended March 31, 2007 (see Exhibit 10.63 therein) | ||
| 10.30 | Amended and Restated Investment Management Agreement dated as of December 31, 2007, among Stateco Financial Services, Inc. and Patrons Mutual Insurance Company of Connecticut, Patrons Fire Insurance Company of Rhode Island, and Provision State Insurance Company |
Form 10-K Annual Report for the year ended December 31, 2007 (see Exhibit 10.22 therein) | ||
| 10.31 | Amended and Restated Investment Management Agreement dated as of December 31, 2007, between Stateco Financial Services, Inc. and Litchfield Mutual Fire Insurance Company |
Form 10-K Annual Report for the year ended December 31, 2007 (see Exhibit 10.23 therein) | ||
| 10.32 | Cost Sharing Agreement among State Auto Property and Casualty Insurance Company, State Automobile Mutual Insurance Company, and State Auto Florida Insurance Company effective January 1, 2003 |
Form 10-K Annual Report for year ended December 31, 2002 (see Exhibit 10(OO) therein) | ||
| 10.33 | Cost Sharing Agreement among State Auto Property and Casualty Insurance Company, State Automobile Mutual Insurance Company, and Columbus Marketing, Inc. (n/k/a BroadStreet Capital Partners, Inc.) effective January 1, 2003 |
Form 10-K Annual Report for the year ended December 31, 2008 (see Exhibit 10.28 therein) | ||
| 10.34 | Renewal of Cost Sharing Agreement among State Auto Property & Casualty Insurance Company, State Automobile Mutual Insurance Company and BroadStreet Capital Partners, Inc. effective March 31, 2008 |
Form 10-K Annual Report for the year ended December 31, 2008 (see Exhibit 10.29 therein) | ||
143
Table of Contents
| Exhibit No. |
Description of Exhibit | If incorporated by reference document with which Exhibit was previously filed with SEC | ||
| 10.35 | Midwest Security Insurance Company Management Agreement amended and restated as of January 1, 2000 by and among State Automobile Mutual Insurance Company, State Auto Property and Casualty Insurance Company and Midwest Security Insurance Company (nka State Auto Insurance Company of Wisconsin) |
Form 10-K Annual Report for the year ended December 31, 2005 (see Exhibit 10.45 therein) | ||
| 10.36 | Management and Operations Agreement, Amended and Restated as of January 1, 2005 by and among State Automobile Mutual Insurance Company, State Auto Financial Corporation, State Auto Property and Casualty Insurance Company, State Auto National Insurance Company, Milbank Insurance Company, State Auto Insurance Company of Ohio, Meridian Security Insurance Company, Meridian Citizens Mutual Insurance Company, Meridian Insurance Group, Inc., Farmers Casualty Insurance Company, Stateco Financial Services, Inc., Strategic Insurance Software, Inc., and 518 Property Management and Leasing, LLC |
Form 10-Q Quarterly Report for the period ended March 31, 2005 (see Exhibit 10.56 therein) | ||
| 10.37 | First Amendment, made as of April 1, 2007, to Management and Operations Agreement Amended and Restated as of January 1, 2005, by and among State Automobile Mutual Insurance Company, State Auto Financial Corporation, State Auto Property and Casualty Insurance Company, State Auto National Insurance Company, Milbank Insurance Company, State Auto Insurance Company of Ohio, Meridian Security Insurance Company, Meridian Citizens Mutual Insurance Company, Meridian Insurance Group, Inc., Farmers Casualty Insurance Company, Stateco Financial Services, Inc., Strategic Insurance Software, Inc., 518 Property Management and Leasing, LLC, State Auto Florida Insurance Company, Beacon National Insurance Company, Beacon Lloyds, Inc., Beacon Lloyds Insurance Company, First Preferred Insurance Company, and Petrolia Insurance Company |
Form 10-Q Quarterly Report for the period ended June 30, 2007 (see Exhibit 66.67 therein) | ||
144
Table of Contents
| Exhibit No. |
Description of Exhibit | If incorporated by reference document with which Exhibit was previously filed with SEC | ||
| 10.38 | Second Amendment dated as of December 31, 2008, to the Management and Operations Agreement, Amended and Restated as of January 1, 2005, among State Auto Financial Corporation, State Automobile Mutual Insurance Company, State Auto Property & Casualty Insurance Company, State Auto National Insurance Company, Milbank Insurance Company, State Auto Insurance Company of Ohio, Meridian Security Insurance Company, Meridian Citizens Mutual Insurance Company, Meridian Insurance Group, Inc., Farmers Casualty Insurance Company, Stateco Financial Services, Inc., Strategic Insurance Software, Inc., 518 Property Management and Leasing, LLC, State Auto Florida Insurance Company, Beacon National Insurance Company, Beacon Lloyds, Inc., Beacon Lloyds Insurance Company, Patrons Mutual Insurance Company of Connecticut, Litchfield Mutual Fire Insurance Company, and Provision State Insurance Company |
Form 8-K Current Report filed on January 27, 2009 (see Exhibit 10.1 therein) | ||
| 10.39 | Consulting Services Agreement dated as of November 1, 2009, by and between State Automobile Mutual Insurance Company, State Auto Property & Casualty Insurance Company, Meridian Security Insurance Company, Meridian Citizens Mutual Insurance Company, Farmers Casualty Insurance Company, Milbank Insurance Company, and RTW, Inc. |
Form 10-Q Quarterly Report for the period ended September 30, 2009 (see Exhibit 10.01 therein) | ||
| 10.40 | Underwriting Management Agreement effective as of November 20, 2009, by and between Rockhill Insurance Company, Plaza Insurance Company, American Compensation Insurance Company, Bloomington Compensation Insurance Company, State Automobile Mutual Insurance Company, State Auto Property & Casualty Insurance Company, Meridian Security Insurance Company, Milbank Insurance Company, Farmers Casualty Insurance Company, and Risk Evaluation and Design, LLC |
Form 8-K Current Report filed on November 25, 2009 (see Exhibit 10.1 therein) | ||
| 10.41 | Inter-Company Expense Agreement (dated as of June 18, 2001), including First Amendment (dated as of September 30, 2002) and Second Amendment (dated as of December 14, 2007), thereto, among Patrons Fire Insurance Company of Rhode Island, Patrons Mutual Insurance Company of Connecticut, State Automobile Mutual Insurance Company and State Auto Property & Casualty Insurance Company |
Form 10-K Annual Report for the year ended December 31, 2007 (see Exhibit 10.28 therein) | ||
145
Table of Contents
| Exhibit No. |
Description of Exhibit | If incorporated by reference document with which Exhibit was previously filed with SEC | ||
| 10.42 | Inter-Company Expense Agreement (dated as of January 12, 2001), including First Amendment (dated as of September 30, 2002) and Second Amendment (dated as of December 14, 2007) thereto among Litchfield Mutual Fire Insurance Company, Patrons Mutual Insurance Company of Connecticut, State Automobile Mutual Insurance Company and State Auto Property & Casualty Insurance Company |
Form 10-K Annual Report for the year ended December 31, 2007 (see Exhibit 10.29 therein) | ||
| 10.43 | Inter-Company Expense Agreement (dated as of June 18, 2001), including First Amendment (dated as of December 14, 2007) thereto among Provision State Insurance Company, Patrons Mutual Insurance Company of Connecticut, State Automobile Mutual Insurance Company and State Auto Property and Casualty Insurance Company |
Form 10-K Annual Report for the year ended December 31, 2007 (see Exhibit 10.30 therein) | ||
| 10.44 | Management Services Agreement (dated as of August 30, 1996), including First Amendment (dated as of December 14, 2007) thereto among Patrons Fire Insurance Company of Rhode Island, Patrons Mutual Insurance Company of Connecticut, State Automobile Mutual Insurance Company and State Auto Property & Casualty Insurance Company |
Form 10-K Annual Report for the year ended December 31, 2007 (see Exhibit 10.31 therein) | ||
| 10.45 | Management Services Agreement (dated as of August 26, 1998), including First Amendment (dated as of December 14, 2007) thereto among Litchfield Mutual Fire Insurance Company, Patrons Mutual Insurance Company of Connecticut, State Automobile Mutual Insurance Company and State Auto Property & Casualty Insurance Company |
Form 10-K Annual Report for the year ended December 31, 2007 (see Exhibit 10.32 therein) | ||
| 10.46 | Management and Operations Agreement, effective as of January 1, 2010, entered into as of February 10, 2010, by and among State Auto Property & Casualty Insurance Company, State Automobile Mutual Insurance Company, Rockhill Insurance Company, Plaza Insurance Company, American Compensation Insurance Company, Bloomington Compensation Insurance Company, Rockhill Holding Company, National Environmental Coverage Corporation of the South, LLC, National Environmental Coverage Corporation, RTW, Inc., Rockhill Insurance Services, LLC, Rockhill Underwriting Management, LLC and Risk Evaluation and Design, LLC |
Form 8-K Current Report filed on February 16, 2010 (see Exhibit 10.3 therein) | ||
146
Table of Contents
| Exhibit No. |
Description of Exhibit | If incorporated by reference document with which Exhibit was previously filed with SEC | ||
| 10.47 | Reinsurance Pooling Agreement Amended and Restated as of January 1, 2005 by and among State Automobile Mutual Insurance Company, State Auto Property and Casualty Insurance Company, Milbank Insurance Company, State Auto Insurance Company of Wisconsin, Farmers Casualty Insurance Company, State Auto Insurance Company of Ohio, State Auto Florida Insurance Company, Meridian Security Insurance Company, and Meridian Citizens Mutual Insurance Company |
Form 10-K Annual Report for the year ended December 31, 2004 (see Exhibit 10.55 therein) | ||
| 10.48 | First Amendment to the Reinsurance Pooling Agreement Amended and Restated as of January 1, 2005 by and among State Automobile Mutual Insurance Company, State Auto Property and Casualty Insurance Company, Milbank Insurance Company, State Auto Insurance Company of Wisconsin, Farmers Casualty Insurance Company, State Auto Insurance Company of Ohio, State Auto Florida Insurance Company, Meridian Security Insurance Company, and Meridian Citizens Mutual Insurance Company, made as of April 1, 2007 |
Form 10-Q Quarterly Report for the period ended June 30, 2007 (see Exhibit 10.66 therein) | ||
| 10.49 | Reinsurance Pooling Agreement Amended and Restated as of January 1, 2008 by and among State Automobile Mutual Insurance Company, State Auto Property and Casualty Insurance Company, Milbank Insurance Company, State Auto Insurance Company of Wisconsin, Farmers Casualty Insurance Company, State Auto Insurance Company of Ohio, State Auto Florida Insurance Company, Meridian Security Insurance Company, Meridian Citizens Mutual Insurance Company, Patrons Mutual Insurance Company of Connecticut, Litchfield Mutual Fire Insurance Company and Beacon National Insurance Company |
Form 10-K Annual Report for the year ended December 31, 2007 (see Exhibit 10.38 therein) | ||
| 10.50 | First Amendment effective as of July 1, 2008 to Reinsurance Pooling Agreement Amended and Restated as of January 1, 2008 by and among State Automobile Mutual Insurance Company, State Auto Property & Casualty Insurance Company, Milbank Insurance Company, State Auto Insurance Company of Wisconsin, Farmers Casualty Insurance Company, State Auto Insurance Company of Ohio, State Auto Florida Insurance Company, Meridian Security Insurance Company, Meridian Citizens Mutual Insurance Company, Patrons Mutual Insurance Company of Connecticut, Litchfield Mutual Fire Insurance Company and Beacon National Insurance Company |
Form 10-K Annual Report for the year ended December 31, 2008 (see Exhibit 10.44 therein) | ||
147
Table of Contents
| Exhibit No. |
Description of Exhibit | If incorporated by reference document with which Exhibit was previously filed with SEC | ||
| 10.51 | Reinsurance Pooling Agreement, Amended and Restated effective as of January 1, 2010, entered into as of February 10, 2010, by and among State Automobile Mutual Insurance Company, State Auto Property & Casualty Insurance Company, Milbank Insurance Company, State Auto Insurance Company of Wisconsin, Farmers Casualty Insurance Company, State Auto Insurance Company of Ohio, State Auto National Insurance Company, State Auto Florida Insurance Company, Meridian Security Insurance Company, Meridian Citizens Mutual Insurance Company, Patrons Mutual Insurance Company of Connecticut, Litchfield Mutual Fire Insurance Company, and Beacon National Insurance Company |
Form 8-K Current Report filed on February 16, 2010 (see Exhibit 10.1 therein) | ||
| 10.52 | Commutation and Release Agreement, effective as of January 1, 2010, entered into as of February 10, 2010, between State Automobile Mutual Insurance Company and State Auto National Insurance Company. |
Form 8-K Current Report filed on February 16, 2010 (see Exhibit 10.2 therein) | ||
| 10.53 | Amended and Restated Declaration of Trust of STFC Capital Trust I, dated as of May 22, 2003 |
Form 10-Q Quarterly Report for the period ended June 30, 2003 (see 10(XX) therein) | ||
| 10.54 | Indenture dated as of May 22, 2003, for Floating Rate Junior Subordinated Debt Securities Due 2033 |
Form 10-Q Quarterly Report for the period ended June 30, 2003 (see 10(YY) therein) | ||
| 10.55 | Indenture dated as of November 13, 2003, among State Auto Financial Corporation, as Issuer, and Fifth Third Bank, as Trustee, regarding 6 1/4% Senior Note due 2013 |
Securities Act Registration Statement on Form S-4 (File No. 333-111507)(see Exhibit 4.01 therein) | ||
| 10.56 | Form of 6 1/4% Senior Note due 2013 (Exchange Note) |
Securities Act Registration Statement on Form S-4 (File No. 333-111507)(see Exhibit 4.02 therein) | ||
| 10.57 | Credit Agreement dated as of July 12, 2007, among State Auto Financial Corporation, as borrower, a syndicate of financial institutions, as lenders, and KeyBank National Association, as Administrative Agent, Lead Arranger, Sole Book Runner and Swingline Lender |
Form 8-K Current Report filed on July 17, 2007 (see Exhibit 10.1 therein) | ||
| 10.58 | First Amendment, dated as of March 27, 2009 and effective as of April 1, 2009, to the Credit Agreement, dated as of July 12, 2007, by and among State Auto Financial Corporation, as borrower, the financial institution parties thereto, as lenders, and KeyBank National Association, as administrative agent, swingline lender and lender. |
Form 8-K Current Report filed on April 7, 2009 (see Exhibit 99.1 therein) | ||
148
Table of Contents
| Exhibit No. |
Description of Exhibit | If incorporated by reference document with which Exhibit was previously filed with SEC | ||
| 10.59 | Credit Agreement dated as of May 19, 2009, between State Automobile Mutual Insurance Company, as borrower, and Milbank Insurance Company, as lender |
Form 8-K Current Report filed on May 26, 2009 (see Exhibit 10.1 therein) | ||
| 10.60 | Credit Agreement dated as of May 8, 2009, between State Automobile Mutual Insurance Company, as borrower, and State Auto Property & Casualty Insurance Company, as lender |
Form 8-K Current Report filed on May 13, 2009 (see Exhibit 10.1 therein) | ||
| 10.61* | Employment Agreement effective as of March 1, 2009, among State Auto Financial Corporation, State Auto Property & Casualty Insurance Company, State Automobile Mutual Insurance Company and Robert P. Restrepo, Jr. |
Form 10-K Annual Report for the year ended December 31, 2008 (see Exhibit 10.53 therein) | ||
| 10.62* | Executive Agreement effective as of March 1, 2009, among State Auto Financial Corporation, State Automobile Mutual Insurance Company and Robert P. Restrepo, Jr. |
Form 10-K Annual Report for the year ended December 31, 2008 (see Exhibit 10.54 therein) | ||
| 10.63* | Employment Agreement dated as of October 4, 2007, among State Auto Financial Corporation, State Auto Property and Casualty Insurance Company, State Automobile Mutual Insurance Company and Mark A. Blackburn |
Form 10-Q Quarterly Report for the period ended September 30, 2007 (see Exhibit 10.69 therein) | ||
| 10.64* | Amendment effective January 1, 2009 to Employment Agreement dated as of October 4, 2007, among State Auto Financial Corporation, State Auto Property & Casualty Insurance Company, State Automobile Mutual Insurance Company and Mark A. Blackburn |
Form 10-K Annual Report for the year ended December 31, 2008 (see Exhibit 10.56 therein) | ||
| 10.65* | Amended and Restated Executive Agreement dated as of October 4, 2007, among State Auto Financial Corporation, State Automobile Mutual Insurance Company and Mark A. Blackburn |
Form 10-Q Quarterly Report for the period ended September 30, 2007 (see Exhibit 10.70 therein) | ||
| 10.66* | Retention Agreement dated as of February 9, 2004, between State Auto Property & Casualty Insurance Company and Steven E. English |
Form 10-Q Quarterly Report for the period ended March 31, 2007 (see Exhibit 10.61 therein) | ||
| 10.67* | Executive Change of Control Agreement entered into as of May 5, 2008, and effective April 25, 2008, among State Auto Financial Corporation, State Auto Property & Casualty Insurance Company, State Automobile Mutual Insurance Company and Steven E. English |
Form 8-K Current Report filed on May 9, 2008 (see Exhibit 99.1 therein) | ||
| 10.68* | Executive Change of Control Agreement effective April 25, 2008, among State Auto Financial Corporation, State Auto Property & Casualty Insurance Company, State Automobile Mutual Insurance Company and Clyde H. Fitch |
Form 10-K Annual Report for the year ended December 31, 2008 (see Exhibit 10.60 therein) | ||
149
Table of Contents
| Exhibit No. |
Description of Exhibit | If incorporated by reference document with which Exhibit was previously filed with SEC | ||
| 10.69* | Executive Change of Control Agreement effective April 25, 2008, among State Auto Financial Corporation, State Auto Property & Casualty Insurance Company, State Automobile Mutual Insurance Company and James A. Yano |
Form 10-K Annual Report for the year ended December 31, 2008 (see Exhibit 10.61 therein) | ||
| 10.70* | Amended and Restated Equity Incentive Compensation Plan of State Auto Financial Corporation |
Form 10-Q Quarterly Report for the period ended June 30, 2005 (see Exhibit 10.60 therein) | ||
| 10.71* | Amendment Number 1 to the Amended and Restated Equity Incentive Compensation Plan of State Auto Financial Corporation (amendment effective August 15, 2008) |
Form 10-K Annual Report for the year ended December 31, 2008 (see Exhibit 10.63 therein) | ||
| 10.72* | 2009 Equity Incentive Compensation Plan of State Auto Financial Corporation. |
Form 8-K Current Report filed on May 13, 2009 (see Exhibit 10.7 therein) | ||
| 10.73* | Restricted Share Award Agreement under the Amended and Restated Equity Incentive Compensation Plan dated as of March 2, 2006 between State Auto Financial Corporation and Robert P. Restrepo, Jr. |
Form 10-K Annual Report for the year ended December 31, 2005 (see Exhibit 10.49 therein) | ||
| 10.74* | Restricted Stock Agreement under the Amended and Restated Equity Incentive Compensation Plan dated as of October 4, 2007, between State Auto Financial Corporation and Mark A. Blackburn |
Form 10-Q Quarterly Report for the period ended September 30, 2007 (see Exhibit 10.71 therein) | ||
| 10.75* | Restricted Stock Agreement under the Amended and Restated Equity Incentive Compensation Plan dated as of November 5, 2007, between State Auto Financial Corporation and Clyde H. Fitch |
Form 10-K Annual Report for the year ended December 31, 2008 (see Exhibit 10.66 therein) | ||
| 10.76* | Form of Non-Qualified Stock Option Agreement under the Amended and Restated Equity Incentive Compensation Plan of State Auto Financial Corporation |
Form 10-Q Quarterly Report for the period ended June 30, 2005 (see Exhibit 10.62 therein) | ||
| 10.77* | Non-Qualified Stock Option Agreement under the Amended and Restated Equity Incentive Compensation Plan of State Auto Financial Corporation dated March 2, 2006 between State Auto Financial Corporation and Robert P. Restrepo, Jr. |
Form 10-K Annual Report for the year ended December 31, 2005 (see Exhibit 10.51 therein) | ||
| 10.78* | Form of Incentive Stock Option Agreement under the Amended and Restated Equity Incentive Compensation Plan of State Auto Financial Corporation |
Form 10-Q Quarterly Report for the period ended June 30, 2005 (see Exhibit 10.63 therein) | ||
| 10.79* | Outside Directors Restricted Share Unit Plan of State Auto Financial Corporation |
Form 10-Q Quarterly Report for the period ended June 30, 2005 (see Exhibit 10.61 therein) | ||
150
Table of Contents
| Exhibit No. |
Description of Exhibit | If incorporated by reference document with which Exhibit was previously filed with SEC | ||
| 10.80* | First Amendment to the Outside Directors Restricted Share Unit Plan of State Auto Financial Corporation |
Form 10-K Annual Report for the year ended December 31, 2005 (see Exhibit 10.54 therein) | ||
| 10.81* | Second Amendment to the Outside Directors Restricted Share Unit Plan of State Auto Financial Corporation |
Form 10-K Annual Report for the year ended December 31, 2008 (see Exhibit 10.72 therein) | ||
| 10.82* | Third Amendment to the Outside Directors Restricted Share Unit Plan of State Auto Financial Corporation |
Form 10-K Annual Report for the year ended December 31, 2008 (see Exhibit 10.73 therein) | ||
| 10.83* | Form of Restricted Share Unit Agreement for the Outside Directors Restricted Share Unit Plan of State Auto Financial Corporation |
Form 10-Q Quarterly Report for the period ended June 30, 2005 (see Exhibit 10.64 therein) | ||
| 10.84* | Form of Designation of Beneficiary for the Outside Directors Restricted Share Unit Plan of State Auto Financial Corporation |
Form 10-Q Quarterly Report for the period ended June 30, 2005 (see Exhibit 10.65 therein) | ||
| 10.85* | Supplemental Retirement Plan for Executive Employees of State Auto Insurance Companies (Restatement) effective as of January 1, 1994 |
Form 10-K Annual Report for the year ended December 31, 1997 (see Exhibit 10(HH) therein) | ||
| 10.86* | Amendment No. 1, effective as of January 1, 2008, to Supplemental Retirement Plan for Executive Employees of State Auto Insurance Companies |
Form 10-Q Quarterly Report for the period ended June 30, 2008 (see Exhibit 10.01 therein) | ||
| 10.87* | Amendment No. 2 effective as of January 1, 2009 to the Supplemental Retirement Plan for Executive Employees of State Auto Insurance Companies |
Form 10-Q Quarterly Report for the period ended September 30, 2008 (see Exhibit 10.01 therein) | ||
| 10.88* | State Auto Financial Corporation Supplemental Executive Retirement Plan, effective January 1, 2007 |
Form 10-Q Quarterly Report for the period ended September 30, 2007 (see Exhibit 10.72 therein) | ||
| 10.89* | Form of Designation of Distribution Election for the State Auto Financial Corporation Supplemental Executive Retirement Plan |
Form 10-Q Quarterly Report for the period ended September 30, 2007 (see Exhibit 10.73 therein) | ||
| 10.90* | State Auto Insurance Companies Amended and Restated Directors Deferred Compensation Plan (amended and restated as of March 1, 2001) |
Form 10-K Annual Report for the year ended December 31, 2005 (see Exhibit 10.58 therein) | ||
| 10.91* | First Amendment to the State Auto Insurance Companies Amended and Restated Directors Deferred Compensation Plan (amendment effective as of December 1, 2005) |
Form 10-K Annual Report for the year ended December 31, 2005 (see Exhibit 10.59 therein) | ||
| 10.92* | Second Amendment to the State Auto Insurance Companies Amended and Restated Directors Deferred Compensation Plan (amendment effective as of January 1, 2009) |
Form 10-Q Quarterly Report for the period ended September 30, 2008 (see Exhibit 10.02 therein) | ||
151
Table of Contents
| Exhibit No. |
Description of Exhibit | If incorporated by reference document with which Exhibit was previously filed with SEC | ||
| 10.93* | Third Amendment to the State Auto Insurance Companies Amended and Restated Directors Deferred Compensation Plan (amendment effective as of January 1, 2009) |
Form 10-K Annual Report for the year ended December 31, 2008 (see Exhibit 10.84 therein) | ||
| 10.94* | Agreement of Assignment and Assumption dated as of March 1, 2001, among State Auto Financial Corporation, State Automobile Mutual Insurance Company, State Auto Property and Casualty Insurance Company, and Midwest Security Insurance Company (nka State Auto Insurance Company of Wisconsin) regarding the State Auto Insurance Companies Amended and Restated Directors Deferred Compensation Plan |
Form 10-K Annual Report for the year ended December 31, 2005 (see Exhibit 10.60 therein) | ||
| 10.95* | Form of State Auto Insurance Companies Directors Deferred Compensation Agreement |
Form 10-K Annual Report for the year ended December 31, 2005 (see Exhibit 10.61 therein) | ||
| 10.96* | State Auto Property & Casualty Insurance Company’s Amended and Restated Incentive Deferred Compensation Plan (amended and restated as of March 1, 2001) |
Form 10-K Annual Report for the year ended December 31, 2005 (see Exhibit 10.62 therein) | ||
| 10.97* | First Amendment to the State Auto Property & Casualty Insurance Company’s Amended and Restated Incentive Deferred Compensation Plan (amendment effective as of November 22, 2002) |
Form 10-K Annual Report for the year ended December 31, 2005 (see Exhibit 10.63 therein) | ||
| 10.98* | Second Amendment to the State Auto Property & Casualty Insurance Company’s Amended and Restated Incentive Deferred Compensation Plan (amendment effective as of January 1, 2009) |
Form 10-Q Quarterly Report for the period ended September 30, 2008 (see Exhibit 10.03 therein) | ||
| 10.99* | Agreement of Assignment and Assumption dated as of March 1, 2001, among State Auto Financial Corporation, State Automobile Mutual Insurance Company, and State Auto Property and Casualty Insurance Company regarding the State Auto Property & Casualty Insurance Company’s Amended and Restated Incentive Deferred Compensation Plan |
Form 10-K Annual Report for the year ended December 31, 2005 (see Exhibit 10.64 therein) | ||
| 10.100* | Form of State Auto Property & Casualty Insurance Company’s Incentive Deferred Compensation Agreement |
Form 10-K Annual Report for the year ended December 31, 2005 (see Exhibit 10.65 therein) | ||
| 10.101* | State Auto Financial Corporation Leadership Bonus Plan |
Form 10-Q Quarterly Report for the period ended June 30, 2007 (see Exhibit 10.64 therein) | ||
| 10.102* | First Amendment to the State Auto Financial Corporation Leadership Bonus Plan (amendment effective as of January 1, 2009) |
Form 10-Q Quarterly Report for the period ended September 30, 2008 (see Exhibit 10.04 therein) | ||
| 10.103* | State Auto Financial Corporation Long-Term Incentive Plan |
Form 10-Q Quarterly Report for the period ended June 30, 2007 (see Exhibit 10.65 therein) | ||
152
Table of Contents
| Exhibit No. |
Description of Exhibit | If incorporated by reference document with which Exhibit was previously filed with SEC | ||
| 10.104* | First Amendment to the State Auto Financial Corporation Long-Term Incentive Plan (amendment effective as of January 1, 2008) |
Form 8-K Current Report filed on March 13, 2008 (see Exhibit 10.5 therein) | ||
| 10.105* | Second Amendment to the State Auto Financial Corporation Long-Term Incentive Plan (amendment effective as of January 1, 2009) |
Form 10-Q Quarterly Report for the period ended September 30, 2008 (see Exhibit 10.05 therein) | ||
| 10.106 | Underwriting Management Agreement effective as of November 20, 2009, by and between Rockhill Insurance Company, Plaza Insurance Company, American Compensation Insurance Company, Bloomington Compensation Insurance Company, State Automobile Mutual Insurance Company, State Auto Property & Casualty Insurance Company, Meridian Security Insurance Company, Milbank Insurance Company, Farmers Casualty Insurance Company, and Risk Evaluation and Design, LLC |
Form 8-K Current Report filed on November 25, 2009 (see Exhibit 10.1 therein) | ||
| 21.01 | List of Subsidiaries of State Auto Financial Corporation |
Form 10-K Annual Report for the year ended December 31, 2007 (see Exhibit 21.01 therein) | ||
| 23.01 | Consent of Independent Registered Public Accounting Firm |
Included herein | ||
| 24.01 | Powers of Attorney—Robert P. Restrepo, Jr., David J. D’Antoni, David R. Meuse, S. Elaine Roberts, Richard K. Smith, Alexander B. Trevor and Paul S. Williams |
Form 10-K Annual Report for the year ended December 31, 2007 (see Exhibit 24.01 therein) | ||
| 24.02 | Powers of Attorney—Robert E. Baker and Thomas E. Markert |
Form 10-Q Quarterly Report for the period ended March 31, 2008 (see Exhibit 24.01 therein) | ||
| 31.01 | CEO certification required by Section 302 of Sarbanes-Oxley Act of 2002 |
Included herein | ||
| 31.02 | CFO certification required by Section 302 of Sarbanes-Oxley Act of 2002 |
Included herein | ||
| 32.01 | CEO certification required by Section 906 of Sarbanes-Oxley Act of 2002 |
Included herein | ||
| 32.02 | CFO certification required by Section 906 of Sarbanes-Oxley Act of 2002 |
Included herein | ||
| * | Constitutes either a management contract or a compensatory plan or arrangement required to be filed as an Exhibit. |
| (b) | EXHIBITS |
The exhibits included with this Form 10-K, as indicated in Item 15(a) (3), have been separately filed.
| (c) | FINANCIAL STATEMENT SCHEDULES |
Our financial statement schedules included with this Form 10-K, as indicated in Item 15(a) (2), follow the signatures to this Form 10-K.
153
Table of Contents
Pursuant to the requirements of Section 13 or 15(d) of the Securities Exchange Act of 1934, the Registrant has duly caused this report to be signed on its behalf by the undersigned, thereunto duly authorized.
| STATE AUTO FINANCIAL CORPORATION | ||||
| Dated: March 5, 2010 |
/s/ ROBERT P. RESTREPO, JR. | |||
| Robert P. Restrepo, Jr. | ||||
| Chairman, President and Chief Executive Officer | ||||
Pursuant to the requirements of the Securities Exchange Act of 1934, this report has been signed by the following persons on behalf of the Registrant and in the capacities and on the dates indicated.
| Name |
Title |
Date | ||
| /s/ ROBERT P. RESTREPO, JR. Robert P. Restrepo, Jr. |
Chairman, President and Chief Executive Officer (principal executive officer) |
March 5, 2010 | ||
| /s/ STEVEN E. ENGLISH Steven E. English |
Vice President and Chief Financial Officer (principal financial officer) |
March 5, 2010 | ||
| /s/ CYNTHIA A. POWELL Cynthia A. Powell |
Vice President and Treasurer (principal accounting officer) |
March 5, 2010 | ||
| DAVID J. D’ANTONI* David J. D’Antoni |
Director | March 5, 2010 | ||
| ROBERT E. BAKER* Robert E. Baker |
Director | March 5, 2010 | ||
| THOMAS E. MARKERT* Thomas E. Markert |
Director | March 5, 2010 | ||
| DAVID R. MEUSE* David R. Meuse |
Director | March 5, 2010 | ||
| S. ELAINE ROBERTS* S. Elaine Roberts |
Director | March 5, 2010 | ||
| RICHARD K. SMITH* Richard K. Smith |
Director | March 5, 2010 | ||
| ALEXANDER B. TREVOR* Alexander B. Trevor |
Director | March 5, 2010 | ||
| PAUL S. WILLIAMS* Paul S. Williams |
Director | March 5, 2010 | ||
| * | Steven E. English by signing his name hereto, does sign this document on behalf of the person indicated above pursuant to a Power of Attorney duly executed by such person. |
| /s/ STEVEN E. ENGLISH Steven E. English |
Attorney in Fact | March 5, 2010 |
154
Table of Contents
STATE AUTO FINANCIAL CORPORATION AND SUBSIDIARIES
SCHEDULE I – SUMMARY OF INVESTMENTS - OTHER THAN
INVESTMENTS IN RELATED PARTIES
DECEMBER 31, 2009
| ($ millions) At December 31, 2009: |
Cost or amortized cost(1) |
Fair value |
Amount at which shown in the balance sheet | ||||
| Available-for-sale: |
|||||||
| Fixed maturities: |
|||||||
| U.S. treasury securities and obligations of U.S. government agencies |
$ | 348.4 | 352.9 | 352.9 | |||
| Obligations of states and political subdivisions |
1,046.9 | 1,078.6 | 1,078.6 | ||||
| Corporate securities |
97.4 | 99.7 | 99.7 | ||||
| U.S. government agencies residential mortgage-backed securities |
295.4 | 300.6 | 300.6 | ||||
| Total fixed maturities |
1,788.1 | 1,831.8 | 1,831.8 | ||||
| Equity securities: |
|||||||
| Large-cap equity securities |
164.7 | 196.1 | 196.1 | ||||
| Small-cap equity securities |
25.0 | 28.0 | 28.0 | ||||
| Total equity securities |
189.7 | 224.1 | 224.1 | ||||
| Other invested assets |
44.1 | 52.3 | 52.3 | ||||
| Total available-for-sale |
2,021.9 | 2,108.2 | 2,108.2 | ||||
| Other invested assets |
0.9 | 0.9 | 0.9 | ||||
| Total investments – other than investments in related parties |
$ | 2,022.8 | 2,109.1 | 2,109.1 | |||
| (1) | Original cost of equity securities and, as to fixed maturities, original cost reduced by repayments and adjusted for amortization of premiums or accrual of discounts. |
Table of Contents
STATE AUTO FINANCIAL CORPORATION
SCHEDULE II – CONDENSED FINANCIAL INFORMATION OF REGISTRANT
Condensed Balance Sheets
| (in millions, except per share amounts) | December 31 | ||||||
| 2009 | 2008 | ||||||
| Assets |
|||||||
| Investments in common stock of subsidiaries (equity method) |
$ | 944.5 | 846.5 | ||||
| Other invested assets |
1.6 | 1.1 | |||||
| Cash and cash equivalents |
10.2 | 22.3 | |||||
| Other assets |
1.6 | 1.7 | |||||
| Due from affiliates |
1.7 | — | |||||
| Federal income tax |
10.1 | 10.2 | |||||
| Total assets |
$ | 969.7 | 881.8 | ||||
| Liabilities and Stockholders’ Equity |
|||||||
| Notes payable (affiliates $15.5 and $15.5, respectively) |
$ | 117.2 | 117.6 | ||||
| Due to affiliates |
— | 0.2 | |||||
| Other liabilities |
3.1 | 3.0 | |||||
| Total liabilities |
120.3 | 120.8 | |||||
| Stockholders’ equity: |
|||||||
| Class A Preferred stock (nonvoting), without par value. Authorized 2.5 shares; none issued |
— | — | |||||
| Class B Preferred stock, without par value. Authorized 2.5 shares; none issued |
— | — | |||||
| Common stock, without par value. Authorized 100.0 shares; 46.6 and 46.3 issued, respectively, at stated value of $2.50 per share |
116.6 | 115.9 | |||||
| Treasury Stock, 6.8 and 6.8 shares, respectively, at cost |
(115.7 | ) | (115.5 | ) | |||
| Additional paid-in capital |
115.8 | 109.0 | |||||
| Accumulated other comprehensive loss |
(2.9 | ) | (97.6 | ) | |||
| Retained earnings |
735.6 | 749.2 | |||||
| Total stockholders’ equity |
849.4 | 761.0 | |||||
| Total liabilities and stockholders’ equity |
$ | 969.7 | 881.8 | ||||
See accompanying note to condensed financial statements.
Table of Contents
STATE AUTO FINANCIAL CORPORATION
SCHEDULE II – CONDENSED FINANCIAL INFORMATION OF REGISTRANT
CONTINUED
Condensed Statements of Income
| ($ millions) | Year ended December 31 | |||||||||
| 2009 | 2008 | 2007 | ||||||||
| Net investment income |
$ | 0.1 | 0.9 | 1.4 | ||||||
| Net realized gain on investments |
— | — | 1.5 | |||||||
| Total revenues |
0.1 | 0.9 | 2.9 | |||||||
| Interest expense (affiliate $0.8, $1.2 and $1.5, respectively) |
7.4 | 7.3 | 7.6 | |||||||
| Other operating expenses |
3.3 | 4.3 | 3.7 | |||||||
| Total expenses |
10.7 | 11.6 | 11.3 | |||||||
| Loss before federal income taxes |
(10.6 | ) | (10.7 | ) | (8.4 | ) | ||||
| Federal income tax benefit |
(4.6 | ) | (5.1 | ) | (4.4 | ) | ||||
| Net loss before equity in net income (loss) of subsidiaries |
(6.0 | ) | (5.6 | ) | (4.0 | ) | ||||
| Equity in net income (loss) of subsidiaries |
16.2 | (25.5 | ) | 123.1 | ||||||
| Net income (loss) |
$ | 10.2 | (31.1 | ) | 119.1 | |||||
See accompanying note to condensed financial statements.
Table of Contents
STATE AUTO FINANCIAL CORPORATION
SCHEDULE II – CONDENSED FINANCIAL INFORMATION OF REGISTRANT
CONTINUED
Condensed Statements of Cash Flows
| ($ millions) | Year Ended December 31 | |||||||||
| 2009 | 2008 | 2007 | ||||||||
| Cash flows from operating activities: |
||||||||||
| Net income (loss) |
$ | 10.2 | (31.1 | ) | 119.1 | |||||
| Adjustments to reconcile net income (loss) to net cash used in operating activities: |
||||||||||
| Depreciation and amortization, net |
(0.3 | ) | (0.1 | ) | (0.6 | ) | ||||
| Share-based compensation |
(0.1 | ) | (0.1 | ) | 0.5 | |||||
| Net realized loss on investments |
— | — | (1.5 | ) | ||||||
| Equity in net (income) loss from consolidated subsidiaries |
(16.3 | ) | 25.5 | (123.1 | ) | |||||
| Changes in operating assets and liabilities: |
||||||||||
| Other liabilities and due to affiliates |
(1.6 | ) | (1.0 | ) | 0.7 | |||||
| Other assets |
— | 0.2 | (0.2 | ) | ||||||
| Excess tax benefits on share-based awards |
0.1 | 0.4 | 0.4 | |||||||
| Federal income taxes |
(0.1 | ) | (2.5 | ) | 1.3 | |||||
| Net cash used in operating activities |
(8.1 | ) | (8.7 | ) | (3.4 | ) | ||||
| Cash flows from investing activities: |
||||||||||
| Capitalization of subsidiary |
— | — | (2.0 | ) | ||||||
| Dividends received from consolidated subsidiaries |
16.5 | 45.9 | 57.5 | |||||||
| Purchases of fixed maturities – available-for-sale |
— | — | (2.0 | ) | ||||||
| Purchases of equity securities – available-for-sale |
— | — | (1.0 | ) | ||||||
| Maturities, calls and pay downs of fixed maturities – available-for-sale |
— | — | 3.0 | |||||||
| Sales of equity securities – available-for-sale |
— | 1.2 | 9.9 | |||||||
| Net cash provided by investing activities |
16.5 | 47.1 | 65.4 | |||||||
| Cash flows from financing activities: |
||||||||||
| Proceeds from issuance of common stock |
3.3 | 4.4 | 4.3 | |||||||
| Payments to acquire treasury shares |
— | (33.2 | ) | (22.1 | ) | |||||
| Payment of dividends |
(23.8 | ) | (23.9 | ) | (20.5 | ) | ||||
| Excess tax benefits on share-based awards |
— | 0.3 | 0.3 | |||||||
| Net cash used in financing activities |
(20.5 | ) | (52.4 | ) | (38.0 | ) | ||||
| Net (decrease) increase in cash and cash equivalents |
(12.1 | ) | (14.0 | ) | 24.0 | |||||
| Cash and cash equivalents at beginning of year |
22.3 | 36.3 | 12.3 | |||||||
| Cash and cash equivalents at end of year |
$ | 10.2 | 22.3 | 36.3 | ||||||
| Supplemental Disclosures: |
||||||||||
| Federal income tax benefit received |
$ | (4.6 | ) | (3.4 | ) | (6.3 | ) | |||
| Interest paid (affiliates $0.8, $1.2 and $1.5, respectively) |
$ | 7.1 | 7.5 | 7.8 | ||||||
Note to Condensed Financial Statements:
In our parent-company-only financial statements, our Company’s investment in subsidiaries is stated at cost plus equity in net income (loss) from consolidated subsidiaries since the date of acquisition. Our Company’s share of net income (loss) of its unconsolidated subsidiaries is included in consolidated income (loss) using the equity method. Our parent-company-only financial statements should be read in conjunction with our Company’s consolidated financial statements.
Table of Contents
STATE AUTO FINANCIAL CORPORATION AND SUBSIDIARIES
SCHEDULE III – SUPPLEMENTARY INSURANCE INFORMATION
Years Ended December 31, 2009, 2008 and 2007
| ($ millions) Segment |
Deferred policy acquisition cost |
Future benefits, claims and losses(1) |
Unearned premiums |
Other policy claims and benefits payable |
Premium revenue | ||||||
| Year ended December 31, 2009: |
|||||||||||
| Personal insurance segment |
$ | 68.4 | 325.6 | 320.7 | — | 732.8 | |||||
| Business insurance segment |
58.9 | 493.8 | 226.3 | — | 443.7 | ||||||
| Investment operations segment |
— | — | — | — | — | ||||||
| Total |
$ | 127.3 | 819.4 | 547.0 | — | 1,176.5 | |||||
| Year ended December 31, 2008: |
|||||||||||
| Personal insurance segment |
$ | 59.9 | 291.3 | 278.3 | — | 670.9 | |||||
| Business insurance segment |
62.4 | 478.7 | 236.8 | — | 455.1 | ||||||
| Investment operations segment |
— | — | — | — | — | ||||||
| Total |
$ | 122.3 | 770.0 | 515.1 | — | 1,126.0 | |||||
| Year ended December 31, 2007: |
|||||||||||
| Personal insurance segment |
$ | 50.3 | 249.6 | 233.6 | — | 609.6 | |||||
| Business insurance segment |
55.5 | 397.5 | 202.4 | — | 402.0 | ||||||
| Investment operations segment |
— | — | — | — | — | ||||||
| Total |
$ | 105.8 | 647.1 | 436.0 | — | 1,011.6 | |||||
| Segment |
Net investment income |
Benefits, losses and settlement expenses(2) |
Amort. of deferred policy acquisition costs |
Other operating expenses |
Premiums written | ||||||
| Year ended December 31, 2009: |
|||||||||||
| Personal insurance segment |
$ | — | 554.7 | 156.9 | 76.7 | 775.1 | |||||
| Business insurance segment |
— | 283.8 | 120.6 | 46.7 | 435.3 | ||||||
| Investment operations segment |
82.1 | — | — | — | — | ||||||
| Total |
$ | 82.1 | 838.5 | 277.5 | 123.4 | 1,210.4 | |||||
| Year ended December 31, 2008: |
|||||||||||
| Personal insurance segment |
$ | — | 520.3 | 139.0 | 63.4 | 715.6 | |||||
| Business insurance segment |
— | 322.1 | 118.2 | 69.2 | 489.3 | ||||||
| Investment operations segment |
87.4 | — | — | — | — | ||||||
| Total |
$ | 87.4 | 842.4 | 257.2 | 132.6 | 1,204.9 | |||||
| Year ended December 31, 2007: |
|||||||||||
| Personal insurance segment |
$ | — | 378.4 | 128.5 | 60.7 | 615.1 | |||||
| Business insurance segment |
— | 207.2 | 114.2 | 44.5 | 404.7 | ||||||
| Investment operations segment |
84.7 | — | — | — | — | ||||||
| Total |
$ | 84.7 | 585.6 | 242.7 | 105.2 | 1,019.8 | |||||
| (1) | Segmented balances are net of reinsurance recoverable on losses and loss expenses payable. |
| (2) | Benefits, losses and settlement expenses are monitored on a statutory basis. |
Table of Contents
STATE AUTO FINANCIAL CORPORATION AND SUBSIDIARIES
SCHEDULE IV – REINSURANCE
Years Ended December 31, 2009, 2008 and 2007
| Ceded to | Assumed from | Net amount |
Percentage of amount assumed to net(2) |
||||||||||||||||||
| ($ million, except percentages) | Gross amount |
Outside companies |
Affiliated companies(1) |
Outside companies |
Affiliated companies(1) |
||||||||||||||||
| Year ended December 31, 2009: |
|||||||||||||||||||||
| Property-casualty earned premiums |
$ | 802.8 | $ | 26.5 | $ | 742.6 | $ | 5.0 | $ | 1,137.8 | $ | 1,176.5 | 0.4 | % | |||||||
| Year ended December 31, 2008: |
|||||||||||||||||||||
| Property-casualty earned premiums |
759.4 | 21.5 | 700.9 | 5.6 | 1,083.4 | 1,126.0 | 0.5 | % | |||||||||||||
| Year ended December 31, 2007: |
|||||||||||||||||||||
| Property-casualty earned premiums |
751.0 | 18.8 | 695.7 | 6.5 | 968.6 | 1,011.6 | 0.6 | % | |||||||||||||
| (1) | These columns include the effect of intercompany pooling. |
| (2) | Calculated as earned premiums assumed from outside companies to net amount. |