Attached files
UNITED
STATES
SECURITIES
AND EXCHANGE COMMISSION
WASHINGTON,
D.C. 20549
FORM
10-K
(Mark One)
|
x
|
ANNUAL
REPORT PURSUANT TO SECTION 13 OR 15(d) OF THE SECURITIES EXCHANGE ACT OF
1934
|
For
the fiscal year ended December 31, 2009
OR
|
¨
|
TRANSITION
REPORT PURSUANT TO SECTION 13 OR 15(d) OF THE SECURITIES EXCHANGE ACT OF
1934
|
For
the transition period from N/A to
Commission
file number 1-10959
STANDARD
PACIFIC CORP.
(Exact
name of registrant as specified in its charter)
|
Delaware
|
33-0475989
|
|
(State
or other jurisdiction of
incorporation
or organization)
|
(I.R.S.
Employer
Identification
No.)
|
26
Technology Drive, Irvine, California, 92618
(Address
of principal executive offices)
(949)
789-1600
(Registrant’s
telephone number, including area code)
Securities
registered pursuant to Section 12(b) of the Act:
|
Title
of each class
|
Name
of each exchange on which registered
|
|
Common
Stock, $0.01 par value
(and
accompanying Preferred Share Purchase Rights)
|
New
York Stock Exchange
|
|
6¼%
Senior Notes due 2014
(and
related guarantees)
|
New
York Stock Exchange
|
Securities
registered pursuant to Section 12(g) of the Act:
None
Indicate
by check mark if the registrant is a well-known seasoned issuer, as defined in
Rule 405 of the Securities Act. Yes ¨ No x
Indicate
by check mark if the registrant is not required to file reports pursuant to
Section 13 or Section 15(d) of the
Act. Yes ¨ No x
Indicate
by check mark whether the registrant (1) has filed all reports required to
be filed by Section 13 or 15(d) of the Securities Exchange Act of 1934
during the preceding 12 months (or for such shorter period that the registrant
was required to file such reports), and (2) has been subject to such filing
requirements for the past 90 days. Yes x No ¨
Indicate
by check mark whether the registrant has submitted electronically and posted on
its corporate Website, if any, every Interactive Data File required to be
submitted and posted pursuant to Rule 405 of Regulation S-T (§ 232.405 of this
chapter) during the preceding 12 months (or for such shorter period that the
registrant was required to submit and post such
files). Yes o No o
Indicate
by check mark if disclosure of delinquent filers pursuant to Item 405 of
Regulation S-K (§229.405 of this chapter) is not contained herein,
and will not be contained, to the best of the registrant’s knowledge, in
definitive proxy or information statements incorporated by reference in Part III
of this Form 10-K or any amendment to this Form 10-K. ¨
Indicate
by check mark whether the registrant is a large accelerated filer, an
accelerated filer, or a non-accelerated filer, or a smaller reporting company.
See the definitions of “large accelerated filer,” “accelerated filer” and
“smaller reporting company” in Rule 12b-2 of the Exchange Act.
|
Large
accelerated filer ¨
|
Accelerated
filer x
|
|
Non-accelerated
filer ¨ (Do not check if
a smaller reporting company)
|
Smaller
reporting company ¨
|
Indicate
by check mark whether the registrant is a shell company (as defined in
Rule 12b-2 of the Act). Yes ¨ No x
The
aggregate market value of the common equity held by non-affiliates computed by
reference to the price at which the common equity was last sold as of the last
business day of the registrant’s most recently completed second fiscal quarter
was $202,953,158.
As of
March 3, 2010, there were 106,111,178 shares of the registrant’s common
stock outstanding.
Documents
incorporated by reference:
Portions
of the registrant’s Definitive Proxy Statement to be filed with the Securities
and Exchange Commission in connection with the registrant’s 2010 Annual Meeting
of Stockholders are incorporated by reference into Part III hereof.
STANDARD
PACIFIC CORP.
|
Page No.
|
||
|
PART
I
|
||
|
Item 1.
|
1
|
|
|
Item 1A.
|
5
|
|
|
Item 1B.
|
13
|
|
|
Item 2.
|
13
|
|
|
Item 3.
|
13
|
|
|
Item 4.
|
||
|
PART
II
|
||
|
Item 5.
|
15
|
|
|
Item 6.
|
17
|
|
|
Item 7.
|
18
|
|
|
Item 7A.
|
42
|
|
|
Item 8.
|
44
|
|
|
Item 9.
|
86
|
|
|
Item 9A.
|
86
|
|
|
Item 9B.
|
88
|
|
|
PART
III
|
||
|
Item 10.
|
88
|
|
|
Item 11.
|
88
|
|
|
Item 12.
|
88
|
|
|
Item 13.
|
88
|
|
|
Item 14.
|
88
|
|
|
PART
IV
|
||
|
Item 15.
|
90
|
STANDARD
PACIFIC CORP.
PART
I
|
ITEM 1.
|
We are a
geographically diversified builder of single-family attached and detached
homes. We construct homes within a wide range of price and size
targeting a broad range of homebuyers. We have operations in major
metropolitan markets in California, Florida, Arizona, Texas, the Carolinas,
Colorado and Nevada and have built homes for more than 110,000 families during
our 44-year history.
In 2009,
the percentages of our home deliveries by state (including deliveries by
unconsolidated joint ventures) were as follows:
|
State
|
Percentage of
Deliveries
|
|
|
California
|
41%
|
|
|
Florida
|
22
|
|
|
Texas
|
12
|
|
|
Carolinas
|
12
|
|
|
Arizona
|
8
|
|
|
Colorado
|
4
|
|
|
Nevada
|
1
|
|
|
Total
|
100%
|
|
In
addition to our core homebuilding operations, we also have a mortgage banking
subsidiary that originates loans for our homebuyers which are generally sold in
the secondary mortgage market and a title services subsidiary that acts as a
title insurance agent performing title examination services for our Texas
homebuyers. For business segment financial data, including revenue,
total assets, pretax income (loss), income (loss) from investments in
unconsolidated joint ventures and impairments, please see “Management’s
Discussion and Analysis of Financial Condition and Results of Operations”
beginning on page 18, as well as Note 3 to our consolidated financial statements
beginning on page 59.
Standard
Pacific Corp. was incorporated in the State of Delaware in
1991. Through our predecessors, we commenced our homebuilding
operations in 1966. Our principal executive offices are located at 26 Technology
Drive, Irvine, California 92618. Unless the context otherwise requires, the
terms “we,” “us,” “our” and “the Company” refer to Standard Pacific Corp. and
its predecessors and subsidiaries.
This
annual report on Form 10-K and each of our other quarterly reports on Form 10-Q
and current reports on Form 8-K, including any amendments, are
available free of charge on our website, www.standardpacifichomes.com,
as soon as reasonably practicable after such material is electronically filed
with, or furnished to, the Securities and Exchange Commission (“SEC”). The
information contained on our website is not incorporated by reference into this
report and should not be considered part of this report. In addition,
the SEC website contains reports, proxy and information statements, and other
information about us at www.sec.gov.
Strategy
The
prolonged downturn in our markets has provided us the opportunity to refine our
strategy for creating long-term shareholder value. Our strategy
includes the following elements:
Overhead,
Costs and Operations
|
·
|
Align
overhead structure with current and projected delivery
levels;
|
|
·
|
Manage
speculative starts and new community openings to align production with
sales;
|
|
·
|
Be
among the leaders in each of our markets allowing better access to land
opportunities and the potential for a lower cost
structure;
|
|
·
|
Centralize
key administrative functions, such as finance and treasury, information
technology, legal and risk management, and human resources, in our
corporate headquarters to facilitate control and minimize
costs;
|
|
·
|
Use
the downturn in the economy as an opportunity to improve our operating
model to be positioned to offer better value to our customers as industry
conditions improve;
|
|
·
|
Value
engineer our homes with a sharpened focus on preferred customer
features;
|
|
·
|
Accelerate
our national and regional purchasing, re-bidding and other purchasing
initiatives; and
|
|
·
|
Focus
on our historical strength, single family detached and attached homes
(including condominiums) configured in three or fewer stories and which
are offered at multiple price points to appeal to a broad range of
homebuyers.
|
Land and Footprint
|
·
|
Take
advantage of the distressed land market to acquire land positions in
markets that are expected to be high growth in the
future;
|
|
·
|
Invest
in our land position while prices are depressed with a long-term goal of
having a 2 to 3 year land supply when market conditions normalize;
and
|
|
·
|
Focus
on our existing geographic footprint (we currently operate in 11 of the
top 25 markets in the country based on building permits) and exceptional
opportunities that become available in additional high growth
markets.
|
Financial
|
·
|
Preserve
sufficient cash resources to meet debt repayment obligations until market
conditions improve and re-financing alternatives become available;
and
|
|
·
|
Pursue
land acquisition opportunities through use of excess cash, equity or
potential partnerships with external financial
partners.
|
Homebuilding
Operations
We
currently build homes in 16 markets through a total of seven operating
divisions. At December 31, 2009, we had 198 projects, of which 122
were actively selling (excluding unconsolidated joint ventures).
For the
year ended December 31, 2009, approximately 74% of our deliveries were
single-family detached dwellings. The remainder of our deliveries
were single family attached homes, generally townhomes and condominiums
configured with eight or fewer units per building.
Our homes
are designed to suit the particular market in which they are located and are
available in a variety of models, exterior styles and materials depending upon
local preferences. While we have built homes from 1,100 to over 6,000
square feet, our homes typically range in size from approximately 1,500 to 3,500
square feet. The sales prices of our homes generally range from approximately
$100,000 to over $1 million. Set forth below are our average selling prices by
state (excluding joint ventures) of homes delivered during 2009:
|
State
|
Average
Selling
Price
|
|
|
California
|
$ 434,000
|
|
|
Texas
|
$
282,000
|
|
|
Florida
|
$ 190,000
|
|
|
Arizona
|
$ 211,000
|
|
|
Carolinas
|
$ 218,000
|
|
|
Colorado
|
$ 305,000
|
|
|
Nevada
|
$ 225,000
|
Development
and Construction
We
customarily acquire unimproved or improved land zoned for residential
use. To control larger land parcels, we sometimes form land
development joint ventures with third parties which provide us the right to
acquire a portion of the lots from the joint venture when
developed. If we purchase raw land or partially developed land, we
will perform development work on a project in addition to constructing
homes. This development work may include negotiating with
governmental agencies and local communities to obtain any necessary zoning,
environmental and other regulatory approvals, and constructing, as necessary,
roads, water, sewer and drainage systems, recreational facilities, and other
improvements.
We act as
a general contractor with our supervisory employees coordinating all development
and construction work on a project. The services of independent
architectural design, engineering and other consulting firms are generally
engaged on a project-by-project basis to assist in project planning and home
design, and subcontractors are employed to perform all of the physical
development and construction work. Although the construction time for
our homes varies from project to project depending on geographic region, the
time of year, the size and complexity of the homes, local labor situations, the
governmental approval processes, availability of materials and supplies, and
other factors, we typically complete the construction of a home in
approximately three to six months, with a current average cycle time of
approximately four months.
Marketing
and Sales
Our homes
are generally marketed by our divisional sales teams through furnished and
landscaped model homes, which are typically maintained at each project site. We
host a website, www.standardpacifichomes.com,
with project listings, floor plans, pricing and other project information, which
we intend to use as an increasingly important means of marketing in the
future.
Our
homes are sold using sales contracts that are usually accompanied by a cash
deposit from the homebuyer. Under current market conditions, an
increasing number of homebuyers are seeking to buy a completed or close to
complete home. For those homes sold prior to construction, homebuyers
are afforded the opportunity to contract to purchase various optional amenities
and upgrades such as prewiring and electrical options, upgraded flooring,
cabinets, finished carpentry and countertops, varied interior and exterior color
schemes, additional and upgraded appliances, and some room configurations.
Purchasers are typically permitted for a limited time to cancel their contracts
if they fail to qualify for financing. In some cases, purchasers are also
permitted to cancel their contract if they are unable to sell their existing
homes or if certain other conditions are not met. A buyer’s liability for
wrongfully terminating a sales contract is typically limited to the forfeiture
of the buyer’s cash deposit to the Company, although some states provide for
even more limited remedies.
Financing
We
typically use both our equity (including internally generated funds from
operations and proceeds from public and private equity offerings and proceeds
from the exercise of stock options) and debt financing in the form of bank debt
and proceeds from our note offerings, to fund land acquisition and development
and construction of our properties. To a lesser extent, we use
purchase money trust deeds to finance the acquisition of land and, in some
markets, community facility district or other similar assessment district bond
financing is used to fund community infrastructure such as roads and
sewers.
We also
utilize joint ventures and option arrangements with land sellers, other
builders, developers and financial entities from time to time as a means of
accessing lot positions, expanding our market opportunities, establishing
strategic alliances, leveraging our capital base and managing the financial and
market risk associated with land holdings. In addition to equity
contributions made by us and our partners, our joint ventures typically will
obtain secured project specific financing to fund the acquisition of land and
development and construction costs. We have reduced our investments
in joint ventures but still intend to utilize these types of arrangements in the
future. For more detailed discussion of our current joint venture
arrangements please see “Off-Balance Sheet Arrangements” beginning on page
32.
Seasonality
Our
homebuilding operations have historically experienced seasonal
fluctuations. We typically experience the highest new home order
activity in the spring and summer months, although new order activity is highly
dependent on the number of active selling communities and the timing of new
community openings as well as other market factors. Because it
typically takes us three to six months to construct a new home, we typically
deliver a greater number of homes in the second half of
3
the
calendar year as the prior orders are converted to home
deliveries. As a result, our revenues from homebuilding operations
are generally higher in the second half of the calendar year, particularly in
the fourth quarter.
Sources
and Availability of Raw Materials
We,
either directly or through our subcontractors, purchase drywall, cement, steel,
lumber, insulation and the other building materials necessary to construct a
home. While these materials are generally widely available from a
variety of sources, from time to time we experience serious material shortages
on a localized basis, particularly during periods where the regions in which we
operate experience natural disasters that have a significant impact on existing
residential and commercial structures. During these periods, the
prices for these materials can substantially increase and our construction
process can be slowed.
Dollar
Value of Backlog
For a
discussion of the dollar value of our backlog, please see the discussion of
backlog in “Management’s Discussion and Analysis of Financial Condition and
Results of Operations” on page 26.
Competitive
Conditions in the Business
The
homebuilding industry is fragmented and highly competitive. We compete with
numerous other residential construction companies, including large national and
regional firms, for customers, land, financing, raw materials, skilled labor and
employees. We compete for customers primarily on the basis of the location,
design, quality and price of our homes and the availability of mortgage
financing. Some of our competitors have substantially larger operations and
greater financial resources than we do and as a result may have lower costs of
capital, labor and materials than us, and may be able to compete more
effectively for land acquisition opportunities.
Under
current market conditions, we have experienced intense price competition as many
builders seek to aggressively reduce their inventory levels and land holdings.
At the same time we are also competing with the resale of existing homes, rental
homes, the “short-sale” of almost new homes and foreclosures. All of these
factors have resulted in a substantial increase in the supply of homes available
for sale at reduced prices, which may continue or increase, making it more
difficult for us to sell our homes and to maintain our profit
margins. Many of our competitors are better capitalized and have
lower leverage than we do, which may position them to compete more effectively
on price (which can trigger impairments for us), better enable them to ride out
the current industry-wide downturn and allow them to compete more effectively
for land when conditions improve.
Government
Regulation
For a
discussion of the impact of government regulations on our business, please see
the risk factors included under the heading “Regulatory Risks” in the Risk
Factors section.
Financial
Services
Customer
Financing
As part
of our ongoing operations, we provide mortgage loans to our homebuyers through
our mortgage financing subsidiary, Standard Pacific
Mortgage. Standard Pacific Mortgage’s principal sources of financing
revenue are fees generated from loan originations, net gains on the sale of
loans and net interest income earned on loans during the period they are held
prior to sale. In addition to being a source of revenues, our
mortgage operations benefit our homebuyers and complement our homebuilding
operations by offering a dependable source of competitively priced financing,
staffed by a team of professionals experienced in the new home purchase process
and our sales and escrow procedures.
We sell
substantially all of the loans we originate in the secondary mortgage market,
with servicing rights released on a non-recourse basis. These sales
are generally subject to our obligation to repay gain on sale if the loan is
prepaid by the borrower within a certain time period following such sale, or to
repurchase the loan if, among other things, the loan purchaser’s underwriting
guidelines are not met or there is fraud in connection with the
loan. As of December 31, 2009, we had been required to repurchase or
pay make-whole premiums on 0.23% of the $5.6 billion total dollar value of the
loans ($2.2 billion of which represented non-full documentation loans) we
originated in the 2004-2009 period, and incurred approximately $3.5 million of
related losses ($3.3 million for non-full documentation loans) during this
period. However, as loan defaults in general increase, it is possible
that we will be required to make a materially higher level of loan repurchases
4
in the
future. Under such a scenario current reserves might prove to be
inadequate and we would be required to use additional cash and take additional
charges to reflect the higher level of repurchase activity.
We manage
the interest rate risk associated with making loan commitments and holding loans
for sale by preselling loans. Preselling loans consists of obtaining
commitments (subject to certain conditions) from third party investors to
purchase the mortgage loans while concurrently extending interest rate locks to
loan applicants. Before completing the sale to these investors,
Standard Pacific Mortgage finances these loans under its mortgage credit
facilities for a short period of time (typically for 15 to 30 days), while the
investors complete their administrative review of the applicable loan
documents. While preselling these loans reduces our risk, we remain
subject to risk relating to purchaser non-performance, particularly during
periods of significant market turmoil.
Title
Services
In Texas, we act as a title insurance
agent performing title examination services for our Texas homebuyers through our
title service subsidiary, SPH Title, Inc.
Employees
At
December 31, 2009, we had approximately 800 employees, a reduction of
approximately 500 employees from the prior year end. Of our employees
at the end of 2009, approximately 230 were executive, administrative and
clerical personnel, 240 were sales and marketing personnel, 190 were involved in
construction and project management, 75 were involved in new home warranty, and
65 worked in the mortgage operations. None of our employees are
covered by collective bargaining agreements, although employees of some of the
subcontractors that we use are represented by labor unions and may be subject to
collective bargaining agreements.
We
believe that our relations with our employees and subcontractors are
good.
|
ITEM 1A.
|
Discussion
of our business and operations included in this annual report on Form 10-K
should be read together with the risk factors set forth below. They
describe various risks and uncertainties to which we are or may become
subject. These risks and uncertainties, as well as other risks which
we cannot foresee at this time, have the potential to affect our business,
financial condition, results of operations, cash flows, strategies or prospects
in a material and adverse manner.
Market
and Economic Risks
Adverse
changes in general and local economic conditions have affected and may continue
to affect the demand for homes and reduce our earnings.
The
residential homebuilding industry is sensitive to changes in economic conditions
such as the level of employment, consumer confidence, consumer income,
availability of financing and interest rate levels. The national recession,
credit market disruption, high unemployment levels, declining home values, the
absence of home price stability, and the decreased availability of mortgage
financing have, among other factors, resulted in falling consumer confidence,
and adversely impacted the homebuilding industry and our operations and
financial condition. These conditions may continue or worsen. We can
provide no assurance that our strategies to address these challenges will be
successful.
We
are experiencing a significant and substantial downturn in homebuyer demand.
Continuation of this downturn may result in a continuing reduction in our
revenues, deterioration of our margins and additional impairments.
We are
experiencing a significant and substantial downturn in homebuyer
demand. Many of our competitors are aggressively liquidating
land and new home inventories by selling homes at significantly reduced prices.
At the same time we are also competing with the resale of existing homes, rental
homes, the “short-sale” of almost new homes and foreclosures. All of these
factors have resulted in a substantial increase in the supply of homes available
for sale at reduced prices, which may continue or increase, making it more
difficult for us to sell our homes and to maintain our profit
margins.
We
depend on the California market and, to a lesser extent, the Florida market. If
conditions in these markets continue or worsen, our sales and earnings may be
negatively impacted.
We
generate a significant amount of our revenues and profits in California. In
addition, a significant portion of our business, revenues and profits outside of
California are concentrated in Florida. While demand for new homes, and in many
instances home prices, have declined in substantially all of our markets, demand
and home prices over the last several years have generally declined more rapidly
in California and Florida, negatively impacting our profitability and financial
position. There can be no assurance that our profitability and financial
position will not be further impacted if the challenging conditions in these
markets continue or worsen. If buyers are unable to afford new homes in these
markets, prices will continue to decline, which will continue to harm our
profitability.
Customers
may be unwilling or unable to purchase our homes at times when
mortgage-financing costs are high or when credit is difficult to
obtain.
The
majority of our homebuyers finance their purchases through Standard Pacific
Mortgage or third-party lenders. In general, housing demand is adversely
affected by increases in interest rates and by decreases in the availability of
mortgage financing as a result of declining customer credit quality, tightening
of mortgage loan underwriting standards, or other issues. Many lenders have
significantly tightened their underwriting standards, are requiring higher
credit scores, substantial down payments, increased cash reserves, and have
eliminated or significantly limited many subprime and other alternative mortgage
products, including “jumbo” loan products, which are important to sales in many
of our California markets. In addition, the use of seller funded down
payment assistance programs was prohibited in late 2008. As a result of these
trends, the ability and willingness of prospective buyers to finance home
purchases or to sell their existing homes has been adversely affected, which has
adversely affected our operating results and profitability. These conditions may
continue or worsen.
The
market value and availability of land may fluctuate significantly, which could
decrease the value of our developed and undeveloped land holdings and limit our
ability to develop new communities.
The risk
of owning developed and undeveloped land can be substantial for us. The market
value of undeveloped land, buildable lots and housing inventories can fluctuate
significantly as a result of changing economic and market
conditions. We have experienced such conditions and this has resulted
in impairments of a number of our land positions and write-offs of some of our
land option deposits and pre-acquisition costs when we elect not to pursue or
continue projects. If current market conditions continue to
deteriorate, our competition adjusts their pricing strategy or if other
significant adverse changes in economic or market conditions occur, we may have
to impair additional land holdings and projects, write down our investments in
unconsolidated joint ventures, write off option deposits and pre-acquisition
costs, sell homes or land at a loss, and/or hold land or homes in inventory
longer than planned. In addition, inventory carrying costs can be significant,
particularly if inventory must be held for longer than planned, which can
trigger asset impairments in a poorly performing project or market.
Our
long-term success also depends in part upon the continued availability of
suitable land at acceptable prices. The availability of land for purchase at
favorable prices depends on a number of factors outside of our control,
including the risk of competitive over-bidding of land prices and restrictive
governmental regulation. If a sufficient amount of suitable land opportunities
do not become available, it could limit our ability to develop new communities,
increase land costs and negatively impact our sales and earnings.
The
homebuilding industry is highly competitive and, with more limited resources
than some of our competitors, we may not be able to compete
effectively.
The
homebuilding industry is fragmented and highly competitive. We compete with
numerous other residential construction companies, including large national and
regional firms, for customers, land, financing, raw materials, skilled labor and
employees. We compete for customers primarily on the basis of the location,
design, quality and price of our homes and the availability of mortgage
financing. Some of our competitors have substantially larger operations and
greater financial resources than we do and as a result may have lower costs of
capital, labor and materials than us, and may be able to compete more
effectively for land acquisition opportunities.
Under
current market conditions, we have experienced intense price competition as many
builders seek to aggressively reduce their inventory levels and land holdings.
At the same time we are also competing, directly or indirectly, with the resale
of existing homes, rental homes, the “short-sale” of almost new homes and
foreclosures. All of these factors have resulted in
6
a
substantial increase in the supply of homes available for sale at reduced
prices, which may continue or increase, making it more difficult for us to sell
our homes and to maintain our profit margins. Many of our competitors
are better capitalized and have lower leverage than we do, which may position
them to compete more effectively on price (which can trigger impairments for
us), better enable them to ride out the current industry-wide downturn and allow
them to compete more effectively for land when conditions
improve.
Operational
Risks
We
may be unable to obtain suitable bonding for the development of our
communities.
We
provide bonds to governmental authorities and others to ensure the completion of
our projects. If we are unable to provide required surety bonds for our
projects, our business operations and revenues could be adversely affected. As a
result of market conditions, surety providers have become increasingly reluctant
to issue new bonds and some providers are requesting credit enhancements (such
as cash deposits or letters of credit) in order to maintain existing bonds or to
issue new bonds. If we are unable to obtain required bonds in the future, or are
required to provide credit enhancements with respect to our current or future
bonds, our liquidity could be negatively impacted.
Labor
and material shortages could delay or increase the cost of home construction and
reduce our sales and earnings.
The
residential construction industry experiences serious labor and material
shortages from time to time, including shortages in qualified tradespeople, and
supplies of insulation, drywall, cement, steel and lumber. These labor and
material shortages can be more severe during periods of strong demand for
housing or during periods where the regions in which we operate experience
natural disasters that have a significant impact on existing residential and
commercial structures. From time to time, we have experienced volatile price
swings in the cost of labor and materials, including in particular the cost of
lumber, cement, steel and drywall. Shortages and price increases could cause
delays in and increase our costs of home construction, which in turn could harm
our operating results and profitability.
Severe
weather and other natural conditions or disasters may disrupt or delay
construction.
Severe
weather and other natural conditions or disasters, such as earthquakes,
landslides, hurricanes, tornadoes, droughts, floods, heavy or prolonged rain or
snow, and wildfires can negatively affect our operations by requiring us to
delay or halt construction or to perform potentially costly repairs to our
projects under construction and to unsold homes. Some scientists
believe that the rising level of carbon dioxide in the atmosphere is leading to
climate change and that climate change is increasing the frequency and severity
of weather related disasters. If true, we may experience increasing
negative weather related impacts to our operations in the future.
We
are subject to product liability and warranty claims arising in the ordinary
course of business, which can be costly.
As a
homebuilder, we are subject to construction defect and home warranty claims
arising in the ordinary course of business. These claims are common in the
homebuilding industry and can be costly. While we maintain product liability
insurance and generally seek to require our subcontractors and design
professionals to indemnify us for liabilities arising from their work, there can
be no assurance that these insurance rights and indemnities will be collectable
or adequate to cover any or all construction defect and warranty claims for
which we may be liable. For example, contractual indemnities can be difficult to
enforce, we are often responsible for applicable self-insured retentions
(particularly in markets where we include our subcontractors on our general
liability insurance and are prohibited from seeking indemnity for insured
claims), certain claims may not be covered by insurance or may exceed applicable
coverage limits, and one or more of our insurance carriers could become
insolvent. Additionally, the coverage offered by and availability of product
liability insurance for construction defects is limited and costly. There can be
no assurance that coverage will not be further restricted, become more costly or
even unavailable.
In
addition, we conduct a material portion of our business in California, one of
the most highly regulated and litigious jurisdictions in the United States,
which imposes a ten year, strict liability tail on most construction liability
claims. As a result, our potential losses and expenses due to
litigation, new laws and regulations may be greater than our competitors who
have smaller California operations.
We
rely on subcontractors to construct our homes and, in many cases, to obtain,
building materials. The failure of our subcontractors to properly
construct our homes, or to obtain suitable building materials, may be
costly.
We engage
subcontractors to perform the actual construction of our homes, and in many
cases, to obtain the necessary building materials. Despite our
quality control efforts, we may discover that our subcontractors were engaging
in improper construction practices or installing defective materials, like
Chinese drywall, in our homes. When we discover these issues we
repair the homes in accordance with our new home warranty. The cost
of satisfying our warranty obligations in these instances may be significant and
we may be unable to recover the cost of repair from subcontractors, suppliers
and insurers.
We are in
the process of repairing homes that we have confirmed contain Chinese
drywall. While we believe we have likely identified nearly all of the
homes we delivered that contain Chinese drywall, we delivered thousands of homes
during the timeframe that defective Chinese drywall was thought to have been
delivered to U.S. ports. We have inspected only a fraction of these
homes and therefore cannot definitively conclude that additional homes
containing Chinese drywall will not be identified. If additional
homes containing Chinese drywall are discovered, we may be required to spend
amounts in excess of our current reserves on repairs and our financial condition
may be negatively impacted. In addition, we have been named as a
defendant in multiple lawsuits related to Chinese drywall. These and
any additional future claims could also cause us to incur additional significant
costs.
Our
mortgage subsidiary may become obligated to repurchase loans it has sold in the
secondary mortgage market or may become subject to borrower
lawsuits.
While our
mortgage subsidiary generally sells the loans it originates within a short
period of time in the secondary mortgage market on a non-recourse basis, this
sale is subject to an obligation to repurchase the loan if, among other things,
the purchaser’s underwriting guidelines are not met or there is fraud in
connection with the loan. As of December 31, 2009, our mortgage subsidiary had
been required to repurchase or pay make-whole premiums on 0.23% of the $5.6
billion total dollar value of the loans it originated in the 2004-2009
period. If loan defaults in general increase, it is possible that our
mortgage subsidiary will be required to make a materially higher level of
repurchases in the future as the holders of defaulted loans scrutinize loan
files to seek reasons to require us to repurchase them. In such a
case our current reserves might prove to be inadequate and we would be required
to use additional cash and take additional charges to reflect the higher level
of repurchase activity, which could harm our financial condition and results of
operations.
In
addition, a number of homebuyers have initiated lawsuits against builders and
lenders claiming, among other things, that builders pressured the homebuyers to
make inaccurate statements on loan applications, that the lenders failed to
correctly explain the terms of adjustable rate and interest-only loans, and/or
that the lender financed home purchases for unsuitable buyers resulting
indirectly in a diminution in value of homes purchased by more appropriately
qualified buyers. While we have experienced only a small number of
such lawsuits to date and are currently unaware of any regulatory investigation
into our mortgage operations, if loan defaults increase, the possibility of
becoming subject to additional lawsuits and/or regulatory investigations becomes
more likely. If our mortgage subsidiary becomes the subject of significant
borrower lawsuits or regulatory authority action our financial results may be
negatively impacted.
We
are dependent on the services of key employees and the loss of any substantial
number of these individuals or an inability to hire additional personnel could
adversely affect us.
Our
success is dependent upon our ability to attract and retain skilled employees,
including personnel with significant management and leadership skills.
Competition for the services of these individuals in many of our operating
markets can be intense and will likely increase substantially if and when market
conditions improve. If we are unable to attract and retain skilled employees, we
may be unable to accomplish the objectives set forth in our business
plan.
We
may not be able to successfully identify, complete and integrate acquisitions,
which could harm our profitability and divert management resources.
We may
from time to time acquire other homebuilders. Successful acquisitions require us
to correctly identify appropriate acquisition candidates and to integrate
acquired operations and management with our own. Should we make an error in
judgment when identifying an acquisition candidate, should the acquired
operations not perform as anticipated, or should we fail to successfully
integrate acquired operations and management, we will likely fail to realize the
benefits we intended to derive from the acquisition and may suffer other adverse
consequences. Acquisitions involve a number of other risks, including the
diversion of the attention of our management and corporate staff from operating
our existing business and
8
potential
charges to earnings in the event of any write-down or write-off of goodwill and
other assets recorded in connection with acquisitions. We can give no assurance
that we will be able to successfully identify, complete and integrate
acquisitions.
Regulatory
Risks
We
are subject to extensive government regulation, which can increase costs and
reduce profitability.
Our
homebuilding operations are subject to extensive federal, state and local
regulation, including environmental, building, worker health and safety, zoning
and land use regulation. This regulation affects all aspects of the homebuilding
process and can substantially delay or increase the costs of homebuilding
activities, even on land for which we already have approvals. During the
development process, we must obtain the approval of numerous governmental
authorities that regulate matters such as:
|
·
|
permitted
land uses, levels of density and architectural
designs;
|
|
·
|
the
installation of utility services, such as water and waste
disposal;
|
|
·
|
the
dedication of acreage for open space, parks, schools and other community
services; and
|
|
·
|
the
preservation of habitat for endangered species and wetlands, storm water
control and other environmental
matters.
|
The
approval process can be lengthy, can be opposed by consumer or environmental
groups, and can cause significant delays or permanently halt the development
process. Delays or a permanent halt in the development process can cause
substantial increases to development costs or cause us to abandon the project
and to sell the affected land at a potential loss, which in turn could harm our
operating results.
In
addition, new housing developments are often subject to various assessments for
schools, parks, streets, highways and other public improvements. The costs of
these assessments can be substantial and can cause increases in the effective
prices of our homes, which in turn could reduce our sales and/or
profitability.
Currently,
there is a variety of new energy related legislation being enacted, or
considered for enactment, at the federal, state and local level. For
instance, California recently adopted a state-wide building code that imposes
mandatory energy efficiency standards on new homes constructed within the state
that will increase our cost of construction. Similarly, the federal
congress is considering a wide array of energy related initiatives, from carbon
“cap and trade” to a federal energy efficiency building code that would increase
energy efficiency requirements for new homes between 30 and 50
percent. If all or part of this proposed federal legislation were to
be enacted, the cost of home construction could increase significantly, which in
turn could reduce our sales and/or profitability.
Much of
this proposed legislation is in response to concerns about climate
change. As climate change concerns grow, legislation and regulatory
activity of this nature is expected to continue and become more
onerous. Similarly, energy related initiatives will impact a wide
variety of other companies throughout the United States and world and because
our operations are heavily dependent on significant amounts of raw materials,
such as lumber, steel, and concrete, these initiatives could have an indirect
adverse effect on our operations and profitability to the extent the suppliers
of our materials are burdened with expensive cap and trade and similar energy
related regulations.
Our
mortgage operations are also subject to federal, state, and local regulation,
including eligibility requirements for participation in federal loan programs
and various consumer protection laws. Our title insurance agency operations are
subject to applicable insurance and other laws and regulations. Failure to
comply with these requirements can lead to administrative enforcement actions,
the loss of required licenses and other required approvals, claims for monetary
damages or demands for loan repurchase from investors, and rescission or voiding
of the loan by the consumer.
States,
cities and counties in which we operate may adopt slow growth initiatives
reducing our ability or increasing our costs to build in these areas, which
could harm our future sales and earnings.
Several
states, cities and counties in which we operate have in the past approved, or
approved for inclusion on their ballot, various “slow growth” or “no growth”
initiatives and other ballot measures that could negatively impact the land we
own, as well as, the availability of additional land and building opportunities
within those localities. For instance, in
9
November
2010, Florida voters will be asked to approve a measure that will generally
prevent changes to entitlements on a parcel of land without voter
approval. Approval of this measure or other slow or no growth
measures would increase the cost of land and reduce our ability to open new home
communities and to build and sell homes in the affected markets and would create
additional costs and administration requirements, which in turn could harm our
future sales and earnings.
Increased
regulation of the mortgage industry could harm our future sales and
earnings.
The
mortgage industry is under intense scrutiny and is facing increasing regulation
at the federal, state and local level. Changes in regulation have the
potential to negatively impact the full spectrum of mortgage related
activity. Potential changes to federal laws and regulations could
have the effect of limiting the activities of the Federal National Mortgage
Association and the Federal Home Loan Mortgage Corporation, the entities that
provide liquidity to the secondary mortgage market, which could lead to
increases in mortgage interest rates. At the same time, changes to
the Federal Housing Administration’s rules to require increased Borrower FICO
scores, increased down payment amounts, and potentially limiting the amount of
permitted seller concessions, lessen the number of buyers able to finance a new
home. All of these regulatory activities reduce the number of
potential buyers who qualify for the financing necessary to purchase our homes,
which could harm our future sales and earnings.
Changes
to tax laws could make homeownership more expensive.
Current
tax laws generally permit significant expenses associated with owning a home,
primarily mortgage interest expense and real estate taxes, to be deducted for
the purpose of calculating an individual’s federal, and in many cases, state,
taxable income. If the federal or state governments were to change
applicable tax law to eliminate or reduce these benefits, the after-tax cost of
owning a home could increase significantly. This would harm our
future sales and earnings.
Also,
while difficult to quantify, our 2009 home sales were likely positively impacted
by federal and state tax credits made available to first-time and other
qualifying homebuyers. Many of these tax credits have expired or are
scheduled to expire in 2010, which could negatively impact home sales and our
results of operations.
Financing
Risks
We
may be unable to repay, renew or extend our outstanding debt instruments when
they are due.
We have a
significant amount of debt, including an aggregate of approximately $1,131.4
million in senior notes, senior subordinated notes and term loans that mature
between 2010 and 2016. There can be no assurance that we will be able to repay
these debt arrangements or extend or renew them on terms acceptable to us, or at
all. If we are unable to repay, renew or extend these debt arrangements, it
could adversely affect our liquidity and capital resources and financial
condition.
We
are currently unable to meet the conditions contained in our debt instruments
that must be satisfied to incur most additional indebtedness and make restricted
payments.
Our debt
instruments impose restrictions on our operations, financing, investments and
other activities. The indentures for our outstanding notes provide that the
Company must either stay below a maximum leverage ratio or maintain a minimum
interest coverage ratio in order to be permitted to incur additional
indebtedness beyond limited categories of indebtedness specified in the
indentures. The indentures also provide that, in order to make restricted
payments (including dividends and distributions on stock or investments beyond
limited categories of investments specified in the indentures), the Company must
satisfy the ratio requirements for incurrence of additional debt and generate
(by a formula based on 50% of consolidated net income) a basket for such
additional restricted payments. As of December 31, 2009, we did not
satisfy the leverage condition or the interest coverage
condition. There can be no assurance that we will be able to satisfy
these conditions in the future. If we are unable to comply with these
conditions, we will be precluded from incurring additional borrowings, subject
to certain limitations, and will be precluded from making restricted payments,
other than through funds available from our unrestricted
subsidiaries.
We
may need additional funds, and if we are unable to obtain these funds, we may
not be able to operate our business as planned.
Our
operations require significant amounts of cash. Our
requirements for additional capital, whether to finance operations or to
refinance existing obligations, fluctuate as market conditions and our financial
performance and operations change. During 2009, we terminated our
revolving credit facility, which means that we must principally rely on our cash
reserves and future cash flows to meet our short-term cash needs. The
availability of additional capital, whether from private capital sources
(including banks) or the public capital markets, fluctuates as our financial
condition and market conditions in general change. There may be times when the
private capital markets and the public debt or equity markets lack sufficient
liquidity or when our securities cannot be sold at attractive prices, in which
case we would not be able to access capital from these sources. In addition, a
weakening of our financial condition or deterioration in our credit ratings
could adversely affect our ability to obtain necessary funds.
Even if
available, additional financing could be costly or have adverse consequences.
For instance, if additional funds are raised through the issuance of stock,
dilution to stockholders will result, particularly in light of our stock price.
In addition, our certificate of incorporation also authorizes our board of
directors to issue new series of common stock and preferred stock without
stockholder approval. If any such series were created, depending on the rights
and terms of any new series created, and the reaction of the market to the
series, the rights or the value of our common stock could be negatively
affected. If additional funds are raised through the incurrence of debt, we will
incur increased debt servicing costs and may become subject to additional
restrictive financial and other covenants. We can give no assurance as to the
terms or availability of additional capital. If we are not successful in
obtaining or refinancing capital when needed, it could adversely impact our
ability to operate our business effectively, which could reduce our sales and
earnings, and adversely impact our financial position.
We
currently have significant amounts invested in unconsolidated joint ventures
with independent third parties in which we have less than a controlling
interest. These investments are highly illiquid and have significant
risks.
We
participate in unconsolidated homebuilding and land development joint ventures
with independent third parties in which we have less than a controlling
interest. At December 31, 2009, we had an aggregate of $40.4 million
invested in these joint ventures, which had outstanding borrowings recourse to
us of approximately $38.8 million and nonrecourse borrowings of approximately
$178.4 million.
While
these joint ventures provide us with a means of accessing larger land parcels
and lot positions, they are subject to a number of risks, including the
following:
|
·
|
Restricted Payment Risk.
Our public note indentures prohibit us from making restricted
payments, including investments in joint ventures, when we are unable to
meet either a leverage condition or an interest coverage condition and
when making such a payment will cause us to exceed a basket limitation. As
of December 31, 2009, we did not satisfy the leverage condition or the
interest coverage condition. As a result, we are unable to make payments
to satisfy our joint venture obligations, other than through funds
available from our unrestricted subsidiaries. If we become unable to fund
our joint venture obligations this could result in, among other things,
defaults under our joint venture operating agreements, loan agreements,
and credit enhancements.
|
|
·
|
Entitlement Risk.
Certain of our joint ventures acquire parcels of unentitled raw
land. If the joint venture is unable to timely obtain entitlements at a
reasonable cost, project delay or even project termination may occur
resulting in an impairment of the value of our
investment.
|
|
·
|
Development Risk. The
projects we build through joint ventures are often larger and have a
longer time horizon than the typical project developed by our wholly-owned
homebuilding operations. Time delays associated with obtaining
entitlements, unforeseen development issues, unanticipated labor and
material cost increases, and general market deterioration and other
changes are more likely to impact larger, long-term projects, all of which
may negatively impact the profitability of these ventures and our
proportionate share of income.
|
|
·
|
Financing Risk. There
are currently a limited number of sources willing to provide acquisition,
development and construction financing to land development and
homebuilding joint ventures. Due to current market conditions, it may be
difficult or impossible to obtain financing for our joint ventures on
commercially reasonable terms, or to refinance existing borrowings as such
borrowings mature. As a result, we may
be
|
|
|
required
to expend corporate funds to finance acquisition and development and/or
construction costs following termination or step-down of joint venture
financing that the joint venture is unable to restructure, extend, or
refinance with another third party lender. In addition, our
ability to expend such funds to or for the joint venture is limited as a
result of the restricted payment risk discussed
above.
|
|
·
|
Contribution Risk.
Under credit enhancements that we typically provide with respect to joint
venture borrowings, we and our partners could be required to make
additional unanticipated investments in these joint ventures, either in
the form of capital contributions or loan repayments, to reduce such
outstanding borrowings. We may have to make additional
contributions that exceed our proportional share of capital if our
partners fail to contribute any or all of their share. While in
most instances we would be able to exercise remedies available under the
applicable joint venture documentation if a partner fails to contribute
its proportional share of capital, our partner’s financial condition may
preclude any meaningful cash recovery on the
obligation.
|
|
·
|
Completion Risk. We
often sign a completion agreement in connection with obtaining financing
for our joint ventures. Under such agreements, we may be compelled to
complete a project even if we no longer have an economic interest in the
property.
|
|
·
|
Illiquid Investment
Risk. We lack a controlling interest in our joint ventures and
therefore are generally unable to compel our joint ventures to sell
assets, return invested capital, require additional capital contributions
or take any other action without the vote of at least one or more of our
venture partners. This means that, absent partner agreement, we will be
unable to liquidate our joint venture investments to generate
cash.
|
|
·
|
Partner Dispute. If we
have a dispute with one of our joint venture partners and are unable to
resolve it, a buy-sell provision in the applicable joint venture agreement
could be triggered or we may otherwise pursue a negotiated settlement
involving the unwinding of the venture. In either case, we may sell our
interest to our partner or purchase our partner’s interest. If we sell our
interest, we will forgo the profit we would have otherwise earned with
respect to the joint venture project and may be required to forfeit our
invested capital and/or pay our partner to release us from our joint
venture obligations. If we are required to purchase our partner’s
interest, we will be required to fund this purchase, as well as the
completion of the project, with corporate level capital and to consolidate
the joint venture project onto our balance sheet, which could, among other
things, adversely impact our liquidity, our leverage and other financial
conditions or covenants.
|
|
·
|
Consolidation Risk. The
accounting rules for joint ventures are complex and the decision as to
whether it is proper to consolidate a joint venture onto our balance sheet
is fact intensive. If the facts concerning an unconsolidated joint venture
were to change and a triggering event under applicable accounting rules
were to occur, we might be required to consolidate previously
unconsolidated joint ventures onto our balance sheet which could adversely
impact our leverage and other financial conditions or
covenants.
|
Other
Risks
Our principal stockholder has the
ability to exercise significant influence over the composition of our Board of
Directors and matters requiring stockholder approval.
As of
December 31, 2009, MP CA Homes LLC held 49% of the voting power of our voting
stock. Pursuant to the stockholders' agreement that we entered into
with MP CA Homes LLC on June 27, 2008, MP CA Homes LLC is entitled to designate
a number of directors to serve on our Board of Directors as is proportionate to
the total voting power of its voting stock (up to one less than a majority), and
at least one MP CA Homes LLC designated director shall be a member of each
committee of the board (subject to limited exceptions), giving MP CA Homes LLC
the ability to exercise significant influence on the composition and actions of
our board and its committees. In addition, this large voting block
may have a significant or decisive effect on the approval or disapproval of
matters requiring approval of our stockholders, including any amendment to our
certificate of incorporation, any proposed merger, consolidation or sale of all
or substantially all of our assets and other corporate transactions. The
interests of MP CA Homes LLC in these other matters may not always coincide with
the interests of our other stockholders. In addition, the ownership of
such a large block of our voting power and the right to designate directors by
MP CA Homes LLC may discourage someone from making a significant equity
investment in us, even if we needed the investment to operate our business, or
could be a significant factor in delaying or preventing a change of control
transaction that other stockholders may deem to be in their best interests, such
as a transaction in which the other stockholders would receive a premium for
their shares over their current trading prices.
We may not be
able to realize the benefit of our net deferred tax asset.
We
incurred significant losses in 2007, 2008 and 2009. As of the date
hereof, we had carried back to prior taxable periods the maximum permitted
amount of these losses. Following exhaustion of these carrybacks, we
were left with a net deferred tax asset of approximately $535 million (excluding
the $9 million deferred tax asset related to our interest rate swap) that is
potentially available to offset taxable income in future periods. The
$535 million net deferred tax asset has been fully reserved against by a
corresponding deferred tax asset valuation allowance of the same amount. Our
ability to realize the benefit, if any, of our deferred tax asset is dependent,
among other things, upon the interplay between applicable tax laws (including
Internal Revenue Code Section 382 discussed below), our ability to generate
taxable income in the future, and the timing of our disposition of assets that
contain unrealized built-in losses.
Section
382 contains rules that limit the ability of a company that undergoes an
ownership change to utilize net operating loss carryforwards and built-in losses
after the ownership change. We underwent a change in ownership for
purposes of Section 382 following completion of MP CA Homes LLC’s initial
investment in the Company on June 27, 2008. Approximately $190
million of our $535 million net deferred tax asset represents unrealized
built-in losses. Future realization of this $190 million of
unrealized built-in losses may be limited under Section 382 depending on, among
other things, when, and at what price, we dispose of the underlying
assets. In addition, all or a portion of the $345 million portion of
the net deferred tax asset not currently limited by Section 382 may become
similarly limited if we undergo another Section 382 ownership change during a
period of time that the Company is deemed a loss corporation under Section
382. The limitations of Section 382 may ultimately have the effect of
significantly limiting our ability to recognize a benefit from our deferred tax
asset. Significant judgment is required in determining the future
realization of these potential deductions, and as a result, actual results may
differ materially from our estimates.
|
ITEM 1B.
|
None.
|
ITEM 2.
|
We lease
office facilities for our homebuilding and mortgage operations. We
lease our corporate headquarters, which is located in Irvine,
California. The lease on this facility, which also includes space for
our Orange County division consists of approximately 26,000 square feet and
expires in 2012. We lease approximately 42 other properties for our
other division offices and design centers. For information about land
owned or controlled by us for use in our homebuilding activities, please refer
to Item 7, “Management’s Discussion and Analysis of Financial Condition and
Results of Operations” on pages 26-27.
|
ITEM 3.
|
Chinese
Drywall
Like many
other homebuilders, we have learned that some of our subcontractors installed
drywall manufactured in China in Company constructed homes. Reports have
indicated that certain Chinese drywall, thought to be delivered to the United
States primarily during 2005 and 2006, may emit various sulfur-based gases that,
among other things, have the potential to corrode non-ferrous metals (copper,
silver, etc.). We have conducted an internal review in an attempt to determine
how many of the homes that we constructed may be impacted. To date, it appears
that a subset of homes with drywall dates from February 2006 through February
2007 in five of our Florida communities contain some high-sulfur Chinese
drywall. We have inspected all but about 20 of the homes that we
believe are likely to be impacted in these communities based on their location
and drywall installation dates. Approximately 150 have been
confirmed, and we are still seeking access to the remaining 20 to complete our
investigation. If we were to locate high sulfur drywall outside of
these communities and drywall installation dates, we would broaden the scope of
our investigation. We have notified homeowners of the results of our
inspections, and have offered to make comprehensive repairs, including removing
and replacing all drywall and wiring. Over 70 homeowners have
requested repairs and we have entered into over 30 settlement agreements to
date. We will continue to negotiate additional settlements as we make
repairs and will work through the group as quickly and efficiently as
possible. Although we are encouraging other homeowners to allow us to
make repairs rather than engaging in litigation, approximately 50 of these
homeowners have joined a federal class action lawsuit or filed suit in state
court, seeking property and, in some cases, bodily injury
damages. Some of these already have agreed to allow us to make
repairs. We plan to vigorously defend litigation involving
Chinese drywall, while seeking to make repairs wherever possible.
In
addition, various other claims and actions that we consider normal to our
business have been asserted and are pending against us. We do not believe that
any of such claims and actions will have a material adverse effect upon our
results of operations or financial position.
|
ITEM 4.
|
Executive
Officers of the Registrant
Our
executive officers’ ages, positions and brief accounts of their business
experience as of March 3, 2010, are set forth below.
|
Name
|
Age
|
Position
|
||
|
Kenneth
L. Campbell
|
53
|
Chief
Executive Officer, President, and Director
|
||
|
Scott
D. Stowell
|
52
|
Chief
Operating Officer
|
||
|
John
M. Stephens
|
41
|
Senior
Vice President and Chief Financial Officer
|
||
|
John
P. Babel
|
39
|
Senior
Vice President, General Counsel and Secretary
|
||
|
Todd
J. Palmaer
|
51
|
President,
California Region
|
||
|
Kathleen
R. Wade
|
56
|
President,
Southwest and Southeast Regions
|
Kenneth
L. Campbell has served as Chief
Executive Officer and President since December 2008 and as a Director of
the Company since July 2008. From July 2007 to May 2009, Mr. Campbell
served as a partner of MatlinPatterson Global Advisers, LLC, a private equity
firm and an affiliate of our largest shareholder. From May 2006 to
May 2007, Mr. Campbell served as Chief Executive Officer and Director of Ormet
Corporation, a U.S. producer of aluminum. Prior to that, Mr. Campbell
served as Chief Financial Officer of RailWorks Corporation, a provider of track
and transit systems construction and maintenance services, from December 2003 to
May 2006. Before joining MatlinPatterson, Mr. Campbell spent a period
of over twenty years serving in various restructuring roles at companies with
significant operational and/or financial difficulties.
Scott D. Stowell has served
as Chief Operating Officer since May 2007. From September 2002 to May
2007, Mr. Stowell served as President of our Southern California
Region. From April 1996 until September 2002, Mr. Stowell served as
President of our Orange County division. Mr. Stowell joined the
Company in 1986 as a project manager.
John M. Stephens has served
as Senior Vice President since May 2007 and as our Chief Financial Officer since
February 2009. From November 1996 until February 2009, Mr. Stephens
served as our Corporate Controller and as Vice President from October 2002
through May 2007. In addition, Mr. Stephens served as Treasurer from
May 2001 until October 2002 and as Assistant Treasurer from December 1997 until
May 2001. Prior to joining the Company, Mr. Stephens was an audit
manager with an international accounting firm.
John P. Babel has served as
Senior Vice President, General Counsel and Secretary since February
2009. From October 2002 until February 2009, Mr. Babel served as our
Associate General Counsel, as Senior Vice President from October 2008 to
February 2009, and as Vice President from February 2005 through October
2008. Prior to joining the Company, Mr. Babel was an associate with
the international law firm of Gibson, Dunn & Crutcher LLP.
Todd J. Palmaer has served as
President of our California Region since July 2008. From May 2007 to July 2008,
Mr. Palmaer served as President of our Southern California
Region. From September 2002 until May 2007, Mr. Palmaer served as
President of our Orange County division. Mr. Palmaer joined the Company in 1999
as President of our San Diego division.
Kathleen R. Wade has served
as President of our Southwest Region since November 2002 and as President of our
Southeast Region since April 2009. From December 2000 until October 2002, Ms.
Wade served as Chief Executive Officer of our Arizona division and as President
of this division from September 1998 to December 2000. Prior to joining Standard
Pacific in 1998, Ms. Wade served as President of the Arizona division of UDC
Homes and, prior to that, as Co-CEO of Continental Homes, a publicly traded
homebuilder.
PART
II
Our
shares of common stock are listed on the New York Stock Exchange under the
symbol “SPF.” The following table sets forth, for the fiscal quarters
indicated, the reported high and low intra-day sales prices per share of our
common stock as reported on the New York Stock Exchange Composite Tape and the
common dividends paid per share.
|
Year
Ended December 31,
|
|||||||||||||||||||
|
2009
|
2008
|
||||||||||||||||||
|
High
|
Low
|
Dividend
|
High
|
Low
|
Dividend
|
||||||||||||||
|
Quarter Ended
|
|||||||||||||||||||
|
March
31
|
$
|
2.07
|
$
|
0.65
|
$
|
―
|
$
|
5.55
|
$
|
1.47
|
$
|
―
|
|||||||
|
June
30
|
2.74
|
0.85
|
―
|
6.50
|
2.17
|
―
|
|||||||||||||
|
September
30
|
4.59
|
1.86
|
―
|
6.85
|
2.87
|
―
|
|||||||||||||
|
December
31
|
3.83
|
2.84
|
―
|
5.25
|
1.22
|
―
|
|||||||||||||
For
further information on our dividend policy, see “Management’s Discussion and
Analysis of Financial Condition and Results of Operations—Liquidity and Capital
Resources.”
As of
March 3, 2010, the number of record holders of our common stock was
627.
We did
not repurchase any shares during the three months ended December 31,
2009.
The
following graph shows a five-year comparison of cumulative total returns to
stockholders for the Company, as compared with the Standard & Poor’s 500
Composite Stock Index and the Dow Jones Industry Group-U.S. Home Construction
Index. The graph assumes reinvestment of all dividends.
Comparison
of Five-Year Cumulative Total Stockholders’ Return
Among
Standard Pacific Corp., The Standard & Poor’s 500 Composite Stock Index
and
the
Dow Jones Industry Group-U.S. Home Construction Index
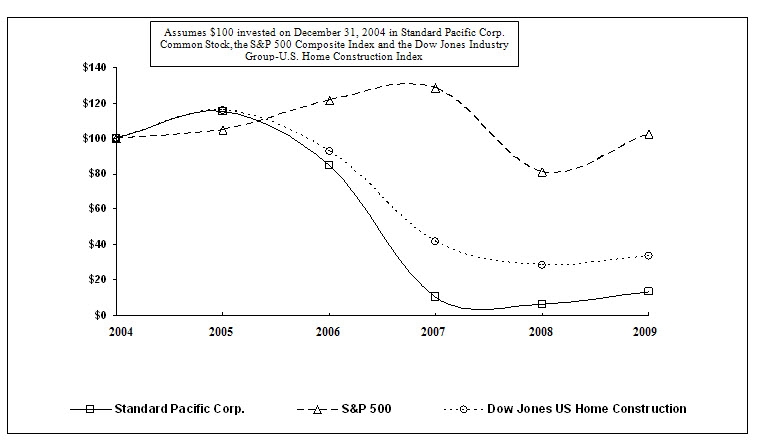
The above
graph is based upon common stock and index prices calculated as of year-end for
each of the last five calendar years. The Company’s common stock
closing price on December 31, 2009 was $3.74 per share. On
March 3, 2010 the Company’s common stock closed at $4.45 per
share. The stock price performance of the Company’s common stock
depicted in the graph above represents past performance only and is not
necessarily indicative of future performance.
|
ITEM 6.
|
The following should
be read in conjunction with our consolidated financial statements and related
notes included elsewhere in this Form 10-K. On September 3, 2008, we
completed a common stock rights offering. All prior period share and
per share amounts have been restated to reflect the rights offering bonus
element. In addition, all years and periods presented have been
reclassified to reflect the adoption of Statement of Financial Accounting
Standards No. 160, later codified in ASC 810-10, “Noncontrolling Interests in
Consolidated Financial Statements” and Staff Position No. APB 14-1, later
codified in ASC 470-20, “Debt
with Conversion and Other Options.” Please see Note 2.x. of
the accompanying consolidated financial statements for further
discussion.
|
Year
Ended December 31,
|
||||||||||||||||||
|
2009
|
2008
|
2007
|
2006
|
2005
|
||||||||||||||
|
(Dollars
in thousands, except per share amounts)
|
||||||||||||||||||
|
Revenues:
|
||||||||||||||||||
|
Homebuilding
(1)
|
$
|
1,166,397
|
$
|
1,535,616
|
$
|
2,888,833
|
$
|
3,740,470
|
$
|
3,893,019
|
||||||||
|
Financial
Services
|
13,145
|
13,587
|
16,677
|
24,866
|
17,359
|
|||||||||||||
|
Total
revenues from continuing operations
|
$
|
1,179,542
|
$
|
1,549,203
|
$
|
2,905,510
|
$
|
3,765,336
|
$
|
3,910,378
|
||||||||
|
Pretax
Income (Loss):
|
||||||||||||||||||
|
Homebuilding
(1)(2)
|
$
|
(111,068)
|
$
|
(1,237,840)
|
$
|
(846,586)
|
$
|
220,812
|
$
|
703,164
|
||||||||
|
Financial
Services
|
1,586
|
1,016
|
2,293
|
8,211
|
6,314
|
|||||||||||||
|
Pretax
income (loss) from continuing operations
|
$
|
(109,482)
|
$
|
(1,236,824)
|
$
|
(844,293)
|
$
|
229,023
|
$
|
709,478
|
||||||||
|
Net Income
(Loss):
|
||||||||||||||||||
|
Income
(loss) from continuing operations
|
$
|
(13,217)
|
$
|
(1,231,329)
|
$
|
(695,290)
|
$
|
146,093
|
$
|
439,950
|
||||||||
|
Income
(loss) from discontinued operations
|
(569)
|
(2,286)
|
(72,090)
|
(22,400)
|
1,034
|
|||||||||||||
|
Net
income (loss)
|
$
|
(13,786)
|
$
|
(1,233,615)
|
$
|
(767,380)
|
$
|
123,693
|
$
|
440,984
|
||||||||
|
Basic
Earnings (Loss) Per Common Share:
|
||||||||||||||||||
|
Continuing
operations
|
$
|
(0.06)
|
$
|
(9.12)
|
$
|
(9.63)
|
$
|
2.01
|
$
|
5.84
|
||||||||
|
Discontinued
operations
|
―
|
(0.02)
|
(1.00)
|
(0.31)
|
0.01
|
|||||||||||||
|
Basic
earnings (loss) per common share
|
$
|
(0.06)
|
$
|
(9.14)
|
$
|
(10.63)
|
$
|
1.70
|
$
|
5.85
|
||||||||
|
Diluted
Earnings (Loss) Per Common Share:
|
||||||||||||||||||
|
Continuing
operations
|
$
|
(0.06)
|
$
|
(9.12)
|
$
|
(9.63)
|
$
|
1.97
|
$
|
5.67
|
||||||||
|
Discontinued
operations
|
―
|
(0.02)
|
(1.00)
|
(0.30)
|
0.01
|
|||||||||||||
|
Diluted
earnings (loss) per common share
|
$
|
(0.06)
|
$
|
(9.14)
|
$
|
(10.63)
|
$
|
1.67
|
$
|
5.68
|
||||||||
|
Weighted
Average Common Shares Outstanding:
|
||||||||||||||||||
|
Basic
|
95,623,851
|
81,439,248
|
72,157,394
|
72,644,368
|
75,357,074
|
|||||||||||||
|
Diluted.
|
95,623,851
|
81,439,248
|
72,157,394
|
74,213,185
|
77,704,823
|
|||||||||||||
|
Weighted
Average If-Converted Preferred
|
||||||||||||||||||
|
Shares
Outstanding: (3)
|
147,812,786
|
53,523,829
|
―
|
―
|
―
|
|||||||||||||
|
Balance
Sheet and Other Financial Data:
|
||||||||||||||||||
|
Homebuilding
cash (including restricted cash)
|
$
|
602,222
|
$
|
626,379
|
$
|
219,141
|
$
|
17,356
|
$
|
18,796
|
||||||||
|
Total
assets
|
$
|
1,861,011
|
$
|
2,252,488
|
$
|
3,401,904
|
$
|
4,502,941
|
$
|
4,280,842
|
||||||||
|
Homebuilding
debt (4)
|
$
|
1,158,626
|
$
|
1,486,437
|
$
|
1,747,730
|
$
|
1,953,880
|
$
|
1,571,554
|
||||||||
|
Financial
services debt
|
$
|
40,995
|
$
|
63,655
|
$
|
164,172
|
$
|
250,907
|
$
|
123,426
|
||||||||
|
Stockholders'
equity
|
$
|
435,798
|
$
|
407,941
|
$
|
1,034,279
|
$
|
1,764,370
|
$
|
1,739,159
|
||||||||
|
Stockholders'
equity per common share (5)
|
$
|
4.30
|
$
|
4.40
|
$
|
15.95
|
$
|
27.39
|
$
|
25.91
|
||||||||
|
Pro
forma stockholders' equity per common share (6)
|
$
|
1.75
|
$
|
1.70
|
$
|
15.95
|
$
|
27.39
|
$
|
25.91
|
||||||||
|
Cash
dividends declared per common share
|
$
|
―
|
$
|
―
|
$
|
0.12
|
$
|
0.16
|
$
|
0.16
|
||||||||
|
(1)
|
Excludes
our Tucson and San Antonio divisions, which are classified as discontinued
operations.
|
|
(2)
|
The
2009, 2008, 2007 and 2006 homebuilding pretax income (loss) includes
pretax impairment charges totaling $71.1 million, $1,153.5 million, $984.6
million and $334.9 million, respectively. (Please see Item 7,
“Management’s Discussion and Analysis of Financial Condition and Results
of Operations—Results of Operations” and Notes 2, 4 and 13 of the
accompanying Consolidated Financial Statements for further
discussion).
|
|
(3)
|
In
June 2008 and September 2008, we issued 125.0 million and 22.8 million,
respectively, equivalent shares of common stock (in the form of preferred
stock) in connection with the Investment Agreement with MP CA Homes LLC,
an affiliate of MatlinPatterson Global Advisers LLC. If the
preferred stock was converted to common stock, the total weighted average
common shares outstanding as of December 31, 2009 and 2008 would have been
243.4 million and 135.0 million,
respectively.
|
|
(4)
|
Homebuilding
debt includes the indebtedness related to liabilities from inventories not
owned of $1.9 million, $0, $11.4 million, $13.4 million and $43.2 million,
as of December 31, 2009, 2008, 2007, 2006 and 2005,
respectively.
|
|
(5)
|
At
December 31, 2009, 2008 and 2007, common shares outstanding exclude 3.9
million, 7.8 million and 7.8 million shares, respectively, issued under a
share lending facility related to our 6% convertible senior subordinated
notes issued September 28, 2007 and 147.8 million common equivalent shares
issued during the year ended December 31, 2008 in the form of preferred
stock to MP CA Homes LLC, an affiliate of MatlinPatterson Global Advisers
LLC.
|
|
(6)
|
At
December 31, 2009 and 2008, pro forma common shares outstanding include
147.8 million preferred shares outstanding on an if-converted
basis. In addition, at December 31, 2009, 2008 and 2007, pro
forma common shares outstanding exclude 3.9 million, 7.8 million and 7.8
million shares, respectively, issued under a share lend facility related
to our 6% convertible senior subordinated
notes.
|
The
following discussion and analysis should be read in conjunction with the section
“Selected Financial Data” and our consolidated financial statements and the
related notes included elsewhere in this Form 10-K.
Results
of Operations
Selected
Financial Information
|
Year
Ended December 31,
|
|||||||||||||||
|
2009
|
2008
|
2007
|
|||||||||||||
|
(Dollars
in thousands, except per share amounts)
|
|||||||||||||||
|
Homebuilding:
|
|||||||||||||||
|
Home
sale revenues
|
$
|
1,060,502
|
$
|
1,521,640
|
$
|
2,607,824
|
|||||||||
|
Land
sale revenues
|
105,895
|
13,976
|
281,009
|
||||||||||||
|
Total
revenues
|
1,166,397
|
1,535,616
|
2,888,833
|
||||||||||||
|
Cost
of home sales
|
(907,058)
|
(2,107,758)
|
(2,520,264)
|
||||||||||||
|
Cost
of land sales
|
(117,517)
|
(124,786)
|
(568,539)
|
||||||||||||
|
Total
cost of sales
|
(1,024,575)
|
(2,232,544)
|
(3,088,803)
|
||||||||||||
|
Gross
margin
|
141,822
|
(696,928)
|
(199,970)
|
||||||||||||
|
Gross
margin percentage
|
12.2%
|
(45.4%)
|
(6.9%)
|
||||||||||||
|
Selling,
general and administrative expenses
|
(191,488)
|
(305,480)
|
(387,981)
|
||||||||||||
|
Loss
from unconsolidated joint ventures
|
(4,717)
|
(151,729)
|
(190,025)
|
||||||||||||
|
Interest
expense
|
(47,458)
|
(10,380)
|
―
|
||||||||||||
|
Gain
(loss) on early extinguishment of debt
|
(6,931)
|
(15,695)
|
1,087
|
||||||||||||
|
Other
income (expense)
|
(2,296)
|
(57,628)
|
(69,697)
|
||||||||||||
|
Homebuilding
pretax loss
|
(111,068)
|
(1,237,840)
|
(846,586)
|
||||||||||||
|
Financial
Services:
|
|||||||||||||||
|
Revenues
|
13,145
|
13,587
|
16,677
|
||||||||||||
|
Expenses
|
(11,817)
|
(13,659)
|
(16,045)
|
||||||||||||
|
Income
from unconsolidated joint ventures
|
119
|
854
|
1,050
|
||||||||||||
|
Other
income
|
139
|
234
|
611
|
||||||||||||
|
Financial
services pretax income
|
1,586
|
1,016
|
2,293
|
||||||||||||
|
Loss
from continuing operations before income taxes
|
(109,482)
|
(1,236,824)
|
(844,293)
|
||||||||||||
|
Benefit
for income taxes
|
96,265
|
5,495
|
149,003
|
||||||||||||
|
Loss
from continuing operations
|
(13,217)
|
(1,231,329)
|
(695,290)
|
||||||||||||
|
Loss
from discontinued operations, net of income taxes
|
(569)
|
(2,286)
|
(52,540)
|
||||||||||||
|
Loss
from disposal of discontinued operations, net of income
taxes
|
―
|
―
|
(19,550)
|
||||||||||||
|
Net
income (loss)
|
(13,786)
|
(1,233,615)
|
(767,380)
|
||||||||||||
|
Less:
Net loss allocated to preferred shareholders
|
8,371
|
489,229
|
―
|
||||||||||||
|
Net
loss available to common stockholders
|
$
|
(5,415)
|
$
|
(744,386)
|
$
|
(767,380)
|
|||||||||
|
Basic
Earnings (Loss) Per Common Share:
|
|||||||||||||||
|
Continuing
operations
|
$
|
(0.06)
|
$
|
(9.12)
|
$
|
(9.63)
|
|||||||||
|
Discontinued
operations
|
―
|
(0.02)
|
(1.00)
|
||||||||||||
|
Basic
earnings (loss) per common share
|
$
|
(0.06)
|
$
|
(9.14)
|
$
|
(10.63)
|
|||||||||
|
Diluted
Earnings (Loss) Per Common Share:
|
|||||||||||||||
|
Continuing
operations
|
$
|
(0.06)
|
$
|
(9.12)
|
$
|
(9.63)
|
|||||||||
|
Discontinued
operations
|
―
|
(0.02)
|
(1.00)
|
||||||||||||
|
Diluted
earnings (loss) per common share
|
$
|
(0.06)
|
$
|
(9.14)
|
$
|
(10.63)
|
|||||||||
|
Weighted
Average Common Shares Outstanding:
|
|||||||||||||||
|
Basic
|
95,623,851
|
81,439,248
|
72,157,394
|
||||||||||||
|
Diluted
|
95,623,851
|
81,439,248
|
72,157,394
|
||||||||||||
|
Weighted
Average If-Converted Preferred Shares Outstanding: (1)
|
147,812,786
|
53,523,829
|
―
|
||||||||||||
|
Net
cash provided by (used in) operating activities
|
$
|
419,830
|
$
|
263,151
|
$
|
655,558
|
|||||||||
|
Net
cash provided by (used in) investing activities
|
$
|
(27,301)
|
$
|
(11,579)
|
$
|
(197,815)
|
|||||||||
|
Net
cash provided by (used in) financing activities
|
$
|
(422,815)
|
$
|
142,712
|
$
|
(258,285)
|
|||||||||
|
Adjusted
Homebuilding EBITDA (2)
|
$
|
116,252
|
$
|
43,885
|
$
|
297,369
|
|||||||||
|
(1)
|
In
June 2008 and September 2008, we issued 125.0 million and 22.8 million,
respectively, equivalent shares of common stock (in the form of preferred
stock) in connection with the Investment Agreement with MP CA Homes LLC,
an affiliate of MatlinPatterson Global Advisers LLC. If the
preferred stock was converted to common stock, the total weighted average
common shares outstanding as of December 31, 2009 and 2008 would have been
243.4 million and 135.0 million,
respectively.
|
|
(2)
|
Adjusted
Homebuilding EBITDA means net income (loss) (plus cash distributions of
income from unconsolidated joint ventures) before (a) income taxes, (b)
homebuilding interest expense, (c) expensing of previously capitalized
interest included in cost of sales, (d) impairment charges, (e) gain
(loss) on early extinguishment of debt, (f) homebuilding depreciation and
amortization, (g) amortization of stock-based compensation, (h) income
(loss) from unconsolidated joint ventures and (i) income (loss) from
financial services subsidiary. Other companies may calculate Adjusted
Homebuilding EBITDA (or similarly titled measures) differently. We believe
Adjusted Homebuilding EBITDA information is useful to management and
investors as one measure of our ability to service debt and obtain
financing. However, it should be noted that Adjusted Homebuilding EBITDA
is not a U.S. generally accepted accounting principles (“GAAP”) financial
measure. Due to the significance of the GAAP components excluded, Adjusted
Homebuilding EBITDA should not be considered in isolation or as an
alternative to cash flows from operations or any other liquidity
performance measure prescribed by
GAAP.
|
Selected
Financial Information (continued)
|
(2)
|
Continued
|
The table
set forth below reconciles net cash provided by (used in) operating activities,
calculated and presented in accordance with GAAP, to Adjusted Homebuilding
EBITDA.
|
Year
Ended December 31,
|
|||||||||||||||
|
2009
|
2008
|
2007
|
|||||||||||||
|
(Dollars
in thousands)
|
|||||||||||||||
|
Net
cash provided by (used in) operating activities
|
$
|
419,830
|
$
|
263,151
|
$
|
655,558
|
|||||||||
|
Add:
|
|||||||||||||||
|
Provision
for (benefit from) income taxes
|
(96,563)
|
(6,795)
|
(188,954)
|
||||||||||||
|
Deferred
tax valuation allowance
|
51,429
|
(473,627)
|
(180,480)
|
||||||||||||
|
Homebuilding
interest amortized to cost of sales and interest expense
|
134,293
|
94,452 | 131,289 | ||||||||||||
|
Excess
tax benefits from share-based payment arrangements
|
297
|
―
|
1,498
|
||||||||||||
|
Less:
|
|||||||||||||||
|
Income
(loss) from financial services subsidiary
|
1,328
|
(72)
|
632
|
||||||||||||
|
Depreciation
and amortization from financial services subsidiary
|
678
|
783
|
703
|
||||||||||||
|
Loss
on disposal of property and equipment
|
2,611
|
2,792
|
1,439
|
||||||||||||
|
Net
changes in operating assets and liabilities:
|
|||||||||||||||
|
Trade
and other receivables
|
(8,440)
|
(6,408)
|
(45,083)
|
||||||||||||
|
Mortgage
loans held for sale
|
(24,718)
|
(91,380)
|
(99,618)
|
||||||||||||
|
Inventories-owned
|
(326,062)
|
(34,567)
|
(399,432)
|
||||||||||||
|
Inventories-not
owned
|
2,805
|
(1,049)
|
(10,449)
|
||||||||||||
|
Deferred
income taxes
|
45,133
|
343,754
|
135,741
|
||||||||||||
|
Other
assets
|
(118,265)
|
(142,834)
|
245,723
|
||||||||||||
|
Accounts
payable
|
18,554
|
57,949
|
13,105
|
||||||||||||
|
Accrued
liabilities
|
22,576
|
44,742
|
41,245
|
||||||||||||
|
Adjusted
Homebuilding EBITDA
|
$
|
116,252
|
$
|
43,885
|
$
|
297,369
|
|||||||||
Overview
Our
operations continue to be impacted by weak housing demand in substantially all
of our markets, driven by a housing supply/demand imbalance (including the
impact of short sales and foreclosures), declining home prices, low consumer
confidence and high unemployment. Despite these factors, our net loss
for 2009 decreased considerably from the prior year. In addition, we
were successful in generating positive cash flows from operating activities,
which was the result of our efforts to adjust our overhead structure to better
align our operations with the decline in demand for new homes, reduce our supply
of completed and unsold homes, and reduce our construction
costs. While our absolute net new orders were lower in 2009 than in
2008 and are still weak relative to normal market conditions, our monthly sales
absorption rate per active selling community increased from 1.7 per community in
2008 to 2.0 per community in 2009.
For
the year ended December 31, 2009, we incurred a net loss of $13.8 million, or
$0.06 per diluted share, compared to a net loss of $1,233.6 million, or $9.14
per diluted share, in 2008 and a net loss of $767.4 million, or $10.63 per
diluted share, in 2007. The net loss incurred during fiscal 2009
included $71.1 million of pretax impairment charges and $29.5 million of debt
refinancing and other restructuring charges, which were offset in part by an
income tax benefit of $94.1 million related to federal tax legislation that
extended the carryback of net operating losses from two years to five
years. Our results for the years ended December 31, 2008 and 2007
included pretax impairment charges totaling $1,153.5 million and $984.6 million,
respectively.
We
generated cash flows from operations of $419.8 million during 2009 and ended the
year with $602.2 million of homebuilding cash (including $15.1 million of
restricted cash). The cash flows from operations were driven
primarily by a $326.1 million decrease in inventories (largely due to a 60%
reduction in the number of completed and unsold homes and the bulk sale of two
podium projects) and the receipt of our $114.5 million 2008 federal income tax
refund. We reduced the principal amount of our homebuilding debt
during 2009 by $321.8 million, from $1,512.7 million as of December 31, 2008, to
$1,190.9 million as of December 31, 2009. In addition, we
reduced our homebuilding debt due before 2013 from $837.7 million at the end of
2008 to $239.3 million as of December 31, 2009.
Homebuilding
|
Year
Ended December 31,
|
||||||||||||
|
2009
|
2008
|
2007
|
||||||||||
|
(Dollars
in thousands)
|
||||||||||||
|
Homebuilding
revenues:
|
||||||||||||
|
California
|
$
|
665,414
|
$
|
796,737
|
$
|
1,484,047
|
||||||
|
Southwest
(1)
|
238,249
|
416,749
|
793,455
|
|||||||||
|
Southeast
|
262,734
|
322,130
|
611,331
|
|||||||||
|
Total
homebuilding revenues
|
$
|
1,166,397
|
$
|
1,535,616
|
$
|
2,888,833
|
||||||
|
Homebuilding
pretax income (loss):
|
||||||||||||
|
California
|
$
|
(16,817)
|
$
|
(724,047)
|
$
|
(524,913)
|
||||||
|
Southwest
(1)
|
(28,950)
|
(257,031)
|
(165,714)
|
|||||||||
|
Southeast
|
(30,880)
|
(222,586)
|
(150,829)
|
|||||||||
|
Corporate
|
(34,421)
|
(34,176)
|
(5,130)
|
|||||||||
|
Total
homebuilding pretax income (loss)
|
$
|
(111,068)
|
$
|
(1,237,840)
|
$
|
(846,586)
|
||||||
|
Homebuilding
pretax impairment charges:
|
||||||||||||
|
California
|
$
|
43,313
|
$
|
690,890
|
$
|
577,990
|
||||||
|
Southwest
(1)
|
16,426
|
252,877
|
211,075
|
|||||||||
|
Southeast
|
11,342
|
209,763
|
195,527
|
|||||||||
|
Total
homebuilding pretax impairment charges
|
$
|
71,081
|
$
|
1,153,530
|
$
|
984,592
|
||||||
|
Homebuilding
pretax impairment charges by type:
|
||||||||||||
|
Deposit
write-offs
|
$
|
2,490
|
$
|
25,649
|
$
|
22,539
|
||||||
|
Inventory
impairments
|
60,450
|
943,094
|
705,420
|
|||||||||
|
Joint
venture impairments
|
8,141
|
149,265
|
202,309
|
|||||||||
|
Goodwill
impairments
|
―
|
35,522
|
54,324
|
|||||||||
|
Total
homebuilding pretax impairment charges
|
$
|
71,081
|
$
|
1,153,530
|
$
|
984,592
|
||||||
|
As
of December 31,
|
||||||||||||
|
2009
|
2008
|
2007
|
||||||||||
| (Dollars in thousands) | ||||||||||||
|
Total
Assets:
|
||||||||||||
|
California
|
$
|
671,887
|
$
|
810,619
|
$
|
1,376,000
|
||||||
|
Southwest
(1)
|
210,058
|
299,039
|
622,873
|
|||||||||
|
Southeast
|
181,931
|
275,893
|
544,162
|
|||||||||
|
Corporate
|
730,046
|
777,256
|
648,569
|
|||||||||
|
Total
homebuilding
|
1,793,922
|
2,162,807
|
3,191,604
|
|||||||||
|
Financial
services
|
67,089
|
88,464
|
190,573
|
|||||||||
|
Discontinued
operations
|
―
|
1,217
|
19,727
|
|||||||||
|
Total
Assets
|
$
|
1,861,011
|
$
|
2,252,488
|
$
|
3,401,904
|
||||||
|
(1)
|
Excludes
our Tucson and San Antonio divisions, which are classified as discontinued
operations.
|
For 2009,
we generated a homebuilding pretax loss of $111.1 million compared to a pretax
loss of $1,237.8 million in 2008. This improvement was primarily the
result of a $1,082.4 million decrease in impairment charges, a $114.0 million
decrease in our selling, general and administrative (“SG&A”) expenses (which
included approximately $19.1 million in restructuring charges related to
severance and facilities reductions) and an $8.8 million decrease in loss on
early extinguishment of debt. These changes were partially offset by
a $37.1 million increase in non-capitalized interest expense during
2009. Our homebuilding operations for the year ended December 31,
2009 included $71.1 million of pretax impairment charges, which are detailed in
the table above. Inventory impairment charges are included in cost of
sales, joint venture charges are included in loss from unconsolidated joint
ventures and deposit write-offs are included in other income
(expense).
For 2008,
homebuilding pretax loss was $1,237.8 million compared to $846.6 million in
2007. The increase in pretax loss from 2007 to 2008 was primarily the
result of a $168.9 million increase in impairment charges and a $10.4 million
increase in non-capitalized interest expense. These changes were
partially offset by an $82.5 million decrease in our SG&A expenses (which
included approximately $19.2 million in restructuring charges). Our
homebuilding operations for the year ended December 31, 2008 included $1,153.5
million of pretax impairment charges, which are detailed in the table
above. Goodwill impairment charges are included in other income
(expense).
Homebuilding
revenues for 2009 decreased 24% from 2008 as a result of a 25% decrease in new
home deliveries and a 7% decrease in our consolidated average home price to
$306,000. The decreases were partially offset by a $91.9 million
year-over-year increase in land sale revenues, which included $80.8 million from
the sale of two podium projects in Southern California. Homebuilding
revenues for 2008 decreased 47% from 2007 as a result of a 33% decrease in new
home deliveries, a 12% decrease in our consolidated average home price to
$330,000 and a $267.0 million decrease in land sale revenues from
2007.
|
Year
Ended December 31,
|
||||||||||||||
|
2009
|
%
Change
|
2008
|
%
Change
|
2007
|
||||||||||
|
New
homes delivered:
|
||||||||||||||
|
California
|
1,344
|
(19%)
|
1,668
|
(24%)
|
2,189
|
|||||||||
|
Arizona
(1)
|
303
|
(44%)
|
540
|
(48%)
|
1,029
|
|||||||||
|
Texas
(1)
|
419
|
(38%)
|
677
|
(31%)
|
984
|
|||||||||
|
Colorado
|
147
|
(36%)
|
229
|
(41%)
|
388
|
|||||||||
|
Nevada
|
15
|
(76%)
|
62
|
(9%)
|
68
|
|||||||||
|
Total
Southwest
|
884
|
(41%)
|
1,508
|
(39%)
|
2,469
|
|||||||||
|
Florida
|
797
|
(10%)
|
883
|
(33%)
|
1,314
|
|||||||||
|
Carolinas
|
440
|
(20%)
|
548
|
(42%)
|
946
|
|||||||||
|
Total
Southeast
|
1,237
|
(14%)
|
1,431
|
(37%)
|
2,260
|
|||||||||
|
Consolidated
total
|
3,465
|
(25%)
|
4,607
|
(33%)
|
6,918
|
|||||||||
|
Unconsolidated
joint ventures (2)
|
112
|
(59%)
|
270
|
(46%)
|
499
|
|||||||||
|
Discontinued
operations (including joint ventures) (2)
|
4
|
(97%)
|
148
|
(77%)
|
634
|
|||||||||
|
Total
(including joint ventures) (2)
|
3,581
|
(29%)
|
5,025
|
(38%)
|
8,051
|
|||||||||
|
(1)
|
Arizona
and Texas exclude our Tucson and San Antonio divisions, which are
classified as discontinued
operations.
|
|
(2)
|
Numbers
presented regarding unconsolidated joint ventures reflect total deliveries
of such joint ventures. Our ownership interests in these joint
ventures vary but are generally less than or equal to
50%.
|
New home
deliveries decreased 25% in 2009 as compared to the prior year. The
decline in our 2009 deliveries reflected a 50% decrease in our beginning backlog
level and a 27% decrease in the number of average active selling
communities. This decrease was partially offset by the increased
number of speculative homes that we sold and delivered during fiscal
2009. 2008 new home deliveries were down 33% from 2007 as a result of
the significant decline in our 2008 order activity and a 48% decrease in our
2008 beginning backlog level.
|
Year
Ended December 31,
|
||||||||||||||||
|
2009
|
%
Change
|
2008
|
%
Change
|
2007
|
||||||||||||
|
Average
selling prices of homes delivered:
|
||||||||||||||||
|
California
|
$
|
434,000
|
(9%)
|
$
|
475,000
|
(21%)
|
$
|
601,000
|
||||||||
|
Arizona
(1)
|
211,000
|
(7%)
|
228,000
|
(25%)
|
304,000
|
|||||||||||
|
Texas
(1)
|
282,000
|
1%
|
280,000
|
11%
|
253,000
|
|||||||||||
|
Colorado
|
305,000
|
(12%)
|
348,000
|
(2%)
|
355,000
|
|||||||||||
|
Nevada
|
225,000
|
(21%)
|
285,000
|
(10%)
|
316,000
|
|||||||||||
|
Total
Southwest
|
260,000
|
(4%)
|
272,000
|
(7%)
|
292,000
|
|||||||||||
|
Florida
|
190,000
|
(9%)
|
209,000
|
(22%)
|
267,000
|
|||||||||||
|
Carolinas
|
218,000
|
(11%)
|
246,000
|
6%
|
232,000
|
|||||||||||
|
Total
Southeast
|
200,000
|
(10%)
|
223,000
|
(12%)
|
253,000
|
|||||||||||
|
Consolidated
total
|
306,000
|
(7%)
|
330,000
|
(12%)
|
377,000
|
|||||||||||
|
Unconsolidated
joint ventures (2)
|
517,000
|
(2%)
|
525,000
|
(7%)
|
565,000
|
|||||||||||
|
Discontinued
operations (including joint ventures) (2)
|
201,000
|
15%
|
175,000
|
(13%)
|
200,000
|
|||||||||||
|
Total
(including joint ventures) (2)
|
$
|
313,000
|
(7%)
|
$
|
336,000
|
(14%)
|
$
|
390,000
|
||||||||
|
(1)
|
Arizona
and Texas exclude the Tucson and San Antonio divisions, which are
classified as discontinued
operations.
|
|
(2)
|
Numbers
presented regarding unconsolidated joint ventures reflect total average
selling prices of such joint ventures. Our ownership interests
in these joint ventures vary but are generally less than or equal to
50%.
|
During 2009, our consolidated average home price (excluding joint ventures and discontinued operations) decreased 7% to $306,000 as compared to $330,000 for 2008. The decrease in our consolidated average home price during 2009 was due primarily to general price declines and higher incentives required to sell homes as compared to the prior year and was partially offset by a slight mix shift to more California deliveries. In addition, the 9% drop in our average home price in California in 2009 was also impacted by the increased number of deliveries from our lower priced podium projects in Southern California. In 2009, 13% of our California deliveries were podium product versus 2% in 2008.
During
2008, the 12% decline in our consolidated average price from $377,000 to
$330,000 was primarily due to the significant level of incentives, discounts and
price reductions required to sell homes in most of our markets due to weaker
housing demand, the tightening of available mortgage credit for homebuyers, and
increased competition and foreclosure activity. These declines were
partially offset by various changes in our geographic delivery mix, including a
shift towards larger, higher-priced homes in our Texas and Carolina
markets.
Gross
Margin
Our 2009 homebuilding gross margin
percentage (including land sales) was up year-over-year to 12.2% from a negative
45.4% in 2008. The 2009 gross margin reflected $60.5 million of
inventory impairment charges related to 27 projects, of which $46.1 million
related to current and future projects, $8.9 million related to the sale of two
finished podium projects in Southern California and $5.5 million related to land
or lots that have been or are intended to be sold (please see Note 4.a. of the
accompanying consolidated financial statements for further
discussion). These impairments related primarily to projects located
in California and Florida, and to a lesser degree, in Arizona, Colorado, Nevada,
the Carolinas and Texas. The operating margins (defined as gross
margin less direct selling and marketing costs) used to calculate land residual
values and related fair values for the majority of our projects during the year
ended December 31, 2009 were generally in the 8% to 12% range and discount rates
were generally in the 15% to 25% range. Excluding the housing
inventory impairment charges and land sales, our 2009 gross margin percentage
from home sales would have been 18.8% versus 15.9% in 2008 (please see the table
set forth below reconciling this non-GAAP measure to our gross margin from home
sales). The 290 basis point increase in the adjusted gross margin
percentage was driven primarily by higher gross margins in California, Arizona
and Colorado and lower direct construction costs company-wide as a result of
value engineering and the rebidding of contracts.
Our 2008 homebuilding gross margin
percentage (including land sales) was negative 45.4% versus a negative 6.9% in
2007. The 2008 gross margin included $943.1 million of inventory
impairment charges related to 184 projects, of which $827.6 million related to
current and future projects and $115.5 million related to land sold or held for
sale. These impairments related primarily to projects located in
California, Florida, Nevada, and Arizona, and to a lesser degree, in Colorado,
the Carolinas and Texas. The operating margins used to calculate land
residual values and related fair values for the majority of our projects during
the year ended December 31, 2008 were generally in the 7% to 12% range and
discount rates were generally in the 15% to 25% range, with a small portion of
the projects in the low to mid 30% range. Excluding the housing inventory
impairment charges from continuing operations and land sales, our 2008 gross
margin percentage from home sales would have been 15.9% versus 19.2% in 2007
(please see the table set forth below reconciling this non-GAAP measure to our
gross margin from home sales). The 330 basis point decrease in the
adjusted gross margin percentage was
driven
primarily by lower gross margins in California, Arizona and Florida, and to a
lesser extent, Texas, Colorado and the Carolinas. The lower gross
margins in these markets were driven by lower selling prices resulting from
increased incentives and discounts resulting from weaker demand, more limited
availability of mortgage credit, and an increased level of existing homes
available for sale in the marketplace during this period.
The table set
forth below reconciles our homebuilding gross margin and gross margin percentage
for the years ended December 31, 2009, 2008 and 2007 to gross margin and gross
margin percentage from home sales, excluding housing inventory impairment
charges and land sales:
|
Year
Ended December 31,
|
|||||||||||||||
|
2009
|
Gross
Margin
%
|
2008
|
Gross
Margin
%
|
2007
|
Gross
Margin
%
|
||||||||||
|
(Dollars
in thousands)
|
|||||||||||||||
|
Homebuilding
gross margin
|
$
|
141,822
|
12.2%
|
$
|
(696,928)
|
(45.4%)
|
$
|
(199,970)
|
(6.9%)
|
||||||
|
Less:
Land sale revenues
|
105,895
|
13,976
|
281,009
|
||||||||||||
|
Add:
Cost of land sales
|
117,517
|
124,786
|
568,539
|
||||||||||||
|
Gross
margin from home sales
|
153,444
|
14.5%
|
(586,118)
|
(38.5%)
|
87,560
|
3.4%
|
|||||||||
|
Add:
Housing inventory impairment charges
|
46,063
|
827,611
|
414,244
|
||||||||||||
|
Gross
margin from home sales, as adjusted
|
$
|
199,507
|
18.8%
|
$
|
241,493
|
15.9%
|
$
|
501,804
|
19.2%
|
||||||
We believe
that the measures described above, which exclude land sales and housing
inventory impairment charges, are useful to management and investors as they
provide a perspective on the underlying operating performance of the business by
excluding these charges and provides comparability with the Company’s peer
group. However, it should be noted that such measures are not GAAP
financial measures and other companies in the homebuilding industry may
calculate these measures differently. Due to the significance of the
GAAP components excluded, such measures should not be considered in isolation or
as an alternative to operating performance measures prescribed by
GAAP.
Restructuring Activities
Our operations have
been impacted by the weak housing demand in substantially all of our
markets. As a result, during 2008 we initiated a restructuring plan
designed to reduce ongoing overhead costs and improve operating efficiencies
through the consolidation of selected divisional offices, the disposal of
related property and equipment, and a reduction in our
workforce. During 2009 and 2008, we incurred $22.1 million and $24.2
million, respectively, in homebuilding restructuring charges. We
believe that these restructuring activities were substantially complete as of
December 31, 2009. However, until market conditions stabilize, we may
incur additional restructuring charges for employee severance, lease termination
and other exit costs. We estimate that employee severance and lease
terminations during 2009 and 2008 will result in gross annual savings of
approximately $75 million, primarily related to SG&A
expenses. For further information about our restructuring activities,
including costs paid and costs remaining to be paid, please see Note 2.j. in the
accompanying consolidated financial statements beginning on page
51.
SG&A Expenses
Our SG&A
expense rate (including corporate G&A) for 2009 decreased 350 basis points
to 16.4% of homebuilding revenues compared to 19.9% for
2008. Excluding land sale revenues and restructuring charges, our
2009 SG&A rate was 16.3% versus 18.8% for 2008, despite a 30% decrease in
home sale revenues (please see the table set forth below reconciling this
non-GAAP measure to our SG&A expenses). The 250 basis point
decrease in our adjusted SG&A rate was primarily due to our focus on
reducing our SG&A expenses and was driven primarily by reductions in
personnel costs and advertising and marketing expenses, offset in part by an
increase in incentive and stock based compensation.
Our
SG&A expense rate (including corporate G&A) for 2008 increased 650 basis
points to 19.9% of homebuilding revenues compared to 13.4% for
2007. Excluding land sale revenues and restructuring charges, our
2008 SG&A rate was 18.8% versus 14.9% for 2007 (please see the table set
forth below reconciling this non-GAAP measure to our SG&A
expenses). The 390 basis point increase in our adjusted SG&A rate
was primarily due to a lower level of revenues to spread costs over as well as a
higher level of sales and marketing costs as a percentage of revenues as a
result of our focus on generating sales in challenging market conditions, an
increase in professional fees incurred in connection with pursuing strategic and
financial alternatives prior to the investment by MP CA Homes LLC
(“MatlinPatterson”) in our preferred stock and costs related to potential
acquisition related activities. These increases as a percentage of
homebuilding revenues were offset in part by a reduction in personnel costs as a
result of reductions in headcount made to better align our overhead with the
weaker housing market, a reduction in the level of incentive compensation
expense, and the general effort to reduce other general and administrative
expenses due to the downsizing of our operations.
The
table set forth below reconciles our SG&A expense and SG&A rate for the
years ended December 31, 2009, 2008 and 2007 to our SG&A expense and
SG&A rate, excluding land sale revenues and restructuring
charges:
|
Year
Ended December 31,
|
|||||||||||||||
|
2009
|
SG&A
% (excl. land sales)
|
2008
|
SG&A
% (excl. land sales)
|
2007
|
SG&A
% (excl. land sales)
|
||||||||||
|
(Dollars
in thousands)
|
|||||||||||||||
|
Selling,
general and administrative expenses
|
$
|
191,488
|
18.1%
|
$
|
305,480
|
20.1%
|
$
|
387,981
|
14.9%
|
||||||
|
Less:
Restructuring charges
|
(19,125)
|
(1.8%)
|
(19,179)
|
(1.3%)
|
―
|
―
|
|||||||||
|
Selling,
general and administrative expenses,
|
|||||||||||||||
|
excluding
restructuring charges
|
$
|
172,363
|
16.3%
|
$
|
286,301
|
18.8%
|
$
|
387,981
|
14.9%
|
||||||
We believe
that the measures described above, which exclude land sales and restructuring
charges, are useful to management and investors as they provide a perspective on
the underlying operating performance of the business excluding these charges and
provides comparability with the Company’s peer group. However, it
should be noted that such measures are not GAAP financial measures and other
companies in the homebuilding industry may calculate these measures
differently. Due to the significance of the GAAP components excluded,
such measures should not be considered in isolation or as an alternative to
operating performance measures prescribed by GAAP.
Unconsolidated
Joint Ventures
We recognized a $4.7 million loss
from unconsolidated joint ventures during 2009 compared to a loss of $151.7
million in 2008 and $190.0 million in 2007. The 2009 loss included
$11.4 million in losses related to our North Las Vegas joint venture, which was
offset in part by approximately $3.7 million of income from a Southern
California land development joint venture and $2.9 million in income from the
delivery of 112 homes from six joint ventures. The 2008 loss
reflected a $149.3 million pretax charge related to our share of joint venture
impairments related to 20 projects located primarily in California and our North
Las Vegas joint venture. The loss in 2007 reflected a $202.3 million
pretax charge related to our share of joint venture inventory impairments
related to 30 projects located predominantly in California and to a much smaller
degree, in Arizona and Texas.
Interest
Expense
For 2009,
we expensed $47.5 million of interest costs related to the portion of real
estate inventories which we were not actively preparing for their intended use,
and as a result were deemed unqualified assets in accordance with ASC Topic 835,
Interest. Interest
costs incurred during the six months ended June 30, 2008 and all of 2007 were
capitalized to inventories. To the extent our debt exceeds our
qualified assets in the future, we will expense a portion of the interest
related to such debt.
Gain
(Loss) on Early Extinguishment of Debt
During
2009, we recognized a loss on early extinguishment of debt of $6.9
million. We recorded a $7.3 million loss related to the amendment of
our revolving credit facility and the amendment and termination of our Term Loan
A facility, which included the write-off of unamortized deferred debt issuance
costs and the unwind of the ineffective portion of the Term Loan A interest rate
swap. In addition, we recorded a $3.5 million loss (including the
write-off of unamortized debt issuance costs) related to the repurchase through
a tender offer of approximately $133.4 million, $122.0 million and $3.4 million
in principal amount of senior notes due 2010, 2011 and 2013, respectively, and a
$1.5 million loss (including the write-off of unamortized debt issuance costs)
related to the exchange of $32.8 million of our 2012 senior subordinated
convertible notes for 7.6 million shares of our common stock. These
losses were partially offset by a $5.4 million gain related to the early
redemption of $24.5 million of our 2010 senior notes and $4.4 million of our
2011 senior notes.
During
2008, we recognized loss on early extinguishment of debt of $15.7
million. This loss included a $9.1 million charge related to the
exchange of $128.5 million of senior and senior subordinated notes for a warrant
issued to MatlinPatterson to purchase shares of our preferred stock, $3.3
million of expense related to the ineffectiveness of the Term Loan A and Term
Loan B interest rate swaps, and a $3.9 million loss related to the write-off of
unamortized deferred debt issuance costs associated with amending our revolving
credit facility. These losses were offset in part by a $1.1 million gain related
to the early extinguishment of $22.5 million of our 2008 senior notes through
open market purchases.
Other
Income (Expense)
Other
income (expense) for the year ended December 31, 2009 included $2.5 million of
deposit write-offs and $2.0 million of fixed asset write-offs related to
restructuring activities, which was partially offset by $2.3 million of interest
income. Other income (expense) for the year ended December 31, 2008
included $25.6 million of deposit write-offs and $2.3 million of fixed asset
write-offs related to restructuring activities, which was partially offset by
$6.3 million of interest income. Also included in other
income (expense) for 2008 were goodwill impairment charges of approximately
$35.5 million related to our Northern California, Phoenix, Orlando, Tampa and
Charlotte divisions.
|
Year
Ended December 31,
|
|||||||||||||
|
2009
|
%
Change
|
2008
|
%
Change
|
2007
|
|||||||||
|
Net
new orders (1):
|
|||||||||||||
|
California
|
1,358
|
(9%)
|
1,495
|
(29%)
|
2,112
|
||||||||
|
Arizona
(2)
|
274
|
(35%)
|
422
|
(29%)
|
593
|
||||||||
|
Texas
(2)
|
398
|
(21%)
|
506
|
(40%)
|
844
|
||||||||
|
Colorado
|
123
|
(33%)
|
184
|
(49%)
|
363
|
||||||||
|
Nevada
|
11
|
(70%)
|
37
|
(57%)
|
86
|
||||||||
|
Total
Southwest
|
806
|
(30%)
|
1,149
|
(39%)
|
1,886
|
||||||||
|
Florida
|
728
|
(10%)
|
810
|
(3%)
|
837
|
||||||||
|
Carolinas
|
451
|
(8%)
|
492
|
(43%)
|
862
|
||||||||
|
Total
Southeast
|
1,179
|
(9%)
|
1,302
|
(23%)
|
1,699
|
||||||||
|
Consolidated
total
|
3,343
|
(15%)
|
3,946
|
(31%)
|
5,697
|
||||||||
|
Unconsolidated
joint ventures (3)
|
174
|
(12%)
|
197
|
(62%)
|
518
|
||||||||
|
Discontinued
operations
|
3
|
(97%)
|
105
|
(80%)
|
522
|
||||||||
|
Total
(including joint ventures) (3)
|
3,520
|
(17%)
|
4,248
|
(37%)
|
6,737
|
||||||||
|
(1)
|
Net
new orders are new orders for the purchase of homes during the period,
less cancellations during such period of existing contracts for the
purchase of homes.
|
|
(2)
|
Arizona
and Texas exclude the Tucson and San Antonio divisions, which are
classified as discontinued
operations.
|
|
(3)
|
Numbers
presented regarding unconsolidated joint ventures reflect total net new
orders of such joint ventures. Our ownership interests in these
joint ventures vary but are generally less than or equal to
50%.
|
|
Year
Ended December 31,
|
|||||||||||||
|
2009
|
%
Change
|
2008
|
%
Change
|
2007
|
|||||||||
|
Average
number of selling communities during the year:
|
|||||||||||||
|
California
|
50
|
(21%)
|
63
|
(2%)
|
64
|
||||||||
|
Arizona
(1)
|
8
|
(47%)
|
15
|
(17%)
|
18
|
||||||||
|
Texas
(1)
|
19
|
(34%)
|
29
|
16%
|
25
|
||||||||
|
Colorado
|
6
|
(25%)
|
8
|
(27%)
|
11
|
||||||||
|
Nevada
|
2
|
(33%)
|
3
|
(25%)
|
4
|
||||||||
|
Total
Southwest
|
35
|
(36%)
|
55
|
(5%)
|
58
|
||||||||
|
Florida
|
31
|
(31%)
|
45
|
(4%)
|
47
|
||||||||
|
Carolinas
|
24
|
(17%)
|
29
|
7%
|
27
|
||||||||
|
Total
Southeast
|
55
|
(26%)
|
74
|
0%
|
74
|
||||||||
|
Consolidated
total
|
140
|
(27%)
|
192
|
(2%)
|
196
|
||||||||
|
Unconsolidated
joint ventures (2)
|
7
|
(42%)
|
12
|
(48%)
|
23
|
||||||||
|
Discontinued
operations
|
―
|
(100%)
|
2
|
(92%)
|
25
|
||||||||
|
Total
(including joint ventures) (2)
|
147
|
(29%)
|
206
|
(16%)
|
244
|
||||||||
|
(1)
|
Arizona
and Texas exclude the Tucson and San Antonio divisions, which are
classified as discontinued
operations.
|
|
(2)
|
Numbers
presented regarding unconsolidated joint ventures reflect total average
selling communities of such joint ventures. Our ownership
interests in these joint ventures vary but are generally less than or
equal to 50%.
|
Net new
orders (excluding joint ventures and discontinued operations) for 2009 decreased
15% to 3,343 new homes on a 27% decrease in the number of average active selling
communities from 192 in 2008 to 140 in 2009. Our monthly sales
absorption rate was 2.0 per community for 2009, up from 1.7 per community for
2008. During the 2009 fourth quarter our monthly sales absorption
rate was 1.5 per community, up from 1.0 per community for the 2008 fourth
quarter, but down from 2.2 per community for the 2009 third
quarter. Our consolidated cancellation rate for 2009 was 18% compared
to 26% in 2008 and was 21% for the 2009 fourth quarter. Although
sales absorption rates improved during 2009 compared to the prior year, they
still remained low relative to historical rates and reflected weaker demand in
substantially all of our markets, driven by a housing supply/demand imbalance,
low consumer confidence and high unemployment. These conditions have
been magnified by the tightening of available mortgage credit for
homebuyers.
For 2008,
net new orders (excluding joint ventures and discontinued operations) decreased
31% to 3,946 new homes on a 2% lower average community count. Our
consolidated cancellation rate for 2008 was 26% compared to 30% in
2007. The decrease in net new orders resulted primarily from weaker
housing market conditions experienced in all of our markets.
|
Year
Ended December 31,
|
||||||||||||||||||
|
2009
|
2008
|
2007
|
||||||||||||||||
|
Backlog
($ in thousands):
|
Homes
|
Dollar
Value
|
Homes
|
Dollar
Value
|
Homes
|
Dollar
Value
|
||||||||||||
|
California
|
247
|
$
|
117,536
|
154
|
$
|
69,522
|
303
|
$
|
163,813
|
|||||||||
|
Arizona
(1)
|
47
|
9,686
|
76
|
17,083
|
194
|
50,091
|
||||||||||||
|
Texas
(1)
|
109
|
33,708
|
130
|
38,782
|
301
|
92,030
|
||||||||||||
|
Colorado
|
54
|
15,587
|
78
|
24,017
|
123
|
44,311
|
||||||||||||
|
Nevada
|
―
|
―
|
4
|
893
|
29
|
8,160
|
||||||||||||
|
Total
Southwest
|
210
|
58,981
|
288
|
80,775
|
647
|
194,592
|
||||||||||||
|
Florida
|
78
|
15,033
|
147
|
30,408
|
220
|
52,787
|
||||||||||||
|
Carolinas
|
64
|
16,337
|
53
|
12,735
|
109
|
31,476
|
||||||||||||
|
Total
Southeast
|
142
|
31,370
|
200
|
43,143
|
329
|
84,263
|
||||||||||||
|
Consolidated
total
|
599
|
207,887
|
642
|
193,440
|
1,279
|
442,668
|
||||||||||||
|
Unconsolidated
|
||||||||||||||||||
|
joint
ventures (2)
|
9
|
4,601
|
26
|
11,929
|
123
|
82,006
|
||||||||||||
|
Discontinued
operations
|
―
|
―
|
1
|
208
|
44
|
8,099
|
||||||||||||
|
Total
(including joint ventures)
(2)
|
608
|
$
|
212,488
|
669
|
$
|
205,577
|
1,446
|
$
|
532,773
|
|||||||||
________________________________
|
(1)
|
Arizona
and Texas exclude the Tucson and San Antonio divisions, which are
classified as discontinued
operations.
|
|
(2)
|
Numbers
presented regarding unconsolidated joint ventures reflect total backlog of
such joint ventures. Our ownership interests in these joint
ventures vary but are generally less than or equal to
50%.
|
The
number of homes in our backlog (excluding joint ventures and discontinued
operations) decreased 7% from December 31, 2008 due to the high backlog
conversion rate and slower sales rates experienced during the 2009 fourth
quarter, and a 27% decrease in the average number of active selling communities
during 2009. However, the dollar value of our backlog at December 31,
2009 increased 7% from December 2008 to approximately $207.9 million, reflecting
a higher average sales price in backlog primarily due to a mix shift to more
California homes. All orders are subject to potential cancellation by
the customer.
|
At
December 31,
|
|||||||||||||
|
2009
|
%
Change
|
2008
|
%
Change
|
2007
|
|||||||||
|
Building
sites owned or controlled:
|
|||||||||||||
|
California
|
7,685
|
(9%)
|
8,491
|
(28%)
|
11,814
|
||||||||
|
Arizona
(1)
|
1,831
|
(20%)
|
2,303
|
(23%)
|
2,997
|
||||||||
|
Texas
(1)
|
1,714
|
(9%)
|
1,881
|
(44%)
|
3,370
|
||||||||
|
Colorado
|
255
|
(32%)
|
374
|
(51%)
|
771
|
||||||||
|
Nevada
|
1,218
|
(39%)
|
1,994
|
(17%)
|
2,390
|
||||||||
|
Total
Southwest
|
5,018
|
(23%)
|
6,552
|
(31%)
|
9,528
|
||||||||
|
Florida
|
4,678
|
(33%)
|
6,986
|
(17%)
|
8,462
|
||||||||
|
Carolinas
|
1,809
|
(11%)
|
2,042
|
(47%)
|
3,885
|
||||||||
|
Illinois
|
―
|
(100%)
|
60
|
(3%)
|
62
|
||||||||
|
Total
Southeast
|
6,487
|
(29%)
|
9,088
|
(27%)
|
12,409
|
||||||||
|
Discontinued
operations
|
1
|
(80%)
|
5
|
(100%)
|
1,007
|
||||||||
|
Total
(including joint ventures)
|
19,191
|
(20%)
|
24,136
|
(31%)
|
34,758
|
||||||||
|
Building
sites owned
|
15,826
|
(18%)
|
19,306
|
(10%)
|
21,371
|
||||||||
|
Building
sites optioned or subject to contract
|
2,361
|
(6%)
|
2,519
|
(55%)
|
5,619
|
||||||||
|
Joint
venture lots (2)
|
1,003
|
(57%)
|
2,306
|
(66%)
|
6,761
|
||||||||
|
Total
continuing operations
|
19,190
|
(20%)
|
24,131
|
(29%)
|
33,751
|
||||||||
|
Discontinued
operations
|
1
|
(80%)
|
5
|
(100%)
|
1,007
|
||||||||
|
Total
(including joint ventures) (2)
|
19,191
|
(20%)
|
24,136
|
(31%)
|
34,758
|
||||||||
_______________________________
|
(1)
|
Arizona
and Texas exclude the Tucson and San Antonio divisions, which are
classified as discontinued
operations.
|
|
(2)
|
Joint
venture lots represent our expected share of land development joint
venture lots and all of the lots of our homebuilding joint
ventures.
|
Total
building sites owned and controlled as of December 31, 2009 decreased 20% from
the year earlier period, reflecting our efforts to better align our land supply
with the current level of new housing demand.
|
At
December 31,
|
||||||||||||||||
|
2009
|
%
Change
|
2008
|
%
Change
|
2007
|
||||||||||||
|
Homes
under construction (including specs):
|
||||||||||||||||
|
Consolidated
(excluding podium projects)
|
934
|
(14%)
|
1,081
|
(48%)
|
2,085
|
|||||||||||
|
Podium
projects
|
―
|
(100%)
|
245
|
―
|
―
|
|||||||||||
|
Total
consolidated
|
934
|
(30%)
|
1,326
|
(36%)
|
2,085
|
|||||||||||
|
Joint
ventures
|
25
|
(86%)
|
183
|
(58%)
|
440
|
|||||||||||
|
Total
continuing operations (1)
|
959
|
(36%)
|
1,509
|
(40%)
|
2,525
|
|||||||||||
|
Discontinued
operations
|
―
|
―
|
―
|
(100%)
|
64
|
|||||||||||
|
Total
|
959
|
(36%)
|
1,509
|
(42%)
|
2,589
|
|||||||||||
|
Spec
homes under construction:
|
||||||||||||||||
|
Consolidated
(excluding podium projects)
|
530
|
(15%)
|
620
|
(43%)
|
1,089
|
|||||||||||
|
Podium
projects
|
―
|
(100%)
|
245
|
―
|
―
|
|||||||||||
|
Total
consolidated
|
530
|
(39%)
|
865
|
(21%)
|
1,089
|
|||||||||||
|
Joint
ventures
|
20
|
(87%)
|
154
|
(58%)
|
368
|
|||||||||||
|
Total
continuing operations (1)
|
550
|
(46%)
|
1,019
|
(30%)
|
1,457
|
|||||||||||
|
Discontinued
operations
|
―
|
―
|
―
|
(100%)
|
31
|
|||||||||||
|
Total
|
550
|
(46%)
|
1,019
|
(32%)
|
1,488
|
|||||||||||
|
Completed
and unsold homes:
|
||||||||||||||||
|
Consolidated
(excluding podium projects)
|
233
|
(60%)
|
589
|
(15%)
|
695
|
|||||||||||
|
Podium
projects
|
49
|
―
|
―
|
―
|
―
|
|||||||||||
|
Total
consolidated
|
282
|
(52%)
|
589
|
(15%)
|
695
|
|||||||||||
|
Joint
ventures
|
6
|
(77%)
|
26
|
(42%)
|
45
|
|||||||||||
|
Total
continuing operations (1)
|
288
|
(53%)
|
615
|
(17%)
|
740
|
|||||||||||
|
Discontinued
operations
|
―
|
(100%)
|
1
|
(98%)
|
54
|
|||||||||||
|
Total
|
288
|
(53%)
|
616
|
(22%)
|
794
|
|||||||||||
________________________________
|
(1)
|
Arizona
and Texas exclude the Tucson and San Antonio divisions, which are
classified as discontinued
operations.
|
We
continue to remain focused on managing the number of completed and unsold homes
and homes under construction we have in inventory to better match new
construction starts with lower sales volume. As of December 31, 2009,
the number of homes under construction from continuing operations (exclusive of
joint ventures) decreased 30% compared to December 31, 2008. Total
completed and unsold homes from continuing operations (excluding joint ventures)
as of December 31, 2009 decreased 52% compared to December 31, 2008, reflecting
our focus on managing our speculative inventory levels.
Financial
Services
For 2009,
our financial services subsidiary generated pretax income of approximately $1.3
million compared to a pretax loss of $72,000 in 2008. The increase in
2009 was driven primarily by an increase in margins on loans closed and sold
during 2009 and a decrease in personnel expenses due to a reduction in headcount
to better align our fixed overhead with lower production
levels. These changes were partially offset by a 14% year-over-year
decrease in the volume of loans closed and sold and a $1.5 million increase in
loan loss reserve expense to $4.6 million for 2009, primarily related to
indemnification and repurchase reserves. The decrease in volume of
loans closed and sold was primarily the result of a decrease in new home
deliveries in the markets in which our financial services subsidiary
operates.
For 2008,
our financial services subsidiary generated a pretax loss of approximately
$72,000 compared to pretax income of $632,000 in 2007. The decrease
in 2008 was driven primarily by a 42% decrease in the volume of loans sold and a
$0.9 million increase in loan loss reserves, primarily related to loans held for
investment. These decreases and charges were partially offset by an
increase in margins on loans sold during 2008 as compared to 2007 and a decrease
in personnel expenses.
The
following table details information regarding loan originations and related
credit statistics for our mortgage banking operations (exclusive of our mortgage
financing joint ventures):
|
Year
Ended December 31,
|
||||||
|
2009
|
2008
|
2007
|
||||
|
Mortgage
Loan Origination Product Mix:
|
||||||
|
Conforming
loans
|
40%
|
46%
|
61%
|
|||
|
Government
loans (FHA and VA)
|
60%
|
44%
|
7%
|
|||
|
Jumbo
loans
|
―
|
9%
|
26%
|
|||
|
Other
loans
|
―
|
1%
|
6%
|
|||
|
100%
|
100%
|
100%
|
||||
|
Loan
Type:
|
||||||
|
Fixed
|
98%
|
93%
|
80%
|
|||
|
ARM
|
2%
|
7%
|
20%
|
|||
|
Credit
Quality:
|
||||||
|
FICO
score ≥ 700
|
96%
|
94%
|
81%
|
|||
|
FICO
score between 620 - 699
|
4%
|
6%
|
18%
|
|||
|
FICO
score < 620 (sub-prime loans)
|
―
|
―
|
1%
|
|||
|
Avg.
FICO score
|
733
|
732
|
733
|
|||
|
Other
Data:
|
||||||
|
Avg.
combined LTV ratio
|
89%
|
87%
|
86%
|
|||
|
Full
documentation loans
|
100%
|
96%
|
61%
|
|||
|
Non-Full
documentation loans
|
―
|
4%
|
39%
|
|||
|
Loan Capture
Rates
|
80%
|
78%
|
76%
|
|||
Income Taxes
During
2009, we recorded a $96.6 million income tax benefit primarily related to a
$94.1 million benefit realized in connection with tax legislation that increased
the carryback of federal net operating losses from two years to five
years. We also generated a $42.7 million deferred tax asset during
2009 related to the pretax loss generated during the year, which was fully
reserved against through a non-cash valuation allowance. As of
December 31, 2009, we had a $534.6 million net deferred tax asset (excluding the
$9.4 million deferred tax asset relating to our interest rate swap) which has
been fully reserved against by a corresponding deferred tax asset valuation
allowance of the same amount. To the extent that we generate eligible
taxable income in the future, allowing us to utilize the tax benefits of the
related deferred tax assets, we will be able to reduce our effective tax rate,
subject to certain limitations under Internal Revenue Code Section 382 (“Section
382”), by reducing the valuation allowance and offsetting a portion of taxable
income. See Note 14 to our accompanying consolidated financial
statements for further discussion.
Discontinued
Operations
During
the fourth quarter of 2007, we sold substantially all of our Tucson and San
Antonio assets. The results of operations of our Tucson and San
Antonio divisions have been classified as discontinued operations in accordance
with ASC Topic 360, Property,
Plant, and Equipment, and prior periods have been reclassified to conform
with current year presentation.
Liquidity and
Capital Resources
Our
principal uses of cash over the last several years have been for:
|
· land
acquisitions
· operating
expenses
· joint
ventures (including capital contributions, remargin
payments and purchases of assets and partner interests)
|
· construction
and development expenditures
· principal
and interest payments on debt (including market
repurchases)
· market
expansion (including acquisitions)
· share
repurchases
· dividends
to our stockholders
|
Cash
requirements over the last several years have been met by:
|
· internally
generated funds
· bank
revolving credit facility
· land
option contracts
· land
seller notes
· sales
of our equity through public and private offerings
· proceeds
received upon the exercise of employee stock options
|
· public
and private note offerings (including convertible notes)
· bank
term loans
· joint
venture financings
· assessment
district bond financings
· issuance
of common stock as acquisition consideration
· mortgage
credit facilities
· tax
refunds
|
For
the year ended December 31, 2009, we generated $419.8 million in cash flows from
operating activities driven primarily from a $326.1 million decrease in our
inventories (largely due to a reduction in the number of completed and unsold
homes and the sale of two podium projects in Southern California) and the
receipt of a $114.5 million tax refund related to our 2008 federal tax
return. Cash flows used in investing activities was approximately
$27.3 million and included $14.7 million in remargin payments related to two
Southern California joint ventures. Cash flows used in financing
activities reflected the net repayment of $382.6 million of homebuilding debt
and $22.7 million in mortgage credit facility debt. As of December
31, 2009, our homebuilding cash balance was $602.2 million (including $15.1
million in restricted cash).
Revolving Credit Facility and Term
Loans. During 2009, we repaid in full and terminated our Term
Loan A credit facility. We also repaid in full and terminated the
revolving loan portion of our revolving credit facility and elected to reduce
the letter of credit commitment under the facility to $5 million. As
of December 31, 2009, we had $4.1 million in cash collateralized letters of
credit outstanding under the revolving credit facility. During
the third quarter of 2009, our $225 million Term Loan B credit facility was
amended to, among other things, eliminate most negative covenants and to
eliminate the liquidity test requiring the Company to maintain either a minimum
ratio of cash flow from operations to consolidated homebuilding interest
incurred or a minimum cash interest reserve. This liquidity test was
replaced with a new financial covenant requiring the Company to either (a)
maintain compliance with one of the following three ratios (i) a minimum ratio
of cash flow from operations to consolidated homebuilding interest incurred,
(ii) a minimum ratio of homebuilding EBITDA to consolidated homebuilding
interest incurred or (iii) a maximum ratio of combined net homebuilding debt to
consolidated tangible net worth or (b) pay a fee equal to 50 basis points per
quarter on the outstanding principal amount of the Term Loan B and prepay, on a
quarterly basis, an aggregate principal amount of $7.5 million of the Term Loan
B. As of December 31, 2009, we were in compliance with each of these
three ratios as illustrated below:
|
Covenant
Requirements
|
Actual
at
December
31, 2009
|
Covenant
Requirements
at
December
31, 2009
|
|||
|
Cash
Flow Coverage Ratio:
|
|||||
|
Cash
Flow from Operations to Consolidated Homebuilding
|
|||||
|
Interest
Incurred
|
4.94
|
≥
1.00
|
|||
|
Interest
Coverage Ratio:
|
|||||
|
Adjusted
Homebuilding EBITDA (as defined in the Term Loan B credit
facility) to Consolidated
|
|||||
|
Homebuilding
Interest Incurred
|
1.14
|
≥
1.00
|
|||
|
Total
Leverage Ratio:
|
|||||
|
Net
Homebuilding Debt to Adjusted Consolidated
|
|||||
|
Tangible
Net Worth Ratio
|
1.40
|
≤
3.00
|
|||
Letter of Credit
Facilities. As of December 31, 2009, we were party to
four letter of credit facilities (including the $5 million revolving credit
facility discussed above). These facilities, which require cash
collateralization of outstanding letters of credit, have
commitments that aggregate $65 million and, as of December 31, 2009, had a total
of $14.7 million in letters of credit outstanding that were secured by cash
collateral deposits of $15.1 million.
Senior and Senior Subordinated Notes.As
of December 31, 2009, we had $872.2 million of senior and senior subordinated
notes outstanding (the “Notes”). The Notes contain certain
restrictive covenants, including a limitation on additional indebtedness and a
limitation on restricted payments. Under the limitation on additional
indebtedness, we are permitted to incur specified categories of indebtedness but
are prohibited, aside from those exceptions, from incurring further indebtedness
if we do not satisfy either a leverage condition or an interest coverage
condition. As of December 31, 2009, we were unable to satisfy either
condition. As a result, our ability to incur further indebtedness is
limited. Exceptions to this limitation include new borrowings of up
to $550 million
under existing or future bank credit facilities, non-recourse purchase money
indebtedness (subject to available borrowing sources)
and indebtedness incurred for the purpose of refinancing or repaying existing
indebtedness.
Under
the limitation on restricted payments, we are also prohibited from making
restricted payments (which include investments in and advances to our joint
ventures and other unrestricted subsidiaries), if we do not satisfy either the
leverage condition or interest coverage condition. As of December 31,
2009, we were unable to satisfy either condition. Our ability to make
restricted payments is also subject to a basket limitation. Our
unrestricted subsidiaries are not subject to this prohibition. As of
December 31, 2009, we had approximately $408.3 million of cash in our
unrestricted subsidiaries available to fund our joint venture capital
requirements and to take actions that would otherwise constitute prohibited
restricted payments if made by us or our restricted subsidiaries.
The
leverage and interest coverage conditions contained in our 6¼% Senior Notes due
2014 (our most restrictive series of Notes based on the leverage condition as of
December 31, 2009) are set forth in the table below:
|
Covenant
and Other Requirements
|
Actual
at
December
31, 2009
|
Covenant
Requirements
at
December
31, 2009
|
|||||
|
Total
Leverage Ratio:
|
|||||||
|
Indebtedness
to Consolidated Tangible Net Worth Ratio
|
3.02
|
≤
|
2.25
|
(1)
|
|||
|
Interest
Coverage Ratio:
|
|||||||
|
EBITDA
(as defined in the indenture) to Consolidated Interest
Incurred
|
1.08
|
≥
|
2.00
|
||||
|
(1)
|
The
leverage ratio under the indenture governing our 9¼% Senior Subordinated
Notes due 2012
is ≤ 2.50.
|
Senior Subordinated Convertible
Notes. As of December 31,
2009, we had $45.6 million of Senior Subordinated Convertible Notes due 2012
outstanding (the “Convertible Notes”). In connection with the
adoption of certain provisions of ASC Topic 470, Debt (“ASC 470”), we
reclassified a portion of our Convertible Notes to stockholders equity ($11.8
million as of December 31, 2009) and the remaining principal amount will be
accreted to its redemption value of $45.6 million over the remaining term of
these notes. ASC 470 also requires the restatement of the principal
amount for any prior periods in which the Convertible Notes are
outstanding.
Transactions Impacting Senior and
Senior Subordinated Notes. On
September 17, 2009, a Standard Pacific Corp. subsidiary issued $280 million
of 10¾% senior notes due September 15, 2016 (the “2016 Notes”). We assumed our
subsidiary’s obligations under the 2016 Notes on October 9, 2009. The
2016 Notes rank equally with the other Notes. We used the net
proceeds from the issuance of the 2016 Notes (approximately $250.6 million) and
cash on hand to repurchase $133.4 million, $122.0 million, and $3.4 million
principal amount of our Notes due 2010, 2011 and 2013,
respectively.
During
the year ended December 31, 2009, we entered into three privately negotiated
transactions pursuant to which we repurchased at a discount $32.8 million
principal amount of our Convertible Notes in exchange for an aggregate of 7.6
million shares of our common stock. The Convertible Notes were
exchanged at a discount to their par value at an effective common stock issuance
price of $4.30 per share.
In
the future, we may, from time to time, undertake negotiated or open market
purchases of, or tender offers for, our Notes and Convertible Notes prior to
maturity when they can be purchased at prices that we believe are
attractive. We may also, from time to time, engage in exchange
transactions (including debt for equity and debt for debt transactions) for all
or part of our Notes and Convertible Notes. Such transactions, if
any, will depend on market conditions, our liquidity requirements, contractual
restrictions and other factors.
Joint Venture
Loans. As described more
particularly under the heading “Off-Balance Sheet Arrangements” beginning on
page 32, our land development and homebuilding joint ventures have typically
obtained secured acquisition, development and construction
financing. This financing is designed to reduce the use of funds from
corporate financing sources. Over the last several years both the
number of joint ventures in which we participate and the dollar value of loans
outstanding with respect to these joint ventures have been significantly
reduced. As of December 31, 2009, we held interests in eight active
joint ventures which had a total of approximately $38.8 million of borrowings
recourse to us (three joint ventures) and $178.4 million of nonrecourse
borrowings (one joint venture) outstanding.
Despite
the reduced size of our joint venture portfolio, we have, and likely will be
required in the future to, expend corporate resources for anticipated and
unanticipated obligations associated with these joint
ventures. During the year ended December 31, 2009, we assumed $77.3
million of project specific debt in connection with unwinding three joint
ventures and paid $23.0 million to satisfy other joint venture obligations which
consisted primarily of loan to value remargin payments and other payments
related to exiting certain joint ventures.
Secured Project Debt and Other Notes
Payable. At December 31,
2009, we had approximately $57.6 million outstanding in secured project debt
that was assumed in connection with the unwinding of three joint
ventures. In February 2010, we repaid in full two of the assumed
loans for approximately $32.4 million. The remaining loan matures on
March 31, 2010. We are actively engaged in discussion with the lender
to extend this loan.
At
December 31, 2009, we had approximately $1.9 million outstanding in other notes
payable. Our other notes payable consist of purchase money mortgage financing
and community development district and similar assessment district bond
financings used to finance land development and infrastructure costs for which
we are responsible.
Mortgage Credit
Facilities. At December 31,
2009, we had approximately $41.0 million outstanding under our mortgage
financing subsidiary’s mortgage credit facilities. These mortgage
credit facilities consist of a $45 million repurchase facility and a $60 million
early purchase facility. The lender generally does not have
discretion to refuse to fund requests under the repurchase facility if our
mortgage loans comply with the requirements of the facility, though the lender
has substantial discretion to modify these requirements from time to time, even
if any such modification adversely affects our mortgage financing subsidiary’s
ability to utilize the facility. The lender has the right to
terminate the repurchase facility on not less than 90 days
notice. These mortgage credit facilities are scheduled to mature in
July 2010 and require Standard Pacific Mortgage to maintain cash collateral
accounts aggregating $3.2 million. These facilities also contain financial
covenants which require Standard Pacific Mortgage to, among other things,
maintain a minimum level of tangible net worth, not to exceed a debt to tangible
net worth ratio, maintain a minimum liquidity of $5 million (inclusive of the
$3.2 million cash collateral requirement), and satisfy pretax income (loss)
requirements. As of December 31, 2009, Standard Pacific Mortgage was
in compliance with the financial and other covenants contained in these
facilities.
Surety
Bonds. Surety bonds serve as
a source of liquidity for the Company because they are used in lieu of cash
deposits and letters of credit that would otherwise be required by governmental
entities and other third parties to ensure our completion of the infrastructure
of our projects and other performance. At December 31, 2009, we had
approximately $226.3 million in surety bonds outstanding (exclusive of surety
bonds related to our joint ventures), with respect to which we had an estimated
$69.0 million remaining in cost to complete.
Tax Refunds. During 2009, we collected a tax refund of $114.5
million related to our 2008 federal net operating loss (“NOL”)
carryback. We recorded a federal income tax receivable of $103.2
million for the 2009 tax year as a result of new tax legislation which increased
the carryback of NOL’s from two years to five years. The federal
income tax receivable was included in homebuilding other assets at December 31,
2009. We expect to collect this refund in March
2010.
Availability of Additional
Liquidity. The availability
of additional capital, whether from private capital sources (including banks) or
the public capital markets, fluctuates as market conditions
change. There may be times when the private capital markets and the
public debt or equity markets lack sufficient liquidity or when our securities
cannot be sold at attractive prices, in which case we would not be able to
access capital from these sources. Based on current market conditions
and our financial condition (including our inability to satisfy the conditions
contained in our public note indentures that are required to be satisfied to
permit us to incur additional indebtedness, except through certain exceptions,
including the refinance exception), our ability to effectively access these
liquidity sources for new borrowing is significantly limited. In
addition, a further weakening of our financial condition or strength, including
in particular a material increase in our leverage or a further decrease in our
profitability or cash flows, could adversely affect our ability to obtain
necessary funds, result in a credit rating downgrade or change in outlook, or
otherwise increase our cost of borrowing. During the 2009 first
quarter, three credit rating agencies downgraded our corporate and debt ratings
and/or changed their outlook to negative due to deterioration in our financial
condition, coupled with the wide-spread decline in the general homebuilding
market. During the 2009 third quarter, one of the credit rating
agencies upgraded our rating and changed their outlook from negative to
developing.
Dividends. We paid no dividends to our stockholders during the
year ended December 31, 2009. Subject to limited exceptions, we are prohibited
by the terms of our public note indentures from paying dividends (other than
dividends paid in the form of capital stock or through an accretion to the
liquidation preference of any capital stock).
Stock Repurchases. We did not repurchase capital stock during the year
ended December 31, 2009. Subject to limited exceptions, we are
prohibited by the terms of our public note indentures from repurchasing capital
stock for cash.
Leverage. Our homebuilding leverage ratio was 72.6% at December
31, 2009 and our adjusted net homebuilding debt to adjusted total book
capitalization was 56.0%. This adjusted ratio reflects the offset of
homebuilding cash and excludes $41.0 million of indebtedness of our financial
services subsidiary and $1.9 million of indebtedness included in liabilities
from inventories not owned. We believe that this adjusted ratio is
useful to investors as an additional measure of our ability to
31
service debt. Our leverage level has been
negatively impacted over the last several years due to the reduction in our
equity base as a result of the significant level of impairments, operating
losses and deferred tax valuation allowances recorded by us as well
as by the debt we have had to assume in connection with joint venture
unwinds. The impact of these impairments on our leverage has been
offset in part by the $662 million in equity we raised in 2008, the $32.8
million in debt for equity exchanges completed during 2009 and the $94.1 million
tax benefit recorded during 2009 related to the federal NOL
carryback. Excluding the impact and timing of recording impairments,
historically, our leverage increases during the first three quarters of the year
and tapers off at year end.
Contractual
Obligations
The
following table summarizes our future estimated cash payments under existing
contractual obligations as of December 31, 2009, including estimated cash
payments due by period. Our purchase obligations primarily represent
commitments for land purchases under land purchase and land option contracts
with non-refundable deposits, estimated future payments under price and profit
participation agreements with land sellers and commitments for subcontractor
labor and material to be utilized in the normal course of
business.
|
Payments
Due by Period
|
|||||||||||||||||||
|
Total
|
Less
Than 1 Year
|
1-3
Years
|
4-5
Years
|
After
5
Years
|
|||||||||||||||
|
(Dollars
in thousands)
|
|||||||||||||||||||
|
Contractual Obligations
|
|||||||||||||||||||
|
Long-term
debt principal payments (1)
|
$ | 1,190,899 | $ | 58,256 | $ | 181,060 | $ | 496,583 | $ | 455,000 | |||||||||
|
Long-term
debt interest payments
|
426,463 | 93,597 | 169,947 | 103,842 | 59,077 | ||||||||||||||
|
Operating
leases (2)
|
17,105 | 7,254 | 7,803 | 1,640 | 408 | ||||||||||||||
|
Purchase
obligations (3)
|
297,771 | 255,647 | 36,867 | 5,257 | ― | ||||||||||||||
|
Total
(4)
|
$ | 1,932,238 | $ | 414,754 | $ | 395,677 | $ | 607,322 | $ | 514,485 | |||||||||
|
(1)
|
Long-term
debt represents senior and senior subordinated notes payable and secured
project debt and other notes payable. For a more detailed description of
our long-term debt, please see Note 7 in our accompanying consolidated
financial statements.
|
|
(2)
|
For
a more detailed description of our operating leases, please see Note 13.e.
in our accompanying consolidated financial
statements.
|
|
(3)
|
Includes
approximately $75.3 million (net of deposits) in non-refundable land
purchase and option contracts and $221.0 million in commitments under
development and construction contracts. For a more detailed description of
our land purchase and option contracts, please see “—Off-Balance Sheet
Arrangements” below and Note 13.a. in our accompanying consolidated
financial statements.
|
|
(4)
|
The
table above excludes $11.4 million of nonrecognized tax benefits as of
December 31, 2009. Due to the uncertainty of the timing of
settlement with taxing authorities, we are unable to make reasonable
estimates of the period of cash settlements. For a more
detailed description of our unrecognized tax benefit, please see Note 14
to our accompanying consolidated financial
statements.
|
At
December 31, 2009, we had a $45 million repurchase facility and a $60 million
early purchase facility and had $41.0 million outstanding under these
facilities.
Off-Balance
Sheet Arrangements
Land
Purchase and Option Agreements
We are
subject to customary obligations associated with entering into contracts for the
purchase of land and improved homesites. These purchase contracts typically
require a cash deposit or delivery of a letter of credit, and the purchase of
properties under these contracts is generally contingent upon satisfaction of
certain requirements by the sellers, including obtaining applicable property and
development entitlements. We also utilize option contracts with land
sellers and third-party financial entities as a method of acquiring land in
staged takedowns, to help us manage the financial and market risk associated
with land holdings, and to reduce the use of funds from our corporate financing
sources. Option contracts generally require a non-refundable deposit
for the right to acquire lots over a specified period of time at predetermined
prices. We generally have the right at our discretion to terminate
our obligations under both purchase contracts and option contracts by forfeiting
our cash deposit or by repaying amounts drawn under our letter of credit with no
further financial responsibility to the land seller, although in certain
instances, the land seller has the right to compel us to purchase a specified
number of lots at predetermined prices. Also, in a few instances
where we have entered into option contracts with third party financial entities,
we have generally entered into construction agreements that do not terminate if
we elect not to exercise our option. In these instances, we are
generally obligated to complete land development improvements on the optioned
property at a predetermined cost (paid by the option provider) and are
responsible for all cost overruns. At December 31, 2009, we had two
option contracts outstanding with third party financial entities with
approximately $2.6 million of remaining land development improvement costs, all
of which is anticipated to be funded by the option provider. In some
instances, we may also expend funds for due diligence, development and
construction activities with respect to our land purchase and option contracts
prior to purchase, which we would have to write off should we not purchase the
land. At December 31, 2009, we
32
had
non-refundable cash deposits and letters of credit outstanding of approximately
$4.3 million and capitalized preacquisition and other development and
construction costs of approximately $4.2 million relating to land purchase and
option contracts having a total remaining purchase price of approximately $75.3
million. Approximately $7.2 million of the remaining purchase price
is included in inventories not owned in the accompanying consolidated balance
sheets.
Our
utilization of option contracts is dependent on, among other things, the
availability of land sellers willing to enter into option takedown arrangements,
the availability of capital to financial intermediaries, general housing market
conditions, and geographic preferences. Options may be more difficult
to procure from land sellers in strong housing markets and are more prevalent in
certain geographic regions.
Land
Development and Homebuilding Joint Ventures
Historically,
we have entered into land development and homebuilding joint ventures from time
to time as a means of:
|
· accessing
lot positions
· establishing
strategic alliances
· leveraging
our capital base
|
· expanding
our market opportunities
· managing
the financial and market risk associated with land
holdings
|
These
joint ventures typically obtain secured acquisition, development and
construction financing, which is designed to reduce the use of funds from
corporate financing sources. Over the last several years both the
number of joint ventures in which we participate and the dollar value of loans
outstanding with respect to these joint ventures have been significantly
reduced. At December 31, 2009, our joint ventures had borrowings
outstanding that totaled approximately $217.2 million (of which $38.8 million
was recourse to us) compared to $421.8 million (of which $173.9 million was
recourse to us) as of December 31, 2008.
Despite
the reduced size of our joint venture portfolio, we may be required in the
future to expend corporate funds for anticipated and unanticipated obligations
associated with these joint ventures. Potential future obligations
may include payments associated with:
|
·
|
joint
venture loans (including to replace expiring loans, to satisfy loan
remargin and land development and construction completion obligations, and
to satisfy environmental indemnity
obligations)
|
|
·
|
joint
venture development and construction costs and cost overruns (including
the funding of the joint venture partner’s share when the partner is
unable or unwilling to make the required
contribution)
|
|
·
|
indemnity
obligations to joint venture surety
providers
|
|
·
|
joint
venture land takedown obligations
|
|
·
|
joint
venture unwinds (including the satisfaction of joint venture indebtedness
either through repayment or the assumption of such indebtedness, payments
required to be made to our partners in connection with the unwind, and the
remaining cost to complete former joint venture
projects)
|
During
the years ended December 31, 2009 and 2008, we assumed $77.3 million and $115.3
million, respectively, of project specific debt in connection with the unwinding
of three and four joint ventures, respectively, of which $57.6 million was
outstanding as of December 31, 2009. In addition, during 2009 and
2008 we paid $23.0 million and $85.8 million, respectively, to satisfy other
joint venture obligations which consisted primarily of loan to value remargin
payments and other payments related to exiting certain joint
ventures.
As of
December 31, 2009, we held membership interests in 19 homebuilding and land
development joint ventures, of which eight were active and 11 were inactive or
winding down. As of such date, three joint ventures had an aggregate
of $38.8 million in recourse project specific financing and one had $178.4
million of nonrecourse project specific financing. In addition, as of
December 31, 2009, we had $17.8 million of surety bonds outstanding subject to
indemnity arrangements by us and our partners and had an estimated $0.9 million
remaining in cost to complete.
The
following lists a number of recent developments regarding our joint
ventures.
|
·
|
Renegotiation/Loan Extension
& Loan-to-Value Maintenance Related Payments. During
the year ended December 31, 2009, we extended the loan maturity dates for
four of our joint ventures and made $14.7 million in remargin payments
related to two of these joint ventures. As of the date hereof,
the maturity dates of our three joint venture recourse loans range from
June 2010 to January 2011.
|
|
·
|
Purchases and
Consolidation. During the year ended December 31, 2009,
we purchased and unwound three Southern California joint
ventures. In connection with these transactions, we made
aggregate payments of approximately $1.1 million, assumed $77.3 million of
joint venture indebtedness, assumed 120 completed podium units, 57
finished lots, 16 completed or partially completed homes, and six model
homes. As of December 31, 2009, we had sold and delivered 102
of the assumed podium units and five of the completed
homes.
|
|
·
|
Joint Ventures
Exited. During the year ended December 31, 2009, we
exited our Chicago joint venture for a $7.3 million cash payment and
eliminated $19.8 million of joint venture recourse debt. In
addition, our Tucson, Arizona joint venture (included in discontinued
operations) forfeited the joint venture’s remaining real estate to the
lender in exchange for the elimination of approximately $23.8 million of
joint venture non-recourse debt.
|
|
·
|
North Las Vegas Joint
Venture. In May 2009, our joint venture in Las Vegas
filed for reorganization under Chapter 11 of the Bankruptcy
Code. The bankruptcy court confirmed the plan in October 2009,
which became effective subject to the resolution of any appeals on
November 19, 2009. The reorganization resulted in a reduction
of the joint venture’s debt balance to $178.4 million, all of which is
nonrecourse to us. In connection with implementation of the
plan we funded approximately $7.8 million to the joint venture during the
2009 fourth quarter, including $6.2 million to purchase approximately 59
acres of residential land from the venture. As of the date
hereof, there are two matters, which are not expected to impact the
confirmation of the plan, that require resolution before the bankruptcy
court is able to formally close the
case.
|
Critical Accounting
Policies
The
preparation of our consolidated financial statements requires us to make
estimates and judgments that affect the reported amounts of our assets,
liabilities, revenues and expenses, and the related disclosure of contingent
assets and liabilities. On an ongoing basis, we evaluate our
estimates and judgments, including those that impact our most critical
accounting policies. We base our estimates and judgments on
historical experience and various other assumptions that are believed to be
reasonable under the circumstances. Actual results may differ from
these estimates under different assumptions or conditions. We believe
that the accounting policies related to the following accounts or activities are
those that are most critical to the portrayal of our financial condition and
results of operations and require the more significant judgments and
estimates:
Segment
Reporting
We
operate two principal businesses: homebuilding and financial services
(consisting of our mortgage financing and title operations). In
accordance with ASC Topic 280, Segment Reporting (“ASC
280”), we have determined that each of our homebuilding operating divisions and
our financial services operations are our operating
segments. Corporate is a non-operating segment.
Our
homebuilding operations construct and sell single-family attached and detached
homes. In accordance with the aggregation criteria defined in ASC
280, our homebuilding operating segments have been grouped into three reportable
segments: California; Southwest, consisting of our operating divisions in
Arizona, Texas, Colorado and Nevada; and Southeast, consisting of our operating
divisions in Florida and the Carolinas. In particular, we have
determined that the homebuilding operating divisions within their respective
reportable segments have similar economic characteristics, including similar
historical and expected future long-term gross margin percentages. In
addition, the operating divisions also share all other relevant aggregation
characteristics prescribed in ASC 280, such as similar product types, production
processes and methods of distribution.
Our
mortgage financing operations provide mortgage financing to our homebuyers in
substantially all of the markets in which we operate. Our title
service operation provides title examinations for our homebuyers in
Texas. Our mortgage financing and title services operations are
included in our financial services reportable segment, which is separately
reported in our consolidated financial statements under “Financial
Services.”
Corporate
is a non-operating segment that develops and implements strategic initiatives
and supports our operating divisions by centralizing key administrative
functions such as finance and treasury, information technology, insurance and
risk management, litigation, and human resources. Corporate also
provides the necessary administrative functions to support us as a publicly
traded company. A substantial portion of the expenses incurred by
Corporate are allocated to each of the homebuilding operating divisions based on
their respective percentage of revenues.
Inventories
and Impairments
Inventories
consist of land, land under development, homes under construction, completed
homes and model homes and are stated at cost, net of impairment
losses. We capitalize direct carrying costs, including interest,
property taxes and related development costs to inventories. Field
construction supervision and related direct overhead are also included in the
capitalized cost of inventories. Direct construction costs are
specifically identified and allocated to homes while other common costs, such as
land, land improvements and carrying costs, are allocated to homes within a
community based upon their anticipated relative sales or fair
value.
We assess
the recoverability of real estate inventories in accordance with the provisions
of ASC Topic 360, Property,
Plant, and Equipment (“ASC 360”). ASC 360 requires long-lived
assets, including inventories, that are expected to be held and used in
operations to be carried at the lower of cost or, if impaired, the fair value of
the asset. ASC 360 requires that companies evaluate long-lived assets
for impairment based on undiscounted future cash flows of the assets at the
lowest level for which there is identifiable cash flows. Long-lived
assets to be disposed of are reported at the lower of carrying amount or fair
value less cost to sell.
We
evaluate real estate projects (including unconsolidated joint venture real
estate projects) for inventory impairments when indicators of potential
impairment are present. Indicators of impairment include, but are not limited
to: significant decreases in local housing market values and selling prices of
comparable homes; significant decreases in gross margins and sales absorption
rates; accumulation of costs in excess of budget; actual or projected operating
or cash flow losses; current expectations that a real estate asset will more
likely than not be sold before its previously estimated useful
life.
We
perform a detailed budget and cash flow review of all of our real estate
projects (including projects actively selling as well as projects under
development and on hold) on a periodic basis throughout each fiscal year to,
among other things, determine whether the estimated remaining undiscounted
future cash flows of the project are more or less than the carrying value of the
asset. If the undiscounted cash flows are more than the carrying
value of the real estate project, then no impairment adjustment is
required. However, if the undiscounted cash flows are less than the
carrying amount, then the asset is deemed impaired and is written-down to its
fair value. We evaluate the identifiable cash flows at the project
level. When estimating undiscounted future cash flows of a project,
we are required to make various assumptions, including the following: (i) the
expected sales prices and sales incentives to be offered, including the number
of homes available and pricing and incentives being offered in other communities
by us or by other builders; (ii) the expected sales pace and cancellation rates
based on local housing market conditions and competition; (iii) costs expended
to date and expected to be incurred in the future, including, but not limited
to, land and land development costs, home construction costs, interest costs,
indirect construction and overhead costs, and selling and marketing costs; (iv)
alternative product offerings that may be offered that could have an impact on
sales pace, sales price and/or building costs; and (v) alternative uses for the
property such as the possibility of a sale of lots to a third party versus the
sale of individual homes. Many of these assumptions are
interdependent and changing one assumption generally requires a corresponding
change to one or more of the other assumptions. For example,
increasing or decreasing the sales absorption rate has a direct impact on the
estimated per unit sales price of a home, the level of time sensitive costs
(such as indirect construction, overhead and carrying costs), and selling and
marketing costs (such as model maintenance costs and promotional and advertising
campaign costs). Depending on what objective we are trying to
accomplish with a community, it could have a significant impact on the project
cash flow analysis. For example, if our business objective is to
drive delivery levels our project cash flow analysis will be different than if
the business objective is to preserve operating margins. These
objectives may vary significantly from project to project, from division to
division, and over time with respect to the same project.
Once we
have determined a real estate project is impaired, we calculate the fair value
of the project under a land residual value analysis and in certain cases in
conjunction with a discounted cash flow analysis. Under the land
residual value analysis, we estimate what a willing buyer (including us) would
pay and what a willing seller would sell a parcel of land for (other than in a
forced liquidation) in order to generate a market rate operating margin based on
projected revenues, costs to develop land, and costs to construct and sell homes
within a community. Under the discounted cash flow method, all
estimated future cash inflows and outflows directly associated with the real
estate project are discounted to calculate fair value. The net
present value of these project cash flows are then compared to the carrying
value of the asset to determine the amount of the impairment that is
required. The land residual value analysis is the primary method that
we use to calculate impairments as it is the principal method used by us and
land sellers for determining the fair value of a residential parcel of
land. In many cases, we also supplement our land residual value
analysis with a discounted cash flow analysis in evaluating the fair
value. In addition, for projects that require a longer time frame to
develop and sell assets, in some instances we incorporate a certain level of
inflation or deflation into our projected revenue and cost
assumptions. This evaluation and the assumptions used by management
to determine future estimated cash flows and fair value require a substantial
degree of judgment, especially with respect to real estate projects that have a
substantial amount of development to be completed, have
35
not
started selling or are in the early stages of sales, or are longer-term in
duration. Due to the inherent uncertainty in the estimation process,
significant volatility in the demand for new housing, and the availability of
mortgage financing for potential homebuyers, actual results could differ
significantly from our estimates.
From time
to time, we write-off deposits and preacquisition costs related to land options
that we decide not to exercise. The decision not to exercise a land
option takes into consideration changes in market conditions, the timing of
required land takedowns, the willingness of land sellers to modify terms of the
land option contract (including the timing of land takedowns), the availability
and best use of our capital, and other factors. The write-off is
charged to homebuilding other income (expense) in our consolidated statement of
operations in the period that it is deemed probable that the optioned property
will not be acquired. If we recover deposits and/or preacquisition
costs which were previously written off, the recoveries are recorded to
homebuilding other income (expense) in the period received.
Homebuilding
Revenue and Cost of Sales
Homebuilding
revenue and cost of sales are recognized after construction is completed, a
sufficient down payment has been received, title has transferred to the
homebuyer, collection of the purchase price is reasonably assured and we have no
continuing involvement. Cost of sales is recorded based upon total estimated
costs to be allocated to each home within a community. Any changes to the
estimated costs are allocated to the remaining undelivered lots and homes within
their respective community. The estimation and allocation of these costs
requires a substantial degree of judgment by management.
The
estimation process involved in determining relative sales or fair values is
inherently uncertain because it involves estimating future sales values of homes
before delivery. Additionally, in determining the allocation of costs to a
particular land parcel or individual home, we rely on project budgets that are
based on a variety of assumptions, including assumptions about construction
schedules and future costs to be incurred. It is common that actual results
differ from budgeted amounts for various reasons, including construction delays,
increases in costs that have not been committed or unforeseen issues encountered
during construction that fall outside the scope of existing contracts, or costs
that come in less than originally anticipated. While the actual results for a
particular construction project are accurately reported over time, a variance
between the budget and actual costs could result in the understatement or
overstatement of costs and have a related impact on gross margins between
reporting periods. To reduce the potential for such variances, we have
procedures that have been applied on a consistent basis, including assessing and
revising project budgets on a periodic basis, obtaining commitments from
subcontractors and vendors for future costs to be incurred, and utilizing the
most recent information available to estimate costs. We believe that these
policies and procedures provide for reasonably dependable estimates for purposes
of calculating amounts to be relieved from inventories and expensed to cost of
sales in connection with the sale of homes.
Variable Interest
Entities
We
account for variable interest entities in accordance with ASC Topic 810, Consolidation (“ASC 810”).
Under ASC 810, a variable interest entity (“VIE”) is created when (i) the equity
investment at risk in the entity is not sufficient to permit the entity to
finance its activities without additional subordinated financial support
provided by other parties, including the equity holders, (ii) the entity’s
equity holders as a group either (a) lack the direct or indirect ability to make
decisions about the entity, (b) are not obligated to absorb expected losses of
the entity or (c) do not have the right to receive expected residual returns of
the entity or (iii) the entity’s equity holders have voting rights that are not
proportionate to their economic interests, and the activities of the entity
involve or are conducted on behalf of the equity holder with disproportionately
few voting rights. If an entity is deemed to be a VIE pursuant to ASC 810, the
enterprise that is deemed to absorb a majority of the entity’s expected losses,
receive a majority of the entity’s expected residual returns, or both, is
considered the primary beneficiary and must consolidate the VIE. Expected losses
and residual returns for VIEs are calculated based on the probability of
estimated future cash flows as defined in ASC 810.
Limited
Partnerships and Limited Liability Companies
We
analyze our homebuilding and land development joint ventures under the
provisions of ASC 810 (as discussed above) when determining whether the entity
should be consolidated. In accordance with the provisions of ASC 810, limited
partnerships or similar entities, such as limited liability companies, must be
further evaluated under the presumption that the general partner, or the
managing member in the case of a limited liability company, is deemed to have a
controlling interest and therefore must consolidate the entity unless the
limited partners or non-managing members have: (1) the ability, either by a
single limited partner or through a simple majority vote, to dissolve or
liquidate the entity, or kick-out the managing member/general partner without
cause, or (2) substantive participatory rights that are exercised in the
ordinary course of business. Examples of these participatory rights include, but
are not limited to:
|
·
|
selecting,
terminating or setting compensation levels for management that sets
policies and procedures for the
entity;
|
|
·
|
establishing
and approving operating and capital decisions of the entity, including
budgets, in the ordinary course of
business;
|
|
·
|
setting
and approving sales price releases;
and
|
|
·
|
approving
material contracts.
|
Evaluating
whether the limited partners or non-managing members have substantive
participatory rights is subjective and requires substantial judgment including
the evaluation of various qualitative and quantitative factors. Some of these
factors include:
|
·
|
determining
whether there are significant barriers that would prevent the limited
partners or non-managing members from exercising their
rights;
|
|
·
|
analyzing
the level of participatory rights possessed by the limited partners or
non-managing members relative to the rights retained by the general
partner or managing member;
|
|
·
|
evaluating
whether the limited partners or non-managing members exercise their rights
in the ordinary course of business;
and
|
|
·
|
evaluating
the ownership and economic interests of the general partner or managing
member relative to the limited partners’ or non-managing members’
ownership interests.
|
If we are
the general partner or managing member and it is determined that the limited
partners or non-managing member have either kick-out rights or substantive
participatory rights as described above, then we account for the joint venture
under the equity method of accounting. If the limited partners or non-managing
members do not have either of these rights, then we would consolidate the
related joint venture under the provisions of ASC 810. As of December 31, 2009
and 2008, we did not have any joint ventures consolidated in our balance sheets
as a result of applying the provisions of ASC 810.
Unconsolidated Homebuilding and Land
Development Joint Ventures
Investments
in our unconsolidated homebuilding and land development joint ventures are
accounted for under the equity method of accounting. Under the equity
method, we recognize our proportionate share of earnings and losses earned by
the joint venture upon the delivery of lots or homes to third
parties. All joint venture profits generated from land sales to us
are deferred and recorded as a reduction to our cost basis in the lots purchased
until the homes are ultimately sold by us to third parties. Our share
of joint venture losses from land sales to us are recorded in the current
period. Our ownership interests in our unconsolidated joint ventures
vary but are generally less than or equal to 50%.
We review
inventory projects within our unconsolidated joint ventures for impairments
consistent with the critical accounting policy described above under
“Inventories and Impairments.” We also review our investments in
unconsolidated joint ventures for evidence of an other than temporary decline in
value. To the extent that we deem any portion of our investment in
unconsolidated joint ventures not recoverable, we impair our investment
accordingly.
In
addition, we accrue for guarantees provided to unconsolidated joint ventures
when it is determined that there is an obligation that is due from
us. These obligations consist of various items, including but not
limited to, surety indemnities credit enhancements provided in connection with
joint venture borrowings such as loan-to-value maintenance agreements,
construction completion agreements, and environmental indemnities. In
many cases we share these obligations with our joint
37
venture
partners, and in some cases, we are solely responsible for such
obligations. For further discussion regarding these guarantees,
please see “Management’s Discussion and Analysis of Financial Condition –
Off-Balance Sheet Arrangements” and Note 13 of the accompanying consolidated
financial statements.
Business
Combinations and Goodwill
We
account for acquisitions of other businesses under the purchase method of
accounting in accordance with ASC Topic 805, Business Combinations (“ASC
805”). Under the purchase method of accounting, the assets acquired
and liabilities assumed are recorded at their estimated fair
values. Any purchase price paid in excess of the net fair values of
tangible and identified intangible assets less liabilities assumed is recorded
as goodwill. The estimation of fair values of assets and liabilities
and the allocation of purchase price requires a substantial degree of judgment
by management, especially with respect to valuations of real estate inventories,
which at the time of acquisition, are generally in various stages of
development. Actual revenues, costs and time to complete and sell a
community could vary from estimates used to determine the allocation of purchase
price between tangible and intangible assets. The allocation of
purchase price between asset groups, including inventories and goodwill, could
have an impact on the timing and ultimate recognition of expenses and therefore
impact our current and future operating results. Our reported income
(loss) from an acquired company includes the operations of the acquired company
from the date of acquisition.
The
excess amount paid for business acquisitions over the net fair value of assets
acquired and liabilities assumed is capitalized as goodwill in accordance with
ASC 805. ASC Topic 350, Intangibles – Goodwill and
Other (“ASC 350”) addresses financial accounting and reporting for
acquired goodwill and other intangible assets. ASC 350 requires that goodwill
not be amortized but instead assessed at least annually for impairment and
expensed against earnings as a noncash charge if the estimated fair value of a
reporting unit is less than its carrying value, including
goodwill. We test goodwill for impairment annually as of October 1 or
more frequently if an event occurs or circumstances change that more likely than
not reduce the value of a reporting unit below its carrying
value. For purposes of goodwill impairment testing, we compare the
fair value of each reporting unit with its carrying amount, including
goodwill. For this purpose, each of our homebuilding operating
divisions is considered a reporting unit. The fair value of each
reporting unit is determined based on expected discounted cash flows. Each
division’s discounted cash flows consist of a 10-year projection and a terminal
value calculation. The discount rates used to calculate the net
present value of future cash flows approximated our estimated pretax cost of
capital. The terminal value is based on the present value of a
stabilized cash flow estimate (including an expected growth rate) that we expect
the operating division to generate beyond the tenth year of the projected cash
flows. Other assumptions and factors that are evaluated in connection
with analyzing the discounted cash flows of a division, include but are not
limited to:
|
·
|
historical
and projected revenue and volume
levels;
|
|
·
|
historical
and projected gross margins and pretax income
levels;
|
|
·
|
historical
and projected inventory turn ratio;
and
|
|
·
|
estimated
capital requirements.
|
If the
carrying amount of a reporting unit exceeds its fair value, goodwill is
considered impaired. If goodwill is considered impaired, the
impairment loss to be recognized is measured by the amount by which the carrying
amount of the goodwill exceeds the implied fair value of that
goodwill.
Inherent
in our fair value determinations are certain judgments and
estimates. A change in these underlying assumptions would cause a
change in the results of the tests, which could cause the fair value of one or
more reporting units to be less than their respective carrying
amounts. In addition, to the extent that there are significant
changes in market conditions or overall economic conditions or our strategic
plans change, it is possible that our conclusion regarding goodwill impairment
could change, which could have a material adverse effect on our financial
position and results of operations.
Warranty
Accruals
In the
normal course of business, we incur warranty-related costs associated with homes
that have been delivered to homebuyers. Estimated future direct
warranty costs are accrued and charged to cost of sales in the period when the
related homebuilding revenues are recognized while indirect warranty overhead
salaries and related costs are charged to cost of sales in the period
incurred. Amounts accrued are based upon historical experience
rates. We review the adequacy of the warranty accruals each reporting
period by evaluating the historical warranty experience in each market in which
we operate, and the warranty accruals are adjusted as appropriate for current
quantitative and qualitative factors. Factors that affect the
warranty accruals include the number of homes delivered, historical and
anticipated rates of warranty claims, and cost per
claim.
38
Although
we consider the warranty accruals reflected in our consolidated balance sheet to
be adequate, actual future costs could differ from our currently estimated
amounts.
Insurance
and Litigation Accruals
Insurance
and litigation accruals are established with respect to estimated future claims
cost. We maintain general liability insurance designed to protect us
against a portion of our risk of loss from construction-related
claims. We also generally require our subcontractors and design
professionals to indemnify us for liabilities arising from their work, subject
to various limitations. We record reserves to cover our estimated
costs of self-insured retentions and deductible amounts under these policies and
estimated costs for claims that may not be covered by applicable insurance or
indemnities. Estimation of these accruals include consideration of
our claims history, including current claims, estimates of claims incurred but
not yet reported, and potential for recovery of costs from insurance and other
sources. We utilize the services of an independent third party
actuary to assist us with evaluating the level of our insurance and litigation
accruals. Because of the high degree of judgment required in
determining these estimated accrual amounts, actual future claim costs could
differ significantly from our currently estimated amounts.
Income
Taxes
We
account for income taxes in accordance with ASC Topic 740, Income Taxes (“ASC
740”). This statement requires an asset and a liability approach for
measuring deferred taxes based on temporary differences between the financial
statement and tax bases of assets and liabilities existing at each balance sheet
date using enacted tax rates for years in which taxes are expected to be paid or
recovered.
We
evaluate our deferred tax assets on a quarterly basis to determine whether a
valuation allowance is required. In accordance with ASC 740, we
assess whether a valuation allowance should be established based on our
determination of whether it is more likely than not that some portion or all of
the deferred tax assets will not be realized. The ultimate
realization of deferred tax assets depends primarily on: (i) our ability to
carry back net operating losses to tax years where we have previously paid
income taxes based on applicable federal law; and (ii) our ability to generate
future taxable income during the periods in which the related temporary
differences become deductible. The assessment of a valuation
allowance includes giving appropriate consideration to all positive and negative
evidence related to the realization of the deferred tax asset. This
assessment considers, among other things, the nature, frequency and severity of
current and cumulative losses, forecasts of future profitability, the duration
of statutory carryforward periods, our experience with operating loss and tax
credit carryforwards not expiring unused, and tax planning
alternatives. Significant judgment is required in determining the
future tax consequences of events that have been recognized in our consolidated
financial statements and/or tax returns. Differences between
anticipated and actual outcomes of these future tax consequences could have a
material impact on our consolidated financial position or results of
operations.
We
generated significant deferred tax assets during 2007 through 2009, largely due
to inventory, joint venture and goodwill impairments and have been in a
cumulative loss position as described in ASC 740 since December 31,
2007. During the years ended December 31, 2009, 2008 and 2007, we
recorded noncash valuation allowances of $42.7 million, $473.6 million and
$180.5 million, respectively, against our net deferred tax assets. In
addition, we recorded a $94.1 million reversal of our deferred tax asset
valuation allowance due to the tax legislation that extended the carryback of
net operating losses from two years to five years. Our total
valuation allowance was $534.6 million and $654.1 million at December 31, 2009
and 2008, respectively. To the extent that we generate eligible
taxable income in the future, allowing us to utilize the tax benefits of the
related deferred tax assets, we will be able to reduce our effective tax rate,
subject to certain limitations under Internal Revenue Code Section 382, by
reducing the valuation allowance and offsetting a portion of taxable income.
Conversely, any future operating losses generated by us in the near term would
increase the deferred tax asset valuation allowance and adversely impact our
income tax provision (benefit) to the extent we are in a cumulative loss
position as described in ASC 740.
Recent
Accounting Pronouncements
On
January 1, 2009, we adopted certain provisions of ASC Topic 805, Business Combinations (“ASC
805”). These provisions expand the application of ASC 805 to all
transactions and other events in which one entity obtains control over one or
more other businesses. ASC 805 broadens the fair value measurement
and recognition of assets acquired, liabilities assumed, and interests
transferred as a result of business combinations. It also requires that the
acquisition method of accounting be used for all business combinations and for
an acquirer to be identified for each business combination. It also establishes
principles and requirements for how the acquirer recognizes and measures in its
financial statements the
39
identifiable
assets acquired, the liabilities assumed, and any noncontrolling interest in the
acquiree. The adoption of these provisions also requires additional
disclosures to improve the statement users’ abilities to evaluate the nature and
financial effects of business combinations. Adoption is prospective,
and early adoption was not permitted. These new provisions are effective for us
for any business combination entered into subsequent to January 1,
2009. The adoption of these new provisions on January 1, 2009
did not have a material impact on our consolidated financial
statements.
On
January 1, 2009, we adopted certain provisions of ASC Topic 810, Consolidation (“ASC 810”),
which require that a noncontrolling interest in a subsidiary be reported as
equity and the amount of consolidated net income specifically attributable to
the noncontrolling interest be reported separately in the consolidated income
statement and consolidated statement of equity. It also calls for consistency in
the manner of reporting changes in the parent’s ownership interest and requires
fair value measurement of any noncontrolling equity investment retained in a
deconsolidation. Upon adoption on January 1, 2009, minority
interests were reclassified to noncontrolling interests as a separate component
in equity for all periods presented. The adoption of these provisions
did not impact earnings per share attributable to our common
stockholders.
In March
2008, the FASB updated certain provisions of ASC Topic 815, Derivatives and Hedging (“ASC
815”). Under these new provisions, entities are required to provide
enhanced disclosures about (a) how and why an entity uses derivative
instruments, (b) how derivative instruments and related hedged items are
accounted for under ASC 815, and (c) how derivative instruments and related
hedged items affect an entity’s financial position, financial performance, and
cash flows. We adopted the provisions of ASC 815 on January 1,
2009 and have included the required disclosures in Note 2.v. “Derivative
Instruments and Hedging Activities” of the accompanying consolidated financial
statements.
In May
2008, the FASB updated certain provisions of ASC Topic 470, Debt (“ASC
470”). These new provisions require bifurcation of a component of
convertible debt instruments, classification of that component in stockholder’s
equity, and then accretion of the resulting discount on the debt to result in
interest expense equal to the issuer’s nonconvertible debt borrowing
rate. These new provisions of ASC 470 are effective for financial
statements issued for fiscal years beginning after December 15, 2008,
and interim periods within those fiscal years. Retroactive application to
all periods presented is required. As a result, we have retroactively
applied the standard to our financial statements for all periods
presented. We adopted these new provisions of ASC 470 as of
January 1, 2009 and the adoption impacted the historical accounting for our
6% Senior Subordinated Convertible Notes due 2012 (the “Convertible Notes”)
resulting in an increase to additional paid-in capital of $31.8 million with an
offset to accumulated deficit of $3.7 million, inventories owned of $2.6 million
and senior subordinated notes payable of $25.5 million as of January 1,
2009. During 2008, MatlinPatterson exchanged $21.6 million principal
amount of the Convertible Notes for a warrant to purchase shares of Series B
Preferred Stock at a common stock equivalent exercise price of $4.10 per
share. In connection with the exchange, we derecognized $7.6 million of
unamortized discount of the Convertible Notes, which was reflected in the $31.8
million adjustment to additional paid-in capital recorded upon adoption on
January 1, 2009. During 2009, we repurchased at a discount $32.8
million principal amount of the Convertible Notes in exchange for an aggregate
of 7.6 million shares of our common stock. In connection with the
exchange, we derecognized $9.3 million of unamortized discount of the
Convertible Notes. The remaining balance of the Convertible Notes
will be accreted to its redemption value, approximately $45.6 million, over the
remaining term of these notes. The unamortized discount of the
Convertible Notes, which was included in additional paid-in capital, was $11.8
million and $25.5 million at December 31, 2009 and December 31, 2008,
respectively. In addition, approximately $2.5 million and $4.6
million of interest related to amortization of the discount was capitalized to
inventories, and $2.0 million and $0.4 million was expensed directly to interest
expense during 2009 and 2008, respectively. Interest capitalized to
inventories owned is included in cost of sales as related units are sold (please
see Note 2.q. “Capitalization of Interest” of the accompanying consolidated
financial statements).
On
January 1, 2009, we adopted certain provisions of ASC Topic 260, Earnings per Share (“ASC
260”), which provide that unvested share-based payment awards that contain
non-forfeitable rights to dividends or dividend equivalents (whether paid or
unpaid) are participating securities and require that they be included in the
computation of earnings per share. These new provisions of ASC 260 are effective
for financial statements issued for fiscal years beginning after
December 15, 2008, and interim periods within those years, and require
retrospective application. During the year ended December 31, 2009, we had no
unvested share-based payment awards outstanding. In addition, during the years
ended December 2008 and 2007, the holders of any unvested share-based payment
awards were not required to participate in losses of the Company. The adoption
of these new provisions of ASC 260 on January 1, 2009 did not have an
impact on our results of operations, financial position or earnings per
share.
In April
2009, the FASB updated certain provisions of ASC Topic 825, Financial Instruments (“ASC
825”) and ASC Topic 270, Interim Reporting (“ASC
270”). These new provisions require that the fair value disclosures
required for all financial instruments within the scope of ASC 825 be included
in interim financial statements. ASC 825 also requires entities to disclose the
method and significant assumptions used to estimate the fair value of financial
instruments on an interim and
40
annual
basis and to highlight any changes from prior periods. These new
provisions of ASC 825 are effective for interim periods ending after
June 15, 2009. The adoption of ASC 825 did not have a material
impact on our consolidated financial statements (please see Note 12 “Disclosures
about Fair Value” of the accompanying consolidated financial
statements).
In May
2009, the FASB issued ASC Topic 855, Subsequent Events (“ASC
855”), which provides guidance to establish general standards of accounting for
and disclosures of events that occur after the balance sheet date but before
financial statements are issued or are available to be issued. ASC 855 sets
forth (i) the period after the balance sheet date during which management
of a reporting entity should evaluate events or transactions that may occur for
potential recognition or disclosure in the financial statements, (ii) the
circumstances under which an entity should recognize events or transactions
occurring after the balance sheet date in its financial statements, and
(iii) the disclosures that an entity should make about events or
transactions that occurred after the balance sheet date. ASC
855 is effective for interim periods ending after June 15,
2009. Pursuant to ASC 855 we have evaluated subsequent events through
the date that the consolidated financial statements were issued for the year
ended December 31, 2009.
In
June 2009, the FASB updated ASC Topic 810, Consolidation (“ASC 810”) to
among other things, (i) define the primary beneficiary of a variable
interest entity (“VIE”) as the enterprise that has both (a) the power to
direct the activities of a VIE that most significantly impact the entity’s
economic performance and (b) the obligation to absorb losses of the entity
or the right to receive benefits from the entity that could potentially be
significant to the VIE, (ii) require ongoing reassessments of whether an
enterprise is the primary beneficiary of a VIE, and (iii) add an additional
reconsideration event for determining whether an entity is a VIE when any
changes in facts and circumstances occur such that the holders of the equity
investment at risk, as a group, lose the power from voting rights or similar
rights to direct the activities of the entity that most significantly impact the
entity’s economic performance. We do not expect the adoption of the
updated provisions of ASC 810 to have a material impact on our consolidated
financial statements. However, upon adoption on January 1, 2010, we
expect to derecognize approximately $5.4 million of inventories not owned
related to option contracts, $1.9 million of liabilities from inventories not
owned, and $3.5 million of noncontrolling interests related to three VIE’s
consolidated as of December 31, 2009 since we do not have power to direct the
activities of the VIE that most significantly impact the entity’s economic
performance.
In July
2009, the FASB updated certain provisions of ASC 470, which provide guidance to
share lending arrangements executed in connection with a convertible debt
offering or other financing and require that share lending arrangements be
measured at fair value, recognized as a debt issuance cost with an offset to
stockholders’ equity, and then amortized as interest expense over the life of
the financing arrangement. These new provisions of ASC 470 are effective
for interim or annual periods beginning on or after June 15, 2009 for share
lending arrangements entered in during fiscal year 2009. For all
arrangements that existed prior to fiscal year 2009, retrospective application
is required beginning January 1, 2010. We are currently in the process of
determining the impact of adopting these new provisions of ASC 470 on our
financial condition and results of operations.
FORWARD-LOOKING
STATEMENTS
This
report contains “forward-looking statements” within the meaning of the Private
Securities Litigation Reform Act of 1995, Section 27A of the Securities Act of
1933, as amended, and Section 21E of the Securities Exchange Act of 1934, as
amended. In addition, other statements we may make from time to time,
such as press releases, oral statements made by Company officials and other
reports we file with the Securities and Exchange Commission, may also contain
such forward-looking statements. These statements, which represent
our expectations or beliefs regarding future events, may include, but are not
limited to, statements regarding:
|
·
|
the
alignment of our overhead structure with current delivery levels and our
speculative starts with sales;
|
|
·
|
our
belief that our restructuring activities are substantially complete and
the amount of savings that will result from such
restructuring;
|
|
·
|
our
efforts to generate cash, reduce real estate inventories and to better
align our land supply with the current levels of new housing
demand;
|
|
·
|
the
potential need for, and magnitude of, unanticipated joint venture
expenditures requiring the use of our
funds;
|
|
·
|
our
ability to obtain reimbursement from our partners for their share of joint
venture remargin obligations;
|
|
·
|
the
potential for additional impairments and further deposit and capitalized
preacquisition cost write-offs;
|
|
·
|
our
ability to renegotiate, restructure or extend joint venture loans on
acceptable terms;
|
|
·
|
a
slowdown in demand and a decline in new home
orders;
|
|
·
|
housing
market conditions and trends in the geographic markets in which we
operate;
|
|
·
|
our
expectations about sales orders, sales cancellation rates, the value and
delivery of our backlog;
|
|
·
|
the
likelihood that we will be required to complete lot takedowns on
uneconomic terms;
|
|
·
|
the
future availability of lot option
structures;
|
|
·
|
our
ability to obtain surety bonds, the need to provide security to obtain
surety bonds, and the impact on our
liquidity;
|
|
·
|
the
sufficiency of our capital resources and ability to access additional
capital, including the sufficiency of unrestricted funds available to
satisfy joint venture obligations and make other restricted
payments;
|
|
·
|
continuation
of our historical leverage trends;
|
|
·
|
our
exposure to loss with respect to land under purchase contract and optioned
property;
|
|
·
|
the
extent of our liability for VIE obligations and the estimates we utilize
in making VIE determinations;
|
|
·
|
expected
performance by derivative
counterparties;
|
|
·
|
estimated
remaining cost to complete the infrastructure of our
projects;
|
|
·
|
future
warranty costs;
|
|
·
|
litigation
outcomes and related costs;
|
|
·
|
our
ability to comply with the covenants contained in our debt
instruments;
|
|
·
|
the
estimated fair value of our swap
agreements;
|
|
·
|
the
market risk associated with loans originated by Standard Pacific Mortgage,
Inc.;
|
|
·
|
plans
to purchase our notes prior to maturity and to engage in debt exchange
transactions;
|
|
·
|
our
intention to continue to utilize joint venture
arrangements;
|
|
·
|
our
future marketing plans and
strategies;
|
|
·
|
trends
relating to forced mortgage loan
repurchases;
|
|
·
|
the
extent and magnitude of our exposure to defective Chinese
drywall;
|
|
·
|
changes
to our unrealized tax benefits;
|
|
·
|
the
expected equity award forfeiture rates and vesting periods of unrecognized
compensation expense;
|
|
·
|
our
ability to realize the value of our deferred tax assets;
and
|
|
·
|
the
impact of recent accounting
standards.
|
Forward-looking
statements are based on our current expectations or beliefs regarding future
events or circumstances, and you should not place undue reliance on these
statements. Such statements involve known and unknown risks,
uncertainties, assumptions and other factors—many of which are out of our
control and difficult to forecast—that may cause actual results to differ
materially from those that may be described or implied. Such factors
include, but are not limited to, the risks described in this Annual Report under
the heading “Risk Factors.”
Except as
required by law, we assume no, and hereby disclaim any, obligation to update any
of the foregoing or any other forward-looking statements. We
nonetheless reserve the right to make such updates from time to time by press
release, periodic report or other method of public disclosure without the need
for specific reference to this report. No such update shall be deemed
to indicate that other statements not addressed by such update remain correct or
create an obligation to provide any other updates.
We are
exposed to market risks related to fluctuations in interest rates on our
rate-locked loan commitments, mortgage loans held for sale and outstanding
variable rate debt. Other than interest rate swaps used to manage our
exposure to changes in interest rates on our variable rate-based term loans, we
did not utilize swaps, forward or option contracts on interest rates, foreign
currencies or commodities, or other types of derivative financial instruments as
of or during the year ended December 31, 2009. We do not enter into
or hold derivatives for trading or speculative purposes. Many of the
statements contained in this section are forward looking and should be read in
conjunction with our disclosures under the heading “Forward-Looking
Statements.”
We have
interest rate swap agreements that effectively fixed our 3-month LIBOR rates for
our Term Loan B through its scheduled maturity date. The swap
agreements have been designated as cash flow hedges and as of December 31, 2009,
the estimated fair value of the swap represented a liability of $24.7 million
and was included in accrued liabilities in our consolidated balance
sheets.
As part
of our ongoing operations, we provide mortgage loans to our homebuyers through
our mortgage financing subsidiary, Standard Pacific
Mortgage. Standard Pacific Mortgage manages the interest rate risk
associated with making loan commitments and holding loans for sale by preselling
loans. Preselling loans consists of obtaining commitments (subject to
certain conditions) from third party investors to purchase the mortgage loans
while concurrently extending interest rate locks
42
to loan
applicants. Before completing the sale to these investors, Standard
Pacific Mortgage finances these loans under its mortgage credit facilities for a
short period of time (typically for 15 to 30 days), while the investors complete
their administrative review of the applicable loan documents. While
preselling these loans reduces our risk, we remain subject to risk relating to
purchaser non-performance, particularly during periods of significant market
turmoil. As of December 31, 2009, Standard Pacific Mortgage had
approximately $86.8 million in closed mortgage loans held for sale and mortgage
loans in process that were presold to investors subject to completion of the
investors’ administrative review of the applicable loan documents.
The table below details
the principal amount and the average interest rates for the mortgage loans held
for sale and outstanding debt for each category based upon the expected maturity
or disposition dates. Certain mortgage loans held for sale require
periodic principal payments prior to the expected maturity date. The
fair value estimates for these mortgage loans held for sale are based upon
future discounted cash flows of similar type notes or quoted market prices for
similar loans. The fair value of our variable rate debt, which consists of our
Senior Term Loan B and our mortgage credit facilities, is based on quoted market
prices for the same or similar instruments as of December 31,
2009. Our fixed rate debt consists of secured project debt and other
notes payable, senior notes payable and senior subordinated notes payable. The
interest rates on our secured project debt and other notes payable approximate
the current rates available for secured real estate financing with similar terms
and maturities and, as a result, their carrying amounts approximate fair
value. Our senior notes payable and senior subordinated notes payable
are publicly traded debt instruments and their fair values are based on their
quoted market prices as of December 31, 2009.
|
Expected
Maturity Date
|
||||||||||||||||||||||||||||
|
Estimated
|
||||||||||||||||||||||||||||
|
December
31,
|
2010
|
2011
|
2012
|
2013
|
2014
|
Thereafter
|
Total
|
Fair
Value
|
||||||||||||||||||||
|
(Dollars
in thousands)
|
||||||||||||||||||||||||||||
|
Assets:
|
||||||||||||||||||||||||||||
|
Mortgage
loans held for sale (1)
|
$
|
41,048
|
$
|
―
|
$
|
―
|
$
|
―
|
$
|
―
|
$
|
―
|
$
|
41,048
|
$
|
41,048
|
||||||||||||
|
Average
interest rate
|
4.9%
|
―
|
―
|
―
|
―
|
―
|
4.9%
|
|||||||||||||||||||||
| Mortgage loans held for investment |
$
|
141
|
$
|
151
|
$
|
162
|
$
|
174
|
$
|
187
|
$
|
10,003
|
$
|
10,818
|
$
|
10,818
|
||||||||||||
|
Average
interest rate
|
7.3%
|
7.3%
|
7.4%
|
7.4%
|
7.4%
|
7.8%
|
7.8%
|
|||||||||||||||||||||
|
Liabilities:
|
||||||||||||||||||||||||||||
|
Fixed
rate debt
|
$
|
58,256
|
$
|
64,943
|
$
|
116,117
|
$
|
121,583
|
$
|
150,000
|
$
|
455,000
|
$
|
965,899
|
$
|
914,719
|
||||||||||||
|
Average
interest rate
|
5.3%
|
6.3%
|
8.0%
|
7.8%
|
6.3%
|
9.3%
|
7.9%
|
|||||||||||||||||||||
|
Variable
rate debt
|
$
|
40,995
|
$
|
―
|
$
|
―
|
$
|
225,000
|
$
|
―
|
$
|
―
|
$
|
265,995
|
$
|
227,745
|
||||||||||||
|
Average
interest rate
|
4.6%
|
―
|
―
|
7.3%
|
―
|
―
|
6.8%
|
|||||||||||||||||||||
|
Off-Balance
Sheet Financial Instruments:
|
||||||||||||||||||||||||||||
|
Commitments
to originate mortgage
loans:
|
||||||||||||||||||||||||||||
|
Notional
amount
|
$
|
45,774
|
$
|
―
|
$
|
―
|
$
|
―
|
$
|
―
|
$
|
―
|
$
|
45,774
|
$
|
46,481
|
||||||||||||
|
Average
interest rate
|
4.9%
|
―
|
―
|
―
|
―
|
―
|
4.9%
|
|||||||||||||||||||||
|
(1)
|
Substantially
all of the amounts presented in this line item for 2010 reflect the
expected date of disposition of certain loans rather than the actual
scheduled maturity dates of these
mortgages.
|
Based on the
current interest rate management policies we have in place with respect to most
of our mortgage loans held for sale, commitments to originate rate-locked
mortgage loans and outstanding debt, we do not believe that the future market
rate risks related to the above securities will have a material adverse impact
on our financial position, results of operations or liquidity.
To the
Board of Directors and Stockholders of Standard Pacific Corp.:
We have
audited the accompanying consolidated balance sheets of Standard Pacific Corp.
and subsidiaries as of December 31, 2009 and 2008, and the related consolidated
statements of operations, equity and cash flows for each of the three years in
the period ended December 31, 2009. These financial statements are the
responsibility of the Company’s management. Our responsibility is to express an
opinion on these financial statements based on our audits.
We
conducted our audits in accordance with the standards of the Public Company
Accounting Oversight Board (United States). Those standards require that we plan
and perform the audit to obtain reasonable assurance about whether the financial
statements are free of material misstatement. An audit includes examining, on a
test basis, evidence supporting the amounts and disclosures in the financial
statements. An audit also includes assessing the accounting principles used and
significant estimates made by management, as well as evaluating the overall
financial statement presentation. We believe that our audits provide a
reasonable basis for our opinion.
In our
opinion, the financial statements referred to above present fairly, in all
material respects, the consolidated financial position of Standard Pacific Corp.
and subsidiaries at December 31, 2009 and 2008, and the consolidated results of
their operations and their cash flows for each of the three years in the period
ended December 31, 2009, in conformity with U.S. generally accepted accounting
principles.
As
discussed in Note 2.x. to the consolidated financial statements, on January 1,
2009 the Company adopted Financial Accounting Standard No. 160, later codified
in ASC 810-10, “Noncontrolling
Interests in Consolidated Financial Statements” and also adopted Staff
Position No. APB 14-1, later codified in ASC 470-20, “Debt with Conversion and Other
Options.” All years and periods presented have been
reclassified to conform to the adopted accounting standards.
We also
have audited, in accordance with the standards of the Public Company Accounting
Oversight Board (United States), Standard Pacific Corp.’s internal control over
financial reporting as of December 31, 2009, based on criteria established in
Internal Control—Integrated Framework issued by the Committee of Sponsoring
Organizations of the Treadway Commission and our report dated March 5, 2010
expressed an unqualified opinion thereon.
|
|
/s/
ERNST &
YOUNG
LLP
|
|
|
Irvine,
California
|
|
|
March
5, 2010
|
STANDARD
PACIFIC CORP. AND SUBSIDIARIES
|
Year
Ended December 31,
|
||||||||||||
|
2009
|
2008
|
2007
|
||||||||||
|
(Dollars
in thousands, except per share amounts)
|
||||||||||||
|
Homebuilding:
|
||||||||||||
|
Home
sale revenues
|
$
|
1,060,502
|
$
|
1,521,640
|
$
|
2,607,824
|
||||||
|
Land
sale revenues
|
105,895
|
13,976
|
281,009
|
|||||||||
|
Total
revenues
|
1,166,397
|
1,535,616
|
2,888,833
|
|||||||||
|
Cost
of home sales
|
(907,058)
|
(2,107,758)
|
(2,520,264)
|
|||||||||
|
Cost
of land sales
|
(117,517)
|
(124,786)
|
(568,539)
|
|||||||||
|
Total
cost of sales
|
(1,024,575)
|
(2,232,544)
|
(3,088,803)
|
|||||||||
|
Gross
margin
|
141,822
|
(696,928)
|
(199,970)
|
|||||||||
|
Selling,
general and administrative expenses
|
(191,488)
|
(305,480)
|
(387,981)
|
|||||||||
|
Loss
from unconsolidated joint ventures
|
(4,717)
|
(151,729)
|
(190,025)
|
|||||||||
|
Interest
expense
|
(47,458)
|
(10,380)
|
―
|
|||||||||
|
Gain
(loss) on early extinguishment of debt
|
(6,931)
|
(15,695)
|
1,087
|
|||||||||
|
Other
income (expense)
|
(2,296)
|
(57,628)
|
(69,697)
|
|||||||||
|
Homebuilding
pretax loss
|
(111,068)
|
(1,237,840)
|
(846,586)
|
|||||||||
|
Financial
Services:
|
||||||||||||
|
Revenues
|
13,145
|
13,587
|
16,677
|
|||||||||
|
Expenses
|
(11,817)
|
(13,659)
|
(16,045)
|
|||||||||
|
Income
from unconsolidated joint ventures
|
119
|
854
|
1,050
|
|||||||||
|
Other
income
|
139
|
234
|
611
|
|||||||||
|
Financial
services pretax income
|
1,586
|
1,016
|
2,293
|
|||||||||
|
Loss
from continuing operations before income taxes
|
(109,482)
|
(1,236,824)
|
(844,293)
|
|||||||||
|
Benefit
for income taxes
|
96,265
|
5,495
|
149,003
|
|||||||||
|
Loss
from continuing operations
|
(13,217)
|
(1,231,329)
|
(695,290)
|
|||||||||
|
Loss
from discontinued operations, net of income taxes
|
(569)
|
(2,286)
|
(52,540)
|
|||||||||
|
Loss
from disposal of discontinued operations, net of income
taxes
|
―
|
―
|
(19,550)
|
|||||||||
|
Net
loss
|
(13,786)
|
(1,233,615)
|
(767,380)
|
|||||||||
|
Less:
Net loss allocated to preferred shareholders
|
8,371
|
489,229
|
―
|
|||||||||
|
Net
loss available to common stockholders
|
$
|
(5,415)
|
$
|
(744,386)
|
$
|
(767,380)
|
||||||
|
Basic
Loss Per Common Share:
|
||||||||||||
|
Continuing
operations
|
$
|
(0.06)
|
$
|
(9.12)
|
$
|
(9.63)
|
||||||
|
Discontinued
operations
|
―
|
(0.02)
|
(1.00)
|
|||||||||
|
Basic
loss per common share
|
$
|
(0.06)
|
$
|
(9.14)
|
$
|
(10.63)
|
||||||
|
Diluted
Loss Per Common Share:
|
||||||||||||
|
Continuing
operations
|
$
|
(0.06)
|
$
|
(9.12)
|
$
|
(9.63)
|
||||||
|
Discontinued
operations
|
―
|
(0.02)
|
(1.00)
|
|||||||||
|
Diluted
loss per common share
|
$
|
(0.06)
|
$
|
(9.14)
|
$
|
(10.63)
|
||||||
|
Weighted
Average Common Shares Outstanding:
|
||||||||||||
|
Basic
|
95,623,851
|
81,439,248
|
72,157,394
|
|||||||||
|
Diluted
|
95,623,851
|
81,439,248
|
72,157,394
|
|||||||||
|
Weighted
Average If-Converted Preferred Shares Outstanding:
|
147,812,786
|
53,523,829
|
―
|
|||||||||
|
Cash dividends per
share
|
$
|
―
|
$
|
―
|
$
|
0.12
|
||||||
The
accompanying notes are an integral part of these consolidated
statements.
STANDARD
PACIFIC CORP. AND SUBSIDIARIES
|
December
31,
|
|||||||||
|
2009
|
2008
|
||||||||
|
(Dollars
in thousands)
|
|||||||||
|
ASSETS
|
|||||||||
|
Homebuilding:
|
|||||||||
|
Cash
and equivalents
|
$
|
587,152
|
$
|
622,157
|
|||||
|
Restricted
cash
|
15,070
|
4,222
|
|||||||
|
Trade
and other receivables
|
12,676
|
21,008
|
|||||||
|
Inventories:
|
|||||||||
|
Owned
|
986,322
|
1,262,521
|
|||||||
|
Not
owned
|
11,770
|
42,742
|
|||||||
|
Investments
in unconsolidated joint ventures
|
40,415
|
50,468
|
|||||||
|
Deferred
income taxes, net
|
9,431
|
14,122
|
|||||||
|
Other
assets
|
131,086
|
145,567
|
|||||||
|
1,793,922
|
2,162,807
|
||||||||
|
Financial
Services:
|
|||||||||
|
Cash
and equivalents
|
8,407
|
3,681
|
|||||||
|
Restricted
cash
|
3,195
|
4,295
|
|||||||
|
Mortgage
loans held for sale, net
|
41,048
|
63,960
|
|||||||
|
Mortgage
loans held for investment, net
|
10,818
|
11,736
|
|||||||
|
Other
assets
|
3,621
|
4,792
|
|||||||
|
67,089
|
88,464
|
||||||||
|
Assets
of discontinued operations
|
―
|
1,217
|
|||||||
|
Total
Assets
|
$
|
1,861,011
|
$
|
2,252,488
|
|||||
|
LIABILITIES
AND EQUITY
|
|||||||||
|
Homebuilding:
|
|||||||||
|
Accounts
payable
|
$
|
22,702
|
$
|
40,225
|
|||||
|
Accrued
liabilities
|
196,135
|
216,418
|
|||||||
|
Liabilities
from inventories not owned
|
3,713
|
24,929
|
|||||||
|
Revolving
credit facility
|
―
|
47,500
|
|||||||
|
Secured
project debt and other notes payable
|
59,531
|
111,214
|
|||||||
|
Senior
notes payable
|
993,018
|
1,204,501
|
|||||||
|
Senior
subordinated notes payable
|
104,177
|
123,222
|
|||||||
|
1,379,276
|
1,768,009
|
||||||||
|
Financial
Services:
|
|||||||||
|
Accounts
payable and other liabilities
|
1,436
|
3,657
|
|||||||
|
Mortgage
credit facilities
|
40,995
|
63,655
|
|||||||
|
42,431
|
67,312
|
||||||||
|
Liabilities
of discontinued operations
|
―
|
1,331
|
|||||||
|
Total
Liabilities
|
1,421,707
|
1,836,652
|
|||||||
|
Equity:
|
|||||||||
|
Stockholders'
Equity:
|
|||||||||
|
Preferred
stock, $0.01 par value; 10,000,000 shares authorized;
450,829
|
|||||||||
|
issued
and outstanding at December 31, 2009 and 2008,
respectively
|
5
|
5
|
|||||||
|
Common
stock, $0.01 par value; 600,000,000 shares authorized;105,293,180
and
|
|||||||||
|
100,624,350
shares issued and outstanding at December 31, 2009 and 2008,
respectively
|
1,053
|
1,006
|
|||||||
|
Additional
paid-in capital
|
1,030,664
|
996,492
|
|||||||
|
Accumulated
deficit
|
(580,628)
|
(566,842)
|
|||||||
|
Accumulated
other comprehensive loss, net of tax
|
(15,296)
|
(22,720)
|
|||||||
|
Total
Stockholders' Equity
|
435,798
|
407,941
|
|||||||
|
Noncontrolling
interest
|
3,506
|
7,895
|
|||||||
|
Total
Equity
|
439,304
|
415,836
|
|||||||
|
Total
Liabilities and Equity
|
$
|
1,861,011
|
$
|
2,252,488
|
|||||
The
accompanying notes are an integral part of these consolidated balance
sheets.
STANDARD PACIFIC
CORP. AND SUBSIDIARIES
|
Years
Ended December 31, 2007, 2008 and 2009
|
Number
of Preferred
Shares
|
Preferred
Stock
|
Number
of Common
Shares
|
Common
Stock
|
Additional
Paid in Capital
|
Retained
Earnings (Deficit)
|
Accumulated
Other Comprehensive Loss
|
Total
Stockholders'
Equity
|
Noncontrolling
Interest
|
Total
Equity
|
|||||||||||||||||||
|
(Dollars
in thousands, except per share amounts)
|
|||||||||||||||||||||||||||||
|
Balance,
December 31, 2006
|
―
|
$
|
―
|
64,422,548
|
$
|
644
|
$
|
323,099
|
$
|
1,446,043
|
$
|
(5,416)
|
$
|
1,764,370
|
$
|
69,287
|
$
|
1,833,657
|
|||||||||||
|
ASC
Topic 740 adoption (FIN 48)
|
―
|
―
|
―
|
―
|
―
|
(4,112)
|
―
|
(4,112)
|
―
|
(4,112)
|
|||||||||||||||||||
|
Net
loss
|
―
|
―
|
―
|
―
|
―
|
(767,380)
|
―
|
(767,380)
|
―
|
(767,380)
|
|||||||||||||||||||
|
Change
in fair value of interest rate swaps,
|
|||||||||||||||||||||||||||||
|
net
of tax
|
―
|
―
|
―
|
―
|
―
|
―
|
(7,267)
|
(7,267)
|
―
|
(7,267)
|
|||||||||||||||||||
|
Comprehensive
loss
|
(774,647)
|
―
|
(774,647)
|
||||||||||||||||||||||||||
|
Stock
issuances under employee plans,
|
|||||||||||||||||||||||||||||
|
including
income tax benefits
|
―
|
―
|
533,231
|
5
|
5,373
|
―
|
―
|
5,378
|
―
|
5,378
|
|||||||||||||||||||
|
Issuance
of common stock under share
|
|||||||||||||||||||||||||||||
|
lending
facility
|
―
|
―
|
7,839,809
|
79
|
―
|
―
|
―
|
79
|
―
|
79
|
|||||||||||||||||||
|
Convertible
Note issuance (Note 2.x.)
|
―
|
―
|
―
|
―
|
39,395
|
―
|
―
|
39,395
|
―
|
39,395
|
|||||||||||||||||||
|
Repurchase
of and retirement of common
|
|||||||||||||||||||||||||||||
|
stock,
net of expenses
|
―
|
―
|
(105,993)
|
(1)
|
(2,900)
|
―
|
―
|
(2,901)
|
―
|
(2,901)
|
|||||||||||||||||||
|
Cash
dividends declared ($0.12 per share)
|
―
|
―
|
―
|
―
|
―
|
(7,778)
|
―
|
(7,778)
|
―
|
(7,778)
|
|||||||||||||||||||
|
Senior
subordinated convertible notes
|
|||||||||||||||||||||||||||||
|
hedge
payments, net of taxes
|
―
|
―
|
―
|
―
|
(5,655)
|
―
|
―
|
(5,655)
|
―
|
(5,655)
|
|||||||||||||||||||
|
Amortization
of stock-based compensation
|
―
|
―
|
―
|
―
|
20,150
|
―
|
―
|
20,150
|
―
|
20,150
|
|||||||||||||||||||
|
Change
in noncontrolling interest
|
|||||||||||||||||||||||||||||
|
attributable
to lot option contracts
|
―
|
―
|
―
|
―
|
―
|
―
|
―
|
―
|
(31,086)
|
(31,086)
|
|||||||||||||||||||
|
Balance,
December 31, 2007
|
―
|
―
|
72,689,595
|
727
|
379,462
|
666,773
|
(12,683)
|
1,034,279
|
38,201
|
1,072,480
|
|||||||||||||||||||
|
Net
loss
|
―
|
―
|
―
|
―
|
―
|
(1,233,615)
|
―
|
(1,233,615)
|
―
|
(1,233,615)
|
|||||||||||||||||||
|
Change
in fair value of interest rate swaps,
|
|||||||||||||||||||||||||||||
|
net
of tax
|
―
|
―
|
―
|
―
|
―
|
―
|
(10,037)
|
(10,037)
|
―
|
(10,037)
|
|||||||||||||||||||
|
Comprehensive
loss
|
(1,243,652)
|
―
|
(1,243,652)
|
||||||||||||||||||||||||||
|
Issuance
of Preferred Stock, net of
|
|||||||||||||||||||||||||||||
|
issuance
costs
|
450,829
|
5
|
―
|
―
|
410,844
|
―
|
―
|
410,849
|
―
|
410,849
|
|||||||||||||||||||
|
Issuance
of Warrant, net of issuance costs
|
―
|
―
|
―
|
―
|
131,759
|
―
|
―
|
131,759
|
―
|
131,759
|
|||||||||||||||||||
|
Convertible
Note exchanged for
|
|||||||||||||||||||||||||||||
|
Warrant
(Note 2.x.)
|
―
|
―
|
―
|
―
|
(7,633)
|
―
|
―
|
(7,633)
|
―
|
(7,633)
|
|||||||||||||||||||
|
Issuance
of common shares in connection
|
|||||||||||||||||||||||||||||
|
with
rights offering, net of issuance costs
|
―
|
―
|
27,187,137
|
272
|
78,160
|
―
|
―
|
78,432
|
―
|
78,432
|
|||||||||||||||||||
|
Stock
issuances under employee plans,
|
|||||||||||||||||||||||||||||
|
including
income tax benefits
|
―
|
―
|
963,149
|
9
|
(6,486)
|
―
|
―
|
(6,477)
|
―
|
(6,477)
|
|||||||||||||||||||
|
Repurchase
of and retirement of common
|
|||||||||||||||||||||||||||||
|
stock,
net of expenses
|
―
|
―
|
(215,531)
|
(2)
|
(724)
|
―
|
―
|
(726)
|
―
|
(726)
|
|||||||||||||||||||
|
Amortization
of stock-based compensation
|
―
|
―
|
―
|
―
|
11,110
|
―
|
―
|
11,110
|
―
|
11,110
|
|||||||||||||||||||
|
Change
in noncontrolling interest
|
|||||||||||||||||||||||||||||
|
attributable
to lot option contracts
|
―
|
―
|
―
|
―
|
―
|
―
|
―
|
―
|
(30,306)
|
(30,306)
|
|||||||||||||||||||
|
Balance,
December 31, 2008
|
450,829
|
5
|
100,624,350
|
1,006
|
996,492
|
(566,842)
|
(22,720)
|
407,941
|
7,895
|
415,836
|
|||||||||||||||||||
|
Net
loss
|
―
|
―
|
―
|
―
|
―
|
(13,786)
|
―
|
(13,786)
|
―
|
(13,786)
|
|||||||||||||||||||
|
Change
in fair value of interest rate swaps,
|
|||||||||||||||||||||||||||||
|
net
of tax
|
―
|
―
|
―
|
―
|
―
|
―
|
7,424
|
7,424
|
―
|
7,424
|
|||||||||||||||||||
|
Comprehensive
loss
|
(6,362)
|
―
|
(6,362)
|
||||||||||||||||||||||||||
|
Issuance of
common stock in connection
|
|||||||||||||||||||||||||||||
|
with
debt for equity exchange
|
―
|
―
|
7,640,463
|
76
|
24,455
|
―
|
―
|
24,531
|
―
|
24,531
|
|||||||||||||||||||
|
Stock
issuances under employee plans,
|
|||||||||||||||||||||||||||||
|
including
income tax benefits
|
―
|
―
|
948,272
|
10
|
929
|
―
|
―
|
939
|
―
|
939
|
|||||||||||||||||||
|
Common
stock returned under share lending
|
|||||||||||||||||||||||||||||
|
facility
|
―
|
―
|
(3,919,905)
|
(39)
|
39
|
―
|
―
|
―
|
―
|
―
|
|||||||||||||||||||
|
Amortization
of stock-based compensation
|
―
|
―
|
―
|
―
|
8,749
|
―
|
―
|
8,749
|
―
|
8,749
|
|||||||||||||||||||
|
Change
in noncontrolling interest
|
|||||||||||||||||||||||||||||
|
attributable
to lot option contracts
|
―
|
―
|
―
|
―
|
―
|
―
|
―
|
―
|
(4,389)
|
(4,389)
|
|||||||||||||||||||
|
Balance,
December 31, 2009
|
450,829
|
$
|
5
|
105,293,180
|
$
|
1,053
|
$
|
1,030,664
|
$
|
(580,628)
|
$
|
(15,296)
|
$
|
435,798
|
$
|
3,506
|
$
|
439,304
|
|||||||||||
The
accompanying notes are an integral part of these consolidated
statements.
STANDARD
PACIFIC CORP. AND SUBSIDIARIES
|
Year
Ended December 31,
|
|||||||||||||
|
2009
|
2008
|
2007
|
|||||||||||
|
(Dollars
in thousands)
|
|||||||||||||
|
Cash
Flows From Operating Activities:
|
|||||||||||||
|
Income
(loss) from continuing operations
|
$
|
(13,217)
|
$
|
(1,231,329)
|
$
|
(695,290)
|
|||||||
|
Income
(loss) from discontinued operations, net of income taxes
|
(569)
|
(2,286)
|
(52,540)
|
||||||||||
|
Loss
from disposal of discontinued operations, net of income
taxes
|
―
|
―
|
(19,550)
|
||||||||||
|
Adjustments
to reconcile net income (loss) to net cash provided by (used
in)
|
|||||||||||||
|
operating
activities:
|
|||||||||||||
|
Loss
from unconsolidated joint ventures
|
4,598
|
150,875
|
198,674
|
||||||||||
|
Cash
distributions of income from unconsolidated joint ventures
|
3,465
|
1,975
|
16,717
|
||||||||||
|
Depreciation
and amortization
|
3,516
|
6,634
|
8,396
|
||||||||||
|
Loss
on disposal of property and equipment
|
2,611
|
2,792
|
1,439
|
||||||||||
|
(Gain)
loss on early extinguishment of debt
|
6,931
|
15,695
|
(1,087)
|
||||||||||
|
Amortization
of stock-based compensation
|
12,864
|
11,110
|
20,150
|
||||||||||
|
Excess
tax benefits from share-based payment arrangements
|
(297)
|
―
|
(1,498)
|
||||||||||
|
Deferred
income taxes
|
(45,133)
|
(343,754)
|
(135,741)
|
||||||||||
|
Deferred
tax asset valuation allowance
|
(51,429)
|
473,627
|
180,480
|
||||||||||
|
Inventory
impairment charges and write-offs of deposits and
capitalized
|
|||||||||||||
|
preacquisition
costs
|
62,940
|
968,743
|
815,145
|
||||||||||
|
Goodwill
impairment charges
|
―
|
35,522
|
65,754
|
||||||||||
|
Changes
in cash and equivalents due to:
|
|||||||||||||
|
Trade
and other receivables
|
8,440
|
6,408
|
45,083
|
||||||||||
|
Mortgage
loans held for sale
|
24,718
|
91,380
|
99,618
|
||||||||||
|
Inventories
- owned
|
326,062
|
34,567
|
399,432
|
||||||||||
|
Inventories
- not owned
|
(2,805)
|
1,049
|
10,449
|
||||||||||
|
Other
assets
|
118,265
|
142,834
|
(245,723)
|
||||||||||
|
Accounts
payable
|
(18,554)
|
(57,949)
|
(13,105)
|
||||||||||
|
Accrued
liabilities
|
(22,576)
|
(44,742)
|
(41,245)
|
||||||||||
|
Net
cash provided by (used in) operating activities
|
419,830
|
263,151
|
655,558
|
||||||||||
|
Cash
Flows From Investing Activities:
|
|||||||||||||
|
Proceeds
from disposition of discontinued operations
|
―
|
―
|
40,850
|
||||||||||
|
Investments
in unconsolidated homebuilding joint ventures
|
(28,600)
|
(113,493)
|
(329,258)
|
||||||||||
|
Distributions
from unconsolidated homebuilding joint ventures
|
3,524
|
104,164
|
115,412
|
||||||||||
|
Other
investing activities
|
(2,225)
|
(2,250)
|
(24,819)
|
||||||||||
|
Net
cash provided by (used in) investing activities
|
(27,301)
|
(11,579)
|
(197,815)
|
||||||||||
|
Cash
Flows From Financing Activities:
|
|||||||||||||
|
Change
in restricted cash
|
(9,748)
|
(8,517)
|
―
|
||||||||||
|
Net
proceeds from (payments on) revolving credit facility
|
(47,500)
|
(42,500)
|
(199,500)
|
||||||||||
|
Principal
payments on secured project debt and other notes
payable
|
(125,984)
|
(20,318)
|
(8,512)
|
||||||||||
|
Redemption
of senior notes payable
|
(466,689)
|
(167,375)
|
(46,235)
|
||||||||||
|
Proceeds
from the issuance of senior subordinated convertible notes
|
―
|
―
|
100,000
|
||||||||||
|
Proceeds
from the issuance of senior notes payable
|
257,592
|
―
|
―
|
||||||||||
| Payment of debt issuance costs | (8,764) | ― | (3,000) | ||||||||||
|
Purchase
of senior subordinated convertible note hedge
|
―
|
―
|
(9,120)
|
||||||||||
|
Net
proceeds from (payments on) mortgage credit facilities
|
(22,660)
|
(100,517)
|
(86,735)
|
||||||||||
|
Excess
tax benefits from share-based payment arrangements
|
297
|
―
|
1,555
|
||||||||||
|
Dividends
paid
|
―
|
―
|
(7,778)
|
||||||||||
|
Repurchases
of common stock
|
―
|
(726)
|
(2,901)
|
||||||||||
|
Net
proceeds from the issuance of preferred stock and the issuance of
warrant
|
―
|
404,233
|
―
|
||||||||||
|
Net
proceeds from the issuance of common stock
|
―
|
78,432
|
79
|
||||||||||
|
Proceeds
from the exercise of stock options
|
641
|
―
|
3,862
|
||||||||||
|
Net
cash provided (used in) by financing activities
|
(422,815)
|
142,712
|
(258,285)
|
||||||||||
|
Net
increase (decrease) in cash and equivalents
|
(30,286)
|
394,284
|
199,458
|
||||||||||
|
Cash
and equivalents at beginning of year
|
625,845
|
231,561
|
32,103
|
||||||||||
|
Cash
and equivalents at end of year
|
$
|
595,559
|
$
|
625,845
|
$
|
231,561
|
|||||||
|
Cash
and equivalents at end of year
|
$
|
595,559
|
$
|
625,845
|
$
|
231,561
|
|||||||
|
Homebuilding
restricted cash at end of year
|
15,070
|
4,222
|
―
|
||||||||||
|
Financial
services restricted cash at end of year
|
3,195
|
4,295
|
―
|
||||||||||
|
Cash
and equivalents and restricted cash at end of year
|
$
|
613,824
|
$
|
634,362
|
$
|
231,561
|
|||||||
The
accompanying notes are an integral part of these consolidated
statements.
48
STANDARD
PACIFIC CORP. AND SUBSIDIARIES
NOTES
TO CONSOLIDATED FINANCIAL STATEMENTS
We
operate as a geographically diversified builder of single-family attached and
detached homes for use as primary residences with operations in the major
metropolitan markets in California, Florida, Arizona, Texas, the Carolinas,
Colorado and Nevada. We also provide mortgage financing services to our
homebuyers through our mortgage banking subsidiary and title
examination services to our Texas homebuyers through our title services
subsidiary. Unless the context otherwise requires, the terms “we,” “us,”
“our” and “the Company” refer to Standard Pacific Corp. and its
subsidiaries.
Our
percentage of home deliveries by state (including deliveries by unconsolidated
joint ventures) for the years ended December 31, 2009, 2008 and 2007 were as
follows:
|
Year Ended December 31,
|
||||||
|
State
|
2009
|
2008
|
2007
|
|||
|
California
|
41%
|
38%
|
33%
|
|||
|
Florida
|
22
|
18
|
16
|
|||
|
Arizona
|
8
|
11
|
13
|
|||
|
Texas
|
12
|
13
|
12
|
|||
|
Carolinas
|
12
|
11
|
12
|
|||
|
Colorado
|
4
|
5
|
5
|
|||
|
Nevada
|
1
|
1
|
1
|
|||
|
Discontinued
operations
|
―
|
3
|
8
|
|||
|
Total
|
100%
|
100%
|
100%
|
|||
We
generate a significant amount of our revenues and profits and losses in
California. In addition, a significant portion of our business,
revenues and profits and losses outside of California are concentrated in
Florida.
2.
Summary of Significant Accounting Policies
a.
Basis of Presentation
The
consolidated financial statements include the accounts of Standard Pacific
Corp., its wholly owned subsidiaries and accounts of consolidated variable
interest entities. All significant intercompany accounts and transactions have
been eliminated.
b.
Use of Estimates
The
preparation of financial statements in conformity with U.S. generally accepted
accounting principles requires management to make estimates and assumptions that
affect the reported amounts of assets and liabilities and disclosure of
contingent assets and liabilities at the date of the financial statements and
the reported amounts of revenues and expenses during the reporting
period. Actual results could differ from those
estimates.
c.
Segment Reporting
ASC Topic
280, Segment Reporting
(“ASC 280”) established standards for the manner in which public
enterprises report information about operating segments. In
accordance with ASC 280, we have determined that each of our homebuilding
operating divisions and our financial services operations (consisting of our
mortgage financing and title operations) are our operating
segments. Corporate is a non-operating segment. In
accordance with the aggregation criteria defined in ASC 280, we have grouped our
homebuilding operations into three reportable segments: California; Southwest,
consisting of our operating divisions in Arizona, Texas, Colorado and Nevada;
and Southeast, consisting of our operating divisions in Florida and
the Carolinas. In particular, we have determined that the
homebuilding operating divisions within their respective reportable segments
have similar economic characteristics, including similar historical and expected
future long-term gross margin percentages. In addition, our
homebuilding operating divisions also share all other relevant aggregation
characteristics prescribed in ASC 280, such as similar product types, production
processes and methods of distribution.
STANDARD
PACIFIC CORP. AND SUBSIDIARIES
NOTES
TO CONSOLIDATED FINANCIAL STATEMENTS
d.
Business Combinations
Acquisitions
of businesses were accounted for under the purchase method of accounting in
accordance with ASC Topic 805, Business Combinations (“ASC
805”). Under the purchase method of accounting, the assets acquired
and liabilities assumed are recorded at their estimated fair values. Any
purchase price paid in excess of the net fair values of tangible and identified
intangible assets less liabilities assumed was recorded as goodwill. Our
reported income from an acquired company includes the operations of the acquired
company from the effective date of acquisition.
e.
Variable Interest Entities
We
account for variable interest entities in accordance with ASC Topic 810, Consolidation (“ASC
810”). Under ASC 810, a variable interest entity (“VIE”) is created
when (i) the equity investment at risk in the entity is not sufficient to permit
the entity to finance its activities without additional subordinated financial
support provided by other parties, including the equity holders, (ii) the
entity’s equity holders as a group either (a) lack the direct or indirect
ability to make decisions about the entity, (b) are not obligated to absorb
expected losses of the entity or (c) do not have the right to receive expected
residual returns of the entity or (iii) the entity’s equity holders have voting
rights that are not proportionate to their economic interests, and the
activities of the entity involve or are conducted on behalf of the equity holder
with disproportionately few voting rights. If an entity is deemed to
be a VIE pursuant to ASC 810, the enterprise that is deemed to absorb a majority
of the entity’s expected losses, receive a majority of the entity’s expected
residual returns, or both, is considered the primary beneficiary and must
consolidate the VIE. Expected losses and residual returns for VIEs
are calculated based on the probability of estimated future cash flows as
described in ASC 810.
f.
Limited Partnerships and Limited Liability Companies
We
analyze our homebuilding and land development joint ventures under the
provisions of ASC 810 (as discussed above) when determining whether the entity
should be consolidated. In accordance with the provisions of ASC 810, limited
partnerships or similar entities, such as limited liability companies, must be
further evaluated under the presumption that the general partner, or the
managing member in the case of a limited liability company, is deemed to have a
controlling interest and therefore must consolidate the entity unless the
limited partners or non-managing members have: (1) the ability, either by a
single limited partner or through a simple majority vote, to dissolve or
liquidate the entity, or kick-out the managing member/general partner without
cause, or (2) substantive participatory rights that are exercised in the
ordinary course of business. Under the provisions of ASC 810, we may be required
to consolidate certain investments in which we hold a general partner or
managing member interest. As of December 31, 2009 and 2008, we did
not have any joint ventures consolidated in our balance sheets as a result of
applying the provisions of ASC 810.
g.
Revenue Recognition
In
accordance with ASC Topic 360-20, Property, Plant, and Equipment –
Real Estate Sales (“ASC 360-20”), homebuilding revenues are recorded
after construction is completed, a sufficient down payment has been received,
title has passed to the homebuyer, collection of the purchase price is
reasonably assured and we have no other continuing involvement. In
instances where the homebuyer’s financing is originated by our mortgage banking
subsidiary and the buyer has not made an adequate initial or continuing
investment as prescribed by ASC 360-20, the profit on such home sales is
deferred until the sale of the related mortgage loan to a third-party investor
has been completed and the contractual terms of the applicable early payment
default provisions have lapsed. Total profits that were deferred on
such home sales for the years ended December 31, 2009, 2008 and 2007 were
approximately $25,000, $3.6 million and $18.8 million,
respectively.
Generally
our policy is to sell all mortgage loans originated. These sales
generally occur within 30 days of origination. Mortgage loan interest is accrued
only so long as it is deemed collectible. For the year ended December
31, 2007 and for the ten months ended October 31, 2008, we recognized loan
origination fees and expenses and gains and losses on loans when the related
mortgage loans were sold. Effective November 1, 2008, we implemented the
requirements of ASC Topic 825, Financial Instruments (“ASC
825”). Under ASC 825, we recognize loan origination fees and expenses
upon origination of the loans by us. The adoption of ASC 825 did not
have a material impact on our financial condition or results of
operations.
STANDARD
PACIFIC CORP. AND SUBSIDIARIES
NOTES
TO CONSOLIDATED FINANCIAL STATEMENTS
h.
Cost of Sales
Homebuilding
cost of sales is recognized after construction is completed, a sufficient down
payment has been received, title has transferred to the homebuyer, collection of
the purchase price is reasonably assured and we have no continuing
involvement. Cost of sales is recorded based upon total estimated
costs to be allocated to each home within a community. Certain direct
construction costs are specifically identified and allocated to homes while
other common costs, such as land, land improvements and carrying costs, are
allocated to homes within a community based upon their anticipated relative
sales or fair value. Any changes to the estimated costs are allocated
to the remaining undelivered lots and homes within their respective
community. The estimation of these costs requires a substantial
degree of judgment by management.
i.
Warranty Costs
Estimated
future direct warranty costs are accrued and charged to cost of sales in the
period when the related homebuilding revenues are recognized. Amounts
accrued are based upon historical experience rates. Indirect warranty
overhead salaries and related costs are charged to cost of sales in the period
incurred. We assess the adequacy of our warranty accrual on a
quarterly basis and adjust the amounts recorded if necessary. During
the year ended December 31, 2008, we recorded $12.1 million in reductions to our
warranty accrual due to a decrease in our warranty expenditure
trends. Our warranty accrual is included in accrued liabilities in
the accompanying consolidated balance sheets. Changes in our warranty
accrual are detailed in the table set forth below:
|
Year
Ended December 31,
|
||||||||||||
|
2009
|
2008
|
2007
|
||||||||||
|
(Dollars
in thousands)
|
||||||||||||
|
Warranty
accrual, beginning of the year
|
$ | 19,998 | $ | 30,790 | $ | 32,384 | ||||||
|
Warranty
costs accrued during the year
|
5,931 | 10,512 | 14,195 | |||||||||
|
Warranty
costs paid during the year
|
(4,232 | ) | (9,215 | ) | (12,427 | ) | ||||||
|
Adjustments
to warranty accrual during the year
|
909 | (12,089 | ) | (3,362 | ) | |||||||
|
Warranty
accrual, end of the year
|
$ | 22,606 | $ | 19,998 | $ | 30,790 | ||||||
j.
Restructuring Costs
Our
operations have been impacted by the weak housing demand in substantially all of
our markets. As a result, during 2008 we initiated a restructuring
plan designed to reduce ongoing overhead costs and improve operating
efficiencies through the consolidation of selected divisional offices, the
disposal of related property and equipment, and a reduction in our
workforce. Our restructuring activities are substantially complete as
of December 31, 2009. However, until market conditions stabilize, we
may incur additional restructuring charges for employee severance, lease
termination and other exit costs.
Below
is a summary of restructuring charges (including financial services) incurred
during the years ended December 31, 2009 and 2008 and the cumulative amount
incurred from January 1, 2008 through December 31, 2009:
|
Year
Ended December 31,
|
||||||||||||
|
2009
|
2008
|
Total
|
||||||||||
| (Dollars in thousands) | ||||||||||||
|
Employee
severance costs
|
$ | 14,844 | $ | 14,066 | $ | 28,910 | ||||||
|
Lease
termination and other exit costs
|
5,480 | 7,937 | 13,417 | |||||||||
|
Property
and equipment disposals
|
2,048 | 2,290 | 4,338 | |||||||||
| $ | 22,372 | $ | 24,293 | $ | 46,665 | |||||||
During
the years ended December 31, 2009 and 2008, employee severance costs of $13.7
million and $11.3 million, respectively, were included in homebuilding selling,
general and administrative expenses and $0.9 and $2.7 million, respectively,
were included in homebuilding cost of sales, while lease termination and other
exit costs were included in homebuilding selling, general and administrative
expenses and property and equipment disposals were included in homebuilding
other income (expense) in the accompanying consolidated statements of
operations. Additionally, during the
STANDARD
PACIFIC CORP. AND SUBSIDIARIES
NOTES
TO CONSOLIDATED FINANCIAL STATEMENTS
Our
restructuring accrual is included in accrued liabilities in the accompanying
consolidated balance sheets. Changes in our restructuring accrual
from continuing operations are detailed in the table set forth below:
|
Year
Ended December 31, 2009
|
|||||||||||||
|
Employee
Severance
Costs
|
Lease
Termination
and
Other
Costs
|
Property
and
Equipment
Disposals
|
Total
|
||||||||||
|
(Dollars
in thousands)
|
|||||||||||||
|
Restructuring
accrual, beginning of the year
|
$
|
4,917
|
$
|
6,045
|
$
|
―
|
$
|
10,962
|
|||||
|
Restructuring
costs accrued and other adjustments during the year
|
14,844
|
5,480
|
2,048
|
22,372
|
|||||||||
|
Restructuring
costs paid during the year
|
(18,344)
|
(5,715)
|
―
|
(24,059)
|
|||||||||
|
Non-cash
settlements
|
―
|
―
|
(2,048)
|
(2,048)
|
|||||||||
|
Restructuring
accrual, end of the year
|
$
|
1,417
|
$
|
5,810
|
$
|
―
|
$
|
7,227
|
|||||
|
Year
Ended December 31, 2008
|
|||||||||||||
|
Employee
Severance
Costs
|
Lease
Termination
and
Other
Costs
|
Property
and
Equipment
Disposals
|
Total
|
||||||||||
|
(Dollars
in thousands)
|
|||||||||||||
|
Restructuring
accrual, beginning of the year
|
$
|
―
|
$
|
1,164
|
$
|
―
|
$
|
1,164
|
|||||
|
Restructuring
costs accrued and other adjustments during the year
|
14,066
|
7,937
|
2,290
|
24,293
|
|||||||||
|
Restructuring
costs paid during the year
|
(9,149)
|
(3,056)
|
―
|
(12,205)
|
|||||||||
|
Non-cash
settlements
|
―
|
―
|
(2,290)
|
(2,290)
|
|||||||||
|
Restructuring
accrual, end of the year
|
$
|
4,917
|
$
|
6,045
|
$
|
―
|
$
|
10,962
|
|||||
k.
Earnings (Loss) Per Common Share
We
compute earnings (loss) per share in accordance with ASC Topic 260, Earnings per Share (“ASC
260”), which requires the presentation of both basic and diluted earnings (loss)
per common share for financial statement purposes. Basic earnings (loss) per
common share is computed by dividing income or loss available to common
stockholders by the weighted average number of shares of common stock
outstanding. Our Series B junior participating convertible preferred stock
(“Series B Preferred Stock”), which is convertible into shares of our common
stock at the holder’s option (subject to a limitation based upon voting
interest), is classified as a convertible participating security in accordance
with ASC 260, which requires that both net income and loss per share for each
class of stock (common stock and participating preferred stock) be calculated
for basic earnings per share purposes based on the contractual rights and
obligations of this participating security. Net loss allocated to the holders of
our Series B Preferred Stock is calculated based on the preferred shareholder’s
proportionate share of weighted average shares of common stock outstanding on an
if-converted basis.
For
purposes of determining diluted earnings per common share, basic earnings per
common share is further adjusted to include the effect of the potential dilutive
common shares outstanding, including convertible debt and convertible preferred
stock using the if-converted method, and stock options using the treasury stock
method. Diluted loss per common share for the years ended December
31, 2009, 2008 and 2007 excluded potential common shares outstanding because the
effect of their inclusion would be anti-dilutive.
l.
Stock-Based Compensation
We
account for share-based awards in accordance with ASC Topic 718, Compensation – Stock
Compensation (“ASC 718”). ASC 718 requires that the cost
resulting from all share-based payment transactions be recognized in the
financial statements. ASC 718 requires all entities to apply a fair-value-based
measurement method in accounting for share-based payment transactions with
employees except for equity instruments held by employee share ownership
plans.
STANDARD
PACIFIC CORP. AND SUBSIDIARIES
NOTES
TO CONSOLIDATED FINANCIAL STATEMENTS
m.
Cash and Equivalents and Restricted Cash
For
purposes of the consolidated statements of cash flows, cash and equivalents
include cash on hand, demand deposits and all highly liquid short-term
investments, including interest-bearing securities purchased with a maturity of
three months or less from the date of purchase. At December 31, 2009,
restricted cash $18.3 million of cash held in cash collateral accounts related
to certain letters of credit that have been issued and a portion related to one
of our financial services subsidiary mortgage credit facilities ($15.1 million
of homebuilding cash and $3.2 million of financial services cash).
n.
Mortgage Loans Held for Sale
Prior
to November 1, 2008, mortgage loans held for sale were reported at the lower of
cost or market on an aggregate basis. For loans that were effectively hedged as
fair value hedges, the loans were recorded at fair value in accordance with ASC
Topic 815, Derivatives and
Hedging (“ASC 815”). In connection with the adoption of ASC
825 as discussed further in Note 2.g., mortgage loans held for sale are recorded
at fair value and loan origination and related costs are no longer deferred and
are recognized upon the loan closing. In addition, we recognize net
interest income on loans held for sale from the date of origination through the
date of disposition. We sell substantially all of the loans we originate in the
secondary mortgage market, with servicing rights released on a non-recourse
basis. These sales are generally subject to our obligation to repay
gain on sale if the loan is prepaid by the borrower within a certain time period
following such sale, or to repurchase loans or indemnify investors for losses
from borrower defaults if, among other things, the loan purchaser’s underwriting
guidelines are not met or there is fraud in connection with the
loan. During the years ended December 31, 2009, 2008 and 2007, we
recorded loan loss reserves related to loans sold of $2.8 million, $0.5 million
and $1.0 million, respectively. As of December 31, 2009 and 2008, we
had repurchase reserves related to loans sold of $1.4 million and $0.9 million,
respectively.
o. Mortgage Loans Held for
Investment
Mortgage
loans are classified as held for investment based on our intent and ability to
hold the loans for the foreseeable future or to maturity. Mortgage
loans held for investment are recorded at their unpaid principal balance, net of
discounts and premiums, unamortized net deferred loan origination costs and fees
and allowance for loan losses. Discounts, premiums, and net deferred
loan origination costs and fees are amortized into income over the contractual
life of the loan. Mortgage loans held for investment are continually
evaluated for collectability and, if appropriate, specific reserves are
established based on estimates of collateral value. Loans are placed
on non-accrual status for first trust deeds when the loan is 90 days past due
and for second trust deeds when the loan is 30 days past due, and previously
accrued interest is reversed from income if deemed
uncollectible. During the years ended December 31, 2009, 2008 and
2007, we recorded loan loss reserves related to loans held for investment of
$1.8 million, $2.6 million and $1.2 million, respectively. As of
December 31, 2009 and 2008, we had allowances for loan losses for loans held for
investment of $4.1 million and $2.7 million, respectively.
p.
Inventories
Inventories
consist of land, land under development, homes under construction, completed
homes and model homes and are stated at cost, net of impairment
charges. We capitalize direct carrying costs, including interest,
property taxes and related development costs to inventories. Field construction
supervision and related direct overhead are also included in the capitalized
cost of inventories. Direct construction costs are specifically
identified and allocated to homes while other common costs, such as land, land
improvements and carrying costs, are allocated to homes within a community based
upon their anticipated relative sales or fair value.
We
assess the recoverability of real estate inventories in accordance with the
provisions of ASC 360, Property,
Plant, and Equipment ("ASC 360"). ASC 360 requires long-lived
assets, including inventories, that are expected to be held and used in
operations to be carried at the lower of cost or, if impaired, the fair value of
the asset. ASC 360 requires that companies evaluate long-lived assets
for impairment based on undiscounted future cash flows of the assets at the
lowest level for which there is identifiable cash flows. Long-lived assets to be
disposed of are reported at the lower of carrying amount or fair value less cost
to sell.
STANDARD
PACIFIC CORP. AND SUBSIDIARIES
NOTES
TO CONSOLIDATED FINANCIAL STATEMENTS
Inventory
not owned represents the fair value of land under option agreements consolidated
pursuant to ASC 810. ASC 810 requires us to consolidate the financial results of
a variable interest entity (“VIE”) if the Company is the primary beneficiary of
the VIE (please see Notes 2.e. and 4.b. for further
discussion).
q.
Capitalization of Interest
We
follow the practice of capitalizing interest to inventories owned during the
period of development and to investments in unconsolidated homebuilding and land
development joint ventures in accordance with ASC Topic 835, Interest (“ASC 835”).
Homebuilding interest capitalized as a cost of inventories owned is included in
cost of sales as related units or lots are sold. Interest capitalized to
investments in unconsolidated homebuilding and land development joint ventures
is included as reduction of income from unconsolidated joint ventures when the
related homes or lots are sold to third parties. Interest capitalized to
investments in unconsolidated land development joint ventures is transferred to
inventories owned if the underlying lots are purchased by us. To the
extent our debt exceeds our qualified assets as defined in ASC 835, we expense a
portion of the interest incurred by us. Qualified assets represent
inventory of projects that are actively selling or under development as well as
investments in unconsolidated joint ventures accounted for under the equity
method. For the years ended December 31, 2009 and 2008, we expensed
$47.5 million and $10.4 million, respectively, of interest costs related
primarily to the portion of real estate inventories held for development that
were deemed unqualified assets in accordance with ASC 835. All
interest costs incurred during the first six months of 2008 and all of 2007 were
capitalized to inventories and to investments in unconsolidated joint ventures
as our qualified inventory and investments in unconsolidated joint ventures
exceeded our debt.
The
following is a summary of homebuilding interest capitalized to inventories owned
and investments in unconsolidated joint ventures, amortized to cost of sales and
loss from unconsolidated joint ventures and expensed as interest expense
(including discontinued operations), for the years ended December 31, 2009, 2008
and 2007:
|
Year
Ended December 31,
|
|||||||||
|
2009
|
2008
|
2007
|
|||||||
|
(Dollars
in thousands)
|
|||||||||
|
Total
interest incurred
|
$
|
107,976
|
$
|
135,693
|
$
|
138,553
|
|||
|
Less:
Interest capitalized to inventories owned
|
(57,338)
|
(115,107)
|
(124,259)
|
||||||
|
Less:
Interest capitalized to investments in unconsolidated joint
ventures
|
(3,180)
|
(10,206)
|
(14,294)
|
||||||
|
Interest
expense
|
$
|
47,458
|
$
|
10,380
|
$
|
―
|
|||
|
Interest
previously capitalized to inventories owned, included in home cost of
sales
|
$
|
67,522
|
$
|
83,053
|
$
|
98,497
|
|||
|
Interest
previously capitalized to inventories owned, included in land cost of
sales
|
$
|
19,313
|
$
|
1,019
|
$
|
32,792
|
|||
|
Interest
previously capitalized to investments in unconsolidated
joint
|
|||||||||
|
ventures,
included in loss from unconsolidated joint ventures
|
$
|
5,680
|
$
|
4,438
|
$
|
8,138
|
|||
|
Interest
capitalized in ending inventories owned (1)
|
$
|
141,463
|
$
|
169,431
|
$
|
127,335
|
|||
|
Interest
capitalized as a percentage of inventories owned
|
14.3%
|
13.4%
|
6.2%
|
||||||
|
Interest
capitalized in ending investments in unconsolidated joint ventures
(1)
|
$
|
1,939
|
$
|
5,968
|
$
|
11,261
|
|||
|
Interest
capitalized as a percentage of investments in unconsolidated joint
ventures
|
4.8%
|
11.8%
|
3.8%
|
||||||
|
(1)
|
During
the years ended December 31, 2009, 2008 and 2007, in connection with lot
purchases from our unconsolidated joint ventures and joint venture
purchases and unwinds, $1.5 million, $11.1 million and $4.6 million,
respectively, of capitalized interest was transferred from investments in
unconsolidated joint ventures to inventories
owned.
|
r.
Investments in Unconsolidated Land Development and Homebuilding Joint
Ventures
Investments
in our unconsolidated land development and homebuilding joint ventures are
accounted for under the equity method of accounting. Under the equity method, we
recognize our proportionate share of earnings and losses generated by the joint
venture upon the delivery of lots or homes to third parties. All joint venture
profits generated from land sales to us are deferred and recorded as a reduction
to our cost basis in the lots purchased until the homes are ultimately sold by
us to third parties. Our ownership interests in our unconsolidated joint
ventures vary, but are generally less than or equal to 50 percent.
We
review inventory projects within our unconsolidated joint ventures for
impairments consistent with our real estate inventories described in Note
2.p. We also review our investments in unconsolidated joint ventures
for evidence of an other
STANDARD
PACIFIC CORP. AND SUBSIDIARIES
NOTES
TO CONSOLIDATED FINANCIAL STATEMENTS
than
temporary decline in value. To the extent we deem any portion of our
investment in unconsolidated joint ventures as not recoverable, we impair our
investment accordingly.
s.
Income Taxes
We
account for income taxes in accordance with ASC Topic 740, Income Taxes (“ASC
740”). This statement requires an asset and a liability approach for
measuring deferred taxes based on temporary differences between the financial
statement and tax bases of assets and liabilities existing at each balance sheet
date using enacted tax rates for years in which taxes are expected to be paid or
recovered.
We
evaluate our deferred tax assets on a quarterly basis to determine whether a
valuation allowance is required. In accordance with ASC 740, we
assess whether a valuation allowance should be established based on our
determination of whether it is more likely than not that some portion or all of
the deferred tax assets will not be realized. The ultimate
realization of deferred tax assets depends primarily on: (i) our ability to
carry back net operating losses to tax years where we have previously paid
income taxes based on applicable federal law; and (ii) our ability to generate
future taxable income during the periods in which the related temporary
differences become deductible. The assessment of a valuation
allowance includes giving appropriate consideration to all positive and negative
evidence related to the realization of the deferred tax asset. This
assessment considers, among other things, the nature, frequency and severity of
current and cumulative losses, forecasts of future profitability, the duration
of statutory carryforward periods, our experience with operating loss and tax
credit carryforwards not expiring unused, and tax planning
alternatives. Significant judgment is required in determining the
future tax consequences of events that have been recognized in our consolidated
financial statements and/or tax returns. Differences between
anticipated and actual outcomes of these future tax consequences could have a
material impact on our consolidated financial position or results of
operations.
ASC
740 defines the methodology for recognizing the benefits of tax return positions
as well as guidance regarding the measurement of the resulting tax
benefits. These provisions require an enterprise to recognize the
financial statement effects of a tax position when it is more likely than not
(defined as a likelihood of more than 50%), based on the technical merits, that
the position will be sustained upon examination. In addition, these
provisions provide guidance on derecognition, classification, interest and
penalties, accounting in interim periods, disclosure, and
transition. The evaluation of whether a tax position meets the
more-likely-than-not recognition threshold requires a substantial degree of
judgment by management based on the individual facts and
circumstances. Actual results could differ from
estimates.
t.
Goodwill
The
excess amount paid for business acquisitions over the net fair value of assets
acquired and liabilities assumed was capitalized as goodwill in accordance with
ASC Topic 350, Intangibles –
Goodwill and Other (“ASC 350”). ASC 350 requires that goodwill
not be amortized but instead be assessed for impairment at least annually or
more frequently if certain impairment indicators are present. For purposes of
this test, each of our homebuilding operating divisions has been treated as a
reporting unit. As a result of the deteriorating housing market
conditions in most of the markets in which we operate and due to changes in our
near-term and long-term forecasts and expected returns, we recorded pretax
goodwill impairment charges for the years ended December 31, 2008 and 2007 of
$35.5 million and $54.3 million, respectively. These charges were
included in other expense in the accompanying consolidated statements of
operations. After recording these charges, we did not have any
goodwill remaining as of December 31, 2008.
u. Insurance and Litigation
Accruals
Insurance
and litigation accruals are established for estimated future claims costs. We
maintain general liability insurance designed to protect us against a portion of
our risk of loss from construction-related claims. We also generally require our
subcontractors and design professionals to indemnify us for liabilities arising
from their work, subject to various limitations. We record reserves to cover our
estimated costs of self-insured retentions and deductible amounts under these
policies and estimated costs for claims that may not be covered by applicable
insurance or indemnities. Estimation of these accruals includes consideration of
our claims history, including current claims, estimates of claims incurred but
not yet reported, and potential for recovery of costs from insurance and other
sources. We utilize the services of an independent third party
actuary to assist us with evaluating the level of our insurance and litigation
accruals.
STANDARD
PACIFIC CORP. AND SUBSIDIARIES
NOTES
TO CONSOLIDATED FINANCIAL STATEMENTS
v.
Derivative Instruments and Hedging Activities
We
account for derivatives and certain hedging activities in accordance with ASC
Topic 815, Derivatives and
Hedging (“ASC 815”). ASC 815 establishes the accounting and reporting
standards requiring that every derivative instrument, including certain
derivative instruments embedded in other contracts, be recorded as either assets
or liabilities in the consolidated balance sheets and to measure these
instruments at fair market value. Gains or losses resulting from changes in the
fair market value of derivatives are recognized in the consolidated statement of
operations or recorded in accumulated other comprehensive income (loss), net of
tax, and recognized in the consolidated statement of operations when the hedged
item affects earnings, depending on the purpose of the derivatives and whether
the derivatives qualify for hedge accounting treatment.
Our
policy is to designate at a derivative’s inception the specific assets,
liabilities or future commitments being hedged and monitor the derivative to
determine if the derivative remains an effective hedge. The effectiveness of a
derivative as a hedge is based on a high correlation between changes in the
derivative’s value and changes in the value of the underlying hedged
item. We recognize gains or losses for amounts received or paid when
the underlying transaction settles. We do not enter into or hold
derivatives for trading or speculative purposes.
The
primary risks associated with derivative instruments are market and credit risk.
Market risk is defined as the potential for loss in value of the derivative
instruments due to adverse changes in market prices (interest rates). Utilizing
derivative instruments allows us to effectively manage the risk of increasing
interest rates with respect to the potential effects these fluctuations could
have on future earnings and cash flows. Credit risk is the risk that
one of the parties to a derivative contract fails to perform or meet their
financial obligation. We do not obtain collateral associated with derivative
instruments, but monitor the credit standing of our counterparties, primarily
global institutional banks, on a regular basis. Should a counterparty fail to
perform, we would incur a financial loss to the extent that the associated
derivative contract was in an asset position. At December 31, 2009, we do not
anticipate non-performance by counterparties to our outstanding derivative
contracts and in addition, such contracts were not in an asset
position.
In
May 2006, we entered into one interest rate swap agreement related to our Term
Loan A with a notional amount of $100 million and two interest rate swap
agreements related to our Term Loan B with an aggregate notional amount of $250
million that effectively fixed our 3-month LIBOR rates for our term loans
through their original maturity dates of May 2011 and May 2013,
respectively. The swap agreements have been designated as cash flow
hedges and, accordingly, are reflected at their fair market value in accrued
liabilities in our consolidated balance sheets. To the extent the
swaps are deemed effective and qualify for hedge accounting treatment, the
related gain or loss is deferred, net of tax, in stockholders’ equity as
accumulated other comprehensive income or loss. During 2007, we
repaid $25 million of our Term Loan B which resulted in a portion of the
interest rate swap being ineffective, and as a result, we recorded a $0.2
million and $1.7 million loss on early extinguishment of debt related to the
Term Loan B during the years ended December 31, 2008 and 2007,
respectively. During 2008, we reduced $25 million notional amounts of
the Term Loan B interest rate swaps for payments of approximately $1.9
million. The reduction in the notional amount of our Term Loan B swap
agreements resulted in the interest rate swaps being highly effective and,
accordingly, gains or losses are recorded, net of tax, in stockholders’ equity
as accumulated other comprehensive income or loss.
In
June 2008, we repaid $35 million of our Term Loan A in connection with an
amendment to our Term Loan A agreement which also required amortization payments
of $2.5 million per quarter resulting in the related interest rate swap being
ineffective, and as a result, we recorded a $0.1 million and $3.6 million loss
on early extinguishment of debt during the years ended December 31, 2009 and
2008, respectively. Additionally, in connection with the full
repayment and termination of our Term Loan A during the 2009 third quarter, we
made a $3.7 million payment to terminate our Term Loan A swap agreement and
recorded a $2.2 million loss on early extinguishment of debt, which had been
previously included in other comprehensive income or loss.
The
estimated fair value of the swaps at December 31, 2009 and December 31, 2008
represented liabilities of $24.7 million and $38.0 million, respectively, which
were included in accrued liabilities in the accompanying consolidated financial
statements. For the years ended December 31, 2009 and 2008, we
recorded after-tax other comprehensive income of $7.4 million and other
comprehensive loss of $10.0 million, respectively, related to the swap
agreements.
STANDARD
PACIFIC CORP. AND SUBSIDIARIES
NOTES
TO CONSOLIDATED FINANCIAL STATEMENTS
w.
Accounting for Guarantees
We
account for guarantees in accordance with the provisions of ASC Topic 470, Debt (“ASC 470”). Under ASC
470, recognition of a liability is recorded at its estimated fair value based on
the present value of the expected contingent payments under the guarantee
arrangement. The types of guarantees that we generally provide that are subject
to ASC 470 generally are made to third parties on behalf of our unconsolidated
homebuilding and land development joint ventures. As of December 31, 2009, these
guarantees included, but were not limited to, loan-to-value maintenance
agreements, construction completion guarantees, environmental indemnities and
surety bond indemnities (please see Note 13 for further
discussion).
x.
Recent Accounting Pronouncements
On
January 1, 2009, we adopted certain provisions of ASC Topic 805, Business Combinations (“ASC
805”). These provisions expand the application of ASC 805 to all
transactions and other events in which one entity obtains control over one or
more other businesses. ASC 805 broadens the fair value measurement
and recognition of assets acquired, liabilities assumed, and interests
transferred as a result of business combinations. It also requires that the
acquisition method of accounting be used for all business combinations and for
an acquirer to be identified for each business combination. It also establishes
principles and requirements for how the acquirer recognizes and measures in its
financial statements the identifiable assets acquired, the liabilities assumed,
and any noncontrolling interest in the acquiree. The adoption of
these provisions also requires additional disclosures to improve the statement
users’ abilities to evaluate the nature and financial effects of business
combinations. Adoption is prospective, and early adoption was not permitted.
These new provisions are effective for us for any business combination entered
into subsequent to January 1, 2009. The adoption of these new
provisions on January 1, 2009 did not have a material impact on our
consolidated financial statements.
On
January 1, 2009, we adopted certain provisions of ASC Topic 810, Consolidation (“ASC 810”),
which require that a noncontrolling interest in a subsidiary be reported as
equity and the amount of consolidated net income specifically attributable to
the noncontrolling interest be reported separately in the consolidated income
statement and consolidated statement of equity. It also calls for consistency in
the manner of reporting changes in the parent’s ownership interest and requires
fair value measurement of any noncontrolling equity investment retained in a
deconsolidation. Upon adoption on January 1, 2009, minority
interests were reclassified to noncontrolling interests as a separate component
in equity for all periods presented. The adoption of these provisions
did not impact earnings per share attributable to our common
stockholders.
In
March 2008, the FASB updated certain provisions of ASC Topic 815, Derivatives and Hedging (“ASC
815”). Under these new provisions, entities are required to provide
enhanced disclosures about (a) how and why an entity uses derivative
instruments, (b) how derivative instruments and related hedged items are
accounted for under ASC 815, and (c) how derivative instruments and related
hedged items affect an entity’s financial position, financial performance, and
cash flows. We adopted the provisions of ASC 815 on January 1,
2009 and have included the required disclosures in Note 2.v. “Derivative
Instruments and Hedging Activities” of the accompanying consolidated financial
statements.
In
May 2008, the FASB updated certain provisions of ASC Topic 470, Debt (“ASC
470”). These new provisions require bifurcation of a component of
convertible debt instruments, classification of that component in stockholder’s
equity, and then accretion of the resulting discount on the debt to result in
interest expense equal to the issuer’s nonconvertible debt borrowing
rate. These new provisions of ASC 470 are effective for financial
statements issued for fiscal years beginning after December 15, 2008,
and interim periods within those fiscal years. Retroactive application to
all periods presented is required. As a result, we have retroactively
applied the standard to our financial statements for all periods
presented. We adopted these new provisions of ASC 470 as of
January 1, 2009 and the adoption impacted the historical accounting for our
6% Senior Subordinated Convertible Notes due 2012 (the “Convertible Notes”)
resulting in an increase to additional paid-in capital of $31.8 million with an
offset to accumulated deficit of $3.7 million, inventories owned of $2.6 million
and senior subordinated notes payable of $25.5 million as of January 1,
2009. During 2008, MatlinPatterson exchanged $21.6 million principal
amount of the Convertible Notes for a warrant to purchase shares of Series B
Preferred Stock at a common stock equivalent exercise price of $4.10 per
share. In connection with the exchange, we derecognized $7.6 million of
unamortized discount of the Convertible Notes, which was reflected in the $31.8
million adjustment to additional paid-in capital recorded upon adoption on
January 1, 2009. During 2009, we repurchased at a discount $32.8
million principal amount of the Convertible Notes in exchange for an aggregate
of 7.6 million shares of our common stock. In connection with the
exchange, we derecognized $9.3 million of unamortized discount of the
Convertible Notes. The remaining balance of the Convertible
57
STANDARD
PACIFIC CORP. AND SUBSIDIARIES
NOTES
TO CONSOLIDATED FINANCIAL STATEMENTS
Notes
will be accreted to its redemption value, approximately $45.6 million, over the
remaining term of these notes. The unamortized discount of the
Convertible Notes, which was included in additional paid-in capital, was $11.8
million and $25.5 million at December 31, 2009 and December 31, 2008,
respectively. In addition, approximately $2.5 million and $4.6
million of interest related to amortization of this discount was capitalized to
inventories, and $2.0 million and $0.4 million was expensed directly to interest
expense during 2009 and 2008, respectively. Interest capitalized to
inventories owned is included in cost of sales as related units are sold (please
see Note 2.q.“Capitalization of Interest” of the accompanying consolidated
financial statements).
On
January 1, 2009, we adopted certain provisions of ASC Topic 260, Earnings per Share (“ASC
260”), which provide that unvested share-based payment awards that contain
non-forfeitable rights to dividends or dividend equivalents (whether paid or
unpaid) are participating securities and require that they be included in the
computation of earnings per share. These new provisions of ASC 260 are effective
for financial statements issued for fiscal years beginning after
December 15, 2008, and interim periods within those years, and require
retrospective application. During the year ended December 31, 2009, we had no
unvested share-based payment awards outstanding. In addition, during the years
ended December 31, 2008 and 2007, the holders of any unvested share-based
payment awards were not required to participate in losses of the Company. The
adoption of these new provisions of ASC 260 on January 1, 2009 did not have
an impact on our results of operations, financial position or earnings per
share.
In
April 2009, the FASB updated certain provisions of ASC Topic 825, Financial Instruments (“ASC
825”) and ASC Topic 270, Interim Reporting (“ASC
270”). These new provisions require that the fair value disclosures
required for all financial instruments within the scope of ASC 825 be included
in interim financial statements. ASC 825 also requires entities to disclose the
method and significant assumptions used to estimate the fair value of financial
instruments on an interim and annual basis and to highlight any changes from
prior periods. These new provisions of ASC 825 are effective for
interim periods ending after June 15, 2009. The adoption of ASC
825 did not have a material impact on our consolidated financial statements
(please see Note 12 “Disclosures about Fair Value” of the accompanying
consolidated financial statements).
In
May 2009, the FASB issued ASC Topic 855, Subsequent Events (“ASC
855”), which provides guidance to establish general standards of accounting for
and disclosures of events that occur after the balance sheet date but before
financial statements are issued or are available to be issued. ASC 855 sets
forth (i) the period after the balance sheet date during which management
of a reporting entity should evaluate events or transactions that may occur for
potential recognition or disclosure in the financial statements, (ii) the
circumstances under which an entity should recognize events or transactions
occurring after the balance sheet date in its financial statements, and
(iii) the disclosures that an entity should make about events or
transactions that occurred after the balance sheet date. ASC 855 is
effective for interim periods ending after June 15,
2009. Pursuant to ASC 855 we have evaluated subsequent events through
the date that the consolidated financial statements were issued for the year
ended December 31, 2009.
In
June 2009, the FASB updated ASC Topic 810, Consolidation (“ASC 810”) to
among other things, (i) define the primary beneficiary of a variable
interest entity (“VIE”) as the enterprise that has both (a) the power to
direct the activities of a VIE that most significantly impact the entity’s
economic performance and (b) the obligation to absorb losses of the entity
or the right to receive benefits from the entity that could potentially be
significant to the VIE, (ii) require ongoing reassessments of whether an
enterprise is the primary beneficiary of a VIE, and (iii) add an additional
reconsideration event for determining whether an entity is a VIE when any
changes in facts and circumstances occur such that the holders of the equity
investment at risk, as a group, lose the power from voting rights or similar
rights to direct the activities of the entity that most significantly impact the
entity’s economic performance. We do not expect the adoption of the
updated provisions of ASC 810 to have a material impact on our consolidated
financial statements. However, upon adoption on January 1, 2010,
we expect to derecognize approximately $5.4 million of inventories not
owned related to lot option contracts, $1.9 million of liabilities from
inventories not owned, and $3.5 million of noncontrolling interests related to
three VIE’s consolidated as of December 31, 2009 since we do not have power to
direct the activities of the VIE that most significantly impact the entity’s
economic performance.
In
July 2009, the FASB updated certain provisions of ASC 470, which provide
guidance to share lending arrangements executed in connection with a convertible
debt offering or other financing and require that share lending arrangements be
measured at fair value, recognized as a debt issuance cost with an offset to
stockholders’ equity, and then amortized as interest expense over the life of
the financing arrangement. These new provisions of ASC 470 are effective
for interim or annual periods beginning on or after June 15, 2009 for share
lending arrangements entered in during fiscal year 2009. For all
arrangements that existed prior to fiscal year 2009, retrospective application
is required beginning January 1, 2010. We are
58
STANDARD
PACIFIC CORP. AND SUBSIDIARIES
NOTES
TO CONSOLIDATED FINANCIAL STATEMENTS
currently
in the process of determining the impact of adopting these new provisions of ASC
470 on our financial condition and results of operations.
y.
Reclassifications
Certain
items in prior year financial statements have been reclassified to conform with
current year presentation.
3.
Segment Reporting
We
operate two principal businesses: homebuilding and financial
services.
Our homebuilding operations construct and sell
single-family attached and detached homes. In accordance with the aggregation
criteria defined in ASC 280, our homebuilding operating segments have been
grouped into three reportable segments: California; Southwest, consisting of our
operating divisions in Arizona, Texas, Colorado and Nevada; and Southeast,
consisting of our operating divisions in Florida and the Carolinas. In
particular, we have determined that the homebuilding operating divisions within
their respective reportable segments have similar economic characteristics,
including similar historical and expected future long-term gross margin
percentages. In addition, the operating divisions also share all other relevant
aggregation characteristics, such as similar product types, production
processes and methods of distribution.
Our
mortgage financing operations provide mortgage financing to our homebuyers in
substantially all of the markets in which we operate. Our title
service operation provides title examinations for our homebuyers in
Texas. Our mortgage financing and title services operations are
included in our financial services reportable segment, which is separately
reported in our consolidated financial statements under “Financial
Services.”
Corporate
is a non-operating segment that develops and implements strategic initiatives
and supports our operating divisions by centralizing key administrative
functions such as finance and treasury, information technology, insurance
and risk management, litigation, and human
resources. Corporate also provides the necessary administrative
functions to support us as a publicly traded company. A substantial
portion of the expenses incurred by Corporate are allocated to the homebuilding
operating divisions based on their respective percentage of
revenues.
Segment
financial information relating to the Company’s homebuilding operations was as
follows:
|
Year
Ended December 31,
|
||||||||||||
|
2009
|
2008
|
2007
|
||||||||||
|
(Dollars
in thousands)
|
||||||||||||
|
Homebuilding
revenues:
|
||||||||||||
|
California
|
$ | 665,414 | $ | 796,737 | $ | 1,484,047 | ||||||
|
Southwest
(1)
|
238,249 | 416,749 | 793,455 | |||||||||
|
Southeast
|
262,734 | 322,130 | 611,331 | |||||||||
|
Total
homebuilding revenues
|
$ | 1,166,397 | $ | 1,535,616 | $ | 2,888,833 | ||||||
|
Homebuilding
pretax income (loss):
|
||||||||||||
|
California
|
$ | (16,817 | ) | $ | (724,047 | ) | $ | (524,913 | ) | |||
|
Southwest
(1)
|
(28,950 | ) | (257,031 | ) | (165,714 | ) | ||||||
|
Southeast
|
(30,880 | ) | (222,586 | ) | (150,829 | ) | ||||||
|
Corporate
|
(34,421 | ) | (34,176 | ) | (5,130 | ) | ||||||
|
Total
homebuilding pretax income (loss)
|
$ | (111,068 | ) | $ | (1,237,840 | ) | $ | (846,586 | ) | |||
|
Homebuilding
income (loss) from unconsolidated joint ventures:
|
||||||||||||
|
California
|
$ | 6,727 | $ | (96,005 | ) | $ | (150,057 | ) | ||||
|
Southwest
(1)
|
(11,487 | ) | (46,116 | ) | (35,271 | ) | ||||||
|
Southeast
|
43 | (9,608 | ) | (4,697 | ) | |||||||
|
Total
homebuilding income (loss) from unconsolidated joint
ventures
|
$ | (4,717 | ) | $ | (151,729 | ) | $ | (190,025 | ) | |||
|
Restructuring
charges:
|
||||||||||||
|
California
|
$ | 2,167 | $ | 10,511 | $ | ― | ||||||
|
Southwest
(1)
|
2,172 | 2,394 | ― | |||||||||
|
Southeast
|
5,052 | 2,570 | ― | |||||||||
|
Corporate
|
12,750 | 8,691 | ― | |||||||||
|
Total
restructuring charges
|
$ | 22,141 | $ | 24,166 | $ | ― | ||||||
|
(1)
|
Excludes
our Tucson and San Antonio divisions, which are classified as discontinued
operations.
|
59
STANDARD
PACIFIC CORP. AND SUBSIDIARIES
NOTES
TO CONSOLIDATED FINANCIAL STATEMENTS
Homebuilding
pretax income (loss) includes the following pretax inventory, joint venture and
goodwill impairment charges and land deposit write-offs recorded in the
following segments:
|
Year
Ended December 31, 2009
|
||||||||||||
|
California
|
Southwest
(1)
|
Southeast
|
Total
|
|||||||||
|
(Dollars
in thousands)
|
||||||||||||
|
Deposit
write-offs
|
$
|
―
|
$
|
1,298
|
$
|
1,192
|
$
|
2,490
|
||||
|
Inventory
impairments
|
43,313
|
6,987
|
10,150
|
60,450
|
||||||||
|
Joint
venture impairments
|
―
|
8,141
|
―
|
8,141
|
||||||||
|
Total
impairments and write-offs
|
$
|
43,313
|
$
|
16,426
|
$
|
11,342
|
$
|
71,081
|
||||
|
Year
Ended December 31, 2008
|
||||||||||||
|
California
|
Southwest
(1)
|
Southeast
|
Total
|
|||||||||
|
(Dollars
in thousands)
|
||||||||||||
|
Deposit
write-offs
|
$
|
14,950
|
$
|
5,463
|
$
|
5,236
|
$
|
25,649
|
||||
|
Inventory
impairments
|
578,057
|
192,929
|
172,108
|
943,094
|
||||||||
|
Joint
venture impairments
|
95,192
|
45,818
|
8,255
|
149,265
|
||||||||
|
Goodwill
impairments
|
2,691
|
8,667
|
24,164
|
35,522
|
||||||||
|
Total
impairments and write-offs
|
$
|
690,890
|
$
|
252,877
|
$
|
209,763
|
$
|
1,153,530
|
||||
|
Year
Ended December 31, 2007
|
||||||||||||
|
California
|
Southwest
(1)
|
Southeast
|
Total
|
|||||||||
|
(Dollars
in thousands)
|
||||||||||||
|
Deposit
write-offs
|
$
|
8,674
|
$
|
6,919
|
$
|
6,946
|
$
|
22,539
|
||||
|
Inventory
impairments
|
406,318
|
168,491
|
130,611
|
705,420
|
||||||||
|
Joint
venture impairments
|
162,998
|
35,665
|
3,646
|
202,309
|
||||||||
|
Goodwill
impairments
|
―
|
―
|
54,324
|
54,324
|
||||||||
|
Total
impairments and write-offs
|
$
|
577,990
|
$
|
211,075
|
$
|
195,527
|
$
|
984,592
|
||||
Segment
financial information relating to the Company’s homebuilding assets and
investments in unconsolidated joint ventures was as follows:
|
December
31,
|
||||||||
|
2009
|
2008
|
|||||||
|
(Dollars
in thousands)
|
||||||||
|
Homebuilding
assets:
|
||||||||
|
California
|
$ | 671,887 | $ | 810,619 | ||||
|
Southwest
(1)
|
210,058 | 299,039 | ||||||
|
Southeast
|
181,931 | 275,893 | ||||||
|
Corporate
|
730,046 | 777,256 | ||||||
|
Total
homebuilding assets
|
$ | 1,793,922 | $ | 2,162,807 | ||||
|
Homebuilding
investments in unconsolidated joint ventures:
|
||||||||
|
California
|
$ | 36,793 | $ | 39,879 | ||||
|
Southwest
(1)
|
2,762 | 10,073 | ||||||
|
Southeast
|
860 | 516 | ||||||
|
Total
homebuilding investments in unconsolidated joint ventures
|
$ | 40,415 | $ | 50,468 | ||||
|
(1)
|
Excludes
our Tucson and San Antonio divisions, which are classified as discontinued
operations.
|
60
STANDARD
PACIFIC CORP. AND SUBSIDIARIES
NOTES
TO CONSOLIDATED FINANCIAL STATEMENTS
4.
Inventories
a.
Inventories Owned
Inventories
from continuing operations consisted of the following at:
|
December
31, 2009
|
||||||||||||||||
|
California
|
Southwest
|
Southeast
|
Total
|
|||||||||||||
|
(Dollars
in thousands)
|
||||||||||||||||
|
Land
and land under development
|
$ | 335,528 | $ | 125,823 | $ | 103,165 | $ | 564,516 | ||||||||
|
Homes
completed and under construction
|
207,719 | 57,641 | 50,963 | 316,323 | ||||||||||||
|
Model
homes
|
75,089 | 12,815 | 17,579 | 105,483 | ||||||||||||
|
Total
inventories owned
|
$ | 618,336 | $ | 196,279 | $ | 171,707 | $ | 986,322 | ||||||||
|
December
31, 2008
|
||||||||||||||||
|
California
|
Southwest
|
Southeast
|
Total
|
|||||||||||||
|
(Dollars
in thousands)
|
||||||||||||||||
|
Land
and land under development
|
$ | 356,854 | $ | 135,661 | $ | 136,581 | $ | 629,096 | ||||||||
|
Homes
completed and under construction
|
310,603 | 96,697 | 94,180 | 501,480 | ||||||||||||
|
Model
homes
|
79,384 | 23,864 | 28,697 | 131,945 | ||||||||||||
|
Total
inventories owned
|
$ | 746,841 | $ | 256,222 | $ | 259,458 | $ | 1,262,521 | ||||||||
In
accordance with ASC 360, we record impairment losses on inventories when events
and circumstances indicate that they may be impaired, and the undiscounted cash
flows estimated to be generated by those assets are less than their carrying
amounts. Inventories that are determined to be impaired are written
down to their estimated fair value. We calculate the fair value of a
project under a land residual value analysis and in certain cases in conjunction
with a discounted cash flow analysis. The operating margins (defined
as gross margin less direct selling and marketing costs) used to calculate land
residual values and related fair values for the majority of our projects during
the years ended December 31, 2009, 2008 and 2007, were generally in the 7% to
12% range and discount rates were generally in the 15% to 25%
range. The following table summarizes inventory impairments recorded
during the years ended December 31, 2009, 2008 and 2007:
|
Year
Ended December 31,
|
||||||||||||
|
2009
|
2008
|
2007
|
||||||||||
|
(Dollars
in thousands)
|
||||||||||||
|
Inventory
impairments related to:
|
||||||||||||
|
Land
under development and homes completed and under
construction
|
$ | 46,063 | $ | 827,611 | $ | 414,244 | ||||||
|
Land
held for sale or sold
|
14,387 | 115,483 | 291,176 | |||||||||
|
Total
inventory impairments
|
$ | 60,450 | $ | 943,094 | $ | 705,420 | ||||||
|
Remaining
carrying value of inventory impaired at year end
|
$ | 73,844 | $ | 847,655 | $ | 736,663 | ||||||
|
Number
of projects impaired during the year
|
27 | 184 | 132 | |||||||||
|
Total
number of projects included in inventories-owned and reviewed for
impairment during the year (1)
|
262 | 326 | 390 | |||||||||
|
(1)
|
Represents
the peak number of real estate projects that we had outstanding during
each respective year. The number of projects outstanding at the
end of each year is less than the number of projects listed
herein.
|
The
inventory impairments related to land under development and homes completed and
under construction were included in cost of home sales and the impairments
related to land held for sale or sold were included in cost of land sales in the
accompanying consolidated statements of operations (please see Note 3 for a
breakout of impairment charges by segment). The impairment charges
recorded during the periods noted above resulted primarily from lower home
prices, which were driven by increased incentives and price reductions required
to address weak demand and economic conditions, including record foreclosures,
high unemployment, low consumer confidence and tighter mortgage credit
standards.
61
STANDARD
PACIFIC CORP. AND SUBSIDIARIES
NOTES
TO CONSOLIDATED FINANCIAL STATEMENTS
b.
Inventories Not Owned
Inventories
not owned consisted of the following at:
|
December
31,
|
||||||||
|
2009
|
2008
|
|||||||
|
(Dollars
in thousands)
|
||||||||
|
Land
purchase and lot option deposits
|
$ | 4,543 | $ | 9,910 | ||||
|
Variable
interest entities, net of deposits
|
5,414 | 7,903 | ||||||
|
Other
lot option contracts, net of deposits
|
1,813 | 24,929 | ||||||
|
Total
inventories not owned
|
$ | 11,770 | $ | 42,742 | ||||
Under ASC
810, a non-refundable deposit paid to an entity is deemed to be a variable
interest that will absorb some or all of the entity’s expected losses if they
occur. Therefore, whenever we enter into a land option or purchase
contract with an entity and make a non-refundable deposit, a VIE may have been
created. If a VIE exists and we have a variable interest in that
entity, ASC 810 requires us to calculate expected losses and residual returns
for the VIE based on the probability of estimated future cash flows as described
in ASC 810. If we are deemed to be the primary beneficiary of a VIE
based on such calculations, we are required to consolidate the VIE on our
balance sheet.
At
December 31, 2009 and 2008, we consolidated three and two VIEs, respectively, as
a result of our options to purchase land or lots from the selling
entities. We made cash deposits or issued letters of credit to these
VIEs totaling approximately $0.7 million and $1.5 million as of December 31,
2009 and 2008, respectively, of which the cash deposits are included in land
purchase and lot option deposits in the table above. Our option
deposits generally represent our maximum exposure to the land seller if we elect
not to purchase the optioned property. In some instances, we may also
expend funds for due diligence, development and construction activities with
respect to optioned land prior to takedown, which we would have to write off
should we not exercise the option. We consolidated these VIEs because
we were considered the primary beneficiary in accordance with ASC
810. As a result, included in our consolidated balance sheets at
December 31, 2009 and 2008 were inventories not owned related to these VIEs of
approximately $6.1 million and $8.9 million (which includes $0.7 million and
$1.0 million in deposits, exclusive of outstanding letters of credit),
liabilities from inventories not owned of approximately $1.9 million and $0,
respectively, and noncontrolling interests of approximately $3.5 million and
$7.9 million, respectively. These amounts were recorded based on each
VIE’s estimated fair value upon consolidation. Creditors of these
VIEs, if any, have no recourse against us.
Other lot
option contracts represent specific performance obligations to purchase lots
that we have with various land sellers. In certain instances, the
land option contract contains a binding obligation requiring us to complete the
lot purchases. In other instances, the land option contract does not
obligate us to complete the lot purchases but, due to the magnitude of our
capitalized preacquisition costs, development and construction expenditures, we
are considered economically compelled to complete the lot
purchases.
5.
Homebuilding Other Assets
Homebuilding
other assets consisted of the following at:
|
December
31,
|
||||||||
|
2009
|
2008
|
|||||||
|
(Dollars
in thousands)
|
||||||||
|
Income
tax receivables
|
$
|
103,219
|
$
|
115,650
|
||||
|
Property
and equipment, net
|
4,827
|
8,939
|
||||||
|
Deferred
debt issuance costs
|
12,389
|
12,175
|
||||||
|
Prepaid
insurance
|
2,692
|
4,575
|
||||||
|
Other
assets
|
7,959
|
4,228
|
||||||
|
Total
homebuilding other assets
|
$
|
131,086
|
$
|
145,567
|
||||
62
STANDARD
PACIFIC CORP. AND SUBSIDIARIES
NOTES
TO CONSOLIDATED FINANCIAL STATEMENTS
6. Investments in Unconsolidated Land Development and Homebuilding Joint Ventures
The table
set forth below summarizes the combined statements of operations related to our
unconsolidated land development and homebuilding joint ventures accounted for
under the equity method:
|
Year
December 31,
|
||||||||||||
|
2009
|
2008
|
2007
|
||||||||||
|
(Dollars
in thousands)
|
||||||||||||
|
Revenues
|
$ | 69,900 | $ | 153,664 | $ | 412,630 | ||||||
|
Cost
of sales and expenses
|
(344,270 | ) | (293,205 | ) | (630,169 | ) | ||||||
|
Loss
of unconsolidated joint ventures
|
$ | (274,370 | ) | $ | (139,541 | ) | $ | (217,539 | ) | |||
|
Loss
from unconsolidated joint ventures reflected in the
|
||||||||||||
|
accompanying
consolidated statements of operations
|
$ | (4,717 | ) | $ | (151,729 | ) | $ | (190,025 | ) | |||
The loss
of our unconsolidated joint ventures for the year ended December 31, 2009 was
$274.4 million and included $291.0 million of losses from our North Las Vegas
joint venture (which recorded an impairment charge of approximately $300
million), offset by $13.8 million of income from our land development joint
venture in Southern California and $4.0 million of income from six homebuilding
joint ventures. The $4.7 million loss from unconsolidated joint ventures
reflected on the accompanying consolidated statement of operations included
$11.4 million in losses related to our North Las Vegas joint venture, which was
offset in part by approximately $3.7 million of income from our land development
joint venture in Southern California and $2.9 million in income from the
delivery of 112 homes from six joint ventures. We did not record the full
amount of our share of losses of our North Las Vegas joint venture as this joint
venture has non-recourse debt and we have no further obligation to fund such
joint venture or record losses in excess of our total amount
invested. Loss from unconsolidated joint ventures for the years ended
December 31, 2008 and 2007 in the accompanying consolidated statements of
operations reflects our proportionate share of the income (loss) of these
unconsolidated land development and homebuilding joint ventures plus any
additional impairments recorded against our investments in joint ventures which
we do not deem recoverable.
The table
set forth below summarizes the impairments we recorded against our investment in
unconsolidated joint ventures during the years ended December 31, 2009, 2008 and
2007:
|
Year
Ended December 31,
|
||||||||||||
|
2009
|
2008
|
2007
|
||||||||||
|
(Dollars
in thousands)
|
||||||||||||
|
Joint
venture impairments related to:
|
||||||||||||
|
Homebuilding
joint ventures
|
$ | ― | $ | 64,379 | $ | 103,518 | ||||||
|
Land
development joint ventures
|
8,141 | 84,886 | 98,791 | |||||||||
|
Total
joint venture impairments
|
$ | 8,141 | $ | 149,265 | $ | 202,309 | ||||||
|
Number
of projects impaired during the year
|
1 | 20 | 30 | |||||||||
|
Total
number of projects included in unconsolidated joint
|
||||||||||||
|
ventures
and reviewed for impairment during the year (1)
|
13 | 39 | 74 | |||||||||
|
(1)
|
Represents
the peak number of real estate projects that we had outstanding during
each respective year. The number of projects outstanding at the
end of each year is less than the number of projects listed
herein. In addition, certain unconsolidated joint ventures have
multiple real estate projects.
|
63
STANDARD
PACIFIC CORP. AND SUBSIDIARIES
NOTES
TO CONSOLIDATED FINANCIAL STATEMENTS
The table
set forth below summarizes the combined balance sheets related to our
unconsolidated land development and homebuilding joint ventures:
|
December
31,
|
|||||||
|
2009
|
2008
|
||||||
|
(Dollars
in thousands)
|
|||||||
|
Assets:
|
|||||||
|
Cash
|
$
|
26,382
|
$
|
48,566
|
|||
|
Inventories
|
351,267
|
843,419
|
|||||
|
Other
assets
|
5,433
|
4,874
|
|||||
|
Total
assets
|
$
|
383,082
|
$
|
896,859
|
|||
|
Liabilities
and Equity:
|
|||||||
|
Accounts
payable and accrued liabilities
|
$
|
105,431
|
$
|
102,218
|
|||
|
Recourse
debt
|
38,835
|
173,894
|
|||||
|
Non-recourse
debt
|
178,373
|
247,954
|
|||||
|
Standard
Pacific equity
|
14,160
|
106,872
|
|||||
|
Other
Members' equity
|
46,283
|
265,921
|
|||||
|
Total
liabilities and equity
|
$
|
383,082
|
$
|
896,859
|
|||
|
Investment
in unconsolidated joint ventures reflected in the accompanying
consolidated balance sheets
|
$
|
40,415
|
$
|
50,468
|
|||
In some
cases our net investment in these unconsolidated joint ventures is not equal to
our proportionate share of equity reflected in the table above because of
differences between asset impairments recorded against our joint venture
investments and impairments recorded by the applicable joint
venture. Our net investment also included approximately $1.9 million
and $6.0 million of homebuilding interest capitalized to investments in
unconsolidated joint ventures as of December 31, 2009 and 2008,
respectively.
The $26.3
million difference between our share of equity in our unconsolidated joint
ventures reflected in the table above and our net investment reflected in the
accompanying balance sheets as of December 31 2009, relates primarily to our
investment in our North Las Vegas joint venture. As a result of the
inventory impairment charges recorded by this joint venture during the year
ended December 31, 2009, we impaired the remaining portion of our investment in
such joint venture to $0. However, the Standard Pacific equity
related to this joint venture reflected in the table above was further reduced
to negative $29.4 million and since we have no further obligation to fund this
deficit amount, we have not recorded this negative capital balance in our
investment in unconsolidated joint venture account.
For
certain joint ventures for which we are the managing member, we receive
management fees, which represent overhead and other reimbursements for costs
associated with managing the related real estate projects. During the
years ended December 31, 2009, 2008 and 2007, we recognized management fees of
approximately $1.9 million, $0.6 million and $5.7 million,
respectively. Management fees were recorded as a reduction of our
general and administrative and construction overhead costs. As of
December 31, 2009 and 2008, we had approximately $358,000 from two joint
ventures and $283,000 from one joint venture, respectively, in management fees
receivable which were included in trade and other receivables in the
accompanying consolidated balance sheets.
During
the year ended December 31, 2009, we purchased and unwound three Southern
California joint ventures. In connection with these transactions, we
assumed $77.3 million of joint venture indebtedness during
2009. During the year ended December 31, 2008, we purchased and
unwound four Southern California joint ventures, accelerated the takedown of
substantially all of the lots from two Southern California joint ventures, one
Northern California joint venture and one Arizona joint venture and exited two
other Northern California joint ventures. In connection with these
transactions, we assumed $115.3 million of joint venture indebtedness during
2008.
64
STANDARD
PACIFIC CORP. AND SUBSIDIARIES
NOTES
TO CONSOLIDATED FINANCIAL STATEMENTS
7.
Homebuilding Indebtedness
a.
Revolving Credit Facility and Term Loans
During
2009 we repaid in full and terminated our Term Loan A credit
facility. We also repaid in full the revolving loan portion of our
revolving credit facility and elected to reduce the letter of credit commitment
under the facility to $5 million. As of December 31, 2009, we had
$4.1 million in cash collateralized letters of credit outstanding under the
revolving credit facility. During the third quarter of 2009,
our $225 million Term Loan B credit facility was amended to, among other things,
eliminate most negative covenants and to eliminate the liquidity test requiring
the Company to maintain either a minimum ratio of cash flow from operations to
consolidated homebuilding interest incurred or a minimum interest
reserve. This liquidity test was replaced with a new financial
covenant requiring the Company to either (a) maintain compliance with one of the
following three ratios (i) a minimum ratio of cash flow from operations to
consolidated homebuilding interest incurred, (ii) a minimum ratio of
homebuilding EBITDA to consolidated homebuilding interest incurred or (iii) a
maximum ratio of combined net homebuilding debt to consolidated tangible net
worth or (b) pay a fee equal to 50 basis points per quarter on the outstanding
principal amount of the Term Loan B and prepay, on a quarterly basis, an
aggregate principal amount of $7.5 million of the Term Loan B. As of
December 31, 2009, we were in compliance with each of these three
ratios.
The
following summarizes the borrowings outstanding under our revolving credit
facility and bank term loans during the years ended December 31:
|
2009
|
2008
|
2007
|
||||||||||
|
(Dollars
in thousands)
|
||||||||||||
|
Maximum
month end borrowings outstanding during the year
|
$ | 330,000 | $ | 415,000 | $ | 773,500 | ||||||
|
Average
outstanding balance during the year
|
$ | 268,226 | $ | 371,667 | $ | 623,350 | ||||||
|
Weighted
average interest rate for the year
|
7.6% | 7.5 | 6.8% | |||||||||
|
Weighted
average interest rate on borrowings outstanding at year
end
|
7.3% | 8.0% | 7.2% | |||||||||
b.
Senior Notes Payable
Senior
notes payable consist of the following at:
|
December 31,
|
||||||||
|
2009
|
2008
|
|||||||
|
(Dollars
in thousands)
|
||||||||
|
5⅛%
Senior Notes due April 2009
|
$ | ― | $ | 124,550 | ||||
|
6½%
Senior Notes due August 2010
|
15,049 | 173,000 | ||||||
|
6⅞%
Senior Notes due May 2011
|
48,619 | 175,000 | ||||||
|
7¾%
Senior Notes due March 2013, net of discount
|
121,149 | 124,451 | ||||||
|
6¼%
Senior Notes due April 2014
|
150,000 | 150,000 | ||||||
|
7%
Senior Notes due August
2015
|
175,000 | 175,000 | ||||||
|
10¾%
Senior Notes due September 2016, net of
discount
|
258,201 | ― | ||||||
|
Term
Loan A due December 2009
|
― | 57,500 | ||||||
|
Term
Loan B due May 2013
|
225,000 | 225,000 | ||||||
| $ | 993,018 | $ | 1,204,501 | |||||
In March
2003, we issued $125 million of 7¾% Senior Notes due March 15, 2013. These
notes were issued at a discount to yield approximately 7.88% under the effective
interest method and have been reflected net of the unamortized discount in the
accompanying consolidated balance sheets. Interest on these notes is payable on
March 15 and September 15 of each year until maturity. The notes are
redeemable at our option, in whole or in part, at 103.875% of par, with the call
price reducing ratably to par on March 15, 2011.
In May
2003, we issued $175 million of 6⅞% Senior Notes due May 15, 2011. Interest
on these notes is due and payable on May 15 and November 15 of each
year until maturity. The notes are redeemable at our option, in whole or in
part, pursuant to a “make whole” formula.
In March
2004, we issued $150 million of 5⅛% Senior Notes due April 1, 2009 and $150
million of 6¼% Senior Notes due April 1, 2014. These notes were issued at
par with interest due and payable on April 1 and October 1 of each
year until maturity. The notes are redeemable at our option, in whole or in
part, pursuant to a “make whole” formula.
65
STANDARD
PACIFIC CORP. AND SUBSIDIARIES
NOTES
TO CONSOLIDATED FINANCIAL STATEMENTS
In August
2005, we issued $175 million of 6½% Senior Notes due August 15, 2010 and
$175 million of 7% Senior Notes due August 15, 2015. These notes were
issued at par with interest due and payable on February 15 and
August 15 of each year until maturity. The notes are redeemable at our
option, in whole or in part, pursuant to a “make whole” formula.
In
September 2009, a Standard Pacific Corp. subsidiary issued $280 million of 10¾%
senior notes due September 15, 2016 (the “2016 Notes”). We assumed
our subsidiary’s obligations under the 2016 Notes in October
2009. The 2016 Notes rank equally with our existing senior
notes. These notes were issued at a discount to yield approximately 12.50%
under the effective interest method and have been reflected net of the
unamortized discount in the accompanying consolidated balance sheets. The $250.6
million net proceeds from the offering were used to repurchase through a tender
offer approximately $133.4 million, $122.0 million and $3.4 million in principal
amount of senior notes due 2010, 2011 and 2013, respectively. As a
result of the repurchase, we recorded a $3.5 million loss (including the
write-off of $0.5 million of unamortized debt issuance costs), which was
included in gain (loss) on early extinguishment of debt in the accompanying
consolidated financial statements.
During
the year ended December 31, 2009, we repurchased at a discount, $24.5 million of
our 6½ % Senior Notes due 2010 and $4.4 million of our 6⅞% Senior Notes due 2011
and as a result, recognized a $5.4 million gain which was included in gain
(loss) on early extinguishment of debt in the accompanying consolidated
financial statements.
The
senior notes payable described above are all senior obligations and rank equally
with our other existing senior indebtedness, including borrowings under our Term
Loan B. These senior notes described above and our 9¼% Senior Subordinated Notes
further described below, contain covenants which, among other things, impose
certain limitations on our ability to (1) incur additional indebtedness,
(2) create liens, (3) make restricted payments (including payments of
dividends, other distributions, share repurchases, and investments in
unrestricted subsidiaries and unconsolidated joint ventures) and (4) sell
assets. Under the limitation on restricted payments, we are also
prohibited from making restricted payments, which include investments in and
advances to our joint ventures and other unrestricted subsidiaries, if we do not
satisfy either the leverage condition or interest coverage
condition. As of December 31, 2009, we were unable to satisfy either
condition. Our ability to make restricted payments is also subject to
a basket limitation. Our unrestricted subsidiaries are not subject to
this prohibition. As of December 31, 2009, we had approximately
$408.3 million of cash in our unrestricted subsidiaries available to fund our
joint venture capital requirements and to take actions that would otherwise
constitute prohibited restricted payments if made by us or our restricted
subsidiaries.
Many of
our wholly owned direct and indirect subsidiaries (collectively, the “Guarantor
Subsidiaries”) guaranty our outstanding senior notes and our senior subordinated
notes. The guarantees are full and unconditional, and joint and
several. Please see Note 20 for supplemental financial statement
information about our guarantor subsidiaries group and non-guarantor
subsidiaries group.
c.
Senior Subordinated Notes Payable
Senior
subordinated notes payable consisted of the following at:
|
December 31,
|
||||||||
|
2009
|
2008
|
|||||||
|
(Dollars
in thousands)
|
||||||||
|
6%
Senior Subordinated Convertible Notes due October 2012, net of
discount
|
$ | 33,852 | $ | 52,963 | ||||
|
9¼% Senior Subordinated Notes due
April 2012, net of discount
|
70,325 | 70,259 | ||||||
| $ | 104,177 | $ | 123,222 | |||||
On
April 15, 2002, we issued $150 million of 9¼% Senior Subordinated Notes due
April 15, 2012. These notes were issued at a discount to yield
approximately 9.38% under the effective interest method and have been reflected
net of the unamortized discount in the accompanying consolidated balance sheets
and are unsecured obligations that are junior to our senior indebtedness.
Interest on these notes is payable on April 15 and October 15 of each
year until maturity. We will, under certain circumstances, be obligated to make
an offer to purchase all or a portion of these notes in the event of certain
asset sales.
On
September 28, 2007, we issued $100 million of 6% senior subordinated convertible
notes (the “Convertible Notes”) due October 1, 2012. In connection
with this offering, we also entered into a convertible note hedge transaction
designed to
66
STANDARD
PACIFIC CORP. AND SUBSIDIARIES
NOTES
TO CONSOLIDATED FINANCIAL STATEMENTS
During
the year ended December 31, 2009, we entered into three privately negotiated
transactions pursuant to which we repurchased at a discount $32.8 million
principal amount of our Convertible Notes in exchange for 7.6 million shares of
our common stock and as a result, recognized a $1.5 million loss which was
included in gain (loss) on early extinguishment of debt in the accompanying
consolidated financial statements. The loss included the write-off of
$0.7 million of unamortized debt issuance costs and $0.8 million related to the
derecognition of the convertible debt discount that was previously included in
stockholders’ equity in accordance with ASC 470. The Convertible
Notes were exchanged at a discount to their par value at an effective common
stock issuance price of $4.30 per share.
To
facilitate transactions by which investors in the Convertible Notes may hedge
their investments in such Convertible Notes, we entered into a share lending
facility, dated September 24, 2007, with an affiliate of one of the underwriters
in the Convertible Notes offering, under which we agreed to loan to the share
borrower up to approximately 7.8 million shares of our common stock for a period
beginning on the date we entered into the share lending facility and ending on
October 1, 2012, or, if earlier, the date as of which we have notified the share
borrower of our intention to terminate the facility after the entire principal
amount of the Convertible Notes ceases to be outstanding as a result of
conversion, repurchase or redemption, or earlier in certain
circumstances. During the 2009 third quarter, 3.9 million of the
shares issued under the share lending facility were returned to us, and as of
December 31, 2009, 3.9 million of these shares remained
outstanding.
d.
Secured Project Debt and Other Notes Payable
At
December 31, 2009, we had approximately $57.6 million outstanding in secured
project debt that was assumed in connection with the unwinding of three joint
ventures. In February 2010, we repaid in full two of the assumed
loans for approximately $32.4 million. The remaining loan matures
on March 31, 2010. We are actively engaged in discussions with
the lender to extend this loan.
In
addition, at December 31, 2009, we had approximately $1.9 million outstanding in
other notes payable. Our other notes payable consist of purchase money mortgage
financing and community development district and similar assessment district
bond financings used to finance land development and infrastructure costs for
which we are responsible.
e.
Borrowings and Maturities
Maturities
of the Term Loan B, senior and senior subordinated notes payable, and secured
project debt and other notes payable are as follows:
|
Year
Ended
December
31,
|
|||
|
(Dollars
in thousands)
|
|||
|
2010
|
$ | 58,256 | |
|
2011
|
64,943 | ||
|
2012
|
116,117 | ||
|
2013
|
346,583 | ||
|
2014
|
150,000 | ||
|
Thereafter
|
455,000 | ||
| $ | 1,190,899 | ||
The
weighted average interest rate of our borrowings outstanding under our revolving
credit facility, bank term loans, senior and senior subordinated notes payable,
secured project debt and other notes payable (excluding indebtedness included in
liabilities from inventories not owned) as of December 31, 2009, 2008 and 2007,
was 8.1%, 6.8%, and 6.8%, respectively.
67
STANDARD
PACIFIC CORP. AND SUBSIDIARIES
NOTES
TO CONSOLIDATED FINANCIAL STATEMENTS
8.
Comprehensive Income (Loss)
The
components of comprehensive income (loss) were as follows:
|
Year
Ended December 31,
|
||||||||||||
|
2009
|
2008
|
2007
|
||||||||||
|
(Dollars
in thousands)
|
||||||||||||
|
Net
income (loss)
|
$ | (13,786 | ) | $ | (1,233,615 | ) | $ | (767,380 | ) | |||
|
Unrealized
income (loss) on interest rate swaps, net of related income tax
effects
|
7,424 | (10,037 | ) | (7,267 | ) | |||||||
|
Comprehensive
income (loss)
|
$ | (6,362 | ) | $ | (1,243,652 | ) | $ | (774,647 | ) | |||
9.
Loss Per Share
The following
table sets forth the components used in the computation of basic and diluted
loss per share. For the years ended December 31, 2009, 2008 and 2007,
all dilutive securities were excluded from the calculation as they were
anti-dilutive as a result of the net loss for these respective
periods. Shares outstanding under the share lending facility are not
treated as outstanding for earnings per share purposes in accordance with ASC
260 because the share borrower must return to us all borrowed shares (or
identical shares) on or about October 1, 2012, or earlier in certain
circumstances.
|
Year
Ended December 31,
|
||||||||||
|
2009
|
2008
|
2007
|
||||||||
|
(Dollars
in thousands, except per share amounts)
|
||||||||||
|
Numerator:
|
||||||||||
|
Net
loss from continuing operations
|
$
|
(13,217)
|
$
|
(1,231,329)
|
$
|
(695,290)
|
||||
|
Less:
Net loss from continuing operations allocated to preferred
shareholders
|
8,025
|
488,322
|
―
|
|||||||
|
Numerator
for basic and diluted loss per common share from continuing
operations
|
$
|
(5,192)
|
$
|
(743,007)
|
$
|
(695,290)
|
||||
|
Net
loss from discontinued operations
|
$
|
(569)
|
$
|
(2,286)
|
$
|
(72,090)
|
||||
|
Less:
Net loss from discontinued operations allocated to preferred
shareholders
|
346
|
907
|
―
|
|||||||
|
Numerator
for basic and diluted loss per common share from discontinued
operations
|
$
|
(223)
|
$
|
(1,379)
|
$
|
(72,090)
|
||||
|
Denominator:
|
||||||||||
|
Weighted
average basic and diluted common shares outstanding
|
95,623,851
|
81,439,248
|
72,157,394
|
|||||||
|
Basic
and diluted loss per common share from continuing
operations
|
$
|
(0.06)
|
$
|
(9.12)
|
$
|
(9.63)
|
||||
|
Basic
and diluted loss per common share from discontinued
operations
|
(0.00)
|
(0.02)
|
(1.00)
|
|||||||
|
Basic
and diluted loss per common share
|
$
|
(0.06)
|
$
|
(9.14)
|
$
|
(10.63)
|
||||
On September
3, 2008, we completed our Rights Offering for which each holder of our common
stock as of the record date was issued a transferable right to purchase up to
such holder’s pro rata share of 50 million shares of our common stock at a per
share price of $3.05. Record date stockholders received one right for
every share of common stock on the record date. Each right entitled
the holder to purchase 0.68523554 of a share of common stock. The
market price of our common stock was $4.08 per share on July 23, 2008, which was
the last day that our common stock and the rights traded
together. Since the $3.05 per share subscription price of common
stock issued under the rights offering was lower than the $4.08 per share market
price on July 23, 2008, the rights offering contained a bonus element as defined
under ASC 260. As a result, we retroactively increased the weighted
average common shares outstanding used to compute basic earnings (loss) per
share by an adjustment factor of approximately 1.1144 for all periods prior to
the rights issue.
10.
Stockholders’ Equity
a. Series
B Preferred Stock
At December 31,
2009, we had 450,829 shares of Series B junior participating convertible
preferred stock (“Series B Preferred Stock”) outstanding, which are convertible
into 147.8 million shares of our common stock. The number of shares of common
stock into which our Series B Preferred Stock is convertible is determined by
dividing $1,000 by the applicable conversion price ($3.05, subject to customary
anti-dilution adjustments) plus cash in lieu of fractional shares. The Series B
Preferred Stock will be convertible at the holder’s option into shares of our
common stock provided that no holder, with its affiliates, may beneficially own
total voting power of our voting stock in excess of 49%. The Series B
Preferred Stock also mandatorily converts into our common stock upon its sale,
transfer or other disposition by MatlinPatterson or its affiliates to an
unaffiliated third party. The Series B Preferred Stock votes together with our
common stock on all matters upon which
68
STANDARD
PACIFIC CORP. AND SUBSIDIARIES
NOTES
TO CONSOLIDATED FINANCIAL STATEMENTS
holders
of our common stock are entitled to vote. Each share of Series B Preferred Stock
is entitled to such number of votes as the number of shares of our common stock
into which such share of Series B Preferred Stock is convertible, provided that
the aggregate votes attributable to such shares with respect to any holder of
Series B Preferred Stock (including its affiliates), taking into consideration
any other voting securities of the Company held by such stockholder, cannot
exceed more than 49% of the total voting power of the voting stock of the
Company. Shares of Series B Preferred Stock are entitled to receive only those
dividends declared and paid on the common stock. As of December 31,
2009, the outstanding shares of Series B Preferred Stock owned by
MatlinPatterson represented approximately 58% (or 69%, assuming MatlinPatterson
had exercised the Warrant for cash on such date) of the total number of shares
of our common stock outstanding on an if-converted basis.
b. Warrant
At
December 31, 2009, MatlinPatterson holds a warrant to purchase 272,670 shares of
Senior Preferred Stock at a common stock equivalent exercise price of $4.10 per
share (the “Warrant”), which is exercisable for Series B Preferred Stock. The
shares of Series B Preferred Stock issuable upon exercise of the Warrant
(assuming MatlinPatterson does not make a cashless exercise) will initially be
convertible into 89.4 million shares of our common stock. The Warrant
contains a mandatory exercise provision requiring exercise of 25%, 25% and 50%
of the shares subject to the Warrant if the following price hurdles for a share
of our common stock are exceeded for twenty out of thirty consecutive trading
days: $7.50, $9.00, and $10.50, respectively.
11.
Mortgage Credit Facilities
At
December 31, 2009, we had approximately $41.0 million outstanding under our
mortgage financing subsidiary’s mortgage credit facilities. These
mortgage credit facilities consist of a $45 million repurchase facility and a
$60 million early purchase facility. The lender generally does not
have discretion to refuse to fund requests under the repurchase facility if our
mortgage loans comply with the requirements of the facility, though the lender
has substantial discretion to modify these requirements from time to time, even
if any such modification adversely affects our mortgage financing subsidiary’s
ability to utilize this facility. The lender has the right to
terminate the repurchase facility on not less than 90 days
notice. These mortgage credit facilities are scheduled to mature in
July 2010 and require Standard Pacific Mortgage to maintain cash collateral
accounts aggregating $3.2 million. These facilities also contain financial
covenants which require Standard Pacific Mortgage to, among other things,
maintain a minimum level of tangible net worth, not to exceed a debt to tangible
net worth ratio, maintain a minimum liquidity of $5 million (inclusive of the
$3.2 million cash collateral requirement), and satisfy pretax income (loss)
requirements. As of December 31, 2009, Standard Pacific Mortgage was
in compliance with the financial and other covenants contained in these
facilities.
12.
Disclosures about Fair Value
The
following methods and assumptions were used to estimate the fair value of each
class of financial instrument for which it is practicable to
estimate:
Cash and
Equivalents—The carrying amount is a reasonable estimate of fair value as
these assets primarily consist of short-term investments and demand
deposits.
Mortgage Loans
Held for Investment—Fair value of these loans is based on the estimated
market value of the underlying collateral based on market data and other factors
for similar type properties as further adjusted to reflect their estimated net
realizable value of carrying the loans through disposition.
Revolving
Credit Facility—The fair value of this credit facility was based on
quoted market prices for similar instruments at the end of the
period.
Mortgage Credit
Facilities—The carrying amounts of these credit obligations approximate
market value because of the frequency of repricing the
borrowings.
Secured Project
Debt and Other Notes Payable—These notes are for purchase money deeds of
trust on land acquired and certain other real estate inventory construction,
including secured bank acquisition, development and construction loans and
community development district bonds. The notes were discounted at an interest
rate that is commensurate with market rates of similar secured real estate
financing.
69
STANDARD
PACIFIC CORP. AND SUBSIDIARIES
NOTES
TO CONSOLIDATED FINANCIAL STATEMENTS
Senior and
Senior Subordinated Notes Payable—The public senior and senior
subordinated notes are traded over the counter and their fair values were based
upon the values of their last trade at the end of the period. The Term Loan A
and Term Loan B notes were based on quoted market prices at the end of the
period.
Forward Sale
Commitments of Mortgage-Backed Securities—These instruments consist of
the forward sale of publicly traded mortgage-backed securities. Fair values of
these instruments are based on quoted market prices for similar
instruments.
Commitments to
Originate Mortgage Loans—These instruments consist of extending interest
rate locks to loan applicants. Fair values of these instruments are based on
market rates of similar interest rate locks.
|
December
31,
|
||||||||||||||||
|
2009
|
2008
|
|||||||||||||||
|
Carrying
Amount
|
Fair
Value
|
Carrying
Amount
|
Fair
Value
|
|||||||||||||
|
(Dollars
in thousands)
|
||||||||||||||||
|
Financial
assets:
|
||||||||||||||||
|
Homebuilding:
|
||||||||||||||||
|
Cash
and equivalents
|
$ | 602,222 | $ | 602,222 | $ | 626,379 | $ | 626,379 | ||||||||
|
Financial
services:
|
||||||||||||||||
|
Cash
and equivalents
|
$ | 11,602 | $ | 11,602 | $ | 7,976 | $ | 7,976 | ||||||||
|
Mortgage
loans held for investment
|
$ | 10,818 | $ | 10,818 | $ | 11,736 | $ | 11,736 | ||||||||
|
Financial
liabilities:
|
||||||||||||||||
|
Homebuilding:
|
||||||||||||||||
|
Revolving
credit facility
|
$ | ― | $ | ― | $ | 47,500 | $ | 35,625 | ||||||||
|
Secured
project debt and other notes payable
|
$ | 59,531 | $ | 59,531 | $ | 111,214 | $ | 111,214 | ||||||||
|
Senior
notes payable, net
|
$ | 993,018 | $ | 931,710 | $ | 1,204,501 | $ | 769,298 | ||||||||
|
Senior
subordinated notes payable, net
|
$ | 104,177 | $ | 110,228 | $ | 123,222 | $ | 68,625 | ||||||||
|
Financial
services:
|
||||||||||||||||
|
Mortgage
credit facilities
|
$ | 40,995 | $ | 40,995 | $ | 63,655 | $ | 63,655 | ||||||||
|
Off-balance
sheet financial instruments:
|
||||||||||||||||
|
Forward
sale commitments of mortgage-backed securities
|
$ | ― | $ | ― | $ | 15,000 | $ | 14,762 | ||||||||
|
Commitments
to originate mortgage loans
|
$ | 45,774 | $ | 46,481 | $ | 12,032 | $ | 12,272 | ||||||||
ASC Topic
820, Fair Value Measurements
and Disclosures (“ASC 820”) establishes a framework for measuring fair
value, expands disclosures regarding fair value measurements and defines fair
value as the price that would be received to sell an asset or paid to transfer a
liability in an orderly transaction between market participants at the
measurement date. Further, ASC 820 requires us to maximize the use of observable
market inputs, minimize the use of unobservable market inputs and disclose in
the form of an outlined hierarchy the details of such fair value measurements.
ASC 820 specifies a hierarchy of valuation techniques based on whether the
inputs to a fair value measurement are considered to be observable or
unobservable in a marketplace. The three levels of the hierarchy are as
follows:
|
·
|
Level
1 – quoted prices for identical assets or
liabilities in active markets;
|
|
·
|
Level
2 – quoted prices for similar assets or
liabilities in active markets; quoted prices for identical or similar
assets or liabilities in markets that are not active; and model-derived
valuations in which significant inputs and significant value drivers are
observable in active markets; and
|
|
·
|
Level
3 – valuations derived from valuation techniques in which one or more
significant inputs or significant value drivers are unobservable.
|
70
STANDARD
PACIFIC CORP. AND SUBSIDIARIES
NOTES
TO CONSOLIDATED FINANCIAL STATEMENTS
The
following assets and liabilities have been measured at fair value in accordance
with ASC 820 for the year ended December 31, 2009:
|
Fair
Value Measurements at Reporting Date Using
|
||||||||||||
|
Quoted
Prices in
|
Significant
Other
|
Significant
|
||||||||||
|
Active
Markets for
|
Observable
|
Unobservable
|
||||||||||
|
As
of
|
Identical
Assets
|
Inputs
|
Inputs
|
|||||||||
|
Description
|
December
31, 2009
|
(Level
1)
|
(Level
2)
|
(Level
3)
|
||||||||
|
(Dollars
in thousands)
|
||||||||||||
|
Assets:
|
||||||||||||
|
Inventories
owned
|
$
|
119,391
|
$
|
―
|
$
|
―
|
$
|
119,391
|
||||
|
Mortgage
loans held for sale
|
$
|
41,048
|
$
|
―
|
$
|
41,048
|
$
|
―
|
||||
|
Liabilities:
|
||||||||||||
|
Interest
rate swaps
|
$
|
24,727
|
$
|
―
|
$
|
24,727
|
$
|
―
|
||||
Inventories
Owned—Represents the aggregate fair
values for projects that were impaired during the year ended December 31, 2009,
as of the date that the fair value measurements were made. The
carrying value for these projects may have subsequently increased or decreased
due to activities that have occurred since the measurement date. In
accordance with ASC 360, during the year ended December 31, 2009, inventories
owned with a carrying amount of $179.8 million were determined to be impaired
and were written down to their estimated fair value of $119.4 million, resulting
in an impairment charge of $60.5 million. These impairment charges
were included in cost of sales in the accompanying statements of
operations.
Mortgage Loans Held for
Sale—These consist of first mortgages on
single-family residences which are eligible for sale to Fannie Mae, FHA or VA,
as applicable. Fair values of these loans are based on quoted prices from third
party investors when preselling loans.
Interest Rate Swaps—The fair value of interest rate swap agreements is
the estimated amount that we would receive or pay to terminate the swap
agreements at the reporting date, based on quoted mid-market prices or pricing
models using current mid-market rates.
We
adopted the provisions of ASC Topic 825, Financial Instruments (“ASC 825”), on a
prospective basis for mortgage loans held for sale, effective November 1,
2008. In accordance with the provisions of ASC 825, mortgage loans held for sale
originated on or subsequent to November 1, 2008 are measured at fair value.
The adoption of ASC 825 for mortgage loans held for sale improves consistency of
mortgage loan valuation between the date the borrower locks the interest rate on
the pending loan and the date of the mortgage loan sale. Prior to the adoption
of ASC 825, mortgage loans held for sale were reported at the lower of cost or
market on an aggregate basis.
13.
Commitments and Contingencies
a.
Land
Purchase and Option Agreement
We
are subject to customary obligations associated with entering into contracts for
the purchase of land and improved homesites. These purchase contracts typically
require a cash deposit or delivery of a letter of credit, and the purchase of
properties under these contracts is generally contingent upon satisfaction of
certain requirements by the sellers, including obtaining applicable property and
development entitlements. We also utilize option contracts with land
sellers and third-party financial entities as a method of acquiring land in
staged takedowns, to help us manage the financial and market risk associated
with land holdings, and to reduce the use of funds from our corporate financing
sources. Option contracts generally require a non-refundable deposit
for the right to acquire lots over a specified period of time at predetermined
prices. We generally have the right at our discretion to terminate
our obligations under both purchase contracts and option contracts by forfeiting
our cash deposit or by repaying amounts drawn under our letter of credit with no
further financial responsibility to the land seller, although in certain
instances, the land seller has the right to compel us to purchase a specified
number of lots at predetermined prices. Also, in a few instances
where we have entered into option contracts with third party financial entities,
we have generally entered into construction agreements that do not terminate if
we elect not to exercise our option. In these instances, we are
generally obligated to complete land development improvements on the optioned
property at a predetermined cost (paid by the option provider) and are
responsible for all cost overruns. At December 31, 2009, we had two
option contracts outstanding with third party financial entities with
approximately $2.6 million of remaining land
71
STANDARD
PACIFIC CORP. AND SUBSIDIARIES
NOTES
TO CONSOLIDATED FINANCIAL STATEMENTS
development
improvement costs, all of which is anticipated to be funded by the option
provider. In some instances, we may also expend funds for due
diligence, development and construction activities with respect to our land
purchase and option contracts prior to purchase, which we would have to write
off should we not purchase the land. At December 31, 2009, we had
non-refundable cash deposits and letters of credit outstanding of approximately
$4.3 million and capitalized preacquisition and other development and
construction costs of approximately $4.2 million relating to land purchase and
option contracts having a total remaining purchase price of approximately $75.3
million. Approximately $7.2 million of the remaining purchase price
has been capitalized in inventories not owned in the accompanying consolidated
balance sheets.
Our
utilization of option contracts is dependent on, among other things, the
availability of land sellers willing to enter into option takedown arrangements,
the availability of capital to financial intermediaries, general housing market
conditions, and geographic preferences. Options may be more difficult
to procure from land sellers in strong housing markets and are more prevalent in
certain geographic regions.
For
the years ended December 31, 2009, 2008 and 2007, we incurred pretax charges
(net of recoveries) of $2.5 million, $25.6 million and $22.5 million,
respectively, related to the write-offs of option deposits and capitalized
preacquisition costs for abandoned projects. These charges were
included in other income (expense) in the accompanying consolidated statements
of operations. We continue to evaluate the terms of open land option
and purchase contracts in light of slower housing market conditions and may
write-off additional option deposits and capitalized preacquisition costs in the
future, particularly in those instances where land sellers or third party
financial entities are unwilling to renegotiate significant contract
terms.
b. Land
Development and Homebuilding Joint Ventures
During
the years ended December 31, 2009 and 2008, we assumed $77.3 million and $115.3
million, respectively, of project specific debt in connection with the unwinding
of three and four joint ventures, respectively, of which $57.6 million was
outstanding as of December 31, 2009. In addition, during 2009
and 2008 we paid $23.0 million and $85.8 million, respectively, to satisfy other
joint venture obligations, which consisted primarily of loan to value remargin
payments and other payments related to exiting certain joint
ventures. As of December 31, 2009, we held membership interests in 19
homebuilding and land development joint ventures, of which eight were active and
11 were inactive or winding down. As of such date, three joint
ventures had an aggregate of $38.8 million in project specific financing
recourse to us and one had $178.4 million of nonrecourse project specific
financing. In addition, as of such date, we had approximately $17.8
million of surety bonds outstanding subject to indemnity arrangements by us and
our partners and had an estimated $0.9 million remaining in cost to
complete.
c.
Surety Bonds
We
cause surety bonds to be issued in the normal course of business to ensure
completion of the infrastructure of our projects. At December 31,
2009, we had approximately $226.3 million in surety bonds outstanding from
continuing operations (exclusive of surety bonds related to our joint ventures)
with respect to which we had an estimated $69.0 million remaining in cost to
complete.
d.
Mortgage Loans and Commitments
We
commit to making mortgage loans to our homebuyers through our mortgage financing
subsidiary, Standard Pacific Mortgage, Inc. Mortgage loans in process
for which interest rates were committed to borrowers totaled approximately $45.2
million at December 31, 2009 and carried a weighted average interest rate of
approximately 4.9%. Interest rate risks related to these obligations
are mitigated through the preselling of loans to investors. As
of December 31, 2009, Standard Pacific Mortgage had approximately $86.8 million
in closed mortgage loans held for sale and mortgage loans in process which were
presold to investors subject to completion of the investors’ administrative
review of the applicable loan documents.
Standard
Pacific Mortgage sells substantially all of the loans it originates in the
secondary mortgage market, with servicing rights released on a non-recourse
basis. This sale is subject to Standard Pacific Mortgage’s obligation
to repay its gain on sale if the loan is prepaid by the borrower within a
certain time period following such sale, or to repurchase the loan if, among
other things, the purchaser’s underwriting guidelines are not met, or there is
fraud in connection with the loan.
72
STANDARD
PACIFIC CORP. AND SUBSIDIARIES
NOTES
TO CONSOLIDATED FINANCIAL STATEMENTS
e.
Operating Leases
We
lease office facilities and certain equipment under noncancelable operating
leases. Future minimum rental payments under these leases, net of related
subleases, having an initial term in excess of one year as of December 31, 2009
are as follows:
|
Year
Ended
December
31,
|
||||
|
(Dollars
in thousands)
|
||||
|
2010
|
$
|
7,254
|
||
|
2011
|
4,817
|
|||
|
2012
|
2,986
|
|||
|
2013
|
1,074
|
|||
|
2014
|
566
|
|||
|
Thereafter
|
408
|
|||
|
Subtotal
|
17,105
|
|||
|
Less
- Estimated sublease income
|
(2,449)
|
|||
|
Net
rental obligations
|
$
|
14,656
|
||
Rent expense
under noncancelable operating leases, net of sublease income, for each of the
years ended December 31, 2009, 2008 and 2007 was approximately $6.0 million,
$11.0 million and $13.0 million, respectively.
14.
Income Taxes
The
(provision) benefit for income taxes includes the following
components:
|
Year
Ended December 31,
|
||||||||||
|
2009
|
2008
|
2007
|
||||||||
|
(Dollars
in thousands)
|
||||||||||
|
Current
(provision) benefit for income taxes:
|
||||||||||
|
Federal
|
$
|
93,861
|
$
|
(128,453)
|
$
|
235,631
|
||||
|
State
|
2,702
|
―
|
(985)
|
|||||||
|
96,563
|
(128,453)
|
234,646
|
||||||||
|
Deferred
(provision) benefit for income taxes:
|
||||||||||
|
Federal
|
|
―
|
|
135,248
|
|
(39,956)
|
||||
|
State
|
―
|
―
|
(5,736)
|
|||||||
|
―
|
135,248
|
(45,692)
|
||||||||
|
(Provision)
benefit for income taxes
|
$
|
96,563
|
$
|
6,795
|
$
|
188,954
|
||||
|
(Provision)
benefit for income taxes - continuing operations
|
$
|
96,265
|
$
|
5,495
|
$
|
149,003
|
||||
|
(Provision)
benefit for income taxes - discontinued operations
|
298
|
1,300
|
39,951
|
|||||||
|
(Provision)
benefit for income taxes
|
$
|
96,563
|
$
|
6,795
|
$
|
188,954
|
||||
73
STANDARD
PACIFIC CORP. AND SUBSIDIARIES
NOTES
TO CONSOLIDATED FINANCIAL STATEMENTS
The
components of our net deferred income tax asset are as follows:
|
December
31,
|
||||||||
|
2009
|
2008
|
|||||||
|
(Dollars
in thousands)
|
||||||||
|
Inventory
impairment charges
|
$ | 296,375 | $ | 441,037 | ||||
|
Investments
in unconsolidated joint ventures
|
(12,930 | ) | 29,259 | |||||
|
Financial
accruals
|
58,700 | 56,013 | ||||||
|
Federal
net operating loss carryforwards
|
129,507 | 44,428 | ||||||
| State net operating loss carryforwards | 40,345 | 63,877 | ||||||
|
Goodwill
impairment charges
|
21,424 | 24,835 | ||||||
|
Interest
rate swap
|
9,431 | 14,122 | ||||||
|
Other,
net
|
1,175 | (5,342 | ) | |||||
|
Subtotal
|
544,027 | 668,229 | ||||||
|
Less:
Valuation allowance
|
(534,596 | ) | (654,107 | ) | ||||
|
Deferred
income taxes
|
$ | 9,431 | $ | 14,122 | ||||
At
December 31, 2009, we had gross federal and state net operating loss
carryforwards of approximately $423 million and $732 million, respectively,
which if unused, will begin to expire in 2028 and 2019,
respectively.
The
effective tax rate differs from the federal statutory rate of 35% due to the
following items:
|
Year
Ended December 31,
|
||||||||||
|
2009
|
2008
|
2007
|
||||||||
|
(Dollars
in thousands)
|
||||||||||
|
Income
(loss) before taxes
|
$
|
(110,349)
|
$
|
(1,240,410)
|
$
|
(956,334)
|
||||
|
(Provision)
benefit for income taxes at federal statutory rate
|
$
|
38,622
|
$
|
434,144
|
$
|
334,717
|
||||
|
(Increases)
decreases in tax resulting from:
|
||||||||||
|
State
income taxes, net of federal benefit
|
4,195
|
48,168
|
34,583
|
|||||||
|
Net
deferred tax asset valuation (allowance) benefit
|
51,429
|
(473,627)
|
(180,480)
|
|||||||
|
Other,
net
|
2,317
|
(1,890)
|
134
|
|||||||
|
Benefit
for income taxes
|
$
|
96,563
|
$
|
6,795
|
$
|
188,954
|
||||
|
Effective
tax rate
|
87.5%
|
0.5%
|
19.8%
|
|||||||
We generated
significant deferred tax assets during 2007 through 2009, largely due to
inventory, joint venture and goodwill impairments, and have been in a cumulative
loss position as described in ASC Topic 740, Income Taxes (“ASC 740”)
since December 31, 2007. During the years ended December 31, 2009,
2008 and 2007, we recorded noncash valuation allowances of $42.7 million, $473.6
million and $180.5 million, respectively, against the net deferred tax
assets. In addition, during the fourth quarter of 2009, we recorded a
$94.1 million reversal of our deferred tax asset valuation allowance due to the
federal tax legislation that extended the carryback of net operating losses from
two years to five years. In connection with this legislation, we were
able to carry back our 2009 net operating losses five years to earnings
generated in 2004, 2005 and 2006. As of December 31, 2009, we had a
$534.6 million net deferred tax asset (excluding the $9.4 million deferred tax
asset relating to our interest rate swap) which has been fully reserved against
by a corresponding deferred tax asset valuation allowance of the same
amount. To the extent that we generate taxable income in the future
to utilize the tax benefits of the related deferred tax assets, subject to
certain potential limitations under Internal Revenue Code Section 382 (“Section
382”), we will be able to reduce our effective tax rate by reducing the
valuation allowance.
We
underwent a change in ownership under Section 382 during the 2008 second quarter
as a result of closing the first phase of the investment by MatlinPatterson in
our preferred stock. Approximately $190.0 million of our $534.6
million deferred tax asset represents unrealized built-in
losses. Future realization of this $190.0 million of unrealized
built-in losses may be limited under Section 382 depending on, among other
things, when, and at what price, we dispose of the underlying
assets. As of December 31, 2009, approximately $312.2 million of our
gross federal net operating loss carryforwards and approximately $327.8 million
of our gross state net operating loss carryforwards were subject to a gross
annual deduction limitation. The gross annual deduction limitation
for federal and state income tax purposes is approximately $15.6 million, which
is generally realized over a 20 year period commencing on the date of the
ownership change. Significant judgment is required in determining the
future realization of these potential deductions, and as a result, actual
results may differ materially from our estimates.
74
STANDARD
PACIFIC CORP. AND SUBSIDIARIES
NOTES
TO CONSOLIDATED FINANCIAL STATEMENTS
As of
December 31, 2009, our liability for gross unrecognized tax benefits was $11.4
million, of which $10.6 million, if recognized, would affect our effective tax
rate. Our liabilities for unrecognized tax benefits are included in
accrued liabilities on the accompanying consolidated balance
sheets. We classify estimated interest and penalties related to
unrecognized tax benefits in our provision for income taxes. A
reconciliation of the beginning and ending amount of gross unrecognized tax
benefits is as follows:
|
Year
Ended December 31,
|
||||||
|
2009
|
2008
|
|||||
|
(Dollars
in thousands)
|
||||||
|
Balance,
beginning of the year
|
$
|
4,613
|
$
|
5,511
|
||
|
Changes
based on tax positions related to the current year
|
9,126
|
―
|
||||
|
Changes
for tax position in prior years
|
―
|
50
|
||||
|
Reductions
due to lapse of statute of limitations
|
(2,307)
|
(948)
|
||||
|
Settlements
|
―
|
―
|
||||
|
Balance,
end of the year
|
$
|
11,432
|
$
|
4,613
|
||
We do not
anticipate significant changes in the accrued liability related to uncertain tax
positions during the next 12-month period. In addition, we remain
subject to examination by certain tax jurisdictions for the tax years ended
December 31, 2004 through 2009.
15. Stock Incentive and Employee
Benefit Plans
a. Stock
Incentive Plans
The
Company has share-based awards outstanding under four different plans,
pursuant to which we have granted stock options, performance share awards, and
restricted stock grants to key officers, employees, and directors. The exercise
price of our stock options may not be less than the market value of our common
stock on the date of grant. Stock options vest based on either time (generally
over a one to four year period) or market performance (based on stock price
appreciation) and generally expire between five and ten years after the date of
grant. The fair value for options is established at the date of grant using the
Black-Scholes model for options that vest based on time and the Lattice model
for options that vest based on market performance. Restricted stock typically
vests over a one to three year period and is valued at the closing price on the
date of grant.
The
following is a summary of stock option transactions relating to the four plans
on a combined basis for the years ended December 31, 2009, 2008 and
2007:
|
2009
|
2008
|
2007
|
|||||||||||||
|
Options
|
Weighted
Average
Exercise
Price
|
Options
|
Weighted
Average
Exercise
Price
|
Options
|
Weighted
Average
Exercise
Price
|
||||||||||
|
Options
outstanding, beginning of year
|
14,397,701
|
$
|
8.07
|
6,086,780
|
$
|
19.63
|
5,006,874
|
$
|
20.07
|
||||||
|
Granted
|
12,814,000
|
2.09
|
12,765,000
|
3.16
|
2,437,500
|
18.07
|
|||||||||
|
Exercised
|
(592,125)
|
1.08
|
―
|
―
|
(286,764)
|
8.12
|
|||||||||
|
Canceled
|
(6,227,620)
|
7.30
|
(4,454,079)
|
9.79
|
(1,070,830)
|
21.23
|
|||||||||
|
Options
outstanding, end of year
|
20,391,956
|
$
|
4.75
|
14,397,701
|
$
|
8.07
|
6,086,780
|
$
|
19.63
|
||||||
|
Options
exercisable at end of year
|
7,835,831
|
$
|
8.40
|
5,342,701
|
$
|
16.50
|
3,268,419
|
$
|
17.97
|
||||||
|
Options
available for future grant
|
5,624,664
|
|
|
||||||||||||
At December
31, 2009, 18,095,606 stock options were vested or expected to vest in the future
with a weighted average exercise price of $5.07 and a weighted average expected
life of 3.48 years.
75
STANDARD
PACIFIC CORP. AND SUBSIDIARIES
NOTES
TO CONSOLIDATED FINANCIAL STATEMENTS
The
following table summarizes information about stock options outstanding and
exercisable at December 31, 2009:
|
Options
Outstanding
|
Options
Exercisable
|
|||||||||||
|
Exercise
Prices
|
Number
of
Shares
|
Weighted
Average
Exercise
Price
|
Weighted
Average
Remaining
Contractual Life
|
Number
of
Shares
|
Weighted
Average
Exercise
Price
|
|||||||
|
Low
|
High
|
|||||||||||
|
$0.67
|
$8.25
|
18,702,483
|
$2.72
|
6.00
|
6,146,358
|
$3.21
|
||||||
|
$11.00
|
$11.69
|
304,038
|
$11.34
|
2.15
|
304,038
|
$11.34
|
||||||
|
$14.82
|
$27.59
|
479,385
|
$23.52
|
4.05
|
479,385
|
$23.52
|
||||||
|
$29.84
|
$43.53
|
906,050
|
$34.58
|
3.29
|
906,050
|
$34.58
|
||||||
The fair
value of each stock option granted during each of the three years ended December
31, 2009, 2008 and 2007 was estimated using the following weighted average
assumptions:
|
2009
|
2008
|
2007
|
|||
|
Dividend
yield
|
0.00%
|
0.00%
|
0.29%
|
||
|
Expected
volatility
|
86.32%
|
66.64%
|
43.23%
|
||
|
Risk-free
interest rate
|
2.21%
|
3.12%
|
4.43%
|
||
|
Expected
life
|
4.5
years
|
4.5 years
|
2.6 years
|
Based on
the above assumptions, the weighted average per share fair value of options
granted during the years ended December 31, 2009, 2008 and 2007, was $1.09,
$1.76 and $4.37, respectively.
On May 14, 2008, our
stockholders approved our 2008 Stock Incentive Plan (the “2008
Plan”). Under the 2008 Plan, as amended and approved by the
stockholders on August 18, 2008, the maximum number of shares of common stock
that may be issued is 21,940,000 plus awards forfeited under our prior
plans. During the year ended December 31, 2009, we granted 12.8
million stock options to our employees and issued 356,147 shares of stock to our
independent directors.
Total
compensation expense recognized related to stock-based compensation was as
follows:
|
Year
Ended December 31,
|
||||||||||||
|
2009
|
2008
|
2007
|
||||||||||
|
(Dollars
in thousands)
|
||||||||||||
|
Stock
options
|
$ | 8,174 | $ | 6,454 | $ | 13,691 | ||||||
|
Performance
share awards
|
― | 3,297 | 4,926 | |||||||||
|
Restricted
and unrestricted stock grants
|
4,690 | 1,359 | 1,533 | |||||||||
|
Total
|
$ | 12,864 | $ | 11,110 | $ | 20,150 | ||||||
Total
unrecognized compensation expense related to stock-based compensation was as
follows:
|
As
of December 31,
|
|||||||||||||||||||||
|
2009
|
2008
|
2007
|
|||||||||||||||||||
|
Unrecognized
Expense
|
Weighted
Average
Period
|
Unrecognized
Expense
|
Weighted
Average
Period
|
Unrecognized
Expense
|
Weighted
Average
Period
|
||||||||||||||||
|
(Dollars
in thousands)
|
|||||||||||||||||||||
|
Unvested
stock options
|
$ | 13,559 |
3.1
years
|
$ | 11,169 |
3.5
years
|
$ | 3,855 |
1.8
years
|
||||||||||||
|
Nonvested
performance share awards
|
― | ― | ― | ― | 3,384 |
1.8
years
|
|||||||||||||||
|
Nonvested
restricted stock grants
|
― | ― | ― | ― | 842 |
0.9
years
|
|||||||||||||||
|
Total
unrecognized compensation expense
|
$ | 13,559 |
3.1
years
|
$ | 11,169 |
3.5
years
|
$ | 8,081 |
1.7
years
|
||||||||||||
76
STANDARD
PACIFIC CORP. AND SUBSIDIARIES
NOTES
TO CONSOLIDATED FINANCIAL STATEMENTS
b. Employee
Benefit Plan
We have a
defined contribution plan pursuant to Section 401(k) of the Internal Revenue
Code. Each employee may elect to make before-tax contributions up to the current
tax limits. The Company matches employee contributions up to $5,000
per employee per year. The Company provides this plan to help its
employees save a portion of their cash compensation for retirement in a tax
efficient environment. Our contributions to the plan for the years
ended December 31, 2009, 2008 and 2007, were $2.5 million, $5.3 million and $7.1
million, respectively.
16. Discontinued
Operations
During
the fourth quarter of 2007, we sold substantially all of the assets of our
Tucson and San Antonio homebuilding divisions. The results of
operations of our Tucson and San Antonio divisions have been classified as
discontinued operations in accordance with ASC 360. In addition,
assets and liabilities related to these discontinued operations are presented
separately on the consolidated balance sheets, and all prior periods have been
reclassified to conform with current year presentation.
The following
amounts related to the Tucson and San Antonio homebuilding divisions were
derived from historical financial information and have been segregated from
continuing operations and reported as discontinued
operations:
|
Year
Ended December 31,
|
||||||||||||
|
2009
|
2008
|
2007
|
||||||||||
|
(Dollars
in thousands)
|
||||||||||||
|
Home
sale revenues
|
$ | 803 | $ | 25,958 | $ | 124,177 | ||||||
|
Land
sale revenues
|
― | 694 | 57,935 | |||||||||
|
Total
revenues
|
803 | 26,652 | 182,112 | |||||||||
|
Cost
of home sales
|
(922 | ) | (21,127 | ) | (144,921 | ) | ||||||
|
Cost
of land sales
|
― | (751 | ) | (96,354 | ) | |||||||
|
Total
cost of sales
|
(922 | ) | (21,878 | ) | (241,275 | ) | ||||||
|
Gross
margin
|
(119 | ) | 4,774 | (59,163 | ) | |||||||
|
Selling,
general and administrative expenses
|
(430 | ) | (8,180 | ) | (25,619 | ) | ||||||
|
Loss
from unconsolidated joint ventures
|
― | ― | (9,699 | ) | ||||||||
|
Other
income (expense)
|
(318 | ) | (180 | ) | (17,560 | ) | ||||||
|
Pretax
loss
|
(867 | ) | (3,586 | ) | (112,041 | ) | ||||||
|
Benefit
for income taxes
|
298 | 1,300 | 39,951 | |||||||||
|
Net
loss from discontinued operations
|
$ | (569 | ) | $ | (2,286 | ) | $ | (72,090 | ) | |||
During
the year ended December 31, 2007, we recorded the following pretax inventory
impairment charges, land deposit write-offs and goodwill impairment charges
related to our discontinued operations:
|
Year
Ended
December
31, 2007
|
||||
|
(Dollars
in thousands)
|
||||
|
Write-off
of deposits and capitalized preacquisition costs
|
$ | 524 | ||
|
Inventory
impairments
|
86,661 | |||
|
Joint
venture impairments
|
9,524 | |||
|
Goodwill
impairments
|
11,430 | |||
|
Total
impairments
|
$ | 108,139 | ||
We did
not record any impairments related to our discontinued operations during the
years ended December 31, 2009 and 2008.
77
STANDARD
PACIFIC CORP. AND SUBSIDIARIES
NOTES
TO CONSOLIDATED FINANCIAL STATEMENTS
The
following is a summary of the assets and liabilities of the Tucson and San
Antonio divisions discontinued operations. The amounts presented
below were derived from historical financial information and adjusted to exclude
intercompany receivables between the divisions, discontinued operations and the
Company:
|
December
31,
|
||||||||
|
2009
|
2008
|
|||||||
|
(Dollars
in thousands)
|
||||||||
|
Assets
|
||||||||
|
Cash
and equivalents
|
$ | ― | $ | 7 | ||||
|
Trade
and other receivables
|
― | 160 | ||||||
|
Inventories
|
― | 930 | ||||||
|
Other
assets
|
― | 120 | ||||||
|
Total
Assets
|
$ | ― | $ | 1,217 | ||||
|
Liabilities
|
||||||||
|
Accounts
payable
|
$ | ― | $ | 320 | ||||
|
Accrued
liabilities
|
― | 1,011 | ||||||
|
Total
Liabilities
|
$ | ― | $ | 1,331 | ||||
17.
Stockholder Rights Plan
Effective
December 31, 2001, Standard Pacific’s Board of Directors approved the adoption
of a stockholder rights agreement (the “Rights Agreement”). Under the Rights
Agreement, one preferred stock purchase right was granted for each share of
outstanding common stock payable to holders of record on December 31, 2001. The
rights issued under the Rights Agreement replace rights previously issued by
Standard Pacific in 1991 under the prior rights plan, which rights expired on
December 31, 2001. Each right entitles the holder, in certain takeover
situations, as described in the Rights Agreement, and upon paying the exercise
price (currently $57.50), to purchase common stock or other securities having a
market value equal to two times the exercise price. Also, in such takeover
situations, if we merge into another corporation, or if 50% or more of our
assets are sold, the rights holders may be entitled, upon payment of the
exercise price, to buy common shares of the acquiring corporation at a 50%
discount from the then-current market value. In either situation, these rights
are not exercisable by the acquiring party. Until the occurrence of certain
events, the rights may be terminated at any time or redeemed by Standard
Pacific’s Board of Directors including, if it believes a proposed transaction to
be in the best interests of our stockholders, at the rate of $.001 per right.
The rights will expire on December 31, 2011, unless earlier terminated, redeemed
or exchanged. If the rights are separated from the common shares, the rights
expire ten years from the date they were separated.
78
STANDARD
PACIFIC CORP. AND SUBSIDIARIES
NOTES
TO CONSOLIDATED FINANCIAL STATEMENTS
18.
Results of Quarterly Operations (Unaudited)
|
First
Quarter
|
Second
Quarter
|
Third
Quarter
|
Fourth
Quarter
|
Total
(1)
|
||||||||||||||||
|
(Dollars
in thousands, except per share amounts)
|
||||||||||||||||||||
|
2009:
|
||||||||||||||||||||
|
Revenues
|
$ | 211,585 | $ | 293,955 | $ | 331,173 | $ | 342,829 | $ | 1,179,542 | ||||||||||
|
Homebuilding
gross margin
|
$ | 8,098 | $ | 39,108 | $ | 42,623 | $ | 51,993 | $ | 141,822 | ||||||||||
|
Income
(loss) from continuing operations, net of income taxes
|
$ | (48,968 | ) | $ | (23,113 | ) | $ | (23,799 | ) | $ | 82,663 | $ | (13,217 | ) | ||||||
|
Loss
from discontinued operations, net of income taxes
|
(504 | ) | (20 | ) | (45 | ) | ― | (569 | ) | |||||||||||
|
Net
income (loss)
|
$ | (49,472 | ) | $ | (23,133 | ) | $ | (23,844 | ) | $ | 82,663 | $ | (13,786 | ) | ||||||
|
Basic
income (loss) per common share:
|
||||||||||||||||||||
|
Continuing
operations
|
$ | (0.21 | ) | $ | (0.10 | ) | $ | (0.10 | ) | $ | 0.33 | $ | (0.06 | ) | ||||||
|
Discontinued
operations
|
― | ― | ― | ― | ― | |||||||||||||||
|
Basic
income (loss) per common share
|
$ | (0.21 | ) | $ | (0.10 | ) | $ | (0.10 | ) | $ | 0.33 | $ | (0.06 | ) | ||||||
|
Diluted
income (loss) per common share
|
||||||||||||||||||||
|
Continuing
operations
|
$ | (0.21 | ) | $ | (0.10 | ) | $ | (0.10 | ) | $ | 0.31 | $ | (0.06 | ) | ||||||
|
Discontinued
operations
|
― | ― | ― | ― | ― | |||||||||||||||
|
Diluted
income (loss) per common share
|
$ | (0.21 | ) | $ | (0.10 | ) | $ | (0.10 | ) | $ | 0.31 | $ | (0.06 | ) | ||||||
|
2008:
|
||||||||||||||||||||
|
Revenues
|
$ | 354,484 | $ | 412,798 | $ | 402,832 | $ | 379,089 | $ | 1,549,203 | ||||||||||
|
Homebuilding
gross margin
|
$ | (117,594 | ) | $ | (75,890 | ) | $ | (207,657 | ) | $ | (295,787 | ) | $ | (696,928 | ) | |||||
|
Loss
from continuing operations, net of income taxes
|
$ | (215,676 | ) | $ | (248,251 | ) | $ | (369,840 | ) | $ | (397,562 | ) | $ | (1,231,329 | ) | |||||
|
Loss
from discontinued operations, net of income taxes
|
(1,191 | ) | (745 | ) | (69 | ) | (281 | ) | (2,286 | ) | ||||||||||
|
Net
loss
|
$ | (216,867 | ) | $ | (248,996 | ) | $ | (369,909 | ) | $ | (397,843 | ) | $ | (1,233,615 | ) | |||||
|
Basic
loss per common share:
|
||||||||||||||||||||
|
Continuing
operations
|
$ | (2.98 | ) | $ | (3.43 | ) | $ | (2.54 | ) | $ | (1.65 | ) | $ | (9.12 | ) | |||||
|
Discontinued
operations
|
(0.02 | ) | (0.01 | ) | ― | ― | (0.02 | ) | ||||||||||||
|
Basic
loss per common share
|
$ | (3.00 | ) | $ | (3.44 | ) | $ | (2.54 | ) | $ | (1.65 | ) | $ | (9.14 | ) | |||||
|
Diluted
loss per common share:
|
||||||||||||||||||||
|
Continuing
operations
|
$ | (2.98 | ) | $ | (3.43 | ) | $ | (2.54 | ) | $ | (1.65 | ) | $ | (9.12 | ) | |||||
|
Discontinued
operations
|
(0.02 | ) | (0.01 | ) | ― | ― | (0.02 | ) | ||||||||||||
|
Diluted
loss per common share
|
$ | (3.00 | ) | $ | (3.44 | ) | $ | (2.54 | ) | $ | (1.65 | ) | $ | (9.14 | ) | |||||
|
(1)
|
Some
amounts do not add across due to rounding differences in quarterly amounts
and due to the impact of differences between the quarterly and annual
weighted average share
calculations.
|
19. Supplemental Disclosure to
Consolidated Statements of Cash Flows
The following are supplemental
disclosures to the consolidated statements of cash flows:
|
Year
Ended December 31,
|
|||||||||||
|
2009
|
2008
|
2007
|
|||||||||
|
(Dollars
in thousands)
|
|||||||||||
|
Supplemental
Disclosures of Cash Flow Information:
|
|||||||||||
|
Cash
paid during the period for:
|
|||||||||||
|
Interest
|
$
|
102,022
|
$
|
132,525
|
$
|
144,733
|
|||||
|
Income
taxes
|
$
|
386
|
$
|
415
|
$
|
14,179
|
|||||
|
Supplemental
Disclosure of Noncash Activities:
|
|||||||||||
|
Increase
in inventory in connection with purchase or consolidation of joint
ventures
|
$
|
85,573
|
$
|
134,659
|
$
|
21,679
|
|||||
|
Increase
in secured project debt in connection with purchase or consolidation of
joint ventures
|
$
|
77,272
|
$
|
115,257
|
$
|
―
|
|||||
|
Inventory
received as distributions from unconsolidated homebuilding joint
ventures
|
$
|
15,471
|
$
|
42,663
|
$
|
45,711
|
|||||
|
Senior
subordinated notes exchanged for the issuance of common
stock
|
$
|
32,837
|
$
|
―
|
$
|
―
|
|||||
|
Senior
and senior subordinated notes exchanged for the issuance of
warrant
|
$
|
―
|
$
|
128,496
|
$
|
―
|
|||||
|
Increase
in investments in unconsolidated joint ventures related to accrued joint
venture
|
|||||||||||
|
loan-to-value
remargin obligations
|
$
|
―
|
$
|
5,000
|
$
|
45,000
|
|||||
|
Reduction
in seller trust deed note payable in connection with modification of
purchase agreement
|
$
|
3,370
|
$
|
25,807
|
$
|
14,079
|
|||||
|
Changes
in inventories not owned
|
$
|
25,605
|
$
|
48,384
|
$
|
71,228
|
|||||
|
Changes
in liabilities from inventories not owned
|
$
|
21,216
|
$
|
18,078
|
$
|
40,142
|
|||||
|
Changes
in noncontrolling interests
|
$
|
4,389
|
$
|
30,306
|
$
|
31,086
|
|||||
79
STANDARD
PACIFIC CORP. AND SUBSIDIARIES
NOTES
TO CONSOLIDATED FINANCIAL STATEMENTS
20.
Supplemental Guarantor Information
On
February 22, 2006, our 100% owned direct and indirect subsidiaries
(“Guarantor Subsidiaries”), other than our financial services subsidiary, title
services subsidiary, and certain other subsidiaries (collectively,
“Non-Guarantor Subsidiaries”), guaranteed our outstanding senior indebtedness
and senior subordinated notes payable. The guarantees are full and unconditional
and joint and several. Presented below are the consolidated financial statements
for our Guarantor Subsidiaries and Non-Guarantor Subsidiaries. All
prior year periods presented have been retroactively adjusted in accordance with
ASC 470.
CONDENSED
CONSOLIDATING STATEMENT OF OPERATIONS
|
Year
Ended December 31, 2009
|
||||||||||||||||||
|
Standard
Pacific
Corp.
|
Guarantor
Subsidiaries
|
Non-
Guarantor
Subsidiaries
|
Consolidating
Adjustments
|
Consolidated
Standard
Pacific
Corp.
|
||||||||||||||
|
(Dollars
in thousands)
|
||||||||||||||||||
|
Homebuilding:
|
||||||||||||||||||
|
Revenues
|
$
|
459,876
|
$
|
570,156
|
$
|
136,365
|
$
|
―
|
$
|
1,166,397
|
||||||||
|
Cost
of sales
|
(403,261)
|
(502,231)
|
(119,083)
|
―
|
(1,024,575)
|
|||||||||||||
|
Gross
margin
|
56,615
|
67,925
|
17,282
|
―
|
141,822
|
|||||||||||||
|
Selling,
general and administrative expenses
|
(107,013)
|
(78,748)
|
(5,727)
|
―
|
(191,488)
|
|||||||||||||
|
Income
(loss) from unconsolidated joint ventures
|
6,855
|
(7,768)
|
(3,804)
|
―
|
(4,717)
|
|||||||||||||
|
Equity
income (loss) of subsidiaries
|
(24,266)
|
―
|
―
|
24,266
|
―
|
|||||||||||||
|
Interest
expense
|
(20,722)
|
(21,314)
|
(5,422)
|
―
|
(47,458)
|
|||||||||||||
|
Loss
on early extinguishment of debt
|
(6,931)
|
―
|
―
|
―
|
(6,931)
|
|||||||||||||
|
Other
income (expense)
|
(2,753)
|
(3,947)
|
4,404
|
―
|
(2,296)
|
|||||||||||||
|
Homebuilding
pretax income (loss)
|
(98,215)
|
(43,852)
|
6,733
|
24,266
|
(111,068)
|
|||||||||||||
|
Financial
Services:
|
||||||||||||||||||
|
Financial
services pretax income (loss)
|
(139)
|
258
|
1,467
|
―
|
1,586
|
|||||||||||||
|
Income
(loss) from continuing operations before income taxes
|
(98,354)
|
(43,594)
|
8,200
|
24,266
|
(109,482)
|
|||||||||||||
|
(Provision)
benefit for income taxes
|
84,568
|
12,403
|
(706)
|
―
|
96,265
|
|||||||||||||
|
Income
(loss) from continuing operations
|
(13,786)
|
(31,191)
|
7,494
|
24,266
|
(13,217)
|
|||||||||||||
|
Loss
from discontinued operations, net of income taxes
|
―
|
(569)
|
―
|
―
|
(569)
|
|||||||||||||
|
Net
income (loss)
|
$
|
(13,786)
|
$
|
(31,760)
|
$
|
7,494
|
$
|
24,266
|
$
|
(13,786)
|
||||||||
|
Year
Ended December 31, 2008
|
||||||||||||||||||
|
Standard
Pacific
Corp.
|
Guarantor
Subsidiaries
|
Non-
Guarantor
Subsidiaries
|
Consolidating
Adjustments
|
Consolidated
Standard
Pacific
Corp.
|
||||||||||||||
|
(Dollars
in thousands)
|
||||||||||||||||||
|
Homebuilding:
|
||||||||||||||||||
|
Revenues
|
$
|
720,106
|
$
|
801,443
|
$
|
14,067
|
$
|
―
|
$
|
1,535,616
|
||||||||
|
Cost
of sales
|
(1,015,504)
|
(1,157,682)
|
(59,358)
|
―
|
(2,232,544)
|
|||||||||||||
|
Gross
margin
|
(295,398)
|
(356,239)
|
(45,291)
|
―
|
(696,928)
|
|||||||||||||
|
Selling,
general and administrative expenses
|
(174,532)
|
(130,095)
|
(853)
|
―
|
(305,480)
|
|||||||||||||
|
Loss
from unconsolidated joint ventures
|
(76,769)
|
(56,357)
|
(18,603)
|
―
|
(151,729)
|
|||||||||||||
|
Equity
income (loss) of subsidiaries
|
(491,148)
|
―
|
―
|
491,148
|
―
|
|||||||||||||
|
Interest
expense
|
7,038
|
(16,773)
|
(645)
|
―
|
(10,380)
|
|||||||||||||
|
Loss
on early extinguishment of debt
|
(15,695)
|
―
|
―
|
―
|
(15,695)
|
|||||||||||||
|
Other
income (expense)
|
(19,439)
|
(40,751)
|
2,562
|
―
|
(57,628)
|
|||||||||||||
|
Homebuilding
pretax income (loss)
|
(1,065,943)
|
(600,215)
|
(62,830)
|
491,148
|
(1,237,840)
|
|||||||||||||
|
Financial
Services:
|
||||||||||||||||||
|
Financial
services pretax income (loss)
|
(274)
|
1,088
|
202
|
―
|
1,016
|
|||||||||||||
|
Income
(loss) from continuing operations before income taxes
|
(1,066,217)
|
(599,127)
|
(62,628)
|
491,148
|
(1,236,824)
|
|||||||||||||
|
(Provision)
benefit for income taxes
|
(167,398)
|
167,582
|
5,311
|
―
|
5,495
|
|||||||||||||
|
Income
(loss) from continuing operations
|
(1,233,615)
|
(431,545)
|
(57,317)
|
491,148
|
(1,231,329)
|
|||||||||||||
|
Loss
from discontinued operations, net of income taxes
|
―
|
(2,286)
|
―
|
―
|
(2,286)
|
|||||||||||||
|
Net
income (loss)
|
$
|
(1,233,615)
|
$
|
(433,831)
|
$
|
(57,317)
|
$
|
491,148
|
$
|
(1,233,615)
|
||||||||
80
STANDARD
PACIFIC CORP. AND SUBSIDIARIES
NOTES
TO CONSOLIDATED FINANCIAL STATEMENTS
20.
Supplemental Guarantor Information
CONDENSED
CONSOLIDATING STATEMENT OF OPERATIONS
|
Year
Ended December 31, 2007
|
||||||||||||||||||
|
Standard
Pacific
Corp.
|
Guarantor
Subsidiaries
|
Non-Guarantor
Subsidiaries
|
Consolidating
Adjustments
|
Consolidated
Standard
Pacific
Corp.
|
||||||||||||||
|
(Dollars
in thousands)
|
||||||||||||||||||
|
Homebuilding:
|
||||||||||||||||||
|
Revenues
|
$
|
1,405,749
|
$
|
1,435,770
|
$
|
47,314
|
$
|
―
|
$
|
2,888,833
|
||||||||
|
Cost
of sales
|
(1,466,945)
|
(1,546,028)
|
(75,830)
|
―
|
(3,088,803)
|
|||||||||||||
|
Gross
margin
|
(61,196)
|
(110,258)
|
(28,516)
|
―
|
(199,970)
|
|||||||||||||
|
Selling,
general and administrative expenses
|
(195,826)
|
(189,660)
|
(2,495)
|
―
|
(387,981)
|
|||||||||||||
|
Loss
from unconsolidated joint ventures
|
(159,610)
|
(29,283)
|
(1,132)
|
―
|
(190,025)
|
|||||||||||||
|
Equity
income (loss) of subsidiaries
|
(384,606)
|
―
|
―
|
384,606
|
―
|
|||||||||||||
|
Gain
on early extinguishment of debt
|
1,087
|
―
|
―
|
―
|
1,087
|
|||||||||||||
|
Other
income (expense)
|
(10,172)
|
(59,525)
|
―
|
―
|
(69,697)
|
|||||||||||||
|
Homebuilding
pretax income (loss)
|
(810,323)
|
(388,726)
|
(32,143)
|
384,606
|
(846,586)
|
|||||||||||||
|
Financial
Services:
|
||||||||||||||||||
|
Financial
services pretax income (loss)
|
(747)
|
1,661
|
1,379
|
―
|
2,293
|
|||||||||||||
|
Income
(loss) from continuing operations before income taxes
|
(811,070)
|
(387,065)
|
(30,764)
|
384,606
|
(844,293)
|
|||||||||||||
|
(Provision)
benefit for income taxes
|
43,690
|
106,305
|
(992)
|
―
|
149,003
|
|||||||||||||
|
Income
(loss) from continuing operations
|
(767,380)
|
(280,760)
|
(31,756)
|
384,606
|
(695,290)
|
|||||||||||||
|
Loss
from discontinued operations, net of income taxes
|
―
|
(52,540)
|
―
|
―
|
(52,540)
|
|||||||||||||
|
Loss
from disposal of discontinued operations,
|
||||||||||||||||||
|
net
of income taxes
|
―
|
(19,550)
|
―
|
―
|
(19,550)
|
|||||||||||||
|
Net
income (loss)
|
$
|
(767,380)
|
$
|
(352,850)
|
$
|
(31,756)
|
$
|
384,606
|
$
|
(767,380)
|
||||||||
81
STANDARD
PACIFIC CORP. AND SUBSIDIARIES
NOTES
TO CONSOLIDATED FINANCIAL STATEMENTS
20.
Supplemental Guarantor Information
CONDENSED
CONSOLIDATING BALANCE SHEET
|
December
31, 2009
|
||||||||||||||||||
|
Standard
Pacific
Corp.
|
Guarantor
Subsidiaries
|
Non-Guarantor
Subsidiaries
|
Consolidating
Adjustments
|
Consolidated
Standard
Pacific
Corp.
|
||||||||||||||
|
(Dollars
in thousands)
|
||||||||||||||||||
|
ASSETS
|
||||||||||||||||||
|
Homebuilding:
|
||||||||||||||||||
|
Cash
and equivalents
|
$
|
183,135
|
$
|
402
|
$
|
403,615
|
$
|
―
|
$
|
587,152
|
||||||||
|
Restricted
cash
|
―
|
―
|
15,070
|
―
|
15,070
|
|||||||||||||
|
Trade
and other receivables
|
233,879
|
1,612
|
95,746
|
(318,561)
|
12,676
|
|||||||||||||
|
Inventories:
|
||||||||||||||||||
|
Owned
|
307,429
|
561,923
|
116,970
|
―
|
986,322
|
|||||||||||||
|
Not
owned
|
823
|
10,847
|
100
|
―
|
11,770
|
|||||||||||||
|
Investments
in unconsolidated joint ventures
|
12,419
|
2,534
|
25,462
|
―
|
40,415
|
|||||||||||||
|
Investments
in subsidiaries
|
905,297
|
―
|
―
|
(905,297)
|
―
|
|||||||||||||
|
Deferred
income taxes, net
|
9,283
|
―
|
―
|
148
|
9,431
|
|||||||||||||
|
Other
assets
|
123,612
|
7,378
|
138
|
(42)
|
131,086
|
|||||||||||||
|
1,775,877
|
584,696
|
657,101
|
(1,223,752)
|
1,793,922
|
||||||||||||||
|
Financial
Services:
|
||||||||||||||||||
|
Cash
and equivalents
|
―
|
―
|
8,407
|
―
|
8,407
|
|||||||||||||
|
Restricted
cash
|
―
|
―
|
3,195
|
―
|
3,195
|
|||||||||||||
|
Mortgage
loans held for sale, net
|
―
|
―
|
41,048
|
―
|
41,048
|
|||||||||||||
|
Mortgage
loans held for investment, net
|
―
|
―
|
10,818
|
―
|
10,818
|
|||||||||||||
|
Other
assets
|
―
|
―
|
5,920
|
(2,299)
|
3,621
|
|||||||||||||
|
―
|
―
|
|
69,388
|
|
(2,299)
|
|
67,089
|
|||||||||||
|
Total
Assets
|
$
|
1,775,877
|
$
|
584,696
|
$
|
726,489
|
$
|
(1,226,051)
|
$
|
1,861,011
|
||||||||
|
LIABILITIES
AND EQUITY
|
||||||||||||||||||
|
Homebuilding:
|
||||||||||||||||||
|
Accounts
payable
|
$
|
9,177
|
$
|
10,986
|
$
|
2,741
|
$
|
(202)
|
$
|
22,702
|
||||||||
|
Accrued
liabilities
|
167,599
|
253,294
|
11,494
|
(236,252)
|
196,135
|
|||||||||||||
|
Liabilities
from inventories not owned
|
―
|
3,713
|
―
|
―
|
3,713
|
|||||||||||||
|
Secured
project debt and other notes payable
|
66,108
|
16,978
|
55,115
|
(78,670)
|
59,531
|
|||||||||||||
|
Senior
notes payable
|
993,018
|
―
|
―
|
―
|
993,018
|
|||||||||||||
|
Senior
subordinated notes payable
|
104,177
|
―
|
―
|
―
|
104,177
|
|||||||||||||
|
1,340,079
|
284,971
|
69,350
|
(315,124)
|
1,379,276
|
||||||||||||||
|
Financial
Services:
|
||||||||||||||||||
|
Accounts
payable and other liabilities
|
―
|
―
|
4,566
|
(3,130)
|
1,436
|
|||||||||||||
|
Mortgage
credit facilities
|
―
|
―
|
43,495
|
(2,500)
|
40,995
|
|||||||||||||
|
―
|
―
|
48,061
|
(5,630)
|
42,431
|
||||||||||||||
|
Total
Liabilities
|
1,340,079
|
284,971
|
117,411
|
(320,754)
|
1,421,707
|
|||||||||||||
|
Equity:
|
||||||||||||||||||
|
Total
Stockholders' Equity
|
435,798
|
296,219
|
609,078
|
(905,297)
|
435,798
|
|||||||||||||
|
Noncontrolling
interest
|
―
|
3,506
|
―
|
―
|
3,506
|
|||||||||||||
|
Total
Equity
|
435,798
|
299,725
|
609,078
|
(905,297)
|
439,304
|
|||||||||||||
|
Total
Liabilities and Equity
|
$
|
1,775,877
|
$
|
584,696
|
$
|
726,489
|
$
|
(1,226,051)
|
$
|
1,861,011
|
||||||||
82
STANDARD
PACIFIC CORP. AND SUBSIDIARIES
NOTES
TO CONSOLIDATED FINANCIAL STATEMENTS
20.
Supplemental Guarantor Information
CONDENSED
CONSOLIDATING BALANCE SHEET
|
December
31, 2008
|
||||||||||||||||||
|
Standard
Pacific
Corp.
|
Guarantor
Subsidiaries
|
Non-Guarantor
Subsidiaries
|
Consolidating
Adjustments
|
Consolidated
Standard
Pacific
Corp.
|
||||||||||||||
|
(Dollars
in thousands)
|
||||||||||||||||||
|
ASSETS
|
||||||||||||||||||
|
Homebuilding:
|
||||||||||||||||||
|
Cash
and equivalents
|
$
|
111,702
|
$
|
433
|
$
|
510,022
|
$
|
―
|
$
|
622,157
|
||||||||
|
Restricted
cash
|
4,222
|
―
|
―
|
―
|
4,222
|
|||||||||||||
|
Trade
and other receivables
|
340,471
|
5,095
|
17,055
|
(341,613)
|
21,008
|
|||||||||||||
|
Inventories:
|
||||||||||||||||||
|
Owned
|
397,059
|
725,679
|
139,783
|
―
|
1,262,521
|
|||||||||||||
|
Not
owned
|
5,455
|
37,287
|
―
|
―
|
42,742
|
|||||||||||||
|
Investments
in unconsolidated joint ventures
|
24,895
|
19,830
|
5,743
|
―
|
50,468
|
|||||||||||||
|
Investments
in subsidiaries
|
964,757
|
―
|
―
|
(964,757)
|
―
|
|||||||||||||
|
Deferred
income taxes, net
|
13,975
|
―
|
―
|
147
|
14,122
|
|||||||||||||
|
Other
assets
|
140,174
|
5,849
|
3
|
(459)
|
145,567
|
|||||||||||||
|
2,002,710
|
794,173
|
672,606
|
(1,306,682)
|
2,162,807
|
||||||||||||||
|
Financial
Services:
|
||||||||||||||||||
|
Cash
and equivalents
|
―
|
―
|
3,681
|
―
|
3,681
|
|||||||||||||
|
Restricted
cash
|
―
|
―
|
4,295
|
―
|
4,295
|
|||||||||||||
|
Mortgage
loans held for sale, net
|
―
|
―
|
63,960
|
―
|
63,960
|
|||||||||||||
|
Mortgage
loans held for investment, net
|
―
|
―
|
11,736
|
―
|
11,736
|
|||||||||||||
|
Other
assets
|
―
|
―
|
4,939
|
(147)
|
4,792
|
|||||||||||||
|
―
|
―
|
|
88,611
|
|
(147)
|
|
88,464
|
|||||||||||
|
Assets
of discontinued operations
|
―
|
1,217
|
―
|
―
|
1,217
|
|||||||||||||
|
Total
Assets
|
$
|
2,002,710
|
$
|
795,390
|
$
|
761,217
|
$
|
(1,306,829)
|
$
|
2,252,488
|
||||||||
|
LIABILITIES
AND EQUITY
|
||||||||||||||||||
|
Homebuilding:
|
||||||||||||||||||
|
Accounts
payable
|
$
|
20,318
|
$
|
17,556
|
$
|
2,351
|
$
|
―
|
$
|
40,225
|
||||||||
|
Accrued
liabilities
|
187,927
|
368,983
|
1,121
|
(341,613)
|
216,418
|
|||||||||||||
|
Liabilities
from inventories not owned
|
1,873
|
23,056
|
―
|
―
|
24,929
|
|||||||||||||
|
Revolving
credit facility
|
47,500
|
―
|
―
|
―
|
47,500
|
|||||||||||||
|
Secured
project debt and other notes payable
|
9,428
|
38,214
|
63,572
|
―
|
111,214
|
|||||||||||||
|
Senior
notes payable
|
1,204,501
|
―
|
―
|
―
|
1,204,501
|
|||||||||||||
|
Senior
subordinated notes payable
|
123,222
|
―
|
―
|
―
|
123,222
|
|||||||||||||
|
1,594,769
|
447,809
|
67,044
|
(341,613)
|
1,768,009
|
||||||||||||||
|
Financial
Services:
|
||||||||||||||||||
|
Accounts
payable and other liabilities
|
―
|
―
|
4,116
|
(459)
|
3,657
|
|||||||||||||
|
Mortgage
credit facilities
|
―
|
―
|
63,655
|
―
|
63,655
|
|||||||||||||
|
―
|
―
|
67,771
|
(459)
|
67,312
|
||||||||||||||
|
Liabilities
of discontinued operations
|
―
|
1,331
|
―
|
―
|
1,331
|
|||||||||||||
|
Total
Liabilities
|
1,594,769
|
449,140
|
134,815
|
(342,072)
|
1,836,652
|
|||||||||||||
|
Equity:
|
||||||||||||||||||
|
Total
Stockholders' Equity
|
407,941
|
338,355
|
626,402
|
(964,757)
|
407,941
|
|||||||||||||
|
Noncontrolling
interest
|
―
|
7,895
|
―
|
―
|
7,895
|
|||||||||||||
|
Total
Equity
|
407,941
|
346,250
|
626,402
|
(964,757)
|
415,836
|
|||||||||||||
|
Total
Liabilities and Equity
|
$
|
2,002,710
|
$
|
795,390
|
$
|
761,217
|
$
|
(1,306,829)
|
$
|
2,252,488
|
||||||||
83
STANDARD
PACIFIC CORP. AND SUBSIDIARIES
NOTES
TO CONSOLIDATED FINANCIAL STATEMENTS
20.
Supplemental Guarantor Information
CONDENSED
CONSOLIDATING STATEMENT OF CASH FLOWS
|
Year
Ended December 31, 2009
|
||||||||||||||||||
|
Standard
Pacific
Corp.
|
Guarantor
Subsidiaries
|
Non-Guarantor
Subsidiaries
|
Consolidating
Adjustments
|
Consolidated
Standard
Pacific
Corp.
|
||||||||||||||
|
(Dollars
in thousands)
|
||||||||||||||||||
|
Cash
Flows From Operating Activities:
|
||||||||||||||||||
|
Net
cash provided by (used in) operating activities
|
$
|
244,354
|
$
|
33,519
|
$
|
139,457
|
$
|
2,500
|
$
|
419,830
|
||||||||
|
Cash
Flows From Investing Activities:
|
||||||||||||||||||
|
Investments
in unconsolidated homebuilding joint ventures
|
(1,127)
|
(849)
|
(26,624)
|
―
|
(28,600)
|
|||||||||||||
|
Distributions
from unconsolidated homebuilding joint ventures
|
340
|
―
|
3,184
|
―
|
3,524
|
|||||||||||||
|
Other
investing activities
|
(1,069)
|
(268)
|
(888)
|
―
|
(2,225)
|
|||||||||||||
|
Net
cash provided by (used in) investing activities
|
(1,856)
|
(1,117)
|
(24,328)
|
―
|
(27,301)
|
|||||||||||||
|
Cash
Flows From Financing Activities:
|
||||||||||||||||||
|
Change
in restricted cash
|
4,222
|
―
|
(13,970)
|
―
|
(9,748)
|
|||||||||||||
|
Net
proceeds from (payments on) revolving credit facility
|
(24,630)
|
―
|
(22,870)
|
―
|
(47,500)
|
|||||||||||||
|
Principal
payments on secured project debt and other notes payable
|
(6,058)
|
(22,064)
|
(97,862)
|
―
|
(125,984)
|
|||||||||||||
|
Redemption
of senior notes payable
|
(429,559)
|
―
|
(37,130)
|
―
|
(466,689)
|
|||||||||||||
|
Proceeds
from the issuance of senior notes payable
|
257,592
|
―
|
―
|
―
|
257,592
|
|||||||||||||
| Payment of debt issuance costs | (8,764) | ― | ― | ― | (8,764) | |||||||||||||
|
Net
proceeds from (payments on) mortgage credit facilities
|
―
|
―
|
(20,160)
|
(2,500)
|
(22,660)
|
|||||||||||||
|
(Contributions
to) distributions from Corporate and subsidiaries
|
35,194
|
(10,376)
|
(24,818)
|
―
|
―
|
|||||||||||||
|
Excess
tax benefits from share-based payment arrangements
|
297
|
―
|
―
|
―
|
297
|
|||||||||||||
|
Proceeds
from the exercise of stock options
|
641
|
―
|
―
|
―
|
641
|
|||||||||||||
|
Net
cash provided by (used in) financing activities
|
(171,065)
|
(32,440)
|
(216,810)
|
(2,500)
|
(422,815)
|
|||||||||||||
|
Net
decrease in cash and equivalents
|
71,433
|
(38)
|
(101,681)
|
―
|
(30,286)
|
|||||||||||||
|
Cash
and equivalents at beginning of year
|
111,702
|
440
|
513,703
|
―
|
625,845
|
|||||||||||||
|
Cash
and equivalents at end of year
|
$
|
183,135
|
$
|
402
|
$
|
412,022
|
$
|
―
|
$
|
595,559
|
||||||||
|
Year
Ended December 31, 2008
|
||||||||||||||||||
|
Standard
Pacific
Corp.
|
Guarantor
Subsidiaries
|
Non-Guarantor
Subsidiaries
|
Consolidating
Adjustments
|
Consolidated
Standard
Pacific
Corp.
|
||||||||||||||
|
(Dollars
in thousands)
|
||||||||||||||||||
|
Cash
Flows From Operating Activities
|
||||||||||||||||||
|
Net
cash provided by (used in) operating activities
|
$
|
124,560
|
$
|
29,045
|
$
|
109,883
|
$
|
(337)
|
$
|
263,151
|
||||||||
|
Cash
Flows From Investing Activities:
|
||||||||||||||||||
|
Investments
in unconsolidated homebuilding joint ventures
|
(20,344)
|
(36,998)
|
(56,151)
|
―
|
(113,493)
|
|||||||||||||
|
Distributions
from unconsolidated homebuilding joint ventures
|
55,804
|
16,542
|
31,818
|
―
|
104,164
|
|||||||||||||
|
Other
investing activities
|
(1,380)
|
(66)
|
(804)
|
―
|
(2,250)
|
|||||||||||||
|
Net
cash provided by (used in) investing activities
|
34,080
|
(20,522)
|
(25,137)
|
―
|
(11,579)
|
|||||||||||||
|
Cash
Flows From Financing Activities:
|
||||||||||||||||||
|
Change
in restricted cash
|
(4,222)
|
―
|
(4,295)
|
―
|
(8,517)
|
|||||||||||||
|
Net
proceeds from (payments on) revolving credit facility
|
(42,500)
|
―
|
―
|
―
|
(42,500)
|
|||||||||||||
|
Principal
payments on secured project debt and other notes payable
|
(2,001)
|
(14,296)
|
(4,021)
|
―
|
(20,318)
|
|||||||||||||
|
Redemption
of senior notes payable
|
(167,375)
|
―
|
―
|
―
|
(167,375)
|
|||||||||||||
|
Net
proceeds from (payments on) mortgage credit facilities
|
―
|
―
|
(100,854)
|
337
|
(100,517)
|
|||||||||||||
|
Repurchases
of common stock
|
(726)
|
―
|
―
|
―
|
(726)
|
|||||||||||||
|
(Contributions
to) distributions from Corporate and subsidiaries
|
(530,908)
|
5,450
|
525,458
|
―
|
―
|
|||||||||||||
|
Net
proceeds from the issuance of senior preferred stock and the
issuance
|
||||||||||||||||||
|
of
warrant
|
404,233
|
―
|
―
|
―
|
404,233
|
|||||||||||||
|
Proceeds
from the issuance of common stock
|
78,432
|
―
|
―
|
―
|
78,432
|
|||||||||||||
|
Net
cash provided by (used in) financing activities
|
(265,067)
|
(8,846)
|
416,288
|
337
|
142,712
|
|||||||||||||
|
Net
decrease in cash and equivalents
|
(106,427)
|
(323)
|
501,034
|
―
|
394,284
|
|||||||||||||
|
Cash
and equivalents at beginning of year
|
218,129
|
763
|
12,669
|
―
|
231,561
|
|||||||||||||
|
Cash
and equivalents at end of year
|
$
|
111,702
|
$
|
440
|
$
|
513,703
|
$
|
―
|
$
|
625,845
|
||||||||
84
STANDARD
PACIFIC CORP. AND SUBSIDIARIES
NOTES
TO CONSOLIDATED FINANCIAL STATEMENTS
20.
Supplemental Guarantor Information
CONDENSED
CONSOLIDATING STATEMENT OF CASH FLOWS
|
Year
Ended December 31, 2007
|
||||||||||||||||||
|
Standard
Pacific
Corp.
|
Guarantor
Subsidiaries
|
Non-Guarantor
Subsidiaries
|
Consolidating
Adjustments
|
Consolidated
Standard
Pacific
Corp.
|
||||||||||||||
|
(Dollars
in thousands)
|
||||||||||||||||||
|
Cash
Flows From Operating Activities:
|
||||||||||||||||||
|
Net
cash provided by (used in) operating activities
|
$
|
553,950
|
$
|
(17,386)
|
$
|
118,657
|
$
|
337
|
$
|
655,558
|
||||||||
|
Cash
Flows From Investing Activities:
|
||||||||||||||||||
|
Proceeds
from disposition of discontinued operations
|
―
|
40,850
|
―
|
―
|
40,850
|
|||||||||||||
|
Investments
in unconsolidated homebuilding joint ventures
|
(265,602)
|
(63,656)
|
―
|
―
|
(329,258)
|
|||||||||||||
|
Distributions
from unconsolidated homebuilding joint ventures
|
91,890
|
44,330
|
(20,808)
|
―
|
115,412
|
|||||||||||||
|
Other
investing activities
|
(9,794)
|
(1,509)
|
(13,516)
|
―
|
(24,819)
|
|||||||||||||
|
Net
cash provided by (used in) investing activities
|
(183,506)
|
20,015
|
(34,324)
|
―
|
(197,815)
|
|||||||||||||
|
Cash
Flows From Financing Activities:
|
||||||||||||||||||
|
Net
proceeds from (payments on) revolving credit facility
|
(199,500)
|
―
|
―
|
―
|
(199,500)
|
|||||||||||||
|
Principal
payments on secured project debt and other notes payable
|
(5,626)
|
(2,886)
|
―
|
―
|
(8,512)
|
|||||||||||||
|
Redemption
of senior notes payable
|
(46,235)
|
―
|
―
|
―
|
(46,235)
|
|||||||||||||
|
Proceeds
from issuance of senior subordinated convertible notes
|
100,000
|
―
|
―
|
―
|
100,000
|
|||||||||||||
| Payment of debt issuance costs | (3,000) | ― | ― | ― | (3,000) | |||||||||||||
|
Purchase
of senior subordinated convertible note hedge
|
(9,120)
|
―
|
―
|
―
|
(9,120)
|
|||||||||||||
|
Net
proceeds from (payments on) mortgage credit facilities
|
―
|
―
|
(86,398)
|
(337)
|
(86,735)
|
|||||||||||||
|
Excess
tax benefits from share-based payment arrangements
|
1,555
|
―
|
―
|
―
|
1,555
|
|||||||||||||
|
Dividends
paid
|
(7,778)
|
―
|
―
|
―
|
(7,778)
|
|||||||||||||
|
Repurchases
of common stock
|
(2,901)
|
―
|
―
|
―
|
(2,901)
|
|||||||||||||
|
Net
proceeds from the issuance of common stock
|
79
|
―
|
―
|
―
|
79
|
|||||||||||||
|
Proceeds
from the exercise of stock options
|
3,862
|
―
|
―
|
―
|
3,862
|
|||||||||||||
|
Net
cash provided by (used in) financing activities
|
(168,664)
|
(2,886)
|
(86,398)
|
(337)
|
(258,285)
|
|||||||||||||
|
Net
decrease in cash and equivalents
|
201,780
|
(257)
|
(2,065)
|
―
|
199,458
|
|||||||||||||
|
Cash
and equivalents at beginning of year
|
16,349
|
1,020
|
14,734
|
―
|
32,103
|
|||||||||||||
|
Cash
and equivalents at end of year
|
$
|
218,129
|
$
|
763
|
$
|
12,669
|
$
|
―
|
$
|
231,561
|
||||||||
Not
applicable.
|
ITEM 9A.
|
Conclusion
Regarding the Effectiveness of Disclosure Controls and Procedures
As of the
end of the period covered by this annual report on Form 10-K, we carried out an
evaluation, under the supervision and with the participation of our management,
including our Chief Executive Officer and Chief Financial Officer, of the
effectiveness of the design and operation of our disclosure controls and
procedures as such term is defined in Exchange Act Rules 13a-15(e) and
15d-15(e), including controls and procedures to timely alert management to
material information relating to Standard Pacific Corp. and subsidiaries
required to be included in our periodic SEC filings. Based on that evaluation,
our Chief Executive Officer and Chief Financial Officer have concluded that our
disclosure controls and procedures were effective as of the end of the period
covered by this report.
Management’s
Annual Report on Internal Control Over Financial Reporting
Our
management is responsible for establishing and maintaining adequate internal
control over financial reporting, as such term is defined in Exchange Act Rules
13a-15(f) and 15d-15(f). Our internal control over financial reporting is a
process designed to provide reasonable assurance regarding the reliability of
financial reporting and the preparation of our financial statements for external
purposes in accordance with U.S. generally accepted accounting principles.
Because of its inherent limitations, internal control over financial reporting
may not prevent or detect misstatements. Also, projections of any evaluation of
effectiveness to future periods are subject to the risk that controls may become
inadequate because of changes in conditions, or that the degree of compliance
with the policies or procedures may deteriorate.
Under the
supervision and with the participation of our management, including our Chief
Executive Officer and Chief Financial Officer, we conducted an evaluation of the
effectiveness of our internal control over financial reporting based on the
framework in Internal Control—Integrated Framework issued
by the Committee of Sponsoring Organizations of the Treadway Commission. Based
on our evaluation under the framework in Internal Control—Integrated Framework,
our management concluded that our internal control over financial reporting was
effective as of December 31, 2009.
The
effectiveness of our internal control over financial reporting as of December
31, 2009 has been audited by Ernst & Young LLP, an independent registered
public accounting firm, as stated in their report which is included
herein.
Changes
in Internal Control Over Financial Reporting
Our
management, including our Chief Executive Officer and Chief Financial Officer,
has evaluated our internal control over financial reporting to determine whether
any change occurred during the fourth quarter of the year ended December 31,
2009 that has materially affected, or is reasonably likely to materially affect,
our internal control over financial reporting. Based on that evaluation, there
has been no such change during the fourth quarter of the period covered by this
report.
Report
of Independent Registered Public Accounting Firm
To the
Board of Directors and Stockholders of Standard Pacific Corp.:
We have
audited Standard Pacific Corp.’s internal control over financial reporting as of
December 31, 2009, based on criteria established in Internal Control—Integrated
Framework issued by the Committee of Sponsoring Organizations of the Treadway
Commission (the COSO criteria). Standard Pacific Corp.’s management is
responsible for maintaining effective internal control over financial reporting,
and for its assessment of the effectiveness of internal control over financial
reporting included in the accompanying Management’s Annual Report on Internal
Control Over Financial Reporting. Our responsibility is to express an opinion on
the Company’s internal control over financial reporting based on our
audit.
We
conducted our audit in accordance with the standards of the Public Company
Accounting Oversight Board (United States). Those standards require that we plan
and perform the audit to obtain reasonable assurance about whether effective
internal control over financial reporting was maintained in all material
respects. Our audit included obtaining an understanding of internal control over
financial reporting, assessing the risk that a material weakness exists, testing
and evaluating the design and operating effectiveness of internal control based
on the assessed risk, and performing such other procedures as we considered
necessary in the circumstances. We believe that our audit provides a reasonable
basis for our opinion.
A
company’s internal control over financial reporting is a process designed to
provide reasonable assurance regarding the reliability of financial reporting
and the preparation of financial statements for external purposes in accordance
with generally accepted accounting principles. A company’s internal control over
financial reporting includes those policies and procedures that (1) pertain to
the maintenance of records that, in reasonable detail, accurately and fairly
reflect the transactions and dispositions of the assets of the company; (2)
provide reasonable assurance that transactions are recorded as necessary to
permit preparation of financial statements in accordance with generally accepted
accounting principles, and that receipts and expenditures of the company are
being made only in accordance with authorizations of management and directors of
the company; and (3) provide reasonable assurance regarding prevention or timely
detection of unauthorized acquisition, use, or disposition of the company’s
assets that could have a material effect on the financial
statements.
Because
of its inherent limitations, internal control over financial reporting may not
prevent or detect misstatements. Also, projections of any evaluation of
effectiveness to future periods are subject to the risk that controls may become
inadequate because of changes in conditions, or that the degree of compliance
with the policies or procedures may deteriorate.
In our
opinion, Standard Pacific Corp. maintained, in all material respects, effective
internal control over financial reporting as of December 31, 2009, based on the
COSO criteria.
We also
have audited, in accordance with the standards of the Public Company Accounting
Oversight Board (United States), the accompanying consolidated balance sheets of
Standard Pacific Corp. and subsidiaries as of December 31, 2009 and 2008, and
the related consolidated statements of operations, equity, and cash flows for
each of the three years in the period ended December 31, 2009 of Standard
Pacific Corp. and our report dated March 5, 2010 expressed an unqualified
opinion thereon.
|
|
/s/
ERNST & YOUNG LLP
|
Irvine,
California
March 5,
2010
|
ITEM 9B.
|
Not
applicable.
PART
III
The
remaining information required by Items 401, 405, 406 and 407(c)(3), (d)(4) and
(d)(5) of Regulation S-K that is not set forth in this Item 10 or in Part I of
this Form 10-K under the heading “Executive Officers of the Registrant”, will be
set forth in the Company’s 2010 Annual Meeting Proxy Statement, which will be
filed with the Securities and Exchange Commission not later than 120 days after
December 31, 2009 (the “2010 Proxy Statement”). For the limited purpose of
providing the information necessary to comply with this Item 10, the 2010 Proxy
Statement is incorporated herein by this reference. All references to the 2010
Proxy Statement in this Part III are exclusive of the information set forth
under the captions “Report of the Compensation Committee” and “Report of the
Audit Committee.”
Code
of Business Conduct and Ethics and Corporate Governance Guidelines
We have
adopted a Code of Business Conduct and Ethics that applies to all of our
employees, including our senior financial and executive officers, as well as our
directors. We will disclose any waivers of, or amendments to, any provision of
the Code of Business Conduct and Ethics that applies to our directors and senior
financial and executive officers on our website, www.standardpacifichomes.com,
through the “Investor Relations” link under the heading “Corporate
Governance”.
In
addition, we have adopted Corporate Governance Guidelines and charters for each
of the Board of Director’s standing committees, which include the Audit,
Compensation, Nominating and Corporate Governance, and Executive committees. Our
Code of Business Conduct and Ethics and the charters for each of the
aforementioned committees are accessible via our website at
www.standardpacifichomes.com, through the “Investor Relations” link under the
heading “Corporate Governance.”
|
ITEM 11.
|
The
information required by Items 402 and 407 (e)(4) and (e)(5) of Regulation S-K
will be set forth in the 2010 Proxy Statement. For the limited
purpose of providing the information necessary to comply with this Item 11, the
2010 Proxy Statement is incorporated herein by this reference.
|
ITEM 12.
|
The
information required by Item 201(d) and 403 of Regulation S-K will be set forth
in the 2010 Proxy Statement for the limited purpose of providing the information
necessary to comply with this Item 12, the 2010 Proxy Statement is incorporated
herein by this reference.
The
information required by Items 404 and 407(a) of Regulation S-K will be set forth
in the 2010 Proxy Statement. For the limited purpose of providing the
information necessary to comply with this Item 13, the 2010 Proxy Statement is
incorporated herein by this reference.
This
information required by Item 9(e) of Schedule 14A will be set forth in the 2010
Proxy Statement. For the limited purpose of providing the information
necessary to comply with this Item 14, the 2010 Proxy Statement is incorporated
herein by this reference.
PART
IV
|
Page
Reference
|
||
|
(a)(1)
|
Financial
Statements, included in Part II of this report:
|
|
|
44
|
||
|
45
|
||
|
46
|
||
|
47
|
||
|
48
|
||
|
49
|
||
|
(2)
|
Financial
Statement Schedules:
|
|
|
Financial
Statement Schedules are omitted since the required information is not
present or is not present in the amounts sufficient to require submission
of a schedule, or because the information required is included in the
consolidated financial statements, including the notes
thereto.
|
||
|
(3)
|
Index
to Exhibits
|
|
|
See
Index to Exhibits on pages 91-94 below.
|
||
|
(b)
|
Index
to Exhibits. See Index to Exhibits on pages 91-94 below.
|
|
|
(c)
|
Financial
Statements required by Regulation S-X excluded from the annual report to
shareholders by Rule 14a-3(b). Not applicable.
|
SIGNATURES
Pursuant
to the requirements of Section 13 or 15(d) of the Securities Exchange Act of
1934, the Registrant has duly caused this report to be signed on its behalf by
the undersigned, thereunto duly authorized, in the City of Irvine, California,
on the 5th day
of March 2010.
|
STANDARD
PACIFIC CORP.
(Registrant)
|
|
|
By:
|
/s/ Kenneth L.
Campbell
|
|
Kenneth
L. Campbell
|
|
|
Chief
Executive Officer and President
|
|
Pursuant
to the requirements of the Securities Exchange Act of 1934, this report has been
signed below by the following persons on behalf of the Registrant in the
capacities and on the dates indicated.
|
Signature
|
Title
|
Date
|
||
|
/s/ Kenneth L.
Campbell
|
Chief
Executive Officer and President
|
March 5,
2010
|
||
| (Kenneth L. Campbell) | ||||
|
/s/ RONALD R. FOELL
|
Chairman
of the Board
|
March 5,
2010
|
||
| (Ronald R. Foell) | ||||
|
/s/ John M.
Stephens
|
Senior
Vice President and Chief Financial Officer (Principal Financial and
Accounting Officer)
|
March 5,
2010
|
||
| (John M. Stephens) | ||||
|
/s/ Bruce A.
Choate
|
Director
|
March 5,
2010
|
||
| (Bruce A. Choate) | ||||
|
/s/ JAMES L. DOTI
|
Director
|
March 5,
2010
|
||
| (James L. Doti) | ||||
|
/s/ DOUGLAS C. JACOBS
|
Director
|
March 5,
2010
|
||
| (Douglas C. Jacobs) | ||||
|
/s/ David J.
Matlin
|
Director
|
March 5,
2010
|
||
| (David J. Matlin ) | ||||
|
/s/ F. Patt
Schiewitz
|
Director
|
March 5,
2010
|
||
| (F. Patt Schiewitz) | ||||
|
/s/ Peter
Schoels
|
Director
|
March 5,
2010
|
||
| (Peter Schoels) |
INDEX
TO EXHIBITS
|
*3.1
|
Amended
and Restated Certificate of Incorporation of the Registrant, incorporated
by reference to Exhibit 3.1 to the Registrant’s Current Report on Form 8-K
filed with the Securities and Exchange Commission on August 19,
2008.
|
|
*3.2
|
Certificate
of Designations of Series A Junior Participating Cumulative Preferred
Stock of the Registrant, incorporated by reference to Exhibit 3.2 to the
Registrant’s Current Report on Form 8-K filed with the Securities and
Exchange Commission on August 19, 2008.
|
|
*3.3
|
Certificate
of Designations of Series B Junior Participating Convertible Preferred
Stock of the Registrant, incorporated by reference to Exhibit 3.3 to the
Registrant’s Current Report on Form 8-K filed with the Securities and
Exchange Commission on August 19, 2008.
|
|
*3.4
|
Amended
and Restated Bylaws of the Registrant, incorporated by reference to
Exhibit 3.1 of the Registrant’s Current Report on Form 8-K filed with the
Securities and Exchange Commission on October 28, 2009.
|
|
*4.1
|
Form
of Specimen Stock Certificate, incorporated by reference to Exhibit 28.3
of the Registrant’s Registration Statement on Form S-4 (file no. 33-42293)
filed with the Securities and Exchange Commission on August 16,
1991.
|
|
*4.2
|
Amended
and Restated Rights Agreement, dated as of July 24, 2003, between the
Registrant and Mellon Investor Services LLC, as Rights Agent, incorporated
by reference to Exhibit 4.1 of the Registrant’s Quarterly Report on Form
10-Q for the quarter ended June 30, 2003.
|
|
*4.3
|
Amendment
No. 1 to Amended and Restated Rights Agreement, dated as of June 27, 2008,
between the Registrant and Mellon Investor Services LLC, as Rights Agent,
incorporated by reference to Exhibit 4.1 of the Registrant’s Current
Report on Form 8-K filed with the Securities and Exchange Commission on
July 1, 2008.
|
|
*4.4
|
Senior
Debt Securities Indenture, dated as of April 1, 1999, by and between the
Registrant and The First National Bank of Chicago, as Trustee,
incorporated by reference to Exhibit 4.1 of the Registrant’s Current
Report on Form 8-K filed with the Securities and Exchange Commission on
April 16, 1999.
|
|
*4.5
|
Fourth
Supplemental Indenture relating to the Registrant’s 7¾% Senior Notes due
2013, dated as of March 4, 2003, by and between the Registrant and Bank
One Trust Company, N.A., as Trustee, incorporated by reference to Exhibit
4.1 of the Registrant’s Current Report on Form 8-K filed with the
Securities and Exchange Commission on March 7, 2003.
|
|
*4.6
|
Fifth
Supplemental Indenture relating to the Registrant’s 6⅞% Senior Notes due
2011, dated as of May 12, 2003, by and between the Registrant and Bank One
Trust Company, N.A., as Trustee, incorporated by reference to Exhibit 4.2
of the Registrant’s Quarterly Report on Form 10-Q for the quarter ended
June 30, 2003.
|
|
*4.7
|
Eighth
Supplemental Indenture relating to the Registrant’s 6¼% Senior Notes due
2014, dated as of March 11, 2004, by and between the Registrant and J.P.
Morgan Trust Company, National Association, as Trustee, incorporated by
reference to Exhibit 4.2 to the Registrant’s Current Report on Form 8-K
filed with the Securities and Exchange Commission on March 16,
2004.
|
|
*4.8
|
Ninth
Supplemental Indenture relating to the Registrant’s 6½% Senior Notes due
2010, dated as of August 1, 2005, by and between the Registrant and J.P.
Morgan Trust Company, National Association, as Trustee, incorporated by
reference to Exhibit 4.1 to the Registrant's Current Report on Form
8-K filed with the Securities and Exchange Commission on August 5,
2005.
|
|
*4.9
|
Tenth
Supplemental Indenture relating to the Registrant’s 7% Senior Notes due
2015, dated as of August 1, 2005, by and between the Registrant and J.P.
Morgan Trust Company, National Association, as Trustee, incorporated by
reference to Exhibit 4.2 to the Registrant’s Current Report on Form 8-K
filed with the Securities and Exchange Commission on August 5,
2005.
|
|
*4.10
|
Eleventh
Supplemental Indenture relating to the addition of certain of the
Registrant’s wholly owned subsidiaries as guarantors of all of the
Registrant’s outstanding Senior Notes (including the form of guaranty),
dated as of February 22, 2006, by and between the Registrant and J.P.
Morgan Trust Company, National Association, as
|
| Trustee incorporated by reference to Exhibit 4.11 to the Company’s Annual Report on Form 10-K for the year ended December 31, 2005. | |
|
*4.11
|
Twelfth
Supplemental Indenture, dated as of May 5, 2006, by and between the
Registrant and J.P. Morgan Trust Company, National Association, as
Trustee, incorporated by reference to Exhibit 4.1 to the Registrant’s
Quarterly Report on Form 10-Q for the quarter ended March 31,
2006.
|
|
*4.12
|
Senior
Subordinated Debt Securities Indenture, dated as of April 10, 2002, by and
between the Registrant and Bank One Trust Company, N.A., as Trustee,
incorporated by reference to Exhibit 4.1 of the Registrant’s Current
Report on Form 8-K, filed with the Securities and Exchange Commission on
April 15, 2002.
|
|
*4.13
|
First
Supplemental Indenture relating to the Registrant’s 9¼% Senior
Subordinated Notes due 2012, dated as of April 10, 2002, by and between
the Registrant and Bank One Trust Company, N.A., as Trustee, with Form of
Note attached, incorporated by reference to Exhibit 4.2 to the
Registrant’s Current Report on Form 8-K filed with the Securities and
Exchange Commission on April 15, 2002.
|
|
*4.14
|
Second
Supplemental Indenture relating to the addition of certain of the
Registrant’s wholly owned subsidiaries as guarantors of all of the
Registrant’s outstanding Senior Subordinated Notes (including the form of
guaranty), dated as of February 22, 2006, by and between the Registrant
and J.P. Morgan Trust Company, National Association, as Trustee,
incorporated by reference to Exhibit 4.14 to the Registrant’s Annual
Report on Form 10-K for the year ended December 31,
2005.
|
|
*4.15
|
Third
Supplemental Indenture relating to the Registrant’s 6% Convertible Senior
Subordinated Notes due 2012, dated as of September 24, 2007, by and among
the Registrant, the Guarantors, and the Bank of New York Trust Company
N.A., as Trustee, incorporated by reference to Exhibit 4.1 to the
Registrant’s Current Report on Form 8-K filed with the Securities and
Exchange Commission on September 28, 2007.
|
|
*4.16
|
Fourth
Supplemental Indenture relating to the Registrant’s 9¼% Senior
Subordinated Notes due 2012, dated as of June 26, 2008, by and among the
Registrant, the guarantors named therein and the Bank of New York Trust
Company N.A., as Trustee, incorporated by reference to Exhibit 4.1 to the
Registrant’s Current Report on Form 8-K filed with the Securities and
Exchange Commission on June 27, 2008.
|
|
*4.17
|
Indenture,
dated as of September 17, 2009, between Standard Pacific Escrow LLC and
The Bank of New York Mellon Trust Company, N.A., incorporated by reference
to Exhibit 4.1 to the Registrant’s Current Report on Form 8-K filed with
the Securities and Exchange Commission on September 17,
2009.
|
|
*4.18
|
First
Supplemental Indenture, dated as of October 8, 2009, between the
Registrant, Standard Pacific Escrow LLC and The Bank of New York Mellon
Trust Company, N.A., incorporated by reference to Exhibit 4.1 to the
Registrant’s Current Report on Form 8-K filed with the Securities and
Exchange Commission on October 9, 2009.
|
|
*4.19
|
Thirteenth
Supplemental Indenture, dated as of October 8, 2009, between the
Registrant and The Bank of New York Mellon Trust Company, N.A.,
incorporated by reference to Exhibit 4.3 to the Registrant’s Current
Report on Form 8-K filed with the Securities and Exchange Commission on
October 9, 2009.
|
|
*4.20
|
Registration
Rights Agreement, dated as of October 8, 2009, among the Registrant, the
subsidiary guarantors party thereto and the initial purchasers,
incorporated by reference to Exhibit 4.2 to the Registrant’s Current
Report on Form 8-K filed with the Securities and Exchange Commission on
October 9, 2009.
|
|
*10.1
|
Warrant
to Purchase Shares of Series B Junior Participating Convertible Preferred
Stock, dated June 27, 2008, incorporated by reference to
Exhibit 10.1 to the Registrant’s Current Report on Form 8-K filed with the
Securities and Exchange Commission on July 1, 2008.
|
|
*10.2
|
Stockholders
Agreement, dated June 27, 2008, between the Registrant and MP CA Homes,
LLC, incorporated by reference to Exhibit 10.3 to the Registrant’s Current
Report on Form 8-K filed with the Securities and Exchange Commission on
July 1, 2008.
|
|
*10.3
|
Term
Loan B Credit Agreement, dated as of May 5, 2006, by and among the
Registrant, Bank of America, N.A., and the several lenders named therein,
incorporated by reference to Exhibit 10.3 to the Registrant’s Quarterly
Report on Form 10-Q for the quarter ended March 31,
2006.
|
|
*10.4
|
Pledge
Agreement, dated as of May 5, 2006, between Standard Pacific Corp.,
certain of Standard Pacific Corp.’s subsidiaries and Bank of America,
N.A., as Collateral Agent, as amended through November 1, 2009,
incorporated by reference to Exhibit 10.5 to the Registrant’s Quarterly
Report on Form 10-Q for the quarter ended September 30,
2009.
|
|
*10.5
|
Collateral
Agent and Intercreditor Agreement dated as of May 5, 2006, between
Standard Pacific Corp., certain of Standard Pacific Corp.’s subsidiaries,
Bank of America, N.A., as Collateral Agent, and the various creditors
party thereto, as amended through November 1, 2009, incorporated by
reference to Exhibit 10.6 to the Registrant’s Quarterly Report on Form
10-Q for the quarter ended September 30, 2009.
|
|
*10.6
|
Notice
of Auto-Amendment to Term Loan B Credit Agreement, dated as of April 25,
2007, by and between the Registrant and Bank of America, N.A.,
incorporated by reference to Exhibit 99.2 to the Registrant’s Current
Report on Form 8-K filed with the Securities and Exchange Commission on
April 26, 2007.
|
|
*10.7
|
Notice
of Revolver and Term Loan A Amendment and Second Amendment to Term B
Credit Agreement, dated as of September 14, 2007, by and between the
Registrant and Bank of America, N.A., incorporated by reference to Exhibit
99.2 to the Registrant’s Current Report on Form 8-K filed with the
Securities and Exchange Commission on September 18,
2007.
|
|
*10.8
|
Notice
of Revolver and Term Loan A Amendment and Fourth Amendment to Term B
Credit Agreement, dated as of June 30, 2008, by and between the Registrant
and Bank of America, N.A., incorporated by reference to Exhibit 10.5 to
the Registrant’s Current Report on Form 8-K filed with the Securities and
Exchange Commission on July 1, 2008.
|
|
*10.9
|
Confirmation,
dated September 25, 2007, by and between the Registrant and Bank of
America, N.A., incorporated by reference to Exhibit 10.1 to the
Registrant’s Current Report on Form 8-K filed with the Securities and
Exchange Commission on September 28, 2007.
|
|
*10.10
|
Confirmation,
dated September 25, 2007, by and between the Registrant and JPMorgan Chase
Bank, National Association, London Branch, incorporated by reference to
Exhibit 10.2 to the Registrant’s Current Report on Form 8-K filed with the
Securities and Exchange Commission on September 28,
2007.
|
|
*10.11
|
Share
Lending Agreement, dated September 24, 2007, by and between the Registrant
and Credit Suisse International, as Borrower, and Credit Suisse, New York
Branch, as agent, incorporated by reference to Exhibit 10.3 to the
Registrant’s Current Report on Form 8-K filed with the Securities and
Exchange Commission on September 28, 2007.
|
|
+*10.12
|
Standard
Pacific Corp. 1997 Stock Incentive Plan, incorporated by reference to
Exhibit 99.1 of the Registrant’s Registration Statement on Form S-8 filed
with the Securities and Exchange Commission on August 21,
1997.
|
|
+*10.13
|
2000
Stock Incentive Plan of Standard Pacific Corp., as amended and restated,
effective May 12, 2004, incorporated by reference to Appendix A to the
Registrant’s Definitive Proxy Statement filed with the Securities and
Exchange Commission on April 2, 2004.
|
|
+*10.14
|
Standard
Pacific Corp. 2005 Stock Incentive Plan, incorporated by reference to
Exhibit 10.1 to the Registrant’s Current Report on Form 8-K filed with the
Securities and Exchange Commission on May 11, 2005.
|
|
+*10.15
|
Standard
Pacific Corp. 2008 Equity Incentive Plan, incorporated by reference to
Exhibit 10.1 to the Registrant’s Current Report on Form 8-K filed with the
Securities and Exchange Commission on August 19, 2008.
|
|
+*10.16
|
Standard
Terms and Conditions (CIC) for Non-Qualified Stock Options to be used in
connection with the Company’s 2008 Stock Incentive Plan, incorporated by
reference to Exhibit 10.28 to the Registrant’s Annual Report on Form 10-K
for the year ended December 31, 2008.
|
|
+*10.17
|
Standard
Terms and Conditions for Non-Qualified Stock Options to be used in
connection with the Company’s 2008 Stock Incentive Plan, incorporated by
reference to Exhibit 10.29 to the Registrant’s Annual Report on Form 10-K
for the year ended December 31, 2008.
|
|
|
|
| +*10.18 |
Restated
Settlement Agreement and Mutual Release of Claims, dated as of February
27, 2009, between the Registrant and Andrew H. Parnes, incorporated
by reference to Exhibit 10.2 to the Registrant’s Current Report on Form
8-K filed with the Securities and Exchange Commission on March 9,
2009.
|
|
+*10.19
|
Form
of Executive Officers Indemnification Agreement incorporated by reference
to the Registrant’s Annual Report on Form 10-K for the year ended December
31, 2007.
|
|
+*10.20
|
Employment
Agreement, dated June 1, 2009, between the Registrant and Kenneth L.
Campbell, incorporated by reference to Exhibit 10.1 to the Registrant’s
Current Report on Form 8-K filed with the Securities and Exchange
Commission on June 1, 2009.
|
|
+*10.21
|
Incentive
Compensation Agreement, dated February 1, 2010, between Registrant and
Kenneth L. Campbell, incorporated by reference to Exhibit 99.1 to the
Registrant’s Current Report on Form 8-K filed with the Securities and
Exchange Commission on February 4, 2010.
|
|
+*10.22
|
Employment
Letter Agreement, dated March 26, 2009, between the Registrant and Scott
D. Stowell, incorporated by reference to Exhibit 10.1 to the Registrant’s
Current Report on Form 8-K filed with the Securities and Exchange
Commission on April 1, 2009.
|
|
+*10.23
|
Incentive
Compensation Agreement, dated February 1, 2010, between Registrant and
Scott D. Stowell, incorporated by reference to Exhibit 99.2 to the
Registrant’s Current Report on Form 8-K filed with the Securities and
Exchange Commission on February 4, 2010.
|
|
+*10.24
|
Retirement
and Transition Services Agreement, dated March 26, 2009, between the
Registrant and Bruce F. Dickson, incorporated by reference to Exhibit 10.1
to the Registrant’s Current Report on Form 8-K filed with the Securities
and Exchange Commission on April 3, 2009.
|
|
*10.25
|
Notice
of Revolver and Term A Amendment, dated August 12, 2009, incorporated by
reference to Exhibit 10.2 to the Registrant’s Current Report on Form 8-K
filed with the Securities and Exchange Commission on August 13,
2009.
|
|
*10.26
|
Third
Amendment of Term B Credit Agreement, dated as of September 3, 2009, by
and among the Registrant and Bank of America, N.A., as Administrative
Agent for the Term B Lenders, incorporated by reference to Exhibit 10.1 to
the Registrant’s Current Report on Form 8-K filed with the Securities and
Exchange Commission on September 3, 2009.
|
|
*10.27
|
Instrument
of Joinder (Additional Creditor Representative), dated as of October 8,
2009, between The Bank of New York Mellon Trust Company, N.A. and Bank of
America, N.A., incorporated by reference to Exhibit 10.1 to the
Registrant’s Current Report on Form 8-K filed with the Securities and
Exchange Commission on October 9, 2009.
|
|
21.1
|
Subsidiaries
of the Registrant.
|
|
23.1
|
Consent
of Ernst & Young LLP, Independent Registered Public Accounting
Firm.
|
|
31.1
|
Certification
of the CEO pursuant to Section 302 of the Sarbanes-Oxley Act of
2002.
|
|
31.2
|
Certification
of the CFO pursuant to Section 302 of the Sarbanes-Oxley Act of
2002.
|
|
32.1
|
Certification
pursuant to 18 U.S.C. Section 1350, as adopted pursuant to Section 906 of
the
Sarbanes–Oxley
Act of 2002.
|
|
(*)
|
Previously
filed.
|
|
(+)
|
Management
contract, compensation plan or
arrangement.
|
94