Attached files
| file | filename |
|---|---|
| EX-31.1 - EXHIBIT 31.1 - SONICWALL INC | ex311.htm |
| EX-23.1 - EXHIBIT 23.1 - SONICWALL INC | ex231.htm |
| EX-21.1 - EXHIBIT 21.1 - SONICWALL INC | ex211.htm |
| EX-31.2 - EXHIBIT 31.2 - SONICWALL INC | ex312.htm |
| EX-32.1 - EXHIBIT 32.1 - SONICWALL INC | ex321.htm |
SECURITIES
AND EXCHANGE COMMISSION
Washington,
D.C. 20549
|
x
|
ANNUAL
REPORT PURSUANT TO SECTION 13 OR 15(d) OF THE SECURITIES EXCHANGE ACT OF
1934
|
For
the year ended December 31, 2009
or
|
¨
|
TRANSITION
REPORT PURSUANT TO SECTION 13 OR 15(d) OF THE SECURITIES EXCHANGE ACT OF
1934
|
For
the transition period from
to .
Commission
File Number 000-27723

SonicWALL,
Inc.
(Exact
name of registrant as specified in its charter)
|
California
|
77-0270079
|
|
|
(State
or other jurisdiction of incorporation or organization)
|
(IRS
Employer Identification No.)
|
2001
Logic Drive
San
Jose, CA 95124
(Address
of Principal Executive Offices, including zip code)
(408)
745-9600
(Registrant’s
Telephone Number, including area code)
Securities
registered pursuant to Section 12(b) of the Act:
|
Title
of each class
|
Name
of each exchange on which registered
|
|
Common
Stock, no par value
|
The
NASDAQ Stock Market LLC
|
|
(The
Nasdaq Global Select
Market)
|
Securities
registered pursuant to Section 12(g) of the Act:
None
Indicate
by check mark if the registrant is a well-known seasoned issuer, as defined in
Rule 405 of the Securities Act. Yes ¨ No x
Indicate
by check mark if the registrant is not required to file reports pursuant to
Section 13 or Section 15(d) of the
Act. Yes ¨ No x
Indicate
by check mark whether the registrant (1) has filed all reports required to
be filed by Section 13 or 15(d) of the Securities Exchange Act of 1934
during the preceding 12 months (or for such shorter period that the registrant
was required to file such reports), and (2) has been subject to such filing
requirements for the past 90 days. Yes x No ¨
Indicate
by check mark if disclosure of delinquent filers pursuant to Item 405 of
Regulation S-K (§229.405 of this chapter) is not contained herein, and will not
be contained, to the best of Registrant’s knowledge, in definitive proxy or
information statements incorporated by reference in Part III of this Form 10-K
or any amendment to this Form 10-K. ¨
Indicate
by check mark whether the registrant is a large accelerated filer, an
accelerated filer, a non-accelerated filer, or a smaller reporting
company. See the definitions of “large accelerated filer,”
“accelerated filer” and “smaller reporting company” in Rule 12b-2 of the
Exchange Act.
Large
accelerated filer ¨ Accelerated
filer x
Non-accelerated
filer ¨ Smaller
reporting company ¨
(Do not
check if a smaller reporting company)
Indicate
by check mark whether the registrant is a shell company (as defined in Rule
12b-2 of the Act). Yes ¨ No x
As of
June 30, 2009, the aggregate market value of Common Stock held by
non-affiliates of the registrant (based upon the closing sale price on the
NASDAQ Global Market on that date) was approximately
$225,880,586. Shares held by each executive officer, director and by
each person who owns 10% or more of the outstanding Common Stock have been
excluded in that such persons may be deemed to be affiliates. This
determination of affiliate status is not necessarily a conclusive determination
for other purposes.
As of
February 28, 2010, there were 54,577,511 shares of the Registrant’s Common
Stock outstanding. This is the only outstanding class of common stock
of the Registrant.
DOCUMENTS
INCORPORATED BY REFERENCE
Certain
portions of the registrant’s proxy statement for its 2009 annual meeting of
shareholders, to be filed with the Securities and Exchange Commission pursuant
to Regulation 14A, are incorporated by reference into Part III of this Form
10-K.
EXPLANATORY
NOTE
The
Consolidated Financial Statements of SonicWALL, Inc. as of and for the fiscal
years ended December 31, 2008 and 2007, and related financial information, have
been restated to correct errors in the accounting for deferred tax assets
related to unrealized gains and losses on available-for-sale securities as
discussed in Note 5 of the Consolidated Financial Statements included in Part
II, Item 8 of this Annual Report. As the net unrealized losses from
available-for-sale securities are recognized through Other Comprehensive Income,
the impacts of these errors do not affect tax expense and are recorded in Other
Comprehensive Income. Consequently, the Company has restated the Consolidated
Balance Sheet as of December 31, 2008 and the Consolidated Statement of
Shareholder’s Equity for the years ended December 31, 2008 and December 31,
2007. The errors have no effect on the previously reported
Consolidated Statements of Operations or Consolidated Statements of Cash
Flows. Restated balances have been identified where
appropriate.
We are filing this comprehensive Annual Report on Form 10-K for the fiscal year ended December 31, 2009 with expanded financial and other disclosures in lieu of filing a separate amended Annual Report on Form 10-K/A for the fiscal years ended December 31, 2008 and 2007. This comprehensive report is being filed to facilitate the dissemination of current financial and other information to investors. The Company does not intend to file a separate amended Annual Report on Form 10-K/A for the fiscal years ended December 31, 2008 and 2007 to reflect restated financial information. The financial information that has been previously filed or otherwise reported for these periods is superseded by the information in this Annual report on Form 10-K, and the financial statements and related financial information contained in those previously filed reports should no longer be relied upon.
|
Page
|
||
|
PART
I
|
5 | |
|
ITEM
1. Business
|
5 | |
|
ITEM
1A. Risk Factors
|
16 | |
|
ITEM
1B. Unresolved Staff Comments
|
27 | |
|
ITEM
2. Properties
|
27 | |
|
ITEM
3. Legal Proceedings
|
28 | |
|
ITEM
4. Submission of Matters to a Vote of Security Holders
|
28 | |
|
PART
II
|
29 | |
|
ITEM
5. Market for Registrant's Common Equity and Related Stockholder
Matters
|
29 | |
|
ITEM
6. Selected Consolidated Financial Data
|
31 | |
|
ITEM
7. Management's Discussion and Analysis of Financial Condition and Results
of Operations
|
32 | |
|
ITEM
7A. Quantitative and Qualitative Disclosures About Market
Risk
|
55 | |
|
ITEM
8. Financial Statements and Supplementary Data
|
57 | |
|
ITEM
9. Changes in and Disagreements with Accountants on Accounting and
Financial Disclosure
|
93 | |
|
ITEM
9A. Controls and Procedures
|
93 | |
|
ITEM
9B. Other Information
|
94 | |
|
PART
III
|
95 | |
|
ITEM
10. Directors, Executive Officers and Corporate Governance
|
95 | |
|
ITEM
11. Executive Compensation
|
95 | |
|
ITEM
12. Security Ownership of Certain Beneficial Owners and Management and
Related Stockholder Matters
|
95 | |
|
ITEM
13. Certain Relationships and Related Transactions, and Director
Independence
|
95 | |
|
ITEM
14. Principal Accounting Fees and Services
|
95 | |
|
PART
IV
|
96 | |
|
ITEM
15. Exhibits and Financial Statement Schedules
|
96 | |
|
SIGNATURES
|
102 | |
|
|
||
CAUTIONARY
NOTE ON FORWARD-LOOKING STATEMENTS
This
Annual Report includes “forward-looking statements” within the meaning of
Section 27A of the Securities Act and Section 21E of the 1934 Act. We
intend that the forward-looking statements be covered by the safe harbor
provisions for forward-looking statements in these sections. In some
cases, you can identify forward-looking statements by terminology such as “may,”
“will,” “could,” “expect,” “plan,” “anticipate,” “believe,” “estimate,”
“predict,” “potential,” “intend,” or “continue,” the negative of such terms or
other comparable terminology. These statements are only predictions,
reflecting our expectations for future events or our future financial
performance. Actual events or results may differ
materially. In evaluating these statements you should specifically
consider various factors, including the risks outlined under “Risk
Factors.” These factors may cause our actual results to differ
materially from any forward-looking statement.
We cannot
guarantee future results, levels of activity, performance, or
achievements. You should not place undue reliance on these
forward-looking statements, which apply only as of the date of this Annual
Report.
PART
I
Overview
SonicWALL
designs, develops, manufactures, and sells network security, content security,
and business continuity solutions for businesses of all sizes. Our
products are designed to provide secure Internet access to both wired and
wireless broadband customers, enable secure Internet-based connectivity for
distributed organizations, inspect the content entering and leaving
our customers’ networks, protect organizations against inbound and outbound
email threats, and provide business continuity in the case of data or
connectivity loss. We believe our security appliances and software
provide high-performance, robust, reliable, easy-to-use, and affordable security
solutions for our customers. Additionally, our Internet security
products are designed to make our customers more productive and more mobile,
while still maintaining a high level of security. As of December 31,
2009, we have sold more than 1.5 million of our Internet security appliance
platforms worldwide. We also sell value-added services for our
security appliances, including content filtering, anti-spam protection, client
anti-virus protection, integrated gateway anti-virus, anti-spyware, email
protection, offsite data backup, and intrusion prevention on a subscription
basis and license software packages such as our Global Management System
(“GMS”), our Global Virtual Private Networks (“VPN”) Client, and our email
security licenses. Our GMS solutions enable distributed enterprises
and service providers to manage and monitor a large number of SonicWALL Internet
security appliances and deploy our security software and services from a central
location thereby reducing staffing requirements, increasing the speed of
deployment and lowering costs. Our Global VPN Client provides mobile
users with a simple, easy-to-use solution for securely accessing the
network.
Our
products and services are sold, and software licensed, through a two tiered
distribution model: first to distributors and then to resellers, who provide
solutions using our products, services, and software to end-user
customers.
SonicWALL,
Inc. was incorporated in California in 1991 as Sonic Systems. The
company name was changed to SonicWALL, Inc. in August
1999. References in this report to “we,” “our,” “us,” and “the
Company” refer to SonicWALL, Inc. Our principal executive offices are
located at 2001 Logic Drive, San Jose, California 95124, and our telephone
number is (408) 745-9600.
Industry
Background
Businesses
access the Internet for a wide variety of uses including communications,
information gathering, and commerce. Businesses and enterprises of
all sizes have accepted the Internet as a critical yet affordable means of
achieving global reach and brand awareness, allowing access and shared
information among a large number of geographically dispersed employees,
customers, suppliers, and business partners. The Internet has become
a particularly attractive solution for small and medium size businesses due to
its cost effectiveness and ease-of-use. Larger enterprises also
connect their internal networks to the Internet allowing for greater and quicker
communications and expanded operations. Many of today’s larger
enterprises also have branch offices, mobile workers, and telecommuters who
connect electronically through the Internet to the corporate office and each
other. The Internet has also become a vital tool of information
access and communication for schools, libraries, government agencies, and other
institutions.
Increasing
Use of Broadband Access Technologies
The
connection speed by which individuals, businesses and enterprises of all sizes
connect to the Internet is increasing. Small to medium enterprises,
branch offices, and consumers are benefiting from increasingly faster and always
connected internet connections such as digital subscriber lines (“DSL”) and
cable Internet access. Larger enterprises are moving from T1
connectivity to T3 connectivity and in some cases to OC-3 or Ethernet
connectivity. These “broadband” connections allow for substantially
faster Internet access among many simultaneous users. Additionally,
as Internet access speeds increase, both network bandwidth and network traffic
speeds have significantly increased, further reflecting the ubiquity and the
importance of the Internet to business operations.
Importance
of Data Security
We
believe Internet security is essential for businesses and enterprises due to the
large amount of confidential information transmitted or accessible over the
Internet. Broadband technologies, including DSL and cable, are always
connected to the Internet. This constant connectivity increases the
risk that confidential information, information controlled by privacy
regulations, and other sensitive business information might be compromised by
computer hackers, identity thieves, disgruntled employees, contractors, or
competitors. In addition, business or enterprise data and networks
become increasingly vulnerable to security threats and sophisticated attacks as
the number of connections to the Internet and the volume of confidential
information accessible through the Internet increases. Breaches of
network security are costly to a business, both financially and as a source of
lost productivity resulting from network and computer downtime.
The
productivity gains of network use are also threatened by large volumes of
unsolicited email (“spam”), which can overload mail servers and applications as
well as consuming employee time. Additionally, some types of
unsolicited e-mail are conduits for network attacks, or attempt to deceive the
recipient into disclosing confidential information.
As
networks and the data carried on them become more essential to the conduct of
business, the financial risk associated with data loss also
increases. Network security breaches can cause data loss, as can
cause disk drive failures and accidental or intentional deletion of critical
files.
The
market for security and productivity products includes a variety of applications
to address vulnerabilities and protect critical data both during transmission
and at rest. These applications include, among others, firewalls, VPN
access products, anti-virus solutions, intrusion prevention, content filtering,
backup and restore systems, and e-mail security products.
Integrated
Solutions for Internet Security
As
network connection speeds and bandwidth have increased, and as more complex
forms of data are transmitted by and within enterprises, reliable solutions have
developed that emphasize high rates of data transfer while maintaining the
integrity and security of network data. Enterprises of all sizes
require a broad array of high performance, cost-effective products to protect
their networks, delivering security and productivity not only for the central
office headquarters and for perimeter branch offices but also for telecommuters
and other employees working from remote locations.
We
believe solutions that integrate hardware, software, and service elements
overcome many of the shortcomings of solutions based upon software
alone. Software based security solutions can be difficult to install
and manage, often requiring dedicated and highly skilled in-house information
technology (“IT”) personnel. Additionally, software only security
solutions can also be difficult to integrate within networks, often requiring
installation of dedicated server equipment and the use of complex load balancing
switches to provide reliable, high-speed performance. Our integrated
solution approach can overcome many of these limitations by integrating multiple
security and productivity functions into easy-to-deploy devices that are
interoperable with many industry standards. These integrated
solutions can remain current through automatic update services.
The
Advent of Secure Virtual Private Networks
Large and
small enterprises utilize VPNs in the place of more costly private, dedicated
networks or leased lines. VPNs allow for two or more individual
networks to be linked creating one large private network. The private
network is “virtual” because it leverages the public Internet as the network
infrastructure. Enterprises use VPNs to achieve a variety of
objectives. Telecommuters and traveling workers can access a
corporate network to work from their out-of-office locations using
remote
access
VPN. Satellite and branch offices can connect to the home office
network using site-to-site VPNs. An enterprise can connect with its
business partners, suppliers, and customers utilizing an Extranet
VPN. These VPN connections must be secure from unauthorized access
and safe from unauthorized alteration. To secure a VPN, information
traveling between the locations is encrypted and authenticated. To
help deliver the desired quality and security levels, businesses can monitor and
prioritize network traffic for business-critical applications and allocate
bandwidth for specific traffic, typically using customer premises equipment
encryption and authentication products.
In a
distributed business model, branch offices and point-of-sale (“POS”) and other
locations extend a company’s reach into key markets. To realize these
benefits, the communication link must be available at all times and be able to
support the application. VPN solutions help companies establish
centralized control over branch offices, POS locations, or remote kiosks by
providing the robust security and performance needed for business
continuity. A traditional site-to-site connection often requires the
leasing of expensive, dedicated data lines that are difficult to deploy and
manage. With the advent of affordable broadband and standards-based
VPN, organizations can deploy secure remote access via Internet
connections. With today’s VPN technology and broadband connections,
enterprises of any size may use the Internet to securely communicate with their
multiple locations.
Changing
Mobile Computing Environment and Demand for SSL-VPN
In
today’s mobile environment, information needs to be accessed by a highly diverse
community of users from essentially anywhere an internet connection exists and
through access devices that are not always owned or controlled by the IT
organization. For large enterprises with in-house IT personnel and
higher IT spending budgets, these challenges are more easily addressable than
for the more IT constrained small and mid-sized business (“SMB”).
SSL-VPN
allows any user in any location where internet connectivity is available to
connect to any network resource reliably and conveniently, with enhanced levels
of security. The Web browser on the user’s device provides the means
for establishing an encrypted tunnel between the user’s device and the SSL-VPN
gateway. Through a Web browser, users can access applications and
resources behind the gateway. SSL-VPN solutions were originally
designed for large enterprises with a feature set and price that exceeded SMB
needs and means. This situation is changing with a new generation of
SSL-VPN product offerings specifically designed to meet the remote access needs
of SMBs at affordable prices.
Need
for Anti-Virus, Intrusion Prevention and Content Filtering
Solutions
In
addition to lost productivity, companies, their partners, and customers are
vulnerable to severe financial losses. This reality has been
underscored by the rapid infection of many users through widespread and highly
publicized virus outbreaks affecting business networks around the
globe. At the same time, we believe that issues such as loss of
employee productivity, liability concerns, and network bandwidth constraints
continue to fuel the growth of content filtering. Enterprises are
deploying anti-virus protection, content filtering, and intrusion prevention
solutions across the enterprise and expending technical resources to keep these
defenses updated against the latest virus threats and objectionable or
inappropriate content.
Rising
Value of Data and Demand for Business Continuity
As
enterprises increase their reliance on networked computer systems to develop
products, maintain relationships with customers, and conduct commerce, the data
stored on the networked systems become increasingly critical to the productivity
and success of the business. Loss of important files or data can
result in significant interruptions in the ability of a company to conduct
business. To counter this risk and to meet emerging and existing
regulatory requirements, companies have traditionally turned to tape-based
backup and restoration technologies. Increasing performance of hard
disk drives and the speed of internet connectivity coupled with reduced costs
have given rise to alternatives to tape-based solutions. These
solutions offer continuous, rather than point-in-time, data protection as well
as higher performance.
Increases
in Unsolicited E-Mail
Email is
one of the most critical business applications making use of the
Internet. Recent years have seen a dramatic rise in the amount of
unsolicited email (“spam”) directed to both consumers and business Internet
users. This unsolicited email can be a nuisance at best, consuming
employee productivity. In more extreme cases, spam can cause email
servers to slow down or even stop working, causing delays or interruptions in
business operations. Aside from the employee and network
productivity
degradations, some forms of unsolicited mail may be conduits for network attacks
or may contain other types of threats, including attempts to cause recipient
computers to execute malicious code, or attempts to mislead recipients into
disclosing confidential information to criminal enterprises engaged in fraud or
theft.
Strategy
Our goal
is to build on our leadership position in Internet security by continuing the
transition of our company to a comprehensive provider of integrated network
security, content security, and business continuity solutions. We
plan to accomplish our goal by focusing on value innovation, the process whereby
we deliver solutions with price-performance advantages.
Key
elements of our strategy include:
|
•
|
Global
Growth. We plan to focus our investment in those
geographical areas that can sustain rates of growth consistent with our
business objectives. Part of our global growth initiative also
includes taking advantage of supply chain improvements wherever
possible. We believe that this type of alignment of our
resources will strengthen our global
position.
|
|
•
|
Continue to Bring New Products
to the Market. We use our internal product design and
development and integration expertise to produce solutions that deliver
value to our end-users.
|
|
•
|
Cost
Reduction. We intend to be vigorous in our pursuit to
lower costs in all aspects of our business. Supply chain
improvements and continual business process improvement are key components
of this initiative. We believe that the associated cost
reductions will strengthen our market position and assist us in
penetrating new markets.
|
|
•
|
Strengthen Our Indirect
Channel. Our global target markets are generally served
by a two-tier distribution model. We have achieved varying
degrees of regional penetration in these markets with large-scale
distributors at the hub of our model fulfilling the needs of authorized
resellers and systems integrators and creating a distribution web that
covers over 50 countries. We intend to continue to implement
programs designed to enhance our competitive position through distributors
and authorized resellers.
|
|
•
|
Increase Services and Software
Revenue. We intend to continue to develop new services
and licensed software offerings to generate additional revenue from our
installed base and to provide additional sources of revenue ancillary to
our product sales. We currently offer a selection of integrated
functionality including gateway anti-virus, client anti-virus,
anti-spyware, anti-spam protection, intrusion prevention, offsite data
backup, email security, and content filtering subscription
services. We also offer fee-based customer support services and
training. We have dedicated sales and marketing personnel and
programs that focus on selling these services, as well as add-on products
to our existing base of customers.
|
|
•
|
Inorganic
Growth. We intend to continue to explore corporate
opportunities to enhance our ability to broaden the product range that we
bring to the market. Where appropriate, we may license, OEM, or
acquire technologies in order to better address the current and future
requirements of our customers.
|
The
SonicWALL Solutions
SonicWALL
provides comprehensive Internet security solutions that include network
security, business continuity and content security, training and support
services. Our Internet gateways serve as platforms for which
SonicWALL sells additional software and services to enhance customer security
and productivity. Our solutions provide cost effective and high
performance Internet security solutions to small, medium, and large enterprise
users in commercial, healthcare, education, and government markets.
SonicWALL
products are designed to provide comprehensive Internet security solutions for
(1) networks ranging in size from one to many thousands of end points; (2)
enterprises having branch offices, telecommuting employees or POS locations; and
(3) e-commerce applications that handle millions of secure transactions
daily. Our security appliances span a wide range of requirements,
from single-user appliances to rack-mounted enterprise-class units capable of
supporting thousands of users. Our products offer substantial
flexibility in the number of supported users, the number of ports, and a variety
of software
options
such as gateway anti-virus, anti-spyware, intrusion prevention and content
filtering, protection against spam, phishing, virus, and other attacks, as well
as management and reporting tools that enable our customers to easily manage
SonicWALL appliances installed throughout their networks.
Security
Appliances
SonicWALL’s
current generation line of security appliances can be categorized into the
following groups. Each group provides appliances for small, medium, and large
networks and businesses.
SonicWALL Unified Threat Management
(UTM) Appliances. The UTM products consist of the TZ, NSA, and
NSA E-class appliance series. The TZ series is a security platform for home,
small and remote/branch offices. The TZ series offerings include wireless
features. The Network Security Appliance (NSA) and the NSA E-class appliance
series represent our higher performance UTM appliances and are designed to
provide a comprehensive security platform for complex networks.
SonicWALL SSL VPN
Appliances. The SSL-VPN products are designed to provide a
secure remote network and application access solution that requires no
pre-installed client software. Utilizing only a standard Web browser,
users can access e-mail, files, intranets, remote desktops (including both full
desktop and individual application access), and other resources on the corporate
LAN from any location.
SonicWALL Email Security
Appliances. The Email Security products are designed to
provide inbound and outbound email threat protection for the small to medium
size business by protecting against spam, virus, and phishing
attacks.
SonicWALL Data Backup
Appliances. The Continuous Data Protection (CDP)
Backup and Recovery products are integrated, end-to-end backup and recovery
solutions for businesses and remote offices that are designed to provide
automatic, real-time, disk-based data backup for productivity files, Microsoft
Exchange, SQL Server, and business applications, as well as remote laptops and
desktops. These solutions also integrate “bare metal restore”
capability, allowing full data restoration in circumstances where a catastrophic
disk failure has occurred.
Security
Application and Services
SonicWALL
Internet security appliances are designed to integrate seamlessly with our line
of value-added security applications to provide a comprehensive Internet
security solution. With SonicWALL’s integrated security applications
and services, we believe users can reduce the integration and maintenance
problems that often result from sourcing, installing, and maintaining security
products and services from multiple vendors. Our security
applications and services include:
SonicWALL Global VPN
Client. Our virtual private networking capabilities enable
communications over the Internet between geographically dispersed offices,
workers, and partners.
SonicWALL Content Filtering
Service. Our content filtering service enables businesses,
families, schools and libraries to control access to objectionable or
inappropriate web sites by uniform resource locator (“URL”), keyword or
application type. We offer a content filtering subscription service
that provides a list of objectionable web sites that is automatically
updated.
SonicWALL Enforced Anti-Virus and
Anti-Spyware Client. Our enforced anti-virus and anti-spyware
subscription service for desktops and laptops integrates with our security
appliances to deploy and maintain anti-virus and anti-spyware software for each
user on the network without the need for desktop-by-desktop installation,
configuration, and maintenance. Users of this service receive
automatic anti-virus and anti-spyware updates to all network nodes.
SonicWALL Gateway Anti-Virus,
Anti-Spyware, and Intrusion Prevention. SonicWALL Gateway Anti-Virus,
Anti-Spyware, and Intrusion Prevention Service is a bundled offering
designed to provide a fully integrated approach against sophisticated
application layer and content-based attacks. Utilizing a deep packet
inspection architecture, SonicWALL Gateway Anti-Virus, Anti-Spyware, and
Intrusion Prevention Service is designed to secure the network from the core to
the perimeter against a comprehensive array of dynamic threats and software
vulnerabilities.
SonicWALL Anti-Virus, Email
Security. SonicWALL Anti-Spam / Email Security solutions provide
effective, high-performance and easy-to-use inbound and outbound email threat
protection. This self-running, self-updating solution, delivers powerful
protection against spam, virus and phishing attacks in addition to preventing
leaks of confidential
information.
Combining anti-spam, anti-phishing, content filtering, policy management and
content compliance capabilities in a single seamlessly integrated solution,
SonicWALL Anti-Spam / Email Security solutions provide powerful protection
without complexity.
SonicWALL Backup and Recovery
Offsite Services. Coupled with SonicWALL CDP, we provide
offsite data protection at our secure offsite data centers. Data
replicated to SonicWALL data centers is transmitted and stored with an
encryption key that is designed to be known only to the end user or SonicWALL
channel partner. This service is designed to enable customers to
recover data lost in the event of natural disasters such as floods, fires, and
electrical power surges, or from a theft in the business.
Global
Security Management Applications
Today,
enterprises and service providers face an increasing security management
challenge resulting from geographically distributed networks. As a
distributed network grows and branches into multiple sub-networks linked by the
Internet, so does the complexity of managing security policies. A
weakness in security implementation at any remote location can expose the entire
network infrastructure to attack.
For
network administrators, managing security for distributed networks on a
site-by-site basis places a strain on resources. Visits to remote
sites to setup security, inspect security installations, or provide training to
local personnel is time consuming, expensive, and
impractical. Administrators cannot be certain that every installation
in the distributed network is complying with company security
policies. To address these realities, SonicWALL’s Global Management
System (“GMS”) is designed to provide network administrators with configuration
and management tools to globally define, distribute, enforce, and deploy the
full range of security application services and upgrades for thousands of
SonicWALL Internet security appliances. GMS is available as either software or
as an integrated appliance.
Value
Proposition
The
SonicWALL product line of Internet security solutions provides our customers
with the following key benefits:
|
|
•
|
High-Performance, Scalable,
and Robust Access Security. We offer our customers a
comprehensive integrated security solution that includes firewall, VPN,
gateway anti-virus, anti-spyware, intrusion prevention, content security,
and content filtering. Specifically, we offer the following
values:
|
|
-
|
Our
access security products protect private networks against Internet-based
theft, destruction, or modification of data, and can automatically notify
customers if their network is under certain types of
attack. SonicWALL has been awarded the internationally
recognized International Computer Security Association (“ICSA”) Firewall
and VPN Certification.
|
|
-
|
Our
SSL-VPN product family provides organizations of
various sizes with an affordable, simple and secure clientless
remote network and application access solution that requires no
pre-installed client software.
|
|
-
|
Our
client anti-virus services provide comprehensive virus protection with
automatic updates and minimal
administration.
|
|
-
|
Our
gateway anti-virus, anti-spyware, and intrusion prevention services shield
networks from infection from malicious code by blocking transmissions
through the gateway and disrupting background communications from existing
spyware programs that transmit confidential
data.
|
|
-
|
Our
content filtering service enables customers such as businesses, schools,
government agencies, and libraries to restrict access to objectionable or
inappropriate web sites.
|
|
|
•
|
Ease of Installation and
Use. The SonicWALL product line of Internet security
solutions delivers “plug-and-play” appliances designed for easy
installation and use. SonicWALL products are configured and
managed through a web browser-based interface or through our GMS and do
not require reconfiguration of personal computer
applications.
|
|
|
•
|
Low Total Cost of
Ownership. The SonicWALL product design minimizes the
purchase, installation, and maintenance costs of Internet
security. The suggested retail prices of our security solutions
start below $300 and scale up to over
$100,000.
|
|
|
•
|
Reliability. The
SonicWALL products are designed for reliability and uptime. Our
products use an embedded single purpose operating
system.
|
Technology
We have
designed our SonicWALL products using a unique combination of hardware and
software that delivers Internet security with what we believe is excellent
ease-of-use and industry-leading price/performance.
Appliance
Platforms
SonicWALL’s
TZ, NSA and NSA E-class products are based on a new, highly efficient processor
technology, allowing us to offer a level of performance beyond any of our
previous designs. The processor technology scales from 1 to 16 cores
in the current product line and is capable of expanding further to create an
entire scalable product line based on this one design.
The
SonicWALL’s UTM appliance solutions provide the following core
features:
|
|
•
|
Deep Packet Inspection UTM and
IPSec VPN. The core technology is the deep packet
inspection UTM software that examines all layers of the packet (from the
physical layer up to application layer) and determines whether to accept
or reject the requested communication based on information derived from
previous communications and the applications in use. Deep
packet inspection dynamically adjusts based on the changing state of the
communication running across the firewall and is invisible to users on the
protected network.
|
|
|
•
|
IP Address
Management. Our appliances manage the complexity of IP
addressing through Network Address Translation (“NAT”) tools which allow
networks to share a small number of valid public IP addresses with an
equal or larger number of client computers on the
LAN.
|
The
SonicWALL security solutions offer the following options for device
management:
|
|
•
|
Web Browser-Based Management
Interface. This interface is designed to provide an
intuitive and easy-to-use web-based management interface for rapid
installation, configuration, and maintenance. This interface
can be accessed from any web browser on the internal, private
network. This interface can also be accessed remotely in a
secure manner.
|
|
|
•
|
SonicWALL Global Management
System. Our global management system, SonicWALL GMS, is
an enterprise software application or integrated appliance designed to
enable service providers and distributed enterprises to manage their
SonicWALL appliances from a central location. SonicWALL GMS
software is available to use in Windows and Sun Solaris operating
environments. SonicWALL GMS is also compatible with leading
relational database management systems such as Oracle and Microsoft SQL
Server.
|
|
|
•
|
Logging and
Reporting. SonicWALL appliances maintain an event log of
potential security concerns, which can be viewed with a web browser or
automatically sent on a periodic basis to any e-mail
address. SonicWALL appliances notify the administrator of
high-priority security issues, such as an attack on a server, by
immediately sending an alert message to a priority e-mail account such as
an e-mail pager. SonicWALL appliances also provide pre-defined
reports that show different views of Internet usage, such as the most
commonly accessed web sites.
|
The
SonicWALL SSL-VPN solutions provide the following core features:
|
•
|
The
SonicWALL Aventail E-Class Secure Remote Access offerings are clientless
SSL-VPN solutions that deliver secure, easy-to-manage remote access for
mobile enterprise organizations, supporting up to thousands of concurrent
users from a single appliance.
|
|
•
|
The
SonicWALL SSL-VPN Series provides organizations of all sizes with an
affordable, simple and secure remote network and application access
solution that requires no pre-installed client
software.
|
The
SonicWALL content security solutions provide the following core
features:
|
•
|
SonicWALL
Email Security solutions provide inbound and outbound e-mail management,
content compliance capabilities, anti-spam and Time Zero anti-virus
technology, DHA, DoS and Zombie attack protection, end-user spam
management, seamless LDAP integration, and robust
reporting.
|
The
SonicWALL CDP solutions provide the following core features:
|
•
|
SonicWALL
CDP is a proprietary software / hardware appliance that continuously
searches servers, mobile laptops, and connected desktops for file changes,
coordinates protection of multiple networked client PCs and servers,
updates client servers with latest versions, and coordinates updates with
the SonicWALL web infrastructure.
|
Applications
and Services
SonicWALL
Internet security appliances are designed to integrate with a complete line of
value-added security services to provide comprehensive Internet
security. With SonicWALL’s integrated security services, we believe
that integration and maintenance problems that often result from sourcing,
installing, and maintaining security products from multiple vendors are
minimized. Our security services are enabled on the base hardware
platform via a software key.
|
•
|
Content
Filtering. Our Internet content filter blocks
objectionable content using a list of prohibited URLs and keywords as well
as cookies, Java and ActiveX
scripts.
|
|
•
|
Gateway
Anti-Virus. Our gateway anti-virus service is intended
to provide anti-virus protection throughout a business and across a
distributed network and delivers protection for high threat viruses and
malware by conducting inspections over the most common protocols used in
today's networked environments. Automatic anti-virus updates
are available for all network nodes to protect them from new virus
outbreaks.
|
|
•
|
Anti-Spyware. Our
gateway anti-spyware service is intended to provide anti-spyware
protection throughout a business and across a distributed network and
delivers protection for intrusive and unwanted applications, from being
loaded onto user’s computers without their knowledge. Automatic
anti-spyware updates are available for all network nodes to protect them
from new virus outbreaks.
|
|
•
|
Instrusion
Prevention. Our intrusion
prevention service utilizes a configurable, ultra-high performance deep
packet inspection engine to deliver network protection while preventing
known buffer overflow vulnerabilities in software. This service
also defends against various worms, Trojans, and backdoor
exploits. The service not only protects networks from attacks
originating outside the network (WAN), but also from internal attacks
targeting network segments (LANs), and provides a robust database of
attack and vulnerability signatures that is dynamically updated as new
exploits and vulnerabilities are
discovered.
|
|
•
|
Anti-Spam
Protection. Our anti-spam
protection service offers end-to-end attack monitoring through a response
network consisting of over one million nodes worldwide. Feedback from this
service provides SonicWALL with daily information on the latest spam
attacks, new spam domains and other e-mail threats, which in turn is used
to deliver the most current, updated anti-spam engine on the
market.
|
|
•
|
Offsite Data
Backup. Our
offsite data backup service uses SSL encryption, advanced compression, and
backup of only binary differences. Data can be sent to a secure
datacenter, via SonicWALL CDP Offsite Service, or to another CDP
Appliance, via SonicWALL CDP Site-to-Site Backup. This offsite feature
protects data against the risks of fire, theft, misplacement and other
issues relating to tape or CD-based
backup.
|
Competition
The
market for Internet security solutions is global and highly
competitive. Competition in the markets in which we participate
continues to increase. There are few substantial barriers to
entry. Additional competition from existing competitors and new
market entrants will likely occur in the future.
Our competitors may be able to respond more quickly than we can to new or emerging technologies and changes in customer requirements. In addition, our current and future competitors may integrate security solutions into the infrastructure of their existing product lines, including operating systems, routers, and browsers, in a manner that may discourage users from purchasing the products and services we offer. Many of our current and potential competitors have greater name recognition, larger customer bases to leverage, and greater access to proprietary technology, and could therefore gain market share to our detriment. In addition, our current and potential competitors may consolidate through mergers or acquisitions or establish cooperative relationships among themselves or with third parties. These actions may further enhance their financial, technical, and other resources. We expect additional competition as other established and emerging companies enter the Internet security market and new products and technologies are introduced.
Principal
competitors in our markets include, but are not limited to the following, all of
which sell worldwide or have a presence in most of the major markets for such
products:
|
•
|
Enterprise
firewall software providers such as Check Point, Microsoft, and
Symantec;
|
|
•
|
Network
equipment providers such as Cisco Systems, Lucent Technologies, and Check
Point;
|
|
•
|
Security
appliance providers such as WatchGuard Technologies, Fortinet, and Juniper
Networks;
|
|
•
|
Content
security providers such as Barracuda Networks and
McAfee.
|
Our
primary competitors in the backup / recovery market are tape drive
manufacturers, software providers whose software points to tape devices, and
offsite backup providers. Competitive tape manufacturers include
Sony, Hewlett-Packard, and Quantum, while software competitors include Symantec,
CA, Seagate, and Iron Mountain.
Customer
Service and Technical Support
We offer
our customers a complete range of support programs that include electronic
support, product maintenance, and personalized technical support services on a
worldwide basis. We offer direct support to customers in North
America, Europe, Japan, and selected countries in Asia
Pacific. Support services in other locations are provided through
SonicWALL distributors. We now have customer support centers located
in California, Arizona, Washington, United Kingdom, Japan, and India. A small
portion of our technical support function is outsourced to third party service
providers under agreements having an initial term of one (1) year subject to six
(6) month extensions thereafter unless terminated upon 90 days prior written
notice.
Our
standard service offerings include support which is available during normal
business hours, as well as an enhanced offering providing access to support
services 24 hours a day, seven days a week. These support offerings
provide problem identification, problem resolution, replacement for failing
hardware, telephone or web-based technical support, and firmware
updates. For certain large customers, SonicWALL offers custom support
agreements that may include additional features including dedicated technical
account management, accelerated escalation, and logistical support.
Customers
We sell
our products primarily through distributors who resell the products to
authorized resellers who in turn market and sell our products to end-user
customers. Our top worldwide distributors based on revenues in the
year ended December 31, 2009 were Ingram Micro, Inc. (“Ingram Micro”), Tech Data
Product Management, Inc. (“Tech Data”), and Alternative Technology, Inc. In
November 2006, Alternative Technology was acquired by Arrow Electronics, Inc. As
of June 1, 2009, Alternative Technology was absorbed into Arrow Enterprise
Computing Solutions, Inc. “(Arrow”), a subsidiary of Arrow Electronics,
Inc.
Sales
and Marketing
Our sales
and marketing efforts focus on generating and fulfilling demand for our products
in the small to mid-sized business, enterprise and government
markets. Our marketing programs promote SonicWALL brand awareness and
reputation as a provider of reliable, high-performance, easy-to-use, and
affordable Internet security solutions including a suite of value added support,
service, and software offerings. We try to strengthen our brand
through a variety of marketing programs including
on-going public relations, our web site, advertising, direct mail, industry and regional trade shows, and seminars. We intend to continue expanding and strengthening our indirect channel relationships through additional marketing programs and increased promotional activities.
We
believe that SonicWALL solutions are ideally suited for the indirect channel
business model. We market and sell our solutions in this indirect
channel through a two-tiered distribution structure consisting of distributors
and authorized resellers in the United States and over 50 other
countries. Distributors and authorized resellers accounted for
approximately 99% of our total revenue for the year ended December 31,
2009. Authorized resellers, including systems integrators, ISPs,
dealers, and mail order online catalogs, generally purchase our products from
our distributors and then sell our products to end-users in our target
markets.
We divide
our sales organization regionally into the following territories: the Americas;
Asia Pacific (“APAC”); and Europe, the Middle East and Africa
(“EMEA”). Regional sales representatives manage our relationships
with our network of distributors, value-added resellers, and customers, help our
value-added reseller network sell and support key customer accounts, and act as
a liaison between our value-added reseller network and our marketing
organization. The regional sales representative’s primary
responsibility is to help the indirect channel succeed and grow within the
territory. We also have an internal sales staff that supports the
indirect channel.
Domestic
Channel. In the Americas, the primary distributors of our
products to resellers are Ingram Micro, Tech Data, and Arrow. Ingram
Micro accounted for approximately 18%, 16%, and 16% of total revenue in 2009,
2008, and 2007, respectively. Tech Data accounted for approximately
17%, 17%, and 17% of total revenue in 2009, 2008, and 2007,
respectively. Arrow accounted for 11%, 16%, and 18%, of total revenue
in 2009, 2008, and 2007, respectively.
Domestic
resellers receive various benefits and product discounts, generally depending on
the level of purchase commitment and achievement. Our standard
reseller program offers access to sales and marketing
materials. Certain of our resellers qualify for our Medallion
program, which extends those benefits by adding access to an expanded set of
partnership benefits including sales and marketing tools, priority technical
support and other benefits.
International
Channel. We believe there is a strong international market for
our products. International sales represented approximately 33%, 34%,
and 32%, of our total revenue in 2009, 2008, and 2007. We direct
substantially all of our international resellers to an appropriate distributor
in each territory. We support our international distributors by
offering localized marketing materials, sales tools, leads, co-operative
marketing funds, joint advertising, discounted demonstration units, and
training. We also participate in regional press tours, trade shows,
and seminars.
Original Equipment Manufacturer
Channel. From time to time we may enter into select original
equipment manufacturer relationships in order to take advantage of opportunities
to rapidly penetrate certain target markets. We believe these
opportunities expand our overall market while having a minor impact on our own
indirect channel sales.
Research
and Development
We
believe that our future success will depend in large part on our ability to
develop new and enhanced Internet security solutions and our ability to meet the
rapidly changing needs of our target customers who have broadband access to the
Internet. We focus our research and development on evolving Internet
security needs. We have made substantial investments in hardware,
firmware, and software, which are critical to drive product cost reductions and
higher performance solutions. Our research and development activities
are primarily conducted at our headquarters facilities in San Jose, California
as well as in Seattle, Washington, Shanghai, China and Bangalore,
India.
Intellectual
Property
We
currently rely on a combination of patent, trademark, copyright, and trade
secret laws, confidentiality provisions and other contractual provisions to
protect our intellectual property. Our intellectual property program
consists of an on-going patent disclosure and application process, the purchase
of intellectual property assets and the licensing of intellectual property from
others. We plan to continue our aggressive plan to build our
intellectual property portfolio. We believe that the duration of the
patents we have been granted is adequate relative to the expected market lives
of our products. Despite our efforts to protect our intellectual
property, unauthorized parties may misappropriate or infringe our intellectual
property. We plan to aggressively pursue any such misappropriation or
infringement of our intellectual property. Our patent
applications
may not result in the issuance of any patents. Even if we obtain the patents we are seeking, we cannot guarantee that our patent rights will be valuable, create a competitive barrier, or will not be infringed by others. Furthermore, if any patent is issued, it might be invalidated or circumvented or otherwise fail to provide us any meaningful protection. We face additional risk of adequately protecting our intellectual property when conducting business in countries that have poorly developed or inadequately enforced intellectual property laws. In addition, competitors may independently develop similar or superior technologies or duplicate the technologies we have developed, which could substantially limit the value of our intellectual property.
U.S.
Government Export Regulation Compliance
Our
products are subject to federal export restrictions on encryption
strength. Federal legal requirements allow the export of any-strength
encryption to designated business sectors overseas, including U.S. subsidiaries,
banks, financial institutions, insurance companies, and health and medical
end-users. We have federal export authorization that allows us to
export encryption technology to commercial entities in approved
countries. In certain instances, we are required to obtain individual
export licenses as a prerequisite to the exportation of the
technology. With appropriate approvals, we are able to export strong
encryption to a wide range of foreign end-users, subject to certain limitations
and record-keeping requirements. Our agreements with our distributors
require them to understand and comply with these export requirements in the sale
and distribution of our products.
Manufacturing
We currently outsource our hardware
manufacturing and assembly to contract manufacturers in the U.S. and
Taiwan. Typically, the agreements with our contract manufacturers
specify an initial term of one (1) year with automatic yearly renewal terms
unless terminated by either party upon 90 days prior written notice.
Outsourcing our manufacturing and
assembly enables us to reduce fixed overhead and personnel costs and to provide
flexibility in meeting market demand.
We design
and develop the key components for the majority of our products. In
addition, we generally determine the components that are incorporated in our
products and select the appropriate suppliers of these
components. Product testing and burn-in are performed by our contract
manufacturer using tests that we typically specify.
As part
of our design and development activity, we constantly review environmental and
safety regulations in the jurisdictions in which we do
business. Working with our contract manufacturers, we review the
applicability of these regulations to our products and the established
timetables for implementation of the regulations to position us to meet various
environmental and safety restrictions on product content.
Information
about Segments and Geographic Areas
Financial
information relating to our segments and information on revenues generated in
different geographic areas are set forth in Note 10, entitled “Segment
Reporting,” of the Notes to Consolidated Financial Statements in Part II, Item 8
of this report. In addition, information regarding risks attendant to
our foreign operations is set forth under the heading “RISK FACTORS” included
later in this report.
Employees
As of
December 31, 2009, we had 819 employees. Of these, 220 were employed
in sales and marketing, 62 in finance and administration, 295 in research and
development and 242 in support and operations. We are not party to
any collective bargaining agreements with our employees and we have not
experienced any work stoppages. We believe we have excellent
relations with our employees.
Where
You Can Find More Information
We make
our annual report on Form 10-K, quarterly reports on Form 10-Q, current reports
on Form 8-K, and all amendments to such reports filed pursuant to Section 13(a)
or 15(d) of the Exchange Act, available free of charge on or through our
Internet website located at www.sonicwall.com, as soon as
reasonably practicable after they are filed with or furnished to the
SEC.
We also
make available on our Internet website our Corporate Governance Principles and
other corporate governance related documents including the charters of the Audit
Committee, Compensation Committee, and Nominations and Corporate Governance
Committee of our Board of Directors, the Code of Conduct for all employees and
directors, and our Code of Ethics for Principal Executive and Senior Financial
Officers. Such information is also available in print to shareholders
upon request.
You
should carefully review the following risks associated with owning our common
stock. Our business, operating results or financial condition could
be materially adversely affected in the event any of the following risks were to
be realized. You should also refer to the other information set forth
in this report and incorporated by reference herein, including our financial
statements and the related notes. Given these risks and
uncertainties, readers are cautioned not to place undue reliance on such
forward-looking statements.
Rapid
changes in technology, regulatory requirements and industry standards could
render our products, software and services unmarketable or obsolete, and we may
be unable to successfully introduce new products and services.
To
succeed, we must continually introduce new products, software and services and
change and improve our solutions in response to new competitive product
introductions, rapid technological developments, changes in regulatory
requirements, and changes in operating systems, Internet access, application and
networking software, computer and communications hardware, programming tools,
computer language technology and other security threats. Product and
service development for security, productivity, mobility, and data protection
solutions requires substantial engineering time and testing. The
disparities between the laws and administrative measures adopted by various
jurisdictions in which we do business create uncertainty over the applicability,
scope, and form of the regulations affecting our products and services and the
timing for compliance with applicable regulations. Releasing new
products, software and services prematurely may result in quality problems, and
delays may result in loss of customer confidence and market share. In
the past, we have on occasion experienced delays in the scheduled introduction
of new and enhanced products, software and services, and we may experience
delays in the future. We may be unable to develop new products,
software, and services or achieve and maintain market acceptance of them once
they have come to market. Furthermore, when we do introduce new or
enhanced products, software and services, we may be unable to manage the
transition from previous generations of products or previous versions of
software and services to minimize disruption in customer ordering patterns,
avoid excessive inventories of older products, and deliver enough new products,
software, and services to meet customer demand. If any of the
foregoing were to occur, our business could be adversely affected.
Sales
to three major distributors account for a significant amount of our revenue, and
if they or others cancel or delay purchase orders or fail to pay us in a timely
fashion, and we are unable to offset these factors our revenue may decline and
the price of our stock may fall.
Sales
through Ingram Micro, Tech Data, and Arrow account for a significant portion of
our revenue. For the fiscal years ended December 31, 2009, 2008, and
2007, substantially all of our sales were to distributors and authorized
resellers as shown in the following table, expressed as a percentage of total
revenue:
|
2009
|
2008
|
2007
|
||||||||||
|
Distributors/Resellers
|
99%
|
99%
|
98%
|
|||||||||
Sales
through Ingram Micro, Tech Data, and Arrow for the fiscal years ended December
31, 2009, 2008, and 2007 represented the following percentages of total
revenue:
|
2009
|
2008
|
2007
|
||||||||||
|
Ingram
Micro
|
18%
|
16%
|
16%
|
|||||||||
|
Tech
Data
|
17%
|
17%
|
17%
|
|||||||||
|
Arrow
|
11%
|
16%
|
18%
|
|||||||||
For the
fiscal year ended December 31, 2009, 2008, and 2007, our top 10 distributors and
resellers accounted for 74%, 67%, and 67% of our total revenue,
respectively.
We anticipate that sales of our solutions to relatively few distributors will continue to account for a significant portion of our revenue. Although we have renewable one-year agreements with Ingram Micro, Tech Data, Arrow and certain other large distributors, these contracts are subject to termination at any time. We cannot assure you that any of these distributors will continue to place orders with us, that orders will continue at the levels of previous periods, or that we will be able to obtain large orders from new distributors or resellers. We also anticipate that sales of our solutions to certain enterprise customers will account for an increasing portion of our revenue. We cannot assure you that sales to enterprise customers will materialize at anticipated levels. The financial turmoil impacting the banking systems and financial markets worldwide may continue to result in tight credit markets. The lowering of the level of liquidity in the credit markets may impact the ability of our distributors to obtain credit to finance purchases of our products and services. If any of the foregoing should occur, our rate of revenue growth will suffer, our revenue may decline and our business will be adversely affected.
In
addition, Ingram Micro, Tech Data, and Arrow represented the following dollar
amount and percentages of our accounts receivable balance (in millions, except
for percentages):
|
December
31,
|
||||||||||||||||||||||||
|
2009
|
2008
|
2007
|
||||||||||||||||||||||
|
Ingram
Micro
|
$5.5M
|
22%
|
$2.5M
|
12%
|
$3.6M
|
14%
|
||||||||||||||||||
|
Tech
Data
|
$1.6M
|
6%
|
$2.0M
|
10%
|
$3.1M
|
12%
|
||||||||||||||||||
|
Arrow
|
$0.9M
|
4%
|
$2.8M
|
13%
|
$1.1M
|
4%
|
||||||||||||||||||
In the
event the liquidity of our distributors or enterprise customers is adversely
impacted by uncertainties in the financial markets, they may be unable to pay us
in a timely manner. The failure to receive timely payment from our distributors
or enterprise customers could adversely affect our balance sheet, our results of
operations and our creditworthiness.
If
we are unable to compete successfully in the highly competitive market for
Internet security products, software, and services, our business could be
adversely affected.
The
market for Internet security products, software, and services is global and
highly competitive. Competition in markets in which we compete
continues to increase, and we expect competition to intensify in the
future. There are few substantial barriers to entry and additional
competition from existing competitors and new market entrants will likely occur
in the future. Current and potential competitors in our markets
include, but are not limited to, Check Point, Microsoft, Symantec, Cisco
Systems, Lucent Technologies, Nokia, Fortinet, WatchGuard Technologies,
Barracuda Networks, and Juniper Networks, all of which sell worldwide or have a
presence in most of the major markets for such products.
Competitors
to date have generally targeted the security needs of enterprises of every size
with firewall and VPN products that range in price starting from below $300 to
more than $100,000. We may experience increased competitive pressure for some of
our products, software, and services. This increased competitive
pressure may result in both lower prices and gross profits. Many of
our current or potential competitors have longer operating histories, greater
name recognition, larger customer bases, and significantly greater financial,
technical, marketing, and other resources than we do. Some of our
competitors focus all of their attention on a single market area rather than
offering a comprehensive suite of security solutions and services. In
addition, our competitors may bundle products, software and services that are
competitive to ours with other products, software and services that they may
sell to our current or potential customers. These customers may
accept these bundled offerings rather than separately purchasing our
offerings. If any of the foregoing were to occur, our business could
be adversely affected.
The
current global economic slowdown can adversely affect our revenue, results of
operations and overall financial strength.
The
continuing global economic slowdown and the uncertainty over its breadth, depth
and duration may continue to have a negative effect on our business. The
shortage of liquidity and credit may result in an extended period of slow
economic growth in the United States and worldwide. Governments have taken
unprecedented actions intended to stimulate economic growth. There can be no
assurance that these macro economic conditions will not impair our operating
results. If conditions in the global economy, United States economy
or other key vertical or geographic markets remain uncertain or weaken further,
we could experience material adverse impacts on our business, overall financial
condition, results of operations, cash flow, capital resources and
liquidity.
Difficulty
predicting our future operating results or profitability due to volatility in
general economic conditions and in the security, productivity, mobility, and
data protection markets may
result in a misallocation in spending, and a shortfall in revenue which would
harm our operating results.
Changes
in general economic conditions and the volatility in the demand for network
security, content security, and business continuity solutions are two of the
many factors underlying our inability to predict our revenue for a given
period. Our operating results may be affected by uncertain or
changing economic conditions impacting particular customer and geographic
segments of our business. A large proportion of our expenses for
product development, sales and marketing are fixed for a particular quarter or
year, and therefore, we may be unable to implement an immediate decrease in our
spending in time to compensate for any unexpected quarterly or annual shortfall
in revenue. As a result, any shortfall in revenue would likely
adversely affect our operating results. For the year ended December
31, 2009, we reported a net income of $13.2 million. For the year ended December
31, 2008, we reported a net income of $4.9 million. For the year
ended December 31, 2007, we reported a net income of $28.6
million. Our accumulated deficit as of December 31, 2009 is $108.1
million. We do not know if we will be able to sustain profitability
in the future.
The
selling prices of our solution offerings may decrease, which may reduce our
gross profits.
The
average selling prices for our solution offerings may decline as a result of
competitive pricing pressures, an overall reduction in demand for our products
and services, a change in our mix of products, software, and services,
anticipation of introduction of new functionality in our products or software,
promotional programs and customers who negotiate price reductions in exchange
for longer-term purchase commitments. In addition, competition
continues to increase in the market segments in which we participate and we
expect competition to further increase in the future, thereby leading to
increased pricing pressures. Furthermore, we anticipate that the
average selling prices and gross profits for our products will decrease over
product life cycles. We cannot assure you that we will be successful
in developing and introducing new offerings with enhanced functionality on a
timely basis, or that our product, software and service offerings, if
introduced, will enable us to maintain our prices and gross profits at current
levels. If the price of individual products, software, or services
decline or if the price of our solution offerings decline, our overall revenue
may decline and our operating results may be adversely affected.
We
offer retroactive price protection to our major distributors and if we fail to
balance their inventory with end- user demand for our products, our allowance
for price protection may be inadequate. This could adversely affect
our results of operations.
We
provide our major distributors with price protection rights for inventories of
our products held by them. If we reduce the list price of our
products, our major distributors receive refunds or credits from us that reduce
the price of such products held in their inventory based upon the new list
price. As of December 31, 2009, we estimated that approximately $24.0
million of our products in our distributors’ inventory were subject to price
protection. We have issued credits of approximately $646,000,
$1,040,000, and $494,000 under our price protection policies in 2009, 2008, and
2007, respectively. Future credits for price protection will depend
on the percentage of our price reductions for the products in inventory and our
ability to manage the level of our major distributors’ inventory. If
future price protection adjustments are higher than expected, our future results
of operations could be materially adversely affected.
We
are dependent on international sales for a substantial amount of our
revenue. We face the risk of international business and associated
currency fluctuations, which might adversely affect our operating
results.
International
revenue represented 33%, 34%, and 32% of total revenue in 2009, 2008, and 2007,
respectively. We expect that international revenue will continue to
represent a substantial portion of our total revenue in the foreseeable
future. Our performance depends significantly on worldwide economic
conditions. Our risks of doing business abroad include the impact of
global economic conditions on the demand for our products and services, the
ability of our international channel partners to pay us in a timely fashion, the
ability of our international channel partners to obtain credit to finance
purchases of our products and services, and our ability to structure our
distribution relationships in a manner consistent with marketplace requirements
and on favorable terms. Our sales are denominated in U.S. dollars. As
a result, the strengthening of the U.S. dollar against a local foreign currency
will increase the price of our products, software, and services in such country
and may reduce our sales by making our products, software, and services more
expensive in the local currency. A weakened dollar could increase the
cost of local operating expenses and procurement of raw materials. We
are subject to other risks of operating a global business, including potential
foreign government regulation of our technology, geopolitical risks
associated
with political and economic instability, changes in diplomatic and trade
relationships, and changes in foreign countries’ laws affecting such areas as
employment relationships, environmental and safety regulation, intellectual
property protection and the Internet generally.
Delays
in deliveries from our suppliers could cause our revenue to decline and
adversely affect our results of operations.
Our
products incorporate certain components, component subassemblies, or
technologies, including our highly integrated system-on-a-chip architecture,
that are available from single or limited sources of
supply. Specifically, our products rely upon components from
companies such as Intel, Cavium, and Marvell. We do not have long-term supply
arrangements with any vendor, and any disruption in the supply of these products
or technologies may adversely affect our ability to obtain necessary components
or technology for our products. If this were to happen, our product
shipments may be delayed and business lost, resulting in a decline in
sales. In addition, our products utilize components that have in the
past been subject to market shortages and price fluctuations. If we
experience price increases in our product components, we will experience
declines in our gross profit.
We
license intellectual property, including certain databases and software, and if
our licensors experience delays in product updates or provide us with products
of substandard quality, the revenue we receive from our products and services
that use this intellectual property would be at risk.
We have
agreements to license intellectual property, including databases and software,
which we incorporate as part of certain of our products and
services. Licensors of such databases and software may fail to
provide us with updated products or may experience delays in providing us with
updated products. In addition, our licensors may provide us with
products of substandard quality. If either of these events happens,
we may be unable to provide our customers with the appropriate level of
functionality in our solution offerings. In that event, our customers
may purchase similar offerings from one of our competitors, or sales to our
customers may be delayed. In either case, our revenue would be
adversely affected.
We
rely primarily on contract manufacturers for our product manufacturing and
assembly, and if these operations are disrupted for any reason, we may not be
able to ship our products.
We
currently outsource our hardware manufacturing and assembly to contract
manufacturers in the U.S. and Taiwan. Typically, the agreement with our contract
manufacturers specify an initial term of one (1) year with automatic yearly
renewal terms unless terminated by either party upon 90 days prior written
notice. Our operations could be disrupted if we have to switch to a
replacement vendor or if our hardware supply is interrupted for any
reason. In addition, we provide forecasts of our demand to our
contract manufacturers nine months prior to scheduled delivery of products to
our customers. If we overestimate our requirements, our contract
manufacturers may have excess inventory, which would increase our
costs. If we underestimate our requirements, our contract
manufacturers may have an inadequate component inventory, which could interrupt
manufacturing of our products and result in delays in shipments and
revenue. In addition, lead times for materials and components that we
order vary significantly and depend on factors such as the specific supplier,
contract terms and demand for each component at a given
time. Liquidity or other financial problems of our contract
manufacturers or reservation of manufacturing capacity by other companies,
inside or outside of our industry, could either limit supply or increase
costs. We may also experience shortages of components from time to
time, which also could delay the manufacturing of our products. If
any of the foregoing occurs we could lose customer orders and revenue could
decline.
Sales of our
solutions may be adversely affected by various factors which would adversely
affect our revenue.
Sales of
our solutions may be adversely affected in the future by changes in the
geopolitical environment including the financial stability of our customers and
supply chain; sales and implementation cycles; changes in our product mix;
structural variations in sales channels; ability of our channel to absorb new
product, software and service introductions; ability of our sales organization
to sell into enterprise level accounts; acceptance of our solutions in the
market place; and changes in our supply chain model. These changes may result in
corresponding variations in order backlog. A variation in backlog
levels could result in less predictability in our quarter-to-quarter net sales
and operating results. Sales may also be adversely affected by
fluctuations in demand, price and product competition in the markets we service,
introduction and market acceptance of new technologies and new product, software
or service offerings, and financial difficulties experienced by our
distributors, resellers or end-users. We may, from time to time, experience
manufacturing issues that create a delay in our suppliers’ ability to provide
specific components resulting in delayed shipments. To the extent
that manufacturing issues and any related component shortages result in delayed
shipments in the future, and particularly in periods when we and
our
suppliers
are operating at higher levels of capacity, it is possible that revenue could be
adversely affected for a quarter or longer.
The
failure to successfully conduct offshore activities could adversely affect
results of operations.
To better
align our costs with market conditions, increase its presence in growing
markets, and enhance productivity and operational efficiency, we conduct
engineering, development and certain technical support activities in the United
Kingdom, India and China. We have undertaken a transition of certain
technical support activities to facilities located in India and United
Kingdom. In addition, we conduct certain engineering and development
activities in Shanghai, China. As part of these offshore activities
we have established a corporate presence and have hired employees in the United
Kingdom, India and China, entered into a long-term lease for facilities to
support these offshore efforts. If we are unable to effectively
develop and implement our offshore strategies, including the ability to recruit
or retain qualified technical personnel, or are unable to build the necessary
corporate infrastructure in a timely and efficient manner, or are unable to
effectively integrate certain technical support and engineering functions, the
costs associated with the these offshore activities may be greater than
anticipated and we may not realize anticipated productivity improvements and may
experience other operational difficulties, and or all of which could materially
and adversely affect our business, financial condition and results of
operations.
Environmental
and safety regulations enacted in various jurisdictions in which we do business
may increase the component costs of our products and if we experience delays in
shipment of compliant products our revenue would decline and our operating
results would be adversely affected.
We are
subject to environmental and safety regulations in connection with out global
business operations, including but not limited to regulations relating to the
development, manufacture, and use of its products and, the safe use of
chemicals, and recycling and disposal of material used in its
products. Various jurisdictions in which we do business are
implementing environmental and safety directives that impact manufacturers doing
business in those jurisdictions. The disparities between the
regulatory frameworks adopted create uncertainty over the applicability, scope,
and form of the regulations affecting our products and the timing for compliance
with the applicable regulations. Our inability to comply with
applicable environmental and safety regulations in a timely fashion may subject
us to fines and penalties levied by appropriate regulatory
authorities. Certain of these regulations may necessitate changes to
the components used in our products which could result in an increase in product
cost and a decrease in our gross profit. Further, while we and our
contract manufacturers constantly review environmental and safety regulations in
the jurisdictions in which we do business, the timetable for implementation of
these regulations may result in delays in our ability to provide compliant
products in a timely manner to those markets which would cause our revenues to
decline and our operating results to be adversely affected.
If
we fail to maintain an effective system of internal controls, we may not be able
to accurately report our financial results. As a result, current and
potential shareholders could lose confidence in our financial reporting which
would harm our business and the trading price of our stock.
Section
404 of the Sarbanes-Oxley Act of 2002 requires our management to report on, and
our independent registered public accounting firm to attest to, the
effectiveness of our internal control over financial reporting. We
have an ongoing program to perform the system and process evaluation and testing
necessary to comply with these requirements. We have incurred
considerable expense and have devoted additional management resources to on
going Section 404 compliance activity. Effective internal controls
are necessary for us to provide reliable financial reports. If we
cannot provide reliable financial reports, our business and operating results
could be harmed.
Acquisitions
could be difficult to integrate, disrupt our business, dilute shareholder value
and the products and services acquired may not be accepted by the market. As
a result, our operating results would be adversely affected.
We are
continually reviewing the market for possible corporate opportunities and we may
announce acquisitions or investments in other companies, products, or
technologies in the future. As part of each transaction, we will be required to
integrate operations, train, retain, and motivate the personnel of these
entities. We may be unable to maintain uniform standards, controls, information
technology systems, procedures and policies across our entire enterprise and if
the products and services released as a result of these acquisitions experience
quality problems or are otherwise not accepted by the market, we may suffer a
loss of confidence by our distributors, resellers and end users and sales of
these products and services will not meet expectations. As a consequence, these
acquisitions may cause disruptions in our operations and divert
management’s
attention from day-to-day operations, which could impair our relationships with
our current employees, customers, and strategic partners.
We may
have to incur debt or issue equity securities to pay for any future
acquisitions. The issuance of equity securities for any acquisition could be
substantially dilutive to our shareholders. In addition, due to acquisitions
made in the past, our profitability has suffered because of acquisition-related
costs, amortization costs, and impairment losses for acquired goodwill and other
intangible assets.
We
cannot be certain that our internal controls over financial reporting will be
effective or sufficient when tested by increased scale of growth or the impact
of acquisitions.
It may be
difficult to design and implement effective internal controls over financial
reporting for combined operations and differences in existing controls of
acquired businesses may result in weaknesses that require remediation when
internal controls over financial reporting are combined. Our ability
to manage our operations and growth will require us to improve our operations,
financial and management controls, as well as our internal reporting systems and
controls. We may not be able to implement improvements to our
internal reporting systems and controls in an efficient and timely manner and
may discover deficiencies and weaknesses in existing systems and controls
especially when such systems and controls are tested by increased scale of
growth or the impact of acquisitions.
Our
Financial Statements could be affected by the need to restate previously issued
annual or interim financial statements.
In the
event an error in our financial statements requires us to report that previously
reported financial statements should no longer be relied upon, amended financial
statements for such previously reported periods would be required. In
such an event, we may be unable to file our current interim or annual reports
with the Securities and Exchange Commission in a timely fashion and may be
subject to delisting by the NASDAQ Global Market. Furthermore, we may
be unable to certify the adequacy of our internal controls over financial
reporting and our independent registered public accounting firm may be unable to
attest thereto. In such circumstances, investors could lose
confidence in our internal controls over financial reporting, our disclosure
controls, and the reliability of our financial statements, which could result in
a decrease in the value of our common stock and could cause serious harm to our
business, financial condition, and results of operations.
Changes
in our effective tax rate or tax liability may have an adverse effect on our
results of operations.
As a
global company, we are subject to taxation in the United States and various
other countries. Significant judgment is required to determine and
estimate worldwide tax liabilities. Our future effective tax rates
may be adversely affected by a number of factors including changes in the
valuation of our deferred tax assets; our ability to use net operating losses of
acquired companies to the fullest extent; increases in expenses not deductible
for tax purposes, including write-offs of acquired in-process research and
development and impairment of goodwill in connection with acquisitions; changes
in share-based compensation expense; and changes in tax laws in the countries in
which we operate or the interpretation of such tax laws and changes in generally
accepted accounting principles. Any significant change in our future effective
tax rates could adversely impact our consolidated financial position, results of
operations, and cash flows.
If
our estimates or judgments relating to our critical accounting
policies based on assumptions change or prove to be incorrect, our
operating results could fall below expectations of securities analysts and
investors, resulting in a decline in our stock price.
Our
discussion and analysis of financial condition and results of operations in this
report is based on our consolidated financial statements, which have been
prepared in accordance with accounting principles generally accepted in the
United States. The preparation of financial statements in conformity
with generally accepted accounting principles requires management to make
estimates and assumptions that affect the amounts reported in the consolidated
financial statements and accompanying notes. On an ongoing basis, we
evaluate significant estimates used in preparing our financial statements,
including those related to: the valuation and recognition of investments, the
valuation of the revenue and accounts receivable, the valuation of inventory,
the assessment of recoverability of intangible assets and their estimated useful
lives, the valuation and recognition of stock based compensation and the
recognition and measurement of current and deferred income tax assets and
liabilities.
We base
our estimates on historical experience and on various other assumptions that we
believe to be reasonable under the circumstances, as provided in our discussion
and analysis of financial condition and results of operations in this annual
report, the results of which form the basis for making judgments about the
carrying values of assets and liabilities that are not readily apparent from
other sources. The current volatility in the financial markets and
overall economic uncertainty increases the risk that actual amounts realized
from the sale or exchange of certain of our financial instruments may differ
significantly from those in our assumptions. In any such case, our
operating results could fall below the expectations of securities analysts and
investors, resulting in a decline in our stock price.
Changes
to our senior management may have an adverse effect on our ability to execute
our business strategy.
Our
future success will depend largely on the efforts and abilities of our senior
management to execute our business plan. Changes in our senior
management and any future departures of key employees may be disruptive to our
business and may adversely affect our operations. Experienced senior management
in the technology industry is in high demand and competition for their talents
is intense, especially in Silicon Valley, where many of our senior management
reside. Historically, we have relied on equity awards in the form of stock
options as one means of recruiting and retaining senior management. If the
quantity of equity awards we are able to make to our senior management under our
equity plans falls below what is available to our senior management from other
potential employers or if a stock option’s exercise price exceeds the underlying
stock’s market value, the effectiveness of our equity awards as a means for
retaining senior management will lessen.
Our
ability to attract, retain, and motivate key qualified employees is vital to our
success.
Our
success depends in part on our ability to attract, retain, and motivate key
engineering, operations, finance, information systems, customer support, and
sales and marketing personnel. Our employees may leave us at any
time, and we have continuing challenges in retaining employees from acquired
companies. The loss of services of any of our key personnel, the
inability to attract, retain, and motivate qualified personnel in the future, or
delays in hiring required personnel, particularly engineering and sales
personnel, could delay the development and introduction of, and negatively
impact our ability to sell our products, software and
services. Historically, we have relied on equity awards in the form
of stock options as one means of recruiting and retaining key employees. If the
quantity of equity awards we are able to make to our key employees under our
equity plans falls below what is available to our key employees from other
potential employers or if a stock option’s exercise price exceeds the underlying
stock’s market value, the effectiveness of our equity awards as a means of
retaining key employees will lessen. If we are not successful in attracting,
retaining, and motivating key employees, our ability to capitalize on our
business opportunities and our operating results may be materially and adversely
affected.
We may be unable
to adequately protect our intellectual property proprietary rights, which may
limit our ability to compete effectively.
We
currently rely on a combination of patent, trademark, copyright, and trade
secret laws, confidentiality provisions and other contractual provisions to
protect our intellectual property. Our intellectual property program
consists of an on-going patent disclosure and application process, the purchase
of intellectual property assets including intellectual property assets from
acquisition activity, and the licensing of intellectual property from
others. We plan to continue our aggressive plan to build our
intellectual property portfolio. Despite our efforts to protect our
intellectual property, unauthorized parties may misappropriate or infringe our
intellectual property. We plan to aggressively pursue any such
misappropriation or infringement of our intellectual property. Our
patent applications may not result in the issuance of any
patents. Even if we obtain the patents we are seeking, that will not
guarantee that our patent rights will be valuable, create a competitive barrier,
or will be free from infringement. Furthermore, if any patent is
issued, it might be invalidated or circumvented or otherwise fail to provide us
any meaningful protection. We face additional risk of adequately
protecting our intellectual property when conducting business in countries that
have poorly developed or inadequately enforced intellectual property
laws. In addition, competitors may independently develop similar or
superior technologies or duplicate the technologies we have developed, which
could substantially limit the value of our intellectual property.
Potential
intellectual property claims and litigation could subject us to significant
liability for damages and invalidation of our proprietary rights.
Litigation
over intellectual property rights is not uncommon in our industry. We
face infringement claims from third parties. We may have to resort to litigation
to protect our intellectual property rights. We expect that
infringement or
misappropriation
claims will be more frequent as the number of products, feature sets in software
and services, and the number of competitors grows in the market segments in
which we do business. Any litigation, regardless of its success, is
costly and requires significant time and attention of our key management and
technical personnel. An adverse result in litigation could also force
us to:
|
·
|
stop
or delay selling, incorporating or using products that incorporate the
challenged intellectual property;
|
|
·
|
pay
damages;
|
|
·
|
enter
into licensing or royalty agreements, which may be unavailable on
acceptable terms; or
|
|
·
|
redesign
products or services that incorporate infringing
technology.
|
If any of
the above occurs, our revenue could decline and our business could
suffer.
We
have been named as defendant in litigation matters that could subject us to
liability for significant damages.
We are a
defendant in on-going litigation matters. No estimate can be made of
the possible loss or possible range of loss, if any, associated with the
resolution of these litigation matters. Failure to prevail in these
matters could have a material adverse effect on our consolidated financial
position, results of operations, and cash flows in the future.
In
addition, the results of litigation are uncertain and the litigation process may
utilize a significant portion of our cash resources and divert management’s
attention from the day-to-day operations, all of which could harm our
business.
Any
alleged or actual failure of our products, software or services to operate as
warranted may require us to defend product liability or breach of warranty
claims.
Our
products, software, and services provide network security, business continuity
and content security. Networks protected by our products, software
and services may be vulnerable to electronic break-ins. Because the
techniques used by computer hackers to access or sabotage networks change
frequently and generally are not recognized until launched against a target, we
may be unable to anticipate these techniques. If a third party were
able to successfully overcome our security measures, such a person or entity
could misappropriate customer data, third party data stored by our customers and
other information, including intellectual property. In addition, the
operations of our end user customers may be interrupted. If that
happens, affected end-users or others may file actions against us alleging
product liability, tort, or breach of warranty claims. Although we
attempt to reduce the risk of losses from claims through contractual warranty
disclaimers and liability limitations, these provisions may not be
enforceable. Some courts, for example, have found contractual
limitations of liability in standard computer and software contracts to be
unenforceable in some circumstances. Defending a lawsuit, regardless
of its merit, could be costly and could divert management
attention. Although we currently maintain business liability
insurance, this coverage may be inadequate or may be unavailable in the future
on acceptable terms, if at all. In addition, the market perception of
our products, software, and services would likely be adversely affected which
could cause us to lose current and potential customers, resellers, distributors
or other business partners. If any of the above occurs, our revenue
could decline and our business would suffer.
A
security breach of our internal systems could harm our business.
Because
we provide Internet security, we may be a more attractive target for attacks by
computer hackers. We will not succeed unless the marketplace is
confident that we provide effective Internet security
protection. Although we have not experienced significant damages from
acts of sabotage or unauthorized access by a third party of our internal
network, if an actual or perceived breach of Internet security occurs in our
internal systems it could adversely affect the market perception of our
products, software and services. In addition, such a security breach
may impact the ability of our company to operate, including the ability to
adequately support our customers. If this happens, our revenue could
decline and our business could suffer.
If
our solutions do not interoperate with our end customers’ networks,
installations could be delayed or cancelled, which could significantly reduce
our revenue.
Our
solutions are designed to interface with existing networks of our end-users,
each of which have different specifications and utilize multiple protocol
standards. Many of the networks of our end-user’s contain multiple
generations of products that have been added over time as these networks have
grown and evolved. Our solutions must interoperate with the products
within these networks as well as with future products that might be added to
these networks in order to meet the requirements of our end-users. If
we find errors in the existing software used in the networks of our end-users,
we may elect to modify our software to fix or overcome these errors so that our
solutions will interoperate and scale with their existing software and
hardware. If our solutions do not interoperate properly,
installations could be delayed or orders for our solutions could be cancelled,
which could significantly reduce our revenue.
Product
errors or defects could result in loss of revenue, delayed market acceptance,
and claims against us.
We offer
one and two year warranty periods on our products. During the
warranty period end users may receive a refurbished or replacement product for
any defective unit subject to completion of certain procedural
requirements. Our products may contain undetected errors or
defects. If there is a product failure, we may have to replace all
affected products without being able to record revenue for the replacement
units, or we may have to refund the purchase price for such units if the defect
cannot be resolved. Despite extensive testing, some errors are
discovered only after a product has been installed and used by
customers. Any errors discovered after commercial release could
result in loss of revenue and an increase in warranty related claims against
us. Such product defects can negatively impact our products’
reputation and result in reduced sales.
Industry
consolidation may lead to increased competition and may harm our operating
results.
There has
been a trend toward industry consolidation in our market. We expect
this trend toward industry consolidation to continue as companies attempt to
strengthen or hold their market positions in an evolving industry and as
companies are acquired or are unable to continue operations. We
believe that industry consolidation may result in stronger competitors that are
better able to compete with us. This could lead to more variability
in operating results and could have a material adverse effect on our business,
operating results, and financial condition.
If
we are unable to meet our future capital requirements, our business will be
harmed.
We expect
our cash on hand, cash equivalents and short-term investments to meet our
working capital and capital expenditure needs for at least the next twelve
months. However, at any time, we may decide to raise additional
capital to take advantage of strategic opportunities available or attractive
financing terms. If we issue equity securities, shareholders may
experience additional dilution or the new equity securities may have rights,
preferences, or privileges senior to those of existing holders of common
stock. If we cannot raise funds, if needed, on acceptable terms, we
may not be able to develop or enhance our products, software or services, take
advantage of future opportunities, or respond to competitive pressures or
unanticipated requirements, which could have a material adverse effect on our
business, operating results, and financial condition.
Governmental
regulations of imports or exports affecting Internet security could affect our
revenue.
Any
additional governmental regulation of imports or exports or failure to obtain
required export approval of our encryption technologies could adversely affect
our international and domestic sales. The United States and various
foreign governments have imposed controls, export license requirements, and
restrictions on the import or export of some technologies, especially encryption
technology. In addition, from time to time, governmental agencies
have proposed additional regulation of encryption technology, such as requiring
the escrow and governmental recovery of private encryption keys. In
response to terrorist activity, governments could enact additional regulation or
restriction on the use, import, or export of encryption
technology. This additional regulation of encryption technology could
delay or prevent the acceptance and use of encryption products and public
networks for secure communications resulting in decreased demand for our
products and services. In addition, some foreign competitors are
subject to less stringent controls on exporting their encryption
technologies. As a result, they may be able to compete more
effectively than we can in the United States and the international Internet
security market.
Our
stock price may be volatile.
The
market price of our common stock has been highly volatile and has fluctuated
significantly in the past. We believe that it may continue to
fluctuate significantly in the future in response to the following factors, some
of which are beyond our control:
|
·
|
general
economic conditions and the effect that such conditions have upon
customers’ purchasing decisions;
|
|
·
|
variations
in quarterly operating results;
|
|
·
|
changes
in financial estimates by securities
analysts;
|
|
·
|
changes
in market valuations of technology and Internet infrastructure
companies;
|
|
·
|
announcements
by us of significant contracts, acquisitions, strategic partnerships,
joint ventures or capital
commitments;
|
|
·
|
the
accretive or dilutive effects of acquisitions on operating
results;
|
|
·
|
loss
of a major client or failure to complete significant license
transactions;
|
|
·
|
additions
or departures of key personnel;
|
|
·
|
our
ability to remediate material weaknesses and/or significant deficiencies,
if any, in internal controls over financial reporting in an effective and
timely manner;
|
|
·
|
receipt
of an adverse or qualified opinion from our independent auditors regarding
our internal controls over financial
reporting;
|
|
·
|
sales
of common stock in the future; and
|
|
·
|
fluctuations
in stock market price and volume, which are particularly common among
highly volatile securities of Internet-related
companies.
|
The
long sales and implementation cycles for our solutions may cause revenue and
operating results to vary significantly.
The
decision of an end-user to purchase our solutions often involves a significant
commitment of resources and a lengthy evaluation and qualification
process. Throughout the sales cycle, we often spend considerable time
educating our channel partners and providing information for prospective
end-users regarding the use and benefits of our products, software, and
services. Budget constraints, the availability of credit, and the
need for multiple approvals within enterprises, carriers, and government
entities may delay purchase decisions. Failure to obtain the required
approval for a particular project or purchase decision may delay the purchase of
our solutions from our channel partners. As a result, the sales cycle
for our security solutions could be longer than 90 days.
Even
after making the decision to purchase our solutions end-users may not deploy
these solutions broadly within their networks. The timing of
implementation can vary widely and depends on the skill set of the end-user, the
size of the network deployment, the complexity of the network environment, and
the degree of specialized hardware and software configuration necessary to
deploy. End-users with large networks usually expand their networks
in large increments on a periodic basis. Large deployments and
purchases of our security solutions also require a significant outlay of capital
by the end-user. If the deployment of our solutions in these complex
network environments is slower than expected, sales through our distributors to
our resellers would slow, our revenue could be below our expectations, and our
operating results could be adversely affected.
The
inability to obtain any third-party license required to developing new products
or software or enhancements to our products or software could require us to
obtain substitute technology of lower quality or performance standards or at
greater cost, which could seriously harm our business, financial condition, and
results of operations.
We
license intellectual property from third parties to develop new products or
software or enhancements to existing products or
software. Third-party licenses may not be available to us on
commercially reasonable terms or at all. The inability to obtain
third-party licenses required developing new products or software or
enhancements to existing products or software could require us to obtain
substitute technology of lower quality or performance standards or at greater
cost, any of which could seriously harm our business, financial condition, and
results of operations.
Seasonality
and concentration of revenue at the end of the quarter could cause our revenue
to fall below the expectations of securities analysts and investors, resulting
in a decline in our stock price.
The rate
of our domestic and international sales has been and may continue to be lower in
the summer months or be adversely affected by other seasonal factors, both
domestically and internationally. During these periods, businesses
often defer purchasing decisions. As a result of customer buying
patterns and the efforts of our sales force to meet or exceed quarterly and
year-end quotas, we have historically received a substantial portion
of a quarter’s sales orders and earned a substantial portion of a quarter’s
revenue during our last month of each quarter. If expected revenue at
the end of any quarter is delayed, our revenue for that quarter could fall below
the expectations of securities analysts and investors, resulting in a decline in
our stock price.
Our
business is especially subject to the risks of earthquakes, floods and other
natural catastrophic events, and to interruption by manmade problems such as
computer viruses or terrorism.
Our
corporate headquarters, including certain of our research and development
operations and some of our contract manufacturer’s facilities, are located in
the Silicon Valley area of Northern California, a region known for seismic
activity. Additionally, certain of our facilities, which including
contracted manufacturing facilities, are located in areas that are subject to
typhoons and other natural disasters. A significant natural disaster,
such as an earthquake or a flood, could have a material adverse impact on our
business, operating results, and financial condition. In addition,
despite our implementation of network security measures, our servers are
vulnerable to computer viruses, break-ins, and similar disruptions from
unauthorized tampering with our computer systems. Any such event
could have a material adverse effect on our business, operating results, and
financial condition. In addition, the effects of war or acts of
terrorism could have a material adverse effect on our business, operating
results, and financial condition. The continued threat of terrorism
and heightened security and military action in response to this threat, or any
future acts of terrorism, may cause further disruptions to these economies and
create further uncertainties. To the extent that such disruptions or
uncertainties result in delays, curtailment or cancellations of customer orders,
or the manufacture or shipment of our products, our revenue, gross profits and
operating profits may decline and we may not achieve our financial goals and
achieve or maintain profitability.
We
face risks associated with changes in telecommunications regulation and
tariffs.
Changes
in telecommunications requirements in the United States or other countries could
affect the sales of our products. We believe it is possible that
there may be changes in U.S. telecommunications regulations in the future that
could slow the expansion of the service providers’ network infrastructures and
materially adversely affect our business, operating results, and financial
condition. Future changes in tariffs by regulatory agencies or
application of tariff requirements to currently untariffed services could affect
the sales of our products for certain classes of
customers. Additionally, in the United States, our products must
comply with various Federal Communications Commission requirements and
regulations. In countries outside of the United States, our products
must meet various requirements of local telecommunications
authorities. Changes in tariffs or failure by us to obtain timely
approval of products could have a material adverse effect on our business,
operating results, and financial condition.
Due
to the global nature of our business, economic or social conditions or changes
in a particular country or region could adversely affect our sales or increase
our costs and expenses, which would have a material adverse impact on our
financial condition.
We
conduct significant sales, research and development, and customer support
operations in countries outside of the United States. Accordingly,
our future results could be materially adversely affected by a variety of
uncontrollable and changing
factors
including, among others, political or social unrest or economic instability or
terrorist activity in a specific country or region; macro economic conditions
adversely affecting geographies where we do business; trade protection measures;
environmental and safety directives and other regulatory requirements which may
affect our ability to import or export our products from various countries;
government spending patterns affected by political considerations; and
difficulties in staffing and managing international operations. Any or all of
these factors could have a material adverse impact on our revenue, costs,
expenses, and financial condition.
We
are exposed to various risks associated with the credit and capital
markets.
Included
within our investment portfolio at December 31, 2009 were auction rate
securities (ARS) and asset backed securities (ABS). In connection
with the liquidity issues experienced in the global credit and capital markets,
our ARS and ABS holdings have experienced failed auctions or thinly traded
markets. The Company has recognized unrealized losses in its
consolidated financial statements as of December 31, 2009. If the credit ratings
of these investments continue to deteriorate, the fair value of these securities
may decline further. If uncertainties in the credit and capital
markets continue or if the Company experiences any rating downgrades on any
investments in its portfolio, the Company may incur impairment charges to its
investment portfolio, which would negatively affect our financial condition,
cash flow, and reported earnings.
None.
The
Company leases office space in several U.S. locations including California,
Washington, and Arizona. Additional facilities are leased worldwide under leases
that expire at various dates ranging from 2010 to 2015.
The
Company’s corporate headquarters and executive offices are located in
approximately 72,000 square feet of office space in San Jose, California under a
lease that expires in September 2014. The lease provides for a one
year renewal option. In addition, the Company leases office space of
approximately 32,000 square feet in Tempe, Arizona. The lease term is for
7.5 years and expires in August 2015. The base rent for this lease
escalates annually at 3%.
In July
2007, the Company assumed a five-year lease for approximately 20,000 square feet
of office space located in Seattle, Washington. This lease expires in
February 2012. In September 2008, the Company closed approximately half of its
leased facility and recorded a liability of approximately $0.9 million
equivalent to the net present value of the expected future lease costs, net of
estimated future sublease.
In
February 2008, the Company entered into a lease agreement to lease approximately
36,000 square feet of office space in Bangalore, India to carry out certain
research and development and technical support activities. The lease
term is for a period of five years commencing in March 2008 and requires a lock
in period of 4 years, after which either party to the contract can terminate the
lease with notice duly given. The base rent for this lease escalates
annually at 5%.
In
November 2008, the Company expanded its existing facility in Shanghai, China to
a total of approximately 16,000 square feet of office space to carry out our
research and development activities. The lease term is for a period of three
years and expires in November 2011.
In
December 2009, the Company expanded its existing facility in London, United
Kingdom to a total of approximately 7,000 square feet of office space to carry
out our sales and technical support activities. The lease term will expire in
February 2013.
We
believe that our existing facilities are suitable and adequate for our current
needs and that the capacity of such facilities is substantially being utilized
or we have plans to utilize it.
The
information set forth under Note 11 of the Notes to Consolidated Financial
Statements, included in Part II, Item 8 of this Form 10-K, is incorporated
herein by reference. For an additional discussion of certain risks associated
with legal proceedings, see the section entitled “Risk Factors” in Part I, Item
1A of this Form 10-K.
None.
PART
II
Price
Range of Common Stock
Our
common stock commenced trading on the NASDAQ Global Market on November 11, 1999
and is traded under the symbol “SNWL”. As of December 31, 2009, there
were approximately 83 shareholders of record of the common stock. The
high and low sale prices for the common stock as reported on the NASDAQ Global
Market were:
|
High
|
Low
|
|||||||
|
Fiscal
2008
|
||||||||
|
First
Quarter
|
$10.91
|
$7.51
|
||||||
|
Second
Quarter
|
$
8.74
|
$6.45
|
||||||
|
Third
Quarter
|
$
6.82
|
$4.78
|
||||||
|
Fourth
Quarter
|
$
5.23
|
$2.90
|
||||||
|
Fiscal
2009
|
||||||||
|
First
Quarter
|
$
4.88
|
$3.38
|
||||||
|
Second
Quarter
|
$
6.07
|
$4.32
|
||||||
|
Third
Quarter
|
$
8.53
|
$5.34
|
||||||
|
Fourth
Quarter
|
$
8.80
|
$7.32
|
||||||
Dividend
Policy
We have
never paid a cash dividend on our capital stock. We currently
anticipate that we will retain all available funds, for use in our business and
we do not currently anticipate paying any cash dividends.
Stock
Performance Graph
Below is
a line graph comparing relative performance in the cumulative return to
shareholders of our common stock with the cumulative return on the Nasdaq
Composite Index, Russell 2000 Index and RDG Technology Composite Index over a
60-month period commencing December 31, 2004 and ending on December 31,
2009. This graph assumes the investment of $100 on December 31,
2004 and the reinvestment of dividends, if any, through December 31,
2009.
The
comparisons shown in the graph below are based upon historical
data. We consistently caution that the stock price performance shown
in the graph below is not indicative of, nor intended to forecast, the potential
future performance of our common stock.
COMPARISON OF 5 YEAR CUMULATIVE
TOTAL RETURN*
Among SonicWALL, Inc.
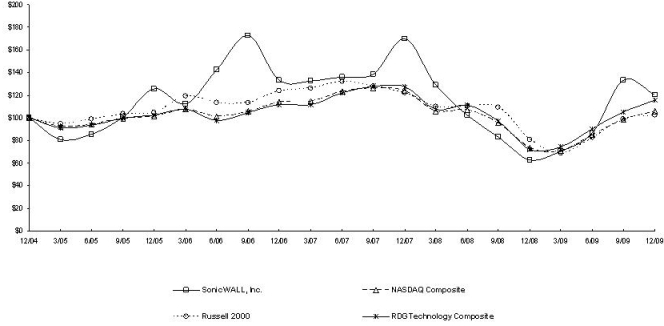
* $100 invested on 12/31/04 in stock or index,
including reinvestment of dividends.
Fiscal year ending December 31.
Recent
Sales of Unregistered Securities
None.
Issuer
Purchases of Equity Securities
None.
The
following selected consolidated financial data should be read in conjunction
with our consolidated financial statements and related notes thereto and
“Management’s Discussion and Analysis of Financial Condition and Results of
Operations” included in this Form 10-K.
|
Year
Ended December 31,
|
||||||||||||||||||||
|
2009
|
2008
|
2007
|
2006
|
2005
|
||||||||||||||||
|
Statements
of Operations Data:
|
(In
thousands, except per share data)
|
|||||||||||||||||||
|
Revenue:
|
||||||||||||||||||||
|
Product
|
$
|
73,847
|
$
|
90,857
|
$
|
98,936
|
$
|
92,797
|
$
|
75,525
|
||||||||||
|
License
and service
|
126,728
|
127,787
|
100,263
|
82,741
|
59,799
|
|||||||||||||||
|
Total
revenue
|
200,575
|
218,644
|
199,199
|
175,538
|
135,324
|
|||||||||||||||
|
Cost
of revenue:
|
||||||||||||||||||||
|
Product
|
39,038
|
43,507
|
40,555
|
39,164
|
27,699
|
|||||||||||||||
|
License
and service
|
15,857
|
20,102
|
15,894
|
12,287
|
8,031
|
|||||||||||||||
|
Amortization
of purchased technology
|
3,017
|
3,017
|
2,232
|
5,387
|
4,552
|
|||||||||||||||
|
Total
cost of revenue
|
57,912
|
66,626
|
58,681
|
56,838
|
40,282
|
|||||||||||||||
|
Gross
profit
|
142,663
|
152,018
|
140,518
|
118,700
|
95,042
|
|||||||||||||||
|
Operating
expenses:
|
||||||||||||||||||||
|
Research
and development
|
37,858
|
44,176
|
39,410
|
33,670
|
22,768
|
|||||||||||||||
|
Sales
and marketing
|
70,000
|
82,348
|
77,741
|
71,256
|
53,403
|
|||||||||||||||
|
General
and administrative
|
17,134
|
18,613
|
21,473
|
20,324
|
15,535
|
|||||||||||||||
|
Amortization
of purchased intangible assets
|
1,095
|
1,114
|
715
|
2,721
|
2,893
|
|||||||||||||||
|
Restructuring
charges
|
-
|
1,683
|
-
|
1,409
|
-
|
|||||||||||||||
|
In-process
research and development
|
-
|
-
|
1,930
|
1,580
|
-
|
|||||||||||||||
|
Total
operating expenses
|
126,087
|
147,934
|
141,269
|
130,960
|
94,599
|
|||||||||||||||
|
Income
(loss) from operations
|
16,576
|
4,084
|
(751
|
)
|
(12,260
|
)
|
443
|
|||||||||||||
|
Interest
income and other expense, net
|
3,164
|
6,368
|
11,771
|
9,713
|
6,867
|
|||||||||||||||
|
Income
(loss) before income taxes
|
19,740
|
10,452
|
11,020
|
(2,547
|
)
|
7,310
|
||||||||||||||
|
Benefit
(provision) for income taxes
|
(6,586
|
)
|
(5,571
|
)
|
17,601
|
(8,206
|
)
|
(1,034
|
)
|
|||||||||||
|
Net
income (loss)
|
$
|
13,154
|
$
|
4,881
|
$
|
28,621
|
$
|
(10,753
|
)
|
$
|
6,276
|
|||||||||
|
Net
income (loss) per share:
|
||||||||||||||||||||
|
Basic
|
$
|
0.24
|
$
|
0.09
|
$
|
0.45
|
$
|
(0.17
|
)
|
$
|
0.10
|
|||||||||
|
Diluted
|
$
|
0.24
|
$
|
0.08
|
$
|
0.43
|
$
|
(0.17
|
)
|
$
|
0.09
|
|||||||||
|
Shares
used in computing net income (loss) per share:
|
||||||||||||||||||||
|
Basic
|
53,914
|
56,069
|
64,305
|
65,117
|
64,684
|
|||||||||||||||
|
Diluted
|
55,568
|
57,897
|
67,099
|
65,117
|
66,797
|
|||||||||||||||
|
As
of December 31,
|
||||||||||||||||||||
|
2009
|
2008
|
2007
|
2006
|
2005
|
||||||||||||||||
|
(In
thousands, except per share data)
|
||||||||||||||||||||
|
Consolidated
Balance Sheet Data:
|
||||||||||||||||||||
|
Cash
and cash equivalents
|
$
|
39,071
|
$
|
45,127
|
$
|
33,324
|
$
|
25,927
|
$
|
42,593
|
||||||||||
|
Short-term
investments
|
161,079
|
60,327
|
195,647
|
209,251
|
197,849
|
|||||||||||||||
|
Total
assets
|
450,557
|
401,836
|
472,635
|
416,291
|
387,683
|
|||||||||||||||
|
Total
shareholders’ equity
|
301,265
|
265,771
|
327,704
|
318,068
|
320,170
|
|||||||||||||||
|
Long-term
liabilities
|
24,920
|
15,072
|
17,495
|
6,269
|
636
|
|||||||||||||||
This Form 10-K contains
forward-looking statements which relate to future events or our future financial
performance. In many cases you can identify forward-looking
statements by terminology such as “may”, “will”, “should,” “expect,” “plan,”
“anticipate,” “believe,” “estimate,” “predict,” “potential,” “intend” or
“continue,” or the negative of such terms and other comparable
terminology. In addition, forward-looking statements in this document
include, but are not limited to, those regarding the dedication of resources to
develop new products and services and marketing those products and services to
channel partners and customers; the introduction of more service offerings on
our platforms as a vehicle to generate additional revenue from our installed
base of products; our ability to deliver comprehensive and profitable solutions
to our channel partners; the growth opportunity associated with sales through
our indirect channel to larger distributed enterprises; weakening economic
conditions that could lead to decreases in IT spending that could adversely
impact operating results; the level of comfort of our channel
partners in offering our solutions to their customers; the growth of the Network
Security, Secure Content Management and Business Continuity markets; the impact
of a failure to achieve greater international sales; our ability to
maintain and enhance current product lines, develop new products, maintain
technological competitiveness and meet the expanding range of customer
requirements; the market opportunity for license and service revenue
growth; our ability to deliver comprehensive solutions to channel
partners, the positive characteristics of our software license and service
revenue model on future revenue growth and the predictability of our revenue
stream; the impact on revenue of the combination of subscription services sold
in conjunction with new product offerings; expected competition in
the Internet security market and our ability to compete in markets in which we
participate; impact of service renewal rates on lowering selling and marketing
expense; our ability to achieve increased incremental revenue per transaction
through success of our software license and service revenue model; the impact of
IT spending on demand for our products and services; the current and
likely future impact of share-based compensation expense on reported operating
results; the impact of
changes in tax laws and rates on the Company’s operating results, cash flows or
financial position; anticipated revenue contributions of new products including
continuous data protection, email security and SSL-VPN products and related
services; the impact of growth in international operations on our exposure to
foreign currency fluctuations; the possible impact of uncertainties in the
auction rate and asset backed securities markets on the Company’s financial
performance; our ability to access funds held as auction rate securities in our
investment portfolio; the impact of significant fluctuations in the exchange
rate of some foreign currencies in relation to the US Dollar; diverging economic
conditions in foreign markets in which we do business; pricing
pressures on our solution based offerings; anticipated higher gross margins
associated with our license and service offerings; the probability of
realization of all deferred tax assets; assessment of future effective tax rates
and the continued need for a partial tax valuation allowance; the expected
impact on reported revenue associated with the adoption of amendments to FASB
605 and FASB ASC 985; the potential for product gross margins to erode based
upon changes in product mix; downward pressure on product pricing or upward
pressure on production costs; the impact of product mix on product gross
profits; the impact of the completion of “in sourcing” certain technical support
functions on period over period comparisons of cost of license and service
revenue and gross margin; the implementation of a second phase of technical
support “in sourcing” activity; our ability to maintain investment in current
and future product development and enhancement efforts; the introduction of new
products and the broadening of existing product offerings; planned investments
and expenses in current and future product development; production costs and
sales volume comparisons between the NSA and SSL-VPN products and other hardware
appliances; the rate of change of general and administrative
expenses; the impact of geopolitical and macro-economic conditions on
demand for our offerings; the ability of our contract manufacturers to meet our
requirements; the belief that existing cash, cash equivalents and short-term
investments will be sufficient to meet our cash requirements at least through
the next twelve months; factors potentially impacting operating cash flows in
future periods; and expected fluctuations in days sales outstanding. These
statements are only predictions, and they are subject to risks and
uncertainties. Our actual results may differ materially from those
anticipated in these forward-looking statements as a result of a variety of
factors, including, but not limited to, those set forth herein under the heading
“Risk Factors”. References to “we,” “our,” and “us” refer to
SonicWALL, Inc. and its subsidiaries.
Overview
SonicWALL
provides network security, secure remote access, content security, and business
continuity solutions for businesses of all sizes. Our solutions are
typically deployed at the edges of networks. These networks are often
aggregated into broader distributed deployments to support companies that do
business in multiple physical locations, interconnect their networks with
trading partners, or support a mobile or remote workforce. Our
solutions are sold in over 50 countries worldwide. Our descriptions
of regions of the world in which we do business specifically excludes Cuba,
Iran, Syria, Sudan and any other country identified by the United States
Government as being state sponsors of terrorism and subject to economic
sanctions or export controls.
The
Company groups revenue into the following primary product categories of similar
products:
|
(1)
|
Unified Threat Management
(“UTM”) including both NSA and TZ products; subscription services
such as Comprehensive Gateway Security Suite, Comprehensive Anti-Spam
Service, integrated Gateway Anti-Virus, and Intrusion Prevention; software
licenses such as our enhanced “SonicOS” operating system, node upgrades,
and other services such as extended warranty and service contracts,
training, consulting and engineering
services.
|
|
(2)
|
Secure Content Management
(“SCM”) including CSM and email security appliances, subscription
services such as internet filtering and email protection term and
perpetual licenses, and other services such as extended warranty and
service contracts, training, consulting and engineering
services.
|
|
(3)
|
SSL VPN Secure Remote Access
(“SSL”) including SSL-VPN appliances, add-on software licenses and
other services such as extended warranty and service contracts, training,
consulting and engineering
services.
|
|
(4)
|
Continuous Data Protection
(“CDP”) including the CDP appliances, off-site data backup
subscription services, site-to-site back-up licenses, and other services
such as extended warranty and service contracts, training, consulting and
engineering services.
|
We
generate revenue within these product categories primarily from the sale of: (1)
products, (2) software licenses, (3) subscriptions for services such as content
filtering, anti-virus protection and intrusion prevention, offsite data backup,
email protection, and (4) other services such as extended warranty and service
contracts, training, consulting and engineering services.
We
currently outsource our hardware manufacturing and assembly to third party
contract manufacturers and some of the key components in the Company’s products
come from a single or limited number of suppliers. Outsourcing our
manufacturing and assembly enables us to reduce fixed overhead and personnel
costs and to provide flexibility in meeting market demand.
We design
and develop the key components for the majority of our products. In
addition, we generally determine the components that are incorporated in our
products and select the appropriate suppliers of these
components. Product testing and burn-in are performed by our contract
manufacturers using tests that we typically specify.
We sell
our solutions primarily through distributors and value-added resellers, who in
turn sell our products to end-users. Some of our resellers are
carriers or service providers who provide solutions to the end-user customers as
managed services. Channel sales accounted for approximately 99%, 99%,
and 98% of total revenue in 2009, 2008, and 2007,
respectively. Ingram Micro, Tech Data, and Arrow, all of whom are
technology product distributors, collectively accounted for approximately 46%,
49%, and 50% of our revenue during 2009, 2008, and 2007,
respectively.
We seek
to provide our channel partners and customers with differentiated solutions that
are innovative, easy to use, reliable, and provide good value. To
support this commitment, we dedicate significant resources to developing new
products and marketing our products to our channel partners and
customers.
Key
Success Factors of our Business
We
believe that there are several key success factors of our business, and that we
create value in our business by focusing on our execution in these
areas.
Channel
Our
distributors and authorized resellers provide a valuable service in assisting
end-users in the design, implementation, and service of our network security,
content security, and business continuity solutions. We support our
distribution and channel partners with sales, marketing, and technical support
to help them create and fulfill demand for our offerings. We also
focus on helping our channel partners succeed with our solutions by
concentrating on comprehensive reseller training and certification, and support
for our channel’s sales activities.
Product
and Service Platform
Our
products serve as a platform for revenue generation for both us and our channel
partners. Most product sales can result in additional revenue through
the simultaneous or subsequent acquisition of software licenses, such as our
Global Management System, or through the sale of additional value-added
subscription services, such as Content Filtering; client
Anti-Virus
and integrated Gateway Anti-Virus; Anti-Spyware and Intrusion Prevention
Services; email protection and off-site data backup.
Distributed
Architecture
Our
security solutions are based on a distributed architecture, which we believe
allows our offerings to be deployed and managed at the most efficient location
in the network. We are providing our customers and their service
providers with mechanisms to enforce the networking and security policies they
have defined for their business. We also use the flexibility of a
distributed architecture to allow us to enable new functionality in
already-deployed platforms through the provisioning of an electronic key, which
may be distributed through the Internet.
Market
Acceptance
We began
offering integrated security appliances in 1997, and since that time we have
shipped over 1.5 million revenue units. Our experience in
serving a broad market and our installed base of customers provides us with
opportunities to sell our new network security, content security, and business
continuity solutions as they become available. The market acceptance
of our current solutions provides our current and prospective channel partners
with an increased level of comfort when deciding to offer our new solutions to
their customers.
Integrated
Design
Our
platforms utilize a highly integrated design in order to improve ease-of-use,
lower acquisition and operational costs for our customers, and enhance
performance. Various models also integrate functionality to support
different internet connection alternatives. Every appliance also
ships with pre-loaded firmware to provide for rapid set up and easy
installation. Each of these tasks can be managed through a simple
web-browser session.
Our
Opportunities, Challenges, and Risks
We serve
substantial markets for network security, content security, and business
continuity. Our goal is to deliver comprehensive and profitable
solutions to our channel partners which address their customers'
needs. We pursue the creation of these solutions through a blend of
organic and inorganic growth strategies including internal development efforts,
licensing and OEM opportunities, and acquisition of other
companies. To the extent that these efforts result in solutions which
fit well with our channel and end-users, we would expect to generate increasing
sales. To the extent that these efforts are not successful, we would
expect to see loss of sales and/or increased expenses without commensurate
return.
International
Growth
We expect
that international revenue will continue to represent a substantial portion of
our total revenue in the foreseeable future. Our percentage of sales
from international territories does not represent the same degree of penetration
of those markets as we have achieved domestically. We believe that a
significant opportunity exists to grow our revenue by increasing our
international penetration rate to match our penetration rate in the domestic
market.
If we
fail to structure our distribution relationships in a manner consistent with
marketplace requirements and on favorable terms, the percentage of sales from
international territories will decline and the revenue from our international
operations may decrease.
Growth
in Enterprises
We
believe that sales through our indirect channel to enterprise class customers
represent a growth opportunity for the Company. Our percentage of
revenues from such customers does not represent the same degree of penetration
of that segment as we have achieved with small to medium sized
businesses. We believe that a significant opportunity exists to grow
our revenue by increasing our penetration rate with this segment by leveraging
the company’s technological and channel strengths.
If we
fail to establish competitive products and services for this segment, or fail to
develop the correct channel partners and resources, the percentage of our
revenue derived from enterprise class customers will not increase, and may, in
fact, decrease.
License
and Services Revenue
We
believe that the software license and services component of our revenue has
several characteristics that are positive for our business as a whole: our
license and services revenue is associated with a higher gross profit than our
product revenue; the subscription services component of license and services
revenue is recognized ratably over the services period, and thus provides, in
the aggregate, a more predictable revenue stream than product or license
revenue, which are generally recognized at the time of the sale; and to the
extent that we are able to achieve good renewal rates, we have the opportunity
to lower our selling and marketing expenses attributable to that
segment. We expect our revenue from software licenses and services to
continue to represent the majority of our total revenue subject to (1)
continuing demand from our installed base of customers for the renewal and
upgrading of such service, (2) the number of new hardware appliances sold, and
(3) the demand for such services as attached to new hardware appliances
sold.
Macro-Economic
Factors Affecting IT Spending
We believe that our products and
services are subject to the macro-economic factors that affect much of the
information technology (“IT”) market. Growing IT budgets and an
increased funding for projects to provide security, mobility, data protection,
and productivity could drive product upgrade cycles and/or create demand for new
applications of our solutions. Contractions in IT spending can affect
our revenue by causing projects incorporating our products and services to be
delayed and/or canceled. We believe that demand for our solutions
correlate with increases or decreases in global IT spending and we believe that
economic uncertainties, including fluctuating energy prices, difficulties in the
financial sector, the availability of credit, softness in the housing market,
underlying market liquidity, and geopolitical uncertainties may continue to have
an adverse impact on IT spending in the markets in which we do
business.
Critical
Accounting Policies and Critical Accounting Estimates
The
preparation of our financial statements and related disclosures in conformity
with accounting principles generally accepted in the United States (“U.S. GAAP”)
requires us to make judgments, assumptions, and estimates that affect the
amounts reported in our consolidated financial statements and accompanying
notes. We believe that the judgments, assumptions and estimates upon
which we rely are reasonable based upon information available to us at the time
that these judgments, assumptions and estimates are made. However,
any differences between these judgments, assumptions and estimates and actual
results could have a material impact on our statement of operations and
financial condition. The current volatility in the financial markets
and associated general economic uncertainty increase the risk that such
differences may be realized. The accounting policies that reflect our
most significant judgments, assumptions and estimates and which we believe are
critical in understanding and evaluating our reported financial results include:
(1) revenue recognition; (2) sales returns and other allowances, allowance for
doubtful accounts and warranty reserve; (3) valuation of inventory; (4)
accounting for income taxes; (5) valuation of long-lived and intangible assets
and goodwill, (6) share-based compensation, and (7) fair value of
investments.
Revenue
Recognition
The
Company derives its revenue primarily from the sale of: (1) products, (2)
software licenses, (3) subscriptions for services, and (4) other services such
as extended warranty and service contracts, training, consulting and engineering
services. As described below, significant management judgments and
estimates must be made and used in connection with the revenue recognized in any
accounting period. The Company may experience material differences in
the amount and timing of its revenue for any period if management makes
different judgments or utilizes different estimates.
The
Company recognizes revenue for products when persuasive evidence of an
arrangement exists, the product has been delivered, title and risk of loss have
been transferred to the customer, the fee is fixed or determinable, and
collection of the resulting receivable is reasonably assured. While
the Company’s sales agreements contain standard terms and conditions, there are
agreements that contain non-standard terms and conditions. In these
cases, interpretation of non-standard provisions is required to determine the
appropriate accounting for the transaction.
Retroactive
price protection rights resulting from price reductions on products previously
sold to customers are contractually offered to the Company’s channel
partners. The Company evaluates the revenue impact of these rights
carefully based on stock on hand in the channels and records a provision for
estimated future price protection credit. Revenue from certain distributors is
not recognized until these distributors sell the product to their
customers. As a consequence, there is no
provision
required for sales to these distributors. In general, retroactive
price adjustments are not significant. At December 31, 2009, 2008,
and 2007, the Company recorded a provision for price protection on sales to the
Company’s channel partners in the amounts of $0, $200,000, and $985,000,
respectively.
Delivery
to customers is generally deemed to occur when we deliver the product to a
common carrier. Certain distributor agreements provide customers with
rights of return for stock rotation. These stock rotation rights are
generally limited to 15% to 25% of the distributor's purchases for the
immediately prior 3 to 6 months period or contain other measurable restrictions,
and we estimate reserves for these return rights as discussed
below. Certain distributors, have rights of return under certain
circumstances that are not limited, therefore, we do not deem delivery to have
occurred for any sales to these distributors until they sell the product to
their customers.
Evidence
of an arrangement is manifested by a master distribution or OEM (Original
Equipment Manufacturer) agreement, an individual binding purchase order, or a
signed license agreement. In most cases, sales through our
distributors and OEM partners are governed by a master agreement against which
individual binding purchase orders are placed on a transaction-by-transaction
basis.
At the
time of the transaction, the Company assesses whether the fee associated with
the transaction is fixed or determinable, and whether or not collection is
reasonably assured. The Company assesses whether the fee is fixed or
determinable based upon the terms of the binding purchase order, including the
payment terms associated with the transaction. If a significant
portion of a fee is due beyond the Company’s normal payment terms, typically 30
to 90 days from invoice date, the Company accounts for the fee as not being
fixed or determinable and recognizes revenue as the fees become
due.
The
Company assesses probability of collection based on a number of factors,
including past transaction history with and the credit-worthiness of the
customer. The Company does not request collateral from its
customers. If the Company determines that collection of a fee is not
reasonably assured, it defers the fee and recognizes revenue at the time
collection becomes reasonably assured, which is generally upon receipt of
cash.
For
arrangements with multiple elements (for example, the sale of an appliance which
includes a year of maintenance or a subscription based product), the Company
allocates revenue first to undelivered components of the arrangement based on
the vendor specific objective evidence of fair value of the undelivered
elements, which is generally the average selling price of each element when sold
separately. This allocation process means that the Company defers
revenue from the arrangement equal to the fair value of the undelivered elements
and recognizes such amounts as revenue when the elements are
delivered.
The
Company’s arrangements do not generally include acceptance
clauses. However, if an arrangement includes an acceptance provision,
recognition of revenue occurs upon the earlier of receipt of a written customer
acceptance or expiration of the acceptance period.
License
and service revenue includes revenue from subscription service licenses,
technical support services and perpetual software licenses. The Company
recognizes revenue for subscriptions and services such as content filtering,
anti-virus protection and intrusion prevention, and extended warranty and
service contracts, ratably over the contract term. The Company’s
training, consulting and engineering services are generally billed and
recognized as revenue as these services are performed.
The
Company collects and remits sales taxes on products and services that it
purchases and sells under its contracts with customers, and reports
such amounts under the net method in its consolidated statements of
operations. Accordingly, there are no sales taxes included in
revenue.
In October 2009, the FASB issued Accounting Standard Update
(“ASU”) No. 2009-13, Multiple-Deliverable Revenue
Arrangements (“ASU 2009-13”) and No. 2009-14, Certain Revenue Arrangements that
include Software Elements (“ASU 2009-14”). These standards update FASB
ASC 605, Revenue Recognition
(“ASC 605”) and FASB ASC 985, Software (“ASC 985”). The
amendments to ASC 605 requires entities to allocate revenue in an arrangement
using estimated selling prices of the delivered goods and services based on a
selling price hierarchy. The amendments to ASC 985 remove tangible products from
the scope of software revenue guidance and provide guidance on determining
whether software deliverables in an arrangement that includes a tangible product
are covered by the scope of the software revenue guidance. These amendments to
ASC 605 and ASC 985 should be applied on a prospective basis for revenue
arrangements entered into or materially modified in fiscal years beginning on or
after June 15, 2010, with early adoption permitted. The Company adopted these
amendments on January 1, 2010. Management estimates that the impact
of the adoption on the Company’s consolidated financial statements will be a 2%
increase in revenue recognized in the fiscal year with a corresponding decrease
in deferred revenue.
Sales
Returns and Other Allowances, Allowance for Doubtful Accounts, and Warranty
Reserve
The
preparation of financial statements in accordance with U.S. GAAP requires us to
make estimates and assumptions that affect the reported amount of assets and
disclosure of contingent assets and liabilities at the date of the financial
statements and the reported amounts of revenues and expenses during the reported
period. Specifically, we must make estimates of potential future
product returns and price changes related to current period product
revenue. We analyze historical returns, current economic trends, and
changes in customer demand and acceptance of our products when evaluating the
adequacy of the sales returns and other allowances. Significant
management judgments and estimates must be made and used in connection with
establishing the sales returns and other allowances in any accounting
period. We may experience material differences in the amount and
timing of our revenue for any period if management makes different judgments or
utilizes different estimates.
In
addition, we must make estimates based upon a combination of factors to ensure
that our accounts receivable balances are not overstated due to
uncollectibility. We specifically analyze accounts receivable and
historical bad debts, the length of time receivables are past due, macroeconomic
conditions including liquidity and the availability of credit facilities,
deterioration in customer’s operating results or financial position, customer
concentrations, and customer credit-worthiness, when evaluating the adequacy of
the allowance for doubtful accounts.
Our
appliance products are generally covered by a warranty period of one or two
years. We accrue a warranty reserve for estimated costs to provide
warranty services, including the cost of technical support, product repairs, and
product replacement for units that cannot be repaired. Our estimate
of costs to fulfill our warranty obligations is based on historical experience
and expectation of future conditions. To the extent we experience
increased warranty claim activity or increased costs associated with servicing
those claims, our warranty accrual will increase, resulting in decreased gross
profit.
Valuation
of Inventory
We
continually assess the valuation of our inventory and periodically write-down
the value for estimated excess and obsolete inventory based upon assumptions
about future demand and market conditions. Such estimates are
difficult to make since they are based, in part, on estimates of current and
future economic conditions. Reviews for excess inventory are done on
a quarterly basis and required reserve levels are calculated with reference to
our projected ultimate usage of that inventory. In order to determine
the ultimate usage, we take into account forecasted demand, rapid technological
changes, product life cycles, projected obsolescence, current inventory levels,
and purchase commitments. The excess balance determined by this
analysis becomes the basis for our excess inventory charge. If actual
demand is lower than our forecasted demand, and we fail to reduce manufacturing
output accordingly, we could be required to record additional inventory
write-downs, which would have a negative effect on our gross profit and
earnings.
Accounting
for Income Taxes
As part
of the process of preparing our consolidated financial statements we are
required to estimate our taxes in each of the jurisdictions in which we
operate. We must make certain estimates and judgments in determining
income tax expense for financial statement purposes. These estimates
and judgments occur in the calculation of tax credits, benefits, and deductions,
and in the calculation of certain tax assets and liabilities, which arise from
differences in the timing of recognition of revenue and expense for tax and
financial statement purposes, as well as the interest and penalties related to
these uncertain tax positions. Significant changes to these estimates may result
in an increase or decrease to our tax provision in a subsequent
period.
We must
assess the likelihood that we will be able to recover our deferred tax assets.
If recovery is not likely, we must increase our provision for taxes by recording
a valuation allowance against the deferred tax assets that we estimate will not
ultimately be recoverable. We believe that we will ultimately recover
a substantial majority of the deferred tax assets recorded on our consolidated
balance sheets. However, should there be a change in our ability to
recover our deferred tax assets, our tax provision would increase in the period
in which we determined that the recovery was not likely.
The
calculation of our tax liabilities involves dealing with uncertainties in the
application of complex tax regulations. We recognize liabilities for uncertain
tax positions based on the two-step process. The first step is to
evaluate the tax position for recognition by determining if the weight of
available evidence indicates that it is more likely than not that the position
will be sustained on audit, including resolution of related appeals or
litigation processes, if any. The second step requires us
to
estimate
and measure the tax benefit as the largest amount that is more than 50% likely
to be realized upon ultimate settlement. It is inherently difficult
and subjective to estimate such amounts, as we have to determine the probability
of various possible outcomes. We reevaluate these uncertain tax
positions on a quarterly basis. This evaluation is based on factors
including, but not limited to, changes in facts or circumstances, changes in tax
law, effectively settled issues under audit, and new audit
activity. Such a change in recognition or measurement would result in
the recognition of a tax benefit or an additional charge to the tax
provision.
Valuation
of Long-Lived Assets, Intangible Assets and Goodwill
Purchased
intangibles consist of purchased technology, customer installed
base/relationships, customer backlog and other
intangibles. Intangible assets are amortized on a straight-line basis
over their estimated useful lives which range from 3 months to eight
years. We periodically evaluate our intangible assets for indications
of impairment. If this evaluation indicates that the value of the
intangible asset may be impaired, we make an assessment of the recoverability of
the net carrying value of the asset over its remaining useful
life. If this assessment indicates that the intangible asset is not
recoverable, based on the estimated undiscounted future cash flows of the
technology over the remaining amortization period, we reduce the net carrying
value of the related intangible asset to fair value and may adjust the remaining
amortization period.
Goodwill
represents the excess of the aggregate purchase price over the fair market value
of the net tangible and intangible assets acquired by the
Company. Goodwill is tested for impairment on December 31st of
each fiscal year or more often if an event or circumstances indicate that an
impairment loss has been incurred. An impairment charge is recognized
if a reporting unit’s goodwill carrying amount exceeds its implied fair
value. Goodwill impairment is determined using a two-step approach
and one or more of the following fair value measures including: present value
techniques of estimated future cash flows; or valuation techniques based on
multiples of earnings or revenue, or a similar performance
measure. Any such impairment charge could be significant and could
have a material adverse effect on our reported financial
statements. Based on the impairment tests performed, there was no
impairment of goodwill in 2009, 2008, and 2007. The goodwill recorded
as a result of the business combinations in the years presented is not
deductible for tax purposes.
We
continually monitor events and changes in circumstances that could indicate
carrying amounts of long-lived assets, including intangible assets, may not be
recoverable. When such events or changes in circumstances occur, we
assess the recoverability of long-lived assets by determining whether the
carrying value of such assets will be recovered through undiscounted expected
future cash flows. If the total of the future cash flows is less than
the carrying amount of those assets, we record an impairment charge based on the
excess of the carrying amount over the fair value of the assets.
Share-Based
Compensation
The
Company measures and recognizes the compensation expenses for all share-based
payment awards made to employees and directors including employee stock options
and employee stock purchases related to the Employee Stock Purchase Plan based
on the grant date fair value estimated using a Black-Scholes option-pricing
model. The Company estimates the forfeiture rate at the time of grant
and revised, if necessary, in subsequent periods if actual forfeitures differ
from those estimates. Share-based compensation expense recognized in the
Consolidated Statements of Operations are based on awards ultimately expected to
vest and has been reduced for estimated forfeitures. The value of the
portion of the award that is ultimately expected to vest is recognized as
expenses using the straight-line single option method over the requisite service
periods in the Company’s Consolidated Statements of Operations.
Share-based
compensation expenses recognized in the Company’s Consolidated Statements of
Operations for the years ended December 31, 2009, 2008, and 2007 included
compensation expenses for share-based payment awards granted prior to, but not
yet vested as of December 31, 2005 based on the grant date fair value
estimated in accordance with the pro forma provisions and compensation expenses
for the share-based payment awards granted subsequent to December 31, 2005
based on the grant date fair value estimated using a Black-Scholes
option-pricing model.
Fair Value of Investments
Fair
Value
Our
investments consist of U.S. Treasury and U.S. government agency securities,
municipal notes and bonds, auction rate securities (“ARS”), asset backed
securities (“ABS”), corporate notes and bonds, commercial paper, and money
market funds. In the current market environment, the assessment of the fair
value of the debt securities can be difficult and subjective. The volume of
trading activity of certain debt instruments has declined, and the rapid changes
occurring in the financial markets can lead to changes in the fair value of
financial instruments in a relatively short period of time. The
Company designated all investments, except for ARS held by UBS, as
available-for-sale and therefore these investments are reported at fair value,
with unrealized gains and losses recorded in accumulated other comprehensive
income. During the fourth quarter of fiscal 2008, the Company
reclassified ARS from UBS, one of its investment providers, from
available-for-sale to trading securities. Investments that the
Company designates as trading assets are reported at fair value, with gains or
losses resulting from changes in fair value recognized in
earnings. The information contained in Note 2 and Note 4 of the
Company’s Consolidated Financial Statements is hereby incorporated by
reference.
Other-Than-Temporary
Impairment. All of the Company’s available-for-sale investments are
subject to a periodic impairment review. The Company recognizes an
impairment charge when a decline in the fair value of its investments below the
cost basis is judged to be other-than-temporary. The Company
considers various factors in determining whether to recognize an impairment
charge, including the length of time and extent to which the fair value has been
less than the Company’s cost basis, the financial condition and near-term
prospects of the investee, and the Company’s intent and ability to hold the
investment for a period of time sufficient to allow for any anticipated recovery
in the market value. During the years ended December 31, 2009,
2008 and 2007 the Company did not record any other-than-temporary impairment
charges on its available-for-sale securities.
Significant
Transactions
Acquisitions
On July
10, 2007, the Company completed the acquisition of 100% of the outstanding
shares of Aventail Corporation (“Aventail”) for approximately $25.6 million
in purchase consideration, consisting of cash of approximately $23.6 million,
$2.0 million in direct transaction costs incurred in connection with the
acquisition, and stock options assumed. The Company acquired Aventail
to complement and extend its current SSL-VPN product offering. Of the
total purchase price of $25.6 million, approximately $1.9 million was allocated
to in-process research and development, approximately $6.9 million was allocated
to purchased technology that will be amortized over its estimated useful life of
six years, approximately $7.9 million was allocated to customer relationship
that will be amortized over eight years, approximately $2.6 million was used to
pay off an assumed loan, and approximately $4.0 million was recorded for net
liabilities assumed. The remaining $15.4 million was allocated to
goodwill. In addition, pursuant to the terms of the Merger Agreement, 744,043
stock options held by employees of Aventail were assumed by
SonicWALL. The fair value as of the acquisition date of these stock
options assumed, using the Black-Scholes valuation method, was $2.2
million. There were no options vested as of the acquisition date thus
the purchase price component related to the assumption was zero. The
total fair value of $2.2 million is being recognized as compensation cost over
the requisite service period.
The
Consolidated Financial Statements include the operating results of each business
from the date of acquisition. The above transaction was accounted for
as a purchase business combination. The Company allocated the
purchase price based upon the fair value of the assets acquired and liabilities
assumed. The excess of the purchase price over the fair value of the
assets acquired and liabilities assumed has been allocated to the identified
intangible assets.
Restructuring
During
the first quarter of fiscal year 2008, the Company commenced the implementation
of a 2008 restructuring plan associated primarily with the relocation of support
activities, the closure of facilities in Pune, India and Sunnyvale, California,
and other employee reductions for the purpose of better integration and
alignment of Company functions.
The
information contained in Note 8 to the Consolidated Financial Statements is
hereby incorporated by reference into this Part II, Item 7.
Results
of Operations
The
following table sets forth financial data for the years indicated as a
percentage of total revenue:
|
Year
Ended December 31,
|
||||||||||||
|
2009
|
2008
|
2007
|
||||||||||
|
Revenue:
|
||||||||||||
|
Product
|
36.8%
|
41.6%
|
49.7%
|
|||||||||
|
License
and service
|
63.2
|
58.4
|
50.3
|
|||||||||
|
Total
revenue
|
100.0
|
100.0
|
100.0
|
|||||||||
|
Cost
of revenue:
|
||||||||||||
|
Product
|
19.5
|
19.9
|
20.4
|
|||||||||
|
License
and service
|
7.9
|
9.2
|
8.0
|
|||||||||
|
Amortization
of purchased technology
|
1.5
|
1.4
|
1.1
|
|||||||||
|
Total
cost of revenue
|
28.9
|
30.5
|
29.5
|
|||||||||
|
Gross
profit
|
71.1
|
69.5
|
70.5
|
|||||||||
|
Operating
expenses:
|
||||||||||||
|
Research
and development
|
18.9
|
20.2
|
19.8
|
|||||||||
|
Sales
and marketing
|
34.9
|
37.7
|
38.9
|
|||||||||
|
General
and administrative
|
8.5
|
8.5
|
10.8
|
|||||||||
|
Amortization
of purchased intangible assets
|
0.5
|
0.5
|
0.4
|
|||||||||
|
Restructuring
charges
|
-
|
0.8
|
-
|
|||||||||
|
In-process
research and development
|
-
|
-
|
1.0
|
|||||||||
|
Total
operating expenses
|
62.8
|
67.7
|
70.9
|
|||||||||
|
Income
(loss) from operations
|
8.3
|
1.8
|
(0.4)
|
|||||||||
|
Interest
income and other expense, net
|
1.6
|
2.9
|
5.9
|
|||||||||
|
Income
before income taxes
|
9.9
|
4.7
|
5.5
|
|||||||||
|
Benefit
(provision) for income taxes
|
(3.3)
|
(2.5)
|
8.9
|
|||||||||
|
Net
income
|
6.6%
|
2.2%
|
14.4%
|
|||||||||
The
following table shows share-based compensation cost before taxes as a percent of
total revenues for the periods indicated:
|
Year
Ended December 31,
|
||||||||||||
|
2009
|
2008
|
2007
|
||||||||||
|
Cost
of sales
|
0.2%
|
0.2%
|
0.3%
|
|||||||||
|
Research
and development
|
1.4%
|
1.5%
|
2.3%
|
|||||||||
|
Sales
and marketing
|
1.6%
|
1.7%
|
2.4%
|
|||||||||
|
General
and administrative
|
1.3%
|
1.4%
|
2.0%
|
|||||||||
|
Total
share-based compensation expenses
|
4.5%
|
4.8%
|
7.0%
|
|||||||||
Total Revenue
Total
Revenue by Product Category (in thousands, except for percentage
data)
|
Year
Ended December 31,
|
Dollar
Change
|
Percent
Change
|
||||||||||||||||||||||||||
|
2009
|
2008
|
2007
|
2009
vs. 2008
|
2008
vs. 2007
|
2009
vs. 2008
|
2008
vs. 2007
|
||||||||||||||||||||||
|
UTM
|
$ | 155,052 | $ | 164,788 | $ | 147,696 | $ | (9,736 | ) | $ | 17,092 | (6%) | 12% | |||||||||||||||
|
%
of total revenue
|
77% | 75% | 74% | |||||||||||||||||||||||||
|
SCM
|
19,805 | 22,988 | 23,604 | (3,183 | ) | (616 | ) | (14%) | (3%) | |||||||||||||||||||
|
%
of total revenue
|
10% | 11% | 12% | |||||||||||||||||||||||||
|
SSL
|
17,160 | 20,668 | 15,706 | (3,508 | ) | 4,962 | (17%) | 32% | ||||||||||||||||||||
|
%
of total revenue
|
9% | 9% | 8% | |||||||||||||||||||||||||
|
CDP
|
8,558 | 10,200 | 12,193 | (1,642 | ) | (1,993 | ) | (16%) | (16%) | |||||||||||||||||||
|
%
of total revenue
|
4% | 5% | 6% | |||||||||||||||||||||||||
|
Total
revenue
|
$ | 200,575 | $ | 218,644 | $ | 199,199 | $ | (18,069 | ) | $ | 19,445 | (8%) | 10% | |||||||||||||||
The 6% decline in revenue in the UTM product category in 2009 compared to 2008 was due to the combination of a 12% decrease in product revenue and a 1% decrease in revenue from software license and subscription services. The decline in product revenue was due to the combination of a 10% decrease in average net revenue per unit and a 2% decrease in units sold. The decrease in software license and subscription services revenue was offset by a 16% increase in revenue from our CGSS subscription services. The 14% decline in revenue in the SCM product category in 2009 compared to 2008 was due to the combination of a 47% decrease in product revenue and a 10% decrease in revenue from software license and subscription services. The decline in product revenue was due to the combination of a 42% decrease in units sold and a 9% decrease in average net revenue per unit. The 17% decline in revenue in the SSL product category in 2009 compared to 2008 was due to the combination of a 47% decrease in product revenue and a 4% decrease in subscription services revenue, offset by an 81% increase in software license revenue. The decrease in product revenue was due to the combination of a 22% decrease in units sold and a 32% decrease in average net revenue per unit. The increase in software license revenue was primarily due to a change that was effected in the fourth quarter of 2008 to the pricing structure of Aventail SSL-VPN solutions that offered end user licenses separately from the base appliances. The 16% decline in revenue in the CDP product category in 2009 compared to 2008 was due to a 31% decrease in product revenue, offset by a 7% increase in revenue from software license and subscription services. The decline in product revenue was primarily due to a 33% decrease in units sold.
The 12%
increase in revenue in the UTM product category in 2008 compared to 2007 was due
to a 29% increase in revenue from software license and subscription services,
offset by a 5% decrease in product revenue. The increase in software license and
subscription services revenue was primarily due to a 99% increase in revenue
from our CGSS subscription services. The decline in product revenue was
primarily due to a 6% decrease in units sold. The 3% decline in revenue in the
SCM product category in 2008 compared to 2007 was due to a 42% decrease in
product revenue, offset by a 7% increase in revenue from software license and
subscription services. The decline in product revenue was due to the
combination of a 38% decrease in units sold and a 7% decrease in average net
revenue per unit. The 32% increase in revenue in the SSL product category in
2008 compared to 2007 was primarily due to a 100% increase in software license
revenue. The 16% decline in revenue in the CDP product category in
2008 compared to 2007 was due to a 28% decrease in product revenue, offset by a
13% increase in revenue from software license and subscription
services. The decline in product revenue was primarily due to a 28%
decrease in units sold.
Total
Revenue by Geographic Area (in thousands, except for percentage
data)
|
Year
Ended December 31,
|
Dollar
Change
|
Percent
Change
|
||||||||||||||||||||||||||
|
2009
|
2008
|
2007
|
2009
vs. 2008
|
2008
vs. 2007
|
2009
vs. 2008
|
2008
vs. 2007
|
||||||||||||||||||||||
|
Americas
|
$ | 139,458 | $ | 149,986 | $ | 138,678 | $ | (10,528 | ) | $ | 11,308 | (7%) | 8% | |||||||||||||||
|
%
of total revenue
|
70% | 69% | 70% | |||||||||||||||||||||||||
|
EMEA
|
40,949 | 46,144 | 40,420 | (5,195 | ) | 5,724 | (11%) | 14% | ||||||||||||||||||||
|
%
of total revenue
|
20% | 21% | 20% | |||||||||||||||||||||||||
|
APAC
|
20,168 | 22,514 | 20,101 | (2,346 | ) | 2,413 | (10%) | 12% | ||||||||||||||||||||
|
%
of total revenue
|
10% | 10% | 10% | |||||||||||||||||||||||||
|
Total
revenue
|
$ | 200,575 | $ | 218,644 | $ | 199,199 | $ | (18,069 | ) | $ | 19,445 | (8%) | 10% | |||||||||||||||
Revenue in the Americas included sales from regions outside the United States and Canada of $4.3 million and $5.6 million for 2009 and 2008, respectively. The decline in revenue in the Americas for 2009 compared to 2008 was primarily due to the combination of decreases in the units sold in the SCM, SSL and CDP product categories, average net revenue per unit in the UTM and SSL product categories, and sales of software license and subscription services in the UTM and SCM product categories, offset by increased sales of software license and subscription services in the SSL product category. The decline in revenue in EMEA for 2009 compared to 2008 was primarily due to the combination of decreases in the units sold in the UTM, SSL and CDP product categories and average net revenue per unit in the UTM and SSL product categories, offset by increased sales of software licenses and subscription services in the SSL product category. The decline in revenue in APAC for 2009 compared to 2008 was primarily due to the combination of decreases in average net revenue per unit in the UTM, SCM and SSL product categories, offset by increases in the units sold in the UTM product category.
Revenue
in the Americas included sales from regions outside the United States and Canada
of $5.6 million and $3.0 million for 2008 and 2007, respectively. The increase
in revenue in the Americas for 2008 compared to 2007 was primarily due to
increases in sales of software license and subscription services in the UTM and
SSL product categories, offset by the combination of decreases in the units sold
in the UTM, SCM and CDP product categories and average net revenue per unit in
the UTM product category. The increase in revenue in EMEA for 2008
compared to 2007 was primarily due to the combination of increased sales of
software license and subscription services in the UTM, SCM and SSL product
categories and average net revenue per unit in the UTM product category, offset
by decreases in the units sold in the UTM product category. The
increase in revenue in APAC for 2008 compared to 2007 was primarily due to the
combination of increased sales of software license and subscription services in
the UTM and SSL product categories and average net revenue per unit in the UTM
product category, offset by decreases in the units sold in the UTM and CDP
product categories.
Product
and License and Service Revenue (in thousands, except for percentage
data)
|
Year
Ended December 31,
|
Dollar
Change
|
Percent
Change
|
||||||||||||||||||||||||||
|
2009
|
2008
|
2007
|
2009
vs. 2008
|
2008
vs. 2007
|
2009
vs. 2008
|
2008
vs. 2007
|
||||||||||||||||||||||
|
Product
|
$ | 73,847 | $ | 90,857 | $ | 98,936 | $ | (17,010 | ) | $ | (8,079 | ) | (19%) | (8%) | ||||||||||||||
|
%
of total revenue
|
37% | 42% | 50% | |||||||||||||||||||||||||
|
License
and service
|
126,728 | 127,787 | 100,263 | (1,059 | ) | 27,524 | (1%) | 27% | ||||||||||||||||||||
|
%
of total revenue
|
63% | 58% | 50% | |||||||||||||||||||||||||
|
Total
revenue
|
$ | 200,575 | $ | 218,644 | $ | 199,199 | $ | (18,069 | ) | $ | 19,445 | (8%) | 10% | |||||||||||||||
Product
Revenue
We
shipped approximately 174,000, 182,000, and 196,000 total units, respectively,
during fiscal 2009, 2008, and 2007.
The
decrease in product revenue in 2009 compared to 2008 was primarily due to the
combination of decreases in units sold in all product categories and average net
revenue per unit in UTM and SSL product categories.
The
decrease in product revenue in 2008 compared to 2007 was primarily due to
decreases in units sold in all product categories, offset by increases in
average net revenue per unit in the UTM and SSL product categories.
License
and Service Revenue
License
and service revenue includes revenue from subscription service licenses,
technical support services and perpetual software licenses.
The
decline in license and service revenue in 2009 compared to 2008 was primarily
due to (1) a decrease in sales of software licenses associated with our UTM
solution, and (2) a decrease in sales of subscription services associated with
our SCM solutions. These decreases were offset by (1) an increase in
sales of subscription services associated with our UTM solutions, and (2) an
increase in sales of software licenses associated with our SSL and CDP
solutions.
The
increase in license and service revenue in 2008 compared to 2007 was primarily
due to (1) an increase in sales of software licenses associated with our SSL
solution; and (2) an increase in sales of subscription services associated with
our UTM and SCM solutions. These increases were offset by a decrease
in sales of software licenses associated with our UTM and SCM
solutions.
Cost of Revenue
and Gross Profit
The
following table shows the cost of revenue for product and the cost of revenue
for license and service (in thousands, except for percentage data):
|
Year
Ended December 31,
|
Percent
Variance
|
|||||||||||||||||||
|
2009
|
2008
|
2007
|
2009
vs. 2008
|
2008
vs. 2007
|
||||||||||||||||
|
Product
|
$
|
39,038
|
$
|
43,507
|
$
|
40,555
|
(10%)
|
7%
|
||||||||||||
|
License
and service
|
15,857
|
20,102
|
15,894
|
(21%)
|
26%
|
|||||||||||||||
|
Amortization
of purchased technology
|
3,017
|
3,017
|
2,232
|
-
|
35%
|
|||||||||||||||
|
Total
cost of revenue
|
$
|
57,912
|
$
|
66,626
|
$
|
58,681
|
(13%)
|
14%
|
||||||||||||
Note
– Effect of amortization of purchased technology has been excluded from
product and license and service gross profit discussions below.
The
following table shows the gross profit for product and the gross profit for
license and service (in thousands, except for percentage data):
|
Year
Ended December 31,
|
||||||||||||||||||||||||
|
Gross
Profit Amount
|
Gross
Margin
|
|||||||||||||||||||||||
|
2009
|
2008
|
2007
|
2009
|
2008
|
2007
|
|||||||||||||||||||
|
Product
|
$
|
34,809
|
$
|
47,350
|
$
|
58,381
|
47%
|
52%
|
59%
|
|||||||||||||||
|
License
and service
|
110,871
|
107,685
|
84,369
|
87%
|
84%
|
84%
|
||||||||||||||||||
|
Amortization
of purchased technology
|
(3,017
|
)
|
(3,017
|
)
|
(2,232
|
)
|
||||||||||||||||||
|
Total
gross profit
|
$
|
142,663
|
$
|
152,018
|
$
|
140,518
|
71%
|
70%
|
71%
|
|||||||||||||||
Cost
of Product Revenue and Gross Profit/Margin
Cost of
product revenue includes costs associated with the production of our products,
including cost of materials, manufacturing and assembly costs paid to contract
manufacturers, freight, related fulfillment cost, and overhead costs associated
with our manufacturing operations. Additionally, warranty costs and
inventory provisions or write-downs are included in cost of product
revenue.
In 2009
compared to 2008, the cost of product revenue decreased in all product
categories. The 10% decline was primarily due to the combination of a
2% decrease in the units sold from the UTM product category, a 42% decrease in
units sold from the SCM product category, a 22% decrease in units sold from the
SSL product category, a 33% decrease in units sold from the CDP product category
and a 5% decrease in the average production cost per unit in the UTM product
category, offset by a 21% increase in the average production cost per unit in
the CDP product category. Compared to 2008, 2009 average production
cost per unit for all product categories decreased by approximately
6%.
In 2008
compared to 2007, the cost of product revenue increased in the UTM product
category, but decreased in the SCM, SSL, and CDP product
categories. The 7% increase was primarily due to a 23% increase in
the average production cost per unit in the UTM product category, offset by a 6%
decrease in the units sold in the UTM product category, a 38% decrease in the
SCM product category and a 28% decrease in the CDP product category. Compared to
2007, 2008 average production cost per unit for all product categories increased
by approximately 16%.
In 2009
compared to 2008, gross profit and gross profit percentage from product sales
decreased in all four product categories. In the UTM product category, an 18%
decline in gross profit was primarily due to the combination of a 10% decrease
in the average net revenue per unit and a 2% decrease in the units sold, offset
by a 5% decrease in the average production cost per unit. In the SCM
product category, a 59% decline in gross profit was due to the combination of a
9% decrease in the average net revenue per unit and a 42% decrease in the units
sold. In the SSL product category, a 55% decline in gross profit was
primarily due to the combination of a 32% decrease in the average net revenue
per unit and a 22% decrease in the units sold. In the CDP product
category, a 40% decline in gross profit was due to the combination of a 33%
decrease in the units sold and a 21% increase in the average production cost per
unit.
In 2008
compared to 2007, gross profit and gross profit percentage from product sales
decreased in the UTM, SCM and CDP product categories. In the UTM product
category, a 19% decline in gross profit was primarily due to the combination of
a 23% increase in the average production cost per unit and a 6% decrease in the
units sold, offset by a 1% increase in the average net revenue per
unit. In the SCM product category, a 52% decline in gross profit was
due to the combination of a 7% decrease in the average net revenue per unit, a
38% decrease in the units sold, and a 5% increase in the average production cost
per unit. In the CDP product category, a 31% decline in gross profit
was due to the combination of a 28% decrease in the units sold and a 6% increase
in the average production cost per unit.
We expect
future product gross profit to erode to the extent that we experience downward
pressure on product pricing or upward pressure on production costs. A
change in the mix of product sold could also change product gross profit and
gross profit percentage.
Cost
of License and Service Revenue and Gross Profit
Cost of
license and service revenue includes costs associated with the production and
delivery of our license and service offerings, including technical support costs
related to our service contracts, royalty costs related to certain subscription
offerings, personnel costs related to the delivery of training, consulting, and
professional services; and cost of packaging materials and related costs paid to
contract manufacturers.
In 2009
compared to 2008, gross profit from license and service increased in the UTM,
SSL and CDP product categories and gross profit percentage from license and
service increased in all product categories. These increases were
primarily due to decreased costs. Cost of license and service revenue decreased
by 21% in 2009 compared to 2008. This decrease was primarily due to
decreased technical support costs. In 2007, the Company started a
process to “in-source” a portion of our technical support delivery to centers
located in the United States and India. That phase of the
“in-sourcing” process was completed in mid 2008 and has resulted in a decline in
our technical support costs for 2009 compared to 2008. The Company has also
completed the implementation of a second phase of technical support “in
sourcing” activity for certain other regions in the fourth quarter of
2009.
In 2008
compared to 2007, gross profit from license and service increased in all product
categories and gross profit percentage from license and service increased in the
UTM and SCM product categories. These increases were primarily due to
a 28% increase in net revenue, offset by a 27% increase in the cost of license
and service revenue. The increase in the cost of license and service was
primarily due to the technical support costs associated with a larger base of
license and subscription service customers. In addition, in 2007, the Company
started a process to “in-source” a portion of our technical support delivery to
centers located in the United States and India. That phase of the
“in-sourcing” process was completed in mid 2008. The planning and
other ramp up costs associated with these centers, without a corresponding
decrease in costs associated with existing third party service providers,
resulted in duplicate or redundant technical support expenses for a period of
time.
Amortization
of Purchased Technology
|
Year
Ended December 31,
|
||||||||||||
|
2009
|
2008
|
2007
|
||||||||||
|
(in
thousands)
|
||||||||||||
|
Expenses
|
$
|
3,017
|
$
|
3,017
|
$
|
2,232
|
||||||
|
%
of total revenue
|
2%
|
1%
|
1%
|
|||||||||
|
Year
over year change in dollars
|
-
|
785
|
||||||||||
|
Year
over year change in percent
|
-
|
35%
|
||||||||||
Amortization
of purchased technology represents the amortization of existing technology
acquired in our business combinations accounted for using the purchase
method. Purchased technology is being amortized over the estimated
useful lives of four to eight years. The increase in amortization for
the year ended December 31, 2008 as compared to the same period last year is
primarily due to the timing difference of the amortization of the purchased
technology from Aventail.
The
amounts for the year ended December 31, 2009, 2008 and 2007 represent
amortization of purchased intangibles associated with our acquisitions of enKoo,
Lasso Logic, MailFrontier, and Aventail.
Future
amortization to be included in cost of revenue based on the current balance of
purchased technology absent any additional investment is as follows (in
thousands):
|
Fiscal
Year
|
Amortization
Amount to Cost of Revenue
|
|||
|
2010
|
$
|
2,374
|
||
|
2011
|
1,382
|
|||
|
2012
|
1,382
|
|||
|
2013
|
803
|
|||
|
2014
|
225
|
|||
|
Thereafter
|
206
|
|||
|
Total
|
$
|
6,372
|
||
Our gross
profit has been and will continue to be affected by a variety of factors,
including competition, the mix of products and services, new product
introductions and enhancements, fluctuations in manufacturing volumes, and the
cost of components and manufacturing labor.
Operating
Expenses
Research
and Development
|
Year
Ended December 31,
|
||||||||||||
|
2009
|
2008
|
2007
|
||||||||||
|
(in
thousands)
|
||||||||||||
|
Expenses
|
$
|
37,858
|
$
|
44,176
|
$
|
39,410
|
||||||
|
%
of total revenue
|
19%
|
20%
|
20%
|
|||||||||
|
Year
over year change in dollars
|
(6,318
|
)
|
4,766
|
|||||||||
|
Year
over year change in percent
|
(14%)
|
12%
|
||||||||||
Research
and development expenses primarily consist of personnel costs, contract
consultants, outside testing services and equipment and supplies associated with
enhancing existing products and developing new products.
During
2009, the decrease in research and development costs in comparison to the same
period last year was primarily due to the following: (1) a decrease in personnel
costs, including salaries, contract labor, variable compensation and benefit
expenses of approximately $3.9 million; (2) a decrease in contract services of
$0.5 million; (3) a decrease in share-based compensation expense related to
employee stock options and rights granted under the Employee Stock Purchase
Program (“ESPP”) of approximately $0.5 million; (4) a decrease in travel related
costs of approximately $0.4 million; and (5) a decrease in information service
and facilities costs allocated to product development of approximately $0.7
million.
During 2008, the increase in research and development costs in comparison to the same period last year was primarily due to the following: (1) an increase in salary, variable compensation and benefit expenses of approximately $3.1 million resulting primarily from increased headcount related to the Aventail acquisition; and (2) an increase in information service and facilities costs allocated to product development of approximately $2.7 million. These increases in research and development expenses were partially offset by a decrease in share-based compensation expense related to employee stock options and rights granted under the ESPP of approximately $1.4 million.
We
believe that our future performance will depend in large part on our ability to
maintain and enhance our current product line, develop new products that achieve
market acceptance, maintain technological competitiveness, and meet an expanding
range of customer requirements. We plan to maintain our investments
in current and future product development and enhancement efforts, and incur
expenses associated with these initiatives, such as prototyping expense and
non-recurring engineering charges associated with the development of new
products and technologies.
Sales
and Marketing
|
Year
Ended December 31,
|
||||||||||||
|
2009
|
2008
|
2007
|
||||||||||
|
(in
thousands)
|
||||||||||||
|
Expenses
|
$
|
70,000
|
$
|
82,348
|
$
|
77,741
|
||||||
|
%
of total revenue
|
35%
|
38%
|
39%
|
|||||||||
|
Year
over year change in dollars
|
(12,348
|
)
|
4,607
|
|||||||||
|
Year
over year change in percent
|
(15%)
|
6%
|
||||||||||
Sales and
marketing expenses primarily consist of personnel costs, including commissions,
costs associated with the development of our business and corporate
identification, costs related to customer support, travel, tradeshows,
promotional and advertising costs, and related facilities costs.
During
2009, the decrease in sales and marketing expenses compared to the same period
in 2008 is primarily due to (1) a decrease in personnel costs, including
salaries, contract labor, and other related employee benefits, of approximately
$5.9 million; (2) a decrease in share-based compensation expense related to
employee stock options and rights granted under the ESPP of approximately $0.5
million; (3) a decrease of $1.4 million in travel related costs; (4) a decrease
in marketing program, advertising, channel marketing and promotional costs of
approximately $4.0 million; and (5) a decrease of approximately $0.3 million in
expenses associated with our sales and marketing facilities including rent,
maintenance costs, telephone, and internet connectivity.
During
2008, the increase in sales and marketing expenses compared to the same period
in 2007 is primarily due to (1) increased personnel costs, including
commissions, contract labor, and other related employee benefits, of
approximately $3.7 million resulting from the acquisition of Aventail and the
“in-sourcing” of our technical support services; (2) an increase of
approximately $3.9 million in expenses associated with our sales and marketing
facilities including rent, maintenance costs, telephone, and internet
connectivity primarily due to the “in-sourcing” of our technical support
services; and (3) an increase of approximately $0.3 million in travel related
expenses. These increases in sales and marketing expenses were partially offset
by (1) a decrease in marketing program, advertising, channel marketing and
promotional costs of approximately $2.2 million; and (2) a decrease in the cost
of share-based compensation expense related to employee stock options and rights
granted under the ESPP of approximately $1.0 million.
We expect
to direct our sales and marketing expenses toward the expansion of domestic and
international markets, introduction of new products and establishment and
expansion of new distribution channels.
General
and Administrative
|
Year
Ended December 31,
|
||||||||||||
|
2009
|
2008
|
2007
|
||||||||||
|
(in
thousands)
|
||||||||||||
|
Expenses
|
$
|
17,134
|
$
|
18,613
|
$
|
21,473
|
||||||
|
%
of total revenue
|
9%
|
9%
|
11%
|
|||||||||
|
Year
over year change in dollars
|
(1,479
|
)
|
(2,860
|
)
|
||||||||
|
Year
over year change in percent
|
(8%)
|
(13%)
|
||||||||||
General
and administrative expenses consist primarily of personnel costs, business
insurance, corporate governance costs, professional fees, travel expense, and
related facilities costs.
During
2009, the decrease in G&A expenses was primarily related to (1) a decrease
in share-based compensation expense related to employee stock options and rights
granted under the ESPP of approximately $0.4 million; (2) a decrease of
approximately $0.2 million in personnel costs; (3) a decrease in accounting
related expenses of approximately $0.7 million; (4) a decrease in bad debt
expenses of approximately $0.2 million; and (5) a decrease of approximately $0.1
million in office supplies expenses. These decreases were partially
offset by an increase in litigation related expenses of approximately $0.4
million.
During
2008, the decrease in G&A expenses was primarily related to (1) a decrease
in personnel costs of approximately $1.2 million primarily due to decreased
performance based bonus expenses; (2) a decrease in share-based compensation
expense related to employee stock options and rights granted under the ESPP of
approximately $1 million; (3) a decrease of approximately $0.4 million in
allocated facilities expenses including rent, maintenance costs, depreciation,
telephone, and internet connectivity; (4) a decrease in litigation related
expenses of approximately $0.3 million; and (5) a decrease of approximately $0.1
million in travel related expenses.
We
believe that general and administrative expenses will increase in absolute
dollars and remain relatively stable as a percentage of total revenue as we
incur costs related to corporate governance matters and the pursuit of various
corporate opportunities.
Amortization
of Purchased Intangible Assets Included in Operating Expenses
|
Year
Ended December 31,
|
||||||||||||
|
2009
|
2008
|
2007
|
||||||||||
|
(in
thousands)
|
||||||||||||
|
Expenses
|
$
|
1,095
|
$
|
1,114
|
$
|
715
|
||||||
|
%
of total revenue
|
0.5%
|
0.5%
|
0.4%
|
|||||||||
|
Year
over year change in dollars
|
(19
|
)
|
399
|
|||||||||
|
Year
over year change in percent
|
(2%)
|
56%
|
||||||||||
Amortization
of purchased intangibles included in operating expenses represents the
amortization of assets arising from contractual or other legal rights acquired
in business combinations and excludes for amortization of acquired developed
technology which is included in cost of revenue. Purchased intangible
assets are being amortized over their estimated useful lives of three to eight
years.
The
reduction in amortization expense included in operating expenses in 2009
compared to 2008 was the result of the completion of the amortization of certain
intangibles associated with the acquisition of MailFrontier.
The
increase in amortization expense included in operating expense in 2008 compared
to 2007 was the result of an increase in the amortization of intangibles
associated with the acquisition of Aventail. This increase was
partially offset by a decrease in the amortization of intangibles associated
with the acquisition of MailFrontier.
Future amortization to be included in operating expenses based on current balance of purchased intangibles absent any additional investment is as follows (in thousands):
|
Fiscal
Year
|
Amortization
Amount to Operating Expenses
|
|||
|
2010
|
$
|
1,095
|
||
|
2011
|
1,095
|
|||
|
2012
|
1,008
|
|||
|
2013
|
990
|
|||
|
2014
|
990
|
|||
|
Thereafter
|
495
|
|||
|
Total
|
$
|
5,673
|
||
Restructuring
Charges
|
Year
Ended December 31,
|
||||||||||||
|
2009
|
2008
|
2007
|
||||||||||
|
(in
thousands)
|
||||||||||||
|
Expenses
|
$
|
-
|
$
|
1,683
|
$
|
-
|
||||||
|
%
of total revenue
|
-
|
0.8%
|
-
|
|||||||||
|
Year
over year change in dollars
|
(1,683
|
)
|
1,683
|
|||||||||
|
Year
over year change in percent
|
(100%)
|
100%
|
||||||||||
During
the first quarter of fiscal year 2008, the Company commenced the 2008
restructuring plan associated primarily with the relocation of support
activities, the closure of facilities in Pune, India and Sunnyvale, California,
and other employee reductions for the purpose of better integration and
alignment of Company functions. The Company recorded $1.0 million in
restructuring expenses related to costs associated with the termination of 21
employees across multiple geographic regions and functions, primarily related to
severance, benefits and related costs. Furthermore, the Company
recorded additional restructuring costs of $0.8 million in connection with
facilities and property and equipment that was disposed of or removed from
service. At December 31, 2008, the Company’s restructuring accrual
was $72,000 and included as a component of “Other accrued liabilities” in the
Company’s Condensed Consolidated Balance Sheets. As of December 31, 2009, the
Company has no remaining liability relating to the restructuring
activities.
In-Process
Research and Development
|
Year
Ended December 31,
|
||||||||||||
|
2009
|
2008
|
2007
|
||||||||||
|
(in
thousands)
|
||||||||||||
|
Expenses
|
$
|
-
|
$
|
-
|
$
|
1,930
|
||||||
|
%
of total revenue
|
-
|
-
|
1.0%
|
|||||||||
|
Year
over year change in dollars
|
-
|
(1,930
|
)
|
|||||||||
|
Year
over year change in percent
|
-
|
(100%)
|
||||||||||
Our
methodology for allocating the purchase price for purchase acquisitions to
in-process research and development (“IPR&D”) is determined through
established valuation techniques and analysis, as applied in the high-technology
internet security industry.
The
IPR&D expense in 2007, which is related to the acquisition of Aventail, was
primarily for the development of Aventail’s next generation
product. This IPR&D was expensed upon the acquisition of Aventail
because technological feasibility had not been established and no future
alternative uses existed. Total IPR&D expense of $1.9 million was
charged to product development expenses on the date the assets were
acquired.
The fair
value of the existing purchased technology, as well as the technology under
development, is determined using the income approach, which discounts expected
future cash flows to present value. The discount rate used in the
present value calculation was derived from a weighted average cost of capital
analysis. We consider this pricing model for acquired products and
technology to be standard within the high-technology internet security
industry. We do not expect to achieve a material amount of expense
reductions as a result of integrating the acquired in-process
technology. Therefore, the valuation assumptions do not include
significant anticipated cost savings.
The key
assumptions underlying the valuation of our 2007 Aventail purchase acquisition
for which in-process research and development was recorded were as follows: (1)
estimated cost to complete technology at time of acquisition was approximately
$1.3 million; and (2) risk adjusted discount rate of 22%. Other key
assumptions include an expected completion date of approximately one year and
revenue and expense projections, assuming that the product has entered the
market.
Interest
Income and Other Expense, Net
Interest
income and other expense (net) were $3.2 million, $6.4 million, and $11.8
million in the years ended December 31, 2009, 2008 and 2007, respectively, and
primarily consists of interest income on our cash, cash equivalents, and
investments. The fluctuations in the short-term interest rates
directly influence the interest income we recognize. The decrease in
2009 as compared to 2008 was caused by lower investment yields. The decrease in
2008 as compared to 2007 was caused by a combination of a significantly lower
overall balance in our investment portfolio due to our share repurchase program
and lower investment yields.
Benefit
(Provision) for Income Taxes
|
Year
Ended December 31,
|
||||||||||||
|
2009
|
2008
|
2007
|
||||||||||
|
(in
thousands)
|
||||||||||||
|
Benefit
(provision) for income taxes
|
$
|
(6,586
|
)
|
$
|
(5,571
|
)
|
$
|
17,601
|
||||
|
%
of income before taxes
|
(33%)
|
(53%)
|
160%
|
|||||||||
|
%
of total revenue
|
(3%)
|
(3%)
|
9%
|
|||||||||
|
Year
over year change in dollars
|
(1,015
|
)
|
(23,172
|
)
|
||||||||
|
Year
over year change in percent
|
18%
|
(132%)
|
||||||||||
The
effective tax rate was 33%, 53%, and (160%) in fiscal years 2009, 2008 and 2007,
respectively.
Our
effective tax rate differs from the statutory federal and state tax rates for
the fiscal year ended December 31, 2009 primarily due to the tax benefit from
the partial release of the valuation allowance, other non-deductible book/tax
differences, state income taxes which were offset by state research and
development credits, and the effect of share-based compensation expense related
to incentive stock options and ESPP.
Our effective tax rate differs from the statutory federal and state tax rates for the fiscal year ended December 31, 2008 primarily due to non-deductible share-based compensation expense and state income taxes which were offset by state research and development tax credits.
In 2007,
we released a substantial portion of our valuation allowance considering all
available evidence. The available positive evidence at December 31,
2007, included three years of cumulative historical operating profits, a
projection of future income sufficient to realize most of the remaining deferred
tax assets, and other evidence. The Company recorded a partial
valuation allowance release of $23.5 million in fiscal year 2007, because as of
December 31, 2007, it was considered more likely than not that the Company’s
deferred tax assets would be realized with the exception of certain acquired net
operating losses due to the annual “change in ownership” limitation by the
Internal Revenue Code of 1986, as amended.
Changes
in tax laws and rates could also affect recorded deferred tax assets and
liabilities in the future. Management is not aware of any such changes that
would have a material effect on the Company’s results of operations, cash flows
or financial position.
Quarterly
Results of Operations
The
following table sets forth our unaudited quarterly results of operations, in
dollars for the eight quarters ended December 31, 2009. You should
read the following table in conjunction with the financial statements and
related notes contained elsewhere in this Form 10-K. We have prepared
this unaudited information on the same basis as our audited financial
statements. This table includes all adjustments, consisting only of
normal recurring adjustments, that we consider necessary for a fair presentation
of our financial position and operating results for the quarters
presented. You should not draw any conclusions about our future
results from the results of operations for any quarter.
|
Year
Ended December 31, 2009
|
Year
Ended December 31, 2008
|
|||||||||||||||||||||||||||||||
|
Q4
|
Q3
|
Q2
|
Q1
|
Q4
|
Q3
|
Q2
|
Q1
|
|||||||||||||||||||||||||
|
(in
thousands, except per share data)
|
||||||||||||||||||||||||||||||||
|
Revenue:
|
||||||||||||||||||||||||||||||||
|
Product
|
$
|
22,628
|
$
|
19,248
|
$
|
16,507
|
$
|
15,464
|
$
|
21,867
|
$
|
21,439
|
$
|
23,810
|
$
|
23,741
|
||||||||||||||||
|
License
and service
|
31,519
|
31,471
|
32,054
|
31,684
|
32,389
|
31,839
|
31,989
|
31,570
|
||||||||||||||||||||||||
|
Total
revenue
|
54,147
|
50,719
|
48,561
|
47,148
|
54,256
|
53,278
|
55,799
|
55,311
|
||||||||||||||||||||||||
|
Cost
of revenue:
|
||||||||||||||||||||||||||||||||
|
Product
|
11,917
|
9,916
|
8,948
|
8,257
|
11,028
|
10,627
|
10,811
|
11,041
|
||||||||||||||||||||||||
|
License
and service
|
4,079
|
3,733
|
3,905
|
4,140
|
4,689
|
5,150
|
5,441
|
4,822
|
||||||||||||||||||||||||
|
Amortization
of purchased technology
|
755
|
754
|
754
|
754
|
755
|
754
|
754
|
754
|
||||||||||||||||||||||||
|
Total
cost of revenue
|
16,751
|
14,403
|
13,607
|
13,151
|
16,472
|
16,531
|
17,006
|
16,617
|
||||||||||||||||||||||||
|
Gross
profit
|
37,396
|
36,316
|
34,954
|
33,997
|
37,784
|
36,747
|
38,793
|
38,694
|
||||||||||||||||||||||||
|
Operating
expenses:
|
||||||||||||||||||||||||||||||||
|
Research
and development
|
9,705
|
9,416
|
8,910
|
9,827
|
9,807
|
11,411
|
11,414
|
11,544
|
||||||||||||||||||||||||
|
Sales
and marketing
|
18,002
|
17,357
|
17,399
|
17,242
|
18,395
|
19,472
|
21,756
|
22,725
|
||||||||||||||||||||||||
|
General
and administrative
|
4,546
|
4,406
|
3,935
|
4,247
|
4,479
|
3,957
|
5,032
|
5,145
|
||||||||||||||||||||||||
|
Amortization
of purchased intangible assets
|
273
|
274
|
274
|
274
|
273
|
274
|
274
|
293
|
||||||||||||||||||||||||
|
Restructuring
charges (reversal)
|
-
|
-
|
-
|
-
|
-
|
(87
|
)
|
(35
|
)
|
1,805
|
||||||||||||||||||||||
|
Total
operating expenses
|
32,526
|
31,453
|
30,518
|
31,590
|
32,954
|
35,027
|
38,441
|
41,512
|
||||||||||||||||||||||||
|
Income
(loss) from operations
|
4,870
|
4,863
|
4,436
|
2,407
|
4,830
|
1,720
|
352
|
(2,818
|
)
|
|||||||||||||||||||||||
|
Interest
income and other expense, net
|
787
|
573
|
1,013
|
791
|
1,041
|
1,122
|
1,585
|
2,620
|
||||||||||||||||||||||||
|
Income
(loss) before income taxes
|
5,657
|
5,436
|
5,449
|
3,198
|
5,871
|
2,842
|
1,937
|
(198
|
)
|
|||||||||||||||||||||||
|
Benefit
(provision) for income taxes
|
(698
|
)
|
(2,396
|
)
|
(2,037
|
)
|
(1,455
|
)
|
(2,418
|
)
|
(2,273
|
)
|
(1,012
|
)
|
132
|
|||||||||||||||||
|
Net
income (loss)
|
$
|
4,959
|
$
|
3,040
|
$
|
3,412
|
$
|
1,743
|
$
|
3,453
|
$
|
569
|
$
|
925
|
$
|
(66
|
)
|
|||||||||||||||
|
Net
income (loss) per share:
|
||||||||||||||||||||||||||||||||
|
Basic
|
$
|
0.09
|
$
|
0.06
|
$
|
0.06
|
$
|
0.03
|
$
|
0.06
|
$
|
0.01
|
$
|
0.02
|
$
|
(0.00
|
)
|
|||||||||||||||
|
Diluted
|
$
|
0.09
|
$
|
0.05
|
$
|
0.06
|
$
|
0.03
|
$
|
0.06
|
$
|
0.01
|
$
|
0.02
|
$
|
(0.00
|
)
|
|||||||||||||||
|
Shares
used in computing net income (loss) per share:
|
||||||||||||||||||||||||||||||||
|
Basic
|
54,236
|
53,946
|
53,816
|
53,654
|
53,575
|
53,412
|
56,356
|
60,988
|
||||||||||||||||||||||||
|
Diluted
|
56,888
|
56,012
|
55,033
|
54,537
|
54,459
|
54,928
|
58,605
|
60,988
|
||||||||||||||||||||||||
Liquidity
and Capital Resources
We ended
December 31, 2009 with $200.2 million in cash, cash equivalents, and short-term
investments, consisting principally of corporate bonds, U.S. government
securities, auction rate securities, and money market funds, an increase of
$94.7 million as compared to prior year ending balance. Our primary
source of cash is receipts from sales of our products, license and services, and
issuance of common stock under employee stock option and purchase
plans. The primary uses of cash during 2009 are related to payments
for the production of our products, payroll (salaries and related benefits), and
general operating expenses (marketing, travel, office rent).
Operating
Activities
Cash
provided by operating activities for fiscal 2009 totaled $35.8 million, a $16.6
million increase in comparison to the prior year. Cash provided by
operating activities was primarily the result of the net income of $13.2 million
adjusted by non-cash items such as share-based compensation expense of $9.2
million, depreciation and amortization expense of $9.1 million, income tax
benefit from the exercise of employee stock options of $7.8 million, deferred
income taxes of $5.4 million, and changes in our operating assets and
liabilities of $17.9 million. The main drivers of the changes in
operating assets and liabilities are as follows:
|
§
|
Accounts
receivable increased due to the timing of collections. Our DSO
in accounts receivable was 41 days at December 31, 2009 compared to 34
days at December 31, 2008. The increase in DSO at December 31,
2009 as compared to December 31, 2008 was primarily due to the timing of
shipments and billings combined with certain customers electing to forgo
early payment discounts. Collection of accounts receivable and
related DSO will continue to fluctuate in future periods due to the timing
and amount of our future shipments and billings, the payment terms that we
extend to our customers, and the effectiveness of our collection
efforts.
|
|
§
|
The
decrease in inventories was primarily related to a reduction in inventory
in transit related to a change in terms on purchased inventory from FOB
shipping point to FOB destination in
2009.
|
|
§
|
The
increase in prepaid expenses and other current assets was primarily due to
(1) an increase in our deferred compensation asset primarily driven by
participant activities, and (2) an increase in the amount of deferred cost
of goods sold associated with products shipped on deferred revenue
arrangements.
|
|
§
|
The
decrease in accounts payable is primarily due to a decrease in the
payables from our operating expenses and the timing of payments to
vendors.
|
|
§
|
The
increase in accrued payroll and related benefits was primarily attributed
to (1) an increase in the accrual related to our deferred compensation
plan, and (2) an increase in amount accrued under payroll, bonuses,
commissions, and payroll taxes payable, offset by a decrease in our
vacation accrual.
|
|
§
|
Deferred
revenue increased primarily because of increased sales of subscription
services for multi-year periods as well as an increase related to
shipments to distributors whereby revenue is recognized on a sell-through
basis.
|
|
§
|
The
increase in other accrued liabilities was primarily due to an increase in
accrued taxes offset by one final settlement of the restricted cash in
escrow in connection with the acquisition of
Aventail.
|
Cash provided by operating activities for fiscal 2008 totaled $19.2 million, a $42.9 million decrease in comparison to the prior year. Cash provided by operating activities was primarily the result of the net income of $4.9 million adjusted by non-cash items such as share-based compensation expense of $10.6 million, depreciation and amortization expense of $8.9 million, income tax benefit from the exercise of employee stock options of $3.6 million, deferred income taxes of $355,000, adjustment to goodwill of $283,000, and changes in our operating assets and liabilities of $1.7 million. The main drivers of the changes in operating assets and liabilities are as follows:
|
§
|
Accounts
receivable decreased due to the timing of collections. Our DSO
in accounts receivable was 34 days at December 31, 2008 compared to 42
days at December 31, 2007. The decrease in DSO at December 31,
2008 as compared to December 31, 2007 was primarily due to the timing of
shipments and billings, combined with certain customers taking advantage
of early payment discounts.
|
|
§
|
The
increase in inventories was primarily related to the expansion of our
product line with the release of E-Class NSA and NSA UTM
products.
|
|
§
|
The
decrease in prepaid expenses and other current assets was primarily due to
(1) a decrease in our deferred compensation asset primarily driven by
participant activities, and (2) a decrease in the amount of deferred cost
of goods sold associated with products shipped on deferred revenue
arrangements.
|
|
§
|
The
decrease in accounts payable is primarily due to a decrease in the
payables related to cost of goods sold and partially offset by an increase
in the payables from our operating
expenses.
|
|
§
|
The
decrease in accrued payroll and related benefits was primarily attributed
to (1) a decrease in the accrual related to our deferred compensation
plan, (2) a decrease in amount accrued under payroll, commissions, and
payroll taxes payable, (3) a decrease in our ESPP withholding, and (4) a
decrease in our vacation accrual.
|
|
§
|
Deferred
revenue increased due to increased sales of subscription services as well
as an increase related to shipments to distributors whereby revenue is
recognized on a sell-through basis.
|
|
§
|
The
decrease in other accrued liabilities was primarily due to one final
settlement of the restricted cash in escrow in connection with the
acquisition of MailFrontier.
|
Cash
provided by operating activities for fiscal 2007 totaled $63.7 million, a $30.1
million increase in comparison to the prior year. Cash provided by
operating activities was primarily the result of the net income of $28.6 million
adjusted by non-cash items such as deferred income taxes of ($27.5) million,
share-based compensation expense of $13.5 million, adjustment to goodwill of
$7.1 million, depreciation and amortization expense of $6.0 million, in-process
research and development expense of $1.9 million, income tax benefit from the
exercise of employee stock options of $1.5 million, and changes in our operating
assets and liabilities of $34.2 million. The main drivers of the
changes in operating assets and liabilities are as follows:
|
§
|
Accounts
receivable decreased due to the timing of collections. Our DSO
in accounts receivable was 42 days at December 31, 2007 compared to 45
days at December 31, 2006. The decrease in DSO at December 31,
2007 as compared to December 31, 2006 was primarily due to the timing of
shipments and billings, combined with an increase in
revenue.
|
|
§
|
The
increase in prepaid expenses and other current assets was primarily due to
(1) an increase in our deferred compensation asset primarily from
participant contributions, and (2) an increase in the amount of deferred
cost of goods sold associated with products shipped on deferred revenue
arrangements.
|
|
§
|
The
increase in accounts payable is primarily due to an increase in the level
of cost of goods sold and operating expenses and the timing of payments to
our vendors.
|
|
§
|
The
increase in accrued payroll and related benefits was primarily attributed
to (1) an increase in the accrual related to our deferred compensation
plan, (2) an increase in amount accrued under payroll, commissions, and
payroll taxes payable, and (3) an increase in our vacation
accrual.
|
|
§
|
Deferred
revenue increased due to increased sales of subscription services as well
as an increase related to shipments to distributors whereby revenue is
recognized on a sell-through basis. In addition, as of December
31, 2007 there was approximately $3.7 million remaining in deferred
revenue derived through the acquisition of
Aventail.
|
|
§
|
The
decrease in other accrued liabilities was primarily due to final
settlement of the restricted cash in escrow in connection with the
acquisition of MailFrontier.
|
In
addition, our operating cash flows may be impacted in the future as a
result of a number of factors, including fluctuations in our operating results,
accounts receivable collections, inventory management, expensing stock options,
and the timing and amount of income tax and the timing of payments to our
vendors for accounts payable. For additional discussion, see the
section entitled “Risk Factors” in this Form 10-K.
Investing
Activities
Net cash
used in investing activities in 2009 was $52.9 million, principally as a result
of (1) the net purchase of $52.7 million in investments, (2) the purchase of
$5.3 million in property and equipment, and (3) a net decrease in restricted
cash in escrow of $5.1 million primarily due to the final payment of amounts
held in escrow in connection with the Aventail acquisition.
Net cash
provided by investing activities in 2008 was $63.1 million, principally as a
result of (1) the net sale and maturity of $66.7 million in investments, (2) a
net decrease in restricted cash in escrow of $1.4 million primarily due to the
final settlement of the MailFrontier escrow, and (3) the purchase of $5.0
million in property and equipment.
Net cash
used in investing activities in 2007 was $23.4 million, principally as a result
of (1) the acquisition of Aventail Corporation for $25.3 million, net of cash
acquired, (2) the net sale and maturity of $12.5 million in short-term
investments, (3) the purchase of $7.5 million in property and equipment and $1.8
million in intangible assets related to a license agreement for certain
intellectual property, and (4) a net increase in restricted cash in escrow of
$1.4 million primarily due to the final settlement of the MailFrontier escrow,
partially offset by the creation of a new escrow related to the Aventail
acquisition.
Financing
Activities
Net cash
provided by financing activities in 2009 was $11.0 million due to (1) $3.1
million provided by common stock issuances through employee stock option
exercises or purchase of shares under the employee stock purchase plan, and (2)
$7.8 million provided by income tax benefit from the exercise of employee stock
options.
Net cash
used in financing activities in 2008 was $70.5 million, of which $79.4 million
was used to repurchase common stock under the Company’s stock repurchase
program, partially offset by (1) $5.3 million provided by common stock issuances
through employee stock option exercises or purchase of shares under the employee
stock purchase plan; and (2) $3.6 million provided by income tax benefit from
the exercise of employee stock options.
Net cash
used in financing activities in 2007 was $32.9 million, of which $49.9 million
was used to repurchase common stock under the Company’s stock repurchase
program, partially offset by (1) $17.0 million provided by common stock
issuances through employee stock option exercises or purchase of shares under
the employee stock purchase plan; and (2) $1.5 million provided by income tax
benefit from the exercise of employee stock options.
Liquidity
and Capital Resource Requirements
We
believe our existing cash, cash equivalents, and short-term investments will be
sufficient to meet our cash requirements at least through the next twelve
months. However, we could elect to seek additional funding prior to
that time. Our future capital requirements will depend on many
factors, including our rate of revenue growth, the timing and extent of spending
to support product development efforts and expansion of sales, marketing, and
support operations, the timing of introductions of new products and enhancements
to existing products, market acceptance of our products, and pursuit of
corporate opportunities. We cannot assure you that additional equity
or debt financing will be available on acceptable terms or at
all. Our sources of liquidity beyond twelve months, in management’s
opinion, will be our then current cash balances, funds from operations and
whatever long-term credit facilities we can arrange. We have no
agreements or arrangements with third parties to provide us with sources of
liquidity and capital resources beyond twelve months. We believe that
future liquidity and capital resources will not be materially affected in the
event we are not able to prevail in litigation for which we have been named a
defendant as described in Note 11 of the Consolidated Financial
Statements.
Off-Balance
Sheet Arrangements
As of
December 31, 2009, we did not have any significant off-balance sheet
arrangements, as defined in Item 303(a)(4)(ii) of SEC Regulation
S-K.
Contractual
Obligations
We do not
have any debt, long-term obligations, or long-term capital
commitments. The following summarizes our principal contractual
commitments as of December 31, 2009 (in thousands):
|
Payments
Due by Period
|
||||||||||||||||||||
|
Less
Than
|
1
to 3
|
3
to 5
|
||||||||||||||||||
|
Total
|
One
Year
|
Years
|
Years
|
Thereafter
|
||||||||||||||||
|
Operating
lease obligations
|
$
|
15,323
|
$
|
4,265
|
$
|
6,888
|
$
|
3,764
|
$
|
406
|
||||||||||
|
Non-cancelable
purchase obligations
|
$
|
17,273
|
$
|
17,273
|
$
|
-
|
$
|
-
|
$
|
-
|
||||||||||
We
outsource our manufacturing function to third party contract manufacturers and
at December 31, 2009 we have purchase obligations totaling $19.6
million. Of this amount, $16.7 million cannot be cancelled and is
payable within one year. We are contingently liable for any inventory
owned by a contract manufacturer that becomes excess and obsolete. As
of December 31, 2009, $21,000 had been accrued for excess and obsolete inventory
held by our contract manufacturers. In addition, as of December 31,
2009 in the normal course of business, we had $0.6 million in non-cancelable
purchase commitments.
Stock
Repurchase Program
In
November 2004, the Company’s Board of Directors authorized a stock repurchase
program to reacquire up to $50 million of common stock. The term of
the stock repurchase plan was set at twelve (12) months from the date of
authorization. In February 2005, the Company’s Board of Directors
increased the amount authorized for repurchase from $50 million to $75 million,
extended the term of the program from twelve (12) to twenty-four (24) months
following the date of original authorization and increased certain predetermined
pricing formulas. In April 2005, the Company’s Board of Directors
authorized a modification to the stock repurchase program to delete certain
elements that provided for systematic repurchases.
In
February 2006, the Company’s Board of Directors approved an increase in the
amount authorized for repurchase under the Company’s share repurchase program
from $75.0 million to $100.0 million and extended the term of the program from
twenty-four (24) months to thirty-six (36) months following the date of original
authorization.
On July
24, 2007, the Company’s Board of Directors approved a follow-on program for the
repurchase of the Company’s common stock. The authorization under the
follow-on share repurchase program was $100 million plus approximately $19.6
million remaining under the share repurchase program originally authorized by
the Company’s Board of Directors in November 2004. The term of the
follow-on program was one year from the date of approval. As of
September 30, 2008, the Company had completed the Stock Repurchase Plan and
repurchased and retired 25.9 million shares of our common stock at an average
price of $7.73 per share for an aggregate purchase price of $200.0
million. There was no stock repurchase activity in
2009.
Recent
Accounting Pronouncements
The
information contained in Note 2 to the Consolidated Financial Statements under
the heading recent accounting pronouncements is hereby incorporated by reference
into this Part II, Item 7.
Interest
Rate Risk
Our
exposure to market risk for changes in interest rates relates primarily to our
cash, cash equivalents, and investment portfolio. We classified our
investments as available-for-sale except the auction rate securities in one of
our investment firms. Refer to Note 4 of the Consolidated Financial
Statements for further detailed discussion. The available-for-sale investments
are recorded on the balance sheet at the fair value with unrealized gains and
losses reported as a separate component of accumulated other comprehensive
income (loss), net of tax. As of December 31, 2009, our cash, cash
equivalents and investment portfolio included money-markets securities,
corporate bonds, municipal bonds, auction rate securities, asset backed
securities, and commercial papers which are generally subject to no interest
rate risk when held to maturity, but may increase or decrease in value if
interest rates change prior to maturity. A hypothetical 100 basis point change
in the floating interest rates applicable to the December 31, 2009 balance would
result in a change in annual interest income of approximately $2.2
million.
Fixed-rate
securities may have their fair market value adversely impacted due to a rise in
interest rates, while floating-rate securities may produce less income than
expected if interest rates fall. Due in part to these factors, our
future investment income may fall short of expectations due to changes in
interest rates or we may suffer losses in principal if we are forced to sell
securities which have declined in market value due to changes in interest
rates.
As stated
in our investment policy, we are adverse to principal loss and further the goal
of preservation of our invested funds by limiting default and market
risk. We mitigate default risk by investing in only investment-grade
instruments. As of December 31, 2009, we do not have any derivative
financial instruments in our investment portfolio.
Principal
amounts by expected year of maturity in U.S. dollars as of December 31, 2009 are
as follows (in thousands, except percentages):
|
Maturing
in
|
||||||||||||||||||||||||||||||||
|
2010
|
2011
|
2012
|
2013
|
2014
|
Thereafter
|
Total
|
Fair
Value
|
|||||||||||||||||||||||||
|
Corporate
debt securities
|
$
|
38,104
|
$
|
21,003
|
$
|
-
|
$
|
-
|
$
|
-
|
$
|
-
|
$
|
59,107
|
$
|
59,648
|
||||||||||||||||
|
Weighted
average interest rate
|
1.6%
|
2.2%
|
-
|
-
|
-
|
-
|
1.8%
|
|||||||||||||||||||||||||
|
U.S.
government securities
|
37,422
|
17,535
|
-
|
-
|
-
|
-
|
54,957
|
55,004
|
||||||||||||||||||||||||
|
Weighted
average interest rate
|
1.0%
|
0.7%
|
-
|
-
|
-
|
-
|
0.9%
|
|||||||||||||||||||||||||
|
Local
government securities
|
1,003
|
-
|
-
|
-
|
-
|
-
|
1,003
|
1,004
|
||||||||||||||||||||||||
|
Weighted
average interest rate
|
0.7%
|
-
|
-
|
-
|
-
|
-
|
0.7%
|
|||||||||||||||||||||||||
|
Asset
backed securities
|
-
|
123
|
-
|
219
|
58
|
19,691
|
20,091
|
16,470
|
||||||||||||||||||||||||
|
Weighted
average interest rate
|
-
|
5.7%
|
-
|
6.4%
|
5.2%
|
5.3%
|
5.3%
|
|||||||||||||||||||||||||
|
Auction
rate securities
|
41,975
|
-
|
-
|
-
|
-
|
10,000
|
51,975
|
43,823
|
||||||||||||||||||||||||
|
Weighted
average interest rate
|
1.7%
|
-
|
-
|
-
|
-
|
3.3%
|
2.0%
|
|||||||||||||||||||||||||
|
Total
marketable securities
|
$
|
118,504
|
$
|
38,661
|
$
|
-
|
$
|
219
|
$
|
58
|
$
|
29,691
|
$
|
187,133
|
$
|
175,949
|
||||||||||||||||
At
December 31, 2009, included within our investment portfolio are $52.0 million of
investments in auction rate securities and $20.1 million of assets backed
securities. The information contained in Note 4 to the Consolidated
Financial Statements is hereby incorporated by reference.
Foreign
Currency Risk
We
consider our exposure to foreign currency exchange rate fluctuations in general
to be moderate. We invoice substantially all of our foreign customers
from the United States in U.S. dollars and substantially all revenue is
collected in U.S. dollars. For the year ended December 31, 2009, we
earned approximately 33% of our revenue from international
markets. We may, in the future, denominate these transactions in
various local currencies. Because our sales are currently denominated
in U.S. dollars, the weakness of a foreign country’s currency against the dollar
could increase the price of our products in such country and reduce our product
unit sales by making our products more expensive in the local
currency. A weakened dollar could increase the cost of local
operating expenses and procurement of raw materials to the extent we must
purchase components in foreign currencies. As our base of
international operations expands, a greater percentage of our employee base will
be paid in local currency. As a result, our operating results may
become subject to significant fluctuations based upon changes in the exchange
rates of some currencies in relation to the U.S. dollar and diverging economic
conditions in foreign markets in which we do business. We do not
enter into forward exchange contracts to hedge exposures denominated in foreign
currencies and do not use derivative financial instruments for trading or
speculative purposes.
As our
business model changes to include greater international participation, our
exposure to foreign currency risk increases. We will continue to monitor our
exposure to currency transactions. We cannot, however, assure you
that exchange rate fluctuations will not adversely affect our financial results
in the future.
Financial
Market Risk
Included
within our investment portfolio at December 31, 2009 were ARS that we purchased
for $52.0 million whose underlying assets are primarily student loans which are
substantially backed by the federal government and ABS that were purchased for
$20.1 million whose underlying assets are all prime mortgages of which
approximately 37% are backed by the federal government. In 2008, we
accepted an offer from one of our investment banks under which the bank would
purchase over 80% of our ARS at par anytime during a two-year period beginning
June 30, 2010. In the event the liquidity of our investment bank is adversely
impacted by the current uncertainties in the financial market, they may be
unable to pay us when their payment option comes due. We may not be
able to access these funds until our investment bank is able to pay us the
offered amount, future auctions for the ARS in our portfolio are successful or
until we sell the securities in a secondary market which currently is
volatile. As of December 31, 2009, $42.0 million ARS from one
investment firm continues to be classified as current investment due to the
offer described above. The remaining $10.0 million ARS from another
investment firm and non-government backed ABS investments currently lack short
term liquidity and therefore remain classified as non-current on our December
31, 2009 balance sheet. We will continue to evaluate any changes in the market
for ARS and ABS. Depending upon future market conditions, we may be
required to record an other-than-temporary decline in market
value. In such an event, the Company’s financial condition, cash flow
and reported earnings could be negatively affected.
INDEX
TO CONSOLIDATED FINANCIAL STATEMENTS AND FINANCIAL STATEMENT
SCHEDULE
|
Page
|
|
|
Report
of Independent Registered Public Accounting Firm
|
|
|
Consolidated
Balance Sheets
|
|
|
Consolidated
Statements of Operations
|
|
|
Consolidated
Statements of Shareholders’ Equity
|
|
|
Consolidated
Statements of Cash Flows
|
|
|
Notes
to Consolidated Financial Statements
|
|
|
Financial
Statement Schedule – Valuation and Qualifying Accounts
|
The
Board of Directors and Shareholders, SonicWALL, Inc.
We have
audited the accompanying balance sheets of SonicWALL, Inc. and subsidiaries
(“the Company”) as of December 31, 2009 and 2008, and the related consolidated
statements of operations, shareholders’ equity, and cash flows for each of the
years in the three-year period ended December 31, 2009. We also have audited the
Company’s internal control over financial reporting as of December 31, 2009,
based on criteria established in Internal Control—Integrated Framework issued by
the Committee of Sponsoring Organizations of the Treadway Commission (COSO). Our
audits also included the financial statement schedule listed in the Index at
Part IV, Item 15. The Company’s management is responsible for these financial
statements, for maintaining effective internal control over financial reporting,
and for its assessment of the effectiveness of internal control over financial
reporting, included in the accompanying Management Report on Internal Control
Over Financial Reporting, appearing under Item 9A. Our responsibility is to
express an opinion on these financial statements and schedule and an opinion on
the company’s internal control over financial reporting based on our
audits.
We
conducted our audits in accordance with the standards of the Public Company
Accounting Oversight Board (United States). Those standards require that we plan
and perform the audits to obtain reasonable assurance about whether the
financial statements are free of material misstatement and whether effective
internal control over financial reporting was maintained in all material
respects. Our audits of the financial statements included examining, on a test
basis, evidence supporting the amounts and disclosures in the financial
statements, assessing the accounting principles used and significant estimates
made by management, and evaluating the overall financial statement presentation.
Our audit of internal control over financial reporting included obtaining an
understanding of internal control over financial reporting, assessing the risk
that a material weakness exists, and testing and evaluating the design and
operating effectiveness of internal control based on the assessed risk. Our
audits also included performing such other procedures as we considered necessary
in the circumstances. We believe that our audits provide a reasonable basis for
our opinions.
A
company’s internal control over financial reporting is a process designed to
provide reasonable assurance regarding the reliability of financial reporting
and the preparation of financial statements for external purposes in accordance
with generally accepted accounting principles. A company’s internal control over
financial reporting includes those policies and procedures that (1) pertain to
the maintenance of records that, in reasonable detail, accurately and fairly
reflect the transactions and dispositions of the assets of the company; (2)
provide reasonable assurance that transactions are recorded as necessary to
permit preparation of financial statements in accordance with generally accepted
accounting principles, and that receipts and expenditures of the company are
being made only in accordance with authorizations of management and directors of
the company; and (3) provide reasonable assurance regarding prevention or timely
detection of unauthorized acquisition, use, or disposition of the company’s
assets that could have a material effect on the financial
statements.
Because
of its inherent limitations, internal control over financial reporting may not
prevent or detect misstatements. Also, projections of any evaluation of
effectiveness to future periods are subject to the risk that controls may become
inadequate because of changes in conditions, or that the degree of compliance
with the policies or procedures may deteriorate.
In our
opinion, the consolidated financial statements and schedule referred to above
present fairly, in all material respects, the financial position of the Company
as of December 31, 2009 and 2008, and the results of its operations and its cash
flows for each of the years in the three-year period ended December 31, 2009 in
conformity with accounting principles generally accepted in the United States of
America. Also in our opinion, the Company maintained, in all material respects,
effective internal control over financial reporting as of December 31, 2009,
based on criteria established in Internal Control—Integrated Framework issued by
COSO.
/s/
ARMANINO McKENNA LLP
San
Ramon, California
March 5,
2010
SONICWALL,
INC.
|
December
31,
|
||||||||
|
2009
|
2008
|
|||||||
|
(In
thousands, except share data)
|
||||||||
|
ASSETS
|
||||||||
|
Current
Assets:
|
||||||||
|
Cash
and cash equivalents
|
$
|
39,071
|
$
|
45,127
|
||||
|
Short-term
investments
|
161,079
|
60,327
|
||||||
|
Accounts
receivable, net of allowance for doubtful accounts of
|
||||||||
|
$86
and $113 in 2009 and 2008, respectively
|
24,909
|
20,945
|
||||||
|
Inventories,
net
|
6,814
|
8,956
|
||||||
|
Deferred
tax assets
|
12,937
|
9,300
|
(1)
|
|||||
|
Prepaid
expenses and other current assets
|
8,071
|
11,861
|
||||||
|
Total
current assets
|
252,881
|
156,516
|
||||||
|
Property
and equipment, net
|
9,819
|
9,543
|
||||||
|
Goodwill
|
138,470
|
138,470
|
||||||
|
Long-term
investments
|
15,746
|
61,450
|
||||||
|
Deferred
tax assets, non-current
|
23,082
|
22,143
|
(1)
|
|||||
|
Purchased
intangibles and other assets, net
|
13,309
|
17,328
|
||||||
|
Total
assets
|
$
|
453,307
|
$
|
405,450
|
||||
|
LIABILITIES
AND SHAREHOLDERS' EQUITY
|
||||||||
|
Current
Liabilities:
|
||||||||
|
Accounts
payable
|
$
|
5,393
|
$
|
10,717
|
||||
|
Accrued
payroll and related benefits
|
13,457
|
11,554
|
||||||
|
Other
accrued liabilities
|
6,270
|
10,307
|
||||||
|
Deferred
revenue
|
99,252
|
88,415
|
||||||
|
Total
current liabilities
|
124,372
|
120,993
|
||||||
|
Deferred
revenue, non-current
|
24,920
|
15,072
|
||||||
|
Total
liabilities
|
149,292
|
136,065
|
||||||
|
Commitments
and contingencies (Note 11)
|
||||||||
|
Shareholders'
Equity:
|
||||||||
|
Common
stock, no par value; 200,000,000 shares authorized; 54,311,926
and
|
||||||||
|
53,575,371
shares issued and outstanding in 2009 and 2008,
respectively
|
416,388
|
396,223
|
||||||
|
Accumulated
other comprehensive loss
|
(4,284
|
)
|
(5,595
|
)(1)
|
||||
|
Accumulated
deficit
|
(108,089
|
)
|
(121,243
|
)
|
||||
|
Total shareholders'
equity
|
304,015
|
269,385
|
||||||
|
Total
liabilities and shareholders' equity
|
$
|
453,307
|
$
|
405,450
|
||||
(1) As
restated. See Note 5 for restatement details.
The
accompanying notes are an integral part of these consolidated financial
statements.
SONICWALL,
INC.
|
Year
Ended December 31,
|
||||||||||||
|
2009
|
2008
|
2007
|
||||||||||
|
(In
thousands, except per share data)
|
||||||||||||
|
Revenue:
|
||||||||||||
|
Product
|
$
|
73,847
|
$
|
90,857
|
$
|
98,936
|
||||||
|
License
and service
|
126,728
|
127,787
|
100,263
|
|||||||||
|
Total
revenue
|
200,575
|
218,644
|
199,199
|
|||||||||
|
Cost
of revenue:
|
||||||||||||
|
Product
|
39,038
|
43,507
|
40,555
|
|||||||||
|
License
and service
|
15,857
|
20,102
|
15,894
|
|||||||||
|
Amortization
of purchased technology
|
3,017
|
3,017
|
2,232
|
|||||||||
|
Total
cost of revenue
|
57,912
|
66,626
|
58,681
|
|||||||||
|
Gross
profit
|
142,663
|
152,018
|
140,518
|
|||||||||
|
Operating
expenses:
|
||||||||||||
|
Research
and development
|
37,858
|
44,176
|
39,410
|
|||||||||
|
Sales
and marketing
|
70,000
|
82,348
|
77,741
|
|||||||||
|
General
and administrative
|
17,134
|
18,613
|
21,473
|
|||||||||
|
Amortization
of purchased intangible assets
|
1,095
|
1,114
|
715
|
|||||||||
|
Restructuring
charges
|
-
|
1,683
|
-
|
|||||||||
|
In-process
research and development
|
-
|
-
|
1,930
|
|||||||||
|
Total
operating expenses
|
126,087
|
147,934
|
141,269
|
|||||||||
|
Income
(loss) from operations
|
16,576
|
4,084
|
(751
|
)
|
||||||||
|
Interest
income and other expense, net
|
3,164
|
6,368
|
11,771
|
|||||||||
|
Income
before income taxes
|
19,740
|
10,452
|
11,020
|
|||||||||
|
Benefit
(provision) for income taxes
|
(6,586
|
)
|
(5,571
|
)
|
17,601
|
|||||||
|
Net
income
|
$
|
13,154
|
$
|
4,881
|
$
|
28,621
|
||||||
|
Net
income per share:
|
||||||||||||
|
Basic
|
$
|
0.24
|
$
|
0.09
|
$
|
0.45
|
||||||
|
Diluted
|
$
|
0.24
|
$
|
0.08
|
$
|
0.43
|
||||||
|
Shares
used in computing net income per share:
|
||||||||||||
|
Basic
|
53,914
|
56,069
|
64,305
|
|||||||||
|
Diluted
|
55,568
|
57,897
|
67,099
|
|||||||||
The
accompanying notes are an integral part of these consolidated financial
statements.
SONICWALL,
INC.
(In thousands, except for share
data)
|
Common
Stock
|
||||||||||||||||||||
|
Shares
|
Amount
|
Accumulated
Other Comprehensive Loss
|
Accumulated
Deficit
|
Total
Shareholders' Equity
|
||||||||||||||||
|
BALANCE
AT DECEMBER 31, 2006
|
65,385,629
|
453,409
|
(718
|
)
|
(1)
|
(134,233
|
)
|
318,458
|
||||||||||||
|
Issuance
of common stock upon exercise of stock options
|
2,269,940
|
14,305
|
14,305
|
|||||||||||||||||
|
Issuance
of common stock in connection with the Employee Stock Purchase Plan
(ESPP)
|
378,908
|
2,730
|
2,730
|
|||||||||||||||||
|
Share-based
compensation
|
13,542
|
13,542
|
||||||||||||||||||
|
Repurchase
of common stock
|
(5,556,887
|
)
|
(39,085
|
)
|
(10,831
|
)
|
(49,916
|
)
|
||||||||||||
|
Excess
tax benefit from share-based compensation
|
1,530
|
1,530
|
||||||||||||||||||
|
Comprehensive
income:
|
||||||||||||||||||||
|
Change
in unrealized loss on investment securities, net of tax
|
(652
|
)
|
(1)
|
(652
|
)
|
|||||||||||||||
|
Net
income
|
28,621
|
28,621
|
||||||||||||||||||
|
Total
comprehensive income
|
27,969
|
|||||||||||||||||||
|
BALANCE
AT DECEMBER 31, 2007
|
62,477,590
|
446,431
|
(1,370
|
)
|
(116,443
|
)
|
328,618
|
|||||||||||||
|
Issuance
of common stock upon exercise of stock options
|
446,923
|
2,878
|
2,878
|
|||||||||||||||||
|
Issuance
of common stock in connection with ESPP
|
376,728
|
2,428
|
2,428
|
|||||||||||||||||
|
Share-based
compensation
|
10,617
|
10,617
|
||||||||||||||||||
|
Repurchase
of common stock
|
(9,725,870
|
)
|
(69,727
|
)
|
(9,681
|
)
|
(79,408
|
)
|
||||||||||||
|
Excess
tax benefit from share-based compensation
|
3,596
|
3,596
|
||||||||||||||||||
|
Comprehensive
loss:
|
||||||||||||||||||||
|
Change
in unrealized loss on investment securities, net of tax
|
(4,225
|
)
|
(1)
|
(4,225
|
)
|
|||||||||||||||
|
Net
income
|
4,881
|
4,881
|
||||||||||||||||||
|
Total
comprehensive loss
|
(656
|
)
|
||||||||||||||||||
|
BALANCE
AT DECEMBER 31, 2008
|
53,575,371
|
396,223
|
(5,595
|
)
|
(121,243
|
)
|
269,385
|
|||||||||||||
|
Issuance
of common stock upon exercise of stock options
|
362,177
|
1,737
|
1,737
|
|||||||||||||||||
|
Issuance
of common stock in connection with ESPP
|
374,378
|
1,407
|
1,407
|
|||||||||||||||||
|
Share-based
compensation
|
9,186
|
9,186
|
||||||||||||||||||
|
Excess
tax benefit from share-based compensation
|
7,835
|
7,835
|
||||||||||||||||||
|
Comprehensive
income:
|
||||||||||||||||||||
|
Change
in unrealized loss on investment securities, net of tax
|
1,311
|
1,311
|
||||||||||||||||||
|
Net
income
|
13,154
|
13,154
|
||||||||||||||||||
|
Total
comprehensive income
|
14,465
|
|||||||||||||||||||
|
BALANCE
AT DECEMBER 31, 2009
|
54,311,926
|
$
|
416,388
|
$
|
(4,284
|
)
|
$
|
(108,089
|
)
|
$
|
304,015
|
|||||||||
(1) As
restated. See Note 5 for restatement details.
The
accompanying notes are an integral part of these consolidated financial
statements.
SONICWALL,
INC.
|
Year
Ended December 31,
|
||||||||||||
|
2009
|
2008
|
2007
|
||||||||||
|
(In
thousands)
|
||||||||||||
|
CASH
FLOWS FROM OPERATING ACTIVITIES:
|
||||||||||||
|
Net
income
|
$
|
13,154
|
$
|
4,881
|
$
|
28,621
|
||||||
|
Adjustments
to reconcile net income to net cash provided by
|
||||||||||||
|
operating
activities:
|
||||||||||||
|
Depreciation
and amortization
|
9,146
|
8,939
|
5,961
|
|||||||||
|
Adjustment
of goodwill
|
-
|
283
|
7,100
|
|||||||||
|
In-process
research and development
|
-
|
-
|
1,930
|
|||||||||
|
Share-based
compensation expense related to employee stock options and
ESPP
|
9,186
|
10,617
|
13,542
|
|||||||||
|
Excess
tax benefits from share-based compensation
|
(7,835
|
)
|
(3,596
|
)
|
(1,530
|
)
|
||||||
|
Change
in fair value of financial instruments
|
(190
|
)
|
210
|
-
|
||||||||
|
Change
in allowance for doubtful accounts and others
|
(37
|
)
|
(24
|
)
|
(169
|
)
|
||||||
|
Deferred
income taxes
|
(5,440
|
)
|
(355
|
)
|
(27,474
|
)
|
||||||
|
Changes
in operating assets and liabilities, net of effects of businesses
acquired:
|
||||||||||||
|
Accounts
receivable
|
(3,937
|
)
|
5,374
|
902
|
||||||||
|
Inventories
|
2,142
|
(2,899
|
)
|
(606
|
)
|
|||||||
|
Prepaid
expenses and other current assets
|
(1,314
|
)
|
1,283
|
(1,596
|
)
|
|||||||
|
Other
assets
|
(91
|
)
|
(215
|
)
|
28
|
|||||||
|
Accounts
payable
|
(5,324
|
)
|
(158
|
)
|
3,781
|
|||||||
|
Accrued
payroll and related benefits
|
1,903
|
(8,833
|
)
|
3,366
|
||||||||
|
Other
accrued liabilities
|
3,798
|
1,477
|
103
|
|||||||||
|
Deferred
revenue
|
20,685
|
2,249
|
28,201
|
|||||||||
|
Net
cash provided by operating activities
|
35,846
|
19,233
|
62,160
|
|||||||||
|
CASH
FLOWS FROM INVESTING ACTIVITIES:
|
||||||||||||
|
Purchase
of property and equipment
|
(5,299
|
)
|
(5,035
|
)
|
(7,481
|
)
|
||||||
|
Purchase
of intangible asset
|
-
|
-
|
(1,800
|
)
|
||||||||
|
Cash
paid for acquisitions, net of cash acquired
|
-
|
-
|
(25,269
|
)
|
||||||||
|
Change
in restricted cash in escrow
|
5,104
|
1,375
|
(1,379
|
)
|
||||||||
|
Maturity
and sale of investments
|
104,023
|
183,224
|
325,747
|
|||||||||
|
Purchase
of investments
|
(156,709
|
)
|
(116,488
|
)
|
(313,230
|
)
|
||||||
|
Net
cash provided by (used in) investing activities
|
(52,881
|
)
|
63,076
|
(23,412
|
)
|
|||||||
|
CASH
FLOWS FROM FINANCING ACTIVITIES:
|
||||||||||||
|
Issuance
of common stock under employee stock option and purchase
plans
|
3,144
|
5,306
|
17,035
|
|||||||||
|
Repurchase
of common stock
|
-
|
(79,408
|
)
|
(49,916
|
)
|
|||||||
|
Excess
tax benefits from share-based compensation
|
7,835
|
3,596
|
1,530
|
|||||||||
|
Net
cash provided by (used in) financing activities
|
10,979
|
(70,506
|
)
|
(31,351
|
)
|
|||||||
|
NET
INCREASE (DECREASE) IN CASH AND CASH EQUIVALENTS
|
(6,056
|
)
|
11,803
|
7,397
|
||||||||
|
CASH
AND CASH EQUIVALENTS AT BEGINNING OF PERIOD
|
45,127
|
33,324
|
25,927
|
|||||||||
|
CASH
AND CASH EQUIVALENTS AT END OF PERIOD
|
$
|
39,071
|
$
|
45,127
|
$
|
33,324
|
||||||
|
SUPPLEMENTAL
CASH FLOW INFORMATION:
|
||||||||||||
|
Cash
paid for income taxes, net of refunds received
|
$
|
2,221
|
$
|
1,339
|
$
|
1,700
|
||||||
The
accompanying notes are an integral part of these consolidated financial
statements.
SonicWALL,
Inc. (the “Company”) was incorporated in California in February 1991 as Sonic
Systems, Inc. The name of the Company was changed to SonicWALL, Inc.
in August, 1999. SonicWALL, Inc. designs, develops, and manufactures
comprehensive network security, secure remote access, Web and e-mail security,
backup and recovery, and policy and management solutions, which enable
organizations to maximize network security without compromising network
performance.
Note
2—Summary of Significant Accounting Policies
Principles
of Consolidation
The
consolidated financial statements have been prepared in accordance with
Generally Accepted Accounting Principles in the United States of America (U.S.
GAAP) and include the accounts of the Company and its wholly owned
subsidiaries. All intercompany accounts and transactions have been
eliminated.
Use
of Estimates
The
preparation of financial statements in conformity with U.S. GAAP requires
management to make estimates and assumptions that affect the amounts reported in
the consolidated financial statements and accompanying notes. The
accounting estimates that require management’s most significant and subjective
judgments include the valuation of investments, the valuation and recognition of
revenue and accounts receivable, the valuation of inventory, the assessment of
recoverability of intangible assets and their estimated useful lives, the
valuation and recognition of share-based compensation and the recognition and
measurement of current and deferred income tax assets and
liabilities. Actual results could differ materially from these
estimates.
Foreign
Currencies
The
functional currency for all of the Company’s foreign subsidiaries is the U.S.
dollar, and accordingly, the foreign subsidiaries’ assets and liabilities are
remeasured into U.S. dollars using exchange rates at the period end or
historical exchange rate, as appropriate. The results of operations
are remeasured at the average exchange rate during each reporting
period. Currency remeasurement gains (losses) for the years ended
December 31, 2009, 2008, and 2007 amounted to $(186,000), $(361,000), and
$14,000, respectively, and are included in interest income and other expense,
net.
Cash
and Cash Equivalents
The
Company considers all highly liquid investments purchased with an original
maturity or remaining maturity at the date of purchase of three months or less
to be cash equivalents.
Investments
Available-For-Sale and Trading
Investments. The Company’s investments consist of U.S. Treasury and U.S.
government agency securities, municipal notes and bonds, auction rate securities
(“ARS”), asset backed securities (“ABS”), corporate notes and bonds, commercial
paper, and money market funds. The Company designated all investments, except
for ARS held by UBS, as available-for-sale and therefore these investments are
reported at fair value, with unrealized gains and losses recorded in accumulated
other comprehensive loss. During the fourth quarter of fiscal 2008,
the Company reclassified ARS held by UBS, one of its investment providers, from
available-for-sale to trading securities. Investments that the
Company designates as trading securities are reported at fair value, with gains
or losses resulting from changes in fair value recognized in
earnings. See Note 4 of the Company’s consolidated financial
statements for further detailed discussion. For securities sold prior
to maturity, the cost of securities sold is based on the specific identification
method. Realized gains and losses on the sale of investments are recorded in
interest income and other expense, net. Investments that are readily
convertible to cash are classified as short-term
investments. Investments that are not readily convertible to cash are
classified as long-term investments. At December 31, 2009, all ARS
except the ARS held by UBS and the non-government backed ABS are classified as
long-term investments.
Page 63
of 103
SONICWALL, INC.
NOTES TO CONSOLIDATED
FINANCIAL STATEMENTS -
(Continued)
Other-Than-Temporary Impairment. All of the Company’s available-for-sale investments are subject to a periodic impairment review. The Company recognizes an impairment charge when a decline in the fair value of its investments below the cost basis is judged to be other-than-temporary. The Company considers various factors in determining whether to recognize an impairment charge, including the length of time and extent to which the fair value has been less than the Company’s cost basis, the financial condition and near-term prospects of the investee, and the Company’s intent and ability to hold the investment for a period of time sufficient to allow for any anticipated recovery in the market value. During the years ended December 31, 2009, 2008 and 2007 the Company did not record any other-than-temporary impairment charges on its available-for-sale securities.
Fair
Value of Financial Instruments
The
carrying value of the Company’s financial instruments, including cash and cash
equivalents, short-term investments, accounts receivable, and accounts payable,
approximates their fair values due to their relatively short maturities. The
Company does not hold or issue financial instruments for trading purposes other
than the UBS auction rate securities.
Allowance
for Doubtful Accounts
Trade
accounts receivable is recorded at the invoiced amount and do not bear
interest. The allowance for doubtful accounts is based on the
Company’s assessment of the collectability of customer accounts. The
Company reviews the allowance monthly by considering factors such as historical
experience, type of receivables, credit quality, the age of the accounts
receivable balances, and the current economic conditions that may affect a
customer’s ability to pay. Account balances are charged off against
the allowance when it is probable the receivable will not be
recovered.
Concentration
of Credit Risk, Foreign Operations, and Significant Customers
Financial
instruments that potentially subject the Company to concentrations of credit
risk consist principally of cash and cash equivalents, investments and accounts
receivable. The Company maintains its cash, cash equivalents, and
investments with high quality financial institutions and limits its investment
in individual securities based on the type and credit quality of each such
security. Cash balances held with banks periodically exceed the
amount of insurance provided on such balances.
The
Company’s customer base consists of international businesses, and the Company
performs ongoing credit evaluations of its customers’ financial condition and
requires no collateral from its customers. Sales to foreign customers
for the years ended December 31, 2009, 2008, and 2007, all of which were
denominated in U.S. dollars, accounted for 33%, 34%, and 32% of total revenue,
respectively.
Sales
through our three largest distributors, Ingram Micro, Tech Data, and Arrow
represented the following percentages of total revenue:
|
Year
Ended December 31,
|
||||||||||||
|
2009
|
2008
|
2007
|
||||||||||
|
Ingram
Micro
|
18%
|
16%
|
16%
|
|||||||||
|
Tech
Data
|
17%
|
17%
|
17%
|
|||||||||
|
Arrow
|
11%
|
16%
|
18%
|
|||||||||
In
addition, Ingram Micro, Tech Data, and Arrow represented the following
percentages of our accounts receivable balance:
|
December
31,
|
||||||||||||
|
2009
|
2008
|
2007
|
||||||||||
|
Ingram
Micro
|
22%
|
12%
|
14%
|
|||||||||
|
Tech
Data
|
6%
|
10%
|
12%
|
|||||||||
|
Arrow
|
4%
|
13%
|
4%
|
|||||||||
Page 64
of 103
SONICWALL, INC.
NOTES TO CONSOLIDATED
FINANCIAL STATEMENTS -
(Continued)
While a reduction in sales by any of these distributors could be offset by an increase in sales to either of the other two distributors or by the addition of other distributors, a material reduction in sales to any of these distributors, would likely result in a temporary decline in overall sales. Uncertainties in the banking system and financial markets may continue to impact the availability of credit. The lowering of the level of liquidity in the credit markets may impact the ability of our distributors to obtain credit to finance purchases of our products and services. If the liquidity of our distributors is adversely impacted by the uncertainties in the financial markets, they may be unable to pay us in a timely manner. If any of the foregoing should occur, our rate of revenue growth will suffer, our revenue may decline and our business will be adversely affected.
The
Company outsources its manufacturing to third party contract manufacturers and
some of the key components in the Company’s products come from a single or
limited number of suppliers. The inability of any supplier or
manufacturer to fulfill supply requirements of the Company could materially
impact future operating results.
Inventories
Inventories
are stated at the lower of standard cost (which approximates cost determined on
a first-in, first-out basis) or market. The Company writes down the
value of inventories for estimated excess and obsolete inventories based upon
assumptions about future demand and market conditions. Inventories
consist primarily of finished systems. Inventory reserves, once
established, are only reversed upon sale or disposition of related
inventories.
Property
and Equipment
Property
and equipment are stated at cost less accumulated depreciation and
amortization. Depreciation is computed using the straight-line method
over the estimated useful lives of the related assets, which range from three to
five years. Leasehold improvements are amortized over the lesser of
the related lease term or the estimated useful life of the improvement, which
ranges from one to five years. Depreciation and amortization expenses
for the years ended December 31, 2009, 2008 and 2007 were $5.0 million, $4.8
million, and $3.0 million, respectively. Gains or losses on disposals are
included in the results of operations at amounts equal to the difference between
the net book value of the disposed assets and the proceeds received upon
disposal. Costs for replacements and betterments are capitalized,
while the costs of repairs and maintenance are charged against earnings as
incurred.
Purchased
Intangibles and Other Long-Lived Assets
Purchased
intangibles consist of purchased technology, customer installed
base/relationships, customer backlog and other
intangibles. Intangible assets are amortized on a straight-line basis
over their estimated useful lives which range from 3 months to eight
years. Amortization of intangible assets was $4.1 million, $4.1
million, and $2.9 million in fiscal 2009, 2008, and 2007,
respectively. The Company periodically evaluates its intangible and
other long-lived assets for indications of impairment. If this
evaluation indicates that the value of the asset may be impaired, the Company
makes an assessment of the recoverability of the net carrying value of the asset
over its remaining useful life. If this assessment indicates that the
intangible or other long-lived asset is not recoverable, based on the estimated
undiscounted future cash flows of the technology over the remaining amortization
period, the Company reduces the net carrying value of the related asset to fair
value and may adjust the remaining amortization period.
Goodwill
and Impairment of Goodwill
Goodwill
represents the excess of the aggregate purchase price over the fair market value
of the net tangible and intangible assets acquired by the
Company. Goodwill is tested for impairment on December 31st of
each fiscal year or more often if an event or circumstances indicate that an
impairment loss has been incurred. An impairment charge is recognized
if a reporting unit’s goodwill carrying amount exceeds its implied fair
value. Goodwill impairment is determined using a two-step approach
with one or more of the following fair value measures including: present value
techniques of estimated future cash flows; or valuation techniques based on
multiples of earnings or revenue; or a similar performance
measure. Any such impairment charge could be significant and could
have a material adverse effect on the Company’s reported financial
statements. The goodwill recorded as a result of the business
combinations in the years presented is not deductible for tax
purposes.
Page 65
of 103
SONICWALL, INC.
NOTES TO CONSOLIDATED
FINANCIAL STATEMENTS -
(Continued)
The Company operates as one reportable segment, which is also the only reporting unit. On December 31, 2009, based on the Public Share Price Methodology, the fair value exceeded the carrying value of the single reporting unit by over 72%. The impairment test on December 31, 2009 indicated that the goodwill was not impaired. The Company also performed the annual assessment on December 31, 2008 and no indication of impairment was noted. Goodwill as of December 31, 2009 was $138 million. There can be no assurances that future goodwill impairments will not occur.
Interest
Income and Other Expense, Net
Interest
income and other expense, net consist primarily of interest income in the amount
of $3.1 million, $7.0 million, and $11.9 million for the years ended December
31, 2009, 2008 and 2007, respectively.
Share-Based
Compensation
The
Company measures and recognizes the compensation expenses for all share-based
payment awards made to employees and directors including employee stock options
and employee stock purchases related to the Employee Stock Purchase Plan
(“employee stock purchases”) based on the grant date fair value estimated using
a Black-Scholes option-pricing model. The Company estimates the
forfeiture rate at the time of grant and revised, if necessary, in subsequent
periods if actual forfeitures differ from those estimates. Share-based
compensation expense recognized in the Consolidated Statements of Operations are
based on awards ultimately expected to vest and has been reduced for estimated
forfeitures. The value of the portion of the award that is ultimately
expected to vest is recognized as expenses using the straight-line single option
method over the requisite service periods in the Company’s Consolidated
Statements of Operations.
Share-based
compensation expenses recognized in the Company’s Consolidated Statements of
Operations for the years ended December 31, 2009, 2008, and 2007 included
compensation expenses for share-based payment awards granted prior to, but not
yet vested as of December 31, 2005 and compensation expenses for the
share-based payment awards granted subsequent to December 31,
2005. The grant date fair value for share-based payment awards
granted has been estimated using a Black-Scholes option-pricing
model.
See Note
12 for additional information on share-based compensation.
Revenue
Recognition
The
Company derives its revenue primarily from the sale of: (1) products, (2)
software licenses, (3) subscriptions for services; and (4) other services such
as extended warranty and service contracts, training, consulting and engineering
services. As described below, significant management judgments and
estimates must be made and used in connection with the revenue recognized in any
accounting period. The Company may experience material differences in
the amount and timing of its revenue for any period if management makes
different judgments or utilizes different estimates.
The
Company recognizes revenue for products when persuasive evidence of an
arrangement exists, the product has been delivered, title and risk of loss have
been transferred to the customer, the fee is fixed or determinable, and
collection of the resulting receivable is reasonably assured. While
the Company’s sales agreements contain standard terms and conditions, some
agreements include non-standard terms and conditions. In these cases,
interpretation of non-standard provisions is required to determine the
appropriate accounting for the transaction.
Retroactive
price protection rights resulting from price reductions on products previously
sold to customers are contractually offered to the Company’s channel
partners. The Company evaluates the revenue impact of these rights
carefully based on stock on hand in the channels and records a provision for
estimated future price protection credit. Revenue from certain distributors is
not recognized until these distributors sell the product to their
customers. As a consequence, there is no provision required for sales
to these distributors. In general, retroactive price adjustments are
not significant. At December 31, 2009, 2008, and 2007, the Company
recorded a provision for price protection on sales to the Company’s channel
partners in the amounts of $0, $200,000, and $985,000,
respectively.
Page 66
of 103
SONICWALL, INC.
NOTES TO
CONSOLIDATED FINANCIAL STATEMENTS - (Continued)
Delivery
to customers is generally deemed to occur when we deliver the product to a
common carrier. Certain distributor agreements provide customers with
rights of return for stock rotation. These stock rotation rights are
generally limited to 15% to 25% of the distributor's purchases for the
immediately prior 3 to 6 months period or contain other measurable restrictions,
and we estimate reserves for these return rights as discussed
below. Certain distributors have rights of return under certain
circumstances that are not limited; therefore, we do not deem delivery to have
occurred for any sales to these distributors until they sell the product to
their customers.
Evidence
of an arrangement is manifested by a master distribution or OEM (Original
Equipment Manufacturer) agreement, an individual binding purchase order, or a
signed license agreement. In most cases, sales through our
distributors and OEM partners are governed by a master agreement against which
individual binding purchase orders are placed on a transaction-by-transaction
basis.
At the
time of the transaction, the Company assesses whether the fee associated with
the transaction is fixed or determinable, and whether or not collection is
reasonably assured. The Company assesses whether the fee is fixed or
determinable based upon the terms of the binding purchase order, including the
payment terms associated with the transaction. If a significant
portion of a fee is due beyond the Company’s normal payment terms, typically 30
to 90 days from invoice date, the Company accounts for the fee as not being
fixed or determinable and recognizes revenue as the fees become
due.
The
Company assesses probability of collection based on a number of factors,
including past transaction history with, and the credit-worthiness of, the
customer. The Company does not request collateral from its
customers. If the Company determines that collection of a fee is not
reasonably assured, it defers the fee and recognizes revenue at the time
collection becomes reasonably assured, which is generally upon receipt of
cash.
For
arrangements with multiple obligations (for example, the sale of an appliance
which includes a year of maintenance or a subscription based product), the
Company allocates revenue first to undelivered components of the arrangement
based on the vendor specific objective evidence of fair value of the undelivered
elements, which is generally the average selling price of each element when sold
separately. This allocation process means that the Company defers
revenue from the arrangement equal to the fair value of the undelivered elements
and recognizes such amounts as revenue when the elements are
delivered.
The
Company’s arrangements do not generally include acceptance
clauses. However, if an arrangement includes an acceptance provision,
recognition of revenue occurs upon the earlier of receipt of a written customer
acceptance or expiration of the acceptance period.
License
and service revenue includes revenue from subscription service licenses,
technical support services and perpetual software licenses. The Company
recognizes revenue for subscriptions and services such as content filtering,
anti-virus protection and intrusion prevention, and extended warranty and
service contracts, ratably over the contract term. The Company’s
training, consulting and engineering services are generally billed and
recognized as revenue as these services are performed.
The
Company collects and remits sales taxes on products and services that it
purchases and sells under its contracts with customers, and reports
such amounts under the net method in its consolidated statements of
operations. Accordingly, there are no sales taxes included in
revenue.
Sales
Returns, Other Allowances, and Warranty Reserve
The
preparation of financial statements in accordance with U.S. GAAP requires the
Company to make estimates and assumptions that affect the reported amount of
assets and disclosure of contingent assets and liabilities at the date of the
financial statements and the reported amounts of revenue and expenses during the
reported period. Specifically, the Company must make estimates of
potential future product returns and price changes related to current period
product revenue. The Company analyzes historical returns, current
economic trends, and changes in customer demand and acceptance of its products
when evaluating the adequacy of the sales returns and other
allowances. Significant management judgments and estimates must be
made and used in connection with establishing the sales returns and other
allowances in any accounting period. The Company may experience
material differences in the amount and timing of its revenue for any period if
management makes different judgments or utilizes different
estimates.
Page 67
of 103
SONICWALL, INC.
NOTES TO
CONSOLIDATED FINANCIAL STATEMENTS - (Continued)
The Company’s appliance products are generally covered by a warranty for a one year period. The Company accrues a warranty reserve for estimated costs to provide warranty services, including the cost of technical support, product repairs, and product replacement for units that cannot be repaired. The estimate of costs to fulfill the Company’s warranty obligations is based on historical experience and expectation of future conditions. To the extent the Company experiences increased warranty claim activity or increased costs associated with servicing those claims, its warranty accrual will increase, resulting in decreased gross profit.
Shipping
and Handling Costs
The
Company records costs related to shipping and handling of products in cost of
revenue for all periods presented.
Income
Taxes
The Company accounts for income taxes under the liability method, which requires, among other things, that deferred income taxes be provided for temporary differences between the tax basis of the Company’s assets and liabilities and their financial statement reported amounts. Deferred tax assets are recorded for the future benefit of utilizing net operating losses, research and development credit carry forwards and temporary differences. A valuation allowance is provided to reduce deferred tax assets to an amount for which realization is more likely than not. For unrealized losses on debt securities held as available-for-sale, the Company records the tax impact in comprehensive income. Valuation allowances relative to deferred tax assets established for unrealized losses on debt securities held as available-for-sale are evaluated separately from other deferred tax assets. A valuation allowance is not recorded on such deferred tax assets as the company has the intent and ability to hold the underlying debt security until recovery, which may be maturity.
Research
and Development and Capitalized Software Development Costs
Software
development costs incurred prior to the establishment of technological
feasibility are charged to research and development expense as
incurred. Technological feasibility is established upon completion of
a working model, which is typically demonstrated by initial beta
shipment. Software development costs incurred subsequent to the time
a product’s technological feasibility has been established, through the time the
product is available for general release to customers, are capitalized if
material. To date, software development costs incurred subsequent to
the establishment of technological feasibility have been immaterial and
accordingly have not been capitalized.
Advertising
Costs
The
Company expenses advertising costs as incurred. Advertising expense
totaled $1.2 million, $4.4 million, and $5.8 million for the years ended
December 31, 2009, 2008 and 2007, respectively.
The
Company has agreements with certain of its distributors to provide marketing
development funds. In 2008 and 2007, the Company accounted for such
fees as a reduction in revenue, unless there is an identifiable benefit and the
fair value of the charges can be reasonably estimated in which case the Company
records these transactions as marketing expense. In the years ended
December 31, 2008, and 2007, the Company incurred operating expense for
marketing development funds of $2.9 million, and $4.1 million, respectively. In
2009, the Company accounts for such funds as a reduction in
revenue.
Computation
of Net Income Per Share
Basic net
income per share is computed by dividing the net income for the period by the
weighted average number of common shares outstanding during the
period. Weighted average shares exclude shares subject to repurchase
(“restricted shares”). Diluted net income per share is computed by
dividing the net income for the period by the weighted average number of common
and potential dilutive securities outstanding during the
period. Potential dilutive securities are composed of incremental
common shares issuable upon the exercise of stock options.
Page 68
of 103
SONICWALL, INC.
NOTES TO
CONSOLIDATED FINANCIAL STATEMENTS - (Continued)
The
following table sets forth the computation of basic and diluted net income per
share for the periods indicated (in thousands, except per share
amounts):
|
Year
Ended December 31,
|
||||||||||||
|
2009
|
2008
|
2007
|
||||||||||
|
Numerator:
|
||||||||||||
|
Net
income
|
$
|
13,154
|
$
|
4,881
|
$
|
28,621
|
||||||
|
Denominator:
|
||||||||||||
|
Weighted
average shares used to compute basic EPS
|
53,914
|
56,069
|
64,305
|
|||||||||
|
Effect
of dilutive securities:
|
||||||||||||
|
Dilutive
common stock equivalents
|
1,654
|
1,828
|
2,794
|
|||||||||
|
Weighted
average shares used to compute diluted EPS
|
55,568
|
57,897
|
67,099
|
|||||||||
|
Net
income per share:
|
||||||||||||
|
Basic
|
$
|
0.24
|
$
|
0.09
|
$
|
0.45
|
||||||
|
Diluted
|
$
|
0.24
|
$
|
0.08
|
$
|
0.43
|
||||||
For the
years ended December 31, 2009, 2008, and 2007, 15,000,856, 13,697,705, and
838,437 stock options with a weighted average exercise price of $8.49, $8.59,
and $16.22, respectively, were not included in the computation of diluted
earnings per share because the options’ exercise prices were greater than the
average market price of the common shares for the period and therefore, the
effect would be anti-dilutive.
Recent
Accounting Pronouncements
In
October 2009, the FASB issued Accounting Standard Update (“ASU”) No. 2009-13,
Multiple-Deliverable Revenue
Arrangements (“ASU 2009-13”) and No. 2009-14, Certain Revenue Arrangements that
include Software Elements (“ASU 2009-14”). These standards update FASB
ASC 605, Revenue Recognition
(“ASC 605”) and FASB ASC 985, Software (“ASC 985”). The
amendments to ASC 605 requires entities to allocate revenue in an arrangement
using estimated selling prices of the delivered goods and services based on a
selling price hierarchy. The amendments to ASC 985 remove tangible products from
the scope of software revenue guidance and provide guidance on determining
whether software deliverables in an arrangement that includes a tangible product
are covered by the scope of the software revenue guidance. These amendments to
ASC 605 and ASC 985 should be applied on a prospective basis for revenue
arrangements entered into or materially modified in fiscal years beginning on or
after June 15, 2010, with early adoption permitted. The Company adopted these
amendments on January 1, 2010. Management estimates that the impact
of the adoption on the Company’s consolidated financial statements will be a 2%
increase in revenue recognized in the fiscal year with a corresponding decrease
in deferred revenue.
In
January 2010, the FASB issued ASU No. 2010-06, Fair Value Measurements and
Disclosures (“ASU 2010-06”). This standard updates FASB ASC
820, Fair Value
Measurements (“ASC 820”). ASU 2010-06 requires additional disclosures
about fair value measurements including transfers in and out of Levels 1 and 2
and separate disclosures about purchases, sales, issuances, and settlements
relating to Level 3 measurements. It also clarifies existing fair value
disclosures about the level of disaggregation and about inputs and valuation
techniques used to measure fair value. The standard is effective for interim and
annual reporting periods beginning after December 15, 2009 except for the
disclosures about purchases, sales, issuances and settlements which is effective
for fiscal years beginning after December 15, 2010 and for interim periods
within those fiscal years. The Company adopted ASU 2010-06 on January
1, 2010, which had no material impact on the Company’s consolidated financial
statements.
Page 69
of 103
SONICWALL, INC.
NOTES TO
CONSOLIDATED FINANCIAL STATEMENTS - (Continued)
Note 3—Balance Sheet Components
The
following table presents more information related to our balance sheet
accounts.
|
December
31,
|
||||||||
|
2009
|
2008
|
|||||||
|
(in
thousands)
|
||||||||
|
Prepaid
expenses and other current assets:
|
||||||||
|
Cash
in escrow
|
$
|
-
|
$
|
5,104
|
||||
|
Deferred
compensation asset
|
4,150
|
3,430
|
||||||
|
Other
prepaid expenses
|
3,921
|
3,327
|
||||||
|
$
|
8,071
|
$
|
11,861
|
|||||
|
Property
and equipment, net:
|
||||||||
|
Equipment
|
$
|
16,465
|
$
|
19,787
|
||||
|
Office
equipment and furniture
|
4,923
|
5,371
|
||||||
|
Leasehold
improvements
|
1,940
|
2,364
|
||||||
|
Software
|
5,330
|
10,824
|
||||||
|
28,658
|
38,346
|
|||||||
|
Less:
accumulated depreciation
|
(18,839
|
)
|
(28,803
|
)
|
||||
|
$
|
9,819
|
$
|
9,543
|
|||||
|
Purchased
intangibles and other assets, net:
|
||||||||
|
Purchased
intangible assets
|
$
|
77,650
|
$
|
77,650
|
||||
|
Other
assets
|
1,264
|
1,171
|
||||||
|
78,914
|
78,821
|
|||||||
|
Less:
accumulated amortization
|
(65,605
|
)
|
(61,493
|
)
|
||||
|
$
|
13,309
|
$
|
17,328
|
|||||
|
Other
accrued liabilities:
|
||||||||
|
Accrued
acquisition costs
|
$
|
-
|
$
|
5,104
|
||||
|
Warranty
reserves
|
537
|
575
|
||||||
|
Income
taxes payable
|
2,177
|
97
|
||||||
|
Other
accrued liabilities
|
3,556
|
4,531
|
||||||
|
$
|
6,270
|
$
|
10,307
|
|||||
Page 70
of 103
SONICWALL, INC.
NOTES TO
CONSOLIDATED FINANCIAL STATEMENTS - (Continued)
Note 4—Financial Instruments
Available-for-sale
securities
The
following is a summary of our available-for-sale securities (in
thousands):
|
As
of December 31, 2009
|
Fair
Value
|
Gross
Unrealized Gains
|
Gross
Unrealized (Losses)
|
Amortized
Cost
|
||||||||||||
|
Corporate
debt securities
|
||||||||||||||||
|
Auction
rate securities
|
$ | 6,713 | $ | - | $ | (3,296 | ) | $ | 10,009 | |||||||
|
Asset
backed securities
|
16,470 | 15 | (3,725 | ) | 20,180 | |||||||||||
|
Corporate
bonds
|
59,648 | 68 | (75 | ) | 59,655 | |||||||||||
|
Total
corporate debt securities
|
82,831 | 83 | (7,096 | ) | 89,844 | |||||||||||
|
Local
government securities
|
1,004 | - | - | 1,004 | ||||||||||||
|
U.S.
government securities
|
55,004 | 3 | (24 | ) | 55,025 | |||||||||||
|
Total
available-for-sale securities
|
$ | 138,839 | $ | 86 | $ | (7,120 | ) | $ | 145,873 | |||||||
|
Included
in cash equivalent
|
$ | 3,999 | $ | - | $ | - | $ | 3,999 | ||||||||
|
Included
in short-term investments
|
119,094 | 86 | (133 | ) | 119,141 | |||||||||||
|
Included
in long-term investments
|
15,746 | - | (6,987 | ) | 22,733 | |||||||||||
|
Total
available-for-sale securities
|
$ | 138,839 | $ | 86 | $ | (7,120 | ) | $ | 145,873 | |||||||
|
As
of December 31, 2008
|
Fair
Value
|
Gross
Unrealized Gains
|
Gross
Unrealized (Losses)
|
Amortized
Cost
|
||||||||||||
|
Corporate
debt securities
|
||||||||||||||||
|
Auction
rate securities
|
$ | 6,565 | $ | - | $ | (3,444 | ) | $ | 10,009 | |||||||
|
Asset
backed securities
|
34,905 | 60 | (5,809 | ) | 40,654 | |||||||||||
|
Corporate
bonds
|
12,816 | 26 | (5 | ) | 12,795 | |||||||||||
|
Total
corporate debt securities
|
54,286 | 86 | (9,258 | ) | 63,458 | |||||||||||
|
U.S.
government securities
|
22,336 | 35 | (72 | ) | 22,373 | |||||||||||
|
Total
available-for-sale securities
|
$ | 76,622 | $ | 121 | $ | (9,330 | ) | $ | 85,831 | |||||||
|
Included
in short-term investments
|
$ | 60,288 | $ | 116 | $ | (248 | ) | $ | 60,420 | |||||||
|
Included
in long-term investments
|
16,334 | 5 | (9,082 | ) | 25,411 | |||||||||||
|
Total
available-for-sale securities
|
$ | 76,622 | $ | 121 | $ | (9,330 | ) | $ | 85,831 | |||||||
The estimated fair value and amortized cost of available-for-sale securities by contractual maturity as of December 31, 2009 and 2008 were as follows (in thousands):
|
As
of December 31, 2009
|
As
of December 31, 2008
|
|||||||||||||||
|
Fair
Value
|
Amortized
Cost
|
Fair
Value
|
Amortized
Cost
|
|||||||||||||
|
Due
within one year
|
$
|
71,793
|
$
|
71,754
|
$
|
29,320
|
$
|
29,265
|
||||||||
|
Due
between one and five years
|
44,280
|
44,333
|
6,450
|
6,502
|
||||||||||||
|
Due
between five and ten years
|
-
|
-
|
1,697
|
1,687
|
||||||||||||
|
Due
after ten years
|
22,766
|
29,786
|
39,155
|
48,377
|
||||||||||||
|
Total
available-for-sale securities
|
$
|
138,839
|
$
|
145,873
|
$
|
76,622
|
$
|
85,831
|
||||||||
Page 71
of 103
SONICWALL, INC.
NOTES TO
CONSOLIDATED FINANCIAL STATEMENTS - (Continued)
The proceeds and realized gains and losses from sales of available-for-sale securities, and the amount of the net unrealized gains and losses on available-for-sale securities that has been included in other comprehensive income for 2009, 2008, and 2007 were as follows (in thousands):
|
Year
Ended December 31,
|
||||||||||||
|
2009
|
2008
|
2007
|
||||||||||
|
Proceeds
from sales
|
$
|
103,783
|
$
|
183,296
|
$
|
326,660
|
||||||
|
Realized
gains
|
28
|
67
|
-
|
|||||||||
|
Realized
losses
|
(2
|
)
|
(13
|
)
|
-
|
|||||||
|
Net
unrealized gains (losses)
|
||||||||||||
|
included
in other comprehensive income
|
$
|
2,175
|
$
|
(6,925
|
)
|
$
|
(1,087
|
)
|
||||
The
following tables provide the breakdown of the investments with unrealized losses
for which other-than-temporary impairments have not been recognized in earnings
at December 31, 2009 and 2008 (in thousands):
|
December
31, 2009
|
Unrealized
Losses Less Than 12 Months
|
Unrealized
Losses 12 Months or Greater
|
Total
|
|||||||||||||||||||||
|
Available-for-sale
securities
|
Fair
Value
|
Gross
Unrealized Losses
|
Fair
Value
|
Gross
Unrealized Losses
|
Fair
Value
|
Gross
Unrealized Losses
|
||||||||||||||||||
|
Corporate
debt securities
|
||||||||||||||||||||||||
|
Auction
rate securities
|
$ | - | $ | - | $ | 6,713 | $ | (3,296 | ) | $ | 6,713 | $ | (3,296 | ) | ||||||||||
|
Asset
backed securities
|
6,794 | (34 | ) | 9,317 | (3,692 | ) | 16,111 | (3,726 | ) | |||||||||||||||
|
Corporate
bonds
|
22,097 | (75 | ) | - | - | 22,097 | (75 | ) | ||||||||||||||||
|
Total
corporate debt securities
|
28,891 | (109 | ) | 16,030 | (6,988 | ) | 44,921 | (7,097 | ) | |||||||||||||||
|
U.S.
government securities
|
28,636 | (23 | ) | 3,354 | (1 | ) | 31,990 | (24 | ) | |||||||||||||||
|
Total
marketable securities
|
$ | 57,527 | $ | (132 | ) | $ | 19,384 | $ | (6,989 | ) | $ | 76,911 | $ | (7,121 | ) | |||||||||
|
December
31, 2008
|
Unrealized
Losses Less Than 12 Months
|
Unrealized
Losses 12 Months or Greater
|
Total
|
|||||||||||||||||||||
|
Available-for-sale
securities
|
Fair
Value
|
Gross
Unrealized Losses
|
Fair
Value
|
Gross
Unrealized Losses
|
Fair
Value
|
Gross
Unrealized Losses
|
||||||||||||||||||
|
Corporate
debt securities
|
||||||||||||||||||||||||
|
Auction
rate securities
|
$ | 6,565 | $ | (3,444 | ) | $ | - | $ | - | $ | 6,565 | $ | (3,444 | ) | ||||||||||
|
Asset
backed securities
|
- | - | 22,230 | (5,809 | ) | 22,230 | (5,809 | ) | ||||||||||||||||
|
Corporate
bonds
|
618 | (5 | ) | - | - | 618 | (5 | ) | ||||||||||||||||
|
Total
corporate debt securities
|
7,183 | (3,449 | ) | 22,230 | (5,809 | ) | 29,413 | (9,258 | ) | |||||||||||||||
|
U.S.
government securities
|
8,232 | (72 | ) | - | - | 8,232 | (72 | ) | ||||||||||||||||
|
Total
marketable securities
|
$ | 15,415 | $ | (3,521 | ) | $ | 22,230 | $ | (5,809 | ) | $ | 37,645 | $ | (9,330 | ) | |||||||||
As of
December 31, 2009, the Company had 43 investments with unrealized losses for
which other-than-temporary impairments have not been recognized in
earnings.
In
February 2008, auctions began to fail for the ARS. Since auctions for ARS
continue to fail, the investments are not currently liquid. The Company does not
expect the need to access these funds in the short-term, however, in the event
the Company needs to access these funds, they are not expected to be accessible
until one of the following occurs: a successful auction occurs, the issuer
redeems the issue, a buyer is found outside of the auction process or the
underlying securities mature. Based on these factors, along with the
underlying maturities of the securities, a portion of which is greater than 20
years, the Company has classified these ARS except the ARS from UBS as long-term
assets on its Consolidated Balance Sheet as of December 31,
2009. As of December 31, 2008, the Company classified all ARS as
long-term assets in its Consolidated Balance Sheet. The failures of these
auctions do not affect the value of the collateral underlying the ARS, and the
Company continues to earn and receive interest on its ARS based on a
pre-determined formula. The Company intends to
Page 72
of 103
SONICWALL, INC.
NOTES TO
CONSOLIDATED FINANCIAL STATEMENTS - (Continued)
retain its investment in these ARS until the earlier of anticipated recovery in market value or maturity and as a result has not recorded an other-than-temporary loss on these ARS.
As of
December 31, 2009, the Company had $7.4 million in ABS backed by agencies of the
U.S. Government. These securities could be generally liquidated
within a timeframe of three to nine months and are included in short-term
investments on the consolidated balance sheet. For the remaining $9.0
million in non-government backed ABS, the market continues to be
illiquid. As a result, the Company has classified these as long-term
investments. The Company has both the intent and the ability to hold
these investments until a recovery of the fair value occurs, which may be at
maturity, evidenced by its cash and short-term investment position and the
ability to generate positive cash flows from its operations.
The
unrealized losses on U.S. corporate debt and U.S. government agency securities
were the result of overall market risk aversion, lack of demand for securities
that are not government guaranteed, and the relative widening of credit spreads
relative to the U.S. treasuries. The Company believes that it will be able to
collect all principal and interest amounts due at maturity given the high credit
quality of these investments. Since the decline in the market value is
attributable to changes in market conditions and not credit quality, and since
the Company has the ability and intent to hold these investments until a
recovery of par value, which may be maturity, the Company does not consider
these investments to be other-than temporarily impaired as of December 31,
2009.
Trading
securities
In
November 2008, the Company accepted an offer (the “Right”) from UBS entitling
the Company to sell to UBS at par value ARS originally purchased from UBS
(approximately $45.3 million, par value) at anytime during the period
June 30, 2010 through July 2, 2012. In accepting the Right,
the Company also granted UBS the authority to sell or auction the ARS at par at
any time after accepting the offer until the expiration date of the offer
provided that the Company receive par value of their ARS. As part of
the offer, the Company released UBS from any claims relating to the marketing
and sale of ARS. Although the Company expects to sell its ARS under the Right,
if the Right is not exercised before July 2, 2012, the Right will expire
and UBS will have no further right or obligation to buy the Company’s ARS. UBS’s
obligations under the Right are not secured by its assets and do not require UBS
to obtain any financing to support its performance obligations under the Right.
UBS has disclaimed any assurance that it will have sufficient financial
resources to satisfy its obligations under the Right.
The
Company believes the enforceability of the Right results in a put option and
should be recognized as a separate freestanding asset and accounted for
separately from the ARS investment. The Company valued the Right using a
discounted cash flow approach including estimates of interest rates, timing and
amount of cash flows, adjusted for any bearer risk associated with UBS’s
financial ability to repurchase the ARS beginning June 30, 2010. These
assumptions are volatile and subject to change if the underlying sources of
these assumptions and market conditions change. As of December 31, 2009 and
2008, the Company recorded $4.9 million and $7.6 million, respectively, as the
fair value of the put option asset.
Prior to
accepting the UBS offer, the Company recorded its ARS as available-for-sale
investments. In connection with the acceptance of the UBS offer in November
2008, resulting in a right to require UBS to purchase the ARS at par value
beginning on June 30, 2010, the Company has reclassified the related
portion of its ARS subject to the Right and held by UBS from available-for-sale
securities to trading securities. The transfer to trading securities reflects
management’s intent to exercise its put option during the period from
June 30, 2010 to July 3, 2012. Upon the reclassification of the
related ARS to trading securities as of December 31, 2008, the Company
immediately recognized a loss of $7.8 million, included in Interest and other
income, net, for the amount of the unrealized loss not previously recognized in
earnings. This loss was offset against the fair value of the put
option asset, which was $7.6 million.
As of
December 31, 2009, the ARS from UBS and its related Right are still held as
trading securities and the unrealized gains on trading securities that have been
included in net income for the year ended December 31, 2009, were $190,000, net
of losses on the related offer from UBS.
Page 73
of 103
SONICWALL, INC.
NOTES TO
CONSOLIDATED FINANCIAL STATEMENTS - (Continued)
Fair Value of Financial Instruments
The
following table represents the Company’s assets and liabilities required to be
measured at fair value on a recurring basis as of December 31, 2009 (in
thousands):
|
Fair
Value Measurements at December 31, 2009 Using
|
||||||||||||||||
|
Quoted
Prices in Active Markets for Identical Assets
|
Significant
Other Observable Inputs
|
Significant
Unobservable Inputs
|
||||||||||||||
|
Total
|
(Level
1)
|
(Level
2)
|
(Level
3)
|
|||||||||||||
|
Money
market funds (1)
|
$
|
23,981
|
$
|
23,981
|
$
|
-
|
$
|
-
|
||||||||
|
Asset
backed securities (2)
|
16,470
|
-
|
7,429
|
9,041
|
||||||||||||
|
Auction
rate securities (3)
|
43,823
|
-
|
-
|
43,823
|
||||||||||||
|
Auction
rate securities right (4)
|
4,875
|
-
|
-
|
4,875
|
||||||||||||
|
Other
available-for-sale securities (5)
|
115,656
|
115,656
|
-
|
-
|
||||||||||||
|
Total
|
$
|
204,805
|
$
|
139,637
|
$
|
7,429
|
$
|
57,739
|
||||||||
The
following table represents the Company’s financial assets (cash equivalents and
investments) measured at fair value on a recurring basis as of December 31,
2008 (in thousands):
|
Fair
Value Measurements at December 31, 2008 Using
|
||||||||||||||||
|
Quoted
Prices in Active Markets for Identical Assets
|
Significant
Other Observable Inputs
|
Significant
Unobservable Inputs
|
||||||||||||||
|
Total
|
(Level
1)
|
(Level
2)
|
(Level
3)
|
|||||||||||||
|
Money
Market Funds (1)
|
$
|
25,211
|
$
|
25,211
|
$
|
-
|
$
|
-
|
||||||||
|
Asset
Backed Securities (2)
|
34,905
|
-
|
-
|
34,905
|
||||||||||||
|
Auction
Rate Securities (3)
|
44,079
|
-
|
-
|
44,079
|
||||||||||||
|
Auction
Rate Securities Right (4)
|
7,640
|
-
|
-
|
7,640
|
||||||||||||
|
Other
available-for-sale Securities (5)
|
35,152
|
35,152
|
-
|
-
|
||||||||||||
|
Total
|
$
|
146,987
|
$
|
60,363
|
$
|
-
|
$
|
86,624
|
||||||||
_______________
Note:
|
(1)
|
Classified
as cash and cash equivalents.
|
|
(2)
|
The
balance at December 31, 2009 consists of $7.4 million classified as
short-term investments and $9.0 million classified as long-term
investments. The balance at December 31, 2008 consists of $25.1 million
classified as short-term investments and $9.8 million classified as
long-term investments.
|
|
(3)
|
The
balance at December 31, 2009 consists of $37.1 million classified as
short-term investments and $6.7 million classified as long-term
investments. The balance at December 31, 2008 consists totally of
long-term investments.
|
|
(4)
|
Classified
as short-term investments in 2009 and long-term investments in
2008.
|
|
(5)
|
Classified
as short-term investments.
|
Historically,
the fair value of the ARS and the ABS investments approximated par value due to
the frequent resets through the auction process. While the Company
continues to earn interest on its ARS and ABS investments at the contractual
rate, these investments are not currently trading and therefore do not have a
readily determinable market value.
For ABS
backed by the U.S. Government, the securities were valued using a matrix pricing
methodology which was derived from sales of similar bonds in the market. Some of
the observable inputs used in this methodology include prepayment speeds, loss
severities, credit risks, maturities, and collateral. The Company considers the
fair value was derived from level 2 inputs.
Page 74
of 103
SONICWALL, INC.
NOTES TO
CONSOLIDATED FINANCIAL STATEMENTS - (Continued)
For ABS not backed by the U.S. Government, the investment firm holding the securities valued the investments at $8.6 million. The Company engaged an independent investment firm’s trading desk to go into the market and solicit actual bids for the securities. The bids received aggregated to a fair value of $9.0 million. The Company determined the fair value of these securities should be $9.0 million and the fair value was derived from level 3 inputs.
For ARS,
the Company used a discounted cash flow model to determine the value at each
reporting period. The assumptions used in preparing the discounted
cash flow model include estimates of, based on data available as of December 31,
2009, interest rates, timing and amount of cash flows, credit and illiquidity
premiums, and expected holding periods of the ARS. The Company valued
the Right as a put option asset using a discounted cash flow approach including
estimates of interest rates, timing and amount of cash flow, adjusted for any
bearer risk associated with UBS’s financial ability to repurchase the ARS
beginning June 30, 2010.
The
assumptions used in valuing the ARS, the ABS, and the right are volatile and
subject to change as the underlying sources of these assumptions and market
conditions change.
The other
available-for-sale securities consist of U.S. Treasury and U.S. government
agency securities, municipal notes and bonds, corporate notes and bonds, and
commercial paper. These are all high quality investments. The Company values
these securities based on pricing from its brokers, which use quoted prices in
active markets for identical assets.
The
following table presents a reconciliation of all assets measured at fair value
on a recurring basis using significant unobservable inputs (Level 3) as of
December 31, 2009 and 2008 (in thousands):
|
Asset
Backed Securities
|
Auction
Rate Securities
|
Auction
Rate Securities Right
|
Total
(1)
|
|||||||||||||
|
Balance
at December 31, 2007
|
$
|
-
|
$
|
-
|
$
|
-
|
$
|
-
|
||||||||
|
Transfers
to Level 3
|
40,655
|
79,100
|
-
|
119,755
|
||||||||||||
|
Purchases,
sales, issuances and settlements, net
|
-
|
(23,727
|
)
|
-
|
(23,727
|
)
|
||||||||||
|
Total
realized or unrealized gains or (losses)
|
||||||||||||||||
|
Included
in other comprehensive loss
|
(5,750
|
)
|
(3,444
|
)
|
-
|
(9,194
|
)
|
|||||||||
|
Included
in earnings
|
-
|
(7,850
|
)
|
7,640
|
(210
|
)
|
||||||||||
|
Balance
at December 31, 2008
|
$
|
34,905
|
$
|
44,079
|
$
|
7,640
|
$
|
86,624
|
||||||||
|
Transfers
out of Level 3
|
(7,429
|
)
|
(7,429
|
)
|
||||||||||||
|
Purchases,
sales, issuances and settlements, net
|
(20,374
|
)
|
(3,351
|
)
|
(23,725
|
)
|
||||||||||
|
Total
realized or unrealized gains or (losses)
|
||||||||||||||||
|
Included
in other comprehensive income
|
2,038
|
148
|
2,186
|
|||||||||||||
|
Included
in earnings
|
(99
|
)
|
2,947
|
(2,765
|
)
|
83
|
||||||||||
|
Balance
at December 31, 2009
|
$
|
9,041
|
$
|
43,823
|
$
|
4,875
|
$
|
57,739
|
||||||||
|
The
amount of total gains or (losses) for the period
|
||||||||||||||||
|
included
in earnings attributable to the change
|
||||||||||||||||
|
in
unrealized gains or losses relating to assets
|
||||||||||||||||
|
still
held at December 31, 2009
|
$
|
-
|
$
|
2,955
|
$
|
(2,765
|
)
|
$
|
190
|
|||||||
_______________
Note:
|
(1)
|
The
balance at December 31, 2008 consists entirely of long-term investments.
The balance at December 31, 2009 consists of $49.4 million classified as
short-term investments and $15.7 million classified as long-term
investments.
|
Page 75
of 103
SONICWALL, INC.
NOTES TO
CONSOLIDATED FINANCIAL STATEMENTS - (Continued)
Note 5—Income Taxes
The
benefit (provision) for income taxes consists of the following (in
thousands):
|
Year
Ended December 31,
|
||||||||||||
|
2009
|
2008
|
2007
|
||||||||||
|
Current
tax expense:
|
||||||||||||
|
Federal
|
$ | (9,927 | ) | $ | (4,541 | ) | $ | (1,710 | ) | |||
|
State
|
(1,513 | ) | (805 | ) | (583 | ) | ||||||
|
Foreign
|
(653 | ) | (484 | ) | (399 | ) | ||||||
|
|
(12,093 | ) | (5,830 | ) | (2,692 | ) | ||||||
|
Deferred
tax benefit (expense):
|
||||||||||||
|
Federal
|
4,502 | (269 | ) | 11,920 | ||||||||
|
State
|
1,005 | 528 | 8,373 | |||||||||
|
|
5,507 | 259 | 20,293 | |||||||||
|
Total
|
$ | (6,586 | ) | $ | (5,571 | ) | $ | 17,601 | ||||
As part of the process of preparing the Company’s consolidated financial statements, the Company is required to estimate its income taxes in each of the jurisdictions in which it operates. This process involves determining the Company’s income tax benefit (expense) together with calculating the deferred income tax benefit (expense) related to temporary differences resulting from differing treatment of items, such as deferred revenue or deductibility of certain intangible assets, for tax and accounting purposes. These differences result in deferred tax assets and liabilities, which are included within the consolidated balance sheet. The Company must then assess the likelihood that the deferred tax assets will be recovered through the generation of future taxable income.
The
Company considers all available evidence, both positive and negative, including
historical levels of income, expectations and risks associated with estimates of
future taxable income and ongoing prudent and feasible tax planning strategies
in assessing the need for a valuation allowance. If it is not more
likely than not that SonicWALL will recover its deferred tax assets, the Company
will increase its provision for taxes by recording a valuation allowance against
the deferred tax assets that the Company estimates will not ultimately be
recoverable.
The
available positive evidence at December 31, 2007, included three years of
cumulative historical operating profits, a projection of future income
sufficient to realize most of the remaining deferred tax assets, and other
evidence. The Company recorded a partial valuation allowance release
of $23.5 million in fiscal year 2007, because as of December 31, 2007, it was
considered more likely than not that the Company’s deferred tax assets would be
realized with the exception of certain acquired net operating losses due to the
annual “change in ownership” limitation by the Internal Revenue Code of 1986, as
amended. The Company does not forecast future income beyond a 5-year time
horizon to determine if these deferred tax assets can be realized. At
December 31, 2009, the Company continues to believe that a valuation allowance
is not necessary with the exception of certain acquired net operating
losses. The change in valuation allowance in fiscal 2009 was
primarily related to positive future income sufficient to realize a portion of
these acquired net operating losses. The remaining valuation
allowance of approximately $8.6 million as of December 31, 2009, would result in
a credit to income tax expense if and when the Company concludes it is more
likely than not that the related deferred tax assets will be
realized.
As of
December 31, 2009, the Company believed that the amount of deferred tax assets
recorded on our balance sheet would ultimately be recovered. However,
should there be a change in the Company’s ability to recover the deferred tax
assets, the tax provision would increase in the period in which SonicWALL
determines that it is more likely than not that the Company cannot recover the
deferred tax assets. If the Company has to re-establish a full
valuation allowance against the deferred tax assets, it would result in an
increase of $33.3 million to income tax expense.
Page 76
of 103
SONICWALL, INC.
NOTES TO
CONSOLIDATED FINANCIAL STATEMENTS - (Continued)
Significant components of the deferred tax assets and liabilities are as follows (in thousands):
|
December
31,
|
||||||||
|
2009
|
2008
|
|||||||
|
Deferred
tax assets:
|
||||||||
|
Net
operating loss carryforwards
|
$
|
15,581
|
$
|
17,190
|
||||
|
Inventory
reserves
|
1,697
|
1,137
|
||||||
|
Deferred
revenue
|
6,706
|
2,434
|
||||||
|
Tax
credits
|
5,701
|
5,951
|
||||||
|
Share-based
compensation
|
7,061
|
5,469
|
||||||
|
Unrealized
loss on available-for-sale securities
|
2,750
|
3,614
|
(1)
|
|||||
|
Other
reserves and accruals
|
10,144
|
12,322
|
||||||
|
49,640
|
48,117
|
|||||||
|
Deferred
tax liabilities:
|
||||||||
|
Intangible
assets
|
(5,032
|
)
|
(6,490
|
)
|
||||
|
Net
deferred tax assets before valuation allowance
|
44,608
|
41,627
|
||||||
|
Valuation
allowance
|
(8,589
|
)
|
(10,184
|
)
|
||||
|
Net
deferred tax assets
|
$
|
36,019
|
$
|
31,443
|
||||
(1) As
restated.
As of
December 31, 2009, the Company had cumulative net operating loss
carry-forwards for federal and state income tax reporting purposes of
approximately $38.5 million and $52.8 million, respectively. The
federal net operating loss carry-forwards expire through the year 2027 and the
state net operating loss carry-forwards expire at various dates through the year
2019.
As of
December 31, 2009, the Company had cumulative carry-forwards for research
and development credits for federal and state income tax purposes of
approximately $4.5 million and $9.8 million, respectively. These state research
and development credits can be carried forward indefinitely.
The
utilization of certain acquired net operating losses and tax credits are subject
to substantial annual limitation due to the “change in ownership” provisions of
the Internal Revenue Code of 1986, as amended, and similar state
provisions. As a result, the annual limitation may result in the
expiration of net operating losses and tax credits before
utilization.
Additionally,
the Company determined that certain gross deferred tax assets related to the
acquired companies as of December 31, 2009, required a valuation
allowance. At December 31, 2009, a partial valuation allowance of
$8.6 million had been recorded for a portion of the acquired deferred tax assets
as a result of the uncertainties regarding realization of the assets based upon
the limitation on the use of the net operating losses in the
future. If and when such deferred tax assets become realizable, the
benefit will be credited to income tax expense. In fiscal year 2008,
the Company utilized $283,000 of the deferred tax assets related to the acquired
companies resulting in a reduction in goodwill. The Company’s overall
change in valuation allowance was $(1.6) million, $(0.5) million, and $(25.7)
million for the years ended December 31, 2009, 2008 and 2007,
respectively.
Restatement
During
the preparation of the Annual Report on Form 10-K for the year ended December
31, 2009, the Company determined there was an omission in recording deferred tax
assets associated with net unrealized losses on available for sale securities in
fiscal years 2008 and 2007. As the net unrealized losses from
available-for-sale securities are recognized through Other Comprehensive Income,
the impacts of these errors do not affect tax expense and are recorded in Other
Comprehensive Income. Consequently, the Company has restated the Consolidated
Balance Sheet as of December 31, 2008 and the Consolidated Statement of
Shareholder’s Equity for the years ended December 31, 2008 and December 31,
2007. The errors have no effect on the previously reported
Consolidated Statements of Operations or Consolidated Statements of Cash
Flows.
Page 77
of 103
SONICWALL, INC.
NOTES TO
CONSOLIDATED FINANCIAL STATEMENTS - (Continued)
The adjustments had the effect of increasing our deferred tax assets by $3.6 million, $0.9 million and $0.5 million as of December 31, 2008, 2007 and 2006, respectively, with corresponding increases to other comprehensive income for the same amounts.
The
Company’s effective tax rate on income differs from the U.S. Federal statutory
regular tax rate as follows:
|
Year
Ended December 31,
|
||||||||||||
|
2009
|
2008
|
2007
|
||||||||||
|
Federal
statutory rate
|
35%
|
35%
|
35%
|
|||||||||
|
State
taxes, net of federal benefit
|
5%
|
8%
|
5%
|
|||||||||
|
IPR&D
|
-
|
-
|
7%
|
|||||||||
|
Share-based
compensation
|
9%
|
23%
|
22%
|
|||||||||
|
Tax
credits
|
(8%)
|
(22%)
|
(21%)
|
|||||||||
|
Change
in valuation allowance
|
(8%)
|
-
|
(213%)
|
|||||||||
|
Other
|
-
|
9%
|
5%
|
|||||||||
|
33%
|
53%
|
(160%)
|
||||||||||
Undistributed
earnings of the Company’s foreign subsidiaries of approximately $5.0
million at December 31, 2009, are considered to be indefinitely reinvested and,
accordingly, no provisions for federal and state income taxes have been provided
thereon. Upon distribution of those earnings in the form of dividends
or otherwise, the Company would be subject to both U.S. income taxes
(subject to an adjustment for foreign tax credits) and withholding taxes payable
to various foreign countries.
The
Company’s income before income taxes was earned in the following jurisdictions
(in thousands):
|
Year
Ended December 31,
|
||||||||||||
|
2009
|
2008
|
2007
|
||||||||||
|
Domestic
|
$
|
17,638
|
$
|
8,497
|
$
|
9,529
|
||||||
|
Foreign
|
2,102
|
1,955
|
1,491
|
|||||||||
|
Total
|
$
|
19,740
|
$
|
10,452
|
$
|
11,020
|
||||||
In July
2006, the FASB issued Financial Interpretation 48, “Accounting for Uncertainty in Income
Taxes,” (“FIN 48”) (codified primarily in FASB ASC Topic 740, “Income Taxes”) which
clarifies the accounting for uncertainty in income taxes recognized in the
financial statements. This interpretation prescribes a recognition threshold and
measurement attribute for the financial statement recognition and measurement of
a tax position taken or expected to be taken in a tax return. FIN 48 also
provides guidance on derecognition of tax benefits, classification on the
balance sheet, interest and penalties, accounting in interim periods,
disclosure, and transition. The Company adopted FIN 48 effective January 1,
2007. In accordance with ASC 740-10-45 (formerly known as FIN 48,
paragraph 19), the Company recognizes interest and penalties related to
unrecognized tax benefits within the income tax expense line in the accompanying
consolidated statement of operations. As a result of the implementation of FIN
48, the Company recognized an $89,000 increase in liability for unrecognized tax
benefits, which was accounted for as a reduction to the January 1, 2007 balance
of retained earnings.
The
Company recognizes tax liabilities in accordance with FASB ASC Topic 740 and
adjusts these liabilities when judgment changes as a result of the evaluation of
new information not previously available. Due to the complexity of some of these
uncertainties, the ultimate resolution may result in a payment that is
materially different from the current estimate of the tax liabilities. These
differences will be reflected as increases or decreases to income tax expense in
the period in which they are determined.
Page 78
of 103
SONICWALL, INC.
NOTES TO
CONSOLIDATED FINANCIAL STATEMENTS - (Continued)
A reconciliation of the beginning and ending balances of the total amounts of gross unrecognized tax benefits is as follows (in thousands):
|
2009
|
2008
|
2007
|
||||||||||
|
At
January 1
|
$
|
1,696
|
$
|
1,657
|
$
|
3,124
|
||||||
|
Increases
in tax positions for prior years
|
145
|
86
|
726
|
|||||||||
|
Decreases
in tax positions for prior years
|
(131
|
)
|
(406
|
)
|
(2,443
|
)
|
||||||
|
Increases
in tax positions for current years
|
512
|
359
|
250
|
|||||||||
|
Settlements
|
-
|
-
|
-
|
|||||||||
|
Lapse
in statute of limitations
|
-
|
-
|
-
|
|||||||||
|
At
December 31
|
$
|
2,222
|
$
|
1,696
|
$
|
1,657
|
||||||
The
Company recognizes interest and penalties related to unrecognized tax benefits
within the income tax expense line in the accompanying consolidated statement of
operations.
The
Company had unrecognized tax benefits of approximately $2.2 million as of
December 31, 2009. Included in the balance of unrecognized tax benefits at
December 31, 2009, 2008 and 2007 respectively, are $2.2 million, $1.7 million
and $0.4 million of tax benefits that, if recognized, would affect the effective
tax rate. Accrued interest and penalties are immaterial as of
December 31, 2009 and 2008 and included in the unrecognized tax
benefits.
The
Company’s unrecognized tax benefits include state exposures from not filing
state tax returns. The Company does not expect any material changes
in unrecognized tax benefits within the next 12 months.
The
Company is subject to taxation in the United States and various states and
foreign jurisdictions. As of December 31, 2009, the Company’s tax
years from 2006 through 2009 are subject to examination by the tax
authorities. With few exceptions, as of December 31, 2009, the
Company is no longer subject to U.S. federal, state, local or foreign
examinations by tax authorities for years before 2006.
Note
6—Acquisitions
On July
10, 2007, the Company completed the acquisition of 100% of the outstanding
shares of Aventail Corporation (“Aventail”) for approximately $25.6 million
in purchase consideration, consisting of cash of approximately $23.6 million,
and $2.0 million in direct transaction costs incurred in connection with the
acquisition. This transaction was accounted for as a purchase
business combination. The Company acquired Aventail to complement and
extend its current SSL-VPN product offering.
The
Company allocated the purchase price based upon the fair value of the assets
acquired and liabilities assumed. The excess of the purchase price
over the fair value of the assets acquired and liabilities assumed has been
allocated to the identified intangible assets. The following is the
final allocation of the purchase consideration (in thousands):
Page 79
of 103
SONICWALL, INC.
NOTES TO
CONSOLIDATED FINANCIAL STATEMENTS - (Continued)
|
Fair Market Values (in
thousands)
|
||||
|
Cash
and cash equivalents
|
$
|
352
|
||
|
Accounts
receivable, net
|
3,764
|
|||
|
Inventories
|
241
|
|||
|
Prepaid
expenses and other current assets
|
661
|
|||
|
Property
and equipment, net
|
825
|
|||
|
In-process
research and development
|
1,930
|
|||
|
Goodwill
|
15,454
|
|||
|
Intangible
assets:
|
||||
|
Existing
technology
|
6,940
|
|||
|
Customer
relationships
|
7,920
|
|||
|
Other
Assets
|
235
|
|||
|
Total
assets acquired
|
38,322
|
|||
|
Accounts
payable and other current liabilities
|
1,253
|
|||
|
Accrued
compensation
|
3,695
|
|||
|
Deferred
revenue
|
5,146
|
|||
|
Loan
payable
|
2,607
|
|||
|
Total
liabilities assumed
|
12,701
|
|||
|
Net
assets acquired
|
$
|
25,621
|
||
Pursuant
to the terms of the Merger Agreement, options held by employees of Aventail to
acquire 744,043 shares of common stock were assumed by SonicWALL. The
fair value as of the acquisition date of these stock options assumed, using the
Black-Scholes valuation method, was $2.2 million. There were no
options vested as of the acquisition date, therefore the purchase price
component related to the assumption was zero. The total fair value of
$2.2 million is being recognized as compensation cost over the requisite service
period.
The
acquired purchased technology and customer relationships are being amortized
over their estimated useful life of six and eight years,
respectively.
The
Company's methodology for allocating a portion of the purchase price for
purchase acquisitions to in-process research and development (“IPR&D”) is
determined through established valuation techniques in the high-technology
internet security industry. IPR&D is expensed upon acquisition
because technological feasibility had not been established and no future
alternative use exists. Total IPR&D expense of $1.9 million
was charged to product development expenses on the date the assets were
acquired.
The
results of operations of Aventail have been included in the Company’s
consolidated financial statements subsequent to the date of
acquisition.
Note
7—Goodwill and Purchased Intangibles
The
following table presents the changes in goodwill (in thousands):
|
December
31,
|
||||||||
|
2009
|
2008
|
|||||||
|
Balance
as of beginning of the year
|
$
|
138,470
|
$
|
138,753
|
||||
|
Tax
adjustment related to acquisitions (see Note 5)
|
-
|
(283
|
)
|
|||||
|
Balance
at the end of the year
|
$
|
138,470
|
$
|
138,470
|
||||
Page 80
of 103
SONICWALL, INC.
NOTES TO
CONSOLIDATED FINANCIAL STATEMENTS - (Continued)
Intangible
assets for the year ended December 31, 2009 and 2008 consist of the following
(in thousands):
|
December
31, 2009
|
December
31, 2008
|
||||||||||||||||||||||||
|
Weighted
Average Amortization Period
|
Gross
Carrying Amount
|
Accumulated
Amortization
|
Net
|
Gross
Carrying Amount
|
Accumulated
Amortization
|
Net
|
|||||||||||||||||||
|
Purchased
technology
|
70
month
|
$ | 43,211 | $ | (36,839 | ) | $ | 6,372 | $ | 43,211 | $ | (33,822 | ) | $ | 9,389 | ||||||||||
|
Non-compete
agreements
|
36
month
|
7,249 | (7,249 | ) | - | 7,249 | (7,249 | ) | - | ||||||||||||||||
|
Customer
base
|
77
month
|
26,690 | (21,017 | ) | 5,673 | 26,690 | (19,922 | ) | 6,768 | ||||||||||||||||
|
Other
|
16
month
|
500 | (500 | ) | - | 500 | (500 | ) | - | ||||||||||||||||
|
Total
intangibles
|
69
month
|
$ | 77,650 | $ | (65,605 | ) | $ | 12,045 | $ | 77,650 | $ | (61,493 | ) | $ | 16,157 | ||||||||||
On December 14, 2007, the Company entered into a perpetual license agreement with Linkbit, Inc. for certain intellectual property for $1.8 million, which will be amortized over the estimated useful life of the technology of eight years.
All of
the Company’s intangible assets excluding goodwill are subject to
amortization. Estimated future amortization expense to be included in
cost of revenue and in operating expenses is as follows (in
thousands):
|
Fiscal
Year
|
Amortization
Amount to Cost of Revenue
|
Amortization
Amount to Operating Expenses
|
||||||
|
2010
|
$
|
2,374
|
$
|
1,095
|
||||
|
2011
|
1,382
|
1,095
|
||||||
|
2012
|
1,382
|
1,008
|
||||||
|
2013
|
803
|
990
|
||||||
|
2014
|
225
|
990
|
||||||
|
Thereafter
|
206
|
495
|
||||||
|
Total
|
$
|
6,372
|
$
|
5,673
|
||||
Note
8—Restructuring Charges
During
the first quarter of fiscal year 2008, the Company commenced the implementation
of a 2008 restructuring plan associated primarily with the relocation of support
activities, the closure of facilities in Pune, India and Sunnyvale, California,
and other employee reductions for the purpose of better integration and
alignment of Company functions. The Company recorded $1.0 million in
restructuring expenses related to costs associated with the termination of 21
employees across multiple geographic regions and functions, primarily related to
severance, benefits and related costs. Furthermore, the Company
recorded additional restructuring costs of $0.8 million in connection with
facilities and property and equipment that was disposed of or removed from
service. As of December 31, 2009, the Company had no remaining
liability relating to the restructuring activities.
Page 81
of 103
SONICWALL, INC.
NOTES TO
CONSOLIDATED FINANCIAL STATEMENTS - (Continued)
The
following tables set forth an analysis of the components of the 2008
restructuring plan and the payments made in 2008 and 2009 (in
thousands):
|
Employee
Severance Benefits
|
Facility
Costs
|
Total
|
||||||||||
|
Accrual
balance at December 31, 2007
|
$
|
-
|
$
|
-
|
$
|
-
|
||||||
|
Restructuring
charges incurred
|
1,042
|
762
|
1,804
|
|||||||||
|
Impairment
charges recorded
|
-
|
(56
|
)
|
(56
|
)
|
|||||||
|
Adjustment
|
(125
|
)
|
-
|
(125
|
)
|
|||||||
|
Cash
paid
|
(917
|
)
|
(634
|
)
|
(1,551
|
)
|
||||||
|
Accrual
balance at December 31, 2008
|
-
|
72
|
72
|
|||||||||
|
Cash
paid
|
-
|
(72
|
)
|
(72
|
)
|
|||||||
|
Accrual
balance at December 31, 2009
|
$
|
-
|
$
|
-
|
$
|
-
|
||||||
Note
9—Shareholders’ Equity
Stock
Repurchase Program
In
November 2004, the Company’s Board of Directors authorized a stock repurchase
program to acquire up to $50 million of common stock. The term of the
stock repurchase plan was set at twelve (12) months from the date of
authorization. In February 2005, the Company’s Board of Directors
increased the amount authorized for repurchase from $50 million to $75 million,
extended the term of the program from twelve (12) to twenty-four (24) months
following the date of original authorization and increased certain predetermined
pricing formulas. In April 2005, the Company’s Board of Directors
authorized a modification to the stock repurchase program to delete certain
elements that provided for systematic repurchases.
In
February 2006, the Company’s Board of Directors approved an increase in the
amount authorized for repurchase under the Company’s share repurchase program
from $75.0 million to $100.0 million and extended the term of the program from
twenty-four (24) months to thirty-six (36) months following the date of original
authorization.
On July
24, 2007, the Company’s Board of Directors approved a follow-on program for the
repurchase of the Company’s common stock. The authorization under the
follow-on share repurchase program was $100 million plus approximately $19.6
million remaining under the share repurchase program originally authorized by
the Company’s Board of Directors in November 2004. The term of the
follow-on program was one year from the date of approval.
During
fiscal year 2008, the Company repurchased 9.7 million shares of SonicWALL common
stock at an average price of $8.16 for an aggregate purchase price of $79.4
million. During fiscal year 2007, the Company repurchased 5.6 million
shares of SonicWALL common stock at an average price of $8.98 for an aggregate
purchase price of $49.9 million. During fiscal year 2006, the Company
repurchased 2.4 million shares of SonicWALL common stock at an average price of
$8.73 for an aggregate purchase price of $21.1 million. The Company’s
Stock Repurchase Program was completed as of September 30, 2008.
The
purchase price for the shares of the Company’s common stock repurchased was
reflected as a reduction to shareholders’ equity and allocated as a reduction to
retained earnings and common stock and additional paid-in capital.
Note
10—Segment Reporting
The
Company conducts its business within one business segment. The
Company has determined that the Chief Operating Decision Maker (“CODM”) is the
Chief Executive Officer (“CEO”). The CODM allocates resources and
assesses the performance of the Company as a whole by functional
area.
Page 82
of 103
SONICWALL, INC.
NOTES TO
CONSOLIDATED FINANCIAL STATEMENTS - (Continued)
Revenue by product category is as follows (in thousands):
|
Year
Ended December 31,
|
||||||||||||
|
2009
|
2008
|
2007
|
||||||||||
|
UTM
|
$
|
155,052
|
$
|
164,788
|
$
|
147,696
|
||||||
|
SCM
|
19,805
|
22,988
|
23,604
|
|||||||||
|
SSL
|
17,160
|
20,668
|
15,706
|
|||||||||
|
CDP
|
8,558
|
10,200
|
12,193
|
|||||||||
|
Total
|
$
|
200,575
|
$
|
218,644
|
$
|
199,199
|
||||||
Revenue
by geographic region, based on ship-to address, is as follows (in
thousands):
|
Year
Ended December 31,
|
||||||||||||
|
2009
|
2008
|
2007
|
||||||||||
|
United
States
|
$
|
135,102
|
$
|
143,913
|
$
|
135,000
|
||||||
|
All
other countries
|
65,473
|
74,731
|
64,199
|
|||||||||
|
Total
|
$
|
200,575
|
$
|
218,644
|
$
|
199,199
|
||||||
Long-lived
assets, which consist primarily of property and equipment, by geographic region
based on the location of the assets, are presented as follows (in
thousands):
|
Year
Ended December 31,
|
||||||||||||
|
2009
|
2008
|
2007
|
||||||||||
|
United
States
|
$
|
8,658
|
$
|
8,301
|
$
|
8,558
|
||||||
|
All
other countries
|
2,426
|
2,414
|
1,756
|
|||||||||
|
Total
|
$
|
11,084
|
$
|
10,715
|
$
|
10,314
|
||||||
The
following three customers accounted for 10% or more of the Company’s
revenue:
|
Year
Ended December 31,
|
||||||||||||
|
2009
|
2008
|
2007
|
||||||||||
|
Ingram
Micro
|
18%
|
16%
|
16%
|
|||||||||
|
Tech
Data
|
17%
|
17%
|
17%
|
|||||||||
|
Arrow
|
11%
|
16%
|
18%
|
|||||||||
Revenue
derived from Ingram Micro, Tech Data, and Arrow is solely in the
Americas. No other customer represented more than 10% of our sales in
those years.
Note
11—Commitments and Contingencies
Lease
Commitments
The
Company leases office space in several U.S. locations including California,
Washington, and Arizona. Additional facilities are leased worldwide under leases
that expire at various dates ranging from 2010 to 2015.
The
Company’s corporate headquarters and executive offices are located in
approximately 72,000 square feet of office space in San Jose, California under a
lease that expires in September 2014. The lease provides for a one
year renewal option. In addition, the Company leases office space of
approximately 32,000 square feet in Tempe, Arizona. The lease term is for
7.5 years and expires in August 2015. The base rent for this lease
escalates annually at 3%.
Page 83
of 103
SONICWALL, INC.
NOTES TO
CONSOLIDATED FINANCIAL STATEMENTS - (Continued)
In July 2007, the Company assumed a five-year lease for approximately 20,000 square feet of office space located in Seattle, Washington. This lease expires in February 2012. In September 2008, the Company closed approximately half of its leased facility and recorded a liability of approximately $0.9 million equivalent to the net present value of the expected future lease costs, net of estimated future sublease.
In
February 2008, the Company entered into a lease agreement to lease approximately
36,000 square feet of office space in Bangalore, India to carry out certain
research and development and technical support activities. The lease
term is for a period of five years commencing in March 2008 and requires a lock
in period of 4 years, after which either party to the contract can terminate the
lease with notice duly given. The base rent for this lease escalates
annually at 5%.
In
November 2008, the Company expanded its existing facility in Shanghai, China to
a total of approximately 16,000 square feet of office space to carry out our
research and development activities. The lease term is for a period of three
years and expires in November 2011. The base rent was increased by 15% in
September 2009 as agreed.
In
December 2009, the Company expanded its existing facility in the United Kingdom
to a total of approximately 7,000 square feet of office space to carry out our
sales and technical support activities. The lease term will expire in February
2013.
Rent
expense for the Company was approximately $3.4 million, $4.1 million, and $ 2.1
million for the years ended December 31, 2009, 2008 and 2007,
respectively.
Future
annual minimum lease payments under all non-cancelable operating leases with an
initial term in excess of one year as of December 31, 2009 were as follows (in
thousands):
|
Year
Ending December 31,
|
||||
|
2010
|
$
|
4,265
|
||
|
2011
|
3,833
|
|||
|
2012
|
3,055
|
|||
|
2013
|
2,150
|
|||
|
2014
|
1,614
|
|||
|
Thereafter
|
406
|
|||
|
Total
|
$
|
15,323
|
||
Purchase
Commitments (Unaudited)
The
Company outsources its manufacturing function to third party contract
manufacturers, and at December 31, 2009 it had purchase obligations totaling
$19.6 million. Of this amount, $16.7 million cannot be cancelled and
is payable within one year. The Company is contingently liable for
any inventory owned by a contract manufacturer that becomes excess and
obsolete. As of December 31, 2009, $21,000 had been accrued for
excess and obsolete inventory held by our contract manufacturers. In
addition, as of December 31, 2009, in the normal course of business, the Company
had $0.6 million in non-cancelable purchase commitments.
Page 84
of 103
SONICWALL, INC.
NOTES TO
CONSOLIDATED FINANCIAL STATEMENTS - (Continued)
Product Warranties
The
Company's standard warranty period for its products is one year and includes
repair or replacement obligations for units with product defects. The
Company estimates the accrual for future warranty costs based upon its
historical cost experience and its current and anticipated product failure
rates. If actual product failure rates or replacement costs differ
from its estimates, revisions to the estimated warranty obligations would be
required. However, the Company concluded that no adjustment to pre-
existing warranty accruals were necessary for the years ended December 31, 2009,
2008 or 2007, respectively. A reconciliation of the changes to the
Company's warranty accrual is as follows (in thousands):
|
Year
Ended December 31,
|
||||||||||||
|
2009
|
2008
|
2007
|
||||||||||
|
Beginning
balance
|
$
|
575
|
$
|
741
|
$
|
811
|
||||||
|
Accruals
for warranties issued
|
356
|
919
|
854
|
|||||||||
|
Settlements
made during the period
|
(394
|
)
|
(1,085
|
)
|
(924
|
)
|
||||||
|
Ending
balance
|
$
|
537
|
$
|
575
|
$
|
741
|
||||||
Guarantees
and Indemnification Agreements
The
Company enters into standard indemnification agreements in its ordinary course
of business. As part of its standard distribution agreements, the
Company indemnifies, holds harmless, and agrees to reimburse the indemnified
parties for losses suffered or incurred by the indemnified party, in connection
with any U.S. patent or any copyright or other intellectual property
infringement claim by any third party with respect to the Company's products,
software, or services. The indemnification agreements commence upon
execution of the agreement and do not have specific terms. The
maximum potential amount of future payments the Company could be required to
make under these agreements is not limited. The Company has never
incurred costs to defend lawsuits or settle claims related to these
indemnification agreements. As a result, the Company believes the
estimated exposure from these agreements is minimal.
The
Company's articles of incorporation limit the liability of directors to the full
extent permitted by California law. In addition, the Company's bylaws
provide that the Company will indemnify its directors and officers to the
fullest extent permitted by California law, including circumstances in which
indemnification is otherwise discretionary under California law. The
Company has entered into indemnification agreements with its directors and
officers that may require the Company: to indemnify its directors and officers
against liabilities that may arise by reason of their status or service as
directors or officers, other than liabilities arising from willful misconduct of
a culpable nature; to advance their expenses incurred as a result of any
proceeding against them as to which they could be indemnified; and to obtain
directors' and officers' insurance if available on reasonable terms. The Company
currently has directors and officers insurance in place. The Company
has not incurred costs related to these indemnification agreements.
The
Company has entered into agreements with certain executives where the Company
may be required to pay severance benefits up to 24 months of salary, bonuses and
accelerate vesting of stock options in the event of termination of employment
under certain circumstances, including a change of control. In October 2008, the
Compensation Committee of the Board of Directors authorized modifications to
these agreements designed to comply with Section 409A of the Internal Revenue
Code of 1986, as amended.
In 2007,
the Company paid severance benefits to certain of its former executives in the
amount of $41,000.
In
January 2008, Mr. John DiLullo, Vice President of Worldwide Sales and a named
executive officer, ceased to be employed by the Company. Under the
terms of Mr. DiLullo’s retention and severance agreement entered into at the
time of his employment in January 2006, the Company paid severance benefits and
bonuses, in compliance with Internal Revenue Code Section 409A, in the amount of
approximately $258,000.
Page 85
of 103
SONICWALL, INC.
NOTES TO
CONSOLIDATED FINANCIAL STATEMENTS - (Continued)
Legal Proceedings
On
December 5, 2001, a securities class action complaint was filed in the U.S.
District Court for the Southern District of New York against the Company, three
of its officers and directors, and certain of the underwriters in the Company’s
initial public offering in November 1999 and its follow-on offering in March
2000. Similar complaints were filed in the same court against
numerous public companies that conducted initial public offerings (“IPOs”) of
their common stock since the mid-1990s. All of these lawsuits were
consolidated for pretrial purposes before Judge Shira Scheindlin. On
April 19, 2002, plaintiffs filed an amended complaint. The amended
complaint alleged claims under the Securities Act of 1933 and the Securities
Exchange Act of 1934, and sought damages or rescission for misrepresentations or
omissions in the prospectuses relating to, among other things, the alleged
receipt of excessive and undisclosed commissions by the underwriters in
connection with the allocation of shares of common stock in the Company’s public
offerings. After more than seven (7) years after the filing of the
initial compliant, the parties filed formal settlement papers with the Count on
April 2, 2009. On June 9, 2009, the Court, without altering any of the terms of
the proposed settlement, issued an order granting preliminary approval of the
settlement. On October 5, 2009 the Court issued an order of final approval of
the settlement. Under the terms of the settlement, the insurers will pay the
full amount of the settlement share allocated to the Company, and the Company
will not be required to make any payments. The Company, as well as the officer
and director defendants who were previously dismissed from the action without
prejudice pursuant to tolling agreements, receive complete dismissals from the
case. Subsequent to the court order, several groups of objectors indicated their
intent to appeal once judgments have been entered. Judgments were entered and
the case in now before the appeals court. These developments will, at a minimum,
delay the effective date of the settlement. Under the terms of the settlement,
the settlement does not become effective until final judgment in each case is
either upheld on appeal or is no longer subject to appeal. If the settlement is
overturned on appeal and the litigation against the Company continues, the
Company believes it has a meritorious defense and intends to defend the case
vigorously. No estimate can be made of the possible loss or possible range of
loss, if any, associated with the resolution of this matter. As a result, no
loss has been accrued in the Company’s financial statements as of December 31,
2009.
On
October 8, 2008, Northpeak Wireless, LLC filed a complaint captioned Northpeak
Wireless, LLC v. 3Com Corporation, et al, No. CV-08-J-1813-NE, in the United
States District Court for the Northern District of Alabama. The complaint names
thirty one (31) defendants, including the Company. The complaint alleges that
the Company makes, uses, sells, offers to sell, and/or imports products that
incorporate and/or utilize direct sequence spread spectrum wireless technology
that infringes U.S. Patent No. 4,977,577 (the “577 Patent”) and U.S. Patent No.
5,987,058 (the “058 Patent”) and seeks a judgment that the Company has
infringed, actively induced infringement and/or contributorily infringed the 577
Patent and the 058 Patent. The complaint seeks an award of unspecified damages,
pre-judgment and post-judgment interest together with costs, expenses and
attorneys’ fees. On January 21, 2009, the Court granted the motion made by the
defendants, including SonicWALL, to transfer the case to the Northern District
of California. On August 28, 2009, the Court granted a stay in this case pending
the results of a request for reexamination filed on behalf of certain of the
defendants, not including the Company. The Company intends to defend the case
vigorously. No estimate can be made at this time of the possible loss or
possible range of loss, if any, associated with the resolution of this matter.
As a result, no loss has been accrued in the Company’s financial statements as
of December 31, 2009.
On May
29, 2009, Enhanced Security Research, LLC filed a complaint captioned Enhanced
Security Research LLC v. Cisco Systems, Inc., et al, C.A. No. 09-390 in the
United States District Court for the District of Delaware. The complaint names
ten (10) defendants, including the Company. The complaint alleges that the
Company makes, uses, offers to sell within the United States past, present, and
future versions of products and/or methods that use intrusion detection and
prevention systems that infringe or contribute to the infringement
of U.S. Patent No. 6,119,236 (the “236 Patent”) and U.S. Patent No.
6,304,975 B1 (the “975 Patent”). The complaint seeks a declaration that the
Company has infringed the 236 Patent and the 975 Patent, a permanent injunction
against further infringement and contributory infringement, unspecified damages,
pre-judgment and post-judgment interest together with costs and attorneys’ fees.
The Company intends to defend the case vigorously. No estimate can be made at
this time of the possible loss or possible range of loss, if any, associated
with the resolution of this matter. As a result, no loss has been accrued in the
Company’s financial statements as of December 31, 2009.
Page 86
of 103
SONICWALL, INC.
NOTES TO
CONSOLIDATED FINANCIAL STATEMENTS - (Continued)
On July 9, 2009, Southwest Technology Innovations LLC filed a complaint captioned Southwest Technology Innovations LLC v. St. Bernard Software, Inc., et al, 09-CV-1487-JAH-JMA in the United States District Court for the Southern District of California. The complaint names six (6) defendants, including the Company. The complaint alleges that the Company makes, uses, imports, sells, offers to sell, induces, aids and abets, encourages others or contributes to other use of certain products of the Company that infringe or contribute to the infringement of U.S. Patent No. 6,952,719 (the “719 Patent”) via its update functions that update software and/or firmware. The complaint seeks a judgment that the Company infringes the 719 Patent, unspecified damages, prejudgment interest not less than a reasonable royalty, and such other further relief as the court or jury may deem proper. The Company intends to defend the case vigorously. No estimate can be made at this time of the possible loss or possible range of loss, if any, associated with the resolution of this matter. As a result, no loss has been accrued in the Company’s financial statements as of December 31, 2009.
On August
28, 2009, Meteora, LLC filed a complaint captioned Meteora, LLC v. Marshal8E6,
et al, CV09-6293-PSG (JEMx) in the United States District Court for the Central
District of California. The complaint names twenty three (23) defendants,
including the Company. The complaint alleges that the Company has been and now
is infringing, inducing and/or contributing to others’ infringement of U.S.
Patent No. 6,782,510 (the “510 Patent”) literally and/or under the doctrine of
equivalents, by making, using, importing, selling, offering to sell word
checking products, including, but not limited to, its email security products.
The complaint seeks a judgment that the Company infringes, contributed and/or
actively induced others’ infringement of the 510 Patent, a preliminary and
permanent injunction from further acts of infringement of the 510 Patent,
unspecified damages, prejudgment interest and post-judgment interest at the
maximum rate allowed by law, attorneys’ fees, enhanced damages pursuant to 35
U.S.C. Section 284, compulsory future royalties, court costs and such other and
further relief as the Court deems proper. On February 5, 2010, the parties
reached a settlement, including customary releases and covenants. The settlement
did not have a material impact on the Company’s financial condition or results
of operations and has been recognized in the Company’s consolidated financial
statements as of December 31, 2009. On February 10, 2010, the Court issued an
order of dismissal with prejudice.
Additionally,
the Company is, from time to time, a party to routine litigation incidental to
its business. The Company believes that none of these legal
proceedings will have a material adverse effect on the Company’s consolidated
financial statements taken as a whole or its results of operations, financial
position, and cash flows.
Note
12—Employee Benefits
1999
Employee Stock Purchase Plan
The 1999
Employee Stock Purchase Plan (“ESPP”) is designed to enable eligible employees
to purchase shares of the Company’s common stock at a discount. Each
offering period is for one year and consists of two six-month purchase
periods. The purchase price for shares of common stock under the ESPP
is 85% of the lesser of the fair market value of the Company’s common stock on
the first day of the applicable offering period or the last day of each purchase
period.
At their
annual meeting on June 14, 2007, the Company’s shareholders voted to increase
the number of shares authorized for issuance under the ESPP by 1,500,000 shares
and extend the term of the ESPP to July 31, 2017. The cumulative
total shares authorized for issuance under the ESPP is 4,025,000
shares.
For the
years ended December 31, 2009, 2008, and 2007, the Company issued approximately
374,000, 377,000, and 379,000 shares, respectively, under the
ESPP. At December 31, 2009, 937,126 shares were available for future
issuance under the ESPP. The weighted average purchase price of the
shares issued under the ESPP in 2009, 2008, and 2007 was $3.76, $6.45, and $7.21
per share, respectively. The weighted average fair value of shares
issued under the ESPP was $1.54, $2.03, and $2.34 per share, respectively, for
2009, 2008, and 2007.
Page 87
of 103
SONICWALL, INC.
NOTES TO
CONSOLIDATED FINANCIAL STATEMENTS - (Continued)
Employee Stock Incentive Plans
As of
December 31, 2009, the Company had two stock incentive plans (together the
“Equity Incentive Plans”): the shareholder approved 2008 Equity Incentive Plan
(the “2008 Plan”) and the Board approved 2008 Inducement Equity Incentive Plan
(the “2008 Inducement Plan”). The 2008 Plan was approved by the Company’s
shareholders on June 10, 2008. In connection with the acquisitions of various
companies, the Company assumed the share-based awards granted under stock
incentive plans of the acquired companies. Share-based awards are designed to
reward employees for their long-term contributions to the Company and provide
incentives for them to remain with the Company. The number and frequency of
share-based awards are based on competitive practices, operating results of the
Company, government regulations and the other factors disclosed by the Company
in its filings under the Securities Exchange Act of 1934, as amended. The
Company’s primary stock incentive plans are summarized as follows:
2008
Plan
The 2008
Plan permits the granting of stock options, restricted stock, restricted stock
units (“RSUs”), stock appreciation rights, and performance shares to employees,
consultants of the Company and its subsidiaries and affiliates, and non-employee
directors of the Company. As approved by the shareholders on June 10, 2008, the
maximum number of shares issuable over the term of the 2008 Plan is 800,000
shares. In addition, shares subject to stock options or similar awards granted
under the Company’s expired 1998 Stock Option Plan (the “1998 Plan”) that expire
or otherwise terminate without having been exercised in full and shares issued
pursuant to awards granted under the 1998 Plan that are forfeited to, or
repurchased by the Company, up to a maximum of 5,000,000 shares may be added to
the 2008 Plan. Stock options granted under the 2008 Plan have an exercise price
of at least 100% of the fair market value of the underlying stock on the grant
date and expire no later than seven years from the grant date. Stock options
granted under the 2008 Plan will generally become exercisable either (1) for 25%
of the option shares one year from the date of grant and then ratably over the
following 36 months or (2) as to 1/48th of
the option shares on the one month anniversary of the grant date and on each
one-month anniversary thereafter. Subject to the annual per-person limit, shares
granted under the 2008 Plan, including applicable vesting schedules, shall be
granted as determined by the Board of Directors, or any of its committees
administering the 2008 Plan, in its sole discretion.
2008 Inducement
Plan
The 2008
Inducement Plan permits the granting of nonstatutory stock options, restricted
stock, restricted stock units, performance shares, and stock appreciation rights
to new employees of the Company, its subsidiaries and affiliates, as material
inducements to accept an offer of employment. As adopted by the Board on June
10, 2008, the maximum number of shares issuable over the term of the 2008
Inducement Plan is 500,000 shares. Nonqualified stock options granted under the
2008 Inducement Plan have an exercise price of at least 100% of the fair market
value of the underlying stock on the grant date and expire no later than seven
years from the grant date. The stock options awarded under the 2008
Inducement Plan will generally become exercisable as to 25% of the option
shares, one year after the date of grant and then ratably over the following 36
months. The Board of Directors or other committees administering the plan, have
the discretion to use a different vesting schedule.
1998
Plan
The 1998
Plan expired on June 10, 2008 upon shareholder approval of the 2008 Plan, and
the Company can no longer make equity awards under the 1998 Plan. As amended on
August 24, 1999 and October 12, 2000, the maximum number of shares issuable over
the term of the 1998 Plan was 38.9 million shares. Incentive stock options
granted under the 1998 Plan have an exercise price of at least 100% of the fair
market value of the underlying stock on the grant date and expire no later than
ten years from the grant date. Nonqualified stock options are granted at a price
that is not to be less than 85% of the fair market value of the common stock on
the date of grant, as determined by the Board of Directors or other committees
administering the plan, and expire no later than ten years from the date of
grant. The stock options generally become exercisable for 25% of the
option shares one year from the date of grant, and then ratably over the
following 36 months. The Board of Directors or other committees administering
the plan had the discretion to use a different vesting schedule and did so from
time to time.
Page 88
of 103
SONICWALL, INC.
NOTES TO
CONSOLIDATED FINANCIAL STATEMENTS - (Continued)
Employee
Stock Incentive Plans
Stock Option
Awards
The
following table summarizes the Company’s stock option activities under the
Equity Incentive Plans:
|
Number
of Shares Outstanding
|
Weighted
Average Exercise Price per Share
|
|||||||
|
Balance
at December 31, 2006
|
16,657,520
|
$
|
6.85
|
|||||
|
Options
assumed related to acquisition
|
744,043
|
$
|
8.44
|
|||||
|
Granted
|
3,295,880
|
$
|
8.82
|
|||||
|
Exercised
|
(2,269,940
|
)
|
$
|
6.30
|
||||
|
Canceled
|
(1,234,350
|
)
|
$
|
7.74
|
||||
|
Balance
at December 31, 2007
|
17,193,153
|
$
|
7.30
|
|||||
|
Granted
|
4,752,037
|
$
|
7.94
|
|||||
|
Exercised
|
(446,923
|
)
|
$
|
6.44
|
||||
|
Canceled
|
(1,939,787
|
)
|
$
|
8.36
|
||||
|
Balance
at December 31, 2008
|
19,558,480
|
$
|
7.30
|
|||||
|
Granted
|
1,445,300
|
$
|
7.94
|
|||||
|
Exercised
|
(362,177
|
)
|
$
|
4.80
|
||||
|
Canceled
|
(599,052
|
)
|
$
|
7.66
|
||||
|
Balance
at December 31, 2009
|
20,042,551
|
$
|
7.45
|
|||||
The
following table summarizes significant ranges of outstanding and exercisable
options as of December 31, 2009:
|
Options
Outstanding
|
Options
Exercisable
|
|||||||||||||||||||||||||||||
|
Range
of Exercise Prices
|
Number
of Shares Outstanding
|
Weighted
Average Remaining Contractual Life (in Years)
|
Weighted
Average Exercise Price per Share
|
Aggregate
Intrinsic Value
|
Number
of Shares Exercisable
|
Weighted
Average Exercise Price per Share
|
Aggregate
Intrinsic Value
|
|||||||||||||||||||||||
|
$
0.30 – $ 0.45
|
38
|
5.6
|
$
|
0.30
|
$
|
278
|
38
|
$
|
0.30
|
$
|
278
|
|||||||||||||||||||
|
$
1.41 – $ 2.12
|
6,859
|
0.6
|
1.41
|
42,526
|
6,859
|
1.41
|
42,526
|
|||||||||||||||||||||||
|
$
2.87 – $ 4.31
|
2,817,020
|
3.2
|
3.44
|
11,745,077
|
2,774,618
|
3.43
|
11,586,882
|
|||||||||||||||||||||||
|
$
4.32 – $ 6.48
|
2,615,167
|
4.5
|
5.66
|
5,104,292
|
2,562,051
|
5.66
|
4,998,344
|
|||||||||||||||||||||||
|
$
6.49 – $ 9.74
|
13,867,813
|
6.9
|
8.10
|
555,532
|
8,744,316
|
8.07
|
549,740
|
|||||||||||||||||||||||
|
$
9.75 – $14.63
|
497,044
|
6.3
|
10.53
|
-
|
369,415
|
10.60
|
-
|
|||||||||||||||||||||||
|
$14.64
– $21.96
|
118,610
|
1.5
|
17.67
|
-
|
118,610
|
17.67
|
-
|
|||||||||||||||||||||||
|
$21.97
– $32.96
|
20,000
|
0.4
|
29.75
|
-
|
20,000
|
29.75
|
-
|
|||||||||||||||||||||||
|
$32.97
– $49.46
|
100,000
|
0.5
|
45.56
|
-
|
100,000
|
45.56
|
-
|
|||||||||||||||||||||||
|
Total
|
20,042,551
|
6.0
|
$
|
7.45
|
$
|
17,447,705
|
14,695,907
|
$
|
7.20
|
$
|
17,177,770
|
|||||||||||||||||||
The
aggregate intrinsic value in the preceding table represents the total pretax
intrinsic value, based on options with an exercise price less than the Company’s
closing stock price of $7.61 as of December 31, 2009, which would have been
received by the option holders had all option holders exercised their options as
of that date. The total number of in-the-money options exercisable as
of December 31, 2009 was 7.9 million.
Page 89
of 103
SONICWALL, INC.
NOTES TO
CONSOLIDATED FINANCIAL STATEMENTS - (Continued)
Restricted Stock Unit Awards
The
Company grants RSUs under the 2008 Plan. Each RSU issued is counted as two
shares toward the limit of shares available under the 2008 Plan. The
Company issues new shares of common stock upon the vesting of RSUs.
The
following table summarizes the Company’s RSU activities as of December 31, 2009
under the Equity Incentive Plans:
|
Restricted
Stock Units
|
Weighted
Average Price per Share
|
|||||||
|
Balance
at December 31, 2008
|
-
|
$
|
-
|
|||||
|
Granted
|
52,500
|
$
|
5.82
|
|||||
|
Balance
at December 31, 2009
|
52,500
|
$
|
5.82
|
|||||
Share-Based Awards Available
for Grant
A summary
of share-based awards available for grant are as follows:
|
Share-Based
Awards Available for Grant
|
||||
|
Balance
at December 31, 2006
|
791,563
|
|||
|
Authorized
|
2,615,425
|
|||
|
Options
granted
|
(3,295,880
|
)
|
||
|
Options
canceled/expired
|
1,186,970
|
|||
|
Balance
at December 31, 2007
|
1,298,078
|
|||
|
Authorized
|
3,799,104
|
|||
|
Options
granted
|
(4,752,037
|
)
|
||
|
Options
canceled/expired
|
1,529,422
|
|||
|
Option
Retired
|
(89
|
)
|
||
|
Balance
at December 31, 2008
|
1,874,478
|
|||
|
Options
granted
|
(1,445,300
|
)
|
||
|
Restricted
stock units granted
|
(105,000
|
)
|
||
|
Options
canceled/expired
|
544,155
|
|||
|
Balance
at December 31, 2009
|
868,333
|
|||
Fair Value
Disclosure
The
share-based compensation expenses recognized for the years ended December 31,
2009, 2008, and 2007 were as follows (in thousands):
|
2009
|
2008
|
2007
|
||||||||||
|
Cost
of sales
|
$ | 501 | $ | 532 | $ | 524 | ||||||
|
Research
and development
|
2,763 | 3,290 | 4,642 | |||||||||
|
Sales
and marketing
|
3,285 | 3,802 | 4,824 | |||||||||
|
General
and administrative
|
2,637 | 2,993 | 3,987 | |||||||||
|
Share-based
compensation expense
|
$ | 9,186 | $ | 10,617 | $ | 13,977 | ||||||
Page 90
of 103
SONICWALL, INC.
NOTES TO
CONSOLIDATED FINANCIAL STATEMENTS - (Continued)
The weighted average grant-date fair value of options granted for the year ended December 31, 2009, 2008, and 2007 was $3.17, $2.68, and $2.92 per share, respectively. The total fair value of options vested during the year-ended December 31, 2009 was $9.4 million. The total intrinsic value of options exercised during the year-ended December 31, 2009 was $0.9 million. The total cash received from employees as a result of employee stock option exercises and employee stock purchase plan during the year ended December 31, 2009 was $3.1 million. In connection with these exercises, there was a tax benefit of $124,000 realized by the Company due to the Company’s current tax position. The weighted average remaining contractual term for options exercisable at December 31, 2009 was 5.38 years. The Company issues new shares of common stock upon exercise of stock options. The total compensation cost (gross) related to non-vested options not yet recognized at December 31, 2009 was $14.4 million and the weighted-average period over which this amount is expected to be recognized is 2.70 years.
The
Company has assumed certain option plans in connection with business
combinations. Generally, the options granted under these plans have
terms similar to the Company’s own options. The exercise prices of
such options have been adjusted to reflect the relative exchange
ratios.
The
Company estimates the fair value of stock options using a Black-Scholes
option-pricing model to determine the fair value of share-based awards, and
consistent with that used pro forma disclosures for grants awarded prior to
December 31, 2005. The Black-Scholes option-pricing model
incorporates various and highly subjective assumptions including expected
volatility, expected term and interest rates. Although the fair value of
employee stock options is determined using an option-pricing model, that value
may not be indicative of the fair value observed in a willing buyer/willing
seller market transaction.
Expected
Volatility: The Company used a combination of historical and
implied volatility (“blended volatility”) in deriving its expected volatility
assumption. Implied volatility was derived based on traded options on
the Company’s common stock with a minimum term of six months. The
selection of the blended volatility approach was based upon the availability of
traded options on the Company’s stock and the Company’s assessment that blended
volatility is more representative of future stock price trends than historical
volatility alone. In calculating blended volatility, historical and
implied volatility were weighted equally.
Risk-Free Interest
Rate: The risk-free interest rate is based on the market yield
currently available on U.S. Treasury securities with an equivalent remaining
term.
Expected Term: The
Company’s expected term represents the period that the Company’s share-based
awards are expected to be outstanding and was determined based on historical
experience of similar awards, giving consideration to the contractual terms of
the share-based awards, vesting schedules and expectations of future employee
behavior as influenced by changes to the terms of its share-based
awards.
Expected
Dividend: The Black-Scholes valuation model calls for a single
expected dividend yield as an input. The Company has not paid and
does not anticipate paying any dividends in the near future.
The
assumptions used to estimate the fair value of stock options granted under the
Company’s Stock Option Plans using the Black-Scholes option pricing model for
the year ended December 31, 2009, 2008 and 2007 are as follows:
|
2009
|
2008
|
2007
|
||||||||||
|
Expected
volatility
|
44.6%
to 58.3%
|
40.6%
to 46.6%
|
39.4%
to 43.9%
|
|||||||||
|
Risk-free
interest rate
|
1.3%
to 2.3%
|
1.2%
to 3.0%
|
3.2%
to 5.1%
|
|||||||||
|
Expected
life
|
3.5
to 4.6 years
|
3.5 to
3.7 years
|
2.9 to
3.5 years
|
|||||||||
|
Dividend
yield
|
-
|
-
|
-
|
|||||||||
Page 91
of 103
SONICWALL, INC.
NOTES TO
CONSOLIDATED FINANCIAL STATEMENTS - (Continued)
The fair value of purchase rights issued under the Employee Stock Purchase Plan was estimated using the following assumptions for the year ended December 31, 2009, 2008 and 2007:
|
2009
|
2008
|
2007
|
||||||||||
|
Expected
volatility
|
56.3%
to 73.9%
|
42.8%
to 43.3%
|
30.3%
to 34.3%
|
|||||||||
|
Risk-free
interest rate
|
0.3%
to 0.6%
|
2.0%
to 2.8%
|
4.1%
to 5.2%
|
|||||||||
|
Expected
life
|
0.5
to 1 year
|
0.5
to 1 year
|
0.5
to 1 year
|
|||||||||
|
Dividend
yield
|
-
|
-
|
-
|
|||||||||
Pension
Plan
The
Company has a defined contribution retirement plan covering substantially all of
its eligible United States employees. The Company’s contribution to
this plan is discretionary. The Company provided for a discretionary
matching contribution in an amount equal to 50% of the employee contribution up
to a maximum of $2,000 annually for each participant. All such
employer contributions vested immediately. Effective April 24, 2009, the
discretionary matching contribution made by the Company was discontinued. The
Company has expensed approximately $403,000, $758,000, and $678,000 of employer
contributions for the years ended December 31, 2009, 2008 and 2007,
respectively.
Deferred
Compensation Plan
SonicWALL
has a deferred compensation plan (“DCP”) to provide specified benefits to, and
help retain, a select group of management and highly compensated employees and
directors (“Participants”) who contribute materially to the Company’s continued
growth, development, and future business success. Under the DCP,
Participants may defer up to 80% of their salary and up to 100% of their annual
bonus and commission. Each Participant’s deferral account is credited
with an amount equal to the net investment return of one or more equity or bond
funds selected by the Participant. Amounts in a Participant’s
deferral account represent an unsecured claim against the Company’s assets and
are paid, pursuant to the Participant’s election, in a lump sum or in quarterly
installments at a specified date during the participant’s employment or upon the
Participant’s termination of employment with the Company. The Company
pays for the insurance coverage provided under this plan, but does not make any
contributions to this plan. In August 2008, the Compensation
Committee of the Board of Directors (“Committee”) approved an amended and
restated DCP designed to comply with Section 409A of the Internal Revenue Code
of 1986, as amended. In October 2008, the Committee adopted certain clerical
modifications to the DCP which are all in accordance with the requirements of
Section 409A of the Internal Revenue Code of 1986, as amended. At December 31,
2009, the trust assets and the corresponding deferred compensation liabilities
were $4,150,000 and $4,101,000, respectively, and are included in other current
assets and other current liabilities, respectively.
None.
Evaluation
of Disclosure Controls and Procedures
The
Company, with the participation of our Chief Executive Officer (CEO), Chief
Financial Officer (CFO), and Chief Accounting Officer (CAO), has evaluated the
effectiveness of the design and operation of its disclosure controls and
procedures, as defined in Rules 13a-15(e) and 15d-15(e) under the Securities
Exchange Act of 1934, as amended (the “Exchange Act”), as of December 31,
2009. Based on the evaluation, the CEO, CFO and CAO have concluded
that the Company’s disclosure controls and procedures were effective as of
December 31, 2009 for the information required to be disclosed in the reports we
file or submit under the Exchange Act to be recorded, processed, summarized and
reported within the time period specified in the SEC’s rules and forms and such
information is accumulated and communicated to management as appropriate to
allow timely decisions regarding required disclosure.
Management
Report on Internal Control over Financial Reporting
Management
of the Company is responsible for establishing and maintaining adequate internal
control over financial reporting, as defined in Exchange Act Rule
13a-15(f). The management, under the supervision and with the
participation of its CEO, CFO, and CAO, assessed the effectiveness of our
internal controls over financial reporting based on the criteria established in
“Internal Control – Integrated
Framework” issued by the Committee of Sponsoring Organizations of the
Treadway Commission (COSO). Management’s assessment included
evaluation of such elements as the design and operating effectiveness of key
financial reporting controls, process documentation, accounting policies and our
overall control environment. This assessment is supported by testing
and monitoring performed by our internal finance organization and our retained
internal audit organization. Based upon the assessment performed,
management believes that, as of
December
31, 2009, the Company’s internal control over financial reporting is effective
to provide reasonable assurance regarding the reliability of financial reporting
and the preparation of financial statements in accordance with generally
accepted accounting principles. We review with the Audit Committee of
the Board of Directors on a regular basis our assessment of our internal
controls over financial reporting including the evaluation of any changes in our
internal control over financial reporting environment to determine if material
changes have occurred.
Armanino
McKenna LLP, the independent registered public accounting firm that audited our
financial statements included in this Annual Report on Form 10-K, has also
assessed the effectiveness of internal control over financial reporting as of
December 31, 2009. Armanino McKenna LLP has issued an attestation
report with an unqualified opinion. This attestation report is
included herein under Part II, Item 8.
Changes
in Internal Control over Financial Reporting
During
the fourth quarter ended December 31, 2009, there have not been any changes in
the Company’s internal control over financial reporting (as defined in Rules
13a-15(f) and 15d – 15(f) under the Exchange Act) that have materially affected,
or are reasonably likely to materially affect, the Company’s internal control
over financial reporting.
Inherent
Limitations on Effectiveness of Controls
The
Company’s management, including the Chief Executive Officer and the Chief
Financial Officer, believe that our disclosure controls and procedures are
designed to provide reasonable assurance of achieving their objectives and
concluded that our disclosure controls and procedures were effective at that
reasonable assurance level as of December 31, 2009. We also believe that our
disclosure controls and procedures or our internal control over financial
reporting will prevent or detect all error and all fraud. A control
system, no matter how well designed and operated, can provide only reasonable,
not absolute, assurance that the control system’s objectives will be
met. Because of the inherent limitations in all control systems, no
evaluation of controls can provide absolute assurance that misstatements due to
error or fraud will not occur or that all control issues and instances of fraud,
if any, within the Company have been detected. These inherent
limitations include the realities that judgments in decision-making can be
faulty and that breakdowns can occur because of simple error or
mistake. Controls can also be circumvented by the individual acts of
some persons, by collusion of two or more people, or by management override of
the controls. The design of any system of controls is based in part
on certain assumptions about the likelihood of future events, and there can be
no assurance that any design will succeed in achieving its stated goals under
all potential future conditions. Over time, controls may become
inadequate because of changes in conditions or deterioration in the degree of
compliance with policies or procedures.
None.
PART
III
You will find information regarding our Directors and Executive Officers appearing under the headings “Proposal No. 1 ---Election of Directors”, “Section 16(a) Beneficial Ownership Reporting Compliance” and “Corporate Governance and Other Matters” in the Proxy Statement which we will deliver to our shareholders in connection with our Annual Meeting of Shareholders to be held on June 17, 2010. We are incorporating the information contained in those sections of our Proxy Statement here by reference.
The
Company maintains a set of Corporate Governance Principles, a Code of Ethics for
Principle Executive Officers and Senior Financial Officers, and a Code of
Conduct. Our Code of Conduct is applicable to all employees,
including all officers and our independent directors. The full text
of our Corporate Governance Principles, our Code of Ethics for Principle
Executive Officers and Senior Financial Officers and our Code of Conduct are
published on our corporate website www.sonicwall.com
under the tab Corporate Governance.
You will find this information in the sections captioned “Compensation Discussion and Analysis,” “Report of the Compensation Committee”, “Executive Compensation”, and “Director Compensation” which will appear in the 2009 Proxy Statement we will deliver to our shareholders in connection with our Annual Meeting of Shareholders to be held on June 17, 2010. We are incorporating the information contained in those sections here by reference.
You will find this information in the section captioned “Security Ownership of Certain Beneficial Owners and Management”, and “Equity Compensation Plan Information” which will appear in the 2010 Proxy Statement we will deliver to our shareholders in connection with our Annual Meeting of Shareholders to be held on June 17, 2010. We are incorporating the information contained in that section here by reference.
You will
find this information in the sections captioned “Certain Relationships and
Related Transactions,” and “Corporate Governance and Other Matters” which will
appear in the 2010 Proxy Statement we will deliver to our shareholders in
connection with our Annual Meeting of Shareholders to be held on June 17,
2010. We are incorporating the information contained in those
sections here by reference.
You will find this information in the sections captioned “Report of the Audit Committee” and Proposal No. 2--- Ratification of Selection of Independent Auditors” which will appear in the 2010 Proxy Statement we will deliver to our shareholders in connection with our Annual Meeting of Shareholders to be held on June 17, 2010. We are incorporating the information contained in those sections here by reference.
PART
IV
(a) The following documents are filed
as part of this report:
1. Financial Statements—See
Index to Consolidated Financial Statements in Part II,
Item 8.
2. Financial Statement
Schedules— Schedule II (Valuation and Qualifying Accounts) are included
in this Annual Report on Form 10-K. All other financial statement
schedules have been omitted because the information required is not applicable
or is shown in the Consolidated Financial Statements or notes
thereto.
3. Exhibits—
|
Number
|
Description
|
|
2.1
|
Agreement
and Plan of Merger and Reorganization, dated as of October 16, 2000, among
Registrant, Pluto Acquisition Corp., Phobos Corporation, and GMS Capital
Partners, L.P. (Incorporated by reference to Registrant’s Current Report
on Form 8-K (File No. 000-27723), filed on November 27,
2000).
|
|
2.2
|
Amendment
to Agreement and Plan of Merger dated as of November 6, 2000, by and among
Registrant, Pluto Acquisition Corp., Phobos Corporation, and GMS Capital
Partners, L.P. (Incorporated by reference to Registrant’s Current Report
on Form 8-K (File No. 000-27723), filed on November 27,
2000).
|
|
2.3
|
Agreement
and Plan of Merger and Reorganization, dated March 1, 2001, among
Registrant, ITI Acquisition Corp., Ignyte Technology, Inc., and Jeff
Stark. (Incorporated by reference to Registrant’s Registration
Statement on Form S-3 (File No. 333-61168), filed on May 17,
2001).
|
|
2.4
|
Amendment
No. 1 to the Agreement and Plan of Merger and Reorganization by and among
Registrant, ITI Acquisition Corp., Ignyte Technology, Inc., and Jeff
Stark, dated as of March 6, 2001. (Incorporated by reference to
Registrant’s Registration Statement on Form S-3 (File No. 333-61168),
filed on May 17, 2001).
|
|
2.5
|
Agreement
and Plan of Merger and Reorganization, dated November 18, 2005, by and
among the Registrant, Spectrum Acquisition Corporation and Lasso Logic,
Inc., et al. (Incorporated by reference to the Registrant’s Annual Report
on Form 10-K (File No. 000-27723) for the year ended December 31, 2005,
filed on March 15, 2006).
|
|
2.6
|
Agreement
and Plan of Merger, dated February 7, 2006, by and among the Registrant,
Meridian Acquisition Corporation, MailFrontier, Inc., and Anne Bonaparte
and Sonja Hoel, as the Representatives. (Incorporated by
reference to the Registrant’s Current Report on Form 8-K (File No.
0000950134-06-003922), filed on February 28, 2007).
|
|
2.7
|
Agreement
and Plan of Merger, date June 12, 2007, by and among the Registrant,
Avalon Acquisition Corp. and Aventail, including amendment number one
thereto effective July 5, 2007. (Incorporated by reference to
the Registrant’s Current Report on Form 8-K (File No.
0001093885-07-000004), filed on July 7, 2007).
|
|
3.1
|
Registrant’s
Amended and Restated Articles of Incorporation (Incorporated by reference
to the Registrant’s Registration Statement on Form S-1, as amended (File
No. 333-85997), which became effective on November 9, 1999).
|
|
3.2
|
Registrant’s
Bylaws, as amended December 12, 2003 (Incorporated by reference to the
Registrant’s Annual Report on Form 10-K (File No. 000-27723) for the year
ended December 31, 2005, filed on March 15, 2006).
|
|
Number
|
Description
|
|
3.3
|
Bylaws
of SonicWALL, Inc., as Amended July 24, 2007. (Incorporated by
reference to the Registrant’s Current Report on Form 8-K (File No.
0001093885-07-000008), filed on July 30, 2007).
|
|
4.1
|
Registrant’s
specimen common stock certificate (Incorporated by reference to the
Registrant’s Registration Statement on Form S-1, as amended (File No.
333-85997), which became effective on November 9, 1999).
|
|
10.1
|
Registrant’s
1994 Stock Option Plan, as amended to date (Incorporated by reference to
the Registrant’s Registration Statement on Form S-1, as amended (File No.
333-85997), which became effective on November 9, 1999).
|
|
10.2
|
Form
of Stock Option Agreement for Registrant’s 1994 Stock Option Plan
(Incorporated by reference to the Registrant’s Filing on Schedule TO (File
No. 005-58485), filed on January 9, 2003).
|
|
10.3
|
Registrant’s
1998 Stock Option Plan, as amended to date (Incorporated by reference to
the Registrant’s 2000 Definitive Proxy Statement (File No. 000-27723),
filed on November 7, 2001).
|
|
10.4
|
Form
of Stock Option Agreement for Registrant’s 1998 Stock Option Plan
(Incorporated by reference to the Registrant’s Filing on Schedule TO (File
No. 005-58485), filed on January 9, 2003).
|
|
10.5
|
Registrant’s
1999 Employee Stock Purchase Plan (Incorporated by reference to the
Registrant’s 2003 Definitive Proxy Statement (File No. 000-27723), filed
on November 5, 2003).
|
|
10.6
|
Form
of Stock Option Agreement under Phobos Corporation 1998 Stock Plan
(Incorporated by reference to the Registrant’s Registration Statement on
Form S-8 (File No. 333-54976), filed on February 5, 2001).
|
|
10.7
|
Form
of Stock Option Agreement under Phobos Corporation 1999 Stock Plan
(Incorporated by reference to the Registrant’s Registration Statement on
Form S-8 (File No. 333-54976), filed on February 5, 2001).
|
|
10.8
|
RedCreek
Communications, Inc. 2001 Stock Option Plan (Incorporated by reference to
the Registrant’s Registration Statement on Form S-8 (File No. 333-81492),
filed on January 28, 2002).
|
|
10.9
|
Employment
agreement dated June 21, 2003 between Registrant and Kathleen Fisher
(Incorporated by reference to the Registrant’s Quarterly Report on Form
10-Q (File No. 000-27723) for the quarter ended June 30, 2003, filed on
August 14, 2003).
|
|
10.10
|
Registrant’s
Form of Individual Compensation Arrangements (Incorporated by reference to
the Registrant’s Registration Statement on Form S-8 (File No. 333-81492),
filed on January 28, 2002).
|
|
10.11
|
Form
of Indemnification Agreement entered into by Registrant with each of its
officers and directors (Incorporated by reference to the Registrant’s
Quarterly Report on Form 10-Q (File No. 000-27723) for the quarter ended
September 30, 2001, filed on November 14, 2001).
|
|
10.12
|
Loan
and Security Agreement dated May 26, 1995 between Registrant and Comerica
Bank (Incorporated by reference to the Registrant’s Registration Statement
on Form S-1, as amended (File No. 333-85997), which became effective on
November 9, 1999).
|
|
Number
|
Description
|
|
|
10.13++
|
Distribution
Agreement dated February 9, 1999 between Registrant and Tech Data Product
Management, Inc. (Incorporated by reference to the Registrant’s
Registration Statement on Form S-1, as amended (File No. 333-85997), which
became effective on November 9, 1999).
|
|
|
10.14++
|
Distribution
Agreement dated July 5, 1998 between Registrant and Sumitomo Metal Systems
Development Co., Ltd. (Incorporated by reference to the Registrant’s
Registration Statement on Form S-1, as amended (File No. 333-85997), which
became effective on November 9, 1999).
|
|
|
10.15++
|
Distribution
Agreement dated November 11, 1992 between Registrant and Ingram Micro,
Inc. (Incorporated by reference to the Registrant’s Registration Statement
on Form S-1, as amended (File No. 333-85997), which became effective on
November 9, 1999).
|
|
|
10.16
|
Agreement
of Sublease dated as of October 26, 1998 between Registrant and AMP
Incorporated (Incorporated by reference to the Registrant’s Registration
Statement on Form S-1, as amended (File No. 333-85997), which became
effective on November 9, 1999).
|
|
|
10.17
|
Purchase
Agreement dated September 28, 1999 between Registrant and Flash
Electronics Inc. (Incorporated by reference to the Registrant’s
Registration Statement on Form S-1, as amended (File No. 333-85997), which
became effective on November 9, 1999).
|
|
|
10.18
|
Lease
dated September 27, 1999 between Registrant, as Tenant, and AMB Property,
L.P., as Landlord (Incorporated by reference to the Registrant’s
Registration Statement on Form S-1, as amended (File No. 333-85997), which
became effective on November 9, 1999).
|
|
|
10.19
|
First
Amendment to Lease dated May 2, 2001 between Registrant, as Tenant, and
AMB Property, L.P., as Landlord (Incorporated by reference to the
Registrant’s Annual Report on Form 10-K (File No. 000-27723) for the
fiscal year ended December 31, 2001, filed on April 1, 2002).
|
|
|
10.20
|
Second
Amendment to Lease dated September 26, 2001 between Registrant, as Tenant,
and AMB Property, L.P., as Landlord (Incorporated by reference to the
Registrant’s Annual Report on Form 10-K (File No. 000-27723) for the
fiscal year ended December 31, 2001, filed on April 1, 2002).
|
|
|
10.21++
|
OEM
Hardware (with Software) License and Purchase Agreement effective as of
May 29, 2001 between Registrant and Cisco Systems, Inc. (Incorporated by
reference to the Registrant’s Annual Report on Form 10-K (File No.
000-27723) for the fiscal year ended December 31, 2001, filed on April 1,
2002).
|
|
|
10.22++
|
Amendment
Number One to OEM Hardware (with Software) License and Purchase Agreement
dated June 25, 2002 between Registrant and Cisco Systems, Inc.
(Incorporated by reference to the Registrant’s Quarterly Report on Form
10-Q (File No. 000-27723) for the quarter ended June 30, 2002, filed on
August 14, 2002).
|
|
|
10.23
|
Employment
agreement dated March 14, 2003 between Registrant and Matthew Medeiros
(Incorporated by reference to the Registrant’s Annual Report on Form 10-K
(File No. 000-27723) for the fiscal year ended December 31, 2002, filed on
March 31, 2003).
|
|
|
10.24
|
Employment
agreement dated August 11, 2003 between Registrant and Michael Stewart
(Incorporated by reference to the Registrant’s Quarterly Report on Form
10-Q (File No. 000-27723) for the quarter ended September 30, 2003, filed
on November 14, 2003).
|
|
|
Number
|
Description
|
|
10.25
|
Employment
agreement dated October 29, 2003 between Registrant and Robert Knauff
(Incorporated by reference to the Registrant’s Annual Report on Form 10-K
(File No. 000-27723) for the fiscal year ended December 31, 2003, filed on
March 15, 2004).
|
|
10.26
|
Manufacturing
and Purchase Agreement dated June 4, 2004 by and between Flash
Electronics, Inc. and SonicWALL, Inc. (Incorporated by reference to the
Registrant’s Quarterly Report on Form 10-Q (File No. 000-27723) for the
quarter ended June 30, 2004, filed on August 9, 2004).
|
|
10.27
|
Third
Amendment to Lease executed on April 28, 2004 by and between AMB Property,
L.P., as Landlord, and SonicWALL, Inc. as Tenant. (Incorporated
by reference to the Registrant’s Quarterly Report on Form 10-Q (File No.
000-27723) for the quarter ended June 30, 2004, filed on August 9,
2004).
|
|
10.28
|
Retention
and Severance Agreement for Executive Officers dated April 20,
2004. (Incorporated by reference to the Registrant’s Quarterly
Report on Form 10-Q (File No. 000-27723) for the quarter ended June 30,
2004, filed on August 9, 2004).
|
|
10.29
|
Registrant’s
Stock Option Agreement dated July 29, 2004 (Incorporated by reference to
the Registrant’s Quarterly Report on Form 10-Q (File No. 000-27723) for
the quarter ended September 30, 2004, filed on November 9,
2004).
|
|
10.30
|
Employment
Agreement as amended and restated July 29, 2004 between Registrant and
Matthew Medeiros (Incorporated by reference to the Registrant’s Quarterly
Report on Form 10-Q (File No. 000-27723) for the quarter ended September
30, 2004, filed on November 9, 2004).
|
|
10.31
|
Stock
Option Agreement dated July 29, 2004 between Registrant and Outside
Directors (Incorporated by reference to the Registrant’s Quarterly Report
on Form 10-Q (File No. 000-27723) for the quarter ended September 30,
2004, filed on November 9, 2004).
|
|
10.32
|
Issuer
Repurchase Plan Agreement dated November 29, 2004 between Registrant and
RBC Dain Rauscher Inc. (Incorporated by reference to the Registrant’s
Annual Report on Form 10-K (File No. 000-27723) for the year ended
December 31, 2004, filed on March 21, 2005).
|
|
10.33
|
Issuer
Repurchase Plan Agreement amended and restated, dated February 15, 2005
between Registrant and RBC Dain Rauscher Inc. (Incorporated by reference
to the Registrant’s Annual Report on Form 10-K (File No. 000-27723) for
the year ended December 31, 2004, filed on March 21, 2005).
|
|
10.34
|
Lease
dated December 19, 2006 between Registrant, as Tenant, and Kolte Patil
Developers Limited, as Landlord (Incorporated by reference to the
Registrant’s Annual Report on Form 10-K (File No. 0000950134-07-005644)
for the year ended December 31, 2006, filed on March 14,
2007).
|
|
10.35
|
Issuer
Repurchase Plan Agreement amended and restated, dated November 3, 2006
between Registrant and RBC Dain Rauscher Inc. (Incorporated by reference
to the Registrant’s Annual Report on Form 10-K (File No.
0000950134-07-005644) for the year ended December 31, 2006, filed on March
14, 2007).
|
|
10.36
|
Registrant’s
Employee Stock Purchase Plan, dated August 24, 1999, as amended August 1,
2006 (Incorporated by reference to the Registrant’s Annual Report on Form
10-K (File No. 0000950134-07-005644) for the year ended December 31, 2006,
filed on March 14, 2007).
|
|
Number
|
Description
|
|
10.37
|
Lease
dated September 25, 2007 between Registrant, as Tenant, and TMC-3011 S
52nd
ST, LLC, as Landlord. (Incorporated by reference to the
Registrant’s Quarterly Report on Form 10-Q (File No. 0001093885-07-000021)
for the quarter ended September 30, 2007, filed on November 7,
2007).
|
|
10.38
|
Lease
dated February 1, 2008 between Aventail Info Tech Private Limited, a
subsidiary of the Registrant, as Tenant, and Salarpuria Softzone, as
Landlord, and SPPL Property Management Private Limited, as Maintenance
Service Provider. (Incorporated by reference to the Registrant’s Annual
Report on Form 10K (File No. 0000950134-08-004440) for the year ended
December 31, 2007, filed on March 10, 2008).
|
|
10.39
|
Limited
Licensed Materials License Agreement dated December 14, 2007 between
Registrant, as Licensee, and Linkbit, Inc. (Incorporated by reference to
the Registrant’s Annual Report on Form 10K (File No. 0000950134-08-004440)
for the year ended December 31, 2007, filed on March 10,
2008).
|
|
10.40
|
Registrant’s
2008 Equity Incentive Plan (Incorporated by reference to the Registrant’s
Current Report on Form 8-K (File No. 0001093885-08-000017), filed on June
16, 2008).
|
|
10.41
|
Registrant’s
2008 Inducement Equity Incentive Plan (Incorporated by reference to the
Registrant’s Current Report on Form 8-K (File No. 0001093885-08-000017),
filed on June 16, 2008).
|
|
10.42
|
Registrant’s
2008 Inducement Equity Incentive Plan as amended (Incorporated by
reference to the Registrant’s Quarterly Report on Form 10-Q (File No.
0001093885-08-000027) for the quarter ended September 30, 2008, filed on
October 31, 2008).
|
|
10.43
|
Registrant’s
Deferred Compensation Plan as amended and restated August 8, 2008
(Incorporated by reference to the Registrant’s Quarterly Report on Form
10-Q (File No. 0001093885-08-000027) for the quarter ended September 30,
2008, filed on October 31, 2008).
|
|
10.44
|
Employment
Agreement as amended and restated, dated October 20, 2008 between
Registrant and Matthew Medeiros (Incorporated by reference to the
Registrant’s Annual Report on Form 10K (File No. 0001093885-09-000007) for
the year ended December 31, 2008, filed on March 6, 2009).
|
|
10.45
|
Retention
and Severance Agreement as amended and restated, dated October 20, 2008
among Registrant and Executive Officers (Incorporated by reference to the
Registrant’s Annual Report on Form 10K (File No. 0001093885-09-000007) for
the year ended December 31, 2008, filed on March 6, 2009).
|
|
10.46++
|
Lease
dated June 19, 2009 between Registrant, as Tenant, and Xilinx, as
Landlord. (Incorporated by reference to the Registrant’s Quarterly Report
on Form 10-Q (File No. 0001093885-09-000025) for the quarter ended June
30, 2009, filed on August 7, 2009).
|
|
10.47
|
Registrant’s
2008 Equity Incentive Plan Restricted Stock Unit Agreement (Incorporated
by reference to the Registrant’s Quarterly Report on Form 10-Q (File No.
0001093885-09-000025) for the quarter ended June 30, 2009, filed on August
7, 2009).
|
|
10.48
|
Second
Amendment to Lease dated August 12, 2009 between the Registrant, as
Tenant, and Xilinx, as Landlord. (Incorporated by reference to the
Registrant’s Quarterly Report on Form 10-Q (File No. 0001093885-09-000036)
for the quarter ended September 30, 2009, filed on November 6,
2009).
|
|
Number
|
Description
|
|
10.49
|
Distribution
Agreement dated April 18, 2002 between Registrant and Alternative
Technology, Inc. (Incorporated by reference to the Registrant’s Quarterly
Report on Form 10-Q (File No. 0001093885-09-000036) for the quarter ended
September 30, 2009, filed on November 6, 2009).
|
|
10.50
|
Amendment
to Distribution Agreement dated October 6, 2006 between Registrant and
Alternative Technology, Inc. (Incorporated by reference to the
Registrant’s Quarterly Report on Form 10-Q (File No. 0001093885-09-000036)
for the quarter ended September 30, 2009, filed on November 6,
2009).
|
|
21.1*
|
List
of Subsidiaries.
|
|
23.1*
|
Consent
of Independent Registered Public Accounting Firm
|
|
31.1*
|
Certification
of Chief Executive Officer pursuant to Securities Exchange Act Rules
13a-15(e) and 15d-15(e), as adopted pursuant to Section 302 of the
Sarbanes-Oxley Act of 2002.
|
|
31.2*
|
Certification
of Chief Financial Officer pursuant to Securities Exchange Act Rules
13a-15(e) and 15d-15(e), as adopted pursuant to Section 302 of the
Sarbanes-Oxley Act of 2002.
|
|
32.1*
|
Certification
of Chief Executive Officer and Chief Financial Officer pursuant to 18
U.S.C. Section 1350, as adopted pursuant to Section 906 of the
Sarbanes-Oxley Act of 2002.
|
|
*
|
Filed
herewith.
|
|
++
|
Confidential
treatment has been obtained or requested for portions of this
exhibit. The omitted material has been separately filed with
the Securities and Exchange
Commission.
|
(b) Exhibits
See Item
15(a) (3) above.
(c) Financial Statement
Schedules
See Item
15(a) (2) above.
Pursuant
to the requirements of Sections 13 or 15(d) of the Securities Exchange Act of
1934, the registrant has duly caused this report to be signed on its behalf by
the undersigned, thereunto duly authorized, in the City of San Jose, State of
California.
Date:
March 5, 2010
|
|
SonicWALL, Inc. |
|
By:
|
/s/ Matthew Medeiros |
|
Matthew
Medeiros
Chief
Executive Officer
|
Pursuant
to the requirements of the Securities Exchange Act of 1934, this report has been
signed below by the following persons on behalf of the registrant in the
capacities and on the dates indicated.
|
Signature
|
Title
|
Date
|
| /s/ Matthew Medeiros |
President,
Chief Executive Officer and
|
|
|
Matthew
Medeiros
|
Director
(Principal Executives Officer)
|
March
5, 2010
|
| /s/ Robert Selvi |
Chief
Financial Officer
|
|
|
Robert
Selvi
|
(Principal
Financial Officer)
|
March
5, 2010
|
| /s/ Robert Knauff |
Chief
Accounting Officer
|
|
|
Robert
Knauff
|
(Principal
Accounting Officer)
|
March
5, 2010
|
| /s/ John C. Shoemaker | ||
|
John
C. Shoemaker
|
Chairman
of the Board of Directors
|
March
5, 2010
|
| /s/ Charles Berger | ||
|
Charles
Berger
|
Director
|
March
5, 2010
|
| /s/ David W. Garrison | ||
|
David
W. Garrison
|
Director
|
March
5, 2010
|
| /s/ Charles Kissner | ||
|
Charles
Kissner
|
Director
|
March
5, 2010
|
| /s/ Edward F. Thompson | ||
|
Edward
F. Thompson
|
Director
|
March
5, 2010
|
| /s/ Cary Thompson | ||
|
Cary
Thompson
|
Director
|
March
5, 2010
|
| /s/ Clark Masters | ||
|
Clark
Masters
|
Director
|
March
5, 2010
|
| /s/ Carl A. Thomsen | ||
|
Carl
A. Thomsen
|
Director
|
March
5, 2010
|
VALUATION
AND QUALIFYING ACCOUNTS
|
Balance
at Beginning of Year
|
Other
|
Charged
to Cost and Expenses
|
Deductions/
Write-off of Accounts
|
Balance
at End of Year
|
||||||||||||||||
|
(in
thousands)
|
||||||||||||||||||||
|
Year
ended December 31, 2007
|
||||||||||||||||||||
|
Allowance
for doubtful accounts
|
152
|
213
|
87
|
(275
|
)
|
177
|
||||||||||||||
|
Year
ended December 31, 2008
|
||||||||||||||||||||
|
Allowance
for doubtful accounts
|
177
|
(171
|
)
|
233
|
(126
|
)
|
113
|
|||||||||||||
|
Year
ended December 31, 2009
|
||||||||||||||||||||
|
Allowance
for doubtful accounts
|
113
|
-
|
-
|
(27
|
)
|
86
|
||||||||||||||
Page
103 of 103