Attached files
Table of Contents
UNITED STATES
SECURITIES AND EXCHANGE COMMISSION
Washington, DC 20549
FORM 10-K
| x | ANNUAL REPORT PURSUANT TO SECTION 13 OR 15(d) OF THE SECURITIES EXCHANGE ACT OF 1934 |
For the fiscal year ended December 31, 2009
OR
| ¨ | TRANSITION REPORT PURSUANT TO SECTION 13 OR 15(d) OF THE SECURITIES EXCHANGE ACT OF 1934 |
For the transition period from to
Commission file number 1-13664
THE PMI GROUP, INC.
(Exact name of registrant as specified in its charter)
| Delaware | 3003 Oak Road Walnut Creek, California 94597 |
94-3199675 | ||
| (State of Incorporation) | (Address of principal executive offices) | (I.R.S. Employer Identification No.) |
(925) 658-7878
(Registrant’s telephone number, including area code)
Securities registered pursuant to Section 12(b) of the Act:
| Title of each class |
Name of each exchange on which registered | |
| Common Stock, $0.01 par value | New York Stock Exchange |
Securities registered pursuant to Section 12(g) of the Act:
None
Indicate by check mark if the registrant is a well-known seasoned issuer, as defined in Rule 405 of the Securities Act. Yes ¨ No x
Indicate by check mark if the registrant is not required to file reports pursuant to Section 13 or Section 15(d) of the Act. Yes ¨ No x
Indicate by check mark whether the registrant: (1) has filed all reports required to be filed by Section 13 or 15(d) of the Securities Exchange Act of 1934 during the preceding 12 months (or for such shorter period that the registrant was required to file such reports), and (2) has been subject to such filing requirements for the past 90 days. Yes x No ¨
Indicate by check mark if disclosure of delinquent filers pursuant to Item 405 of Regulation S-K is not contained herein, and will not be contained, to the best of registrant’s knowledge, in definitive proxy or information statements incorporated by reference in Part III of this Form 10-K or any amendment to this Form 10-K. x
Indicate by check mark whether the registrant has submitted electronically and posted on its corporate Web site, if any, every Interactive Data File required to be submitted and posted pursuant to Rule 405 of Regulation S-T (§232.405 of this chapter) during the preceding 12 months (or for such shorter period that the registrant was required to submit and post such files). Yes ¨ No ¨
Indicate by check mark whether the registrant is a large accelerated filer, an accelerated filer, a non-accelerated filer or a smaller reporting company. See the definition of “large accelerated filer” and “accelerated filer” and “smaller reporting company” in Rule 12b-2 of the Exchange Act. (Check one):
| Large accelerate filer ¨ |
Accelerated filer x | Non-accelerated filer ¨ | Smaller Reporting Company ¨ |
Indicate by check mark whether the registrant is a shell company (as defined in Rule 12b-2 of the Exchange Act). Yes ¨ No x
The aggregate market value of the voting stock (common stock) held by non-affiliates of the registrant as of the close of business on June 30, 2009 was approximately $121.1 million based on the closing sale price of the common stock on the New York Stock Exchange consolidated tape on that date. All executive officers and directors, and beneficial owners of 10% or more of the outstanding shares, of the registrant have been deemed, solely for the purpose of the foregoing calculation, to be “affiliates” of the registrant.
Number of shares outstanding of registrant’s common stock, as of close of business on February 26, 2010: 82,748,367.
DOCUMENTS INCORPORATED BY REFERENCE
Portions of the Proxy Statement for registrant’s Annual Meeting of Stockholders to be held on May 21, 2010 are incorporated by reference into Items 10 through 14 of Part III.
Table of Contents
| PART I | ||||
| Item 1. | 2 | |||
| 2 | ||||
| B. PMI, The Mortgage Insurance Industry and the Current Pronounced Real Estate Cycle |
3 | |||
| 4 | ||||
| 7 | ||||
| 8 | ||||
| 12 | ||||
| 13 | ||||
| 13 | ||||
| 14 | ||||
| 19 | ||||
| 21 | ||||
| 30 | ||||
| 30 | ||||
| 32 | ||||
| 38 | ||||
| 43 | ||||
| 44 | ||||
| 46 | ||||
| Item 1A. | 46 | |||
| Item 1B. | 66 | |||
| Item 2. | 66 | |||
| Item 3. | 66 | |||
| Executive Officers of Registrant | 68 | |||
| PART II | ||||
| Item 5. | Market for the Registrant’s Common Equity, Related Stockholder Matters and Issuer Purchases of Equity Securities | 69 | ||
| Item 6. | 72 | |||
| Item 7. | Management’s Discussion and Analysis of Financial Condition and Results of Operations |
74 | ||
| Item 7A. | 124 | |||
| Item 8. | 127 | |||
| Item 9A. | 191 | |||
| PART III | ||||
| Item 10. | 192 | |||
| Item 11. | 192 | |||
| Item 12. | Security Ownership of Certain Beneficial Owners and Management and Related Stockholder Matters | 192 | ||
| Item 13. | Certain Relationships and Related Transactions, and Director Independence |
192 | ||
| Item 14. | 192 | |||
| PART IV | ||||
| Item 15. | 193 | |||
Table of Contents
Cautionary Statement Regarding Forward-Looking Statements
Statements we make or incorporate by reference in this and other documents filed with the Securities and Exchange Commission that are not historical facts, that are preceded by, followed by or include the words “believes,” “expects,” “anticipates,” “estimates” or similar expressions, or that relate to future plans, events or performance are “forward-looking statements” within the meaning of the federal securities laws. Forward-looking statements in this report include discussions of future potential trends relating to losses, claims paid, loss reserves, default inventories and cure rates of our various insurance subsidiaries, rescission and claim denial activity and the challenges thereto, persistency, premiums, new insurance written, refinance activity, the make-up of our various insurance portfolios, the impact of market and competitive conditions, rising unemployment, liquidity, capital requirements and initiatives, regulatory and contractual capital adequacy requirements, potential legislative changes, potential discretionary regulatory decisions by insurance regulators, captive reinsurance agreements, restructuring opportunities associated with our modified pool policies, fair value of certain debt instruments, the performance of our derivative contracts as well as certain securities held in our investment portfolios and potential litigation. When a forward-looking statement includes an underlying assumption, we caution that, while we believe the assumption to be reasonable and make it in good faith, assumed facts almost always vary from actual results, and the difference between assumed facts and actual results can be material. Where, in any forward-looking statement, we express an expectation or belief as to future results, there can be no assurance that the expectation or belief will result. Our actual results may differ materially from those expressed in our forward-looking statements. Forward-looking statements involve a number of risks or uncertainties including, but not limited to, the Risk Factors addressed in Item 1A below. Other risks are referred to from time to time in our periodic filings with the Securities and Exchange Commission. All of our forward-looking statements are qualified by and should be read in conjunction with our risk disclosures. Except as may be required by applicable law, we undertake no obligation to publicly update or revise any forward-looking statements, whether as a result of new information, future events or otherwise.
1
Table of Contents
| ITEM 1. | BUSINESS |
| A. | Overview of Operations |
Through our subsidiary, PMI Mortgage Insurance Co. (“MIC”), and its affiliated companies (collectively “PMI”), we provide residential mortgage insurance in the United States. Mortgage insurance provides loss protection to mortgage lenders and investors in the event of borrower default. By protecting lenders and investors from credit losses, we help to ensure that mortgages are available to prospective U.S. homebuyers.
Our business has undergone significant changes in the past few years, and the protracted deterioration of the U.S. economy has negatively affected our financial condition and results of operations. Our consolidated net loss was $659.3 million for the year ended December 31, 2009. Our financial condition and results of operations for 2009 are discussed on both a consolidated and segment basis in Item 7. Management’s Discussion and Analysis of Financial Condition and Results of Operations (the “MD&A”), below. As a result of our significant net losses, we face a number of regulatory and other issues as discussed in C. Regulatory and Other Issues Facing PMI, below, and in the MD&A.
In 2008, we sold our Australian and Asian operations and we are not writing new business in our European and Canadian operations. As a result, we are primarily focused on our U.S. Mortgage Insurance operations. In response to changing economic and industry conditions and in order to preserve capital, PMI made a number of changes to its underwriting guidelines and customer management strategies in 2008 and 2009, all of which had the effect of limiting PMI’s new business writings in 2009. We are undertaking efforts to maintain or slightly increase insurance writings in 2010. However, we expect a variety of factors to continue to impact our new business writings in 2010. Such factors include, among others, mortgage and private mortgage insurance market conditions, PMI’s underwriting guidelines, which limit the type of new business that PMI is willing to write, and the continuation of certain customer management strategies adopted in 2009.
In 2009, we implemented a number of capital and business initiatives designed to mitigate losses and/or generate capital or capital relief. Such initiatives included:
Homeownership Preservation—In 2007, we formed PMI’s Homeownership Preservation Initiatives (“HPI”) department to develop and carry out our loss mitigation strategies. One of our strategies is to help loan servicers with their implementation of programs, including the Home Affordable Modification Program (“HAMP”), designed to assist troubled borrowers with finding solutions to avoid foreclosure and potentially cure and reinstate their loans. In 2009, loss mitigation efforts contributed to approximately $1.0 billion of workouts of delinquent risk in force.
Modified Pool Restructuring—In 2009, we restructured (including through commutation) certain modified pool policies which resulted in the acceleration of claims paid at a discount of the reserves established on such modified pool policies and the release of loss reserves, which in turn resulted in capital benefits to MIC, on both a statutory and GAAP basis.
Contribution of PMI Insurance Co., or PIC, to MIC—Effective September 30, 2009, we contributed our wholly owned subsidiary, PIC, to MIC. As of the effective date, the contribution of PIC improved MIC’s capital position and increased MIC’s excess minimum policyholders’ position.
Sale of RAM Re—In 2009, MIC sold its entire investment in RAM Re, which benefited PMI’s liquidity and capital position. MIC previously reduced its carrying value of its investment in RAM Re to zero.
We continue to focus on capital initiatives but, especially given current and expected future market conditions, there can be no assurance that we will be able to achieve further statutory capital relief or improve our capital and liquidity position. See Item 1A. Risk Factors—Capital and Liquidity Constraints.
2
Table of Contents
We divide our business into three segments—U.S. Mortgage Insurance Operations, International Operations and Corporate and Other.
U.S. Mortgage Insurance Operations. As a U.S. residential mortgage insurer, PMI offers a variety of mortgage insurance products to meet the capital and credit risk mitigation needs of its customers. PMI also owns 50% of CMG Mortgage Insurance Company, or CMG MI, a joint venture that provides mortgage insurance exclusively to credit unions.
International Operations. Our International Operations segment consists of our European and Canadian subsidiaries (“PMI Europe” and “PMI Canada”), neither of which is writing new business. PMI Europe offered mortgage insurance and mortgage credit enhancement products tailored primarily to the European mortgage markets, through 2008. PMI Canada offered residential mortgage insurance products in Canada from 2007 to 2008. Our International Operations segment also consists of the discontinued operations of our former Australian and Asian mortgage insurance subsidiaries, which we sold in 2008. Our International Operations segment did not generate significant revenues in 2009. In connection with our sale of PMI Australia, we received a note from QBE in the principal amount of approximately $187 million, with interest accruing through September 2011, when it matures. The note, which we refer to as the QBE Note, is payable by QBE. Other than revenues from the amounts due on the QBE Note in 2011, we do not expect that our International Operations segment will generate significant revenues in the future.
Corporate and Other. Our Corporate and Other segment consists of corporate debt and expenses of our holding company, The PMI Group, Inc. (“The PMI Group” or “TPG” or the “Company”), equity in earnings or losses from investments in certain limited partnerships and our discontinued contract underwriting operations. This segment also includes our investment in FGIC Corporation and its wholly-owned subsidiary, Financial Guaranty Insurance Company (“FGIC”) and our former investment in RAM Re, which we sold in the fourth quarter of 2009. FGIC is a financial guarantor and has ceased writing new business. In 2008, we reduced the carrying value of our investment in FGIC to zero.
As of December 31, 2009, our consolidated total assets were $4.6 billion, including our investment portfolio of $2.6 billion and total cash and cash equivalents of $0.7 billion. Our consolidated shareholders’ equity was $0.7 billion as of December 31, 2009. See Item 8. Financial Statements and Supplementary Data – Note 18. Business Segments, for financial information regarding our business segments.
Our website address is http://www.pmi-us.com. Information on our website does not constitute part of this report. Our annual report on Form 10-K, quarterly reports on Form 10-Q, current reports on Form 8-K and any amendments to those reports are available free of charge on our website via a hyperlink as soon as reasonably practicable after such material is electronically filed with or furnished to the Securities and Exchange Commission. The PMI Group is a Delaware corporation founded in 1972. Our principal executive offices are located at 3003 Oak Road, Walnut Creek, California 94597-2098, and our telephone number is (925) 658-7878.
| B. | PMI, the Mortgage Insurance Industry and the Current Pronounced Real Estate Cycle |
The insurance coverage issued by PMI and other U.S. mortgage insurers has several attributes that make mortgage insurance companies more susceptible to the cyclical nature of the economy in general and the housing and labor markets in particular than many other types of insurance companies. Mortgage insurance is generally renewable at the option of the insured at the premium rate fixed when the insurance on the loan was initially issued. As a result, losses from increased claims from policies originated in a particular year cannot be offset by renewal premium increases on policies in force. In addition, we may not cancel the insurance coverage we issue except in the event of nonpayment of premiums or certain violations of PMI’s master policies. Therefore, the average life of a PMI mortgage insurance policy generally has ranged from approximately four to ten years and may span a significant portion of an economic or real estate cycle. As a result, the loss ratios, which are the ratios of an insurer’s incurred losses to premiums earned, of PMI and the mortgage insurance industry are particularly
3
Table of Contents
affected by the cyclical nature of the U.S. economy and housing and labor markets. The chart below shows the mortgage insurance industry’s average loss ratios between 1989 and September 30, 2009 (the most recent date for which industry data is available) and PMI’s loss ratios between 1989 and 2009.
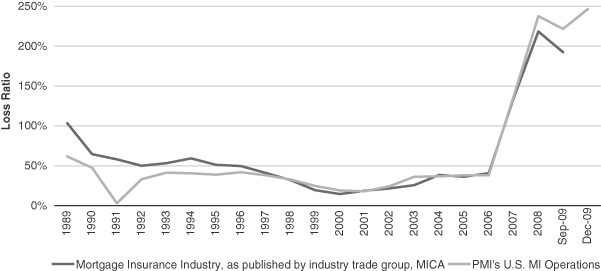
As shown in the chart above, rising unemployment rates in the United States and ongoing weakness in U.S. credit, capital, residential mortgage, and housing markets have been reflected in our and the industry’s increasing loss ratios in recent years. For the same reason, we expect PMI to continue to experience elevated losses in 2010. These losses have reduced, and will continue to reduce, PMI’s net assets. This reduction in net assets and the prospect of continued losses have raised a number of regulatory and other issues, discussed in Section C (as well as in the MD&A) below.
| C. | Certain Regulatory and Other Issues Facing PMI |
State Regulatory Capital Adequacy Requirements. In sixteen states, if a mortgage insurer does not meet a required minimum policyholders’ position or exceeds a maximum permitted risk-to-capital ratio (generally 25 to 1), it may be prohibited from writing new business until its policyholders’ position meets the minimum or its risk-to-capital ratio falls below the limit, as applicable. In certain of those states, the applicable regulations require a mortgage insurer to immediately cease writing new business if and so long as it fails to meet the applicable capital adequacy requirements. In other states, the applicable regulator has discretion as to whether the mortgage insurer may continue writing new business. In 2009, North Carolina, Arizona and California adopted legislation giving the respective state’s insurance regulators such discretion. Thirty-four other states do not have specific capital adequacy requirements for mortgage insurers.
4
Table of Contents
As a result of its high losses, MIC’s risk-to-capital ratio has increased and its excess minimum policyholders’ position has decreased. The graph below shows MIC’s risk-to-capital ratio and excess minimum policyholders’ position:
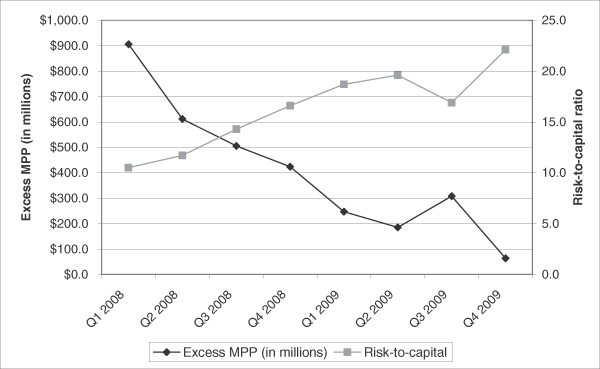
As of December 31, 2009, MIC’s risk-to-capital ratio was 22.1 to 1 and its excess minimum policyholders’ position was $63.9 million. Unless we raise substantial additional capital or achieve significant additional statutory capital relief in the first quarter of 2010, MIC’s excess minimum policyholders’ position will decline and risk-to-capital ratio will increase beyond levels necessary to meet regulatory capital adequacy requirements.
MIC’s principal regulator is the Arizona Department of Insurance (the “Department”). The Department notified MIC in the third quarter of 2009 of its initiation of a limited scope examination to determine, among other things, whether to exercise discretion and permit MIC to continue writing new business in the event MIC fails to maintain Arizona’s minimum policyholders’ position. On February 10, 2010, MIC received a letter from the Department waiving, until December 31, 2011, the requirement that MIC maintain the Arizona required minimum policyholders’ position to write new business. The waiver may be withdrawn by the Arizona Director of Insurance in her sole discretion at any time. Accordingly, there can be no assurance as to the period during which the waiver will remain in effect. If the Department were to withdraw the waiver and MIC fails to maintain Arizona’s minimum policyholders’ position, we would likely be required to suspend writing new business in all states. Even with the waiver from the Department, other states could require MIC to cease new business writings if we fail to maintain the applicable capital adequacy requirements. While the waiver remains in effect, the waiver letter requires that MIC, among other things, comply with certain information reporting requirements, submit to the Department for its approval MIC’s annual operating plan for calendar years 2010 and 2011, and submit to the Department for its approval any proposed material change to MIC’s then-current underwriting guidelines or operating plan. See Item 1A. Risk Factors—Unless we raise substantial additional capital or achieve significant capital relief in the first quarter of 2010, MIC will fail to meet various capital adequacy requirements and could be required to cease writing new business and could be subject to the terms of its runoff support agreement with Allstate.
5
Table of Contents
From time to time, we have discussed with certain state insurance regulators their financially hazardous condition regulations generally applicable to licensed insurance companies and those states’ interpretive positions that we are, or could be, in violation of their respective regulations. None of these states has taken any action against MIC to date. If any of those states or other states having similar financially hazardous condition regulations (which are most states) were to conclude that MIC was in a financially hazardous condition, MIC may be required to cease writing new business in that state.
PMI Mortgage Assurance Co. (“PMAC”). In the event that MIC is unable to continue to write new mortgage insurance in one or more states, we are working on a plan to enable us to write new mortgage insurance in such states by PMAC. PMAC is a subsidiary of MIC, and was formerly known as Commercial Loan Insurance Corporation, or CLIC. PMAC is currently licensed to write insurance in all states except Connecticut, Michigan and New York. In several other states, PMAC is applying to revise the line of insurance business it is authorized to transact so that it may begin writing residential mortgage guaranty insurance in those states. There is no guarantee that PMAC will be able to obtain insurance licenses in Connecticut, Michigan or New York or approval to revise its existing licenses in other impacted states. In addition, before PMAC can begin writing new business, Freddie Mac must approve PMAC as an eligible mortgage insurer. On February 12, 2010, Fannie Mae approved PMAC as a direct issuer of mortgage guaranty insurance. Fannie Mae’s approval terminates on the earlier of December 31, 2011 or the date that MIC ceases to transact new business in all jurisdictions in which it is licensed. The approval is subject to a number of detailed conditions. Among others, the approval contains limitations as to the jurisdictions, volume and types of new business PMAC may write, and restricts MIC and PMAC from taking a variety of actions, subject to enumerated exceptions, without Fannie Mae’s prior written consent, which is not to be unreasonably withheld, including engaging in certain transactions with affiliates, paying dividends or making distributions or payments of indebtedness or transferring assets outside the ordinary course of business or in excess of specified levels. Notwithstanding these restrictions, the agreement with Fannie Mae permits MIC to make dividend, interest and principal payments in connection with the issuance of certain new debt or equity instruments up to specified levels. PMAC is currently in negotiations with Freddie Mac about becoming an eligible insurer under Freddie Mac’s criteria.
Continued GSE Eligibility. Lenders purchase mortgage insurance from us to reduce losses as a result of borrower default, to obtain capital relief and, most often, to facilitate the sale of their low down payment loans to the GSEs. The GSEs purchase residential mortgages from lenders and investors as part of their mandate to provide liquidity in the secondary mortgage market. As a result of their purchases of low down payment mortgages, the GSEs are, and historically have been, two of PMI’s largest customers. The GSEs have established approval requirements for eligible mortgage insurers. In 2008, because of rating agency actions discussed under “—Financial Strength Ratings” below, in order to maintain its GSE eligibility, MIC was required to submit written remediation plans to each GSE outlining, among other things, the steps we are taking or plan to take to bolster MIC’s financial strength. To date, each of the GSEs continues to treat MIC as an eligible mortgage insurer. There can be no assurance, however, that the GSEs will continue to treat MIC as an eligible mortgage insurer. See Item 1A. Risk Factors—The exercise of certain rights reserved by the GSEs under eligibility requirements for mortgage insurers could harm our profitability and reduce our operational flexibility.
Financial Strength Ratings. Independent rating agencies have assigned our insurance subsidiaries certain insurer financial strength ratings, which are based on the rating agencies’ assessments of the financial risks associated with historical business activities and new business initiatives. In their assessments, the rating agencies model the adequacy of capital to withstand severe loss scenarios and review, among other things, corporate strategy, operational performance, available liquidity, the outlook for the relevant industry, and competitive position. The rating agencies can change or withdraw their ratings at any time.
6
Table of Contents
The insurer financial strength ratings of our insurance subsidiaries are set forth in the table below.
| Insurer Financial Strength Ratings (as of March 5, 2010) | ||||||
| Standard & Poor’s | Moody’s | Fitch | ||||
| PMI Mortgage Insurance Co. |
B+ | B2 | NR | |||
| PMI Insurance Co. |
B+ | NR | NR | |||
| PMI Europe |
B+ | NR | NR | |||
| CMG Mortgage Insurance Company |
BBB | NR | BBB | |||
| FGIC |
NR | NR | NR | |||
Ratings assigned to our holding company or its debt are set out below.
| Holding Company Ratings (as of March 5, 2010) | ||||||
| Standard & Poor’s Counterparty Credit Rating |
Moody’s Senior Unsecured Debt Rating |
Fitch Senior Unsecured Debt Rating | ||||
| The PMI Group, Inc. |
CCC+ | Caa2 | NR | |||
In 2008, and further in 2009, partially in response to MIC’s increased losses and reduced capital, Standard & Poor’s (“S&P”) and Moody’s Investors Service (“Moody’s”) each lowered its insurer financial strength rating on MIC from “AA” or equivalent to “B+” and “B2” respectively. In addition, PMI Europe and CMG MI receive capital support from MIC and are, therefore, dependent in part upon the financial strength of MIC. For a discussion of recent rating agency actions with respect to our holding company’s ratings and subsidiaries’ insurer financial strength ratings and risk factors associated with these issues, see Item 1A. Risk Factors—We have been and will continue to be negatively impacted by downgrades of MIC’s insurer financial strength ratings and —A downgrade of our senior unsecured debt ratings could increase our borrowing costs and, therefore, adversely affect our liquidity and “—Liquidity and Capital Resources—Ratings” in the MD&A.
| D. | U.S. Mortgage Insurance Operations |
Through PMI, we provide residential mortgage insurance products to mortgage lenders and investors throughout the United States. MIC is incorporated in Arizona, headquartered in Walnut Creek, California, and licensed in all 50 states, the District of Columbia, Puerto Rico, Guam, and the Virgin Islands. Under its monoline insurance licenses, MIC may only offer mortgage insurance covering first lien, one-to-four family residential mortgages.
Residential mortgage insurance protects mortgage lenders and investors in the event of borrower default, by reducing and, in some instances, eliminating the resulting credit loss to the insured institution. By mitigating losses as a result of borrower default, residential mortgage insurance facilitates the origination of “low down payment mortgages,” generally mortgages to borrowers who make down payments of less than 20% of the value of the homes. Mortgage insurance also reduces the capital that financial institutions are required to hold against insured loans and facilitates the sale of low down payment mortgage loans in the secondary mortgage market, primarily to the GSEs, or “agency market”.
PMI’s residential mortgage insurance products typically provide first loss protection on loans originated by residential mortgage lenders and sold to the GSEs and, to a lesser extent, on loans held by portfolio lenders. PMI’s current product offerings are described below. In response to changing economic and industry conditions and in order to preserve capital, PMI made a number of changes to its underwriting guidelines and customer management strategies in 2008 and 2009, all of which had the effect of limiting PMI’s new business writings in
7
Table of Contents
2009. We are undertaking efforts to maintain or slightly increase insurance writings in 2010. However, we expect a variety of factors to continue to impact our new business writings in 2010. Such factors include, among others, mortgage and private mortgage insurance market conditions, PMI’s underwriting guidelines, which limit the type of new business that PMI is willing to write, and the continuation of certain customer management strategies adopted in 2009. Section 6. Risk Management, below, discusses risk management strategies and underwriting guideline changes made by PMI. Even with the adoption of tighter underwriting guidelines and management strategies of new business writings, unless we raise substantial additional capital or achieve significant additional statutory capital relief in the first quarter of 2010, MIC will fail to satisfy regulatory capital adequacy requirements, which could require MIC to cease writing new business. See also Item 7. Management’s Discussion and Analysis of Financial Condition and Results of Operations—Conditions and Trends Affecting our Business—U.S. Mortgage Insurance Operations, and Item 1A. Risk Factors—Capital and Liquidity Constraints, below.
| 1. | Products |
(a) Primary Mortgage Insurance
Primary insurance provides the insured with first-loss mortgage default protection on individual loans at specified coverage percentages. Our maximum obligation to an insured with respect to a claim is generally determined by multiplying the coverage percentage selected by the insured by the loss amount on the defaulted loan. The loss amount includes any unpaid loan balance, delinquent interest and certain expenses associated with the loan’s default and property foreclosure. In lieu of paying the coverage percentage of the loss amount on a defaulted loan, we generally may: (i) pay the full loss amount and take title to the mortgaged property, or (ii) in the event that the property is sold prior to settlement of the claim, pay the insured’s actual loss up to the maximum level of coverage.
Our core, primary mortgage insurance business is offered on a loan-by-loan basis to lenders through our “flow” channel. The majority of our primary insurance written is on loans sold to the GSEs. Prior to 2009, through its structured finance channel, PMI also offered and sold primary mortgage insurance products to non-agency mortgage-backed securities (“MBS”) issuers as credit enhancement covering portfolios of loans (“non-agency market”). PMI does not expect to offer structured primary mortgage insurance products in 2010.
PMI’s primary insurance in force and primary risk in force at December 31, 2009 were $113.7 billion and $27.8 billion, respectively. Primary insurance in force refers to the current principal balance of all outstanding mortgage loans with primary insurance coverage as of a given date. Primary risk in force is the aggregate dollar amount of each primary insured mortgage loan’s current principal balance multiplied by the insurance coverage percentage specified in the applicable policy. The chart below shows our U.S. primary new insurance written, or NIW, for the years ended December 31, 2009, 2008 and 2007. NIW refers to the original principal balance of all loans that receive new primary mortgage insurance coverage during a given period.
| 2009 | 2008 | 2007 | ||||||||||||||||
| (Dollars in millions) | ||||||||||||||||||
| Flow Channel |
$ | 8,993 | 100 | % | $ | 22,197 | 98 | % | $ | 37,584 | 81 | % | ||||||
| Structured Finance Channel |
1 | 0 | % | 442 | 2 | % | 8,549 | 19 | % | |||||||||
| Total Primary NIW |
$ | 8,994 | 100 | % | $ | 22,639 | 100 | % | $ | 46,133 | 100 | % | ||||||
PMI’s total primary NIW decreased substantially in 2009, principally due to PMI’s capital management strategies and changes to PMI’s underwriting guidelines that limited the types of loans PMI would insure. The size of the U.S. mortgage origination market also impacts PMI’s NIW and is influenced by many economic factors, including access to credit markets, unemployment rates, interest rates, home prices, federal and state economic stimulus programs and policies, GSE and lender-specific policies, and the availability of mortgage insurance for high-LTV loans. Increased competition from mortgage insurance programs offered by the Federal Housing Authority (FHA) has also contributed to PMI’s declining NIW. Notwithstanding these external market
8
Table of Contents
pressures, in 2009, there was substantial market demand for primary mortgage insurance products on low-down payment mortgage loans; however, due to capital constraints, PMI limited its new insurance writings. We believe that the size of the residential U.S. mortgage origination market in 2010 will be smaller than in 2009, primarily because, with interest rates expected to rise in 2010 and with borrowers faced with significant equity constraints, refinance activity is likely to decrease sharply. While the size of the mortgage origination market is expected to be smaller in 2010, purchase loan originations as a percentage of the total origination market are expected to increase. As discussed above, while we are undertaking efforts to maintain or slightly increase insurance writings, we expect a variety of factors to continue to impact such new business writings in 2010.
Primary Flow Channel.
As the GSEs have traditionally been the principal purchasers of conforming mortgage loans, mortgage lenders have typically originated such loans in conformance with GSE guidelines for sellers and servicers. These guidelines reflect the GSEs’ own charter requirements which, among other things, allow the GSEs to purchase low down payment mortgage loans only if the lender: (i) secures mortgage insurance on those loans from an eligible insurer, such as PMI; or (ii) retains a participation of not less than 10% in the mortgage; or (iii) agrees to repurchase or replace the mortgage in the event of a default under specified conditions. If the lender retains a participation in the mortgage or agrees to repurchase or replace the mortgage, banking regulations may increase the level of capital required to be held by the lender to reflect the lender’s increased obligations, which could in turn increase the lender’s cost of doing business.
Under the U.S. Department of the Treasury’s (“Treasury”) Home Affordable Refinance Program (“HARP”), announced on March 4, 2009, certain borrowers whose loans are owned or guaranteed by the GSEs and have loan-to-value ratios that have risen as a result of declines in home prices, may refinance and take advantage of lower interest rates or a more stable loan product. HARP will be in effect through June 2010. Under HARP, the GSEs will not require mortgage insurance as credit enhancement on refinances of mortgages that were originated at less than 80% LTV, but are now greater than 80% LTV. For loans that were originated with mortgage insurance, the original policies are generally expected to remain in place on the affected loans. As of December 31, 2009, PMI approved 3,594 HARP requests and, of those, 2,339 were finalized, totaling approximately $509.5 million in modified insurance in force.
The GSEs have established approval requirements for eligible mortgage insurers. The approval requirements cover substantially all areas of PMI’s mortgage insurance operations and require disclosure of certain activities and new products to the GSEs. Prior to the suspension of certain eligibility criteria in February 2008, the GSEs mandated that eligible mortgage insurers maintain at least two of the following three ratings: “AA-” by S&P or Fitch Ratings (“Fitch”), or “Aa3” by Moody’s. In response to ratings downgrades of MIC below “AA-”, the GSEs required us to submit remediation plans and each GSE has required regular updates from MIC with respect to the remediation plans. To date, each GSE has continued to treat us as an eligible mortgage insurer, although there is no assurance that they will continue to do so. See Item 1A. Risk Factors—We have been and will continue to be negatively impacted by downgrades of MIC’s insurer financial strength ratings and—The exercise of certain rights reserved by the GSEs under eligibility requirements for mortgage insurers could harm our profitability and reduce our operational flexibility. In 2009, each of the GSEs circulated among all currently approved private mortgage insurers drafts of their respective revised eligibility requirements, to which we provided comments. Generally, the changes are principally focused on capital management and GSE review and consent of a wide array of operational, fiscal and product matters. We expect that under the revised eligibility requirements, the circumstances under which the GSEs will exercise increased oversight of eligible private mortgage insurers will be more clearly defined. Because we are presently operating under remediation plans with the GSEs, the level of oversight the GSEs currently have over PMI is not expected to materially change under the revised requirements. Although the timing is uncertain, we expect that the GSEs will finalize their revised requirements in the first half of 2010.
9
Table of Contents
In September 2008, the Treasury placed the GSEs into conservatorship and appointed the Federal Housing Finance Agency (“FHFA”) as their conservator. In conservatorship, the GSEs could change their business practices with respect to the mortgage insurance industry or individual mortgage insurers, which could materially impact the quantity and level of mortgage insurance coverage required by the GSEs on residential mortgage loans or MIC’s status as an eligible mortgage insurer. Moreover, the GSEs’ business practices may be impacted by their results of operations as well as legislative or regulatory changes governing their operations. The appointment of a conservator increases the likelihood that the U.S. Congress will examine the role and purpose of the GSEs in the U.S. housing market and potentially propose structural and other changes to the GSEs. New federal legislation could reduce the level of private mortgage insurance coverage used by the GSEs as credit enhancement or eliminate the requirement altogether. See Item 1A. Risk Factors—If the role of the GSEs in the U.S. housing market is changed, or if the GSEs change other policies or practices, the amount of insurance that PMI writes could further decrease, which could result in a decrease of our future revenue.
Lenders that purchase mortgage insurance select specific coverage levels for insured loans. As a result of the GSEs’ coverage requirements, lenders generally select a coverage percentage that effectively reduces the ratio of the original loan amount to the value of the property, or LTV, to not more than 80%. In the past, the GSEs have had programs under which for certain loans lenders could choose a mortgage insurance coverage percentage that was the minimum required by the GSEs’ charters, or “charter coverage”, rather than a higher, or “standard coverage”, in exchange for a lower payment from the GSEs. The GSEs also have had programs known as “reduced coverage”, under which for certain loans lenders could choose a coverage level that was higher than charter coverage but lower than standard coverage. Effective January 1, 2010, the lender’s option to purchase reduced coverage for loans sold to Fannie Mae was eliminated, and lenders have the option of selecting charter coverage, rather than standard coverage, on a broader array of loans. Because the new option only recently went into effect, we cannot predict with any certainty whether lenders will select the lower charter coverage option on a significantly higher percentage of loans.
PMI charges higher premium rates for higher coverage, as higher coverage percentages generally result in higher amounts paid per claim. Depending on the loan, the premium payments for flow primary mortgage insurance coverage are typically borne by the insured’s customer, the mortgage borrower (“Borrower Paid MI”), and less frequently, by the insured (“Lender Paid MI”). In either case, the payment of premiums to us is generally the responsibility of the insured. PMI’s primary insurance rates are based on rates that we have filed with the various state insurance departments. To establish these rates, we utilize pricing models that allow PMI to assess risk across a spectrum of variables, including coverage percentages, loan and property attributes, and borrower risk characteristics. We also offer Lender Paid MI products, which are priced and filed in the same manner as our standard Borrower Paid MI rates. Lender Paid MI represented 8.4%, 6.2% and 20.1% of flow NIW in 2009, 2008 and 2007, respectively.
Premium payments may be paid to us on a monthly, annual or single premium basis. Monthly payment plans represented 88.3%, 94.7% and 93.5% of NIW in 2009, 2008 and 2007, respectively. As of December 31, 2009, monthly plans represented 92.4% of our U.S. primary risk in force compared to 92.8% at December 31, 2008 and 92.9% at December 31, 2007. Single premium plans represented substantially all of the remaining NIW and primary risk in force. A portion of single premium plan payments may be refundable if the insured cancels coverage, which generally occurs when the loan is repaid, the loan amortizes to a sufficiently low amount to trigger a lender permitted or legally required cancellation or the value of the property has increased sufficiently.
Primary mortgage insurance premium rates are fixed when the insurance on the loan is initially issued. As a result, losses from increased claims on policies originated in a particular year cannot be offset by renewal premium increases on policies in force. We may not cancel mortgage insurance coverage except in the event of nonpayment of premiums or certain material violations of PMI’s master policies. However, the insured or the loan’s mortgage servicer generally may cancel mortgage insurance coverage issued through our flow channel at any time. In addition, the GSEs’ guidelines generally provide that a borrower’s written request to cancel Borrower Paid MI should be honored if the borrower has a satisfactory payment record and the principal balance is not greater than 80% of the original value of the property or, in some instances, the current value of the
10
Table of Contents
property. The Homeowners Protection Act of 1998 also provides for the automatic termination of Borrower Paid MI on most loans when the LTV ratio (based upon the loan’s amortization schedule) reaches 78%, and provides for cancellation of Borrower Paid MI upon a borrower’s request when the LTV ratio (based on the original value of the property) reaches 80%, upon satisfaction of conditions set forth in the statute.
Structured Finance Channel.
PMI has offered primary mortgage insurance products through its structured finance channel, primarily to MBS issuers as credit enhancement covering portfolios of loans. While the terms varied, our structured finance products generally insured a group of pre-existing loans or loans that were to be originated in the future whose attributes were to conform to the terms of the negotiated agreement. A structured finance product can include primary insurance (first loss) and/or modified pool insurance (discussed below). We utilized risk-based pricing models to establish premium rates for our structured finance transactions business, which considered the requested structure, real estate loss scenarios, as well as loan and property attributes and borrower risk characteristics. Payment of premiums to us is generally the obligation of the insured. We do not anticipate offering structured finance products in 2010.
(b) Pool Insurance
Modified Pool Insurance. Prior to 2008, we offered modified pool insurance products, primarily to the GSEs for regulatory capital relief or the reduction of mortgage default risk. Modified pool insurance may be used in tandem with primary mortgage insurance or may be placed on loans that do not require primary insurance. The extent of coverage of modified pool products varies. Some products provide first loss protection by covering losses (up to a loan-level benefit limit) on individual loans held within the pool of insured loans up to a stated aggregate loss limit (“stop loss limit”) for the entire pool. Some modified pool products offer mezzanine-level coverage by providing for claims payments only after a predetermined cumulative claims level, or deductible, is reached. Such mezzanine-level coverage generally also includes a stop loss limit. The existence of stop-loss protection for PMI’s modified pool exposure results in a maximum loss amount equal to PMI’s modified pool risk-in-force. As of December 31, 2009, PMI had $0.8 billion of modified pool risk in force, representing 2.7% of PMI’s total risk in force. Unless otherwise noted, primary insurance statistics in this report do not include pool insurance.
As a key component of our capital relief strategy, we have been and continue to pursue opportunities to restructure our modified pool exposure (including through commutation). As the modified pool portfolio’s 2005, 2006 and 2007 book years are likely to continue to age under severe economic conditions, we recorded significant reserves in 2009 and expect to record significant additional reserves in 2010 with respect to this portfolio. The existence of stop-loss protection and the significant reserves we have recorded and expect to record provides PMI with opportunities to work with its insured customers to restructure the risk on certain modified pool policies by negotiating early, discounted claim payments. This may particularly be the case when both parties agree on the likely amount of the ultimate contract losses and where the counterparty, rather than waiting to receive future expected claim payments, prefers to receive an acceleration of claim payments for the particular pool, although at a discount of such expected future claim payments. When we restructure our modified pool contracts at a discount to the level of our associated recorded reserves, we realize a statutory capital benefit. In connection with the restructurings we completed in 2009, PMI paid the counterparties accelerated discounted claim payments of approximately $498 million (subject to certain adjustments) in the aggregate. The positive impact that these restructurings had on our loss reserves in 2009 resulted in an estimated aggregate capital benefit, on both a statutory and GAAP basis, to MIC of approximately $130 million.
Other Pool Insurance. Prior to 2002, PMI offered certain traditional pool insurance products, referred to principally as GSE Pool or Old Pool, to lenders, the GSEs and the non-agency market. As of December 31, 2009, other pool insurance represented 1.0% of PMI’s total net risk in force and 28.0% of PMI’s total net pool risk in force (including modified pool).
11
Table of Contents
(c) Joint Venture—CMG Mortgage Insurance Company
CMG Mortgage Insurance Company and its affiliates (collectively “CMG MI”) offer mortgage insurance for loans originated by credit unions. CMG MI is a joint venture, equally owned by MIC and CUNA Mutual Insurance Society (“CMIS”). CMIS is part of the CUNA Mutual Group, which provides insurance and financial services to credit unions and their members. Both MIC and CMIS provide services to CMG MI. CMG MI is a GSE-eligible mortgage insurer. As of December 31, 2009, CMG MI had $22.0 billion of primary insurance in force and $5.4 billion of primary risk in force. CMG MI’s financial results are reported in our consolidated financial statements under the equity method of accounting in accordance with U.S. generally accepted accounting principles or GAAP. CMG MI’s operating results are not included in our results shown in Part I of this Report on Form 10-K, unless otherwise noted.
Under the terms of the restated joint venture agreement effective as of June 1, 2003, CMIS has the right on September 8, 2015, or earlier under certain limited conditions, to require MIC to sell, and MIC has the right to require CMIS to purchase, MIC’s interest in CMG MI for an amount equal to the then current fair market value of MIC’s interest. MIC and CMIS have also entered into a capital support agreement, which is subject to certain limitations, for the benefit of CMG MI. Under the capital support agreement, MIC has an obligation, under specified conditions, to maintain CMG MI’s risk-to-capital ratio at or below 19.0 to 1. CMG MI’s risk-to-capital ratio as of December 31, 2009 was 17.2 to 1. See Item 1A. Risk Factors—Current market volatility combined with falling home prices and rising unemployment have materially and adversely affected our business and results of operations, and we do not expect these conditions to improve in the near future. MIC’s capital support obligation is limited to an aggregate of $37.7 million.
| 2. | Competition |
U.S. Private Mortgage Insurance Industry
The U.S. private mortgage insurance industry presently consists of seven active mortgage insurers: PMI; CMG MI; Mortgage Guaranty Insurance Corporation, or MGIC; Genworth Mortgage Insurance Corporation, an affiliate of Genworth Financial, Inc.; United Guaranty Residential Insurance Company, an affiliate of American International Group, Inc.; Radian Guaranty Inc., or Radian; and Republic Mortgage Insurance Co., an affiliate of Old Republic International. Assured Guaranty Mortgage Insurance Company, a subsidiary of Assured Guaranty Ltd., is also licensed to offer mortgage insurance in the U.S. One new private mortgage insurer, Essent US Holdings, Inc., a member of Essent Group Ltd., was recently approved as a qualified mortgage insurer by the GSEs.
U.S. and State Government Agencies
PMI and other private mortgage insurers compete with federal and state government agencies that sponsor their own mortgage insurance programs. The private mortgage insurers’ principal government competitor is the Federal Housing Administration, or FHA, and to a lesser degree, the Veterans Administration, or VA. The following table shows the relative mortgage insurance market share of FHA/VA and private mortgage insurers over the past five years.
| Federal Government and Private Mortgage Insurance Market Share (Based on NIW) |
|||||||||||||||
| Year Ended December 31, | |||||||||||||||
| 2009 | 2008 | 2007 | 2006 | 2005 | |||||||||||
| FHA/VA |
84.6 | % | 60.3 | % | 20.1 | % | 22.7 | % | 23.5 | % | |||||
| Private Mortgage Insurance |
15.4 | % | 39.7 | % | 79.9 | % | 77.3 | % | 76.5 | % | |||||
| Total |
100.0 | % | 100.0 | % | 100.0 | % | 100.0 | % | 100 | % | |||||
| Source: | Inside Mortgage Finance (based upon primary NIW but includes certain insurance written that we classify as pool insurance) |
12
Table of Contents
Since early 2008, the FHA has substantially increased its market share of the U.S. primary mortgage insurance business. FHA’s market share is higher as a result of private mortgage insurance companies adopting tighter underwriting guidelines limiting the types of loans they will insure and federal legislation enacted in 2008 designed to stabilize the mortgage markets by providing the FHA with greater flexibility in establishing new products and temporarily increasing the maximum loan amount that the FHA may insure, in some cases up to the GSE limits, including up to $729,750 in “high-cost” areas. The FHA is also authorized to refinance distressed mortgages in return for lenders and investors agreeing to write-down the amount of the original mortgage. The 2008 legislation had the effect of broadening the scope of loans eligible for mortgage insurance from the FHA.
While the FHA continues to view its role as providing access to underserved communities and supporting the nation’s economic recovery, on January 20, 2010 it announced a number of changes to its program which are designed to tighten FHA’s eligibility criteria and increase its premium rates. In its announcement, the FHA proposed to: increase its mortgage insurance premium; update the combination of FICO scores and down payments for new borrowers to require those with less than a 580 FICO to put down at least 10% of a property’s purchase price, rather than 3.5% for borrowers with FICO scores of 580 or higher; reduce seller concessions to 3% from 6%; and implement a series of measures aimed at strengthening lender enforcement. The future size of the FHA market share will depend in large part on whether Congress will permanently keep the FHA maximum loan limit at its current level or adopt additional increases. The recently announced changes and any future changes to the FHA program may impact demand for private mortgage insurance.
The size of the private mortgage insurance market is also influenced by GSE conforming loan limits, the maximum loan amount that the GSEs may purchase. In February 2008, Congress passed an economic stimulus package, which temporarily raised (until December 31, 2008) the GSE conforming loan limits for certain statutorily defined high cost areas to $729,750, and the American Recovery and Reinvestment Act of 2009 extended the 2008 GSE loan limits through 2009. In November 2009, the FHFA announced that the maximum conforming loan limits, including those for high cost areas, will remain unchanged in 2010. The increase to the GSE conforming loan limit could increase demand for mortgage insurance products. We and other private mortgage insurers also face competition in several states from state-supported mortgage insurance funds.
Financial Institutions and Mortgage Lenders
We and other private mortgage insurers compete with financial institutions, primarily commercial banks and thrifts, when they retain risk on all or a portion of their high LTV mortgage portfolios rather than obtain insurance for this risk. Our use of captive reinsurance with certain lenders with whom we do business (see Section 9(a)—Captive Reinsurance, below) also negatively impacts our premiums earned.
| 3. | Customers |
Our U.S. customers are primarily mortgage lenders, depository institutions, commercial banks and investors, including the GSEs. In 2009, PMI’s top ten customers generated 56.9% of PMI’s premiums earned compared to 49.4% in 2008. The beneficiary under PMI’s master policies is the owner of the insured loan. The GSEs, as major purchasers of conventional mortgage loans in the U.S., are the primary beneficiaries of PMI’s mortgage insurance coverage. In 2009, we received $74.6 million in premium revenues from Fannie Mae, which exceeded 8% of our consolidated revenues.
| 4. | Sales and Product Development |
We employ a sales force located throughout the U.S. to directly sell products and services to lenders. Our U.S. sales force is comprised entirely of PMI employees who receive compensation consisting of a base salary and incentive compensation tied to certain performance objectives. PMI’s product development and marketing department has primary responsibility for supporting our existing products and the creation of new products.
13
Table of Contents
| 5. | Business Composition |
Primary Risk in Force. The composition of PMI’s primary risk in force is summarized in the table below. The table is based on information available to PMI at the date of policy origination.
| As of December 31, | ||||||||||||||||||||
| 2009 | 2008 | 2007 | 2006 | 2005 | ||||||||||||||||
| Primary Risk in Force (In millions) |
$ | 27,794 | $ | 30,605 | $ | 30,967 | $ | 25,711 | $ | 24,971 | ||||||||||
| Loan and Borrower Characteristics as Percentages of Primary Risk in Force |
||||||||||||||||||||
| LTV: |
||||||||||||||||||||
| Above 97.0% LTV |
20.4 | % | 21.5 | % | 24.6 | % | 17.6 | % | 14.3 | % | ||||||||||
| 95.01% to 97.0% LTV |
4.0 | % | 4.1 | % | 3.8 | % | 4.6 | % | 5.3 | % | ||||||||||
| 90.01% to 95.0% LTV |
30.5 | % | 29.9 | % | 29.5 | % | 31.0 | % | 33.7 | % | ||||||||||
| 85.01% to 90% LTV |
38.1 | % | 37.5 | % | 35.0 | % | 37.9 | % | 37.4 | % | ||||||||||
| 85.00% LTV and below |
7.0 | % | 7.0 | % | 7.1 | % | 8.9 | % | 9.3 | % | ||||||||||
| Loan Type*: |
||||||||||||||||||||
| Fixed |
90.7 | % | 89.7 | % | 87.2 | % | 81.3 | % | 80.4 | % | ||||||||||
| ARMs (excluding 2/28 Hybrid ARMs) |
7.5 | % | 8.0 | % | 9.5 | % | 12.5 | % | 13.7 | % | ||||||||||
| 2/28 Hybrid ARMs |
1.8 | % | 2.3 | % | 3.3 | % | 6.2 | % | 5.9 | % | ||||||||||
| Less-than-A Quality (less than 620 FICO) |
6.8 | % | 7.1 | % | 8.1 | % | 8.0 | % | 9.3 | % | ||||||||||
| Alt-A |
17.0 | % | 18.8 | % | 22.8 | % | 19.9 | % | 17.2 | % | ||||||||||
| Interest Only |
10.9 | % | 11.8 | % | 14.2 | % | 9.9 | % | 6.2 | % | ||||||||||
| Payment Option ARMs |
3.1 | % | 3.4 | % | 3.8 | % | 4.5 | % | 3.5 | % | ||||||||||
| Property Type: |
||||||||||||||||||||
| Single-family detached |
82.0 | % | 82.1 | % | 82.8 | % | 82.7 | % | 83.8 | % | ||||||||||
| Condominium, townhouse, cooperative |
14.2 | % | 13.9 | % | 12.8 | % | 11.9 | % | 11.5 | % | ||||||||||
| Multi-family dwelling and other |
3.8 | % | 4.0 | % | 4.4 | % | 5.4 | % | 4.7 | % | ||||||||||
| Occupancy Status: |
||||||||||||||||||||
| Primary residence |
90.0 | % | 89.3 | % | 88.6 | % | 88.8 | % | 91.0 | % | ||||||||||
| Second home |
4.3 | % | 4.4 | % | 4.3 | % | 3.9 | % | 3.4 | % | ||||||||||
| Non-owner occupied |
5.7 | % | 6.3 | % | 7.1 | % | 7.3 | % | 5.6 | % | ||||||||||
| Loan Amount: |
||||||||||||||||||||
| $100,000 or less |
11.8 | % | 12.3 | % | 14.6 | % | 17.9 | % | 19.5 | % | ||||||||||
| Over $100,000 and up to $250,000 |
52.1 | % | 52.5 | % | 53.3 | % | 56.4 | % | 59.1 | % | ||||||||||
| Over $250,000 |
36.1 | % | 35.2 | % | 32.1 | % | 25.7 | % | 21.4 | % | ||||||||||
| GSE conforming loans** |
92.7 | % | 92.1 | % | 91.7 | % | 91.7 | % | 91.8 | % | ||||||||||
| Non-conforming loans** |
7.3 | % | 7.9 | % | 8.3 | % | 8.3 | % | 8.2 | % | ||||||||||
| Average primary loan size (In thousands) |
$ | 161.2 | $ | 160.2 | $ | 155.0 | $ | 142.5 | $ | 136.0 | ||||||||||
| * | Loans types are not mutually exclusive and, therefore, do not total 100%. |
| ** | GSE conforming loans have principal balances that do not exceed the maximum single-family principal balance loan limit eligible for purchase by the GSEs. Non-conforming loans have principal balances that exceed the GSE loan limits. |
| • | High LTV Loans. LTV is the ratio of the original loan amount to the value of the property. In our experience, as LTV ratios increase, the associated default and claim rates generally increase as well. In particular, “Above-97s”, mortgages with LTVs exceeding 97%, have higher default and claim rates than mortgages with lower LTVs. In 2008, we stopped insuring Above-97s, and as of February 1, 2009, we stopped insuring loans with LTVs exceeding 95%. As of December 31, 2009, Above-97s represented 20.4% of our primary risk in force, down from 21.5% of our primary risk in force as of December 31, 2008. |
14
Table of Contents
| • | Fixed, Adjustable Rate and 2/28 Hybrid Mortgages. We consider a loan an adjustable rate mortgage, or ARM, if its interest rate may be adjusted prior to the loan’s fifth anniversary. Based on our experience, the delinquency and claim rates of ARMs are generally higher than in the case of fixed rate loans. A 2/28 Hybrid ARM is a loan whose interest rate is fixed for an initial two year period and floats thereafter. PMI previously insured 2/28 Hybrid ARMs through its structured finance channel. 2/28 Hybrid ARMs have experienced higher default rates than other ARM products. As of December 31, 2009, 2/28 Hybrid ARMs represented 1.8% of our primary risk in force. |
| • | Less-than-A Quality and Alt-A Loans. We previously insured less-than-A quality loans and Alt-A loans through our primary flow and structured finance channels. We define less-than-A quality loans to include loans with FICO scores generally less than 620. We define Alt-A loans as loans where the borrower’s FICO score is 620 or higher and the borrower requests and is given the option of providing reduced documentation verifying the borrower’s income, assets, deposit information, and/or employment. The default and claim rates of less-than-A quality and Alt-A loans exceed PMI’s average rates. In 2008, we eliminated eligibility of less-than-A quality and Alt-A loans for insurance from PMI. Due primarily to commitments issued prior to elimination of Alt-A loan eligibility, we had an immaterial amount of NIW on Alt A loans for the year ended December 31, 2009, compared to 5.3% of our total primary NIW for the year ended December 31, 2008. As of December 31, 2009, less-than-A quality and Alt-A loans represented 6.8% and 17.0% of our primary risk in force, respectively, down from 7.1% and 18.8% of our primary risk in force, respectively, as of December 31, 2008. |
| • | Interest Only Loans. Interest only loans, also known as deferred amortization loans, have more exposure to declining home prices than traditional amortizing loans, in part because principal is not reduced during an initial deferral period (usually between two and ten years). The significant majority of interest only loans insured by PMI have initial deferral periods of ten years. We believe that less than one half of 1% of PMI’s primary risk in force consists of interest only loans whose initial deferral period ended in 2009. Due to the tightening of underwriting guidelines and because interest only loan originations have substantially declined in the market, NIW in 2009 was not material for interest only loans compared to 5.2% in 2008. As of December 31, 2009, interest only loans represented 10.9% of our primary risk in force, down from 11.8% of our primary risk in force as of December 31, 2008. |
| • | Payment Option ARMs. With a payment option ARM, a borrower generally has the option every month to make a payment consisting of principal and interest, interest only, or an amount established by the lender that may be less than the interest owed. Depending on prevailing interest rates and payment amounts, monthly payments may not be sufficient to fully cover interest due, in which case the shortfall is added to the principal amount of the loan in a manner known as “negative amortization.” While generally the amount of negative amortization allowed under the loan is capped, borrowers with payment option ARMs may choose not to pay all accrued interest during the early years of the loan, resulting in an increase to the principal amount owed. Typically, no later than the loan’s fifth anniversary the loan is “recast” as fully-amortizing with a loan balance equal to the principal then outstanding. Accordingly, like interest only loans, payment option ARMs have more exposure to declining home prices than amortizing loans. In addition, these loans may have interest rate risks similar to traditional ARMs. In 2008, we eliminated coverage of negatively-amortizing ARM products. As of December 31, 2009, payment option ARMs represented 3.1% of our primary risk in force, down from 3.4% of our primary risk in force as of December 31, 2008. |
| • | Layered Risk. PMI insures loans that may possess one or more of the above characteristics. For example, as of December 31, 2009: |
| • | Approximately 2.4% of PMI’s primary risk in force consists of Above-97s with FICO scores below 620. |
| • | Approximately 0.2% of PMI’s primary risk in force consists of 2/28 Hybrid ARMs that are also Above-97s. |
15
Table of Contents
| • | Approximately 0.3% of PMI’s primary risk in force consists of 2/28 Hybrid ARMs with FICO scores below 620. |
| • | Approximately 2.4% of PMI’s primary risk in force consists of Alt-A loans that are also Above-97s. |
| • | Approximately 3.1% of PMI’s primary risk in force consists of interest only loans that are also Above-97s. |
| • | Approximately 0.1% of PMI’s primary risk in force consists of interest only loans with FICO scores below 620. |
This “layering” of risk further increases the risk of borrower default.
| • | Average Primary Loan Size. As the table above shows, our average insured loan size increased each year since 2005. These increases were primarily caused by home price appreciation and a higher percentage of loans insured in geographic locations with higher average property values, such as California and Florida. As of December 31, 2009, the average primary loan sizes of PMI’s California and Florida insured loans were $295,037 and $175,965, respectively. Because our premium rates are based in part upon the size of the insured loan, higher average loan sizes favorably impact premiums written and earned. Our obligation to an insured with respect to a claim is generally determined by multiplying the stated coverage percentage by the loss amount, which includes any unpaid principal and interest. Accordingly, higher insured loan balances negatively affect our average claim sizes. In addition, we have to hold more capital against larger insured loan balances, because they represent more risk, which negatively impacts our capital position. In November 2009, the FHFA confirmed that the GSE maximum conforming loan limits will remain between $417,000 and $729,750, for high cost areas, through 2010. Because the significant majority of insurance written is on GSE conforming loans, the higher conforming loan limits may cause our average primary insured loan size to increase in 2010. |
The following table shows U.S. primary risk in force by FICO score:
| Percentage of Primary Risk in Force by FICO Score As of December 31, |
|||||||||
| 2009 | 2008 | 2007 | |||||||
| FICO Score: |
|||||||||
| Less than 575 |
1.7 | % | 1.8 | % | 2.2 | % | |||
| 575—619 |
5.0 | % | 5.2 | % | 5.9 | % | |||
| 620—679 |
29.6 | % | 30.8 | % | 33.1 | % | |||
| 680—719 |
24.6 | % | 25.1 | % | 25.1 | % | |||
| 720 and above |
38.2 | % | 36.1 | % | 32.7 | % | |||
| Unreported |
0.9 | % | 1.0 | % | 1.0 | % | |||
| Total |
100.0 | % | 100.0 | % | 100.0 | % | |||
Pool Risk in Force. The following table shows components of PMI’s net pool risk in force as of December 31 for the last five years.
| Pool Risk in Force (In millions) | |||||||||||||||
| As of December 31, | |||||||||||||||
| 2009 | 2008 | 2007 | 2006 | 2005 | |||||||||||
| Modified Pool |
$ | 772.4 | $ | 2,221.5 | $ | 2,851.9 | $ | 2,527.0 | $ | 1,809.6 | |||||
| Old Pool |
39.6 | 190.4 | 277.8 | 346.7 | 420.6 | ||||||||||
| Other Traditional Pool |
163.5 | 203.8 | 225.6 | 230.6 | 242.8 | ||||||||||
| GSE Pool |
97.6 | 106.7 | 109.0 | 112.2 | 116.0 | ||||||||||
| Total Pool Risk in Force |
$ | 1,073.1 | $ | 2,722.4 | $ | 3,464.3 | $ | 3,216.5 | $ | 2,589.0 | |||||
16
Table of Contents
Some of our modified pool products are subject to deductibles and some are not. The first table below presents data for the portion of PMI’s modified pool portfolio that is subject to deductibles. The second table presents similar data for the portion of PMI’s modified pool portfolio that is not subject to deductibles. The data in the tables below are organized by book year (the year in which the risk was written) and represent in each case the aggregate of modified pool transactions written during the applicable book year. The data presented are as of December 31, 2009.
| Modified Pool with Deductibles | ||||||||||||||||||
| 2004 and Prior | 2005 | 2006 | 2007 | 2008 | 2009 | |||||||||||||
| (Dollars in millions) | ||||||||||||||||||
| Insurance in Force |
$ | 4,877 | $ | 4,105 | $ | 8,023 | $ | 4,647 | $ | — | $ | — | ||||||
| PMI’s Claims Paid to Date, Including Restructuring |
31 | 134 | 255 | 78 | — | — | ||||||||||||
| Stop Loss Amount |
287 | 265 | 418 | 181 | — | — | ||||||||||||
| Deductible Amount |
174 | 171 | 280 | 98 | — | — | ||||||||||||
| Losses Applicable to Deductible |
69 | 59 | 45 | 10 | — | — | ||||||||||||
| Deductible Balance |
105 | 111 | 234 | 88 | — | — | ||||||||||||
| Reserves for Losses (1) |
6 | 30 | 67 | 27 | — | — | ||||||||||||
| Remaining Risk in Force (2) |
$ | 103 | $ | 64 | $ | 72 | $ | 56 | $ | — | $ | — | ||||||
| Modified Pool without Deductibles | ||||||||||||||||||
| 2004 and Prior | 2005 | 2006 | 2007 | 2008 | 2009 | |||||||||||||
| (Dollars in millions) | ||||||||||||||||||
| Insurance in Force |
$ | 2,139 | $ | 1,183 | $ | 3,853 | $ | — | $ | — | $ | — | ||||||
| Stop Loss Amount |
483 | 49 | 305 | — | — | — | ||||||||||||
| PMI’s Claims Paid to Date |
47 | 26 | 45 | — | — | — | ||||||||||||
| Stop Loss Balance |
436 | 23 | 260 | — | — | — | ||||||||||||
| Reserves for Losses (1) |
44 | 15 | 37 | — | — | — | ||||||||||||
| Remaining Risk in Force (2) |
$ | 247 | $ | 9 | $ | 223 | $ | — | $ | — | $ | — | ||||||
| (1) | Established loss reserves for delinquent modified pool loans, which represents PMI’s estimates of losses for those loans at December 31, 2009. |
| (2) | Remaining Risk in Force is net of claims paid to date and the reserves established on delinquent modified pool loans, and represents PMI’s maximum risk on its modified pool exposure. With certain pool agreements, the maximum possible loss to PMI is less than the contractual stop loss amount, primarily as a result of substantial runoff of loans subject to the agreement. |
We are experiencing accelerated and substantial loss development in our modified pool products as a result of sustained adverse market conditions and exposure to Alt-A loans in our modified pool (with deductible) portfolio. Our maximum exposure is equal to our remaining modified pool risk-in-force, which is set out in the tables above. Due to increases in pending delinquencies, average loan amounts, claim sizes, claim rates and severity, as of December 31, 2009, we established significant loss reserves with respect to modified pool (with deductibles) and we expect to record additional reserves up to the maximum loss amounts on our modified pool (with deductibles) exposure for the 2005, 2006 and 2007 book years. We do not expect to incur material losses on modified pool (with and without deductible) risk written in book years 2004 and prior. Our loss reserve balance for all pool loans increased from $261.6 million as of December 31, 2008 to $261.8 million as of December 31, 2009. Increases to loss reserves on modified pool risk were significantly offset by the modified pool restructurings and commutations we completed in 2009. (See Section 7. Defaults and Claims—Pool Claims, below.) As discussed above in Section 1(b). Products - Pool Insurance, the existence of stop-loss protection and the significant reserves we have recorded and expect to record provides PMI with opportunities to restructure its modified pool (with deductible) risk. In 2009, PMI completed modified pool restructurings which resulted in an aggregate capital benefit, on both a statutory and GAAP basis, to MIC of approximately $130 million.
17
Table of Contents
The following table shows the composition of the portion of PMI’s modified pool portfolio that is not subject to deductibles by book year based upon the effective date of coverage. We do not expect losses on our modified pool (without deductibles) exposure for any book years to reach our maximum loss limits. However, we and our industry are experiencing material losses, particularly on insurance written in 2005 and 2006, and the ultimate amount of loss on pool risk from such book years may depend on, among other things, the composition of the risk. Because modified pool stop loss limits operate across a pool of loans, we show the composition of PMI’s modified pool portfolio (without deductibles) in the table below on an insurance-in-force (“IIF”) rather than risk in force basis.
| Modified Pool (without Deductibles) by Book Year | |||||||||||||||||||||
| As of December 31, 2009 | |||||||||||||||||||||
| 2009 | 2008 | 2007 | 2006 | 2005 | 2004 & Prior |
||||||||||||||||
| Modified Pool (without Deductibles) IIF |
$ | — | $ | — | $ | — | $ | 3,853 | $ | 1,183 | $ | 2,139 | |||||||||
| Credit Score as percentages of above IIF*** |
|||||||||||||||||||||
| Less than 575 |
N/A | N/A | N/A | 8.3 | % | 0.0 | % | 0.5 | % | ||||||||||||
| 575—619 |
N/A | N/A | N/A | 18.5 | % | 0.4 | % | 1.7 | % | ||||||||||||
| 620—679 |
N/A | N/A | N/A | 44.6 | % | 20.8 | % | 33.8 | % | ||||||||||||
| 680—719 |
N/A | N/A | N/A | 19.5 | % | 29.8 | % | 27.3 | % | ||||||||||||
| 720 and above |
N/A | N/A | N/A | 9.1 | % | 47.7 | % | 28.8 | % | ||||||||||||
| Loan Type as percentages of above IIF |
|||||||||||||||||||||
| Fixed Rate |
N/A | N/A | N/A | 36.6 | % | 98.4 | % | 89.2 | % | ||||||||||||
| ARMs |
N/A | N/A | N/A | 63.4 | % | 1.6 | % | 8.5 | % | ||||||||||||
| 2/28 Hybrid ARMs |
N/A | N/A | N/A | 0.0 | % | 0.0 | % | 0.0 | % | ||||||||||||
| Specific Portfolio Characteristics* as percentages of above IIF |
|||||||||||||||||||||
| Above 97s |
N/A | N/A | N/A | 37.0 | % | 0.1 | % | 3.0 | % | ||||||||||||
| Auto States** Loans |
N/A | N/A | N/A | 16.7 | % | 4.5 | % | 6.5 | % | ||||||||||||
| California Loans |
N/A | N/A | N/A | 11.2 | % | 22.4 | % | 20.9 | % | ||||||||||||
| Florida Loans |
N/A | N/A | N/A | 9.9 | % | 7.6 | % | 7.6 | % | ||||||||||||
| Alt-A Loans |
N/A | N/A | N/A | 4.3 | % | 70.5 | % | 73.6 | % | ||||||||||||
| Interest Only Loans |
N/A | N/A | N/A | 3.2 | % | 42.7 | % | 6.6 | % | ||||||||||||
| Avg Loan Size |
N/A | N/A | N/A | $ | 153,153 | $ | 193,329 | $ | 123,289 | ||||||||||||
| Avg LTV |
N/A | N/A | N/A | 94 | % | 75 | % | 78 | % | ||||||||||||
| Avg FICO |
N/A | N/A | N/A | 648 | 718 | 693 | |||||||||||||||
| * | Specific portfolio characteristics are not necessarily mutually exclusive. |
| ** | Auto States include Michigan, Indiana, Ohio, and Illinois. |
| *** | Total may not equal 100% due to unreported FICO scores. |
| N/A | We did not write any modified pool (without deductibles) in the 2009, 2008 and 2007 book years. |
Persistency; Policy Cancellations. A significant percentage of PMI’s insurance-in-force is comprised of polices written in previous years, and our premiums earned are generated by the policies that remain in force over time. Consequently, the level of policy cancellations and resulting length of time that insurance remains in force are key determinants of PMI’s revenue and net income and, with current capital constraints, can impact our new business writings. One measure of the impact of policy cancellations on insurance in force is our persistency rate, which is based on the percentage of primary insurance in force at the beginning of a 12-month period that remains in force at the end of that period. The following graph and table show average annual mortgage interest rates and MIC’s primary portfolio persistency rates from 1999 to 2009. As shown in the table and graph, PMI’s primary persistency rate has been increasing since 2007. Typically, higher persistency rates stabilize PMI’s
18
Table of Contents
risk-in-force and premium income stream. However, because PMI must maintain sufficient capital to satisfy regulatory risk to capital metrics, higher persistency rates may further constrain PMI’s capital position and limit its ability to write new business.
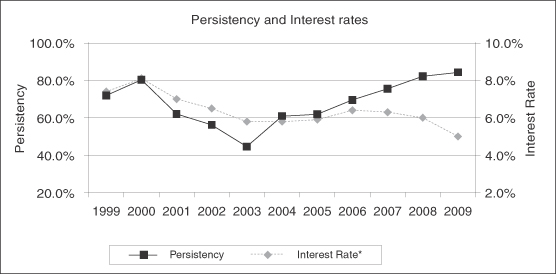
| 1999 | 2000 | 2001 | 2002 | 2003 | 2004 | 2005 | 2006 | 2007 | 2008 | 2009 | |||||||||||||||||||||||
| Interest Rate* |
7.4 | % | 8.1 | % | 7.0 | % | 6.5 | % | 5.8 | % | 5.8 | % | 5.9 | % | 6.4 | % | 6.3 | % | 6.0 | % | 5.0 | % | |||||||||||
| Persistency Rate |
71.9 | % | 80.3 | % | 62.0 | % | 56.2 | % | 44.6 | % | 60.9 | % | 61.9 | % | 69.6 | % | 75.5 | % | 82.2 | % | 84.3 | % |
| * | Average annual thirty-year fixed mortgage interest rate derived from Freddie Mac data. |
As shown above, until 2006, there was a close correlation between low or declining interest rate environments and lower persistency rates. Between 2001 and 2003, declining interest rates resulted in heavy mortgage refinance activity, causing PMI’s policy cancellations to increase, thereby negatively impacting earned premiums during those years. From 2004 through 2006, the rate of policy cancellation declined, partly as a result of stabilizing or rising interest rates, which caused our primary persistency rate to increase during those years. Refinance activity in the insured loan market is also influenced by levels of home price appreciation or depreciation, consumer behavior and access to credit. We believe that higher levels of home price appreciation between 2001 and 2006 and increased consumer acceptance of refinance transactions and alternative loan products, such as interest only loans and payment option ARMs, contributed to higher levels of refinance activity during those years. Between 2007 and 2009, interest rates have declined; however, refinance activity decreased, primarily as a result of nationwide home price depreciation coupled with reduced consumer access to credit, particularly for borrowers who obtained low-down payment mortgage loans. As a result, even in a relatively low interest rate environment, PMI’s primary persistency rate increased between 2007 and 2009. With interest rates expected to rise in 2010 and with borrowers faced with significant equity constraints, refinance activity is expected to decrease sharply in 2010. To the extent that home prices continue to decline or experience low appreciation rates, we expect that PMI’s persistency rate will likely remain high and therefore limit the rate at which PMI’s risk in force runs off over the next few years.
| 6. | Risk Management |
Risk Management Approach
We utilize our loan level database in addition to proprietary and other statistical models to measure and predict loan performance based on historical prepayment and loss experience. We analyze performance based on borrower, loan and property characteristics, along with geographic factors, through historic economic and real
19
Table of Contents
estate cycles. We use the results of our analysis of loan behavior in addition to economic and market conditions to develop and refine how we price our coverage and in the establishment of national and regional underwriting guidelines to control the concentrations of risk in PMI’s portfolio. Historically, in developing our guidelines, we took into account the GSEs’ eligibility criteria and generally would place mortgage insurance coverage on any mortgage loan accepted by the GSEs’ automated underwriting systems. Prior to 2009, we made significant changes to our underwriting guidelines, under which a loan application must independently meet our underwriting guidelines to be eligible for mortgage insurance from PMI, regardless of whether such loan would be accepted by the GSEs’ automated underwriting systems for purchase by the GSEs.
We continually monitor risk concentrations in our portfolio using various statistical tools. Among these are the pmiAURAsm System and the PMI Market Risk Indexsm. The pmiAURAsm System is a proprietary risk scoring tool we developed over 20 years ago that assigns a unique risk score to each loan in PMI’s portfolio corresponding to the relative likelihood of an insured loan going to claim based on demographic, geographic, economic, and loan specific characteristics. The PMI Market Risk Indexsm is a proprietary statistical model that predicts the probability of a decline in home prices at the end of two years in Metropolitan Statistical Areas, or MSAs, in the United States based on local, historical home price appreciation, changes in the local labor markets and local home affordability. During 2008 and 2009, as part of our normal review process, we revised and added to certain attributes of the model to adapt it to changes in the housing market.
Current Credit Policies and Pricing
We review PMI’s portfolio and underwriting guidelines on an on-going basis for historical and prospective performance in light of economic, housing, competitive and mortgage market conditions. Over the past several years, PMI has made significant changes to its credit policies and pricing. Some of these changes include the elimination of coverage eligibility for 2/28 Hybrid ARMs, LTVs higher than 95%, limited documentation loans (Alt-A), bulk channel deliveries and interest-only or payment option ARM loans. Over the course of recent periods, we have also tightened our underwriting criteria in areas including investment properties, larger loan amounts, debt-to-income ratios, cash-out refinances and second homes. Furthermore, we have greatly restricted the lender base from which we will accept third-party or wholesale originations. In 2008, PMI significantly increased its premium rates in all states of its operation for both borrower-paid and lender-paid mortgage insurance products. PMI no longer offers custom lender-paid premium products. As a result of the underwriting guideline and pricing changes we adopted in the last several years, insurance written in the second half of 2008 and in 2009 generally is expected to perform well and generate underwriting profits.
PMI also has a Distressed Markets Policy, with loan-to-value and loan product limitations on loans originated in certain distressed markets. Under our current Distressed Markets Policy, for those areas (principally metropolitan statistical areas (MSAs)) that are designated as distressed, PMI caps the maximum insured loan-to-value ratio and/or prescribes additional limiting criteria and underwriting guidelines. PMI assesses MSAs on a regular basis.
Underwriting Process
To obtain mortgage insurance on an individual mortgage loan, a customer submits an application to us. If the loan is approved for mortgage insurance, we issue a commitment to the customer. The significant majority of our primary flow business is conducted through our electronic delivery channel.
More than 86% of PMI’s flow NIW is underwritten pursuant to a delegated underwriting program that allows approved lenders, subject to periodic quality-control audits, to determine whether loans meet program guidelines and are thus eligible for mortgage insurance. Delegated underwriting enables us to meet mortgage lenders’ demands for immediate insurance coverage of certain loans. If PMI determines that a lender participating in the program commits us to insure a loan that fails to meet all of the approved underwriting guidelines, subject to certain exceptions, PMI has the right to exclude or rescind the coverage on the loan. PMI
20
Table of Contents
may also suspend or terminate the insured’s delegated authority to extend coverage to new loans if it determines that the insured has not been complying with approved underwriting guidelines. In 2008 and 2009, as a result of significant variance from our quality control standards, we terminated the right of certain customers to participate in the delegated underwriting program. Flow customers who are not approved to participate in the delegated program generally must submit to us an application for each loan, supported by various documents sufficient to satisfy our underwriting standards.
Contract Underwriting
In early 2009, we announced the discontinuation of contract underwriting services provided by our wholly-owned subsidiary, PMI Mortgage Services Co., or MSC. MSC performed contract underwriting services for PMI and CMG MI. New insurance policies processed by MSC contract underwriters in 2009 were 7.7% of PMI’s primary NIW compared to 11.0% in 2008 and 10.8% in 2007. As a part of its contract underwriting services, MSC provided to its customers monetary and other remedies, including loan indemnifications under certain circumstances, in the event that MSC failed to properly underwrite a mortgage loan. These remedies are separate from the insurance coverage provided by PMI. Contract underwriting remedies were $8.3 million in 2009 compared to $4.8 million and $7.1 million in 2008 and 2007, respectively. MSC may still be obligated to pay remedies in the future even though it has ceased providing contract underwriting services.
| 7. | Defaults and Claims |
Defaults. Our claims process begins with notification by the insured or servicer to us of a default on an insured loan. “Default” is defined in PMI’s primary master policies as the borrower’s failure to pay when due an amount equal to the scheduled mortgage payment under the terms of the mortgage. Generally, the master policies require an insured to notify us of a default no later than the last business day of the month following the month in which the borrower becomes three payments in default. For reporting and internal tracking purposes, we do not consider a loan to be in default for the purposes of reporting defaults and default rates until a borrower has failed to pay two regularly scheduled payments. Depending upon its scheduled payment date, when a borrower fails to make two consecutive payments, the loan default could be reported to us between the 31st and 60th day after the first missed payment due date. Borrowers default for a variety of reasons, including a reduction of income, unemployment, divorce, illness, inability to manage credit, rising interest rate levels and declining home prices. In 2009, PMI’s primary default inventory increased as a result of a number of factors, including declining home prices, higher rates of unemployment, diminished access to credit, weak performance in certain geographic areas where PMI has a higher concentration of risk-in-force, higher than expected levels of default on Above 97, Alt-A and Interest-only loans, and a decline in the rate at which defaults cure (the “cure rate”).
PMI’s Homeownership Preservation Initiatives (HPI) department was formed to facilitate borrowers’ retention workout requests, including loan modifications and repayment plans, which may enable borrowers to cure their defaults and reinstate their loans. The HPI department facilitates loan servicer efforts by providing enhanced workout approval delegation on certain loans, placing PMI loss mitigation staff on-site within loan servicers’ offices, training of servicer staff and providing additional resources to supplement loan workout strategies on PMI insured loans. HPI also conducts supplemental outreach to delinquent borrowers on PMI insured loans to educate them about workout options and to hasten loan workout discussions with their loan servicers. PMI’s HPI team supplements loan servicers’ outreach efforts through the use of our own loss mitigation professionals, through the engagement of specialty vendors, non-profit housing counseling agencies and through our participation in community outreach events, including HOPE NOW homeownership preservation forums.
Borrowers may cure defaults by making all of the delinquent loan payments or by satisfying in full all amounts due under their mortgages. The cure rate is influenced by borrowers’ financial resources, regional housing and economic conditions, such as unemployment rates, and, recently, the speed with which loan servicers process delinquencies or engage in other loss mitigation efforts. Loans that cure are removed from
21
Table of Contents
PMI’s default inventory and we do not factor in such loans when calculating our loss reserves. PMI’s cure rate declined in 2009 as a result of, among other things, rising unemployment, diminished refinancing opportunities as a result of declining home prices and unavailability of certain loan products, a slowdown in the time to resolve defaults (either through cure or claim payment) attributable to significant backlogs in workout activity by loan servicers and implementation of the Treasury’s HAMP program. With a traditional loan modification, a loan default is typically cured within a relatively short time period after the modification is approved. For loans approved for HAMP modifications, however, the borrowers are subject to 90 to 150 days trial periods, during which the borrowers must strictly adhere to their trial modification plans in order to complete the modification process. As of December 31, 2009, 23,180 delinquent loans in our default inventory are subject to HAMP trial periods compared to approximately 12,700 loans at September 30, 2009. We do not remove from our default inventory a loan subject to a HAMP trial modification period unless and until the trial period is completed, all required documents have been received, the loan modification is closed, and the default is officially cured. The decline in PMI’s cure rate has been partially offset by PMI’s loss mitigation efforts unrelated to HAMP and by increased rescissions of insurance written in prior periods.
Rescission Activity. PMI routinely investigates early payment default loans (loans that default prior to the thirteenth payment) or EPDs, and also investigates certain other non-EPD loans for misrepresentations, negligent underwriting and eligibility for coverage. Based upon PMI’s recent investigations, industry data and other data, we believe that there were significantly higher levels of mortgage origination fraud and decreases in the quality of mortgage origination underwriting primarily in 2006 and 2007. As a result, PMI is reviewing and investigating a larger volume of insured loans, and the number of loans on which coverage has been rescinded by PMI increased in 2008 and 2009. In part because we believe that new EPDs have peaked and our standing inventory of EPDs is approaching its peak, we currently expect rescission levels to remain high and then to begin declining modestly toward the end of 2010.
When PMI rescinds insurance coverage with respect to an investigated loan, we notify the insured of the rescission, refund all premiums associated with the insured loan, and remove the rescinded loan from our calculation of PMI’s risk in force and insurance in force. In addition, if the rescinded loan was delinquent, we cease to include that loan in our default inventory and, therefore, do not incorporate that loan into our loss reserve estimates. Accordingly, past rescission activity has materially reduced our loss reserve estimates. In arriving at our loss reserve estimates, we also consider the effect of projected future rescission activity with respect to the current inventory of delinquent insured loans. As we expect rescission activity to remain at current levels in 2010, projected future rescission activity is also materially reducing our current loss reserve estimates. To the extent that we are required to reverse rescissions beyond recent levels or future rescission activity is lower than projected, we would be required to increase loss reserves in future periods. The table below shows the aggregate risk in force of delinquent loans (including primary and pool) rescinded by PMI in each quarter in 2008 and 2009:
| Q4 2009 | Q3 2009 | Q2 2009 | Q1 2009 | Q4 2008 | Q3 2008 | Q2 2008 | Q1 2008 | |||||||||||||||||
| (Dollars in millions) | ||||||||||||||||||||||||
| Delinquent risk in force rescinded per quarter |
$ | 123.6 | $ | 148.4 | $ | 170.3 | $ | 200.6 | $ | 187.6 | $ | 240.8 | $ | 95.1 | $ | 34.6 | ||||||||
Upon receiving PMI’s notice of rescission with respect to an insured loan, the insured may seek additional information as to the bases of our rescission and/or disagree with our decision to rescind coverage. As a result of the increase in rescission activity, we experienced an increase in the number of such disagreements in 2009. If we are unsuccessful in defending our rescission decisions beyond expected levels, we may need to re-establish loss reserves for, and would need to reassume risk on, such rescinded loans. See Part I, Item 3. Legal Proceedings and Item 1A. Risk Factors—We establish loss reserves with respect to our mortgage insurance policies only upon loan defaults; accordingly, our loss reserve estimates are not intended to be an estimate of future losses and —We are subject to heightened litigation risk related to the increase in rescissions.
22
Table of Contents
In some cases, our servicing customers do not produce documents necessary to perfect the claim. Most often, this is the result of the servicer’s inability to provide the loan origination file for our review. If, after repeated requests by PMI, the loan file is not produced, the claim will be denied. Levels of claim denials increased in 2008 and 2009. See Part I, Item 1A. Risk Factors—We establish loss reserves with respect to our mortgage insurance policies only upon loan defaults, accordingly, our loss reserve estimates are not intended to be an estimate of future losses. The table below shows the risk in force of claims denials (including primary and pool) in each quarter in 2008 and 2009:
| Q4 2009 | Q3 2009 | Q2 2009 | Q1 2009 | Q4 2008 | Q3 2008 | Q2 2008 | Q1 2008 | |||||||||||||||||
| (Dollars in millions) | ||||||||||||||||||||||||
| Claims denials per quarter—delinquent risk in force |
$ | 93.4 | $ | 80.1 | $ | 184.8 | $ | 63.6 | $ | 51.7 | $ | 17.7 | $ | 12.8 | $ | 8.4 | ||||||||
Claims and Policy Servicing. As a result of the portion of delinquent loans that cure, the frequency of claims is not directly proportional to the number of defaults we receive. In most cases, however, defaults that are not cured result in claims. Whether an uncured default leads to a claim principally depends on the borrower’s equity in the underlying property at the time of default and the borrower’s or the insured’s ability to sell the home for an amount sufficient to satisfy all amounts due under the mortgage loan. When the likelihood of a defaulted loan being reinstated is minimal, we work with the servicer to explore the possibility of a liquidation workout such as a pre-foreclosure sale (or early disposal of the underlying property, usually in an amount less than what is owed) or a deed in lieu (where the borrower conveys title to the lender in satisfaction of their debt)—both avoiding the lengthy foreclosure process, which can result in a lower claim size to PMI.
Generally, our master policies provide that within 60 days after an insured or servicer files a valid primary insurance claim and supporting documentation, we have the option of:
| • | paying the coverage percentage specified in the certificate of insurance multiplied by the loss amount; |
| • | in the event the property is sold pursuant to an agreement made prior to or during the 60-day period after the claim is filed, which we refer to as a prearranged sale, paying the lesser of (i) 100% of the loss amount less the proceeds of sale of the property or (ii) the specified coverage percentage multiplied by the loss amount; or |
| • | paying 100% of the loss amount in exchange for the insured’s conveyance to us of good and marketable title to the property, with us then selling the property for our own account. Properties acquired under this option are included on PMI’s balance sheet in other assets as residential properties from claim settlements, also referred to as real estate owned, or REO. |
If we do not settle a valid claim within the 60-day claim settlement period, we must pay interest on the insurance benefit at the rate due under the loan from the last day of the 60-day claim settlement period until the claim is actually paid.
While we select the claim settlement option that best mitigates the amount of our claim payment, we generally pay the coverage percentage multiplied by the loss amount. At December 31, 2009, our carrying value, which approximates fair value, of REO properties was $0.1 million compared to $4.8 million at December 31, 2008 and $20.3 million at December 31, 2007.
Primary Claim Sizes and Severity. The severity of an individual claim is calculated as the ratio of the claim paid to the original risk in force relating to the loan. The main determinants of the severity of a claim are the value of the underlying property, accrued interest on the loan, expenses advanced by the insured, foreclosure expenses, the time required to complete foreclosure (which varies by state), and the amount of mortgage insurance coverage placed on the loan. Pre-foreclosure sales, acquisitions and other early workout efforts, including those described above, help to reduce overall claim severity. In 2009, we processed 6.9% of the paid
23
Table of Contents
primary insurance claims on the basis of a prearranged sale, compared to 10.9% and 20.0% in 2008 and 2007, respectively. In 2009, we exercised the option to acquire the property on 0.01% of the primary claims processed for payment, compared to 0.2% and 2.4% for 2008 and 2007, respectively.
PMI’s average primary claim severity is, for a given period, primary claims paid as a percentage of the total risk in force of primary loans for which claims were paid. The increase in average primary claim severity in 2008 (shown in the table below) reflects the deterioration of the mortgage, housing, labor and credit markets, as well as other factors, including declining home prices, higher coverage levels, delays in delinquency and claim resolutions and the related decline in early workout opportunities. Because severity reflects regional as well as national market conditions, PMI’s average primary claim severity varies from region to region. The table below shows average primary claim severity, by region, for the years 2006 through 2009. In 2009, severity improved in every region. The decline in severity in 2009 was driven primarily by the substantial increase in claims denials, which are settled without payment. For a discussion of claims denials, see “—Rescission Activity” above.
| Average Primary Claim Severity | ||||||||||||
| 2009 | 2008 | 2007 | 2006 | |||||||||
| Region |
||||||||||||
| Great Lakes (1) |
96.8 | % | 105.2 | % | 104.4 | % | 101.7 | % | ||||
| Mid-Atlantic (2) |
84.1 | % | 91.1 | % | 75.8 | % | 71.5 | % | ||||
| New England (3) |
79.6 | % | 94.8 | % | 90.6 | % | 76.9 | % | ||||
| North Central (4) |
89.7 | % | 98.7 | % | 93.8 | % | 86.1 | % | ||||
| Northeast (5) |
81.2 | % | 98.1 | % | 83.0 | % | 84.2 | % | ||||
| Pacific (6) |
82.7 | % | 95.7 | % | 88.2 | % | 53.5 | % | ||||
| Plains (7) |
89.3 | % | 93.5 | % | 92.9 | % | 88.2 | % | ||||
| South Central (8) |
79.4 | % | 91.9 | % | 87.7 | % | 80.6 | % | ||||
| Southeast (9) |
87.3 | % | 92.1 | % | 87.2 | % | 83.0 | % | ||||
| Average Primary Claim Severity—U.S. |
85.5 | % | 95.6 | % | 91.5 | % | 86.1 | % | ||||
| (1) | Includes Indiana, Kentucky, Michigan and Ohio. |
| (2) | Includes Delaware, Maryland, Virginia, Washington D.C. and West Virginia. |
| (3) | Includes Connecticut, Maine, Massachusetts, New Hampshire, Rhode Island and Vermont. |
| (4) | Includes Illinois, Minnesota, Missouri and Wisconsin. |
| (5) | Includes New Jersey, New York and Pennsylvania. |
| (6) | Includes California, Hawaii, Nevada, Oregon and Washington, Alaska and Guam. |
| (7) | Includes Idaho, Iowa, Kansas, Montana, Nebraska, North Dakota, South Dakota and Wyoming. |
| (8) | Includes Arizona, Colorado, Louisiana, New Mexico, Oklahoma, Texas and Utah. |
| (9) | Includes Alabama, Arkansas, Florida, Georgia, Mississippi, North Carolina, South Carolina, Tennessee and Puerto Rico. |
The table below sets out by channel primary claims paid (which does not include changes in loss reserves):
| Primary Claims Paid for the Year Ended December 31, | |||||||||||
| 2009 | 2008 | 2007 | |||||||||
| (In thousands) | |||||||||||
| Flow Channel |
$ | 615,670 | $ | 483,988 | $ | 222,273 | |||||
| Structured Finance Channel |
218,171 | 288,355 | 104,144 | ||||||||
| Other* |
(3,005 | ) | (29,392 | ) | 3,230 | ||||||
| Total Primary Claims paid |
$ | 830,836 | $ | 742,951 | $ | 329,647 | |||||
| * | Includes supplemental payments and reversals, including $34.0 million recovered from certain terminated captive trust accounts during 2008, which reduces the total claims paid and $3.3 million in 2009 for captive recoveries. |
24
Table of Contents
Primary Default Rates by Region. Primary default rates and claim activity differ from region to region in the United States depending upon economic conditions and cyclical growth patterns. PMI’s default rates are calculated by dividing the number of insured loans in default in the particular portfolio by the total number of policies in force in that portfolio. Declining home prices and weak economic conditions, particularly in California and Florida, have negatively affected PMI’s default rates in those states. The two tables below set forth primary default rates by region for the various regions of the United States and the ten largest states by PMI’s primary risk in force. Default rates are shown by region based on location of the underlying property.
| Percent of Primary Risk in Force as of December 31, 2009 |
Primary Default Rate by Region as of December 31, |
|||||||||||
| 2009 | 2008 | 2007 | ||||||||||
| Region |
||||||||||||
| Pacific (1) |
15.13 | % | 27.84 | % | 17.24 | % | 7.16 | % | ||||
| New England (2) |
4.53 | % | 15.87 | % | 10.47 | % | 6.44 | % | ||||
| Northeast (3) |
10.64 | % | 18.45 | % | 11.70 | % | 7.26 | % | ||||
| South Central (4) |
17.11 | % | 16.53 | % | 10.93 | % | 6.14 | % | ||||
| Mid-Atlantic (5) |
6.40 | % | 19.53 | % | 12.12 | % | 5.96 | % | ||||
| Great Lakes (6) |
9.07 | % | 20.01 | % | 14.85 | % | 11.23 | % | ||||
| Southeast (7) |
24.08 | % | 26.95 | % | 17.88 | % | 9.00 | % | ||||
| North Central (8) |
10.03 | % | 20.85 | % | 13.32 | % | 7.99 | % | ||||
| Plains (9) |
3.01 | % | 13.23 | % | 8.80 | % | 5.74 | % | ||||
| Total Primary Portfolio |
100.00 | % | 21.40 | % | 14.12 | % | 7.93 | % | ||||
| (1) | Includes California, Hawaii, Nevada, Oregon and Washington, Alaska and Guam. |
| (2) | Includes Connecticut, Maine, Massachusetts, New Hampshire, Rhode Island and Vermont. |
| (3) | Includes New Jersey, New York and Pennsylvania. |
| (4) | Includes Arizona, Colorado, Louisiana, New Mexico, Oklahoma, Texas and Utah. |
| (5) | Includes Delaware, Maryland, Virginia, Washington D.C. and West Virginia. |
| (6) | Includes Indiana, Kentucky, Michigan and Ohio. |
| (7) | Includes Alabama, Arkansas, Florida, Georgia, Mississippi, North Carolina, South Carolina, Tennessee and Puerto Rico. |
| (8) | Includes Illinois, Minnesota, Missouri and Wisconsin. |
| (9) | Includes Idaho, Iowa, Kansas, Montana, Nebraska, North Dakota, South Dakota and Wyoming. |
| Percent of Primary Risk in Force as of December 31, 2009 |
Primary Default Rates for Top Ten States by Primary Risk in Force (1) |
|||||||||||
| Default Rates as of December 31, |
||||||||||||
| 2009 | 2008 | 2007 | ||||||||||
| Florida |
10.1 | % | 41.14 | % | 27.79 | % | 10.56 | % | ||||
| California |
7.7 | % | 36.68 | % | 24.68 | % | 10.92 | % | ||||
| Texas |
7.5 | % | 12.97 | % | 9.44 | % | 6.03 | % | ||||
| Illinois |
5.2 | % | 24.96 | % | 14.80 | % | 8.19 | % | ||||
| Georgia |
4.7 | % | 23.15 | % | 14.62 | % | 9.50 | % | ||||
| New York |
4.0 | % | 18.50 | % | 11.27 | % | 6.78 | % | ||||
| Ohio |
3.9 | % | 18.04 | % | 13.50 | % | 10.83 | % | ||||
| Pennsylvania |
3.4 | % | 15.46 | % | 10.75 | % | 7.47 | % | ||||
| New Jersey |
3.3 | % | 24.06 | % | 14.17 | % | 7.53 | % | ||||
| Washington |
3.2 | % | 16.50 | % | 8.15 | % | 3.58 | % | ||||
| (1) | Top ten states as determined by primary risk in force as of December 31, 2009. |
Primary Default Rates by Channel and Loan Characteristics. As discussed in Section 5. Business Composition, above, certain borrower and loan characteristics increase the risk, on average, of loan default and
25
Table of Contents
ultimate claims. Insured loans in PMI’s portfolio may contain one, more than one or none of the loan characteristics identified in Section 5 above and in the table below, which shows default rates for PMI’s flow and structured finance channels and for loans that contain certain of the characteristics identified by PMI as having heightened risk.
| Primary Default Rates as of December 31, |
|||||||||
| 2009 | 2008 | 2007 | |||||||
| Flow Channel |
|||||||||
| Loan Type* |
|||||||||
| Alt-A Loans |
44.1 | % | 30.0 | % | 11.6 | % | |||
| Less-than-A Quality |
40.9 | % | 30.4 | % | 18.6 | % | |||
| Above 97s |
28.8 | % | 18.3 | % | 8.8 | % | |||
| ARMs |
43.2 | % | 32.8 | % | 15.1 | % | |||
| 2/28 Hybrid ARMs |
— | — | — | ||||||
| Payment option ARMs |
53.1 | % | 38.9 | % | 14.5 | % | |||
| Interest Only |
44.0 | % | 28.2 | % | 9.6 | % | |||
| Total Flow Channel |
20.2 | % | 13.0 | % | 6.7 | % | |||
| Structured Finance Channel |
|||||||||
| Loan Type* |
|||||||||
| Alt-A Loans |
43.2 | % | 32.4 | % | 20.8 | % | |||
| Less-than-A Quality |
40.6 | % | 31.6 | % | 23.6 | % | |||
| Above 97s |
28.3 | % | 18.1 | % | 10.2 | % | |||
| ARMs (excluding 2/28 Hybrid ARMs) |
42.5 | % | 30.4 | % | 16.4 | % | |||
| 2/28 Hybrid ARMs |
54.3 | % | 48.5 | % | 38.6 | % | |||
| Payment option ARMs |
— | — | — | ||||||
| Interest Only |
43.1 | % | 30.1 | % | 15.9 | % | |||
| Total Structured Finance Channel |
28.8 | % | 20.7 | % | 13.9 | % | |||
| Total Primary |
|||||||||
| Loan Type* |
|||||||||
| Alt-A Loans |
43.9 | % | 30.6 | % | 13.9 | % | |||
| Less-than-A Quality |
40.8 | % | 30.8 | % | 20.2 | % | |||
| Above 97s |
28.7 | % | 18.3 | % | 9.1 | % | |||
| ARMs (excluding 2/28 Hybrid ARMs) |
43.0 | % | 32.0 | % | 15.5 | % | |||
| 2/28 Hybrid ARMs |
54.3 | % | 48.5 | % | 38.6 | % | |||
| Payment option ARMs |
53.1 | % | 38.9 | % | 14.5 | % | |||
| Interest Only |
43.8 | % | 28.6 | % | 11.0 | % | |||
| Total Primary |
21.4 | % | 14.1 | % | 7.9 | % | |||
| * | Loan types are not mutually exclusive. |
The higher default rates exhibited by PMI’s structured finance channel are primarily the result of a larger concentration of loans insured through that channel that have layered risk characteristics.
Primary Default Rates and the Aging of PMI’s Insurance Portfolio. Default and claims activity are not spread evenly throughout the coverage period of a primary insurance book of business. Based upon our experience, we generally expect the majority of default and claims activity on insured loans in PMI’s current portfolio to occur in the second through fourth years after loan origination. Primary insurance written from the period of January 1, 2005 through December 31, 2008 represented 71.2% of PMI’s primary insurance in force at December 31, 2009. The table below, which sets out default rates by book year, shows that PMI has experienced adverse and accelerated delinquency development in its 2005, 2006, 2007 insured loan portfolios.
26
Table of Contents
| Book Year |
PMI Average Fixed Rate (1) |
Percent of Primary Risk in Force as of December 31, 2009 |
Default Rates | |||||||||||||||||||||
| 2009 | 2008 | 2007 | 2006 | 2005 | 2004 | |||||||||||||||||||
| 2002 and prior |
7.72 | % | 6.3 | % | 16.4 | % | 12.3 | % | 9.7 | % | 9.5 | % | 10.7 | % | 9.2 | % | ||||||||
| 2003 |
6.00 | % | 7.6 | % | 15.3 | % | 9.6 | % | 6.4 | % | 5.3 | % | 5.1 | % | 3.1 | % | ||||||||
| 2004 |
6.15 | % | 8.4 | % | 17.6 | % | 11.4 | % | 7.8 | % | 5.9 | % | 4.7 | % | 1.6 | % | ||||||||
| 2005 |
6.31 | % | 12.4 | % | 23.3 | % | 16.0 | % | 9.6 | % | 4.9 | % | 2.3 | % | — | |||||||||
| 2006 |
7.10 | % | 15.7 | % | 31.4 | % | 21.2 | % | 10.8 | % | 2.5 | % | — | — | ||||||||||
| 2007 |
7.17 | % | 28.0 | % | 30.9 | % | 18.3 | % | 5.1 | % | — | — | — | |||||||||||
| 2008 |
6.37 | % | 15.0 | % | 11.7 | % | 3.9 | % | — | — | — | — | ||||||||||||
| 2009 |
5.16 | % | 6.6 | % | 0.6 | % | — | — | — | — | — | |||||||||||||
| Total |
100.0 | % | 21.4 | % | 14.1 | % | 7.9 | % | 5.6 | % | 5.7 | % | 4.9 | % | ||||||||||
| (1) | Average PMI fixed annual mortgage interest rate. |
The following table sets forth, for each of the years 2007, 2008 and 2009, the dispersion of PMI’s losses and loss adjustment expenses by book year. Losses and loss adjustment expenses represent claims paid, certain expenses related to default notification and claim processing, and changes to loss reserves during the applicable year.
| 2009 | 2008 | 2007 | |||||||
| (Dollars in thousands) | |||||||||
| Book Year |
|||||||||
| 2002 and prior |
$ | 48,924 | $ | 64,629 | $ | 76,327 | |||
| 2003 |
94,432 | 79,310 | 72,104 | ||||||
| 2004 |
137,362 | 142,950 | 119,522 | ||||||
| 2005 |
411,932 | 324,842 | 262,247 | ||||||
| 2006 |
469,590 | 555,607 | 349,265 | ||||||
| 2007 |
455,108 | 580,516 | 216,628 | ||||||
| 2008 |
119,091 | 87,866 | — | ||||||
| 2009 |
4,252 | — | — | ||||||
| Total |
$ | 1,740,691 | $ | 1,835,720 | $ | 1,096,093 | |||
Pool Claims. Pool claims are generally filed after the underlying property is sold. We settle a pool claim in accordance with the terms of the applicable pool insurance policy, which includes a stop loss limit and, in some cases, a specified deductible. Subject to such stop loss limit and any deductible, our modified pool insurance generally covers a specified percentage of the particular loss less net proceeds from the sale of the property and any primary claim proceeds. Our traditional pool insurance generally covers 100% of the loss less net proceeds from the sale of the property and any primary claim proceeds. Other pool insurance policies may include a maximum coverage percentage or a defined benefit. Claims relating to policies with a maximum coverage percentage are settled at the lesser of the actual loss or the maximum coverage set forth in the applicable policy. Claims relating to policies with defined benefits are settled at the maximum coverage percentage set forth in the applicable policy. We settle pool claims upon receipt of all supporting documentation. Pool insurance claims paid by PMI increased from $55.2 million in 2008 to $618.5 million in 2009. In 2009, we restructured (including through commutation) certain modified pool policies which resulted in the acceleration of claims paid at a discount of the reserves established on such modified pool policies of approximately $498 million (subject to certain adjustments) and the release of loss reserves.
Modified Pool Performance. The tables Modified Pool (with Deductibles) by Book Year and Modified Pool (without Deductibles) by Book Year, in Section 5 above, summarize the loss development of PMI’s modified pool portfolio.
27
Table of Contents
Loss Reserves
A period of time may elapse between the occurrence of the borrower’s default on mortgage payments (the event triggering a potential future claim payment), the reporting of such default to us and the eventual payment of the claim related to such default. To recognize the liability for unpaid losses related to loans in default, PMI, in accordance with industry practice, establishes loss reserves in respect of loans in default based upon the estimated claim rate and estimated average claim amount of loans in default. Included in loss reserves are loss adjustment expense (“LAE”) reserves, and incurred but not reported (“IBNR”) reserves. IBNR reserves represent our estimated unpaid losses on loans that are in default but have not yet been reported to us as delinquent by our customers. We also consider the effect of projected future rescission and claim denial activity with respect to the current inventory of delinquent loans, which has materially reduced our loss reserve estimates. To the extent we must reverse our rescissions beyond expected levels or future rescission activity is lower than expected, we would be required to increase loss reserves in future periods. Because loss reserves are estimates, there can be no assurance that PMI’s reserves will prove to be adequate to cover ultimate loss developments on reported defaults. Consistent with industry accounting practices, PMI does not establish loss reserves for estimated potential defaults that have not occurred but that may occur in the future. For a full discussion of our loss reserving policy and process, see Item 7. Management’s Discussion and Analysis of Financial Condition and Results of Operations—Critical Accounting Estimates, Reserves for Losses and LAE. For a reconciliation of the beginning and ending reserve for losses and loss adjustment expenses on a consolidated basis, see Item 8. Financial Statements and Supplementary Data—Note 8. Reserve for Losses and Loss Adjustment Expenses (LAE).
The table below shows PMI’s total risk in force and loss reserves as of December 31, 2009, 2008 and 2007.
| Risk In Force and Loss Reserves as of December 31, | |||||||||
| 2009 | 2008 | 2007 | |||||||
| (Dollars in thousands) | |||||||||
| Total Primary and Pool Risk In Force |
$ | 28,867,036 | $ | 33,327,248 | $ | 34,431,473 | |||
| Gross Loss Reserves by Book Year |
|||||||||
| 2002 and prior |
$ | 135,572 | $ | 137,136 | $ | 117,987 | |||
| 2003 |
144,066 | 118,672 | 87,713 | ||||||
| 2004 |
194,421 | 166,420 | 119,017 | ||||||
| 2005 |
450,343 | 406,224 | 238,077 | ||||||
| 2006 |
850,322 | 774,871 | 345,918 | ||||||
| 2007 |
1,214,096 | 928,065 | 224,368 | ||||||
| 2008 |
220,657 | 93,116 | — | ||||||
| 2009 |
4,258 | — | — | ||||||
| Total Loss Reserves |
$ | 3,213,735 | $ | 2,624,504 | $ | 1,133,080 | |||
The higher loss reserve balance for 2009 shown in the table above reflects, among other factors, accelerated delinquency development of the 2007 and 2008 books and significant additions to reserves in 2009 for the 2005, 2006 and 2007 book years, both as a result of increasingly higher delinquency and claim rates, higher claim severity and a slowdown in delinquency resolution, partially offset by reductions in our loss reserve estimates resulting from projected future rescission activities.
28
Table of Contents
Loan Performance
The table below shows cumulative losses paid by PMI at the end of the year of original policy issuance (“policy year”) and each successive year thereafter, expressed as a percentage of the cumulative premiums written on such policies.
| Year |
1980 |
1981 |
1982 |
1983 |
1984 |
1985 |
1986 |
1987 |
1988 |
1989 |
1990 |
1991 |
1992 |
1993 |
1994 | |||||||||||||||
| 1 |
— | — | — | — | — | — | 0.1 | 0.0 | — | — | — | — | — | — | — | |||||||||||||||
| 2 |
11.8 | 23.3 | 38.1 | 14.8 | 9.8 | 4.5 | 1.5 | 0.4 | 0.1 | 0.3 | 0.7 | 0.8 | 1.1 | 1.0 | 1.0 | |||||||||||||||
| 3 |
39.2 | 90.4 | 112.1 | 47.3 | 44.0 | 18.7 | 5.2 | 2.0 | 2.0 | 3.6 | 7.1 | 6.6 | 6.9 | 5.5 | 6.5 | |||||||||||||||
| 4 |
74.2 | 139.3 | 166.3 | 83.0 | 83.1 | 35.2 | 8.7 | 5.1 | 6.1 | 10.8 | 17.8 | 16.9 | 16.3 | 13.4 | 13.7 | |||||||||||||||
| 5 |
95.5 | 168.3 | 180.9 | 129.3 | 114.3 | 47.4 | 12.2 | 9.7 | 11.6 | 21.9 | 31.7 | 28.9 | 28.3 | 18.7 | 18.0 | |||||||||||||||
| 6 |
100.8 | 168.0 | 229.6 | 165.9 | 127.1 | 56.4 | 15.6 | 13.1 | 18.5 | 32.4 | 41.8 | 39.8 | 36.1 | 21.1 | 20.1 | |||||||||||||||
| 7 |
90.8 | 184.8 | 251.0 | 177.5 | 135.9 | 60.7 | 18.5 | 17.5 | 23.1 | 40.3 | 50.5 | 47.4 | 40.3 | 21.9 | 20.9 | |||||||||||||||
| 8 |
98.5 | 197.3 | 265.4 | 184.6 | 139.3 | 63.0 | 21.3 | 20.7 | 26.2 | 45.7 | 56.2 | 51.3 | 41.5 | 22.0 | 21.3 | |||||||||||||||
| 9 |
107.8 | 203.6 | 265.7 | 187.7 | 141.9 | 65.0 | 24.1 | 23.0 | 29.1 | 49.6 | 59.2 | 52.7 | 41.3 | 21.8 | 21.3 | |||||||||||||||
| 10 |
111.4 | 205.6 | 264.4 | 189.8 | 142.6 | 65.3 | 25.8 | 25.1 | 31.5 | 51.7 | 60.9 | 52.6 | 41.1 | 21.6 | 21.3 | |||||||||||||||
| 11 |
113.0 | 207.1 | 263.8 | 191.0 | 142.9 | 65.9 | 27.4 | 26.5 | 33.6 | 52.8 | 61.4 | 52.7 | 41.0 | 21.7 | 21.4 | |||||||||||||||
| 12 |
114.1 | 208.8 | 264.4 | 191.3 | 142.6 | 65.8 | 28.4 | 27.8 | 34.6 | 53.1 | 61.4 | 52.7 | 41.0 | 21.7 | 21.4 | |||||||||||||||
| 13 |
114.6 | 208.9 | 263.3 | 191.1 | 142.1 | 65.8 | 28.8 | 28.4 | 35.0 | 53.3 | 61.4 | 52.6 | 41.0 | 21.7 | 21.4 | |||||||||||||||
| 14 |
115.0 | 209.8 | 262.2 | 190.6 | 141.7 | 65.9 | 29.0 | 28.6 | 35.2 | 53.3 | 61.4 | 52.6 | 41.0 | 21.6 | 21.4 | |||||||||||||||
| 15 |
115.1 | 209.5 | 261.5 | 190.1 | 141.5 | 66.0 | 29.1 | 28.5 | 35.2 | 53.2 | 61.4 | 52.6 | 41.0 | 21.6 | 21.4 | |||||||||||||||
| 16 |
115.3 | 209.2 | 260.8 | 189.8 | 141.3 | 66.0 | 29.1 | 28.5 | 35.2 | 53.2 | 61.5 | 52.6 | 41.0 | 21.7 | 21.5 | |||||||||||||||
| 17 |
115.5 | 208.9 | 260.4 | 189.5 | 141.0 | 66.0 | 29.1 | 28.6 | 35.2 | 53.2 | 61.5 | 52.6 | 41.0 | 21.7 | ||||||||||||||||
| 18 |
115.5 | 208.5 | 259.8 | 189.5 | 140.9 | 66.0 | 29.1 | 28.6 | 35.2 | 53.2 | 61.5 | 52.7 | 41.0 | |||||||||||||||||
| 19 |
115.5 | 208.1 | 259.6 | 189.5 | 140.8 | 66.0 | 29.1 | 28.5 | 35.2 | 53.2 | 61.5 | 52.7 | ||||||||||||||||||
| 20 |
115.4 | 208.1 | 259.6 | 189.4 | 140.8 | 66.0 | 29.1 | 28.5 | 35.2 | 53.2 | 61.5 | |||||||||||||||||||
| 21 |
115.4 | 208.0 | 259.5 | 189.5 | 140.7 | 65.9 | 29.1 | 28.5 | 35.2 | 53.2 | ||||||||||||||||||||
| 22 |
115.3 | 208.0 | 259.5 | 189.5 | 140.7 | 65.9 | 29.1 | 28.5 | 35.2 | |||||||||||||||||||||
| 23 |
115.3 | 208.0 | 259.5 | 189.4 | 140.6 | 65.9 | 29.1 | 28.5 | ||||||||||||||||||||||
| 24 |
115.3 | 208.0 | 258.6 | 189.5 | 140.5 | 65.9 | 29.1 | |||||||||||||||||||||||
| 25 |
115.3 | 206.6 | 258.1 | 189.5 | 140.5 | 65.9 | ||||||||||||||||||||||||
| 26 |
114.5 | 206.3 | 258.1 | 189.5 | 140.5 | |||||||||||||||||||||||||
| 27 |
114.0 | 206.3 | 258.1 | 189.5 | ||||||||||||||||||||||||||
| 28 |
114.0 | 206.3 | 258.1 | |||||||||||||||||||||||||||
| 29 |
114.0 | 206.3 | ||||||||||||||||||||||||||||
| 30 |
114.0 | |||||||||||||||||||||||||||||
| 1995 |
1996 |
1997 |
1998 |
1999 |
2000 |
2001 |
2002 |
2003 |
2004 |
2005 |
2006 |
2007 |
2008 |
2009 | ||||||||||||||||
| 1 |
0.1 | 0.0 | 0.0 | — | 0.1 | 1.2 | 1.1 | 0.1 | 0.1 | 0.1 | 0.1 | 0.3 | 0.2 | 0.1 | — | |||||||||||||||
| 2 |
2.8 | 2.9 | 2.3 | 1.2 | 2.7 | 10.2 | 6.6 | 4.5 | 2.8 | 3.9 | 4.9 | 11.3 | 14.9 | 3.6 | ||||||||||||||||
| 3 |
10.4 | 8.3 | 5.8 | 3.8 | 5.9 | 21.8 | 22.5 | 14.5 | 8.9 | 12.3 | 22.2 | 56.8 | 36.0 | |||||||||||||||||
| 4 |
15.4 | 11.9 | 8.7 | 5.7 | 8.6 | 35.2 | 34.1 | 23.3 | 13.9 | 21.2 | 60.0 | 86.4 | ||||||||||||||||||
| 5 |
18.2 | 14.2 | 10.4 | 6.7 | 11.1 | 43.0 | 42.0 | 27.7 | 17.4 | 30.8 | 84.1 | |||||||||||||||||||
| 6 |
19.2 | 15.3 | 11.1 | 7.7 | 12.7 | 48.0 | 45.8 | 30.5 | 20.5 | 37.9 | ||||||||||||||||||||
| 7 |
20.1 | 15.8 | 11.9 | 8.3 | 13.9 | 50.3 | 47.9 | 32.5 | 23.1 | |||||||||||||||||||||
| 8 |
20.3 | 16.1 | 12.4 | 8.8 | 14.4 | 51.7 | 49.1 | 33.9 | ||||||||||||||||||||||
| 9 |
20.4 | 16.3 | 12.8 | 9.0 | 14.7 | 52.3 | 49.8 | |||||||||||||||||||||||
| 10 |
20.5 | 16.5 | 13.0 | 9.2 | 15.0 | 52.8 | ||||||||||||||||||||||||
| 11 |
20.6 | 16.6 | 13.0 | 9.4 | 15.2 | |||||||||||||||||||||||||
| 12 |
20.7 | 16.7 | 13.2 | 9.5 | ||||||||||||||||||||||||||
| 13 |
20.8 | 16.8 | 13.3 | |||||||||||||||||||||||||||
| 14 |
20.9 | 16.9 | ||||||||||||||||||||||||||||
| 15 |
20.9 | |||||||||||||||||||||||||||||
| * | Gross premiums written has not been reduced by ceded and refunded premiums. |
29
Table of Contents
As the above table shows, performance of policies originally issued in the years 1980 through 1984 was adverse, with cumulative loss ratios ranging from 114% to 258.1% at the end of 2009. Such adverse experience was significantly impacted by deteriorating economic and real estate market conditions in the “Oil Patch” states in the 1980s. In 1985, PMI adopted substantially more conservative underwriting standards which we believe, along with increased premium rates and generally improving economic conditions, contributed to the lower cumulative loss ratios in subsequent years.
The above table also shows that the cumulative loss ratios for all policy years through 2001 did not change by a material amount from the end of 2008, which indicates that these ratios have stabilized and reached their ultimate development for each of these policy years. The 2002 and 2003 book years are developing favorably compared to 2000 and 2001 due to a lower level of claims and higher persistency. 2004 has a higher cumulative loss ratio development than 2003, due to higher claims development and comparable persistency.
Book years 2005 through 2007 are developing under sustained negative economic conditions and have experienced progressively higher loss ratios. The high loss ratios are primarily due to higher delinquencies, claim rates and claim severity associated with the ongoing weakness in the residential mortgage and housing markets as well as a result of loan products that have experienced higher levels of losses. In particular, the cumulative loss ratio from book year 2007 reflects significant exposure to insurance written on Alt-A loans as well as loans with higher LTVs with greater exposure to home price declines. We do not expect business written in the 2005-2007 book years to be profitable.
The 2008 book year is still in its early stages of development, with a loss ratio of 3.6 in its second year, which is similar in performance to the 2004 book year. As a result of our adoption of tighter underwriting guidelines and customer management strategies throughout 2008 and 2009, insurance written during 2009 is expected to perform favorably.
| 8. | Sustainable Homeownership |
We support certain nonprofit organizations whose stated goals are to foster sustainable homeownership. Fostering sustainable homeownership includes preparing families for their ownership responsibilities and helping them meet that obligation. In line with these two goals, we support community-based organizations that offer homebuyer education programs and, through our HPI department, endeavor to facilitate loan servicers’ efforts to keep families in their homes. PMI, and through the PMI Foundation, is committed to creating sustainable homeownership opportunities by sponsoring organizations with national reach that provide counseling related services. We also work with various nonprofit counseling agencies to assist in their efforts to reach borrowers who are in financial distress. The housing organizations we have supported include: NeighborWorks America Foreclosure Prevention Initiative, HopeNow, AREAA (Asian Real Estate Association of America), NAHREP (National Association of Hispanic Real Estate Professionals), NHC (National Housing Conference), Consumer Credit Counseling Services of San Francisco, NeighborWorks America and others.
| 9. | Reinsurance |
Reinsurance does not discharge PMI, as the primary insurer, from liability to a policyholder. The reinsurance company indemnifies PMI for the reinsurance company’s share of losses incurred under specific insurance policies, unlike an assumption and novation agreement, where the assuming company’s liability to the policyholder is substituted for that of PMI . PMI’s reinsurance arrangements include captive reinsurance, both excess-of-loss (“XOL”) and quota-share and other reinsurance structures, as well as reinsurance agreements with affiliates to comply with state statutory requirements.
30
Table of Contents
(a) Captive Reinsurance
Mortgage insurers, including PMI, offer products to lenders that are designed to allow them to participate in the risks and rewards of the mortgage insurance business. Many of the major mortgage lenders have established affiliated captive reinsurance companies. Under a captive reinsurance agreement, PMI reinsures a portion of its risk written on loans originated by a certain lender with the captive reinsurance company affiliated with such lender. In return, a commensurate amount of PMI’s gross premiums received is ceded to the captive reinsurance company less, in some instances, a ceding commission paid to us for underwriting and administering the business.
Ceded premiums, as well as capital deposits required of the captive reinsurer, are held in a bankruptcy-remote trust for PMI’s benefit to secure the payment of potential future claims. Captive reinsurers must comply with applicable insurance regulations and must adhere to minimum capital requirements, which consider only eligible assets held in trust specifically for our benefit. If, at the end of predetermined reporting periods, the value of assets in the trust is less than that required under the minimum capital requirement, the captive reinsurer must deposit additional amounts into the trust account. If a captive reinsurer does not meet its capital deposit obligations, the agreement will either be placed into run-off or commuted according to its express terms or by mutual agreement of the parties, in which case PMI would reassume the ceded risk and recover all trust assets.
Dividends from the trust accounts are only permissible once specified capital ratios are exceeded and then, only to the extent of such excess. For example, with respect to XOL arrangements, only amounts held in the trust that exceed 20% of the ceded risk may be dividended to the captive. In addition to adherence to dividend capital ratios, some captive reinsurance agreements prohibit any dividends until book years have been reinsured for a minimum time period, typically three years. Because captive trust assets are not segregated by book or policy year, ceded premiums deposited into a trust in one year may be used to pay claims on policies reinsured by the captive in prior or later book years. As of December 31, 2009, assets in captive trust accounts held for the benefit of PMI totaled approximately $940.7 million. We do not anticipate that the aggregate amount of assets held for the benefit of PMI in captive trust accounts will increase in 2010, due primarily to increased claim payments from captive trust accounts and given that PMI is no longer seeking reinsurance under XOL captive reinsurance agreements on new business.
PMI’s captive reinsurance agreements primarily provide for XOL reinsurance, in which PMI retains a first loss position on a defined set of mortgage insurance risk, reinsures a second loss layer of this risk with the captive reinsurance company and retains the remaining risk above the second loss layer. In the first quarter of 2008, the GSEs’ eligibility requirements for approved mortgage insurers were temporarily amended, with respect to business written on or after June 1, 2008, to prohibit cessions of gross risk or gross premium cedes greater than 25% to captive reinsurers. In 2009, PMI ceased seeking reinsurance under XOL captive reinsurance agreements on new business, following which these agreements were placed into run-off where they will mature pursuant to the existing terms and conditions. PMI will, however, continue to consider quota share captive reinsurance arrangements under which the captive reinsurance company assumes a pro rata share of all losses in return for a pro rata share of the premiums collected, less a ceding commission. PMI did not enter into any new captive reinsurance agreements in 2009.
Captive reinsurance agreements mitigate catastrophic losses in times of economic stress. In addition, certain rating agency capital models recognize the trust balances of the captive reinsurers and, thus, also recognize the reinsurance value and transfer of risk associated with captive reinsurance. Typically, only flow Borrower Paid MI is subject to captive reinsurance agreements. The captive reinsurance agreements must comply with both federal and state statutes and regulations, including the Real Estate Settlement Procedures Act of 1974, as well as criteria established by the GSEs.
In 2009, we received $125.9 million compared to $12.9 million in 2008 in claim payments from captive trusts. We expect this amount to increase in 2010. See Item 1A. Risk Factors—The U.S. mortgage insurance industry and PMI are subject to regulatory risk and have been subject to increased scrutiny by insurance and
31
Table of Contents
other regulatory authorities and Item 7. Management’s Discussion and Analysis of Financial Condition and Results of Operations—U.S. Mortgage Insurance Operations, Premiums written and earned, below.
(b) Reinsurance with Affiliates
Certain states limit the amount of risk a mortgage insurer may retain on a single loan to 25% of the indebtedness to the insured, and as a result, the portion of such insurance in excess of 25% (“deep coverage”) must be reinsured. To minimize reliance on third party reinsurance companies and to permit PMI to retain the premiums (and related risk) on deep coverage business, The PMI Group, our parent company, formed several wholly-owned subsidiaries including PMI Reinsurance Co., or PRC, Residential Insurance Co., or RIC, and PMI Mortgage Guaranty Co., or PMG, to provide reinsurance of such deep coverage to MIC. These deep cede reinsurance agreements with PRC, PMG and RIC replaced reciprocal deep cede reinsurance agreements that MIC had with certain non-affiliate mortgage insurance companies, which have now largely run off. Prior to 2008, Residential Guaranty Co. (now known as PMI Insurance Co., or PIC) also provided such reinsurance to MIC. MIC uses reinsurance provided by its reinsurance affiliates primarily for purposes of compliance with statutory coverage limits. CMG MI also uses reinsurance provided by its reinsurance affiliate, CMG Reinsurance Company, to comply with statutory limits.
In 2009, MIC entered into three XOL reinsurance agreements with three affiliated reinsurance companies. Taken together, the agreements provide MIC with a layer of risk remote reinsurance of its 2007 non-delinquent risk-in-force as of September 30, 2009, subject to potential adjustment each quarter based on the relevant affiliate’s risk-to-capital ratio. By entering into these agreements, MIC’s excess minimum policyholders’ position increased as of the effective date of the agreements.
| 10. | Regulation |
State Regulation
General. Our U.S. mortgage insurance subsidiaries are subject to comprehensive, detailed regulation by the insurance departments of the various states in which they are licensed to transact business. The principal aim of this regulation is to safeguard their solvency for the protection of policyholders. Although their scope varies, state insurance laws generally grant broad powers to supervisory agencies or officials to examine the financial books and records of companies, as well as their market conduct and practices, and to enforce rules or exercise discretion touching the most significant aspects of the insurance business. In light of current negative economic conditions and the impacts on our financial condition and results of operations, we expect greater scrutiny from state insurance regulators certain of whom have increased their reporting requirements.
Mortgage insurers are required under various state insurance laws and regulations to transact mortgage insurance business only. This restriction prohibits our mortgage insurance subsidiaries from directly writing other kinds of insurance. Our non-insurance subsidiaries are not subject to regulation under state insurance laws except with respect to transactions with their insurance company affiliates.
Insurance Holding Company Regulations. All states have enacted legislation that requires each insurance company in a holding company system to register with the insurance regulatory authority of its state of domicile and to furnish to such regulatory authority financial and other information concerning the operations of, and the interrelationships and transactions among, companies within the holding company system that may materially affect the operations, management or financial condition of the insurers within the system. The states also regulate transactions between insurance companies and their parents and non-insurer affiliates.
The PMI Group is treated as an insurance holding company under the laws of the State of Arizona. The Arizona insurance laws govern, among other things, certain transactions in our common stock and certain transactions between or among The PMI Group and its domestic and international subsidiaries. For example, no person may, directly or indirectly, offer to acquire or acquire voting securities of The PMI Group or any one of
32
Table of Contents
the Arizona subsidiaries, if after consummation thereof, such person would be in control, directly or indirectly, of such entity, unless such person obtains the Arizona Director of Insurance’s prior approval. For purposes of the foregoing, “control” is rebuttably presumed to exist if such person, following the acquisition, would, directly or indirectly, own, control or hold with the power to vote or hold proxies representing 10% or more of the entity’s voting securities. In addition, all material transactions involving MIC, PIC, PMAC, PMG, PRC, and/or RIC and any of their affiliates, such as PMI Europe and PMI Canada, are subject to prior approval of the Arizona Director of Insurance, and may be disapproved if they are found to be not “fair and reasonable.” MIC, on behalf of itself and its affiliates, is required to file an annual insurance holding company system registration statement with the Arizona and Wisconsin Departments of Insurance (and any other states that so request) disclosing all inter-affiliate relationships, transactions and arrangements that occurred or were in effect during the prior calendar year, and providing information on The PMI Group, the holding company’s “ultimate controlling person.” We must also submit and update biographical information about the executive officers and directors of the holding company’s insurance subsidiaries, as well as executive officers and directors of The PMI Group as required by those states.
The insurance holding company laws and regulations are substantially similar in Wisconsin (where CMG MI is domiciled), and transactions among these subsidiaries, or any one of them and another affiliate (including The PMI Group) are subject to regulatory review and approval in the respective states of domicile. FGIC is subject to regulation under insurance holding company statutes of New York, where it is domiciled, as well as regulations of other jurisdictions where FGIC is licensed to do insurance business. Transactions between FGIC and The PMI Group and its subsidiaries are subject to prior approval of the New York Department of Insurance as well as the Arizona Department of Insurance.
Risk-to-Capital and Minimum Policyholders’ Position. As discussed above in Item 1(C). Business—Certain Regulatory and Other Issues Facing PMI, in sixteen states, a mortgage insurer must adhere to those states’ capital adequacy requirements and may be prohibited from writing new business in those states if its policyholders’ position does not meet the minimum or its risk-to-capital ratio exceeds the limit, as applicable. In certain of those states, the applicable regulations require a mortgage insurer to immediately cease writing new business if and so long as it fails to meet the applicable capital adequacy requirements. In other states, the applicable regulator has discretion as to whether the mortgage insurer may continue writing new business. Thirty-four other states do not have specific capital adequacy requirements for mortgage insurers. As a result of its high losses, MIC’s risk-to-capital ratio has increased and its excess minimum policyholders’ position has decreased. As of December 31, 2009, MIC’s risk-to-capital ratio was 22.1 to 1 and its excess minimum policyholders’ position was $63.9 million. Unless we raise substantial additional capital or achieve significant additional statutory capital relief in the first quarter of 2010, MIC’s excess minimum policyholders’ position will decline and risk-to-capital ratio will increase beyond levels necessary to meet regulatory capital adequacy requirements. See Item 1A. Risk Factors—Unless we raise substantial additional capital or achieve significant capital relief in the first quarter of 2010, MIC will fail to meet various capital adequacy requirements and could be required to cease writing new business and could be subject to the terms of its runoff support agreement with Allstate.
Reserves. Our mortgage insurance subsidiaries are required under the insurance laws of their state of domicile and many other states, including New York and California, to establish a special contingency reserve with annual additions of amounts equal to 50% of premiums earned. Contingency reserves are required to be held for ten years and then are released into surplus, although earlier releases may be authorized by state insurance regulators in certain cases or if, and to the extent, the mortgage insurer’s loss ratio exceeds 35%. For the year ended December 31, 2009, MIC released $1.2 billion of contingency reserves into surplus attributable to losses in excess of 35% of earned premiums. PIC released $174.3 million of contingency reserves into surplus for excess of 35% losses. At December 31, 2009, PMI had statutory policyholders’ surplus of $772.2 million and statutory contingency reserves of $37.2 million.
33
Table of Contents
Dividends. MIC did not pay shareholder dividends to The PMI Group in 2009 and we do not expect that MIC will pay dividends to The PMI Group in 2010. Our Arizona insurance subsidiaries’ ability to pay dividends (including returns of capital) to The PMI Group as their sole shareholder is limited, among other things, by the insurance laws of Arizona and other states. Under Arizona law, an insurance subsidiary may pay dividends out of available surplus without prior approval of the Arizona Director of Insurance, as long as such dividends during any 12-month period do not exceed the lesser of (i) 10% of policyholders’ surplus as of the preceding calendar year end, or (ii) the preceding calendar year’s net investment income. A dividend that exceeds the foregoing threshold is deemed an “extraordinary dividend” and requires the prior approval of the Arizona Director of Insurance. The Arizona Director of Insurance may approve an extraordinary dividend if he or she finds that, following the distribution, the insurer’s policyholders’ surplus is reasonable in relation to its liabilities and adequate to its financial needs. See Item 7. Management’s Discussion and Analysis of Financial Condition and Results of Operations—Liquidity and Capital Resources—The PMI Group Liquidity—Dividends to The PMI Group.
In addition to Arizona, other states may limit or restrict our insurance subsidiaries’ abilities to pay shareholder dividends. For example, California, New York and Illinois prohibit mortgage insurers from declaring dividends except from undivided profits remaining on hand over and above the aggregate of their paid-in capital, paid-in surplus and contingency reserves. CMG MI is subject to shareholder dividend/distribution restrictions under Wisconsin laws similar to those applicable to MIC.
Insurance regulatory authorities have broad discretion to limit the payment of dividends by insurance companies. For example, if insurance regulators determine that payment of a dividend or any other payments to an affiliate (such as payments under a tax-sharing agreement, payments for employee or other services, or payments pursuant to a surplus note) would, because of the financial condition of the paying insurance company or otherwise, be hazardous to such insurance company’s policyholders or creditors, the regulators may block payments that would otherwise be permitted without prior approval.
Premium Rates and Policy Forms. Our insurance subsidiaries’ premium rates and policy forms are subject to regulation in every jurisdiction in which each is licensed to transact business. In most U.S. jurisdictions, policy rates and forms must be filed prior to their use. In some U.S. jurisdictions, these rates and forms must be approved by the state regulator prior to use.
Reinsurance. Regulation of reinsurance varies by state. With the notable exceptions of Arizona, Illinois, Wisconsin, New York, North Carolina, and California, many states have no special restrictions on mortgage guaranty reinsurance other than standard reinsurance requirements applicable to property and casualty insurance companies. Certain restrictions apply under Arizona law to domestic companies and under the laws of several other states to any licensed company ceding business to unlicensed or unaccredited reinsurance companies. Under such laws, if a reinsurance company is not accredited in such states, the domestic company ceding business to the reinsurance company cannot take credit in its statutory financial statements for the risk ceded to such reinsurance company absent compliance with certain minimum statutory capital and reinsurance security requirements. In addition, Arizona prohibits reinsurance unless the reinsurance agreements meet certain requirements even if no statutory financial statement credit is taken.
Examinations. Our licensed insurance and reinsurance subsidiaries are subject to examination of their financial condition and market conduct by the insurance departments of each of the states in which they are licensed to transact business. The Arizona Department of Insurance (the “Department”) periodically conducts a financial examination of insurance companies domiciled in Arizona. In 2008 and 2009, the Department conducted its regularly scheduled financial examination of MIC, PMG, PRC, PIC and RIC for the five year period between January 1, 2003 and December 31, 2007 and filed its report on June 29, 2009. The Wisconsin Office of the Commissioner of Insurance examined CMG MI, CLIC (now PMAC) and WMAC in 2008 for the five year period ended December 31, 2008 and issued its final examination report in 2009. On August 25, 2009, the California Department of Insurance notified CMG MI that it intends to conduct a claims examination;
34
Table of Contents
however, the California Department has not yet commenced such examination. In addition, as mentioned in Item 1(C). Business—Certain Regulatory and Other Issues Facing PMI, above, the Department notified MIC in the third quarter of 2009 of its initiation of a limited scope examination to determine, among others, whether to exercise discretion and permit MIC to continue writing new business in the event MIC fails to maintain Arizona’s minimum policyholders’ position. On February 10, 2010, MIC received a letter from the Department waiving, until December 31, 2011, the requirement that MIC maintain the Arizona required minimum policyholders’ position to write new business. The waiver may be withdrawn by the Arizona Director of Insurance in her sole discretion at any time. Accordingly, there can be no assurance as to the period during which the waiver will remain in effect. The waiver also imposes certain requirements and restrictions on MIC, as discussed in Item 1(C). Business—Certain Regulatory and Other Issues Facing PMI. The waiver letter also states that the Department may conduct examinations and/or analyses to confirm that MIC continues to operate within limits of the approved business plan and to ensure that its financial condition has not become financially hazardous to its policyholders and the public. See Item 1A. Risk Factors—Unless we raise substantial additional capital or achieve significant capital relief in the first quarter of 2010, MIC will fail to meet various capital adequacy requirements and could be required to cease writing new business and could be subject to the terms of its runoff support agreement with Allstate. In lieu of examining a foreign insurer (i.e., an insurer licensed but not domiciled in a state), the insurance supervisors may accept an examination report by a state that has been accredited by the National Association of Insurance Commissioners. Thus, while states have the authority to examine all licensed insurers, in practice, insurance supervisors for the most part defer to the examination reports issued by the domiciliary supervisor. The final examination reports are public records and may be obtained from the applicable state’s department of insurance.
GSEs. In order to be eligible to insure loans purchased by the GSEs, mortgage insurers must meet Fannie Mae’s and Freddie Mac’s mortgage insurer eligibility requirements. These requirements, among other things, impose standards for minimum ratings, legal compliance, use of reinsurance, including captive reinsurance, policies and procedures, risk-sharing, and reporting requirements. As discussed in Item 1(C). Business—Certain Regulatory and Other Issues Facing PMI—Continued GSE Eligibility, above, in 2008, we submitted remediation plans to the GSEs, who currently treat MIC as an eligible mortgage insurer. See Item 1A. Risk Factors—The exercise of certain rights reserved by the GSEs under eligibility requirements for mortgage insurers could harm our profitability and reduce our operational flexibility. In September 2008, the GSEs were placed into conservatorship, which may impact the GSEs’ role in the mortgage industry as well as their treatment of mortgage insurers. In addition, in 2009, each of the GSEs released drafts of their respective revised eligibility requirements, which principally focused on capital management and GSE review and consent of a wide array of operational, fiscal and product matters. The GSEs are expected to finalize their revised eligibility requirements during the first half of 2010. See Item 1(D)(1)(a). Business—U.S. Mortgage Insurance Operations—Products- Primary Mortgage Insurance—Primary Flow Channel and Item 1A. Risk Factors—If the role of the GSEs in the U.S. housing market is changed, or if the GSEs change other policies or practices, the amount of insurance that PMI writes could further decrease, which could result in a decrease of our future revenue. In addition, as discussed in Item 1(C). Business—Certain Regulatory and Other Issues Facing PMI, in connection with the approval by Fannie Mae of PMAC as a direct issuer of mortgage guaranty insurance, MIC and PMAC are restricted from taking a variety of actions.
National Association of Insurance Commissioners. The National Association of Insurance Commissioners, or NAIC, is an organization of the state insurance regulators of all 50 states, the District of Columbia, Puerto Rico, Guam, and U.S. Territories. A major objective of the NAIC is to promote uniformity and harmonization of insurance regulation among the states by the adoption and promulgation of model laws and regulations. The NAIC has developed a rating system, the Insurance Regulatory Information System, or IRIS, primarily intended to assist state insurance departments in overseeing the statutory financial condition of all insurance companies operating within their respective states. IRIS consists of key financial ratios, which are intended to indicate unusual fluctuations in an insurer’s statutory financial position and/or operating results. State insurance regulators apply NAIC IRIS financial ratios to MIC and its insurer affiliates on a continuing basis in order to monitor their financial condition. The NAIC’s Financial Analysis Working Group has been facilitating the exchange of information among regulators of mortgage guaranty insurers.
35
Table of Contents
Federal Laws and Regulation
Certain federal laws, such as the Homeowners Protection Act, discussed below, directly affect private mortgage insurers. Private mortgage insurers, including PMI, are impacted indirectly by federal legislation and regulation affecting mortgage originators and lenders, purchasers of mortgage loans, such as the GSEs, and governmental insurers such as the FHA and VA. For example, changes in federal housing legislation and other laws and regulations that affect the demand for private mortgage insurance may have a material adverse effect on PMI. As noted in Item 1(D)(2). Business—U.S. Mortgage Insurance Operations—Competition—U.S. and State Government Agencies above, the FHA has substantially increased its market share of the U.S. primary mortgage insurance business, as the result primarily of private mortgage insurers adopting tighter underwriting guidelines and federal legislation adopted in 2008 that provides the FHA with greater flexibility in establishing new products and temporarily increases the maximum loan amount that the FHA may insure, in some cases up to the GSE limits, including up to $729,750 in “high-cost” areas. Further legislation that increases the number of persons eligible for FHA or VA mortgages could have a material adverse effect on our ability to compete with the FHA or VA. In November of 2009, the President signed into law a provision extending the current loan limits for the FHA through 2010.
The placement of the GSEs into the conservatorship of the FHFA increases the likelihood that the U.S. Congress will examine the role and purpose of the GSEs in the U.S. housing market and potentially propose certain structural and other changes to the GSEs. The House Financial Services Committee recently announced that it would begin considering the future structure and role of the GSEs. New federal legislation or Treasury programs such as those discussed below could reduce the level of private mortgage insurance coverage used by the GSEs as credit enhancement or eliminate the requirement altogether, and thereby materially affect our ability to compete, demand for our products and the profitability of our mortgage insurance business. See Item 1(D)(1)(a). Business—U.S. Mortgage Insurance Operations—Product—Primary Mortgage Insurance—Primary Flow Channel, above and Item 1A. Risk Factors—If the role of the GSEs in the U.S. housing market is changed, or if the GSEs change other policies or practices, the amount of insurance that PMI writes could further decrease, which could result in a decrease of our future revenue.
On February 18, 2009, President Obama announced his administration’s “Homeowner Affordability and Stability Plan”, or the Plan, which is designed to keep certain borrowers in their homes and reduce the rate of foreclosures. In 2009, the Treasury began implementing two programs under the Plan: “The Home Affordable Refinance Program”, or “HARP” and “The Home Affordable Modification Program”, or “HAMP”. The refinance and modification programs are designed to keep homeownership affordable for borrowers who remain current on their mortgages but whose LTVs have risen because of declining home values and to aid struggling borrowers with high mortgage debt to income ratios. The Plan also includes a component requiring participating lenders to adhere to the Treasury’s uniform modification guidelines. Under the Plan, the Treasury increased its funding commitment to the GSEs to ensure strength and liquidity in the mortgage markets as well as to keep mortgage rates affordable.
The extent to which the HAMP and HARP programs will impact PMI’s operations and financial results is difficult to predict, given that the programs only recently began to be implemented in the second half of 2009. As of December 31, 2009, PMI approved 3,594 HARP modification requests and, of those, 2,339 were finalized, totaling approximately $509.5 million in modified insurance in force. As of December 31, 2009, 23,180 delinquent loans in our default inventory were subject to HAMP trial periods compared to approximately 12,700 loans at September 30, 2009. As discussed above in Item 1 (D)(7). Business—U.S. Mortgage Insurance Operations—Defaults and Claims, loans subject to HAMP trial periods are impacting our cure rate. Although the loans subject to HAMP trial periods are affecting our cure rate, we view any incremental assistance at reducing foreclosures as ultimately having a positive impact.
On February 17, 2009, President Obama signed the “American Recovery and Reinvestment Act of 2009”, which was designed to stimulate the economy through a combination of tax breaks, infrastructure investment and
36
Table of Contents
program enhancement. The components of the American Recovery and Reinvestment Act of 2009 related to housing: (1) increased the first time homebuyer tax credit and extended the credit through December 2009 (which was further extended through April 30, 2010 by the enactment of The Worker, Homeownership, and Business Assistance Act of 2009); (2) extended the 2008 GSE loan limits (up to $729,750 in high cost areas) through 2009 (which have been further extended through 2010); and (3) increased funding to states to rehabilitate and dispose of foreclosed homes.
In order to help stabilize the housing market and provide liquidity, the Federal Reserve instituted a program to purchase Mortgage Backed Securities (MBS). The Federal Reserve has signaled its desire to end the MBS purchase program at the end of the first quarter of 2010. Such an action could increase the cost of mortgages and reduce demand, which could have a negative impact on our business.
Efforts to reform the regulation of financial services more generally may have a material impact on PMI. In 2009, the House of Representatives passed H.R. 4173, which is intended to provide comprehensive reform of financial services regulation. This legislation has many provisions that could impact PMI. For example, under Title VII of the bill, the “Mortgage Reform and Anti-Predatory Lending Act,” new and more stringent requirements would be made applicable to mortgage originators. One potential impact of Title VII might be to limit the availability or raise the cost of mortgage loans, especially for borrowers who want to qualify for low-down payment, insured mortgage loans. Title VII would also require loan originators to retain a significant interest in loans sold into a securitization. This provision could act as a disincentive to banks and other regulated entities that want to securitize mortgage loans, thereby also potentially reducing demand for PMI’s insurance products. The Senate is also considering similar legislation to reform the financial services industry.
We continue to evaluate the above-mentioned legislation and programs. The extent to which such legislation and programs and their implementation will impact PMI’s operations and profitability is unknown.
Mortgage origination transactions are subject to compliance with various federal and state consumer protection laws, including the Real Estate Settlement Procedures Act of 1974, or RESPA, the Equal Credit Opportunity Act, the Fair Housing Act, the Homeowners Protection Act, the Fair Credit Reporting Act, or FCRA, the Fair Debt Collection Practices Act, and others. Among other things, these laws and their implementing regulations prohibit payments for referrals of settlement service business, require fairness and non-discrimination in granting or facilitating the granting of credit, require cancellation of insurance and refunding of unearned premiums under certain circumstances, govern the circumstances under which companies may obtain and use consumer credit information, and define the manner in which companies may pursue collection activities. Changes in these laws or regulations could adversely affect the operations and profitability of our mortgage insurance business.
The Homeowners Protection Act of 1998, or HOPA, provides for the automatic termination, or cancellation upon a borrower’s request, of private mortgage insurance upon satisfaction of certain conditions. HOPA applies to owner-occupied residential mortgage loans regardless of lien priority and to borrower-paid mortgage insurance closed on or after July 29, 1999. FHA loans are not covered by HOPA. Under HOPA, automatic termination of mortgage insurance would generally occur once the LTV reaches 78%. A borrower who has a “good payment history,” as defined by HOPA, may generally request cancellation of mortgage insurance once the LTV reaches 80% of the home’s original value or when actual payments reduce the loan balance to 80% of the home’s original value, whichever occurs earlier.
The Real Estate Settlement Procedures Act of 1974, or RESPA, applies to most residential mortgages insured by PMI. Mortgage insurance has been considered in some cases to be a “settlement service” for purposes of loans subject to RESPA. Subject to limited exceptions, RESPA prohibits persons from giving or accepting any thing of value in connection with the referral of real estate settlement services. RESPA is enforced by HUD and the U.S. Department of Justice, and also provides for private rights of action.
37
Table of Contents
Home Mortgage Disclosure Act of 1975. Most originators of mortgage loans are required to collect and report data relating to a mortgage loan applicant’s race, nationality, gender, marital status, and census tract to HUD or the Federal Reserve under the Home Mortgage Disclosure Act of 1975, or HMDA. Mortgage insurers are not required pursuant to any law or regulation to report HMDA data, although, under the laws of several states, mortgage insurers are currently prohibited from discriminating on the basis of certain classifications. Mortgage insurers have, through the Mortgage Insurance Companies of America, entered voluntarily into an agreement with the Federal Financial Institutions Examinations Council to report the same data on loans submitted for insurance as is required for most mortgage lenders under HMDA.
Privacy and Information Security. The Gramm-Leach-Bliley Act of 1999, or GLB, imposes privacy requirements on financial institutions, including obligations to protect and safeguard consumers’ nonpublic personal information and records, and limitations on the re-use of such information. Federal regulatory agencies have issued the Interagency Guidelines Establishing Information Security Standards (Security Guidelines), and interagency regulations regarding financial privacy (Privacy Rule) implementing sections of GLB. The Security Guidelines establish standards relating to administrative, technical and physical safeguards to ensure the security, confidentiality, integrity, and the proper disposal of consumer information. The Privacy Rule limits a financial institution’s disclosure of nonpublic personal information to unaffiliated third parties unless certain notice requirements are met and the consumer does not elect to prevent, or “opt out” of the disclosure. The Privacy Rule also requires that privacy notices provided to customers and consumers describe the financial institutions’ policies and practices to protect the confidentiality and security of the information. With respect to PMI, GLB is enforced by the U.S. Federal Trade Commission (“FTC”) and state insurance regulators. Many states have enacted legislation implementing GLB and establishing information security regulation. Many states have enacted privacy and data security laws which impose compliance obligations beyond GLB, including obligations to provide notification in the event that a security breach results in a reasonable belief that unauthorized persons may have obtained access to consumer nonpublic information. Privacy and data security in the financial service industry continues to be the subject of pending legislation on both federal and state levels.
Fair Credit Reporting Act. The Fair Credit Reporting Act of 1970, as amended, or FCRA, imposes restrictions on the permissible use of credit report information. FCRA has been interpreted by some FTC staff to require mortgage insurance companies to provide “adverse action” notices to consumers in the event an application for mortgage insurance is declined on the basis of a review of the consumer’s credit.
| E. | International Operations |
Our International Operations segment includes the results of PMI Europe and PMI Canada and our former subsidiaries, PMI Australia and PMI Asia, which are reported as discontinued operations for all periods presented. In 2009, consistent with our goals of enhancing capital and liquidity and focusing on our core U.S. Mortgage Insurance Operations, we ceased writing new business through PMI Europe and continued the process of closing PMI Canada. Revenues from PMI Europe were $45.1 million and 4.9% of our consolidated revenues in 2009 compared to $8.4 million and 0.9% of our consolidated revenues in 2008. Premium revenues from PMI Canada in 2008 and 2009 were negligible. See Item 7. Management’s Discussion and Analysis of Financial Condition and Results of Operations—International Operations, and Item 8. Financial Statements and Supplementary Data—Note 18. Business Segments, for additional information about geographic areas. Excluding revenue from the discontinued operations of PMI Australia and PMI Asia, our International Operations segment generated 4.8% of our consolidated revenues in 2009 compared to 1.7% in 2008, and we expect revenue from our International Operations to continue to be minimal in 2010.
Europe
PMI Europe is a mortgage insurance and credit enhancement company incorporated and located in Dublin, Ireland. PMI Europe is authorized to provide credit, suretyship and miscellaneous financial loss insurance by Ireland’s Financial Regulator (“IFR”). In 2008, to conserve capital and reduce expenses, PMI Europe stopped
38
Table of Contents
assuming new risk and reduced staff and facilities. At December 31, 2009, the total assets of PMI Europe were $183.3 million compared to $261.8 million at December 31, 2008. PMI Europe’s insurer financial strength rating is “B+” (Negative Outlook) from S&P.
PMI Europe’s insured portfolio consists of capital markets products, reinsurance and primary insurance, all of which are related to credit default risk on residential mortgage loans. As of December 31, 2009, PMI Europe’s insurance in force and risk in force with respect to these products were $14.1 billion and $4.9 billion, respectively. The table below shows PMI Europe’s risk in force by country, as of December 31, 2009.
| Country* |
Risk in Force December 31, 2009 |
Percent of Total |
||||
| (USD in millions) | ||||||
| France |
$ | 2,607.2 | 53.5 | % | ||
| Italy |
166.4 | 3.4 | % | |||
| Germany |
1,404.6 | 28.8 | % | |||
| United Kingdom (U.K.) |
576.9 | 11.8 | % | |||
| United States |
121.0 | 2.5 | % | |||
| Total Portfolio |
$ | 4,876.1 | 100.0 | % | ||
| * | By country in which insured mortgage loan was originated. |
The table below summarizes PMI Europe’s credit enhancement portfolio by transaction type.
| Risk in Force December 31, 2009 | |||
| (USD in millions) | |||
| Capital Markets Transactions/CDS |
$ | 4,007.4 | |
| Primary Mortgage Insurance |
747.7 | ||
| Reinsurance |
121.0 | ||
| $ | 4,876.1 | ||
Approximately 81% of PMI Europe’s risk in force represents capital market transactions that consist of investment grade risk. Default protection written by PMI Europe that attaches at the first loss, unrated position is considered sub-investment grade. PMI Europe’s investment grade coverage attaches at a mezzanine or remote loss level and is rated at least “BBB-” by S&P, “BBB-” by Fitch and/or “Baa3” by Moody’s. PMI Europe’s European portfolio does not include any “credit impaired” insured mortgages as commonly understood in Europe. Approximately 3% of PMI Europe’s risk in force consists of U.S. credit impaired mortgages (i.e., mortgages granted to borrowers whose credit history and/or application type is not sufficient to get a conventional mortgage at the prevailing mortgage rate).
Capital Markets Products. PMI Europe’s capital markets products were designed to support secondary market transactions, notably credit-linked notes or synthetic securities transactions (principally, credit default swap (“CDS”) transactions). As of December 31, 2009, approximately 82% of PMI Europe’s risk in force was derived from nine CDS transactions. In five of these transactions, PMI Europe assumed a sub-investment grade or an unrated risk position. In the remaining transactions, PMI Europe’s risk position was rated at “AAA” investment grade. PMI may incur losses on its CDS exposures if losses on the underlying mortgage loans reach PMI’s risk layer. Losses on underlying mortgages may only occur following a credit event, which is typically defined as borrower default or bankruptcy, and only if recoveries (typically foreclosure proceeds) are less than the total outstanding mortgage balances and foreclosure expenses, and, in the case of some transactions, accrued interest. In the first quarter of 2010, PMI Europe was notified that two of its CDS transactions will be called at the contractual call date in March 2010. As a result, PMI Europe’s risk in force will decrease by approximately $2.6 billion as of the call effective date. The call of these transactions is not expected to have a material impact on our results of operations or financial condition.
39
Table of Contents
Certain of PMI Europe’s CDS contracts contain collateral support provisions which, under certain defined circumstances, including a downgrade of PMI Europe’s insurer financial strength ratings and/or deterioration of the underlying mortgage loan performance, require PMI Europe to post collateral for the benefit of the counterparty. The methodology for determining collateral varies and can include mark-to-market valuations, contractual formulae (principally related to expected loss performance) and/or negotiated amounts. As a result of rating agency actions and other contractual requirements, PMI Europe has posted collateral, consisting of corporate securities and cash, of $25.7 million as of December 31, 2009 on CDS transactions. Any further downgrades will have no impact on the required collateral, as the current ratings are below all the ratings related triggers. As of December 31, 2009, the aggregate fair value of all derivative instruments with collateral support provisions upon which we have been required to post collateral was a net liability of $15.8 million. We estimate, based on expected defaults and loss payments, that the amount of additional collateral posted will range from $4.4 million to $11.4 million in 2010. The actual collateral posted at year end will be dependent upon performance of the underlying mortgage portfolios, claim payments and the extent to which PMI Europe is successful in commuting these contracts. As of December 31, 2009, the maximum amount of collateral that PMI Europe could be required to post under these contracts was approximately $37.1 million, including the $25.7 million already posted. See Item 1A. Risk Factors—We are exposed to risk in the winding down of our European and Canadian operations and the MD&A.
Reinsurance. As of December 31, 2009, approximately 2.5% of PMI Europe’s risk in force relates to reinsurance coverage of financial guaranty companies. PMI Europe has completed six reinsurance transactions with financial guaranty companies. Those transactions consist of U.S. credit impaired mortgages and PMI Europe holds second loss positions behind over-collateralization, excess spread mechanisms and other forms of credit enhancement. In five of the transactions, PMI Europe provides excess of loss reinsurance. In the other transaction, PMI Europe provides quota share reinsurance where it assumes risk pari passu with the financial guarantor. As of December 31, 2009, approximately 2% of PMI Europe’s risk in force stemmed from reinsurance of financial guaranty companies. PMI Europe established loss reserves of $17.5 million as of December 31, 2009 in respect of its reinsurance portfolio, which includes a reinsurance transaction with FGIC, a wholly-owned subsidiary of FGIC Corporation, a company in which we are the largest shareholder. As disclosed in Item 1(F). Business—Corporate and Other—FGIC Overview, FGIC’s financial condition is severely impaired, and its primary regulator, the New York State Insurance Department, has issued an order requiring it to suspend paying any and all claims. As PMI Europe is contractually entitled to reinsurance premiums, as well as certain recoveries and reimbursements, from FGIC under the reinsurance transaction, there is a risk that PMI Europe may incur higher costs on the FGIC reinsurance transaction than it would have if FGIC was not impaired. PMI Europe has posted collateral related to certain U.S. subprime exposures on which it provided reinsurance coverage in 2005, and as of March 1, 2010, the posted collateral balance was $8.1 million. PMI Europe may be required to post additional collateral on these reinsurance transactions as a result of future loss developments.
Primary Insurance. As of December 31, 2009, approximately 15% of PMI Europe’s risk in force consisted of primary insurance written in Italy, Germany and the UK. PMI Europe’s primary insurance is structured similarly to the primary mortgage insurance products written in the U.S. A majority of PMI Europe’s primary insurance in force stems from its acquisition of a portion of the U.K. lenders’ mortgage insurance portfolio of Royal and Sun Alliance in the fourth quarter of 2003. However, as this portfolio is very seasoned, losses being generated from the remaining risk are de minimus. PMI Europe recognizes premiums associated with this portfolio in accordance with established earnings patterns that are based upon management’s estimation of the expiration of the portfolio’s risk. We expect the premiums earned and risk in force associated with the portfolio to continue to decline through the remaining life of the portfolio.
40
Table of Contents
The following table shows default rates for each of the last three years by type of credit enhancement coverage.
| Percentage of Risk in Force December 31, 2009 |
Default Rates* by Product Line as of December 31, | |||||||||||
| 2009 | 2008 | 2007 | ||||||||||
| Capital Markets |
82.2 | % | 1.5 | % | 1.2 | % | 0.8 | % | ||||
| Primary Mortgage Insurance |
15.3 | % | 4.4 | % | 3.2 | % | 1.6 | % | ||||
| Reinsurance |
2.5 | % | 32.0 | % | 4.7 | % | 3.6 | % | ||||
| Total |
100.0 | % | ||||||||||
| * | Default rates were calculated using delinquent insurance in force divided by the total insurance in force. |
The increase in the default rate for primary mortgage insurance in 2009 reflects increased defaults on the Italian primary flow business, as well as the overall growth and seasoning of the primary portfolio. Higher default rates in the reinsurance portfolio reflect commutation of transactions with lower default rates during 2009 and that book’s concentration of credit impaired U.S. loans. PMI Europe’s reserves for losses and LAE are shown below for the years 2007 through 2009.
| Reserves for losses and LAE | |||||||||
| 2009 | 2008 | 2007 | |||||||
| (USD in Thousands) | |||||||||
| Capital Market Transactions* |
$ | 6,095 | $ | 11,156 | $ | 19,295 | |||
| Primary Mortgage Insurance |
12,353 | 8,900 | 3,024 | ||||||
| Reinsurance |
17,509 | 64,447 | 19,260 | ||||||
| Total reserves for losses and LAE |
$ | 35,957 | $ | 84,503 | $ | 41,579 | |||
| * | Excluding credit default swap transactions classified as derivatives. |
The loss reserve on reinsurance as of December 31, 2009 was related to certain U.S. subprime exposures on which PMI Europe provided reinsurance coverage in 2005. During 2009, we paid $55.3 million of claims related to the reinsurance coverage and we expect to pay out a substantial portion of the remaining reserves in 2010. For discussion on PMI Europe’s loss reserves, refer to Item 7. Management’s Discussion and Analysis of Financial Condition and Results of Operations, Critical Accounting Estimates, Reserves for Losses and LAE—International Operations.
PMI Europe’s loss reserves shown above do not include CDS transactions, which are considered derivatives and marked to market through earnings under the requirements of FASB ASC Topic 815 Derivatives and Hedging (“Topic 815”), previously SFAS No. 133 and SFAS No. 149. As of December 31, 2009, the fair value of derivative liabilities was $17.3 million. The fair value of these CDS liabilities includes payment obligations that have been incurred but unpaid as of the balance sheet date. Our CDS exposures are dependent on the performance of certain prime residential mortgage loans originated throughout Europe, which are the reference assets for the underlying mortgage-related securities. The fair values of our CDS contracts are affected predominantly by estimated changes in credit spreads of the underlying obligations. As estimated credit spreads change, the fair values of these CDS contracts will change. In addition, with the adoption of FASB ASC Topic 820 Fair Value Measurements and Disclosures (“Topic 820”), previously SFAS No. 157, we have incorporated our non-performance risk into the market value of our derivative assets and liabilities. Excluding our non-performance risk, the fair value of these CDS liabilities would have been $19.3 million as of December 31, 2009.
As discussed in Note 10, Fair Value Disclosures, to our Consolidated Financial Statements, in estimating the fair values of CDS contracts, PMI Europe incorporates expected life of contract dates in its internal valuation models. To the extent that credit spreads are higher than at the time of inception of the transaction, extending the
41
Table of Contents
expected life from the call date to the maturity date could result in PMI Europe recognizing further significant mark-to-market losses. If counterparties elect to extend PMI Europe’s CDS contracts and spreads remain at their current levels, mark-to-market losses could be material and there will be a greater likelihood of incurring higher than currently expected realized losses in the form of paid claims on the contracts.
We do not currently expect that the fair value portion of the CDS liability related to fluctuations in market spreads and our cost of capital will result in additional cash outflows; however, higher than expected defaults, higher loss severities or the acceleration in the timing of claim payments would likely result in an increase in PMI’s expected discounted future net cash outflows and fair value liability, which could materially impact our results of operations.
The applicable regulator of PMI Europe is the IFR. Ireland is a member of the European Union and applies the harmonized system of regulation set out in the European Union directives. Under applicable regulations, PMI Europe may provide insurance only in the classes for which it has authorization and must maintain required capital reserves. Irish insurance companies are required, among other things, to submit comprehensive annual returns to the IFR. The IFR has broad powers to intervene in the affairs of insurance companies including the power to enforce, and take remedial and disciplinary action with respect to, its regulations. Under IFR regulations, insurance companies must maintain a margin of solvency, the calculation of which is based on recent years’ premium volumes or claims experience, and which supplements technical loss and premium reserve requirements.
Canada
In 2007, we began offering residential mortgage insurance products to Canadian lenders and mortgage originators through PMI Canada. PMI Canada did not provide any mortgage insurance coverage in 2007, wrote a limited amount of insurance in 2008 and wrote no insurance in 2009. In 2009, we continued the process of closing PMI Canada. To fully close our operations in Canada, we must remove PMI Canada’s risk in force and obtain regulatory approvals.
Discontinued Operations in PMI Australia and PMI Asia
On October 22, 2008, we sold PMI Australia for an aggregate purchase price of approximately $920 million. In connection with the sale, MIC received approximately $746 million in cash and a note receivable (the “QBE Note”) in the principal amount of approximately $187 million, with interest accruing through September 2011 when it matures and is payable. The actual amount owed under the QBE Note is subject to reduction to the extent that the sum of (i) claims paid between June 30, 2008 and June 30, 2011, with respect to PMI Australia’s policies in force at June 30, 2008, (ii) increases in reserves with respect to such policies at June 30, 2011 as compared to June 30, 2008 and (iii) projected ultimate unpaid losses in excess of such reserves as of June 30, 2011 (together, the “ultimate projected losses”) exceeds $237.6 million (50% of the unearned premium reserve of such policies at June 30, 2008). In addition, the amount payable on the QBE note is subject to reduction in the event that we are required to satisfy claims for breach of warranty under the agreements entered into for the sales of PMI Australia and PMI Asia, in each case if such claims are not otherwise satisfied by April 1, 2010. QBE has not asserted any such warranty claims to date. See Item 1A. Risk Factors—If the value of the contingent note we received in connection with our sale of PMI Australia is reduced our financial condition could suffer.
In connection with the sale of PMI Australia, MIC funded premiums of approximately $46.5 million to procure an excess-of-loss reinsurance cover for PMI Australia. The agreement provides for potential reinsurance profit-sharing for one-half of the reinsurance premiums (equivalent to $25 million) at the end of the three-year policy life, provided that PMI Australia’s losses do not exceed a certain loss amount specified in the PMI Australia sale agreement. PMI Australia is recorded as discontinued operations in the international segment for all periods.
42
Table of Contents
On December 17, 2008, we sold PMI Asia for a cash purchase price of approximately $51.6 million, which is 92.5% of PMI Asia’s net tangible asset value under U.S. GAAP as of June 30, 2008, plus a pre-completion adjustment of $0.1 million. PMI Asia is recorded as discontinued operations in the international segment for all periods presented.
Foreign Currency Exchange
We are subject to foreign currency exposure due to operations in Europe and Canada, whose currencies fluctuate relative to the U.S. dollar—the basis of our consolidated financial reporting. Such exposure falls into two general categories: economic exposure and transaction exposure.
Economic exposure is defined as the change between anticipated net cash flows in currencies other than the U.S. dollar and the actual results that are reflected in our consolidated financial statements after translation. To the extent there are changes in the average translation rates from local currencies to the U.S. dollar, our recorded consolidated net income can be positively or negatively affected. If the U.S. dollar strengthens relative to other applicable foreign currencies, our net income and loss from our International Operations segment will be reduced by translation losses. Conversely, if the U.S. dollar weakens against other applicable foreign currencies, our net income and loss from International Operations will be magnified by translation gains. We did not hedge our economic exposure to PMI Europe or PMI Canada in 2009.
We do not currently hedge foreign currency exposures of net investments in our foreign operations. If the spot exchange rates of the U.S. dollar relative to other applicable foreign currencies change, our net investment in our foreign operations will be impacted. Foreign currency translation gains in accumulated other comprehensive income were $50.1 million as of December 31, 2009, due primarily to the strengthening of the spot exchange rates of the Euro relative to the U.S. dollar. This cumulative foreign currency translation gain benefits MIC’s statutory surplus as PMI Europe is its wholly-owned subsidiary.
Transaction exposure refers to currency risk related to specific transactions and occurs between the time a firm commitment in a foreign currency is entered into and the time the cash is actually paid. Under our Derivative Use Plan’s Foreign Exchange Policy Guidelines, we are authorized to hedge our transaction exposure through the purchase of currency option and forward contracts. We did not engage in any hedging activities of transaction risk in 2009.
| F. | Corporate and Other |
FGIC Overview. We are the largest shareholder of FGIC Corporation, with a common equity ownership interest of approximately 42%. FGIC Corporation’s wholly-owned subsidiary, Financial Guaranty Insurance Company (“FGIC”), is a New York Stock Insurance Corporation, which was engaged in the business of providing financial guaranty insurance and other forms of credit enhancement for public finance and structured finance obligations. The other principal investors in FGIC Corporation are affiliates of The Blackstone Group, L.P., The Cypress Group L.L.C. and CIVC Partners L.P. We account for this investment under the equity method of accounting in accordance with FASB ASC Topic 323 Investments-Equity Methods and Joint Ventures (“Topic 323”), previously Accounting Principles Board (APB) Opinion No. 18, and, accordingly, the investment is not consolidated.
The financial guaranty industry changed dramatically in 2008 and 2009. Financial guaranty insurers’ ability to compete has been highly dependent on their triple-A ratings. As a result of the downgrades in FGIC’s financial strength ratings and FGIC’s financial condition, FGIC ceased writing new business in January 2008. We impaired our investment in FGIC in the first quarter of 2008 and reduced the carrying value of the investment to zero. To the extent that our carrying value remains zero, no equity in losses relating to FGIC will be recorded. See Item 1A. Risk Factors—It is unlikely we will recover our investment in FGIC. We are under no obligation, nor do we intend, to provide additional capital to FGIC.
43
Table of Contents
On November 20, 2009, FGIC filed with its primary regulator, the New York State Insurance Department (the “NYID”), its Quarterly Statement for the period ending September 30, 2009, in which FGIC reported a surplus to policyholders deficit at September 30, 2009 of $865,834,577 and an impairment of its required minimum surplus to policyholders at September 30, 2009 of $932,234,577. On November 24, 2009, FGIC announced that the NYID had issued an order requiring FGIC to suspend paying any and all claims and prohibiting FGIC from writing any new business. This announcement also noted that the NYID order requires FGIC to take such steps as necessary to remove the impairment of FGIC’s capital and to return to compliance with its applicable minimum surplus to policyholders requirement by no later than March 25, 2010, or such subsequent date as the NYID deems appropriate, without limiting in any way the NYID’s ability to seek rehabilitation or liquidation of FGIC prior to such date. The NYID order further requires FGIC to provide the NYID a proposed surplus restoration plan to remove FGIC’s capital impairment and return FGIC to compliance with its minimum surplus to policyholders requirement. On January 6, 2010, FGIC announced that it had submitted to the NYID a proposed surplus restoration plan. In February 2010, FGIC released its 2009 year-end statutory-basis financial statements that reported a surplus to policyholders deficit at December 31, 2009 of $1,281,420,000 and an impairment of its required minimum surplus to policyholders at December 31, 2009 of $1,347,820,000.
As of December 31, 2009, FGIC Corporation had $261,895,000 of principal amount of senior notes outstanding (net of senior notes held by FGIC Corporation) and $46,000,000 of principal amount of debt outstanding under its credit facility. In addition, FGIC Corporation had preferred stock outstanding with a redemption price as of December 31, 2009 of approximately $344,774,000. FGIC Corporation has stated that it did not make the January 15, 2010 interest payment on its senior notes when due and did not cure such default during the thirty day grace period. As a result, FGIC Corporation is in default under its senior notes. In addition, FGIC Corporation has disclosed that the administrative agent for its credit facility has asserted that an event of default has occurred and is continuing under FGIC Corporation’s credit facility as a result of FGIC’s failure to pay claims when due (following the NYID’s November 24, 2009 order that FGIC suspend paying claims) and that the administrative agent may further assert than an additional event of default has occurred as a result of FGIC Corporation’s failure to make the January 15, 2010 interest payment on its senior notes prior to the end of the grace period. FGIC Corporation has stated that it does not plan to recommence debt service payments in the absence of a successful restructuring of its debts.
In their respective 2009 year-end financial statements, FGIC Corporation and FGIC stated that their respective management had concluded that there was substantial doubt about the abilities of FGIC Corporation and FGIC to continue as going concerns. As of March 4, 2010, FGIC had not concluded a plan that would remove FGIC’s capital impairment and return FGIC to compliance with its minimum surplus to policyholders requirement.
Sale of RAM Re. In 2009, MIC sold its entire investment in RAM Re, which benefited MIC’s liquidity and capital position. MIC previously reduced its carrying value of its investment in RAM Re to zero.
| G. | Investment Portfolio |
As of December 31, 2009, The PMI Group and its consolidated subsidiaries had total cash and cash equivalents of $0.7 billion and investments of $2.6 billion. The PMI Group’s Board of Directors oversees our investment portfolio, including our unconsolidated subsidiaries, approves investment strategies, and monitors our investment performance. The U.S. companies included in the consolidated financial statements, or the U.S. Portfolio, held cash and cash equivalents and investments of $3.1 billion as of December 31, 2009. Our U.S. Portfolio is managed by an external investment management firm.
44
Table of Contents
The following table summarizes the rating distributions of our consolidated investment portfolio (including cash and cash equivalents, excluding common stocks) as of December 31, 2009:
| December 31, | ||||||
| 2009 | 2008 | |||||
| AAA or equivalent |
48 | % | 59 | % | ||
| AA |
24 | % | 24 | % | ||
| A |
24 | % | 14 | % | ||
| BBB |
4 | % | 3 | % | ||
| Total |
100 | % | 100 | % | ||
Our ten largest holdings at December 31, 2009 appear in the table below:
| Market Value | |||||
| (Dollars in thousands) | |||||
| 1. | New York, NY | $ | 76,713 | ||
| 2. | Metropolitan Transportation Authority NY | 59,895 | |||
| 3. | Chicago, IL O’ Hare International Airport | 51,145 | |||
| 4. | California St. | 49,976 | |||
| 5. | Florida St. Board of Education Lottery Revenue | 45,571 | |||
| 6. | Miami-Dade County FL School Board | 43,156 | |||
| 7. | Westchester Tobacco Asset | 41,233 | |||
| 8. | Louisville & Jefferson County KY Sewer | 40,020 | |||
| 9. | New York, NY City Transitional Financing Authority | 38,184 | |||
| 10. | Chicago, IL | 37,370 | |||
| $ | 483,263 | ||||
We manage the U.S. Portfolio to achieve the goals of providing a predictable, high level of investment income, while maintaining adequate levels of liquidity, safety and preservation of capital. Growth of capital and surplus through long-term market appreciation are secondary considerations. Realization of taxable capital gains is minimized and emphasis is given to credit quality, price volatility and diversification, for each investment category as well as for the portfolio as a whole. As of December 31, 2009, based on market value and excluding cash and cash equivalents, approximately 100% of the U.S. Portfolio was invested in fixed income securities and preferred stocks. During 2009, we recorded a realized loss of $10.6 million related to preferred securities held in our U.S. investment portfolio. We may have additional impairments for preferred or other securities if they meet the criteria for other-than-temporary impairment due to continuing stress in the capital markets. We do not invest in non-agency mortgage-backed securities.
Investments held by The PMI Group’s U.S. insurance subsidiaries are subject to the insurer investment laws of each of the states in which they are licensed. These statutes, designed to preserve insurer assets for the protection of policyholders, set limits on the percentage of assets that an insurer can hold in certain investment categories (e.g., under Arizona law, no more than 20% in equity securities) and with a single issuer (e.g., 10% under Arizona law).
PMI Europe’s and PMI Canada’s investments are subject to the investment policies adopted by their respective boards of directors and are managed by investment advisory firms under separate investment management agreements. We regularly review these entities’ investment strategies and performances. The investment policies specify that the portfolios must be invested predominantly in intermediate-term and high-grade bonds.
45
Table of Contents
As of December 31, 2009, PMI Europe had $42.7 million in cash and cash equivalents and $129.4 million of investments which are managed by an external investment management firm. The investment portfolio primarily consists of Euro, British Pounds Sterling, and U.S. dollar denominated fixed income securities issued by sovereign, agency and corporate entities. The portfolio’s option-adjusted duration, including cash and cash equivalents, was 4.0 as of December 31, 2009. PMI Europe’s portfolio did not contain investments in equity securities as of December 31, 2009.
As of December 31, 2009, PMI Canada had $4.7 million in cash and cash equivalents and $14.3 million of investments which are managed by an external investment management firm. The investment portfolio consists of Canadian dollar and U.S. dollar denominated fixed income securities issued by sovereign, agency and corporate entities. The portfolio’s option-adjusted duration, including cash and cash equivalents, was 1.7 at December 31, 2009. PMI Canada’s portfolio did not contain investments in equity securities as of December 31, 2009.
We review the investment portfolios and strategies of our unconsolidated subsidiaries on a quarterly basis. Through our representation on their boards of directors, we have a limited ability to influence their investment management decisions.
| H. | Employees |
As of December 31, 2009, The PMI Group, together with its wholly-owned subsidiaries and CMG MI, had 600 full-time and part-time employees, of which 567 persons performed services primarily for PMI, 5 were employed by PMI Europe and 28 performed services primarily for CMG MI. Our employees are not unionized and we consider our employee relations to be good. In addition, we had 113 temporary workers as of December 31, 2009.
| ITEM 1A. | RISK FACTORS |
| A. | Capital and Liquidity Constraints |
We may face liquidity issues at our holding company, The PMI Group, and if an event of default were to occur under our credit facility, our business would suffer.
We currently have outstanding borrowings of $125 million under our credit facility. At December 31, 2009, The PMI Group held cash and marketable securities of $61.5 million. The PMI Group is a holding company and conducts its business operations through various subsidiaries. Historically, The PMI Group’s principal sources of funds have been dividends from its insurance subsidiaries and income from its investment portfolio. State insurance regulations restrict the amount of dividends that may be paid by The PMI Group’s insurance subsidiaries without the consent of the applicable regulator. As a result of, among other things, MIC’s losses and the decline in its capital position, MIC did not pay dividends to The PMI Group in 2008 or 2009, and we do not expect that MIC will be able to pay dividends in 2010. As discussed under There is no assurance that we will be able to raise needed capital on a timely basis and on favorable terms, or at all below, the substantial decline in our market capitalization, the downgrades in the ratings of our debt securities and our significant operating losses, combined with difficult market conditions generally and in our industry specifically, limit our ability to obtain debt or equity financing in capital markets transactions or from private sources.
Under the terms of our credit facility, we are required to maintain a minimum Adjusted Consolidated Net Worth (as defined in the facility) of at least $700 million at December 31, 2009 and $500 million from January 1, 2010 through the maturity date of the facility of October 24, 2011. Our Adjusted Consolidated Net Worth, as defined in the credit facility, was $1.0 billion, as compared to a net worth requirement of $700 million at December 31, 2009. Our Adjusted Consolidated Net Worth will be adversely affected by our continued losses and other factors negatively affecting our financial position. Absent significant additional capital, our Adjusted Consolidated Net Worth will decline in 2010. Although we currently expect to remain in compliance, due to continuing losses and other factors negatively affecting our financial position, there is a risk that we will not be able to maintain the minimum Adjusted
46
Table of Contents
Consolidated Net Worth as required by the credit facility. If we were to anticipate being, or were to become, unable to maintain the required minimum Adjusted Consolidated Net Worth, we intend to pursue one or more of the following actions - (1) negotiate with the lenders under our credit facility to amend or waive compliance with the covenant, (2) seek to sell certain assets, including the QBE Note prior to maturity, for an amount sufficient to repay the credit facility and (3) other corporate initiatives, inclusive of expense reductions, within our control to maintain compliance with the covenant. There can be no assurance that we will be able to successfully effectuate one or more of the above measures in a timely manner or at all. In addition, even if we are able to sell certain assets or execute corporate initiatives, there can be no assurance that we will maintain the minimum Adjusted Consolidated Net Worth required under the credit facility thereafter.
In addition, under our credit facility, upon the occurrence of certain events, we may be required to reduce our outstanding borrowing below $125 million and the size of the facility may be permanently reduced below $125 million. We may be required to make such a reduction and repay a portion of our outstanding borrowings, even when we have not received funds sufficient to repay such amounts. For example, the size of the credit facility could be reduced if the value of the QBE Note decreases, including as a result of quarterly estimates prepared by an independent actuary. See MD&A—Liquidity and Capital Resources—Sources and Uses of Funds—The PMI Group Liquidity—The QBE Note. The value of the QBE Note will depend on a number of factors that are beyond our control and difficult to predict, including judgments by the independent actuary as to ultimate projected losses on the PMI Australia insurance policies as of June 30, 2008 that were acquired by QBE. We cannot be certain that we will not be required to repay the credit facility in whole or in part as a result of a decline in the value of the QBE Note or otherwise.
Failure to comply with the covenants (including the adjusted consolidated net worth covenant) or failure to pay amounts due under our credit facility would be events of default under our credit facility. Upon an event of default, we would likely be required to repay all outstanding indebtedness under the credit facility and the lenders under the credit facility would have the right to terminate their loan commitments under the facility. In addition, an event of default under the facility, if not cured within 30 days after notice from the trustee for our senior notes or from holders of our senior notes, would cause an event of default under our outstanding senior notes and could require us to repay all our outstanding senior notes. We currently do not have sufficient funds at our holding company to repay the credit facility or the senior notes.
Unless we raise substantial additional capital or achieve significant capital relief in the first quarter of 2010, MIC will fail to meet various capital adequacy requirements and could be required to cease writing new business and could be subject to the terms of its runoff support agreement with Allstate.
At December 31, 2009, MIC’s excess minimum policyholders’ position was $63.9 million, and MIC’s risk-to-capital ratio was 22.1 to 1. Unless we raise substantial additional capital or achieve significant additional statutory capital relief in the first quarter of 2010, MIC’s excess minimum policyholders’ position will decline and risk-to-capital ratio will increase beyond levels necessary to meet regulatory capital adequacy requirements. If this were to occur, as described below, MIC could be required to immediately suspend writing new business in some states. Any such failure to meet the capital adequacy requirements of one or more states could have a material adverse impact on our financial condition, results of operations and business. See Our plan to write certain new mortgage insurance in a subsidiary of MIC, while progressing, may not be successful and, even if it is implemented in some states, it may not allow us to continue to write mortgage insurance in other states, below. In sixteen states, if a mortgage insurer does not meet a required minimum policyholders’ position (which amount fluctuates and is calculated in accordance with applicable state statutory formulae) or exceeds a maximum permitted risk-to-capital ratio (generally 25 to 1), it may be prohibited from writing new business until its policyholders’ position meets the minimum or its risk-to-capital ratio falls below the limit, as applicable. In certain of those states, the applicable regulations require a mortgage insurer to immediately cease writing new business if and so long as it fails to meet the applicable capital adequacy requirements. In other states, the applicable regulator has discretion as to whether the mortgage insurer may continue writing new business. In 2009, North Carolina, Arizona and California adopted legislation giving the respective state’s insurance
47
Table of Contents
regulators such discretion. Thirty-four other states do not have specific capital adequacy requirements for mortgage insurers. We and other mortgage insurers continue to discuss with the remaining states that have regulations requiring a mortgage insurer to immediately cease writing new business if capital adequacy requirements are not met, the potential adoption of legislation similar to the laws enacted in Arizona, California and North Carolina.
MIC’s principal regulator is the Arizona Department of Insurance (the “Department”). The Department notified MIC in the third quarter of 2009 of its initiation of a limited scope examination to determine, among other things, whether to exercise discretion and permit MIC to continue writing new business in the event MIC fails to maintain Arizona’s minimum policyholders’ position requirement. On February 10, 2010, MIC received a letter from the Department waiving, until December 31, 2011, the requirement that MIC maintain the Arizona required minimum policyholders’ position to write new business. The waiver may be withdrawn by the Arizona Director of Insurance in her sole discretion at any time if the facts and circumstances warrant such action. Accordingly, there can be no assurance as to the period during which the waiver will remain in effect. The waiver also imposes certain requirements and restrictions on MIC, as discussed in Item 1(C). Business—Certain Regulatory and Other Issues Facing PMI.
If the Department were to withdraw the waiver and MIC fails to maintain Arizona’s minimum policyholders’ position, we would likely be required to suspend writing new business in all states. In addition, we believe that certain insurance regulators could interpret their respective states’ statutes to require a mortgage insurer to suspend writing new business in all states if it fails to meet the applicable capital adequacy requirement of their respective states. We cannot predict whether and under what circumstances an insurance regulator might exercise its discretion to permit MIC to write new business or, in the case of the Department, under what circumstances it might modify or terminate the waiver MIC has received. Moreover, even if an insurance regulator were to exercise its discretion to permit MIC to continue writing new business, we may be unable to write new business in other states in which MIC fails to meet regulatory capital requirements, and regulators in certain other states could take the position that MIC must suspend writing new business nationwide. In states that do not have capital adequacy requirements, it is not clear what actions the applicable insurance regulators would take if we failed to meet the capital adequacy requirement established by another state. Accordingly, if MIC fails to meet the capital adequacy requirements in one or more states, MIC may have to immediately suspend writing new business in some or all states in which it does business. Moreover, even with the waiver, if MIC breached regulatory capital adequacy requirements, there is a risk that certain of our customer relationships would be negatively impacted.
From time to time, we have discussed with certain state insurance regulators their financially hazardous condition regulations generally applicable to licensed insurance companies and those states’ interpretive positions that we are, or could be, in violation of their respective regulations. None of these states has taken any action against MIC to date. If any of those states or other states having similar financially hazardous condition regulations (which are most states) were to conclude that MIC was in a financially hazardous condition, MIC may be required to cease writing new business in that state.
Under the terms of our runoff support agreement with Allstate Insurance Company, MIC is subject to restrictions that may apply if its risk-to-capital ratio exceeds 23 to 1. Under the runoff support agreement, among other things, if MIC’s risk-to-capital ratio equals or exceeds 23 to 1 at three consecutive monthly measurement dates, MIC may not enter into new insurance or reinsurance contracts without the consent of Allstate Insurance Company. If following such time as MIC’s risk-to-capital ratio were to exceed 23 to 1, Allstate Insurance Company were to make any payments on account of specified third party claims, or if MIC’s risk-to-capital ratio were to exceed 24.5 to 1, the runoff support agreement requires MIC to transfer substantially all of its liquid assets to a trust account for the payment of MIC’s obligations to policyholders. The original risk-in-force on policies covered under the Allstate runoff support agreement has been reduced from approximately $13 billion in 1994 to approximately $46 million as of December 31, 2009 (less than 1% of the original risk-in-force). We expect any potential future losses associated with the remaining risk-in-force under the Allstate runoff support agreement to be immaterial and total loss reserves on the remaining risk-in-force were approximately $1 million
48
Table of Contents
as of December 31, 2009 (less than 1% of MIC’s total loss reserves as of the same date). The remaining business has an average LTV of less than 40%. Any failure to meet the capital requirements set forth in the runoff support agreement with Allstate Insurance Company could, if pursued by Allstate, have a material adverse impact on our financial condition, results of operations and business.
Our plan to write certain new mortgage insurance in a subsidiary of MIC, while progressing, may not be successful and, even if it is implemented in some states, it may not allow us to continue to write mortgage insurance in other states.
In the event that MIC is unable to continue to write new mortgage insurance in one or more states, we are working on a plan to enable us to write new mortgage insurance in those states by PMI Mortgage Assurance Co. (“PMAC”). PMAC is a subsidiary of MIC and was formerly known as Commercial Loan Insurance Corporation. PMAC is currently licensed to write insurance in all states except Connecticut, Michigan and New York. In seven other states, PMAC is applying to revise the line of insurance business it is authorized to transact so that it may begin writing residential mortgage guaranty insurance in those states. There is no guarantee that PMAC will be able to obtain insurance licenses in Connecticut, Michigan or New York or approval to revise its existing licenses in other impacted states. In addition, before PMAC can begin writing new business, Freddie Mac must approve PMAC as an eligible mortgage insurer. On February 12, 2010, Fannie Mae approved PMAC as a direct issuer of mortgage guaranty insurance. Fannie Mae’s approval terminates on the earlier of December 31, 2011 or the date that MIC ceases to transact new business in all jurisdictions in which it is licensed. The approval is subject to a number of detailed conditions and restrictions on our business, as discussed in Item 1(C). Business —Certain Regulatory and Other Issues Facing PMI, and there can be no assurance that we will be able to satisfy these conditions or comply with the restrictions. PMAC is currently in negotiations with Freddie Mac about becoming an eligible insurer under Freddie Mac’s criteria.
In the event MIC is prohibited from writing new business in certain states, there is no assurance that PMAC would be able to obtain, in a timely manner or at all, the appropriate insurance licenses in all applicable states. In addition, certain customers may choose not to purchase mortgage insurance from us in any state in the event that we cannot offer mortgage insurance through the combined companies in all fifty states. Our inability to successfully and timely implement this plan, in the event MIC is unable to continue writing new mortgage insurance in certain states, could have a material adverse impact on our financial condition, results of operations and business.
There is no assurance that we will be able to raise needed capital on a timely basis and on favorable terms, or at all.
As a result of continued losses in 2009, and our expectation that we will continue to incur significant losses in 2010, we need to procure significant amounts of additional capital. In response to our capital constraints, we managed our new insurance writings in 2009. In addition, we implemented a number of capital and business initiatives designed to mitigate losses and/or generate capital relief for PMI and The PMI Group, including HPI initiatives, restructuring of certain modified pool contracts, contribution of PIC to MIC and the sale of RAM Re. We are also exploring other alternatives to enhance our liquidity and capital, including debt or equity offerings and/or other capital relief initiatives at PMI.
The amount and timing of capital we require could depend on a number of factors, such as:
| • | the performance of our U.S. mortgage insurance operations, which is affected by, among other things, the economy, unemployment, default and cure rates and losses and LAE; |
| • | levels of new insurance written; |
| • | our ability to comply with capital adequacy requirements imposed by regulators or third parties; |
| • | rating agencies and GSE requirements and determinations; |
49
Table of Contents
| • | the performance of our investment portfolio and the extent to which we are required to impair portions of the portfolio as a result of deteriorating capital markets; |
| • | financial and other covenants and event of default triggers in our credit facility; |
| • | the performance of PMI Europe, which is affected by the U.S. and European mortgage markets and, among other things, changes in the fair value of CDS derivative contracts resulting from the widening of RMBS credit spreads; and |
| • | any requirements to provide capital under the PMI Europe or CMG MI capital support agreements, which are discussed in—We have been and will continue to be negatively impacted by downgrades of MIC’s insurer financial strength ratings and Item 1(D)(1)(c). Business—U.S. Mortgage Insurance Operations—Products—Joint Venture—CMG Mortgage Insurance Company. |
Many of these factors are outside of our control and difficult to predict. In addition, some of these factors, such as the views and requirements of the rating agencies and GSEs, are subjective and not subject to specific quantitative standards.
The substantial decline in our market capitalization, the downgrades in the ratings of our debt securities and our significant operating losses, combined with difficult market conditions generally and in our industry specifically, limit our ability to obtain debt or equity financing in capital markets transactions or from private sources. We cannot be sure that we will be able to raise capital on favorable terms and in the amounts that we require, or at all. In addition, continued losses or additional ratings downgrades could make it more difficult for us to raise the necessary capital. Moreover, to the extent a capital raising transaction is undertaken in an effort to avoid an adverse action by a third party, we cannot be sure that the transaction could be completed in a timely manner to avoid such action. The terms of a capital raising transaction could require us to agree to stringent financial and operating covenants and to grant security interests on our assets to lenders or holders of our debt securities that could limit our flexibility in operating our business or our ability to pay dividends on our common stock and could make it more difficult for us to obtain capital in the future. We may not be able to access additional debt financing on acceptable terms or at all. If we were to obtain equity financing for a significant portion of our capital needs, any such financing would likely be significantly dilutive to our existing shareholders or result in the issuance of securities that have rights, preferences and privileges that are senior to those of our common stock, or both. Further, any capital initiatives in the form of reinsurance, or other risk transfer transactions of our existing portfolios, would have a dilutive effect on our future earnings, if any.
We have been and will continue to be negatively impacted by downgrades of MIC’s insurer financial strength ratings.
S&P’s and Moody’s insurer financial strength ratings of MIC are “B+” and “B2”, respectively. As a result of the downgrades of MIC, PMI Europe has also been downgraded and has an insurer financial strength rating of “B+” from S&P. PMI Europe’s rating is dependent in part upon the capital support of MIC.
MIC’s insurer financial strength ratings have had a negative effect on our eligibility to insure mortgage loans from the GSEs and other private mortgage lenders who condition our eligibility partly on our maintenance of certain ratings and on our financial strength. See The exercise of certain rights reserved by the GSEs under eligibility requirements for mortgage insurers could harm our profitability and reduce our operational flexibility. Some mortgage lenders have reduced the amount of or eliminated all mortgage insurance they purchase from us as a result of the ratings downgrade. If we become ineligible to provide insurance to a portion or all of the mortgage loans from the GSEs or mortgage lenders, our financial condition and results of operations would be materially adversely affected. In addition, CMG MI receives capital support from MIC and is, therefore, dependent in part upon the financial strength of MIC. Therefore, sustained lower ratings may have additional negative impacts on CMG MI.
50
Table of Contents
If we experience further downgrades, or if all or some of our competitors’ ratings improve and our ratings remain at the current level, our business prospects, revenues, competitive position, holding company debt ratings and the performance of our insurance subsidiaries could be significantly harmed. We will need to raise significant additional capital to improve our ratings. There can be no assurance that we will be able to raise any additional capital in the future, either on acceptable terms or in a timely manner, or at all, or that such additional capital will be sufficient to improve our ratings. See There is no assurance that we will be able to raise needed capital on a timely basis and on favorable terms, or at all.
The exercise of certain rights reserved by the GSEs under eligibility requirements for mortgage insurers could harm our profitability and reduce our operational flexibility.
The GSEs have established approval requirements for eligible mortgage insurers, covering substantially all areas of PMI’s mortgage insurance operations, including requiring mortgage insurers to maintain certain insurer financial strength ratings. The GSEs may revise any eligibility requirement at any time in their own discretion. Indeed, both Fannie Mae and Freddie Mac are currently considering revisions to their eligibility guidelines that include greater limitations and restrictions on mortgage insurers.
In 2008, in order to maintain its eligibility with the GSEs, MIC was required to submit remediation plans to each GSE outlining, among other things, the steps we are taking or plan to take to bolster MIC’s financial strength. To date each of the GSEs continues to treat MIC as an eligible mortgage insurer. There can be no assurance, however, that the GSEs will continue to treat MIC as an eligible mortgage insurer. See Item 1(D)(1)(a). U.S. Mortgage Insurance Operations—Products—Primary Mortgage Insurance—Primary Flow Channel.
The GSEs, in their own discretion, could require MIC to limit certain activities and practices in order to remain an eligible mortgage insurer with them. Such limitations could include, among other things, maximum risk-to-capital ratios and limitations on our ability to pay dividends or make other payments, which could limit our operating flexibility and limit the areas in which we may write new business. In addition, the agreement that we entered into with Fannie Mae regarding PMAC restricts MIC and PMAC for taking a variety of actions, subject to enumerated exceptions, without Fannie Mae’s prior written consent, which is not to be unreasonably withheld, including amending certain agreements with affiliates, paying dividends or making distributions or payments of indebtedness, transferring securities, modifying underwriting guidelines beyond eligibility standards for standard GSE business, transferring new mortgage insurance business to other affiliates, entering into new, or modifying existing, expense or tax sharing arrangements or commutation transactions, or transferring assets outside the ordinary course of business or in excess of specified levels.
Either or both of the GSEs could determine that MIC is no longer an eligible mortgage insurer. The GSEs, as major purchasers of conventional mortgage loans in the United States, are the primary beneficiaries of MIC’s mortgage insurance coverage. If either or both of the GSEs were to cease to consider MIC an eligible mortgage insurer and, therefore, cease accepting our mortgage insurance products, our consolidated financial condition and results of operations would be significantly harmed.
A downgrade of our senior unsecured debt ratings could increase our borrowing costs and, therefore, adversely affect our liquidity.
Our senior unsecured debt is rated “CCC+” by S&P and “Caa2” by Moody’s. Our access to external sources of financing, as well as the cost of financing, is dependent on various factors and would be adversely affected by continued deterioration of our unsecured debt ratings. Debt ratings are influenced by a number of factors, including, but not limited to: financial leverage on an absolute basis or relative to peers, the composition of the balance sheet and/or capital structure, material changes in earning trends and volatility, inability to dividend monies from subsidiaries, our competitive position, and the rating agencies’ views on the future earnings prospects of our insurance subsidiaries and the mortgage insurance industry. Sustained deterioration in any one
51
Table of Contents
or a combination of these factors, including our weak financial results and continued weak earnings performance, could result in additional downgrades of our debt ratings, thus increasing the cost of and/or limiting the availability of unsecured financing. Placement of our senior unsecured debt ratings on credit watch by the rating agencies increases the risk that our debt ratings may be downgraded again in the near future. As discussed above, if we cannot obtain adequate capital on favorable terms or at all, our business, operating results and financial condition would be adversely affected.
As a result of significant volatility and uncertainty in the market, we impaired the value of certain securities held in our investment portfolio and there is a risk that additional impairments may occur in the future.
In 2009, we determined that certain preferred securities held in our U.S. investment portfolio were “other-than-temporarily” impaired and incurred a $10.6 million loss related to the impairment. Changing and unprecedented market conditions have materially impacted and could continue to materially impact the valuation of investment securities in our investment portfolios, which may cause us to impair in the future some portion of the preferred and other securities remaining in our portfolio. Any decision to impair securities held in our investment portfolio would be based on our assessment of, among other things, recent credit downgrades of the applicable security or the issuer by the rating agencies; the severity and nature of the decline in market value below cost regardless of the duration of the decline, the financial condition of the applicable issuer, whether scheduled interest payments are past due and whether we have the ability and intent to hold the security for a sufficient period of time to allow for anticipated recoveries in fair value. Future reductions to the value of our investment securities on an other-than-temporary basis could have a material adverse effect on our results of operations and financial condition. In addition, future reductions to the value of our investment portfolios would negatively affect our capital, which could cause MIC’s excess minimum policyholders’ position to decline and its risk-to-capital ratio to increase and further constrain our ability to write new insurance. See Unless we raise substantial additional capital or achieve significant capital relief in the first quarter of 2010, MIC will fail to meet various capital adequacy requirements and could be required to cease writing new business and could be subject to the terms of its runoff support agreement with Allstate, above.
| B. | Risks Relating to Risk Management and Loss Reserving |
Past rescission activity has materially reduced our loss reserve estimates, and our loss reserves will increase if we are required to reverse rescissions beyond expected levels or future rescission activity is lower than projected.
In recent years, mortgage insurers, including PMI, have been involved in litigation with policyholders regarding the rescission of mortgage insurance coverage on individual loans under the terms of the insurers’ master policies where the mortgage insurers discovered misrepresentations by, for example, a borrower, lender or an agent of the lender. Based on PMI’s recent investigations and industry and other data, we believe that there were unexpectedly and significantly high levels of mortgage origination fraud and decreases in the quality of mortgage origination underwriting primarily in 2006 and 2007. We believe that mortgage investors are requiring significantly higher levels of mortgage repurchases by mortgage originators as a result of the unexpectedly high levels of fraudulent, negligent or otherwise noncompliant mortgage loan origination. As a result, PMI is reviewing and investigating a larger volume of insured loans and the number of loans on which coverage has been rescinded by PMI has substantially increased. Between December 31, 2008 and December 31, 2009, we have rescinded loans (including primary and pool) with an aggregate risk in force of approximately $643 million.
As a result of these rescissions, we have reduced our loss reserves and/or risk in force for the corresponding policies. When PMI rescinds insurance coverage with respect to an investigated loan, we notify the insured of the rescission, refund all premiums associated with the insured loan, and remove the rescinded loan from our calculation of PMI’s risk in force and insurance in force. In addition, if the rescinded loan was delinquent, we cease to include that loan in our default inventory and, therefore, do not incorporate that loan into our loss reserve estimates. Accordingly, past rescission activity has materially reduced our loss reserve estimates. In arriving at our loss reserve estimates, we also consider the effect of projected future rescission activity with
52
Table of Contents
respect to the current inventory of delinquent insured loans. As we expect rescission activity to remain elevated through 2010, projected future rescission activity is also materially reducing our current loss reserve estimates. To the extent that we are required to reverse rescissions beyond expected levels or actual future rescission activity is lower than projected, we would be required to increase our loss reserves in future periods. If we are unsuccessful in defending these rescissions, we would need to re-establish loss reserves for, and reassume the risk on, such rescinded loans, which could materially harm our results of operations.
In some cases, our servicing customers do not produce documents necessary to perfect the claim. Most often, this is the result of the servicer’s inability to provide the loan origination file for our review. If, after repeated requests by PMI, the loan file is not produced, the claim will be denied. In our loss reserve estimation process, we do not include claim denials in our delinquent inventory and, therefore, do not incorporate them into our loss reserve estimates. Levels of claim denials have increased in 2008 and 2009. Between December 31, 2008 and December 31, 2009, we had claim denials (including primary and pool) with an aggregate risk in force of approximately $422 million. If our servicing customers ultimately produce a loan origination file on such loans, PMI may, under certain circumstances, review the file for potential claim payment. Our loss reserve estimation process takes into consideration this possibility, which historically has occurred infrequently. There can be no assurance, however, that the frequency will not increase in the future or that our loss reserve estimates adequately provide for such occurrences.
We establish loss reserves with respect to our mortgage insurance policies only upon loan defaults; accordingly, our loss reserve estimates are not intended to be an estimate of future losses.
The establishment of loss reserves with respect to our mortgage insurance business is subject to inherent uncertainty and requires significant estimates and judgment by management, principally with respect to the rate and severity of claims. In accordance with mortgage insurance industry practice, we establish loss reserves for our mortgage insurance subsidiaries only for loans in default. We establish reserves for losses and loss adjustment expenses, or LAE, based upon our estimate of unpaid losses and LAE on (i) reported mortgage loans in default and (ii) estimated defaults incurred but not yet reported to us by servicers. Accordingly loss reserves are not intended to be an estimate of total future losses, and our mortgage insurance reserving process does not take account of the impact of future losses that could occur from loans that are not in default. Because of this, our actual future losses on our insured book of business (including both current and delinquent loans) will substantially exceed the loss reserve estimates we have established on loans in default, and future notices of default on insured loans will have a material impact on our financial results.
Loss reserve estimates are particularly uncertain during an economic downturn, which is characterized by market volatility and disruption. The continuing adverse economic and market conditions, including the high rate of unemployment, and resulting uncertainty with respect to the rate and severity of claims may result in substantial increases in loss reserves in the future. Additional increases in loss reserves would negatively affect our consolidated financial condition and results of operations. In addition, when establishing loss reserves, we rely on models that have been developed internally and by third parties to analyze and predict estimated losses relating to our current inventory of loans in default. Flaws in these models and/or in assumptions used by these models could lead to insufficient loss reserving, which could increase our ultimate losses in the future.
Due to higher losses, we may be required to record a premium deficiency reserve in the future.
We perform premium deficiency analyses quarterly on a single book basis for the U.S. Mortgage Insurance Operations using assumptions based on our best estimates when the analyses are performed. The calculation for premium deficiency, which is the present value of expected future losses and expenses to the extent they exceed the present value of expected future premium, requires significant judgment and includes estimates of future expected premiums, expected claims, loss adjustment expenses and maintenance costs as of the date of the test. The calculation of future expected premiums uses assumptions for persistency and termination levels on policies currently in force. Assumptions for future expected losses include future expected average claim sizes and claim rates which are based on the current default rate and expected future defaults.
53
Table of Contents
A premium deficiency analysis was performed on a U.S. GAAP basis, as of December 31, 2009, and we determined there was no premium deficiency in our U.S. Mortgage Insurance Operations segment despite continued significant losses in 2009. Because this premium deficiency calculation required significant judgment and estimation, to the extent actual losses are higher or actual premiums are lower than the assumptions we used in our analysis, we could be required to record a premium deficiency reserve in future reporting periods, which could indirectly trigger an event of default under our credit facility and would negatively affect our financial condition and results of operations.
Our underwriting and risk management policies and practices may not anticipate all risks and/or the magnitude of potential for loss as the result of unforeseen risks.
We have established underwriting and risk management policies and practices which seek to mitigate our exposure to borrower default risk in our insured portfolio by anticipating future risks and the magnitude of those risks. PMI has experienced and is continuing to experience material losses. The ultimate losses we incur are uncertain and will depend largely on general economic conditions, including rates of unemployment and home prices. Over the past several years, PMI has made significant changes to its underwriting and risk management policies, which have limited the types of new business PMI writes. Given the uncertainties caused by the sustained deterioration of the U.S. economy and, to the extent that a risk is unforeseen or is underestimated in terms of magnitude of loss, these policies and practices will not completely insulate us from the effects of those risks. We expect that we will continue to experience material incurred and paid losses on insurance written prior to 2009.
| C. | U.S. Mortgage Insurance Operations |
Current market volatility combined with falling home prices and rising unemployment have materially and adversely affected our business and results of operations, and we do not expect these conditions to improve in the near future.
Through our main operating businesses, we are exposed to the risk that borrowers will default on residential mortgage loans we have insured. The current economic downturn, characterized by deteriorating and volatile credit and capital markets, falling home prices and higher unemployment, has significantly increased the likelihood of borrowers defaulting on their mortgage loans and increased defaults and claims. As a result, we have incurred higher losses, and the amount of new insurance written has declined. We expect that the economic downturn will continue and will continue to materially affect our results of operations and financial condition.
As discussed in the MD& A, we significantly increased PMI’s loss reserves in 2009 as a result of the increase in PMI’s default inventory, higher claim rates, higher average claim sizes and worsened severity, which is the ratio of the claim paid to the original risk-in-force relating to the loan. Higher claim rates were driven in part by home price declines and the diminished availability of certain loan products, both of which constrain refinancing opportunities and decrease the cure rate. The increase in PMI’s average claim size was driven by higher average loan sizes and coverage levels in PMI’s portfolio, as well as declines in home prices, which limit PMI’s loss mitigation opportunities. We had significant losses in 2009 and we expect losses to continue in 2010 as a result of the continued severe economic downturn.
In addition, continuing adverse market conditions have adversely affected the business of CMG MI. Under the terms of a capital support agreement, MIC has an obligation, under specified conditions, to maintain CMG MI’s risk-to-capital ratio at or below 19.0 to 1. CMG MI’s risk-to-capital ratio as of December 31, 2009 was 17.2 to 1, and there is a risk that MIC would be required to make contributions to CMG MI if its risk-to-capital ratio increases. See—Capital and Liquidity Constraints and Item 1(D)(1)(c). Business—U.S. Mortgage Insurance Operations—Products—Joint Venture—CMG Mortgage Insurance Company.
54
Table of Contents
If the role of the GSEs in the U.S. housing market is changed, or if the GSEs change other policies or practices, the amount of insurance that PMI writes could further decrease, which could result in a decrease of our future revenue.
The GSEs are the beneficiaries of a significant portion of the insurance policies we issue as a result of their purchases, statutorily required or otherwise, of qualifying mortgage loans from lenders or investors. Accordingly, changes in the following or other GSE policies and practices with respect to mortgage credit enhancement could significantly affect our business:
| • | level of private mortgage insurance coverage lenders may select when private mortgage insurance is used as the required credit enhancement on low down payment mortgages; |
| • | amount of loan level delivery fees that the GSEs assess on loans that require mortgage insurance; |
| • | loan eligibility standards for loans purchased by the GSEs, which impact the conforming mortgage loan origination market, including loan quality and availability; |
| • | terms on which mortgage insurance coverage can be canceled before reaching the cancellation thresholds established by law; |
| • | whether the GSEs influence mortgage lenders’ selection of mortgage insurers providing coverage; and |
| • | GSE loss mitigation programs on insured mortgages and the circumstances in which mortgage servicers must implement such programs. |
In the past, the GSEs have had programs under which for certain loans lenders could choose a mortgage insurance coverage percentage that was the minimum required by the GSEs’ charters, or “charter coverage”, rather than a higher, or “standard coverage”, with the GSEs paying a lower price for loans with charter coverage. The GSEs also have had programs known as “reduced coverage”, under which on certain loans lenders could choose a coverage level that was higher than charter coverage but lower than standard coverage. PMI charges lower premium rates for charter or reduced coverage commensurate with the reduced risk. Effective January 1, 2010, Fannie Mae began giving lenders the option of selecting charter coverage on a broader array of loans and eliminated reduced coverage altogether. As the new program has only recently commenced, we cannot predict how frequently lenders will select charter coverage rather than standard coverage on loans PMI insures after January 1, 2010, and the effect of the program changes on PMI’s business is difficult to quantify.
The placement of the GSEs into the conservatorship of the Federal Housing Finance Agency increases the likelihood that the U.S. Congress will examine the role and purpose of the GSEs in the U.S. housing market and potentially propose certain structural and other changes to the GSEs. New federal legislation or programs could reduce the level of, or eliminate entirely, the purchase of private mortgage insurance by the GSEs, or fundamentally change the manner in which the GSEs utilize credit enhancement. The Obama administration has indicated that it will outline broad principles regarding the future of the GSEs in 2010 but does not expect to submit a full legislative proposal until 2011. Both Fannie Mae and Freddie Mac are currently considering revisions to their eligibility guidelines that involve greater limitations and restrictions on mortgage insurers. Changes in the GSEs’ practices could have a material adverse effect on our business, harm our ability to compete and reduce the profitability of the mortgage insurance business generally and our business in particular. See also, The exercise of certain rights reserved by the GSEs under eligibility requirements for mortgage insurers could harm our profitability and reduce our operational flexibility, above.
Our revenues and profits could decline if PMI loses market share as a result of actions we have taken to limit new insurance written, increased industry competition and mortgage lenders and investors selecting alternatives to private mortgage insurance.
The principal sources of PMI’s competition include other private mortgage insurers, several of which are wholly-owned subsidiaries of public companies with direct or indirect capital reserves that provide them with potentially greater resources than we have, as well as the various alternatives to private mortgage insurance discussed below.
55
Table of Contents
We believe that certain of the changes that we made during 2008 and 2009 in order to conserve capital, including our underwriting guideline changes and reducing or ceasing new insurance written with certain of our customers, have made it more difficult to compete among private mortgage insurers as we seek to write new business. Other changes we have made and actions we have taken, such as the termination of our contract underwriting operations in 2009, also have negatively impacted our relationships with certain of our current and former customers and may impact our ability to maintain or gain market share. In addition, as a result of the increase in rescission activity discussed in We are subject to heightened litigation risk related to the increase in rescissions, we are experiencing an increase in the number of disagreements with mortgage lenders, commercial banks and other mortgage originators who are our customers and are engaged in litigation. Such disagreements or litigation, even if resolved in our favor, may adversely affect our business relationships with these customers. As a result of these and other factors, we may be unable to write new business at desired levels, even taking into account current capital constraints, and may be unable to fully increase levels of activity in the event we obtain additional capital or capital relief and/or market conditions otherwise improve. In addition, we believe that the difficult conditions and resulting capital constraints facing mortgage insurers have provided opportunities for new entrants in the private mortgage insurance industry, and we expect that we may face increased competition from new competitors. One new private mortgage insurer, Essent US Holdings, Inc., announced that it secured equity funding, purchased an information technology and operating platform from Triad Guaranty Inc., a mortgage insurer in runoff, obtained licenses in 45 states, anticipates obtaining licenses in all states in 2010, and is approved as a qualified mortgage insurer by the GSEs.
Tighter underwriting guidelines adopted industry-wide by private mortgage insurers and capital constraints in the mortgage insurance industry generally have resulted in greater demand for mortgage insurance from the FHA. As a result of federal legislation providing the FHA with greater competitive flexibility and increasing the maximum loan amount that the FHA may insure, the FHA has substantially increased its market share since early 2008 and is a significant competitor of ours. In addition, any current or new alternatives to private mortgage insurance that may develop could further reduce the market opportunities for private mortgage insurers and result in further increased competition, any of which could negatively impact our financial condition and results of operations.
Given the recent changes in industry conditions, we believe that the private mortgage insurance market has significantly contracted, and we not only face increased competition from existing and new private mortgage insurers, including the FHA and VA, but also from other sources, including the following:
| • | the GSEs pursuing arrangements that meet their charter requirement for buying loans with LTVs over 80% that do not involve the use of mortgage insurance; |
| • | lenders and investors holding mortgages in their portfolios and self-insuring; and |
| • | mortgage lenders maintaining lender recourse or participation with respect to loans sold to the GSEs. |
Any failure of PMI to effectively compete could adversely affect our financial condition and results of operations.
A decrease in the volume of low down-payment home mortgage originations would cause our revenues to decline.
Our future revenues also depend on the volume of low down payment home mortgage originations. A decline in the volume of low down payment mortgage originations would reduce the demand for private mortgage insurance and, consequently, our revenues. The volume of low down payment mortgage originations is affected by, among other factors:
| • | general economic conditions, including access to credit markets, unemployment rates, interest rates and home prices; |
| • | government policies, including government housing policies encouraging homeownership, federal and state economic stimulus programs and policies, and GSE and lender-specific policies; and |
56
Table of Contents
| • | the availability of mortgage insurance for high LTV loans, which is affected by, among other things, general economic conditions, secondary market demand, government housing policy and capital constraints facing mortgage insurers. |
A decline in the volume of low down payment mortgage originations would reduce the demand for mortgage insurance products such as the ones we offer and could in turn have an adverse effect on our results of operations and financial condition.
Our business and financial performance could suffer if PMI were to lose the business of a major customer.
PMI’s top ten customers generated 56.9% of its premiums earned in 2009. Earned premiums from Fannie Mae exceeded 8% of our consolidated revenues and represented 10.2% of PMI’s earned premiums in 2009. The loss of a significant customer for any reason could reduce our revenue and, if not replaced, harm our consolidated financial condition and results of operations.
The premiums we charge for mortgage insurance on insured loans and the associated investment income may not be adequate to compensate for future losses from these loans.
We charge premium rates in effect at the time a policy is issued based upon our expectations regarding likely performance over the life of insurance coverage. We generally cannot cancel mortgage insurance coverage or adjust renewal premiums during the life of a mortgage insurance policy. As a result, losses from higher than anticipated claims generally cannot be offset by premium increases on policies in force or mitigated by non-renewal or cancellation of insurance coverage. The premiums we charge on our insurance in force and the associated investment income may not be adequate to compensate us for the risks and costs associated with the insurance coverage provided to customers. An increase in the number or size of unanticipated claims could adversely affect our consolidated financial condition and results of operations.
PMI’s primary new insurance written and risk in force includes:
| • | Loans with LTVs exceeding 97%, known as Above-97s. As of December 31, 2009, 20.4% of PMI’s primary risk in force consisted of Above-97s. We no longer intend to insure loans with LTVs exceeding 95%. |
| • | ARMs. As of December 31, 2009, 7.5% of PMI’s primary risk in force consisted of ARMs, excluding 2/28 Hybrid ARMs. |
| • | 2/28 Hybrid ARMs. As of December 31, 2009, 1.8% of PMI’s primary risk in force consisted of 2/28 Hybrid ARMs through PMI’s structured finance channel. |
| • | Alt-A loans. As of December 31, 2009, 17.0% of PMI’s primary risk in force consisted of Alt-A loans. In June , 2008, we eliminated Alt-A loan eligibility altogether. |
| • | Interest only loans. As of December 31, 2009, 10.9% of PMI’s primary risk in force consisted of interest only loans. |
| • | Payment option ARMs. As of December 31, 2009, approximately 3.1% of PMI’s primary risk in force consisted of payment option ARMs. In April 2008, we eliminated future coverage of negatively-amortizing ARM products. |
| • | Less-than-A quality mortgage loans. As of December 31, 2009, 6.8% of PMI’s primary risk in force consisted of less-than-A quality loans. |
We also insure loans that have more than one of the above risk characteristics. As of December 31, 2009, approximately 2.4% of PMI’s primary risk in force consisted of Above-97s that are less-than-A quality loans, approximately 2.4% of PMI’s primary risk in force consisted of Alt-A loans that are also Above-97s and approximately 3.1% of PMI’s primary risk in force consisted of interest only loans that are also Above-97s. This “layering” of risk has increased the risk of borrower default. A material portion of these loans were written in 2005 through the first quarter of 2008.
57
Table of Contents
Even in stable economic times, we expect higher default and claim rates for high-LTV, ARM, 2/28 Hybrid ARM, Alt-A, interest only, payment option ARM, and less-than-A quality loans, as well as loans with “layered” risk. Although we attempt to incorporate the higher default and claim rates associated with these loans into our underwriting and pricing models, there can be no assurance that the premiums earned and the associated investment income will prove adequate to compensate for future losses from these loans. Worsening economic conditions, rising unemployment rates and/or additional house price declines could even more significantly increase the default risks associated with these loans. In addition, these same negative economic and market conditions could also significantly increase the default and claim risk on loans for which we did not assume higher default and claim rates.
PMI’s loss experience may increase as its policies continue to age.
Generally, we expect the majority of losses and LAE on insured loans in PMI’s current portfolio to occur during the second through the fourth years after loan origination. 58.8% of PMI’s primary risk in force as of December 31, 2009 is on insurance written from the period of January 1, 2006 through December 31, 2008. Accordingly, a significant percentage of the primary portfolio is in, or approaching, its peak claim years. In addition, PMI has experienced adverse and accelerated delinquency development in the 2005, 2006 and 2007 insured loan portfolios. We believe our loss experience will continue as these policies age. If the claim frequency on PMI’s risk in force significantly exceeds the claim frequency that was assumed in setting premium rates, our consolidated financial condition and results of operations would be harmed.
The extent to which loan modification and other similar programs provide benefit to PMI is uncertain.
In order to reduce foreclosures, the federal government, including through the FDIC and the GSEs, and some lenders have adopted programs to modify residential mortgage loans to make them more affordable to borrowers. Under the HARP refinance program discussed above in Item 1(D)(1)(a). Business—U.S. Mortgage Insurance Operations—Products—Primary Mortgage Insurance—Primary Flow Channel, certain borrowers have the opportunity to refinance into loans with lower interest rates.
Under the HAMP Program certain borrowers whose loans are delinquent may modify their loans if and so long as they strictly adhere to their trial modification plans during a 90 to 150 days trial period in order to complete the modification process. As of December 31, 2009, 23,180 delinquent loans in our default inventory were subject to HAMP trial periods compared to approximately 12,700 loans at September 30, 2009. We do not remove from our default inventory a loan subject to a HAMP trial modification period unless and until the trial period is completed, all required documents have been received, the loan modification is closed, and the default is officially cured. Under HAMP, a net present value test (the “NPV Test”) is used to determine if loan modifications will be offered. For loans owned or guaranteed by the GSEs, servicers may, depending on the results of the NPV Test and other factors, be required to offer loan modifications, as defined by HAMP, to borrowers. As of December 1, 2009, the GSEs changed how the NPV Test is used. These changes made it more difficult for some loans to be modified under HAMP. While we lack sufficient data to determine the impact of these changes, we believe that they may decrease the number of our loans that will participate in HAMP.
These programs are in their early stages and are continuing to be developed, changed and refined. The effect of these programs on PMI depends, among other things, on the number of loans in PMI’s portfolio that will ultimately qualify for modification and officially cure and the re-default rate of the loans that ultimately are modified. Our estimates of the number of loans that may qualify for modification programs are inherently uncertain. Because re-default rates can be affected by a number of factors (including changes in home values and unemployment rates), we cannot predict what the ultimate re-default rate will be. Accordingly, we cannot be certain what the benefits of these programs will be for PMI or whether these programs will provide material benefits to PMI.
58
Table of Contents
Geographic concentration of PMI’s primary insurance in force could continue to increase losses and harm our financial performance.
We are affected by economic downturns and other events in specific regions of the United States where a large portion of our U.S. business is concentrated. As of December 31, 2009, 10.1% of PMI’s primary risk in force was located in Florida and 7.7% was located in California. We are currently experiencing higher levels of losses in those states. In addition, as of December 31, 2009, 21.1% of our primary risk-in-force related to loans located in Illinois, Georgia, New Jersey, New York and Ohio. Collectively these states experienced higher default rates in 2009 than other states in the U.S. as a result of relatively weak economic activity, higher unemployment rates and declines in home prices. We expect that our loss experience with respect to risk-in-force in these states will remain elevated in the near future, which could continue to adversely affect our results of operations and financial position.
We delegate underwriting authority to mortgage lenders which could cause us to insure mortgage loans that do not conform to our underwriting guidelines, and thereby increase claims and losses.
More than 86% of PMI’s flow new insurance written is underwritten pursuant to a delegated underwriting program under which, subject to periodic audit, certain mortgage lenders may determine whether mortgage loans meet our program guidelines and commit us to issue mortgage insurance. If PMI determines that a lender participating in the delegated program commits PMI to insure a loan that fails to meet all of the approved underwriting guidelines, subject to certain exceptions, PMI has the right to exclude or rescind coverage on the loan. PMI may also suspend or terminate the insured’s delegated authority to extend coverage to new loans if it determines that the insured has not been complying with approved underwriting guidelines. In 2008 and 2009, as a result of significant variance from our quality control standards, we terminated the right of certain customers to participate in the delegated program. Because PMI does not review the underwriting determinations on all loans, claims may be paid on certain loans with unacceptable risk profiles or which failed to meet approved underwriting guidelines at the time of origination. In addition, certain customers who fail to comply with approved underwriting guidelines may go undetected and continue to submit noncompliant loans under their delegated authority.
Higher persistency rates in our U.S. Mortgage Insurance Operations place additional constraints on capital, making it more difficult to write new business.
As discussed in Item 1(D)(5). Business—U.S. Mortgage Insurance Operations—Business Composition—Persistency, PMI’s persistency rate has increased in recent years, rising to 84.3% in 2009 from 82.2% and 75.5% in 2008 and 2007, respectively. PMI’s persistency rate has been positively impacted by lower borrower refinance activity of PMI insured loans, primarily as a result of declining home prices and the diminished availability of loan products. To the extent that home prices continue to decline and residential mortgage refinance activity in the insured loan market remains relatively low, we expect that PMI’s persistency rate will remain high and therefore limit the rate at which PMI’s existing risk in force runs off. Because PMI must maintain sufficient capital to satisfy regulatory risk-to-capital metrics, higher persistency rates, even though they create relatively higher revenues, may constrain PMI’s capital position and its ability to write new business, which may adversely impact our future revenues and results of operations.
We reinsure a portion of our mortgage insurance default risk with lender-affiliated captive reinsurance companies, which reduces our net premiums written and earned.
Mortgage insurers, including PMI, offer products to lenders that are designed to allow them to participate in the risks and rewards of the mortgage insurance business. Many of the major mortgage lenders have established affiliated captive reinsurance companies. These captive reinsurance companies assume a portion of the risks associated with the lender’s insured mortgage loans in exchange for a percentage of the associated gross premiums. Because the GSEs currently prohibit cessions of gross risk or gross premium cedes greater than 25% to captive reinsurers and PMI ceased seeking excess-of-loss (XOL) captive reinsurance arrangements, we expect
59
Table of Contents
the portion of our new primary insurance business that is subject to captive arrangements to decrease. PMI did not enter into any new XOL captive reinsurance agreements in 2009. See Item 1(D)(9)(a). Business—U.S. Mortgage Insurance Operations—Reinsurance—Captive Reinsurance. PMI will continue to cede premiums under its in-force XOL contracts until they run-off and mature pursuant to the existing terms and conditions, and as a result, captive reinsurance agreements will continue to negatively impact our net premiums written and earned.
If we are unable to keep pace with the technological demands of our customers or with the technology-related products and services offered by our competitors, our business and financial performance could be significantly harmed.
Participants in the mortgage lending and mortgage insurance industries rely on e-commerce and other technology to provide and expand their products and services. Our customers generally require that we provide our products and services electronically via the Internet or electronic data transmission, and we process the significant majority of our new insurance written and claims processing electronically. We expect this to continue, and accordingly, we believe that it is essential that we continue to invest resources in maintaining electronic connectivity with our customers and, more generally, in e-commerce and technology. Because of capital constraints, we may reduce costs by, among other things, decreasing the level of resources devoted to e-commerce and technology upgrades. Our business may suffer if we do not keep pace with the technological demands of our customers and the technological capabilities of our competitors.
| D. | Regulatory and Litigation Risk |
We are subject to heightened litigation risk related to the increase in rescissions.
We believe the rise in the numbers of rescissions heightens the risk of litigation concerning our rescission decisions. As we continue to review our insured loan portfolios, we will likely rescind more insurance policies in the future. The rise in the numbers of rescissions has resulted in lenders and policyholders increasingly challenging our specific rescissions of coverage on individual loans and our general right to rescind coverage under the terms and conditions of PMI’s master policies. Part I. Item 3. Legal Proceedings, below, discusses certain rescission-related litigation in which PMI is currently involved. In addition to the litigation discussed in that section, we are discussing with certain policyholders their objections to PMI’s rescissions of large groups of loans that in the aggregate are material, and as a result, we expect that PMI will engage in litigation or other dispute resolution proceedings related to some portion of these challenged rescissions if we are unable to resolve them informally. Addressing such disputes through litigation or otherwise is likely to be costly even if we are ultimately successful in defending against such claims. As discussed in We establish loss reserves with respect to our mortgage insurance policies only upon loan defaults; accordingly, our loss reserve estimates are not intended to be an estimate of future losses above, if we are not successful in defending these rescissions, we would need to re-establish loss reserves for, and re-assume the risk on, such rescinded loans, which could materially harm our financial condition and results of operations.
The U.S. mortgage insurance industry and PMI are subject to litigation risk generally.
The mortgage insurance industry and PMI face litigation risk in the ordinary course of operations, including the risk of class action lawsuits. Consumers are bringing a growing number of lawsuits against home mortgage lenders and settlement service providers. Mortgage insurers, including PMI, have been involved in litigation alleging violations of RESPA and FCRA. In the past, a number of lawsuits have challenged the actions of private mortgage insurers, including PMI, under RESPA, alleging that the insurers have provided products or services at improperly reduced prices in return for the referral of mortgage insurance. RESPA precludes PMI from providing services or products to mortgage lenders free of charge, charging fees for services that are lower than their reasonable or fair market value, and paying fees for services that others provide that are higher than their reasonable or fair market value, in exchange for the referral of settlement services.
60
Table of Contents
Litigation relating to capital markets transactions and securities-related matters in general has increased and is expected to continue to increase as a result of the deterioration of the capital, credit, housing and mortgage markets. In March 2008, we and certain of our executive officers were named in securities class action complaints filed in the United States District Court for the Northern District of California. In April 2008, we and certain of our executive officers and directors were named in two shareholder derivative suits. Both of the derivative suits assert various acts and/or omissions against the defendants. The status of these litigation matters is described below in Item 3. Legal Proceedings. We continue to believe that we have meritorious defenses to these lawsuits and intend to defend ourselves vigorously.
We cannot predict whether additional actions of the types described herein, or other actions, will be brought against us or other mortgage insurers in the future. Any such proceedings could have an adverse effect on our consolidated financial position, results of operations or cash flows.
The U.S. mortgage insurance industry and PMI are subject to regulatory risk and have been subject to increased scrutiny by insurance and other regulatory authorities.
PMI and the mortgage insurance industry are subject to comprehensive, detailed regulation by state insurance departments whose primary goal is to safeguard insurers’ solvency for the protection of policyholders. Although their scope varies, state insurance laws generally grant broad powers to supervisory agencies and officials to examine and investigate insurance companies and to enforce rules or exercise discretion touching almost every aspect of PMI’s business.
We have been subject to increased scrutiny by the Arizona Department of Insurance (the “Department”) and other state insurance regulatory authorities as a result of our substantial losses in recent periods and the decrease in our statutory capital. As discussed above in Unless we raise substantial additional capital or achieve significant capital relief in the first quarter of 2010, MIC will fail to meet various capital adequacy requirements and could be required to cease writing new business and could be subject to the terms of its runoff support agreement with Allstate, the Department notified MIC in the third quarter of 2009 of its initiation of a limited scope examination to determine, among other things, whether to exercise discretion and permit MIC to continue writing new business in the event MIC fails to maintain Arizona’s minimum policyholders’ position requirement. On February 10, 2010, MIC received a letter from the Department waiving, until December 31, 2011, the requirement that MIC maintain Arizona’s required minimum policyholders’ position to write new business. The waiver may be withdrawn by the Arizona Director of Insurance in her sole discretion at any time, if the facts and circumstances warrant such action. Accordingly, there can be no assurance as to the period during which the waiver will remain in effect. See Item 1(C). Business—Certain Regulatory and Other Issues Facing PMI. In addition, from time to time, we have discussed with certain state insurance regulators their financially hazardous condition regulations generally applicable to licensed insurance companies and those states’ interpretive positions that we are, or could be, in violation of their respective regulations. None of these states has taken any action against MIC to date. As a result of these and other potential future examinations or discussions, state insurance regulatory authorities could require us to cease writing new business or take other actions to restrict our ability to conduct business. Such regulatory actions would adversely affect our operating results.
In addition, the insurance industry has become the focus of increased scrutiny by regulatory and law enforcement authorities concerning certain practices, including captive reinsurance arrangements. MIC continues to respond to requests from the Minnesota Department of Commerce and the Office of Inspector General (“OIG”) of the U.S. Department of Housing and Urban Development (“HUD”) for information regarding its captive reinsurance arrangements among other matters. We cannot predict whether the Minnesota Department of Commerce and the HUD OIG’s administrative subpoenas will lead to further inquiries, or investigations, of these matters, or the scope, timing or outcome of any inquiry or actions by those Departments or any inquiry or actions that may be commenced by state insurance departments, attorneys general or other regulators.
61
Table of Contents
As a result of the deterioration of the housing and mortgage markets in the U.S., regulatory oversight of our insurance subsidiaries may significantly increase in the future. Increased federal or state regulatory scrutiny could lead to new legal precedents, new regulations or new practices, or regulatory actions or investigations, which could adversely affect our financial condition and results of operation.
Changes to the risk-based capital rules applicable to the GSEs could cause PMI’s business to suffer.
The FHFA, the agency which currently regulates the GSEs, has risk-based capital rules that prescribe treatment of credit enhancement issued by private mortgage insurers and provides capital guidelines for the GSEs in connection with their use of other types of credit protection counterparties in addition to mortgage insurers. The rules require the GSEs to hold different amounts of capital against mortgage insurance coverage according to the rating of the mortgage insurance company that issued the policy. See Item 1(D)(1)(a). U.S. Mortgage Insurance Operations—Products—Primary Mortgage Insurance-Primary Flow Channel. Although these rules were suspended in 2008, the FHFA, or other governmental authority, including Congress, may revisit the risk-based capital rules and the treatment of mortgage insurance at any time in the future. If the rules change or if the GSEs begin again to follow the FHFA’s risk-based capital rules, demand for our mortgage insurance products could decrease and our consolidated financial condition and results of operation could be adversely affected.
The implementation of the Basel II Capital Accord may affect the use of mortgage insurance.
The Basel II Accord establishes a risk-based capital framework that is applicable to the 10 to 12 largest banking organizations in the United States, as well as to smaller banking organizations with significant international operations. The proposal is being phased-in, and is not expected to be fully implemented in the United States until 2012. However, in light of the current disruption in the financial markets, it is likely that many institutions will ask for a postponement in the mandatory implementation date, and such a request may be granted at the discretion of U.S. bank regulators. In addition, since further changes in the capital framework have been suggested at the international level, the full implementation may be further delayed if significant amendments are adopted. Under the Basel II Accord as adopted in the U.S., banking organizations will determine capital requirements for mortgage loans based on their respective internal models with parameters such as the probability of default and loss given a default. We expect that mortgage insurance will be factored in these internal models and will likely provide mortgage lenders with capital relief by reducing the capital charge on mortgages, although the extent of capital relief will depend upon the particular model employed by the banking organization. We cannot predict the extent of any benefits that lenders will ultimately obtain under Basel II, or how any such benefits may affect the opportunities for growth of the mortgage insurance industry. If Basel II is implemented in a manner that does not provide sufficient capital relief to lenders using mortgage insurance, our business could be negatively impacted.
| E. | Other Risk |
If the value of the contingent note we received in connection with our sale of PMI Australia is reduced, our financial condition could suffer.
In connection with the sale of PMI Australia, MIC received approximately $746 million in cash and the QBE Note in the principal amount of approximately $187 million, with interest accruing through September 2011 when it matures and is payable. The actual amount owed under the QBE Note is subject to reduction to the extent that the sum of (i) claims paid between June 30, 2008 and June 30, 2011, with respect to PMI Australia’s policies in force at June 30, 2008, (ii) increases in reserves with respect to such policies at June 30, 2011 as compared to June 30, 2008 and (iii) projected ultimate unpaid losses in excess of such reserves as of June 30, 2011 (together, the “ultimate projected losses”) exceeds $237.6 million (50% of the unearned premium reserve of such policies at June 30, 2008). Based on the information made available to us on the performance of such PMI Australia policies through December 31, 2009, we do not currently expect that, as of December 31, 2009, ultimate projected losses with respect to such policies will exceed $237.6 million. However, we have not yet received the report with respect to the loss performance of PMI Australia’s insurance policies as of December 31, 2009, prepared by an independent actuary as of December 31, 2009. The last such actuarial report that we
62
Table of Contents
received was as of September 30, 2009. The performance of such policies will depend, among other things, on the performance of the Australian housing market and economy over the next several years and other factors that are beyond our control and difficult to predict with any degree of certainty. Accordingly, we cannot be certain that the performance of such PMI Australia policies will not deteriorate in the future or that any such deterioration will not reduce the amount due on the QBE Note. In addition, the amount payable on the QBE Note is subject to reduction in the event that MIC is required to satisfy claims for breach of warranty under the agreements entered into for the sale of PMI Australia or TPG is required to satisfy claims for breach of warranty under the agreements entered into for the sale of PMI Asia, in each case if such claims are not otherwise satisfied by April 1, 2010. QBE has not asserted any such warranty claims to date.
We cannot be sure that the amount due on the QBE Note will not be reduced. In addition, the QBE Note is an unsecured obligation of the note issuer, and we cannot be certain that the note issuer will be able to make payment on the QBE Note when due. Any of these events would impair our ability to recover the full value of the QBE Note, reduce or eliminate the lenders’ commitments under our credit facility and require us to repay the amount borrowed under our credit facility to the extent in excess of any reduced or eliminated commitments. Any such failure to recover payment in full of the QBE Note or required repayment could materially impair our liquidity. See the MD&A—Liquidity and Capital Resources—Sources and Uses of Funds—The PMI Group Liquidity—The QBE Note.
We are exposed to risk in the winding down of our European and Canadian operations.
Substantial risks remain in the winding down of our European operations as a result of the sustained adverse economic conditions in the United States and, to a lesser degree, the European Union. As a result of PMI Europe’s exposure to U.S. subprime risk under reinsurance agreements and the continued losses associated with such risk, PMI Europe incurred additional losses of $8.4 million and paid claims of $55.3 million during the year ended December 31, 2009. If the performance of these exposures continues to deteriorate, PMI Europe will continue to experience increased losses and increases to its loss reserves, which could have a material adverse effect on our results and financial condition.
Certain of PMI Europe’s CDS contracts contain collateral support provisions which, upon certain defined circumstances, including deterioration of the underlying mortgage loan performance, require PMI Europe to post collateral for the benefit of the counterparty. As of December 31, 2009, PMI Europe had posted collateral of $14.7 million on its CDS transactions. As of December 31, 2009, the maximum amount of collateral that PMI Europe may be required to post under these contracts is approximately $37.1 million, including the $14.7 million already posted. We estimate, based on expected defaults and loss payments, that the amount of additional collateral to be posted will be up to $11.4 million in the next twelve months. The actual collateral posted will depend upon performance of the underlying mortgage portfolios, claim payments and the extent to which PMI Europe is successful in commuting these contracts. PMI Europe is currently engaged in negotiations with one reinsured counterparty regarding the appropriate amounts of collateral required to be posted by PMI Europe under the terms of the applicable reinsurance agreement. If PMI Europe is required to post additional collateral, our financial condition could be negatively impacted.
As a result of changes in the fair value of its CDS contracts, PMI Europe’s financial results have been volatile. The fair value of derivative liabilities was $17.3 million and $54.5 million as of December 31, 2009 and December 31, 2008, respectively, and is included in other liabilities on the balance sheet. The fair value of these CDS liabilities includes payment obligations that have been incurred but unpaid as of the balance sheet date. The fair values of PMI Europe’s CDS contracts are affected predominantly by estimated changes in credit spreads of the underlying obligations, which are dependent on the performance of certain prime residential mortgage loans originated throughout Europe, which are the reference assets for the underlying mortgage-related securities. See Note 10, Fair Value Disclosures, to our Consolidated Financial Statements for PMI Europe’s methodology in estimating the fair value of its CDS contracts. As estimated credit spreads change, the fair values of these CDS contracts will change and the resulting gains and losses will be recorded in our operating results. In addition, with
63
Table of Contents
the adoption of Topic 820, we have incorporated our non-performance risk into the market value of our derivative assets and liabilities. Excluding our non-performance risk, the fair value of these CDS liabilities would have been $19.3 million as of December 31, 2009.
As discussed in Note 10, Fair Value Disclosures, to our Consolidated Financial Statements, in estimating the fair values of CDS contracts, PMI Europe incorporates expected life of contract dates in its internal valuation models. To the extent that credit spreads are higher than at the time of inception of the transaction, extending the expected life from the call date to the maturity date could result in PMI Europe recognizing further significant mark-to-market losses. If counterparties elect to extend PMI Europe’s CDS contracts and spreads remain at their current levels, mark-to-market losses could be material and there will be a greater likelihood of incurring higher than currently expected realized losses in the form of paid claims on the contracts.
Although we do not currently expect that the fair value portion of the CDS liability related to fluctuations in market spreads and our cost of capital will result in any cash outflows, higher than expected defaults, higher loss severities or the acceleration in the timing of claim payments would likely result in an increase in PMI’s expected discounted future net cash outflows and fair value liability, which could materially impact our results of operations.
All of the above risks could result in material losses to PMI Europe in our winding down of its operations and, if significant enough in the aggregate, could require MIC to make additional capital contributions to PMI Europe pursuant to its capital support agreements, which could harm the financial condition of MIC.
PMI Canada’s insured loan portfolio is comprised of non-conforming loans with short-term maturities, ranging from three to seven years from the loan origination date. Approximately 60% of such loans in PMI Canada’s portfolio (approximately $31 million of risk in force as of December 31, 2009) will mature in the second half of 2010. As a result of the contraction in the availability of mortgage products for non-prime borrowers in Canada, the borrowers who obtained the short-term loans in PMI Canada’s portfolio may, when their loans become due, be unable to qualify for renewal or refinancing of such loans. If a greater than expected percentage of borrowers holding short-term loans insured by PMI Canada default in 2010, PMI Canada’s losses could significantly increase in 2010 and 2011. However, we do not expect PMI Canada’s losses to be significant to our overall results of operations and financial condition.
We may not be able to realize all of our deferred tax assets and may be required to record a full or partial valuation allowance against our net deferred tax assets.
As of December 31, 2009, we had $175.6 million of net deferred tax assets. Topic 740 requires deferred tax assets to be reduced by a valuation allowance, with a corresponding charge to net income, if, based on the weight of available evidence, it is more likely than not that some portion or all of the recorded deferred tax assets will not be realized in future periods. Our management reviews the need to establish a valuation allowance against deferred tax assets on a quarterly basis, based on, among others, the severity and frequency of operating or capital losses, our capacity for the carryback or carryforward of any losses, the expected occurrence of future income or loss and available tax planning alternatives.
Due to our cumulative operating losses and the continuing economic downturn, we may not have sufficient taxable income to realize all of our deferred tax assets and have in the past recorded a valuation allowance against our deferred tax assets. As a result, we may be required to record a full or an increase to the current partial valuation allowance against our remaining net deferred tax assets, with a corresponding charge to net income, which could result in a material adverse effect on our results of operations and financial condition. See MD&A—Critical Accounting Estimates—Valuation of Deferred Tax Assets for more discussion.
64
Table of Contents
Our deferred tax assets could be significantly limited if we experience an “ownership change” as defined in Section 382 of the Internal Revenue Code.
We have significant deferred tax assets that are generally available to offset future taxable income or income tax. In the event that we experience an “ownership change” for federal income tax purposes under Internal Revenue Code Section 382 (“Section 382”), we may be restricted annually in our ability to use our tax attributes to offset future taxable income or income tax. In general, we would be deemed to have an “ownership change” under Section 382 if, immediately after any owner shift involving a 5% shareholder or any equity structure shift, the percentage of ownership by one or more 5% shareholder has increased by more than 50% over the lowest percentage of ownership of our company owned by such shareholder at any time during the three-year testing period. While the complexity of Section 382’s provisions and the limited knowledge any public company has about the ownership of its publicly-traded stock make it difficult to determine whether an ownership change has occurred, as of December 31, 2009, we do not believe that an ownership change has occurred that would restrict our ability to use our current deferred tax assets under Section 382. An ownership change could occur in the future as a result of significant trading in our stock or a significant equity offering by us, among other things. If an ownership change were to occur, our ability to use these tax credits and other tax attributes could be limited, which would have a negative impact on our financial position and results of operations.
Our common stock is subject to significant price fluctuation.
Stock prices in general, and the price of our common stock in particular, have experienced significant fluctuation over the past year. As recently as March 10, 2009, the closing price of our common stock was $0.30, 89.3% lower than the closing price of our common stock as of February 26, 2010. The market price of our common stock may continue to be subject to significant fluctuations due to general stock market conditions and change in market perception of the mortgage insurance industry, as well as a variety of other factors, including the following:
| • | our operating and financial performance and prospects; |
| • | our capital and liquidity constraints; |
| • | increases in our loss experience, including as a result of domestic and international economic recessions, declining values of homes, higher unemployment rates and tightening credit market; |
| • | our ability to raise additional capital and to repay our debts; |
| • | legislative or regulatory changes that may affect the demand and pricing for private mortgage insurance; |
| • | changes in the role of the GSEs in the U.S. housing market, or the changes in the policies or practices of the GSEs; |
| • | changes in our capital requirements; and |
| • | general financial, domestic, international, economic and other market conditions. |
The fluctuation may adversely affect the market price of our common stock and will make it more difficult for us to raise equity capital and, if we are able to raise equity capital, significantly increase dilution to our existing stockholders.
The NYSE’s quantitative continuing listing standards require any listed security to have an average closing price during any 30 consecutive trading days of not less than $1.00 per share and an average global market capitalization for any such period of not less than $25 million. Our common stock has traded below $1.00 as recently as May 2009. There is no assurance that our stock will trade above the $1.00 minimum price requirement or that we will satisfy the NYSE market capitalization requirements. If we do not satisfy any of NYSE’s continued listing standards, our common stock could be delisted from the NYSE unless we cure the deficiency during the period provided by the NYSE. If the NYSE were to delist our common stock, it is likely that the liquidity of our common stock will be substantially reduced, which could significantly reduce our stock price.
65
Table of Contents
It is unlikely we will recover our investment in FGIC.
We made a significant investment in the equity securities of FGIC (through FGIC Corporation). Our investment in FGIC Corporation is accounted for under the equity method of accounting in our consolidated financial statements. The carrying value of our investment in FGIC Corporation was zero as of December 31, 2008. FGIC has ceased writing new business in the financial guaranty industry, and we do not expect FGIC to resume writing new business in the future.
| ITEM 1B. | UNRESOLVED STAFF COMMENTS |
None.
| ITEM 2. | PROPERTIES |
We currently own approximately 200,000 square feet of office space in Walnut Creek, California for our home office. PMI leases offices throughout the United States. We conduct our international operations in leased facilities in Ireland and Italy.
| ITEM 3. | LEGAL PROCEEDINGS |
As previously disclosed, in March 2008, The PMI Group and certain of our executive officers were named in a securities class action complaint filed in the United States District Court for the Northern District of California (Lori Weinrib v. The PMI Group, Inc., L. Stephen Smith, David H. Katkov and Donald P. Lofe, Jr.). Also in March 2008, The PMI Group and the same executive officers were named in a second securities fraud class action complaint also filed in the United States District Court for the Northern District of California (Kimberly D. Holt v. The PMI Group, Inc., L. Stephen Smith, David H. Katkov and Donald P. Lofe, Jr.).
On April 17, 2008, the court issued an order consolidating the two actions for pretrial purposes. The plaintiffs filed a consolidated complaint on September 4, 2008, naming as defendants The PMI Group, Inc., L. Stephen Smith, David H. Katkov, Donald P. Lofe, Jr. and Bradley M. Shuster. On October 14, 2008, we filed a motion to dismiss the consolidated complaint.
On July 1, 2009, the Court issued an order granting our motion to dismiss the consolidated actions on the ground that the plaintiffs had not adequately pleaded the element of scienter (i.e., that the defendants acted either intentionally or with deliberate recklessness). On July 24, 2009, the plaintiffs filed a first amended complaint in the consolidated actions. On September 2, 2009, the defendants filed a motion to dismiss the amended complaint. On November 2, 2009, the Court issued an order denying the defendants’ motion to dismiss, as a result of which, the consolidated actions are no longer stayed. The consolidated actions are now in the discovery phase; and a case management conference was held on February 19, 2010, at which a trial date for the consolidated actions was set in October 2011.
In April 2008, The PMI Group and certain of our executive officers and directors were named in two shareholder derivative suits; the first, filed in the United States District Court for the Northern District of California, Case No. CV 082046 (The Port Authority of Allegheny Retirement and Disability Allowance Plan for Employees Represented by Local 85 of the Amalgamated Transit Union v. L. Stephen Smith, W. Roger Haughton, David H. Katkov, Donald P. Lofe, Jr., Mariann Byerwalter, Dr. James C. Castle, Carmine Guerro, Wayne E. Hedien, Louis G. Lower, II, Raymond L. Ocampo, Jr., John D. Roach, Kenneth T. Rosen, Steven L. Scheid, Jose H. Villarreal, Mary Lee Widener, Ronald H. Zech, and The PMI Group, Inc., Nominal Defendant), and the second suit filed in the Superior Court of the State of California, County of Contra Costa, Case No. C 08-01068 (Jorge Torres, Derivatively on Behalf of The PMI Group, Inc. v. L. Stephen Smith, Victor J. Bacigalupi, Bradley M. Shuster, Joanne M. Berkowitz, David H. Katkov, Lloyd A. Porter, Daniel L. Roberts, Thomas H. Jeter, Donald P. Lofe, Jr., Kenneth T. Rosen, John D. Roach, James C. Castle, Ronald H. Zech, Wayne E. Hedien, Mary Lee Widener, and Raymond L. Ocampo), respectively. Both of these suits assert various acts and/or omissions against the defendants. The two derivative actions were previously stayed pending
66
Table of Contents
resolution of the motion to dismiss in the consolidated securities actions. The plaintiffs in the Torres case described above have agreed to stay their action until the complaint in The Port Authority of Allegheny federal derivative action survives a motion to dismiss or is dismissed without leave to amend. The plaintiffs in The Port Authority of Allegheny case filed an amended complaint on March 1, 2010, and the defendants’ response is due by April 15, 2010.
On January 26, 2009, PMI was served with a complaint filed by Bayview Loan Servicing, LLC (“Bayview”) in California Superior Court. Bayview seeks damages and alleges in the complaint that PMI improperly rescinded mortgage insurance coverage on a group of what PMI believes to be approximately 39 loans which Bayview acquired from Alliance Bancorp. PMI filed an answer to Bayview’s complaint in March 2009. Both parties reported to the court in connection with a required case management conference statement filed in early June, 2009 that they would be willing to engage in mediation as a form of alternative dispute resolution. To date, PMI has responded to initial written discovery from Bayview and has served Bayview with written discovery.
The rise in the numbers of rescissions has resulted in lenders and policyholders increasingly challenging the factual basis of rescissions of coverage on individual loans and our general right to rescind coverage under the terms and conditions of PMI’s master policies, which could potentially impact a significant number of rescinded loans. As a result, we expect that PMI will engage in litigation or other dispute resolution proceedings related to some portion of these challenged rescissions if we are unable to resolve them informally. Such litigation or other dispute resolution proceedings is likely to be costly even if we are ultimately successful in defending against such claims. Moreover, if we are unsuccessful in defending these claims, we would need to re-establish loss reserves for, and reassume the risk on, such rescinded loans, which would negatively impact our statutory capital and could materially harm our results of operations. See Item 1A. Risk Factors—We are subject to heightened litigation risk related to the increase of rescissions, above.
67
Table of Contents
EXECUTIVE OFFICERS OF THE REGISTRANT
Set forth below is certain information regarding our executive officers as of February 26, 2010.
L. STEPHEN SMITH, 60, has served as Chairman of the Board of The PMI Group, Inc. since May 2007, and has been one of our directors since February 2002. He has been the Chief Executive Officer since June 1, 2006, and President and Chief Operating Officer since September 1998, of The PMI Group, Inc. He has served as Chief Executive Officer of PMI Mortgage Insurance Co. (“PMI”) since January 2004. He was President and Chief Operating Officer of PMI from September 1998 to June 2006. He was elected Executive Vice President of Marketing and Field Operations of PMI in May 1994 and elected to the same positions with The PMI Group, Inc. in January 1995, serving in such capacities until September 1998. Prior thereto, he held various executive positions with the Company. Mr. Smith joined The PMI Group, Inc. in 1979. He has served as President of the Mortgage Insurance Companies of America, and as a member of the Boards of Directors of National Association of Hispanic Real Estate Professionals and the Contra Costa Council. Mr. Smith currently serves on the Board of Directors of the Bay Area Council and is a member of the Financial Services Roundtable and the National Association of Home Builders Roundtable.
JOANNE BERKOWITZ, 49, has been Executive Vice President—Chief Insurance Operations Officer of The PMI Group, Inc. since November 2008. From January 2008 to November 2008, Ms. Berkowitz served as Executive Vice President—Risk Management and Operations, and from October 2005 to January 2008, she served as Executive Vice President—Chief Enterprise Risk Officer for The PMI Group, Inc. She served as Senior Vice President—Chief Risk Officer for PMI Capital Corporation from January 2004 until October 2005. Ms. Berkowitz joined the PMI Group in 1983, and prior to January 2004, held various risk management, underwriting and marketing positions in the field and corporate headquarters both for U.S. mortgage insurance operations and international and strategic investments with the Company.
ANDREW D. CAMERON, 44, has served The PMI Group, Inc. as Executive Vice President since August 2009, and as General Counsel and Secretary since July 2008. He served as Group Senior Vice President of The PMI Group, Inc. from July 2008 to August 2009. Mr. Cameron joined The PMI Group, Inc. in June 1998 and served as Senior Vice President and Deputy General Counsel from November 2006 to July 2008, and Vice President and Assistant General Counsel from June 2003 to October 2006. Prior to joining The PMI Group, Inc., Mr. Cameron was Senior Counsel in the Enforcement Division of the U.S. Securities and Exchange Commission.
DAVID H. KATKOV, 54, has served The PMI Group, Inc. as Executive Vice President since August 2001 and as Chief Business Officer since November 2008. He has also served as President of PMI Mortgage Insurance Co. (“PMI”) since June 2006. Mr. Katkov joined The PMI Group, Inc. in July 1992, and prior to August 2001, he held a variety of executive management positions in Sales, Structured Transactions, Product Development and Portfolio Management of PMI. Prior to joining The PMI Group, Inc., Mr. Katkov was a Vice President of US Bank Corporation, Minneapolis, Minnesota.
DONALD P. LOFE, JR., 53, has been Executive Vice President of The PMI Group, Inc. since January 2003, Chief Financial Officer since April 2003, and Chief Administrative Officer since November 2008. Prior to joining The PMI Group, Inc., Mr. Lofe was Senior Vice President, Corporate Finance for The CNA Financial Corporation from October 1998 until January 2003. From October 1991 until October 1998, Mr. Lofe was the partner-in-charge of the Northeast Ohio Insurance Practice, and the engagement partner for The Progressive Corporation, with the accounting firm of PricewaterhouseCoopers LLP, where he was employed for approximately 20 years. Mr. Lofe is a certified public accountant.
LLOYD A. PORTER, 49, has been Executive Vice President—Chief Risk Officer of The PMI Group, Inc. since December 2008. Mr. Porter has also served as Executive Vice President and Managing Director, International Mortgage Insurance of PMI Capital Corporation since August 2004. From February 1999 to August 2004, Mr. Porter served as Senior Vice President and Managing Director, International Markets of The PMI Group, Inc. since February 1999. Mr. Porter joined The PMI Group, Inc. in 1983 and has held a variety of positions relating to marketing, capital markets, strategy, and corporate development.
68
Table of Contents
| ITEM 5. | MARKET FOR THE REGISTRANT’S COMMON EQUITY, RELATED STOCKHOLDER MATTERS AND ISSUER PURCHASES OF EQUITY SECURITIES |
Common Stock
The PMI Group is listed on the New York Stock Exchange under the trading symbol “PMI.” As of January 29, 2010, there were approximately 98 stockholders of record.
The following table shows the high, low and closing common stock prices by quarter from the New York Stock Exchange Composite Listing for the years ended:
| 2009 | 2008 | |||||||||||||||||
| High | Low | Close | High | Low | Close | |||||||||||||
| First quarter |
$ | 2.79 | $ | 0.26 | $ | 0.62 | $ | 13.46 | $ | 4.82 | $ | 5.82 | ||||||
| Second quarter |
$ | 2.99 | $ | 0.60 | $ | 1.98 | $ | 6.53 | $ | 1.87 | $ | 1.95 | ||||||
| Third quarter |
$ | 4.96 | $ | 1.27 | $ | 4.25 | $ | 5.43 | $ | 1.20 | $ | 2.95 | ||||||
| Fourth quarter |
$ | 4.24 | $ | 1.81 | $ | 2.52 | $ | 3.36 | $ | 1.15 | $ | 1.95 | ||||||
Preferred Stock
Our Board of Directors is authorized to issue up to 5,000,000 shares of preferred stock of The PMI Group in classes or series and to fix the designations, preferences, qualifications, limitations or restrictions of any class or series with respect to the rate and nature of dividends, the price and terms and conditions on which shares may be redeemed, the amount payable in the event of voluntary or involuntary liquidation, the terms and conditions for conversion or exchange into any other class or series of the stock, voting rights, and other terms. We may issue, without the approval of the holders of common stock, preferred stock that has voting, dividend or liquidation rights superior to the common stock and which may adversely affect the rights of the holders of common stock. As of December 31, 2009, there were no shares of preferred stock of The PMI Group outstanding.
Preferred Share Purchase Rights Plan
On January 13, 1998, we adopted a Preferred Share Purchase Rights Plan, or the Rights Plan, which expired pursuant to its terms on January 25, 2009. On January 29, 2009, we terminated the Series A Junior Participating Preferred Stock, which had been reserved in connection with the Rights Plan, and reduced the authorized number of shares of such series to zero.
Payment of and Policy on Dividends
We have not declared a dividend on our common stock since 2008. We paid regular dividends on our common stock of $0.0025 per share in each of the quarters in the period from July 1, 2008 through December 31, 2008; and $0.0125 per share in each of the quarters in the period from January 1, 2008 through June 30, 2008.
We do not expect that our Board of Directors will declare a quarterly dividend for the foreseeable future. The payment of future dividends is subject to the discretion of our Board of Directors, which will consider, among other factors, our consolidated operating results, our overall financial condition and capital requirements, as well as general business conditions. In addition, The PMI Group’s credit agreement places certain limitations on our ability to pay dividends, including a per year cap of $0.01 per share, subject to an annual aggregate limit of $5 million, and a prohibition from declaring any dividend at any time MIC is prohibited from writing new mortgage insurance by any state in the U.S.
69
Table of Contents
Common Share Repurchases
We currently have approximately $100 million available under our $300 million common share repurchase program, which was authorized by the Board of Directors in February 2007 and extended in July 2007. We did not repurchase any common shares in 2008 and 2009 and do not intend to repurchase common shares in 2010.
Securities Authorized for Issuance under Equity Compensation Plans
See Part III, Item 12, below.
70
Table of Contents
Performance Graph
The following Performance Graph and related information shall not be deemed “soliciting material” or “filed” with the Securities and Exchange Commission, nor shall such information be incorporated by reference into any future filing under the Securities Act of 1933 or Securities Exchange Act of 1934, each as amended, except to the extent that The PMI Group specifically incorporates it by reference into such filing.
The Performance Graph below compares the cumulative total stockholder return for our common stock for the last five fiscal years with that of the Standard & Poor’s 500 Index, the Russell 1000 Financial Services Index and a mortgage insurance company index (“MI Index”). The MI Index consists of Radian Group, Inc. and MGIC Investment Corporation. In 2009, we removed Triad Guaranty, Inc. (“Triad”) from the MI Index because Triad ceased writing new mortgage insurance business and is no longer traded on a major exchange. The graph plots the changes in value of an initial $100 investment over the indicated time periods, assuming all dividends are reinvested quarterly. The total stockholder’s returns are not necessarily indicative of future returns.
Comparison of The PMI Group, Inc. and Benchmarks
Total Return* Index
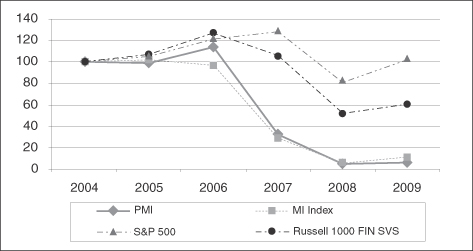
| Total Return* | Total Rate of Return** |
||||||||||||||||||||
| 12/31/04 | 12/31/05 | 12/31/06 | 12/31/07 | 12/31/08 | 12/31/09 | 12/31/09 | |||||||||||||||
| PMI |
$ | 100.00 | $ | 98.86 | $ | 114.07 | $ | 32.37 | $ | 4.80 | $ | 6.21 | (93.79 | )% | |||||||
| MI Index |
$ | 100.00 | $ | 102.22 | $ | 96.62 | $ | 28.81 | $ | 6.12 | $ | 10.97 | (89.03 | )% | |||||||
| S&P 500 |
$ | 100.00 | $ | 104.90 | $ | 121.43 | $ | 128.09 | $ | 80.77 | $ | 102.08 | 2.08 | % | |||||||
| Russell 1000 FIN SVS |
$ | 100.00 | $ | 106.75 | $ | 126.63 | $ | 105.34 | $ | 51.62 | $ | 60.58 | (39.42 | )% | |||||||
| * | Total Return = Capital Appreciation + Dividend Income for the period 12/31/04 – 12/31/09. |
| ** | Total Rate of Return = (Total Return – 100) / 100 |
71
Table of Contents
| ITEM 6. | SELECTED FINANCIAL DATA |
The following financial data should be read in conjunction with Item 7. Management’s Discussion and Analysis of Financial Condition and Results of Operations and Item 8. Financial Statements and Supplementary Data.
THE PMI GROUP, INC. AND SUBSIDIARIES
TEN-YEAR SUMMARY OF FINANCIAL DATA
| As of and for the Years Ended December 31, | ||||||||||||||||||||||||||||||||||||||||
| 2009 | 2008 | 2007 | 2006 | 2005 | 2004 | 2003 | 2002 | 2001 | 2000 | |||||||||||||||||||||||||||||||
| Summary of Consolidated Operations |
||||||||||||||||||||||||||||||||||||||||
| Net premiums written |
$ | 678,058 | $ | 768,895 | $ | 813,922 | $ | 672,871 | $ | 693,807 | $ | 620,198 | $ | 784,251 | $ | 617,255 | $ | 544,361 | $ | 498,255 | ||||||||||||||||||||
| Premiums earned |
$ | 716,841 | $ | 786,159 | $ | 815,440 | $ | 709,532 | $ | 693,821 | $ | 661,328 | $ | 611,878 | $ | 616,928 | $ | 553,619 | $ | 503,749 | ||||||||||||||||||||
| Net investment income |
119,166 | 138,377 | 132,552 | 137,794 | 132,584 | 130,391 | 123,513 | 108,034 | 111,457 | 93,953 | ||||||||||||||||||||||||||||||
| Net realized investment gains (losses) |
37,471 | (139,210 | ) | (37,309 | ) | 318 | 1,864 | 2,546 | 225 | (4,400 | ) | (5,604 | ) | 20 | ||||||||||||||||||||||||||
| Realized gain (loss) on sale of equity investment |
— | — | 12,670 | — | — | (20,420 | ) | — | — | — | — | |||||||||||||||||||||||||||||
| Change in fair value of certain debt instruments |
16,522 | 123,595 | — | — | — | — | — | — | — | — | ||||||||||||||||||||||||||||||
| Other income (loss) |
33,909 | (1,134 | ) | (168 | ) | 20,700 | 20,813 | 32,904 | 39,749 | 39,123 | 28,643 | 8,309 | ||||||||||||||||||||||||||||
| Total revenues |
923,909 | 907,787 | 923,185 | 868,344 | 849,082 | 806,749 | 775,365 | 759,685 | 688,115 | 606,031 | ||||||||||||||||||||||||||||||
| Losses and loss adjustment expenses |
1,756,755 | 1,899,264 | 1,122,898 | 266,273 | 255,283 | 236,690 | 217,241 | 150,451 | 99,553 | 95,308 | ||||||||||||||||||||||||||||||
| Amortization of deferred policy acquisition costs |
17,781 | 18,285 | 87,683 | 53,124 | 61,539 | 72,129 | 78,877 | 74,844 | 76,586 | 78,769 | ||||||||||||||||||||||||||||||
| Other underwriting and operating expenses |
155,211 | 229,522 | 192,917 | 208,787 | 183,515 | 180,273 | 158,601 | 134,303 | 122,797 | 86,666 | ||||||||||||||||||||||||||||||
| Lease abandonment and relocation costs |
— | — | — | — | — | — | — | 12,183 | — | — | ||||||||||||||||||||||||||||||
| Litigation (recovery) settlement |
— | (10,939 | ) | — | (2,839 | ) | — | (2,574 | ) | — | 12,222 | — | — | |||||||||||||||||||||||||||
| Interest expense |
43,013 | 41,007 | 33,391 | 37,930 | 31,129 | 34,552 | 20,810 | 17,648 | 13,685 | 7,656 | ||||||||||||||||||||||||||||||
| Distributions on mandatorily redeemable preferred securities |
— | — | — | — | — | — | 3,676 | 4,030 | 7,604 | 8,309 | ||||||||||||||||||||||||||||||
| Total losses and expenses |
1,972,760 | 2,177,139 | 1,436,889 | 563,275 | 531,466 | 521,070 | 479,205 | 405,681 | 320,225 | 276,708 | ||||||||||||||||||||||||||||||
| (Loss) income before equity in (losses) earnings from unconsolidated subsidiaries and income taxes |
(1,048,851 | ) | (1,269,352 | ) | (513,704 | ) | 305,069 | 317,616 | 285,679 | 296,160 | 354,004 | 367,890 | 329,323 | |||||||||||||||||||||||||||
| Equity in (losses) earnings from unconsolidated subsidiaries |
(12,019 | ) | (51,802 | ) | (741,500 | ) | 127,309 | 97,885 | 83,554 | 4,597 | 44,225 | 19,423 | 12,117 | |||||||||||||||||||||||||||
| (Losses) income from continuing operations before income taxes |
(1,060,870 | ) | (1,321,154 | ) | (1,255,204 | ) | 432,378 | 415,501 | 369,233 | 300,757 | 398,229 | 387,313 | 341,440 | |||||||||||||||||||||||||||
| Income tax (benefit) expense from continuing operations |
(406,879 | ) | (433,966 | ) | (246,522 | ) | 102,616 | 94,808 | 79,012 | 88,840 | 108,701 | 116,991 | 103,879 | |||||||||||||||||||||||||||
| (Loss) income from continuing operations after income taxes |
(653,991 | ) | (887,188 | ) | (1,008,682 | ) | 329,762 | 320,693 | 290,221 | 211,917 | 289,528 | 270,322 | 237,561 | |||||||||||||||||||||||||||
| Income from discontinued operations before income taxes |
— | 46,297 | 127,788 | 127,337 | 125,330 | 115,514 | 119,258 | 72,561 | 59,654 | 32,425 | ||||||||||||||||||||||||||||||
| Income taxes from discontinued operations |
— | 8,868 | 34,432 | 37,448 | 36,854 | 35,405 | 37,160 | 23,044 | 17,959 | 9,774 | ||||||||||||||||||||||||||||||
| Income from discontinued operations after income taxes |
— | 37,429 | 93,356 | 89,889 | 88,476 | 80,109 | 82,098 | 49,517 | 41,695 | 22,651 | ||||||||||||||||||||||||||||||
| (Loss) gain on sale of discontinued operations, net of income taxes of $5,312, $43,361 and $16,536, respectively |
(5,335 | ) | (78,749 | ) | — | — | — | 29,003 | — | — | — | — | ||||||||||||||||||||||||||||
| (Loss) income from discontinued operations, net of taxes |
(5,335 | ) | (41,320 | ) | 93,356 | 89,889 | 88,476 | 109,112 | 82,098 | 49,517 | 41,695 | 22,651 | ||||||||||||||||||||||||||||
| (Loss) income before extraordinary items and cumulative effect of a change in accounting principle |
(659,326 | ) | (928,508 | ) | (915,326 | ) | 419,651 | 409,169 | 399,333 | 294,015 | 339,045 | 312,017 | 260,212 | |||||||||||||||||||||||||||
| Extraordinary gain on write-off of negative goodwill, net of income taxes |
— | — | — | — | — | — | 5,418 | — | — | — | ||||||||||||||||||||||||||||||
| Extraordinary loss on early extinguishment of debt, net of income tax benefit |
— | — | — | — | — | — | — | — | (4,805 | ) | — | |||||||||||||||||||||||||||||
| Cumulative effect of a change in accounting principle |
— | — | — | — | — | — | — | 7,172 | — | — | ||||||||||||||||||||||||||||||
| Net (loss) income |
$ | (659,326 | ) | $ | (928,508 | ) | $ | (915,326 | ) | $ | 419,651 | $ | 409,169 | $ | 399,333 | $ | 299,433 | $ | 346,217 | $ | 307,212 | $ | 260,212 | |||||||||||||||||
| Effective tax rate for continuing operations |
(38.4 | )% | (32.8 | )% | (19.6 | )% | 23.7 | % | 22.8 | % | 21.4 | % | 29.5 | % | 27.3 | % | 30.2 | % | 30.4 | % | ||||||||||||||||||||
72
Table of Contents
THE PMI GROUP, INC. AND SUBSIDIARIES
TEN-YEAR SUMMARY OF FINANCIAL DATA—(Continued)
| As of and for the Years Ended December 31, | ||||||||||||||||||||||||||||||||||||||||
| 2009 | 2008 | 2007 | 2006 | 2005 | 2004 | 2003 | 2002 | 2001 | 2000 | |||||||||||||||||||||||||||||||
| U.S. Mortgage Insurance Operating Ratios |
||||||||||||||||||||||||||||||||||||||||
| Loss ratio |
246.6 | % | 237.7 | % | 136.9 | % | 38.2 | % | 38.1 | % | 36.8 | % | 36.2 | % | 24.5 | % | 18.1 | % | 19.0 | % | ||||||||||||||||||||
| Expense ratio (1) |
20.9 | % | 18.5 | % | 22.5 | % | 23.2 | % | 24.4 | % | 28.6 | % | 22.0 | % | 25.3 | % | 25.5 | % | 26.7 | % | ||||||||||||||||||||
| Combined ratio |
267.5 | % | 256.2 | % | 159.4 | % | 61.4 | % | 62.5 | % | 65.4 | % | 58.2 | % | 49.8 | % | 43.6 | % | 45.7 | % | ||||||||||||||||||||
| Consolidated Balance Sheet Data |
||||||||||||||||||||||||||||||||||||||||
| Total assets |
$ | 4,638,479 | $ | 4,824,399 | $ | 5,070,440 | $ | 5,317,555 | $ | 5,254,136 | $ | 5,145,967 | $ | 4,794,289 | $ | 3,517,049 | $ | 2,989,952 | $ | 2,392,657 | ||||||||||||||||||||
| Reserve for losses and loss adjustment expenses |
$ | 3,250,100 | $ | 2,709,286 | $ | 1,177,309 | $ | 384,089 | $ | 360,360 | $ | 355,058 | $ | 336,760 | $ | 316,223 | $ | 289,443 | $ | 281,704 | ||||||||||||||||||||
| Long-term debt |
$ | 389,991 | $ | 481,764 | $ | 496,593 | $ | 496,593 | $ | 819,529 | $ | 819,529 | $ | 819,543 | $ | 422,950 | $ | 422,950 | $ | 136,819 | ||||||||||||||||||||
| Mandatorily redeemable preferred securities |
$ | — | $ | — | $ | — | $ | — | $ | — | $ | — | $ | — | $ | 48,500 | $ | 48,500 | $ | 99,109 | ||||||||||||||||||||
| Shareholders’ equity |
$ | 727,087 | $ | 1,278,225 | $ | 2,512,962 | $ | 3,568,590 | $ | 3,230,790 | $ | 3,137,755 | $ | 2,784,029 | $ | 2,193,833 | $ | 1,786,688 | $ | 1,499,211 | ||||||||||||||||||||
| Return on equity (2) |
(62.6 | )% | (48.6 | )% | (25.7 | )% | 12.7 | % | 12.7 | % | 13.4 | % | 12.3 | % | 17.1 | % | 18.5 | % | 19.3 | % | ||||||||||||||||||||
| Shares Outstanding (3) (in thousands) |
||||||||||||||||||||||||||||||||||||||||
| Basic at year end |
82,580 | 81,688 | 81,120 | 86,747 | 88,713 | 94,025 | 95,162 | 89,943 | 89,163 | 88,620 | ||||||||||||||||||||||||||||||
| Basic weighted-average |
82,317 | 81,423 | 84,645 | 86,478 | 91,738 | 95,452 | 89,915 | 89,843 | 88,887 | 88,507 | ||||||||||||||||||||||||||||||
| Diluted weighted-average |
82,317 | 81,423 | 84,645 | 92,866 | 101,620 | 105,231 | 99,198 | 99,533 | 94,421 | 90,037 | ||||||||||||||||||||||||||||||
| Per Share Data (3) |
||||||||||||||||||||||||||||||||||||||||
| Book value |
$ | 8.80 | $ | 15.65 | $ | 30.98 | $ | 41.14 | $ | 36.42 | $ | 33.37 | $ | 29.26 | $ | 24.39 | $ | 20.04 | $ | 16.92 | ||||||||||||||||||||
| Basic net (loss) income |
$ | (8.01 | ) | $ | (11.40 | ) | $ | (10.81 | ) | $ | 4.85 | $ | 4.46 | $ | 4.18 | $ | 3.33 | $ | 3.85 | $ | 3.46 | $ | 2.94 | |||||||||||||||||
| Diluted net (loss) income |
$ | (8.01 | ) | $ | (11.40 | ) | $ | (10.81 | ) | $ | 4.57 | $ | 4.10 | $ | 3.87 | $ | 3.09 | $ | 3.55 | $ | 3.28 | $ | 2.89 | |||||||||||||||||
| Cash dividends declared |
$ | — | $ | 0.03 | $ | 0.21 | $ | 0.21 | $ | 0.20 | $ | 0.17 | $ | 0.13 | $ | 0.10 | $ | 0.08 | $ | 0.08 | ||||||||||||||||||||
| U.S. Mortgage Insurance Operations Operating and Statutory Data |
||||||||||||||||||||||||||||||||||||||||
| Primary new insurance written (in millions) |
$ | 8,994 | $ | 22,639 | $ | 46,133 | $ | 32,234 | $ | 35,934 | $ | 41,213 | $ | 57,301 | $ | 47,803 | $ | 46,235 | $ | 27,295 | ||||||||||||||||||||
| New insured primary loans |
41,440 | 107,455 | 234,942 | 174,432 | 205,431 | 260,641 | 381,249 | 332,234 | 335,213 | 206,493 | ||||||||||||||||||||||||||||||
| Primary insurance in force (in millions) |
$ | 113,694 | $ | 124,265 | $ | 123,623 | $ | 102,635 | $ | 101,090 | $ | 105,321 | $ | 105,241 | $ | 107,579 | $ | 109,158 | $ | 96,914 | ||||||||||||||||||||
| Primary risk in force (in millions) |
$ | 27,794 | $ | 30,605 | $ | 30,967 | $ | 25,711 | $ | 24,971 | $ | 25,505 | $ | 24,668 | $ | 25,188 | $ | 25,772 | $ | 23,559 | ||||||||||||||||||||
| Insured primary loans |
705,417 | 775,841 | 797,419 | 720,347 | 743,533 | 803,236 | 827,225 | 874,202 | 882,846 | 820,213 | ||||||||||||||||||||||||||||||
| Persistency |
84.3 | % | 82.2 | % | 75.5 | % | 69.6 | % | 61.9 | % | 60.9 | % | 44.6 | % | 56.2 | % | 62.0 | % | 80.3 | % | ||||||||||||||||||||
| Primary default rate |
21.40 | % | 14.12 | % | 7.93 | % | 5.55 | % | 5.74 | % | 4.86 | % | 4.53 | % | 4.18 | % | 2.86 | % | 2.21 | % | ||||||||||||||||||||
| Statutory capital (4) |
$ | 753,356 | $ | 1,353,261 | $ | 2,554,140 | $ | 2,922,621 | $ | 2,838,778 | $ | 2,831,437 | $ | 2,561,765 | $ | 2,192,712 | $ | 1,900,709 | $ | 1,617,519 | ||||||||||||||||||||
| Statutory risk-to-capital ratio (4) |
22.1:1 | 16.6:1 | 10.8:1 | 8.1:1 | 8.2:1 | 8.2:1 | 9.1:1 | 11.3:1 | 13.0:1 | 14.1:1 | ||||||||||||||||||||||||||||||
| (1) | Expense ratio is the ratio of underwriting expenses to net premiums written. The 2006 and 2004 expense ratios include the litigation settlement recovery. The 2003 expense ratio includes lease abandonment and relocation costs as well as the litigation settlement charge. |
| (2) | Return on equity is calculated using an average of the twelve months ending balances of shareholders’ equity for the respective calendar year. |
| (3) | Share data has been split-adjusted. In accordance with Financial Accounting Standards Board (“FASB”) Accounting Standards Codification (“ASC”) Topic 260 Earnings Per Share , diluted earnings per share data have been retroactively adjusted, from 2001 until the fourth quarter of 2006 at which point the contingent convertible debentures were called, to reflect the dilutive effects of these instruments issued by The PMI Group in 2001. |
| (4) | Statutory data is based on PMI Mortgage Insurance Co. information only. Statutory capital includes policyholders’ surplus and contingency reserves. |
73
Table of Contents
| ITEM 7. | MANAGEMENT’S DISCUSSION AND ANALYSIS OF FINANCIAL CONDITION AND RESULTS OF OPERATIONS |
Financial Results for the Year Ended December 31, 2009
For the year ended December 31, 2009, we recorded a consolidated net loss of $659.3 million compared to a consolidated net loss of $928.5 million for the year ended December 31, 2008. Our consolidated net loss in 2009 was driven by continued high losses and LAE in our U.S. Mortgage Insurance Operations and, to a lesser degree, decreases in premiums earned and investment income. Our consolidated net loss in 2008 was driven by an increase in U.S. Mortgage Insurance Operations’ losses and LAE, higher impairment losses in our U.S. investment portfolio, and the impairment of our investments in FGIC and RAM Re, partially offset by gains related to the change in the fair value of certain of our senior debt instruments.
Overview of Our Business
We provide residential mortgage insurance products designed to promote homeownership and strengthen communities. Mortgage insurance protects lenders and investors from credit losses, helping to ensure that mortgages are available to prospective homebuyers. We divide our business into three segments: U.S. Mortgage Insurance Operations, International Operations and Corporate and Other.
| • | U.S. Mortgage Insurance Operations. The results of U.S. Mortgage Insurance Operations include PMI Mortgage Insurance Co. (“MIC”) and its affiliated U.S. mortgage insurance and reinsurance companies (collectively, “PMI”), and equity in (losses) earnings from PMI’s joint venture, CMG Mortgage Insurance Company and its affiliated companies (collectively, “CMG MI”). U.S. Mortgage Insurance Operations recorded a net loss of $655.9 million in 2009 and $709.5 million in 2008. |
| • | International Operations. Our International Operations segment includes the results of our European and Canadian subsidiaries, “PMI Europe” and “PMI Canada,” neither of which is writing new business. We completed the sales of our Australia and Asia subsidiaries in the fourth quarter of 2008 and their results are reported as discontinued operations in our International Operations segment and in the consolidated statement of operations for all periods presented. Our International segment generated income from continuing operations of $17.7 million in 2009 and a loss from continuing operations of $87.0 million in 2008. |
| • | Corporate and Other. Our Corporate and Other segment consists of corporate debt and expenses of our holding company (“The PMI Group” or “TPG”), contract underwriting operations (which were discontinued in April 2009), our investment in FGIC Corporation, our former investment in RAM Re (which we sold in the fourth quarter of 2009), and equity in earnings or losses from investments in certain limited partnerships. FGIC ceased writing new business in 2008. Our Corporate and Other segment generated net losses from continuing operations of $15.8 million in 2009 and $90.6 million in 2008. |
Conditions and Trends Affecting our Business
U.S. Mortgage Insurance Operations. The financial performance of our U.S. Mortgage Insurance Operations segment is affected by a number of factors, including:
| • | Capital Constraints, Initiatives and Requirements. High unemployment rates in the United States and ongoing weakness in U.S. credit, capital, residential mortgage, and housing markets continue to negatively affect our U.S. Mortgage Insurance Operations segment. As discussed below under Losses and LAE, PMI continues to experience elevated losses, which we expect to continue in 2010. |
These losses have reduced, and will continue to reduce, PMI’s net assets. In 2008, we submitted written remediation plans to Fannie Mae and Freddie Mac (collectively, the “GSEs”) outlining, among other things, the steps we are taking or plan to take to bolster MIC’s financial strength. To date, each of the GSEs has continued to treat MIC as an eligible mortgage insurer. There can be no assurance that the GSEs will continue to treat MIC as an eligible mortgage insurer.
74
Table of Contents
We believe that we will continue to incur and pay material losses. The ultimate amount of losses will depend in part on general economic conditions and other factors, including the health of credit markets, home price fluctuations and unemployment rates. In response to difficult economic and industry conditions and in order to preserve capital, we made a number of changes to PMI’s underwriting guidelines and customer management strategies in 2008 and 2009, all of which had the effect of limiting PMI’s new business writings in 2009. See New Insurance Written (NIW) below.
Unless we raise substantial additional capital or achieve significant additional statutory capital relief in the first quarter of 2010, MIC’s excess minimum policyholders’ position will decline and risk-to-capital ratio will increase beyond levels necessary to meet regulatory capital adequacy requirements. In sixteen states, if a mortgage insurer does not meet a required minimum policyholders’ position or exceeds a maximum permitted risk-to-capital ratio (generally 25 to 1), it may be prohibited from writing new business until its risk-to-capital ratio falls below the limit or its policyholders’ position meets the minimum, as applicable. In certain of those states, the applicable regulations require a mortgage insurer to immediately cease writing new business if and so long as it fails to meet the applicable capital adequacy requirements. In other states, the applicable regulator has discretion as to whether the mortgage insurer may continue writing new business. In 2009, North Carolina, Arizona and California adopted legislation giving the respective state’s insurance regulators such discretion. Thirty-four other states do not have specific capital adequacy requirements for mortgage insurers.
MIC’s principal regulator is the Arizona Department of Insurance (the “Department”). On February 10, 2010, MIC received a letter from the Department waiving, until December 31, 2011, the requirement that MIC maintain the Arizona required minimum policyholders’ position to write new business. The waiver may be withdrawn by the Arizona Director of Insurance in her sole discretion at any time. Accordingly, there can be no assurance as to the period during which the waiver will remain in effect. The waiver also imposes certain requirements and restrictions on MIC, as discussed in Item 1(C). Business—Certain Regulatory and Other Issues Facing PMI. If the Department were to withdraw the waiver and MIC fails to maintain Arizona’s minimum policyholders’ position, we would likely be required to suspend writing new business in all states. Even with the waiver from the Department, other states could require MIC to cease new business writings if we fail to maintain the applicable capital adequacy requirements.
From time to time, we have discussed with certain state insurance regulators their financially hazardous condition regulations generally applicable to licensed insurance companies and those states’ interpretive positions that we are, or could be, in violation of their respective regulations. None of these states has taken any action against MIC to date. If any of those states or other states having similar financially hazardous condition regulations (which are most states) were to conclude that MIC was in a financially hazardous condition, MIC may be required to cease writing new business in that state.
In the event that MIC is unable to continue to write new mortgage insurance in one or more states, we are working on a plan to enable us to write new mortgage insurance in those states by PMI Mortgage Assurance Co. (“PMAC”). PMAC is a subsidiary of MIC, and was formerly known as Commercial Loan Insurance Corporation. PMAC is currently licensed to write insurance in all states except Connecticut, Michigan and New York. In several other states, PMAC must revise the line of insurance business it is authorized to transact so that it may begin writing residential mortgage guaranty insurance in those states. There is no guarantee that PMAC will be able to obtain insurance licenses in Connecticut, Michigan or New York or revise its existing licenses in other impacted states. In addition, before PMAC can begin writing new business Freddie Mac must approve PMAC as an eligible mortgage insurer. On February 12, 2010, Fannie Mae approved PMAC as a direct issuer of mortgage guaranty insurance. Fannie Mae’s approval terminates on the earlier of December 31, 2011 or the date that MIC ceases to transact new business in all jurisdictions in which it is licensed. The approval is subject to a number of detailed conditions. Among others, the approval contains limitations as to the jurisdictions, volume and types of new business PMAC may write, and restricts MIC and PMAC from taking a variety of actions, subject to enumerated exceptions, without Fannie Mae’s prior written consent, which is not to be unreasonably withheld, including engaging in certain transactions with affiliates, paying dividends or making distributions or payments
75
Table of Contents
of indebtedness or transferring assets outside the ordinary course of business or in excess of specified levels. Notwithstanding these restrictions, the agreement with Fannie Mae permits MIC to make dividend, interest and principal payments in connection with the issuance of certain new debt or equity instruments up to specified levels. PMAC is currently in negotiations with Freddie Mac about becoming an eligible insurer under Freddie Mac’s criteria. See Part I, Item 1A. Risk Factors—Capital and Liquidity Constraints.
| • | Losses and LAE. PMI’s losses and LAE were $1.7 billion in 2009 and $1.8 billion in 2008. In 2009, net loss reserves increased by $368.4 million as a result of increases in PMI’s primary and modified pool default inventories (discussed under Defaults below), and higher claim rates and claim sizes, partially offset by reserve releases related to payment of claims and the restructuring of modified pool policies (discussed under Modified Pool below). PMI’s losses and LAE will be negatively affected if notices of default, claim rates and/or claim sizes increase. Changes, or lack of improvement, in economic conditions, including the U.S. credit and capital markets, mortgage interest rates, job creation, unemployment rates and home prices, could significantly impact our reserve estimates and, therefore, PMI’s losses and LAE. See Part I, Item 1A. Risk Factors—We establish loss reserves with respect to our mortgage insurance policies only upon loan defaults; accordingly, our loss reserve estimates are not intended to be an estimate of future losses. In 2009, claim and LAE payments were $1.4 billion compared to $814.0 million in 2008. We expect continued elevated levels of claim and LAE payments during 2010. |
| • | Defaults. PMI’s primary default inventory increased to 150,925 as of December 31, 2009 from 109,580 as of December 31, 2008. PMI’s primary default rate increased to 21.4% as of December 31, 2009 from 14.1% as of December 31, 2008. PMI’s modified pool default inventory decreased to 46,024 as of December 31, 2009 from 46,600 as of December 31, 2008. PMI’s modified pool default rate increased to 25.8% as of December 31, 2009 from 17.6% as of December 31, 2008. The increase in the primary default rate is due primarily to the combined effect of a higher default inventory and fewer policies in force. The increase in modified pool default rate is due primarily to a decrease in the number of policies in force. We expect PMI’s primary and modified pool default inventory and default rates to remain at elevated levels through 2010. We believe that delinquencies from our 2005, 2006 and 2007 primary book years have peaked. With the peaking of these book years, the number of new notices of default are expected to decline in 2010. The increases in PMI’s default inventories and default rates in 2009 were driven by a number of factors including: |
Declining Home Prices and Rising Unemployment—Rising unemployment has made it significantly more difficult for many borrowers to remain current on their mortgage payments, while declining home prices have reduced the opportunities for borrowers to refinance their mortgages or sell their homes. These factors are negatively affecting PMI’s default inventories and default rates.
Decline in Cure Rate—The percentage of defaults that cure has declined primarily due to rising unemployment, diminished refinancing opportunities and implementation of the U.S. Treasury’s Home Affordable Modification Program (“HAMP”). Typically, with a traditional loan modification, a loan default is cured within a relatively short time period after the modification is approved. For loans approved for HAMP modifications, however, borrowers are subject to 90 to 150 days trial periods, during which borrowers must adhere to their trial modification plans in order to complete the modification process. Certain loans in PMI’s default inventory have entered the HAMP trial period. We do not remove from PMI’s inventory a loan subject to a HAMP trial modification period unless and until the trial period is completed, all required documents have been received, the loan modification is closed, and the default is officially cured. The decline in PMI’s cure rate has been partially offset by loss mitigation efforts unrelated to HAMP and by increased rescissions of insurance written in prior periods.
Alt-A Loans—We define Alt-A loans as loans where the borrower’s FICO score is 620 or higher and the borrower requests and is given the option of providing reduced documentation verifying the borrower’s income, assets, deposit information or employment. We eliminated Alt-A loan eligibility in 2008 through the implementation of tighter underwriting guidelines. Due primarily to
76
Table of Contents
commitments issued prior to our elimination of Alt-A loan eligibility, we had an immaterial amount of new insurance written (“NIW”) on Alt-A loans in 2009, compared to 5.3% of NIW in 2008. Risk in force from Alt-A loans represented 17.0% of PMI’s primary risk in force as of December 31, 2009 compared to 18.8% as of December 31, 2008. The primary default rate for Alt-A loans was 43.9% as of December 31, 2009 compared to 30.6% as of December 31, 2008. The modified pool default rate for Alt-A loans was 30.8% as of December 31, 2009 compared to 19.4% as of December 31, 2008.
Above-97s—PMI has experienced higher than expected levels of delinquent mortgages with loan-to-value ratios (“LTVs”) exceeding 97%, which we refer to as “Above 97s”, in its flow and structured channels. Prior to 2009, we stopped insuring Above-97s, and, as a result, none of our total primary NIW for 2009 consisted of Above-97s, compared to 4.8% in 2008. As of February 1, 2009, we stopped insuring loans with LTVs exceeding 95%. As of December 31, 2009, risk in force from Above-97s in all book years represented 20.4% of PMI’s primary risk in force compared to 21.5% as of December 31, 2008. As of December 31, 2009, of the 20.4% of PMI’s primary risk in force consisting of Above-97s, approximately half was from our 2007 book year. The default rate for Above-97s in PMI’s primary portfolio was 28.7% as of December 31, 2009 compared to 18.3% as of December 31, 2008.
Interest Only Loans—Interest only loans, also known as deferred amortization loans, have more exposure to declining home prices than traditional loans, in part because principal is not reduced during an initial deferral period. Due to the tightening of underwriting guidelines and because interest only loan originations have substantially declined in the market, new insurance written in 2009 was not material for interest only loans, compared to 5.2% in 2008. Risk in force from interest only loans represented 10.9% of PMI’s primary risk in force as of December 31, 2009 compared to 11.8% as of December 31, 2008. The default rate for interest only loans was 43.8% as of December 31, 2009 compared to 28.6% as of December 31, 2008.
The above categories (or risk characteristics) are not mutually exclusive, and PMI’s portfolio may contain loans having one or more of such characteristics. We expect the percentage of the above categories of loans in our portfolio to continue to decline in 2010 as a result of our underwriting guideline changes and the corresponding composition of NIW.
Geographic Factors—Declining home prices and weak economic conditions, particularly in California, Florida, Illinois, New Jersey and Georgia, have negatively affected the development of PMI’s portfolio. PMI’s default rates in California and Florida continue to exceed PMI’s average default rate. The default rate from California was 36.7% as of December 31, 2009 compared to 24.7% and 10.9% as of December 31, 2008 and 2007, respectively. The default rate from Florida was 41.1% as of December 31, 2009 compared to 27.8% and 10.6% as of December 31, 2008 and 2007, respectively. As of December 31, 2009, risk in force from Florida and California insured loans represented 10.1% and 7.7% of PMI’s primary risk in force, respectively. See Item 1(D)(7)—Defaults and Claims for further discussion on primary default rates by region. For certain geographic areas (principally metropolitan statistical areas (MSAs)) that are designated as distressed, PMI caps the maximum insured loan-to-value ratio and/or prescribes additional limiting criteria and underwriting guidelines. PMI assesses MSAs on a regular basis.
| • | Modified Pool. Prior to 2008, PMI wrote modified pool policies on pools of loans which feature aggregate stop-losses and per loan coverage liability caps. In some cases, the modified pool policies also include aggregate deductibles which must be reached before PMI would become liable to pay claims. PMI’s modified pool risk in force (net of risk for which reserves have been established) was $0.8 billion as of December 31, 2009 and $2.0 billion as of December 31, 2008. The $1.2 billion reduction in PMI’s modified pool risk in force in 2009 was primarily the result of $552.1 million additional modified pool loss reserves in 2009. The additions in the modified pool loss reserves in 2009 were driven by higher levels of defaults, higher claim sizes and larger claim rates, and relate primarily to our deductible modified pool portfolio, which includes higher concentrations of Alt-A loans and loans originated in |
77
Table of Contents
| California and Florida. Our California and Florida portfolios are exhibiting higher than average claim rates and sizes. Offsetting these reserve increases were $561.8 million of modified pool reserve releases in 2009 due to the acceleration of claim payments described below. |
The existence of stop-loss protection for PMI’s modified pool exposure results in a maximum loss amount equal to PMI’s modified pool risk-in-force. The existence of stop-loss protection and the significant reserves we have recorded and expect to record provides PMI with opportunities to work with its insured customers to restructure the risk on certain modified pool policies by negotiating early, discounted claim payments. This may particularly be the case when both parties agree on the likely amount of the ultimate contract losses and where the counterparty, rather than waiting to receive future expected claim payments, prefers to receive an acceleration of claim payments, although at a discount of the expected future claim payments for the particular pool. When we restructure our modified pool contracts at a discount to the level of our associated recorded reserves, we realize a capital benefit on both a statutory and GAAP basis.
In connection with the restructurings we completed in 2009, PMI paid the counterparties aggregate accelerated discounted claim payments of approximately $498 million (subject to certain adjustments). The positive impact that these restructurings had on our loss reserves for 2009 resulted in an estimated aggregate statutory capital benefit to PMI of approximately $130 million.
Due to increases in delinquencies, average loan amounts, claim sizes, claim rates and severity, as of December 31, 2009, we established significant loss reserves with respect to modified pool with deductibles and expect to record additional losses up to the maximum loss amounts on our modified pool with deductibles exposure for the 2005, 2006 and 2007 book years, which is approximately $192 million. We believe the risk associated with book year 2004 and earlier of $103 million for modified pool with deductibles will not result in future losses of significance. We do not expect losses on our modified pool without deductibles exposure for all book years to reach our maximum loss limits.
| • | Rescission Activity. PMI routinely investigates early payment default loans (loans that default prior to the thirteenth payment), or EPDs, and also investigates certain other non-EPD loans for misrepresentations, negligent underwriting and eligibility for coverage. Based upon PMI’s recent investigations, industry data and other data, we believe that there were significantly higher levels of mortgage origination fraud and decreases in the quality of mortgage origination underwriting primarily in 2006 and 2007. As a result, PMI is reviewing and investigating a larger volume of insured loans and the number of loans on which coverage has been rescinded by PMI increased in 2008 and 2009. In part because we believe that new EPDs have peaked and our standing inventory of EPDs is approaching its peak, we currently expect new rescission levels to remain high and then to begin declining modestly toward the end of 2010. |
When PMI rescinds insurance coverage with respect to an investigated loan, we notify the insured of the rescission, refund all premiums associated with the insured loan, and remove the rescinded loan from our calculation of PMI’s risk in force and insurance in force. In addition, if the rescinded loan was delinquent, we cease to include that loan in our default inventory and, therefore, do not incorporate that loan into our loss reserve estimates. Accordingly, past rescission activity has materially reduced our loss reserve estimates. In arriving at our loss reserve estimates, we also consider the effect of projected future rescission activity with respect to the current inventory of delinquent insured loans. As we expect rescission activity to remain at current levels in 2010, projected future rescission activity is also materially reducing our current loss reserve estimates. To the extent that we are required to reverse rescissions beyond current levels or future rescission activity is lower than projected, we would be required to increase loss reserves in future periods. The table below shows the aggregate risk in force of delinquent loans (including primary and pool) rescinded by PMI in each quarter in 2008 and 2009:
| Q4 2009 | Q3 2009 | Q2 2009 | Q1 2009 | Q4 2008 | Q3 2008 | Q2 2008 | Q1 2008 | |||||||||||||||||
| (Dollars in millions) | ||||||||||||||||||||||||
| Delinquent risk in force rescinded per quarter |
$ | 123.6 | $ | 148.4 | $ | 170.3 | $ | 200.6 | $ | 187.6 | $ | 240.8 | $ | 95.1 | $ | 34.6 | ||||||||
78
Table of Contents
Upon receiving PMI’s notice of rescission with respect to an insured loan, the insured may seek additional information as to the bases of our rescission and/or disagree with our decision to rescind coverage. As a result of the increase in rescission activity, we experienced an increase in the number of such disagreements in 2009. We expect this trend to continue in 2010. If we are unsuccessful in defending our rescission decisions beyond expected levels, we may need to re-establish loss reserves for, and would need to reassume risk on, such rescinded loans. See Part I, Item 3. Legal Proceedings and Item 1A. Risk Factors—We establish loss reserves with respect to our mortgage insurance policies only upon loan defaults; accordingly, our loss reserve estimates are not intended to be an estimate of our future losses, and We are subject to heightened litigation risk related to the increase in rescissions.
In some cases, our servicing customers do not produce documents necessary to perfect the claim. Most often, this is the result of the servicer’s inability to provide the loan origination file for our review. If, after repeated requests by PMI, the loan file is not produced, the claim will be denied. Levels of claim denials increased in 2008 and 2009 and we expect them to decline modestly in 2010. See Part I, Item 1A. Risk Factors—We establish loss reserves with respect to our mortgage insurance policies only upon loan defaults; accordingly, our loss reserve estimates are not intended to be an estimate of our future losses. The table below shows the risk in force of claims denials (including primary and pool) in each quarter in 2008 and 2009:
| Q4 2009 | Q3 2009 | Q2 2009 | Q1 2009 | Q4 2008 | Q3 2008 | Q2 2008 | Q1 2008 | |||||||||||||||||
| (Dollars in millions) | ||||||||||||||||||||||||
| Claims denials per quarter—delinquent risk in force |
$ | 93.4 | $ | 80.1 | $ | 184.8 | $ | 63.6 | $ | 51.7 | $ | 17.7 | $ | 12.8 | $ | 8.4 | ||||||||
| • | New Insurance Written (NIW). PMI’s primary NIW decreased by 60.3% in 2009 compared to 2008. The decrease in PMI’s primary flow NIW in 2009 compared to 2008 was principally due to PMI’s capital preservation initiatives as well as changes to PMI’s pricing and underwriting guidelines that reduce the types of loans that PMI would insure. PMI’s reduced levels of NIW are significantly reducing its premiums written and earned and our consolidated revenues. We are undertaking efforts to maintain or slightly increase insurance writings in 2010 as compared to 2009 levels. However, we expect a variety of factors to continue to impact our new business writings in 2010. Such factors include, among others, mortgage and private mortgage insurance market conditions, PMI’s underwriting guidelines, which limit the type of new business that PMI is willing to write, and customer management strategies adopted in 2009 that have impacted PMI’s competitive position in some markets. |
| • | Policy Cancellations and Persistency. PMI’s persistency rate, which is based upon the percentage of primary insurance in force at the beginning of a 12-month period that remains in force at the end of that period, was 84.3% as of December 31, 2009 and 82.2% as of December 31, 2008. The increase in PMI’s persistency rate reflects home price declines and to a lesser extent lower levels of residential mortgage refinance activity in the insured market. To the extent that home prices continue to decline or experience low appreciation rates, we expect that PMI’s persistency rate will likely remain high and therefore limit the rate at which PMI’s risk in force runs off over the next few years. Because PMI must maintain sufficient capital to satisfy regulatory risk-to-capital metrics, higher persistency rates could constrain PMI’s capital position and limit its ability to write new business. |
| • | Other-than-Temporary Impairment of Investments. During 2009, we recorded a realized loss of $11.1 million primarily related to impairments of preferred securities held in our U.S. investment portfolio. We may have additional impairments for preferred or other securities if they meet the criteria for other-than-temporary impairment, which would negatively affect our capital and have an adverse effect on our results of operations and financial condition. |
79
Table of Contents
International Operations. Factors affecting the financial performance of our International Operations segment include:
PMI Europe. PMI Europe recorded net income of $19.8 million in 2009 compared to a net loss of $80.3 million in 2008. The net income for 2009 was primarily due to gains of approximately $31.6 million related to credit default swaps, which are not likely to continue at those levels in 2010. The net loss for 2008 was primarily driven by increased loss provisions related to the deteriorating performance of certain U.S. sub-prime exposures on which PMI Europe provided reinsurance coverage. As of December 31, 2009, PMI Europe’s total exposure from its reinsurance of U.S. subprime risk was $121.0 million which could experience adverse development in the future. Total reserves associated with this portfolio were $17.5 million as of December 31, 2009. If the performance of these exposures deteriorates, PMI Europe will experience increased losses and increases to its loss reserves. PMI Europe is not currently writing new business.
As a result of rating agency actions and other contractual requirements, counterparties have required PMI Europe to post collateral of $33.8 million on certain transactions as of December 31, 2009. As a result of development in the performance of the underlying risk referenced in such transactions, PMI Europe may be required to post additional collateral. Any further downgrades will have no impact on the required collateral, as the current ratings are below all the ratings related triggers.
| • | PMI Canada. PMI Canada recorded a net loss of $2.1 million compared to a net loss of $6.8 million in 2008. We are in the process of closing our operations in Canada. To fully close our operations in Canada, we must remove PMI Canada’s risk in force and obtain regulatory approvals. |
| • | Discontinued Operations of PMI Australia and PMI Asia. In the fourth quarter of 2008, we sold PMI Australia and PMI Asia and reclassified them as discontinued operations for the year ended December 31, 2008. In the third quarter of 2009, coinciding with the filing of our 2008 tax return, we recorded an additional tax expense of $6.6 million for PMI Australia, due to a refinement of foreign tax credits related to the sale of PMI Australia. In the third quarter of 2009, we recorded a tax benefit of $1.3 million for PMI Asia. The adjustment also related to finalization of tax calculations related to PMI Asia. |
As a result of the changes in our International Operations described above, our International Operations will generate a substantially smaller portion of our revenues in 2010 and thereafter, other than the revenues from the consideration due on the QBE Note in 2011. See Liquidity and Capital Resources—The QBE Note.
Corporate and Other. Factors affecting the financial performance of our Corporate and Other segment include:
| • | Fair Value Measurement of Financial Instruments. Effective January 1, 2008, we adopted the fair value option for certain of our corporate debt outlined in Topic 825. Topic 825 allows an entity the irrevocable option to elect fair value for the initial and subsequent measurement of certain financial assets and liabilities on a contract-by-contract basis. As a result, in 2008, our net losses were partially offset by gains (representing a decline in fair value) of $123.6 million related to the subsequent measurement of fair value for these debt instruments. In 2009, we also experienced net gains (representing a decline in fair value) of $16.5 million, due largely to the widening of credit spreads in the period. (See Item 8, Note 10. Fair Value Disclosures.) |
| • | Share-Based Compensation. During 2009, we incurred pre-tax share-based compensation expenses of $4.1 million compared to $10.1 million in 2008. The decrease in share-based compensation expense was primarily due to decreases in the fair value of share-based compensation granted in 2009 and a lower number of share grants. |
| • | Holding Company Liquidity. Our holding company’s principal sources of liquidity include dividends from its insurance subsidiaries, expected tax receivables from PMI, income from its investment portfolio and funds drawn from our revolving credit facility and cash and investments held at the |
80
Table of Contents
| holding company. MIC did not pay dividends to The PMI Group in 2009, and we do not expect that MIC will be able to pay dividends in 2010. Our holding company’s available funds, consisting of cash and cash equivalents and investments, were $61.5 million at December 31, 2009. Our holding company has $125 million outstanding under its $125 million revolving credit facility. For a discussion of the status of The PMI Group’s revolving credit facility, please see Liquidity and Capital Resources—Credit Facility. |
| • | Deferred Tax Assets. As of December 31, 2009, we have a tax valuation allowance of $248.3 million against a $423.9 million deferred tax asset, for a net deferred tax asset of $175.6 million. Due to cumulative operating losses over the last three years and the continued economic downturn making future taxable income uncertain, we may be required to record an additional valuation allowance against the remaining tax asset or future tax asset if we are unable to substantiate that those net tax assets will more likely than not be utilized. Further, in the event of an “ownership change” for federal income tax purposes under Internal Revenue Code Section 382, we may be restricted annually in its ability to use its deferred tax assets. See Part I, Item 1A. Risk Factors—We may not be able to realize all of our deferred tax assets and may be required to record a full or partial valuation allowance against our net deferred tax assets. |
| • | FGIC and RAM Re. We impaired our investments in FGIC and RAM Re in 2008 and reduced the carrying values of those investments to zero. We sold our investment in RAM Re in the fourth quarter of 2009. To the extent that the carrying value of our investment in FGIC remains zero, no equity in losses relating to FGIC will be recorded. We are under no obligation, nor do we intend, to provide additional capital to FGIC. |
| • | Discontinued Operations of PMI Guaranty. PMI Guaranty completed its runoff activities in 2008. Accordingly, we reported the results of operations of PMI Guaranty as discontinued operations in the Corporate and Other segment and in the consolidated statement of operations for all periods presented through 2008. |
| • | Additional Items Affecting this Segment. Our Corporate and Other segment includes net investment income from our holding company, expenses related to corporate overhead, including compensation expense not included in our other operating segments, and interest expense. |
81
Table of Contents
RESULTS OF OPERATIONS
Consolidated Results
The following table presents our consolidated financial results:
| 2009 | 2008 | 2007 | Percentage Change |
|||||||||||||||
| 2009 vs. 2008 |
2008 vs. 2007 |
|||||||||||||||||
| (Dollars in millions, except per share data) |
||||||||||||||||||
| REVENUES: |
||||||||||||||||||
| Premiums earned |
$ | 716.8 | $ | 786.2 | $ | 815.4 | (8.8 | )% | (3.6 | )% | ||||||||
| Net investment income |
119.2 | 138.7 | 132.6 | (14.1 | )% | 4.6 | % | |||||||||||
| Net realized investment gains (losses) |
37.5 | (139.5 | ) | (24.6 | ) | (126.5 | )% | — | ||||||||||
| Change in fair value of certain debt instruments |
16.5 | 123.6 | — | (86.7 | )% | 100.0 | % | |||||||||||
| Other income (loss) |
33.9 | (1.2 | ) | (0.2 | ) | — | — | |||||||||||
| Total revenues |
923.9 | 907.8 | 923.2 | 1.8 | % | (1.7 | )% | |||||||||||
| LOSSES AND EXPENSES: |
||||||||||||||||||
| Losses and loss adjustment expenses |
1,756.8 | 1,899.3 | 1,122.9 | (7.5 | )% | 69.1 | % | |||||||||||
| Amortization of deferred policy acquisition costs |
17.8 | 18.3 | 87.7 | (2.7 | )% | (79.1 | )% | |||||||||||
| Other underwriting and operating expenses |
155.2 | 218.6 | 192.9 | (29.0 | )% | 13.3 | % | |||||||||||
| Interest expense |
43.0 | 41.0 | 33.4 | 4.9 | % | 22.8 | % | |||||||||||
| Total losses and expenses |
1,972.8 | 2,177.2 | 1,436.9 | (9.4 | )% | 51.5 | % | |||||||||||
| Loss before equity in losses from unconsolidated subsidiaries and income taxes |
(1,048.9 | ) | (1,269.4 | ) | (513.7 | ) | (17.4 | )% | 147.1 | % | ||||||||
| Equity in losses from unconsolidated subsidiaries |
(12.0 | ) | (51.8 | ) | (741.5 | ) | (76.8 | )% | (93.0 | )% | ||||||||
| Loss from continuing operations before taxes |
(1,060.9 | ) | (1,321.2 | ) | (1,255.2 | ) | (19.7 | )% | 5.3 | % | ||||||||
| Income tax benefit from continuing operations |
(406.9 | ) | (434.0 | ) | (246.5 | ) | (6.2 | )% | 76.1 | % | ||||||||
| Loss from continuing operations |
$ | (654.0 | ) | $ | (887.2 | ) | (1,008.7 | ) | (26.3 | )% | (12.0 | )% | ||||||
| (Loss) income from discontinued operations, net of tax |
(5.3 | ) | (41.3 | ) | 93.4 | (87.2 | )% | (144.2 | )% | |||||||||
| Net loss |
$ | (659.3 | ) | $ | (928.5 | ) | $ | (915.3 | ) | (29.0 | )% | 1.4 | % | |||||
| Diluted loss from continuing operations per share |
$ | (7.94 | ) | $ | (10.90 | ) | $ | (11.92 | ) | (27.2 | )% | (8.6 | )% | |||||
| Diluted (loss) income from discontinued operations per share |
(0.07 | ) | (0.50 | ) | 1.11 | (86.0 | )% | (145.0 | )% | |||||||||
| Diluted net loss per share |
$ | (8.01 | ) | $ | (11.40 | ) | $ | (10.81 | ) | (29.7 | )% | 5.5 | % | |||||
For the year ended December 31, 2009, we recorded a consolidated net loss of $659.3 million compared to a consolidated net loss of $928.5 million for the year ended December 31, 2008. Our consolidated net loss in 2009 was driven by continued high losses and LAE in our U.S. Mortgage Insurance Operations and, to a lesser degree, decreases in premiums earned and investment income. Our consolidated net loss in 2008 was driven by an increase in U.S. Mortgage Insurance Operations’ losses and LAE, higher impairment losses in our U.S. investment portfolio, and the impairment of our investments in FGIC and RAM Re, partially offset by gains related to the change in the fair value of certain of our senior debt instruments.
The decrease in premiums earned in 2009 compared to 2008 was driven by U.S. Mortgage Insurance Operations’ decline in insurance in force due in part to lower NIW and higher levels of rescissions of insurance
82
Table of Contents
previously written (which generate premium refunds). This decrease in premiums earned was partially offset by higher persistency in 2009 compared to 2008. The decrease in premiums earned in 2008 compared to 2007 was driven by lower premiums earned in our U.S. Mortgage Insurance Operations segment, which was primarily due to decline in insurance in force due in part to lower NIW and higher levels of rescissions of insurance previously written (which generate premium refunds), partially offset by higher persistency in 2008 compared to 2007.
The decrease in net investment income in 2009 compared to 2008 was primarily due to a decrease in our pre-tax book yield. Our consolidated pre-tax book yield was 3.41%, 3.46% and 5.07% as of December 31, 2009, 2008 and 2007, respectively. This decrease in our consolidated pre-tax book yield was primarily due to a higher concentration of cash and cash equivalents in our investment portfolio to maintain liquidity, which yields significantly lower investment income. The increase in net investment income in 2008 compared to 2007 was primarily due to the growth of PMI’s investment portfolio. The increase in our investment portfolio was partially offset by a decrease in our pre-tax book yield.
The net realized investment gains of $37.5 million in 2009 were driven primarily by sales of municipal bonds, offset by other-than-temporary impairments of certain preferred stocks in our U.S. portfolio and net losses resulting from sales of fixed income securities in our European portfolio. The net realized investment loss in 2008 of $139.2 million was primarily due to impairments of preferred securities in our investment portfolio of $96.5 million, impairments of our investment in FGIC of $88.0 million and impairment of our investment in RAM Re of $2.9 million, partially offset by gains on the sale of common stock in PMI’s investment portfolio. The net realized investment loss in 2007 was driven by the other-than-temporary impairment of our investment in RAM Re of $38.5 million, partially offset by a $12.7 million settlement gain related to the favorable resolution of certain indemnification obligations associated with the sale of our investment in an unconsolidated subsidiary.
The change in fair value of certain debt instruments in 2009 and 2008 resulted from our adoption of the fair value option outlined in Topic 825, effective January 1, 2008. Credit spread fluctuations were the primary driver of changes in fair value of our debt in 2009. In 2009, we experienced net gains (representing a decline in fair value) of $16.5 million, due largely to the widening of credit spreads in the period. The changes in fair value of $123.6 million in 2008 were primarily due to changes in interest rates and credit spreads associated with our senior debt.
The increase in other income in 2009 compared to 2008 was due primarily to an increase in net gains on credit default swaps in Europe.
Losses and LAE in 2009 decreased compared to 2008 primarily as a result of lower levels of loss reserve increases in 2009. In 2009, we increased net loss reserves by $368.4 million. This increase primarily reflected PMI’s higher default inventories, and higher average claim rates and claim sizes in PMI’s modified pool insurance portfolio, partially offset by modified pool restructurings (including commutations), rescission of insurance written in prior periods and loss mitigation activities. The increase in our losses and LAE in 2008 compared to 2007 was primarily driven by U.S. Mortgage Insurance Operations’ and PMI Europe’s increased loss reserves of $1.1 billion due to higher levels of delinquencies and higher estimated claim rates.
The decrease in amortization of deferred policy acquisition costs in 2009 compared to 2008 was primarily due to an increase in the period over which we amortize deferred policy acquisition costs in our U.S. Mortgage Insurance Operations, due to higher persistency levels. PMI’s deferred policy acquisition cost asset increased to $41.3 million at December 31, 2009 from $32.3 million at December 31, 2008. The decrease in amortization of deferred policy acquisition costs in 2008 compared to 2007 was primarily due to our $33.6 million impairment in 2007 of PMI’s deferred policy acquisition costs associated with PMI’s 2007 book year.
The decrease in other underwriting and operating expenses in 2009 compared to 2008 was primarily due to a reduction of expenses in response to the rationalization of our workforce associated with refocusing on our U.S. Mortgage Insurance Operations. The increase in other underwriting and operating expenses in 2008 compared to
83
Table of Contents
2007 was primarily due to severance costs associated with our Voluntary Early Retirement Program and involuntary terminations and disposal costs as well as certain software impairment charges.
As a result of our initial draw down of $200 million on our line of credit in the second quarter of 2008 and subsequent repayment of $75 million in 2009, we paid higher interest and fees in 2009 than in 2008. Interest expense increased in 2008 compared to 2007 due to our initial draw down of $200 million on our line of credit in the second quarter of 2008, which resulted in higher interest and fees in 2008.
Due to our impairment of our FGIC and RAM Re investments in 2008, we did not recognize any equity in earnings (losses) from FGIC in 2008 and 2009 or RAM Re in 2009. The equity in losses in 2008 for RAM Re was $57.7 million, primarily due to RAM Re’s results of operations driven by increases in loss reserves. The equity in losses in 2007 was primarily due to equity in losses from FGIC as a result of net unrealized mark-to-market losses predominantly related to CDS derivative contracts and loss reserve increases.
The effective tax rates for continuing operations were 38.4% for 2009, 32.8% for 2008 and 19.6% for 2007, compared to the federal statutory rate of 35.0%. As we reported a net loss for the year ended December 31, 2009, municipal bond investment income and income from certain international operations, which have lower effective tax rates, increased our 2009 effective tax rates above the federal statutory rate. In addition, adjustments made when filing our 2008 tax return further increased the effective tax rate in 2009. The effective tax rate for the year ended December 31, 2008 was lower than the federal statutory rate due primarily to the impairment of FGIC which resulted in a tax charge that lowered the effective tax rate. The change in our effective tax rate in 2008 was primarily due to losses in our U.S. Mortgage Insurance Operations and Corporate and Other segments and the effects of tax exempt income as a proportion of net losses.
Losses from discontinued operations for 2009 include adjustments to PMI Australia and PMI Asia primarily due to being able to utilize additional foreign tax credits when we prepared our 2008 annual tax return. (Loss) income from discontinued operations for 2008 and earlier includes the financial results of PMI Australia, PMI Asia and PMI Guaranty.
Segment Results
The following table presents consolidated net loss for each of our segments:
| 2009 | 2008 | 2007 | Percentage Change | |||||||||||||||
| 2009 vs. 2008 |
2008 vs. 2007 |
|||||||||||||||||
| (Dollars in millions) | ||||||||||||||||||
| U.S. Mortgage Insurance Operations |
$ | (655.9 | ) | $ | (709.5 | ) | $ | (190.8 | ) | (7.6 | )% | — | ||||||
| International Operations |
17.7 | (87.0 | ) | (35.3 | ) | (120.3 | )% | 146.5 | % | |||||||||
| Corporate and Other |
(15.8 | ) | (90.6 | ) | (782.6 | ) | (82.6 | )% | (88.4 | )% | ||||||||
| Loss from continuing operations* |
$ | (654.0 | ) | $ | (887.2 | ) | $ | (1,008.7 | ) | (26.3 | )% | (12.0 | )% | |||||
| International Operations |
(5.3 | ) | (17.2 | ) | 90.3 | (69.2 | )% | (119.0 | )% | |||||||||
| Corporate and Other |
— | (24.1 | ) | 3.1 | (100.0 | )% | — | |||||||||||
| (Loss) income from discontinued operations* |
$ | (5.3 | ) | $ | (41.3 | ) | $ | 93.4 | (87.2 | )% | (144.2 | )% | ||||||
| Net loss* |
$ | (659.3 | ) | $ | (928.5 | ) | $ | (915.3 | ) | (29.0 | )% | 1.4 | % | |||||
| * | May not total due to rounding |
84
Table of Contents
U.S. Mortgage Insurance Operations
The results of our U.S. Mortgage Insurance Operations include the operating results of PMI. CMG MI is accounted for under the equity method of accounting and its results are recorded as equity in (losses) earnings from unconsolidated subsidiaries. U.S. Mortgage Insurance Operations’ results are summarized in the table below.
| 2009 | 2008 | 2007 | Percentage Change |
|||||||||||||||
| 2009 vs. 2008 |
2008 vs. 2007 |
|||||||||||||||||
| (Dollars in millions) | ||||||||||||||||||
| Net premiums written |
$ | 685.4 | $ | 750.6 | $ | 799.7 | (8.7 | )% | (6.1 | )% | ||||||||
| Premiums earned |
$ | 705.9 | $ | 772.2 | $ | 800.9 | (8.6 | )% | (3.6 | )% | ||||||||
| Net investment income |
110.7 | 115.2 | 110.4 | (3.9 | )% | 4.3 | % | |||||||||||
| Net realized investment gains (losses) |
40.2 | (47.6 | ) | 4.6 | (184.5 | )% | — | |||||||||||
| Other income (loss) |
0.0 | (0.4 | ) | 0.1 | — | — | ||||||||||||
| Total revenues |
856.8 | 839.4 | 916.0 | 2.1 | % | (8.4 | )% | |||||||||||
| Losses and LAE |
1,740.7 | 1,835.7 | 1,096.1 | (5.2 | )% | 67.5 | % | |||||||||||
| Underwriting and operating expenses |
143.3 | 139.1 | 179.9 | 3.0 | % | (22.7 | )% | |||||||||||
| Total losses and expenses |
1,884.0 | 1,974.8 | 1,276.0 | (4.6 | )% | 54.8 | % | |||||||||||
| Loss before equity in (losses) earnings from unconsolidated subsidiaries and income taxes |
(1,027.2 | ) | (1,135.4 | ) | (360.0 | ) | (9.5 | )% | — | |||||||||
| Equity in (losses) earnings from unconsolidated subsidiaries |
(11.5 | ) | 6.5 | 17.1 | — | (62.0 | )% | |||||||||||
| Loss before income taxes |
(1,038.7 | ) | (1,128.9 | ) | (342.9 | ) | (8.0 | )% | — | |||||||||
| Income tax benefit |
(382.8 | ) | (419.4 | ) | (152.1 | ) | (8.7 | )% | 175.7 | % | ||||||||
| Net loss |
$ | (655.9 | ) | $ | (709.5 | ) | $ | (190.8 | ) | (7.6 | )% | — | ||||||
Premiums written and earned—PMI’s net premiums written refers to the amount of premiums recorded based on effective coverage during a given period, net of refunds and premiums ceded primarily under captive reinsurance agreements. Under captive reinsurance agreements, PMI transfers portions of its risk written on loans originated by certain lender-customers to captive reinsurance companies affiliated with such lender-customers. In return, portions of PMI’s gross premiums written are ceded to those captive reinsurance companies.
PMI’s premiums earned refers to the amount of net premiums written, net of changes in unearned premiums. The components of PMI’s net premiums written and premiums earned are as follows:
| 2009 | 2008 | 2007 | Percentage Change |
|||||||||||||||
| 2009 vs. 2008 |
2008 vs. 2007 |
|||||||||||||||||
| (Dollars in millions) | ||||||||||||||||||
| Gross premiums written |
$ | 919.5 | $ | 1,007.8 | $ | 1,001.4 | (8.8 | )% | 0.6 | % | ||||||||
| Ceded and refunded premiums, net of assumed |
(234.1 | ) | (257.2 | ) | (201.7 | ) | (9.0 | )% | 27.5 | % | ||||||||
| Net premiums written |
$ | 685.4 | $ | 750.6 | $ | 799.7 | (8.7 | )% | (6.1 | )% | ||||||||
| Premiums earned |
$ | 705.9 | $ | 772.2 | $ | 800.9 | (8.6 | )% | (3.6 | )% | ||||||||
The decrease in gross premiums written and premiums earned in 2009 compared to 2008 was primarily due to declines in insurance in force and to a lesser extent lower NIW in 2009. The increase in gross premiums
85
Table of Contents
written in 2008 compared to 2007 was primarily due to higher insurance in force in 2008 compared to 2007. The decrease in ceded premiums in 2009 compared to 2008 was primarily due to XOL captives placed in runoff effective January 1, 2009 (as discussed below). The increase in ceded premiums in 2008 compared to 2007 was primarily due to a higher level of rescissions. The decrease in premiums earned in 2008 compared to 2007 was primarily due to higher levels of rescissions and refunded premiums.
As of December 31, 2009, 46.9% of PMI’s primary risk in force was subject to captive reinsurance agreements compared to 49.5% as of December 31, 2008. In 2009, PMI ceased seeking reinsurance under excess-of-loss (“XOL”) reinsurance agreements on new business with lender affiliated captive reinsurers. As a result in-force XOL contracts were placed into runoff and will mature pursuant to the existing terms and conditions. PMI will continue to cede premiums to the captive reinsurers in runoff but these cessions are expected to decrease over time as the number of loans in our portfolio subject to captive reinsurance arrangements decrease.
Net investment income—Net investment income decreased in 2009, primarily due to a decline in PMI’s average pre-tax book yield offset by an increase in average holdings of fixed income securities and cash and cash equivalents. The average pre-tax book yield in 2009 was lower than 2008 primarily due to a higher allocation of cash and cash equivalent investments and a lower allocation of preferred stocks. Net investment income increased in 2008 compared to 2007 primarily due to increased average holdings of fixed income securities and cash and cash equivalents in PMI’s investment portfolio in 2008 compared to 2007, partially offset by a decrease in average pre-tax book yield.
Net realized investment gains (losses)—The net realized investment gains in 2009 were driven primarily by sales of municipal bonds partially offset by our other-than-temporary impairment of certain preferred stocks. The net realized investment loss in 2008 was primarily due to an impairment of preferred securities in our investment portfolio of $96.5 million, partially offset by gains on the sale of common stock in PMI’s investment portfolio.
Losses and LAE—PMI’s losses and LAE represents claims paid, certain expenses related to default notification, loss mitigation and claim processing and changes to loss reserves during the applicable period. Because losses and LAE includes changes to loss reserves, it reflects our best estimate of PMI’s future claim payments and costs to process claims relating only to PMI’s current inventory of loans in default. Claims paid including LAE includes amounts paid on primary and pool insurance claims and LAE. PMI’s losses and LAE and related claims data are shown in the following table.
| 2009 | 2008 | 2007 | Percentage Change |
||||||||||||
| 2009 vs. 2008 |
2008 vs. 2007 |
||||||||||||||
| (Dollars in millions, except claim size) |
|||||||||||||||
| Total primary claims paid |
$ | 704.8 | $ | 725.3 | $ | 328.3 | (2.8 | )% | 120.9 | % | |||||
| Total pool claims paid |
619.2 | 54.6 | 20.4 | — | 167.6 | % | |||||||||
| LAE, supplemental and other |
48.3 | 34.1 | 13.6 | 41.6 | % | 150.7 | % | ||||||||
| Change in net loss reserves |
368.4 | 1,021.7 | 733.8 | (63.9 | )% | 39.2 | % | ||||||||
| Losses and LAE |
$ | 1,740.7 | $ | 1,835.7 | $ | 1,096.1 | (5.2 | )% | 67.5 | % | |||||
| Number of primary claims paid (1) |
19,948 | 17,466 | 10,262 | 14.2 | % | 70.2 | % | ||||||||
| Average primary claim size (in thousands) |
$ | 35.5 | $ | 43.5 | $ | 32.0 | (18.4 | )% | 35.9 | % | |||||
| (1) | Amount includes claims denials, which are settled without payments. Additionally, the calculation of the average primary claim sizes excluded $3.3 million and $34.0 million recovered from certain terminated captive trust accounts for the years ended December 31, 2009 and 2008, respectively. |
86
Table of Contents
The decrease in total primary claims paid in 2009 compared to 2008 was primarily due to an increase in claim denials, partially offset by an increase in the number of primary claims paid. The increase in total pool claims paid in 2009 compared to 2008 was due; primarily to $497.6 million of accelerated claim payments associated with the restructuring of certain modified pool contracts in 2009; and claim payments on certain of our modified pool contracts for which we had exceeded our deductibles. We expect primary claims paid to increase in 2010. For a discussion of the changes in net loss reserves in 2009 and 2008, see Conditions and Trends Affecting our Business—U.S. Mortgage Insurance Operations—Losses and LAE, above. For a discussion of the impact of our rescission activities on losses and LAE, see Conditions and Trends Affecting our Business—U.S. Mortgage Insurance Operations—Rescission Activities, above. The increase in the number of primary claims paid in the year ended December 31, 2009 was driven by higher levels of defaults and higher claim rates resulting from, among other things, home price declines and the diminished availability of certain loan products, both of which constrain refinancing opportunities and result in a decrease in the percentage of the default inventory that is returning to current status. The decreases in PMI’s average primary claim size in 2009 were driven primarily by higher incidences of claim denials, which are settled without payment. See Conditions and Trends Affecting Our Business—U.S. Mortgage Insurance Operations—Rescission Activities, above.
The increase in total primary claims paid in 2008 compared to 2007 was driven by higher average primary claim sizes and an increase in the number of primary claims paid (or claim rate). The increases in PMI’s average claim sizes in 2008 and 2007 were driven by higher loan sizes and coverage levels in PMI’s portfolio and declining home prices, which limited PMI’s loss mitigation opportunities.
As of December 31, 2009, we ceded $703.6 million in loss reserves primarily to captive reinsurers, which we record as reinsurance recoverables. This benefit is reflected in the change in net loss reserves throughout the three years presented in the table above. Reinsurance recoverables do not exceed assets in captive trust accounts. As of December 31, 2009, assets in captive trust accounts held for the benefit of PMI totaled approximately $940.7 million.
Defaults—PMI’s primary mortgage insurance master policies define “default” as the borrower’s failure to pay when due an amount equal to the scheduled monthly mortgage payment under the terms of the mortgage. Generally, the master policies require an insured to notify PMI of a default no later than the last business day of the month following the month in which the borrower becomes three monthly payments in default. For reporting and internal tracking purposes, we do not consider a loan to be in default until the borrower has missed two consecutive payments. Depending upon its scheduled payment date, a loan in default for two consecutive monthly payments could be reported to PMI between the 31st and the 60th day after the first missed payment due date.
PMI’s primary default data are presented in the table below.
| As of December 31, | Percentage Change/ Variance |
||||||||||||||
| 2009 vs. 2008 |
2008 vs. 2007 |
||||||||||||||
| 2009 | 2008 | 2007 | |||||||||||||
| Flow channel |
|||||||||||||||
| Loans in default |
122,365 | 86,060 | 44,931 | 42.2 | % | 91.5 | % | ||||||||
| Policies in force |
606,240 | 662,199 | 666,216 | (8.5 | )% | (0.6 | )% | ||||||||
| Default rate |
20.18 | % | 13.00 | % | 6.74 | % | 7.18 | pps | 6.26 | pps | |||||
| Structured channel |
|||||||||||||||
| Loans in default |
28,560 | 23,520 | 18,266 | 21.4 | % | 28.8 | % | ||||||||
| Policies in force |
99,177 | 113,642 | 131,203 | (12.7 | )% | (13.4 | )% | ||||||||
| Default rate |
28.80 | % | 20.70 | % | 13.92 | % | 8.10 | pps | 6.78 | pps | |||||
| Total primary |
|||||||||||||||
| Loans in default |
150,925 | 109,580 | 63,197 | 37.7 | % | 73.4 | % | ||||||||
| Policies in force |
705,417 | 775,841 | 797,419 | (9.1 | )% | (2.7 | )% | ||||||||
| Default rate |
21.40 | % | 14.12 | % | 7.93 | % | 7.28 | pps | 6.19 | pps | |||||
87
Table of Contents
PMI’s primary delinquent roll forward is presented in the table below.
| 2009 | 2008 | 2007 | Percentage Change |
||||||||||||
| 2009 vs. 2008 |
2008 vs. 2007 |
||||||||||||||
| Number of policies |
|||||||||||||||
| Beginning delinquent inventory, January 1 |
109,580 | 63,197 | 39,997 | 73.4 | % | 58.0 | % | ||||||||
| Plus: New notices |
161,023 | 163,701 | 113,104 | (1.6 | )% | 44.7 | % | ||||||||
| Less: Cures |
(92,052 | ) | (93,356 | ) | (78,461 | ) | (1.4 | )% | 19.0 | % | |||||
| Less: Paids (1) |
(19,948 | ) | (17,466 | ) | (10,262 | ) | 14.2 | % | 70.2 | % | |||||
| Less: Rescissions |
(7,678 | ) | (6,496 | ) | (1,181 | ) | 18.2 | % | — | ||||||
| Ending delinquent inventory, December 31 |
150,925 | 109,580 | 63,197 | 37.7 | % | 73.4 | % | ||||||||
| (1) | Claims paid are net of claim reversals and reinstatements. |
PMI’s modified pool default data are presented in the table below.
| As of December 31, | Percentage Change/ Variance |
||||||||||||||
| 2009 vs. 2008 |
2008 vs. 2007 |
||||||||||||||
| 2009 | 2008 | 2007 | |||||||||||||
| Modified pool with deductible |
|||||||||||||||
| Loans in default |
35,661 | 36,477 | 17,013 | (2.2 | )% | 114.4 | % | ||||||||
| Policies in force |
129,472 | 210,150 | 234,694 | (38.4 | )% | (10.5 | )% | ||||||||
| Default rate |
27.54 | % | 17.36 | % | 7.25 | % | 10.18 | pps | 10.11 | pps | |||||
| Modified pool without deductible |
|||||||||||||||
| Loans in default |
10,363 | 10,122 | 7,441 | 2.4 | % | 36.0 | % | ||||||||
| Policies in force |
48,628 | 55,438 | 66,421 | (12.3 | )% | (16.5 | )% | ||||||||
| Default rate |
21.31 | % | 18.26 | % | 11.20 | % | 3.05 | pps | 7.06 | pps | |||||
| Total modified pool |
|||||||||||||||
| Loans in default |
46,024 | 46,600 | 24,454 | (1.2 | )% | 90.6 | % | ||||||||
| Policies in force |
178,100 | 265,588 | 301,115 | (32.9 | )% | (11.8 | )% | ||||||||
| Default rate |
25.84 | % | 17.55 | % | 8.12 | % | 8.29 | pps | 9.43 | pps | |||||
The changes in PMI’s primary and modified pool default inventories and default rates in 2009 are discussed in Conditions and Trends Affecting our Business—U.S. Mortgage Insurance Operations—Defaults, above. Absent potential future restructuring activity, we expect modified pool loans in default to continue to increase due to sustained adverse market conditions. Deductibles on certain individual pool transactions were pierced in 2008 and 2009. We expect additional deductibles to be exceeded in 2010. For more discussion, see Conditions and Trends Affecting our Business—U.S. Mortgage Insurance Operations—Modified Pool, above. Total pool loans in default (which includes modified and other pool products) as of December 31, 2009, 2008 and 2007 were 51,104, 50,772 and 29,143, respectively. The default rates for total pool loans as of December 31, 2009, 2008 and 2007 were 22.3%, 15.5% and 7.76%, respectively.
88
Table of Contents
Total underwriting and operating expenses—PMI’s total underwriting and operating expenses are as follows:
| 2009 | 2008 | 2007 | Percentage Change |
||||||||||||
| 2009 vs. 2008 |
2008 vs. 2007 |
||||||||||||||
| (Dollars in millions) | |||||||||||||||
| Amortization of deferred policy acquisition costs |
$ | 15.2 | $ | 15.6 | $ | 84.2 | (2.6 | )% | (81.5 | )% | |||||
| Other underwriting and operating expenses |
128.2 | 123.5 | 95.7 | 3.8 | % | 29.0 | % | ||||||||
| Total underwriting and operating expenses |
$ | 143.4 | $ | 139.1 | $ | 179.9 | 3.1 | % | (22.7 | )% | |||||
| Policy acquisition costs incurred and deferred |
$ | 24.2 | $ | 37.4 | $ | 51.2 | (35.3 | )% | (27.0 | )% | |||||
PMI’s policy acquisition costs are those costs that vary with, and are related to, our acquisition, underwriting and processing of new mortgage insurance policies, including contract underwriting and sales related activities. To the extent we provided contract underwriting services on loans that did not require mortgage insurance, associated underwriting costs were not deferred. We defer policy acquisition costs when incurred and amortize these costs in proportion to estimated gross profits for each policy year by type of insurance contract (i.e., monthly, annual and single premium). Policy acquisition costs incurred and deferred are variable and fluctuate with the volume of new insurance applications processed and NIW. The decrease in amortization of deferred policy acquisition costs for 2009 compared to 2008 was primarily due to an increase we made in the second half of 2008 to the period over which we amortize deferred policy acquisition costs in our U.S. Mortgage Insurance Operations as a result of higher persistency levels. PMI’s deferred policy acquisition cost asset was $41.3 million, $32.3 million and $10.5 million as of December 31, 2009, 2008 and 2007, respectively. The decrease in amortization of deferred policy acquisition costs in 2008 compared to 2007 was primarily due to our $33.6 million impairment in 2007 of PMI’s deferred policy acquisition costs associated with PMI’s 2007 book year and the increase we made in the second half of 2008 to the period over which we amortize deferred policy acquisition costs in our U.S. Mortgage Insurance Operations as a result of higher persistency levels.
Other underwriting and operating expenses generally consist of all costs that are not attributable to the acquisition of new business and are recorded as expenses when incurred. Other underwriting and operating expenses increased in 2009 compared to 2008 primarily as a result of lower expense allocations to the Corporate and Other segment in 2009. Our change in expense allocation beginning January 1, 2009 was in response to the change in the focus of our business to U.S. mortgage insurance following the sale of the Australia and Asia operations resulting in less costs being allocated to our Corporate and Other segment. Other underwriting and operating expenses increased in 2008 compared to 2007 primarily as a result of severance costs associated with our Voluntary Early Retirement Program and involuntary terminations.
Prior to April 2009, when we ceased offering contract underwriting services, PMI incurred underwriting expenses related to contract underwriting services for mortgage loans without mortgage insurance coverage. These costs were allocated to PMI Mortgage Services Co., or MSC, which is reported in our Corporate and Other segment, thereby reducing PMI’s underwriting and operating expenses. Contract underwriting expenses allocated to MSC were $2.1 million in 2009, $9.7 million in 2008 and $13.1 million in 2007.
Equity in (losses) earnings from unconsolidated subsidiaries—U.S. Mortgage Insurance Operations’ equity in (losses) earnings from unconsolidated subsidiaries is derived entirely from the results of operations of CMG MI. Equity in losses from CMG MI were $11.5 million in 2009 compared to equity in earnings of $6.5 million in 2008 and $17.1 million in 2007. Equity in losses from CMG MI in 2009 was primarily the result of higher losses and LAE recorded due to increases in CMG MI’s default inventory.
Income taxes—U.S. Mortgage Insurance Operations’ statutory tax rate is 35%. The tax benefit recorded in our U.S. Mortgage Insurance Operations segment reflects tax benefits attributable to tax exempt interest and
89
Table of Contents
dividends and favorable interim period adjustments, resulting in an effective tax rate of 36.8% for 2009. In addition, certain items of taxable income were refined when our 2008 tax return was filed during the third quarter of 2009, and have reduced the effective tax rate for 2009.
Ratios—PMI’s loss, expense and combined ratios are shown below.
| As of December 31, | Variance | ||||||||||||
| 2009 vs. 2008 |
2008 vs. 2007 | ||||||||||||
| 2009 | 2008 | 2007 | |||||||||||
| Loss ratio |
246.6 | % | 237.7 | % | 136.9 | % | 8.9pps | 100.8pps | |||||
| Expense ratio |
20.9 | % | 18.5 | % | 22.5 | % | 2.4 pps | (4.0) pps | |||||
| Combined ratio |
267.5 | % | 256.2 | % | 159.4 | % | 11.3pps | 96.8 pps | |||||
PMI’s loss ratio is the ratio of losses and LAE to premiums earned. The loss ratio increased in 2009 compared to 2008 as a result of continued elevated levels of losses and LAE combined with lower premiums earned. The loss ratio increased in 2008 compared to 2007 primarily as a result of higher losses and LAE and somewhat lower premiums earned.
PMI’s expense ratio is the ratio of total underwriting and operating expenses to net premiums written. The increase in PMI’s expense ratio in 2009 compared to 2008 was primarily due to a decrease in net premiums written and an increase in deferred compensation related expenses due to fewer costs being allocated to the holding company beginning in January of 2009. The decrease in PMI’s expense ratio in 2008 compared to 2007 was primarily due to decreases in amortization of deferred policy acquisition costs and employee severance and associated compensation expenses.
Primary NIW—The components of PMI’s primary NIW are as follows:
| 2009 | 2008 | 2007 | Percent Change |
||||||||||||
| 2009 vs. 2008 |
2008 vs. 2007 |
||||||||||||||
| (Dollar in millions) | |||||||||||||||
| Primary NIW: |
|||||||||||||||
| Flow channel |
$ | 8,993 | $ | 22,197 | $ | 37,584 | (59.5 | )% | (40.9 | )% | |||||
| Structured finance channel |
1 | 442 | 8,549 | (99.8 | )% | (94.8 | )% | ||||||||
| Total primary NIW |
$ | 8,994 | $ | 22,639 | $ | 46,133 | (60.3 | )% | (50.9 | )% | |||||
The decrease in PMI’s primary flow NIW in 2009 compared to 2008 was principally due to PMI’s capital preservation initiatives as well as changes to PMI’s underwriting guidelines that reduced the types of loans that PMI would insure and customer management strategies. PMI has ceased offering products through its structured finance channel. The decrease in PMI’s primary flow NIW in 2008 compared to 2007 was principally due to changes to PMI’s underwriting guidelines that were implemented during 2007 and 2008 that decreased the types of loans that PMI would insure and, to a lesser extent, the continuing slowdown in the mortgage origination and non-agency mortgage capital markets, as well as increased competition from the Federal Housing Administration’s mortgage insurance programs since early 2008.
90
Table of Contents
Insurance and risk in force—PMI’s primary insurance in force and primary and pool risk in force are shown in the table below.
| As of December 31, | Percentage Change/ Variance |
|||||||||||||||||
| 2009 vs. 2008 |
2008 vs. 2007 |
|||||||||||||||||
| 2009 | 2008 | 2007 | ||||||||||||||||
| (Dollars in millions) | ||||||||||||||||||
| Primary insurance in force |
$ | 113,694 | $ | 124,265 | $ | 123,623 | (8.5 | )% | 0.5 | % | ||||||||
| Primary risk in force |
27,794 | 30,605 | 30,967 | (9.2 | )% | (1.2 | )% | |||||||||||
| Pool risk in force* |
1,073 | 2,722 | 3,464 | (60.6 | )% | (21.4 | )% | |||||||||||
| Policy cancellations—primary (year-to-date) |
19,565 | 21,997 | 25,145 | (11.1 | )% | (12.5 | )% | |||||||||||
| Persistency—primary |
84.3 | % | 82.2 | % | 75.5 | % | 2.1 | pps | 6.7 | pps | ||||||||
| * | Includes modified pool and other pool risk in force. As of September 30, 2008, we adjusted pool risk in force to reflect the effect of loan repayments on risk limits. |
Primary insurance in force and risk in force as of December 31, 2009 decreased from December 31, 2008 primarily as a result of policy terminations exceeding NIW, partially offset by higher persistency. The increase in PMI’s persistency rate in 2009 reflects lower levels of residential mortgage refinance activity in the insured market and home price declines. Primary insurance in force as of December 31, 2008 increased from December 31, 2007 primarily as a result of higher persistency. Primary risk in force as of December 31, 2008 decreased from December 31, 2007 primarily as a result of declining coverage due to home price declines in 2008.
Modified pool risk in force as of December 31, 2009 was $0.8 billion compared to $2.0 billion and $2.8 billion as of December 31, 2008 and December 31, 2007, respectively. The decrease in modified pool risk in force in 2009 compared to 2008 was primarily due to increasing loss reserves on certain pool contracts and the restructuring of certain modified pool contracts.
The following table sets forth the percentages of PMI’s primary risk in force as of December 31, 2009, 2008 and 2007 in the ten states with the highest risk in force as of December 31, 2009 in PMI’s primary portfolio:
| Percent of Primary Risk in Force as of December 31, 2009 |
Percent of Primary Risk in Force as of December 31, 2008 |
Percent of Primary Risk in Force as of December 31, 2007 |
|||||||
| Florida |
10.1 | % | 10.3 | % | 10.8 | % | |||
| California |
7.7 | % | 8.0 | % | 8.1 | % | |||
| Texas |
7.5 | % | 7.3 | % | 7.2 | % | |||
| Illinois |
5.2 | % | 5.2 | % | 5.0 | % | |||
| Georgia |
4.7 | % | 4.7 | % | 4.7 | % | |||
| New York |
4.0 | % | 3.9 | % | 3.6 | % | |||
| Ohio |
3.9 | % | 3.8 | % | 3.8 | % | |||
| Pennsylvania |
3.4 | % | 3.3 | % | 3.3 | % | |||
| New Jersey |
3.3 | % | 3.2 | % | 3.0 | % | |||
| Washington |
3.2 | % | 3.1 | % | 3.1 | % |
91
Table of Contents
Credit and portfolio characteristics—Less-than-A quality loans generally include loans with credit scores less than 620. In 2009, PMI’s NIW consisted of significantly lower percentages of less-than-A quality and Alt-A loans than in 2008 primarily as a result of PMI’s pricing and underwriting guideline changes. The following table presents PMI’s less-than-A quality and Alt-A loans as percentages of primary NIW from its flow and structured finance channels:
| 2009 | 2008 | 2007 | ||||||||||||||||
| (Dollars in millions) | ||||||||||||||||||
| Less-than-A quality loan amounts and as a percentage of : |
||||||||||||||||||
| Primary NIW- flow channel |
$ | 3 | 0.0 | % | $ | 296 | 1.3 | % | $ | 3,067 | 8.2 | % | ||||||
| Primary NIW- structured finance channel |
— | 0.0 | % | 26 | 5.8 | % | 1,605 | 18.8 | % | |||||||||
| Total primary NIW |
$ | 3 | 0.0 | % | $ | 322 | 1.4 | % | $ | 4,672 | 10.1 | % | ||||||
| Alt-A loan amounts and as a percentage of: |
||||||||||||||||||
| Primary NIW- flow channel |
$ | 14 | 0.2 | % | $ | 1,195 | 5.4 | % | $ | 11,242 | 29.9 | % | ||||||
| Primary NIW- structured finance channel |
— | 0.0 | % | 16 | 3.6 | % | 1,397 | 15.9 | % | |||||||||
| Total primary NIW |
$ | 14 | 0.2 | % | $ | 1,211 | 5.3 | % | $ | 12,639 | 27.4 | % | ||||||
The following table presents PMI’s ARMs (mortgage loans with interest rates that may adjust prior to their fifth anniversary) and Above-97s (loans exceeding 97% LTV) as percentages of primary NIW from its flow and structured finance channels:
| 2009 | 2008 | 2007 | ||||||||||||||||
| (Dollars in millions) | ||||||||||||||||||
| ARM amounts and as a percentage of : |
||||||||||||||||||
| Primary NIW- flow channel |
$ | 25 | 0.3 | % | $ | 261 | 1.2 | % | $ | 1,907 | 5.1 | % | ||||||
| Primary NIW- structured finance channel |
— | 0.0 | % | 34 | 7.7 | % | 2,238 | 26.2 | % | |||||||||
| Total primary NIW |
$ | 25 | 0.3 | % | $ | 295 | 1.3 | % | $ | 4,145 | 9.0 | % | ||||||
| Above-97 loan amounts and as a percentage of: |
||||||||||||||||||
| Primary NIW- flow channel |
$ | — | 0.0 | % | $ | 974 | 4.4 | % | $ | 11,757 | 31.3 | % | ||||||
| Primary NIW- structured finance channel |
— | 0.0 | % | 113 | 25.6 | % | 2,821 | 33.0 | % | |||||||||
| Total primary NIW |
$ | — | 0.0 | % | $ | 1,087 | 4.8 | % | $ | 14,578 | 31.6 | % | ||||||
The decreases shown above in the percentages of PMI’s NIW consisting of ARM and Above-97 loans were driven primarily by changes in PMI’s pricing and underwriting guidelines. We no longer insure loans with LTVs in excess of 95%.
The following table presents PMI’s interest only loans as percentages of primary NIW from its flow and structured finance channels and payment option ARMs as a percentage of its primary NIW from its flow channel:
| 2009 | 2008 | 2007 | ||||||||||||||||
| (Dollars in millions) | ||||||||||||||||||
| Interest only loan amounts and as a percentage of: |
||||||||||||||||||
| Primary NIW- flow channel |
$ | 14 | 0.2 | % | $ | 1,173 | 5.3 | % | $ | 8,296 | 22.1 | % | ||||||
| Primary NIW- structured finance channel |
— | 0.0 | % | 11 | 2.5 | % | 1,025 | 12.0 | % | |||||||||
| Total primary NIW |
$ | 14 | 0.2 | % | $ | 1,184 | 5.2 | % | $ | 9,321 | 20.2 | % | ||||||
| Payment option ARMs amounts and as a percentage of: |
||||||||||||||||||
| Primary NIW- flow channel |
$ | 3 | 0.0 | % | $ | 54 | 0.2 | % | $ | 1,252 | 3.3 | % | ||||||
| Total primary NIW |
$ | 3 | 0.0 | % | $ | 54 | 0.2 | % | $ | 1,252 | 2.7 | % | ||||||
92
Table of Contents
The year over year decreases shown above in the percentage of PMI’s NIW consisting of interest only and payment option ARM loans were driven primarily by changes in PMI’s pricing and underwriting guidelines.
The following table presents PMI’s less-than-A quality, Alt-A, ARM, Above-97, interest only and payment option ARM loans as percentages of primary risk in force:
| December 31, | |||||||||
| 2009 | 2008 | 2007 | |||||||
| As a percentage of primary risk in force: |
|||||||||
| Less-than-A Quality loans (FICO scores below 620) |
6.8 | % | 7.1 | % | 8.1 | % | |||
| Less-than-A Quality loans with FICO scores below 575* |
1.7 | % | 1.8 | % | 2.2 | % | |||
| Alt-A loans |
17.0 | % | 18.8 | % | 22.8 | % | |||
| ARMs (excluding 2/28 Hybrid ARMs) |
7.5 | % | 8.0 | % | 9.5 | % | |||
| 2/28 Hybrid ARMs** |
1.8 | % | 2.3 | % | 3.3 | % | |||
| Above-97s (above 97% LTV’s) |
20.4 | % | 21.5 | % | 24.6 | % | |||
| Interest Only |
10.9 | % | 11.8 | % | 14.2 | % | |||
| Payment Option ARMs |
3.1 | % | 3.4 | % | 3.8 | % | |||
| * | Less-than-A quality loans with FICO scores below 575 is a subset of PMI’s less-than-A quality loan portfolio. |
| ** | 2/28 Hybrid ARMs are loans whose interest rate is fixed for an initial two year period and floats thereafter. |
International Operations
International Operations’ results include continuing operations of PMI Europe and PMI Canada and discontinued operations of PMI Australia and PMI Asia:
| 2009 | 2008 | 2007 | Percentage Change |
|||||||||||||||
| 2009 vs. 2008 |
2008 vs. 2007 |
|||||||||||||||||
| (USD n millions) | ||||||||||||||||||
| PMI Europe |
$ | 19.8 | $ | (80.3 | ) | $ | (33.4 | ) | (124.7 | )% | 140.4 | % | ||||||
| PMI Canada |
(2.1 | ) | (6.7 | ) | (1.9 | ) | (68.7 | )% | — | |||||||||
| Income (loss) from continuing operations |
17.7 | (87.0 | ) | (35.3 | ) | (120.3 | )% | 146.5 | % | |||||||||
| (Loss) income from discontinued operations |
(5.3 | ) | (17.2 | ) | 90.3 | (69.2 | )% | (119.0 | )% | |||||||||
| Net income (loss)* |
$ | 12.4 | $ | (104.2 | ) | $ | 55.0 | (111.9 | )% | — | ||||||||
| * | May not total due to rounding. |
93
Table of Contents
PMI Europe
The table below sets forth the financial results of PMI Europe:
| 2009 | 2008 | 2007 | Percentage Change |
|||||||||||||||
| 2009 vs. 2008 |
2008 vs. 2007 |
|||||||||||||||||
| (USD in millions) | ||||||||||||||||||
| Net premiums written |
$ | (7.3 | ) | $ | 15.9 | $ | 14.1 | (145.9 | )% | 12.8 | % | |||||||
| Premiums earned |
$ | 10.3 | $ | 13.5 | $ | 14.4 | (23.7 | )% | (6.3 | )% | ||||||||
| Net gains (losses) from credit default swaps |
31.6 | (11.3 | ) | (14.4 | ) | — | (21.5 | )% | ||||||||||
| Net investment income |
4.9 | 10.4 | 8.6 | (52.9 | )% | 20.9 | % | |||||||||||
| Net realized losses |
(1.7 | ) | (4.2 | ) | (0.2 | ) | (59.5 | )% | — | |||||||||
| Other loss |
— | — | (0.1 | ) | — | (100.0 | )% | |||||||||||
| Total revenues |
45.1 | 8.4 | 8.3 | — | 1.2 | % | ||||||||||||
| Losses and LAE |
14.1 | 63.2 | 26.8 | (77.7 | )% | 135.8 | % | |||||||||||
| Other underwriting and operating expenses |
12.4 | 28.8 | 17.5 | (56.9 | )% | 64.6 | % | |||||||||||
| Total losses and expenses |
26.5 | 92.0 | 44.3 | (71.2 | )% | 107.7 | % | |||||||||||
| Income (loss) before taxes |
18.6 | (83.6 | ) | (36.0 | ) | (122.2 | )% | 132.2 | % | |||||||||
| Income tax benefit |
(1.2 | ) | (3.3 | ) | (2.6 | ) | (63.6 | )% | 26.9 | % | ||||||||
| Net income (loss) |
$ | 19.8 | $ | (80.3 | ) | $ | (33.4 | ) | (124.7 | )% | 140.4 | % | ||||||
The average USD/Euro currency exchange rate was 1.3949 in 2009, 1.4712 in 2008 and 1.3709 in 2007. The changes in the average USD/Euro currency exchange rates from 2008 to 2009 negatively impacted PMI Europe’s financial results by $1.1 million in 2009. The changes in the average USD/Euro currency exchange rates from 2007 to 2008 negatively impacted PMI Europe’s financial results by $5.5 million in 2008.
Premiums written and earned—Net premiums written and earned decreased in 2009 compared to 2008 due to the decision to cease writing new business in Europe and the commutation of two reinsurance transactions. Net premiums written were negative in 2009 due to the commutations that resulted in reversals of premiums written. As the total European book of business continues to age, we expect premiums earned and risk in force to continue to decline. Net premiums written increased in 2008 compared to 2007 primarily due to growth in new reinsurance written in the U.K.
Net gains (losses) from credit default swaps—PMI Europe is a party to seven credit default swap (“CDS”) contracts that are classified as derivatives as of December 31, 2009 compared to 14 transactions as of December 31, 2008. We recorded a net gain of $31.6 million in 2009 compared to a net loss of $11.3 million for 2008 on these CDS contracts. Net gains in 2009 from CDS contracts were primarily a result of changes in the fair value of the derivative contracts in 2009 and the negotiated termination of a number of these contracts. The credit spreads of European residential mortgage-backed securities (“RMBS”) narrowed significantly during 2009. The changes in fair value of our CDS contracts resulted in part from the change in credit spreads of the underlying securities but primarily from the reversal of unrealized losses as the contracts continue to age. Net losses during 2008 were primarily a result of changes in the estimated fair value of these contracts during the period resulting from the widening of our market spreads during the period.
Net investment income—PMI Europe’s net investment income consists primarily of interest income from cash and short term investments and foreign exchange gains or losses arising from the revaluation of short term monetary assets. The pre-tax book yield was 2.73%, 3.46% and 4.45% as of December 31, 2009, 2008 and 2007, respectively. The decrease in book yield was primarily due to lower interest rates and a higher concentration of cash and cash equivalents in our investment portfolio. The decrease in net investment income in 2009 compared
94
Table of Contents
to 2008 was primarily due to lower interest rates, a higher concentration of cash and cash equivalents in our investment portfolio and the reduction in the value of the investment portfolio due to cash outflows arising primarily from terminations and claim payments. The increase in net investment income in 2008 compared to 2007 was primarily due to foreign currency re-measurement from Sterling and U.S. dollar denominated investments to Euros.
Losses and LAE—PMI Europe’s losses and LAE includes claim payments, changes in reserves and a premium deficiency reserve of $2.4 million on PMI Europe’s primary portfolio. The premium deficiency reserve relates to a commutation transaction that resulted in a decrease in unearned premium reserves. Losses and LAE in 2009 were primarily driven by reserve increases relating to new defaults in PMI Europe’s Italian mortgage insurance portfolio and U.S. sub-prime reinsurance portfolio. Claim payments (excluding payments for CDS accounted as derivatives) totaled $59.2 million in 2009 compared to $14.4 million and $5.1 million in 2008 and 2007, respectively. The increase in claims paid was primarily due to payments made during 2009 in respect of the reinsurance of U.S. sub-prime exposures. Losses and LAE in 2008 were primarily driven by increases in reserves relating to PMI Europe’s reinsurance of U.S. sub-prime exposures.
Underwriting and operating expenses—PMI Europe’s underwriting and operating expenses decreased in 2009 compared to 2008 due to the cessation of new business writings, partially offset by $1.2 million of deferred acquisition costs impairment associated with recording a premium deficiency reserve. The increase in underwriting and operating expenses in 2008 compared to 2007 was primarily due to severance costs related to the restructuring of PMI Europe and the strengthening of the Euro relative to the U.S. dollar.
Income taxes—PMI has historically provided for U.S. federal income tax on the undistributed earnings from its foreign subsidiaries, except to the extent such earnings are reinvested indefinitely. During the quarter ended June 30, 2009, we determined that earnings from foreign subsidiaries, principally PMI Europe, were no longer deemed “permanently reinvested” resulting in an additional tax expense. In addition, we refined certain estimates as a result of preparing our 2008 income tax return which resulted in additional tax benefits for 2009.
Risk in force—PMI Europe’s risk in force was $4.9 billion as of December 31, 2009 compared to $7.4 billion at December 31, 2008 and $9.4 billion as of December 31, 2007. The decrease in 2009 was primarily due to the commutation of a number of CDS and reinsurance transactions and as a result of a counterparty exercising a call option in respect of two CDS transactions. The decrease in 2008 was primarily due to a number of credit default swap contracts being called as scheduled, limited new business writings and weakening of the Euro against the U.S. dollar.
PMI Canada
The table below sets forth the financial results of PMI Canada. PMI Canada operated from 2007 to 2008, and is not writing new business.
| 2009 | 2008 | 2007 | Percentage Change |
|||||||||||||||
| 2009 vs. 2008 |
2008 vs. 2007 |
|||||||||||||||||
| (USD in millions) | ||||||||||||||||||
| Total (expenses) revenues |
$ | (0.3 | ) | $ | 7.4 | $ | 2.2 | (104.1 | )% | — | ||||||||
| Losses and LAE |
1.9 | 0.3 | — | — | 100.0 | % | ||||||||||||
| Underwriting and operating expenses |
1.4 | 13.8 | 4.1 | (89.9 | )% | — | ||||||||||||
| Total losses and expenses |
3.3 | 14.1 | 4.1 | (76.6 | )% | — | ||||||||||||
| Loss before taxes |
(3.6 | ) | (6.7 | ) | (1.9 | ) | (46.3 | )% | — | |||||||||
| Income tax benefit |
(1.5 | ) | — | — | — | — | ||||||||||||
| Net loss |
$ | (2.1 | ) | $ | (6.7 | ) | $ | (1.9 | ) | (68.7 | )% | — | ||||||
95
Table of Contents
Total revenues—Total revenues decreased in 2009 compared to 2008 primarily due to foreign currency re-measurement losses as a result of the weakening of the U.S. dollar and a decline in investment income. PMI Canada also had a pre-tax loss on investments of $1.0 million in 2009 due to impairments as a result of market volatility. Total revenues increased in 2008 compared to 2007 primarily due to foreign currency re-measurement gains from U.S. dollar denominated cash and cash equivalents and from premiums earned on a 2008 bulk primary transaction.
Losses and LAE—PMI Canada recorded a premium deficiency reserve of $1.4 million in 2009 as a result of the reassessment of loss projections.
Underwriting and operating expenses—The decrease in underwriting and operating expenses in 2009 compared to 2008 was primarily due to PMI Canada’s cessation of new business writings. The increase in underwriting and operating expenses in 2008 compared to 2007 was primarily due to severance costs.
Discontinued Operations
During the third quarter of 2008, we reported PMI Australia and PMI Asia as discontinued operations. Where applicable, the notes to the consolidated financial statements have been restated to reflect these discontinued operations for all periods presented. A summary of the composition of operating results included in discontinued operations is as follows:
| Year Ended December 31, | |||||||||||
| 2009 | 2008 | 2007 | |||||||||
| (Dollars in thousands) | |||||||||||
| PMI Australia |
$ | — | $ | 51,114 | $ | 80,005 | |||||
| PMI Asia |
— | 10,435 | 10,265 | ||||||||
| Income from discontinued operations |
$ | — | $ | 61,549 | $ | 90,270 | |||||
| Loss from sale of discontinued operations, net of taxes |
(5,335 | ) | (78,749 | ) | — | ||||||
| Total (loss) income from discontinued operations |
$ | (5,335 | ) | $ | (17,200 | ) | $ | 90,270 | |||
Summarized below are the overall operating components for each entity.
The following table represents PMI Australia’s results of operations, recorded as discontinued operations for the periods presented:
| 2009 | 2008 | 2007 | |||||||||
| (Dollars in thousands) | |||||||||||
| Premiums earned |
$ | — | $ | 151,018 | $ | 167,106 | |||||
| Net investment income |
— | 68,178 | 72,501 | ||||||||
| Other (loss) income |
— | (28,391 | ) | 1,139 | |||||||
| Total revenues |
— | 190,805 | 240,746 | ||||||||
| Losses and loss adjustment expenses |
— | 73,296 | 77,500 | ||||||||
| Other underwriting and operating expenses |
— | 44,105 | 48,632 | ||||||||
| Income before income taxes from discontinued operations |
— | 73,404 | 114,614 | ||||||||
| Income tax expense |
— | 22,290 | 34,609 | ||||||||
| Income from discontinued operations |
$ | — | $ | 51,114 | $ | 80,005 | |||||
| Loss on sale of PMI Australia before income tax |
— | (25,389 | ) | — | |||||||
| Income tax expense |
6,594 | 39,178 | — | ||||||||
| Loss on sale of PMI Australia |
$ | (6,594 | ) | $ | (64,567 | ) | $ | — | |||
96
Table of Contents
In the third quarter of 2009, we recorded tax expense of $6.6 million due to a refinement to foreign tax credits related to the sale of PMI Australia, in connection with the filing of our 2008 annual tax return.
The following table represents PMI Asia’s results of operations, recorded as discontinued operations for the periods presented:
| 2009 | 2008 | 2007 | ||||||||||
| (Dollars in thousands) | ||||||||||||
| Total revenues |
$ | — | $ | 15,147 | $ | 13,669 | ||||||
| Losses and loss adjustment expenses |
— | 23 | (43 | ) | ||||||||
| Other underwriting and operating expenses |
— | 3,316 | 1,989 | |||||||||
| Income before income taxes from discontinued operations |
— | 11,808 | 11,723 | |||||||||
| Income taxes |
— | 1,373 | 1,458 | |||||||||
| Income from discontinued operations |
$ | — | $ | 10,435 | $ | 10,265 | ||||||
| Loss on sale of PMI Asia before income tax |
(23 | ) | (10,000 | ) | — | |||||||
| Income tax (benefit) expense |
(1,282 | ) | 4,182 | — | ||||||||
| Gain (loss) on sale of PMI Asia |
$ | 1,259 | $ | (14,182 | ) | — | ||||||
In the third quarter of 2009, we recorded a tax benefit of $1.3 million. The benefit was due to a refinement of the tax estimate associated with the sale of PMI Asia in connection with the filing of our 2008 tax return.
97
Table of Contents
Corporate and Other
Effective December 31, 2009, we combined the “Financial Guaranty” segment into a “Corporate and Other” segment for all periods presented. The results of our Corporate and Other segment include income and operating expenses related to contract underwriting, which we discontinued in April 2009, and net investment income, interest expense, corporate overhead of The PMI Group, our holding company, and equity in earnings (losses) from FGIC and our former investment in RAM Re, whose carrying values are zero as a result of our impairments of the investments in 2008. To the extent that our carrying value in our FGIC investment remains zero, we will not recognize in future periods our proportionate share of FGIC’s losses, if any. Having completed its runoff activities in 2008, we now report the results of operations of PMI Guaranty as discontinued operations in the Corporate and Other segment and in the consolidated statement of operations for all periods presented. Our Corporate and Other segment results are summarized as follows:
| 2009 | 2008 | 2007 | Percentage Change |
|||||||||||||||
| 2009 vs. 2008 |
2008 vs. 2007 |
|||||||||||||||||
| (Dollars in millions) | ||||||||||||||||||
| Net investment income |
$ | 3.4 | $ | 10.3 | $ | 11.4 | (67.0 | )% | (9.6 | )% | ||||||||
| Net realized investment (losses) gains |
— | (1.0 | ) | 9.4 | (100.0 | )% | (110.6 | )% | ||||||||||
| Impairment of unconsolidated subsidiaries |
— | (90.9 | ) | (38.5 | ) | (100.0 | )% | 136.1 | % | |||||||||
| Change in fair value of certain debt instruments |
16.5 | 123.6 | — | (86.7 | )% | — | ||||||||||||
| Other income |
2.4 | 10.5 | 14.4 | (77.1 | )% | (27.1 | )% | |||||||||||
| Total revenues (expenses) |
22.3 | 52.5 | (3.3 | ) | (57.5 | )% | — | |||||||||||
| Share-based compensation expense |
3.4 | 8.8 | 16.1 | (61.4 | )% | (45.3 | )% | |||||||||||
| Other operating expenses |
12.6 | 46.5 | 63.2 | (72.9 | )% | (26.4 | )% | |||||||||||
| Total other operating expenses |
16.0 | 55.3 | 79.3 | (71.1 | )% | (30.3 | )% | |||||||||||
| Interest expense |
43.0 | 40.8 | 33.3 | 5.4 | % | 22.5 | % | |||||||||||
| Total expenses |
59.0 | 96.1 | 112.6 | (38.6 | )% | (14.7 | )% | |||||||||||
| Loss before equity in losses from unconsolidated subsidiaries and income taxes |
(36.7 | ) | (43.6 | ) | (115.9 | ) | (15.8 | )% | (62.4 | )% | ||||||||
| Equity in losses from unconsolidated subsidiaries |
(0.6 | ) | (58.3 | ) | (758.6 | ) | (99.0 | )% | (92.3 | )% | ||||||||
| Net loss before income taxes |
(37.3 | ) | (101.9 | ) | (874.5 | ) | (63.4 | )% | (88.3 | )% | ||||||||
| Income tax benefit |
(21.5 | ) | (11.3 | ) | (91.9 | ) | 90.3 | % | (87.7 | )% | ||||||||
| Loss from continuing operations |
(15.8 | ) | (90.6 | ) | (782.6 | ) | (82.6 | )% | (88.4 | )% | ||||||||
| (Loss) income from discontinued operations, net of taxes |
— | (24.1 | ) | 3.1 | (100.0 | )% | — | |||||||||||
| Net loss |
$ | (15.8 | ) | $ | (114.7 | ) | $ | (779.5 | ) | (86.2 | )% | (85.3 | )% | |||||
Net investment income—Net investment income decreased in 2009 compared to 2008 due primarily to decreases in investable assets at the holding company and our investment book yield. Net investment income decreased in 2008 compared to 2007 due primarily to a decrease in book yield on our fixed income securities as well as lower rates on cash and cash equivalents.
Impairment of unconsolidated subsidiaries—The impairment of unconsolidated subsidiaries in 2008 was primarily due to impairments of our investment in FGIC of $88.0 million and our investment in RAM Re $2.9 million. The impairment of unconsolidated subsidiaries in 2007 was driven by the other-than-temporary impairment of our investment in RAM Re of $38.5 million.
Change in fair value of certain debt instruments—The change in fair value of certain debt instruments in 2009 and 2008 resulted from our adoption of the fair value option outlined in Topic 825, effective January 1, 2008. Fluctuations in our credit spreads drove the changes in fair value of our debt in 2009. In 2009, we
98
Table of Contents
experienced net gains (representing a decline in fair value) of $16.5 million, due largely to the widening of credit spreads in the period. The changes in fair value of $123.6 million in 2008 were primarily due to changes in interest rates and credit spreads associated with our senior debt.
Share-based compensation expense—The sequential decreases in share-based compensation expense in 2009 and 2008 were primarily due to decreases in the fair value of share-based compensation and the number of stock units granted in 2009 and 2008.
Other operating expenses—Other operating expenses decreased in 2009 compared to 2008 primarily due to our change in expense allocation beginning on January 1, 2009 in response to changing the focus of our business to our U.S. Mortgage Insurance Operations, following the sale of our Australian and Asian operations in 2008. In addition, in April 2009, we ceased offering contract underwriting services which further reduced expenses in this segment. The decrease in other operating expenses in 2008 compared to 2007 was due primarily to our receipt in 2008 of $10.9 million of litigation settlement proceeds, and a decrease in contract underwriting remedies paid in 2008.
Interest expense—As a result of our initial draw down of $200 million on our line of credit in the second quarter of 2008 and subsequent repayment of $75 million in 2009, we paid higher interest and fees in 2009 than in 2008. Interest expense increased in 2008 compared to 2007 due to our initial draw down of $200 million on our line of credit in the second quarter of 2008, which resulted in higher interest and fees in 2008.
Equity in losses from unconsolidated subsidiaries—The equity in losses from unconsolidated subsidiaries decreased in 2008 compared to 2007 due to the impairment of our investments in FGIC and RAM Re in 2008. The equity in losses from unconsolidated subsidiaries in 2007 were due to unrealized mark-to-market losses related to FGIC and RAM Re’s derivative contracts.
Having completed its runoff activities, we now report the results of operations of PMI Guaranty as discontinued operations in the Corporate and Other segment and in the consolidated statement of operations for all periods presented.
Liquidity and Capital Resources
Sources and Uses of Funds
The PMI Group Liquidity—The PMI Group is a holding company and conducts its business operations through various subsidiaries. Historically, The PMI Group’s liquidity is primarily dependent upon: (i) The PMI Group’s subsidiaries’ ability to pay dividends to The PMI Group; (ii) financing activities in the capital markets; (iii) maturing or refunded investments and investment income from The PMI Group’s investment portfolio; and (iv) receivables from MIC with respect to tax sharing agreements. The PMI Group’s ability to access dividend and financing sources is limited and depends on, among other things, the financial performance of The PMI Group’s subsidiaries, regulatory restrictions on the ability of The PMI Group’s insurance subsidiaries to pay dividends, The PMI Group’s and its subsidiaries’ ratings by the rating agencies, and restrictions and agreements to which The PMI Group or its subsidiaries are subject that restrict their ability to pay dividends, incur debt or issue equity securities. MIC did not pay dividends to The PMI Group in 2009 and we do not expect that MIC will be able to pay dividends during 2010. In addition, the economic downturn has reduced returns on The PMI Group’s investment portfolio, and we expect these returns could continue to be adversely affected to the extent the dislocation in the credit markets and economic downturn continues. See Part I, Item 1A. Risk Factors—We may face liquidity issues at our holding company, The PMI Group, and if an event of default were to occur under our credit facility, our business would suffer.
The PMI Group’s principal uses of liquidity are the payment of operating costs, principal and interest on its capital instruments and dividends to shareholders, repurchases of its common shares, purchases of investments, and capital investments in and for its subsidiaries. The PMI Group’s available funds, consisting of cash and cash
99
Table of Contents
equivalents and investments, were $61.5 million at December 31, 2009 compared to $235.9 million at December 31, 2008. The decrease in The PMI Group’s available funds is primarily due to the $75 million purchase of the QBE note described below and the $75 million repayment on the credit facility.
We believe there is currently sufficient liquidity at the holding company to pay holding company expenses (including interest expense on its outstanding debt) in 2010 and there are sufficient assets at the insurance company level for PMI to meet its obligations in 2010.
Credit Facility
On May 29, 2009, our Amended and Restated Credit Agreement (the “Amended Agreement”), which replaced our prior credit facility in its entirety, became effective. In connection with the Amended Agreement, MIC and The PMI Group entered into a Note Purchase Agreement pursuant to which The PMI Group purchased the contingent note (the “QBE Note”) described below under “The QBE Note” from MIC. Upon the completion of the sale of the QBE Note to The PMI Group from MIC, The PMI Group granted a security interest in the QBE Note in favor of the Administrative Agent, for the benefit of the lenders under the Amended Agreement. We currently have $125 million outstanding under the Amended Agreement, which is the total amount of the lenders’ commitments thereunder.
Failure to comply with the covenants in the Amended Agreement or failure to pay amounts due would be events of default under our credit facility. Upon an event of default, we would likely be required to repay all outstanding indebtedness under the Amended Agreement and the lenders under the Amended Agreement would have the right to terminate their loan commitments under the facility. In addition, an event of default under the facility, if not cured within 30 days after notice from the trustee for our senior notes or from holders of our senior notes, would cause an event of default under our outstanding senior notes and could require us to repay all our outstanding senior notes. We currently do not have sufficient funds at our holding company to repay the amounts outstanding under the Amended Agreement.
The Amended Agreement requires a minimum Adjusted Consolidated Net Worth (as defined under the Amended Agreement) of at least $700 million through December 31, 2009 and at least $500 million from January 1, 2010 through the maturity date of the facility of October 24, 2011. As of December 31, 2009, our Adjusted Consolidated Net Worth, as defined in the credit facility, was $1.0 billion as compared to a net worth requirement of $700 million. Our Adjusted Consolidated Net Worth will be adversely affected by our continued losses and other factors negatively affecting our financial position. Absent significant additional capital, our Adjusted Consolidated Net Worth will decline in 2010. Although we currently expect to remain in compliance, due to continuing losses and other factors negatively affecting our financial position, there is a risk that in 2010 we will not be able to maintain the minimum Adjusted Consolidated Net Worth as required by the credit facility. If we were to anticipate being, or were to become, unable to maintain the required minimum Adjusted Consolidated Net Worth, we intend to pursue one or more of the following actions—(1) negotiate with the lenders under our credit facility to amend or waive compliance with the covenant, (2) seek to sell certain assets, including the QBE Note prior to maturity, for an amount sufficient to repay the credit facility and (3) other corporate initiatives, inclusive of expense reductions, within our control to maintain compliance with the covenant.
Upon the occurrence of certain events, we may be required to reduce our outstanding borrowing below $125 million and the size of the facility may be permanently reduced below $125 million. Such events include, but are not limited to, the reduction of the facility by any amounts received by The PMI Group from the note issuer with respect to the QBE Note or, subject to a $50 million floor, by an amount equal to 33% of net debt proceeds or net equity proceeds (calculated as provided in the Amended Agreement) received by the PMI Group, or by the amount necessary to cause the aggregate commitment of the lenders to be equal to or less than 80% of the estimated value of the QBE Note as determined from time to time pursuant to procedures set forth in the Amended Agreement and described below. See Part I, Item IA. Risk Factors—If the value of the contingent note we received in connection with our sale of PMI Australia is reduced, our financial condition could suffer.
100
Table of Contents
The Amended Agreement also places certain limitations on our ability to pay dividends on our common stock, including a per year cap of $0.01 per share, subject to an annual aggregate limit of $5 million, and a prohibition from declaring any dividend at any time MIC is prohibited from writing new mortgage insurance by any state in the U.S. As discussed in Item 4. Market for the Registrant’s Common Equity, Related Stockholder Matters and Issuer Purchases of Equity Securities—Payment of and Policy on Dividends, we do not expect that our Board of Directors will declare a quarterly dividend for the foreseeable future.
The QBE Note
In connection with the sale of PMI Australia, MIC received approximately $746 million in cash and the QBE Note in the principal amount of approximately $187 million, with interest accruing through September 2011 when it matures and is payable. The actual amount owed under the QBE Note is subject to reduction to the extent that the sum of (i) claims paid between June 30, 2008 and June 30, 2011, with respect to PMI Australia’s policies in force at June 30, 2008, (ii) increases in reserves with respect to such policies at June 30, 2011 as compared to June 30, 2008 and (iii) projected ultimate unpaid losses in excess of such reserves as of June 30, 2011 (together, the “ultimate projected losses”) exceeds $237.6 million (50% of the unearned premium reserve of such policies at June 30, 2008). Based on the information made available to us on the performance of such PMI Australia policies through December 31, 2009, we do not currently expect that, as of December 31, 2009, ultimate projected losses with respect to such policies will exceed $237.6 million. However, we have not yet received the report prepared by an independent actuary for the quarter ended December 31, 2009 (as described below). The last such report that we received was for the period ended September 30, 2009. The ultimate performance of the PMI Australia policies will depend, among other things, on the performance of the Australian housing market and economy over the next several years and other factors that are beyond our control and difficult to predict with any degree of certainty. Accordingly, we cannot be certain that the performance of the PMI Australia policies will not deteriorate in the future or that any such deterioration will not reduce the amount due on the QBE Note. In addition, the amount payable on the QBE note is subject to reduction in the event that we are required to satisfy claims for breach of warranty under the agreements entered into for the sale of PMI Australia and the sale of PMI Asia, in each case if such claims are not otherwise satisfied by April 1, 2010. QBE has not asserted any such warranty claims to date.
We pledged the QBE Note to the lenders under the Amended Agreement. Under the terms of the Amended Agreement, the size of the credit facility may be reduced by the amount necessary to cause the aggregate commitment of the lenders to be equal to or less than 80% of the estimated value of the QBE Note determined from time to time pursuant to procedures set forth in the Amended Agreement. Under these procedures, the value of the QBE Note is subject to reduction on account of warranty claims and losses that reduce the amount of the QBE Note pursuant to the agreement with QBE as described above. In addition, under the Amended Agreement, we are required to provide the lenders with quarterly reports, prepared by an independent actuary, with respect to the estimated loss performance of PMI Australia’s insurance policies as of June 30, 2008, pending the ultimate determination of the amount, if any, by which the QBE Note will be reduced. The Amended Agreement requires that for purposes of determining the commitment under the Amended Agreement, the value of the QBE Note will be reduced to the extent that such a quarterly report forecasts that ultimate projected losses will exceed $237.6 million. In the exercise of its professional judgment, we expect that the independent actuary will consider a variety of factors, including its expectations as to the performance of the Australian housing market and economy and their effect on the loss performance of such insurance policies. To date, such reports (the latest one being issued for the quarter ended September 30, 2009) have not resulted in a decrease in the value accorded to the QBE Note for purposes of the Amended Agreement. However, we cannot be certain that the report as of December 31, 2009 or future reports by the independent actuary will not result in any such decrease or that the independent actuary’s conclusions will be consistent with our expectations. See Part I, Item IA. Risk Factors—If the value of the contingent note we received in connection with our sale of PMI Australia is reduced, our financial condition could suffer.
101
Table of Contents
Dividends to The PMI Group
MIC’s ability to pay dividends to The PMI Group is affected by state insurance laws, credit agreements, rating agencies, the discretion of insurance regulatory authorities and our agreement with Fannie Mae relating to PMAC. The laws of Arizona, MIC’s state of domicile for insurance regulatory purposes, provide that MIC may pay dividends out of any available surplus account, without prior approval of the Director of the Arizona Department of Insurance (“Arizona Director”), during any 12-month period in an amount not to exceed the lesser of 10% of policyholders’ surplus as of the preceding year end or the prior calendar year’s net investment income. A dividend that exceeds the foregoing threshold is deemed an “extraordinary dividend” and requires the prior approval of the Arizona Director. We do not anticipate that MIC will pay any dividends to The PMI Group in 2010.
Other states may also limit or restrict MIC’s ability to pay shareholder dividends. For example, California and New York prohibit mortgage insurers from declaring dividends except from the surplus of undivided profits over the aggregate of their paid-in capital, paid-in surplus and contingency reserves. MIC’s ability to pay dividends is also subject to restriction under the terms of a runoff support agreement with Allstate Insurance Company (“Allstate”), described below under Capital Constraints.
MIC’s ability to pay dividends is also limited by the terms of our agreement with Fannie Mae relating to PMAC. Under the Fannie Mae agreement, MIC may not, without Fannie Mae’s prior written consent, which is not to be unreasonably withheld, pay dividends or make distributions or payments of indebtedness outside the ordinary course of business or in excess of specified levels. Notwithstanding these restrictions, our agreement with Fannie Mae permits MIC to make dividend, interest and principal payments in connection with the issuance of certain new debt or equity instruments up to specified levels. See Item 1(C). Business—Certain Regulatory and Other Issues Facing PMI.
U.S. Mortgage Insurance Operations Liquidity—The principal uses of U.S. Mortgage Insurance Operations’ liquidity are the payment of operating expenses, claim payments, taxes, dividends to The PMI Group and the growth of its investment portfolio. The principal sources of U.S. Mortgage Insurance Operations’ liquidity are the investment portfolio, including cash and cash equivalents, written premiums, net investment income and capital contributed from its holding company (TPG).
International Operations Liquidity—The principal uses of this segment’s liquidity are the payment of operating expenses, claim payments, taxes and growth of its investment portfolio. The principal sources of this segment’s liquidity are written premiums, investment maturities and net investment income.
Capital Constraints
As a result primarily of higher losses and LAE, we require additional capital. The amount and timing of capital required is affected by a variety of factors, many of which are difficult to predict and may be outside of our control. These factors include, among others:
| • | the performance of our U.S. mortgage insurance operations, which is affected by, among other things, the economy, default and cure rates and losses and LAE; |
| • | levels of new insurance written; |
| • | our ability to comply with policyholders’ position requirements and risk-to-capital requirements imposed by regulators or third parties; |
| • | determinations and views, many of which are subjective rather than quantitative in nature, of the GSEs and rating agencies; |
| • | performance of our investment portfolio and the extent of impairments to portions of the portfolio as a result of deteriorating capital markets; |
102
Table of Contents
| • | financial and other covenants and event of default triggers in our credit facility; |
| • | the performance of PMI Europe, which is affected by the U.S. and European mortgage markets and, among other things, changes in the fair value of CDS derivative contracts resulting from the widening of RMBS credit spreads; and |
| • | any requirements to provide capital under the PMI Europe or CMG MI capital support agreements (discussed under Capital Support Obligations below). |
We are exploring capital alternatives, including restructuring certain modified pool contracts, debt or equity offerings, and/or other capital relief initiatives at PMI. Given current market conditions generally and in our industry and the significant amount of additional capital we require, which may be needed with little notice, there can be no assurance that we will be able to consummate any capital raising transactions on favorable terms, in a timely manner or at all.
Unless we raise substantial additional capital or achieve significant statutory capital relief in the first quarter of 2010, MIC’s policyholders’ position will decline and risk-to-capital ratio will increase beyond levels necessary to meet capital adequacy requirements. For a discussion of regulatory issues related to capital constraints and requirements, see See Part I Item 1(C) and Conditions and Trends Affecting our Business—Capital Constraints, Initiatives and Requirements, above.
Under the terms of the Allstate runoff support agreement, MIC is subject to restrictions that may apply if its risk-to-capital ratio exceeds 23 to 1. Under the runoff support agreement, among other things, MIC may not declare or pay dividends at any time that its risk-to-capital ratio equals or exceeds 23 to 1 or if such a dividend would cause its risk-to-capital ratio to equal or exceed 23 to 1. In addition, if MIC’s risk-to-capital ratio equals or exceeds 23 to 1 at three consecutive monthly measurement dates, MIC may not enter into new insurance or reinsurance contracts without the consent of Allstate. If following such time as MIC’s risk-to-capital ratio were to exceed 24.5 to 1, the runoff support agreement requires MIC to transfer substantially all of its liquid assets to a trust account for the payment of MIC’s obligations to policyholders, therefore negatively affecting MIC’s and The PMI Group’s liquidity position. The original risk-in-force on policies covered under the Allstate runoff support agreement has been reduced from approximately $13 billion in 1994 to approximately $46 million as of December 31, 2009 (less than 1% of the total original risk-in-force). We expect any potential future losses associated with the remaining risk-in-force under the Allstate runoff support agreement to be immaterial and total loss reserves on the remaining risk-in force were approximately $1 million as of December 31, 2009 (less than 1% of MIC’s total loss reserves as of the same date). The remaining business has an average LTV of less than 40%. See Part I, Item 1A. Risk Factors—Unless we raise substantial additional capital or achieve significant capital relief in the first quarter of 2010, MIC will fail to meet various capital adequacy requirements and could be required to cease writing new business and could be subject to the terms of its runoff support agreement with Allstate.
As of December 31, 2009, MIC’s risk-to-capital ratio was 22.1 to 1 compared to 16.6 to 1 at December 31, 2008 and 10.8 to 1 at December 31, 2007. As of December 31, 2009, MIC held $63.9 million in excess of the required minimum policyholders’ position.
Consolidated Contractual Obligations
Our consolidated contractual obligations include reserves for losses and LAE, long-term debt obligations, credit default swaps obligations, operating lease obligations, and purchase obligations. Most of our purchase obligations are capital expenditure commitments that will be used for technology improvements. We have lease obligations under certain non-cancelable operating leases. In addition, we may be committed to fund, if called upon to do so, $2.7 million of additional equity in certain limited partnership investments.
103
Table of Contents
Cash payments related to our reserves for losses and LAE as of December 31, 2009 shown below are based upon management’s best estimate from historical experience as well as current economic conditions. These estimates could vary significantly based on, among other things, changes to claim rates and claim sizes. Minimum rental payments under non-cancelable operating leases also are provided in the table below.
| Less Than 1 Year |
1-3 Years | 3-5 Years | 5 Years or more |
Total | |||||||||||
| (Dollars in thousands) | |||||||||||||||
| Reserves for losses and LAE |
$ | 1,862,739 | $ | 1,214,423 | $ | 152,918 | $ | 20,020 | $ | 3,250,100 | |||||
| Debt obligations (1) |
30,566 | 183,198 | 58,448 | 753,804 | 1,026,016 | ||||||||||
| Credit default swaps (2) |
4,972 | 3,074 | 1,225 | 742 | 10,013 | ||||||||||
| Operating lease obligations |
1,761 | 2,421 | 402 | — | 4,584 | ||||||||||
| Purchase obligations |
1,546 | 226 | — | — | 1,772 | ||||||||||
| Total |
$ | 1,901,584 | $ | 1,403,342 | $ | 212,993 | $ | 774,566 | $ | 4,292,485 | |||||
| (1) | Includes $576,343 million of principal debt and $449,673 million of scheduled interest. |
| (2) | Expected cash flows related to CDS contracts are undiscounted; (inflows) represent net cash generated versus net cash outflows. |
Off-Balance Sheet Arrangements
Under certain circumstances, when we made an underwriting error in the course of providing contract underwriting services to a customer, we issued to the customer a loan indemnification. Such an indemnification is in lieu of paying a monetary remedy to the customer at the time the underwriting error was discovered and was usually issued on a loan by loan basis. While the terms of the indemnifications vary, each indemnification generally requires us to reimburse the customer for certain costs (excess of insurance recoverables) it incurs as a result of the borrower’s default on the loan in question. If the indemnified loan remains current, or is repaid or refinanced, we have no actual liability under the indemnification. As of December 31, 2009, we estimate that the total principal balance of indemnified loans was between approximately $22 million and $26 million. We believe a number of factors will cause our contingent liability with respect to these indemnifications to be significantly lower than this amount. These factors include the following: (i) we generally only indemnify performing loans; (ii) we expect only a portion of the indemnified loans to default; (iii) loans in default may not necessarily cause our customers to incur losses; and (iv) we expect a portion of these loans to be refinanced, or their indemnification coverage to expire. In 2009, we discontinued offering contract underwriting services; however, we may still have liabilities under the existing loan indemnifications. In 2009 and 2008, we did not pay material amounts pursuant to loan indemnifications. These amounts are included in our expenses associated with contract underwriting remedies.
In connection with certain past structured finance transactions in the U.S. and Australia, we provided narrative and/or financial information relating to us and our subsidiaries to mortgage-backed securities issuers for inclusion in the relevant offering documents and the issuers’ ongoing SEC filings. In connection with the provision of such information, we or our subsidiaries may be required to indemnify the issuer of the mortgage-backed securities and the underwriters of the offering with respect to the information’s accuracy and completeness and its compliance with applicable U.S. securities laws and regulations.
Certain of PMI Europe’s credit default swap contracts and reinsurance agreements contain collateral support provisions which, upon certain circumstances, including a downgrade of PMI Europe’s insurer financial strength ratings and/or deterioration of the underlying mortgage loan performance, require PMI Europe to post collateral for the benefit of the counterparty. The methodology for determining collateral varies and can include mark-to-market valuations, contractual formulae (principally related to expected loss performances) and/or negotiated amounts. PMI Europe has posted collateral of $25.7 million as of March 1, 2010 with respect to credit default swap transactions. PMI Europe has also posted collateral related to certain reinsurance transactions, and as of March 1, 2010, the posted collateral balance was $8.1 million. PMI Europe may be required to post additional collateral on credit default swaps as a result of such factors as widening of credit spreads and/or
104
Table of Contents
deterioration in the performance of the underlying collateral referenced in such transactions and on reinsurance transactions due to continued loss development. Any further downgrades will have no impact on the required collateral, as the current ratings are below all the ratings related triggers.
Consolidated Investments
Net Investment Income
Net investment income consists of:
| 2009 | 2008 | 2007 | ||||||||||
| (Dollars in thousands) | ||||||||||||
| Fixed income securities |
$ | 99,001 | $ | 103,770 | $ | 97,517 | ||||||
| Equity securities |
15,085 | 21,583 | 19,725 | |||||||||
| Short-term investments, cash and cash equivalents and other |
6,835 | 14,965 | 17,000 | |||||||||
| Investment income before expenses |
120,921 | 140,318 | 134,242 | |||||||||
| Investment expenses |
(1,755 | ) | (1,941 | ) | (1,690 | ) | ||||||
| Net investment income |
$ | 119,166 | $ | 138,377 | $ | 132,552 | ||||||
The decrease in net investment income in 2009 compared to 2008 was primarily due to a decrease in our pre-tax book yield. Our consolidated pre-tax book yield was 3.41%, 3.46% and 5.07% as of December 31, 2009, 2008 and 2007, respectively. This decrease in our consolidated pre-tax book yield was primarily due to a higher concentration of cash and cash equivalents in our investment portfolio to maintain liquidity, which yields significantly lower investment income. The increase in net investment income in 2008 compared to 2007 was primarily due to the growth of PMI’s investment portfolio. The increase in our investment portfolio was partially offset by a decrease in our pre-tax book yield.
Net Realized Investment Gains (Losses)
Net realized investment gains (losses) on investments are composed of:
| 2009 | 2008 | 2007 | ||||||||||
| (Dollars in thousands) | ||||||||||||
| Fixed income securities: |
||||||||||||
| Gross gains |
$ | 48,587 | $ | 30,585 | $ | 2,273 | ||||||
| Gross losses |
(6,239 | ) | (8,439 | ) | (974 | ) | ||||||
| Net gains |
42,348 | 22,146 | 1,299 | |||||||||
| Equity securities: |
||||||||||||
| Gross gains |
13,691 | 24,092 | 14,632 | |||||||||
| Gross losses |
(20,050 | ) | (99,397 | ) | (14,612 | ) | ||||||
| Net (losses) gains |
(6,359 | ) | (75,305 | ) | 20 | |||||||
| Short-term investments: |
||||||||||||
| Gross gains |
— | 6,695 | — | |||||||||
| Gross losses |
(1,745 | ) | (1,878 | ) | (129 | ) | ||||||
| Net (losses) gains |
(1,745 | ) | 4,817 | (129 | ) | |||||||
| Investment in unconsolidated subsidiaries: |
||||||||||||
| Settlement gain on sale of unconsolidated subsidiary |
— | — | 12,670 | |||||||||
| Impairment of unconsolidated subsidiaries |
— | (90,868 | ) | (38,499 | ) | |||||||
| Sale of unconsolidated subsidiary |
3,227 | — | — | |||||||||
| Net gains (losses) |
3,227 | (90,868 | ) | (25,829 | ) | |||||||
| Net realized investment gains (losses) before income taxes |
37,471 | (139,210 | ) | (24,639 | ) | |||||||
| Income tax expense (benefit) |
13,115 | (48,724 | ) | (8,624 | ) | |||||||
| Total net realized investment gains (losses) after income taxes |
$ | 24,356 | $ | (90,486 | ) | $ | (16,015 | ) | ||||
105
Table of Contents
Net realized investment gains (losses) for 2009 resulted primarily from sales of municipal bonds in addition to impairments and exchanges of preferred equity securities. Net realized investment gains for 2009 include other-than-temporary impairments recorded during the first quarter of 2009; upon adoption of Topic 320 on April 1, 2009, we recognized a cumulative effect adjustment to retained earnings and accumulated other comprehensive income for the non-credit portion of previously recorded impairments of debt securities in the amount of $2.4 million; $1.0 million of these losses were recorded in the first quarter of 2009 and $1.4 million of the losses were recorded in previous years. The net realized investment losses in 2008 include a $96.5 million loss related to our other-than-temporary impairment of certain preferred securities in our U.S. investment portfolio. Also included in the net investment losses for 2008 is the impairment of our investment in our unconsolidated subsidiaries, which includes an $88.0 million loss related to the impairment of our investment in FGIC in the first quarter of 2008 and a $2.9 million loss related to our impairment of our investment in RAM Re. The net realized investment losses in 2007 were due primarily to an other-than-temporary impairment of the investment in RAM Re of $38.5 million, partially offset by a $12.7 million settlement gain related to a sale of an unconsolidated subsidiary.
Unrealized Investment Gains and Losses
The changes in net unrealized gains (losses), net of deferred taxes, consist of:
| 2009 | 2008 | 2007 | |||||||||
| (Dollars in thousands) | |||||||||||
| Fixed income securities |
$ | 65,848 | $ | (98,557 | ) | $ | (48,358 | ) | |||
| Equity securities |
26,515 | (9,464 | ) | (26,543 | ) | ||||||
| Investments in unconsolidated subsidiaries |
1,196 | (17,721 | ) | 12,973 | |||||||
| Short-term investments |
— | — | (9 | ) | |||||||
| Changes in unrealized investment gains (losses), net of deferred taxes |
$ | 93,559 | $ | (125,742 | ) | $ | (61,937 | ) | |||
The changes in unrealized gains/losses in 2009 were primarily due to contracting market spreads in the U.S. fixed income portfolio and in the preferred securities portfolio as a result of an improvement in the securities markets as well as other market driven factors. The changes in unrealized gains/losses in 2008 were primarily due to widening market spreads principally in the U.S fixed income portfolio and the preferred securities portfolio. As interest rates, market and other economic conditions change, we expect the market value of the securities in our consolidated investment portfolio and of our unconsolidated equity investments to be affected.
106
Table of Contents
Investment Portfolio by Operating Segment
The following table summarizes the estimated fair value of the consolidated investment portfolio as of December 31, 2009 and December 31, 2008. Amounts shown under “International Operations” consist of the investment portfolios of PMI Europe and PMI Canada. Amounts shown under “Corporate and Other” consist of the investment portfolio of The PMI Group. As of December 31, 2008, PMI Guaranty’s assets and liabilities were merged into our U.S. Mortgage Insurance Operations.
| U.S. Mortgage Insurance Operations |
International Operations |
Corporate and Other |
Consolidated Total | |||||||||
| (Dollars in thousands) | ||||||||||||
| December 31, 2009 |
||||||||||||
| Fixed income securities: |
||||||||||||
| U.S. Municipal bonds |
$ | 2,052,174 | $ | — | $ | 13,221 | $ | 2,065,395 | ||||
| Foreign governments |
— | 46,033 | — | 46,033 | ||||||||
| Corporate bonds |
136,315 | 90,553 | — | 226,868 | ||||||||
| U.S. government and agencies |
3,981 | 7,013 | 146 | 11,140 | ||||||||
| Mortgage-backed securities |
3,279 | — | 2,473 | 5,752 | ||||||||
| Total fixed income securities |
2,195,749 | 143,599 | 15,840 | 2,355,188 | ||||||||
| Equity securities: |
||||||||||||
| Common stocks |
29,090 | — | — | 29,090 | ||||||||
| Preferred stocks |
186,023 | — | — | 186,023 | ||||||||
| Total equity securities |
215,113 | — | — | 215,113 | ||||||||
| Short-term investments |
999 | 23 | 1,210 | 2,232 | ||||||||
| Total investments |
$ | 2,411,861 | $ | 143,622 | $ | 17,050 | $ | 2,572,533 | ||||
| U.S. Mortgage Insurance Operations |
International Operations |
Corporate and Other |
Consolidated Total | |||||||||
| (Dollars in thousands) | ||||||||||||
| December 31, 2008 |
||||||||||||
| Fixed income securities: |
||||||||||||
| U.S. Municipal bonds |
$ | 1,715,376 | $ | — | $ | 98,893 | $ | 1,814,269 | ||||
| Foreign governments |
— | 50,361 | — | 50,361 | ||||||||
| Corporate bonds |
400 | 89,443 | 31,933 | 121,776 | ||||||||
| U.S. government and agencies |
4,265 | — | 154 | 4,419 | ||||||||
| Mortgage-backed securities |
2,391 | — | 4,250 | 6,641 | ||||||||
| Total fixed income securities |
1,722,432 | 139,804 | 135,230 | 1,997,466 | ||||||||
| Equity securities: |
||||||||||||
| Common stocks |
5,593 | — | — | 5,593 | ||||||||
| Preferred stocks |
216,256 | — | — | 216,256 | ||||||||
| Total equity securities |
221,849 | — | — | 221,849 | ||||||||
| Short-term investments |
980 | — | 1,300 | 2,280 | ||||||||
| Total investments |
$ | 1,945,261 | $ | 139,804 | $ | 136,530 | $ | 2,221,595 | ||||
Our consolidated investment portfolio holds primarily investment grade securities comprised of readily marketable fixed income and equity securities. The fair value of these securities in our consolidated investment portfolio increased to $2.6 billion as of December 31, 2009 from $2.2 billion as of December 31, 2008.
107
Table of Contents
Our consolidated investment portfolio consists primarily of publicly traded municipal bonds, corporate bonds and U.S. and foreign government bonds. In accordance with Topic 320, our entire investment portfolio is designated as available-for-sale and reported at fair value with changes in fair value recorded in accumulated other comprehensive income (loss).
The following table summarizes the rating distributions of our consolidated investment portfolio (including cash and cash equivalents, excluding common stocks) as of December 31, 2009:
| U.S. Mortgage Insurance Operations |
International Operations |
Corporate and Other |
Consolidated Total | |||||||||
| AAA or equivalent |
46 | % | 66 | % | 92 | % | 48 | % | ||||
| AA |
26 | % | 6 | % | 6 | % | 24 | % | ||||
| A |
24 | % | 22 | % | 1 | % | 24 | % | ||||
| BBB |
4 | % | 4 | % | 1 | % | 4 | % | ||||
| Below investment grade |
— | 2 | % | — | — | |||||||
| Total |
100 | % | 100 | % | 100 | % | 100 | % | ||||
As of December 31, 2009, approximately $1.1 billion, or 33.0% of our consolidated investment portfolio (including cash and cash equivalents, excluding common stocks) was insured by monoline financial guarantors. The financial guarantors include MBIA, FGIC, FSA, AMBAC and others. The table below presents the fair value of securities and the percentage of our consolidated investment portfolio that are insured by these financial guarantors as of December 31, 2009.
| Fair Value (in thousands) |
% of Consolidated Investments |
|||||
| MBIA |
$ | 307,362 | 9.4 | % | ||
| FGIC |
246,926 | 7.6 | % | |||
| FSA |
193,603 | 5.9 | % | |||
| AMBAC |
114,880 | 3.5 | % | |||
| Other |
216,542 | 6.6 | % | |||
| Total |
$ | 1,079,313 | 33.0 | % | ||
We do not rely on the financial guarantees as a principal source of repayment when evaluating securities for purchase. Rather, securities are evaluated primarily based on the underlying issuer’s credit quality. During 2008, several of the financial guarantors listed above were downgraded by one or more of the rating agencies. A downgrade of a financial guarantor may have an adverse effect on the fair value of investments insured by the downgraded financial guarantor. If we determine that declines in the fair values of our investments are other-than-temporary, we record a realized loss. The table below illustrates the underlying rating distributions of our consolidated investment portfolio (including cash and cash equivalents, excluding common stocks) as of December 31, 2009, excluding the benefit of the financial guarantees provided by these financial guarantors. Underlying ratings, excluding the benefit of financial guarantors, are based upon the higher underlying rating assigned by S&P or Moody’s when an underlying rating exists from either rating agency.
| U.S. Mortgage Insurance Operations |
International Operations |
Corporate and Other |
Consolidated Total |
|||||||||
| AAA or equivalent |
34 | % | 66 | % | 88 | % | 38 | % | ||||
| AA |
26 | % | 6 | % | 8 | % | 25 | % | ||||
| A |
35 | % | 22 | % | 3 | % | 33 | % | ||||
| BBB |
5 | % | 4 | % | 1 | % | 4 | % | ||||
| Below investment grade |
— | 2 | % | — | — | |||||||
| Total |
100 | % | 100 | % | 100 | % | 100 | % | ||||
108
Table of Contents
The following table summarizes the pre-tax book yield of our consolidated investment portfolio by segment as of December 31, 2009, 2008 and 2007.
| U.S. Mortgage Insurance Operations |
International Operations |
Corporate and Other |
Consolidated Total |
|||||||||
| 2009 |
3.53 | % | 2.65 | % | 0.98 | % | 3.41 | % | ||||
| 2008 |
3.49 | % | 3.31 | % | 3.27 | % | 3.46 | % | ||||
| 2007 |
5.15 | % | 4.52 | % | 5.19 | % | 5.07 | % |
The pre-tax book yield of U.S. Mortgage Insurance Operations remained relatively flat between 2008 and 2009. The decrease in the pre-tax book yield of International Operations and Corporate and Other in 2009 was due to interest rate decreases during the year and a higher percentage of the Corporate and Other portfolio invested in cash equivalents. The decrease in the pre-tax book yield of our U.S. Mortgage Insurance Operations and Corporate and Other segments from 2007 book yields was due to interest rate decreases during the year.
Debt and Equity Financing
As of December 31, 2009, our consolidated shareholders’ equity was $727.1 million. The fair value and carrying value of our long-term debt outstanding issued by The PMI Group at December 31 was as follows:
| December 31, 2009 | December 31, 2008 | |||||||||||
| Principal Amount | Fair Value | Carrying Value | Carrying Value | |||||||||
| (Dollars in thousands) | ||||||||||||
| 6.000% Senior Notes, due September 15, 2016 (1) |
$ | 250,000 | $ | 149,063 | $ | 149,063 | $ | 153,027 | ||||
| 6.625% Senior Notes, due September 15, 2036 (1) |
150,000 | 64,585 | 64,585 | 77,144 | ||||||||
| Revolving Credit Facility, due October 24, 2011 |
124,750 | 124,750 | 124,750 | 200,000 | ||||||||
| 8.309% Junior Subordinated Debentures, due February 1, 2027 |
51,593 | 10,061 | 51,593 | 51,593 | ||||||||
| Total debt |
$ | 576,343 | $ | 348,459 | $ | 389,991 | $ | 481,764 | ||||
| (1) | The fair value and carrying value of the our 6.000% Senior Notes and 6.625% Senior Notes at December 31, 2009 include accrued interest. |
6.000% and 6.625% Senior Notes—In September 2006, The PMI Group issued $250 million in principal amount of 6.000% Senior Notes, due September 15, 2016 and $150 million in principal amount of 6.625% Senior Notes, due September 15, 2036. The 6.000% Senior Notes and the 6.625% Senior Notes bear interest at a rate of 6.000% and 6.625% per annum, payable semi-annually in arrears on March 15 and September 15 of each year, beginning on March 15, 2007. The PMI Group may redeem the 6.000% and 6.625% Senior Notes in whole or in part at any time at the “make-whole redemption price”. The “make-whole redemption price” will be equal to the greater of (a) 100% of the principal amount of the 6.000% and 6.625% Senior Notes to be redeemed and (b) the sum of the present values of the remaining scheduled payments thereon discounted to the date of redemption, on a semi-annual basis (assuming a 360-day year consisting of twelve 30-day months), at a rate equal to the applicable treasury rate plus 25 basis points for the 6.000% Senior Notes and 35 basis points for the 6.625% Senior Notes, plus in the case of either (a) or (b), any interest accrued but not paid to but excluding the date of redemption. In connection with the issuance of these Senior Notes, The PMI Group entered into two interest rate lock agreements which were designated as cash flow hedges. The fair value of the cash flow hedges was settled for $9.0 million and is amortized into interest expense over the terms of the new senior debt that was issued. As of December 31, 2009, the unamortized balance in the other comprehensive income related to these fair value hedges was approximately $7.0 million (pre-tax).
109
Table of Contents
Effective January 1, 2008, we elected to adopt the fair value option presented by ASC Topic 825 for our 6.000% Senior Notes and 6.625% Senior Notes. ASC Topic 825 requires that the difference between the carrying value before election of the fair value option and the fair value of these instruments be recorded as an adjustment to beginning retained earnings in the period of adoption. (See Item 8, Note 10. Fair Value Disclosures, for further discussion.)
8.309% Junior Subordinated Debentures—The Junior Subordinated Debentures bear interest at the rate of 8.309% per annum paid semiannually and mature on February 1, 2027. The Junior Subordinated Debentures are subordinated to all senior indebtedness of The PMI Group.
In considering the initial adoption of the ASC Topic 825, we determined that the change in fair value of the 8.309% Junior Subordinated Debentures would not have a significant impact on our consolidated financial results. Therefore, we did not elect to adopt the fair value option for the 8.309% Junior Subordinated Debentures.
For a discussion of our revolving credit facility, see Liquidity and Capital Resources—Credit Facility, above.
Capital Support Obligations
MIC has a capital support agreement with PMI Europe, with a corresponding guarantee from The PMI Group, under which MIC may be required to make additional capital contributions from time-to-time as necessary to maintain PMI Europe’s minimum capital requirements. Under the PMI Europe capital support agreement, MIC also guarantees timely payment of PMI Europe’s obligations. MIC also has a capital support agreement whereby it agreed to contribute funds, under specified conditions, to maintain CMG MI’s risk-to-capital ratio at or below 19.0 to 1. MIC’s obligation under the CMG MI capital support agreement is limited to an aggregate of $37.7 million. As of December 31, 2009, CMG MI’s risk-to-capital ratio was 17.2 to 1. MIC has an additional capital support agreement with PMI Canada; however, we believe it is unlikely there is any remaining material support obligation under the PMI Canada capital support agreement, as we have ceased writing new business through our Canadian operations.
Cash Flows
On a consolidated basis, our principal sources of funds are cash flows generated by our insurance subsidiaries and investment income derived from our investment portfolios. One of the primary goals of our cash management policy is to ensure that we have sufficient funds on hand to pay obligations when they are due. We believe that we have sufficient cash to meet these and other of our short- and medium-term obligations. We believe that we currently have sufficient liquidity at our holding company to pay holding company expenses (including interest expense on our outstanding debt) in 2010. The PMI Group does not currently have sufficient funds or other sources of liquidity to enable it to repay our credit facility or our senior notes if either of those obligations were required to be repaid prior to maturity. Our senior note indenture provides that, if we fail to pay the principal amount of any other indebtedness at any stated maturity or if we default on any other obligation with respect to any such other indebtedness and such default results (i) in any other indebtedness becoming or being declared due and payable prior to the date on which it would otherwise have become due and payable and (ii) the principal amount of all such other indebtedness equals or exceeds an aggregate principal amount of $50 million or more and (iii) we do not repay such indebtedness or such acceleration is not rescinded within 30 days after receiving a notice of default from the trustee of the senior notes or the holders of at least 25% in principal amount of our senior notes, an event of default would occur under our senior notes and we could be required to repay all our outstanding senior notes.
Consolidated cash flows used in operating activities, including premiums, investment income, underwriting and operating expenses and losses, were $540.1 million in 2009 compared to consolidated cash flows provided by operating activities of $277.2 million and $400.6 million in 2008 and 2007, respectively. Cash flows from
110
Table of Contents
operations decreased in 2009 compared to 2008 primarily due to increases in claim payments, including accelerated claim payments in relation to the restructuring of certain modified pool policies, from PMI along with a decrease in net premiums written due to the decline in insurance in force. Cash flows provided by operating activities decreased in 2008 compared to 2007 primarily due to increases in claim payments from PMI. We expect cash flows from operating activities to be negatively affected throughout 2010 due to payment of claims from loss reserves recorded by PMI in 2007, 2008 and 2009, the continued reduction in premiums written due to continued decline of insurance in force and the decline in net investment income due to lower investment balances and lower investment yields.
Consolidated cash flows used in investing activities in 2009, including purchases and sales of investments and capital expenditures, were $179.1 million compared to consolidated cash flows provided by investing activities of $686.0 million in 2008 and cash flows used in investing activities of $102.0 in 2007. The change in cash flows used in investing activities in 2009 compared to cash flows provided by investing activities in 2008 was due primarily to increased purchases of fixed income securities. The change in cash flows provided by investing activities in 2008 compared to cash flows used in investing activities in 2007 was due primarily to proceeds from the sales of PMI Australia and PMI Asia. Our investing activities increased due to the rebalancing of investable assets primarily into municipal bonds. We believe we continue to maintain significant cash and cash equivalents available to pay current and future obligations.
Consolidated cash flows used in financing activities were $74.5 million in 2009 compared to consolidated cash flows provided by financing activities of $155.3 million in 2008 and consolidated cash flows used in financing activities of $197.4 million in 2007. The change in cash flows used in financing activities in 2009 compared to cash flows provided by financing activities in 2008 was driven by our initial draw down of $200 million on our line of credit in 2008 and subsequent repayment of $75 million in 2009. The significant change in cash flows provided by financing activities in 2008 compared to cash flows used in financing activities in 2007 was also due to the initial draw down under our line of credit in 2008. For a discussion of the status of The PMI Group’s revolving credit facility, please see Liquidity and Capital Resources—Credit Facility.
Ratings
The rating agencies have assigned the following ratings to The PMI Group and certain of its affiliates and its equity investee subsidiaries:
| Standard & Poor’s |
Moody’s | Fitch | ||||
| Insurer Counterparty Credit and Financial Strength Ratings |
||||||
| PMI Mortgage Insurance Co. |
B+ | B2 | NR | |||
| PMI Insurance Co. |
B+ | NR | NR | |||
| PMI Europe |
B+ | NR | NR | |||
| CMG Mortgage Insurance Company |
BBB | NR | BBB | |||
| FGIC |
NR | NR | NR | |||
| Issuer Credit Ratings |
||||||
| The PMI Group, Inc. |
CCC+ | Caa2 | NR | |||
| Senior Unsecured Debt |
CCC+ | Caa2 | NR | |||
| Junior Subordinated Debentures |
CC | Caa3 | NR | |||
Recent Developments Relating to Mortgage Insurance Companies Ratings
In July 2009, PMI requested Standard & Poor’s (“S&P”) and Moody’s Investors Service (“Moody’s”) to withdraw ratings on PMI Insurance Co. and PMI Europe. On July 30, 2009, S&P placed its ‘BB-’ financial strength rating on PMI Insurance Co. on CreditWatch with negative implications. This rating action had no impact on the ratings on The PMI Group, Inc. or PMI Mortgage Insurance Co. S&P commented that the
111
Table of Contents
CreditWatch placement reflected management’s decision to discontinue writing new business in PMI Insurance Co. effective August 1, 2009. As a result, S&P commented that it may reclassify PMI Insurance Co. as a nonstrategic entity of our mortgage insurance operations.
On July 29, 2009, S&P lowered its counterparty credit and financial strength ratings on CMG Mortgage Insurance Company to ‘BBB+’ from ‘A’. The outlook remained negative. S&P commented that this rating action reflected the increase in industry-wide prime mortgage defaults, which has affected higher quality mortgage insurance business such as that of CMG Mortgage Insurance Company and that CMG Mortgage Insurance Company’s operating results in the first quarter of 2009 were below expectations.
On October 27, 2009, S&P placed its ratings for several participants in the U.S. mortgage insurance industry on CreditWatch with negative implications. On December 22, 2009, S&P concluded their CreditWatch which resulted in a downgrade to PMI Mortgage Insurance Co., PMI Insurance Co., and PMI Europe to ‘B+’ from ‘BB-’ and to The PMI Group, Inc. to ‘CCC+’ from ‘B-’. The ratings were removed from CreditWatch and assigned a negative outlook.
On December 9, 2009, Fitch downgraded CMG Mortgage Insurance Company’s insurer financial strength rating to ‘BBB’ from ‘A+’. The ratings outlook remains negative. Fitch commented that the downgrade was driven primarily by increasing prime delinquencies and the potential impact on capitalization. Fitch officially withdrew ratings for The PMI Group, Inc. and subsidiaries as of May 12, 2009.
On February 4, 2010, Moody’s took action on the industry which resulted in a downgrade to The PMI Group, Inc. and its mortgage insurance subsidiaries as a result of continued deterioration in its capital position. The Insurance Financial Strength ratings of PMI Mortgage Insurance Co. and PMI Insurance Co. were downgraded to ‘B2’ from ‘Ba3’, and PMI Europe was downgraded to ‘B3’ from ‘B1’. The credit rating of The PMI Group, Inc. was downgraded to ‘Caa2’ from ‘B3’. The ratings outlook was changed from developing to negative for all remaining rated entities.
On February 17, 2010, S&P downgraded CMG Mortgage Insurance Company to ‘BBB’ from ‘BBB+’ with a negative outlook and removed the company from CreditWatch.
On February 18, 2010, Moody’s withdrew the ratings for PMI Insurance Co. and PMI Europe and we expect that S&P will withdraw their ratings for these two companies during the first quarter of 2010.
Determinations of ratings by the rating agencies are affected by a variety of factors, including macroeconomic conditions, economic conditions affecting the mortgage insurance industry, changes in business prospects, regulatory conditions, competition, underwriting and investment losses and the need for additional capital. There can be no assurance that our wholly-owned insurance subsidiaries will not be downgraded in the future.
112
Table of Contents
CRITICAL ACCOUNTING ESTIMATES
Management’s Discussion and Analysis of Financial Condition and Results of Operations, as well as disclosures included elsewhere in this report, are based upon our consolidated financial statements, which have been prepared in accordance with U.S. generally accepted accounting principles. The preparation of these financial statements requires us to make estimates and judgments that affect the reported amounts of assets and liabilities, revenues and expenses, and related disclosure of contingencies. Actual results may differ significantly from these estimates. We believe that the following critical accounting estimates involved significant judgments used in the preparation of our consolidated financial statements.
Reserves for Losses and LAE
We establish reserves for losses and LAE to recognize the liability of unpaid losses related to insured mortgages that are in default. We do not rely on a single estimate to determine our loss and LAE reserves. To ensure the reasonableness of our ultimate estimates, we develop scenarios using generally recognized actuarial projection methodologies that result in various possible losses and LAE.
Changes in loss reserves can materially affect our consolidated net income or loss. The process of estimating loss reserves requires us to forecast interest rate, employment and housing market environments, which are highly uncertain. Therefore, the process requires significant management judgment and estimates. The use of different estimates would have resulted in the establishment of different reserves. In addition, changes in the accounting estimates are reasonably likely to occur from period to period based on the economic conditions. We review the judgments made in our prior period estimation process and adjust our current assumptions as appropriate. While our assumptions are based in part upon historical data, the loss provisioning process is complex and subjective and, therefore, the ultimate liability may vary significantly from our estimates.
The following table shows the reasonable range of loss and LAE reserves, as determined by our actuaries, and recorded reserves for losses and LAE (gross of recoverables) as of December 31, 2009 and December 31, 2008 by segment and on a consolidated basis:
| As of December 31, 2009 | As of December 31, 2008 | |||||||||||||||||
| Low | High | Recorded | Low | High | Recorded | |||||||||||||
| (Dollars in millions) | (Dollars in millions) | |||||||||||||||||
| U.S. Mortgage Insurance Operations |
$ | 2,650.0 | $ | 3,850.0 | $ | 3,213.7 | $ | 2,175.0 | $ | 3,075.0 | $ | 2,624.5 | ||||||
| International Operations |
22.6 | 42.4 | 36.4 | 73.4 | 91.3 | 84.8 | ||||||||||||
| Consolidated loss and LAE reserves |
$ | 2,672.6 | $ | 3,892.4 | $ | 3,250.1 | $ | 2,248.4 | $ | 3,166.3 | $ | 2,709.3 | ||||||
U.S. Mortgage Insurance Operations—We establish PMI’s reserves for losses and LAE based upon our estimate of unpaid losses and LAE on (i) reported mortgage loans in default and (ii) estimated defaults incurred but not reported to PMI by its customers. We believe the amounts recorded represent the most likely outcome within the actuarial ranges.
Our best estimate of PMI’s reserves for losses and LAE is derived primarily from our analysis of PMI’s default and loss experience. The key assumptions used in the estimation process are expected claim rates, average claim sizes and costs to settle claims. We evaluate our assumptions in light of PMI’s historical patterns of claim payments, loss experience in past and current economic environments, the seasoning of PMI’s various books of business, PMI’s coverage levels, the credit quality profile of PMI’s portfolios, and the geographic mix of PMI’s business. We also consider the effect of projected future rescission activity with respect to the current inventory of delinquent loans, and such consideration has materially reduced our loss reserves estimates. To the extent we must reverse our rescissions beyond recent levels or future rescission activity is lower than expected, we may need to significantly increase our loss reserve estimates in future periods. Our assumptions are influenced by historical loss patterns and are adjusted to reflect recent loss trends. Our assumptions are also influenced by our assessment of current and future economic conditions, including trends in housing prices,
113
Table of Contents
unemployment and interest rates. Our estimation process uses generally recognized actuarial projection methodologies. As part of our estimation process, we also evaluate various scenarios representing possible losses and LAE under different economic assumptions.
We established PMI’s reserves at December 31, 2009 based on, among other factors, our evaluation of PMI’s estimated future claim rates and average claim sizes. Management’s best estimate of reserves for losses at December 31, 2009 was approximately the mid-point of the actuarial range.
Our increase to the reserve balance in 2009 was primarily due to PMI’s higher primary and modified pool default inventories and higher average claim sizes and claim rates in its modified pool insurance portfolio, offset by rescissions and loss mitigation activities. For a discussion of the increases in PMI’s default inventory, see Conditions and Trends—U.S. Mortgage Insurance Operations—Defaults. The increase in PMI’s average claim size in its modified pool insurance portfolio has been driven by higher actual and projected loan balances on loans going to claim and higher loss severity due to declining home prices. Higher claim rates have been driven by home price declines and diminished availability of certain loan products, both of which constrain refinancing opportunities and result in a decrease in the percentage of the default inventory that returns to current status (referred to as cure rate). The table below provides a reconciliation of our U.S. Mortgage Insurance Operations’ beginning and ending reserves for losses and LAE for the years ended December 31, 2009, 2008 and 2007:
| 2009 | 2008 | 2007 | ||||||||||
| (Dollars in millions) | ||||||||||||
| Balance at January 1 |
$ | 2,624.5 | $ | 1,133.1 | $ | 366.2 | ||||||
| Reinsurance recoverables |
(482.7 | ) | (35.9 | ) | (2.9 | ) | ||||||
| Net balance at January 1 |
2,141.8 | 1,097.2 | 363.3 | |||||||||
| Losses and LAE incurred (principally with respect to defaults occuring in): |
||||||||||||
| Current year |
1,552.7 | 1,688.0 | 894.4 | |||||||||
| Prior years |
187.9 | 147.7 | 201.7 | |||||||||
| Total incurred |
1,740.6 | 1,835.7 | 1,096.1 | |||||||||
| Losses and LAE payments (principally with respect to defaults occuring in): |
||||||||||||
| Current year |
(308.7 | ) | (100.9 | ) | (43.6 | ) | ||||||
| Prior years |
(1,063.6 | ) | (713.1 | ) | (318.6 | ) | ||||||
| Total payments |
(1,372.3 | ) | (814.0 | ) | (362.2 | ) | ||||||
| Transfer of PMI Guaranty loss reserves to U.S. Mortgage Insurance |
— | 22.9 | — | |||||||||
| Net balance at December 31 |
2,510.1 | 2,141.8 | 1,097.2 | |||||||||
| Reinsurance recoverables |
703.6 | 482.7 | 35.9 | |||||||||
| Balance at December 31 |
$ | 3,213.7 | $ | 2,624.5 | $ | 1,133.1 | ||||||
The above loss reserve reconciliation shows the components of our losses and LAE reserve changes for the periods presented. Losses and LAE payments of $1.4 billion, $814 million and $362.2 million for the years ended December 31, 2009, 2008 and 2007, respectively, reflect amounts paid during the periods presented and are not subject to estimation. Total losses and LAE incurred of $1.7 billion, $1.8 billion and $1.1 billion for the years ended December 31, 2009, 2008 and 2007, respectively, are management’s best estimates of ultimate losses and LAE and are subject to change. The changes in our estimates are principally reflected in the losses and LAE incurred line item which shows an increase to losses and LAE incurred related to prior years of $187.9 million, $147.7 million and $201.7 million for the years ended December 31, 2009, 2008 and 2007, respectively. PMI’s reserve balance at January 1, 2009 includes $22.9 million of PMI Guaranty’s loss reserves, which were merged into our U.S. Mortgage Insurance Operations in 2008.
114
Table of Contents
The table below breaks down the changes in reserves related to prior years by particular accident years for 2009, 2008 and 2007, respectively:
| Losses and LAE Incurred | Change in Incurred | ||||||||||||||||||||||
| Accident Year (year in which default occurred) |
2009 | 2008 | 2007 | 2006 | 2009 vs. 2008 |
2008 vs. 2007 |
2007 vs. 2006 | ||||||||||||||||
| (Dollars in millions) | |||||||||||||||||||||||
| 2002 and prior |
$ | — | $ | — | $ | — | $ | — | $ | (8.6 | ) | $ | (0.6 | ) | $ | 3.1 | |||||||
| 2003 |
226.5 | 225.9 | 226.8 | 220.2 | 0.6 | (0.9 | ) | 6.6 | |||||||||||||||
| 2004 |
241.1 | 241.2 | 241.3 | 229.1 | (0.1 | ) | (0.1 | ) | 12.2 | ||||||||||||||
| 2005 |
271.9 | 272.0 | 270.8 | 240.4 | (0.1 | ) | 1.2 | 30.4 | |||||||||||||||
| 2006 |
414.3 | 409.9 | 410.3 | 260.9 | 4.4 | (0.4 | ) | 149.4 | |||||||||||||||
| 2007 |
1,114.7 | 1,041.6 | 893.1 | — | 73.1 | 148.5 | — | ||||||||||||||||
| 2008 |
1,829.5 | 1,710.9 | — | — | 118.6 | — | — | ||||||||||||||||
| 2009 |
1,552.8 | — | — | — | — | — | — | ||||||||||||||||
| Total |
$ | 187.9 | $ | 147.7 | $ | 201.7 | |||||||||||||||||
The $187.9 million, $147.7 million and $201.7 million increases related to prior years’ reserves in 2009, 2008 and 2007, respectively, were due to re-estimations of ultimate loss rates from those established at the original notices of defaults, updated through the periods presented. The $187.9 million increase in prior years’ reserves during 2009 reflected the significant weakening of the housing and mortgage markets and was driven primarily by adverse claim size and claim rate development in the modified pool insurance portfolio partially offset by reductions in claim size on our primary insurance portfolio. The $147.7 million increase in prior years’ reserves during 2008 and the $201.7 million increase in prior years’ reserves in 2007 reflected significant weakening of the housing and mortgage markets in 2008 and 2007 and were driven by lower cure rates, higher claim rates and higher claim sizes related to our primary insurance portfolio in those years. These re-estimations of ultimate loss rates are the result of management’s periodic review of estimated claim amounts in light of actual claim amounts, loss development data and ultimate claim rates. Future declines in PMI’s cure rate, or higher default and claim rates or claim sizes could lead to further increases in losses and LAE.
The following table shows a breakdown of reserves for losses and LAE by primary and pool insurance:
| December 31, 2009 |
December 31, 2008 | |||||
| (Dollars in millions) | ||||||
| Primary insurance |
$ | 2,931.1 | $ | 2,340.0 | ||
| Pool insurance |
261.8 | 261.6 | ||||
| Other* |
20.8 | 22.9 | ||||
| Total reserves for losses and LAE |
$ | 3,213.7 | $ | 2,624.5 | ||
The increase in primary insurance reserves is driven primarily by the receipt of notices of default and an increase in the default inventory. The increase in the pool insurance reserves is driven by adverse development in the modified pool portfolio from increases in the default inventory, claim size and claim rates, partially offset by the restructuring of certain modified pool policies in 2009 which resulted in an acceleration of pool claims paid in 2009.
115
Table of Contents
The following table shows a breakdown of reserves for losses and LAE by loans in default, incurred but not reported, or IBNR, and the cost to settle claims, or LAE:
| December 31, 2009 |
December 31, 2008 | |||||
| (Dollars in millions) | ||||||
| Loans in default |
$ | 3,017.1 | $ | 2,452.6 | ||
| IBNR |
109.5 | 91.3 | ||||
| Cost to settle claims (LAE) |
66.3 | 57.7 | ||||
| Other* |
20.8 | 22.9 | ||||
| Total reserves for losses and LAE |
$ | 3,213.7 | $ | 2,624.5 | ||
| * | Other relates to PMI Guaranty’s loss reserves related to the agreement between PMI Guaranty, FGIC, and AG Re under which PMI Guaranty commuted certain risks with FGIC. |
To provide a measure of sensitivity of pre-tax income to changes in loss reserve estimates, we estimate that: (i) for every 5% change in our estimate of the future average claim sizes or every 5% change in our estimate of the future claim rates with respect to the December 31, 2009 reserves for losses and LAE, the effect on pre-tax income would be an increase or decrease of approximately $150.9 million; (ii) for every 5% change in our estimate of incurred but not reported loans in default as of December 31, 2009, the effect on pre-tax income would be approximately $5.5 million; and (iii) for every 5% change in our estimate of the future cost of claims settlement expenses as of December 31, 2009, the effect on pre-tax income would be approximately $3.3 million.
If either the claim rate or claim size, or a combination of the claim rate and claim size, were to increase approximately 19.8% above our current estimates, we would reach the top of our actuarially determined range. Conversely, if the claim rate or claim size, or a combination of the claim rate and claim size, were to decrease by approximately 17.5% of our current estimates, we would reach the bottom end of our actuarially determined range.
The establishment of loss reserves is subject to inherent uncertainty and requires judgment by management. The actual amount of claim payments may vary substantially from the loss reserve estimates. For example, the relationship of a change in assumption relating to future average claim sizes, claim rates or cost of claims settlement to the change in value may not be linear. Also, the effect of a variation in a particular assumption on the value of the loss and LAE reserves is calculated without changing any other assumption. Changes in one factor may result in changes in another which might magnify or counteract the sensitivities. Changes in factors such as persistency or cure rates can also affect the actual losses incurred. To the extent persistency increases and assuming all other variables remain constant, the absolute dollars of claims paid will increase as insurance in force will remain in place longer, thereby generating a higher potential for future incidences of loss. Conversely, if persistency were to decline, absolute claim payments would decline. In addition, changes in cure rates would positively or negatively affect total losses if cure rates increased or decreased, respectively.
International Operations—PMI Europe establishes loss reserves for all of its insurance and reinsurance business and for CDS transactions entered into before July 1, 2003. Revenue, losses and other expenses associated with CDS contracts executed on or after July 1, 2003 are recognized through derivative accounting treatment. PMI Europe’s loss reserving methodology contains two components: case reserves and IBNR reserves. Case and IBNR reserves are based upon factors which include, but are not limited to, our analysis of arrears and loss payment reports, loss assumptions derived from pricing analyses, our view of current and future economic conditions and industry information. Our actuaries calculated a range for PMI Europe’s loss reserves at December 31, 2009 of $22.4 million to $41.9 million. PMI Europe’s recorded loss reserves at December 31, 2009 were $36.0 million, which represented our best estimate and a decrease of $48.5 million from PMI Europe’s loss reserve balance of $84.5 million at December 31, 2008. The decrease to PMI Europe’s loss reserves in 2009 was primarily due to claim payments of $55.3 million made in respect of PMI Europe’s reinsurance of certain U.S. subprime exposures. The remaining loss reserves within our International Operations segment relate to PMI Canada, which ceased writing new business in 2008.
116
Table of Contents
The following table shows a breakdown of International Operations’ loss and LAE reserves:
| December 31, 2009 |
December 31, 2008 | |||||
| (Dollars in millions) | ||||||
| Loans in default |
$ | 33.1 | $ | 66.3 | ||
| IBNR |
2.2 | 17.8 | ||||
| Cost to settle claims (LAE) |
1.1 | 0.7 | ||||
| Total loss and LAE reserves |
$ | 36.4 | $ | 84.8 | ||
The following table provides a reconciliation of International Operations’ beginning and ending reserves for losses and LAE for the years ended December 31, 2009, 2008 and 2007:
| 2009 | 2008 | 2007 | ||||||||||
| (Dollars in millions) | ||||||||||||
| Balance at January 1 |
$ | 84.8 | $ | 41.6 | $ | 17.9 | ||||||
| Reinsurance recoverables |
— | (1.0 | ) | (0.9 | ) | |||||||
| Net balance at January 1 |
84.8 | 40.6 | 17.0 | |||||||||
| Losses and LAE incurred (principally with respect to defaults occurring in) |
||||||||||||
| Current year |
3.4 | 18.4 | 19.9 | |||||||||
| Prior years |
8.9 | 45.1 | 6.9 | |||||||||
| Total incurred |
12.3 | 63.5 | 26.8 | |||||||||
| Losses and LAE payments (principally with respect to defaults occurring in) |
||||||||||||
| Current year |
(0.1 | ) | — | — | ||||||||
| Prior years |
(59.6 | ) | (14.4 | ) | (5.1 | ) | ||||||
| Total payments |
(59.7 | ) | (14.4 | ) | (5.1 | ) | ||||||
| Foreign currency translation |
(1.0 | ) | (4.9 | ) | 1.9 | |||||||
| Net balance at December 31 |
36.4 | 84.8 | 40.6 | |||||||||
| Reinsurance recoverables |
— | — | 1.0 | |||||||||
| Balance at December 31 |
$ | 36.4 | $ | 84.8 | $ | 41.6 | ||||||
The increases in losses and LAE incurred relating to prior years of $8.9 million, $45.1 million and $6.9 million in 2009, 2008 and 2007, respectively, were primarily due to a loss provision related to deteriorating performance of several U.S. exposures on which PMI Europe provided reinsurance coverage.
Credit Default Swap Contracts
Through PMI Europe, we provide credit protection in the form of credit default swaps (“CDS”), which are considered derivatives and are marked to market through earnings under the requirements of Topic 815. The fair value of derivative liabilities was $17.3 million and $54.5 million as of December 31, 2009 and December 31, 2008, respectively, and is included in other liabilities on the balance sheet. The fair value of these CDS liabilities includes payment obligations that have been incurred but unpaid as of the balance sheet date. Our CDS exposures are dependent on the performance of certain prime residential mortgage loans originated throughout Europe, which are the reference assets for the underlying mortgage-related securities. The fair values of our CDS contracts are affected predominantly by estimated changes in credit spreads of the underlying obligations. As estimated credit spreads change, the fair values of these CDS contracts will change and the resulting gains and losses will be recorded in our operating results. In addition, with the adoption of Topic 820 we have incorporated our non-performance risk into the market value of our derivative assets and liabilities. Excluding our non-performance risk, the fair value of these CDS liabilities would have been $19.3 million as of December 31, 2009.
117
Table of Contents
PMI may incur losses on its CDS exposures if losses on the underlying mortgage loans reach PMI’s risk layer. Losses on underlying mortgages may only occur following a credit event, which is typically defined as borrower default or bankruptcy, and only if recoveries (typically foreclosure proceeds) are less than the total outstanding mortgage balances and foreclosure expenses, and in the case of some transactions, accrued interest.
Certain of PMI Europe’s CDS contracts contain collateral support provisions which, upon certain defined circumstances, including deterioration of the underlying mortgage loan performance, require PMI Europe to post collateral for the benefit of the counterparty. The methodology for determining collateral varies and can include mark-to-market valuations, contractual formulae (principally related to expected loss performance) and/or negotiated amounts. As a result of rating agency actions and other contractual requirements, PMI Europe has posted collateral, consisting of corporate securities and cash, of $14.7 million as of December 31, 2009 on CDS transactions. Any further downgrades will have no impact on the required collateral, as our current ratings are below all the ratings related triggers. As of December 31, 2009, the aggregate fair value of all derivative instruments with collateral support provisions upon which we have been required to post collateral, was a net liability of $15.8 million. We estimate based on expected defaults and loss estimates that the amount of additional collateral required to be posted will range from $4.4 million to $11.4 million in 2010. The actual collateral posted at year end will be dependent upon performance of the underlying mortgage portfolios, claim payments and the extent to which PMI Europe is successful in commuting these contracts. As of December 31, 2009, the maximum amount of collateral that PMI Europe could be required to post under these contracts is approximately $37.1 million, including the $14.7 million already posted. See Item 1A. Risk Factors—We are exposed to risk in the winding down of our European and Canadian operations.
Our CDS exposures are dependent on the performance of certain prime residential mortgage loans originated throughout Europe, which are the reference assets for the underlying mortgage-related securities. On average, the underlying loan portfolios were seasoned by at least one year when PMI Europe entered into the CDS transactions. Most portfolios had average seasoning of at least three years at issuance. PMI generally defines the notional amount of its exposure as its risk in force. Risk in force represents the maximum potential contractual obligation for PMI. PMI Europe’s risk in force related to its CDS contracts was $4.0 billion as of December 31, 2009. Provided below are tables showing the risk in force or notional amounts by issue year, original and current credit rating, posted collateral and country for all CDS contracts as of December 31, 2009. As of December 31, 2009, the original credit ratings of our investment grade transactions were unchanged:
| Original and Current Credit Rating | Total | ||||||||||||||||||||
| Issue Year |
AAA (Super Senior) |
AAA | AA | A | BBB | Non-investment grade |
|||||||||||||||
| ( Dollars in millions) | |||||||||||||||||||||
| 2000 |
$ | — | $ | — | $ | — | $ | — | $ | — | $ | 18 | $ | 18 | |||||||
| 2003 |
— | — | — | — | — | 7 | 7 | ||||||||||||||
| 2004 |
— | — | — | — | — | 10 | 10 | ||||||||||||||
| 2006 |
1,268 | 84 | — | — | — | — | 1,352 | ||||||||||||||
| 2007 |
2,147 | 218 | 142 | 65 | 35 | — | 2,607 | ||||||||||||||
| Total Notional |
$ | 3,415 | $ | 302 | $ | 142 | $ | 65 | $ | 35 | $ | 35 | $ | 3,994 | |||||||
| Posted collateral |
$ | 2 | $ | — | $ | — | $ | — | $ | — | $ | 13 | $ | 15 | |||||||
| Maximum collateral |
$ | 2 | $ | — | $ | — | $ | — | $ | — | $ | 35 | $ | 37 | |||||||
| Note: | Notional and collateral amounts will change due to fluctuations in the value of the Euro as compared to the U.S. dollar. Maximum collateral represents the contractual limit of collateral that would be required to be posted. |
118
Table of Contents
| Original and Current Credit Rating | Total | ||||||||||||||||||||
| Country |
AAA (Super Senior) |
AAA | AA | A | BBB | Non-investment grade |
|||||||||||||||
| ( Dollars in millions) | |||||||||||||||||||||
| France |
$ | 2,147 | $ | 218 | $ | 142 | $ | 65 | $ | 35 | $ | — | $ | 2,607 | |||||||
| Germany |
1,268 | 84 | — | — | — | 35 | 1,387 | ||||||||||||||
| Total Notional |
$ | 3,415 | $ | 302 | $ | 142 | $ | 65 | $ | 35 | $ | 35 | $ | 3,994 | |||||||
| Note: | Notional amounts will change due to fluctuations in the value of the Euro as compared to the U.S. dollar. |
Provided in the table below are the weighted average expected life and the components of fair value for PMI’s CDS contracts in an asset/(liability) position as of December 31, 2009.
| Original and Current Credit Rating | Total | |||||||||||||||||||||||||||
| AAA (Super Senior) |
AAA | AA | A | BBB | Non-investment grade |
|||||||||||||||||||||||
| (Dollars in millions) | ||||||||||||||||||||||||||||
| Weighted average expected life in years |
0.17 | 0.17 | 0.17 | 0.17 | 0.17 | 1.95 | 0.33 | |||||||||||||||||||||
| Components of fair value |
||||||||||||||||||||||||||||
| Expected discounted future net cash inflows (outflows) |
$ | 0.8 | $ | 0.2 | $ | 0.2 | $ | 0.1 | $ | 0.3 | $ | (11.3 | ) | $ | (9.7 | ) | ||||||||||||
| Market spread/cost of capital adjustment |
(1.3 | ) | (0.7 | ) | (0.3 | ) | (0.3 | ) | (0.6 | ) | (4.4 | ) | (7.6 | ) | ||||||||||||||
| Fair value |
$ | (0.5 | ) | $ | (0.5 | ) | $ | (0.1 | ) | $ | (0.2 | ) | $ | (0.3 | ) | $ | (15.7 | ) | $ | (17.3 | ) | |||||||
| Note: | Fair value amounts will change due to fluctuations in the value of the Euro as compared to the U.S. dollar. |
PMI does not currently expect that the fair value portion of the CDS liability related to fluctuations in market spreads and PMI’s cost of capital will result in additional cash outflows. PMI’s expected future net cash flows could vary over time. Higher than expected defaults, higher loss severities or the acceleration in the timing of claim payments would likely result in an increase in expected discounted future net cash outflows and PMI’s fair value liability, which could materially impact our results of operations. PMI has paid, or expects to pay, losses on most of its non-investment grade CDS contracts. PMI expects to pay net cash outflows of approximately $11.3 million related to its non-investment grade CDS agreements over the next 6 years. PMI has a fair value liability of $15.7 million, which includes all expected lifetime future cash flows, against total notional exposure of $34.9 million on all non-investment grade contracts as of December 31, 2009.
Based on our expectations for default timing, loss severity and timing of exercise of call options, we do not anticipate paying losses on contracts rated ‘BBB’ or higher. When the borrowers on underlying loans are in arrears by at least 90 days, PMI Europe regards such arrears as indicative of potential future losses. As of December 31, 2009, loans that were at least 90 days in arrears represented less than 70% of remaining subordination to PMI’s layer on each investment grade transaction. To date, losses on loans underlying our investment grade transactions have not exceeded 2% of current subordination levels. To the extent expected cash losses were to exceed subordination levels, the fair values of the investment grade CDS contracts would further decline, resulting in an increase in CDS liability, which could become realized in the form of claims paid over time.
In estimating the fair values of CDS contracts, PMI Europe incorporates expected life of contract dates in its internal valuation models. We estimate the life of contract to coincide with expected call dates based on a number of factors, including past experience of counterparties, the underlying economics of the transactions, counterparties’ expressed intent and potential costs associated with extending transactions. The current state of
119
Table of Contents
capital markets, the financial conditions and perspectives of various counterparties and the general weakening of economic conditions in Europe may lead to decisions by customers to extend the credit protection offered by PMI Europe’s CDS contracts, which could be counteracted by PMI Europe’s counterparties’ assessments of its creditworthiness. If a CDS contract is extended beyond its expected call date, PMI Europe will be required to adjust its internal valuation model assumptions. To the extent that credit spreads are higher than at the time of inception of the transaction, extending the expected life from the call date to the maturity date could result in PMI Europe recognizing further significant mark-to-market losses. If counterparties elect to extend PMI Europe’s CDS contracts and spreads remain at their current levels, mark-to-market losses could be material and there will be a greater likelihood of incurring higher than currently expected realized losses in the form of paid claims on the contracts. To date, all of PMI Europe’s CDS contracts have either been called at our expected call date or have deviated from our expected call date in lengths of time that are not significant.
Investment Securities
We review all of our fixed income and equity security investments on a periodic basis for impairment, with focus on those having unrealized losses. We specifically assess all investments with declines in fair value and, in general, monitor all security investments as to ongoing risk.
We review on a quarterly basis, or as needed in the event of specific credit events, unrealized losses on all investments with declines in fair value. These investments are then tracked to establish whether they meet our established other than temporary impairment criteria. This process involves monitoring market events and other items that could impact issuers. We consider relevant facts and circumstances in evaluating whether the impairment of a security is other-than-temporary.
Relevant facts and circumstances considered include, but are not limited to:
| • | a decline in the market value of a security below cost or amortized cost for a continuous period of at least six months; |
| • | the severity and nature of the decline in market value below cost regardless of the duration of the decline; |
| • | recent credit downgrades of the applicable security or the issuer by the rating agencies; |
| • | the financial condition of the applicable issuer; |
| • | whether scheduled interest payments are past due; and |
| • | whether it is more likely than not we will hold the security for a sufficient period of time to allow for anticipated recoveries in fair value. |
Once a security is determined to have met certain of the criteria for consideration as being other-than-temporarily impaired, further information is gathered and evaluated pertaining to the particular security. If the security is an unsecured obligation, the additional research is a security specific approach with particular emphasis on the likelihood of the issuer to meet the contractual terms of the obligation.
We assess equity securities using the criteria outlined above and also consider whether in addition to these factors we have the ability and intent to hold the equity securities for a period of time sufficient for recovery to cost or amortized cost. If we lack the intent or whether it is more likely than not we can hold the security for a sufficient time to allow for anticipated recoveries in value, the equity security’s decline in fair value is deemed to be other than temporary, and we record the full difference between fair value and cost or amortized cost in earnings.
Once the determination is made that a debt security is other-than-temporarily impaired, an estimate is developed of the portion of such impairment that is credit related. The estimate of the portion of impairment due to credit is based upon a comparison of ratings at purchase and the current ratings of the security, to establish
120
Table of Contents
whether there have been any specific credit events during the time we owned the security, as well as the outlook through the expected maturity horizon for the security. We obtain ratings from two nationally recognized rating agencies for each security being assessed. We also incorporate information on the specific securities from our management and, as appropriate, from our external investment advisors on their views on the probability of it receiving the interest and principal cash-flows for the remaining life of the securities.
The following table shows our investments’ gross unrealized losses and fair value, aggregated by investment category and length of time that individual securities have been in a continuous unrealized loss position, as of December 31, 2009 and December 31, 2008:
| Less than 12 months | 12 months or more | Total | |||||||||||||||||||
| Fair Value | Unrealized Losses |
Fair Value | Unrealized Losses |
Fair Value | Unrealized Losses |
||||||||||||||||
| (Dollars in thousands) | |||||||||||||||||||||
| December 31, 2009 |
|||||||||||||||||||||
| Fixed income securities: |
|||||||||||||||||||||
| U.S. municipal bonds |
$ | 559,817 | $ | (11,494 | ) | $ | 62,032 | $ | (4,455 | ) | $ | 621,849 | $ | (15,949 | ) | ||||||
| Foreign governments |
7,270 | (237 | ) | 7,151 | (898 | ) | 14,421 | (1,135 | ) | ||||||||||||
| Corporate bonds |
41,041 | (1,709 | ) | 7,031 | (924 | ) | 48,072 | (2,633 | ) | ||||||||||||
| Total fixed income securities |
608,128 | (13,440 | ) | 76,214 | (6,277 | ) | 684,342 | (19,717 | ) | ||||||||||||
| Equity securities: |
|||||||||||||||||||||
| Common stocks |
28,955 | (594 | ) | — | — | 28,955 | (594 | ) | |||||||||||||
| Preferred stocks |
— | — | 54,706 | (3,322 | ) | 54,706 | (3,322 | ) | |||||||||||||
| Total equity securities |
28,955 | (594 | ) | 54,706 | (3,322 | ) | 83,661 | (3,916 | ) | ||||||||||||
| Total |
$ | 637,083 | $ | (14,034 | ) | $ | 130,920 | $ | (9,599 | ) | $ | 768,003 | $ | (23,633 | ) | ||||||
| Less than 12 months | 12 months or more | Total | |||||||||||||||||||
| Fair Value | Unrealized Losses |
Fair Value | Unrealized Losses |
Fair Value | Unrealized Losses |
||||||||||||||||
| (Dollars in thousands) | |||||||||||||||||||||
| December 31, 2008 |
|||||||||||||||||||||
| Fixed income securities: |
|||||||||||||||||||||
| U.S. municipal bonds |
$ | 801,039 | $ | (49,171 | ) | $ | 460,962 | $ | (49,416 | ) | $ | 1,262,001 | $ | (98,587 | ) | ||||||
| Foreign governments |
6,664 | (1,780 | ) | — | — | 6,664 | (1,780 | ) | |||||||||||||
| Corporate bonds |
25,903 | (1,977 | ) | 30,423 | (5,371 | ) | 56,326 | (7,348 | ) | ||||||||||||
| Total fixed income securities |
833,606 | (52,928 | ) | 491,385 | (54,787 | ) | 1,324,991 | (107,715 | ) | ||||||||||||
| Equity securities: |
|||||||||||||||||||||
| Common stocks |
5,576 | (3,698 | ) | — | — | 5,576 | (3,698 | ) | |||||||||||||
| Preferred stocks |
20,365 | (2,712 | ) | 99,294 | (17,489 | ) | 119,659 | (20,201 | ) | ||||||||||||
| Total equity securities |
25,941 | (6,410 | ) | 99,294 | (17,489 | ) | 125,235 | (23,899 | ) | ||||||||||||
| Total |
$ | 859,547 | $ | (59,338 | ) | $ | 590,679 | $ | (72,276 | ) | $ | 1,450,226 | $ | (131,614 | ) | ||||||
At December 31, 2009, we had gross unrealized losses of $23.6 million on investment securities, including fixed maturity and equity securities that had a fair value of $768.0 million. In addition, included in the gross unrealized losses are securities that we determined had other-than-temporary impairments in accordance with Topic 320. Accordingly, we bifurcated these impairments between credit and non-credit impairments. We had non-credit impairments of $2.6 million on securities considered to be impaired.
The unrealized losses on foreign governments and corporate bonds as of December 31, 2009 were primarily due to foreign currency translation on securities denominated in a currency other than the functional currency as
121
Table of Contents
well as continuing credit issues in that sector. The unrealized losses in the preferred stock portfolio as of December 31, 2009 decreased from December 31, 2008 as a result of an overall improvement in the preferred sector as well as a change in the composition of our holdings as a result of preferred stock exchanges and dispositions throughout 2009. The change in unrealized losses on the fixed income portfolio from December 31, 2008 to December 31, 2009 was primarily due to contracting municipal bonds credit spreads.
Impaired investments either met the criteria established in our accounting policy regarding the extent and length of time the investment was in a loss position or management determined that it would not hold the security for a period of time sufficient to allow for any anticipated recovery. Additional factors considered in evaluating an investment for impairment include the financial condition and near-term prospects of the issuer, evidenced by debt ratings and analyst reports. As of December 31, 2009, our investment portfolio included 129 securities in an unrealized loss position compared to 284 securities as of December 31, 2008.
Deferred Policy Acquisition Costs
Our policy acquisition costs are those costs that vary with, and are primarily related to, our acquisition, underwriting and processing of new mortgage insurance policies, including contract underwriting and sales related activities. To the extent we provided contract underwriting services on loans that did not require mortgage insurance, associated underwriting costs were not deferred. We defer policy acquisition costs when incurred and amortize these costs in proportion to estimated gross profits for each policy year by type of insurance contract (i.e. monthly, annual and single premium). The amortization estimates for each underwriting year are monitored regularly to reflect persistency and expected loss development by type of insurance contract. We review our estimation process on a regular basis and any adjustments made to the estimates are reflected in the current period’s consolidated net income. Deferred policy acquisition costs are reviewed periodically to determine that they do not exceed recoverable amounts, after considering investment income. The decreases in amortization of deferred policy acquisition costs in 2009 compared to 2008 were primarily due to less deferrals due to lower levels of NIW and an increase we made in the second half of 2008 to the period over which we amortize deferred policy acquisition costs in our U.S. Mortgage Insurance Operations as a result of higher persistency levels. PMI’s deferred policy acquisition cost asset increased to $41.3 million at December 31, 2009 from $32.3 million at December 31, 2008 and $10.5 million at December 31, 2007.
Premium Deficiency Analysis
We perform an analysis for premium deficiency using assumptions based on our best estimate when the analysis is performed. The calculation for premium deficiency requires significant judgment and includes estimates of future expected premiums, expected claims, loss adjustment expenses and maintenance costs as of the date of the test. The calculation of future expected premiums uses assumptions for persistency and termination levels on policies currently in force. Assumptions for future expected losses include future expected average claim sizes and claim rates which are based on the current default rate and expected future defaults. Investment income is also considered in the premium deficiency calculation. For the calculation of investment income we use our pre-tax investment yield.
We perform premium deficiency analyses quarterly on a single book basis for the U.S. Mortgage Insurance Operations and International Operations. A premium deficiency analysis was performed as of December 31, 2009 on a GAAP basis. We determined that there was a premium deficiency in our International Operations segment and recorded a premium deficiency reserve of $2.4 million and $1.4 million for PMI Europe and PMI Canada, respectively. Premium deficiency is recorded as Losses and LAE on the Consolidated Statement of Operations and as Other Liabilities on the Consolidated Balance Sheet. We determined there was no premium deficiency in our U.S. Mortgage Insurance Operations segment despite continued significant losses in 2009. To the extent premium levels and actual loss experience differ from our assumptions, our results could be negatively affected in future periods.
122
Table of Contents
Valuation of Deferred Tax Assets
PMI’s management reviews the need to establish a valuation allowance against deferred tax assets on a quarterly basis. In the course of its review, PMI’s management analyzes several factors, including the severity and frequency of operating or capital losses, PMI’s capacity for the carryback or carryforward of any losses, the expected occurrence of future income or loss, and available tax planning alternatives. As discussed below, PMI’s valuation allowance as of December 31, 2009 was approximately $248.3 million.
In periods prior to 2008, we deducted significant amounts of statutory contingency reserves on our federal income tax returns. The reserves were deducted to the extent we purchased tax and loss bonds in an amount equal to the tax benefit of the deduction pursuant to §831(e) of the Internal Revenue Code. The reserves are included in taxable income in future years when they are released for statutory accounting purposes or if we elect to redeem the tax and loss bonds that were purchased in connection with the deduction for the reserves. Remaining contingency reserves were released as of December 31, 2009, generating approximately $965 million of taxable income reflected in the current tax calculation.
Because of the limited ability to generate capital gains or other strategies to utilize unrealized capital losses during the carryback and carryover periods, however, we separately evaluated deferred tax assets of a capital nature totaling approximately $241.3 million that could expire before being utilized. As a result of this analysis, it was estimated that approximately $152.9 million of capital losses would “more-likely-than-not” expire before sufficient capital gains could be generated and the valuation allowance was adjusted, accordingly. Additional adjustments could be recognized in the future due to changes in management’s expectations regarding realization of tax benefits.
In addition to the capital losses, deferred tax assets related to foreign and California net operating losses and certain foreign tax credits were analyzed during the year related to deferred tax assets of $12.5 million, $6.6 million, and $78.9 million, respectively. As a result of this analysis, it was determined that approximately $10.0 million, $6.6 million and $78.8 million of these respective deferred tax assets would “more-likely than not” expire before being utilized, resulting in a total valuation allowance of approximately $95.8 million as of December 31, 2009.
Additional adjustments could be recognized in the future due to changes in management’s expectations regarding realization of tax benefits which could have a material adverse effect on our results of operations and financial condition.
123
Table of Contents
| ITEM 7A. | QUANTITATIVE AND QUALITATIVE DISCLOSURES ABOUT MARKET RISK |
Market risk is the risk of the loss of fair value resulting from adverse changes in market rates and prices, such as interest rates, foreign currency exchange rates and equity prices. Market risk is directly influenced by the volatility and liquidity in the markets in which the related underlying financial instruments are traded. The following is a discussion of our market risk exposures and our risk management practices.
Interest rate risk
As of December 31, 2009, our consolidated investment portfolio excluding cash and cash equivalents was $2.6 billion. The fair value of investments in our portfolio is calculated from independent market quotations and is interest rate sensitive and subject to change based on interest rate movements. As of December 31, 2009, 91.6% of our investments were fixed income securities, primarily U.S. municipal bonds. As interest rates fall, the fair value of fixed income securities generally increases, and as interest rates rise, the fair value of fixed income securities generally decreases. The following table summarizes the estimated change in fair value and the accounting effect on comprehensive income (pre-tax) for our consolidated investment portfolio based upon specified hypothetical changes in interest rates as of December 31, 2009:
| Estimated Increase/ (Decrease) in Fair Value |
||||
| (Dollars in thousands) | ||||
| 300 basis point decline |
$ | 321,673 | ||
| 200 basis point decline |
$ | 245,805 | ||
| 100 basis point decline |
$ | 142,606 | ||
| 100 basis point rise |
$ | (132,367 | ) | |
| 200 basis point rise |
$ | (292,459 | ) | |
| 300 basis point rise |
$ | (438,622 | ) | |
These hypothetical estimates of changes in fair value are primarily related to our fixed-income securities as the fair values of fixed-income securities generally fluctuate with increases or decreases in interest rates. The weighted average option-adjusted duration of our consolidated investment portfolio including cash and cash equivalents was 6.2 as of December 31, 2009.
Currency exchange rate risk
We analyze the sensitivity of fluctuations in foreign currency exchange rates on investments in our foreign subsidiaries denominated in currencies other than the U.S. dollar. This estimate is calculated using the spot exchange rates as of December 31, 2009 and respective current period end investment balances in our foreign subsidiaries in the applicable foreign currencies. The following table summarizes the estimated changes in the investments in our foreign subsidiaries and the accounting effect on comprehensive income (pre-tax) based upon specified hypothetical percentage changes in foreign currency exchange rates as of December 31, 2009, with all other factors remaining constant:
| Estimated Increase (Decrease) Foreign Currency Translation |
||||||||||||
| Change in foreign currency exchange rates |
Europe | Canada | Consolidated | |||||||||
| (USD in thousands) | ||||||||||||
| 15% decline |
$ | (17,242 | ) | $ | (2,375 | ) | $ | (19,617 | ) | |||
| 10% decline |
$ | (11,495 | ) | $ | (1,583 | ) | $ | (13,078 | ) | |||
| 5% decline |
$ | (5,747 | ) | $ | (792 | ) | $ | (6,539 | ) | |||
| 5% rise |
$ | 5,747 | $ | 792 | $ | 6,539 | ||||||
| 10% rise |
$ | 11,495 | $ | 1,583 | $ | 13,078 | ||||||
| 15% rise |
$ | 17,242 | $ | 2,375 | $ | 19,617 | ||||||
| Foreign currency translation rates as of December 31, |
||||||||||||
| U.S. Dollar relative to | ||||||||||||
| Euro | Canadian Dollar |
|||||||||||
| 2009 |
|
1.4321 | 0.9506 | |||||||||
| 2008 |
|
1.3971 | 0.8202 | |||||||||
124
Table of Contents
The changes in the foreign currency exchange rates from 2008 to 2009 positively affected our investments in our foreign subsidiaries by $5.0 million. This foreign currency translation impact is calculated by applying the period over period change in the period end spot exchange rates to the current period end investment balance of our foreign subsidiaries.
As of December 31, 2009, $172.1 million, including cash and cash equivalents of our invested assets, was held by PMI Europe and was denominated primarily in Euros. As of December 31, 2009, $18.9 million, including cash and cash equivalents of our invested assets, was held by PMI Canada and was denominated primarily in U.S. dollars. The above table shows the exchange rate of the U.S. dollar relative to the Euro and Canadian dollar as of December 31, 2009 and 2008. The value of the Euro and Canadian dollar strengthened relative to the U.S. dollar as of December 31, 2009 compared to December 31, 2008.
Credit spread risk
Through PMI Europe, we provide credit protection in the form of credit default swaps (“CDS”), which are considered derivatives and are marked to market through earnings under the requirements of Topic 815. The fair value of derivative liabilities was $17.3 million and $54.5 million as of December 31, 2009 and December 31, 2008, respectively, and is included in other liabilities on the balance sheet. The fair value of these CDS liabilities includes payment obligations that have been incurred but unpaid as of the balance sheet date. Our CDS exposures are dependent on the performance of certain prime residential mortgage loans originated throughout Europe, which are the reference assets for the underlying mortgage-related securities. The fair values of our CDS contracts are affected predominantly by estimated changes in credit spreads of the underlying obligations. As estimated credit spreads change, the fair values of these CDS contracts will change and the resulting gains and losses will be recorded in our operating results. In addition, with the adoption of Topic 820 we have incorporated our non-performance risk into the market value of our derivative assets and liabilities. Excluding our non-performance risk, the fair value of these CDS liabilities would have been $19.3 million as of December 31, 2009.
We do not currently expect that the fair value portion of the CDS liability related to fluctuations in market spreads and our cost of capital will result in any cash outflows. PMI’s expected future net cash flows could vary over time. Higher than expected defaults, higher loss severities or the acceleration in the timing of claim payments would likely result in an increase in PMI’s expected discounted future net cash outflows and fair value liability, which could materially impact our results of operations. The following two tables summarize the estimated changes in the exit value liability in PMI Europe based upon specified hypothetical percentage changes in market spread and cost of capital as of December 31, 2009, with all other factors remaining constant. The specified hypothetical percentage changes are based on our recent historical experience with these factors. We have selected smaller hypothetical percentage changes with respect to cost of capital, which are incorporated in our non-investment grade modeling, as our recent historical experience with this factor would suggest much less volatility than changes in market spreads.
| Change in cost of capital |
Estimated (Decrease)/Increase in Liability |
|||
| (USD in thousands) | ||||
| 35% decline |
$ | (1,477 | ) | |
| 25% decline |
$ | (1,047 | ) | |
| 10% decline |
$ | (415 | ) | |
| 10% rise |
$ | 409 | ||
| 25% rise |
$ | 1,013 | ||
| 35% rise |
$ | 1,409 | ||
125
Table of Contents
| Change in market spread |
Estimated (Decrease)/Increase in Liability |
|||
| (USD in thousands) | ||||
| 95% decline |
$ | (3,129 | ) | |
| 75% decline |
$ | (2,470 | ) | |
| 50% decline |
$ | (1,647 | ) | |
| 50% rise |
$ | 1,647 | ||
| 75% rise |
$ | 2,470 | ||
| 95% rise |
$ | 3,129 | ||
Debt instruments
Effective January 1, 2008, The PMI Group, Inc. adopted Topic 820 and the fair value option outlined in Topic 825. In particular, we elected to adopt the fair value option outlined in Topic 825 for certain corporate debt liabilities on the adoption date. The fair value of these corporate debt instruments is measured under level 2 of the fair value hierarchy and is derived from independent pricing services that use observable market data for similar transactions, including broker-dealer quotes and actual trade activity as a basis for valuation.
Changes in the fair value of these corporate debt liabilities for which the fair value option was elected is principally due to changes in our credit spreads. The following table summarizes the estimated change in yield and corresponding fair value and the accounting effect on income (pre-tax) based upon reasonably likely changes in our credit spreads as of December 31, 2009, with all other factors remaining constant:
| Change in credit spreads |
Estimated (Decrease)/Increase in Liability |
|||
| (USD in thousands) | ||||
| 300 basis point decline |
$ | 37,414 | ||
| 200 basis point decline |
$ | 23,795 | ||
| 100 basis point decline |
$ | 11,374 | ||
| 100 basis point increase |
$ | (10,454 | ) | |
| 200 basis point increase |
$ | (20,094 | ) | |
| 300 basis point increase |
$ | (29,009 | ) | |
Equity market price risk
At December 31, 2009, the market value and book value of equity securities in our investment portfolio were $215 million and $193 million, respectively. Exposure to changes in equity market prices can be estimated by assessing potential changes in market values on our equity investments resulting from a hypothetical broad-based decline in equity market prices of 20%. With all other factors remaining constant, we estimated that such a decrease would reduce our investment portfolio held in equity investments by $43 million as of December 31, 2009. Preferred securities make up approximately 87% of our equity security portfolio with a market value of $186 million. The majority of our preferred stocks are perpetual preferreds with dividends. The fair value of the preferred securities could be affected by a deferral of dividends. We estimate that the fair value of our preferred securities would decrease if the dividends were deferred.
126
Table of Contents
ITEM 8. FINANCIAL STATEMENTS AND SUPPLEMENTARY DATA
Table of Contents
MANAGEMENT’S REPORT ON INTERNAL CONTROL OVER FINANCIAL REPORTING
Our management is responsible for establishing and maintaining adequate internal control over financial reporting as defined in Rules 13a-15(f) and 15d-15(f) under the Securities Exchange Act of 1934. Our internal control over financial reporting is designed to provide reasonable assurance regarding the reliability of financial reporting and the preparation of our consolidated financial statements for external purposes in accordance with U.S. generally accepted accounting principles. Our internal control over financial reporting includes policies and procedures that:
| • | Pertain to the maintenance of records that, in reasonable detail, accurately and fairly reflect the transactions and dispositions of our assets; |
| • | Provide reasonable assurance that transactions are recorded as necessary to permit preparation of consolidated financial statements in accordance with U.S. generally accepted accounting principles, and that our receipts and expenditures are being made only in accordance with authorizations of our management and directors; and |
| • | Provide reasonable assurance regarding prevention or timely detection of unauthorized acquisition, use or disposition of our assets that could have a material effect on our consolidated financial statements. |
Because of its inherent limitations, internal control over financial reporting may not prevent or detect misstatements. Also, projections of any evaluation of effectiveness to future periods are subject to the risk that controls may become inadequate because of changes in conditions, or that the degree of compliance with the policies or procedures may deteriorate.
Management assessed the effectiveness of our internal control over financial reporting as of December 31, 2009. In making this assessment, management used the criteria set forth by the Committee of Sponsoring Organizations of the Treadway Commission (COSO) in Internal Control—Integrated Framework.
Based on management’s assessment and those criteria, management has concluded that we maintained effective internal control over financial reporting as of December 31, 2009.
Our independent registered public accounting firm has issued an audit report on our internal control over financial reporting. That report appears below in this Item 8.
128
Table of Contents
REPORT OF INDEPENDENT REGISTERED PUBLIC ACCOUNTING FIRM
The Board of Directors and Shareholders of The PMI Group, Inc.
We have audited the accompanying consolidated balance sheets of The PMI Group, Inc. and subsidiaries (the Company) as of December 31, 2009 and 2008, and the related consolidated statements of operations, shareholders’ equity, and cash flows for each of the three years in the period ended December 31, 2009. Our audits also included the financial statement schedules listed in the Index at Item 15(a). These financial statements and schedules are the responsibility of the Company’s management. Our responsibility is to express an opinion on these financial statements and schedules based on our audits.
We conducted our audits in accordance with the standards of the Public Company Accounting Oversight Board (United States). Those standards require that we plan and perform the audit to obtain reasonable assurance about whether the financial statements are free of material misstatement. An audit includes examining, on a test basis, evidence supporting the amounts and disclosures in the financial statements. An audit also includes assessing the accounting principles used and significant estimates made by management, as well as evaluating the overall financial statement presentation. We believe that our audits provide a reasonable basis for our opinion.
In our opinion, the financial statements referred to above present fairly, in all material respects, the consolidated financial position of The PMI Group, Inc. and subsidiaries at December 31, 2009 and 2008, and the consolidated results of their operations and their cash flows for each of the three years in the period ended December 31, 2009, in conformity with U.S. generally accepted accounting principles. Also, in our opinion, the related financial statement schedules, when considered in relation to the basic financial statements taken as a whole, present fairly in all material respects the information set forth therein.
In 2009, the Company adopted FSP FAS No. 115-2, codified in ASC Topic 320, Investments—Debt and Equity Securities. In 2008, the Company adopted FASB Statement No. 159, codified in ASC Topic 825, The Fair Value Option for Financial Assets and Financial Liabilities. In 2007, the Company adopted FASB Interpretation No. 48, codified in ASC Topic 740, Income Taxes. These matters are further described in Note 2 to the consolidated financial statements.
We also have audited, in accordance with the standards of the Public Company Accounting Oversight Board (United States), The PMI Group, Inc. and subsidiaries’ internal control over financial reporting as of December 31, 2009, based on criteria established in Internal Control—Integrated Framework issued by the Committee of Sponsoring Organizations of the Treadway Commission and our report dated March 5, 2010 expressed an unqualified opinion thereon.
/s/ Ernst & Young LLP
San Francisco, California
March 5, 2010
129
Table of Contents
REPORT OF INDEPENDENT REGISTERED PUBLIC ACCOUNTING FIRM
ON INTERNAL CONTROL OVER FINANCIAL REPORTING
The Board of Directors and Shareholders of The PMI Group, Inc.
We have audited The PMI Group, Inc. and subsidiaries’ internal control over financial reporting as of December 31, 2009, based on criteria established in Internal Control—Integrated Framework issued by the Committee of Sponsoring Organizations of the Treadway Commission (the COSO criteria). The PMI Group, Inc. and subsidiaries’ management is responsible for maintaining effective internal control over financial reporting, and for its assessment of the effectiveness of internal control over financial reporting included in the accompanying Management’s Report on Internal Control Over Financial Reporting. Our responsibility is to express an opinion on the company’s internal control over financial reporting based on our audit.
We conducted our audit in accordance with the standards of the Public Company Accounting Oversight Board (United States). Those standards require that we plan and perform the audit to obtain reasonable assurance about whether effective internal control over financial reporting was maintained in all material respects. Our audit included obtaining an understanding of internal control over financial reporting, assessing the risk that a material weakness exists, testing and evaluating the design and operating effectiveness of internal control based on the assessed risk, and performing such other procedures as we considered necessary in the circumstances. We believe that our audit provides a reasonable basis for our opinion.
A company’s internal control over financial reporting is a process designed to provide reasonable assurance regarding the reliability of financial reporting and the preparation of financial statements for external purposes in accordance with generally accepted accounting principles. A company’s internal control over financial reporting includes those policies and procedures that (1) pertain to the maintenance of records that, in reasonable detail, accurately and fairly reflect the transactions and dispositions of the assets of the company; (2) provide reasonable assurance that transactions are recorded as necessary to permit preparation of financial statements in accordance with generally accepted accounting principles, and that receipts and expenditures of the company are being made only in accordance with authorizations of management and directors of the company; and (3) provide reasonable assurance regarding prevention or timely detection of unauthorized acquisition, use or disposition of the company’s assets that could have a material effect on the financial statements.
Because of its inherent limitations, internal control over financial reporting may not prevent or detect misstatements. Also, projections of any evaluation of effectiveness to future periods are subject to the risk that controls may become inadequate because of changes in conditions, or that the degree of compliance with the policies or procedures may deteriorate.
In our opinion, The PMI Group, Inc. and subsidiaries maintained, in all material respects, effective internal control over financial reporting as of December 31, 2009, based on the COSO criteria.
We also have audited, in accordance with the standards of the Public Company Accounting Oversight Board (United States), the 2009 consolidated financial statements of The PMI Group, Inc. and subsidiaries and our report dated March 5, 2010 expressed an unqualified opinion thereon.
/s/ Ernst & Young LLP
San Francisco, California
March 5, 2010
130
Table of Contents
THE PMI GROUP, INC. AND SUBSIDIARIES
CONSOLIDATED STATEMENTS OF OPERATIONS
| Year Ended December 31, | ||||||||||||
| 2009 | 2008 | 2007 | ||||||||||
| (Dollars in thousands, except per share data) | ||||||||||||
| REVENUES |
||||||||||||
| Premiums earned |
$ | 716,841 | $ | 786,159 | $ | 815,440 | ||||||
| Net investment income |
119,166 | 138,701 | 132,552 | |||||||||
| Net realized investment gains (losses) |
37,471 | (139,534 | ) | (24,639 | ) | |||||||
| Change in fair value of certain debt instruments |
16,522 | 123,595 | — | |||||||||
| Other income (loss) |
33,909 | (1,134 | ) | (168 | ) | |||||||
| Total revenues |
923,909 | 907,787 | 923,185 | |||||||||
| LOSSES AND EXPENSES |
||||||||||||
| Losses and loss adjustment expenses |
1,756,755 | 1,899,264 | 1,122,898 | |||||||||
| Amortization of deferred policy acquisition costs |
17,781 | 18,285 | 87,683 | |||||||||
| Other underwriting and operating expenses |
155,211 | 218,583 | 192,917 | |||||||||
| Interest expense |
43,013 | 41,007 | 33,391 | |||||||||
| Total losses and expenses |
1,972,760 | 2,177,139 | 1,436,889 | |||||||||
| Losses before equity in losses from unconsolidated subsidiaries and income taxes |
(1,048,851 | ) | (1,269,352 | ) | (513,704 | ) | ||||||
| Equity in losses from unconsolidated subsidiaries |
(12,019 | ) | (51,802 | ) | (741,500 | ) | ||||||
| Loss from continuing operations before income taxes |
(1,060,870 | ) | (1,321,154 | ) | (1,255,204 | ) | ||||||
| Income tax benefit from continuing operations |
(406,879 | ) | (433,966 | ) | (246,522 | ) | ||||||
| Loss from continuing operations |
(653,991 | ) | (887,188 | ) | (1,008,682 | ) | ||||||
| (Loss) income from discontinued operations, net of taxes |
(5,335 | ) | (41,320 | ) | 93,356 | |||||||
| NET LOSS |
$ (659,326 | ) | $ (928,508 | ) | $ (915,326 | ) | ||||||
| PER SHARE DATA |
||||||||||||
| Basic loss from continuing operations |
$ | (7.94 | ) | $ | (10.90 | ) | $ | (11.92 | ) | |||
| Basic (loss) income from discontinued operations |
(0.07 | ) | (0.50 | ) | 1.11 | |||||||
| Basic net loss |
$ | (8.01 | ) | $ | (11.40 | ) | $ | (10.81 | ) | |||
| Diluted loss from continuing operations |
$ | (7.94 | ) | $ | (10.90 | ) | $ | (11.92 | ) | |||
| Diluted (loss) income from discontinued operations |
(0.07 | ) | (0.50 | ) | 1.11 | |||||||
| Diluted net loss |
$ | (8.01 | ) | $ | (11.40 | ) | $ | (10.81 | ) | |||
See accompanying notes to consolidated financial statements.
131
Table of Contents
THE PMI GROUP, INC. AND SUBSIDIARIES
CONSOLIDATED BALANCE SHEETS
| December 31, 2009 |
December 31, 2008 |
|||||||
| (Dollars in thousands, except per share data) | ||||||||
| ASSETS |
||||||||
| Investments—available-for-sale, at fair value: |
||||||||
| Fixed income securities |
$ | 2,355,188 | $ | 1,997,466 | ||||
| Equity securities: |
||||||||
| Common |
29,090 | 5,593 | ||||||
| Preferred |
186,023 | 216,256 | ||||||
| Short-term investments |
2,232 | 2,280 | ||||||
| Total investments |
2,572,533 | 2,221,595 | ||||||
| Cash and cash equivalents |
686,891 | 1,483,313 | ||||||
| Investments in unconsolidated subsidiaries |
139,775 | 150,377 | ||||||
| Related party receivables |
1,254 | 1,526 | ||||||
| Accrued investment income |
35,028 | 36,323 | ||||||
| Premiums receivable |
56,426 | 58,573 | ||||||
| Reinsurance receivables and prepaid premiums |
52,444 | 22,569 | ||||||
| Reinsurance recoverables |
703,550 | 482,678 | ||||||
| Deferred policy acquisition costs |
41,289 | 34,791 | ||||||
| Property, equipment and software, net of accumulated depreciation and amortization |
101,893 | 125,346 | ||||||
| Prepaid and recoverable income taxes |
50,250 | 9,562 | ||||||
| Deferred income tax assets |
175,585 | 148,184 | ||||||
| Other assets |
21,561 | 49,562 | ||||||
| Total assets |
$ | 4,638,479 | $ | 4,824,399 | ||||
| LIABILITIES |
||||||||
| Reserve for losses and loss adjustment expenses |
$ | 3,250,100 | $ | 2,709,286 | ||||
| Unearned premiums |
72,089 | 111,656 | ||||||
| Debt (includes $213,647 and $230,171 measured at fair value at December 31, 2009 and 2008) |
389,991 | 481,764 | ||||||
| Reinsurance payables |
36,349 | 42,442 | ||||||
| Related party payables |
1,865 | 1,853 | ||||||
| Other liabilities and accrued expenses |
160,998 | 199,173 | ||||||
| Total liabilities |
3,911,392 | 3,546,174 | ||||||
| Commitments and contingencies (Notes 8 and 13) |
||||||||
| SHAREHOLDERS’ EQUITY |
||||||||
| Preferred stock—$0.01 par value; 5,000,000 shares authorized; none issued or outstanding |
— | — | ||||||
| Common stock—$0.01 par value; 250,000,000 shares authorized; 119,313,767 shares issued; 82,580,410 and 81,687,583 shares outstanding |
1,193 | 1,193 | ||||||
| Additional paid-in capital |
873,010 | 892,213 | ||||||
| Treasury stock, at cost (36,733,357 and 37,626,184 shares) |
(1,317,252 | ) | (1,341,037 | ) | ||||
| Retained earnings |
1,104,728 | 1,761,535 | ||||||
| Accumulated other comprehensive income (loss), net of deferred taxes |
65,408 | (35,679 | ) | |||||
| Total shareholders’ equity |
727,087 | 1,278,225 | ||||||
| Total liabilities and shareholders’ equity |
$ | 4,638,479 | $ | 4,824,399 | ||||
See accompanying notes to consolidated financial statements.
132
Table of Contents
THE PMI GROUP, INC. AND SUBSIDIARIES
CONSOLIDATED STATEMENTS OF SHAREHOLDERS’ EQUITY
| Comprehensive Income (Loss) |
Common Stock | Additional Paid-in Capital |
Treasury Stock | Retained Earnings |
Accumulated Other Comprehensive Income (Loss) |
Total | ||||||||||||||||||||||||||
| Shares | Amount | Shares | Amount | |||||||||||||||||||||||||||||
| (in thousands) | ||||||||||||||||||||||||||||||||
| BALANCE, JANUARY 1, 2007 |
119,314 | $ | 1,193 | $ | 858,188 | (32,567 | ) | $ | (1,164,214 | ) | $ | 3,609,343 | $ | 264,080 | $ | 3,568,590 | ||||||||||||||||
| Common stock grants for incentive plans |
— | — | 6,651 | 1,057 | 24,609 | — | — | 31,260 | ||||||||||||||||||||||||
| Compensation expense for share-based payments and ESPP |
— | — | 16,652 | — | — | — | — | 16,652 | ||||||||||||||||||||||||
| Tax benefit on share-based payments |
— | — | 7,026 | — | — | — | — | 7,026 | ||||||||||||||||||||||||
| Common stock repurchases |
— | — | — | (6,684 | ) | (214,996 | ) | — | — | (214,996 | ) | |||||||||||||||||||||
| Dividends declared |
— | — | — | — | — | (17,703 | ) | — | (17,703 | ) | ||||||||||||||||||||||
| Non-vested portion of restricted stock |
— | — | 2,081 | — | — | — | — | 2,081 | ||||||||||||||||||||||||
| Net loss |
$ | (915,326 | ) | — | — | — | — | — | (915,326 | ) | — | (915,326 | ) | |||||||||||||||||||
| Change in unrealized gains on investments, net of taxes |
(61,937 | ) | — | — | — | — | — | — | (61,937 | ) | (61,937 | ) | ||||||||||||||||||||
| Pension adjustment (including plan amendment), net of deferred tax |
3,876 | — | — | — | — | — | — | 3,876 | 3,876 | |||||||||||||||||||||||
| Accretion of cash flow hedges to interest expense |
398 | — | — | — | — | — | — | 398 | 398 | |||||||||||||||||||||||
| Foreign currency translation adjustment |
108,660 | — | — | — | — | — | — | 108,660 | 108,660 | |||||||||||||||||||||||
| Comprehensive loss |
$ | (864,329 | ) | — | — | — | — | — | — | — | — | |||||||||||||||||||||
| Adjustment to initially apply new accounting pronouncement (Note 12) |
— | — | — | — | — | (15,619 | ) | — | (15,619 | ) | ||||||||||||||||||||||
| BALANCE, DECEMBER 31, 2007 |
119,314 | $ | 1,193 | $ | 890,598 | (38,194 | ) | $ | (1,354,601 | ) | $ | 2,660,695 | $ | 315,077 | $ | 2,512,962 | ||||||||||||||||
| Common stock grants for incentive plans |
— | — | (10,788 | ) | 568 | 13,564 | — | — | 2,776 | |||||||||||||||||||||||
| Compensation expense for share-based payments and ESPP |
— | — | 9,163 | — | — | — | — | 9,163 | ||||||||||||||||||||||||
| Tax benefit on share-based payments |
— | — | 1,907 | — | — | — | — | 1,907 | ||||||||||||||||||||||||
| Dividends declared |
— | — | — | — | — | (2,451 | ) | — | (2,451 | ) | ||||||||||||||||||||||
| Non-vested portion of restricted stock |
— | — | 1,333 | — | — | — | 1,333 | |||||||||||||||||||||||||
| Net loss |
$ | (928,508 | ) | — | — | — | — | — | (928,508 | ) | — | (928,508 | ) | |||||||||||||||||||
| Change in unrealized gains on investments, net of taxes |
(101,773 | ) | — | — | — | — | — | — | (101,773 | ) | (101,773 | ) | ||||||||||||||||||||
| Pension adjustment (including plan amendment), net of deferred tax |
(16,593 | ) | — | — | — | — | — | — | (16,593 | ) | (16,593 | ) | ||||||||||||||||||||
| Accretion of cash flow hedges to interest expense |
398 | — | — | — | — | — | — | 398 | 398 | |||||||||||||||||||||||
| Foreign currency translation adjustment |
(232,788 | ) | — | — | — | — | — | — | (232,788 | ) | (232,788 | ) | ||||||||||||||||||||
| Comprehensive loss |
$ | (1,279,264 | ) | — | — | — | — | — | — | — | — | |||||||||||||||||||||
| Adjustment to initially apply new accounting pronouncement (Note 10) |
— | — | — | — | — | 31,799 | — | 31,799 | ||||||||||||||||||||||||
| BALANCE, DECEMBER 31, 2008 |
119,314 | $ | 1,193 | $ | 892,213 | (37,626 | ) | $ | (1,341,037 | ) | $ | 1,761,535 | $ | (35,679 | ) | $ | 1,278,225 | |||||||||||||||
| Common stock grants for incentive plans |
— | — | (23,031 | ) | 893 | 23,785 | — | — | 754 | |||||||||||||||||||||||
| Compensation expense for share-based payments and ESPP |
— | — | 3,205 | — | — | — | — | 3,205 | ||||||||||||||||||||||||
| Non-vested portion of restricted stock |
— | — | 623 | — | — | — | — | 623 | ||||||||||||||||||||||||
| Net loss |
$ | (659,326 | ) | — | — | — | — | — | (659,326 | ) | — | (659,326 | ) | |||||||||||||||||||
| Change in unrealized gains on investments, net of taxes |
93,559 | — | — | — | — | — | — | 93,559 | 93,559 | |||||||||||||||||||||||
| Pension adjustment (including plan amendment), net of deferred tax |
5,314 | — | — | — | — | — | — | 5,314 | 5,314 | |||||||||||||||||||||||
| Accretion of cash flow hedges to interest expense |
398 | — | — | — | — | — | — | 398 | 398 | |||||||||||||||||||||||
| Foreign currency translation adjustment |
1,816 | — | — | — | — | — | — | 1,816 | 1,816 | |||||||||||||||||||||||
| Comprehensive loss |
$ | (558,239 | ) | — | — | — | — | — | — | — | — | |||||||||||||||||||||
| Adjustment to initially apply new accounting pronouncement (Note 4) |
— | — | — | — | — | 2,519 | — | 2,519 | ||||||||||||||||||||||||
| BALANCE, DECEMBER 31, 2009 |
119,314 | $ | 1,193 | $ | 873,010 | (36,733 | ) | $ | (1,317,252 | ) | $ | 1,104,728 | $ | 65,408 | $ | 727,087 | ||||||||||||||||
See accompanying notes to consolidated financial statements.
133
Table of Contents
THE PMI GROUP, INC. AND SUBSIDIARIES
CONSOLIDATED STATEMENTS OF CASH FLOWS
| Year Ended December 31, | ||||||||||||
| 2009 | 2008 | 2007 | ||||||||||
| (Dollars in thousands) | ||||||||||||
| CASH FLOWS FROM OPERATING ACTIVITIES FROM CONTINUING OPERATIONS |
||||||||||||
| Net loss |
$ | (659,326 | ) | $ | (928,508 | ) | $ | (915,326 | ) | |||
| Less loss (income) from discontinued operations, net of taxes |
5,335 | 41,320 | (93,356 | ) | ||||||||
| Adjustments to reconcile net loss to net cash provided by operating activities: |
||||||||||||
| Equity in losses from unconsolidated subsidiaries |
12,019 | 51,802 | 741,500 | |||||||||
| Net realized investment (gains) losses |
(34,741 | ) | 138,544 | 24,456 | ||||||||
| Change in fair value of certain debt instruments |
(16,522 | ) | (123,595 | ) | — | |||||||
| Depreciation and amortization |
34,699 | 28,084 | 21,247 | |||||||||
| Realized gain from sale of unconsolidated subsidiary |
(3,227 | ) | — | — | ||||||||
| Deferred income taxes |
(26,773 | ) | (100,015 | ) | (158,339 | ) | ||||||
| Compensation expense related to share-based payments |
3,205 | 8,815 | 16,652 | |||||||||
| Excess tax benefits on the exercise of employee stock options |
— | — | (4,001 | ) | ||||||||
| Deferred policy acquisition costs incurred and deferred |
(24,265 | ) | (38,803 | ) | (55,054 | ) | ||||||
| Amortization of deferred policy acquisition costs |
17,781 | 18,285 | 87,683 | |||||||||
| Changes in: |
||||||||||||
| Accrued investment income |
1,350 | (5,161 | ) | (1,059 | ) | |||||||
| Premiums receivable |
2,227 | 3,600 | 625 | |||||||||
| Reinsurance receivables, and prepaid premiums net of reinsurance payables |
(35,968 | ) | (12,673 | ) | 11,739 | |||||||
| Reinsurance recoverables |
(220,872 | ) | (445,752 | ) | (33,082 | ) | ||||||
| Prepaid and recoverable income taxes |
(40,692 | ) | 74,758 | (73,248 | ) | |||||||
| Reserve for losses and loss adjustment expenses |
539,961 | 1,538,804 | 787,367 | |||||||||
| Unearned premiums |
(39,960 | ) | (17,253 | ) | 489 | |||||||
| Related party receivables, net of payables |
257 | 1,809 | (2,096 | ) | ||||||||
| Liability for pension benefit |
(27,452 | ) | 45,735 | (12,660 | ) | |||||||
| Other |
(27,089 | ) | (2,643 | ) | 57,097 | |||||||
| Net cash (used in) provided by operating activities from continuing operations |
(540,053 | ) | 277,153 | 400,634 | ||||||||
| CASH FLOWS FROM INVESTING ACTIVITIES FROM CONTINUING OPERATIONS |
||||||||||||
| Proceeds from sales and maturities of fixed income securities |
992,735 | 578,664 | 258,158 | |||||||||
| Proceeds from the sale of PMI Australia |
— | 697,470 | — | |||||||||
| Proceeds from the sale of PMI Asia |
— | 51,571 | — | |||||||||
| Proceeds from sales of equity securities |
61,030 | 112,958 | 126,500 | |||||||||
| Proceeds from sale of unconsolidated subsidiary |
3,227 | — | — | |||||||||
| Proceeds from sale of equity investment held for sale |
— | 3,375 | — | |||||||||
| Investment purchases: Fixed income securities |
(1,211,643 | ) | (745,634 | ) | (292,660 | ) | ||||||
| Equity securities |
(21,791 | ) | (7,849 | ) | (201,632 | ) | ||||||
| Net change in short-term investments |
49 | (29 | ) | (22 | ) | |||||||
| Distributions from unconsolidated subsidiaries, net of investments |
(222 | ) | (968 | ) | 23,561 | |||||||
| Capital expenditures and capitalized software, net of dispositions |
(2,473 | ) | (3,517 | ) | (15,916 | ) | ||||||
| Net cash (used in) provided by investing activities from continuing operations |
(179,088 | ) | 686,041 | (102,011 | ) | |||||||
| CASH FLOWS FROM FINANCING ACTIVITIES FROM CONTINUING OPERATIONS |
||||||||||||
| Net proceeds from issuance of long-term debt |
— | 200,000 | — | |||||||||
| Repayment and extinguishment of long-term debt and credit facility, net of expenses |
(75,250 | ) | (45,000 | ) | — | |||||||
| Purchases of treasury stock |
— | — | (214,996 | ) | ||||||||
| Proceeds from issuance of treasury stock |
754 | 2,777 | 31,260 | |||||||||
| Excess tax benefits on the exercise of employee stock options |
— | — | 4,001 | |||||||||
| Dividends paid to common shareholders |
— | (2,451 | ) | (17,703 | ) | |||||||
| Net cash (used in) provided by financing activities from continuing operations |
(74,496 | ) | 155,326 | (197,438 | ) | |||||||
| CASH FLOWS FROM DISCONTINUED OPERATIONS: |
||||||||||||
| Net cash (used in) provided by operating activities from discontinued operations |
(5,335 | ) | (22,472 | ) | 158,013 | |||||||
| Net cash provided by (used in) investing activities from discontinued operations |
— | 46,439 | (359,776 | ) | ||||||||
| Net cash provided by financing activities from discontinued operations |
— | — | 424 | |||||||||
| Net cash (used in) provided by discontinued operations |
(5,335 | ) | 23,967 | (201,339 | ) | |||||||
| Effect of exchange rate changes on cash and cash equivalents from continuing operations |
2,550 | (13,686 | ) | 9,890 | ||||||||
| Effect of exchange rate changes on cash and cash equivalents from discontinued operations—held for sale |
— | 4 | 12,094 | |||||||||
| Net (decrease) increase in cash and cash equivalents |
(796,422 | ) | 1,128,805 | (78,170 | ) | |||||||
| Cash and cash equivalents at the beginning of the year |
1,483,313 | 354,508 | 506,082 | |||||||||
| Less cash and cash equivalents of discontinued operations—held for sale, at the end of the year |
— | — | 73,404 | |||||||||
| Cash and cash equivalents of continuing operations at end of year |
$ | 686,891 | $ | 1,483,313 | $ | 354,508 | ||||||
| SUPPLEMENTAL CASH FLOW DISCLOSURES: |
||||||||||||
| Cash paid during the year: |
||||||||||||
| Interest paid, net of capitalization |
$ | 39,853 | $ | 36,469 | $ | 32,096 | ||||||
| Income taxes refunded, net of payments |
$ | (6,837 | ) | $ | (32,580 | ) | $ | 40,928 | ||||
See accompanying notes to consolidated financial statements.
134
Table of Contents
THE PMI GROUP, INC. AND SUBSIDIARIES
NOTES TO CONSOLIDATED FINANCIAL STATEMENTS
NOTE 1. BASIS OF PRESENTATION
The accompanying consolidated financial statements include the accounts of The PMI Group, Inc. (“The PMI Group”, “TPG” or the “Company”), a Delaware corporation and its direct and indirect wholly-owned subsidiaries, including: PMI Mortgage Insurance Co. (“MIC”), an Arizona corporation, and its affiliated U.S. mortgage insurance and reinsurance companies (collectively “PMI”); PMI Mortgage Insurance Company Limited and its holding company, PMI Europe Holdings Limited, the Irish insurance companies (collectively “PMI Europe”); PMI Mortgage Insurance Company Canada and its holding company, PMI Mortgage Insurance Holdings Canada Inc. (collectively “PMI Canada”); and other insurance, reinsurance and non-insurance subsidiaries. Also included in the accompanying financial statements and reported as discontinued operations for all periods presented are the accounts of PMI Mortgage Insurance Ltd. and its holding company, PMI Mortgage Insurance Australia (Holdings) Pty Limited (collectively “PMI Australia”) and PMI Mortgage Insurance Asia Ltd. (“PMI Asia”) which were sold as of December 31, 2008; and the accounts of PMI Guaranty Co. (“PMI Guaranty”) which was considered disposed of other than by sale as of December 31, 2008. As of December 31, 2008, upon receiving regulatory approval, PMI Guaranty’s remaining assets and liabilities were merged into PMI. The PMI Group and its subsidiaries are collectively referred to as the “Company.” All material inter-company transactions and balances have been eliminated in the consolidated financial statements.
The Company completed the sales of PMI Australia and PMI Asia to the QBE Insurance Group (“QBE”) in the fourth quarter of 2008. The Company has classified the results of its PMI Australia, PMI Asia and PMI Guaranty operations as discontinued operations for all periods presented. The assets and liabilities of PMI Guaranty which were disposed of other than by sale are classified in the consolidated balance sheets according to their nature. The results of discontinued operations, which include both disposed of by sale and disposed of other than by sale, are reported as “Loss from discontinued operations, net of taxes” in the consolidated statements of operations for all periods presented.
The Company has equity ownership interests in CMG Mortgage Insurance Company and CMG Mortgage Assurance Company (collectively “CMG MI”), which conduct residential mortgage insurance business for credit unions. In addition in the third quarter of 2009, MIC and CUNA Mutual Insurance Society contributed the stock of CMG Mortgage Reinsurance Company, which provides reinsurance to residential mortgage insurers, to CMG Mortgage Assurance Company. The Company also has an approximately 42.0% equity ownership interest in FGIC Corporation, the holding company of Financial Guaranty Insurance Company (collectively “FGIC”), a New York-domiciled financial guaranty insurance company. The Company also has ownership interests in several limited partnerships. In addition, the Company owns 100% of PMI Capital I (“Issuer Trust”), an unconsolidated wholly-owned trust that privately issued debt in 1997. In the fourth quarter of 2009, the Company sold its equity ownership interest in RAM Holdings Ltd., the holding company of RAM Reinsurance Company, Ltd. (collectively “RAM Re”), a financial guaranty reinsurance company based in Bermuda.
During the first quarter of 2008, the Company impaired its investment in FGIC and reduced the carrying value of its investment in FGIC from $103.6 million to zero. To the extent that the carrying value of the Company’s investment in FGIC remains zero, the Company will not recognize in future periods its proportionate share of FGIC’s losses, if any. The Company is under no obligation to provide additional capital to FGIC.
Impact of Current Economic Environment
The ongoing weakness in the U.S. residential mortgage, housing, credit, and capital markets continues to negatively affect the Company’s results of operations and overall financial condition. The Company’s consolidated net loss was $659.3 million, $928.5 million and $915.3 million for the years ended December 31, 2009, 2008 and 2007, respectively.
135
Table of Contents
THE PMI GROUP, INC. AND SUBSIDIARIES
NOTES TO CONSOLIDATED FINANCIAL STATEMENTS—(Continued)
The Company continues to focus on its core U.S mortgage insurance business under difficult market conditions. Unless the Company raises substantial additional capital to support PMI or achieves significant additional statutory capital relief in the first quarter of 2010, MIC’s excess minimum policyholders’ position will decline and its risk-to-capital ratio will increase beyond levels necessary to meet regulatory capital adequacy requirements.
In sixteen states, if a mortgage insurer does not meet a required minimum policyholders’ position or exceeds a maximum permitted risk-to-capital ratio (generally 25 to 1), it may be prohibited from writing new business until its risk-to-capital ratio falls below the limit or its policyholders’ position meets the minimum, as applicable. In certain of those states, the applicable regulations require a mortgage insurer to immediately cease writing new business if and so long as it fails to meet the applicable capital adequacy requirements. In other states, the applicable regulator has discretion as to whether the mortgage insurer may continue writing new business. In 2009, North Carolina, Arizona and California adopted legislation giving the respective state’s insurance regulators such discretion. Thirty-four other states do not have specific capital adequacy requirements for mortgage insurers. MIC’s principal regulator is the Arizona Department of Insurance (the “Department”). On February 10, 2010, MIC received a letter from the Department waiving, until December 31, 2011, the requirement that MIC maintain the Arizona required minimum policyholders’ position to write new business. The waiver may be withdrawn by the Arizona Director of Insurance in her sole discretion at any time. If the Department were to withdraw the waiver and MIC fails to maintain Arizona’s minimum policyholders’ position, MIC would likely be required to suspend writing new business in all states. Even with the waiver from the Department, other states could require MIC to cease new business writings if MIC fails to maintain the applicable capital adequacy requirements.
In the event that MIC is unable to continue to write new mortgage insurance in one or more states, the Company is working on a plan to enable it to write new mortgage insurance in those states by PMAC. PMAC is a subsidiary of MIC, and was formerly known as Commercial Loan Insurance Corporation. PMAC is currently licensed to write insurance in all states except Connecticut, Michigan and New York. In several other states, PMAC is applying to revise the line of insurance business it is authorized to transact so that it may begin writing residential mortgage guaranty insurance in those states. There is no guarantee that PMAC will be able to obtain insurance licenses in Connecticut, Michigan or New York or approval to revise its existing licenses in other impacted states. In addition, before PMAC can begin writing new business, Freddie Mac must approve PMAC as an eligible mortgage insurer. On February 12, 2010, Fannie Mae approved PMAC as a direct issuer of mortgage guaranty insurance. Fannie Mae’s approval terminates on the earlier of December 31, 2011 or the date that MIC ceases to transact new business in all jurisdictions in which it is licensed. The approval is subject to a number of detailed conditions. Among other things, the approval contains limitations as to the jurisdictions, volume and types of new business PMAC may write, and restricts MIC and PMAC from taking a variety of actions, subject to enumerated exceptions, without Fannie Mae’s prior written consent, which is not to be unreasonably withheld, including engaging in certain transactions with affiliates, paying dividends or making distributions or payments of indebtedness or transferring assets outside the ordinary course of business or in excess of specified levels. Notwithstanding these restrictions, the agreement with Fannie Mae permits MIC to make dividend, interest, and principal payments in connection with the issuance of certain new debt or equity instruments up to specified levels. PMAC is currently in negotiations with Freddie Mac about becoming an eligible insurer under Freddie Mac’s criteria. Beginning January 1, 2010, PMAC will be included in U.S. Mortgage Insurance Operations.
In response to changing economic and industry conditions and in order to preserve capital, the Company made a number of changes to its underwriting guidelines and customer management strategies in 2008 and 2009, which had the effect of limiting PMI’s new business writings in 2009. The Company is undertaking efforts to maintain or slightly increase insurance writings in 2010. However, the Company expects a variety of factors to continue to impact its new business writings in 2010. Such factors include, among others, mortgage and private
136
Table of Contents
THE PMI GROUP, INC. AND SUBSIDIARIES
NOTES TO CONSOLIDATED FINANCIAL STATEMENTS—(Continued)
mortgage insurance market conditions, PMI’s underwriting guidelines which limit the type of new business that PMI is willing to write and continuation of certain customer management strategies adopted in 2009. The Company believes there is currently sufficient liquidity at the holding company to pay holding company expenses (including interest expense on its outstanding debt) in 2010 and there are sufficient assets at the insurance company level for PMI to meet its obligations in 2010.
NOTE 2. SUMMARY OF SIGNIFICANT ACCOUNTING POLICIES
The Company’s consolidated financial statements have been prepared in accordance with U.S. generally accepted accounting principles (“GAAP”) and the requirements of Form 10-K and Article 7 of Regulation S-X. The preparation of financial statements in conformity with GAAP requires management to make estimates and assumptions that affect the reported amounts of assets and liabilities and disclosure of contingent assets and liabilities at the date of the consolidated financial statements, as well as the reported amounts of revenues and expenses during the reporting period. Actual results could differ from these estimates. In the opinion of management, all adjustments, consisting of only normal recurring adjustments, considered necessary for a fair presentation for the period presented have been included.
Risks and Uncertainties—The Company is dependent upon mortgage originators to provide mortgage loans to insure. In the event any of its largest customers choose to stop providing the Company with mortgage loans to insure, the Company’s ability to generate new insurance business could be adversely affected. The Company’s U.S. Mortgage Insurance Operations’ ten largest customers generated 56.9%, 49.4%, and 52.0% of its premiums earned in 2009, 2008 and 2007, respectively.
The Company is affected by economic downturns, natural disasters and other events in specific regions of the United States where a large portion of its U.S. business is concentrated. As of December 31, 2009, 10.1% of PMI’s primary risk in force was located in Florida, and 7.7% was located in California. The Company has experienced accelerated delinquency and loss development in those states. In addition, it has experienced higher default and claim rates for high LTV loans, ARMs, 2/28 Hybrid ARMs, Alt-A loans, interest only loans, payment option ARMS and less-than-A quality loans. The Company also insures loans that have more than one of the above risk characteristics. This “layering” of risk has further increased the risk of borrower default. Although the Company attempts to incorporate the higher default and claim rates associated with these loans into its underwriting and pricing models, there can be no assurance that the premiums earned and the associated investment income will be adequate to compensate for future losses from these loans or that future adverse loss development will not emerge.
The Company’s various U.S., European, and Canadian insurance subsidiaries are subject to comprehensive regulation. These regulations are generally intended to protect policyholders, rather than to benefit investors. Although their scope varies, applicable laws and regulations grant broad powers to supervisory agencies or officials to examine companies and to enforce rules or exercise discretion covering almost every significant aspect of the insurance business. The licensing of the Company’s insurance subsidiaries, their premium rates, their forms and policies offered to customers, their financial statements and periodic financial reporting, and their permissible investments and adherence to financial standards relating to statutory surplus, dividends to the Company and other criteria of solvency are all subjects of detailed regulations.
The Company establishes loss reserves to recognize the liability for unpaid losses related to insured mortgages that are in default. These loss reserves are based upon the Company’s estimates of the claim rate and average claim size, as well as the estimated costs of settling claims. These estimates are regularly reviewed and updated using currently available information. Any adjustments due to positive or adverse developments, which may be material, resulting from these reviews would impact current reserve requirements. The Company’s
137
Table of Contents
THE PMI GROUP, INC. AND SUBSIDIARIES
NOTES TO CONSOLIDATED FINANCIAL STATEMENTS—(Continued)
reserves may not be adequate to cover ultimate loss development on incurred defaults. The Company’s consolidated financial condition, results of operations and cash flows could be harmed if the Company’s reserve estimates are insufficient to cover the actual related claims paid and loss-related expenses incurred.
Significant accounting policies are as follows:
Investments—The Company has designated its entire portfolio of fixed income and equity securities as available-for-sale. These securities are predominantly recorded at fair value based on quoted market prices with unrealized gains and losses, net of deferred income taxes, accounted for as a component of accumulated other comprehensive income in shareholders’ equity. The Company’s short-term investments have maturities of greater than three and less than 12 months when purchased and are carried at fair value. The Company evaluates its portfolio of equity securities regularly to determine whether there are declines in value and whether such declines meet the definition of other-than-temporary impairment (“OTTI”) in accordance with FASB ASC Topic 320 Investments-Debt and Equity Securities (“Topic 320”), previously SFAS No. 115, Securities and Exchange Commission (“SEC”) Staff Accounting Bulletin (“SAB”) No. 59, Accounting for Noncurrent Marketable Equity Securities, and FSP FAS No. 115-2. When the Company determines that an equity security has suffered an OTTI, the impairment loss is recognized, to the extent of the credit related portion of the decline, as a realized investment loss in the consolidated statement of operations.
The Company recognizes OTTI for debt securities classified as available for sale in accordance with Topic 320. The Company assesses whether it intends to sell or it is more likely than not that it will be required to sell a security before recovery of its amortized cost basis less any current-period credit losses. For debt securities that are considered other-than-temporarily impaired and that the Company does not intend to sell and will not be required to sell prior to recovery of its amortized cost basis, the Company separates the amount of the impairment into the amount that is credit-related (referred to as the credit loss component) and the amount due to all other factors. The credit loss component is recognized in net income and is the difference between the security’s amortized cost basis and the present value of its expected future cash flows. The remaining difference between the security’s fair value and the present value of future expected cash flows is due to factors that are not credit-related and is recognized in accumulated other comprehensive income (“AOCI”). For debt securities that are intended to be sold, or that management believes are more likely than not to be required to be sold prior to recovery, the full impairment is recognized immediately in earnings.
Realized gains and losses on sales of investments are determined on a specific-identification basis. Investment income consists primarily of interest and dividends. Interest income and preferred stock dividends are recognized on an accrual basis. Dividend income on common stocks is recognized on the date of declaration. Net investment income represents interest and dividend income, net of investment expenses.
Cash and Cash Equivalents—The Company considers all highly liquid investments purchased with an original maturity of three months or less to be cash equivalents.
Investments in Unconsolidated Subsidiaries—Investments in the Company’s unconsolidated subsidiaries include both equity investees and other unconsolidated subsidiaries. Investments in equity investees with ownership interests of 20-50% are generally accounted for using the equity method of accounting, and investments of less than 20% ownership interest are generally accounted for using the cost method of accounting if the Company does not have significant influence over the entity. Limited partnerships with ownership interests greater than 3% but less than 50% are primarily accounted for using the equity method of accounting. The carrying value of the investments in the Company’s unconsolidated subsidiaries also includes the Company’s share of net unrealized gains and losses in the unconsolidated subsidiaries’ investment portfolios.
138
Table of Contents
THE PMI GROUP, INC. AND SUBSIDIARIES
NOTES TO CONSOLIDATED FINANCIAL STATEMENTS—(Continued)
Periodically, or as events dictate, the Company evaluates potential impairment of its investments in unconsolidated subsidiaries. FASB ASC Topic 323 Investments-Equity Methods and Joint Ventures (“Topic 323”), previously APB No. 18, provides criteria for determining potential impairment. In the event a loss in value of an investment is determined to be an other-than-temporary decline, an impairment charge would be recognized in the consolidated statement of operations. Evidence of a loss in value that could indicate impairment might include, but would not necessarily be limited to, the absence of an ability to recover the carrying amount of the investment or the inability of the investee to sustain an earnings capacity which would justify the carrying amount of the investment. Realized capital gains or losses resulting from the sale of the Company’s ownership interests of unconsolidated subsidiaries are recognized as net realized investment gains or losses in the consolidated statement of operations.
The Company reports the equity in earnings from CMG MI and FGIC on a current month basis and the Company’s interest in limited partnerships are reported on a one-quarter lag basis. Due to the impairment of the Company’s investment in FGIC in 2008, the carrying value of the Company’s investments in FGIC was reduced to and has remained at zero. To the extent that the carrying value remains zero, the Company will not recognize in future periods its proportionate share of FGIC losses, if any. In the fourth quarter of 2009, the Company sold its equity ownership interest in RAM Re.
Related Party Receivables and Payables—As of December 31, 2009, related party receivables were $1.3 million and related party payables were $1.9 million compared to $1.5 million and $1.9 million as of December 31, 2008, respectively, which were comprised of non-trade receivables and payables from unconsolidated subsidiaries.
Deferred Policy Acquisition Costs—The Company defers certain costs of its mortgage insurance operations relating to the acquisition of new insurance and amortizes these costs against related premium revenue in order to match costs and revenues. To the extent the Company provided contract underwriting services on loans that did not require mortgage insurance, associated underwriting costs were not deferred. Costs related to the acquisition of mortgage insurance business are initially deferred and reported as deferred policy acquisition costs. Consistent with industry accounting practice, amortization of these costs for each underwriting year book of business is charged against revenue in proportion to estimated gross profits. Estimated gross profits are composed of earned premiums, interest income, losses and loss adjustment expenses. The deferred costs are adjusted as appropriate for policy cancellations to be consistent with the Company’s revenue recognition policy. For each underwriting year, the Company estimates the rate of amortization to reflect actual experience and any changes to persistency or loss development. Deferred policy acquisition costs are reviewed periodically to determine that they do not exceed recoverable amounts, after considering investment income.
Property, Equipment and Software—Property and equipment, including software, are carried at cost and are depreciated using the straight-line method over the estimated useful lives of the assets, ranging from three to thirty nine years. Leasehold improvements are recorded at cost and amortized over the lesser of the useful life of the assets or the remaining term of the related lease. The Company’s accumulated depreciation and amortization from continuing operations was $189.0 million and $206.4 million as of December 31, 2009 and December 31, 2008, respectively.
The Company capitalizes costs incurred during the application development stage related to software developed for internal use and for which it has no substantive plan to market externally in accordance with FASB ASC Topic 350 Intangibles-Goodwill and Other, previously SOP No. 98-1. Capitalized costs are amortized at such time as the software is ready for its intended use on a straight-line basis over the estimated useful life of the asset, which is generally three to seven years.
139
Table of Contents
THE PMI GROUP, INC. AND SUBSIDIARIES
NOTES TO CONSOLIDATED FINANCIAL STATEMENTS—(Continued)
Derivatives—Certain credit default swap contracts entered into by PMI Europe are considered credit derivative contracts under FASB ASC Topic 815 Derivatives and Hedging (“Topic 815”), previously SFAS No. 133 and SFAS No. 149. These credit default swap derivatives are recorded at their fair value on the consolidated balance sheet with subsequent changes in fair value recorded in consolidated net income or loss. The Company determines the fair values of its credit default swaps on a quarterly basis and uses internally developed models since observable market quotes are not regularly available. These models include future estimated claim payments and market input assumptions, including discount rates and market spreads to calculate a fair value and reflect management’s best judgment about current market conditions. Due to the illiquid nature of the credit default swap market, the use of available market data and assumptions used by management to estimate fair value could differ materially from amounts that would be realized in the market if the derivatives were traded. Due to the volatile nature of the credit market as well as the imprecision inherent in the Company’s fair value estimate, future valuations could differ materially from those reflected in the current period.
Special Purpose Entities—Certain insurance transactions entered into by PMI and PMI Europe require the use of foreign wholly-owned special purpose entities principally for regulatory purposes. These special purpose entities are consolidated in the Company’s consolidated financial statements.
Premium Deficiency Reserve—The Company performs an analysis for premium deficiency using assumptions based on management’s best estimate when the assessment is performed. The calculation for premium deficiency requires significant judgment and includes estimates of future expected premiums, expected claims, loss adjustment expenses and maintenance costs as of the date of the analysis. The calculation of future expected premiums uses assumptions for persistency and termination levels on policies currently in force. Assumptions for future expected losses include future expected average claim sizes and claim rates which are based on the current default rate and expected future defaults. Investment income is also considered in the premium deficiency calculation. The Company performs premium deficiency analyses quarterly. Premium deficiency analyses were performed as of December 31, 2009. The Company determined that there were premium deficiencies at two companies in the International Operations segment and recorded premium deficiency reserves of $2.4 million and $1.4 million for PMI Europe and PMI Canada, respectively. The effects of establishing premium deficiency reserves were included in losses and loss adjustment expenses in the consolidated statements of operations. The Company determined there was no premium deficiency in its U.S. Mortgage Insurance Operations segment. To the extent premium levels and actual loss experience differ from the assumptions used, the results could be negatively affected in future periods.
Reserve for Losses and Loss Adjustment Expenses—The consolidated reserves for losses and loss adjustment expenses (“LAE”) for the Company’s U.S. Mortgage Insurance and International Operations are the estimated claim settlement costs on notices of default that have been received by the Company, as well as loan defaults that have been incurred but have not been reported by the lenders. For reporting and internal tracking purposes, the Company does not consider a loan to be in default until the borrower has missed two payments. Depending upon its scheduled payment date, a loan in default for two consecutive monthly payments could be reported to PMI between the 31st and the 60th day after the first missed payment due date. The Company’s U.S. mortgage insurance primary master policy defines “default” as the borrower’s failure to pay when due an amount equal to the scheduled monthly mortgage payment under the terms of the mortgage. Generally, however, the master policy requires an insured to notify PMI of a default no later than the last business day of the month following the month in which the borrower becomes three monthly payments in default. Consistent with industry accounting practices, the Company considers its mortgage insurance policies short-duration contracts and, accordingly, does not establish loss reserves for future claims on insured loans that are not currently in default. The Company establishes loss reserves when insured loans are identified as currently in default using estimated claim rates and claim amounts for each report year, net of recoverables. The Company also establishes loss reserves for defaults that it believes have been incurred but not yet reported to the Company prior to the close of
140
Table of Contents
THE PMI GROUP, INC. AND SUBSIDIARIES
NOTES TO CONSOLIDATED FINANCIAL STATEMENTS—(Continued)
an accounting period using estimated claim rates and claim amounts applied to the estimated number of defaults not reported.
The Company establishes loss reserves on a gross basis for losses and LAE for its deductible pool policies, which contain aggregate deductible and stop-loss limits, on a pool by pool basis. The gross reserves for each pool are based on reported delinquencies, claim rate and claim size assumptions which are determined based on the loan characteristics of the pool, delinquency trends and historical performance as well as expected economic conditions. After determining the gross loss reserve, deductible and stop-loss limits are applied to determine the net loss reserve.
The Company establishes reserves for losses and LAE for financial guaranty contracts on a case-by-case basis when specific insured obligations are in payment default or are likely to be in payment default. Financial guaranty contracts are recorded in accordance with the accounting guidance provided in Topic 944. These reserves represent an estimate of the present value of the anticipated shortfall between payments on insured obligations plus anticipated loss adjustment expenses and anticipated cash flows from, and proceeds to be received on sales of any collateral supporting the obligation and/or other anticipated recoveries. The discount rate used in calculating the net present value of estimated losses is based upon the risk-free rate for the duration of the anticipated shortfall. The Company currently reinsures six financial guaranty contracts in PMI Europe.
Changes in loss reserves can materially affect the Company’s consolidated net income or loss. The process of estimating loss reserves requires the Company to forecast the interest rate, employment and housing market environments, which are highly uncertain. Therefore, the process requires significant management judgment and estimates. The use of different estimates would have resulted in the establishment of different reserves. In addition, changes in the accounting estimates are reasonably likely to occur from period to period based on the economic conditions. The Company reviews the judgments made in its prior period estimation process and adjusts the current assumptions as appropriate. While the assumptions are based in part upon historical data, the loss provisioning process is complex and subjective and, therefore, the ultimate liability may vary significantly from the Company’s estimates.
Reinsurance—The Company uses reinsurance to reduce net risk in force, optimize capital allocation and comply with a statutory provision adopted by several states that limits the maximum mortgage insurance coverage that can be provided by a single company to 25% of the original principle balance for any single risk. The Company’s reinsurance agreements typically provide for a recovery of a proportionate level of claim expenses from reinsurers, and a reinsurance receivable is recorded as an asset based on the type of reinsurance coverage. The Company remains liable to its policyholders if the reinsurers are unable to satisfy their obligations under the agreements. Reinsurance recoverables on loss estimates are based on the Company’s actuarial analysis of the applicable business. Amounts the Company will ultimately recover could differ from amounts recorded as reinsurance recoverables. Accordingly, management assesses, among other factors, risk transfer criteria for all reinsurance arrangements.
Revenue Recognition—Mortgage guaranty insurance policies are contracts that are generally non-cancelable by the insurer, are renewable at a fixed price, and provide for payment of premiums on a monthly, annual or single basis. Upon renewal, the Company is not able to re-underwrite or re-price its policies. Consistent with industry accounting practices, premiums written on a monthly basis are earned as coverage is provided. Monthly premiums accounted for 88.5%, 84.7% and 81.0% of gross premiums written from the Company’s mortgage insurance operations in 2009, 2008 and 2007, respectively. Premiums written on an annual basis are amortized on a monthly pro rata basis over the year of coverage. Primary mortgage insurance premiums written on policies covering more than one year are referred to as single premiums. A portion of the revenue from single premiums is recognized in premiums earned in the current period, and the remaining portion is
141
Table of Contents
THE PMI GROUP, INC. AND SUBSIDIARIES
NOTES TO CONSOLIDATED FINANCIAL STATEMENTS—(Continued)
deferred as unearned premiums and earned over the expected life of the policy, a range of seven to fifteen years for the majority of the single premium policies. If single premium policies related to insured loans are cancelled due to repayment by the borrower, and the premium is non-refundable, then the remaining unearned premium related to each cancelled policy is recognized as earned premiums upon notification of the cancellation. Unearned premiums represent the portion of premiums written that is applicable to the estimated unexpired risk of insured loans. Rates used to determine the earning of single premiums are estimates based on actuarial analysis of the expiration of risk.
Income Taxes—The Company accounts for income taxes using the liability method in accordance with FASB ASC Topic 740 Income Taxes (“Topic 740”), previously SFAS No. 109. The liability method measures the expected future tax effects of temporary differences at the enacted tax rates applicable for the period in which the deferred asset or liability is expected to be realized or settled. Temporary differences are differences between the tax basis of an asset or liability and its reported amount in the consolidated financial statements that will result in future increases or decreases in taxes owed on a cash basis compared to amounts already recognized as tax expense in the consolidated statement of operations. The Company’s effective tax rates from continuing operations were 38.4% and 32.8% for the years ended December 31, 2009 and 2008, respectively, compared to the federal statutory rate of 35.0%. As the Company reported a net loss for 2009, municipal bond investment income and income from certain international operations, which have lower effective tax rates, increased the Company’s effective tax rate in comparison to the federal statutory rate. PMI has historically provided for U.S. federal income tax on the undistributed earnings from its foreign subsidiaries, except to the extent such earnings are reinvested indefinitely. During the quarter ended June 30, 2009, the Company determined that earnings from foreign subsidiaries were no longer deemed “permanently reinvested” resulting in a tax expense. In addition, the Company refined certain estimates as a result of preparing its 2008 income tax return which resulted in additional tax benefits for 2009. The refinements primarily related to foreign tax credits, foreign basis adjustments and other tax adjustments and thereby further increased the Company’s effective tax rate for the year ended December 31, 2009. The effective tax rate of 32.8% for 2008 was lower than the federal statutory rate due to income derived from certain international operations, which have lower effective tax rates, combined with the Company’s municipal bond investment income.
The Company also evaluates the need for a valuation allowance against its deferred tax assets. Under Topic 740, if it is more likely than not that the Company will not be able to realize the benefit associated with its deferred tax assets, then a valuation allowance is established. In evaluating whether a deferred tax benefit would be realized, the Company assesses all available evidence both positive and negative and future sources of income such as tax planning strategies, reversing temporary differences and future income. As of December 31, 2009, a tax valuation allowance of $248.3 million was recorded against a $567.9 million deferred tax asset primarily related to FGIC losses in excess of the Company’s tax basis, foreign and California net operating losses and certain foreign tax credits. Additional valuation allowance benefits could be recognized in the future due to changes in management’s expectations regarding realization of tax benefits. (See Note 12, Income Taxes, for further discussion.)
As of January 1, 2007, the Company adopted FASB ASC Topic 740 Income Taxes Recognition (“Topic 740”), previously FASB Interpretation No. 48, Accounting for Uncertainty in Income Taxes—An Interpretation of FASB Statement No. 109 (“FIN 48”).
Benefit Plans—The Company provides pension benefits through noncontributory defined benefit plans to all eligible U.S. employees under The PMI Group, Inc. Retirement Plan (the “Retirement Plan”) and to certain employees of the Company under The PMI Group, Inc. Supplemental Employee Retirement Plan. In addition, the Company provides certain health care and life insurance benefits for retired employees under another post-employment benefit plan. The Company applies FASB ASC Topic 715 Compensation-Retirement Benefits,
142
Table of Contents
THE PMI GROUP, INC. AND SUBSIDIARIES
NOTES TO CONSOLIDATED FINANCIAL STATEMENTS—(Continued)
previously SFAS No. 158, for its treatment of U.S. employees’ pension benefits. This topic requires the Company to recognize the funded status (i.e., the difference between the fair value of plan assets and the projected benefit obligations) of its defined benefit postretirement plans, with a corresponding adjustment to accumulated other comprehensive income or loss.
On May 17, 2007, The PMI Group’s Board of Directors approved an amendment to the Retirement Plan. The amendment changed the Plan’s benefit formula from a “final pay” pension formula to a cash balance formula. Under the new cash balance formula, the Company contributes 8% of qualified employees’ compensation to cash balance accounts and credit interest at a rate equal to the 30-year Treasury bond rate. The cash balance formula took effect immediately for employees hired or rehired on or after September 1, 2007. For employees hired before and were continuously employed on September 1, 2007, the cash balance formula will take effect on January 1, 2011.
Foreign Currency Translation—The financial statements of the Company’s foreign subsidiaries have been translated into U.S. dollars in accordance with FASB ASC Topic 830 Foreign Currency Matters, previously SFAS No. 52. Assets and liabilities denominated in non-U.S. dollar functional currencies are translated using the period-end spot exchange rates. Revenues and expenses are translated at monthly-average exchange rates. The effects of translating financial results with a functional currency other than the reporting currency are reported as a component of accumulated other comprehensive income (loss) included in total shareholders’ equity. Foreign currency translation gains in accumulated other comprehensive income before tax were $50.1 million as of December 31, 2009 compared with $48.3 million as of December 31, 2008. Gains and losses from foreign currency re-measurement for PMI Europe and PMI Canada are reflected in income and represent the revaluation of assets and liabilities denominated in non-functional currencies into the functional currency, the Euro and Canadian dollar, respectively.
Comprehensive Income (Loss)—Comprehensive income (loss) includes net income (loss), the change in foreign currency translation gains or losses, pension adjustments, changes in unrealized gains and losses on investments, accretion of cash flow hedges and reclassification of realized gains and losses previously reported in comprehensive income (loss), net of related tax effects.
Business Segments—The Company’s reportable operating segments are U.S. Mortgage Insurance Operations, International Operations and Corporate and Other. U.S. Mortgage Insurance Operations includes the results of operations of PMI Mortgage Insurance Co., affiliated U.S. insurance and reinsurance companies and the equity in earnings from CMG MI. International Operations includes the results from continuing operations of PMI Europe and PMI Canada, and the results from discontinued operations of PMI Australia and PMI Asia. Effective December 31, 2009 the Company combined its former “Corporate and Other” and “Financial Guaranty” segments into a “Corporate and Other” segment for all periods presented. The Corporate and Other segment includes other income and related operating expenses of PMI Mortgage Services Co.’s change in fair value of certain debt instruments, interest expense, intercompany eliminations and corporate expenses of the Company; the results of PMI Mortgage Assurance Company, formerly Commercial Loan Insurance Co., WMAC Credit Insurance Corporation, equity in earnings (losses) from certain limited partnerships and its equity investment in FGIC Corporation and its former investment in RAM Re. The Company merged the assets and liabilities of PMI Guaranty into its U.S. Mortgage Insurance Operations during the fourth quarter of 2008.
Earnings (Loss) Per Share—Basic earnings (loss) per share (“EPS”) excludes dilution and is based on consolidated net income (loss) available to common shareholders giving effect to discontinued operations and the actual weighted-average common shares that are outstanding during the period. Diluted EPS is based on consolidated net income (loss) available to common shareholders giving effect to discontinued operations, adjusted for the effects of dilutive securities, and the weighted-average dilutive common shares outstanding
143
Table of Contents
THE PMI GROUP, INC. AND SUBSIDIARIES
NOTES TO CONSOLIDATED FINANCIAL STATEMENTS—(Continued)
during the period. The weighted-average dilutive common shares reflect the potential increase of common shares if contracts to issue common shares, including stock options issued by the Company that have a dilutive impact, were exercised, or if outstanding securities were converted into common shares. As a result of the Company’s net losses for the years ended December 31, 2009, 2008 and 2007, 7.3 million, 9.0 million and 7.4 million share equivalents issued under the Company’s share-based compensation plans in the respective periods were excluded from the calculation of diluted earnings per share as their inclusion would have been anti-dilutive.
The following table presents for the periods indicated a reconciliation of the weighted average common shares used to calculate basic EPS to the weighted-average common shares used to calculate diluted EPS from continuing and discontinued operations:
| 2009 | 2008 | 2007 | ||||||||||
| (Dollars and shares in thousands) | ||||||||||||
| Net loss: |
||||||||||||
| Loss from continuing operations |
(653,991 | ) | (887,188 | ) | (1,008,682 | ) | ||||||
| (Loss) income from discontinued operations |
(5,335 | ) | (41,320 | ) | 93,356 | |||||||
| Net loss adjusted for diluted EPS calculation |
$ | (659,326 | ) | $ | (928,508 | ) | $ | (915,326 | ) | |||
| Weighted-average shares for basic EPS |
82,317 | 81,423 | 84,645 | |||||||||
| Weighted-average stock options and other dilutive components |
— | — | — | |||||||||
| Weighted-average shares for diluted EPS |
82,317 | 81,423 | 84,645 | |||||||||
| Dividends declared and accrued to common shareholders |
$ | — | $ | 0.03 | $ | 0.21 | ||||||
Share-Based Compensation—The Company applies FASB ASC Topic 718 Compensation-Stock Compensation (“Topic 718”), previously SFAS No. 123R, in accounting for share-based payments. This topic requires share based payments such as stock options, restricted stock units and employee stock purchase plan shares to be accounted for using a fair value-based method and recognized as compensation expense in the consolidated results of operations. Share-based compensation expense was $4.1 million (pre-tax), $10.1 million (pre-tax) and $18.2 million (pre-tax), respectively, for the years ended December 31, 2009, 2008 and 2007.
Fair Value of Financial Instruments—Effective January 1, 2008, the Company adopted FASB ASC Topic 820 Fair Value Measurements and Disclosures (“Topic 820”), previously SFAS No. 157. This topic describes three levels of inputs that may be used to measure fair value, of which “Level 3” inputs include fair value determinations using pricing models, discounted cash flow methodologies, or similar techniques, as well as instruments for which the determination of fair value requires significant management judgment or estimation. Due to the lack of available market values for the Company’s credit default swap contracts, the Company’s methodology for determining the fair value of its credit default swap contracts is based on “Level 3” inputs. (See Note 3. New Accounting Standards and Note 10. Fair Value Disclosures, for further discussion.) Effective January 1, 2008, the Company adopted Topic 820 and the fair value option outlined in FASB ASC Topic 825 Financial Instruments (“Topic 825”), previously SFAS No. 159. Topic 820 provides a framework for measuring fair value under GAAP. The fair value option allows an entity the irrevocable option to elect fair value for the initial and subsequent measurement of certain financial assets and liabilities on a contract-by-contract basis. The Company elected to adopt the fair value option for certain corporate debt on the adoption date. The fair value option requires that the difference between the carrying value before election of the fair value option and the fair value of these instruments be recorded as an adjustment to beginning retained earnings in the period of adoption. The Company recognized a net of tax gain of $31.8 million in retained earnings as of January 1, 2008 related to the initial adoption of the fair value option for certain debt instruments held by the Company. For the year ended December 31, 2009, the Company’s net loss included a $16.5 million gain related to the subsequent measurement of fair value for these debt instruments compared to a $123.6 million gain for the year ended December 31, 2008.
144
Table of Contents
THE PMI GROUP, INC. AND SUBSIDIARIES
NOTES TO CONSOLIDATED FINANCIAL STATEMENTS—(Continued)
The Company elected the fair value option for its 10 year and 30 year senior debt instruments as their market values are the most readily available. The fair value option was elected with respect to the senior debt as changes in value are expected to generally offset changes in the value of credit default swap contracts that are also accounted for at fair value.
Reclassifications—Certain items in the prior years’ consolidated financial statements have been reclassified to conform to the current years’ consolidated financial statement presentation. The Company reclassified the results of operations of PMI Australia, PMI Asia and PMI Guaranty as discontinued operations for all periods presented.
NOTE 3. NEW ACCOUNTING STANDARDS
Effective July 1, 2009, FASB ASC (“Codification”) Topic 105 Generally Accepted Accounting Principles (“Topic 105”) establishes the FASB ASC as the single source of authoritative U.S. generally accepted accounting principles (“GAAP”) used by nongovernmental entities in the preparation of financial statements, except for rules and interpretive releases of the SEC under authority of federal securities laws, which are sources of authoritative accounting guidance for SEC registrants. The Codification is meant to simplify user access to all authoritative accounting guidance by reorganizing GAAP pronouncements into roughly 90 accounting topics within a consistent structure; its purpose is not to create new accounting and reporting guidance. The Codification supersedes all existing non-SEC accounting and reporting standards and is effective for the Company beginning July 1, 2009. Following Topic 105, the FASB will not issue new standards in the form of Statements, FASB Staff Positions, or Emerging Issues Task Force Abstracts; instead, it will issue Accounting Standards Updates. The FASB will not consider Accounting Standards Updates as authoritative in their own right; these updates will serve only to update the Codification, provide background information about the guidance, and provide the bases for conclusions on the change(s) in the Codification. As the Codification was not intended to change or alter existing GAAP, the adoption of the Codification did not have any impact on the Company’s consolidated financial statements.
In June 2009, the FASB updated guidance in FASB ASC Topic 810 Consolidation (“Topic 810”), previously SFAS No. 167, to provide additional consolidation guidance to enterprises involved with variable interest entities. Topic 810 requires an enterprise to perform an analysis to determine whether the enterprise’s variable interest gives it a controlling financial interest in a variable interest entity. Topic 810 also requires an ongoing reassessment of and eliminates the quantitative approach previously required for determining whether an enterprise is the primary beneficiary. Topic 810 is effective as of the beginning of each reporting entity’s first annual reporting period that begins after November 15, 2009. Topic 810 is not expected to impact the Company’s consolidated financial statements.
In June 2009, the FASB updated FASB ASC Topic 860 Transfers and Servicing—Derecognition (“Topic 860”), previously SFAS No. 166, to eliminate the concept of a qualifying special-purpose entity and modify the derecognition provision in Topic 860. Topic 860 requires additional disclosures to enhance information reported to users of financial statements by providing greater transparency about transfers of financial assets, including securitization transactions, and an entity’s continuing involvement in and exposure to the risks related to transferred financial assets. Topic 860 is effective as of the beginning of each reporting entity’s first annual reporting period that begins after November 15, 2009. Topic 860 is not currently expected to significantly impact the Company’s consolidated financial statements.
145
Table of Contents
THE PMI GROUP, INC. AND SUBSIDIARIES
NOTES TO CONSOLIDATED FINANCIAL STATEMENTS—(Continued)
Recently Adopted Standards
In February 2010, FASB issued Accounting Standards Update No. 2010-09, Subsequent Events (Topic 855): Amendments to Certain Recognition and Disclosure Requirements (“ASU No. 2010-09”) that removed the requirement to disclose a date through which subsequent events have been evaluated in issued financial statements. ASU No. 2010-09 is effective as of February 24, 2010 and has not significantly impacted the Company’s consolidated financial statements.
In April 2009, the FASB updated guidance in Topic 820 related to determining fair value when the volume and level of activity for the asset or liability have significantly decreased and identifying transactions that are not orderly. Topic 820 is effective for interim and annual reporting periods ending after June 15, 2009. Topic 820 has not significantly impacted the Company’s consolidated financial statements.
In April 2009, the FASB updated guidance in Topic 320. Topic 320 provides instruction for assessing whether an impairment of a debt security is other than temporary, as well as how such impairments are presented and disclosed in the financial statements. Topic 320 requires an entity to recognize the credit component of an other-than-temporary impairment of a debt security in earnings and the noncredit component in other comprehensive income when the entity does not intend to sell the security and it is more likely than not that the entity will not be required to sell the security prior to recovery. Topic 320 is effective for interim and annual reporting periods ending after June 15, 2009. The impact of adoption was an opening balance adjustment to reclassify from retained earnings into accumulated other comprehensive income (loss) an amount of $2.5 million. (See Note 4—Investments for expanded disclosures related to Topic 320)
In April 2009, the FASB updated guidance in Topic 825 to require disclosures about fair value of financial instruments for interim reporting periods of publicly traded companies as well as in annual financial statements. Topic 825 requires those disclosures in summarized financial information at interim reporting periods. Topic 825 is effective for interim and annual reporting periods ending after June 15, 2009. Topic 825 has not significantly impacted the Company’s consolidated financial statements.
In December 2008, the FASB amended FASB ASC Topic 715 Compensation-Retirement Benefits, to provide guidance on an employer’s disclosures about plan assets of a defined benefit pension or other postretirement plan. It requires companies to provide users of financial statements with an understanding of how investment decisions are made, the major categories of plan assets, inputs and valuation techniques used to measure fair value of plan assets, the effect of fair value measurements when using unobservable inputs and significant concentrations of risk within plan assets. Topic 715 was implemented as of December 31, 2009 and has not significantly impacted the Company’s consolidated financial statements.
146
Table of Contents
THE PMI GROUP, INC. AND SUBSIDIARIES
NOTES TO CONSOLIDATED FINANCIAL STATEMENTS—(Continued)
NOTE 4. INVESTMENTS
Fair Values and Gross Unrealized Gains and Losses on Investments—The cost or amortized cost, estimated fair value and gross unrealized gains and losses on investments as of December 31, 2009 and December 31, 2008 are shown in the tables below:
| Cost or Amortized Cost |
Gross Unrealized | Fair Value | |||||||||||
| Gains | (Losses) | ||||||||||||
| (Dollars in thousands) | |||||||||||||
| As of December 31, 2009 |
|||||||||||||
| Fixed income securities: |
|||||||||||||
| Municipal bonds |
$ | 2,044,600 | $ | 36,744 | $ | (15,949 | ) | $ | 2,065,395 | ||||
| Foreign governments |
47,023 | 145 | (1,135 | ) | 46,033 | ||||||||
| Corporate bonds |
87,832 | 1,933 | (2,305 | ) | 87,460 | ||||||||
| FDIC corporate bonds |
137,900 | 1,836 | (328 | ) | 139,408 | ||||||||
| U.S. governments and agencies |
10,616 | 524 | — | 11,140 | |||||||||
| Mortgage-backed securities |
5,486 | 266 | — | 5,752 | |||||||||
| Total fixed income securities |
2,333,457 | 41,448 | (19,717 | ) | 2,355,188 | ||||||||
| Equity securities: |
|||||||||||||
| Common stocks |
29,684 | — | (594 | ) | 29,090 | ||||||||
| Preferred stocks |
163,324 | 26,021 | (3,322 | ) | 186,023 | ||||||||
| Total equity securities |
193,008 | 26,021 | (3,916 | ) | 215,113 | ||||||||
| Short-term investments |
2,232 | — | — | 2,232 | |||||||||
| Total investments |
$ | 2,528,697 | $ | 67,469 | $ | (23,633 | ) | $ | 2,572,533 | ||||
| Cost or Amortized Cost |
Gross Unrealized | Fair Value | |||||||||||
| Gains | (Losses) | ||||||||||||
| (Dollars in thousands) | |||||||||||||
| As of December 31, 2008 |
|||||||||||||
| Fixed income securities: |
|||||||||||||
| Municipal bonds |
$ | 1,888,682 | $ | 24,174 | $ | (98,587 | ) | $ | 1,814,269 | ||||
| Foreign governments |
49,965 | 2,176 | (1,780 | ) | 50,361 | ||||||||
| Corporate bonds |
127,873 | 1,251 | (7,348 | ) | 121,776 | ||||||||
| U.S. governments and agencies |
3,620 | 799 | — | 4,419 | |||||||||
| Mortgage-backed securities |
6,476 | 165 | — | 6,641 | |||||||||
| Total fixed income securities |
2,076,616 | 28,565 | (107,715 | ) | 1,997,466 | ||||||||
| Equity securities: |
|||||||||||||
| Common stocks |
9,291 | — | (3,698 | ) | 5,593 | ||||||||
| Preferred stocks |
229,262 | 7,195 | (20,201 | ) | 216,256 | ||||||||
| Total equity securities |
238,553 | 7,195 | (23,899 | ) | 221,849 | ||||||||
| Short-term investments |
2,280 | — | — | 2,280 | |||||||||
| Total investments |
$ | 2,317,449 | $ | 35,760 | $ | (131,614 | ) | $ | 2,221,595 | ||||
At December 31, 2009, the Company had gross unrealized losses of $23.6 million on investment securities, including fixed maturity and equity securities that had a fair value of $2.6 billion. The unrealized losses on foreign governments and corporate bonds as of December 31, 2009 were primarily due to foreign currency
147
Table of Contents
THE PMI GROUP, INC. AND SUBSIDIARIES
NOTES TO CONSOLIDATED FINANCIAL STATEMENTS—(Continued)
translation on securities denominated in a currency other than the functional currency as well as continuing credit issues in that sector. The unrealized losses in the preferred stock portfolio as of December 31, 2009 decreased from December 31, 2008 as a result of an overall improvement in the preferred sector as well as a change in the composition of the Company’s holdings as a result of preferred stock exchanges and dispositions throughout 2009. The change in unrealized losses on the fixed income portfolio from December 31, 2008 to December 31, 2009 was primarily due to contracting municipal bonds credit spreads. At December 31, 2009, the total preferred portfolio had a fair value of $186.0 million, with $35.5 million invested in public utility companies and the remaining $150.5 million invested in the financial services sector. As of December 31, 2009, the total fair value of the mortgage backed securities portfolio was $5.8 million, with $2.6 million invested in residential mortgage backed securities and the remaining $3.2 million invested in commercial mortgage backed securities.
In addition, included in the gross unrealized losses are debt securities that the Company determined had non-credit related other-than-temporary impairments in accordance with Topic 320.
Evaluating Investments for Other-than-Temporary-Impairment
The Company reviews all of its fixed income and equity security investments on a periodic basis for impairment. The Company specifically assesses all investments with declines in fair value and, in general, monitors all security investments as to ongoing risk.
The Company reviews on a quarterly basis, or as needed in the event of specific credit events, unrealized losses on all investments with declines in fair value. These investments are then tracked to establish whether they meet the Company’s established other than temporary impairment criteria. This process involves monitoring market events and other items that could impact issuers. The Company considers relevant facts and circumstances in evaluating whether the impairment of a security is other-than-temporary.
Relevant facts and circumstances considered include but are not limited to:
| • | a decline in the market value of a security below cost or amortized cost for a continuous period of at least six months; |
| • | the severity and nature of the decline in market value below cost regardless of the duration of the decline; |
| • | recent credit downgrades of the applicable security or the issuer by the rating agencies; |
| • | the financial condition of the applicable issuer; |
| • | whether scheduled interest payments are past due; and |
| • | whether it is more likely than not the Company will hold the security for a sufficient period of time to allow for anticipated recoveries in fair value. |
Once a security is determined to have met certain of the criteria for consideration as being other-than-temporarily impaired, further information is gathered and evaluated pertaining to the particular security. If the security is an unsecured obligation, the additional research is a security specific approach with particular emphasis on the likelihood that the issuer will meet the contractual terms of the obligation.
The Company assesses equity securities using the criteria outlined above and also considers whether, in addition to these factors, it has the ability and intent to hold the equity securities for a period of time sufficient for recovery to cost or amortized cost. Where the Company lacks that ability or intent, the equity security’s decline in fair value is deemed to be other than temporary, and the Company records the full difference between fair value and cost or amortized cost in earnings.
148
Table of Contents
THE PMI GROUP, INC. AND SUBSIDIARIES
NOTES TO CONSOLIDATED FINANCIAL STATEMENTS—(Continued)
Once the determination is made that a debt security is other-than-temporarily impaired, an estimate is developed of the portion of such impairment that is credit-related. The estimate of the credit-related portion of impairment is based upon a comparison of ratings at the time of purchase and the current ratings of the security, to establish whether there have been any specific credit events during the time the Company has owned the security, as well as the outlook through the expected maturity horizon for the security. The Company obtains ratings from two nationally recognized rating agencies for each security being assessed. The Company also incorporates information on the specific securities from its management and, as appropriate, from its external investment advisors on their views on the probability of it receiving the interest and principal cash-flows for the remaining life of the securities.
This information is used to determine the Company’s best estimate of what the credit related portion of the impairment is, based on a probability-weighted estimate of future cash flows. The probability weighted cash flows for the individual securities are modeled using internal models, which calculate the discounted cash flows at the implicit rate at purchase through maturity. If the cash flow projections indicate that the Company does not expect to recover its amortized cost basis, the Company recognizes the estimated credit loss in earnings. For debt securities that are intended to be sold, or that management believes are more likely than not to be required to be sold prior to recovery, the full impairment is recognized immediately in earnings. For debt securities that management has no intention to sell and believes it is more likely than not that they will not be required to be sold prior to recovery, only the credit component of the impairment is recognized in earnings, with the remaining impairment loss recognized in AOCI.
During the second quarter of 2009, the Company reviewed all previously recorded other-than-temporary impairments of securities to develop an estimate of the portion of such impairments that were not due to credit. This resulted in an opening balance adjustment to reclassify from retained earnings into AOCI an amount of $2.5 million, which related to non-credit related impairment charges taken prior to adoption of Topic 320 on debt securities held principally at PMI Europe.
In the Consolidated Statements of Operations, the Company had other-than-temporary impairments of $8.3 million for the year ended December 31, 2009 on securities considered to be impaired. The credit component of the impairments for the year ended December 31, 2009 was $7.0 million.
The total impairment for any debt security that is deemed to have an other-than-temporary impairment is recorded in the statement of operations as a net realized loss from investments. The portion of such impairment that is determined to be non-credit-related is deducted from net realized losses in the statement of operations and reflected in other comprehensive income (loss) and accumulated other comprehensive income (loss), the latter of which is a component of stockholders’ equity in the balance sheets.
149
Table of Contents
THE PMI GROUP, INC. AND SUBSIDIARIES
NOTES TO CONSOLIDATED FINANCIAL STATEMENTS—(Continued)
Other-than-temporary Impairment—During the year ended December 31, 2009, the Company recorded other-than-temporary impairment losses as follows:
| Year Ended December 31, 2009 | |||
| (Dollars in thousands) | |||
| Total other-than-temporary impairment losses on debt securities which the Company does not intend to sell or it is more-likely-than-not that it will not be required to sell |
$ | 754 | |
| Less: portion of OTTI losses recognized in AOCI (before taxes) |
433 | ||
| Net impairment losses recognized in net (loss) income for securities that the Company does not intend to sell or it is more-likely-than-not that it will not be required to sell |
321 | ||
| OTTI losses recognized in net (loss) income for debt securities that the Company intends to sell or more-likely-than-not will be required to sell before recovery |
1,247 | ||
| Impairment losses related to equity securities |
6,694 | ||
| Net impairment losses recognized in statement of operations |
$ | 8,262 | |
Activity related to the credit component recognized in net (loss) income on debt securities held by the Company for which a portion of other-than-temporary impairment was recognized in AOCI for the year ended December 31, 2009 is as follows:
| Cumulative Other-Than-Temporary Impairment Credit Losses Recognized in Net (Loss) Income for Debt Securities | |||||||||||||||||||
| April 1, 2009 Cumulative OTTI credit losses recognized for securities still held |
Additions for OTTI securities where no credit losses were recognized prior to April 1, 2009 |
Additions for OTTI securities where credit losses were recognized prior to April 1, 2009 |
Reductions due to sales of credit impaired securities |
Adjustments to book value of credit impaired securities due to changes in cash flows |
December 31, 2009 Cumulative OTTI credit losses recognized for securities still held | ||||||||||||||
| (Dollars in thousands) | |||||||||||||||||||
| OTTI credit losses recognized for debt securities |
|||||||||||||||||||
| Municipal Bonds |
$ | 1,575 | $ | — | $ | 142 | $ | — | $ | — | $ | 1,717 | |||||||
| Corporate Bonds |
632 | — | 179 | (22 | ) | — | 789 | ||||||||||||
| Total OTTI credit losses recognized for debt securities |
$ | 2,207 | $ | — | $ | 321 | $ | (22 | ) | $ | — | $ | 2,506 | ||||||
Scheduled Maturities—The following table sets forth the amortized cost and fair value of fixed income securities by contractual maturity at December 31, 2009:
| Amortized Cost |
Fair Value | |||||
| (Dollars in thousands) | ||||||
| Due in one year or less |
$ | 5,446 | $ | 5,495 | ||
| Due after one year through five years |
243,296 | 244,121 | ||||
| Due after five years through ten years |
550,034 | 555,085 | ||||
| Due after ten years |
1,529,195 | 1,544,735 | ||||
| Mortgage-backed securities |
5,486 | 5,752 | ||||
| Total fixed income securities |
$ | 2,333,457 | $ | 2,355,188 | ||
150
Table of Contents
THE PMI GROUP, INC. AND SUBSIDIARIES
NOTES TO CONSOLIDATED FINANCIAL STATEMENTS—(Continued)
Actual maturities may differ from those scheduled as a result of calls or prepayments by the issuers prior to maturity.
Net Investment Income—Net investment income consists of the following:
| 2009 | 2008 | 2007 | ||||||||||
| (Dollars in thousands) | ||||||||||||
| Fixed income securities |
$ | 99,001 | $ | 103,770 | $ | 97,517 | ||||||
| Equity securities |
15,085 | 21,583 | 19,725 | |||||||||
| Short-term investments, cash and cash equivalents and other |
6,835 | 14,965 | 17,000 | |||||||||
| Investment income before expenses |
120,921 | 140,318 | 134,242 | |||||||||
| Investment expenses |
(1,755 | ) | (1,941 | ) | (1,690 | ) | ||||||
| Net investment income |
$ | 119,166 | $ | 138,377 | $ | 132,552 | ||||||
Net Realized Investment Gains (Losses)—Net realized investment gains (losses) consist of the following:
| 2009 | 2008 | 2007 | ||||||||||
| (Dollars in thousands) | ||||||||||||
| Fixed income securities: |
||||||||||||
| Gross gains |
$ | 48,587 | $ | 30,585 | $ | 2,273 | ||||||
| Gross losses |
(6,239 | ) | (8,439 | ) | (974 | ) | ||||||
| Net gains |
42,348 | 22,146 | 1,299 | |||||||||
| Equity securities: |
||||||||||||
| Gross gains |
13,691 | 24,092 | 14,632 | |||||||||
| Gross losses |
(20,050 | ) | (99,397 | ) | (14,612 | ) | ||||||
| Net (losses) gains |
(6,359 | ) | (75,305 | ) | 20 | |||||||
| Short-term investments: |
||||||||||||
| Gross gains |
— | 6,695 | — | |||||||||
| Gross losses |
(1,745 | ) | (1,878 | ) | (129 | ) | ||||||
| Net (losses) gains |
(1,745 | ) | 4,817 | (129 | ) | |||||||
| Investment in unconsolidated subsidiaries: |
||||||||||||
| Settlement gain on sale of unconsolidated subsidiary |
— | — | 12,670 | |||||||||
| Impairment of unconsolidated subsidiaries |
— | (90,868 | ) | (38,499 | ) | |||||||
| Sale of unconsolidated subsidiary |
3,227 | — | — | |||||||||
| Net gains (losses) |
3,227 | (90,868 | ) | (25,829 | ) | |||||||
| Net realized investment gains (losses) before income taxes |
37,471 | (139,210 | ) | (24,639 | ) | |||||||
| Income tax expense (benefit) |
13,115 | (48,724 | ) | (8,624 | ) | |||||||
| Total net realized investment gains (losses) after income taxes |
$ | 24,356 | $ | (90,486 | ) | $ | (16,015 | ) | ||||
Net realized investment gains (losses) for 2009 resulted primarily from sales of municipal bonds in addition to impairments and exchanges of preferred equity securities. Net realized investment gains for 2009 includes other-than-temporary impairments recorded during the first quarter of 2009; upon adoption of Topic 320 on April 1, 2009, the Company recognized a cumulative effect adjustment to retained earnings and accumulated other comprehensive income for the non-credit portion of previously recorded impairments of debt securities in the amount of $2.5 million; $1.1 million of these losses were recorded in the first quarter of 2009 and $1.4 million of the losses were recorded in previous years. The net investment losses in 2008 include a $96.5 million loss related
151
Table of Contents
THE PMI GROUP, INC. AND SUBSIDIARIES
NOTES TO CONSOLIDATED FINANCIAL STATEMENTS—(Continued)
to the Company’s other-than-temporary impairment of certain preferred securities in its U.S. investment portfolio. Also included in the net investment losses for 2008 is the Company’s impairment of its investment in its unconsolidated subsidiaries, which includes an $88.0 million loss related to the impairment of the Company’s investment in FGIC in the first quarter of 2008 and a $2.9 million loss related to the Company’s impairment of its investment in RAM Re. The net investment losses in 2007 were due primarily to an other-than-temporary impairment of the Company’s investment in RAM Re of $38.5 million, partially offset by a $12.7 million settlement gain related to the sale of an unconsolidated subsidiary. The Company sold its investment in RAM Re in the fourth quarter of 2009 for $3.2 million.
Aging of Unrealized Losses—The following table shows the gross unrealized losses and fair value of the Company’s investments, aggregated by investment category and the length of time the individual securities have been in a continuous unrealized loss position as of December 31, 2009 and December 31, 2008:
| December 31, 2009 | Less than 12 months | 12 months or more | Total | ||||||||||||||||||
| Fair Value | Unrealized Losses |
Fair Value | Unrealized Losses |
Fair Value | Unrealized Losses |
||||||||||||||||
| (Dollars in thousands) | |||||||||||||||||||||
| Fixed income securities: |
|||||||||||||||||||||
| U.S. municipal bonds |
$ | 559,817 | $ | (11,494 | ) | $ | 62,032 | $ | (4,455 | ) | $ | 621,849 | $ | (15,949 | ) | ||||||
| Foreign governments |
7,270 | (237 | ) | 7,151 | (898 | ) | 14,421 | (1,135 | ) | ||||||||||||
| Corporate bonds |
41,041 | (1,709 | ) | 7,031 | (924 | ) | 48,072 | (2,633 | ) | ||||||||||||
| Total fixed income securities |
608,128 | (13,440 | ) | 76,214 | (6,277 | ) | 684,342 | (19,717 | ) | ||||||||||||
| Equity securities: |
|||||||||||||||||||||
| Common stocks |
28,955 | (594 | ) | 28,955 | (594 | ) | |||||||||||||||
| Preferred stocks |
— | — | 54,706 | (3,322 | ) | 54,706 | (3,322 | ) | |||||||||||||
| Total equity securities |
28,955 | (594 | ) | 54,706 | (3,322 | ) | 83,661 | (3,916 | ) | ||||||||||||
| Total |
$ | 637,083 | $ | (14,034 | ) | $ | 130,920 | $ | (9,599 | ) | $ | 768,003 | $ | (23,633 | ) | ||||||
| December 31, 2008 | Less than 12 months | 12 months or more | Total | ||||||||||||||||||
| Fair Value | Unrealized Losses |
Fair Value | Unrealized Losses |
Fair Value | Unrealized Losses |
||||||||||||||||
| (Dollars in thousands) | |||||||||||||||||||||
| Fixed income securities: |
|||||||||||||||||||||
| U.S. municipal bonds |
$ | 801,039 | $ | (49,171 | ) | $ | 460,962 | $ | (49,416 | ) | $ | 1,262,001 | $ | (98,587 | ) | ||||||
| Foreign governments |
6,664 | (1,780 | ) | — | — | 6,664 | (1,780 | ) | |||||||||||||
| Corporate bonds |
25,903 | (1,977 | ) | 30,423 | (5,371 | ) | 56,326 | (7,348 | ) | ||||||||||||
| Total fixed income securities |
833,606 | (52,928 | ) | 491,385 | (54,787 | ) | 1,324,991 | (107,715 | ) | ||||||||||||
| Equity securities: |
|||||||||||||||||||||
| Common stocks |
5,576 | (3,698 | ) | — | — | 5,576 | (3,698 | ) | |||||||||||||
| Preferred stocks |
20,365 | (2,712 | ) | 99,294 | (17,489 | ) | 119,659 | (20,201 | ) | ||||||||||||
| Total equity securities |
25,941 | (6,410 | ) | 99,294 | (17,489 | ) | 125,235 | (23,899 | ) | ||||||||||||
| Total |
$ | 859,547 | $ | (59,338 | ) | $ | 590,679 | $ | (72,276 | ) | $ | 1,450,226 | $ | (131,614 | ) | ||||||
As of December 31, 2009, the Company’s investment portfolio included 129 securities in an unrealized loss position compared to 284 securities as of December 31, 2008.
152
Table of Contents
THE PMI GROUP, INC. AND SUBSIDIARIES
NOTES TO CONSOLIDATED FINANCIAL STATEMENTS—(Continued)
Investment Concentrations and Other Items—The Company maintains an investment portfolio principally of U.S. municipal bonds. The following states and the District of Columbia represent the largest concentrations in the U.S. municipal bond portfolio, expressed as a percentage of the fair value of all U.S. municipal bond holdings. Holdings in states and the District of Columbia that exceed 5% of the U.S. municipal bond portfolio at the respective dates are presented below:
| 2009 | 2008 | |||||
| California |
11.3 | % | 10.1 | % | ||
| New York |
13.3 | % | 12.8 | % | ||
| Florida |
13.9 | % | 7.5 | % | ||
| Illinois |
11.5 | % | 6.7 | % | ||
| Texas |
9.7 | % | 11.7 | % | ||
| District of Columbia |
3.0 | % | 5.1 | % |
At December 31, 2009, fixed income securities and short-term investments with an aggregate fair value of $15.6 million were on deposit with regulatory authorities as required by law.
NOTE 5. INVESTMENTS IN UNCONSOLIDATED SUBSIDIARIES
Investments in the Company’s unconsolidated subsidiaries include both equity investees and other unconsolidated subsidiaries. The carrying values of the Company’s investments in unconsolidated subsidiaries consisted of the following as of December 31, 2009 and December 31, 2008:
| December 31, 2009 |
Ownership Percentage |
December 31, 2008 |
Ownership Percentage |
|||||||||
| (Dollars in thousands) | ||||||||||||
| FGIC |
$ | — | 42.0 | % | $ | — | 42.0 | % | ||||
| CMG MI |
124,826 | 50.0 | % | 135,082 | 50.0 | % | ||||||
| RAM Re |
— | 0.0 | % | — | 23.7 | % | ||||||
| Other* |
14,949 | various | 15,295 | various | ||||||||
| Total |
$ | 139,775 | $ | 150,377 | ||||||||
| * | Other represents principally various limited partnership investments. |
Equity in (losses) earnings from unconsolidated subsidiaries is shown for the periods presented:
| 2009 | Ownership Percentage |
2008 | Ownership Percentage |
2007 | Ownership Percentage |
||||||||||||||||
| (Dollars in thousands) | |||||||||||||||||||||
| FGIC |
$ | — | 42.0 | % | $ | — | 42.0 | % | $ | (763,290 | ) | 42.0 | % | ||||||||
| CMG MI |
(11,452 | ) | 50.0 | % | 6,456 | 50.0 | % | 17,119 | 50.0 | % | |||||||||||
| RAM Re |
— | 0.0 | % | (57,670 | ) | 23.7 | % | 4,457 | 23.7 | % | |||||||||||
| Other |
(567 | ) | various | (588 | ) | various | 214 | various | |||||||||||||
| Total |
$ | (12,019 | ) | $ | (51,802 | ) | $ | (741,500 | ) | ||||||||||||
Due to the impairment of its FGIC investment in the first quarter of 2008, the Company did not recognize any equity in earnings (losses) from FGIC in 2008 or 2009. Additionally, due to the impairment of RAM Re during 2008 and the sale of RAM Re during the fourth quarter of 2009, the Company did not recognize equity in earnings (losses) from RAM Re in 2009.
153
Table of Contents
THE PMI GROUP, INC. AND SUBSIDIARIES
NOTES TO CONSOLIDATED FINANCIAL STATEMENTS—(Continued)
CMG MI’s condensed balance sheets as of December 31, 2009 and 2008, and condensed statements of operations for the years ended December 31, 2009, 2008 and 2007 are as follows:
| December 31, 2009 |
December 31, 2008 | |||||
| (Dollars in thousands) | ||||||
| Condensed Balance Sheets |
||||||
| Assets: |
||||||
| Cash and investments, at fair value |
$ | 399,989 | $ | 337,216 | ||
| Deferred policy acquisition costs |
13,801 | 12,626 | ||||
| Other assets |
22,098 | 19,028 | ||||
| Total assets |
$ | 435,888 | $ | 368,870 | ||
| Liabilities: |
||||||
| Reserve for losses and loss adjustment expenses |
$ | 169,807 | $ | 77,076 | ||
| Unearned premiums |
17,408 | 22,410 | ||||
| Other liabilities |
5,728 | 5,927 | ||||
| Total liabilities |
192,943 | 105,413 | ||||
| Shareholders’ equity |
242,945 | 263,457 | ||||
| Total liabilities and shareholders’ equity |
$ | 435,888 | $ | 368,870 | ||
| Year ended December 31, | ||||||||||||
| 2009 | 2008 | 2007 | ||||||||||
| (Dollar in thousands) | ||||||||||||
| Condensed Statements of Operations |
||||||||||||
| Gross revenues |
$ | 124,588 | $ | 108,808 | $ | 92,878 | ||||||
| Total expenses |
166,301 | 93,670 | 44,223 | |||||||||
| (Loss) income before income taxes |
(41,713 | ) | 15,138 | 48,655 | ||||||||
| Income tax (benefit) expense |
(18,808 | ) | 2,225 | 14,417 | ||||||||
| Net (loss) income |
(22,905 | ) | 12,913 | 34,238 | ||||||||
| PMI’s ownership interest in common equity |
50.0 | % | 50.0 | % | 50.0 | % | ||||||
| Total equity in (losses) earnings from CMG MI |
$ | (11,452 | ) | $ | 6,456 | $ | 17,119 | |||||
NOTE 6. DEFERRED POLICY ACQUISITION COSTS
The following table summarizes deferred policy acquisition cost activity as of and for the periods set forth below:
| 2009 | 2008 | 2007 | ||||||||||
| (Dollars in thousands) | ||||||||||||
| Beginning balance |
$ | 34,791 | $ | 18,305 | $ | 47,611 | ||||||
| Policy acquisition costs incurred and deferred |
24,279 | 34,771 | 58,377 | |||||||||
| Amortization of deferred policy acquisition costs |
(17,781 | ) | (18,285 | ) | (87,683 | ) | ||||||
| Balance at December 31, |
$ | 41,289 | $ | 34,791 | $ | 18,305 | ||||||
154
Table of Contents
THE PMI GROUP, INC. AND SUBSIDIARIES
NOTES TO CONSOLIDATED FINANCIAL STATEMENTS—(Continued)
Deferred policy acquisition costs are affected by qualifying costs that are deferred in the period and amortization of previously deferred costs in such periods. Deferred policy acquisition costs are reviewed periodically to determine whether they exceed recoverable amounts, after considering investment income. In the second quarter of 2008, PMI Guaranty impaired its remaining deferred policy acquisition cost asset by $3.6 million, reducing its value to zero. The Company also impaired $1.2 million of deferred policy acquisition cost assets relating to PMI Europe during both 2009 and 2008. Due to higher persistency levels experienced in the Company’s U.S. Mortgage Insurance portfolio, in 2008 the Company increased the period over which it amortizes deferred policy acquisition costs in its U.S. Mortgage Insurance Operations.
Deferred policy acquisition costs are reviewed periodically to determine that they do not exceed recoverable amounts, after considering investment income. For the year ended December 31, 2007, as a result of a recoverability analysis of deferred costs relating to new mortgage insurance policies acquired in 2007, the Company impaired its deferred policy acquisition cost asset related to its U.S. Mortgage Insurance Operations by $33.6 million relating to the 2007 book year. The deferred policy acquisition cost asset at December 31, 2008 includes only costs associated with the 2008 book of business and book years prior to 2007.
NOTE 7. PROPERTY, EQUIPMENT AND SOFTWARE
The following table sets forth the cost basis of, and accumulated depreciation and amortization for, property, equipment and software for the years ended:
| 2009 | 2008 | |||||||
| (Dollars in thousands) | ||||||||
| Software |
$ | 171,158 | $ | 179,008 | ||||
| Building and leasehold improvements |
96,273 | 99,659 | ||||||
| Furniture and equipment |
18,511 | 48,105 | ||||||
| Land |
5,000 | 5,000 | ||||||
| Property and equipment, at cost |
290,942 | 331,772 | ||||||
| Less accumulated depreciation and amortization |
(189,049 | ) | (206,426 | ) | ||||
| Total property, equipment and software, net of accumulated depreciation and amortization |
$ | 101,893 | $ | 125,346 | ||||
Depreciation and amortization expense related to property, equipment including capital leases, and software totaled $25.2 million in 2009, $29.3 million in 2008 and $30.6 million in 2007. Capitalized costs associated with software developed for internal use were $2.7 million in 2009, $8.1 million in 2008 and $15.8 million in 2007.
155
Table of Contents
THE PMI GROUP, INC. AND SUBSIDIARIES
NOTES TO CONSOLIDATED FINANCIAL STATEMENTS—(Continued)
NOTE 8. RESERVE FOR LOSSES AND LOSS ADJUSTMENT EXPENSES (LAE)
The Company establishes reserves for losses and LAE to recognize the estimated liability for potential losses and LAE related to insured mortgages that are in default. The establishment of a loss reserve is subject to inherent uncertainty and requires significant judgment by management. The following table provides a reconciliation of the beginning and ending consolidated reserves for losses and LAE between January 1 and December 31 for each of the three years:
| 2009 | 2008 | 2007 | ||||||||||
| (Dollars in thousands) | ||||||||||||
| Balance at January 1, |
$ | 2,709,286 | $ | 1,177,309 | $ | 384,089 | ||||||
| Less: reinsurance recoverables |
(482,678 | ) | (36,917 | ) | (3,741 | ) | ||||||
| Net balance at January 1, |
2,226,608 | 1,140,392 | 380,348 | |||||||||
| Losses and LAE incurred, principally with respect to defaults occurring in: |
||||||||||||
| Current year |
1,556,232 | 1,706,383 | 914,333 | |||||||||
| Prior years (1) |
196,767 | 192,881 | 208,565 | |||||||||
| Total incurred |
1,752,999 | 1,899,264 | 1,122,898 | |||||||||
| Losses and LAE payments, principally with respect to defaults occurring in: |
||||||||||||
| Current year |
(308,890 | ) | (100,795 | ) | (43,643 | ) | ||||||
| Prior years |
(1,123,159 | ) | (727,576 | ) | (323,755 | ) | ||||||
| Total payments |
(1,432,049 | ) | (828,371 | ) | (367,398 | ) | ||||||
| Foreign currency translation effects |
(1,008 | ) | (4,927 | ) | 1,894 | |||||||
| Net change in PMI Guaranty’s loss reserves (2) |
— | 20,250 | 2,650 | |||||||||
| Net ending balance at December 31, |
2,546,550 | 2,226,608 | 1,140,392 | |||||||||
| Reinsurance recoverables |
703,550 | 482,678 | 36,917 | |||||||||
| Balance at December 31, |
$ | 3,250,100 | $ | 2,709,286 | $ | 1,177,309 | ||||||
| (1) | The $196.8 million, $192.9 million and $208.6 million increases in prior years’ reserves in 2009, 2008 and 2007, respectively, were due to re-estimations of ultimate loss rates from the prior period estimates. The $196.8 million increase in prior years’ reserves during 2009 reflected the significant weakening of the housing and mortgage markets and was driven primarily by adverse claim size and claim rate development in the modified pool insurance portfolio partially offset by reductions in claim size on the Company’s primary insurance portfolio. The $192.9 million and $208.6 million increases in prior years’ reserves during 2008 and 2007 reflected significant weakening of the housing and mortgage markets and were driven by lower cure rates, higher claim rates and higher claim sizes on the Company’s primary insurance portfolio. These re-estimations of ultimate loss rates are the result of management’s periodic review of estimated claim amounts in light of actual claim amounts, loss development data and ultimate claim rates. |
| (2) | Includes losses and LAE incurred of $29.9 million and payments of $9.6 million for the year ended December 31, 2008 from PMI Guaranty which is reported as discontinued operations in the consolidated statement of operations for all periods presented. |
The increase in total consolidated loss reserves at December 31, 2009 compared to December 31, 2008 was primarily due to increases in the reserve balances for U.S. Mortgage Insurance Operations primarily as a result of an increase in the default inventory and adverse loss development on claim rates and claim sizes from the Company’s modified pool contracts. Upon receipt of default notices, future claim payments are estimated
156
Table of Contents
THE PMI GROUP, INC. AND SUBSIDIARIES
NOTES TO CONSOLIDATED FINANCIAL STATEMENTS—(Continued)
relating to those loans in default and a reserve is recorded. Generally, it takes approximately 12 to 36 months from the receipt of a default notice to result in a claim payment. Accordingly, most losses paid relate to default notices received in prior years.
NOTE 9. DEBT AND REVOLVING CREDIT FACILITY
| December 31, 2009 | December 31, 2008 | |||||||||||
| Principal Amount |
Fair Value | Carrying Value |
Carrying Value | |||||||||
| (Dollars in thousands) | ||||||||||||
| 6.000% Senior Notes, due September 15, 2016 (1) |
$ | 250,000 | $ | 149,063 | $ | 149,063 | $ | 153,027 | ||||
| 6.625% Senior Notes, due September 15, 2036 (1) |
150,000 | 64,585 | 64,585 | 77,144 | ||||||||
| Revolving Credit Facility, due October 24, 2011 |
124,750 | 124,750 | 124,750 | 200,000 | ||||||||
| 8.309% Junior Subordinated Debentures, due February 1, 2027 |
51,593 | 10,061 | 51,593 | 51,593 | ||||||||
| Total debt |
$ | 576,343 | $ | 348,459 | $ | 389,991 | $ | 481,764 | ||||
| (1) | The fair value and carrying value of the Company’s 6.000% Senior Notes and 6.625% Senior Notes at December 31, 2009 include accrued interest. |
6.000% and 6.625% Senior Notes—In September 2006, the Company issued $250 million in principal amount of 6.000% Senior Notes, due September 15, 2016 and $150 million in principal amount of 6.625% Senior Notes, due September 15, 2036. The 6.000% Senior Notes and the 6.625% Senior Notes bear interest at a rate of 6.000% and 6.625% per annum, payable semi-annually in arrears on March 15 and September 15 of each year, beginning on March 15, 2007. The PMI Group may redeem the 6.000% and 6.625% Senior Notes in whole or in part at any time at the “make-whole redemption price”. The “make-whole redemption price” will be equal to the greater of (a) 100% of the principal amount of the 6.000% and 6.625% Senior Notes to be redeemed and (b) the sum of the present values of the remaining scheduled payments thereon discounted to the date of redemption, on a semi-annual basis (assuming a 360-day year consisting of twelve 30-day months), at a rate equal to the applicable treasury rate plus 25 basis points for the 6.000% Senior Notes and 35 basis points for the 6.625% Senior Notes, plus in the case of either (a) or (b), any interest accrued but not paid to but excluding the date of redemption. In connection with the issuance of these Senior Notes, the Company entered into two interest rate lock agreements which were designated as cash flow hedges. The fair value of the cash flow hedges was settled for $9.0 million and is amortized into interest expense over the terms of the new senior debt that was issued. As of December 31, 2009, the unamortized balance in the other comprehensive income related to these fair value hedges was approximately $7.0 million (pre-tax).
Effective January 1, 2008, the Company elected to adopt the fair value option presented by ASC Topic 825 for the Company’s 6.000% Senior Notes and 6.625% Senior Notes. ASC Topic 825 requires that the difference between the carrying value before election of the fair value option and the fair value of these instruments be recorded as an adjustment to beginning retained earnings in the period of adoption. (See Note 10. Fair Value Disclosures, for further discussion.)
8.309% Junior Subordinated Debentures—The Junior Subordinated Debentures bear interest at the rate of 8.309% per annum paid semiannually and mature on February 1, 2027. The Junior Subordinated Debentures are subordinated to all senior indebtedness of The PMI Group.
157
Table of Contents
THE PMI GROUP, INC. AND SUBSIDIARIES
NOTES TO CONSOLIDATED FINANCIAL STATEMENTS—(Continued)
In considering the initial adoption of the ASC Topic 825, the Company determined that the change in fair value of the 8.309% Junior Subordinated Debentures would not have a significant impact on the Company’s consolidated financial results. Therefore, the Company did not elect to adopt the fair value option for the 8.309% Junior Subordinated Debentures.
Revolving Credit Facility—The Company amended its revolving credit facility (the “credit facility” or “facility”) effective May 29, 2009 following the satisfaction of certain conditions precedent agreed upon between the Company and the lenders under the facility on May 8, 2009. In connection with the Amended Agreement, MIC and The PMI Group entered into a Note Purchase Agreement pursuant to which The PMI Group purchased the contingent note (the “QBE Note”) described below. Upon the completion of the sale of the QBE Note to The PMI Group from MIC, The PMI Group granted a security interest in the QBE Note in favor of the Administrative Agent, for the benefit of the lenders under the Amended Agreement. Among other things, the amended credit facility reduced the facility size to a maximum of $125 million and eliminated certain financial covenants and events of default previously contained in the facility (including the elimination of the maximum debt to total capitalization percentage covenant, the maximum risk to capital ratio covenant, and the financial strength ratings event of default). The amended credit facility requires a minimum Adjusted Consolidated Net Worth (as defined in the facility) of at least $700 million through December 31, 2009, and at least $500 million from January 1, 2010 through the facility’s October 24, 2011 maturity date. As of December 31, 2009, The Company’s Adjusted Consolidated Net Worth, as defined in the credit facility, was $1.0 billion, as compared to a net worth requirement of $700 million. The Company’s Adjusted Consolidated Net Worth will be adversely affected by its continued losses and other factors negatively affecting its financial position. Absent significant additional capital, The Company’s Adjusted Consolidated Net Worth will decline in 2010. Although the Company currently expects to remain in compliance, due to continuing losses and other factors negatively affecting its financial position, there is a risk that in 2010 it will not be able to maintain the minimum Adjusted Consolidated Net Worth as required by the credit facility. If the Company were to anticipate being, or were to become, unable to maintain the required minimum Adjusted Consolidated Net Worth, it intends to pursue one or more of the following actions—(1) negotiate with the lenders under its credit facility to amend or waive compliance with the covenant, (2) seek to sell certain assets, including the QBE note prior to maturity, for an amount sufficient to repay the credit facility and (3) other corporate initiatives, inclusive of expense reductions, within its control to maintain compliance with the covenant. The amended facility also contains restrictions on, among other things, asset dispositions, dividends and investments. While the Company is generally permitted under the amended facility to make additional investments in the Company’s reinsurance subsidiaries, the Company’s ability to make additional investments in MIC and MIC’s subsidiaries is subject to dollar limitations.
Prior to the effectiveness of the amended facility, on May 29, 2009, the Shared Collateral Pledge Agreement, dated as of April 24, 2008, between the Company and U.S. Bank National Association as collateral agent (the “Collateral Agent”), pursuant to which the Company granted a security interest in the stock of MIC in favor of the Collateral Agent for the equal and ratable benefit of the lenders under the credit facility and the noteholders under certain of the Company’s senior notes, was terminated and the security interest in the stock of MIC was released.
Thereafter, MIC and the Company entered into a Note Purchase Agreement, dated as of May 29, 2009 (the “Note Purchase Agreement”), pursuant to which the Parent Company purchased the contingent note (the “QBE Note”) that MIC received in connection with the sale of PMI Australia to QBE Holdings (AAP) Pty Limited. Pursuant to the Note Purchase Agreement, the Company made an initial payment to MIC of $75 million and agreed to make an additional contingent payment of up to $25 million; the amount of the contingent payment will be determined based on the value of the QBE Note at redemption or on the net proceeds received by the Company upon a sale of the QBE Note prior to redemption. (See Item 7, Liquidity and Capital Constraints, for further discussion on the QBE Note.)
158
Table of Contents
THE PMI GROUP, INC. AND SUBSIDIARIES
NOTES TO CONSOLIDATED FINANCIAL STATEMENTS—(Continued)
Following the sale of the QBE Note to the Company by MIC, the Company pledged the QBE Note in favor of the Administrative Agent, for the benefit of the lenders under the credit facility. In connection with the effectiveness of the amended credit facility, on May 29, 2009, the Company prepaid its credit facility in an amount sufficient to reduce its outstanding borrowings thereunder to $125 million.
NOTE 10. FAIR VALUE DISCLOSURES
Effective January 1, 2008, the Company adopted Topic 820 and the fair value option outlined in Topic 825. In particular, the Company elected to adopt the fair value option outlined in Topic 825 for certain corporate debt liabilities on the adoption date. The fair value option outlined in Topic 825 requires that the difference between the carrying value before election of the fair value option and the fair value of these instruments at the time of election of the fair value option be recorded as an adjustment to the opening balance of retained earnings in the period of adoption.
The following tables present the difference between fair values as of December 31, 2009 and December 31, 2008 and the aggregate contractual principal amounts of the long-term debt for which the fair value option has been elected. Had the Company not adopted the fair value option, the Company’s diluted loss per share for the year ended December 31, 2009 would have been $(8.14) per share compared to $(12.39) per share for the year ended December 31, 2008.
| Fair Value (including accrued interest) as of December 31, 2009 |
Principal amount and accrued interest |
Difference | |||||||
| (Dollars in thousands) | |||||||||
| Long-term debt |
|||||||||
| 6.000% Senior Notes |
$ | 149,063 | $ | 254,375 | $ | 105,312 | |||
| 6.625% Senior Notes |
$ | 64,585 | $ | 152,898 | $ | 88,313 | |||
| Fair Value (including accrued interest) as of December 31, 2008 |
Principal amount and accrued interest |
Difference | |||||||
| (Dollars in thousands) | |||||||||
| Long-term debt |
|||||||||
| 6.000% Senior Notes |
$ | 153,027 | $ | 254,375 | $ | 101,348 | |||
| 6.625% Senior Notes |
$ | 77,144 | $ | 152,898 | $ | 75,754 | |||
Topic 820 defines fair value as the exchange price that would be received for an asset or paid to transfer a liability (referred to as an exit price) in the principal or most advantageous market for the asset or liability in an orderly transaction between market participants on the measurement date. Topic 820 also establishes a fair value hierarchy which requires an entity to maximize the use of observable inputs and minimize the use of unobservable inputs when measuring fair value. The standard describes three levels of inputs that may be used to measure fair value.
Level 1 Observable inputs with quoted prices in active markets for identical assets or liabilities. Level 1 assets and liabilities include debt and equity securities and derivative contracts that are traded in an active exchange market, as well as certain U.S. Treasury securities that are highly liquid and are actively traded in over-the-counter markets.
Level 2 Observable inputs other than Level 1 prices, such as quoted prices for similar assets or liabilities; quoted prices in markets that are not active; or other inputs that are observable or can be corroborated by
159
Table of Contents
THE PMI GROUP, INC. AND SUBSIDIARIES
NOTES TO CONSOLIDATED FINANCIAL STATEMENTS—(Continued)
observable market data for substantially the full term of the assets or liabilities. Level 2 assets and liabilities include debt securities with quoted prices that are traded less frequently than exchange-traded instruments and derivative contracts whose value is determined using a pricing model with inputs that are observable in the market or can be derived principally from or corroborated by observable market data.
Level 3 Unobservable inputs that are supported by little or no market activity and that are significant to the fair value of the assets or liabilities. Level 3 assets and liabilities include financial instruments whose value is determined using pricing models, discounted cash flow methodologies, or similar techniques, as well as instruments for which the determination of fair value requires significant management judgment or estimation.
When determining the fair value of its debt, the Company has considered the guidance presented in Topic 820 related to determining fair value when the volume and level of activity for the asset or liability have significantly decreased and identifying transactions that are not orderly.
Assets and liabilities measured at fair value on a recurring basis, including financial instruments for which the Company has elected the fair value option, are summarized below:
| December 31, 2009 | Assets/Liabilities at Fair Value | |||||||||||
| Fair Value Measurements Using | ||||||||||||
| Level 1 | Level 2 | Level 3 | ||||||||||
| (Dollars in thousands) | ||||||||||||
| Assets |
||||||||||||
| Fixed income securities |
$ | — | $ | 2,352,041 | $ | 3,147 | $ | 2,355,188 | ||||
| Equity securities |
28,955 | 182,188 | 3,970 | 215,113 | ||||||||
| Short-term investments |
2,232 | — | — | 2,232 | ||||||||
| Cash and cash equivalents |
686,891 | — | — | 686,891 | ||||||||
| Accrued investment income |
35,028 | — | — | 35,028 | ||||||||
| Total assets |
$ | 753,106 | $ | 2,534,229 | $ | 7,117 | $ | 3,294,452 | ||||
| Liabilities |
||||||||||||
| Credit default swaps |
$ | — | $ | — | $ | 17,331 | $ | 17,331 | ||||
| 6.000% Senior Notes |
— | 149,063 | — | 149,063 | ||||||||
| 6.625% Senior Notes |
— | 64,585 | — | 64,585 | ||||||||
| Total liabilities |
$ | — | $ | 213,648 | $ | 17,331 | $ | 230,979 | ||||
| December 31, 2008 | Assets/Liabilities at Fair Value | |||||||||||
| Fair Value Measurements Using | ||||||||||||
| Level 1 | Level 2 | Level 3 | ||||||||||
| (Dollars in thousands) | ||||||||||||
| Assets |
||||||||||||
| Fixed income securities |
$ | — | $ | 1,994,025 | $ | 3,441 | $ | 1,997,466 | ||||
| Equity securities |
5,576 | 211,809 | 4,464 | 221,849 | ||||||||
| Short-term investments |
2,280 | — | — | 2,280 | ||||||||
| Cash and cash equivalents |
1,483,313 | — | — | 1,483,313 | ||||||||
| Accrued investment income |
36,323 | — | — | 36,323 | ||||||||
| Total assets |
$ | 1,527,492 | $ | 2,205,834 | $ | 7,905 | $ | 3,741,231 | ||||
| Liabilities |
||||||||||||
| Credit default swaps |
$ | — | $ | — | $ | 54,542 | $ | 54,542 | ||||
| 6.000% Senior Notes |
— | 153,027 | — | 153,027 | ||||||||
| 6.625% Senior Notes |
— | 77,144 | — | 77,144 | ||||||||
| Total liabilities |
$ | — | $ | 230,171 | $ | 54,542 | $ | 284,713 | ||||
160
Table of Contents
THE PMI GROUP, INC. AND SUBSIDIARIES
NOTES TO CONSOLIDATED FINANCIAL STATEMENTS—(Continued)
PMI Europe’s risk in force related to its credit default swap (“CDS”) contracts was $4.0 billion as of December 31, 2009. Certain PMI Europe CDS contracts contain collateral support provisions which, upon certain circumstances, such as deterioration of underlying mortgage loan performance, require PMI Europe to post collateral for the benefit of the counterparty. The amount of the required posted collateral varies and can include mark-to-market valuations, contractual formulae and/or negotiated amounts. The aggregate fair value of all derivative instruments with collateral support provisions that are in a liability position as of December 31, 2009 is $15.8 million, for which the Company has posted collateral of $14.7 million in the normal course of business. The Company estimates that the amount of additional collateral it may be required to post could range from $4.4 million to $11.4 million in the next twelve months. The actual level of collateral posted at the end of 2010 will be dependent upon deal performance, claim payments, and the extent to which PMI Europe is successful in commuting certain contracts. To the extent PMI Europe is successful in commuting certain contracts the amount of collateral postings could be significantly reduced. The fair value of derivative liabilities was $17.3 million and $54.5 million as of December 31, 2009 and December 31, 2008, respectively, and is included in other liabilities on the balance sheet.
Fair Value of Credit Default Swap Contracts
PMI Europe’s CDS contracts are valued using internal proprietary models because these instruments are unique, complex, and private and are often customized transactions, for which observable market quotes are not regularly available. Due to the lack of observable inputs required to value CDS contracts, they are considered to be Level 3 under the Topic 820 fair value hierarchy. Valuation models and the related assumptions are continuously re-evaluated by management and refined, as appropriate.
Key inputs used in the Company’s valuation of CDS contracts include the transaction notional amount, expected term, premium rates on risk layers, changes in market spreads and cost of capital, estimated loss rates and loss timing, and risk free interest rates. As none of the instruments that the Company is holding are traded, the Company develops internal exit price estimates. Its internal exit price estimates are based on a number of factors, including its own expectations of loss payments and timing, as well as indications of current CDS spreads obtained through market surveys with investment banks, counterparty banks, and other relevant market sources in Europe. The Company validates market surveys obtained from these third-party sources by comparing them against each other for consistency. The assumed market CDS spread is a significant assumption that, if changed, could result in materially different fair values. Accordingly, market perceptions of credit deterioration are likely to result in the increase in the expected exit value (the amount required to be paid to exit the transaction).
The values of the Company’s CDS contracts are affected by estimated changes in credit spreads of the underlying obligations and/or the cost of the Company’s capital. As credit spreads change, the values of these CDS contracts will change and the resulting gains and losses will be recorded in the Company’s operating results. In addition, with the adoption of Topic 820, the Company has incorporated its non-performance risk into the market value of its derivative assets and liabilities. The fair value of these CDS liabilities was $17.3 million as of December 31, 2009. Excluding the Company’s non-performance risk, the fair value of these CDS liabilities would have been $19.3 million as of December 31, 2009.
In estimating the fair values of CDS contracts, PMI Europe incorporates expected life of contract dates in its internal valuation models. The Company estimates the life of contracts to coincide with expected call dates based on a number of factors, including past experience of counterparties, the underlying economics of the transactions, counterparties’ expressed intent and potential costs associated with extending transactions. The current state of capital markets, the financial conditions and perspectives of various counterparties and the general weakening of economic conditions in Europe may lead to decisions by customers to extend the credit protection offered by PMI Europe’s CDS contracts, which could be counteracted by PMI Europe’s counterparties’ assessments of its
161
Table of Contents
THE PMI GROUP, INC. AND SUBSIDIARIES
NOTES TO CONSOLIDATED FINANCIAL STATEMENTS—(Continued)
creditworthiness. If a CDS contract is extended beyond its expected call date, PMI Europe will be required to adjust its internal valuation model assumptions. To the extent that credit spreads are higher than at the time of inception of the transaction, extending the expected life from the call date to the maturity date could result in PMI Europe recognizing further significant mark-to-market losses. If counterparties elect to extend PMI Europe’s CDS contracts and spreads remain at their current levels, mark-to-market losses could be material and there will be a greater likelihood of incurring higher than currently expected realized losses in the form of paid claims on the contracts. To date, all of PMI Europe’s CDS contracts have either been called at the Company’s expected call date or have deviated from the Company’s expected call date in lengths of time that are not significant.
The fair value of investment grade contracts is determined by calculating the difference between the present value of expected future premiums from the contract and the estimated cost of hedging the transaction to the expected life of contract date. The estimated cost of hedging the transaction is established by reference to market spreads on residential mortgage backed securities in the countries in which the underlying reference portfolio is located. Spreads are obtained from banking groups and analysts. The expected life of contract date is determined by using the earlier of the next contractual call date or an estimated regulatory call date based upon discussions with the counterparty.
Similar third party information is not available for non-investment grade contracts, and, accordingly, for those contracts, fair value is estimated using the present value of expected future contractual payments and incorporating a market-based estimated cost of capital that would be required by a third party with similar credit standing as PMI to assume an identical contract. Expected future contractual payments are determined through the analysis of recent performance of the relevant transaction and similar transactions. Cash flows are discounted using a risk-free rate. The market-based cost of capital is based on an estimate of PMI’s cost of capital as of the period in which the value is being determined.
162
Table of Contents
THE PMI GROUP, INC. AND SUBSIDIARIES
NOTES TO CONSOLIDATED FINANCIAL STATEMENTS—(Continued)
The table below presents a reconciliation for all assets and liabilities measured at fair value on a recurring basis using significant unobservable inputs (Level 3) for the year ended December 31, 2009. Level 3 instruments presented in the table, including credit default swaps, and certain fixed income and equity securities, were carried at fair value prior to the adoption of Topic 820.
| Total Fair Value Measurements Year Ended December 31, 2009 |
||||||||||||
| (Dollars in thousands) | ||||||||||||
| Level 3 Instruments Only | Fixed Income Securities |
Equity Securities |
Credit Default Swaps (Liabilities) |
|||||||||
| Balance, January 1, 2009 |
3,441 | 4,464 | (54,542 | ) | ||||||||
| Total gains or (losses) |
||||||||||||
| Included in earnings (1) |
(293 | ) | (494 | ) | 31,581 | |||||||
| Included in other comprehensive income (2) |
— | — | (391 | ) | ||||||||
| Purchase, issuance and settlements (3) |
— | — | 6,021 | |||||||||
| Balance, December 31, 2009 |
$ | 3,148 | $ | 3,970 | $ | (17,331 | ) | |||||
| Year Ended December 31, 2008 | ||||||||||||
| (Dollars in thousands) | ||||||||||||
| Balance, January 1, 2008 |
$ | 3,704 | $ | 5,706 | $ | (26,921 | ) | |||||
| Total gains or (losses) |
||||||||||||
| Included in earnings (1) |
(263 | ) | (1,242 | ) | (11,275 | ) | ||||||
| Included in other comprehensive income (2) |
— | — | 889 | |||||||||
| Purchase, issuance and settlements (3) |
— | — | (17,235 | ) | ||||||||
| Balance, December 31, 2008 |
$ | 3,441 | $ | 4,464 | $ | (54,542 | ) | |||||
| (1) | The combined losses on equity and fixed income securities of $0.8 million and $1.5 million for the years ended December 31, 2009 and 2008, respectively, are included in net investment income in the Company’s consolidated statement of operations. The gain on credit default swaps of $31.6 million and the loss of $11.3 million for the years ended December 31, 2009 and 2008, respectively, is included in other income in the Company’s consolidated statement of operations. |
| (2) | The loss on credit default swaps of $0.4 million and the gain on credit default swaps of $0.9 million for the years ended December 31, 2009 and 2008, respectively is a result of the translation from the Euro to the U.S. dollar and is included in other comprehensive income. |
| (3) | The purchase, issuance and settlements of $6.0 million and $17.2 million for the years ended December 31, 2009 and 2008, respectively represent net cash paid (received) on credit default swaps. |
163
Table of Contents
THE PMI GROUP, INC. AND SUBSIDIARIES
NOTES TO CONSOLIDATED FINANCIAL STATEMENTS—(Continued)
NOTE 11. REINSURANCE
The following table shows the effects of reinsurance on premiums written, premiums earned and losses and LAE of the Company’s operations for the years ended:
| 2009 | 2008 | 2007 | ||||||||||
| (Dollars in thousands) | ||||||||||||
| Premiums written |
||||||||||||
| Direct, net of refunds |
$ | 840,475 | $ | 942,580 | $ | 984,903 | ||||||
| Assumed |
(8,411 | ) | 15,313 | 10,040 | ||||||||
| Ceded |
(154,006 | ) | (188,998 | ) | (181,021 | ) | ||||||
| Net premiums written |
$ | 678,058 | $ | 768,895 | $ | 813,922 | ||||||
| Premiums earned |
||||||||||||
| Direct, net of refunds |
$ | 870,478 | $ | 964,512 | $ | 986,591 | ||||||
| Assumed |
2,696 | 12,851 | 7,657 | |||||||||
| Ceded |
(156,333 | ) | (191,204 | ) | (178,808 | ) | ||||||
| Net premiums earned |
$ | 716,841 | $ | 786,159 | $ | 815,440 | ||||||
| Losses and loss adjustment expenses |
||||||||||||
| Direct |
$ | 2,105,556 | $ | 2,363,233 | $ | 1,157,378 | ||||||
| Assumed |
(1,838 | ) | 441 | (9 | ) | |||||||
| Ceded |
(346,963 | ) | (464,410 | ) | (34,471 | ) | ||||||
| Net losses and LAE |
$ | 1,756,755 | $ | 1,899,264 | $ | 1,122,898 | ||||||
The majority of the Company’s existing reinsurance contracts are captive reinsurance agreements in the U.S. Mortgage Insurance Operations. Under captive reinsurance agreements, a portion of the risk insured by PMI is reinsured with the mortgage originator or investor through a reinsurer that is affiliated with the mortgage originator or investor. Ceded premiums for U.S. captive reinsurance accounted for 99.9% of total ceded premiums written in 2009 compared to 98.9% and 99.2% in 2008 and 2007, respectively. The Company recorded $703.6 million in reinsurance recoverables primarily from captive arrangements related to PMI’s gross loss reserves as of December 31, 2009, compared to $482.7 million as of December 31, 2008. As of December 31, 2009 and December 31, 2008, the total assets in captive trust accounts held for the benefit of PMI totaled approximately $940.7 million and $860.1 million, respectively. As of December 31, 2009, overall assumed premium for the year ended December 31, 2009 was negative due to the restructuring of two contracts in the Company’s European operations and a contract in the Company’s U.S. Mortgage Insurance Operations that resulted in premium reversals of approximately $7.3 million and $1.0 million, respectively.
NOTE 12. INCOME TAXES
The components of income tax benefit from continuing operations for the years ended December 31, 2009, 2008 and 2007 are as follows:
| 2009 | 2008 | 2007 | ||||||||||
| (Dollars in thousands) | ||||||||||||
| Current |
$ | (107,435 | ) | $ | (22,614 | ) | $ | (27,920 | ) | |||
| Deferred |
(299,444 | ) | (411,352 | ) | (218,602 | ) | ||||||
| Total income tax benefit from continuing operations |
$ | (406,879 | ) | $ | (433,966 | ) | $ | (246,522 | ) | |||
164
Table of Contents
THE PMI GROUP, INC. AND SUBSIDIARIES
NOTES TO CONSOLIDATED FINANCIAL STATEMENTS—(Continued)
§832(e) of the Internal Revenue Code permits mortgage guaranty insurers to deduct, within certain limitations, additions to statutory contingency reserves. This provision allows mortgage guaranty insurers to increase statutory unassigned surplus through the purchase of non-interest bearing “tax and loss bonds” from the federal government. The tax and loss bonds purchased are limited to the tax benefit of the deduction for additions to the contingency reserves. The Company did not purchase any tax and loss bonds in 2009, 2008 and 2007. The Company redeemed tax and loss bonds of $274.8 million in 2009, $396.3 million in 2008 and $62.7 million in 2007. The purchase and redemption of tax and loss bonds are included as a deferred component of income tax expense.
A reconciliation of the statutory federal income tax rate to the effective tax rate reported on (loss) income from operations before income taxes is shown in the following table:
| 2009 | 2008 | 2007 | |||||||
| Statutory federal income tax rate |
35.0 | % | 35.0 | % | 35.0 | % | |||
| Tax-exempt interest |
2.8 | 2.2 | 2.1 | ||||||
| Equity in earnings (losses) from unconsolidated subsidiaries |
0.0 | 0.0 | (3.9 | ) | |||||
| Valuation allowance |
0.0 | (0.5 | ) | (13.4 | ) | ||||
| State taxes, net |
0.7 | 0.2 | 0.3 | ||||||
| Foreign taxes, net |
0.8 | (2.0 | ) | (0.4 | ) | ||||
| Other |
(0.9 | ) | (2.1 | ) | (0.1 | ) | |||
| Effective income tax rate |
38.4 | % | 32.8 | % | 19.6 | % | |||
165
Table of Contents
THE PMI GROUP, INC. AND SUBSIDIARIES
NOTES TO CONSOLIDATED FINANCIAL STATEMENTS—(Continued)
The components of the deferred income tax assets and liabilities for the year ended are as follows:
| December 31, 2009 |
December 31, 2008 |
|||||||
| (Dollars in thousands) | ||||||||
| Deferred tax assets: |
||||||||
| AMT and other credits |
$ | 192,819 | $ | 64,901 | ||||
| Discount on loss reserves |
35,558 | 28,350 | ||||||
| Unearned premium reserves |
4,128 | 5,762 | ||||||
| Unrealized net losses on investments |
— | 67,263 | ||||||
| Basis difference on investments in unconsolidated subsidiaries |
215,944 | 245,339 | ||||||
| Pension costs and deferred compensation |
17,964 | 20,604 | ||||||
| Contingency reserve deduction, net of tax and loss bonds |
40,478 | 182 | ||||||
| Foreign net operating loss |
12,569 | 3,882 | ||||||
| Basis difference in foreign subsidiaries |
25,375 | 16,834 | ||||||
| Other assets |
23,076 | 11,613 | ||||||
| Total deferred tax assets |
567,911 | 464,730 | ||||||
| Deferred tax liabilities: |
||||||||
| Deferred policy acquisition costs |
14,451 | 11,311 | ||||||
| Unrealized net gains on investments |
11,118 | — | ||||||
| Unrealized net gains on debt |
77,097 | 72,857 | ||||||
| Software development costs |
8,499 | 18,906 | ||||||
| Equity in earnings from unconsolidated subsidiaries |
27,406 | 32,453 | ||||||
| Other liabilities |
5,478 | 6,378 | ||||||
| Total deferred tax liabilities |
144,049 | 141,905 | ||||||
| Net deferred tax asset |
423,862 | 322,825 | ||||||
| Valuation allowance |
(248,277 | ) | (174,641 | ) | ||||
| Net deferred tax asset |
$ | 175,585 | $ | 148,184 | ||||
The Company evaluates the need for a valuation allowance quarterly taking into consideration the ability to carryback and carryforward tax credits and losses, available tax planning strategies and future income, including the reversal of temporary differences. In addition, the Company has benefits from the use of tax and loss bonds which have allowed the Company to deduct statutory contingency reserves on its federal tax return. Once redeemed, the tax and loss bonds result in taxable income which have offset the Company’s operating losses. As of December 31, 2009, the Company evaluated whether it was “more likely than not” that the deferred tax assets would be utilized in the future and determined that a valuation allowance of $248.3 million was required. Any future changes in management’s assessment on the need for a valuation allowance will be recognized as a change in estimate in future periods.
The Company adopted the provisions of Topic 740 on January 1, 2007. As a result of the implementation, the Company recognized an approximately $15.6 million increase in deferred tax liabilities, which was accounted for as a reduction to the January 1, 2007 balance of consolidated retained earnings. This liability was accrued upon adoption of Topic 740 and after consideration of certain 2004 California legislation relating to the taxation of insurance companies that could impact the Company’s future tax payments. In accordance with Topic 740, the Company has recorded a contingent liability of $3.0 million as of December 31, 2009, which, if recognized, would affect the Company’s future effective tax rate. Of this total, approximately $2.8 million had been accrued as of December 31, 2008.
166
Table of Contents
THE PMI GROUP, INC. AND SUBSIDIARIES
NOTES TO CONSOLIDATED FINANCIAL STATEMENTS—(Continued)
When incurred, the Company recognizes interest and penalties related to unrecognized tax benefits in tax expense. The Company incurred net interest and penalties of $0.4 million in 2009. A contingent liability of $0.2 million was reversed during the third quarter of 2009 based on the closing of the statute of limitations and the conclusion of certain audits. The Company remains subject to examination in the following major tax jurisdictions:
| Jurisdiction |
Years Affected | |
| California |
From 2004 to present | |
| Ireland |
From 2006 to present | |
| Canada |
From 2007 to present |
As of December 31, 2009, there were no positions for which management believes it is reasonably possible that the total amounts of tax contingencies will significantly increase or decrease within 12 months of the reporting date.
As of December 31, 2009, the Company is subject to federal examination in the U.S. from 2006 through the present. In 2007, the IRS closed its audit for taxable years 2001 through 2003 and the statute of limitations lapsed for 2005 in 2009.
PMI has historically provided for U.S. federal income tax on the undistributed earnings from its foreign subsidiaries, except to the extent such earnings are reinvested indefinitely. During the quarter ended June 30, 2009, the Company determined that earnings from foreign subsidiaries, principally PMI Europe, were no longer deemed “permanently reinvested”. As such, related income tax amounts have subsequently been recorded as components in the consolidated statement of operations and accumulated other comprehensive income (loss).
The Company has foreign net operating loss carryforwards of approximately $79.1 million primarily related to our PMI Europe and Canada operations that will expire in 2012-2027.
The Company has tax credit carryforwards of approximately $192.8 million, primarily related to the payment of alternative minimum tax of $113.3 million and foreign taxes of $78.9 million. The foreign tax credits will expire if not utilized in 2018 and the alternative minimum tax credits do not expire.
NOTE 13. COMMITMENTS AND CONTINGENCIES
Leases—The Company leases certain office space and office equipment. Minimum rental payments under non-cancelable operating leases in the aggregate for the five years subsequent to 2009 and thereafter are as follows:
| Operating Leases | |||
| (Dollars in thousands) | |||
| Year ending December 31, |
|||
| 2010 |
$ | 1,761 | |
| 2011 |
1,337 | ||
| 2012 |
1,084 | ||
| 2013 |
209 | ||
| 2014 |
193 | ||
| Thereafter |
— | ||
| Total minimum lease payments |
$ | 4,584 | |
167
Table of Contents
THE PMI GROUP, INC. AND SUBSIDIARIES
NOTES TO CONSOLIDATED FINANCIAL STATEMENTS—(Continued)
Rent expense for all leases was $0.4 million for 2009, $3.8 million for 2008 and $3.5 million for 2007.
Income Taxes—As of December 31, 2009, no tax issues from the most recently closed or pending IRS audit would, in the opinion of management, give rise to a material assessment or have a material effect on the consolidated financial condition, results of operations or cash flows of the Company.
Guarantees—The PMI Group has guaranteed certain payments to the holders of the privately issued debt securities (“Capital Securities”) issued by PMI Capital I, an unconsolidated subsidiary of the Company. Payments with respect to any accrued and unpaid distributions payable, the redemption amount of any Capital Securities that are called and amounts due upon an involuntary or voluntary termination, winding up or liquidation of the Issuer Trust are subject to the guarantee. In addition, the guarantee is irrevocable, is an unsecured obligation of the Company and is subordinate and junior in right of payment to all senior debt of the Company.
Funding Obligations—The Company has invested in certain limited partnerships with ownership interests greater than 3% but less than 50%. As of December 31, 2009, the Company had committed to fund, if called upon to do so, $2.7 million of additional equity in certain limited partnership investments. The Company is under no obligation to fund FGIC, an unconsolidated equity investee.
Legal Proceedings—Various legal actions and regulatory reviews are currently pending that involve the Company and specific aspects of its conduct of business. Although there can be no assurance as to the ultimate disposition of these matters, in the opinion of management, based upon the information available as of the date of these financial statements, the expected ultimate liability in one or more of these actions is not expected to have a material effect on the consolidated financial condition, results of operations or cash flows of the Company.
NOTE 14. RESTRICTED INVESTMENTS, CASH AND CASH EQUIVALENTS
Effective June 2008, PMI Guaranty, FGIC and Assured Guaranty Re Ltd (“AG Re”) executed an agreement pursuant to which all of the direct FGIC business reinsured by PMI Guaranty was recaptured by FGIC and ceded by FGIC to AG Re. Pursuant to the Agreement, with respect to two of the exposures ceded to AG Re, PMI Guaranty agreed to reimburse AG Re for any losses it pays, subject to an aggregate limit of $22.9 million. PMI Guaranty has secured its obligation by depositing $22.9 million into a trust account for the benefit of AG Re and, to the extent AG Re’s obligations are less than $22.9 million, the remaining funds will be returned to the Company. As of December 31, 2009, the $20.8 million remaining deposit is included in cash and cash equivalents with a corresponding liability in losses and LAE reserves on the Company’s consolidated balance sheet.
Certain of PMI Europe’s CDS and reinsurance transactions contain collateral support provisions which, upon certain circumstances, require PMI Europe to post collateral for the benefit of the counterparty. As of December 31, 2009, PMI Europe posted collateral of $14.7 million on credit default swap transactions accounted for as derivatives and $19.1 million related to insurance and certain U.S. sub-prime related reinsurance transactions. The collateral of $33.8 million is included in investments and cash and cash equivalents on the Company’s consolidated balance sheet at December 31, 2009.
NOTE 15. DIVIDENDS AND SHAREHOLDERS’ EQUITY
Common Stock—In February 2007, the Board of Directors authorized the repurchase of additional common shares in an amount not to exceed $150 million. Pursuant to this program, in June 2007, the Company repurchased 468,500 common shares for $22.7 million, or $48.48 per common share. In July 2007, the Board of
168
Table of Contents
THE PMI GROUP, INC. AND SUBSIDIARIES
NOTES TO CONSOLIDATED FINANCIAL STATEMENTS—(Continued)
Directors increased the $150 million repurchase authorization to $300 million. From July 1, 2007 through September 30, 2007, the Company repurchased 5,454,381 common shares for $178.0 million, or $32.64 per common share. While approximately $100.0 million remains on the $300 million repurchase authorization, the Company did not repurchase additional common shares in 2008 and 2009.
In March 2007, the Company repurchased 325,000 common shares for $14.2 million under a $400 million common share repurchase program authorized by the Board of Directors in July 2006. In May 2007, upon completion of a $345 million accelerated share repurchase program entered into in 2006, The PMI Group received the final delivery of 436,152 common shares bringing the total received under the accelerated share repurchase program to 7,624,700 shares. The average price paid per common share upon completion of this program was $45.25 per common share.
Dividends—The payment of dividends to holders of The PMI Group common stock is subject to the discretion of the Company’s Board of Directors, which will consider, among other factors, the Company’s consolidated operating results, the Company’s overall financial condition and capital requirements, as well as general business conditions. In addition, The PMI Group’s credit agreement with Bank of America, N.A. and certain lenders places certain limitations on The PMI Group’s ability to pay dividends on its common stock including a cap of $0.01 per share per year, subject to an aggregate per year limit of $5 million and a prohibition from declaring any dividend at any time MIC is prohibited from writing new mortgage insurance by any state in the U.S. The PMI Group, as a holding company, is dependent upon dividends and any other permitted payments from its subsidiaries to enable it to pay dividends and to service outstanding debt. The PMI Group has not declared a dividend on its common stock since 2008. The Company does not expect that the Board of Directors of The PMI Group will declare a quarterly dividend in the foreseeable future. The Company last paid regular dividends on the common stock of $0.0025 per share in each of the quarters in the period from July 1, 2008 through December 31, 2008; and $0.0125 per share in each of the quarters in the period from January 1, 2008 through June 30, 2008.
MIC did not pay dividends to The PMI Group in 2008 and 2009, and the Company does not expect that MIC will pay dividends to The PMI Group in 2010. MIC’s ability to pay dividends to The PMI Group is affected by state insurance laws, credit agreements, rating agencies, and the discretion of insurance regulatory authorities, and its agreement with Fannie Mae relating to PMAC, as discussed in Note 1, Basis of Presentation. The laws of Arizona, MIC’s state of domicile for insurance regulatory purposes, provide that MIC may pay dividends out of any available surplus account, without prior approval of the Director of the Arizona Department of Insurance (“Arizona Director”), during any 12-month period in an amount not to exceed the lesser of 10% of policyholders’ surplus as of the preceding year end or the prior calendar year’s net investment income. A dividend that exceeds the foregoing threshold is deemed an “extraordinary dividend” and requires the prior approval of the Arizona Director. In 2006 and 2007, the Arizona Director approved two extraordinary dividend requests totaling $450 million. MIC paid $265 million of the $450 million of approved extraordinary dividends to The PMI Group in 2006 and 2007. Any payment of the remaining $185 million of approved dividends by MIC to The PMI Group requires prior written notice to the Director of the Arizona Department of Insurance, who could withdraw approval of such dividends.
Other states may also limit or restrict PMI’s ability to pay shareholder dividends. For example, California and New York prohibit mortgage insurers from declaring dividends except from the surplus of undivided profits over the aggregate of their paid-in capital, paid-in surplus and contingency reserves.
Preferred Stock—The PMI Group’s certificate of incorporation authorizes the Board of Directors to issue up to 5,000,000 shares of preferred stock of The PMI Group in classes or series and to set the designations, preferences, qualifications, limitations or restrictions of any class or series with respect to the rate and nature of
169
Table of Contents
THE PMI GROUP, INC. AND SUBSIDIARIES
NOTES TO CONSOLIDATED FINANCIAL STATEMENTS—(Continued)
dividends, the price and terms and conditions on which shares may be redeemed, the amount payable in the event of voluntary or involuntary liquidation, the terms and conditions for conversion or exchange into any other class or series of the shares, voting rights, and other terms. The Company may issue, without the approval of the holders of common shares, preferred stock that has voting, dividend or liquidation rights superior to the common stock, which may adversely affect the rights of holders of common stock. At December 31, 2009, there were no outstanding shares of The PMI Group preferred stock.
Pursuant to the support agreement described in Note 21, Capital Support Agreements, the Company has agreed that, in the event that Allstate, the Company’s former parent, makes a payment contemplated by the Allstate Support Agreements or the runoff support agreement, Allstate will have the right to receive preferred stock of The PMI Group or PMI with a liquidation preference equal to the amount of such payment. Such preferred stock will rank senior in right of payment to the issuer’s common stock and, so long as such preferred stock is outstanding, the issuer thereof will be prohibited from paying any dividends or making any other distributions on its common stock.
NOTE 16. BENEFIT PLANS
Defined Benefits Plan—Effective January 1, 2003, certain U.S. employees of the Company are eligible to participate in The PMI Group, Inc. Retirement Plan (the “Plan”), a noncontributory defined benefit plan. In addition, certain employees whose annual earnings exceed $220,000 under Internal Revenue Code (“IRC”) Section 401(a)(17) and limits established under IRC Section 415, participate in The PMI Group, Inc. Supplemental Employee Retirement Plan (“The SERP Plan”), a noncontributory defined benefit plan. Benefits under both pension plans are based upon the employees’ length of service and average annual compensation.
On May 17, 2007, The PMI Group’s Board of Directors approved an amendment to the Retirement Plan. The amendment changed the Plan’s benefit formula from a “final pay” pension formula to a cash balance formula. The amendment took effect immediately for employees hired or rehired on or after September 1, 2007. For employees hired before and continuously employed on September 1, 2007, the amendment will take effect on January 1, 2011. Under the new cash balance plan formula, the Company will contribute 8% of qualified employees’ compensation to cash balance accounts and credit interest at a rate equal to the 30-year Treasury Bond rate.
In the third quarter of 2008, the Company initiated a Voluntary Early Retirement Program (VERP). The Program was made available to employees (other than CEO) who were at least 52 years of age and had seven or more years of service. PMI did not incur any expenses in 2009 as a result of this Program. PMI incurred expenses of $33.1 million in 2008 as a result of this Program, primarily in the fourth quarter of 2008. In 2008, the Company contributed $41.0 million to the Plan, which exceeded the maximum deductible limit of $17.0 million. In the third quarter of 2009, the Company received approval from the IRS to have the nondeductible portion of approximately $24.0 million refunded to the Company to avoid excise tax penalties. This amount was returned to the Company in the third quarter of 2009. This refund was consistent with the terms of the Plan which call for the return of excess contributions which exceed the tax deductible limits. The Company contributed an additional $9.1 million to the Plan in the third quarter of 2009, which brought the Plan to 100% of the target funding level as of December 31, 2008. The Company generally makes contributions that are sufficient to fully fund its actuarially determined costs.
170
Table of Contents
THE PMI GROUP, INC. AND SUBSIDIARIES
NOTES TO CONSOLIDATED FINANCIAL STATEMENTS—(Continued)
The reconciliation of the beginning and ending balances of the projected benefit obligation and fair value of plan assets for the years ended and the accumulated benefit obligation at year end is as follows:
| Pension Benefits (including SERP) | Other Post-Employment Benefits | |||||||||||||||||||||||
| 2009 | 2008 | 2007 | 2009 | 2008 | 2007 | |||||||||||||||||||
| (Dollars in thousands, except percentages) | ||||||||||||||||||||||||
| Funded Status |
||||||||||||||||||||||||
| Projected Benefit Obligation |
||||||||||||||||||||||||
| Benefit obligation at January 1 |
$ | 69,359 | $ | 85,964 | $ | 85,921 | $ | 15,379 | $ | 11,046 | $ | 10,248 | ||||||||||||
| Service cost |
5,429 | 7,611 | 8,278 | 406 | 451 | 507 | ||||||||||||||||||
| Interest cost |
4,163 | 5,454 | 5,226 | 1,010 | 738 | 648 | ||||||||||||||||||
| Actuarial (gain) loss |
(3,658 | ) | 1,718 | 1,696 | 1,674 | 1,572 | 27 | |||||||||||||||||
| Benefits paid |
(4,437 | ) | (1,148 | ) | (3,302 | ) | (921 | ) | (412 | ) | (384 | ) | ||||||||||||
| Effect of plan amendments |
— | — | (11,855 | ) | — | — | — | |||||||||||||||||
| Effect of curtailments |
— | (1,312 | ) | — | — | 507 | — | |||||||||||||||||
| Effect of settlements |
(6,400 | ) | (45,836 | ) | — | — | — | — | ||||||||||||||||
| Special termination benefits |
— | 16,908 | — | — | 1,477 | — | ||||||||||||||||||
| Benefit obligation at December 31 |
$ | 64,456 | $ | 69,359 | $ | 85,964 | $ | 17,548 | $ | 15,379 | $ | 11,046 | ||||||||||||
| Fair Value of Plan Assets |
||||||||||||||||||||||||
| Fair value of plan assets at January 1 |
$ | 33,088 | $ | 91,098 | $ | 77,596 | $ | — | $ | — | $ | — | ||||||||||||
| Actual return on plan assets |
6,401 | (28,942 | ) | 6,576 | — | — | — | |||||||||||||||||
| Company contribution (1) |
15,688 | 17,916 | 10,228 | 921 | 412 | 384 | ||||||||||||||||||
| Benefits paid |
(4,437 | ) | (1,148 | ) | (3,302 | ) | (921 | ) | (412 | ) | (384 | ) | ||||||||||||
| Settlements |
(6,400 | ) | (45,836 | ) | — | — | — | — | ||||||||||||||||
| Fair value of plan assets at December 31 |
$ | 44,340 | $ | 33,088 | $ | 91,098 | $ | — | $ | — | $ | — | ||||||||||||
| Funded status |
||||||||||||||||||||||||
| Funded status of plan at December 31 |
$ | (20,115 | ) | $ | (36,271 | ) | $ | 5,134 | $ | (17,548 | ) | $ | (15,379 | ) | $ | (11,046 | ) | |||||||
| Accumulated benefit obligation |
$ | 62,940 | $ | 65,125 | $ | 77,571 | N/A | N/A | N/A | |||||||||||||||
| Amounts recognized in accumulated other comprehensive income consist of: |
||||||||||||||||||||||||
| Net actuarial loss |
$ | 17,085 | $ | 28,168 | $ | 7,354 | $ | 7,408 | $ | 6,223 | $ | 5,072 | ||||||||||||
| Prior service credit |
(6,014 | ) | (7,130 | ) | (11,058 | ) | (5,267 | ) | (5,921 | ) | (8,429 | ) | ||||||||||||
| Amount recognized in accumulated other comprehensive income |
$ | 11,071 | $ | 21,038 | $ | (3,704 | ) | $ | 2,141 | $ | 302 | $ | (3,357 | ) | ||||||||||
| Effect of one-percentage-point change in assumed health care cost trend rate on postretirement obligation |
||||||||||||||||||||||||
| Increase |
N/A | N/A | N/A | 826 | 239 | 215 | ||||||||||||||||||
| Decrease |
N/A | N/A | N/A | (612 | ) | (132 | ) | (123 | ) | |||||||||||||||
| (1) | The 2008 contribution is reflected net of the $24 million refund that was nondeductible for tax purposes. |
171
Table of Contents
THE PMI GROUP, INC. AND SUBSIDIARIES
NOTES TO CONSOLIDATED FINANCIAL STATEMENTS—(Continued)
Included in the underfunded status of the pension benefits is the underfunded status of The SERP Plan of $6.6 million and the underfunded status of the Plan of $13.5 million resulting in a net underfunded status of $20.1 million.
| Pension Benefits (including SERP) | Other Post-Employment Benefits | |||||||||||||||||||||||
| 2009 | 2008 | 2007 | 2009 | 2008 | 2007 | |||||||||||||||||||
| (Dollars in thousands, except percentages) | ||||||||||||||||||||||||
| Components of net periodic benefit cost |
||||||||||||||||||||||||
| Service cost |
$ | 5,429 | $ | 7,611 | $ | 8,278 | $ | 406 | $ | 450 | $ | 507 | ||||||||||||
| Interest cost |
4,163 | 5,454 | 5,226 | 1,010 | 738 | 648 | ||||||||||||||||||
| Expected return on assets |
(2,171 | ) | (7,591 | ) | (6,968 | ) | — | — | — | |||||||||||||||
| Prior service cost amortization |
(1,116 | ) | (1,510 | ) | (964 | ) | (654 | ) | (838 | ) | (838 | ) | ||||||||||||
| Actuarial loss recognized |
2,231 | 470 | 463 | 489 | 422 | 437 | ||||||||||||||||||
| Curtailment gain |
— | (2,441 | ) | — | — | (1,163 | ) | — | ||||||||||||||||
| Additional cost related to settlement |
964 | 15,677 | — | — | — | — | ||||||||||||||||||
| Net periodic benefit cost |
$ | 9,500 | $ | 17,670 | $ | 6,035 | $ | 1,251 | $ | (391 | ) | $ | 754 | |||||||||||
| Cost of special termination benefits |
$ | — | $ | 16,908 | $ | — | $ | — | $ | 1,477 | $ | — | ||||||||||||
| Assumptions to determine net periodic benefit cost |
||||||||||||||||||||||||
| Discount rate |
6.08%-6.17 | % | 6.17%-6.34 | % | 6.06 | %* | 6.12 | % | 6.12%-6.30 | % | 5.89 | % | ||||||||||||
| Expected return on plan assets |
7.00 | % | 8.00 | % | 8.00 | % | N/A | N/A | N/A | |||||||||||||||
| Rate of compensation increase |
3.00 | % | 5.00 | % | 5.00 | % | N/A | N/A | N/A | |||||||||||||||
| Health care cost trend on covered charges |
N/A | N/A | N/A | 8.50 | % | 9.00 | % | 9.00 | % | |||||||||||||||
| Expected benefit payments |
||||||||||||||||||||||||
| 2010 |
$ | 5,065 | $ | 932 | ||||||||||||||||||||
| 2011 |
$ | 8,508 | $ | 942 | ||||||||||||||||||||
| 2012 |
$ | 6,287 | $ | 931 | ||||||||||||||||||||
| 2013 |
$ | 6,399 | $ | 925 | ||||||||||||||||||||
| 2014 |
$ | 9,678 | $ | 953 | ||||||||||||||||||||
| 2015-2019 |
$ | 40,200 | $ | 5,357 | ||||||||||||||||||||
| Effect of one-percentage-point change in assumed health care cost trend rate on aggregate service and interest cost |
||||||||||||||||||||||||
| Increase |
N/A | N/A | N/A | 71 | 23 | 18 | ||||||||||||||||||
| Decrease |
N/A | N/A | N/A | (51 | ) | (10 | ) | (8 | ) | |||||||||||||||
| The estimated amounts that will be amortized from accumulated other comprehensive income into net periodic benefit in 2009 are as follows: |
||||||||||||||||||||||||
| Actuarial loss |
$ | 1,188 | $ | 484 | ||||||||||||||||||||
| Prior service credit |
(1,116 | ) | (654 | ) | ||||||||||||||||||||
| Total |
$ | 72 | $ | (170 | ) | |||||||||||||||||||
| * | Prior to the plan amendment in May 2007, the discount rate used to determine the net periodic cost was 5.95%. |
172
Table of Contents
THE PMI GROUP, INC. AND SUBSIDIARIES
NOTES TO CONSOLIDATED FINANCIAL STATEMENTS—(Continued)
In 2009, the Company contributed $15.7 million to its pension plans. The Company intends to contribute $5.5 million to the Plan in 2010. The benefit costs decreased in 2009 compared to 2008 primarily due to pension settlement costs associated with the VERP initiated in the third quarter of 2008 (discussed above).
The Company’s accumulated benefit obligation for the Plan and SERP Plan at December 31, 2009 was $56.4 million and $6.6 million, respectively, the combination of which equals the $63.0 million accumulated benefit obligation. As of December 31, 2009, the combined fair value of plan assets is approximately $18.7 million lower than the Company’s combined accumulated benefit. The health care cost trend on covered charges for other postretirement benefits was 8.5% in 2009, which will be reduced to 5% in 2016.
PMI’s overall investment strategy is to match its plan asset duration with that of the plan liabilities, through appropriate allocations to equity, fixed income, and cash investments, that provides long-term growth and near-term benefit payments. The target allocation for plan assets are 40 to 60 percent U.S. stocks, 0 to 30 percent International stocks, 20 to 50 percent U.S fixed income securities, and 0 to 10 percent U.S cash and cash equivalents.
The fair values of the assets in the Company’s pension plan at December 31, 2009, by asset category are as follows:
| Total | Fair Value Measurements at December 31, 2009 | |||||||||||
| (Dollars in thousands) | ||||||||||||
| Quoted Prices in Active Markets for Identical Assets (Level 1) |
Significant Observable Inputs (Level 2) |
Significant Unobservable Inputs (Level 3) | ||||||||||
| U.S. stocks |
$ | 17,556 | $ | 17,556 | $ | — | $ | — | ||||
| International stocks |
1,749 | 1,749 | — | — | ||||||||
| U.S. fixed income funds |
23,502 | — | 23,502 | — | ||||||||
| U.S. cash and cash equivalents |
1,533 | 1,533 | — | — | ||||||||
| $ | 44,340 | $ | 20,838 | $ | 23,502 | $ | — | |||||
The strategic asset allocation ranges represent a long-term perspective. Rapid unanticipated market shifts or changes in economic conditions may cause the asset mix to fall outside the policy range. Likewise, temporary higher than expected plan benefit payout obligations may require a higher than target level of liquidity on a short term basis. These divergences should be of a relatively short-term nature, unless the circumstances warrant a longer term divergence from the established permissible ranges. The Company evaluates and rebalances asset allocations as appropriate and reviews the Plan to make sure that the Plan remains properly funded to protect the benefit security of the participants. The Company makes contributions that are sufficient to fully fund its actuarially determined costs, generally exceeding the minimum amounts required by the Employee Retirement Income Security Act.
The primary objective of the Plan is to provide and secure retirement income for the Plan participants and their beneficiaries. As such, the key investment objective is to promote the attainment over a long-term horizon of consistent, competitive total returns that ultimately minimizes reliance on contributions from the plan sponsor. At the same time, a strong emphasis is placed on maintaining adequate levels of liquidity, safety and preservation of the Plan assets. Appropriate emphasis is given to credit quality, price volatility, and diversification for each investment category as well as for the portfolio as a whole. Plan assets are invested in a manner consistent with ERISA fiduciary standards and in accordance with all other relevant legislation and governing documents.
173
Table of Contents
THE PMI GROUP, INC. AND SUBSIDIARIES
NOTES TO CONSOLIDATED FINANCIAL STATEMENTS—(Continued)
Defined Contribution Plan—Certain regular U.S. employees of the Company are eligible to participate in The PMI Group, Inc. Savings and Profit-Sharing Plan (“Savings Plan”). Eligible employees who participate in the Savings Plan may receive, within certain limits, matching Company contributions. The Company contributions recognized as expense were $1.6 million for 2009, $0.9 million for 2008 and $2.1 million for 2007.
Contract underwriters and temporary employees are eligible to participate in the PMI Alternate Savings Plan, under which there are no matching Company contributions.
Deferred Compensation Plan—In addition to the Savings Plan, the Company has an officers’ deferred compensation plan available to certain employees. The obligation related to the deferred compensation plan was $4.8 million and $7.4 million as of December 31, 2009 and 2008, respectively, and is included in other liabilities and accrued expenses.
Welfare Benefits Plan—The Company provides certain health care and life insurance benefits for retired employees who were originally hired on or before December 31, 2004. Generally, qualified employees hired on or before December 31, 2004 may become eligible for these benefits if they retire on or after age 55 with ten or more years of service. The Company contributes a fixed dollar subsidy towards the cost of coverage under one of PMI’s existing benefits options. Retirees are expected to pay all amounts in excess of the Company’s fixed dollar subsidy and must elect coverage upon termination and remain in the plan continuously thereafter to remain eligible. This benefit remains subject to modification or termination by the Company at anytime.
NOTE 17. SHARE-BASED COMPENSATION
Equity Incentive Plan—The PMI Group Inc. Amended and Restated Equity Incentive Plan (the “Equity Incentive Plan”) provides for awards of both non-qualified stock options and incentive stock options, restricted shares, restricted stock units and stock appreciation rights subject to forfeiture and restrictions on transfer, and performance awards entitling the recipient to receive cash or common shares in the future following the attainment of performance goals determined by the Board of Directors. Stock options are granted with an exercise price equal to the market value on the date of grant, and generally expire ten years from the grant date and have a three-year vesting period. The Equity Incentive Plan provides for the granting of restricted shares to officers and key employees. Restricted shares issued under the Equity Incentive Plan to date have had vesting periods ranging from two to four years from the grant date. Holders of restricted stock were entitled to dividends and voting rights, while holders of performance shares accrued dividend equivalents to the same extent that dividends, if any, were paid on the Company’s common stock. Under the Equity Incentive Plan, non-employee directors receive quarterly, non-discretionary grants of stock units. Pursuant to a November 2008 plan amendment, the units have had an initial value of $4,000, subject to a limit of 2,500 units per quarter. The number of units granted depends on the fair market value of the Company’s common shares on the grant date. Each stock unit has an initial value equal to the fair market value of one common share on the grant date. Non-employee director grants of stock units vest on the earlier of the fifth anniversary of the applicable grant date or termination of Board service. Dividend equivalents accrue on directors’ stock units to the same extent that dividends, if any, are paid on the Company’s common stock. The total number of non-employee director stock units outstanding is 405,483 and 436,364 on December 31, 2009 and 2008, respectively.
Non-Employee Director Phantom Stock Plan. Non employee directors also receive quarterly shares of phantom stock under The PMI Group Inc. Non-Employee Director Phantom Stock Plan, which became effective January 15, 2009. The phantom share grants are initially valued at $8,500, with the number of phantom shares being determined based on the fair market value of the Company’s common shares at the grant date. In addition to these grants, if under the Equity Incentive Plan’s 2,500-unit cap on the amount of stock units they can receive on a quarterly basis, the directors receive stock units with a grant date fair value of less than $4,000, the directors
174
Table of Contents
THE PMI GROUP, INC. AND SUBSIDIARIES
NOTES TO CONSOLIDATED FINANCIAL STATEMENTS—(Continued)
will receive phantom stock in an amount that represents the difference between $4,000 and the 2,500-unit cap, if any. The phantom stock vests on the earlier of the fifth anniversary of the applicable grant date or termination of Board service, and upon vesting, is settled in cash. Dividend equivalents accrue on directors’ phantom shares to the same extent that dividends, if any, are paid on the Company’s common stock. Total expense accrued under the Non-Employee Director Phantom Stock Plan was $0.6 million and $0.0 million for the year ended December 31, 2009 and 2008, respectively. The total number of phantom stock shares outstanding under the plan is 218,475 and 0 on December 31, 2009 and 2008, respectively.
Employee Stock Purchase Plan—The PMI Group, Inc. Employee Stock Purchase Plan (“ESPP”) allows eligible employees to purchase shares of the Company’s stock at a 15% discount to fair market value as determined by the plan. The ESPP offers participants the 15% discount to current fair market value or fair market value with a look-back provision of the lesser of the duration an employee has participated in the ESPP or two years. Based on the features of the ESPP, it is considered compensatory according to the provisions of Topic 718. Under the ESPP, the Company issued 381,333 treasury shares in 2009, 470,671 treasury shares in 2008, and 98,038 treasury shares in 2007. Topic 718 requires expense recognition of the amount of the discount to current fair value of ESPP shares purchased by employees.
Impact of Topic 718—The Company has recognized compensation expense for stock options granted based on the estimated grant date fair value method using the Black-Scholes option pricing model to determine the fair value. For stock options, compensation expense is recognized using the accelerated amortization method. The determination of the fair value of share-based payment awards on the date of grant using an option-pricing model is affected by the Company’s share price as well as assumptions regarding a number of complex and subjective variables. These variables include the Company’s expected share price volatility over the expected term of the awards, actual and projected employee stock option exercise behaviors, risk-free interest rates, and expected dividends.
As Topic 718 requires that share-based compensation expense be based on awards that are ultimately expected to vest, share-based compensation has been reduced for estimated forfeitures. The Company is required to estimate forfeitures at the time of grant and revise those estimates in subsequent periods if actual forfeitures differ from those estimates. The Company uses historical data to estimate pre-vesting forfeitures and record share-based compensation expense only for those awards that are expected to vest.
Topic 718 requires cash flows resulting from gross excess tax benefits to be classified as a part of cash flows from financing activities. Excess tax benefits are realized tax benefits from tax deductions for exercised options in excess of the deferred tax asset attributable to share compensation costs for such options. Cash received from ESPP for the years ended December 31, 2009, 2008 and 2007, was $0.6 million, $1.6 million and $3.3 million, respectively. Cash received from option exercises in 2007 was $23.9 million. There were no option exercises in 2009 or 2008. The actual tax benefit realized for the tax deductions from option exercise of the share-based payment arrangements totaled $0.0 million, $0.0 million and $7.0 million, respectively.
The Company recognized employee share-based compensation expense of $4.1 million (pre-tax), $10.1 million (pre-tax) and $18.2 million (pre-tax) for the years ended December 31, 2009, 2008 and 2007, respectively. As of December 31, 2009, there was approximately $1.1 million of unrecognized compensation cost, adjusted for estimated forfeitures, related to non-vested share-based payments granted to employees. This unrecognized expense is expected to be recognized over a weighted average period of 1.1 years. Total unrecognized compensation cost will be adjusted for future changes in estimated forfeitures.
175
Table of Contents
THE PMI GROUP, INC. AND SUBSIDIARIES
NOTES TO CONSOLIDATED FINANCIAL STATEMENTS—(Continued)
The Company recognized share-based compensation expense for non-employee directors of $0.7 million (pre-tax), $1.2 million (pre-tax) and $1.3 million (pre-tax) for the years ended December 31, 2009, 2008 and 2007, respectively.
Valuation Assumptions—The fair value of share options granted to employees is estimated on the date of the grant using the Black-Scholes option pricing model. This option pricing model was developed to estimate the fair value of freely tradable and fully transferable options without vesting restrictions, which differ from the Company’s stock option program. The model also requires considerable judgment, including assumptions regarding future share price volatility and expected time to exercise, which greatly affect the calculated value of stock option grants.
The Company aggregates similar groups of employees with respect to exercise and post-vesting employment-termination behaviors for its option pricing model assumption estimation process. The Company estimates the expected term of options granted by analyzing historical exercise and post-vesting behavior of employees for similar stock option grants. Expected volatility is estimated using the historical volatility of the common stock over the expected term of the options. If new or different information that would be useful in estimating expected volatility becomes available, the Company may incorporate that information into future estimates. The Company considers expected changes of future dividend policy for selection of expected dividends. The risk-free interest rate that the Company uses in the option pricing model is based on the U.S. Treasury zero-coupon yield curve with remaining terms similar to the expected terms on the options.
The fair value of each stock option grant is estimated on the date of the grant using the Black-Scholes option pricing model with the following weighted-average assumptions:
| Year Ended December 31, | |||||||||
| 2009 | 2008 | 2007 | |||||||
| Expected volatility |
88.3 | % | 76.5 | % | 22.9 | % | |||
| Expected dividends |
0.00 | % | 0.95 | % | 0.48 | % | |||
| Expected term (in years) |
4.9 | 3.8 | 4.2 | ||||||
| Risk-free rates |
1.50 | % | 2.12 | % | 4.59 | % | |||
Since the Company’s employee restricted stock units do not participate in dividends during their vesting period, their fair value is determined using the closing price of the Company’s stock on the date of grant less the present value of anticipated dividends (which is zero for the 2009 grant) over the vesting period. The discount rate used is the risk-free rate as of the date of grant of 1.5%.
176
Table of Contents
THE PMI GROUP, INC. AND SUBSIDIARIES
NOTES TO CONSOLIDATED FINANCIAL STATEMENTS—(Continued)
Share-Based Compensation Activity
A summary of the employee stock option activity under the Equity Incentive Plan as of December 31, 2009, 2008 and 2007 and changes during the three years then ended is presented below:
| 2009 | 2008 | 2007 | ||||||||||||||||
| Shares Under Option |
Weighted Average Exercise Price |
Shares Under Option |
Weighted Average Exercise Price |
Shares Under Option |
Weighted Average Exercise Price | |||||||||||||
| Outstanding at beginning of year |
7,122,096 | $ | 36.32 | 6,972,488 | $ | 38.89 | 6,326,883 | $ | 35.26 | |||||||||
| Granted |
880,000 | $ | 0.61 | 553,800 | $ | 5.25 | 1,587,047 | $ | 46.93 | |||||||||
| Exercised |
— | — | — | — | (894,710 | ) | $ | 26.97 | ||||||||||
| Forfeited/expired |
(2,345,551 | ) | $ | 37.53 | (404,192 | ) | $ | 38.02 | (46,732 | ) | $ | 43.63 | ||||||
| Outstanding at end of year |
5,656,545 | $ | 30.38 | 7,122,096 | $ | 36.32 | 6,972,488 | $ | 38.89 | |||||||||
| Vested and Exercisable at year end |
4,386,600 | $ | 36.78 | 5,846,683 | $ | 36.82 | 4,589,129 | $ | 35.44 | |||||||||
| Weighted-average fair value of options granted |
$ | 0.42 | $ | 2.81 | $ | 11.89 | ||||||||||||
| Reserved for future grants |
2,210,098 | — | 1,299,522 | — | 2,923,422 | — | ||||||||||||
The total intrinsic value of options exercised during 2009, 2008 and 2007, was $0.0 million, $0.0 million and $19.8 million, respectively. The weighted-average remaining contractual life of options outstanding as of December 31, 2009 and vested and exercisable as of December 31, 2009 was 4.9 and 3.7 years, respectively. The aggregate intrinsic value for the options outstanding as of December 31, 2009 or for the options vested and exercisable as of December 31, 2009 was $1.7 million and $0.0 million, respectively.
A summary of the restricted stock unit activity under the Equity Incentive Plan as of December 31, 2009 and changes during the year then ended is presented below:
| Shares | Weighted Average Fair Value | ||||
| Outstanding at beginning of year |
1,100,700 | $ | 5.13 | ||
| Granted |
635,000 | $ | 0.61 | ||
| Vested |
514,196 | $ | 5.13 | ||
| Forfeited/expired |
149,070 | $ | 4.46 | ||
| Outstanding at end of year |
1,072,434 | $ | 2.51 | ||
The weighted-average remaining contractual life of employee restricted stock units unvested as of December 31, 2009 was 1.0 years. The aggregate intrinsic value for the employee restricted stock units unvested as of December 31, 2009 was $2.7 million.
177
Table of Contents
THE PMI GROUP, INC. AND SUBSIDIARIES
NOTES TO CONSOLIDATED FINANCIAL STATEMENTS—(Continued)
A summary of the phantom share activity under the Non-Employee Director Phantom Stock Plan as of December 31, 2009 and changes during the year then ended is presented below:
| Restricted Stock Units |
Weighted Average Fair Value | ||||
| Outstanding at beginning of year |
— | — | |||
| Granted |
227,867 | $ | 2.52 | ||
| Vested |
9,392 | $ | 1.01 | ||
| Outstanding at end of year |
218,475 | $ | 2.52 | ||
As phantom shares are cash settled, the shares are valued at the closing price of the Company’s stock. The weighted average fair value of outstanding and granted shares is the closing price of the Company’s stock as of December 31, 2009. The weighted average fair value of vested shares is based on the closing price of the Company’s stock when a participant vested the shares and was paid.
NOTE 18. BUSINESS SEGMENTS
Reporting segments are based upon the Company’s internal organizational structure, the manner in which the Company’s operations are managed, the criteria used by the Company’s management to evaluate segment performance, the availability of separate financial information and overall materiality considerations.
Effective December 31, 2009, the Company combined its former “Corporate and Other” and “Financial Guaranty” segments into a “Corporate and Other” segment for all periods presented. The Company’s Corporate and Other segment, among other things, includes its investment in FGIC and its former investment in RAM Re. The Company impaired its investment in FGIC in 2008 and reduced the carrying value of the investment to zero. The Company is under no obligation to provide additional capital to FGIC.
178
Table of Contents
THE PMI GROUP, INC. AND SUBSIDIARIES
NOTES TO CONSOLIDATED FINANCIAL STATEMENTS—(Continued)
The following tables present segment income or loss and balance sheets as of and for the periods indicated:
| Year Ended December 31, 2009 | ||||||||||||||||
| U.S. Mortgage Insurance Operations |
International Operations |
Corporate and Other |
Consolidated Total |
|||||||||||||
| (Dollars in thousands) | ||||||||||||||||
| Revenues |
||||||||||||||||
| Premiums earned |
$ | 705,940 | $ | 10,880 | $ | 21 | $ | 716,841 | ||||||||
| Net investment income |
110,730 | 5,074 | 3,362 | 119,166 | ||||||||||||
| Net realized investment gains (losses) |
40,227 | (2,737 | ) | (19 | ) | 37,471 | ||||||||||
| Change in fair value of certain debt instruments |
— | — | 16,522 | 16,522 | ||||||||||||
| Net gain from credit default swaps |
— | 31,581 | — | 31,581 | ||||||||||||
| Other (loss) income |
(38 | ) | (13 | ) | 2,379 | 2,328 | ||||||||||
| Total revenues |
856,859 | 44,785 | 22,265 | 923,909 | ||||||||||||
| Losses and expenses |
||||||||||||||||
| Losses and loss adjustment expenses |
1,740,691 | 16,064 | — | 1,756,755 | ||||||||||||
| Amortization of deferred policy acquisition costs |
15,238 | 2,543 | — | 17,781 | ||||||||||||
| Other underwriting and operating expenses |
128,097 | 11,081 | 16,033 | 155,211 | ||||||||||||
| Interest expense |
55 | — | 42,958 | 43,013 | ||||||||||||
| Total losses and expenses |
1,884,081 | 29,688 | 58,991 | 1,972,760 | ||||||||||||
| (Loss) income before equity in losses from unconsolidated subsidiaries and income taxes |
(1,027,222 | ) | 15,097 | (36,726 | ) | (1,048,851 | ) | |||||||||
| Equity in losses from unconsolidated subsidiaries |
(11,452 | ) | — | (567 | ) | (12,019 | ) | |||||||||
| (Loss) income from continuing operations before income taxes |
(1,038,674 | ) | 15,097 | (37,293 | ) | (1,060,870 | ) | |||||||||
| Income tax benefit from continuing operations |
(382,726 | ) | (2,645 | ) | (21,508 | ) | (406,879 | ) | ||||||||
| (Loss) income from continuing operations |
(655,948 | ) | 17,742 | (15,785 | ) | (653,991 | ) | |||||||||
| Loss from discontinued operations, net of taxes |
— | (5,335 | ) | — | (5,335 | ) | ||||||||||
| Net (loss) income |
$ | (655,948 | ) | $ | 12,407 | $ | (15,785 | ) | $ | (659,326 | ) | |||||
179
Table of Contents
THE PMI GROUP, INC. AND SUBSIDIARIES
NOTES TO CONSOLIDATED FINANCIAL STATEMENTS—(Continued)
| Year Ended December 31, 2008 | ||||||||||||||||
| U.S. Mortgage Insurance Operations |
International Operations |
Corporate and Other |
Consolidated Total | |||||||||||||
| (Dollars in thousands) | ||||||||||||||||
| Revenues |
||||||||||||||||
| Premiums earned |
$ | 772,173 | $ | 13,942 | $ | 44 | $ | 786,159 | ||||||||
| Net investment income |
115,219 | 13,237 | 10,245 | 138,701 | ||||||||||||
| Net realized investment losses |
(47,600 | ) | (63 | ) | (1,003 | ) | (48,666 | ) | ||||||||
| Impairment of unconsolidated subsidiaries |
— | — | (90,868 | ) | (90,868 | ) | ||||||||||
| Change in fair value of certain debt instruments |
— | — | 123,595 | 123,595 | ||||||||||||
| Net loss from credit default swaps |
— | (11,275 | ) | — | (11,275 | ) | ||||||||||
| Other (loss) income |
(351 | ) | 5 | 10,487 | 10,141 | |||||||||||
| Total revenues |
839,441 | 15,846 | 52,500 | 907,787 | ||||||||||||
| Losses and expenses |
— | |||||||||||||||
| Losses and loss adjustment expenses |
1,835,720 | 63,544 | — | 1,899,264 | ||||||||||||
| Amortization of deferred policy acquisition costs |
15,586 | 2,699 | — | 18,285 | ||||||||||||
| Other underwriting and operating expenses |
123,368 | 39,903 | 55,312 | 218,583 | ||||||||||||
| Interest expense |
139 | — | 40,868 | 41,007 | ||||||||||||
| Total losses and expenses |
1,974,813 | 106,146 | 96,180 | 2,177,139 | ||||||||||||
| Loss before equity in earnings (losses) from unconsolidated subsidiaries and income taxes |
(1,135,372 | ) | (90,300 | ) | (43,680 | ) | (1,269,352 | ) | ||||||||
| Equity in earnings (losses) from unconsolidated subsidiaries |
6,456 | — | (58,258 | ) | (51,802 | ) | ||||||||||
| Loss from continuing operations before income taxes |
(1,128,916 | ) | (90,300 | ) | (101,938 | ) | (1,321,154 | ) | ||||||||
| Income tax benefit from continuing operations |
(419,371 | ) | (3,264 | ) | (11,331 | ) | (433,966 | ) | ||||||||
| Loss from continuing operations |
(709,545 | ) | (87,036 | ) | (90,607 | ) | (887,188 | ) | ||||||||
| Loss from discontinued operations, net of taxes |
— | (17,200 | ) | (24,120 | ) | (41,320 | ) | |||||||||
| Net loss |
$ | (709,545 | ) | $ | (104,236 | ) | $ | (114,727 | ) | $ | (928,508 | ) | ||||
180
Table of Contents
THE PMI GROUP, INC. AND SUBSIDIARIES
NOTES TO CONSOLIDATED FINANCIAL STATEMENTS—(Continued)
| Year Ended December 31, 2007 | ||||||||||||||||
| U.S. Mortgage Insurance Operations |
International Operations |
Corporate and Other |
Consolidated Total | |||||||||||||
| (Dollars in thousands) | ||||||||||||||||
| Revenues |
||||||||||||||||
| Premiums earned |
$ | 800,937 | $ | 14,446 | $ | 57 | $ | 815,440 | ||||||||
| Net investment income |
110,355 | 10,848 | 11,349 | 132,552 | ||||||||||||
| Net realized investment gains (losses) |
4,587 | (164 | ) | 9,437 | 13,860 | |||||||||||
| Impairment of unconsolidated subsidiary |
— | — | (38,499 | ) | (38,499 | ) | ||||||||||
| Net loss from credit default swaps |
— | (14,447 | ) | — | (14,447 | ) | ||||||||||
| Other income (loss) |
85 | (114 | ) | 14,308 | 14,279 | |||||||||||
| Total revenues (expenses) |
915,964 | 10,569 | (3,348 | ) | 923,185 | |||||||||||
| Losses and expenses |
— | |||||||||||||||
| Losses and loss adjustment expenses |
1,096,093 | 26,805 | — | 1,122,898 | ||||||||||||
| Amortization of deferred policy acquisition costs |
84,214 | 3,469 | — | 87,683 | ||||||||||||
| Other underwriting and operating expenses |
95,557 | 18,104 | 79,256 | 192,917 | ||||||||||||
| Interest expense |
108 | — | 33,283 | 33,391 | ||||||||||||
| Total losses and expenses |
1,275,972 | 48,378 | 112,539 | 1,436,889 | ||||||||||||
| Loss before equity in earnings (losses) from unconsolidated subsidiaries and income taxes |
(360,008 | ) | (37,809 | ) | (115,887 | ) | (513,704 | ) | ||||||||
| Equity in earnings (losses) from unconsolidated subsidiaries |
17,119 | — | (758,619 | ) | (741,500 | ) | ||||||||||
| Loss from continuing operations before income taxes |
(342,889 | ) | (37,809 | ) | (874,506 | ) | (1,255,204 | ) | ||||||||
| Income tax benefit from continuing operations |
(152,073 | ) | (2,529 | ) | (91,920 | ) | (246,522 | ) | ||||||||
| Loss from continuing operations |
(190,816 | ) | (35,280 | ) | (782,586 | ) | (1,008,682 | ) | ||||||||
| Income from discontinued operations, net of taxes |
— | 90,270 | 3,086 | 93,356 | ||||||||||||
| Net (loss) income |
$ | (190,816 | ) | $ | 54,990 | $ | (779,500 | ) | $ | (915,326 | ) | |||||
181
Table of Contents
THE PMI GROUP, INC. AND SUBSIDIARIES
NOTES TO CONSOLIDATED FINANCIAL STATEMENTS—(Continued)
| December 31, 2009 | |||||||||||||
| U.S. Mortgage Insurance Operations |
International Operations |
Corporate and Other |
Consolidated Total | ||||||||||
| (Dollars in thousands) | |||||||||||||
| Assets |
|||||||||||||
| Cash and investments, at fair value |
$ | 2,979,683 | $ | 190,975 | $ | 88,766 | $ | 3,259,424 | |||||
| Investments in unconsolidated subsidiaries |
124,826 | — | 14,949 | 139,775 | |||||||||
| Reinsurance recoverables |
703,550 | — | — | 703,550 | |||||||||
| Deferred policy acquisition costs |
41,289 | — | — | 41,289 | |||||||||
| Property, equipment and software, net of accumulated depreciation and amortization |
35,606 | 27 | 66,260 | 101,893 | |||||||||
| Other assets |
320,483 | 11,755 | 60,310 | 392,548 | |||||||||
| Total assets |
$ | 4,205,437 | $ | 202,757 | $ | 230,285 | $ | 4,638,479 | |||||
| Liabilities |
|||||||||||||
| Reserve for losses and loss adjustment expenses |
$ | 3,213,735 | $ | 36,365 | $ | — | $ | 3,250,100 | |||||
| Unearned premiums |
61,758 | 10,328 | 3 | 72,089 | |||||||||
| Debt |
— | — | 389,991 | 389,991 | |||||||||
| Other liabilities (assets) |
169,032 | 38,483 | (8,303 | ) | 199,212 | ||||||||
| Total liabilities |
3,444,525 | 85,176 | 381,691 | 3,911,392 | |||||||||
| Shareholders’ equity (deficit) |
760,912 | 117,581 | (151,406 | ) | 727,087 | ||||||||
| Total liabilities and shareholders’ equity |
$ | 4,205,437 | $ | 202,757 | $ | 230,285 | $ | 4,638,479 | |||||
182
Table of Contents
THE PMI GROUP, INC. AND SUBSIDIARIES
NOTES TO CONSOLIDATED FINANCIAL STATEMENTS—(Continued)
| December 31, 2008 | |||||||||||||
| U.S. Mortgage Insurance Operations |
International Operations |
Corporate and Other |
Consolidated Total | ||||||||||
| (Dollars in thousands) | |||||||||||||
| Assets |
|||||||||||||
| Cash and investments, at fair value |
$ | 3,184,751 | $ | 264,322 | $ | 255,835 | $ | 3,704,908 | |||||
| Investments in unconsolidated subsidiaries |
135,082 | — | 15,295 | 150,377 | |||||||||
| Reinsurance recoverables |
482,678 | — | — | 482,678 | |||||||||
| Deferred policy acquisition costs |
32,317 | 2,474 | — | 34,791 | |||||||||
| Property, equipment and software, net of accumulated depreciation and amortization |
48,365 | 948 | 76,033 | 125,346 | |||||||||
| Other assets |
268,031 | 14,424 | 43,844 | 326,299 | |||||||||
| Total assets |
$ | 4,151,224 | $ | 282,168 | $ | 391,007 | $ | 4,824,399 | |||||
| Liabilities |
— | ||||||||||||
| Reserve for losses and loss adjustment expenses |
$ | 2,624,504 | $ | 84,782 | $ | — | $ | 2,709,286 | |||||
| Unearned premiums |
86,187 | 25,449 | 20 | 111,656 | |||||||||
| Debt |
— | — | 481,764 | 481,764 | |||||||||
| Other liabilities (assets) |
190,348 | 78,436 | (25,316 | ) | 243,468 | ||||||||
| Total liabilities |
2,901,039 | 188,667 | 456,468 | 3,546,174 | |||||||||
| Shareholders’ equity (deficit) |
1,250,185 | 93,501 | (65,461 | ) | 1,278,225 | ||||||||
| Total liabilities and shareholders’ equity |
$ | 4,151,224 | $ | 282,168 | $ | 391,007 | $ | 4,824,399 | |||||
NOTE 19. DISCONTINUED OPERATIONS
During the third quarter of 2008, PMI Australia, PMI Asia and PMI Guaranty were reported as discontinued operations. Where applicable, the notes to the consolidated financial statements have been restated to reflect these discontinued operations for all periods presented. A summary of the composition of operating results included in discontinued operations is as follows:
| Year Ended December 31, | |||||||||||
| 2009 | 2008 | 2007 | |||||||||
| (Dollars in thousands) | |||||||||||
| PMI Australia |
$ | — | $ | 51,114 | $ | 80,005 | |||||
| PMI Asia |
— | 10,435 | 10,265 | ||||||||
| PMI Guaranty |
— | (24,120 | ) | 3,086 | |||||||
| Income from discontinued operations |
$ | — | $ | 37,429 | $ | 93,356 | |||||
| Loss from sale of discontinued operations, net of taxes |
(5,335 | ) | (78,749 | ) | — | ||||||
| Total (loss) income from discontinued operations |
$ | (5,335 | ) | $ | (41,320 | ) | $ | 93,356 | |||
In 2009, the Company recorded certain reconciliation adjustments related to the sale of PMI Australia and PMI Asia. The adjustments were to reconcile certain estimates that were made during the closing of the transaction.
183
Table of Contents
THE PMI GROUP, INC. AND SUBSIDIARIES
NOTES TO CONSOLIDATED FINANCIAL STATEMENTS—(Continued)
Summarized below are the overall operating components for each entity, as well as certain asset and liability information.
Sale of PMI Australia—On October 22, 2008, the Company completed the sale of PMI Australia and received approximately $746 million in cash (including certain adjustments for pre-completion interest and changes in the value of PMI Australia’s investment portfolio) and a note receivable (“QBE Note”) in the principal amount of approximately $187 million. The actual amount owed under the QBE Note is subject to reductions to the extent (i) performance of PMI Australia’s existing insurance portfolio as of September 30, 2008 does not achieve specified targets and (ii) PMI is required to satisfy certain warranty claims. The Company currently does not record any statutory or GAAP value with respect to the QBE Note due to the contingencies discussed above.
The following table represents PMI Australia’s results of operations for the years ended December 31, 2009, 2008 and 2007, respectively, which were recorded as discontinued operations:
| 2009 | 2008 | 2007 | |||||||||
| (Dollars in thousands) | |||||||||||
| Premiums earned |
$ | — | $ | 151,018 | $ | 167,106 | |||||
| Net investment income |
— | 68,178 | 72,501 | ||||||||
| Other (loss) income |
— | (28,391 | ) | 1,139 | |||||||
| Total revenues |
— | 190,805 | 240,746 | ||||||||
| Losses and loss adjustment expenses |
— | 73,296 | 77,500 | ||||||||
| Other underwriting and operating expenses |
— | 44,105 | 48,632 | ||||||||
| Income before income taxes from discontinued operations |
— | 73,404 | 114,614 | ||||||||
| Income tax expense |
— | 22,290 | 34,609 | ||||||||
| Income from discontinued operations |
$ | — | $ | 51,114 | $ | 80,005 | |||||
| Loss from sale of discontinued operations |
— | (25,388 | ) | — | |||||||
| Tax expense on sale of discontinued operations |
6,594 | 39,179 | — | ||||||||
| Total (loss) income from discontinued operations |
$ | (6,594 | ) | $ | (13,453 | ) | $ | 80,005 | |||
In the third quarter of 2009, the Company recorded tax expense of $6.6 million due to refinement of the tax estimate associated with the sale of PMI Australia.
Sale of PMI Asia—On December 17, 2008, the Company completed the sale of PMI Asia and received approximately $51.6 million in cash equal to 92.5% of PMI Asia’s book value as of June 30, 2008. The following table represents PMI Asia’s results of operations, which were recorded as discontinued operations:
| Year Ended December 31, | |||||||||||
| 2009 | 2008 | 2007 | |||||||||
| (Dollars in thousands) | |||||||||||
| Total revenues |
$ | — | $ | 15,147 | $ | 13,669 | |||||
| Losses, loss adjustment expenses and other underwriting and operating expenses |
— | 3,339 | 1,946 | ||||||||
| Income before income taxes from discontinued operations |
— | 11,808 | 11,723 | ||||||||
| Income tax expense |
— | 1,373 | 1,458 | ||||||||
| Income from discontinued operations |
$ | — | $ | 10,435 | $ | 10,265 | |||||
| Loss from sale of discontinued operations |
(23 | ) | (10,000 | ) | — | ||||||
| Tax (benefit) expense on sale of discontinued operations |
(1,282 | ) | 4,182 | — | |||||||
| Total income (loss) from discontinued operations |
$ | 1,259 | $ | (3,747 | ) | $ | 10,265 | ||||
184
Table of Contents
THE PMI GROUP, INC. AND SUBSIDIARIES
NOTES TO CONSOLIDATED FINANCIAL STATEMENTS—(Continued)
In the third quarter of 2009, the Company recorded a tax benefit of $1.3 million due to a refinement of the tax estimate associated with the sale of PMI Asia.
Discontinued Operations of PMI Guaranty—PMI Guaranty has completed its runoff activities, and is reported as discontinued operations in the Corporate and Other segment and in the consolidated statement of operations for the year ended December 31, 2008. As of December 31, 2008, upon receiving regulatory approval, PMI Guaranty’s remaining assets and liabilities were merged into U.S. Mortgage Insurance Operations.
The results of operations of PMI Guaranty are as follows for the periods indicated:
| Year Ended December 31, |
||||||||
| 2008 | 2007 | |||||||
| (Dollars in thousands) | ||||||||
| Total revenues |
$ | 2,380 | $ | 10,488 | ||||
| Losses and LAE |
29,856 | 2,649 | ||||||
| Other underwriting and operating expenses |
11,440 | 6,388 | ||||||
| (Loss) income before income taxes from discontinued operations |
(38,916 | ) | 1,451 | |||||
| Income tax benefit |
(14,796 | ) | (1,635 | ) | ||||
| Total (loss) income from discontinued operations |
$ | (24,120 | ) | $ | 3,086 | |||
NOTE 20. STATUTORY ACCOUNTING
The Company’s domestic insurance subsidiaries prepare statutory-basis financial statements in accordance with the accounting practices prescribed or permitted by their respective state’s department of insurance, which is a comprehensive basis of accounting other than GAAP.
The following table presents PMI’s statutory net loss, statutory surplus and contingency reserve liability as of and for the years ended as follows:
| 2009 | 2008 | 2007 | ||||||||||
| (Dollars in thousands) | ||||||||||||
| Statutory net loss |
$ | (852,707 | ) | $ | (748,164 | ) | $ | (295,751 | ) | |||
| Statutory surplus |
$ | 772,221 | $ | 568,019 | $ | 581,985 | ||||||
| Contingency reserve liability |
$ | 37,182 | $ | 1,035,151 | $ | 2,341,956 | ||||||
Under the insurance laws of the State of Arizona and several other states, mortgage insurers are required to establish a special contingency reserve included in total liabilities, with annual additions equal to 50% of premiums earned for that year. During 2009, MIC contributed $356 million to the reserve. This reserve is required to be maintained for a period of 120 months to protect against the effects of adverse economic cycles. After 120 months, the reserve is released to unassigned funds. In the event an insurer’s loss ratio in any calendar year exceeds 35%, however, the insurer may withdraw from its contingency reserves an amount equal to the excess portion of such losses. The Company withdrew $1.4 billion from its contingency reserves predominately due to actual losses exceeding 35% of the corresponding earned premiums.
On February 2, 2009, MIC received written approval from the Department for a permitted accounting practice allowing it to report the GAAP value of PMI Plaza, LLC (“PMI Plaza”), a subsidiary, in MIC’s statutory and annual statements without obtaining a GAAP audit as required by Statements of Statutory Accounting Principles (“SSAP”) No. 97, Investment in Subsidiary, Controlled and Affiliated Entities, A Replacement of SSAP No. 88 (“SSAP No. 97”).
185
Table of Contents
THE PMI GROUP, INC. AND SUBSIDIARIES
NOTES TO CONSOLIDATED FINANCIAL STATEMENTS—(Continued)
NOTE 21. CAPITAL SUPPORT AGREEMENTS
MIC has a capital support agreement with PMI Europe, with a corresponding guarantee from The PMI Group, under which MIC may be required to make additional capital contributions from time-to-time as necessary to maintain PMI Europe’s minimum capital requirements. MIC also has a capital support agreement, whereby it agreed to contribute funds, under specified conditions, to maintain CMG MI’s risk-to-capital ratio at or below 19.0 to 1. MIC’s obligation under the CMG MI capital support agreement is limited to an aggregate of $37.7 million. As of December 31, 2009, CMG MI’s risk-to-capital ratio was 17.2 to 1.
MIC also has a capital support agreement with PMI Canada. Because the Company terminated its Canadian operations in PMI Canada, it believes it is unlikely that there is any remaining material support obligation under the PMI Canada capital support agreement.
On October 27, 1994, Allstate Support Agreements were terminated with respect to policies issued after October 27, 1994, but continue in modified form (as so modified, the “Runoff Support Agreement”) for policies written prior to such termination. Under the terms of the Runoff Support Agreement, Allstate may, at its option, either directly pay or cause to be paid, claims relating to policies written during the terms of the respective Allstate Support Agreements if MIC fails to pay such claims or, in lieu thereof, make contributions directly to MIC or The PMI Group. In the event any amounts are paid or contributed, the likelihood of which management believes is remote, Allstate would receive subordinated debt or preferred stock of MIC or The PMI Group in return. No payment obligations have arisen under the Runoff Support Agreement. As of December 31, 2009, less than $46 million of risk in force was subject to the Runoff Support Agreement.
186
Table of Contents
THE PMI GROUP, INC. AND SUBSIDIARIES
NOTES TO CONSOLIDATED FINANCIAL STATEMENTS—(Continued)
NOTE 22. QUARTERLY FINANCIAL INFORMATION (UNAUDITED)
A summary of selected quarterly results follows:
| 2009 |
First | Second | Third | Fourth | Year (1) | |||||||||||||||
| (Dollars in thousands, expect per share data) | ||||||||||||||||||||
| Continuing operations: |
||||||||||||||||||||
| Revenues (2) |
$ | 245,064 | $ | 202,163 | $ | 226,859 | $ | 249,823 | $ | 923,909 | ||||||||||
| Net loss |
$ | (115,261 | ) | $ | (222,627 | ) | $ | (87,920 | ) | $ | (228,183 | ) | $ | (653,991 | ) | |||||
| Basic EPS |
(1.41 | ) | (2.71 | ) | (1.06 | ) | (2.76 | ) | (7.94 | ) | ||||||||||
| Diluted EPS |
(1.41 | ) | (2.71 | ) | (1.06 | ) | (2.76 | ) | (7.94 | ) | ||||||||||
| (Loss) gain on sale of discontinued operations: |
||||||||||||||||||||
| (Loss) gain on sale of PMI Australia and PMI Asia |
$ | (30 | ) | $ | 7 | $ | (5,312 | ) | $ | — | $ | (5,335 | ) | |||||||
| Basic EPS |
— | — | (0.07 | ) | — | (0.07 | ) | |||||||||||||
| Diluted EPS |
— | — | (0.07 | ) | — | (0.07 | ) | |||||||||||||
| Total operations: |
||||||||||||||||||||
| Revenues (2) |
$ | 245,064 | $ | 202,163 | $ | 226,859 | $ | 249,823 | $ | 923,909 | ||||||||||
| Net loss |
$ | (115,291 | ) | $ | (222,620 | ) | $ | (93,232 | ) | $ | (228,183 | ) | $ | (659,326 | ) | |||||
| Basic EPS |
(1.41 | ) | (2.71 | ) | (1.13 | ) | (2.76 | ) | (8.01 | ) | ||||||||||
| Diluted EPS |
(1.41 | ) | (2.71 | ) | (1.13 | ) | (2.76 | ) | (8.01 | ) | ||||||||||
| 2008 |
First | Second | Third | Fourth | Year (1) | |||||||||||||||
| (Dollars in thousands, expect per share data) | ||||||||||||||||||||
| Continuing operations: |
||||||||||||||||||||
| Revenues (2), (3) |
$ | 231,781 | $ | 259,564 | $ | 225,461 | $ | 190,981 | $ | 907,787 | ||||||||||
| Net loss |
$ | (305,916 | ) | $ | (250,970 | ) | $ | (149,309 | ) | $ | (180,993 | ) | $ | (887,188 | ) | |||||
| Basic EPS |
(3.77 | ) | (3.09 | ) | (1.83 | ) | (2.22 | ) | (10.90 | ) | ||||||||||
| Diluted EPS |
(3.77 | ) | (3.09 | ) | (1.83 | ) | (2.22 | ) | (10.90 | ) | ||||||||||
| Discontinued operations: |
||||||||||||||||||||
| Revenues (2) |
$ | 84,851 | $ | 71,763 | $ | 38,765 | $ | 12,954 | $ | 208,333 | ||||||||||
| Net income |
$ | 31,952 | $ | 4,684 | $ | 386 | $ | 407 | $ | 37,429 | ||||||||||
| Basic EPS |
0.40 | 0.06 | — | — | 0.46 | |||||||||||||||
| Diluted EPS |
0.40 | 0.06 | — | — | 0.46 | |||||||||||||||
| (Loss) gain on sale of discontinued operations: |
||||||||||||||||||||
| (Loss) gain on sale of PMI Australia and PMI Asia |
$ | — | $ | — | $ | (80,490 | ) | $ | 1,741 | $ | (78,749 | ) | ||||||||
| Basic EPS |
— | — | (0.98 | ) | 0.03 | (0.96 | ) | |||||||||||||
| Diluted EPS |
— | — | (0.98 | ) | 0.03 | (0.96 | ) | |||||||||||||
| Total operations: |
||||||||||||||||||||
| Revenues (2) |
$ | 316,632 | $ | 331,327 | $ | 264,226 | $ | 203,935 | $ | 1,116,120 | ||||||||||
| Net loss |
$ | (273,964 | ) | $ | (246,286 | ) | $ | (229,413 | ) | $ | (178,845 | ) | $ | (928,508 | ) | |||||
| Basic EPS |
(3.37 | ) | (3.03 | ) | (2.81 | ) | (2.19 | ) | (11.40 | ) | ||||||||||
| Diluted EPS |
(3.37 | ) | (3.03 | ) | (2.81 | ) | (2.19 | ) | (11.40 | ) | ||||||||||
| (1) | Due to the use of weighted average shares outstanding when calculating earnings per share, the sum of the quarterly per share data may not equal the per share data for the year. |
| (2) | The revenues do not include equity in (losses) earnings from unconsolidated subsidiaries. |
| (3) | Revenues from continuing operations include interest income on a surplus note with PMI Guaranty which is classified as discontinued operations. |
187
Table of Contents
THE PMI GROUP, INC. AND SUBSIDIARIES
NOTES TO CONSOLIDATED FINANCIAL STATEMENTS—(Continued)
NOTE 23. COMPREHENSIVE LOSS
The following table shows the components of comprehensive loss for the years ended December 31, 2009, 2008 and 2007:
| 2009 | 2008 | 2007 | ||||||||||
| (Dollars in thousands) | ||||||||||||
| Net Loss |
$ | (659,326 | ) | $ | (928,508 | ) | $ | (915,326 | ) | |||
| Unrealized gains (losses) on investments |
||||||||||||
| Total change in unrealized gains (losses) arising during the year, net of tax (benefit) expense |
116,952 | (136,326 | ) | (61,258 | ) | |||||||
| Less: realized investment gains (losses), net of tax (benefit) expense |
23,393 | (34,553 | ) | 679 | ||||||||
| Change in unrealized gains (losses) arising during the period, net of tax expense (benefit) of $47,720, ($54,581) and ($26,501), respectively |
93,559 | (101,773 | ) | (61,937 | ) | |||||||
| Defined benefit pension plans |
||||||||||||
| Current year actuarial gain (loss) |
4,069 | (24,466 | ) | (1,357 | ) | |||||||
| Recognition of actuarial loss |
2,395 | 10,190 | 301 | |||||||||
| Current year prior service credit |
— | — | 7,706 | |||||||||
| Recognition of prior service credit |
(1,150 | ) | (4,184 | ) | (627 | ) | ||||||
| Other |
— | 1,867 | (2,147 | ) | ||||||||
| Defined benefit pension plans, net of tax expense (benefit) of $2,862, ($12,236) and ($5,389), respectively |
5,314 | (16,593 | ) | 3,876 | ||||||||
| Accretion of cash flow hedges, net of tax expense of $214, $214 and $214, respectively |
398 | 398 | 398 | |||||||||
| Foreign currency translation adjustments |
||||||||||||
| Total change in unrealized gains on foreign currency translation |
1,816 | (357,141 | ) | 108,660 | ||||||||
| Less: realized foreign currency translation gains |
— | (124,353 | ) | — | ||||||||
| Change in unrealized gains on foreign currency translation |
1,816 | (232,788 | ) | 108,660 | ||||||||
| Other comprehensive income (loss) |
101,087 | (350,756 | ) | 50,997 | ||||||||
| Comprehensive loss |
$ | (558,239 | ) | $ | (1,279,264 | ) | $ | (864,329 | ) | |||
The changes in unrealized gains/losses in 2009 were primarily due to contracting market spreads in the U.S. fixed income portfolio and in the preferred securities portfolio as a result of an improvement in the securities markets as well as other market driven factors. The changes in unrealized gains/losses in 2008 were primarily due to widening market spreads principally in the U.S fixed income portfolio and the preferred securities portfolio. The changes in foreign currency translation adjustments in 2009 were due primarily to strengthening of the Euro spot exchange rate relative to the U.S. dollar. The changes in foreign currency translation adjustments in 2008 were due primarily to the recognition of approximately $124.4 million of accumulated currency translation gains in connection with the sale of PMI Australia and PMI Asia.
188
Table of Contents
THE PMI GROUP, INC. AND SUBSIDIARIES
NOTES TO CONSOLIDATED FINANCIAL STATEMENTS—(Continued)
The following table shows the accumulated balances for each component of accumulated other comprehensive income (loss) income for the years ended December 31, 2009, 2008 and 2007:
| Unrealized gains on investments |
Defined benefit plans |
Accretion of cash flow hedges |
Foreign currency translation gains |
Total | ||||||||||||||||
| (Dollars in thousands) | ||||||||||||||||||||
| Balance, January 1, 2007 |
$ | 98,595 | $ | (1,154 | ) | $ | (5,748 | ) | $ | 172,387 | $ | 264,080 | ||||||||
| Current period change |
(61,937 | ) | 3,876 | 398 | 108,660 | 50,997 | ||||||||||||||
| Balance, December 31, 2007 |
$ | 36,658 | $ | 2,722 | $ | (5,350 | ) | $ | 281,047 | $ | 315,077 | |||||||||
| Current period change |
(101,773 | ) | (16,593 | ) | 398 | (232,788 | ) | (350,756 | ) | |||||||||||
| Balance, December 31, 2008 |
$ | (65,115 | ) | $ | (13,871 | ) | $ | (4,952 | ) | $ | 48,259 | $ | (35,679 | ) | ||||||
| Current period change |
93,559 | 5,314 | 398 | 1,816 | 101,087 | |||||||||||||||
| Balance, December 31, 2009 |
$ | 28,444 | $ | (8,557 | ) | $ | (4,554 | ) | $ | 50,075 | $ | 65,408 | ||||||||
189
Table of Contents
NOTE 24. EXIT AND DISPOSAL ACTIVITIES
In the fourth quarter of 2008 and 2009, the Company undertook initiatives to reduce and manage its expenses to focus on its core U.S. mortgage insurance business. The following table provides a reconciliation of exit and disposal costs included in other underwriting expenses by operating segment in 2009 and 2008:
| U.S. Mortgage Insurance Operations |
International Operations |
Consolidated Total |
||||||||||
| (Dollars in thousands) | ||||||||||||
| Balance at January 1, 2008 |
$ | 299 | $ | — | $ | 299 | ||||||
| Exit costs incurred |
||||||||||||
| Severance |
3,127 | 8,566 | 11,693 | |||||||||
| Fringe benefits |
2,561 | 326 | 2,887 | |||||||||
| Lease termination and fixed asset disposals |
649 | 320 | 969 | |||||||||
| Other |
295 | 173 | 468 | |||||||||
| Total incurred |
6,632 | 9,385 | 16,017 | |||||||||
| Exit costs payments |
||||||||||||
| Severance |
(354 | ) | (6,440 | ) | (6,794 | ) | ||||||
| Fringe benefits |
(3,640 | ) | — | (3,640 | ) | |||||||
| Lease termination and fixed asset disposals |
(300 | ) | (170 | ) | (470 | ) | ||||||
| Other |
(294 | ) | — | (294 | ) | |||||||
| Total payments |
(4,588 | ) | (6,610 | ) | (11,198 | ) | ||||||
| Balance at December 31, 2008 |
$ | 2,343 | $ | 2,775 | $ | 5,118 | ||||||
| Exit costs incurred |
||||||||||||
| Severance |
3,183 | — | 3,183 | |||||||||
| Fringe benefits |
— | 10 | 10 | |||||||||
| Lease termination and fixed asset disposals |
315 | 1,793 | 2,108 | |||||||||
| Other |
451 | — | 451 | |||||||||
| Total incurred |
3,949 | 1,803 | 5,752 | |||||||||
| Exit costs payments |
||||||||||||
| Severance |
(3,189 | ) | (2,229 | ) | (5,418 | ) | ||||||
| Fringe benefits |
— | (30 | ) | (30 | ) | |||||||
| Lease termination and fixed asset disposals |
— | (1,812 | ) | (1,812 | ) | |||||||
| Other |
(1,031 | ) | (264 | ) | (1,295 | ) | ||||||
| Total payments |
(4,220 | ) | (4,335 | ) | (8,555 | ) | ||||||
| Balance at December 31, 2009 |
$ | 2,072 | $ | 243 | $ | 2,315 | ||||||
The expenses in the U.S. Mortgage Insurance Operations segment are primarily payroll and related expenses from a reduction in force due to the Voluntary Early Retirement Program in the fourth quarter of 2008 and involuntary terminations in 2008 and 2009. The expenses in the International Operations segment are primarily due to reductions in force from the closure of PMI Canada’s office in Toronto and reconfiguration of PMI Europe. The additions in 2009 are related to the termination of contract underwriting services announced in the first quarter of 2009 and effective April 2009 and fixed asset dispositions. Exit costs incurred to date were $21.8 million which consisted primarily of severance and related costs.
190
Table of Contents
| ITEM 9A. | CONTROLS AND PROCEDURES |
Evaluation of Disclosure Controls and Procedures—Based on their evaluation as of December 31, 2009, our principal executive officer and principal financial officer have concluded that, as of the end of the period covered by this report, our disclosure controls and procedures (as defined in Rules 13a-15(e) and 15d-15(e) under the Securities Exchange Act of 1934) were effective.
Management’s Report on Internal Control Over Financial Reporting—Management’s report is contained in Item 8 of this report.
Changes in Internal Control Over Financial Reporting—There were no changes in our internal control over financial reporting that occurred during our most recent fiscal quarter that have materially affected, or are reasonably likely to materially affect, our internal control over financial reporting.
191
Table of Contents
| ITEM 10. | DIRECTORS, EXECUTIVE OFFICERS AND CORPORATE GOVERNANCE |
The information concerning The PMI Group’s directors, including audit committee financial experts, as well as certain other information concerning our executive officers, as required by this Item is incorporated by reference from The PMI Group’s Proxy Statement for its 2010 Annual Meeting of Stockholders under the captions “Item 1: Election of Directors—Nominees For Director of The PMI Group, Inc.” “Section 16(a) Beneficial Ownership Reporting Compliance” and “Corporate Governance.” Information regarding Executive Officers of The PMI Group is included in a separate item captioned “Executive Officers of Registrant” in Part I of this report, which is incorporated by reference herein.
The PMI Group has adopted a Code of Ethics for Senior Financial Officers that applies to The PMI Group’s principal executive officer, principal financial officer, and principal accounting officer and controller. The Code of Ethics is available on The PMI Group’s website address at http://www.pmi-us.com and is available in print to any stockholder who requests it. The PMI Group intends to disclose any amendment to, or waiver from, a provision of the Code of Ethics by posting such information on its website.
Certain other documents relating to The PMI Group’s corporate governance, including the Code of Business Conduct and Ethics, which is applicable to The PMI Group’s directors, officers and employees, the Board of Directors Guidelines on Significant Corporate Governance Issues, and the charters of the Audit Committee, Compensation Committee and Governance and Nominating Committee of The PMI Group Board of Directors, are available on The PMI Group’s website address at http://www.pmi-us.com.
| ITEM 11. | EXECUTIVE COMPENSATION |
The information required by this Item is incorporated by reference from The PMI Group’s Proxy Statement for its 2010 Annual Meeting of Stockholders under the captions “Directors’ Compensation and Benefits,” “Executive Compensation” and “Compensation Committee Interlocks and Insider Participation.”
| ITEM 12. | SECURITY OWNERSHIP OF CERTAIN BENEFICIAL OWNERS AND MANAGEMENT AND RELATED STOCKHOLDER MATTERS |
The information required by this Item is incorporated by reference from The PMI Group’s Proxy Statement for its 2010 Annual Meeting of Stockholders under the captions “Security Ownership of Certain Beneficial Owners and Management” and “Executive Compensation—Equity Compensation Plan Information.”
| ITEM 13. | CERTAIN RELATIONSHIPS AND RELATED TRANSACTIONS, AND DIRECTOR INDEPENDENCE |
The information required by this Item is incorporated by reference from The PMI Group’s Proxy Statement for its 2010 Annual Meeting of Stockholders under the captions “Compensation Committee Interlocks and Insider Participation,” “Certain Relationships and Related Transactions” and “Corporate Governance.”
| ITEM 14. | PRINCIPAL ACCOUNTANT FEES AND SERVICES |
The information required by this Item is incorporated by reference from The PMI Group’s Proxy Statement for its 2010 Annual Meeting of Stockholders under “Item 2: Ratification of Appointment of Independent Registered Public Accounting Firm.”
192
Table of Contents
| ITEM 15. | EXHIBITS AND FINANCIAL STATEMENT SCHEDULES |
| 1. | Financial Statements: The following financial statements are included in Item 8. | |||
| Management’s Report on Internal Control Over Financial Reporting | ||||
| Report of Independent Registered Public Accounting Firm | ||||
| Report of Independent Registered Public Accounting Firm on Internal Control Over Financial Reporting | ||||
| Consolidated Statements of Operations for the years ended December 31, 2009, 2008 and 2007 | ||||
| Consolidated Balance Sheets as of December 31, 2009 and 2008 | ||||
| Consolidated Statements of Shareholders’ Equity for the years ended December 31, 2009, 2008 and 2007 | ||||
| Consolidated Statements of Cash Flows for the years ended December 31, 2009, 2008 and 2007 | ||||
| Notes to Consolidated Financial Statements | ||||
| 2. | Financial Statement Schedules: The financial statement schedules listed below immediately precede the Index to Exhibits and are filed as part of this Form 10-K. All other schedules are omitted because of the absence of conditions under which they are required or because the required information is included in the consolidated financial statements or notes thereto. | |||
| Schedule II – Condensed Financial Information of Registrant | ||||
| Schedule III – Supplementary Insurance Information | ||||
| Schedule IV – Reinsurance | ||||
| 3. |
Exhibits: Exhibits listed in the accompanying Index to Exhibits are filed as part of this Form 10-K. | |||
193
Table of Contents
SIGNATURES
Pursuant to the requirements of Section 13 or 15(d) of the Securities Exchange Act of 1934, the registrant has duly caused this Report to be signed on its behalf by the undersigned, thereunto duly authorized, in the City of Walnut Creek, State of California, on the 5th day of March, 2010.
| THE PMI GROUP, INC. | ||
| BY: |
/s/ L. STEPHEN SMITH | |
| L. Stephen Smith | ||
| Chief Executive Officer | ||
Pursuant to the requirements of the Securities Exchange Act of 1934, this report has been signed below by the following persons on behalf of the registrant and in the capacities and on the dates indicated.
| Name |
Title |
Date | ||
| /s/ L. STEPHEN SMITH L. Stephen Smith |
Chief Executive Officer, Director |
March 5, 2010 | ||
| /s/ DONALD P. LOFE, JR. Donald P. Lofe, Jr. |
Executive Vice President, Chief Financial Officer and Chief Administrative Officer |
March 5, 2010 | ||
| /s/ THOMAS H. JETER Thomas H. Jeter |
Group Senior Vice President, Chief Accounting Officer and Corporate Controller |
March 5, 2010 | ||
| /s/ CARMINE GUERRO Carmine Guerro |
Director |
March 5, 2010 | ||
| /s/ WAYNE E. HEDIEN Wayne E. Hedien |
Director |
March 5, 2010 | ||
| /s/ LOUIS G. LOWER II Louis G. Lower II |
Director |
March 5, 2010 | ||
| /s/ RAYMOND L. OCAMPO JR. Raymond L. Ocampo Jr. |
Director |
March 5, 2010 | ||
| /s/ JOHN D. ROACH John D. Roach |
Director |
March 5, 2010 | ||
| /s/ JOSÉ H. VILLARREAL José H. Villarreal |
Director |
March 5, 2010 | ||
| /s/ MARY LEE WIDENER Mary Lee Widener |
Director |
March 5, 2010 | ||
| /s/ RONALD H. ZECH Ronald H. Zech |
Director |
March 5, 2010 | ||
194
Table of Contents
THE PMI GROUP, INC.
SCHEDULE II—CONDENSED FINANCIAL INFORMATION OF REGISTRANT
CONDENSED STATEMENTS OF OPERATIONS
PARENT COMPANY ONLY
| Year ended December 31, | ||||||||||||
| 2009 | 2008 | 2007 | ||||||||||
| (In thousands) | ||||||||||||
| REVENUES |
||||||||||||
| Losses from wholly-owned subsidiaries (Note G) |
$ | (638,538 | ) | $ | (839,999 | ) | $ | (163,575 | ) | |||
| Investment income |
2,718 | 9,304 | 10,394 | |||||||||
| Net realized investment losses |
(19 | ) | (91,871 | ) | (29,062 | ) | ||||||
| Change in fair value of certain debt instruments |
16,522 | 123,595 | — | |||||||||
| Other losses |
— | — | (1,206 | ) | ||||||||
| Total revenues |
(619,317 | ) | (798,971 | ) | (183,449 | ) | ||||||
| EXPENSES |
||||||||||||
| Underwriting and operating expenses |
4,494 | 28,633 | 41,360 | |||||||||
| Interest expense |
42,958 | 40,918 | 33,283 | |||||||||
| Total expenses |
47,452 | 69,551 | 74,643 | |||||||||
| Loss before equity in losses from unconsolidated subsidiaries and income taxes |
(666,769 | ) | (868,522 | ) | (258,092 | ) | ||||||
| Equity in losses from unconsolidated subsidiaries |
(12,019 | ) | (51,802 | ) | (741,500 | ) | ||||||
| Loss before income tax benefit |
(678,788 | ) | (920,324 | ) | (999,592 | ) | ||||||
| Income tax benefit |
18,203 | 5,998 | 84,266 | |||||||||
| Loss from continuing operations, net of tax |
(660,585 | ) | (914,326 | ) | (915,326 | ) | ||||||
| Gain (loss) on sale of discontinued operations, net of tax |
1,259 | (14,182 | ) | — | ||||||||
| NET LOSS |
$ | (659,326 | ) | $ | (928,508 | ) | $ | (915,326 | ) | |||
See accompanying supplementary notes to Parent Company only condensed financial statements.
S-1
Table of Contents
THE PMI GROUP, INC.
SCHEDULE II—CONDENSED FINANCIAL INFORMATION OF REGISTRANT
CONDENSED BALANCE SHEETS
PARENT COMPANY ONLY
| As of December 31, | ||||||||
| 2009 | 2008 | |||||||
| (Dollars in thousands, except per share data) | ||||||||
| ASSETS |
||||||||
| Fixed income securities available-for-sale, at fair value (amortized cost of $2,456 and $131,493) |
$ | 2,473 | $ | 122,443 | ||||
| Total investments |
2,473 | 122,443 | ||||||
| Cash and cash equivalents |
58,995 | 113,484 | ||||||
| Investments in wholly-owned subsidiaries |
860,308 | 1,318,396 | ||||||
| Investments in unconsolidated subsidiaries |
139,775 | 150,377 | ||||||
| Other assets |
63,175 | 76,077 | ||||||
| Total assets |
$ | 1,124,726 | $ | 1,780,777 | ||||
| LIABILITIES |
||||||||
| Long-term debt |
$ | 389,991 | $ | 481,764 | ||||
| Other liabilities |
7,648 | 20,788 | ||||||
| Total liabilities |
397,639 | 502,552 | ||||||
| SHAREHOLDERS’ EQUITY |
||||||||
| Preferred stock—$0.01 par value; 5,000,000 shares authorized; none issued or outstanding |
— | — | ||||||
| Common stock—$0.01 par value; 250,000,000 shares authorized; 119,313,767 shares issued; 82,580,410 and 81,687,583 shares outstanding |
1,193 | 1,193 | ||||||
| Additional paid-in capital |
873,010 | 892,213 | ||||||
| Treasury stock, at cost (36,733,357 and 37,626,184 shares) |
(1,317,252 | ) | (1,341,037 | ) | ||||
| Retained earnings |
1,104,728 | 1,761,535 | ||||||
| Accumulated other comprehensive income (loss), net of deferred taxes |
65,408 | (35,679 | ) | |||||
| Total shareholders’ equity |
727,087 | 1,278,225 | ||||||
| Total liabilities and shareholders’ equity |
$ | 1,124,726 | $ | 1,780,777 | ||||
See accompanying supplementary notes to Parent Company only condensed financial statements.
S-2
Table of Contents
THE PMI GROUP, INC.
SCHEDULE II—CONDENSED FINANCIAL INFORMATION OF REGISTRANT
CONDENSED STATEMENTS OF COMPREHENSIVE LOSS
PARENT COMPANY ONLY
| Year ended December 31, | ||||||||||||
| 2009 | 2008 | 2007 | ||||||||||
| (Dollars in thousands) | ||||||||||||
| NET LOSS |
$ | (659,326 | ) | $ | (928,508 | ) | $ | (915,326 | ) | |||
| Change in unrealized gains on investments, net of deferred tax expense (benefit) of $47,720, $(54,581) and $26,501, respectively |
93,559 | (101,773 | ) | (61,937 | ) | |||||||
| Net unrealized losses from derivatives designated as cash flow hedges, net of tax |
— | — | — | |||||||||
| Accretion of cash flow hedges to interest expense |
398 | 398 | 398 | |||||||||
| Foreign currency translation adjustment |
1,816 | (232,788 | ) | 108,660 | ||||||||
| Pension adjustment (including plan amendments), net of deferred tax |
5,314 | (16,593 | ) | 3,876 | ||||||||
| Other comprehensive income (loss), net of taxes |
101,087 | (350,756 | ) | 50,997 | ||||||||
| COMPREHENSIVE LOSS |
$ | (558,239 | ) | $ | (1,279,264 | ) | $ | (864,329 | ) | |||
See accompanying supplementary notes to Parent Company only condensed financial statements.
S-3
Table of Contents
THE PMI GROUP, INC.
SCHEDULE II—CONDENSED FINANCIAL INFORMATION OF REGISTRANT
CONDENSED STATEMENTS OF CASH FLOWS
PARENT COMPANY ONLY
| Year ended December 31, | ||||||||||||
| 2009 | 2008 | 2007 | ||||||||||
| (Dollars in thousands) | ||||||||||||
| CASH FLOWS FROM OPERATING ACTIVITIES |
||||||||||||
| Net loss |
$ | (659,326 | ) | $ | (928,508 | ) | $ | (915,326 | ) | |||
| Adjustments to reconcile net loss to net cash used in operating activities: |
||||||||||||
| Losses from wholly-owned subsidiaries |
638,538 | 839,999 | 163,575 | |||||||||
| Equity in losses from unconsolidated subsidiaries |
12,019 | 51,802 | 741,500 | |||||||||
| Net realized investment losses |
19 | 91,871 | 29,062 | |||||||||
| Change in fair value of certain debt instruments |
(16,522 | ) | (123,595 | ) | — | |||||||
| Depreciation and amortization |
60 | 206 | 830 | |||||||||
| Compensation expense related to stock options and employee stock purchase plan |
3,204 | 8,815 | 16,652 | |||||||||
| Excess tax benefits on the exercise of employee stock options |
— | — | (4,001 | ) | ||||||||
| Deferred income taxes |
(17,838 | ) | 32,291 | (53,385 | ) | |||||||
| Changes in related party receivables, net of payables |
(4,370 | ) | 47,638 | (2,739 | ) | |||||||
| Other |
3,455 | (26,188 | ) | (24,659 | ) | |||||||
| Net cash used in operating activities |
(40,761 | ) | (5,669 | ) | (48,491 | ) | ||||||
| CASH FLOWS FROM INVESTING ACTIVITIES |
||||||||||||
| Proceeds from sales and maturities of fixed income securities |
128,958 | 1,327 | 2,756 | |||||||||
| Investments in unconsolidated subsidiaries, net of distributions |
6,810 | (278 | ) | 2,209 | ||||||||
| Investment in subsidiaries |
(122,350 | ) | (81,618 | ) | (21,013 | ) | ||||||
| Purchase of QBE note from MIC |
(75,000 | ) | — | — | ||||||||
| Return of capital |
— | 8,000 | — | |||||||||
| Dividends received from subsidiaries |
— | — | 165,000 | |||||||||
| Net change in captial contributions to and distributions from consolidated subsidiaries |
122,350 | |||||||||||
| Purchases of fixed income securities |
— | (2,336 | ) | — | ||||||||
| Purchases of equity securities |
— | — | (4,930 | ) | ||||||||
| Net cash provided (used in) by investing activities |
60,768 | (74,905 | ) | 144,022 | ||||||||
| CASH FLOWS FROM FINANCING ACTIVITIES |
||||||||||||
| Net proceeds from issuance of long-term debt |
— | 200,000 | — | |||||||||
| Repayment and extinguishment of long-term debt, net of expenses |
(75,250 | ) | (45,000 | ) | — | |||||||
| Purchases of treasury stock |
— | — | (214,996 | ) | ||||||||
| Proceeds from issuance of treasury stock |
754 | 2,777 | 31,260 | |||||||||
| Excess tax benefits on the exercise of employee stock options |
— | — | 4,001 | |||||||||
| Dividends paid to shareholders |
— | (2,451 | ) | (17,703 | ) | |||||||
| Net cash (used in) provided by financing activities |
(74,496 | ) | 155,326 | (197,438 | ) | |||||||
| Net (decrease) increase in cash and cash equivalents |
(54,489 | ) | 74,752 | (101,907 | ) | |||||||
| Cash and cash equivalents at beginning of year |
113,484 | 38,732 | 140,639 | |||||||||
| Cash and cash equivalents at end of year |
$ | 58,995 | $ | 113,484 | $ | 38,732 | ||||||
See accompanying supplementary notes to Parent Company only condensed financial statements.
S-4
Table of Contents
THE PMI GROUP, INC.
SCHEDULE II—CONDENSED FINANCIAL INFORMATION OF REGISTRANT
PARENT COMPANY ONLY
SUPPLEMENTARY NOTES
A. Basis of Presentation
The accompanying The PMI Group, Inc. (“Parent Company”) condensed financial statements should be read in conjunction with Item 8. Financial Statements and Supplementary Data of this Form 10-K. The Parent Company’s subsidiaries are presented using the equity method of accounting.
Certain items in the prior years’ financial statements have been reclassified to conform to the current year’s financial statement presentation.
The preparation of the condensed financial statements in conformity with U.S. generally accepted accounting principles (“GAAP”) requires management to make estimates and assumptions that affect the reported amounts of assets and liabilities and the disclosure of contingent assets and liabilities at the date of the financial statements and the reported amounts of revenues and expenses during the reporting period. Actual results may differ from those estimates.
B. Investments
The Parent Company classifies its fixed income securities as available-for-sale, and as such, they are carried at fair value. The amortized cost of fixed income securities is adjusted for amortization of premiums and accretion of discounts to maturity, which are included in net investment income, net of deferred taxes. Changes in fair value are reported as a component of other comprehensive income. The Parent Company’s investments in fixed income securities are comprised of corporate bonds and U.S. government agency securities.
C. Investments in Unconsolidated Subsidiaries
Investments in the Parent Company’s unconsolidated subsidiaries include both equity investees and other unconsolidated subsidiaries. Investments in equity investees with ownership interests of 20-50% are generally accounted for using the equity method of accounting, and investments of less than 20% ownership interest are generally accounted for using the cost method of accounting if the Company does not have significant influence over the entity. Limited partnerships with ownership interests greater than 3% but less than 50% are primarily accounted for using the equity method of accounting. The carrying value of the investments in the Parent Company’s unconsolidated subsidiaries also includes the Company’s share of net unrealized gains and losses in the unconsolidated subsidiaries’ investment portfolios.
S-5
Table of Contents
D. Long-Term Debt and Revolving Credit Facility
As of December 31, 2009 and 2008, the fair value and carrying value of long-term debt outstanding issued by The PMI Group, Inc. was as follows:
| December 31, 2009 | December 31, 2008 | |||||||||||
| Principal Amount | Fair Value | Carrying Value | Carrying Value | |||||||||
| (Dollars in thousands) | ||||||||||||
| 6.000% Senior Notes, due September 15, 2016 (1) |
$ | 250,000 | $ | 149,063 | $ | 149,063 | $ | 153,027 | ||||
| 6.625% Senior Notes, due September 15, 2036 (1) |
150,000 | 64,585 | 64,585 | 77,144 | ||||||||
| Revolving Credit Facility, due October 24, 2011 |
124,750 | 124,750 | 124,750 | 200,000 | ||||||||
| 8.309% Junior Subordinated Debentures, due February 1, 2027 |
51,593 | 10,061 | 51,593 | 51,593 | ||||||||
| Total debt |
$ | 576,343 | $ | 348,459 | $ | 389,991 | $ | 481,764 | ||||
| (1) | The fair value and carrying value of the Parent Company’s 6.000% Senior Notes and 6.625% Senior Notes at December 31, 2009 include accrued interest. |
6.000% and 6.625% Senior Notes—In September 2006, the Parent Company issued $250 million in principal amount of 6.000% Senior Notes, due September 15, 2016 and $150 million in principal amount of 6.625% Senior Notes, due September 15, 2036. The 6.000% Senior Notes and the 6.625% Senior Notes bear interest at a rate of 6.000% and 6.625% per annum, payable semi-annually in arrears on March 15 and September 15 of each year, beginning on March 15, 2007. The PMI Group, Inc. may redeem the 6.000% and 6.625% Senior Notes in whole or in part at any time at the “make-whole redemption price”. The “make-whole redemption price” will be equal to the greater of (a) 100% of the principal amount of the 6.000% and 6.625% Senior Notes to be redeemed and (b) the sum of the present values of the remaining scheduled payments thereon discounted to the date of redemption, on a semi-annual basis (assuming a 360-day year consisting of twelve 30-day months), at a rate equal to the applicable treasury rate plus 25 basis points for the 6.000% Senior Notes and 35 basis points for the 6.625% Senior Notes, plus in the case of either (a) or (b), any interest accrued but not paid to but excluding the date of redemption. In connection with the issuance of these Senior Notes, the Parent Company entered into two interest rate lock agreements which were designated as cash flow hedges. The fair value of the cash flow hedges was settled for $9.0 million and is amortized into interest expense over the terms of the new senior debt that was issued. As of December 31, 2009, the unamortized balance in the other comprehensive income related to these fair value hedges was approximately $7.0 million (pre-tax).
Effective January 1, 2008, the Parent Company elected to adopt the fair value option presented by ASC Topic 825 for the Parent Company’s 6.000% Senior Notes and 6.625% Senior Notes. ASC Topic 825 requires that the difference between the carrying value before election of the fair value option and the fair value of these instruments be recorded as an adjustment to beginning retained earnings in the period of adoption. (See Note 10. Fair Value Disclosures, for further discussion.)
8.309% Junior Subordinated Debentures—The Junior Subordinated Debentures bear interest at the rate of 8.309% per annum paid semiannually and mature on February 1, 2027. The Junior Subordinated Debentures are subordinated to all senior indebtedness of The PMI Group, Inc.
In considering the initial adoption of the ASC Topic 825, the Parent Company determined that the change in fair value of the 8.309% Junior Subordinated Debentures would not have a significant impact on the Parent Company’s consolidated financial results. Therefore, the Parent Company did not elect to adopt the fair value option for the 8.309% Junior Subordinated Debentures.
Revolving Credit Facility—The Parent Company amended its revolving credit facility (the “credit facility” or “facility”) effective May 29, 2009 following the satisfaction of certain conditions precedent agreed upon
S-6
Table of Contents
between the Parent Company and the lenders under the facility on May 8, 2009. Among other things, the amended credit facility reduced the facility size to a maximum of $125 million and eliminated certain financial covenants and events of default previously contained in the facility (including the elimination of the maximum debt to total capitalization percentage covenant, the maximum risk to capital ratio covenant, and the financial strength ratings event of default). The amended credit facility requires a minimum Adjusted Consolidated Net Worth (as defined in the facility) of at least $700 million through December 31, 2009, and at least $500 million from January 1, 2010 through the facility’s October 24, 2011 maturity date. (See Item 8, Financial Statements and Supplementary Data, Note 9. Debt and Revolving Credit Facility, for further discussion.) The amended facility also contains restrictions on, among other things, asset dispositions, dividends and investments. While the Parent Company is generally permitted under the amended facility to make additional investments in the Parent Company’s reinsurance subsidiaries, the Parent Company’s ability to make additional investments in PMI Mortgage Insurance Co. (“MIC”) and MIC’s subsidiaries is subject to dollar limitations.
Prior to the effectiveness of the amended facility, on May 29, 2009, the Shared Collateral Pledge Agreement, dated as of April 24, 2008, between the Parent Company and U.S. Bank National Association as collateral agent (the “Collateral Agent”), pursuant to which the Parent Company granted a security interest in the stock of MIC in favor of the Collateral Agent for the equal and ratable benefit of the lenders under the credit facility and the noteholders under certain of the Parent Company’s senior notes, was terminated and the security interest in the stock of MIC was released.
Thereafter, MIC and the Parent Company entered into a Note Purchase Agreement, dated as of May 29, 2009 (the “Note Purchase Agreement”), pursuant to which the Company purchased the contingent note (the “QBE Note”) that MIC received in connection with the sale of PMI Australia to QBE Holdings (AAP) Pty Limited. Pursuant to the Note Purchase Agreement, the Parent Company made an initial payment to MIC of $75 million and agreed to make an additional contingent payment of up to $25 million; the amount of the contingent payment will be determined based on the value of the QBE Note at redemption or on the net proceeds received by the Parent Company upon a sale of the QBE Note prior to redemption. (See Item 7, Conditions and Trends Affecting our Business—International Operations, for further discussion on the QBE Note.)
Following the sale of the QBE Note to the Parent Company by MIC, the Parent Company pledged the QBE Note in favor of the Administrative Agent, for the benefit of the lenders under the credit facility. In connection with the effectiveness of the amended credit facility, on May 29, 2009, TPG prepaid its credit facility in an amount sufficient to reduce its outstanding borrowings thereunder to $125 million.
E. Net Realized Investment Losses
Included in the net realized investment losses is a $16.5 million gain on the change in fair value of certain of the Company’s debt instruments.
F. Dividends from Subsidiaries
During 2009, 2008 and 2007, the Parent Company received $0.0 million, $0.0 million, and $165.0 million, respectively, of cash dividends.
G. Discontinued Operations
During 2008 and 2009, the operations of PMI Australia, PMI Asia and PMI Guaranty were reported as discontinued operations. As a result, the assets and liabilities of PMI Australia and PMI Asia have been presented as discontinued operations for all periods presented in the Parent Company’s consolidated financial statements. The assets and liabilities of PMI Guaranty which were disposed of other than by sale, are classified in the consolidated balance sheet according to their nature. In addition, where applicable, the notes to the consolidated financial statements have been restated to reflect these discontinued operations for all periods presented.
S-7
Table of Contents
In August 2008, PMI Mortgage Insurance Co. entered into a definitive agreement to sell its wholly-owned subsidiary, PMI Australia, and the Parent Company entered into a definitive agreement to sell its wholly-owned subsidiary, PMI Asia. The Parent Company recognized an after-tax loss of $64.6 million relating to the sale of PMI Australia on October 22, 2008 and an after-tax loss of $14.2 million on the sale of PMI Asia on December 17, 2008. The Parent Company received approximately $51.6 million cash proceeds from the sale of PMI Asia. Since these subsidiaries are reported under the equity method of accounting, they are not presented as discontinued operations.
In 2008, the Parent Company discontinued the operations of its wholly-owned subsidiary, PMI Guaranty. During the third quarter of 2008, PMI Guaranty paid approximately $100 million of its excess capital and repaid a $50 million surplus note plus $2.2 million of accrued interest to The PMI Group, Inc. Approximately $144 million was reinvested in U.S. Mortgage Insurance Operations. These payments consisted of approximately $137 million in investment securities plus accrued investment income and $15.3 million in cash and cash equivalents. As of December 31, 2008, upon receiving regulatory approval, PMI Guaranty’s remaining assets and liabilities were merged into U.S. Mortgage Insurance Operations.
S-8
Table of Contents
THE PMI GROUP, INC. AND SUBSIDIARIES
SCHEDULE III—SUPPLEMENTARY INSURANCE INFORMATION
As of and for the years ended December 31, 2009, 2008 and 2007
| Segment |
Deferred Policy Acquisition Costs |
Reserve for Losses and Loss Adjustment Expenses |
Unearned Premiums |
Net Premiums Written |
Premiums Earned |
Net Investment Income |
Losses and Loss Adjustment Expenses |
Amortization of Deferred Acquisition Costs |
Other Operating Expenses |
Equity in (losses) earnings |
||||||||||||||||||||||
| (Dollars in thousands) | ||||||||||||||||||||||||||||||||
| 2009 |
||||||||||||||||||||||||||||||||
| U.S. MI (1) |
$ | 41,289 | $ | 3,213,735 | $ | 61,758 | $ | 685,382 | $ | 705,940 | $ | 110,730 | $ | 1,740,691 | $ | 15,238 | $ | 128,097 | $ | (11,452 | ) | |||||||||||
| International Operations (2) |
— | 36,365 | 10,328 | (7,328 | ) | 10,880 | 5,074 | 16,064 | 2,543 | 11,081 | — | |||||||||||||||||||||
| Corporate and Other |
— | — | 3 | 4 | 21 | 3,362 | — | — | 16,033 | (567 | ) | |||||||||||||||||||||
| Total |
$ | 41,289 | $ | 3,250,100 | $ | 72,089 | $ | 678,058 | $ | 716,841 | $ | 119,166 | $ | 1,756,755 | $ | 17,781 | $ | 155,211 | $ | (12,019 | ) | |||||||||||
| 2008 |
||||||||||||||||||||||||||||||||
| U.S. MI (1) |
$ | 32,317 | $ | 2,624,504 | $ | 86,187 | $ | 750,627 | $ | 772,173 | $ | 115,219 | $ | 1,835,720 | $ | 15,586 | $ | 123,368 | $ | 6,456 | ||||||||||||
| International Operations (2) |
2,474 | 84,782 | 25,449 | 18,233 | 13,942 | 12,913 | 63,544 | 2,699 | 39,903 | — | ||||||||||||||||||||||
| Corporate and Other (3) |
— | — | 20 | 35 | 44 | 10,245 | — | — | 55,312 | (58,258 | ) | |||||||||||||||||||||
| Total |
$ | 34,791 | $ | 2,709,286 | $ | 111,656 | $ | 768,895 | $ | 786,159 | $ | 138,377 | $ | 1,899,264 | $ | 18,285 | $ | 218,583 | $ | (51,802 | ) | |||||||||||
| 2007 |
||||||||||||||||||||||||||||||||
| U.S. MI (1) |
10,474 | 1,133,080 | 107,200 | 799,747 | 800,937 | 110,355 | 1,096,093 | 84,214 | 95,557 | 17,119 | ||||||||||||||||||||||
| International Operations (2) |
3,921 | 41,579 | 22,983 | 14,123 | 14,446 | 10,848 | 26,805 | 3,469 | 18,104 | — | ||||||||||||||||||||||
| Corporate and Other (3) |
3,910 | 2,650 | 6,738 | 52 | 57 | 11,349 | — | — | 79,256 | (758,619 | ) | |||||||||||||||||||||
| Total |
$ | 18,305 | $ | 1,177,309 | $ | 136,921 | $ | 813,922 | $ | 815,440 | $ | 132,552 | $ | 1,122,898 | $ | 87,683 | $ | 192,917 | $ | (741,500 | ) | |||||||||||
| (1) | Represents U.S. Mortgage Insurance Operations. |
| (2) | Excludes the results of PMI Australia and PMI Asia due to their classification to discontinued operations in 2008. |
| (3) | Excludes the results of PMI Guaranty Co. for income statement classification due to its classification to discontinued operations in 2008. The remaining assets and liabilities of PMI Guaranty were merged into U.S. Mortgage Insurance Operations. |
S-9
Table of Contents
THE PMI GROUP, INC. AND SUBSIDIARIES
SCHEDULE IV—REINSURANCE
Years ended December 31, 2009, 2008 and 2007
| Premiums Earned |
Gross Amount |
Assumed from Other Companies |
Ceded To Other Companies |
Net Amount |
Percentage of Amount Assumed to Net |
|||||||||||
| (In thousands, except percentages) | ||||||||||||||||
| 2009 |
||||||||||||||||
| Mortgage Guaranty |
$ | 870,478 | $ | 2,696 | $ | (156,333 | ) | $ | 716,841 | 0.38 | % | |||||
| 2008 |
||||||||||||||||
| Mortgage Guaranty |
$ | 964,512 | $ | 12,851 | $ | (191,204 | ) | $ | 786,159 | 1.63 | % | |||||
| 2007 |
||||||||||||||||
| Mortgage Guaranty |
$ | 986,591 | $ | 7,657 | $ | (178,808 | ) | $ | 815,440 | 0.94 | % | |||||
S-10
Table of Contents
INDEX TO EXHIBITS
| Exhibit |
Description of Exhibits | |
| 3.1 | Restated Certificate of Incorporation (incorporated by reference to exhibit 3.1 to Amendment No. 1 to the registrant’s Registration Statement on Form S-1 (No. 33-88542), filed on March 2, 1995). | |
| 3.1a | Certificate of Amendment of Certificate of Incorporation (incorporated by reference to exhibit 3.1 to the registrant’s quarterly report on Form 10-Q for the quarter ended June 30, 2002, filed on August 14, 2002 (File No. 001-13664)). | |
| 3.1b | Certificate Eliminating Reference to a Series of Shares of Stock from the Certificate of Incorporation of The PMI Group, Inc., filed with the Delaware Secretary of State on January 29, 2009 (incorporated by reference to exhibit 3.(i)l to the registrant’s current report on Form 8-K, filed on January 29, 2009 (File No. 001-13664)). | |
| 3.2 | The PMI Group, Inc. Amended and Restated Bylaws effective July 16, 2008 (incorporated by reference to exhibit 3.2 to the registrant’s current report on Form 8-K, filed on July 22, 2008 (File No. 001-13664)). | |
| 4.1 | Specimen common stock certificate (incorporated by reference to exhibit 4.1 to Amendment No. 1 to the registrant’s Registration Statement on Form S-1 (No. 33-88542), filed on March 2, 1995). | |
| 4.2 | Junior Subordinated Indenture, dated as of February 4, 1997, between The PMI Group, Inc. and The Bank of New York, Inc., as Trustee (incorporated by reference to exhibit 4.3 to the registrant’s annual report on Form 10-K for the year ended December 31, 1996, filed on March 31, 1997 (File No. 001-13664)). | |
| 4.3 | Senior Indenture, dated as of November 3, 2003, between The PMI Group, Inc. and The Bank of New York, as trustee (incorporated by reference to exhibit 10.30 to the registrant’s annual report on Form 10-K for the year ended December 31, 2003, filed on March 15, 2004 (File No. 001-13664)). | |
| 4.3a | Form of Senior Note (contained in exhibit 4.3). | |
| 4.4 | Supplemental Indenture No. 1, dated as of November 3, 2003, between The PMI Group, Inc. and The Bank of New York, as trustee (incorporated by reference to exhibit 10.31 to the registrant’s annual report on Form 10-K for the year ended December 31, 2003, filed on March 15, 2004 (File No. 001-13664)). | |
| 4.5 | Form of 6.000% Senior Note due 2016 (incorporated by reference to exhibit 10.2 to the registrant’s quarterly report on Form 10-Q for the quarter ended September 30, 2006, filed on November 7, 2006 (File No. 001-13664)). | |
| 4.6 | Form of 6.25% Senior Note due 2036 (incorporated by reference to exhibit 10.3 to the registrant’s quarterly report on Form 10-Q for the quarter ended September 30, 2006, filed on November 7, 2006 (File No. 001-13664)). | |
| 10.1* | The PMI Group, Inc. Amended and Restated Equity Incentive Plan (Amended May 21, 2009), (incorporated by reference to exhibit 10.1 to the registrant’s current report on Form 8-K, filed on May 26, 2009 (File No. 001-13664)). | |
| 10.2* | The PMI Group, Inc. Directors’ Deferred Compensation Plan, amended and restated as of July 21, 1999 (incorporated by reference to exhibit 4.2 to the registrant’s Registration Statement on Form S-8 (No. 333-32190), filed on March 10, 2000). | |
| 10.2a* | Amendment No. 1 to The PMI Group, Inc. Directors’ Deferred Compensation Plan (incorporated by reference to exhibit 10.5A to the registrant’s current report on Form 8-K, filed on December 20, 2004 (File No. 001-13664)). | |
| 10.3* | The PMI Group, Inc. 2005 Directors’ Deferred Compensation Plan (September 20, 2007 Restatement) (incorporated by reference to exhibit 10.6 to the registrant’s quarterly report on Form 10-Q for the quarter ended September 30, 2007, filed on November 7, 2007 (File No. 001-13664)). | |
Table of Contents
| Exhibit |
Description of Exhibits | |
| 10.3a* | Amendment No. 1, effective February 20, 2008, to The PMI Group, Inc. 2005 Directors’ Deferred Compensation Plan (September 20, 2007 Restatement) (incorporated by reference to exhibit 10.3a to the registrant’s annual report on Form 10-K for the year ended December 31, 2007, filed on March 17, 2008 (File No. 001-13664)). | |
| 10.3b* | Amendment No. 2, effective November 19, 2008, to The PMI Group, Inc. 2005 Directors’ Deferred Compensation Plan (September 20, 2007 Restatement) (incorporated herein by reference to exhibit 10.3b to the registrant’s annual report on Form 10-K for the year ended December 31, 2008, filed on March 16, 2009 (File No. 001-13664)). | |
| 10.4* | The PMI Group, Inc. Officer Deferred Compensation Plan (effective July 1, 1997) (incorporated by reference to Appendix D to the registrant’s proxy statement filed on April 22, 2004 (File No. 001-13664)). | |
| 10.4a* | Amendment No. 1 to The PMI Group, Inc. Officer Deferred Compensation Plan, dated December 22, 2004 (incorporated by reference to exhibit 10.21a to the registrant’s current report on Form 8-K, filed on December 22, 2004 (File No. 001-13664)). | |
| 10.4b* | Amendment No. 2 to The PMI Group, Inc. Officer Deferred Compensation Plan (incorporated by reference to exhibit 4.1 to the registrant’s Registration Statement on Form S-8, filed on December 2, 2005 (File No. 333-130103)). | |
| 10.5* | The PMI Group, Inc. 2005 Officer Deferred Compensation Plan (September 19, 2007 Restatement) (incorporated by reference to exhibit 10.1 to the registrant’s current report on Form 8-K, filed on September 25, 2007 (File No. 001-13664)). | |
| 10.5a* | Amendment No. 1, effective February 20, 2008, to The PMI Group, Inc. 2005 Officer Deferred Compensation Plan (September 19, 2007 Restatement) (incorporated by reference to exhibit 10.1 to the registrant’s current report on Form 8-K, filed on February 26, 2008 (File No. 001-13664)). | |
| 10.5b* | Amendment No. 2, effective November 19, 2008, to The PMI Group, Inc. 2005 Officer Deferred Compensation Plan (September 19, 2007 Restatement) (incorporated by reference to exhibit 10.1 to the registrant’s current report on Form 8-K, filed on November 25, 2008 (File No. 001-13664)). | |
| 10.6* | Form of Indemnification Agreement between The PMI Group, Inc. and certain of its officers and directors (incorporated by reference to exhibit 10.1 to the registrant’s quarterly report on Form 10-Q for the quarter ended June 30, 2008, filed on August 11, 2008 (File No. 001-13664)). | |
| 10.7* | Pre-2008 Form of Change of Control Employment Agreement (incorporated by reference to exhibit 10.4 to the registrant’s current report on Form 8-K, filed on November 25, 2008 (File No. 001-13664)). | |
| 10.8* | 2008 Form of Change of Control Employment Agreement (incorporated by reference to exhibit 10.5 to the registrant’s current report on Form 8-K, filed on November 25, 2008 (File No. 001-13664)). | |
| 10.8a* | Form of Amendment to 2008 Change of Control Employment Agreement (incorporated herein by reference to exhibit 10.8a to the registrant’s annual report on Form 10-K for the year ended December 31, 2008, filed on March 16, 2009 (File No. 001-13664)). | |
| 10.9* | Form of Stock Option Agreement for Employees (incorporated by reference to exhibit 10.24 to the registrant’s current report on Form 8-K, filed on February 23, 2005 (File No. 001-13664)). | |
| 10.9a* | Form of Amendment to Stock Option Agreement for Employees (incorporated by reference to exhibit 10.5 to the registrant’s quarterly report on Form 10-Q for the quarter ended June 30, 2005, filed on August 5, 2005 (File No. 001-13664)). | |
| 10.10* | Form of Stock Option Agreement for Directors (incorporated by reference to exhibit 10.26 to the registrant’s quarterly report on Form 10-Q for the quarter ended June 30, 2003, filed on August 14, 2003 (File No. 001-13664)). | |
| 10.11* | Form of Restricted Stock Agreement (incorporated by reference to exhibit 10.39 to the registrant’s current report on Form 8-K, filed on May 20, 2005 (File No. 001-13664)). | |
Table of Contents
| Exhibit |
Description of Exhibits | |
| 10.12* | Form of Performance Share Agreement (incorporated by reference to exhibit 10.37 to the registrant’s annual report on Form 10-K for the year ended December 31, 2003, filed on March 15, 2004 (File No. 001-13664)). | |
| 10.13a* | Form of Stock Unit Agreement for Non-Employee Directors (incorporated by reference to exhibit 10.39 to the registrant’s current report on Form 8-K, filed on October 15, 2004 (File No. 001-13664)). | |
| 10.13b* | Revised Form of Stock Unit Agreement for Non-Employee Directors, effective January 15, 2009 (incorporated herein by reference to exhibit 10.13b to the registrant’s annual report on Form 10-K for the year ended December 31, 2008, filed on March 16, 2009 (File No. 001-13664)). | |
| 10.14* | Form of Stock Unit Agreement for Employees (incorporated by reference to exhibit 10.35 to the registrant’s annual report on Form 10-K for the year ended December 31, 2007, filed on March 17, 2008 (File No. 001-13664)). | |
| 10.15* | Summary of Compensation Arrangements Applicable to The PMI Group, Inc. Non-Employee Directors, Effective May 21, 2009 (incorporated by reference to exhibit 10.7 to the registrant’s quarterly report on Form 10-Q for the quarter ended June 30, 2009, filed on August 10, 2009 (File No. 001-13664)). | |
| 10.16* | The PMI Group, Inc. Supplemental Employee Retirement Plan Effective April 1, 1995 (Amended and Restated as of September 1, 2007) (incorporated by reference to exhibit 10.4 to the registrant’s current report on Form 8-K, filed on September 25, 2007 (File No. 001-13664)). | |
| 10.16a* | Amendment No. 1, effective November 19, 2008, to The PMI Group, Inc. Supplemental Employee Retirement Plan (Amended and Restated as of September 1, 2007) (incorporated by reference to exhibit 10.3 to the registrant’s current report on Form 8-K, filed on November 25, 2008 (File No. 001-13664)). | |
| 10.17* | The PMI Group, Inc. Additional Benefits Plan (September 1, 2007 Restatement) (incorporated by reference to exhibit 10.5 to the registrant’s current report on Form 8-K, filed on September 25, 2007 (File No. 001-13664)). | |
| 10.17a* | Amendment No. 1, effective November 19, 2008, to The PMI Group, Inc. Additional Benefits Plan (September 1, 2007 Restatement) (incorporated by reference to exhibit 10.2 to the registrant’s current report on Form 8-K, filed on November 25, 2008 (File No. 001-13664)). | |
| 10.18* | The PMI Group, Inc. Bonus Incentive Plan (February 20, 2008 Amendment and Restatement) (incorporated by reference to exhibit 10.1 to the registrant’s current report on Form 8-K, filed on May 20, 2008 (File No. 001-13664)). | |
| 10.18a* | Amendment to The PMI Group, Inc. Bonus Incentive Plan dated February 25, 2009 ((incorporated by reference to exhibit 10.1 to the registrant’s current report on Form 8-K, filed on March 3, 2009 (File No. 001-13664)). | |
| 10.19* | The PMI Group, Inc. Retirement Plan (September 1, 2007 Restatement) (incorporated by reference to exhibit 10.7 to the registrant’s quarterly report on Form 10-Q for the quarter ended September 30, 2007, filed on November 7, 2007 (File No. 001-13664)). | |
| 10.19a* | Amendment No. 2 to The PMI Group, Inc. Retirement Plan (September 1, 2007 Restatement) (incorporated by reference to exhibit 10.1 to the Company’s current report on Form 8-K, filed on October 27, 2008 (File No. 001-13664)). | |
| 10.19b* | Amendment No. 3, effective November 19, 2008, to The PMI Group, Inc. Retirement Plan (September 1, 2007 Restatement) (incorporated herein by reference to exhibit 10.19b to the registrant’s annual report on Form 10-K for the year ended December 31, 2008, filed on March 16, 2009 (File No. 001-13664)). | |
| 10.20* | The PMI Group, Inc. Non-employee Director Phantom Stock Plan, effective January 15, 2009 (incorporated herein by reference to exhibit 10.20 to the registrant’s annual report on Form 10-K for the year ended December 31, 2008, filed on March 16, 2009 (File No. 001-13664)). | |
Table of Contents
| Exhibit |
Description of Exhibits | |
| 10.20a* | Form of Phantom Stock Agreement for Non-Employee Directors (incorporated herein by reference to exhibit 10.20a to the registrant’s annual report on Form 10-K for the year ended December 31, 2008, filed on March 16, 2009 (File No. 001-13664)). | |
| 10.21 | Form of 1984 Master Policy of PMI Mortgage Insurance Co. (incorporated by reference to exhibit 10.5 to the registrant’s Registration Statement on Form S-1 (No. 33-88542), filed on January 17, 1995). | |
| 10.22 | Form of 1994 Master Policy of PMI Mortgage Insurance Co. (incorporated by reference to exhibit 10.6 to the registrant’s Registration Statement on Form S-1 (No. 33-88542), filed on January 17, 1995). | |
| 10.23 | Amended CMG Shareholders Agreement, dated as of June 1, 2003, between CUNA Mutual Investment Corporation and PMI Mortgage Insurance Co. (incorporated by reference to exhibit 10.8 the registrant’s annual report on Form 10-K for the year ended December 31, 2003, filed on March 15, 2004 (File No. 001-13664)). | |
| 10.24 | Runoff Support Agreement, dated October 28, 1994, between Allstate Insurance Company, The PMI Group, Inc. and PMI Mortgage Insurance Co. (incorporated by reference to exhibit 10.8 to Amendment No. 1 to the registrant’s Registration Statement on Form S-1 (No. 33-88542), filed on March 2, 1995). | |
| 10.25 | Form of Tax Sharing Agreement among The PMI Group, Inc., The PMI Group, Inc.’s subsidiaries, The Allstate Corporation, Allstate Insurance Company and Sears, Roebuck and Co. (incorporated by reference to exhibit 10.17 to Amendment No. 1 to the registrant’s Registration Statement on Form S-1 (No. 33-88542), filed on March 2, 1995). | |
| 10.26 | The Guarantee Agreement, dated February 4, 1997, between The PMI Group, Inc. (as Guarantor) and The Bank of New York (as Trustee) (incorporated by reference to exhibit 10.29 to the registrant’s annual report on Form 10-K for the year ended December 31, 1996, filed on March 31, 1997 (File No. 001-13664)). | |
| 10.27 | Amended and Restated Trust Agreement, dated as of February 4, 1997, among The PMI Group, Inc., as Depositor, The Bank of New York, as Property Trustee, and The Bank of New York (Delaware), as Delaware Trustee (incorporated by reference to exhibit 10.30 to the registrant’s annual report on Form 10-K for the year ended December 31, 1996, filed on March 31, 1997 (File No. 001-13664)). | |
| 10.28 | Stockholders’ Agreement, dated as of August 3, 2003, among Falcons Acquisition Corp., The PMI Group, Inc., Blackstone Capital Partners IV L.P., Blackstone Capital Partners IV-A L.P. and Blackstone Family Investment Partnership IV-A L.P., Cypress Merchant Banking Partners II L.P., Cypress Merchant Banking II C.V., Cypress Side-by-Side LLC, 55th Street Partners II L.P., CIVC/FGIC Investment Company LLC, CIVC Partners Fund III, L.P., CIVC Partners Fund IIIA, L.P., and the management investors listed therein and any other management investors who subsequently become a party to the agreement (“Stockholders’ Agreement”) (incorporated by reference to exhibit 99.1 to the registrant’s current report on Form 8-K, filed on August 6, 2003 (File No. 001-13664)). | |
| 10.28a | First Amendment to Stockholders’ Agreement, dated as of December 18, 2003 (incorporated by reference to exhibit 10.26a to the registrant’s annual report on Form 10-K for the year ended December 31, 2004, filed on March 11, 2005 (File No. 001-13664)). | |
| 10.28b | Second Amendment to Stockholders’ Agreement, dated as of February 24, 2004 (incorporated by reference to exhibit 10.26b to the registrant’s annual report on Form 10-K for the year ended December 31, 2004, filed on March 11, 2005 (File No. 001-13664)). | |
| 10.28c | Third Amendment to Stockholders’ Agreement, dated as of July 14, 2004 (incorporated by reference to exhibit 10.26c to the registrant’s annual report on Form 10-K for the year ended December 31, 2004, filed on March 11, 2005 (File No. 001-13664)). | |
Table of Contents
| Exhibit |
Description of Exhibits | |
| 10.28d | Fourth Amendment to Stockholders’ Agreement, dated as of October 25, 2005 (incorporated by reference to exhibit 10.26d to the registrant’s annual report on Form 10-K for the year ended December 31, 2005, filed on March 14, 2006 (File No. 001-13664)). | |
| 10.28e | Fifth Amendment to Stockholders’ Agreement, dated as of January 31, 2006 (incorporated by reference to exhibit 10.26e to the registrant’s annual report on Form 10-K for the year ended December 31, 2005, filed on March 14, 2006 (File No. 001-13664)). | |
| 10.29 | Equity Commitment Letter, dated as of August 3, 2003, signed by The PMI Group, Inc, Falcons Acquisition Corp., FGIC Holdings, Inc. and General Electric Capital Corporation (incorporated by reference to exhibit 99.2 to the registrant’s current report on Form 8-K, filed on August 6, 2003 (File No. 001-13664)). | |
| 10.30 | Form of Note (included in Exhibit 4.5). | |
| 10.31 | Form of 6.000% Senior Note due 2016 (incorporated by reference to exhibit 10.2 to the registrant’s quarterly report on Form 10-Q for the quarter ended September 30, 2006, filed on November 7, 2006 (File No. 001-13664)). | |
| 10.30 | Form of 6.25% Senior Note due 2036 (incorporated by reference to exhibit 10.3 to the registrant’s quarterly report on Form 10-Q for the quarter ended September 30, 2006, filed on November 7, 2006 (File No. 001-13664)). | |
| 10.33 | Amendment Agreement No. 6, effective May 8, 2009, to the Revolving Credit Agreement dated as of October 24, 2006, among The PMI Group, Inc., as Borrower, Bank of America, N.A., as Administrative Agent, and the Lenders Party thereto, as amended, and the Amended and Restated Revolving Credit Agreement attached thereto as Annex I, which became effective May 29, 2009 (incorporated by reference to Exhibit 10.3 to the Company’s Quarterly Report on Form 10-Q for the quarter ended March 31, 2009 filed on May 11, 2009 (File No. 001-13664)). | |
| 10.33a | Amendment Agreement No. 1, dated as of November 9, 2009, to the Amended and Restated Revolving Credit Agreement, dated as of May 29, 2009, among the Company, the lenders referred to therein and Bank of America, N.A., as Administrative Agent (“Administrative Agent”) and Amendment Agreement No. 1, dated as of November 9, 2009, to the Bank Facility Pledge Agreement, dated as of September 29, 2008, between the Company and the Administrative Agent (incorporated by reference to Exhibit 10.1 to the registrant’s Current Report on Form 8-K filed on November 12, 2009 (File No. 001-13664)). | |
| 10.34 | Share Sale Agreement by and among PMI Mortgage Insurance Co., QBE Holdings (AAP) Pty Limited and QBE Insurance Group Limited, dated as of August 14, 2008 (incorporated by reference to exhibit 10.1 to the Company’s current report on Form 8-K, filed August 15, 2008 (file number 001-13664)). | |
| 10.34a | Amendment Agreement by and among PMI Mortgage Insurance Co., QBE Holdings (AAP) Pty Limited and QBE Insurance Group Limited, dated as of August 29, 2008 (incorporated by reference to exhibit 10.2 to the Company’s current report on Form 8-K, filed September 2, 2008 (File No. 001-13664)). | |
| 10.34b | Second Amendment Agreement by and among PMI Mortgage Insurance Co., QBE Holdings (AAP) Pty Limited and QBE Insurance Group Limited, dated as of October 22, 2008 (incorporated by reference to exhibit 2.3 to the Company’s current report on Form 8-K, filed October 28, 2008 (File No. 001-13664)). | |
| 10.34c | Third Amendment Agreement by and among PMI Mortgage Insurance Co., QBE Holdings (AAP) Pty Limited and QBE Insurance Group Limited, dated as of December 17, 2008 (incorporated by reference to exhibit 2.2 to the registrant’s current report on Form 8-K, filed on December 22, 2008 (File No. 001-13664)). | |
| 10.35 | Share Sale Deed by and among The PMI Group, Inc., QBE Holdings (AAP) Pty Limited and QBE Insurance Group Limited, dated as of August 29, 2008 (incorporated by reference to exhibit 10.1 to the Company’s current report on Form 8-K, filed September 2, 2008 (File No. 001-13664)). | |
Table of Contents
| Exhibit |
Description of Exhibits | |
| 10.36 | Note Deed, dated as of October 22, 2008, between PMI Mortgage Insurance Co. and QBE Insurance Group Limited (incorporated by reference to exhibit 10.1 to the Company’s current report on Form 8-K, filed October 28, 2008 (File No. 001-13664)). | |
| 10.37 | Agreement dated as of June 10, 2008 by and among PMI Guaranty Co., Financial Guaranty Insurance Company and Assured Guaranty Re LTD (incorporated by reference to exhibit 10.2 to the registrant’s quarterly report on Form 10-Q for the quarter ended June 30, 2008, filed on August 11, 2008 (File No. 001-13664)). | |
| 10.38 | Share Sale Deed by and among The PMI Group, Inc., QBE Lenders’ Mortgage Insurance Limited and QBE Insurance Group Limited, dated as of December 17, 2008 (incorporated by reference to exhibit 2.1 to the registrant’s current report on Form 8-K, filed on December 22, 2008 (File No. 001-13664)). | |
| 10.39 | Termination Deed by and among The PMI Group, Inc., QBE Holdings (AAP) Pty Limited and QBE Insurance Group Limited, dated as of December 17, 2008 (incorporated by reference to exhibit 10.1 to the registrant’s current report on Form 8-K, filed on December 22, 2008 (File No. 001-13664)). | |
| 10.40 | Amending Deed by and among PMI Mortgage Insurance Co. and QBE Insurance Group Limited, dated as of December 17, 2008 (incorporated by reference to exhibit 10.2 to the registrant’s current report on Form 8-K, filed on December 22, 2008 (File No. 001-13664)). | |
| 10.41 | Letter Agreement dated February 12, 2010 by and among The PMI Group, Inc., PMI Mortgage Insurance Co., PMI Mortgage Assurance Co., and Federal National Mortgage Association (incorporated herein by reference to exhibit 99.1 to the registrant’s current report on Form 8-K, filed on February 16, 2010 (File No. 001-13664)). | |
| 11.1 | Statement re: Computation of Net Income Per Share. | |
| 12.1 | Statement re: Computation of Ratio of Earnings to Fixed Charges. | |
| 21.1 | Subsidiaries of the Registrant. | |
| 23.1 | Consents of Ernst & Young LLP. | |
| 31.1 | Certificate of Chief Executive Officer. | |
| 31.2 | Certificate of Chief Financial Officer. | |
| 32.1 | Certificate of Chief Executive Officer. | |
| 32.2 | Certificate of Chief Financial Officer. | |
| * | Management or director contract or compensatory plan or arrangement. |