Attached files
Table of Contents
UNITED STATES
SECURITIES AND EXCHANGE COMMISSION
Washington, D.C. 20549
FORM 10-K
| þ | ANNUAL REPORT PURSUANT TO SECTION 13 OR 15(d) OF THE SECURITIES EXCHANGE ACT OF 1934 |
For the fiscal year ended December 31, 2009
| ¨ | TRANSITION REPORT PURSUANT TO SECTION 13 OR 15(d) OF THE SECURITIES EXCHANGE ACT OF 1934 |
For the transition period from to
Commission File Number 001-33612
MONOTYPE IMAGING HOLDINGS INC.
(Exact name of registrant as specified in its charter)
| Delaware | 20-3289482 | |
| (State of incorporation) | (I.R.S. Employer Identification No.) | |
| 500 Unicorn Park Drive Woburn, Massachusetts |
01801 | |
| (Address of principal executive offices) | (Zip Code) | |
Registrant’s telephone number, including area code: (781) 970-6000
(Former Name, Former Address and Former Fiscal year, if changed since last report)
Securities Registered Pursuant to Section 12(b) of the Act:
| Title of Each Class |
Name of Exchange on Which Registered | |
| Common Stock, $0.001 par value | The NASDAQ Stock Market LLC |
Securities Registered Pursuant to Section 12(g) of the Act:
None
Indicate by check mark if the registrant is a well-known seasoned issuer, as defined in Rule 405 of the Securities Act. Yes ¨ No þ
Indicate by check mark if the registrant is not required to file reports pursuant to Section 13 or 15(d) of the Act. Yes ¨ No þ
Indicate by check mark whether the registrant (1) has filed all reports required to be filed by Section 13 or 15(d) of the Securities Exchange Act of 1934 during the preceding 12 months (or such shorter period that the registrant was required to file such reports), and (2) has been subject to such filing requirements for the past 90 days. Yes þ No ¨
Indicate by check mark whether the registrant has submitted electronically and posted on its corporate Web site, if any, every Interactive Data File required to be submitted and posted pursuant to Rule 405 of Regulation S-T (§232.405 of this chapter) during the preceding 12 months (or for such shorter period that the registrant was required to submit and post such files). Yes ¨ No ¨
Indicate by check mark if disclosure of delinquent filers pursuant to Item 405 of Regulation S-K is not contained herein, and will not be contained, to the best of registrant’s knowledge, in definitive proxy or information statements incorporated by reference in Part III of this Form 10-K or any amendment to this Form 10-K. ¨
Indicate by check mark whether the registrant is a large accelerated filer, an accelerated filer, a non-accelerated filer, or a smaller reporting company. See the definitions of “large accelerated filer,” “accelerated filer” and “smaller reporting company” in Rule 12b-2 of the Exchange Act. (Check one):
Large accelerated filer ¨ Accelerated filer þ Non-accelerated filer ¨ Smaller reporting company ¨
Indicate by check mark whether the registrant is a shell company (as defined in Rule 12b-2 of the Act). Yes ¨ No þ
The aggregate market value of the registrant’s common stock held by non-affiliates of the registrant, computed by reference to the last reported sale price of the common stock as reported on the NASDAQ Global Select Market on June 30, 2009 was approximately $90,844,487 (assumes officers, directors, and all shareholders beneficially owning 5% or more of the outstanding common shares are affiliates).
The number of shares outstanding of the registrant’s common stock as of February 22, 2010 was approximately 34,726,710.
DOCUMENTS INCORPORATED BY REFERENCE.
Portions of the registrant’s definitive Proxy Statement to be filed with the Securities and Exchange Commission pursuant to Regulation 14A in connection with the 2010 Annual Meeting of Stockholders are incorporated herein by reference into Part III of this report.
Table of Contents
MONOTYPE IMAGING HOLDINGS INC.
As used in this report, the terms “we,” “us,” “our,” “Monotype Imaging” and the “Company” mean Monotype Imaging Holdings Inc. and its subsidiaries, unless the context indicates another meaning.
Unless otherwise noted, all dollar amounts in this report are expressed in United States dollars.
We own, have rights to, or have applied for the trademarks and trade names that we use in conjunction with our business, including our name and logo. All other trademarks and trade names appearing in this report are the property of their respective holders.
Table of Contents
PART I
| Item 1. | Business |
Certain statements in this Annual Report on Form 10-K are “forward-looking statements” within the meaning of Section 27A of the Securities Act of 1933, as amended (the “Securities Act”), and Section 21E of the Securities Exchange Act of 1934, as amended (the “Exchange Act”). These statements involve a number of risks, uncertainties and other factors that could cause our actual results, performance or achievements to be materially different from any future results, performance or achievements expressed or implied by these forward-looking statements. Factors which could materially affect such forward-looking statements can be found in the section entitled “Risk Factors” in Part 1, Item 1A in this Annual Report on Form 10-K. Investors are urged to consider these factors carefully in evaluating the forward-looking statements and are cautioned not to place undue reliance on such forward-looking statements. The forward-looking statements made herein are only made as of the date hereof and we will undertake no obligation to publicly update such forward-looking statements to reflect subsequent events or circumstances.
Overview
Monotype Imaging Holdings Inc. is a leading global provider of text imaging solutions. Our end-user and embedded solutions for print, web and mobile environments enable people to create and consume dynamic content on any and every device. Our technologies and fonts enable the display and printing of high quality digital content. Our software technologies have been widely deployed across, and embedded in a range of consumer electronics, or CE devices, including laser printers, digital copiers, mobile phones, digital televisions, set-top boxes, navigation devices and digital cameras, as well as in numerous software applications and operating systems. In the laser printer market, we have worked together with industry leaders for over 18 years to provide critical components embedded in printing standards. Our scaling, compression, text layout, printer driver and color technologies solve critical text imaging issues for CE device manufacturers by rendering high quality text on low resolution and memory constrained CE devices. We combine these proprietary technologies with access to more than 13,000 typefaces from a library of some of the most widely used designs in the world, including popular names such as Helvetica and Times New Roman. We also license our typefaces to creative and business professionals through our e-commerce websites fonts.com, linotype.com, itcfonts.com, faces.co.uk and fontexplorerx.com, which combined attracted more than 27 million visits in 2009 from over 200 countries and territories, direct and indirect sales and custom font design services. Our principal office is located in Woburn, Massachusetts; with regional offices in Redwood City, California; Boulder, Colorado; Mt. Prospect, Illinois; Salfords and Hampshire, United Kingdom; Bad Homburg, Germany (Linotype GmbH); Hong Kong, China (Monotype Imaging Hong Kong Ltd., formerly China Type Design); Seoul, South Korea; and Tokyo, Japan.
Until November 5, 2004, Agfa Corporation, or Agfa, operated its font and printer driver business through its wholly-owned subsidiary, Agfa Monotype Corporation, or Agfa Monotype. On November 5, 2004, through a series of transactions, all of the common stock of Agfa Monotype was acquired by a newly formed entity, Monotype Imaging Inc., which was wholly owned by TA Associates, Inc., debt investors and certain of the former officers and employees of Agfa Monotype through a holding company, Imaging Holdings Corp., or IHC. In August 2005, IHC entered into a recapitalization transaction which resulted in it becoming wholly owned by Monotype Imaging Holdings Inc., the registrant and a Delaware corporation.
In 2006, we completed two acquisitions. On July 28, 2006, the Company acquired 80.01% of the capital stock of China Type Design Ltd., or China Type Design, a Hong Kong corporation, specializing in font design. At the time of the acquisition, we already had a 19.99% ownership interest in China Type Design; and, following the acquisition, it became our wholly owned subsidiary. With the China Type Design acquisition, we acquired a library of East Asian stroke-based fonts and gained the internal capability to develop and produce these fonts. On August 1, 2006, the Company acquired Linotype
1
Table of Contents
GmbH, or Linotype, a German company and a leader in the development, marketing, licensing and servicing of digital fonts and proprietor of a font library comprised of typefaces. We also acquired certain fonts and other intellectual property assets from the seller of Linotype. With the purchase of Linotype, we acquired access to a large library of fonts, a strong brand with a significant web presence and a more complete offering for the creative professional market.
On July 30, 2007, we completed an initial public offering, issuing 6.5 million shares of our common stock at a price of $12.00 per share. We received net proceeds from the offering of approximately $67.2 million and used the proceeds, along with cash on hand, to restructure and pay down a portion of our debt. In June 2008, we completed a secondary offering of our common stock under a contractual agreement with a shareholder. We did not receive any proceeds from the secondary offering, as we did not issue any new shares of common stock in connection with the transaction.
On December 10, 2009, we acquired the principal assets of Planetweb, Inc., a global provider of embedded user interface, or UI, software and developer tools for the consumer electronics industry, located in Redwood Shores, California, for $1.9 million.
Industry Overview and Market Opportunity
Our customers are seeking text imaging solutions and related display technologies that are comprehensive, powerful and easy to use. Our OEM and creative professional offerings address the needs of three types of customers: CE device manufacturers, including laser printer manufacturers, independent software vendors and content creators. These customers use our products to enhance the creation, display, distribution and consumption of digital and print content.
| • | CE Device Manufacturers |
CE devices are marketed globally and increasingly require robust multi-media functionality, as consumers create rich digital content and/or acquire such content from service providers, over the Internet, as packaged media and from other users. CE device manufacturers must display multi-media content, including text, from these different sources, while being expected to provide a consistent look-and-feel across global CE devices, support worldwide languages and in some cases provide enhanced navigation and personalization. As technologies enable media to move seamlessly from one CE device to another, scalable text imaging technologies, including multilingual type, and related display solutions that are optimized for these CE devices become critical. For example, PC-like rich media functionality is moving to the mobile phone platform, driving the adoption of robust scalable text. Digital televisions are incorporating scalable text for navigation and connectivity, and domestic appliance manufacturers are adding control panels with enhanced graphical user interfaces to improve the user experience and to provide consumers with additional control over functionality. In addition, electronic publishing and the growth in e-book readers is expanding the industry’s need for robust, global text-display solutions. Our solutions are compatible with most major operating environments as well as those developed directly by CE device manufacturers.
The market for laser printers and digital copiers is generally more mature than the rest of the CE device market. As a result, the lower end of the market is becoming more commoditized. Laser printer manufacturers are responding by increasing the functionality of their products with advances such as a larger number of embedded fonts and color output, scanning and copying capabilities and enhanced control panel capabilities. This increased functionality is in turn driving the advancement of the printer industry, particularly the laser printer industry, which accounts for a significant portion of the printer market. Thus increased reliance by laser printer manufacturers on enhancing technologies to drive value, together with advancing capabilities and functionality of multimedia CE devices, favor comprehensive global text imaging solutions and related display technologies.
2
Table of Contents
| • | Independent Software Vendors |
Similar to CE devices, software solutions are marketed globally. For example, independent software vendors require multilingual text solutions for product user interfaces. In addition, some software vendors seek to customize their offerings with fonts specific to their solutions. Others, including games manufacturers, require multiple, distinctive fonts to employ a unique look-and-feel within their applications.
Independent software vendors are distributing their solutions through multiple channels (including traditional CD-based distribution models as well as software-as-a-service distribution through cloud-based computing distribution models) and to multiple devices (including PCs, mobile phones and other CE devices). As a result, software vendors require font technologies that allow their solutions to maintain a consistent user experience regardless of distribution channel or device.
| • | Content Creators |
Content creators include creative professionals (such as graphic designers, advertisers, printers, publishers and bloggers) and non-professional creators of content (such as home users and other amateur writers, designers, bloggers and publishers.) Both types of content creators produce electronic and /or printed material for distribution, and they seek creative ways to convey meaning and to differentiate identity. Fonts are an important tool for this differentiation. For example, creative and business professionals at multinational corporations are increasingly tasked with creating solutions that extend branding and marketing communications into new markets around the world. Creative and business professionals historically acquired fonts primarily from local or regional distributors or dealers. However, online font vendors have become the preferred channel due to their larger selection of typefaces, greater ease of use, and the ability to easily access font libraries from anywhere. In addition, as more content is distributed electronically, content creators are seeking the same creative flexibility for digital documents as for printed documents. Historically, font options for web-based displays (such as websites, blogs and online applications) were limited to a standard set of ten fonts that were common to all operating systems. Web font services offerings provide creators of online content with a more extensive pallet of fonts from which to work. Web fonts are independent of a consumer’s operating system and travel with the content to a user’s device for consistent viewing regardless of the environment.
Our Products
We develop end-user and embedded text imaging solutions and services that enable the display and printing of high quality text in all of the world’s major languages and include the following:
| • | Font Scaling, Compression and Rasterizing Technologies |
| • | Our iType font scaling engine renders high quality display of text in every major language and in any size on memory constrained CE devices, including, but not limited to, mobile phones, video game consoles, set-top boxes and digital cameras, and is fully compatible with the industry-standard TrueType and OpenType font formats, as well as our proprietary format for stroke-based East Asian fonts. |
| • | Our iType Connects product simplifies the process of integrating iType by providing a pre-integrated solution for common CE development environments. |
| • | Our primary laser printer imaging products are our font scaling engine, UFST (Universal Font Scaling Technology), and a patented font compression technology, MicroType. Our font scaling engine and font compression technologies are compatible with virtually all font |
3
Table of Contents
| formats and CE device manufacturers’ standards, including PostScript and Printer Command Language, or PCL. We currently license these products to 52 laser printer manufacturers worldwide. |
| • | Our Asian Compression for TrueType, or ACT, technology reduces the memory needed for font data storage. ACT allows portions of font data to be decompressed on demand—enabling space saving benefits without paying performance penalties. |
| • | Our SmartHint East Asian fonts use a simple stroke-based format that requires much less memory than regular TrueType fonts. SmartHint fonts are targeted to CE devices with small displays, such as digital cameras. |
| • | Our Edge Technology enables the ability to render East Asian TrueType fonts in a small memory footprint without sacrificing a high degree of typographic style, even at small text sizes. |
| • | Text Layout Engines |
| • | Our WorldType Layout Engine enables CE devices to accurately display multilingual text, including text composed in complex writing systems such as Indic, Arabic and Hebrew scripts. |
| • | Printer Driver and Imaging Tools |
| • | Our printer driver kits enable printer manufacturers to create customized laser printer drivers that allow applications to print as intended. |
| • | Our ColorSet imaging tools give printer manufacturers control over high-quality color reproduction while reducing development time. |
| • | Font Products and Services |
| • | Our collection of more than 13,000 typefaces includes fonts that we own and fonts licensed from third parties. |
| • | Our Monotype, Linotype and ITC typeface libraries include some of the world’s most widely used designs, such as the Times New Roman, Helvetica and ITC Franklin Gothic typefaces. |
| • | We have strong relationships with a broad network of highly talented font designers. |
| • | Our e-commerce websites fonts.com, itcfonts.com, linotype.com, faces.co.uk and fontexplorerx.com offer more than 160,000 high quality font products. |
| • | We offer custom font design services for corporate branding and identity purposes. |
| • | Our core sets of fonts consist of the PCL 6 and PostScript 3 font collections. These fonts are designed for compatibility with Hewlett Packard, or HP, and Adobe Systems Incorporated, or Adobe, font specifications. |
| • | Our FlipFont application, which supports multiple mobile applications, enables the use of fonts for a personalized user experience. For example, our FlipFont application enables mobile phone users to change their phone UI font with mobile-optimized fonts chosen from a selection available from an online resource. |
| • | Font Management Technologies |
| • | Our Fontwise product is a comprehensive font license management solution that allows creative and business professionals to audit, manage and purchase font licenses. |
| • | Our FontExplorer X font management software provides powerful, flexible and easy-to-use capabilities for managing and accessing fonts. FontExplorer X also provides a simple method to license additional fonts. |
4
Table of Contents
| • | UI Technologies |
| • | Our SpectraWorks graphical user interface development suite is a hardware and operating system independent set of tools for developing embedded graphical user interfaces quickly and inexpensively. |
Competitive Strengths
Our text imaging solutions and services provide critical technologies and fonts for users that require the ability to display or print high quality digital text. Our core strengths include:
Established Relationships with Market Leaders. We benefit from established relationships with our OEM customers, many of which date back 18 years or more. We work collaboratively with them and obtain insight into their product roadmaps and future requirements. Our OEM customers include many of the largest and most successful companies in each of the markets that we serve. In the mobile phone and CE device space, we provide technologies to market leaders Nokia, Motorola and Sony Ericsson. In the laser printer market our customers include eight of the top ten laser printer manufacturers based on the volume of units shipped worldwide. Our operating system and application partners include Microsoft, Apple, QUALCOMM and Symbian. Because our technologies and fonts are embedded in the hardware of our customers’ CE devices, it would be costly and time-consuming for customers to replace these solutions.
Technological and Intellectual Property Leadership. We are a leading global provider of text imaging solutions for laser printers. We have achieved this leadership position by combining our proprietary technologies with an extensive font library that includes many of the world’s most popular typefaces. We are leveraging our intellectual property and experience in this market to secure a leading position in other high volume CE device categories. For example, we currently ship our text imaging solutions on mobile phones manufactured by many of the top largest manufacturers of mobile phones. We have also established footholds in emerging CE device categories, such as digital televisions, set-top boxes, personal navigation devices and digital cameras.
International Presence and Technologies Designed to Serve the Global Market. In 2009 and in 2008, 66.4% and 67.5% of our revenue, respectively, was derived from sales by our operating subsidiaries located in the United Kingdom, Germany, China and Japan. Our customers are located in Asia, North America, Europe and other parts of the world. Our technologies and font IP are crucial to our OEM customers who manufacture high volume CE devices that have multimedia functionality and multinational distribution. We support all of the world’s major languages and we have specifically designed scalable font rendering technologies for displaying rich content in Asian and other non-Latin languages. We enable OEM customers to engineer a common platform supporting multiple languages, reducing costs and time-to-market and increasing product flexibility. This is critical to manufacturers of high volume CE devices that have multimedia functionality and multinational distribution. Increasingly, the center of design, manufacturing and consumption of CE devices is in China, Japan and Korea. We have over 18 years of experience partnering with Asian companies such as Ricoh, Toshiba and Kyocera Mita. Additionally, through our acquisition of China Type Design, we have expanded our text imaging solutions portfolio and our international presence. In 2009, we opened a sales office in Seoul, South Korea which will further expand our presence in Asia.
Strong Web Presence and Font Design Services. We have built an extensive customer base of creative and business professionals to whom we license fonts. Our flagship website with the intuitive domain name, fonts.com, along with our other e-commerce websites, including the European site, linotype.com, provide us with a substantial web presence offering more than 160,000 font products. We have also provided custom font design and branding services to many multinational corporations.
5
Table of Contents
Attractive Business Model. We have a significant, recurring base of licensing revenues that is based, in part, on multi-year financial commitments by our OEM customers. In addition, our revenues are highly visible because of our established relationships with OEM customers and due to quarterly royalty reports we receive from those customers. As a technology licensing business, we generate significant cash flows from incremental OEM revenue. We have a relatively low cash tax rate which increases our cash flows. We have low capital requirements, which drive high returns on invested capital.
Experienced Leadership and Employee Base. Our senior management has an average of 19 years of experience in the text imaging or software solutions businesses. Douglas J. Shaw, our President, Chief Executive Officer and Director, has presided over the successful introduction of our text imaging solutions in each of our served markets for over 28 years. Our Chief Financial Officer, Scott E. Landers, has 13 years of public company experience which includes experience in the software solutions business. John L. Seguin, our Executive Vice President, is a long-time veteran of companies that supply technologies to the CE device industry. Many of the members of our sales, engineering and support staff have been with us since we began serving OEMs and creative and business professionals. As a result, there is significant continuity between our team and our key customers.
Our Strategy
Our objective is to extend our position as a leading global provider of text imaging solutions and related display technologies. We intend to:
Increase Penetration of our Technologies and Fonts into Emerging CE Device Categories. Our technologies and fonts are increasingly vital to the mass-market success of certain high growth CE device categories such as digital televisions, set-top boxes, personal navigation devices and digital cameras. We have an established base of customers in these CE device categories, and we intend to increase our targeted sales and support activities to add new customers and increase the number of platforms, products, models, applications and systems in which our technologies and fonts are embedded. For example, our Edge technology, which enables the clear display of East Asian text using stylistic fonts, addresses the inherent challenges these new CE devices present, such as memory constraints and low resolution screens. Edge-enhanced fonts provide a new level of memory efficiency and display quality at small text sizes. We intend to market our text imaging solutions for inclusion in emerging CE device categories with sophisticated display imaging needs such as e-book readers. In addition, we intend to extend our reach into new products, customers and models by continuing to expand our integration into leading industry platforms while increasing our partnerships with leading independent software vendors.
Extend our Leadership Position with Enhanced Technologies in the Laser Printer Market. While the laser printer market has been growing at a slower pace than the market for other CE devices, prior to the recent worldwide economic downturn, we historically sustained consistent growth by anticipating and rapidly adapting to changes in this market. For example, we tailored our products to support PCL and PostScript. We support XPS and the increased font offering that is part of Microsoft Windows Vista and Windows 7 operating systems. As laser printers evolved from analog and monochrome to digital and color printers and, more recently, to multi-function peripherals, we also enhanced our existing compression technologies and imaging tools to maintain the high quality rendering of printed text in these new CE devices. We also introduced new products such as our printer driver kits and color tools to address the increasing demand for customized driver applications. Going forward, we intend to expand our offering to provide additional technologies to the laser printer market. We intend to leverage our extensive experience in this market and our long-standing relationships with laser printer manufacturers to maintain our leadership position in the laser printer market.
Leverage our Installed Base of Leading OEM Customers by Providing New Technologies and Fonts. Our customers include many of the largest manufacturers in the CE device markets as well as independent software vendors, and we continually seek to develop new technologies and fonts to serve these
6
Table of Contents
customers. For example, our Edge Technology, which enables the clear display of text on memory-constrained devices using stylistic fonts, addresses the challenges our OEM customers face. Our recent acquisition of Planetweb provides our OEM customers a powerful user interface development solution that can be integrated with our font rendering technology. By providing additional technologies and fonts, we seek to leverage our core relationships to increase the value we offer to our OEM customers and to expand our presence within our existing customer base. Such technologies include worldwide language support products for laser printers and new products and technologies for multi-function and color printers.
Expand and Deepen our Global Presence, Particularly in Asia. We intend to drive our revenue growth by leveraging our knowledge of global markets and our global operations. We believe that economic growth in Asia will further the demand for Asian text imaging solutions and related display solutions. Through organic expansion and acquisitions, we are increasing our ability to service CE device manufacturers and content creators throughout the world. We intend to focus on the Japanese, Chinese and Korean language markets for laser printers, digital copiers and other CE devices. Significant growth opportunities exist in these markets due to our limited penetration to date.
Continue to Develop our Online Offerings and Services. We have a strong online presence with our websites fonts.com, linotype.com, itcfonts.com, faces.co.uk and fontexplorerx.com. Together these websites attracted more than 27 million visits in 2009 from over 200 countries and territories. Opportunities exist to increase our revenue per visitor by continuing to offer innovative solutions, as well as to benefit from growth in web traffic. For example, FontExplorer X Pro is available for sale through fontexplorerx.com, and our FlipFont application and suite of fonts is available online through supported phones. FlipFont enables users to personalize their mobile phone with fonts. Additionally, new distribution models for fonts, especially for web-based uses of fonts, provide new opportunities for growth.
Selectively Pursue Complementary Acquisitions, Strategic Partnerships and Third-Party Intellectual Property. We intend to continue to pursue selected acquisitions, strategic partnerships and third-party intellectual property to accelerate our time to market with complementary text imaging solutions, penetrate new geographies and enhance our intellectual property portfolio. We believe that the market for text imaging solutions and related display technologies is still fragmented. We have a demonstrated track record of identifying, acquiring and integrating companies that enhance our intellectual property portfolio. In December, we acquired the principal assets of Planetweb, Inc., a global provider of embedded UI software and developer tools for the consumer electronics industry.
Our Customers
Our technologies and services are sold to customers in two principal markets: OEM and creative professional. The OEM market consists of both CE device manufacturers and independent software vendors. Our creative professional customers include purchasers of font end-user licenses, a large proportion of which are large publishing firms, corporations, graphic designers and advertising agencies. In 2009, 2008 and 2007 our revenue in these two markets was as follows (in thousands):
| 2009 | 2008 | 2007 | ||||||||||||||||
| Principal Markets |
Revenue | Percentage of Total Revenue |
Revenue | Percentage of Total Revenue |
Revenue | Percentage of Total Revenue |
||||||||||||
| OEM |
$ | 68,967 | 73 | % | $ | 77,810 | 70 | % | $ | 72,612 | 69 | % | ||||||
| Creative professional |
25,038 | 27 | % | 33,051 | 30 | % | 32,540 | 31 | % | |||||||||
| Total |
$ | 94,005 | 100 | % | $ | 110,861 | 100 | % | $ | 105,152 | 100 | % | ||||||
Our text imaging solutions are embedded in a broad range of CE devices and are compatible with most major operating environments and those developed by CE device manufacturers. We partner with
7
Table of Contents
operating system and software application vendors Microsoft, Apple, Symbian, Qualcomm and ACCESS and have made our patented iType scalable font engine available as a plug-in for open source Linux environments. Additionally, we are an active participant in the development of industry standards, such as the XML Paper Specification with the European Computer Manufacturer’s Association and the use of web fonts with the World Wide Web Consortium.
Our customers are among the world’s leading CE device manufacturers and creative and business professionals, including:
| • | many of the top mobile phone manufacturers including Nokia, Motorola, Sony Ericsson and ZTE; |
| • | eight of the top ten laser printer manufacturers based on the volume of units shipped worldwide; |
| • | digital television and set-top box manufacturers including TTE Technology, Toshiba and JVC; |
| • | digital camera manufacturers; |
| • | major home appliance manufacturers; and |
| • | other multinational corporations and automotive and financial corporations such as Agilent, British Airways and Barclays. |
In 2009, 2008 and 2007, our top ten licensees by revenue accounted for approximately 47.1%, 46.3% and 46.6% of our total revenue, respectively. In 2009, 2008 and 2007, no one customer accounted for more than 10% of our total revenue.
Sales and Marketing
Our OEM sales efforts are focused on large CE device manufacturers and independent software vendors with whom we seek to establish long-term relationships. Our creative and business professional sales representatives directly target prospective corporate clients and specialty dealers to whom we may provide our fonts and custom font design services. Our e-commerce websites, fonts.com, linotype.com, itcfonts.com, faces.co.uk and fontexplorerx.com, offer the ability to preview, license and download thousands of fonts from our Monotype, Linotype and ITC collections, as well as typefaces from hundreds of foundries across the globe.
Our marketing organization works to deliver a consistent message detailing our capabilities and to develop new avenues for presenting our text imaging solutions. Our marketing efforts are principally focused on promoting our websites fonts.com, itcfonts.com, linotype.com, faces.co.uk and fontexplorerx.com through affiliate programs, search engine optimization and e-mail marketing which drive traffic to our websites. Once at our websites, creative and business professionals can find recent typographic news, read typeface designer profiles and access a wealth of educational content, in addition to a selection of more than 160,000 font products.
We promote our text imaging solutions through a combination of newsletters, web content, social media, brochures, print advertising and attendance at conferences and trade shows. Our e-mail marketing communications, directed to a registered user base that has opted to receive our e-mails, include font-related articles, company news and product offerings. We also maintain our corporate website at monotypeimaging.com, which focuses on promoting our offerings for our OEM customers.
Research and Development
We have a strong commitment to research and development for core technology programs directed at creating new products, product enhancements and new applications for existing products, as well as funding research into future market opportunities. Each of the markets we serve is generally characterized by rapid technological change and product innovation. We believe that continued timely
8
Table of Contents
development of new products and product enhancements to serve existing and new markets is necessary to remain competitive. Our research and development operations are located in Woburn, Massachusetts; Redwood City, California; Boulder, Colorado; Salfords, United Kingdom; Bad Homburg, Germany and Hong Kong, China.
In 2009, 2008 and 2007, we incurred research and development expenses of $14.1 million, or 15.0% of sales, $14.9 million, or 13.4% of sales, and $18.8 million, or 17.9% of sales, respectively. Further information on research and development expenses may be found in Item 7, Management’s Discussion and Analysis of Financial Condition and Results of Operations.
Intellectual Property
We rely on a combination of copyright, patent and trademark laws and on contractual restrictions to establish and protect proprietary rights in our technologies and fonts. Whenever possible, we enter into non-disclosure agreements with our suppliers, partners and others to limit access to and disclosure of our proprietary information.
We apply for U.S. and international patents with respect to our technologies and seek copyright registration of our software and U.S. and international trademark registration in those instances in which we determine that it is competitively advantageous and cost effective to do so. We have been granted a total of eight patents and have six patents pending with the U.S. Patent and Trademark Office. Our most important patents are related to our MicroType font compression technology, subpixel rendering technology and ACT technology. We have unregistered trademarks and registered trademarks, where appropriate, on the key fonts in our font libraries. We intend to continue our policy of taking all measures we deem necessary to protect our patent, copyright, trade secret and trademark rights.
Some of our fonts are owned by third parties that we license under exclusive and non-exclusive agreements. We have also collaborated with third parties in the production and development of fonts.
Competition
Our text imaging solutions compete with those offered by a variety of companies, including vendors of laser printer and display imaging technologies and printer drivers and providers of fonts. We compete principally on the basis of our technical innovation, engineering and customer support expertise, the breadth of our font offerings and the overall performance of our text imaging solutions, including reliability and timely delivery. Competition with our solutions principally comes from Adobe and Bitstream, Inc., or Bitstream, but we also compete with local providers of text imaging solutions that offer solutions specific to a particular country’s language requirements. We also compete with FreeType, an open source collaborative organization that provides its Linux font rendering code for free, with printer driver provider Software Imaging and with Extensis and Insider Software with respect to our FontExplorerX product. The competition for our fonts and custom font design services generally comes from companies offering their own typeface libraries and custom typeface services, including Bitstream, Adobe, Ascender Corporation, or Ascender, font foundry websites, font-related websites and independent professionals. We also compete with in-house resources of our OEM customers.
9
Table of Contents
Employees and Consultants
At December 31, 2009, we employed 239 persons. In addition, we have an exclusive relationship with a consulting firm that provides font design and production services in China. The table below provides our employees by functional area.
| Number of Employees |
Percentage | ||||
| Sales and marketing |
104 | 43 | % | ||
| Research and development |
85 | 36 | % | ||
| General and administration |
50 | 21 | % | ||
| Total |
239 | 100 | % | ||
None of our employees or consultants are represented by a union or covered by a collective bargaining agreement. Our Linotype employees are represented by a work council. This work council has the right to participate in certain decisions by Linotype, including operational changes, such as relocation of the business or change of control transactions, and social matters, such as wages and salaries and working hours. We believe that our relations with our employees and consultants are good.
Segment Information
Information concerning revenue from our two principal markets for the last three years may be found in Note 14 to our consolidated financial statements. We do not allocate expenses and assets to our two principal markets, OEM and creative professional, and operating results are assessed on an aggregate basis to make decisions about the allocation of resources. Further information about our principal markets and segment information, including geographic revenue, may be found in Note 14 to our consolidated financial statements.
Corporate and Investor Information
We maintain a website at http://www.monotypeimaging.com. We make available on our website documents describing our corporate governance and our Code of Business Conduct and Ethics. We are not including the information contained on our website as a part of, or incorporating it by reference into, this Annual Report on Form 10-K. We make available free of charge through our website our proxy statements, registration statements, annual reports on Form 10-K, quarterly reports on Form 10-Q and current reports on Form 8-K, and amendments to these reports, as soon as reasonably practicable after we electronically file such material with, or furnish such material to, the Securities and Exchange Commission, or the SEC. Our SEC filings are also available over the Internet at the SEC’s website at http://www.sec.gov. You may also read and copy any document we have filed by visiting the SEC’s public reference room at 100 F Street, NE., Washington, DC 20549. Please call the SEC at 1-800-SEC-0330 for further information about the public reference room. The SEC maintains an internet site that contains reports, proxy and information statements and other information regarding our filings at www.sec.gov. You may also inspect our SEC reports and other information at the offices of the Financial Industry Regulatory Authority, 1735 K Street, N.W., Washington, D.C. 20006.
| Item 1A. | Risk Factors |
Set forth below are certain risk factors that could harm our business, results of operations and financial condition. You should carefully read the following risk factors, together with the financial statements, related notes and other information contained in this Annual Report on Form 10-K. This Annual Report on Form 10-K contains forward-looking statements that contain risks and uncertainties. Please refer to the discussion of “Forward-Looking Statements” on page two of this Annual Report on Form 10-K in connection with your consideration of the risk factors and other important factors that may affect future results described below.
10
Table of Contents
Risks Related to Our Business
A prolonged economic downturn could materially harm our business.
Our ability to generate revenue is affected by the level of business activity of our OEM and Creative Professional customers, which, in most cases, is affected by the level of economic activity occurring in the industries and markets that our customers serve. Negative trends in the general economy, including trends resulting from a recession, the availability of credit, actual or threatened military action by the United States, terrorist attacks on the United States or abroad or increased oil prices, could cause a decrease in consumer and or business spending on computer hardware and software and CE devices in general and could negatively affect the rate of growth of CE device markets or of adoption of CE devices. Any economic downturn, including a reduction in consumer confidence or disposable income in general, could also adversely affect the demand for fonts or impair the ability of our customers to pay for products and services that they have purchased. With the general economic slowdown that the worldwide economy has experienced recently, we have seen a decrease in the demand for CE devices, including laser printers, which in turn, has decreased the demand for our font technologies. With respect to our Creative Professional business, we have also, for example, seen a reduction in font purchases by our publishing customers who have been impacted by overall economic conditions. We cannot predict the timing, strength or duration of any economic slowdown or subsequent economic recovery and this uncertainty makes it difficult to determine if past experience is a good guide to the future. If the downturn in the general economy or markets in which we operate persists or worsens from present levels, the demand for fonts and font technologies could continue to decline and our revenue and profitability could be materially and adversely impacted.
We derive a substantial majority of our revenue from a limited number of licensees, and if we are unable to maintain these customer relationships or attract additional customers, our revenue will be adversely affected.
We derive a substantial majority of our revenue from the licensing of our text imaging solutions to OEMs. For the years ended December 31, 2009, 2008 and 2007, our top ten licensees by revenue accounted for approximately 47.1%, 46.3% and 46.6% of our total revenue, respectively. Accordingly, if we are unable to maintain these relationships or establish relationships with new customers, our licensing revenue will be adversely affected. In addition, some of our license agreements are for a limited period of time and, upon expiration of their license agreements, these OEMs may not renew their agreements or may elect not to enter into new agreements with us on terms as favorable as our current agreements.
We face pressure from our customers to lower our license fees and, to the extent we lower them in the future, our revenue may be adversely affected.
The CE device markets are highly competitive and CE device manufacturers are continually looking for ways to reduce the costs of components included in their products in order to maintain or broaden consumer acceptance of those products. Because our technologies are a component incorporated into CE devices, when negotiating renewals of customer contracts, we face pressure from our customers to lower our license fees. We have in the past, and may in the future, need to lower our license fees, either immediately or over time, to preserve customer relationships or extend use of our technology to a broader range of products. To the extent contractual license fees for any particular customer are lower in the future, we cannot be certain that we will be able to achieve related increases in the use of our technologies or other benefits to fully offset the effects of these adjustments.
If we fail to develop and deliver innovative text imaging solutions in response to changes in our industry, including changes in consumer tastes or trends, our revenue could decline.
The markets for our text imaging solutions are characterized by rapid change and technological evolution and are intensely competitive and price sensitive. We will need to expend considerable
11
Table of Contents
resources on product development in the future to continue to design and deliver enduring and innovative text imaging solutions. We rely on the introduction of new or expanded solutions with additional or enhanced features and functionality to allow us to maintain our royalty rates in the face of downward pressure on our royalties resulting from efforts by CE device manufacturers to reduce costs. Despite our efforts, we may not be able to develop and effectively market new text imaging solutions that adequately or competitively address the needs of the changing marketplace. In addition, we may not correctly identify new or changing market trends at an early enough stage to capitalize on market opportunities. Our future success depends, to a great extent, on our ability to develop and deliver innovative text imaging solutions that are widely adopted in response to changes in our industry, that are compatible with the solutions introduced by other participants in our industry and for which the CE device manufacturers are willing to pay competitive royalties. Our failure to deliver innovative text imaging solutions that allow us to stay competitive and for which we can maintain our royalty rates would adversely affect our revenue.
If Hewlett Packard or Adobe were to discontinue their use of our text imaging solutions in their products, our business could be materially and adversely affected.
Because of their market position as industry leaders, the incorporation by HP of our text imaging solutions in its laser printers and the incorporation of our text imaging solutions by Adobe in its PostScript product promote widespread adoption of our technologies by manufacturers seeking to maintain compatibility with HP and Adobe. If HP or Adobe were to stop using our text imaging solutions in their products, the market acceptance of our technologies by other CE device manufacturers would be materially and adversely affected, and this would in turn adversely affect our revenue.
If we are unable to further penetrate our existing markets or adapt or develop text imaging solutions, our business prospects could be limited.
We expect that our future success will depend, in part, upon our ability to successfully penetrate existing markets for CE devices, including laser printers, digital copiers, mobile phones, digital televisions, set-top boxes, navigation devices and digital cameras. To date, we have penetrated only some of these markets. Our ability to grow our revenue depends upon our ability to further penetrate these markets and to successfully penetrate those markets in which we currently have no presence. Demand for our text imaging solutions in any of these developing markets may not develop or grow, and a sufficiently broad base of OEMs may not adopt or continue to use products that employ our text imaging solutions. Because of our limited experience in some of these markets, we may not be able to adequately adapt our business and our solutions to the needs of these customers. In addition, traditionally we have licensed our technologies and fonts to OEMs that embed our technology on their platforms.
Software licensing models are evolving and if we are not able to make our fonts and font technologies available under these models, our business prospects could suffer.
New licensing and business models are evolving in the software industry. For example, a company may provide software applications, data and related services over the Internet, using primarily advertising or subscription-based revenue models sometimes known as “cloud computing.” Recent advances in computing and communications technologies, and specifically a growth in the demand for web based fonts that integrate seamlessly with all web browsers and operating systems, have made this model viable. As software licensing models evolve, we may not be successful in adapting to these new business models and our business prospects could suffer.
Open source software may make us more vulnerable to competition because new market entrants and existing competitors could introduce similar products quickly and cheaply.
Open source refers to the free sharing of software code used to build applications in the software development community. Individual programmers may modify and create derivative works and distribute
12
Table of Contents
them at no cost to the end-user. To the extent that open source software that has the same or similar functionality as our technologies is developed or gains market share, demand for our text imaging solutions may decline, we may have to reduce the prices we charge for our text imaging solutions and our results of operations may be negatively affected.
The rate of growth of the market for CE devices is uncertain.
Our success depends in large part upon the ability of CE device manufacturers who license our text imaging solutions to successfully market and sell their products. Continued growth in the adoption of CE devices like mobile phones and technological improvements in wireless devices, such as increases in functional memory, are critical to our future growth. If CE device manufacturers do not continue to successfully develop and market new products and services incorporating our text imaging solutions, or the products that our customers develop and market do not meet market acceptance, our revenue and operating results will be adversely affected.
The market for text imaging solutions for laser printers is a mature market growing at a slower rate than other markets in which we operate. To the extent that sales of laser printers level off or decline, our licensing revenue may be adversely affected.
A significant portion of our revenue in 2009, 2008 and 2007 was derived from laser printer manufacturers. The laser printer market is a mature market and as a result, it has grown at a slower rate than other markets in which we operate. In 2009, the laser printer market experienced a decline and our revenue was adversely affected. If sales of printers incorporating our text imaging solutions level off, or decline, then our licensing revenue may be adversely affected.
Our operating results may fluctuate based upon an increase or decrease of market share by CE device manufacturers to whom we license our text imaging solutions.
The terms of our license agreements with our CE device manufacturers vary. For example, we have fixed fee licensing agreements with certain customers, some of which may decline over time. If these customers, some of whom are instrumental in setting industry standards and influencing early adoption of technology incorporating our text imaging solutions, were to increase their share of the CE device market, under the terms of these agreements there would not be a corresponding increase in our revenue. Any change in the market share of CE device manufacturers to whom we license our text imaging solutions is entirely outside of our control.
The success of our business is influenced by the interoperability of our text imaging solutions with a variety of CE devices and software applications and operating systems.
To be successful we must design our text imaging solutions to interoperate effectively with a variety of CE devices. We depend on the cooperation of CE device manufacturers with respect to the components integrated into their devices, such as page description languages, or PDLs, as well as software developers that create the operating systems and applications, to incorporate our solutions into their product offerings. If manufacturers of CE devices elect not to incorporate our solutions into their product offerings, our revenue potential would be adversely affected.
Our success depends on the existence of a market for products that incorporate our text imaging solutions.
Our future success will depend on market demand for text imaging solutions that enable CE devices to render high quality text. This market is characterized by rapidly changing technology, evolving industry standards and needs, and frequent new product introductions. If the need for laser printers and other CE devices utilizing our technology were to decrease or if current models of these products were replaced by
13
Table of Contents
new or existing products for which we do not have a competitive solution or if our solutions are replaced by others that become the industry standard, our customers may not purchase our solutions and our revenue would be adversely affected. For example, if graphical device interface, or GDI, printers became the industry standard replacing PDL printers, our revenue would be adversely affected.
We face significant competition in various markets, and if we are unable to compete successfully, our ability to generate revenue from our business could suffer.
We face significant competition in the text imaging solutions markets. We believe that our most significant competitive threat comes from companies that compete with some of our specific offerings. Those competitors currently include Adobe, Bitstream, Ascender, Software Imaging, Extensis, Insider Software, FreeType, and local providers of text imaging solutions whose products are specific to a particular country’s language. We also compete with the internal development efforts of certain of the CE device manufacturers to whom we license our solutions, most of which have greater financial, technical and other resources than we do. Similarly, we also face competition from font foundries, font related websites and independent professionals.
Some of our current or future competitors may have significantly greater financial, technical, marketing and other resources than we do, may enjoy greater name recognition than we do or may have more experience or advantages than we have in the markets in which they compete. These advantages may include, among others:
| • | sales and marketing advantages; |
| • | advantages in the recruitment and retention of skilled personnel; |
| • | advantages in the establishment and negotiation of profitable strategic, distribution and customer relationships; |
| • | advantages in the development and acquisition of innovative software technology and the acquisition of software companies; |
| • | greater ability to pursue larger scale product development and distribution initiatives on a global basis; |
| • | substantially larger patent portfolios; and |
| • | operational advantages. |
Further, many of the devices that incorporate our text imaging solutions also include technologies and fonts developed by our competitors. As a result, we must continue to invest significant resources in product development in order to enhance our text imaging solutions and introduce new high-quality solutions to meet the wide variety of competitive pressures. Our ability to generate revenue from our business could suffer if we fail to do so successfully.
Our business is dependent in part on technologies and fonts we license from third parties and these license rights may be inadequate for our business.
Certain of our text imaging solutions are dependent in part on the licensing and incorporation of technologies from third parties, and we license a substantial number of fonts from third parties. For example, we have entered into license agreements with AGFA Gevaert N.V. under which we have acquired rights to use certain color technology. We also have license agreements with Microsoft, Adobe and others under which we license certain fonts. Our license agreements with these parties are limited by the ownership or licensing rights of our licensors. If any of the technologies we license from third parties fail to perform as expected, if our licensors do not continue to support any of their technology or intellectual property, including fonts, because they go out of business or otherwise, or if the technologies
14
Table of Contents
or fonts we license are subject to infringement claims, then we may incur substantial costs in replacing the licensed technologies or fonts or fall behind in our development schedule and our business plan while we search for a replacement. In addition, replacement technology and fonts may not be available for license on commercially reasonable terms, or at all.
Parties from whom we license text imaging solutions may challenge the basis for our calculations of the royalties due to them.
Some of our agreements with licensors require us to give them the right to audit our calculations of royalties payable to them. In addition, licensors may at any time challenge the basis of our calculations and we cannot be sure that we will be successful in our defense. Any royalties paid as a result of any successful challenge would increase our expenses and could negatively impact our relationship with such licensor, including by impairing our ability to continue to use and re-license technologies or fonts from that licensor.
Our business and prospects depend on the strength of our brands, and if we do not maintain and strengthen our brands, we may be unable to maintain or expand our business.
Maintaining and strengthening the Monotype and Linotype brands, the fonts.com, itcfonts.com, linotype.com and faces.co.uk brands, the FontExplorerX brand, as well as the brands of our fonts, such as Helvetica and ITC Avant Garde, is critical to maintaining and expanding our business, as well as to our ability to enter into new markets for our text imaging solutions. If we fail to promote and maintain these brands successfully, our ability to sustain and expand our business and enter into new markets will suffer. Maintaining and strengthening our brands will depend heavily on our ability to continue to develop and provide innovative and high-quality solutions for our customers, as well as to continue to maintain our strong online presence. If we fail to maintain high-quality standards, if we fail to meet industry standards, or if we introduce text imaging solutions that our customers or potential customers reject, the strength of our brands could be adversely affected. Further, unauthorized third parties may use our brands in ways that may dilute or undermine their strength.
If we fail to adequately protect our intellectual property, we could lose our intellectual property rights, which could negatively affect our revenue or dilute or undermine the strength of our brands.
Our success is heavily dependent upon our ability to protect our intellectual property, including our fonts. To protect our intellectual property, we rely on a combination of United States and international patents, design registrations, copyrights, trademarks, trade secret restrictions, end-user license agreements, or EULAs, and the implementation and enforcement of nondisclosure and other contractual restrictions. Despite these efforts, we may be unable to effectively protect our proprietary rights and the enforcement of our proprietary rights may be extremely costly. For example, our ability to enforce intellectual property rights in the actual design of our fonts is limited.
We hold patents related to certain of our rasterizer and compression technologies and registered trademarks on many of our fonts. Our patents may be challenged or invalidated, patents may not issue from any of our pending applications or claims allowed from existing or pending patents may not be of sufficient scope or strength (or may not issue in the countries where products incorporating our technology may be sold) to provide meaningful protection or be of any commercial advantage to us. Some of our patents have been and/or may be licensed or cross-licensed to our competitors. We rely on trademark protection for the names of our fonts. Unauthorized parties may attempt to copy or otherwise obtain and distribute our proprietary technologies and fonts. Also, many applications do not need to identify our fonts by name, such as those designs embedded in mobile telephones and set-top boxes, and therefore may not need to license trademarked fonts. We sometimes protect fonts by copyright registration but we do not always own the copyrights in fonts licensed from third parties. In addition, we cannot be certain that we will be able to enforce our copyrights against a third party who independently develops fonts even if it generates font designs identical to ours.
15
Table of Contents
Our EULA generally permits the embedding of our fonts into an electronic document only for the purpose of viewing and printing the document, but technologies, including those related to web-based fonts, may exist or may develop which allow unauthorized persons who receive such an embedded document to use the embedded font for editing the document or even to install the font into an operating system, the same as if the font had been properly licensed. Unauthorized use of our intellectual property or copying of our fonts may dilute or undermine the strength of our brands. Also, we may be unable to generate revenue from products that incorporate our text imaging solutions without our authorization. Monitoring unauthorized use of our text imaging solutions is difficult and expensive. A substantial portion of the CE devices that require text imaging solutions are manufactured in China. We cannot be certain that the steps we take to prevent unauthorized use of our intellectual property will be effective, particularly in countries like the China where the laws may not protect proprietary rights as fully as in the United States.
We conduct a substantial portion of our business outside North America and, as a result, we face diverse risks related to engaging in international business.
We have offices in five foreign countries and we are dedicating a significant portion of our sales efforts in countries outside North America. We are dependent on international sales for a substantial amount of our total revenue. In 2009 and 2008, approximately 66.4% and 67.5%, respectively, of our total revenue was derived from operations outside the U.S and we expect that international sales will continue to represent a substantial portion of our revenue for the foreseeable future. This future international revenue will depend on the continued use and expansion of our text imaging solutions, including the licensing of our technologies and fonts worldwide.
We are subject to the risks of conducting business internationally, including:
| • | our ability to enforce our contractual and intellectual property rights, especially in those foreign countries that do not respect and protect intellectual property rights to the same extent that the United States does, which increases the risk of unauthorized and uncompensated use of our text imaging solutions; |
| • | United States and foreign government trade restrictions, including those that may impose restrictions on importation of programming, technology or components to or from the United States; |
| • | foreign government taxes, regulations and permit requirements, including foreign taxes that we may not be able to offset against taxes imposed upon us in the United States, and foreign tax and other laws limiting our ability to repatriate funds to the United States; |
| • | foreign labor laws, regulations and restrictions; |
| • | changes in diplomatic and trade relationships; |
| • | difficulty in staffing and managing foreign operations; |
| • | political instability, natural disasters, war and/or events of terrorism; and |
| • | the strength of international economies. |
We are an international company and, as a result, we face significant foreign currency exchange rate risk
We face risks related to fluctuations in foreign currency exchange rates, in particular fluctuations in the exchange rate of the Japanese yen, the European Union’s euro, and the United Kingdom’s pound sterling, including risks related to hedging activities we may undertake. For example, prior to instituting foreign currency hedging, we recorded losses on foreign currency exchange of $1.4 million in 2005 primarily due to fluctuation in the value of the Japanese yen relative to the United States dollar.
16
Table of Contents
Although we attempt to mitigate a portion of these risks through foreign currency hedging, these activities may not effectively offset the adverse financial effect resulting from unfavorable movements in currency exchange rates.
Our text imaging solutions compete with solutions offered by some of our customers, which have significant competitive advantages.
We face competitive risks in situations where our customers are also current or potential competitors. For example, Adobe is a significant licensee of our text imaging solutions, but Adobe is also a competitor with respect to the licensing of technologies and fonts. To the extent that Adobe or our other customers choose to utilize competing text imaging solutions they have developed or in which they have an interest, rather than utilizing our solutions, our business and operating results could be adversely affected. Adobe also offers broader product lines than we do, including software products outside of the text imaging solutions markets that provide Adobe with greater opportunities to bundle and cross-sell products to its large user base. To the extent our customers were to offer text imaging solutions comparable to ours at a similar or lower price, our revenue could decline and our business would be harmed.
Adoption of Microsoft’s XPS Printing Language could have an adverse impact on our future licensing revenue.
With the introduction of the Microsoft Vista operating system, a new printing and networking subsystems language, referred to as XML Paper Specification language, or XPS, was introduced to the market . If the laser printer market shifts away from PCL and PostScript to Microsoft’s XPS language, our licensing revenue could be adversely affected.
We may be forced to litigate to defend our intellectual property rights or to defend against claims by third parties against us relating to intellectual property rights.
Disputes and litigation regarding the ownership of technologies and fonts and rights associated with text imaging solutions, such as ours, are common, and sometimes involve patent holding companies or other adverse patent owners who have no relevant product revenue and against whom our own patents may therefore provide little or no deterrence. Third parties have from time to time claimed, and in the future may claim, that our products and services infringe or violate their intellectual property rights. Any such claims could cause us to incur significant expenses and, if successfully asserted against us, could require that we pay substantial damages and prevent us from selling our products. We may be forced to litigate to enforce or defend our intellectual property rights, to protect our trade secrets or to determine the validity and scope of other parties’ proprietary rights. Even if we were to prevail, any litigation regarding intellectual property could be costly and time-consuming and divert the attention of our management and key personnel from our business operations. We may also be obligated to indemnify our customers or business partners pursuant to any such litigation, which could further exhaust our resources. Furthermore, as a result of an intellectual property challenge, we may be required to enter into royalty, license or other agreements, and we may not be able to obtain such agreements at all or on terms acceptable to us. We have been in the past involved in litigation with third parties, including Adobe, to defend our intellectual property rights and have not always prevailed.
Current and future industry standards may limit our business opportunities.
Various industry leaders have adopted or are in the process of adopting standards for CE devices that incorporate, or have the potential to incorporate, our text imaging solutions. Although we have made some efforts to have our text imaging solutions adopted as standards by industry market leaders, these efforts
17
Table of Contents
have been limited and we do not control the ultimate decision with respect to whether our solutions will be adopted as industry standards in the future or, to the extent they are adopted, whether and for how long they will continue as such. If industry standards adopted exclude our solutions, we will lose market share and our ability to secure the business of OEMs subject to those standards will be adversely affected. Costs or potential delays in the development of our solutions to comply with such standards could significantly increase our expenses and place us at a competitive disadvantage compared to others who comply faster or in a more cost efficient way or those whose solutions are adopted as the industry standard. We may also need to acquire or license additional intellectual property rights from third parties which may not be available on commercially reasonable terms, and we may be required to license our intellectual property to third parties for purposes of standards compliance.
We rely on the manufacturers to whom we license our text imaging solutions to accurately prepare royalty reports for our determination of licensing revenue and if these reports are inaccurate, our revenue may be under-, or over-stated and our forecasts and budgets may be incorrect.
Our license revenue is generated primarily from royalties paid by CE device manufacturers who license our text imaging solutions and incorporate them into their products. Under these arrangements, these licensees typically pay us a specified royalty for every consumer hardware device they ship that incorporates our text imaging solutions. We rely on our licensees to accurately report the number of units shipped. We calculate our license fees, prepare our financial reports, projections and budgets and direct our licensing and technology development efforts based in part on these reports. However, it is often difficult for us to independently determine whether or not our licensees are reporting shipments accurately. We understand that CE device manufacturers in specific countries have a history of underreporting or failing to report shipments of their products. We have implemented an audit program of our licensees’ records, but the effects of this program may be limited as audits are generally expensive and time consuming and initiating audits could harm our relationships with licensees. In addition, our audit rights are contractually limited. To the extent that our licensees understate or fail to report the number of products incorporating our text imaging solutions that they ship, we will not collect and recognize revenue to which we are entitled. Alternatively, we may encounter circumstances in which an OEM customer may notify us that it previously reported and paid royalties on units in excess of what the customer actually shipped. In such cases, we may be required to give our licensee a credit for the excess royalties paid which would result in a reduction in revenue in the period in which a credit is granted, and such a reduction could be material.
The technologies in our text imaging solutions may be subject to open source licenses, which may restrict how we use or distribute our technologies or require that we release the source code of certain technologies subject to those licenses.
Certain open source licenses, such as the GNU Lesser General Public License, require that source code subject to the license be released or made available to the public. Such open source licenses typically mandate that proprietary technologies, when combined in specific ways with open source software, become subject to the open source license. We take steps to ensure that our proprietary technologies are not combined with, or do not incorporate, open source software in ways that would require our proprietary technologies to be subject to an open source license. However, few courts have interpreted the open source licenses, and the manner in which these licenses may be interpreted and enforced is therefore subject to uncertainty. While our EULA prohibits the use of our technologies in any way that would cause them to become subject to an open source license, our OEM customers could, in violation of our EULA, combine our technologies with technologies covered by an open source license.
In addition, we rely on multiple software engineers to design our proprietary text imaging solutions. Although we take steps to ensure that our engineers do not include open source software in the technologies they design, we may not exercise complete control over the product development efforts of our engineers and we cannot be certain that they have not incorporated open source software into our
18
Table of Contents
proprietary technologies. In the event that portions of our proprietary technologies are determined to be subject to an open source license, we might be required to publicly release the affected portions of our source code, which could reduce or eliminate our ability to commercialize our text imaging solutions. Also, our ability to market our text imaging solutions depends in part on the existence of proprietary operating systems. If freely distributed operating systems like Linux become more prevalent, the need for our solutions may diminish and our revenue could be adversely affected. Finally, in the event we develop technologies that operate under or are delivered under an open source license, such technologies may have little or no direct financial benefit to us.
Our licensing revenue depends in large part upon OEMs incorporating our text imaging solutions into their products and if our solutions are not incorporated in these products or fewer products are sold that incorporate our solutions, our revenue will be adversely affected.
Our licensing revenue from OEMs depends upon the extent to which these OEMs embed our technologies in their products. We do not control their decision whether or not to embed our solutions into their products, and we do not control their product development or commercialization efforts. If we fail to develop and offer solutions that adequately or competitively address the needs of the changing marketplace, OEMs may not be willing to embed our solutions into their products. The process utilized by OEMs to design, develop, produce and sell their products is generally 12 to 24 months in duration. As a result, if an OEM is unwilling or unable to embed our solutions into a product that it is manufacturing or developing, we may experience significant delays in generating revenue while we wait for that OEM to begin development of a new product that may embed our solutions. In addition, if OEMs sell fewer products incorporating our solutions, our revenue will be adversely affected.
We incur significant costs and demands upon management as a result of complying with changing laws and regulations, including those affecting public companies, which could affect our operating results.
We have incurred and will incur significant costs, and have and could experience internal resources constraints, associated with the evaluation of and compliance with evolving corporate governance, reporting and other requirements, including requirements under the Sarbanes-Oxley Act and the Massachusetts data protection laws, as well as rules implemented by the SEC, and the NASDAQ Global Select Market. The expenses incurred by public companies for reporting and corporate governance purposes have been increasing. We expect that the rules and regulations applicable to us could cause our legal and financial compliance costs to increase and could make some activities more time-consuming and costly. In addition, in the current public company environment officers and directors are subject to increased scrutiny and may be subject to increased potential liability. As a result, it may be more difficult for us to attract and retain qualified individuals to serve on our board of directors or as our executive officers. This could negatively impact our future success.
If we fail to maintain proper and effective internal controls in the future, our ability to produce accurate financial statements could be impaired, which could adversely affect our ability to operate our business and maintain our stock price.
Ensuring that we can produce accurate financial statements on a timely basis is a costly and time-consuming effort that needs to be re-evaluated frequently. Section 404 of the Sarbanes-Oxley Act requires annual management assessments of the effectiveness of our internal controls over financial reporting and that our independent auditors separately report on the effectiveness of our internal control over financial reporting. Both we and our independent auditors test our internal controls in connection with the Section 404 requirements and could, as part of that documentation and testing, identify material weaknesses, significant deficiencies or other areas for further attention or improvement. Our networks may be vulnerable to security risks and hacker attacks, which may affect our ability to maintain effective internal controls as contemplated by Section 404. Implementing any appropriate changes to our internal
19
Table of Contents
controls may require specific compliance training for our directors, officers and employees, entail substantial costs to modify our existing accounting systems, and take a significant period of time to complete. Such changes may not, however, be effective in maintaining the adequacy of our internal controls, and any failure to maintain that adequacy, or consequent inability to produce accurate financial statements on a timely basis, could increase our operating costs and could materially impair our ability to operate our business. In addition, disclosure regarding our internal controls or investors’ perceptions that our internal controls are inadequate or that we are unable to produce accurate financial statements may adversely affect our stock price.
Because of their significant stock ownership, some of our existing stockholders are able to exert substantial control over us and our significant corporate decisions.
As of December 31, 2009, our executive officers, directors and their affiliates, in the aggregate, beneficially owned approximately 39.5% of our outstanding common stock. As a result, these persons, acting together, have the ability to significantly influence the outcome of all matters submitted to our stockholders for approval, including the election and removal of directors and any merger, consolidation or sale of all or substantially all of our assets. In addition, these persons, acting together, have the ability to significantly influence the management and affairs of our company. This concentration of ownership may harm the market price of our common stock by, among other things:
| • | delaying, deferring or preventing a change in control of our Company; |
| • | causing us to enter into transactions or agreements that are not in the best interests of all stockholders; or |
| • | discouraging potential acquirers from making offers to purchase our Company. |
Our quarterly results and stock price may fluctuate significantly.
We expect our operating results to be subject to quarterly fluctuations. The revenue we generate and our operating results will be affected by numerous factors, including:
| • | general economic conditions; |
| • | demand for CE devices that include our text imaging solutions; |
| • | demand for our fonts and custom font design services; |
| • | delays in product shipment by our customers; |
| • | industry consolidation; |
| • | introduction, enhancement and market acceptance of text imaging solutions by us and our competitors; |
| • | price reductions by us or our competitors or changes in how text imaging solutions are priced; |
| • | the mix of text imaging solutions offered by us and our competitors; |
| • | the mix of international and U.S. revenue generated by our solutions; |
| • | financial implications of acquisitions, in particular foreign acquisitions involving different accounting standards, foreign currency issues, international tax planning requirements and the like; |
| • | timing of billings to customers on royalty reports received by us under our licensing agreements; and |
| • | our ability to hire and retain qualified personnel. |
For example, as a result of the royalty reports received from laser printer and other CE device manufacturers, our OEM revenue in the third quarter of 2009 was lower than the revenue in the prior
20
Table of Contents
quarter. In the third quarter of 2009 our OEM revenue declined by approximately $0.6 million, compared to the prior quarter due to a decline in product shipments from our OEM customers. A substantial portion of our quarterly revenue is based on actual shipments by our customers of products incorporating our text imaging solutions in the preceding quarter, and not on contractually agreed upon minimum revenue commitments. Because the shipping of products by our customers is outside our control and difficult to predict, our ability to accurately forecast quarterly revenue is limited. Our revenue also varies from quarter to quarter as a result of variances on the timing of transactions through our e-commerce websites. In addition, under a fixed fee license agreement we have, we have agreed to certain reductions in the fee payable over a period of years. Quarterly fluctuations in our operating results may, in turn, cause the price of our stock to fluctuate substantially. We believe that quarterly comparisons of our financial results are not necessarily meaningful and should not be relied upon as an indication of our future performance.
The loss of key members of our senior management team may prevent us from executing our business strategy.
Our future success depends in large part upon the continued services of key members of our senior management team. All of our executive officers and key employees are at-will employees. Douglas J. Shaw, Chief Executive Officer, has been with the Company in various senior management roles for more than 20 years. Mr. Shaw has been critical to the overall management of the Company, as well as the development of our solutions, our culture and our strategic direction. The loss of his services or of the services of other key members of our senior management could seriously harm our ability to execute our business strategy. We also may have to incur significant costs in identifying, hiring, training and retaining replacements for key employees.
We rely on highly skilled personnel, and if we are unable to retain or motivate key personnel or hire qualified personnel, we may not be able to maintain our operations or grow effectively.
Our performance is largely dependent on the talents and efforts of highly skilled individuals, including font designers who are recognized as leaders in the industry and experienced software engineers. These individuals have acquired specialized knowledge and skills with respect to us and our operations. These individuals can be terminated or can leave our employ at any time. Some of these individuals are consultants. If any of these individuals or a group of individuals were to terminate their employment unexpectedly or end their consulting relationship sooner than anticipated, we could face substantial difficulty in hiring qualified successors, could incur significant costs in connection with their termination and could experience a loss in productivity while any such successor obtains the necessary training and experience.
Our future success depends on our continuing ability to identify, hire, develop, motivate and retain highly skilled personnel and consultants for all areas of our organization. In this regard, if we are unable to hire and train a sufficient number of qualified employees and consultants for any reason or retain employees or consultants with the required expertise, we may not be able to implement our current initiatives or grow effectively or execute our business strategy successfully.
If we have difficulty finding appropriate partnership and/or acquisition candidates, our ability to execute aspects of our strategic plan may be hindered.
Selectively, we intend to pursue complementary acquisitions, strategic partnerships and third party intellectual property licenses to accelerate our time to market, penetrate new geographies and expand our offering. Execution of our strategy relies on finding and closing partnerships and/or acquisitions that fit with our business and that meet our financial expectations. To the extent that we are unable to identify appropriate opportunities and close deals on acceptable financial terms, we may face hurdles in executing portions of our strategy.
21
Table of Contents
We may expand through acquisitions of other companies, which may divert our management’s attention or result in additional dilution to stockholders or use of resources that are necessary to operate other parts of our business.
As part of our business strategy, we may seek to acquire businesses, products or technologies that we believe could complement or expand our products, enhance our technical capabilities or otherwise offer growth opportunities. Acquisitions could create risks for us, including:
| • | difficulties in assimilating acquired personnel, operations and technologies; |
| • | unanticipated costs or liabilities associated with such acquisitions; |
| • | incurrence of acquisition-related costs; |
| • | diversion of management’s attention from other business concerns; |
| • | use of resources that are needed in other parts of our business; and |
| • | use of substantial portions of our available cash to consummate such acquisitions. |
In addition, a significant portion of the purchase price of companies we acquire may be allocated to acquired goodwill and other intangible assets, which must be assessed for impairment at least annually. In the future, if our acquisitions do not yield expected returns, we may be required to take charges to our earnings based on this impairment assessment process, which could harm our results of operations. Acquisitions could also result in potentially dilutive issuances of equity securities or in the incurrence of debt, which could adversely affect our operating results. In addition, if an acquired business fails to meet our expectations, our operating results may suffer.
22
Table of Contents
Risks Related to the Securities Markets and Investment in our Common Stock
Our substantial indebtedness could affect our financing options and liquidity.
We have $93.1 million of debt outstanding and an undrawn $20.0 million revolving credit facility at December 31, 2009; however, availability under the line-of-credit was reduced by approximately $4.0 million at December 31, 2009, as a result of our outstanding derivative instruments with our lender. Our indebtedness is secured by substantially all of our assets and could have important consequences to our business or the holders of our common stock, including:
| • | limiting our ability to obtain additional financing in the future for working capital, capital expenditures or acquisitions; |
| • | requiring a significant portion of our cash flow from operations to be dedicated to the payment of the principal of and interest on our indebtedness, thereby reducing funds available for other purposes; |
| • | making us more vulnerable to economic downturns and limiting our ability to withstand competitive pressures; and |
| • | preventing us from paying dividends on our common stock. |
We are subject to restrictive debt covenants that impose operating and financial restrictions on us and could limit our ability to grow our business.
Covenants in our credit facility impose significant operating and financial restrictions on us. These restrictions prohibit or limit, among other things, our incurrence of additional indebtedness, dividends and distributions, asset sales, some transactions with affiliates, certain acquisitions and creation of certain types of liens. These restrictions could limit our ability to take advantage of business opportunities. Furthermore, our indebtedness requires us to maintain a maximum leverage ratio and maintain a minimum level of cash through a liquidity covenant. Our ability to comply with these covenants may be affected by events beyond our control, including prevailing economic, financial and industry conditions. If we are unable to comply with the covenants, leverage and liquidity ratios in our current credit facility in the future, we may be unable to obtain waivers of non-compliance from the lenders, which would put us in default under the facility, or we may be required to pay substantial fees or penalties to the lenders. If we are in default under the facility, the rate of interest we are charged on the facility could increase, which we may be unable to pay on a continual basis. These developments could have a material adverse effect on our business.
Market volatility may affect our stock price and the value of your investment.
The market price of our common stock may fluctuate significantly in response to a number of factors, most of which we cannot control, including:
| • | announcements of new products, services or technologies, commercial relationships, acquisitions or other events by us or our competitors; |
| • | fluctuations in stock market prices and trading volumes of similar companies; |
| • | variations in our quarterly operating results; |
| • | changes in our financial guidance or securities analysts’ estimates of our financial performance; |
| • | changes in accounting principles; |
| • | sales of large blocks of our common stock, including sales by our executive officers, directors and significant stockholders; |
23
Table of Contents
| • | additions or departures of key personnel; |
| • | discussion of us or our stock price by the financial press and in online investor communities; |
| • | general market conditions and other factors, including factors unrelated to our operating performance or the operating performance of our competitors; and |
| • | other risks and uncertainties described in these “Risk Factors”. |
Market prices of technology companies have been extremely volatile. Stock prices of many technology companies have often fluctuated in a manner unrelated or disproportionate to the operating performance of such companies. In the past, following periods of market volatility, stockholders have often instituted securities class action litigation. If we were involved in securities litigation, it could have a substantial cost and divert resources and the attention of management from our business.
Shares of our common stock are relatively illiquid.
There has only been a public market for our common stock since the completion of our initial public offering in July 2007. For the quarterly period ended December 31, 2009, the average daily trading volume of our common stock on the NASDAQ Global Select Market was less than 89,000 shares. As a result of our relatively small public float, our common stock may be less liquid than the stock of companies with broader public ownership. Among other things, trading of a relatively small volume of our common stock may have a greater impact on the trading price for our shares than would be the case if our public float were larger.
Anti-takeover provisions in our charter documents and under Delaware law could make an acquisition of us, which may be beneficial to our stockholders, more difficult and may inhibit attempts by our stockholders to replace or remove our current management.
Provisions in our certificate of incorporation and by-laws may delay or prevent an acquisition of us or a change in our management. These provisions include a classified board of directors, a prohibition on actions by written consent of our stockholders and the ability of our board of directors to issue preferred stock without stockholder approval. In addition, because we are incorporated in Delaware, we are governed by the provisions of Section 203 of the Delaware General Corporation Law, which limits the ability of stockholders owning in excess of 15% of our outstanding voting stock to merge or combine with us. Although we believe these provisions collectively provide for an opportunity to obtain greater value for stockholders by requiring potential acquirers to negotiate with our board of directors, they would apply even if an offer rejected by our board were considered beneficial by some stockholders. In addition, these provisions may frustrate or prevent any attempts by our stockholders to replace or remove our current management by making it more difficult for stockholders to replace members of our board of directors, which is responsible for appointing the members of our management.
We do not intend to pay dividends on our common stock.
We currently anticipate that we will retain future earnings for the development, operation and expansion of our business and the repayment of indebtedness and do not anticipate declaring or paying any cash dividends for the foreseeable future. Moreover, our credit agreement relating to our credit facility arranged by Wells Fargo Foothill, Inc., or Amended and Restated Credit Agreement, imposes restrictions on our ability to declare and pay dividends.
Future sales of our common stock may cause our stock price to decline.
Our stockholders that held our stock prior to our initial public offering now hold a significant percentage of our outstanding shares of common stock. Any sale by us or our current stockholders of our
24
Table of Contents
common stock in the public market, or any distributions by partnership stockholders to their limited partners followed by a sale, or the perception that sales could occur, could adversely affect the prevailing market price for our common stock.
Certain of the holders of our common stock prior to our initial public offering have rights, subject to some limited conditions, to demand that we file a registration statement on their behalf to register their shares or that we include their shares in a registration statement that we file on our behalf or on behalf of other stockholders. If such demand rights are exercised pursuant to the terms and conditions of the registration rights agreement, we will incur significant expenses in connection with the filing of such registration statement. Additionally, the filing of a registration statement at the request of the stockholders may divert the attention of our senior management from our business operations.
We may require additional capital, and raising additional funds by issuing securities or additional debt financing may cause dilution to existing stockholders, restrict our operations or require us to relinquish proprietary rights.
We may need to raise additional capital in the future. We may raise additional funds through public or private equity offerings or debt financings. To the extent that we raise additional capital by issuing equity securities, our existing stockholders’ ownership will be diluted. Any new debt financing we enter into may involve covenants that restrict our operations more than our current credit facilities. These restrictive covenants would likely include limitations on additional borrowing, specific restrictions on the use of our assets as well as prohibitions on our ability to create liens, pay dividends, redeem our stock or make investments.
| Item 1B. | Unresolved Staff Comments |
None.
| Item 2. | Properties |
The principal leased properties of the Company and its subsidiaries are listed in the table below.
| Location |
Principal Use |
Approximate Square Feet |
Lease term | |||
| Facilities Used in Current Operations |
||||||
| Bad Homburg, Germany |
R&D, Marketing, Sales and Administrative |
21,000 | Leased; expires in 2012 with two 5-year renewal options | |||
| Boulder, Colorado |
R&D and Marketing |
7,000 | Leased; expires May 2011 with one 3-year renewal option | |||
| Salfords, United Kingdom |
R&D, Marketing, Sales and Administrative |
6,000 | Leased; expires in 2013 | |||
| Woburn, Massachusetts, USA |
R&D, Marketing, Sales, Administrative and Corporate |
38,000 | Leased; expires April 2015 with one 5-year renewal option | |||
We also maintain seven additional leased facilities in Redwood City, California; Boulder, Colorado; Mount Prospect, Illinois; Farnborough, United Kingdom; Tokyo, Japan; Hong Kong, China and Seoul, South Korea. These additional offices occupy approximately 10,000 square feet in the aggregate. We do not consider any specific leased facility to be material to our operations. We believe equally suited facilities are available in several other areas throughout the United States and abroad.
25
Table of Contents
| Item 3. | Legal Proceedings |
From time to time, we may be a party to various claims, suits and complaints. We are not currently a party to any legal proceedings that, if determined adversely to us, would have a material adverse effect on our business, results of operations or financial condition.
| Item 4. | Reserved |
26
Table of Contents
PART II
| Item 5. | Market for Registrant’s Common Equity, Related Stockholder Matters and Issuer Purchases of Equity Securities |
Market Information and Related Stockholder Matters
Our common shares, $0.001 par value, have traded on the NASDAQ Global Market under the symbol “TYPE” since July 25, 2007 until March 17, 2008 and on the NASDAQ Global Select Market since March 18, 2008. Prior to July 25, 2007, there was no public market for our common stock.
The following table sets forth, for the periods indicated, the high and low closing sales prices per share of our common stock as reported by the NASDAQ Global Select Market.
| High | Low | |||||
| Period 2009: |
||||||
| First Quarter |
$ | 7.15 | $ | 2.13 | ||
| Second Quarter |
7.21 | 3.69 | ||||
| Third Quarter |
9.10 | 6.28 | ||||
| Fourth Quarter |
9.20 | 7.24 | ||||
| Period 2008: |
||||||
| First Quarter |
$ | 15.70 | $ | 12.63 | ||
| Second Quarter |
16.01 | 11.89 | ||||
| Third Quarter |
13.22 | 10.69 | ||||
| Fourth Quarter |
10.90 | 3.90 | ||||
The closing price of our common stock, as reported by the NASDAQ Global Select Market, was $9.86 on February 22, 2010.
Holders
As of February 22, 2010, there were approximately 106 holders of record of our common stock.
Dividends
We have never paid or declared any cash dividend on our common stock and we are currently restricted on paying dividends under our debt obligation. Accordingly, we intend to retain future earnings for the development, operation and expansion of our business and the repayment of indebtedness. We do not anticipate declaring or paying any cash dividends for the foreseeable future.
Securities Authorized for Issuance Under Equity Compensation Plans
The following table sets forth information regarding securities authorized for issuance under the Company’s equity compensation plans as of December 31, 2009. To date, the Company has not granted any warrants or rights.
| Plan Category |
Number of securities to be issued upon exercise of outstanding options |
Weighted-average exercise price of outstanding options |
Number of securities remaining available for future issuance under equity compensation plans (excluding securities reflected in first column) (3) | ||||
| Equity compensation plans approved by security holders (1) |
4,102,152 | $ | 6.91 | 2,289,625 | |||
| Equity compensation plans not approved by security holders (2) |
— | — | — | ||||
| Total |
4,102,152 | $ | 6.91 | 2,289,625 | |||
| (1) | Includes our 2004 Stock Option and Grant Plan, or 2004 Award Plan, and our 2007 Stock Option and Incentive Plan, or 2007 Award Plan. |
| (2) | There are no equity compensation plans in place not approved by security holders. |
| (3) | Total shares allocated to the plans less the total number of awards granted through December 31, 2009. |
27
Table of Contents
Listing Requirements
The Company is subject to the listing requirements of the NASDAQ Global Select Market.
Performance Graph
This performance graph shall not be deemed “filed” with the SEC or subject to Section 18 of the Exchange Act, nor shall it be deemed incorporated by reference in any of our filings under the Securities Act.
The following graph shows a comparison from July 25, 2007, the date our common stock commenced trading on the NASDAQ Global Select Market, through December 31, 2009 of the cumulative total return for our common stock, The NASDAQ Composite Index and The NASDAQ Computer Index. Such returns are based on historical results and are not intended to suggest future performance. Data for The NASDAQ Composite Index and The NASDAQ Computer Index assumes that dividends, if any, were reinvested.
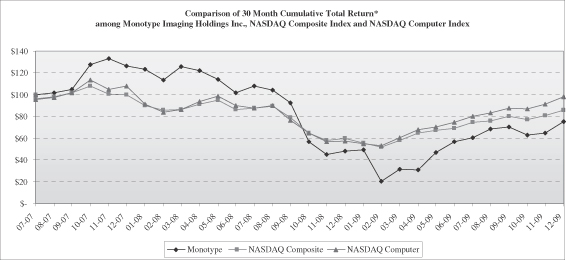
| * | Assumes $100 was invested on July 25, 2007 in our common stock and in the applicable indexes. |
Unregistered Sales of Equity Securities
None.
Issuer Purchases of Securities
Pursuant to the terms of our 2004 Award Plan, we have the right to repurchase unvested restricted shares from employees upon their termination, and it is generally our policy to do so. Pursuant to the terms of our 2007 Award Plan, we automatically reacquire any unvested restricted shares at their original price from the grantee upon termination of employment. We did not repurchase any shares of our common stock during the quarter ended December 31, 2009.
28
Table of Contents
| Item 6. | Selected Financial Data |
The following selected consolidated financial data should be read in conjunction with, and is qualified by reference to, our consolidated financial statements and related notes and “Management’s Discussion and Analysis of Financial Condition and Results of Operations” appearing elsewhere in this report. The data presented for the years ended December 31, 2009, 2008 and 2007, and as of December 31, 2009 and 2008, are derived from our audited consolidated financial statements included elsewhere in this report. The data for the twelve months ended December 31, 2006 includes the operating results of Linotype, following our acquisition of Linotype on August 1, 2006, and the results of operations of Monotype Hong Kong, formerly China Type Design which was acquired by us on July 28, 2006. The data presented for the years ended December 31, 2006 and 2005, and as of December 31, 2007, 2006 and 2005, are derived from our consolidated financial statements not included in this report.
| Years Ended December 31, | |||||||||||||||||
| 2009 | 2008 | 2007 | 2006 | 2005 | |||||||||||||
| Condensed Consolidated Statement of Income Data: |
|||||||||||||||||
| Revenue |
$ | 94,005 | $ | 110,861 | $ | 105,152 | $ | 86,204 | $ | 73,776 | |||||||
| Cost of revenue |
6,861 | 9,101 | 8,705 | 8,305 | 9,513 | ||||||||||||
| Cost of revenue-amortization of acquired technology |
3,383 | 3,392 | 3,376 | 3,021 | 2,408 | ||||||||||||
| Total cost of revenue |
10,244 | 12,493 | 12,081 | 11,326 | 11,921 | ||||||||||||
| Gross profit |
83,761 | 98,368 | 93,071 | 74,878 | 61,855 | ||||||||||||
| Marketing and selling |
23,645 | 22,911 | 19,206 | 14,931 | 11,730 | ||||||||||||
| Research and development |
14,142 | 14,867 | 18,837 | 13,813 | 10,668 | ||||||||||||
| General and administrative |
14,674 | 19,882 | 15,605 | 10,112 | 5,639 | ||||||||||||
| Amortization of other intangibles |
4,744 | 6,924 | 7,162 | 6,687 | 6,459 | ||||||||||||
| Total operating expenses |
57,205 | 64,584 | 60,810 | 45,543 | 34,496 | ||||||||||||
| Income from operations |
26,556 | 33,784 | 32,261 | 29,335 | 27,359 | ||||||||||||
| Other (income) expense: |
|||||||||||||||||
| Interest expense, net |
4,435 | 8,077 | 17,554 | 19,516 | 14,735 | ||||||||||||
| Loss on extinguishment of debt |
— | — | 2,958 | — | — | ||||||||||||
| Other expense (income), net |
1,144 | 556 | (2,147 | ) | (3,164 | ) | 819 | ||||||||||
| Total other expense |
5,579 | 8,633 | 18,365 | 16,352 | 15,554 | ||||||||||||
| Income before provision for income taxes |
20,977 | 25,151 | 13,896 | 12,983 | 11,805 | ||||||||||||
| Provision for income taxes |
7,575 | 9,770 | 4,832 | 5,921 | 4,684 | ||||||||||||
| Net income |
$ | 13,402 | $ | 15,381 | $ | 9,064 | $ | 7,062 | $ | 7,121 | |||||||
| Net income (loss) available to common stockholders |
$ | 13,315 | $ | 15,130 | $ | (25,022 | ) | $ | (17,325 | ) | $ | 36 | |||||
| Net income (loss) per common share: |
|||||||||||||||||
| Basic |
$ | 0.39 | $ | 0.45 | $ | (1.55 | ) | $ | (7.37 | ) | $ | 0.03 | |||||
| Diluted |
$ | 0.38 | $ | 0.43 | $ | (1.55 | ) | $ | (7.37 | ) | $ | 0.00 | |||||
| Weighted average number of common shares outstanding: Basic |
34,365,544 | 33,818,508 | 16,174,165 | 2,351,356 | 1,417,484 | ||||||||||||
| Weighted average number of common shares outstanding: Diluted |
35,288,126 | 35,304,794 | 16,174,165 | 2,351,356 | 27,421,316 | ||||||||||||
29
Table of Contents
| 2009 | 2008 | 2007 | 2006 | 2005 | ||||||||||||
| Consolidated Summary Balance Sheet Data: |
||||||||||||||||
| Cash and cash equivalents |
$ | 34,616 | $ | 31,941 | $ | 19,584 | $ | 8,540 | $ | 10,784 | ||||||
| Total current assets |
43,190 | 41,191 | 28,096 | 16,362 | 16,199 | |||||||||||
| Total assets |
272,377 | 277,421 | 276,346 | 270,273 | 203,879 | |||||||||||
| Total current liabilities |
32,672 | 38,227 | 40,882 | 35,337 | 30,552 | |||||||||||
| Total debt |
91,353 | 113,596 | 131,400 | 202,898 | 157,809 | |||||||||||
| Convertible redeemable preferred stock |
— | — | — | 40,170 | 15,793 | |||||||||||
| Additional paid-in capital |
148,273 | 142,676 | 138,219 | 687 | 226 | |||||||||||
| Total stockholders’ equity (deficit) |
140,522 | 120,836 | 102,007 | (12,580 | ) | 3,703 | ||||||||||
| Item 7. | Management’s Discussion and Analysis of Financial Condition and Results of Operations |
You should read the following discussion and analysis of our financial condition and results of operations in conjunction with our consolidated financial statements and notes to those statements, appearing elsewhere in this report. This report contains forward-looking statements reflecting our current expectations that involve risks and uncertainties, such as statements of our plans, objectives, expectations and intentions. The cautionary statements made in this report should be read as applying to all related forward-looking statements wherever they appear in this report. Our actual results may differ materially from those indicated in the forward-looking statements due to a number of factors, including those discussed in Item 1A, Risk Factors and elsewhere in this report.
Overview
We are a leading global provider of text imaging solutions. Our end-user and embedded solutions for print, web and mobile environments enable people to create and consume dynamic content on any and every device. Our technologies and fonts enable the display and printing of high quality digital content. Our software technologies have been widely deployed across, and embedded in a range of CE devices, including laser printers, digital copiers, mobile phones, digital televisions, set-top boxes, navigation devices and digital cameras, as well as in numerous software applications and operating systems. In the laser printer market, we have worked together with industry leaders for over 18 years to provide critical components embedded in printing standards. Our scaling, compression, text layout, printer driver and color technologies solve critical text imaging issues for CE device manufacturers by rendering high quality text on low resolution and memory constrained CE devices. We combine these proprietary technologies with access to more than 13,000 typefaces from a library of some of the most widely used designs in the world, including popular names such as Helvetica and Times New Roman. We also license our typefaces to creative and business professionals through our e-commerce websites fonts.com, linotype.com, itcfonts.com, faces.co.uk and fontexplorerx.com, which attracted more than 27 million visits in 2009 from over 200 countries and territories, direct and indirect sales and custom font design services.
On December 10, 2009, we acquired the principal assets of Planetweb, Inc., a global provider of embedded user interface software, and developer tools for the CE device industry, located in Redwood Shores, California, for $1.9 million. We are accounting for the acquisition using the purchase method of accounting in accordance with Accounting Standards Codification, or ASC, Topic No. 805, Business Combinations, or ASC 805.
On October 21, 2009, we implemented a restructuring plan. Under the restructuring plan, we reduced headcount in an effort to improve operational efficiencies, primarily within the creative professional area of our business, and we are consolidating certain functions of our European operations within our United Kingdom office. The plan provides for the elimination of 15 positions worldwide. We expect to record a total charge of approximately $0.9 million for severance and termination benefits associated with this plan. Approximately $52 thousand was recognized in the third quarter of 2009
30
Table of Contents
related to the termination of one employee prior to the implementation of the full restructuring plan. In accordance with Accounting Standards Codification, or ASC, Topic No. 420, Exit or Disposal Cost Obligations, or ASC 420, if an employee continues to work beyond a minimum period of time after notification, the termination benefits are to be accrued over the period that they continue to work. As certain of the employees are required to continue working beyond the minimum periods specified in ASC 420 in order to receive their termination benefits, we will accrue such benefits over the remaining term of employment. We recorded charges to operations of approximately $0.6 million in the fourth quarter of 2009 and expect to record approximately $0.2 million and $0.1 million in the first and second quarters of 2010, respectively, as a result of the restructuring plan. We expect the restructuring actions to be completed in the second quarter of 2010.
Sources of Revenue
We derive revenue from two principal sources: licensing our text imaging solutions to CE device manufacturers and independent software vendors, which we refer to as our OEM revenue, and licensing our fonts to creative and business professionals, which we refer to as our creative professional revenue. We derive our OEM revenue primarily from CE device manufacturers. We derive our creative professional revenue primarily from multinational corporations, graphic designers, advertisers, printers and publishers. Historically, we have experienced, and we expect to continue to have, lower revenue in the first quarter of the year due to the timing of some contractual payments of licensing fees from our OEM customers. In prior years we have experienced, and we may in the future have, seasonal slowness in the third quarter of the year from our creative professional customers. In 2009, given the economic conditions, traditional patterns of seasonality did not materialize. Our overall trends in 2009 were primarily impacted by the broader economic downturn.
Our customers are located in the United States, Asia, Europe and throughout the rest of the world, and our operating subsidiaries are located in the United States, Japan, the United Kingdom, Germany and Hong Kong. We are dependent on international sales by our foreign operating subsidiaries for a substantial amount of our total revenue. Revenue from our Asian subsidiaries is generally from Asian customers and revenue from our other subsidiaries is from customers in a number of different countries, including the United States. We attribute revenue to geographic areas based on the location of our subsidiary receiving such revenue. For example, licenses may be sold to large international companies which may be headquartered in Korea, but the sales are received and recorded by our subsidiary located in the United States. In this example, the revenue would be reflected in the United States totals in the table below.
| 2009 | 2008 | 2007 | ||||||||||||||||
| Sales | % of Total | Sales | % of Total | Sales | % of Total | |||||||||||||
| (In thousands of dollars, except %) | ||||||||||||||||||
| United States |
$ | 31,634 | 33.6 | % | $ | 35,975 | 32.5 | % | $ | 32,873 | 31.3 | % | ||||||
| Asia |
36,246 | 38.6 | 42,658 | 38.5 | 40,823 | 38.8 | ||||||||||||
| United Kingdom |
10,418 | 11.1 | 12,905 | 11.6 | 12,171 | 11.6 | ||||||||||||
| Germany |
15,707 | 16.7 | 19,323 | 17.4 | 19,285 | 18.3 | ||||||||||||
| Total |
$ | 94,005 | 100.0 | % | $ | 110,861 | 100.0 | % | $ | 105,152 | 100.0 | % | ||||||
For the years ended December 31, 2009, 2008 and 2007, sales by our subsidiaries located outside North America comprised 66.4%, 67.5% and 68.7%, respectively, of our total revenue. We expect that sales by our international subsidiaries will continue to represent a substantial portion of our revenue for the foreseeable future. Future international revenue will depend on the continued use and expansion of our text imaging solutions worldwide.
31
Table of Contents
We derive a majority of our revenue from a limited number of customers, in particular manufacturers of laser printers and mobile phones. For the years ended December 31, 2009, 2008 and 2007, our top ten licensees by revenue accounted for approximately 47.1%, 46.3% and 46.6% of our total revenue, respectively. No one customer accounted for more than 10% of our total revenue in 2009, 2008 and 2007.
Cost of Revenue
Our cost of revenue consists of font license fees that we pay on certain fonts that are owned by third parties, allocated internal engineering expense and overhead costs directly related to custom design services. License fees that we pay to third parties are typically based on a percentage of our OEM and creative professional revenue and do not involve minimum fees. Our cost of OEM revenue is typically lower than our cost of creative professional revenue because we own a higher percentage of the fonts licensed to our OEM customers, provide value-added technology and have negotiated lower royalty rates on the fonts we license from third parties because of volume. The cost of our custom design service revenue is substantially higher than the cost of our other revenue and, as a result, our gross margin varies from period to period depending on the level of custom design revenue recorded.
Cost of revenue also includes amortization of acquired technology, which we amortize over 8 to 15 years. For purposes of amortizing acquired technology we estimate the remaining useful life of the technology based upon various considerations, including our knowledge of the technology and the way our customers use it. We use the straight-line method to amortize our acquired technology. There is no reliable evidence to suggest that we should expect any other pattern of amortization than an even pattern, and we believe this best reflects the expected pattern of economic usage.
Gross Profit
Our gross profit percentage is influenced by a number of factors including product mix, pricing and volume at any particular time. However, our cost of OEM revenue is typically lower than our cost of creative professional revenue because we own a higher percentage of the fonts licensed to our OEM customers, provide value-added technology and have negotiated lower royalty rates on the fonts we license from third parties because of volume. In addition, the cost of our custom design service revenue is substantially higher than the cost of our other revenue. As a result, our gross profit varies from period to period depending on the mix between, and within, OEM and creative professional revenue.
Marketing and Selling
Our marketing and selling expense consists of salaries, bonuses, commissions and benefits related to our marketing and selling personnel, business travel expenses, advertising and trade show expenses, web-related expenses, allocated facilities costs and other overhead expenses. Sales commission expense varies as a function of revenue and goal achievement from period-to-period. During 2009 our marketing and selling expenses increased as compared to 2008 mainly due to personnel related expenses resulting from a shift in 2008 of headcount from development related activities to a focus on presale customer support and commercial website development.
Research and Development
Our research and development expense consists of salaries, bonuses and benefits related to our research and development, engineering, font design and integration support personnel and their business travel expenses, license fees related to certain of our technology licenses, expenses for contracted services and allocated facilities costs and other overhead expenses. Our research and development expense in a given period may be reduced to the extent that internal engineering resources are allocated to cost of revenue for custom design services.
32
Table of Contents
Our research and development is primarily focused on enhancing the functionality of our text imaging solutions and developing new products. From time to time we license third-party font technology in connection with new technology development projects that are part of our research and development efforts. Our research and development costs are expensed as incurred. During 2009 research and development expense decreased, as compared to 2008, primarily the result of the decrease in personnel related expenses stemming from the headcount shift from development related activities to a focus on presale customer support and commercial website development in 2008.
General and Administrative
Our general and administrative expense consists of salaries, bonuses and benefits related to our general and administrative personnel, accounting, legal and other professional fees, allocated facilities costs and other overhead expenses and insurance costs. In 2009, our general and administrative expenses were significantly lower than in 2008, primarily due to a decline in discretionary spending and the cost of the restructuring actions taken in the fall of 2008. Costs incurred to date with respect to our 2009 restructuring were substantially less than the costs of the 2008 restructuring.
Restructuring
On November 10, 2008, the Company implemented a restructuring plan. Under the restructuring plan, the Company reduced headcount in certain areas and redeployed certain other employees within the Company in order to focus on key initiatives across the business. The small headcount reduction was intended to be offset by the hiring of a few key additional employees whose technical expertise was better aligned with our key initiatives and we did not experience an overall change in headcount. The restructuring plan was completed in April 2009, other than making deferred cash payments to certain terminated employees. We implemented a second restructuring plan on October 21, 2009, which included certain actions that were taken during the three months ended September 30, 2009 in advance of finalizing the plan. Details of this restructuring plan are described in the overview section above. In the year ended December 31, 2009, we recorded $0.7 million of restructuring costs for severance and termination benefits for both plans, which is included in our operating expenses. Future cash expenditures related to these plans are expected to be approximately $0.4 million, net of tax savings.
Amortization of Intangible Assets
We amortize intangible assets acquired as follows:
| • | Customer relationships—9 to 15 years; |
| • | Acquired technology—8 to 15 years; and |
| • | Non-compete agreements—3 to 6 years. |
For purposes of amortization, we estimate the life of customer relationships based upon various considerations, including our knowledge of the industry and the marketplace in which we operate. We amortize non-compete agreements over the stated life of the agreement. We use the straight-line method to amortize our intangible assets. There is no reliable evidence to suggest that we should expect any other pattern of amortization than an even pattern, and we believe this best reflects the expected pattern of economic usage.
Critical Accounting Policies
The preparation of financial statements and related disclosures in conformity with GAAP and our discussion and analysis of our financial condition and results of operations requires us to make judgments, assumptions and estimates that affect the amounts reported in our consolidated financial statements and
33
Table of Contents
accompanying notes. We base our estimates on historical experience and on various other assumptions that we believe are reasonable under the circumstances, the results of which form the basis for judgments about the carrying values of assets and liabilities. Actual results may differ from these estimates.
We believe the following critical accounting policies affect our more significant judgments used in the preparation of our consolidated financial statements. Additional information about our critical accounting policies may be found in Note 2 to our consolidated financial statements in Item 8.
Revenue Recognition
We recognize revenue in accordance with ASC Topic No. 805, Revenue Recognition, or ASC 805. Revenue is recognized when persuasive evidence of an agreement exists, the product has been delivered or services have been provided, the fee is fixed or determinable, and collection of the fee is probable.
OEM Revenue
Our OEM revenue is derived substantially from per-unit royalties received for printer imaging, display imaging and printer driver, or driver, products. Under our licensing arrangements we typically receive a royalty for each product unit incorporating our text imaging solutions that is shipped by our OEM customers. We also receive OEM revenue from fixed fee licenses with certain of our OEM customers. Fixed fee licensing arrangements are not based on units the customer ships, but instead, customers pay us on a periodic basis for use of our text imaging solutions. Although significantly less than royalties from per-unit shipments and fixed fees from OEM customers, we also receive revenue from software application and operating systems vendors, who include our text imaging solutions in their products, and for font development. Many of our per-unit royalty licenses continue for the duration that our OEM customers ship products that include our technology, unless terminated for breach. Other licenses have terms that typically range from three to five years, and usually provide for automatic or optional renewals. We recognize revenue from per-unit royalties in the period during which we receive a royalty report from a customer, typically one quarter after royalty-bearing units are shipped. Revenue from fixed fee licenses is generally recognized when it is billed to the customer, so long as the product has been delivered, the license fee is fixed and non-refundable and collection is probable.
Creative Professional Revenue
Our creative professional revenue is derived from font licenses and from custom font design services. We license fonts directly to end-users through our e-commerce websites, via telephone, email and indirectly through third-party resellers. We also license fonts and provide custom font design services to graphic designers, advertising agencies and corporations.
Revenue from font licenses to our e-commerce customers is recognized upon payment by the customer and electronic shipment of the software embodying the font. Revenue from font licenses to other customers is recognized upon shipment of the software embodying the font and when all other revenue recognition criteria have been met. Revenue from resellers is recognized upon notification from the reseller that our font product has been licensed and when all other revenue recognition criteria have been met. Custom font design services are generally recognized upon delivery.
Goodwill, Indefinite-Lived Intangible Assets and Long-lived Assets
We assess the impairment of goodwill and indefinite-lived intangible assets annually, or more frequently if events or changes in circumstances indicate that the carrying value of such assets exceeds their fair value. With respect to both goodwill and indefinite-lived intangible assets, factors that could trigger an impairment review include significant negative industry or economic trends, exiting an activity
34
Table of Contents
in conjunction with a restructuring of operations, or current, historical or projected losses that demonstrate continuing losses associated with an asset. Impairment evaluations involve management estimates of useful lives and future cash flows, including assumptions about future conditions such as future revenue, operating expenses, the fair values of certain assets based on appraisals and industry trends. Actual useful lives and cash flows could be different from those estimated by our management. If this resulted in an impairment of goodwill and indefinite-lived intangible assets, it could have a material adverse effect on our financial position and results of operations.
In light of the continued macro-economic environment, declines in the stock market and the decline of the Company’s market capitalization, we may be required to perform interim goodwill impairment analyses. Should our stock price deteriorate to a level at which, if sustained, it may require us to perform goodwill impairment analysis, as detailed above. This analysis may determine that our goodwill is impaired in whole, in part, or not at all. In the event that the Company determines that its goodwill is impaired in whole, or in part, the Company will record a non-cash charge, which could be material. If an impairment of goodwill is recognized, an analysis of impairment of our other long-lived assets would be required pursuant to ASC Topic No. 360. In the event that the Company determines that these assets are impaired, the Company will record a non-cash charge, which could be material.
Share Based Compensation
We account for share based compensation in accordance with ASC Topic No. 718, Compensation—Stock Compensation or ASC 718, which requires the measurement of compensation costs at fair value on the date of grant and recognition of compensation expense over the service period for awards expected to vest.
Prior to our initial public offering, or IPO, on July 25, 2007 there was no public market for our common stock, and, in connection with our issuance of stock options, our board of directors, with the assistance of management, had the ultimate responsibility for determining the value of our common stock. In the absence of a public market for our common stock, the board of directors considered objective and subjective factors in determining the fair value of our common stock, including the liquidation preferences, redemption rights and conversion rights of our then-outstanding convertible preferred stock and the likelihood and timing of achieving a liquidity event such as an initial public offering or sale of the Company.
Our compensation committee followed the procedures recommended in the American Institute of Certified Public Accountants Technical Practice Aid, Valuation of Privately-Held Company Equity Securities Issued as Compensation for valuing our common stock. This approach requires an assessment of future prospects, based on the value of the business using a series of potential outcomes and weighing the probability of each of those outcomes. Management prepared three scenarios, a base case, an optimistic case and a pessimistic case. The possibility of an initial public offering was also considered. The compensation committee reviewed a market comparison of our business with a number of publicly traded firms to test the reasonableness of the overall analysis. The compensation committee reviewed the methodology, the resulting valuation and changed the probabilities of the outcomes that were initially applied as well as the weight given to those probabilities to more accurately reflect the changes in the business. At the date of each option grant, our board of directors determined that the exercise price for each option was equivalent to the then-existing fair value of our common stock. Our board of directors believes it properly valued our common stock in all periods.
Since our IPO, we have valued awards granted based on the grant date closing price of our common stock as traded on the NASDAQ Global Market or the NASDAQ Global Select Market, as applicable. The
35
Table of Contents
Company uses the Black-Scholes option pricing model to determine the weighted-average fair value of options granted and recognizes the compensation cost of share based awards on a straight-line basis over the vesting period of the award. The determination of the fair value of share based payment awards using the Black-Scholes model are affected by our stock price and a number of assumptions, including expected volatility, expected life, risk-free interest rate and expected dividends. We do not have a long history of market prices of our common stock and as such we estimate volatility in accordance with Staff Accounting Bulletin No. 110, or SAB 110, using historical volatilities of similar public entities. The expected life of the awards is estimated based on the simplified method, as defined in SAB 110. The risk-free interest rate assumption is based on a treasury instrument whose term is consistent with the expected life of our awards. The expected dividend yield assumption is based on our history and expectation of paying no dividends.
Forfeitures are estimated at the time of grant and revised, if necessary, in subsequent periods if actual forfeitures differ from those estimates. Share based compensation expense recognized in our financial statements is based on awards that are ultimately expected to vest. We evaluate the assumptions used to value our awards on a quarterly basis and if factors change and we employ different assumptions, stock-based compensation expense may differ significantly from what we have recorded in the past. If there are any modifications or cancellations of the underlying unvested securities, we may be required to accelerate, increase or cancel any remaining unearned stock-based compensation expense. Future stock-based compensation expense and unearned stock-based compensation will increase to the extent that we grant additional equity awards to employees or we assume unvested equity awards in connection with acquisitions.
During the year ended December 31, 2009, we recorded total share based compensation expense of $5.2 million, of which $0.3 million is associated with the China Type Design restricted shares. During the year ended December 31, 2008, we recorded total share based compensation expense of $3.6 million, which included a credit of approximately $0.1 million associated with the China Type Design restricted shares. During the year ended December 31, 2007, we recorded total share based compensation expense of $4.3 million, of which $2.6 million was associated with the China Type Design restricted shares. In connection with our initial public offering, three promissory notes issued in connection with the acquisition of China Type Design were converted into 415,903 shares of restricted common stock. These shares vest over a four year period that commenced upon the issuance of the notes in July 2006 and will be fully vested in July 2010. As of December 31, 2009, the Company had $8.5 million of unrecognized compensation expense related to employees and directors unvested stock option awards and restricted share awards that are expected to be recognized over a weighted average period of 2.4 years.
Pension Plan
We account for our defined benefit pension plan in accordance with ASC Subtopic No. 715-30, Defined Benefit Plans—Pension. Our unfunded defined benefit pension plan was acquired in connection with our acquisition of Linotype on August 1, 2006. The plan covers substantially all employees of our Linotype subsidiary who joined Linotype prior to April 1, 2006, at which time the pension plan was closed to new participants. Benefits under this plan are based on the employees’ years of service and compensation. We fund the plan sufficiently to meet current benefits only. There are no assets associated with the plan. In 2009 and 2008 we paid $72 thousand and $67 thousand, respectively, to the plan participants. At December 31, 2009 and 2008, our unfunded position was $3.5 million and $2.9 million, respectively. A significant portion of the pension benefit obligation is determined based on the rate of future compensation increases. Given the fact that the pension plan is unfunded, changes in economic and market conditions may require us to increase cash contributions in future years.
36
Table of Contents
Provision for Income Taxes
We provide for income taxes in accordance with ASC Topic No. 740, Income Taxes. Under this method, a deferred tax asset or liability is determined based on the difference between the financial statement and the tax basis of assets and liabilities, as measured by enacted tax rates in effect when these differences are expected to be reversed. This process includes estimating current tax exposure together with assessing temporary differences resulting from differing treatment of items for tax and financial accounting purposes. These differences result in deferred tax assets and liabilities. We also assess the likelihood that our deferred tax assets will be recovered from future taxable income and, to the extent we believe recovery to be unlikely, we have established a valuation allowance. Significant judgment is required in determining the provision for income taxes, deferred tax assets and liabilities and any valuation allowance against our deferred tax assets. Our financial position and results of operations may be materially affected if actual results significantly differ from these estimates or the estimates are adjusted in future periods.
We have recorded a valuation allowance against certain deferred tax assets, including foreign tax credits, where we have determined that their future use is uncertain. ASC 740 requires a valuation allowance be established when it is “more likely than not” that all or a portion of deferred tax assets will not be realized. A review of all available positive and negative evidence is considered, including a company’s performance, the market environment in which the company operates, length of carry-back and carry-forward periods, existing sales backlog, future taxable income projections and tax planning strategies. We have historically provided valuation allowances on certain tax assets, due to the uncertainty of generating taxable income in the appropriate jurisdiction and of the appropriate character to realize such assets. In these instances, the Company has made the determination that it is “more likely than not” that all or a portion of the deferred tax will not be realized.
We will continue to review our deferred tax position on a periodic basis and will reflect any change in judgment as a discrete item in the related period.
The amount of income taxes we pay is subject to ongoing audits by federal, state and foreign tax authorities, which often result in proposed assessments. Our estimate for the potential outcome for any uncertain tax issue is highly judgmental. We believe we have adequately provided for any reasonably foreseeable outcome related to these matters. However, our future results may include favorable or unfavorable adjustments to our estimated tax liabilities in the period that the assessments are made or resolved, or when the statute of limitations for certain periods expires. As a result, our effective tax rate may fluctuate significantly on a quarterly basis.
As part of the process of preparing our consolidated financial statements, we are required to estimate our income taxes in each of the jurisdictions in which we operate. This process involves estimating our actual current tax expense together with assessing the future impact of temporary differences resulting from differing treatment of items for tax and accounting purposes. The tax effect of these temporary differences is shown on our December 31, 2009 consolidated balance sheet (see Note 10 to our consolidated financial statements) and denotes these differences as a net deferred tax liability of $17.2 million. This consists of total deferred tax liabilities of $22.5 million and net deferred tax assets of $5.3 million after providing a valuation allowance of $2.9 million.
Derivative Financial Instruments
We account for our derivative instruments in accordance with ASC Topic No. 815, Derivatives and Hedging, which requires that all derivative instruments be reported on the balance sheet as either assets or liabilities measured at fair value. All changes in the fair value of derivatives are recognized as current period income or expense unless specific hedge criteria are met, which requires that a company must
37
Table of Contents
formally document, designate and assess the effectiveness of transactions that receive hedge accounting at the inception of each instrument. We recorded our derivatives at fair value, which is determined based on the provisions of ASC Topic No. 820, Fair Value Measurements and Disclosures, using either quoted market prices or prices for similar instruments. The determination of fair value of our derivatives considers our non-performance risk and that of our counterparties.
Results of Operations
The following table sets forth items in the consolidated statement of income as a percentage of sales for the periods indicated:
| Year Ended December 31, | |||||||||
| 2009 | 2008 | 2007 | |||||||
| Revenue: |
|||||||||
| OEM |
73.4 | % | 70.2 | % | 69.1 | % | |||
| Creative professional |
26.6 | 29.8 | 30.9 | ||||||
| Total revenue |
100.0 | 100.0 | 100.0 | ||||||
| Cost of revenue |
7.3 | 8.2 | 8.3 | ||||||
| Cost of revenue—amortization of acquired technology |
3.6 | 3.1 | 3.2 | ||||||
| Total cost of revenue |
10.9 | 11.3 | 11.5 | ||||||
| Gross profit |
89.1 | 88.7 | 88.5 | ||||||
| Marketing and selling |
25.2 | 20.7 | 18.3 | ||||||
| Research and development |
15.1 | 13.4 | 17.9 | ||||||
| General and administrative |
15.6 | 17.9 | 14.8 | ||||||
| Amortization of other intangible assets |
5.0 | 6.2 | 6.8 | ||||||
| Total operating expenses |
60.9 | 58.2 | 57.8 | ||||||
| Income from operations |
28.2 | 30.5 | 30.7 | ||||||
| Interest expense, net |
4.7 | 7.3 | 16.7 | ||||||
| (Gain) loss on foreign exchange |
(0.4 | ) | 0.9 | (2.0 | ) | ||||
| Loss (gain) on derivatives |
1.6 | (0.5 | ) | — | |||||
| Loss on extinguishment of debt |
— | — | 2.8 | ||||||
| Other expense, net |
— | 0.1 | — | ||||||
| Total other expenses |
5.9 | 7.8 | 17.5 | ||||||
| Income before provision for income taxes |
22.3 | 22.7 | 13.2 | ||||||
| Provision for income taxes |
8.0 | 8.8 | 4.6 | ||||||
| Net income |
14.3 | % | 13.9 | % | 8.6 | % | |||
Year Ended December 31, 2009 as Compared to Year Ended December 31, 2008
The following discussion compares the year ended December 31, 2009 with the year ended December 31, 2008.
Sales by Market. We view our operations and manage our business as one segment; the development, marketing and licensing of technologies and fonts. Factors used to identify our single segment include the financial information available for evaluation by our chief operating decision maker, our president and chief executive officer, in determining how to allocate resources and assess performance. While our technologies and services are sold to customers in two principal markets (CE device manufacturers and independent software vendors, together OEM, and creative professional), expenses and assets are not
38
Table of Contents
formally allocated to these market segments, and operating results are assessed on an aggregate basis to make decisions about the allocation of resources. The following table presents revenue for these two principal markets (in thousands):
| 2009 | 2008 | Decrease | ||||||||
| OEM |
$ | 68,967 | $ | 77,810 | $ | (8,843 | ) | |||
| Creative professional |
25,038 | 33,051 | (8,013 | ) | ||||||
| Total revenue |
$ | 94,005 | $ | 110,861 | $ | (16,856 | ) | |||
Revenue
Revenue was $94.0 million and $110.9 million for the years ended December 31, 2009 and 2008, respectively, a decrease of $16.9 million, or 15.2%. The decrease in our revenue year-over-year is a result of the current economic downturn as unit shipments by our OEM customers and discretionary spending by our creative professional customers decreased. OEM revenue was $69.0 million and $77.8 million for the year ended December 31, 2009 and 2008, respectively, a decrease of $8.8 million, or 11.3% mainly the result of a decrease in royalty and license revenue in 2009. Printer imaging and display imaging revenue decreased approximately $9.9 million in 2009, as compared to 2008, the result of decreased royalties from reduced unit shipments by our OEM customers. We attribute the declines we have experienced in our OEM revenue to the current economic downturn. This decrease was partially offset by a net increase in driver revenue of $1.1 million, mainly due to an increase in royalty revenue related to the broader deployment of our driver solutions within the product lines of our existing OEM customer base.
Creative professional revenue decreased $8.0 million, or 24.2%, from $33.0 million for the year ended December 31, 2008 to $25.0 million for the year ended December 31, 2009. Web revenue decreased $2.4 million as discretionary spending by our customers declined. Increased revenue from our FontExplorer product partially offset the decline in other non-web revenue resulting in a decrease of $5.6 million in 2009, as compared to 2008. We believe these declines are attributable to the current economic downturn. In 2008, we recognized revenue on several large one-time direct and indirect licensing deals which did not repeat in 2009. In addition, we experienced a decline in revenue from our customers in the publishing industry during 2009, as compared to 2008, as the publishing industry has been greatly impacted by a consolidation trend.
Cost of Revenue
Cost of revenue, excluding amortization of acquired technology, was $6.9 million and $9.1 million for the years ended December 31, 2009 and 2008, respectively, a decrease of $2.2 million, or 24.6%. The decrease in cost of revenue in dollars was the result of lower sales volume and product mix. As a percentage of total revenue, cost of revenue, excluding amortization was 7.3% in the year ended December 31, 2009, as compared to 8.2% in the same period in 2008. The decrease as a percentage of revenue was mainly due to product mix. OEM revenue represented 73.4% of our total revenue in 2009, as compared to 70.2% in 2008. The higher percentage of OEM revenue resulted in the decline in cost of revenue as a percentage of revenue, as OEM revenue typically has a lower associated cost than our creative professional revenue.
Amortization of acquired technology was $3.4 million in both years ended December 31, 2009 and 2008. We expect amortization of acquired technology to increase approximately $0.1 million in 2010 as a result of our acquisition of Planetweb, Inc.
39
Table of Contents
Gross Profit
Gross profit was 89.1% in the year ended December 31, 2009 compared to 88.7% in the same period in 2008. Our gross profit percentage is influenced by a number of factors including product mix, pricing and volume at any particular time. OEM revenue represented 73.4% of our total revenue in 2009, as compared to 70.2% in 2008. The higher percentage of OEM revenue resulted in a higher gross profit, as OEM revenue typically has a lower associated cost than our creative professional revenue.
Operating Expenses
Marketing and Selling. Marketing and selling expense was $23.6 million and $22.9 million, in 2009 and 2008, respectively, an increase of $0.7 million, or 3.2%. Personnel related expenses decreased $0.7 million, mainly the result of lower variable compensation due to lower sales volume in 2009, as compared to 2008. An increase in severance expense contributed $0.1 million in 2009 as compared to 2008. The Company’s restructuring actions in the fourth quarter of 2009 focused on the sales and marketing area more than the restructuring action taken in 2008. Share based compensation expense increased $0.7 million in 2009, as compared to 2008, the result of an increase in the number of stock awards granted. Software maintenance and third party commissions together contributed $0.5 million to the overall increase year-over-year. Targeted web advertising and discretionary marketing expenses together decreased $0.1 million in 2009, as compared to 2008. Reductions in discretionary spending in other areas such as outside third party services were offset by increased expense in other areas.
Research and Development. Research and development expense was $14.1 million and $14.9 million, in 2009 and 2008, respectively, a decrease of $0.8 million, or 4.9% mainly due to a decrease in personnel expenses. Personnel and personnel related expenses decreased $0.9 million in the year ended December 31, 2009, as compared to the same period in 2008, the result of a reduction in variable compensation and a decline in headcount in this area. In 2008 we recorded approximately $0.1 million of severance, associated with the 2008 restructuring action that did not repeat. Research and development headcount at December 31, 2009 was 5% lower than at December 31, 2008, as a result of restructuring actions. Share based compensation increased $0.5 million in 2009 as compared to 2008, partially due to an increase in the variable portion of our share based compensation which is related to our acquisition of China Type Design, and partially the result of an increase in the number of awards granted. Decreases in outside third party services contributed $0.2 million to the overall decrease year-over-year due partially to a shift in resources and partially due to a decline in discretionary spending. In the fall of 2008, the Company increased certain internal development resources which reduced reliance on external assistance.
General and Administrative. General and administrative expense was $14.7 million and $19.9 million, in 2009 and 2008, respectively, a decrease of $5.2 million, or 26.2%, mainly the result of an overall decline in discretionary spending. A decline in personnel and personnel related expenses contributed $1.1 million to the decrease, mainly the result of lower variable compensation expense. A decline in travel related expenses contributed $0.2 million to the decrease year-over-year. Severance, associated with our restructuring actions in 2008, contributed $0.1 million to the decrease year-over-year since these costs were lower in 2009. In the second quarter of 2008, we filed a registration statement with the Securities and Exchange Commission, or SEC, with respect to a secondary offering of shares of our common stock under a contractual agreement with certain of our shareholders, which amounted to $1.2 million in additional general and administrative expenses in 2008. There was no similar expense in 2009. Decreased Sarbanes-Oxley compliance related expense, as a result of reduced reliance on external assistance, contributed $1.0 million to the overall decrease. A decline in legal expenses contributed $0.7 million to the overall decrease. In the first quarter of 2009, we increased internal legal resources which reduced our reliance on external assistance in 2009, as compared 2008. In addition, the timing of
40
Table of Contents
intellectual property registration actions contributed to the decrease period over period. Decreases in outside services and software and computer maintenance expenses together contributed $0.8 million to the decrease, the result of a reduction in discretionary spending.
Amortization of Other Intangible Assets. Amortization of other intangible assets was $4.7 million and $6.9 million for the year ended December 31, 2009 and 2008, respectively, a decrease of $2.2 million, or 31.5%, due to non-compete agreements that became fully amortized during the fourth quarter of 2008. We expect amortization of other intangible assets to increase approximately $0.1 million in 2010, as a result of our acquisition of Planetweb, Inc.
Interest Expense, Net
Interest expense, net of interest income was $4.4 million in 2009, as compared to $8.1 million in 2008, a decrease of $3.7 million, or 45.1%. The decrease is the result of lower total debt outstanding in 2009 as compared to 2008, as well as a decreased rate of interest on the outstanding debt. Total debt outstanding, net of unamortized financing and debt discounts, at December 31, 2009 was $91.4 million as compared to $113.6 million at December 31, 2008. In March 2009, we paid $7.4 million on the principal of our Amended and Restated Credit Agreement in accordance with the agreement. On October 30, 2009, we amended our Amended and Restated Credit Agreement primarily to permit us to use up to $15.0 million in cash per year for acquisitions. In connection with this amendment, the rate of interest on our debt increased 1 percentage point, and we made a $5.0 million principal payment on the note. See Note 6 of our consolidated financial statements for further details on this amendment. At December 31, 2009, the blended rate of interest on our Amended and Restated Credit Agreement was 4.0%, as compared to a blended rate of interest of 3.2% at December 31, 2008. We anticipate a further reduction in our interest expense going forward as we expect principal reductions to outweigh the one percent increase in our rate of interest resulting from the recent debt amendment.
(Gain) Loss on Foreign Exchange
(Gain) loss on foreign exchange was a gain of $0.4 million and a loss of $1.0 million in 2009 and 2008, respectively, related mainly to our Euro denominated intercompany note. During 2009, we recorded a gain of $0.6 million on the note, and in 2008 we recorded a loss of $1.1 million on the note.
Loss (Gain) on Derivatives
Loss (gain) on derivatives was a loss of $1.5 million and a gain of $0.6 million in 2009 and 2008, respectively. These amounts include cash payments under our interest rate swap contract of $1.4 million and $52 thousand, in 2009 and 2008, respectively. In 2009 we recorded losses on both of our swap instruments. In 2008, we recorded a gain of $1.9 million on our currency swap instrument, which was partially offset by a loss on our interest rate swap contract of $1.3 million.
Provision for Income Taxes
For the year ended December 31, 2009, our effective tax rate was 36.1%. Our 2009 effective tax rate is lower than our 2008 effective tax rate, primarily due to an increased benefit related to foreign tax credits and non-deductible stock registration costs in 2008 that did not occur in 2009. During the fourth quarter of 2009, the Company repatriated earnings from its Japanese subsidiary resulting in a foreign tax credit benefit, as the Japan tax rate on the underlying credits is greater than the U.S. tax on the repatriation of earnings. Non-deductible stock registration costs in 2008 increased the effective tax rate 1.6%. There was no similar item in 2009.
For the year ended December 31, 2008, our effective tax rate was 38.8%. Our 2008 effective tax rate was higher than our 2007 effective tax rate of 34.8%, primarily due to the fact that the 2007 rate was decreased by 10.3% as a result of a change in German tax laws enacted in the third quarter of 2007,
41
Table of Contents
reducing our tax rate on German taxable income and related German deferred tax liabilities from 40% to 30%. This increase was offset by a decrease in the impact of non-deductible share based compensation on the 2008 tax rate by approximately 7.1% compared to 2007, due to a decrease in the amount of non-deductible share based compensation coupled with an increase in the Company’s pretax income. In addition, the 2008 effective tax rate increased by 1.6% due to non-deductible stock registration costs incurred during 2008 in connection with our secondary offering. In 2008 our effective tax rate also benefitted from a reduction in our state deferred tax rate of 2.1%.
In connection with the preparation of its quarterly financial statements for the three months ended September 30, 2008, the Company discovered that it had been erroneously providing for state income taxes based on an incorrect apportionment methodology since 2005. The methodology applied resulted in the overstatement of deferred tax liabilities and a corresponding overstatement of its provision for income taxes. In accordance with SEC Staff Accounting Bulletin (SAB) No. 99, Materiality and SAB No. 108, Considering the Effects of Prior Year Misstatements when Quantifying Misstatements in Current Year Financial Statements, or SAB 108, the Company assessed the materiality of this error on its financial statements for the year ended December 31, 2007, using both the roll-over method and iron-curtain method as defined in SAB 108. The Company concluded the effect of this error was not material to its financial statements for any prior period and, as such, those financial statements are not materially misstated. The Company also concluded that providing for the correction of the error in 2008 will not have a material effect on its financial statements for the year ending December 31, 2008. Accordingly, the Company recorded a reduction to its provision for income taxes of $0.5 million and a corresponding reduction to its deferred income tax liabilities in 2008 to correct this error.
As of December 31, 2009, the total amount of unrecognized tax benefits was $1.5 million. At December 31, 2008, we had $1.6 million of unrecognized tax benefits. We classify potential interest and penalties as a component of tax expense. As of December 31, 2009 and 2008 we had $0.4 million and $0.4 million of accrued interest and penalties, respectively.
Year Ended December 31, 2008 as Compared to Year Ended December 31, 2007
Sales by Market. The following table presents revenue for these two principal markets (in thousands):
| 2008 | 2007 | Increase | |||||||
| OEM |
$ | 77,810 | $ | 72,612 | $ | 5,198 | |||
| Creative professional |
33,051 | 32,540 | 511 | ||||||
| Total revenue |
$ | 110,861 | $ | 105,152 | $ | 5,709 | |||
Revenue
Revenue was $110.9 million and $105.2 million for the years ended December 31, 2008 and 2007, respectively, an increase of $5.7 million, or 5.4%, mainly due to increased OEM revenue. OEM revenue increased $5.2 million, or 7.2%, to $77.8 million for the year ended December 31, 2008 from $72.6 million for the year ended December 31, 2007. Approximately $4.9 million, or 94.7%, of the increase was the result of increased royalty and license revenue in 2008. Royalty revenue increased in our display imaging, driver and printer imaging during 2008, as compared to 2007. The license revenue increase was mainly the result of an increase in display imaging. More than half of the increase in OEM in 2008 as compared to 2007 related to display imaging.
Creative professional revenue was $33.1 million and $32.5 million for the years ended December 31, 2008 and 2007, respectively, an increase of $0.5 million, or 1.6%, the result of increased
42
Table of Contents
direct and indirect revenue. Web sales increased 10% year-over-year, which was offset by decreased custom revenue in the same period. A portion of the increase in web revenue was due to price increases on our web products instituted on April 1, 2008. By contrast, we saw a 43% decline in custom font orders from our corporate customers during the year ended December 31, 2008, as compared to the same period in 2007, which we believe is mainly the result of the recent economic downturn.
Cost of Revenue
Cost of revenue, excluding amortization of acquired technology, was $9.1 million and $8.7 million for the year ended December 31, 2008 and 2007, respectively, an increase of $0.4 million, or 4.6%. Part of the increase was due to the increase in revenue and the rest was due to product mix over the prior period. Cost of revenue as a percentage of total revenue was 8.2% and 8.3% for the years ended December 31, 2008 and 2007, respectively, which reflects a more favorable product mix in 2008 as compared to 2007. We performed less custom work in 2008 as compared to 2007 which typically has a higher associated cost.
Amortization of acquired technology was $3.4 million in both years ended December 31, 2008 and 2007.
Gross Profit
Gross profit was 88.7% in the year ended December 31, 2008, compared to 88.5% in the same period in 2007. Our gross profit percentage is influenced by a number of factors including product mix, pricing and volume at any particular time. The percentage of OEM revenue as compared to total revenue was consistent year-over-year; 70.2% in 2009 and 69.1% in 2008. Our OEM revenue typically has a lower associated cost than our creative professional revenue and the fairly consistent revenue composition in these two years resulted in a gross profit that was relatively unchanged.
Operating Expenses
Marketing and Selling. Marketing and selling expense was $22.9 million and $19.2 million in 2008 and 2007, respectively, an increase of $3.7 million, or 19.3% primarily the result of increased personnel related expenses. Personnel expenses increased $2.8 million in 2008 as compared to 2007, which included an increase in share based compensation expense of $0.7 million and severance costs of $0.3 million, related to our restructuring. Marketing and selling headcount increased 22.1% in 2008, as compared to 2007, mainly the result of shifting the primary focus of several employees from development related activities to presale customer support and commercial web site development. Increased web-based advertising spending in 2008, as compared to 2007, contributed $0.3 million to the increase.
Research and Development. Research and development expense was $14.9 million and $18.8 million, in 2008 and 2007, respectively, a decrease of $3.9 million, or 21.1%. The decrease was primarily the result of a decrease in personnel costs. Share based compensation expense decreased $2.2 million in 2008 as compared to 2007, primarily due to the conversion of China Type Design promissory notes into shares of restricted stock in connection with our initial public offering in 2007. In 2007, we recorded $2.6 million of share based compensation expense on these awards, of which $2.1 million relates to the conversion, and in 2008 we recorded a credit of $0.1 million. A significant portion of the China Type Design share based compensation is accounted for in accordance with the rules for non-employee stock awards and as a result, fluctuates with changes in our stock price. This was partially offset by an increase in share based compensation expense on employee awards of $0.5 million in 2008, as compared to 2007. Other personnel related expenses decreased $1.4 million. During 2008, there was a shift in the primary focus of several employees from development related activities toward presale customer support and commercial web site development. This shift resulted in a 17% reduction in research and development headcount; however, increased salaries and increases in other personnel related expenses offset the majority of the decrease in expenses from this reduction in headcount.
43
Table of Contents
General and Administrative. General and administrative expense was $19.9 million and $15.6 million in 2008 and 2007, respectively, an increase of $4.3 million, or 27.4%. Increased personnel costs contributed $1.7 million to the overall increase, which included increased share based compensation expense of $0.9 million, the result of severance costs of $0.3 million, associated with our restructuring, and increased headcount for most of the year along with annual compensation increases in 2008, as compared to 2007. Increased spending on Sarbanes-Oxley Act compliance of $0.7 million in 2008, as compared to 2007, also contributed to the overall increase. Our first year of compliance with all provisions of the Sarbanes-Oxley Act was 2008. In the second quarter of 2008, we filed a registration statement with respect to a secondary offering of our common stock under a contractual agreement with a shareholder, which contributed $1.2 million to the overall increase in general and administrative expenses in 2008, compared to $0.3 million in expense in the same period of 2007 related to our initial public offering. The cost of filing the registration statement was recorded as an expense because the Company did not receive proceeds from the offering. Legal expenses, other than those associated with the registration statement, increased $0.5 million primarily the result of the ongoing protection of our intellectual property.
Amortization of Other Intangible Assets. Amortization of other intangible assets was $6.9 million and $7.2 million for the years ended December 31, 2008 and 2007, respectively, a decrease of $0.2 million, or 3.3%, primarily due to non-compete agreements that became fully amortized during the fourth quarter of 2008.
Interest Expense, Net
Interest expense, net of interest income was $8.1 million in 2008, as compared to $17.6 million in 2007, a decrease of $9.5 million, or 54.0%. The decrease is the result of lower total debt outstanding in 2008 as compared to 2007, as well as a lower rate of interest on the outstanding debt throughout most of 2008 as compared to 2007. Total debt outstanding, net of unamortized financing and debt discounts, at December 31, 2008 was $113.6 million as compared to $131.4 million at December 31, 2007. In April 2008, we paid approximately $6.8 million on the principal of our Amended and Restated Credit Agreement in accordance with the agreement. At December 31, 2008, the blended rate of interest on our Amended and Restated Credit Agreement was 3.2% as compared to a blended rate of interest of 7.8% at December 31, 2007.
(Gain) Loss on Foreign Exchange
(Gain) loss on foreign exchange was a loss of $1.0 million and a gain of $2.1 million in 2008 and 2007, respectively, a decrease of $3.1 million, primarily due to a loss on our intercompany note. We recorded a $1.1 million loss on our Euro denominated intercompany note in 2008, as compared to a gain of $2.1 million on this note in 2007.
Loss (Gain) on Derivatives
Loss (gain) on derivatives was a gain of $0.6 million and a gain of $14 thousand in 2008 and 2007, respectively, an increase of $0.6 million, primarily due to an increase in our use of derivatives to manage risks. During 2008, we entered into a long term currency swap contract to mitigate exposure on our Euro denominated intercompany note. In 2008, the gain on this derivative was $1.9 million. This was partially offset by a loss on our interest rate swap of $1.3 million in 2008. We entered into a long term interest rate swap contract in November 2008 to mitigate our exposure to interest rate fluctuations on our debt obligations. There were no currency swap contracts or interest rate swap contracts outstanding in 2007. In 2007 the gain of $14 thousand related to our interest rate caps.
44
Table of Contents
Loss on Extinguishment of Debt
In 2007, we recorded a loss of approximately $3.0 million on the extinguishment of our Second Lien Credit Facility. On July 30, 2007, we paid in full the $70 million balance on our Second Lien Credit Facility using the proceeds from our initial public offering, the refinancing of our First Lien Credit Facility and cash on hand. We incurred a prepayment penalty of $1.4 million as a result of the transaction and wrote off approximately $1.6 million in unamortized deferred financing costs. There were no similar charges during the same period in 2008.
Provision for Income Taxes
For the year ended December 31, 2008, our effective tax rate was 38.8%. The 2008 effective rate was higher than the 2007 effective tax rate of 34.8%, primarily due to a decrease in the 2007 rate by 10.3% as a result of a change in German tax laws enacted in the third quarter of 2007, reducing our tax rate on German taxable income and related German deferred tax liabilities from 40% to 30%. As a result, deferred taxes related to our German operations have been adjusted to reflect the rates expected to be in effect when those deferred taxes are expected to reverse. In 2008, our effective tax rate was reduced by 2.1% resulting from a reduction in state income tax rates, and the corresponding adjustment to deferred state income taxes. This was partially offset by a decrease in non-deductible share based compensation in 2008 to 1.7%, from 8.8%, the result of a reduction in the amount of non-deductible share based compensation expense coupled with an increase in the Company’s pre-tax income. In addition, the 2008 effective tax rate increased by 1.6% due to non-deductible stock registration costs incurred during 2008.
We recorded a tax provision of $9.8 million during the 2008 fiscal year. The effective tax rate for 2008 was 38.8% of income before taxes, compared to an effective tax rate of 34.8% of income before taxes for 2007. Our tax rate in 2008 differs from the statutory rates primarily due to the effects of stock compensation charges of $1.2 million that will not result in a tax deduction in the future. This had the effect of increasing the tax provision by $0.4 million and the overall effective tax rate by 1.7%. In addition, the 2008 tax rate is increased as a result of the effect of non-deductible stock registration costs of $1.2 million that had the effect of increasing the provision by $0.4 million, and the overall effective tax rate by 1.6%.
As part of the process of preparing our consolidated financial statements, we are required to estimate our income taxes in each of the jurisdictions in which we operate. This process involves estimating our actual current tax expense together with assessing the future impact of temporary differences resulting from differing treatment of items for tax and accounting purposes. The tax effect of these temporary differences is shown on our December 31, 2008 consolidated balance sheet (see Note 9 to our consolidated financial statements) and denotes these differences as a net deferred tax liability of $15.1 million. This consists of total deferred tax liabilities of $18.3 million and net deferred tax assets of $3.2 million after providing a valuation allowance of $3.0 million.
Recently Issued Accounting Pronouncements
Fair Value Measurements and Disclosures
In January 2010, the Financial Accounting Standards Board (“FASB”) issued ASC Topic No. 820, Fair Value Measurement and Disclosures, (“ASC 820”). ASC 820 improves disclosures about fair value measurements, requiring disclosures about valuation techniques and inputs used to measure fair value for both recurring and non-recurring fair value measurements (class Level 2 or Level 3). In addition, more details are required regarding significant transfers between Levels 1 and 2 and the reasons for these transfers. New disclosures and clarifications regarding existing disclosures are effective for interim and annual reporting periods beginning after December 15, 2009, except for details regarding purchases, sales, issuances and settlements in the activity roll forward of class Level 3 which are effective for fiscal
45
Table of Contents
periods beginning after December 15, 2010 and interim periods within those fiscal periods. We adopted the first provision of ASC 820 and the adoption did not have a material impact on the Company’s results of operations, financial position or liquidity.
Multiple-Deliverable Revenue Arrangements
In October 2009, the FASB approved for issuance ASC Subtopic No. 605-25, Revenue Recognition Multiple-Element Arrangements, or ASC 605-25. ASC 605-25 provides principles for allocation of consideration among its multiple-elements, allowing more flexibility in identifying and accounting for separate deliverables under an arrangement. It introduces an estimated selling price method for valuing the elements of a bundled arrangement if vendor-specific objective evidence or third-party evidence of selling price is not available, and significantly expands related disclosure requirements. ASC 605-25 is effective on a prospective basis for revenue arrangements entered into or materially modified in fiscal years beginning on or after June 15, 2010. Alternatively, adoption may be on a retrospective basis, and early application is permitted. We are currently evaluating the impact of adopting this pronouncement.
Earnings Per Share
On July 1, 2009, we adopted the updated provisions issued by the FASB within ASC 260-10-45-61A for earnings per share. The new guidance provides that unvested share-based payment awards that contain non-forfeitable rights to dividends or dividend equivalents (whether paid or unpaid) are participating securities and shall be included in the computation of earnings per share pursuant to the two-class method. The two-class method determines earnings per share for each class of common stock and participating security according to their respective participation rights in undistributed earnings. Our unvested restricted stock awards granted to employees are considered participating securities as they receive non-forfeitable rights to cash dividends at the same rate as common stock. Upon adoption, a company is required to retrospectively adjust our earnings per share data to conform to the new provisions. We retrospectively adopted the provisions within ASC 260-10-45-61A on January 1, 2009 and adoption did not have a material impact on our condensed consolidated financial statements. Details regarding the impact of the adoption can be found in Note 11 to our consolidated financial statements.
Accounting Standards Codification
In June 2009, the FASB issued Statement of Financial Accounting Standards No. 168, The FASB Accounting Standards Codification and the Hierarchy of Generally Accepted Accounting Principles — a replacement of FASB Statement No. 162, or the Codification. The Codification reorganized existing U.S. accounting and reporting standards issued by the FASB and other related private sector standard setters into a single source of authoritative accounting principles arranged by topic. The Codification supersedes all existing U.S. accounting standards; all other accounting literature not included in the Codification (other than SEC guidance for publicly-traded companies) is considered non-authoritative. The Codification was effective on a prospective basis for interim and annual reporting periods ending after September 15, 2009. The adoption of the Codification changed our references to U.S. GAAP accounting standards but did not impact our results of operations, financial position or liquidity.
Subsequent Events
In May 2009, the FASB issued ASC Topic No. 855, Subsequent Events, or ASC 855. ASC 855 provides guidance to establish general standards of accounting for and disclosures of events that occur after the balance sheet date but before financial statements are issued or are available to be issued. ASC 855 also requires entities to disclose the date through which subsequent events were evaluated as well as the rationale for why that date was selected and is effective for interim and annual periods ending after June 15, 2009. ASC 855 requires that public entities evaluate subsequent events through the date that the
46
Table of Contents
financial statements are issued. We adopted ASC 855 effective with our quarterly period ending on June 30, 2009 and the adoption did not have a material impact on our condensed consolidated financial statements.
Fair Value Measurements and Impairments
On April 9, 2009, the FASB issued ASC Topic No. 825, Financial Instruments, or ASC 825. This ASC topic requires disclosures of fair value for any financial instruments not currently reflected at fair value on the balance sheet for all interim periods. ASC 825 is effective for interim and annual periods ending after June 15, 2009 and is to be applied prospectively. We adopted ASC 825 effective with our quarterly period ending on June 30, 2009 and the adoption did not have a material impact on our condensed consolidated financial statements.
On April 9, 2009 the FASB issued ASC 820-10-65-4, Fair Value Measurements and Disclosures transition guidance, or ASC 820. ASC 820 relates to determining fair values when there is no active market or where the price inputs being used represent distressed sales. Specifically, it reaffirms the need to use judgment to ascertain if a formerly active market has become inactive and in determining fair values when markets have become inactive. ASC 820 is effective for interim and annual periods ending after June 15, 2009 and is to be applied prospectively. We adopted ASC 820 effective with our quarterly period ending on June 30, 2009 and the adoption did not have a material impact on our condensed consolidated financial statements.
Derivative Instruments and Hedging Activities
In March 2008, the FASB issued ASC Topic No. 815, Derivatives and Hedging, or ASC 815. ASC 815 requires enhanced disclosures about an entity’s derivative and hedging activities. ASC 815 is effective for financial statements issued for fiscal years and interim periods beginning after November 15, 2008, with early application encouraged. We adopted ASC 815 on January 1, 2009 and the adoption did not have a material impact on our condensed consolidated financial statements. Our derivative disclosure can be found in Note 7 to our consolidated financial statements.
Business Combinations
In December 2007, the FASB issued ASC Topic No. 805, Business Combinations, or ASC 805. ASC 805 is effective for fiscal years beginning on or after December 15, 2008, and applies to all business combinations. ASC 805 provides that, upon initially obtaining control, an acquirer shall recognize 100 percent of the fair values of acquired assets, including goodwill, and assumed liabilities, with only limited exceptions, even if the acquirer has not acquired 100 percent of its target. Additionally, ASC 805 changed previous guidance, in part, as follows: (1) contingent consideration arrangements are fair valued at the acquisition date and included on that basis in the purchase price consideration; (2) transaction costs are expensed as incurred, rather than capitalized as part of the purchase price; (3) pre-acquisition contingencies, such as legal issues, will generally have to be accounted for in purchase accounting at fair value; and (4) in order to accrue for a restructuring plan in purchase accounting, the requirements in FASB ASC Topic No. 420, Exit or Disposal Cost Obligations, or ASC 420, would have to be met at the acquisition date. We adopted ASC 805 on January 1, 2009, and applied it in accounting for our acquisition of the principal assets of Planetweb, Inc. in December 2009. There was no impact to our condensed consolidated financial statements on the accounting for acquisitions completed by December 31, 2008.
47
Table of Contents
Liquidity and Capital Resources
Initial Public Offering
On July 30, 2007, we completed our initial public offering, issuing 6.5 million shares of our common stock at a price of $12.00 per share. Concurrent with the offering, all of our outstanding convertible redeemable preferred shares were converted into an aggregate of 23,361,416 shares of our common stock and 5,840,354 shares of redeemable preferred stock which were redeemed in connection with the offering. After underwriter’s commissions and other costs and expenses, we received net proceeds of approximately $67.2 million and paid the redemption cost of the redeemable preferred stock which totaled approximately $9.7 million. We used the net proceeds from the offering, net proceeds of $10.8 million from the amendment to our First Lien Credit Facility and $1.6 million of cash on hand, to pay in full the outstanding borrowings under our Second Lien Credit Facility of approximately $70.0 million, plus a $1.4 million prepayment penalty. The changes to our outstanding debt are described in Credit Facilities, below.
Cash Flows for the Years Ended December 31, 2009, 2008 and 2007
Since our inception, we have financed our operations primarily through cash from operations, private and public stock sales and long-term debt arrangements, as described below. We believe our existing cash and cash equivalents, our cash flow from operating activities and available bank borrowings will be sufficient to meet our anticipated cash needs for at least the next twelve months. At December 31, 2009, our principal sources of liquidity were cash and cash equivalents totaling $34.6 million and a $20.0 million revolving line-of-credit which was undrawn at December 31, 2009 and 2008, however, availability under the line-of-credit, was reduced by approximately $4.0 million at December 31, 2009 and 2008 as a result of our outstanding derivative instruments with our lender. Our future working capital requirements will depend on many factors, including the operations of our existing business, our potential strategic expansion, and future acquisitions we might undertake. To the extent that our cash and cash equivalents, our current debt arrangements and our cash flow from operating activities are insufficient to fund our future activities, we may need to raise additional funds through bank credit arrangements or public or private equity or debt financings. In the event additional funding is required, we may not be able to obtain bank credit arrangements or effect an equity or debt financing on terms acceptable to us, especially in light of the economic downturn and the inability or unwillingness of lenders to extend credit.
The following table presents our cash flows from operating activities, investing activities and financing activities for the periods presented (in thousands):
| Year Ended December 31, | ||||||||||||
| 2009 | 2008 | 2007 | ||||||||||
| Net cash provided by operating activities |
$ | 28,071 | $ | 30,533 | $ | 27,278 | ||||||
| Net cash used in investing activities |
(2,555 | ) | (1,125 | ) | (1,311 | ) | ||||||
| Net cash used in financing activities |
(22,853 | ) | (17,957 | ) | (15,873 | ) | ||||||
| Effect of exchange rates on cash and cash equivalents |
12 | 906 | 950 | |||||||||
| Total increase in cash and cash equivalents |
$ | 2,675 | $ | 12,357 | $ | 11,044 | ||||||
Operating Activities
Since 2005, our operating activities have generated positive cash flows. Significant variations in operating cash flows frequently occur because, from time to time, our customers make prepayments against future royalties. Prepayments may be required under the terms of our license agreements and are occasionally made on an elective basis and often cause large fluctuations in accounts receivable and deferred revenue. The timing and extent of such prepayments significantly impact our cash balances.
48
Table of Contents
In 2009 we generated $28.1 million in cash from our operations. Net income after adjusting for depreciation and amortization, amortization of deferred financing costs, loss on retirement of fixed assets, share based compensation, excess tax benefit on stock options, deferred income taxes, provision for doubtful accounts, unrealized currency gain on foreign denominated intercompany transactions and unrealized losses on derivatives generated $30.6 million in cash. Accounts receivable provided $1.3 million in cash the result of our cash collection efforts during the year. Accounts payable and accrued expenses and other liabilities used $2.9 million in cash mainly due to the payment of variable compensation in March and the timing of vendor payments. At December 31, 2008, accrued expenses consisted of a large variable compensation balance resulting from strong revenue in 2008. Deferred revenue provided $0.9 million in cash, primarily the result of two large prepayments in 2009.
We generated $30.5 million in cash from operations during 2008. Net income, after adjusting for depreciation and amortization, amortization of deferred financing costs, loss on retirement of fixed assets, share based compensation, deferred income taxes, provision for doubtful accounts, unrealized currency loss on foreign denominated intercompany transactions and unrealized gains on derivatives generated $34.3 million in cash. Prepaid expense and other assets, income tax refunds receivable and deferred revenue provided cash of $3.1 million. These were offset by increases in accounts receivable and decreases in accounts payable, accrued income taxes, accrued expenses and other liabilities, together which used $6.9 million in cash. Accounts payable decreased mainly due to certain large vendor payments outstanding at December 31, 2007 for which there were no similar payments outstanding at December 31, 2008. Accrued expense decreased primarily due to larger accrued bonus and sales tax balances at December 31, 2007 than at December 31, 2008 as well as decreased accrued interest due to the timing of payments.
Net cash provided by operations for 2007 was $27.3 million as compared to $19.4 million in 2006. Net income, after adjusting for depreciation and amortization, amortization of deferred financing costs, loss on extinguishment of debt, share based compensation, deferred taxes, provision for doubtful accounts, unrealized currency gains and unrealized loss on interest rate caps generated $24.9 million in cash. Accounts receivable, accounts payable and accrued expenses and other liabilities generated $4.5 million in cash during the year, which was partially offset by a reduction in our prepaid expenses and other assets and deferred revenue of $2.5 million. The increase in accrued expenses was mainly due to an increase in foreign sales tax in the current year. We had a one-time tax exemption in 2006 from foreign sales tax in a particular jurisdiction. Net cash provided by accrued income taxes of $1.8 million was partially offset by a use of cash from income tax refund receivable of $1.4 million mainly the result of a lower German effective tax rate and an increase in the amount of our tax deduction for goodwill.
Investing Activities
During 2009, we acquired a business, Planetweb, Inc. which used cash of $1.7 million. We have accrued $0.2 million at December 31, 2009, pending final adjustments. The remainder of the cash used in investing activities in 2009, approximately $0.8 million, was used to purchase property and equipment. During 2008, cash used in investing activities was $1.1 million, consisting of purchases of property and equipment. During 2007, cash used in investing activities was $1.3 million which consisted primarily of purchases of property and equipment of $1.2 million.
Financing Activities
During 2009, we used $22.5 million in cash to pay down our long-term debt obligations. This amount included a $5.0 million principal prepayment on our note in accordance with the second amendment to our Amended and Restated Credit Agreement, discussed in Credit Facilities below. We incurred $0.6 million in refinancing costs associated with the debt amendment.
49
Table of Contents
During 2008, we used $18.0 million of cash in financing activities, primarily related to debt payments. Payments on our long-term debt obligations used $18.6 million in cash. We received $0.6 million in cash from stock option exercises.
During 2007, we used $15.9 million of cash in financing activities. We received $67.4 million in cash from the issuance of common stock associated with our initial public offering, net of underwriter’s commissions and other costs and expenses. During the year, we received $10.8 million in net proceeds from an amendment to our First Lien Credit Facility. Payments on long-term debt were $84.2 million of which $70.0 million related to our Second Lien Credit Facility and the remainder was related to installment payments on our debt obligations. We paid $1.4 million in penalties associated with the early repayment of our Second Lien Credit Facility. We also used $9.7 million for the redemption of our redeemable preferred stock in connection with the initial public offering. In addition, we received a tax benefit on stock options of $0.9 million.
Credit Facilities
On July 30, 2007, in connection with our initial public offering, we amended and restated our First Lien Credit Facility. Upon entering into our Amended and Restated Credit Agreement on July 30, 2007, the principal amount of our term loan was increased to $140.0 million payable in monthly installments of approximately $1.2 million throughout the term of the facility, which expires in July 2012. The Amended and Restated Credit Agreement provides for an additional annual mandatory principal payment based on excess cash flow, as defined by the agreement, or $5.2 million, for 2010, which must be paid within five days of the delivery of our audited financial statements. Also on July 30, 2007, in connection with the initial public offering of our common stock, and with the amendment and restatement of our First Lien Credit Facility, we paid in full the balance of $70.0 million on our Second Lien Credit Facility, plus a prepayment penalty of $1.4 million. The prepayment penalty has been recognized as a debt extinguishment expense, along with approximately $1.6 million of previously capitalized debt financing costs that were written off upon the payoff and termination of the Second Lien Credit Facility. The First and Second Lien Credit Facilities were originally entered into in November 2004, to partially finance our acquisition from Agfa.
Interest rates on borrowings under the Amended and Restated Credit Agreement were at either (i) the prime rate plus 1.25%, as defined by the credit agreement, or (ii) the London Inter-Bank Offering Rate, or LIBOR, plus a 2.75%, payable monthly. The Amended and Restated Credit Agreement is secured by substantially all of our assets and places limitations on indebtedness, liens, dividends and distributions, asset sales, transactions with affiliates and acquisitions and conduct of business, all as defined in the agreements. In addition, the Amended and Restated Credit Agreement provides that we maintain a maximum leverage ratio. The leverage ratio is defined as the ratio of aggregate outstanding indebtedness to trailing twelve months Adjusted EBITDA. Adjusted EBITDA is defined as consolidated net earnings (or loss), plus net interest expense, income taxes, depreciation and amortization and share based compensation expense. The Amended and Restated Credit Agreement also contains a no material adverse change clause.
In May 2007, we amended our First Lien and Second Lien Credit Facilities to define Adjusted EBITDA as described above. In July 2007, we terminated our Second Lien Credit Facility and recognized approximately $3.0 million of debt extinguishment expense. We also amended our First Lien Credit Facility to provide additional borrowings, reduce our interest rate and modify covenants; however, the Adjusted EBITDA definition was not changed.
On April 17, 2008, we amended our First Lien Credit Facility to increase the beneficial ownership threshold in the change of control definition.
50
Table of Contents
On October 30, 2009, the Company, Monotype Imaging Inc., Imaging Holdings Corp., International Typeface Corporation (collectively, the “Borrowers”) entered into a second amendment (the “Second Amendment”) to our Amended and Restated Credit Agreement. The Second Amendment amended, among other items, the following terms:
| • | Modified exceptions to the negative covenants to permit the Borrowers to create unsecured subordinated indebtedness represented by seller notes in connection with permitted acquisitions, provided that such indebtedness does not exceed $5,000,000 in the aggregate. |
| • | Modified the definition of “Adjusted EBITDA” by, among other things, allowing for the add-back of restructuring, issuance and cash non-operating costs and other expenses or losses which do not represent a cash item. Restructuring, issuance and cash non-operating costs include fees, costs and expenses incurred by the Company and its subsidiaries in connection with stock registrations and issuances, debt modifications, business restructurings and cash non-operating expenses, provided that all such cash non-operating expenses shall not exceed $250,000 and all such fees, costs and expense shall not exceed $1,500,000, in each case on a trailing twelve month basis. |
| • | Increased the prime rate margin to 2.25% from 1.25% and LIBOR rate margin to 3.75% from 2.75%. |
| • | The “Excess Cash Flow” definition was modified to permit, among other things, the exclusion of cash payments made to fund permitted discrete asset acquisitions and permitted acquisitions from the calculation of excess cash flow. A permitted discrete asset acquisition pursuant to the Second Amendment is an acquisition by any loan party of certain non-operational assets of any person which, among other conditions, are related to the Borrowers’ business and have a purchase price not in excess of $1,500,000. The purchase price for all such acquisitions shall not exceed $3,000,000 in the aggregate. |
| • | The “Permitted Acquisition” definition was modified to, among other things, include acquisitions by any loan party and by certain non-U.S. subsidiaries of the Company which, among other requirements, (i) have a purchase price which does not exceed an aggregate amount of $15,000,000 together with all other acquisitions consummated during any fiscal year and (ii) immediately prior to and after giving effect to such acquisition, the Borrowers have unrestricted cash and cash equivalents of $20,000,000, either through the Company’s line of credit or cash on hand. |
| • | The “Permitted Investment” definition was modified to, among other things, include investments by loan parties in certain non-U.S. subsidiaries of the Company in an aggregate amount during any fiscal year not to exceed $15,000,000 for the purpose of funding Permitted Acquisitions, as defined in the Second Amendment. |
| • | Required the Company to make a prepayment of principal of the term loan in an aggregate amount equal to $5,000,000, together with accrued interest on such principal amount being prepaid through the date of prepayment as well an amendment fee of $0.6 million, which was accounted for as a debt discount. Accordingly, these costs are amortized into interest expense over the life of the related loans using the effective interest method. |
As of December 31, 2009, the maximum leverage ratio permitted was 2.75:1.00 and our leverage ratio was 2.28:1.00. The maximum leverage ratio decreased by 0.50 in the quarter ended March 31, 2009 to 2.75:1.00, from 3.25:1.00. It will remain at 2.75:1.00 for the remainder of the term of the agreement. As of December 31, 2009, the blended interest rate on the Amended and Restated Credit Agreement was 4.0%. There was no change to the leverage covenant ratio. We do not expect that the leverage and liquidity covenants will affect our ability to operate our business and we expect will be able to meet these compliance requirements in the future.
51
Table of Contents
The following table presents a reconciliation from net income, which is the most directly comparable GAAP operating performance measure, to EBITDA and from EBITDA to Adjusted EBITDA as defined in our credit facilities (in thousands):
| Year Ended December 31, | ||||||||||
| 2009 | 2008 | 2007 | ||||||||
| Net income |
$ | 13,402 | $ | 15,381 | $ | 9,064 | ||||
| Provision for income taxes |
7,575 | 9,770 | 4,832 | |||||||
| Interest expense, net |
4,435 | 8,077 | 17,554 | |||||||
| Depreciation and amortization |
9,298 | 11,441 | 11,567 | |||||||
| EBITDA |
$ | 34,710 | $ | 44,669 | $ | 43,017 | ||||
| Share based compensation |
5,186 | 3,634 | 4,257 | |||||||
| Non-cash add backs |
(163 | ) | N/A | N/A | ||||||
| Restructuring, issuance and cash non-operating costs (3) |
969 | N/A | N/A | |||||||
| Acquisition expenses |
65 | N/A | N/A | |||||||
| Adjusted EBITDA (1)(2) |
$ | 40,767 | $ | 48,303 | $ | 47,274 | ||||
| (1) | Adjusted EBITDA is not a measure of operating performance under GAAP and should not be considered as an alternative or substitute for GAAP profitability measures such as income (loss) from operations and net income (loss). Adjusted EBITDA as an operating performance measure has material limitations since it excludes the statement of income impact of depreciation and amortization expense, interest expense, net, the provision (benefit) for income taxes and share based compensation and therefore does not represent an accurate measure of profitability, particularly in situations where a company is highly leveraged or has a disadvantageous tax structure. We have significant intangible assets and amortization expense is a meaningful element in our financial statements and therefore its exclusion from Adjusted EBITDA is a material limitation. We have a significant amount of debt, and interest expense is a necessary element of our costs and therefore its exclusion from Adjusted EBITDA is a material limitation. We generally incur significant U.S. federal, state and foreign income taxes each year and the provision (benefit) for income taxes is a necessary element of our costs and therefore its exclusion from Adjusted EBITDA is a material limitation. Share based compensation and the associated expense has a meaningful impact on our financial statements. Non-cash expenses, restructuring, issuance and cash non-operating expenses have a meaningful impact on our financial statements. Therefore, their exclusion from Adjusted EBITDA is a material limitation. As a result, Adjusted EBITDA should be evaluated in conjunction with net income (loss) for complete analysis of our profitability, as net income (loss) includes the financial statement impact of these items and is the most directly comparable GAAP operating performance measure to Adjusted EBITDA. As Adjusted EBITDA is not defined by GAAP, our definition of Adjusted EBITDA may differ from and therefore may not be comparable to similarly titled measures used by other companies, thereby limiting its usefulness as a comparative measure. Because of the limitations that Adjusted EBITDA has as an analytical tool, investors should not consider it in isolation, or as a substitute for analysis of our operating results as reported under GAAP. |
| (2) | The definition of Adjusted EBITDA was modified on October 30, 2009 as detailed above. As a result, certain add backs to Adjusted EBITDA are not applicable in years ended December 31, 2008 and 2007. |
| (3) | Permits an add-back of up to $250 thousand of cash non-operating expense, which is not to exceed $1.5 million when combined together with restructuring and issuance costs. |
The Amended and Restated Credit Agreement also contains provisions for an increased interest rate during periods of default. We do not believe that these covenants will affect our ability to operate our business, and we were in compliance with the covenants under our Amended and Restated Credit Agreement as of December 31, 2009.
52
Table of Contents
Other Liquidity Matters
Contractual Obligations
The following summarizes our contractual obligations at December 31, 2009 and the effect of such obligations on liquidity and cash flow in future years (in thousands).
| Contractual Obligations |
Total | 2010 | 2011-2012 | 2013-2014 | Thereafter | ||||||||||
| Long-term debt (1) |
$ | 93,138 | $ | 16,293 | $ | 76,845 | $ | — | $ | — | |||||
| Operating leases (2) |
7,340 | 1,730 | 3,477 | 1,829 | 304 | ||||||||||
| License fees (2) |
1,000 | 900 | 100 | — | — | ||||||||||
| Total |
$ | 101,478 | $ | 18,923 | $ | 80,422 | $ | 1,829 | $ | 304 | |||||
| (1) | See Note 6 to the audited consolidated financial statements included in this report under Item 8. |
| (2) | See Note 15 to the audited consolidated financial statements regarding contractual obligations included in this report under Item 8. |
In addition to the above, we have contractual obligations under our interest rate swap and currency swap instruments at December 31, 2009. The interest rate swap contract has a notional amount of $50.0 million and matures on November 28, 2010. Under the terms of the agreement, we pay a fixed rate of interest on the notional amount of 2.2% and receive interest on the notional amount at the floating one-month LIBOR rate, which at December 31, 2009 was 0.2353%. Net settlements are due monthly. Under the currency swap contract, we pay 1.0 million Euros and we receive payments of $1.5 million quarterly. The currency swap contract terminates on December 2012.
We may be required to make cash outlays related to our unrecognized tax benefits. However, due to the uncertainty of the timing of future cash flows associated with our unrecognized tax benefits, we are unable to make reasonably reliable estimates of the period of cash settlement, if any, with the respective taxing authorities. Accordingly, unrecognized tax benefits of $1.5 million as of December 31, 2009 have been excluded from the contractual obligations table above. For further information on unrecognized tax benefits, see Note 9 to our consolidated financial statements included in this report under Item 8.
In addition to the above, we have a pension obligation under the Linotype defined benefit pension plan. The total projected benefit obligation is $3.5 million and details regarding this plan are located in Note 8 to our consolidated financial statement included in this report under Item 8.
Legal proceedings and disputes
Details on recent legal matters can be found in Note 15 to our consolidated financial statements included in this report under Item 8.
Off-Balance Sheet Arrangements
As of December 31, 2009 and 2008, we did not have any relationships with unconsolidated entities, often referred to as special purpose entities, which would have been established for the purpose of facilitating off-balance sheet arrangements or other contractually narrow or limited purposes. Other than our operating leases for office space and computer equipment, and derivative financial instruments discussed in “Quantitative and Qualitative Disclosures about Market Risk,” we do not engage in off-balance sheet financing arrangements.
| Item 7A. | Quantitative and Qualitative Disclosures about Market Risk |
We are exposed to financial market risk, including interest rate risk and foreign currency exchange risk.
53
Table of Contents
Concentration of Revenue and Credit Risk
Financial instruments that potentially subject us to concentrations of credit risk consist principally of cash and cash equivalents and trade receivables. Cash equivalents consist primarily of bank deposits and overnight repurchase agreements. Deposits of cash held outside the United States totaled approximately $4.3 million and $10.8 million at December 31, 2009 and 2008, respectively.
We grant credit to customers in the ordinary course of business. Credit evaluations are performed on an ongoing basis to reduce credit risk, and no collateral is required from our customers. An allowance for uncollectible accounts is provided for those accounts receivable considered to be uncollectible based upon historical experience and credit evaluation. As of December 31, 2009 two customers, Okidata Corporation and Samsung individually accounted for 15% and 12%, respectively, of our gross accounts receivable. As of December 31, 2008 one customer, Nokia accounted for 19% of our gross accounts receivable. Due to the nature of our quarterly revenue streams derived from royalty revenue, it is not unusual for our accounts receivable balances to include a few customers with large balances. Historically, we have not recorded material losses due to customers’ nonpayment.
For the years ended December 31, 2009, 2008 and 2007, no customer accounted for more than 10% of our revenue.
Interest Rate Risk
We use interest rate derivative instruments to hedge our exposure to interest rate volatility resulting from our variable rate debt, as more fully described in Note 7 to our consolidated financial statements included in this report under Item 8. ASC Topic No. 815, Derivatives and Hedging, or ASC 815, requires that all derivative instruments be reported on the balance sheet at fair value and establishes criteria for designation and effectiveness of hedging relationships, including a requirement that all designations must be made at the inception of each instrument. As we did not make such initial designations, changes in the fair value of the derivative instrument to be recognized as current period income or expense.
The fair value of derivative instruments is estimated based on the amount that we would receive or pay to terminate the agreements at the reporting date. Our exposure to market risk associated with changes in interest rates relates primarily to our long term debt. The interest rate on our Amended and Restated Credit Agreement fluctuates with either the prime rate or the LIBOR interest rate. At December 31, 2009, the blended rate of interest on our outstanding debt was 4.0%. For each one percent increase in interest rates our interest expense would increase by $0.9 million; however, this would be mitigated by our interest rate swap. We purchase interest rate swap instruments to hedge our exposure to interest rate fluctuations on our debt obligations. On November 28, 2008 we entered into a long term interest rate swap contract to pay a fixed rate of interest of 2.2% in exchange for a floating rate interest payment tied to the one-month LIBOR. The contract has a notional amount of $50.0 million and matures on November 28, 2010. The total fair value of the financial instrument at December 31, 2009 and 2008 was a liability of approximately $0.8 million and $1.3 million, respectively. In 2009 and 2008, we recognized a loss of $0.9 million and $1.3 million, respectively, which has been included in loss (gain) on derivatives in the accompanying consolidated statement of income.
We purchase interest rate cap instruments to hedge our exposure to fluctuations in interest rates on our debt obligations. At December 31, 2009 and 2008 we had one interest rate cap contract outstanding totaling $95.0 million. The contract has a fixed rate of 6.5% and expires on December 31, 2010. The notional amount decreased $15.0 million during 2009, with other additional reductions scheduled until it reaches a notional amount of $75.0 million at maturity, to approximate the outstanding balance on our debt over the same period of time. Under this contract, to the extent that LIBOR exceeds a fixed maximum rate, we will receive payments on the notional amount. At December 31, 2008, there was a
54
Table of Contents
shortfall of approximately $4 million of our total debt that was unhedged. The total fair value of these financial instruments at December 31, 2009 and 2008 was approximately $3 thousand and $13 thousand, respectively.
Foreign Currency Exchange Rate Risk
In accordance with ASC Topic No. 830, Foreign Currency Matters, or ASC 830, all assets and liabilities of our foreign subsidiaries whose functional currency is a currency other than U.S. dollars are translated into U.S. dollars at an exchange rate as of the balance sheet date. Revenue and expenses of these subsidiaries are translated at the average monthly exchange rates. The resulting translation adjustments as calculated from the translation of the foreign subsidiaries to U.S. dollars are recorded as a separate component of stockholders’ equity.
We also incur foreign currency exchange gains and losses related to certain customers that are invoiced in U.S. dollars, but who have the option to make an equivalent payment in their own functional currencies at a specified exchange rate as of a specified date. In the period from that date until payment in the customer’s functional currency is received and converted into U.S. dollars, we can incur realized gains and losses. To mitigate our exposure we utilize forward contracts with maturities of 90 days or less to hedge our exposure to these currency fluctuations. Any increase or decrease in the fair value of the forward contracts is offset by the change in the value of the hedged assets of our consolidated foreign affiliate. At December 31, 2009 and 2008 there were no currency contracts outstanding.
In addition, we incur foreign currency exchange rate gains and losses on an intercompany note with one of our foreign subsidiaries that is denominated in Euros. At December 31, 2009 the note balance was approximately $17.2 million. The effect of an immediate 10% strengthening of the U.S. dollar as compared to the Euro would result in a $1.7 million unrealized transaction loss on this note receivable which would be reported in (gain) loss on foreign exchange within our results of operations; however, this would be mitigated by our currency swap. On May 7, 2008, we entered into a long term currency swap contract to purchase 18.3 million Euros in exchange for $28.0 million to mitigate our exposure to currency fluctuation risk on this note. The contract payment terms approximate the payment terms of this intercompany note and the notional amount is amortized down over time as payments are made. The total fair value of the currency swap instrument at December 31, 2009 was $1.1 million. For the year ended December 31, 2009 and 2008, we incurred a loss of $0.6 million and a gain of $1.9 million, respectively, on the currency swap contract which is included in loss (gain) on derivatives in the accompanying consolidated statements of income. Prior to May 7, 2008, this note was unhedged. The loss and gain on the intercompany note are included in (gain) loss on foreign exchange in the accompanying consolidated statements of income.
55
Table of Contents
| Item 8. | Financial Statements and Supplementary Data |
MONOTYPE IMAGING HOLDINGS INC.
INDEX TO CONSOLIDATED FINANCIAL STATEMENTS
56
Table of Contents
REPORT OF INDEPENDENT REGISTERED PUBLIC ACCOUNTING FIRM
The Board of Directors and Stockholders of Monotype Imaging Holdings Inc.
We have audited the accompanying consolidated balance sheets of Monotype Imaging Holdings Inc. as of December 31, 2009 and 2008, and the related consolidated statements of income, convertible redeemable preferred stock, redeemable preferred stock and stockholders’ equity (deficit), and cash flows for each of the three years in the period ended December 31, 2009. Our audits also included the financial statement schedule listed in the Index at Item 15(a). These financial statements and schedule are the responsibility of the Company’s management. Our responsibility is to express an opinion on these financial statements and schedule based on our audits.
We conducted our audits in accordance with the standards of the Public Company Accounting Oversight Board (United States). Those standards require that we plan and perform the audit to obtain reasonable assurance about whether the financial statements are free of material misstatement. An audit includes examining, on a test basis, evidence supporting the amounts and disclosures in the financial statements. An audit also includes assessing the accounting principles used and significant estimates made by management, as well as evaluating the overall financial statement presentation. We believe that our audits provide a reasonable basis for our opinion.
In our opinion, the financial statements referred to above present fairly, in all material respects, the consolidated financial position of Monotype Imaging Holdings Inc. at December 31, 2009 and 2008, and the consolidated results of its operations and its cash flows for each of the three years in the period ended December 31, 2009, in conformity with U.S. generally accepted accounting principles. Also, in our opinion, the related financial statement schedule, when considered in relation to the basic financial statements taken as a whole, presents fairly, in all material respects, the information set forth therein.
We also have audited, in accordance with the standards of the Public Company Accounting Oversight Board (United States), Monotype Imaging Holdings Inc.’s internal control over financial reporting as of December 31, 2009, based on criteria established in Internal Control-Integrated Framework issued by the Committee of Sponsoring Organizations of the Treadway Commission and our report dated March 5, 2010, expressed an unqualified opinion thereon.
/s/ ERNST & YOUNG LLP
Boston, Massachusetts
March 5, 2010
57
Table of Contents
MONOTYPE IMAGING HOLDINGS INC.
CONSOLIDATED BALANCE SHEETS
(in thousands, except share and per share data)
| December 31, | ||||||||
| 2009 | 2008 | |||||||
| ASSETS | ||||||||
| Current assets: |
||||||||
| Cash and cash equivalents |
$ | 34,616 | $ | 31,941 | ||||
| Accounts receivable, net of allowance for doubtful accounts of $82 and $236 at December 31, 2009 and 2008 |
5,145 | 6,010 | ||||||
| Income tax refunds receivable |
885 | — | ||||||
| Deferred income taxes |
878 | 1,637 | ||||||
| Prepaid expenses and other current assets |
1,666 | 1,603 | ||||||
| Total current assets |
43,190 | 41,191 | ||||||
| Property, plant and equipment, net |
1,790 | 2,093 | ||||||
| Goodwill |
140,745 | 138,898 | ||||||
| Intangible assets, net |
85,088 | 91,416 | ||||||
| Other assets |
1,564 | 3,823 | ||||||
| Total assets |
$ | 272,377 | $ | 277,421 | ||||
| LIABILITIES AND STOCKHOLDERS’ EQUITY | ||||||||
| Current liabilities: |
||||||||
| Accounts payable |
$ | 395 | $ | 646 | ||||
| Accrued expenses and other current liabilities |
8,635 | 12,443 | ||||||
| Accrued income taxes |
903 | 1,700 | ||||||
| Deferred revenue |
6,446 | 5,669 | ||||||
| Current portion of long-term debt |
16,293 | 17,769 | ||||||
| Total current liabilities |
32,672 | 38,227 | ||||||
| Long-term debt, less current portion |
75,060 | 95,827 | ||||||
| Other long-term liabilities |
784 | 1,064 | ||||||
| Deferred income taxes |
18,310 | 17,165 | ||||||
| Reserve for income taxes, net of current portion |
1,550 | 1,343 | ||||||
| Accrued pension benefits |
3,479 | 2,959 | ||||||
| Commitments and contingencies (Note 15) |
||||||||
| Stockholders’ equity: |
||||||||
| Preferred stock, $0.001 par value, Authorized shares: 10,000,000 at December 31, 2009 and 2008; Issued and outstanding: none |
— | — | ||||||
| Common shares, $0.001 par value; Authorized shares: 250,000,000 at December 31, 2009 and 2008; Issued: 34,668,554 and 34,512,692 at December 31, 2009 and 2008, respectively |
35 | 35 | ||||||
| Additional paid-in capital |
148,273 | 142,676 | ||||||
| Treasury stock, at cost, 95,516 and 86,194 shares at December 31, 2009 and 2008, respectively |
(86 | ) | (86 | ) | ||||
| Accumulated deficit |
(10,043 | ) | (23,445 | ) | ||||
| Accumulated other comprehensive income |
2,343 | 1,656 | ||||||
| Total stockholders’ equity |
140,522 | 120,836 | ||||||
| Total liabilities and stockholders’ equity |
$ | 272,377 | $ | 277,421 | ||||
The accompanying notes are an integral part of these financial statements.
58
Table of Contents
MONOTYPE IMAGING HOLDINGS INC.
CONSOLIDATED STATEMENTS OF INCOME
(in thousands, except share and per share data)
| Year Ended December 31, | ||||||||||||
| 2009 | 2008 | 2007 | ||||||||||
| Revenue |
$ | 94,005 | $ | 110,861 | $ | 105,152 | ||||||
| Cost of revenue |
6,861 | 9,101 | 8,705 | |||||||||
| Cost of revenue—amortization of acquired technology |
3,383 | 3,392 | 3,376 | |||||||||
| Total cost of revenue |
10,244 | 12,493 | 12,081 | |||||||||
| Gross profit |
83,761 | 98,368 | 93,071 | |||||||||
| Operating expenses: |
||||||||||||
| Marketing and selling |
23,645 | 22,911 | 19,206 | |||||||||
| Research and development |
14,142 | 14,867 | 18,837 | |||||||||
| General and administrative |
14,674 | 19,882 | 15,605 | |||||||||
| Amortization of other intangible assets |
4,744 | 6,924 | 7,162 | |||||||||
| Total operating expenses |
57,205 | 64,584 | 60,810 | |||||||||
| Income from operations |
26,556 | 33,784 | 32,261 | |||||||||
| Other expense: |
||||||||||||
| Interest expense |
4,496 | 8,197 | 17,759 | |||||||||
| Interest income |
(61 | ) | (120 | ) | (205 | ) | ||||||
| (Gain) loss on foreign exchange |
(381 | ) | 1,016 | (2,117 | ) | |||||||
| Loss (gain) on derivatives |
1,520 | (591 | ) | (14 | ) | |||||||
| Loss on extinguishment of debt |
— | — | 2,958 | |||||||||
| Other expense (income), net |
5 | 131 | (16 | ) | ||||||||
| Total other expense |
5,579 | 8,633 | 18,365 | |||||||||
| Income before provision for income taxes |
20,977 | 25,151 | 13,896 | |||||||||
| Provision for income taxes |
7,575 | 9,770 | 4,832 | |||||||||
| Net income |
$ | 13,402 | $ | 15,381 | $ | 9,064 | ||||||
| Net income (loss) available to common stockholders |
$ | 13,315 | $ | 15,130 | $ | (25,022 | ) | |||||
| Net income (loss) per common share: |
||||||||||||
| Basic |
$ | 0.39 | $ | 0.45 | $ | (1.55 | ) | |||||
| Diluted |
$ | 0.38 | $ | 0.43 | $ | (1.55 | ) | |||||
| Weighted average number of shares outstanding: Basic |
34,365,544 | 33,818,508 | 16,174,165 | |||||||||
| Weighted average number of shares outstanding: Diluted |
35,288,126 | 35,304,794 | 16,174,165 | |||||||||
The accompanying notes are an integral part of these financial statements.
59
Table of Contents
MONOTYPE IMAGING HOLDINGS INC.
CONSOLIDATED STATEMENTS OF CONVERTIBLE REDEEMABLE PREFERRED STOCK, REDEEMABLE PREFERRED STOCK AND STOCKHOLDERS’ EQUITY (DEFICIT)
(in thousands, except share and per share data)
| Convertible Redeemable Preferred Stock |
Redeemable Preferred Stock |
Common Stock | Treasury Stock | Additional Paid-In Capital |
Retained Earnings (Deficit) |
Accumulated Other Comprehensive Income |
Total Stock- holders’ Equity (Deficit) |
Compre- hensive Income |
||||||||||||||||||||||||||||||||||
| Shares | Redemption Value |
Shares | Shares | Amount | Shares | Amount | ||||||||||||||||||||||||||||||||||||
| Balance, December 31, 2006 |
5,840,354 | $ | 40,170 | — | 3,764,088 | $ | 4 | 40,836 | $ | (41 | ) | $ | 687 | $ | (13,804 | ) | $ | 574 | $ | (12,580 | ) | |||||||||||||||||||||
| Net income |
9,064 | 9,064 | 9,064 | |||||||||||||||||||||||||||||||||||||||
| Accretion of convertible redeemable preferred stock redemption value |
34,086 | (34,086 | ) | (34,086 | ) | |||||||||||||||||||||||||||||||||||||
| Conversion of convertible redeemable preferred stock to redeemable preferred stock and common stock |
(5,840,354 | ) | (74,256 | ) | 5,840,354 | 23,361,416 | 23 | 74,232 | 74,255 | |||||||||||||||||||||||||||||||||
| Redemption of redeemable preferred stock |
(5,840,354 | ) | (9,654 | ) | (9,654 | ) | ||||||||||||||||||||||||||||||||||||
| Conversion of convertible notes payable |
415,903 | — | 155 | 155 | ||||||||||||||||||||||||||||||||||||||
| Issuance of capital shares |
||||||||||||||||||||||||||||||||||||||||||
| —restricted share grants |
21,559 | — | — | — | ||||||||||||||||||||||||||||||||||||||
| —exercised options |
212,333 | — | 266 | 266 | ||||||||||||||||||||||||||||||||||||||
| Repurchase of unvested restricted common shares |
(12,358 | ) | 12,358 | — | — | |||||||||||||||||||||||||||||||||||||
| Vesting of restricted shares |
92 | 92 | ||||||||||||||||||||||||||||||||||||||||
| Issuance of common stock upon initial public offering, net of related costs |
6,500,000 | 7 | 67,244 | 67,251 | ||||||||||||||||||||||||||||||||||||||
| Share based compensation |
4,257 | 4,257 | ||||||||||||||||||||||||||||||||||||||||
| Tax benefit associated with options |
940 | 940 | ||||||||||||||||||||||||||||||||||||||||
| Unrecognized actuarial gain, net of tax |
328 | 328 | 328 | |||||||||||||||||||||||||||||||||||||||
| Cumulative translation adjustment, net of tax |
1,719 | 1,719 | 1,719 | |||||||||||||||||||||||||||||||||||||||
| Comprehensive income |
$ | 11,111 | ||||||||||||||||||||||||||||||||||||||||
| Balance, December 31, 2007 |
— | $ | — | — | 34,262,941 | $ | 34 | 53,194 | $ | (41 | ) | $ | 138,219 | $ | (38,826 | ) | $ | 2,621 | $ | 102,007 | ||||||||||||||||||||||
| Net income |
15,381 | 15,381 | 15,381 | |||||||||||||||||||||||||||||||||||||||
| Issuance of capital shares |
||||||||||||||||||||||||||||||||||||||||||
| —restricted share grants |
71,617 | — | — | — | ||||||||||||||||||||||||||||||||||||||
| —exercised options |
211,134 | 1 | 615 | 616 | ||||||||||||||||||||||||||||||||||||||
| Repurchase of unvested restricted common shares |
(33,000 | ) | 33,000 | (45 | ) | (45 | ) | |||||||||||||||||||||||||||||||||||
| Vesting of restricted shares |
154 | 154 | ||||||||||||||||||||||||||||||||||||||||
| Share based compensation |
3,634 | 3,634 | ||||||||||||||||||||||||||||||||||||||||
| Tax benefit associated with options |
54 | 54 | ||||||||||||||||||||||||||||||||||||||||
| Unrecognized actuarial gain, net of tax |
175 | 175 | 175 | |||||||||||||||||||||||||||||||||||||||
| Cumulative translation adjustment, net of tax |
(1,140 | ) | (1,140 | ) | (1,140 | ) | ||||||||||||||||||||||||||||||||||||
| Comprehensive income |
$ | 14,416 | ||||||||||||||||||||||||||||||||||||||||
| Balance, December 31, 2008 |
— | $ | — | — | 34,512,692 | $ | 35 | 86,194 | $ | (86 | ) | $ | 142,676 | $ | (23,445 | ) | $ | 1,656 | $ | 120,836 | ||||||||||||||||||||||
The accompanying notes are an integral part of these financial statements.
60
Table of Contents
MONOTYPE IMAGING HOLDINGS INC.
CONSOLIDATED STATEMENTS OF CONVERTIBLE REDEEMABLE PREFERRED STOCK, REDEEMABLE PREFERRED STOCK AND STOCKHOLDERS’ EQUITY (DEFICIT)—(Continued)
(in thousands, except share amounts)
| Convertible Redeemable Preferred Stock |
Redeemable Preferred Stock |
Common Stock | Treasury Stock | Additional Paid-In Capital |
Retained Earnings (Deficit) |
Accumulated Other Comprehensive Income |
Total Stock- holders’ Equity (Deficit) |
Compre- hensive Income |
||||||||||||||||||||||||||||||
| Shares | Redemption Value |
Shares | Shares | Amount | Shares | Amount | ||||||||||||||||||||||||||||||||
| Balance, December 31, 2008 |
— | $ | — | — | 34,512,692 | $ | 35 | 86,194 | $ | (86 | ) | $ | 142,676 | $ | (23,445 | ) | $ | 1,656 | $ | 120,836 | ||||||||||||||||||
| Net income |
13,402 | 13,402 | $ | 13,402 | ||||||||||||||||||||||||||||||||||
| Issuance of capital shares |
||||||||||||||||||||||||||||||||||||||
| —restricted share grants |
57,385 | — | — | — | ||||||||||||||||||||||||||||||||||
| —exercised options |
107,799 | — | 126 | 126 | ||||||||||||||||||||||||||||||||||
| Repurchase of unvested shares of restricted common stock |
(9,322 | ) | — | 9,322 | — | — | ||||||||||||||||||||||||||||||||
| Vesting of restricted shares |
181 | 181 | ||||||||||||||||||||||||||||||||||||
| Share based compensation |
5,186 | 5,186 | ||||||||||||||||||||||||||||||||||||
| Tax benefit associated with options |
104 | 104 | ||||||||||||||||||||||||||||||||||||
| Unrecognized actuarial gain, net of tax |
(202 | ) | (202 | ) | (202 | ) | ||||||||||||||||||||||||||||||||
| Cumulative translation adjustment, net of tax |
889 | 889 | 889 | |||||||||||||||||||||||||||||||||||
| Comprehensive income |
$ | 14,089 | ||||||||||||||||||||||||||||||||||||
| Balance, December 31, 2009 |
— | $ | — | — | 34,668,554 | $ | 35 | 95,516 | $ | (86 | ) | $ | 148,273 | $ | (10,043 | ) | $ | 2,343 | $ | 140,522 | ||||||||||||||||||
The accompanying notes are an integral part of these financial statements.
61
Table of Contents
MONOTYPE IMAGING HOLDINGS INC.
CONSOLIDATED STATEMENTS OF CASH FLOWS
(in thousands)
| Year Ended December 31, | ||||||||||||
| 2009 | 2008 | 2007 | ||||||||||
| Cash flows from operating activities: |
||||||||||||
| Net income |
$ | 13,402 | $ | 15,381 | $ | 9,064 | ||||||
| Adjustments to reconcile net income to net cash provided by operating activities: |
||||||||||||
| Depreciation and amortization |
9,298 | 11,441 | 11,567 | |||||||||
| Amortization of deferred financing costs and debt discount |
840 | 778 | 1,007 | |||||||||
| Loss on retirement of fixed assets |
20 | 111 | — | |||||||||
| Loss on extinguishment of debt |
— | — | 2,958 | |||||||||
| Share based compensation |
5,186 | 3,634 | 4,257 | |||||||||
| Excess tax benefit on stock options |
(104 | ) | (54 | ) | (940 | ) | ||||||
| Deferred income taxes |
1,931 | 3,237 | (1,048 | ) | ||||||||
| Provision for doubtful accounts |
(106 | ) | 126 | 240 | ||||||||
| Unrealized currency (gain) loss on foreign denominated intercompany transactions |
(360 | ) | 433 | (3,212 | ) | |||||||
| Unrealized losses (gains) on derivatives |
437 | (803 | ) | 36 | ||||||||
| Changes in operating assets and liabilities, net of effect of acquisitions: |
||||||||||||
| Accounts receivable |
1,226 | (2,469 | ) | 261 | ||||||||
| Income tax refund receivable |
(885 | ) | 1,391 | (1,391 | ) | |||||||
| Prepaid expenses and other assets |
(3 | ) | 927 | (1,597 | ) | |||||||
| Accounts payable |
(260 | ) | (1,155 | ) | 144 | |||||||
| Accrued income taxes |
(833 | ) | (974 | ) | 1,833 | |||||||
| Accrued expenses and other liabilities |
(2,599 | ) | (2,233 | ) | 5,012 | |||||||
| Deferred revenue |
881 | 762 | (913 | ) | ||||||||
| Net cash provided by operating activities |
28,071 | 30,533 | 27,278 | |||||||||
| Cash flows from investing activities: |
||||||||||||
| Purchases of property and equipment |
(845 | ) | (1,125 | ) | (1,236 | ) | ||||||
| Acquisition of businesses, net of cash acquired |
(1,710 | ) | — | (75 | ) | |||||||
| Net cash used in investing activities |
(2,555 | ) | (1,125 | ) | (1,311 | ) | ||||||
The accompanying notes are an integral part of these financial statements.
62
Table of Contents
MONOTYPE IMAGING HOLDINGS INC.
CONSOLIDATED STATEMENTS OF CASH FLOWS—(Continued)
(in thousands)
| Year Ended December 31, | ||||||||||||
| 2009 | 2008 | 2007 | ||||||||||
| Cash flows from financing activities: |
||||||||||||
| Purchase of interest rate caps |
— | (45 | ) | — | ||||||||
| Proceeds from issuance of debt, net of issuance costs |
— | — | 10,783 | |||||||||
| Debt amendment costs |
(599 | ) | — | — | ||||||||
| Payments on long-term debt |
(22,484 | ) | (18,582 | ) | (84,245 | ) | ||||||
| Payment of penalty fee associated with debt extinguishment |
— | — | (1,400 | ) | ||||||||
| Redemption of redeemable preferred stock |
— | — | (9,654 | ) | ||||||||
| Net proceeds from initial public offering |
— | — | 67,437 | |||||||||
| Excess tax benefit of stock options |
104 | 54 | 940 | |||||||||
| Proceeds from exercise of common stock options and issuance of restricted stock |
126 | 616 | 266 | |||||||||
| Net cash used in financing activities |
(22,853 | ) | (17,957 | ) | (15,873 | ) | ||||||
| Effect of exchange rates on cash and cash equivalents |
12 | 906 | 950 | |||||||||
| Increase in cash and cash equivalents |
2,675 | 12,357 | 11,044 | |||||||||
| Cash and cash equivalents, beginning of year |
31,941 | 19,584 | 8,540 | |||||||||
| Cash and cash equivalents, end of year |
$ | 34,616 | $ | 31,941 | $ | 19,584 | ||||||
| Supplemental disclosures: |
||||||||||||
| Interest paid |
$ | 3,210 | $ | 8,347 | $ | 14,413 | ||||||
| Income taxes paid |
$ | 7,219 | $ | 5,501 | $ | 3,701 | ||||||
| Non cash transactions: |
||||||||||||
| Issuance of common stock in connection with the conversion of the convertible notes payable |
$ | — | $ | — | $ | 155 | ||||||
| Unvested restricted stock liability recognized in connection with the conversion of the convertible notes payable |
$ | — | $ | — | $ | 468 | ||||||
The accompanying notes are an integral part of these financial statements.
63
Table of Contents
MONOTYPE IMAGING HOLDINGS INC.
NOTES TO CONSOLIDATED FINANCIAL STATEMENTS
December 31, 2009
1. Nature of Business
Monotype Imaging Holdings Inc. (the “Company” or “we”) is a leading global provider of text imaging solutions. Our end-user and embedded solutions for print, web and mobile environments enable people to create and consume dynamic content on any and every device. The Company’s technologies and fonts enable the display and printing of high quality digital text. The Company’s technologies and fonts have been widely deployed across a range of consumer electronic, or CE devices, including laser printers, digital copiers, mobile phones, digital televisions, set-top boxes, navigation devices and digital cameras, as well as in numerous software applications and operating systems. The Company licenses its text imaging solutions to CE device manufacturers, independent software vendors and creative and business professionals. The Company is headquartered in Woburn, Massachusetts. The Company operates in one business segment: the development, marketing and licensing of technologies and fonts. The Company also maintains various offices worldwide for selling and marketing, research and development and administration. At December 31, 2009, the Company conducts its operations through two domestic operating subsidiaries, Monotype Imaging Inc. and International Typeface Corporation (“ITC”), and four foreign operating subsidiaries, Monotype Imaging Ltd. (“Monotype UK”), Linotype GmbH (“Linotype”), Monotype Imaging Hong Kong Ltd., formerly China Type Design (“Monotype Hong Kong”), and Monotype Imaging KK (“Monotype Japan”).
2. Significant Accounting Policies
The accompanying financial statements reflect the application of certain significant accounting policies as described in this note and elsewhere in the accompanying consolidated financial statements and notes.
Basis of Presentation and Consolidation
The consolidated financial statements include the accounts of Monotype Imaging Holdings Inc. and its subsidiaries and have been prepared by the Company in United States (U.S.) dollars and in accordance with accounting principles generally accepted in the United States or GAAP, applied on a consistent basis.
In November 2004, Imaging Acquisition Corporation, our wholly-owned subsidiary, acquired all of the common stock of Agfa Monotype Corporation (“Agfa Monotype”), a wholly-owned subsidiary of Agfa Corporation (“Agfa”). On November 5, 2004, Agfa Monotype was spun off into a new entity, MTI, which was owned by TA Associates, D.B. Zwirn and certain of the former officers and employees of Agfa Monotype through Imaging Holdings Corp. (“IHC”). IHC became the parent of MTI. In December 2004, we formed Monotype Japan, our wholly-owned Japanese subsidiary. In August 2005, IHC entered into a recapitalization transaction and debt refinancing which resulted in the Company becoming the parent of IHC.
In July 2006, we acquired 80.01% of the capital stock of China Type Design, a Hong Kong corporation. At the time of this acquisition, we already had a 19.99% ownership interest in China Type Design, and following the acquisition, it became our wholly-owned subsidiary. In August 2006, we completed the acquisition of the capital stock of Linotype, a German corporation, through our newly formed wholly-owned subsidiary, Monotype Imaging GmbH.
On December 10, 2009, we acquired the principal assets of Planetweb, Inc., a global provider of embedded user interface software and developer tools for the consumer electronics industry, located in Redwood Shores, California, for $1.9 million.
64
Table of Contents
The accompanying consolidated financial statements present the Company as of and for the years ended December 31, 2009, 2008 and 2007, including the accounts of ITC, Monotype UK, Linotype, Monotype Hong Kong and Monotype Japan. All intercompany accounts and transactions have been eliminated.
Comparative Amounts
Certain prior year amounts have been reclassified to conform to the current year presentation in our Consolidated Statement of Cash Flows for the year ended December 31, 2009. Excess tax benefit on stock options for the years ended December 31, 2008 and 2007 is presented on a separate line within the cash flows from operating activities. Previously this item was part of the accrued expenses and other liabilities line within cash flows from operating activities. Diluted earnings per share for the year ended December 31, 2008 has been restated in accordance with Financial Accounting Standards Board (“FASB”) Accounting Standards Codification (“ASC”) 260-10-45-61A. These reclassifications had no effect on previously reported results of operations or financial position.
Use of Estimates
The preparation of the financial statements in conformity with GAAP requires management to make estimates and assumptions that affect the reported amounts of assets and liabilities and disclosure of contingent assets and liabilities at the date of the financial statements and the reported amounts of revenue and expenses during the reporting period. We believe the most judgmental estimates include those related to allowance for doubtful accounts, income taxes, valuation of goodwill, other intangible assets, long-lived assets, derivatives and the valuation of share-based compensation. We base our estimates and judgments on historical experience and various other appropriate factors, the results of which form the basis for making judgments about the carrying values of assets and liabilities and the amount of revenue and expenses that are not readily apparent from other sources. Actual results could differ from those estimates.
Fair Value of Financial Instruments
Our financial instruments consist of cash and cash equivalents, accounts receivable, derivative instruments and debt. We value our financial instruments at fair value in accordance with ASC Topic No. 820, Fair Value Measurement and Disclosures, (“ASC 820”). The Company’s recurring fair value measures relate to derivative instruments. The Company’s non-financial assets and non-financial liabilities subject to non-recurring measures include goodwill and intangibles.
Cash and Cash Equivalents
Cash and cash equivalents consist of bank deposits and overnight repurchase agreements. We consider all highly liquid investments with original maturities of three months or less at the time of acquisition to be cash equivalents and are stated at fair value. The Company does not believe it is exposed to any significant credit risk on its cash equivalents.
Concentration of Credit Risks
Financial instruments that potentially subject us to concentration of credit risk consist principally of cash and cash equivalents and trade receivables. Cash equivalents consist primarily of bank deposits and overnight repurchase agreements. Deposits of cash held outside the U.S. totaled approximately $4.3 million and $10.8 million, at December 31, 2009 and 2008, respectively.
65
Table of Contents
We grant credit to customers in the ordinary course of business. Credit evaluations are performed on an ongoing basis to reduce credit risk, and no collateral is required from our customers. An allowance for uncollectible accounts is provided for those accounts receivable considered to be uncollectible based upon historical experience and credit evaluation. As of December 31, 2009 two customers individually accounted for 15% and 12% of our gross accounts receivable. As of December 31, 2008 one customer accounted for 19% of our gross accounts receivable. For the years ended December 31, 2009, 2008 and 2007 no one customer accounted for 10% or more of our total revenue. Historically, we have not recorded material losses due to customers’ nonpayment.
Property and Equipment
Property and equipment are stated at cost. We capitalize expenditures that materially increase asset lives and charge ordinary repairs and maintenance to operations as incurred. Depreciation is computed using the straight-line method over the estimated useful lives of the assets:
| Estimated Useful Life | ||
| Computer equipment |
2 to 5 years | |
| Furniture and fixtures |
3 to 13 years | |
| Leasehold improvements |
Shorter of lease term or estimated useful life of 3 to 5 years |
Goodwill and Indefinite-lived Intangible Assets
Goodwill represents the excess of the cost of acquired businesses over the fair value of identifiable net assets assumed in a business combination. We account for goodwill and indefinite-lived intangible assets in accordance with ASC Topic No. 350, Intangibles—Goodwill and Other (“ASC 350”) which requires that goodwill not be amortized, but instead be tested at least annually for impairment in accordance with the provisions of ASC 350.
The provisions of ASC 350 require that a two-step impairment test be performed on goodwill. In the first step, the Company must compare the fair value of each reporting unit to its carrying value. The Company determines the fair value of its reporting units based on the present value of estimated future cash flows and market approach. If the fair value of the reporting unit exceeds the carrying value of the net assets assigned to that unit, goodwill is not impaired and further testing is not required. If the carrying value of the net assets assigned to the reporting unit exceeds the fair value of the reporting unit, then the Company must perform the second step of the impairment test in order to determine the implied fair value of the reporting unit’s goodwill. If the carrying value of a reporting unit’s goodwill exceeds its implied fair value, then an impairment loss equal to the difference will need to be recorded.
Impairment testing for goodwill is done at a reporting unit level. Reporting units are one level below the business segment level, but can be combined when reporting units within the same segment have similar economic characteristics. We operate within a single business segment and conducted our impairment analysis on the Company as a whole by calculating the fair value of our Company as compared to our carrying value. We estimated the fair value by using forecasts of discounted cash flows and market approach. The Company performs its annual goodwill impairment test as of December 31st. The fair value was greater than the carrying value of the goodwill, and therefore, no write down of goodwill was recorded in any of the years presented.
We perform similar procedures on our indefinite-lived intangible assets. We apply the relief from royalty method, a variation of discounted cash flows, to determine the fair value of these assets. We perform our annual indefinite-lived intangible asset impairment test as of December 31st. The fair value was greater than the carrying value of the indefinite-lived intangible assets, and therefore, no write down of such assets was recorded in any of the years presented.
66
Table of Contents
In light of the continued macro-economic environment, declines in the stock market and the decline of the Company’s market capitalization, we may be required to perform interim goodwill impairment analyses. Should our stock price deteriorate to a level at which, if sustained, it may require us to perform goodwill impairment analysis, as detailed above. This analysis may determine that our goodwill is impaired in whole, in part, or not at all. In the event that the Company determines that its goodwill is impaired in whole, or in part, the Company will record a non-cash charge, which could be material. If an impairment of goodwill is recognized, an analysis of impairment of our other long-lived assets would be required pursuant to ASC Topic No. 360. In the event that the Company determines that these assets are impaired, the Company will record a non-cash charge, which could be material.
Long-Lived Assets
We account for long-lived assets including property and equipment and long-lived amortizable intangible assets in accordance with ASC Topic No. 360, Property, Plant and Equipment, (“ASC 360”). ASC 360 requires companies to assess whether indicators of impairment are present on a periodic basis. If such indicators are present, ASC 360 prescribes a two step impairment test (i) if the carrying amount of a long-lived asset is not recoverable based on its undiscounted future cash flows, and (ii) measure an impairment loss as the difference between the carrying amount and the fair value of the asset. We have had no impairments or indicators of impairment of our long-lived assets during the years presented. Our stock price has fluctuated in the current economic climate. Should our stock price deteriorate to a level at which, if sustained, it may require performance of impairment testing on our long-lived assets in accordance with ASC 360. This analysis may determine that our long-lived assets are impaired in whole, in part, or not at all. In the event that the Company determines that its long-lived assets are impaired in whole, or in part, the Company will record a non-cash charge, which could be material.
Business Acquisitions
In accordance with ASC Topic No. 805, Business Combinations (“ASC 805”), we record acquisitions under the purchase method of accounting. Accordingly, the purchase price is allocated to the tangible assets and liabilities and intangible assets acquired, based on their estimated fair values. The excess purchase price over the fair value of indentified assets is recorded as goodwill. Under ASC 350, goodwill and purchased intangibles with indefinite lives are not amortized but are reviewed for impairment annually, or more frequent, if impairment indicators arise. Purchased intangibles with definite lives are amortized over their respective useful lives.
Revenue Recognition
We recognize revenue in accordance with ASC Topic No. 985, Revenue Recognition (“ASC 985”). Revenue is recognized when persuasive evidence of an agreement exists, the product has been delivered or services have been provided, the fee is fixed or determinable and collection of the fee is probable.
OEM Revenue
Our OEM revenue is derived substantially from per-unit royalties received for printer imaging, display imaging and printer driver, or driver, products. Under our licensing arrangements we typically receive a royalty for each product unit incorporating our text imaging solutions that is shipped by our OEM customers. We also receive OEM revenue from fixed fee licenses with certain of our OEM customers. Fixed fee licensing arrangements are not based on units the customer ships, but instead,
67
Table of Contents
customers pay us on a periodic basis for the right to embed our text imaging solutions. Though significantly less than royalties from per-unit shipments and fixed fees from OEMs, we also receive revenue from software application and operating systems vendors who include our text imaging solutions in their products, and for font development. Many of our licenses continue so long as our OEM customers ship products that include our technology, unless terminated for breach. Other licenses have terms that range from three to five years, and usually provide for automatic or optional renewals. Revenue from per-unit royalties is recognized in the period during which we receive a royalty report from a customer, typically one quarter after royalty-bearing units are shipped. Revenue from fixed fee licenses is generally recognized when it is billed to the customer, so long as the product has been delivered, the license fee is fixed and non-refundable and collection is probable.
Creative Professional Revenue
Our creative professional revenue is derived from font licenses and from custom font design services. We license fonts directly to end-users through our e-commerce websites, via telephone, email and indirectly through third-party resellers. We also license fonts and provide custom font design services to graphic designers, advertising agencies and corporations.
Revenue from font licenses to our e-commerce customers is recognized upon payment by the customer and electronic shipment of the software embodying the font. Revenue from font licenses to other customers is recognized upon shipment of the software embodying the font and when all other revenue recognition criteria have been met. Revenue from resellers is recognized upon notification from the reseller that our font product has been licensed and when all other revenue recognition criteria have been met. We generally recognize custom font design services revenue upon delivery.
Cost of Revenue
We pay font license fees on certain fonts that are owned by third parties. We recognize royalty expenses with respect to those font license fees concurrent with the recognition of revenue on licenses to which they relate. Amortization of acquired technology is an additional cost of revenue (see Note 4).
Deferred Revenue
Deferred revenue results primarily from prepayments against future royalties received from our customers. These amounts are recognized as revenue as the royalties are earned, based upon subsequent royalty reports received from the customers.
Research and Development Expenses
Our research and development expense consists principally of salaries, bonuses and benefits of our research and development, engineering and font design personnel who are primarily focused on enhancing the functionality of our text imaging solutions and developing new products. In accordance with ASC Topic No. 730, Research and Development, such costs are required to be expensed until the point that technological feasibility of the software is established. Technological feasibility is determined after a working model has been completed. As our research and development costs primarily relate to software development during the period prior to technological feasibility, all research and development costs are charged to operations as incurred.
Advertising Costs
We expense advertising costs as incurred. Advertising expenses were $2.8 million, $3.5 million and $3.6 million for the years ended December 31, 2009, 2008 and 2007, respectively.
68
Table of Contents
Share Based Compensation
We account for share based compensation in accordance with ASC Topic No. 718, Compensation—Stock Compensation, (“ASC 718”), which requires all share based payments to employees, including grants of employee stock options, to be recognized in the income statement based on their fair values.
The Company accounts for transactions in which services are received from nonemployees in exchange for equity instruments based on the fair value of such services received or of the equity instruments issued, whichever is more reliably measured, in accordance with ASC 505-50, Equity-Based Payments to Non-employees. During the year ended December 31, 2007, the Company granted 197,554 shares of restricted stock to a consultant, in connection with the acquisition of China Type Design. This award vests over four years and resulted in share based compensation expense of $0.2 million, a credit of $0.3 million and an expense of $1.8 million in 2009, 2008, and 2007, respectively. The award will be fully vested July 2010. The Company did not issue any awards to nonemployees in 2009 or 2008.
The Company uses the Black-Scholes option pricing model to determine the weighted-average fair value of options granted and recognizes the compensation cost of share based awards on a straight-line basis over the vesting period of the award. The determination of the fair value of share based payment awards using the Black-Scholes model are affected by our stock price and a number of assumptions, including expected volatility, expected life, risk-free interest rate and expected dividends. We do not have a long history of market prices of our common stock and as such we estimate volatility in accordance with Staff Accounting Bulletin No. 110 (“SAB 110”) using historical volatilities of similar public entities. The expected life of the awards is estimated based on the simplified method, as defined in SAB 110. The risk-free interest rate assumption is based on a treasury instrument whose term is consistent with the expected life of our awards. The expected dividend yield assumption is based on our history and expectation of paying no dividends.
Forfeitures are estimated at the time of grant and revised, if necessary, in subsequent periods if actual forfeitures differ from those estimates. Share based compensation expense recognized in our financial statements is based on awards that are ultimately expected to vest. We evaluate the assumptions used to value our awards on a quarterly basis and if factors change and we employ different assumptions, stock-based compensation expense may differ significantly from what we have recorded in the past. If there are any modifications or cancellations of the underlying unvested securities, we may be required to accelerate, increase or cancel any remaining unearned stock-based compensation expense. Future stock-based compensation expense and unearned stock-based compensation will increase to the extent that we grant additional equity awards to employees or we assume unvested equity awards in connection with acquisitions.
The fair value of options was estimated at the date of grant using a Black-Scholes option-pricing model with the following weighted average assumptions:
| Year Ended December 31, | ||||||
| 2009 | 2008 | 2007 | ||||
| Risk-free interest rate |
1.9% | 2.8% | 4.4% | |||
| Expected dividend yield |
— | — | — | |||
| Expected volatility |
66.3% | 66.0% | 68.8% | |||
| Expected term |
6.1 years | 6.1 years | 6.0 years | |||
| Weighted average fair value per share |
$2.45 | $8.75 | $8.50 | |||
Prior to our initial public offering on July 25, 2007, we granted our employees options to purchase common stock at exercise prices equal to the fair market value of the underlying stock at the time of each grant, as determined by our compensation committee.
69
Table of Contents
In valuing the common stock our compensation committee considered a number of factors, including:
| • | the illiquidity of our capital stock as a private company; |
| • | the business risks we faced; |
| • | the liquidation preferences, redemption rights and other rights, preferences and privileges of our outstanding preferred stock; |
| • | the outstanding balances on our credit facilities; and |
| • | our actual financial condition and results of operations relative to our formal operating plan during the relevant period. |
From March 31, 2006 until our initial public offering, the compensation committee determined to follow the procedures recommended in the American Institute of Certified Public Accountants Practice Aid. This approach requires an assessment of future prospects, based on the value of the business using a series of potential outcomes and weighing the probability of each of those outcomes. Management prepared three scenarios, a base case, an optimistic case and a pessimistic case. The possibility of an initial public offering was also considered. The compensation committee reviewed a market comparison of our business with a number of publicly traded firms to test the reasonableness of the overall analysis. The compensation committee reviewed the methodology, the resulting valuation and changed the probabilities of the outcomes that were initially applied as well as the weight given to those probabilities to more accurately reflect the changes in the business.
At the date of each option grant, our board of directors determined that the exercise price for each option was equivalent to the then-existing fair value of our common stock. Our board of directors believes it properly valued our common stock in all periods. After our IPO, we value awards granted based on the grant date closing price of our common stock as traded on either the NASDAQ Global Market or NASDAQ Global Select Market.
See Note 12 for a summary of the stock option activity under our stock-based employee compensation plans for the year ended December 31, 2009.
Derivative Financial Instruments
We use interest rate and foreign currency derivative instruments to hedge our exposure to interest rate volatility resulting from our variable rate debt and fluctuations in foreign currencies on our intercompany note (Note 7) and other foreign currency transactions. ASC Topic No. 815, Derivatives and Hedging, (“ASC 815”), requires that all derivative instruments be reported on the balance sheet at fair value and establishes criteria for designation and effectiveness of hedging relationships, including a requirement that all designations must be made at the inception of each instrument. As we did not make such initial designations, ASC 815 requires changes in the fair value of the derivative instrument to be recognized as current period income or expense.
Foreign Currency Translation
In accordance with ASC Topic No. 830, Foreign Currency Matters, all assets and liabilities of our foreign subsidiaries whose functional currency is a currency other than US dollars are translated into US dollars at an exchange rate as of the balance sheet date. Revenue and expenses of these subsidiaries are translated at the average monthly exchange rates in effect for the periods in which the transactions occur. The gains and losses arising from these transactions are reported as a component of (gain) loss on foreign exchange in our consolidated statements of income. The unrealized gains and losses are reported in accumulated other comprehensive income in our consolidated statements of stockholders’ equity.
70
Table of Contents
Accumulated Other Comprehensive Income
ASC Topic No. 220, Comprehensive Income, requires disclosure of all components of comprehensive income on an annual and interim basis. Comprehensive income is defined as the change in equity of a business enterprise during a period from transactions and other events and circumstances from non-owner sources. Accumulated other comprehensive income consists of foreign currency translation adjustments and adjustments to record changes in the funded status of our defined benefit pension plan in accordance with ASC Subtopic No. 715-30, Defined Benefit Plans—Pension.
Income Taxes
We account for income taxes in accordance with ASC Topic No. 740, Income Taxes (“ASC 740”). Under this method, a deferred tax asset or liability is determined based on the difference between the financial statement and the tax basis of assets and liabilities, as measured by enacted tax rates in effect when these differences are expected to be reversed. This process includes estimating current tax expense together with assessing temporary differences resulting from differing treatment of items for tax and financial accounting purposes. These differences result in deferred tax assets and liabilities. We also assess the likelihood that our deferred tax assets will be recovered from future taxable income and, to the extent we believe, based on the weight of available evidence, it is more likely than not that some or all of the deferred tax assets will not be realized, we have established a valuation allowance. Significant judgment is required in determining the provision for income taxes, deferred tax assets and liabilities and any valuation allowance against our deferred tax assets.
We monitor the undistributed earnings of our foreign subsidiaries and, as necessary, provide for income taxes on those earnings that are not deemed permanently invested. As of December 31, 2009, the Company had approximately $4.3 million in undistributed earnings in our foreign subsidiaries for which deferred taxes have been provided.
The Company accrues liabilities for uncertain tax positions in accordance with the framework provided in ASC 740. The total amount of uncertain tax positions, at December 31, 2009 and 2008 was $1.5 million and $1.6 million, respectively. The Company classifies interest and penalties as a component of tax expense. The total amount of recorded interest and penalties expense at December 31, 2009, 2008 and 2007 was $0.4 million, $0.4 million and $0.3 million, respectively.
Net income (loss) per share data
The Company calculates net income (loss) per share in accordance with ASC Topic No. 260, Earnings Per Share, (“ASC 260”). ASC 260 outlines the use of the “two-class” and treasury stock methods of calculating earnings per share. Under the two-class method, basic net income (loss) per share is computed by dividing the net income (loss) applicable to common stockholders by the weighted-average number of common shares outstanding for the fiscal period. Diluted net income (loss) per share is computed using the more dilutive of (a) the if-converted, or treasury stock, method or (b) the two-class method. The treasury stock method assumes exercise of stock options and vesting of restricted stock. The two-class method assumes exercise of stock options using the treasury stock method, but assumes participating securities (unvested restricted stock) are not vested and allocates earnings to common shares and participating securities. Prior to the conversion of convertible preferred stock in 2007, the Company allocated net income first to preferred stockholders based on dividend rights under the Company’s certificate of incorporation and then to common stockholders based on ownership interests. Net losses were not allocated to preferred stockholders. Subsequent to the conversion of convertible preferred stock, income is allocated to participating securities and common stockholders. Diluted net income (loss) per share gives effect to all potentially dilutive securities, including stock options and restricted stock, using either the treasury stock method or the two-class method, whichever is more dilutive.
71
Table of Contents
Recently Issued Accounting Pronouncements
Fair Value Measurements and Disclosures
In January 2010, the FASB issued ASC Topic No. 820, Fair Value Measurement and Disclosures, (“ASC 820”). ASC 820 improves disclosures about fair value measurements, requiring disclosures about valuation techniques and inputs used to measure fair value for both recurring and nonrecurring fair value measurements (class Level 2 or Level 3). In addition, more details are required regarding significant transfers between Levels 1 and 2 and the reasons for these transfers. New disclosures and clarifications regarding existing disclosures are effective for interim and annual reporting periods beginning after December 15, 2009, except for details regarding purchases, sales, issuances and settlements in the activity roll forward of class Level 3 which is effective for fiscal periods beginning after December 15, 2010 and interim period within those fiscal periods. We adopted the first provision of ASC 820 and the adoption did not have a material impact on the Company’s results of operations, financial position or liquidity.
Multiple-Deliverable Revenue Arrangements
In October 2009, the FASB approved for issuance ASC Subtopic No. 605-25, Revenue Recognition Multiple-Element Arrangements, (“ASC 605-25”). ASC 605-25 provides principles for allocation of consideration among its multiple-elements, allowing more flexibility in identifying and accounting for separate deliverables under an arrangement. It introduces an estimated selling price method for valuing the elements of a bundled arrangement if vendor-specific objective evidence or third-party evidence of selling price is not available, and significantly expands related disclosure requirements. ASC 605-25 is effective on a prospective basis for revenue arrangements entered into or materially modified in fiscal years beginning on or after June 15, 2010. Alternatively, adoption may be on a retrospective basis, and early application is permitted. The Company is currently evaluating the impact of adopting this pronouncement.
Earnings Per Share
On July 1, 2009, the Company adopted the updated provisions issued by the FASB within ASC 260-10-45-61A for earnings per share. The new guidance provides that unvested share-based payment awards that contain non-forfeitable rights to dividends or dividend equivalents (whether paid or unpaid) are participating securities and shall be included in the computation of earnings per share pursuant to the two-class method. The two-class method determines earnings per share for each class of common stock and participating security according to their respective participation rights in undistributed earnings. The Company’s unvested restricted stock awards granted to employees are considered participating securities as they receive non-forfeitable rights to cash dividends at the same rate as common stock. Upon adoption, a company is required to retrospectively adjust its earnings per share data to conform to the new provisions. The Company retrospectively adopted the provisions within ASC 260-10-45-61A on January 1, 2009 and adoption did not have a material impact on our condensed consolidated financial statements. Details regarding the impact of the adoption can be found in Note 11.
Accounting Standards Codification
In June 2009, the FASB issued Statement of Financial Accounting Standards No. 168, The FASB Accounting Standards Codification and the Hierarchy of Generally Accepted Accounting Principles—a replacement of FASB Statement No. 162 (“Codification”). The Codification reorganized existing U.S. accounting and reporting standards issued by the FASB and other related private sector standard setters into a single source of authoritative accounting principles arranged by topic. The Codification supersedes all existing U.S. accounting standards; all other accounting literature not included in the Codification (other than SEC guidance for publicly-traded companies) is considered non-authoritative. The Codification was effective
72
Table of Contents
on a prospective basis for interim and annual reporting periods ending after September 15, 2009. The adoption of the Codification changed the Company’s references to U.S. GAAP accounting standards but did not impact the Company’s results of operations, financial position or liquidity.
Subsequent Events
In May 2009, the FASB issued ASC Topic No. 855, Subsequent Events, (“ASC 855”). ASC 855 provides guidance to establish general standards of accounting for and disclosures of events that occur after the balance sheet date but before financial statements are issued or are available to be issued. ASC 855 also requires entities to disclose the date through which subsequent events were evaluated as well as the rationale for why that date was selected and is effective for interim and annual periods ending after June 15, 2009. ASC 855 requires that public entities evaluate subsequent events through the date that the financial statements are issued. We adopted ASC 855 effective with our quarterly period ending on June 30, 2009 and the adoption did not have a material impact on our condensed consolidated financial statements.
Fair Value Measurements and Impairments
On April 9, 2009, the FASB issued ASC Topic No. 825, Financial Instruments, (“ASC 825”). This ASC topic requires disclosures of fair value for any financial instruments not currently reflected at fair value on the balance sheet for all interim periods. ASC 825 is effective for interim and annual periods ending after June 15, 2009 and is to be applied prospectively. We adopted ASC 825 effective with our quarterly period ending on June 30, 2009 and the adoption did not have a material impact on our condensed consolidated financial statements.
On April 9, 2009 the FASB issued ASC 820-10-65-4, Fair Value Measurements and Disclosures transition guidance, (“ASC 820”). ASC 820 relates to determining fair values when there is no active market or where the price inputs being used represent distressed sales. Specifically, it reaffirms the need to use judgment to ascertain if a formerly active market has become inactive and in determining fair values when markets have become inactive. ASC 820 is effective for interim and annual periods ending after June 15, 2009 and is to be applied prospectively. We adopted ASC 820 effective with our quarterly period ending on June 30, 2009 and the adoption did not have a material impact on our condensed consolidated financial statements.
Derivative Instruments and Hedging Activities
In March 2008, the FASB issued ASC Topic No. 815, Derivatives and Hedging, (“ASC 815”). ASC 815 requires enhanced disclosures about an entity’s derivative and hedging activities. ASC 815 is effective for financial statements issued for fiscal years and interim periods beginning after November 15, 2008, with early application encouraged. We adopted ASC 815 on January 1, 2009 and the adoption did not have a material impact on our condensed consolidated financial statements. Our derivative disclosure can be found in Note 7.
Business Combinations
In December 2007, the FASB issued ASC Topic No. 805, Business Combinations (“ASC 805”). ASC 805 is effective for fiscal years beginning on or after December 15, 2008, and applies to all business combinations. ASC 805 provides that, upon initially obtaining control, an acquirer shall recognize 100 percent of the fair values of acquired assets, including goodwill, and assumed liabilities, with only limited exceptions, even if the acquirer has not acquired 100 percent of its target. Additionally, ASC 805 changed previous guidance, in part, as follows: (1) contingent consideration arrangements are fair valued at the acquisition date and included on that basis in the purchase price consideration; (2) transaction costs are
73
Table of Contents
expensed as incurred, rather than capitalized as part of the purchase price; (3) pre-acquisition contingencies, such as legal issues, will generally have to be accounted for in purchase accounting at fair value; and (4) in order to accrue for a restructuring plan in purchase accounting, the requirements in FASB ASC Topic No. 420, Exit or Disposal Cost Obligations, (“ASC 420”) would have to be met at the acquisition date. We adopted ASC 805 on January 1, 2009, and applied it in accounting for our acquisition of the principal assets of Planetweb, Inc. in December 2009. There was no impact to our condensed consolidated financial statements on the accounting for acquisitions completed prior to December 31, 2008.
3. Property and Equipment
Property and equipment consists of the following (in thousands):
| December 31, | ||||||||
| 2009 | 2008 | |||||||
| Computer equipment |
$ | 4,518 | $ | 3,689 | ||||
| Furniture and fixtures |
689 | 676 | ||||||
| Leasehold improvements |
198 | 180 | ||||||
| Total cost |
5,405 | 4,545 | ||||||
| Less accumulated depreciation and amortization |
(3,615 | ) | (2,452 | ) | ||||
| Property and equipment, net |
$ | 1,790 | $ | 2,093 | ||||
Depreciation and amortization expense for the years ended December 31, 2009, 2008 and 2007, was $1.2 million, $1.1 million and $1.0 million, respectively.
4. Goodwill and Intangible Assets
Goodwill
The changes in the carrying value of goodwill are as follows (in thousands):
| Balance at December 31, 2007 |
$ | 141,346 | ||
| Foreign currency exchange rate changes |
(2,348 | ) | ||
| Deferred tax adjustment (Note 9) |
(100 | ) | ||
| Balance at December 31, 2008 |
$ | 138,898 | ||
| Acquisition |
479 | |||
| Foreign currency exchange rate changes |
1,467 | |||
| Deferred tax adjustment (Note 9) |
(99 | ) | ||
| Balance at December 31, 2009 |
$ | 140,745 | ||
The Company recorded approximately $0.5 million increase to goodwill in December 2009 for the acquisition of Planetweb, Inc. The purchase price of Planetweb, Inc. of $1.9 million, subject to final purchase accounting adjustments, was in excess of the fair value of the indentified assets. The majority of the Company’s goodwill balance is not denominated in U.S. dollars, and is therefore, subject to currency fluctuations. Goodwill decreased by approximately $0.1 million in each of the years ended December 31, 2009 and 2008 due to the tax effect of excess tax basis goodwill amortization.
74
Table of Contents
Intangible Assets
Intangible assets are stated at cost and are amortized over the expected life of the asset. Intangible assets as of December 31, 2009 and 2008 are as follows (dollar amounts in thousands):
| Life (Years) | December 31, 2009 | December 31, 2008 | ||||||||||||||||||||
| Gross Carrying Amount |
Accumulated Amortization |
Net Balance |
Gross Carrying Amount |
Accumulated Amortization |
Net Balance | |||||||||||||||||
| Customer relationships |
9-15 | $ | 47,025 | $ | (22,040 | ) | $ | 24,985 | $ | 46,331 | $ | (17,585 | ) | $ | 28,746 | |||||||
| Acquired technology |
8-15 | 44,449 | (15,968 | ) | 28,481 | 43,513 | (12,568 | ) | 30,945 | |||||||||||||
| Non-compete agreements |
3-6 | 11,685 | (11,072 | ) | 613 | 11,620 | (10,707 | ) | 913 | |||||||||||||
| Trademarks |
26,609 | — | 26,609 | 26,412 | — | 26,412 | ||||||||||||||||
| Domain names |
4,400 | — | 4,400 | 4,400 | — | 4,400 | ||||||||||||||||
| Total |
$ | 134,168 | $ | (49,080 | ) | $ | 85,088 | $ | 132,276 | $ | (40,860 | ) | $ | 91,416 | ||||||||
The Company’s intangible asset balances increased approximately $1.4 million in 2009 for the acquisition of Planetweb, Inc. Approximately $0.5 million was attributed to customer relationships and $0.8 million to acquired technology. Amortization expense is calculated using the straight-line method.
Estimated future intangible amortization expense based on balances at December 31, 2009 is as follow (in thousands):
| Acquired Technology |
Other Intangible Assets | |||||
| 2010 |
$ | 3,495 | $ | 4,826 | ||
| 2011 |
3,495 | 4,704 | ||||
| 2012 |
3,495 | 4,512 | ||||
| 2013 |
3,495 | 4,476 | ||||
| 2014 |
3,495 | 3,816 | ||||
| Thereafter |
11,006 | 3,264 | ||||
| Total amortization expense |
$ | 28,481 | $ | 25,598 | ||
5. Accrued Expenses and Other Current Liabilities
Accrued expenses and other current liabilities consist of the following (in thousands):
| December 31, | ||||||
| 2009 | 2008 | |||||
| Payroll and related benefits |
$ | 2,903 | $ | 4,302 | ||
| Royalties |
1,899 | 2,343 | ||||
| Interest |
326 | 49 | ||||
| Legal and audit fees |
777 | 979 | ||||
| Sales taxes |
257 | 542 | ||||
| Derivative liability |
771 | 1,009 | ||||
| Deferred income taxes |
15 | 1,091 | ||||
| Restructuring |
376 | 635 | ||||
| Other |
1,311 | 1,493 | ||||
| Total |
$ | 8,635 | $ | 12,443 | ||
75
Table of Contents
6. Debt
Long-term debt consists of the following (in thousands):
| December 31, | ||||||||
| 2009 | 2008 | |||||||
| Credit Facility—$92.0 million, interest at London Inter-Bank Offering Rate (LIBOR) plus 3.75% (4.0% at December 31, 2009), and $1.1 million at Prime plus 2.25% (5.5% at December 31, 2009) due in monthly installments of principal and interest through July 2012 |
$ | 93,138 | $ | 115,607 | ||||
| Note payable—Other |
— | 16 | ||||||
| 93,138 | 115,623 | |||||||
| Less unamortized financing costs |
(1,785 | ) | (2,027 | ) | ||||
| Total debt |
91,353 | 113,596 | ||||||
| Less current portion |
(16,293 | ) | (17,769 | ) | ||||
| Long-term debt |
$ | 75,060 | $ | 95,827 | ||||
The aggregate annual maturities of long-term debt are as follows (in thousands):
| Years ending December 31: |
|||
| 2010 |
$ | 16,293 | |
| 2011 |
13,360 | ||
| 2012 |
63,485 |
Credit Facilities
On July 30, 2007, in connection with our initial public offering, we amended and restated our First Lien Credit Facility which increased our borrowing there under to $140.0 million from $128.4 million and increased the maximum available under our revolving line-of-credit to $20 million (“Amended and Restated Credit Agreement”). In connection with this amendment and restatement, we paid a fee of $0.7 million. Using proceeds from our initial public offering, proceeds from the Amended and Restated Credit Agreement and cash on hand, we paid the entire $70 million outstanding balance on our Second Lien Credit Facility, together with a prepayment penalty fee of $1.4 million. The prepayment penalty fee was charged to operations as a debt extinguishment expense, along with approximately $1.6 million of previously capitalized debt financing costs associated with the Second Lien Credit Facility that were written off upon the payoff and termination of the facility. The First and Second Lien Credit Facilities were originally entered into in November 2004, to partially finance our acquisition from Agfa.
Upon entering into our Amended and Restated Credit Agreement, our scheduled monthly principal payments were increased to approximately $1.2 million throughout the term of the facility, which expires in July 2012. The Amended and Restated Credit Agreement provides for an additional annual mandatory principal payment based on excess cash flow, as defined by the agreement, which must be paid within five days of the delivery of our audited financial statements. This payment amounted to $7.4 million in 2009 and will be $5.2 million for 2010. The agreement further provides that the next twelve scheduled monthly payments are reduced ratably by an aggregate of 50% of this additional payment. Accordingly, we have included an additional $3.2 million and $4.6 million in the current portion of long-term debt at both December 31, 2009 and 2008. Borrowings under the Amended and Restated Credit Agreement continue to bear interest at either (i) the prime rate plus a margin, or (ii) LIBOR plus a margin as defined by the Amended and Restated Credit Agreement, payable monthly. However, the margin for prime rate borrowings was reduced from 1.75% to 1.25%, and the margin for LIBOR rate borrowings was reduced from 3.25% to 2.75%. In addition, while the Amended and Restated Credit Agreement continues to be
76
Table of Contents
secured by substantially all of our assets and continues to place limitations on indebtedness, liens, dividends and distributions, asset sales, transactions with affiliates and acquisitions and conduct of business, all as defined in the agreements, the limitation on capital spending and certain other financial covenants were removed. The Amended and Restated Credit Agreement also included a maximum leverage ratio financial covenant. The leverage ratio is defined as the ratio of aggregate outstanding indebtedness to trailing twelve months Adjusted EBITDA. Adjusted EBITDA is defined as consolidated net earnings (or loss), plus net interest expense, income taxes, depreciation and amortization and share based compensation. The Amended and Restated Credit Agreement contains a material adverse change clause.
On October 30, 2009, the Company, Monotype Imaging Inc., Imaging Holdings Corp., International Typeface Corporation (collectively, the “Borrowers”) entered into a second amendment (the “Second Amendment”) to our Amended and Restated Credit Agreement. The Second Amendment amended, among other items, the following terms:
| • | Modified exceptions to the negative covenants to permit the Borrowers to create unsecured subordinated indebtedness represented by seller notes in connection with permitted acquisitions, provided that such indebtedness does not exceed $5,000,000 in the aggregate. |
| • | Modified the definition of “Adjusted EBITDA” by, among other things, allowing for the add-back of restructuring, issuance and cash non-operating costs and other expenses or losses which do not represent a cash item. Restructuring, issuance and cash non-operating costs include fees, costs and expenses incurred by the Company and its subsidiaries in connection with stock registrations and issuances, debt modifications, business restructurings and cash non-operating expenses, provided that all such cash non-operating expenses shall not exceed $250,000 and all such fees, costs and expense shall not exceed $1,500,000, in each case on a trailing twelve month basis. |
| • | Increased the base rate margin to 2.25% from 1.25% and LIBOR rate margin to 3.75% from 2.75%. |
| • | The “Excess Cash Flow” definition was modified to permit, among other things, the exclusion of cash payments made to fund permitted discrete asset acquisitions and permitted acquisitions from the calculation of excess cash flow. A permitted discrete asset acquisition pursuant to the Second Amendment is an acquisition by any loan party of certain non-operational assets of any person which, among other conditions, are related to the Borrowers’ business and have a purchase price not in excess of $1,500,000. The purchase price for all such acquisitions shall not exceed $3,000,000 in the aggregate. |
| • | The “Permitted Acquisition” definition was modified to, among other things, include acquisitions by any loan party and by certain non-U.S. subsidiaries of the Company which, among other requirements, (i) have a purchase price which does not exceed an aggregate amount of $15,000,000 together with all other acquisitions consummated during any fiscal year and (ii) immediately prior to and after giving effect to such acquisition, the Borrowers have unrestricted cash and cash equivalents of $20,000,000, either through the Company’s line of credit or cash on hand. |
| • | The “Permitted Investment” definition was modified to, among other things, include investments by loan parties in certain non-U.S. subsidiaries of the Company in an aggregate amount during any fiscal year not to exceed $15,000,000 for the purpose of funding Permitted Acquisitions, as defined in the Second Amendment. |
| • | Required the Company to make a prepayment of principal of the term loan in an aggregate amount equal to $5,000,000, together with accrued interest on such principal amount being |
77
Table of Contents
| prepaid through the date of prepayment as well an amendment fee of $0.6 million, which was accounted for as a debt discount. Accordingly, these costs are amortized into interest expense over the life of the related loans using the effective interest method. |
As of December 31, 2009, the blended interest rate on the Amended and Restated Credit Agreement was 4.0%. The Amended and Restated Credit Agreement also contains provisions for an increased interest rate during periods of default. We do not believe that these covenants will affect our ability to operate our business, and we were in compliance with the covenants under our Amended and Restated Credit Agreement as of December 31, 2009.
There were no outstanding borrowings on the revolving line-of-credit at December 31, 2009 or 2008.
7. Financial Instruments
Derivative Financial Instruments
On November 28, 2008, we entered into a long term interest rate swap contract to pay a fixed rate of interest of 2.2% in exchange for a floating rate interest payment tied to the one-month LIBOR to mitigate our exposure to interest rate fluctuations on our debt obligations. The contract has a notional amount of $50.0 million and matures on November 28, 2010. The total fair value of this financial instrument at December 31, 2009 was a liability of approximately $0.8 million, which is included in accrued expenses and other current liabilities in the accompanying consolidated balance sheet. The total fair value of this financial instrument at December 31, 2008 was a liability of approximately $1.3 million, which is included in other liabilities in the accompanying consolidated balance sheet. In 2009 and 2008 we recognized a loss of $0.9 million and $1.3 million, respectively, which have been included in loss (gain) on derivatives in the accompanying consolidated statements of income. Prior to November 28, 2008, we did not have any interest rate swap contracts outstanding.
On May 7, 2008, we entered into a long-term currency swap contract to purchase 18.3 million Euros in exchange for $28.0 million to mitigate foreign currency exchange rate risk on a Euro denominated intercompany note. In 2009, 2008 and 2007, we incurred a net gain of $0.6 million, a net loss of $1.1 million and a net gain of $3.2 million, respectively, on the intercompany note. The currency swap matures on December 14, 2012. The contract payment terms approximate the payment terms of this intercompany note. The currency swap contract reduces the availability under our revolving line-of-credit by $4.0 million. We did not designate the contract as a hedge; as such, associated gains and losses are recorded to gain on derivatives in our consolidated statements of operations. The total fair value of the financial instrument at December 31, 2009 and 2008 was approximately $1.1 million and $2.1 million, respectively. The current portion of the currency swap is included in prepaid expenses and other current assets and the long-term portion of the swap is included in other assets in our accompanying consolidated balance sheets. For the years ended December 31, 2009 and 2008, we incurred an aggregate fair value loss of $0.6 million and a gain of $1.9 million, which is included in loss (gain) on derivatives in our accompanying consolidated statements of income.
At December 31, 2009 and 2008, we had one interest rate cap contract outstanding with a notional amount totaling $95.0 million to limit our exposure to rising interest rates on our long term debt obligations. The contract has a fixed rate of 6.5% and expires December 31, 2010. Under the contract, to the extent that the London Inter-Bank Offering Rate (LIBOR) exceeds a fixed maximum rate, we will receive payments on the notional amount. The total fair value of the financial instrument at December 31, 2009 and 2008 was approximately $3 thousand and $13 thousand, respectively, and is included in other assets in our accompanying condensed consolidated balance sheets. In the years ended December 31, 2009, 2008 and 2007 we recognized losses of $10 thousand and $33 thousand, and a gain of $14 thousand, respectively, which have been included in loss (gain) on derivatives in the accompanying consolidated statements of income.
78
Table of Contents
We also incur foreign currency exchange gains and losses related to certain customers that are invoiced in US dollars, but who have the option to make an equivalent payment in their own functional currencies at a specified exchange rate as of a specified date. In the period from that date until payment in the customer’s functional currency is received and converted into US dollars, we can incur unrealized gains and losses. We utilize forward contracts with maturities of 90 days or less to hedge our exposure to these currency fluctuations. Any increase or decrease in the fair value of the forward contracts is offset by the change in the value of the hedged assets of our consolidated foreign affiliate. There were no outstanding currency hedges at December 31, 2009 or 2008. There was one outstanding currency hedge at December 31, 2007 with a marked to market loss of $74 thousand recognized in (gain) loss on foreign exchange within our consolidated statement of income.
Fair Value Measurements
Fair value is defined as the price that would be received to sell an asset or paid to transfer a liability in an orderly transaction between market participants. This clarified definition of fair value was adopted prospectively for all recurring measurements of fair value beginning on January 1, 2008, and for all nonrecurring measurements of fair value beginning on January 1, 2009. In order to increase consistency and comparability in fair value measurements, the Codification establishes a fair value hierarchy that prioritizes observable and unobservable inputs used to measure fair value into three broad levels, which are described below:
Level 1: Quoted prices (unadjusted) in active markets that are accessible at the measurement date for assets or liabilities. The fair value hierarchy gives the highest priority to Level 1 inputs.
Level 2: Other inputs that are observable directly or indirectly, such as quoted prices for similar assets and liabilities or market corroborated inputs.
Level 3: Unobservable inputs are used when little or no market data is available and requires the Company to develop its own assumptions about how market participants would price the assets or liabilities. The fair value hierarchy gives the lowest priority to Level 3 inputs.
In determining fair value, the Company utilizes valuation techniques that maximize the use of observable inputs and minimizes the use of unobservable inputs to the extent possible as well as considers counterparty and our own credit risk in its assessment of fair value.
79
Table of Contents
The following table presents our financial assets and liabilities that are carried at fair value, classified according to the three categories described above (in thousands):
| Fair Value Measurement at December 31, 2009 | ||||||||||||
| Total | Quoted Prices in Active Markets for Identical Assets (Level 1) |
Significant Other Observable Inputs (Level 2) |
Significant Unobservable Inputs (Level 3) | |||||||||
| Assets: |
||||||||||||
| Derivatives—currency swap, current portion |
$ | 327 | — | 327 | — | |||||||
| Derivatives—interest rate cap, short-term |
3 | — | 3 | — | ||||||||
| Derivatives—currency swap, long-term portion |
808 | — | 808 | — | ||||||||
| Total assets |
$ | 1,138 | $ | — | $ | 1,138 | $ | — | ||||
| Liabilities: |
||||||||||||
| Derivatives—interest rate swap, current |
$ | 771 | $ | — | $ | 771 | $ | — | ||||
| Total liabilities |
$ | 771 | $ | — | $ | 771 | $ | — | ||||
The Company’s recurring fair value measures relate to derivative instruments. The fair value of our derivatives is based on quoted market prices from various banking institutions or an independent third party provider for similar instruments. In determining the fair value, we consider our non-performance risk and that of our counterparties. At December 31, 2009, the fair value of our long term debt approximates its carrying value of $91.4 million. The Company’s non-financial assets and non-financial liabilities subject to non-recurring measures include goodwill and intangibles.
8. Employee Benefit Plans
Defined Contribution Plans
The Company has defined contribution plans in the United States, the United Kingdom and Japan. The Company has a defined contribution employee savings plan in the United States, the Monotype Imaging Employee Savings Plan (the “U.S. 401(k) Plan”). In the United States, the provisions of Section 401(k) of the Internal Revenue Code under which its United States employees may make contributions govern the plan. On March 9, 2009, the Company’s U.S. 401(k) Plan was amended to change the Company’s matching contribution amount, as prescribed by the plan, from a fixed dollar-for-dollar match up to the first 6% of the participant’s compensation to a discretionary employer matching contribution. For the years ended December 31, 2009, 2008 and 2007, the Company matched dollar-for-dollar up to the first 6% of the participant’s compensation. The 401(k) Plan also provides for a discretionary employer profit sharing contribution. Participants are fully vested in the current value of their contributions and all earnings thereon. Participants become vested in the employer contributions and all earnings thereon based on years of service as follows: 25.0% vested after one year; 50.0% vested after two years; 100.0% vested after three years. In the United Kingdom we contribute 5% of each employee’s salary into a retirement account provided the employee contributes a minimum of 3% of salary. In Japan, the Company contributes a fixed percent of the employee’s salary into an interest bearing account. Contributions to all of the Company’s defined contribution plans were $1.2 million, $1.3 million and $1.0 million for the years ended December 31, 2009, 2008 and 2007, respectively, and have been included in the accompanying consolidated statements of income.
80
Table of Contents
Defined Benefit Pension Plan
Linotype maintains an unfunded defined benefit pension plan based on the “Versorgungsordnung der Heidelberger Druckmaschinen AG” (the “Linotype Plan”) which covers substantially all employees of Linotype who joined before April 1, 2006, at which time the Linotype Plan was closed. Employees are entitled to benefits in the form of retirement, disability and surviving dependent pensions. Benefits generally depend on years of service and the salary of the employees.
The components of net periodic benefit cost included in the accompanying consolidated statements of income were as follows:
| 2009 | 2008 | 2007 | |||||||||
| Service cost |
$ | 76 | $ | 99 | $ | 122 | |||||
| Interest cost |
169 | 173 | 144 | ||||||||
| Recognized losses |
(33 | ) | (17 | ) | — | ||||||
| Net periodic benefit cost |
$ | 212 | $ | 255 | $ | 266 | |||||
The assumptions used to determine the net periodic benefit cost were as follows:
| 2009 | 2008 | 2007 | |||||||
| Weighted-average Discount Rate |
5.25 | % | 5.8 | % | 5.5 | % | |||
| Weighted-average Rate of Compensation Increase |
3.0 | % | 3.0 | % | 2.0 | % |
Reconciliation of Funded Status and Accumulated Benefit Obligation
The Linotype Plan is an unfunded plan and accordingly has no assets. A reconciliation of the beginning and ending balance of the projected benefit obligation for the years ended December 31, 2009 and 2008 is as follow:
| 2009 | 2008 | |||||||
| Change in projected benefit obligation: |
||||||||
| Projected benefit obligation at beginning of year |
$ | 2,941 | $ | 3,170 | ||||
| Service cost |
76 | 99 | ||||||
| Interest cost |
169 | 173 | ||||||
| Actuarial loss (gain) |
231 | (282 | ) | |||||
| Benefits paid |
(72 | ) | (67 | ) | ||||
| Foreign currency exchange rate changes |
106 | (152 | ) | |||||
| Projected benefit obligation at end of year |
$ | 3,451 | $ | 2,941 | ||||
| Accumulated benefit obligation |
$ | 3,339 | $ | 2,842 | ||||
| Funding status at end of year |
$ | (3,451 | ) | $ | (2,941 | ) | ||
| Net Amounts Recognized in the Financial Statements: |
||||||||
| Current liability |
$ | 82 | $ | 76 | ||||
| Unrecognized actuarial gain reported within accrued pension benefits and accumulated other comprehensive loss |
$ | 3,369 | $ | 2,865 | ||||
| Net accrued pension liability recognized |
3,451 | 2,941 | ||||||
| Amounts included in other accumulated comprehensive income not yet recognized in periodic pension cost, net of tax |
353 | 544 | ||||||
| Amounts expected to be amortized from accumulated comprehensive income into net periodic pension costs over the next fiscal year consists of net actuarial gain/loss |
13 | 33 | ||||||
81
Table of Contents
Linotype also provides cash awards to its employees based on length of service. At December 31, 2009 and 2008, the balance accrued for such benefits totaled $110 thousand and $94 thousand, respectively, and is included in accrued pension benefits in the accompanying consolidated balance sheets.
The assumptions used to determine the accrued pension benefits (obligations) were as follows:
| 2009 | 2008 | |||||
| Weighted-average Discount Rate |
5.25 | % | 5.8 | % | ||
| Weighted-average Rate of Compensation Increase |
3.0 | % | 3.0 | % | ||
| Rate of Inflation |
2.0 | % | 2.0 | % |
The most recent actuarial valuation of the plan was performed as of December 31, 2009. The measurement dates are December 31, 2009 for 2009 and December 31, 2008 for 2008.
The following table reflects the total future expected benefit payments to plan participants. These payments have been estimated based on the same assumptions used to measure the Company’s benefit obligation at year end.
| Expected Future Benefit Payments: |
|||
| 2010 |
$ | 82 | |
| 2011 |
90 | ||
| 2012 |
96 | ||
| 2013 |
110 | ||
| 2014 |
131 | ||
| 2015-2019 |
948 |
9. Income Taxes
The components of domestic and foreign income before the provision for income taxes are as follows (in thousands):
| 2009 | 2008 | 2007 | |||||||
| U.S. |
$ | 11,783 | $ | 15,467 | $ | 6,010 | |||
| Foreign |
9,194 | 9,684 | 7,886 | ||||||
| Total income before income tax provision |
$ | 20,977 | $ | 25,151 | $ | 13,896 | |||
The components of the income tax provision are as follows (in thousands):
| December 31, | ||||||||||||
| 2009 | 2008 | 2007 | ||||||||||
| Current |
||||||||||||
| U.S. Federal |
$ | 1,524 | $ | 2,504 | $ | 811 | ||||||
| State and local |
408 | 655 | 424 | |||||||||
| Foreign jurisdictions |
3,712 | 3,374 | 4,645 | |||||||||
| 5,644 | 6,533 | 5,880 | ||||||||||
| Deferred |
||||||||||||
| U.S. Federal |
2,599 | 4,170 | 396 | |||||||||
| State and local |
(40 | ) | (671 | ) | 4 | |||||||
| Foreign jurisdictions |
(628 | ) | (262 | ) | (1,448 | ) | ||||||
| 1,931 | 3,237 | (1,048 | ) | |||||||||
| Total provision |
$ | 7,575 | $ | 9,770 | $ | 4,832 | ||||||
82
Table of Contents
A reconciliation of income taxes computed at federal statutory rates to income tax expense is as follows (dollar amounts in thousands):
| December 31, | |||||||||||||||||||||
| 2009 | 2008 | 2007 | |||||||||||||||||||
| Provision for income taxes at statutory rate |
$ | 7,342 | 35.0 | % | $ | 8,803 | 35.0 | % | $ | 4,864 | 35.0 | % | |||||||||
| State and local income taxes, net of federal tax benefit |
373 | 1.7 | % | 508 | 2.0 | % | 278 | 2.0 | % | ||||||||||||
| Non-deductible registration costs |
— | — | 415 | 1.6 | % | — | — | ||||||||||||||
| Foreign rate differential |
(363 | ) | (1.7 | )% | 189 | 0.7 | % | (30 | ) | (0.2 | )% | ||||||||||
| Effect of rate changes on deferred taxes |
(134 | ) | (0.6 | )% | (527 | ) | (2.1 | )% | (1,427 | ) | (10.3 | )% | |||||||||
| Stock compensation |
415 | 2.0 | % | 423 | 1.7 | % | 1,226 | 8.8 | % | ||||||||||||
| Research credits |
(98 | ) | (0.5 | )% | (208 | ) | (0.8 | )% | (342 | ) | (2.4 | )% | |||||||||
| Other, net |
40 | 0.2 | % | 167 | 0.7 | % | 263 | 1.9 | % | ||||||||||||
| Reported income tax provision |
$ | 7,575 | 36.1 | % | $ | 9,770 | 38.8 | % | $ | 4,832 | 34.8 | % | |||||||||
For the year ended December 31, 2009, our effective tax rate was 36.1%. The Company’s 2009 effective tax rate is lower than our 2008 effective tax rate, primarily due to an increased benefit related to foreign tax credits and non-deductible stock registration costs in 2008 did not occur in 2009. During the fourth quarter of 2009, the Company repatriated earnings from our Japanese subsidiary resulting in a foreign tax credit benefit, as the Japan tax rate on the underlying credits is greater than the U.S. tax on the repatriation of earnings. Non-deductible stock registration costs in 2008 increased the effective tax rate 1.6%. There was no similar item in 2009.
For the year ended December 31, 2008, our effective tax rate was 38.8%. The rate is higher than our 2007 effective tax rate, primarily as a result of the impact of the change in tax rates in Germany, from 40% to 30%, in 2007 which had the effect of decreasing the 2007 rate by 10%. This resulted in a decrease in deferred taxes provided in Germany. This has been partially offset by the reduction in the tax effect of stock compensation charges for financial reporting purposes that may not result in deductions for tax purposes. This amount resulted in an increase in the 2008 tax provision of 1.7%, versus an 8.8% increase in 2007. In addition, the 2008 tax rate was increased for non-deductible stock registration costs.
In connection with the preparation of its quarterly financial statements for the three months ended September 30, 2008, the Company discovered that it had been erroneously providing for state income taxes based on an incorrect apportionment methodology since 2005. The methodology applied resulted in the overstatement of deferred tax liabilities and a corresponding overstatement of its provision for income taxes. In accordance with SEC Staff Accounting Bulletin (SAB) No. 99, Materiality and SAB No. 108 (“SAB 108”), Considering the Effects of Prior Year Misstatements when Quantifying Misstatements in Current Year Financial Statements, the Company assessed the materiality of this error on its financial statements for the year ended December 31, 2007, using both the roll-over method and iron-curtain method as defined in SAB 108. The Company concluded the effect of this error was not material to its financial statements for any prior period and, as such, those financial statements are not materially misstated. The Company also concluded that providing for the correction of the error in 2008 did not have a material effect on its financial statements for the year ended December 31, 2008. Accordingly, the Company recorded a reduction to its provision for income taxes of $0.5 million and a corresponding reduction to its deferred income tax liabilities in 2008 to correct this error.
83
Table of Contents
Significant components of the Company’s deferred tax assets and liabilities consisted of the following (in thousands):
| December 31, | ||||||||
| 2009 | 2008 | |||||||
| Deferred tax assets: |
||||||||
| Compensation related deductions |
$ | 2,145 | $ | 978 | ||||
| Foreign reserves and other |
— | 330 | ||||||
| Tax credit carryforwards |
5,354 | 4,879 | ||||||
| Accrued expenses |
709 | 20 | ||||||
| Subtotal deferred tax assets |
8,208 | 6,207 | ||||||
| Valuation allowance |
(2,905 | ) | (3,042 | ) | ||||
| Total deferred income tax assets |
$ | 5,303 | $ | 3,165 | ||||
| Deferred tax liabilities: |
||||||||
| Intangible assets |
$ | 3,211 | $ | 1,478 | ||||
| Goodwill |
15,340 | 14,052 | ||||||
| Unrealized gains |
2,175 | 911 | ||||||
| Unremitted earnings of foreign subsidiaries |
1,517 | 1,068 | ||||||
| Other |
264 | 747 | ||||||
| Total deferred tax liabilities |
$ | 22,507 | $ | 18,256 | ||||
| Net deferred tax liabilities |
$ | 17,204 | $ | 15,091 | ||||
| Allocated as follows: |
||||||||
| Net deferred income tax assets—short-term |
878 | 1,637 | ||||||
| Net deferred income tax assets—long-term (1) |
243 | 1,528 | ||||||
| Net deferred income tax liabilities—short-term (2) |
(15 | ) | (1,091 | ) | ||||
| Net deferred income tax liabilities—long-term |
(18,310 | ) | (17,165 | ) | ||||
| Net deferred income tax liabilities |
$ | (17,204 | ) | $ | (15,091 | ) | ||
| (1) | Included in other assets in the accompanying consolidated balance sheet. |
| (2) | Included in accrued expenses and other current liabilities in the accompanying consolidated balance sheet. |
In assessing the realizability of the deferred tax assets, the primary evidence we considered included the cumulative pre-tax income for financial reporting purposes over the past three years, and the estimated future taxable income based on historical, as well as subsequent interim period operating results. After giving consideration to these factors, we concluded that it was more likely than not that the domestic deferred tax assets would be fully realized, and as a result, no valuation allowance against the domestic deferred tax assets was deemed necessary at December 31, 2009 and 2008.
A valuation allowance has been established for potential foreign tax credits that may be generated by Linotype’s deferred tax liability related to temporary differences caused by purchase accounting adjustments. As of December 31, 2009 this valuation allowance against these credits was $2.9 million. We have elected to treat Linotype as a branch for U.S. tax purposes, and therefore we are eligible to claim a foreign tax credit for taxes paid to Germany. As a result of the complexity of the U.S. foreign tax credit computation, and the uncertainty related to whether we will be entitled to a foreign tax credit when the related taxes are paid or accrued, we have established a partial valuation allowance against these credits. In accordance with ASC Topic No. 740, the Company has classified approximately $1.5 million to its reserve for uncertain tax positions at December 31, 2009.
84
Table of Contents
The following is a reconciliation of the Company’s gross uncertain tax positions at December 31, 2009 and 2008 (in thousands):
| January 1, 2007 |
$ | 1,663 | ||
| Increases related to positions taken in prior years |
604 | |||
| Increase related to positions taken in the current year |
— | |||
| Decrease related to positions taken in the current year |
(599 | ) | ||
| December 31, 2007 |
$ | 1,668 | ||
| Increases related to positions taken in prior years |
124 | |||
| Decrease related to positions taken in prior years |
(245 | ) | ||
| Increases related to positions taken in the current year |
84 | |||
| December 31, 2008 |
$ | 1,631 | ||
| Decrease related to positions taken in prior years |
(205 | ) | ||
| Increases related to positions taken in the current year |
58 | |||
| December 31, 2009 |
$ | 1,484 | ||
Of this amount of unrecognized tax benefits, approximately $1.3 million and $1.1 million, if recognized, would result in a reduction of the Company’s effective tax rate at December 31, 2009 and December 31, 2008, respectively. As of December 31, 2009, the Company has recorded a liability of $1.5 million related to uncertain tax positions, in long term liabilities. The Company recognizes interest and penalties as a component of income tax expense. As of December 31, 2009, the Company has accrued approximately $0.4 million for tax related interest and penalties. The current year tax provision includes a provision of approximately $0.1 million for interest or $55 thousand, net of federal benefit. The Company does not anticipate a significant change in the balance of uncertain tax positions over the next twelve months.
The Company monitors the undistributed earnings of foreign subsidiaries and, as necessary, provides for income taxes on those earnings that are not deemed permanently invested. As of December 31, 2009, there was approximately $4.3 million of undistributed earnings related to the Company’s U.K. and Japan subsidiaries, for which deferred U.S. taxes have been provided.
The Company is currently subject to audit by the Internal Revenue Service and foreign jurisdictions for the years 2006 through 2009. The Company and its subsidiaries state income tax returns are subject to audit for the years 2005 through 2009.
10. Accumulated other comprehensive income
The following table provides the components of accumulated other comprehensive income (loss):
| Foreign Currency Translation Adjustment |
ASC 715-30 Pension Liability |
Accumulated Other Comprehensive Income (Loss) |
||||||||||
| Balance at December 31, 2007 |
$ | 2,252 | $ | 369 | $ | 2,621 | ||||||
| Current year change, net of tax of ($739) and $75 for foreign currency translation and unrecognized actuarial gain, respectively |
(1,140 | ) | 175 | (965 | ) | |||||||
| Balance at December 31, 2008 |
1,112 | 544 | 1,656 | |||||||||
| Current year change, net of tax of $472 and ($86) for foreign currency translation and unrecognized actuarial loss, respectively |
889 | (202 | ) | 687 | ||||||||
| Balance at December 31, 2009 |
$ | 2,001 | $ | 342 | $ | 2,343 | ||||||
85
Table of Contents
11. Net income (loss) per share
Basic and diluted earnings per share are computed pursuant to the two-class method. The two-class method determines earnings per share for each class of common stock and participating security according to their respective participation rights in undistributed earnings. Unvested restricted stock awards granted to employees are considered participating securities as they receive non-forfeitable rights to cash dividend at the same rate as common stock. In accordance with ASC Topic No. 260, diluted net income per share is calculated using the more dilutive of the following two approaches:
| 1. | Assume exercise of stock options and vesting of restricted stock using the treasury stock method. |
| 2. | Assume exercise of stock options using the treasury stock method, but assume participating securities (unvested restricted stock) are not vested and allocate earnings to common shares and participating securities using the two-class method. |
For all periods presented the treasury stock method was used in the computation as both approaches resulted in the same diluted net income per share. The following presents a reconciliation of the numerator and denominator used in the calculation of basic and a reconciliation of the denominator used in the calculation of diluted net income per share (in thousands, except share and per share data):
| Year Ended December 31, | ||||||||||||
| 2009 | 2008 (1) | 2007 (1) | ||||||||||
| Numerator: |
||||||||||||
| Net income, as reported |
$ | 13,402 | $ | 15,381 | $ | 9,064 | ||||||
| Less: preferred stock accretion |
— | — | (34,086 | ) | ||||||||
| Less: net (income) loss attributable to participating securities |
(87 | ) | (251 | ) | — | |||||||
| Net income (loss) available to common shareholders—basic and diluted |
$ | 13,315 | $ | 15,130 | $ | (25,022 | ) | |||||
| Denominator: |
||||||||||||
| Basic: |
||||||||||||
| Weighted-average shares of common stock outstanding |
34,589,410 | 34,389,086 | 17,099,950 | |||||||||
| Less: Weighted-average shares of unvested restricted common stock outstanding |
(223,866 | ) | (570,578 | ) | (925,785 | ) | ||||||
| Weighted-average number of common shares used in computing basic net income (loss) per common share |
34,365,544 | 33,818,508 | 16,174,165 | |||||||||
| Net income (loss) per share applicable to common shareholders—basic |
$ | 0.39 | $ | 0.45 | $ | (1.55 | ) | |||||
| Diluted: |
||||||||||||
| Weighted-average shares of common stock outstanding |
34,589,410 | 34,389,086 | 17,099,950 | |||||||||
| Less: Weighted-average shares of unvested restricted common stock outstanding |
(223,866 | ) | (570,578 | ) | (925,785 | ) | ||||||
| Weighted-average number of common shares issuable upon exercise of outstanding stock options, based on the treasury stock method |
813,106 | 1,065,759 | — | |||||||||
| Weighted-average number of shares of restricted common stock outstanding |
109,476 | 420,527 | — | |||||||||
| Weighted-average number of common shares used in computing diluted net income (loss) per common share |
35,288,126 | 35,304,794 | 16,174,165 | |||||||||
| Net income (loss) per share applicable to common shareholders—diluted |
$ | 0.38 | $ | 0.43 | $ | (1.55 | ) | |||||
| (1) | As adjusted as noted above and due to the implementation of ASC 260-10-45-61A. |
86
Table of Contents
The following common share equivalents have been excluded from the computation of diluted weighted-average shares outstanding, for the periods indicated, as their effect would have been anti-dilutive:
| Year Ended December 31, | ||||||
| 2009 | 2008 | 2007 | ||||
| Options |
1,684,175 | 1,033,662 | 1,322,142 | |||
The Company excludes shares with combined exercise prices and unamortized fair values that are greater than the average market price for the Company’s common stock from the calculation of diluted net income per share because their effect is anti-dilutive.
12. Stock Compensation Plans
In November 2004, the Company’s stockholders approved the 2004 Stock Option and Grant Plan (the “2004 Award Plan”). The 2004 Award Plan provides long-term incentives and rewards to full-time and part-time officers, directors, employees, consultants, advisors and other key persons (collectively, “Key Persons”) who are responsible for, or contribute to, the management, growth or profitability of the Company. Options and stock grants issued under the 2004 Award Plan generally vest over a four year period and expire ten years from the date of grant. The Company has granted incentive stock options, nonqualified stock options and restricted stock awards under the 2004 Award Plan. As of December 31, 2009, 2,591,204 options and 2,810,403 restricted stock awards have been granted under the 2004 Option Plan. There will be no future grants of awards from the 2004 Award Plan. Pursuant to the terms of our 2004 Award Plan, we have the right to repurchase unvested restricted shares from employees upon their termination, and it is generally our policy to do so. In the year ended December 31, 2009, we did not repurchase any shares of unvested restricted stock pursuant to the 2004 Award Plan. In the year ended December 31, 2008 we repurchased 33,000 shares of unvested restricted stock in accordance with the 2004 Award Plan.
In March 2007, the Company’s Board of Directors approved the adoption of the Company’s 2007 Stock Option and Incentive Plan (“2007 Award Plan”), and the 2007 Award Plan was subsequently approved by stockholders in May 2007 and became effective on July 24, 2007. The 2007 Award Plan permits the Company to make grants of incentive stock options, non-qualified stock options, stock appreciation rights, deferred stock awards, restricted stock awards, unrestricted stock awards, cash-based awards and dividend equivalent rights to Key Persons. The Company has reserved 4,383,560 shares of common stock for issuance of awards under the 2007 Award Plan, subject to adjustment for any stock split, dividend or other change in the Company’s capitalization. In addition, shares that are forfeited or cancelled from awards under the 2004 Award Plan or the 2007 Award Plan will be available for future grants under the 2007 Award Plan. Stock options granted under the 2007 Award Plan have a maximum term of ten years from the date of grant and generally vest over four years. Option awards granted under the 2007 Award Plan must have an exercise price of no less than the fair market value of the common stock on the date of grant. As of December 31, 2009, 2,521,105 options and 142,561 restricted stock awards have been granted under the 2007 Option Plan. Pursuant to the terms of our 2007 Award Plan, we automatically reacquire any unvested restricted shares at their original price from the grantee upon termination of employment. In the year ended December 31, 2009, we repurchased 9,322 shares of unvested restricted common stock pursuant to the 2007 Award Plan. In the year ended December 31, 2008, we did not repurchase any shares of our common stock in accordance with the 2007 Award Plan.
87
Table of Contents
Share Based Compensation
The following presents the impact of share based compensation expense on our consolidated statements of income (in thousands):
| Year Ended December 31, | |||||||||
| 2009 | 2008 | 2007 | |||||||
| Marketing and selling |
$ | 1,818 | $ | 1,141 | $ | 476 | |||
| Research and development |
1,186 | 717 | 2,875 | ||||||
| General and administrative |
2,182 | 1,776 | 906 | ||||||
| Total share based compensation |
$ | 5,186 | $ | 3,634 | $ | 4,257 | |||
Included in our share based compensation expense in the year ended December 31, 2007, was $2.6 million of expense on the shares of restricted common stock that were issued upon the conversion of the China Type Design promissory notes which is included in research and development in the accompanying consolidated statements of income.
As of December 31, 2009, the Company had $8.5 million of unrecognized compensation expense related to employees and directors unvested stock option awards and restricted share awards that are expected to be recognized over a weighted average period of 2.4 years.
Stock Option Awards
Stock option activity for the year ended December 31, 2009 is presented below:
| Number of Shares |
Weighted- Average Exercise Price per Share |
Aggregate Intrinsic Value (1) (in thousands) |
Weighted- Average Remaining Contractual Life (in Years) | ||||||||
| Outstanding at December 31, 2008 |
3,077,231 | $ | 7.95 | ||||||||
| Granted |
1,236,304 | $ | 4.02 | ||||||||
| Exercised |
(107,799 | ) | $ | 1.16 | |||||||
| Cancelled |
(103,584 | ) | $ | 9.17 | |||||||
| Outstanding at December 31, 2009 |
4,102,152 | $ | 6.91 | $ | 14,851 | 7.6 | |||||
| Exercisable at December 31, 2009 |
2,058,780 | $ | 6.35 | $ | 8,297 | 6.5 | |||||
| Vested and expected to vest at December 31, 2009 (2) |
3,932,143 | $ | 6.89 | $ | 14,306 | ||||||
| (1) | The aggregate intrinsic value is calculated as the positive difference between the exercise price of the underlying options and the quoted price of our shares of common stock on December 31, 2009. |
| (2) | Represents the number of vested options as of December 31, 2009, plus the number of unvested options at December 31, 2009 that are ultimately expected to vest based on our estimated forfeiture rate. |
88
Table of Contents
Options granted during the 2007 period prior to our IPO on July 25, 2007, were as follows:
| Accounting Grant |
Legal Grant Date (1) |
Number of Shares |
Exercise Price Per Share (1) |
Fair Value of Common Stock (2) |
Accounting Grant Date Intrinsic Value of Options (3) | ||||||||
| January 10, 2007 |
December 31, 2006 | 89,000 | $ | 8.50 | $ | 8.82 | $ | 0.32 | |||||
| May 10, 2007 |
March 31, 2007 | 15,556 | $ | 11.35 | $ | 12.19 | $ | 0.84 | |||||
| August 2, 2007 |
June 30, 2007 | 50,844 | $ | 13.25 | $ | 12.00 | $ | — | |||||
| (1) | The exercise price was based on a contemporaneous valuation as of each legal grant date. The legal grant date is the date on which the compensation committee of the Board of Directors authorized the option grants with exercise prices equal to the fair market value of our common stock as of that date, to be finalized upon completion of a valuation report in the future. |
| (2) | For accounting purposes, the grant date for stock options cannot precede the date on which all of the necessary approvals were obtained and the key terms of the grant were known. Accordingly, the Company uses the date on which the compensation committee of our Board of Directors receives and approves the applicable valuation report as the grant date for accounting purposes. The fair value of the common stock at the accounting grant date was determined by straight-line interpolation of the fair value of the common stock per the valuation reports preceding and following the accounting grant date. |
| (3) | The intrinsic value of the options on the accounting grant date represents the increase in fair value of our common stock during the period of time between the legal and the accounting grant dates. |
Following our initial public offering on July 25, 2007, both the legal and accounting dates of options granted were the same as we had a readily available value of our common stock on the particular grant dates as traded on the NASDAQ Global Market.
The aggregate intrinsic value of exercised options in the years ended December 31, 2009, 2008 and 2007 was $0.5 million, $2.0 million and $2.6 million, respectively. The fair value of shares vested during 2009, 2008 and 2007 was $1.0 million, $6.3 million and $7.5 million, respectively.
Cash received from option exercises under all share based payment arrangements for the years ended December 31, 2009, 2008 and 2007 was $0.1 million, $0.6 million and $0.3 million, respectively. Option exercises will result in the issuance of new shares of common stock.
Unvested Share Awards
Unvested share activity for the year ended December 31, 2009 is presented below:
| Shares | Weighted- Average Grant Date Fair Value Per Share | |||||
| Unvested shares outstanding at December 31, 2008 |
291,300 | $ | 3.68 | |||
| Granted |
57,385 | $ | 6.50 | |||
| Vested |
(166,595 | ) | $ | 3.27 | ||
| Forfeited |
(9,322 | ) | $ | 14.75 | ||
| Unvested shares outstanding at December 31, 2009 |
172,768 | $ | 4.42 | |||
89
Table of Contents
13. Restructuring
On November 10, 2008 we implemented a restructuring plan. Under the plan, we reduced headcount in certain areas of the Company and redeployed certain other employees within the Company in order to focus on key initiatives across the business. This restructuring plan was completed in April 2009, other than the payment of deferred termination benefits to certain terminated employees. A second restructuring plan was implemented on October 21, 2009, which included certain actions that were taken during the three months ended September 30, 2009 in advance of finalizing the plan. Under the restructuring plan, the Company will reduce headcount in an effort to improve operational efficiencies, primarily within the creative professional area of our business, and consolidate certain functions of our European operations within our United Kingdom office. The plan provided for the elimination of 15 positions worldwide. The Company expects to record a charge of approximately $0.9 million for severance and termination benefits associated with this plan. Approximately $52 thousand was recognized in the third quarter of 2009, related to an initial termination that was subsequently included in the plan. In accordance with ASC Topic No. 420, Exit or Disposal Cost Obligations, (“ASC 420”) if an employee continues to work beyond a minimum period of time after notification, the termination benefits are to be accrued over the period that they continue to work. As certain of the employees are required to continue working beyond the minimum periods specified in ASC 420 in order to receive their termination benefits, the Company will accrue such benefits over the remaining term of employment. The Company recorded charges to operations of approximately $0.6 million in the fourth quarter of 2009, and expects to record approximately $0.2 million and $0.1 million in the first and second quarters of 2010, respectively, as a result of the actions taken in the fourth quarter of 2009. We expect the restructuring actions to be completed in the second quarter of 2010.
The following presents the impact of the restructuring actions on our consolidated statements of income (in thousands):
| 2009 | 2008 | |||||
| Marketing and selling |
$ | 437 | $ | 297 | ||
| Research and development |
52 | 124 | ||||
| General and administrative |
175 | 315 | ||||
| Total restructuring |
$ | 664 | $ | 736 | ||
Restructuring charges incurred to date relate to severance and termination benefits.
The following presents the restructuring provision (in thousands):
| Personnel related |
||||
| Charges during 2008 |
$ | 736 | ||
| Cash payments during 2008 |
(116 | ) | ||
| Foreign currency exchange rate changes |
15 | |||
| Provision at December 31, 2008 |
$ | 635 | ||
| Charges during 2009 |
664 | |||
| Cash payments during 2009 |
(911 | ) | ||
| Foreign currency exchange rate changes |
(12 | ) | ||
| Provision at December 31, 2009 |
$ | 376 | ||
Future cash expenditures related to the restructuring are expected to be approximately $0.4 million, net of tax savings.
90
Table of Contents
14. Segment Reporting
We view our operations and manage our business as one segment: the development, marketing and licensing of technologies and fonts. Factors used to identify our single segment include the financial information available for evaluation by our chief operating decision maker, our president and chief executive officer, in determining how to allocate resources and assess performance. While our technologies and services are sold into two principal markets, OEM and creative professional, expenses and assets are not formally allocated to these market segments, and operating results are assessed on an aggregate basis to make decisions about the allocation of resources. The following table presents revenue for our two major markets (in thousands):
| Year Ended December 31, | |||||||||
| 2009 | 2008 | 2007 | |||||||
| OEM |
$ | 68,967 | $ | 77,810 | $ | 72,612 | |||
| Creative professional |
25,038 | 33,051 | 32,540 | ||||||
| Total |
$ | 94,005 | $ | 110,861 | $ | 105,152 | |||
Geographic segment information
The Company attributes revenues to geographic areas based on the location of our subsidiary receiving such revenue. For example, licenses may be sold to large international companies which may be headquartered in Korea for instance, but the sales are received and recorded by our subsidiary located in the United States. This revenue is therefore reflected in the United States totals in the table below. We market our products and services through offices in the U.S., the United Kingdom, Germany, Hong Kong, Korea and Japan. The following summarizes revenue by location:
| Year Ended December 31, | ||||||||||||||||||
| 2009 | 2008 | 2007 | ||||||||||||||||
| Sales | % of Total | Sales | % of Total | Sales | % of Total | |||||||||||||
| (In thousands, except percentages) | ||||||||||||||||||
| United States |
$ | 31,634 | 33.6 | % | $ | 35,975 | 32.5 | % | $ | 32,873 | 31.3 | % | ||||||
| Asia |
36,246 | 38.6 | 42,658 | 38.5 | 40,823 | 38.8 | ||||||||||||
| United Kingdom |
10,418 | 11.1 | 12,905 | 11.6 | 12,171 | 11.6 | ||||||||||||
| Germany |
15,707 | 16.7 | 19,323 | 17.4 | 19,285 | 18.3 | ||||||||||||
| Total |
$ | 94,005 | 100.0 | % | $ | 110,861 | 100.0 | % | $ | 105,152 | 100.0 | % | ||||||
Long-lived assets, which include property, plant and equipment, goodwill and intangibles, but exclude other assets, long-term investments and deferred tax assets, are attributed to geographic areas in which Company assets reside and is shown below (in thousands):
| December 31, | ||||||
| 2009 | 2008 | |||||
| Long-lived assets: |
||||||
| United States |
$ | 162,494 | $ | 167,834 | ||
| Asia |
3,523 | 3,658 | ||||
| United Kingdom |
59 | 74 | ||||
| Germany |
61,547 | 60,841 | ||||
| Total |
$ | 227,623 | $ | 232,407 | ||
91
Table of Contents
15. Commitments and Contingencies
Operating Leases
We conduct operations in facilities under operating leases expiring through 2015. In accordance with the lease terms, we pay real estate taxes and other operating costs. Our leases in Colorado, Germany and Massachusetts contain renewal options. The Company’s future minimum payments under non-cancelable operating leases as of December 31, 2009, are approximately as follows (in thousands):
| Years ending December 31: |
|||
| 2010 |
$ | 1,730 | |
| 2011 |
1,836 | ||
| 2012 |
1,641 | ||
| 2013 |
917 | ||
| 2014 |
912 | ||
| Thereafter |
304 | ||
| Total |
$ | 7,340 | |
Rent expense charged to operations was approximately $2.0 million, $1.7 million and $1.6 million for the years ended December 31, 2009, 2008 and 2007, respectively.
License Agreements
We license fonts and related technology from third parties for development and resale purposes, and certain of our license agreements provide for minimum annual payments. As of December 31, 2009, we had the following minimum commitments under such license agreements (in thousands):
| Years ending December 31: |
|||
| 2010 |
$ | 900 | |
| 2011 |
100 | ||
| 2012 |
— | ||
| 2013 |
— | ||
| 2014 |
— | ||
| Total |
$ | 1,000 | |
Legal Proceedings
From time to time, we may be a party to various claims, suits and complaints. We are not currently a party to any legal proceedings that, if determined adversely to us, would have a material adverse effect on our business, results of operations or financial condition.
Licensing Warranty
Under our standard license agreement with OEMs, we warrant that the licensed technologies are free of infringement claims of intellectual property rights and will meet the specifications as defined in the licensing agreement for a one-year period. Under the licensing agreements, liability for such indemnity obligations is limited, generally to the total arrangement fee; however, exceptions have been made on a case-by-case basis, increasing the maximum potential liability to agreed upon amounts at the time the contract is entered into. We have never incurred costs payable to a customer or business partner to defend lawsuits or settle claims related to these warranties, and as a result, management believes the estimated fair value of these warranties is minimal. Accordingly, there are no liabilities recorded for these warranties as of December 31, 2009 and 2008.
92
Table of Contents
16. Supplementary Financial Data (Unaudited)
(in thousands, except share amounts)
| Three Months Ended | ||||||||||||||||||||||||
| December 31, 2009 |
September 30, 2009 |
June 30, 2009 |
March 31, 2009 |
December 31, 2008 |
September 30, 2008 |
June 30, 2008 |
March 31, 2008 | |||||||||||||||||
| Revenue |
$ | 25,116 | $ | 23,032 | $ | 22,251 | $ | 23,606 | $ | 27,369 | $ | 27,310 | $ | 28,839 | $ | 27,343 | ||||||||
| Cost of revenue |
1,870 | 1,788 | 1,442 | 1,761 | 1,702 | 2,640 | 2,058 | 2,701 | ||||||||||||||||
| Cost of revenue—amortization of acquired technology |
848 | 847 | 845 | 843 | 844 | 848 | 851 | 849 | ||||||||||||||||
| Total cost of revenue |
2,718 | 2,635 | 2,287 | 2,604 | 2,546 | 3,488 | 2,909 | 3,550 | ||||||||||||||||
| Gross profit |
$ | 22,398 | $ | 20,397 | $ | 19,964 | $ | 21,002 | $ | 24,823 | $ | 23,822 | $ | 25,930 | $ | 23,793 | ||||||||
| Net income |
4,022 | 3,019 | 3,071 | 3,290 | 4,078 | 4,393 | 3,224 | 3,686 | ||||||||||||||||
| Net income available to common shareholders |
4,000 | 3,001 | 3,050 | 3,264 | 4,032 | 4,330 | 3,164 | 3,604 | ||||||||||||||||
| Income per common share: |
||||||||||||||||||||||||
| Basic |
$ | 0.12 | $ | 0.09 | $ | 0.09 | $ | 0.10 | $ | 0.12 | $ | 0.13 | $ | 0.09 | $ | 0.11 | ||||||||
| Diluted |
$ | 0.11 | $ | 0.08 | $ | 0.09 | $ | 0.09 | $ | 0.11 | $ | 0.12 | $ | 0.09 | $ | 0.10 | ||||||||
| Item 9. | Changes In and Disagreements With Accountants on Accounting and Financial Disclosure |
None.
| Item 9A. | Controls and Procedures |
We maintain disclosure controls and procedures, which are designed to ensure that information required to be disclosed in the reports we file or submit under the Exchange Act is recorded, processed, summarized and reported within the time periods specified in the SEC’s rules and forms, and that such information is accumulated and communicated to our management, including our chief executive officer (“CEO”) and chief financial officer (“CFO”), as appropriate, to allow timely decisions regarding required disclosure.
Our management, including our CEO and CFO, evaluated the effectiveness of our disclosure controls and procedures, as such term is defined in Rule 13a-15(e) and Rule 15d-15(e) under the Exchange Act, as of the end of the period covered by this Annual Report on Form 10-K. Based on that evaluation, our management, including our CEO and CFO, concluded that our disclosure controls and procedures were effective as of December 31, 2009. All internal control systems, no matter how well designed, have inherent limitations. Therefore, even those systems determined to be effective can provide only reasonable assurance with respect to financial statement preparation and presentation.
Management’s Report on Internal Control Over Financial Reporting
Our management is responsible for establishing and maintaining adequate internal control over financial reporting, as this term is defined in Exchange Act Rule 13a-15(f) and 15d-15(f) of the Exchange Act. All internal control systems, no matter how well designed, have inherent limitations. Therefore, even those systems determined to be effective can provide only reasonable assurance with respect to financial statement preparation and presentation.
93
Table of Contents
Under the supervision and with the participation of our management, including our CEO and CFO, we conducted an evaluation of the effectiveness of our internal control over financial reporting based on the framework set forth in Internal Control-Integrated Framework issued by the Committee of Sponsoring Organizations of the Treadway Commission. Based on our evaluation under the framework set forth in Internal Control-Integrated Framework, our management concluded that our internal control over financial reporting was effective at the reasonable assurance level as of December 31, 2009.
Our internal control over financial reporting as of December 31, 2009 has been audited by Ernst & Young LLP, an independent registered public accounting firm, as stated in their report below.
Changes in Internal Control over Financial Reporting
An evaluation was also performed under the supervision and with the participation of our management, including the CEO and CFO, of any change in our internal controls over financial reporting that occurred during our last fiscal quarter and that has materially affected, or is reasonably likely to affect, our internal controls over financial reporting. There has been no change in our internal controls over financial reporting during our most recent fiscal quarter that has materially affected, or is reasonably likely to materially affect, our internal controls over financial reporting.
94
Table of Contents
REPORT OF INDEPENDENT REGISTERED PUBLIC ACCOUNTING FIRM
The Board of Directors and Stockholders of Monotype Imaging Holdings Inc.
We have audited Monotype Imaging Holding Inc.’s internal control over financial reporting as of December 31, 2009, based on criteria established in Internal Control—Integrated Framework issued by the Committee of Sponsoring Organizations of the Treadway Commission (the COSO criteria). Monotype Imaging Holding Inc.’s management is responsible for maintaining effective internal control over financial reporting, and for its assessment of the effectiveness of internal control over financial reporting included in the accompanying Management’s Report on Internal Control Over Financial Reporting. Our responsibility is to express an opinion on the company’s internal control over financial reporting based on our audit.
We conducted our audit in accordance with the standards of the Public Company Accounting Oversight Board (United States). Those standards require that we plan and perform the audit to obtain reasonable assurance about whether effective internal control over financial reporting was maintained in all material respects. Our audit included obtaining an understanding of internal control over financial reporting, assessing the risk that a material weakness exists, testing and evaluating the design and operating effectiveness of internal control based on the assessed risk, and performing such other procedures as we considered necessary in the circumstances. We believe that our audit provides a reasonable basis for our opinion.
A company’s internal control over financial reporting is a process designed to provide reasonable assurance regarding the reliability of financial reporting and the preparation of financial statements for external purposes in accordance with generally accepted accounting principles. A company’s internal control over financial reporting includes those policies and procedures that (1) pertain to the maintenance of records that, in reasonable detail, accurately and fairly reflect the transactions and dispositions of the assets of the company; (2) provide reasonable assurance that transactions are recorded as necessary to permit preparation of financial statements in accordance with generally accepted accounting principles, and that receipts and expenditures of the company are being made only in accordance with authorizations of management and directors of the company; and (3) provide reasonable assurance regarding prevention or timely detection of unauthorized acquisition, use or disposition of the company’s assets that could have a material effect on the financial statements.
Because of its inherent limitations, internal control over financial reporting may not prevent or detect misstatements. Also, projections of any evaluation of effectiveness to future periods are subject to the risk that controls may become inadequate because of changes in conditions, or that the degree of compliance with the policies or procedures may deteriorate.
In our opinion, Monotype Imaging Holdings Inc. maintained, in all material respects, effective internal control over financial reporting as of December 31, 2009, based on the COSO criteria.
We also have audited, in accordance with the standards of the Public Company Accounting Oversight Board (United States), the consolidated balance sheets of Monotype Imaging Holdings Inc. as of December 31, 2009 and 2008, and the related consolidated statements of income, convertible redeemable preferred stock, redeemable preferred stock and stockholders’ equity (deficit), and cash flows for each of the three years in the period ended December 31, 2009 and our report dated March 5, 2010 expressed an unqualified opinion thereon.
/S/ ERNST & YOUNG LLP
Boston, Massachusetts
March 5, 2010
95
Table of Contents
| Item 9B. | Other Information |
None.
PART III
| Item 10. | Directors, Executive Officers and Corporate Governance |
Pursuant to General Instructions G to Form 10-K, the information required for Part III, Item 10 is incorporated herein by reference from our proxy statement in connection with our 2010 Annual Meeting of Stockholders, which proxy statement is expected to be filed with the SEC not later than 120 days after the close of our fiscal year ended December 31, 2009.
| Item 11. | Executive Compensation |
Pursuant to General Instructions G to Form 10-K, the information required for Part III, Item 11, including specifically the “Compensation Committee Report,” is incorporated herein by reference from our proxy statement in connection with our 2010 Annual Meeting of Stockholders, which proxy statement is expected to be filed with the SEC not later than 120 days after the close of our fiscal year ended December 31, 2009.
| Item 12. | Security Ownership of Certain Beneficial Owners and Management and Related Stockholder Matters |
Pursuant to General Instructions G to Form 10-K, the information required for Part III, Item 12 is incorporated herein by reference from our proxy statement in connection with our 2010 Annual Meeting of Stockholders, which proxy statement is expected to be filed with the SEC not later than 120 days after the close of our fiscal year ended December 31, 2009.
| Item 13. | Certain Relationships and Related Transactions, and Directors Independence |
Pursuant to General Instructions G to Form 10-K, the information required for Part III, Item 13 is incorporated herein by reference from our proxy statement in connection with our 2010 Annual Meeting of Stockholders, which proxy statement is expected to be filed with the SEC not later than 120 days after the close of our fiscal year ended December 31, 2009.
| Item 14. | Principal Accountant Fees and Services |
Pursuant to General Instructions G to Form 10-K, the information required for Part III, Item 14 is incorporated herein by reference from our proxy statement in connection with our 2010 Annual Meeting of Stockholders, which proxy statement is expected to be filed with the SEC not later than 120 days after the close of our fiscal year ended December 31, 2009.
96
Table of Contents
PART IV
| Item 15. | Exhibits and Financial Statement Schedules |
(a) The following documents are filed as part of this Report:
1. Consolidated Financial Statements
The financial statements required by this item are listed in Item 8, “Financial Statements and Supplementary Data” herein.
2. List of Financial Statement Schedules
See “Schedule II—Valuation and Qualifying Accounts.” All other schedules are omitted because they are not applicable, not required or the required information is shown in the consolidated financial statements or notes thereto.
3. List of Exhibits
EXHIBIT INDEX
| Exhibit |
Description | |
| 3.1 | Amended and Restated Certificate of Incorporation of the Registrant (5) | |
| 3.2 | Amended and Restated By-Laws of the Registrant (4) | |
| 3.3 | Amendment No. 1 to the Amended and Restated By-Laws (14) | |
| 4.1 | Specimen Stock Certificate (5) | |
| 4.2 | Registration Rights Agreement by and among Monotype Imaging Holdings Corp., the Investors and the Management Stockholders named therein, dated as of November 5, 2004 (1) | |
| 4.3 | Stockholders Agreement by and among Monotype Imaging Holdings Corp., the Management Stockholders and the Investors named therein, dated as of November 5, 2004 (1) | |
| 4.4 | Amendment No. 1 to Registration Rights Agreement by and among Monotype Imaging Holdings Corp., and Investors and the Management Stockholders named therein, dated as March 31, 2008 (9) | |
| 10.1 | 2004 Stock Option and Grant Plan (1) | |
| 10.2 | Form of Non-Qualified Option Agreement under the 2004 Stock Option and Grant Plan (1) | |
| 10.3 | Form of Incentive Stock Option Agreement under the 2004 Stock Option and Grant Plan (1) | |
| 10.4 | Form of Restricted Stock Agreement under the 2004 Stock Option and Grant Plan (1) | |
| 10.5 | 2007 Stock Option and Incentive Plan (3) | |
| 10.6 | Form of Non-Qualified Option Agreement under the 2007 Stock Option and Incentive Plan (3) | |
| 10.7 | Form of Incentive Stock Option Agreement under the 2007 Stock Option and Incentive Plan (3) | |
| 10.8 | Form of Restricted Stock Agreement under the 2007 Stock Option and Incentive Plan (3) | |
97
Table of Contents
| Exhibit |
Description | |
| 10.9 | Form of Director Restricted Stock Award Agreement under the 2007 Stock Option and Incentive Plan (11) | |
| 10.10 | Service agreement by and between Monotype Imaging Inc. and Frank Wildenberg, dated as of January 24, 2007 (3) | |
| 10.11 | Employment agreement by and between Monotype Imaging Inc. and Scott E. Landers, dated as of July 14, 2008 (12) | |
| 10.12 | Employment agreement by and between Douglas J. Shaw and Monotype Imaging Inc., effective as of December 19, 2008 (15) | |
| 10.13 | Employment agreement by and between John L. Seguin and Monotype Imaging Inc., effective as of December 19, 2008 (15) | |
| 10.14 | Employment agreement by and between David L. McCarthy and Monotype Imaging Inc., effective as of December 19, 2008 (15) | |
| 10.15 | Employment agreement by and between Janet M. Dunlap and Monotype Imaging Inc., effective as of December 19, 2008 (15) | |
| 10.16 | Form of Indemnification Agreement between Monotype Imaging Inc. and certain of its Directors and Officers (1) | |
| 10.17 | Lease, dated as of January 5, 2005, between Acquiport Unicorn, Inc. and Monotype Imaging, Inc., as amended (3) | |
| 10.18 | Third Amendment to Lease by and between Acquiport Unicorn, Inc. and Monotype Imaging, Inc., dated as of March 4, 2008 (8) | |
| 10.19 | Fourth Amendment to Lease by and between Acquiport Unicorn, Inc. and Monotype Imaging, Inc., dated as of December 2, 2009* | |
| 10.20 | Lease, dated as of April 6, 2006, between 6610, LLC and Monotype Imaging, Inc. (1) | |
| 10.21 | First Amendment to Lease dated as of April 6, 2006, between 6610, LLC and Monotype Imaging, Inc. (8) | |
| 10.22 | Lease, dated as of February 18, 2008, between 6610, LLC and Monotype Imaging, Inc. (8) | |
| 10.23 | Lease, dated April 11, 2008, between ELINOR Grundstücksgesellschaft GmbH & Co. Apollo KG and Linotype GmbH (11) | |
| 10.24 | Lease between Bytec Group Limited and Monotype Imaging Limited, dated as of June 3, 2008 (13) | |
| 10.25 | Stock Purchase Agreement by and among Agfa Corp., Afga Monotype Corporation and Imaging Acquisition Corporation, dated as of November 5, 2004 (2) | |
| 10.26 | Security Agreement by and among the Grantors (as defined therein) and Wells Fargo Foothill, Inc., dated as of November 5, 2004 (3) | |
| 10.27 | Supplemental No. 1 to the Security Agreement by and among the Grantors (as defined therein) and Wells Fargo Foothill, Inc., dated as of December 28, 2006 (3) | |
| 10.28 | Intercompany Subordination Agreement by and among Monotype Acquisition Corporation, Agfa Monotype Corporation, International Typeface Corporation, Monotype Imaging Holdings Corp., and Wells Fargo Foothill, Inc., dated as of November 5, 2004 (3) | |
98
Table of Contents
| Exhibit |
Description | |
| 10.29 | Share Pledge Agreement by and among Monotype Imaging Holdings Corp., Blitz 06-683 GmbH, Wells Fargo Foothill, Inc. and the Lenders (as defined therein), dated as of July 31, 2006 (2) | |
| 10.30 | Joinder and Consent Agreement to and Consent and Waiver Under Credit Agreement, by and among Linotype Corp., Monotype Imaging Holdings Corp., Monotype Imaging, Inc., International Typeface Corporation, the Required Lenders (as defined therein) and Wells Fargo Foothill, Inc., dated as of December 13, 2006 (2) | |
| 10.31 | Amended and Restated Credit Agreement by and among Monotype Imaging Holdings Inc., Imaging Holdings Corp., Monotype Imaging Inc., and International typeface Corporation, as Borrowers, the Lenders (as defined therein) and Wells Fargo Foothill, Inc., as the Arranger and Administrative Agent, dated as of July 30, 2007 (6) | |
| 10.32 | Joinder to Security Agreement, Guaranty and Intercompany Subordination Agreement, by and among Monotype Imaging Holdings Inc., Imaging Holdings Corp., Monotype Imaging Inc., International Typeface Corporation, Linotype Corp., and Wells Fargo Foothill, Inc., as the Arranger and Administrative Agent, dated as of July 30, 2007 (8) | |
| 10.33 | Supplement No. 2 to the Security Agreement by and among the Grantors (as defined therein) and Wells Fargo Foothill, Inc., dated as of July 30, 2007 (8) | |
| 10.34 | Copyright Security Agreement by and among the Grantors (as defined therein) and Wells Fargo Foothill, Inc., dated as of July 30, 2007 (8) | |
| 10.35 | Trademark Security Agreement by and among the Grantors (as defined therein) and Wells Fargo Foothill, Inc., dated as of July 30, 2007 (8) | |
| 10.36 | Patent Security Agreement by and among the Grantors (as defined therein) and Wells Fargo Foothill, Inc., dated as of July 30, 2007 (8) | |
| 10.37 | First Amendment to the Amended and Restated Credit Agreement by and among Monotype Imaging Holdings Inc., Imaging Holdings Corp., Monotype Imaging Inc., and International Typeface Corporation, as Borrowers, the Lenders, (as defined therein) and Wells Fargo Foothill, Inc., as the Arranger and Administrative Agent, dated as of April 17, 2008 (10) | |
| 10.38 | Second Amendment to the Amended and Restated Credit Agreement by and among Monotype Imaging Holdings Inc., Imaging Holdings Corp., Monotype Imaging Inc., and International Typeface Corporation, as Borrowers, the Lenders, (as defined therein) and Wells Fargo Foothill, Inc., as the Arranger and Administrative Agent, dated as of October 20, 2009 (18) | |
| 10.39 | Equity Award Grant Policy, as amended (17) | |
| 10.40 | 2009 Executive Incentive Compensation Program, as amended (16) | |
| 10.41 | 2010 Executive Incentive Compensation Program (19) | |
| 10.42 | Agreement and Plan of Merger by and among the Registrant, MIHC Merger Sub Inc. and Monotype Imaging Holdings Corp., dated as of August 24, 2005 (1) | |
| 10.43 | Stock Purchase Agreement by and among Monotype Imaging Inc. and certain stockholders of China Type Design Limited, dated as of July 28, 2006 (1) | |
| 10.44 | Purchase Agreement for the Sale of Shares in Linotype GmbH by and among Heidelberger Druckmaschinen Aktiengesellschaft, Blitz 06-683 GmbH and Monotype Imaging Holdings Corp., dated as of August 1, 2006 (3) | |
99
Table of Contents
| Exhibit |
Description | |
| 14.1 | Code of Business Conduct and Ethics (7) | |
| 21.1 | List of Subsidiaries * | |
| 23.1 | Consent of Independent Registered Public Accounting Firm * | |
| 31.1 | Chief Executive Officer Certification pursuant to Section 302 of the Sarbanes-Oxley Act of 2002 * | |
| 31.2 | Chief Financial Officer Certification pursuant to Section 302 of the Sarbanes-Oxley Act of 2002 * | |
| 32.1 | Certification pursuant to 18 U.S.C. Section 1350, as adopted pursuant to Section 906 of the Sarbanes-Oxley Act of 2002, by Chief Executive Officer and Chief Financial Officer * | |
| (1) | Incorporated by reference to the Company’s Registration Statement on Form S-1 (File No. 333-140232), filed with the SEC on January 26, 2007. |
| (2) | Incorporated by reference to Amendment No. 1 to the Company’s Registration Statement on Form S-1 (File No. 333-140232), filed with the SEC on February 8, 2007. |
| (3) | Incorporated by reference to Amendment No. 2 to the Company’s Registration Statement on Form S-1 (File No. 333-140232), filed with the SEC on April 13, 2007. |
| (4) | Incorporated by reference to Amendment No. 4 to the Company’s Registration Statement on Form S-1 (File No. 333-140232), filed with the SEC on July 5, 2007. |
| (5) | Incorporated by reference to Amendment No. 5 to the Company’s Registration Statement on Form S-1 (File No. 333-140232), filed with the SEC on July 10, 2007. |
| (6) | Incorporated by reference to the Company’s Quarterly Report on Form 10-Q for the period ended June 30, 2007, filed on September 7, 2007. |
| (7) | Incorporated by reference to the Company’s Current Report on Form 8-K filed on February 8, 2008. |
| (8) | Incorporated by reference to the Company’s Annual Report on Form 10-K for the period ended December 31, 2007, filed on March 27, 2008. |
| (9) | Incorporated by reference to the Company’s Registration Statement on Form S-1 (File No. 333-150034), filed with the SEC on April 2, 2008. |
| (10) | Incorporated by reference to Amendment No. 1 to the Company’s Registration Statement on Form S-1 (File No. 333-150034), filed with the SEC on April 22, 2008 |
| (11) | Incorporated by reference to Amendment No. 2 to the Company’s Registration Statement on Form S-1 (File No. 333-150034), filed with the SEC on May 23, 2008. |
| (12) | Incorporated by reference to the Company’s Current Report on Form 8-K filed on July 17, 2008. |
| (13) | Incorporated by reference to the Company’s Quarterly Report on Form 10-Q for the period ended June 30, 2008, filed on August 12, 2008. |
| (14) | Incorporated by reference to the Company’s Current Report on Form 8-K filed on November 7, 2008. |
| (15) | Incorporated by reference to the Company’s Current Report on Form 8-K filed on December 22, 2008. |
| (16) | Incorporated by reference to the Company’s Current Report on Form 8-K filed on March 3, 2009. |
100
Table of Contents
| (17) | Incorporated by reference to the Company’s Quarterly Report on Form 10-Q for the period ended June 30, 2009, filed on August 3, 2009. |
| (18) | Incorporated by reference to the Company’s Current Report on Form 8-K filed on November 3, 2009. |
| (19) | Incorporated by reference to the Company’s Current Report on Form 8-K filed on March 4, 2010. |
| * | Filed herewith. |
101
Table of Contents
Pursuant to the requirements of Section 13 or 15(d) of the Securities Exchange Act of 1934, the Registrant has duly caused this report to be signed on its behalf by the undersigned, thereunto duly authorized on March 5, 2010.
| MONOTYPE IMAGING HOLDINGS INC. | ||
| By: | /s/ DOUGLAS J. SHAW | |
| Douglas J. Shaw | ||
| President and Chief Executive Officer and Director | ||
SIGNATURES AND POWER OF ATTORNEY
KNOWN ALL MEN BY THESE PRESENTS that each individual whose signature appears below constitutes and appoints each of Douglas J. Shaw and Scott E. Landers such person’s true and lawful attorney-in-fact and agent with full power of substitution and resubstitution, for such person and in such person’s name, place and stead, in any and all capacities, to sign any and all amendments to this Annual Report on Form 10-K, and to file the same, with all exhibits thereto, and all documents in connection therewith, with the Securities and Exchange Commission, granting unto each said attorney-in-fact and agent full power and authority to do and perform each and every act and thing requisite and necessary to be done in and about the premises, as fully to all intents and purposes as such person might or could do in person, hereby ratifying and confirming all that any said attorney-in-fact and agent, or any substitute or substitutes of any of them, may lawfully do or cause to be done by virtue hereof.
Pursuant to the requirements of the Securities Exchange Act of 1934, this report has been signed by the following persons on behalf of the registrant and in the capacities and on the dates indicated:
| Signature |
Title |
Date | ||
| /s/ DOUGLAS J. SHAW Douglas J. Shaw |
President, Chief Executive Officer and Director (Duly Authorized Officer and Principal Executive Officer) |
March 5, 2010 | ||
| /s/ SCOTT E. LANDERS Scott E. Landers |
Senior Vice President, Chief Financial Officer, Treasurer and Assistant Secretary (Principal Accounting Officer) | March 5, 2010 | ||
| /s/ ROBERT M. GIVENS Robert M. Givens |
Chairman of the Board of Directors | March 5, 2010 | ||
| /s/ A. BRUCE JOHNSTON A. Bruce Johnston |
Director | March 5, 2010 | ||
| /s/ ROGER J. HEINEN, JR. Roger J. Heinen, Jr. |
Director | March 5, 2010 | ||
| /s/ PAMELA F. LENEHAN Pamela F. Lenehan |
Director | March 5, 2010 | ||
| /s/ PETER J. SIMONE Peter J. Simone |
Director | March 5, 2010 | ||
| /s/ ROBERT L. LENTZ Robert L. Lentz |
Director | March 5, 2010 | ||
102
Table of Contents
MONOTYPE IMAGING HOLDINGS INC.
SCHEDULE II—VALUATION AND QUALIFYING ACCOUNTS
| Description |
Balance at Beginning of Period |
Charged (benefit) to Costs and Expenses |
Deductions | Balance at End of Period | ||||||||||
| Year ended December 31, 2009 |
$ | 236 | $ | (106 | ) | $ | (48 | ) | $ | 82 | ||||
| Year ended December 31, 2008 |
177 | 126 | (67 | ) | 236 | |||||||||
| Year ended December 31, 2007 |
— | 240 | (63 | ) | 177 | |||||||||
103