Attached files
UNITED STATES SECURITIES AND EXCHANGE COMMISSION
Washington, D.C. 20549
FORM 10-K
(Mark One)
| x | ANNUAL REPORT PURSUANT TO SECTION 13 OR 15(d) OF THE SECURITIES EXCHANGE ACT OF 1934 |
| For the fiscal year ended December 31, 2009, or |
| ¨ | TRANSITION REPORT PURSUANT TO SECTION 13 OR 15(d) OF THE SECURITIES EXCHANGE ACT OF 1934 |
| For the transition period from to |
Commission File No.: 001-16753

AMN HEALTHCARE SERVICES, INC.
(Exact Name of Registrant as Specified in Its Charter)
| Delaware | 06-1500476 | |
| (State or Other Jurisdiction of Incorporation or Organization) |
(I.R.S. Employer Identification No.) | |
| 12400 High Bluff Drive, Suite 100 San Diego, California |
92130 | |
| (Address of principal executive offices) | (Zip Code) | |
Registrant’s Telephone Number, Including Area Code: (866) 871-8519
Securities registered pursuant to Section 12(b) of the Act:
| Title of Each Class |
Name of each exchange on which registered | |
| Common Stock, $0.01 par value | New York Stock Exchange |
Securities registered pursuant to Section 12(g) of the Act:
None.
Indicate by check mark if the registrant is a well-known seasoned issuer, as defined in Rule 405 of the Securities Act. Yes ¨ No þ
Indicate by check mark if the registrant is not required to file reports pursuant to Section 13 or Section 15(d) of the Exchange Act. Yes ¨ No þ
Indicate by check mark whether the registrant: (1) has filed all reports required to be filed by Section 13 or 15(d) of the Securities Exchange Act of 1934 during the preceding 12 months (or for such shorter period that the registrant was required to file such reports), and (2) has been subject to such filing requirements for the past 90 days. Yes þ No ¨
Indicate by check mark if disclosure of delinquent filers pursuant to Item 405 of Regulation S-K (§ 229.405 of this chapter) is not contained herein, and will not be contained, to the best of registrant’s knowledge, in definitive proxy or information statements incorporated by reference in Part III of this Form 10-K or any amendment to this Form 10-K. þ
Indicate by check mark whether the registrant has submitted electronically and posted on its corporate Web site, if any, every Interactive Data File required to be submitted and posted pursuant to Rule 405 of Regulation S-T during the preceding 12 months (or for such shorter period that the registrant was required to submit and post such files). Yes ¨ No ¨
Indicate by check mark whether the registrant is a large accelerated filer, an accelerated filer, a non-accelerated filer, or a smaller reporting company. See the definitions of “large accelerated filer”, “accelerated filer” and “smaller reporting company” in Rule 12b-2 of the Exchange Act. (Check one):
| Large accelerated filer ¨ |
Accelerated filer þ | Non-accelerated filer ¨ | Smaller reporting company ¨ |
Indicate by check mark whether the registrant is a shell company (as defined in Rule 12b-2 of the Exchange Act). Yes ¨ No þ
The aggregate market value of the voting and non-voting common equity held by non-affiliates computed by reference to the price at which the common equity was last sold, or the average bid and asked price of such common equity, as of June 30, 2009 was $207,739,914 based on a closing sale price of $6.38 per share.
As of March 3, 2010, there were 32,631,136 shares of common stock, $0.01 par value, outstanding.
Documents Incorporated By Reference: Portions of the registrant’s definitive Proxy Statement for the annual meeting of shareholders to be held on April 14, 2010 have been incorporated by reference into Part II and Part III of this Form 10-K.
TABLE OF CONTENTS
References in this Annual Report on Form 10-K to “AMN Healthcare,” the “Company,” “we,” “us” and “our” refer to AMN Healthcare Services, Inc. and its wholly owned subsidiaries.
PART I
| Item 1. | Business |
Our Company
AMN Healthcare Services, Inc. is the nation’s leading provider of comprehensive healthcare staffing and management services. As a leading provider of travel nurse and allied staffing services, locum tenens (temporary physician staffing) and physician permanent placement services, we recruit and place healthcare professionals on assignments of variable lengths and in permanent positions with clients throughout the United States, who range from acute-care hospitals and physician practice groups to other healthcare settings, including rehabilitation centers, dialysis clinics, pharmacies, home health service providers and ambulatory surgery centers. We also offer a managed services program in which we provide flexible, customized solutions for our clients to manage their multiple clinical vendors, and recruitment process outsourcing services, where we conduct our clients’ recruitment for permanent clinical positions.
Physicians, nurses and allied healthcare professionals choose temporary assignments for a wide variety of reasons that include seeking flexible work opportunities, exploring different areas of the country and diverse practice settings, building clinical skills and experience by working at prestigious healthcare facilities, avoiding the demands and political environment of working as permanent staff, working through life and career transitions, and as a means of access into a permanent staff position.
Our hospital and healthcare facility clients utilize our temporary healthcare staffing services to cost-effectively manage both short and long-term shortages in their staff due to a variety of circumstances, including a lack of qualified, specialized local healthcare professionals, attrition, leave schedules, new unit openings, and to identify candidates for permanent positions. In addition to providing continuity of care and quality patient care, we believe our hospitals, healthcare facilities and other clients contract with us because of our access to a large national network of quality temporary and permanent healthcare professionals, our ability to meet their specific staffing needs, our flexible staffing assignment lengths, our excellent reputation and our reliable and superior customer service.
The overlap of clients seeking physicians for both temporary and permanent placement assignments provide us an opportunity to cross-sell our physician permanent placement services. Physicians are significant drivers of revenue, influencing many hospitals, healthcare facilities and physician practice groups to devote the resources necessary to recruit them. While this demand creates significant competition for a limited supply of physicians, our national reach and brand awareness position us well in this environment.
Our staffing services are marketed primarily to two distinct customer groups: (1) healthcare professionals and (2) hospitals, physician practice groups and other healthcare settings. We use distinct brands to market our differentiated services throughout the healthcare staffing spectrum.
We use a multi-brand recruiting strategy to enhance our ability to successfully attract healthcare professionals in the United States and internationally. We market our staffing opportunities to healthcare professionals under recruitment brands that include American Mobile® Healthcare, Medical ExpressSM , NurseChoice®, NursesRx®, Med Travelers®, Platinum Select StaffingSM, Rx Pro Health®, O’Grady Peyton International® , Staff Care® and Merritt Hawkins & Associates®. Each brand has a distinct clinician focus, market strengths and brand reputation. We provide our temporary healthcare professionals with an attractive benefit package that may include free or subsidized housing, meals and incidentals, free or reimbursed travel, competitive wages, professional development opportunities, professional liability insurance, and, for employed
1
professionals, a 401(k) plan and health insurance. We believe that we attract temporary healthcare professionals due to our long-standing reputation for providing a high level of service, our numerous job opportunities, our benefit packages, our innovative marketing programs and word-of-mouth referrals from our thousands of current and former healthcare professionals.
Our clients include acute-care and sub-acute healthcare facilities, physician groups, dialysis centers, clinics, radiology imaging facilities, ambulatory surgery centers, retail and mail-order pharmacies, home health agencies and long-term care facilities. We market our nurse and allied staffing services to hospitals and healthcare facilities generally under one brand, AMN Healthcare®, as a single staffing and management services provider with access to healthcare professionals from multiple recruitment brands. We market our locum tenens and physician permanent placement services under the brand names Staff Care and Merritt Hawkins, respectively. Additionally, we market our pharmacy staffing services to retail customers under the company name Rx Pro Health.
Our large number of hospital, healthcare facility and other clients provides us with the opportunity to offer clinical positions typically in all 50 states and in a variety of work environments and clinical settings.
Competition
The healthcare staffing, recruitment and management services industry is highly competitive. We compete in national, regional and local markets for both healthcare professionals and hospital and healthcare facility clients. We compete with staffing and workforce management companies for hospital and healthcare facility clients primarily on the basis of the depth and quality of our healthcare professionals, the timely availability of our professionals with requisite skills, the quality, breadth, price and geographic reach of our services, our customer service and our recruitment expertise. When recruiting for healthcare professionals, in addition to other recruitment and staffing firms, we also compete with hospital systems that have developed their own recruitment departments and interim staffing pools. We compete for healthcare professionals primarily on the basis of customer service knowledge and expertise, the quantity, diversity and quality of available assignments and placement opportunities, compensation packages and, for our temporary nurses and allied healthcare professionals, the benefits that we provide to them while they are on assignment.
We believe that larger, national firms that offer a broad spectrum of services such as us enjoy distinct advantages over smaller, local and regional competitors in the management services, healthcare staffing and recruitment industry. We generally have access to a larger pool of available candidates, substantial word-of-mouth referral networks and more recognizable brand names, enabling us to attract a consistent flow of new applicants. The breadth of our services also allow us to take a more strategic, comprehensive and integrated approach to our clients providing even greater value. Larger firms also generally have a deeper, more comprehensive infrastructure with a more established operating model and processes that provide the long-term stability and foundation for quality standards recognition, such as the Joint Commission staffing agency certification. We also believe a solid financial structure provides an advantage as the provision of payroll and housing services are working capital intensive. This advantage may be amplified during periods of tight credit markets and general depressed economic conditions.
Some of our competitors in the management services, travel nurse, allied and locum tenens staffing sectors include Cross Country Healthcare, CHG Healthcare Services, Medfinders, On Assignment and LocumTenens.com.
Demand and Supply Drivers
Demand Drivers
| • | Demographics and Advances in Medicine and Technology. As the U.S. population ages and medical technology advances result in longer life expectancy, chronic illnesses and hospital census will increase. |
2
| We believe that these factors will increase the demand for both temporary and permanent healthcare professionals. In addition, enhanced healthcare technology has increased the demand for specialty clinicians who are qualified to operate advanced medical equipment and perform complex medical procedures. |
| • | Increased Hospital Revenue Opportunity. Hospital and healthcare facilities’ primary revenue source is generated by physicians. By using permanent physician search and locum tenens staffing services to fill both permanent and temporary vacancies more quickly, hospitals and healthcare facilities are able to benefit by sustained or increased patient flow and procedures resulting in additional revenue. With more physicians admitting and treating patients, healthcare facilities will have a need for more nurses and allied healthcare professionals to support the increased patient census. |
| • | Shift to Flexible Staffing Models. Nurse wages comprise the largest percentage of hospitals’ labor expenses. A focus on cost-effective healthcare service delivery continues to lead more hospitals and other healthcare facilities to adopt adjustable staffing models that may include utilization of flexible staffing resources such as temporary healthcare professionals, although during 2009, we saw many facilities rely on the willingness of permanent part-time and full-time staff to work additional hours. |
| • | Physician and Nursing Shortage. Many regions of the United States are experiencing a pronounced shortage of physicians and registered nurses. While the extent of the physician shortage is debated, the Bureau of Labor Statistics’ last estimates projected that the incremental job openings for physicians and surgeons from 2008 to 2018 will be 144,100, an increase of 22.0% over ten years. The demand for our nursing staffing services is correlated with activity in the permanent labor market at hospitals. In particular, when nurse vacancy rates increase, order levels typically increase as well. In September 2004, the U.S. Department of Health and Human Services reported that the registered nurse workforce is expected to be 36% below projected requirements by 2020. An overall growing need for healthcare professionals is subject to cyclical fluctuations as general economic conditions can impact unemployment rates and patient demand for healthcare services. Moreover, during periods of higher unemployment rates, we believe more healthcare professionals remain in their current employment, which causes a reduction in facility’s employee attrition. This lower attrition results in decreased demand for temporary or new permanent healthcare professionals and, to a lesser extent, affects the supply of candidates available for travel assignments. Toward the end of 2008, and in the first half of 2009, demand decreased considerably in the nurse and allied healthcare staffing segment, we believe due to widespread and unprecedented economic conditions. Nevertheless, factors that we believe are contributing to the current and long-term supply shortage of healthcare professionals include: |
| — | Aging of Physician and Nurse Population. Approximately 47% of all licensed physicians in the United States are 50 years and older. Studies estimate that 14% of physicians between the age of 56 and 60 as well as 27% of physicians between age of 61 and 65 indicate they plan to retire within three years. The average age of a registered nurse was estimated to be 47 years old in 2004, an increase of 10.6% since 1996. |
| — | Shortage of Medical and Nursing Schools. As a result of a shortage of qualified faculty and the limited availability of medical and nursing schools to prospective healthcare professionals, many believe that the numbers of medical and nursing school graduates are well below the number of new healthcare professionals needed to address the projected shortage. |
| — | Healthcare Professionals Leaving Patient Care Environments for Better Career Opportunities. Approximately 29% of nurses plan to take steps in the next one to three years that would take them out of nursing altogether (by retiring or seeking non-nursing jobs) or reduce the volume of clinical work they do (by switching to part-time or less demanding roles). Healthcare professionals’ career opportunities have expanded beyond the traditional bedside role. |
3
| Pharmaceutical companies, insurance companies, HMOs and hospital management, service and supply companies offer healthcare professionals attractive positions which involve work that may be perceived as more rewarding, and with increased compensation, less demanding work schedules and more varied career progression and opportunity. |
| — | Physicians Leaving Practices Due to Burdens of Malpractice Insurance and Medical Insurance Reimbursement. Physicians are concerned over reimbursement levels from insurance companies and government agencies and frustrated with claim billing restrictions and paperwork. The cost of malpractice insurance is also a consideration for physicians. |
| • | Patient Demand. Patients have increasing access to healthcare information through various channels including the internet and advertising. With this information, many patients in recent years have shown they are taking a more active role in their own healthcare management, including requesting diagnostic tests and elective and non-elective procedures. This increased patient demand for healthcare services is generally expected to drive an increased need for healthcare professionals; however, if poor economic conditions continue, such an increase may be offset in the short or medium term by a reduction in elective procedures related to high unemployment and higher rates of the uninsured and underinsured. |
| • | Medical Insurance Reimbursement. Reimbursement levels and coverage by government agencies and insurance companies can drive fluctuations in demand for the particular specialties or procedures that are impacted. |
Supply Drivers
| • | Traditional Reasons for a Healthcare Professional to Work on a Temporary Assignment. Temporary staffing allows healthcare professionals to explore new areas of the United States, work at prestigious hospitals, learn new skills, manage work/life balance, build their resumes, try out different clinical settings, reduce administrative burdens, allow for a transitional period between permanent jobs and avoid unwanted workplace politics that may accompany a permanent position. Other benefits available to temporary healthcare professionals include free or subsidized housing, competitive wages, professional liability insurance coverage, professional development opportunities, meals and incidentals, free or reimbursed travel, health insurance, and completion bonuses for some assignments. All of these opportunities have been constant supply drivers which continue to attract new healthcare professionals into our industry. |
| • | Word-of-Mouth Referrals. New applicants are often referred to staffing companies by other healthcare professionals who have taken temporary assignments with or been placed in a permanent position by those staffing companies. Growth in the number of healthcare professionals who have worked on temporary assignments or have been placed in permanent positions by a staffing agency, as well as growth in the number of hospital and healthcare facilities that have utilized temporary healthcare professionals, creates more opportunities for referrals. |
| • | More Physicians Choosing Temporary Staffing Due to Increased Malpractice and Reimbursement Concerns. Locum tenens positions provide physicians the opportunity to practice medicine without undue concern for malpractice costs or insurance reimbursement. |
| • | Nurses Choose Travel Staffing Due to the Nursing Shortage. In times of nursing shortages, permanent staff nurses are often required to assume greater responsibility and patient loads, work overtime and deal with increased pressures within the hospital. Many experienced nurses choose to leave their permanent employer and look for a more flexible and rewarding position. This may be offset in times of economic difficulties when general unemployment levels may reduce hospital attrition rates due to nurses or their spouses’ employment concerns. |
4
| • | Legislation Allowing Nurses to Be Mobile. The Mutual Recognition Compact Legislation, promoted by the National Council of State Boards of Nursing, allows nurses to work more freely within states participating in the Compact Legislation without obtaining new state licenses. The recognition legislation began in 1999 and has been implemented in 23 states. |
Growth Strategy
Our goal is to expand our leadership position within the healthcare management services, staffing and recruitment sector in the United States. The key components of our business strategy include:
| • | Strengthening and Expanding Our Relationships with Hospitals and Healthcare Facilities. We continue to strengthen and expand our relationships with our current hospital and healthcare facility clients and continue to develop new relationships. Hospitals and healthcare facilities are seeking a strong business partner who can fulfill the quantity, breadth and quality of their temporary and permanent staffing needs and help them develop strategies for the most cost-effective staffing models. In addition, over the last few years, hospitals and healthcare facilities have shown an interest in working with fewer vendors in order to increase efficiency. We believe that our larger size, reputation for quality and proven ability to fill our clients’ staffing needs provide us with the opportunity to serve our client facilities implementing this vendor consolidation strategy. Because we possess the largest national network of available physician, nurse and allied healthcare professionals, we are well positioned to offer our hospital and healthcare facility clients a wide spectrum of effective management and staffing solutions to meet their staffing needs. |
| • | Expanding Our Network of Qualified Healthcare Professionals. Through our recruiting efforts, we continue to expand our network of qualified healthcare professionals and our breadth of specialties, including dental practitioners, medical and lab technicians, nurse practitioners and intermittent care-experienced healthcare professionals. We continue to build our supply of healthcare professionals through referrals from healthcare professionals who are currently working or have been placed by us in the past, as well as through advertising and internet sources. We have also conducted several research initiatives enabling us to segment the population of healthcare professionals and develop targeted advertising campaigns directed at these different segments. |
| • | Leveraging Our Business Model and Large Hospital and Healthcare Facility Client Base. We seek to increase our effectiveness through our proven multi-brand recruiting strategy, large network of healthcare professionals, established hospital and healthcare facility client relationships, proprietary information systems, innovative marketing and recruitment programs, training programs and centralized administrative support systems. Our multi-brand recruiting strategy for temporary nurses and allied healthcare professionals generally allows a recruiter in any of our nurse or allied staffing brands to take advantage of all of our nationwide placement opportunities. In addition, our information systems and operational support and customer service personnel permit our recruiters to spend more time focused on the placement of our healthcare professionals. In early 2009, we made the decision to streamline our travel nursing operations by condensing our eight travel nurse brands down to five, a strategic decision to leverage the brand awareness and brand equity of our stronger brands. Going forward, our brand portfolio will be supported by a more streamlined operating structure with the opportunity for greater, more distinct differentiation for each of the healthcare professional-facing brands, and greater leveraging of brand equity and awareness across our facility client-facing brands. |
| • | Expanding and Enhancing our Service Offerings. In order to further enhance the growth in our business and improve our competitive position in the healthcare management services, staffing and recruitment sector, we continue to introduce new service offerings and enhance our existing service offerings. As our hospital and healthcare facility clients’ needs change, we constantly explore what additional services we can provide to better serve those needs, including offering managed staffing |
5
| services, home health staffing, and recruitment process outsourcing. We continue to pursue opportunities in new facility client settings such as specialty hospitals, ambulatory surgery centers, retail health clinics, retail pharmacies and long-term care facilities. In addition, we continue to consider possible areas of expansion based on our key criteria: deliver long-term value to our shareholders; align with our core expertise of recruitment, credentialing, and access to clinical labor; strengthen and broaden our client relationships; offer opportunities to reduce exposure to economic cycles and enhance our long-term sustainable, differentiated business model. |
| • | Providing Innovative Technology. We continue to be an innovation leader in healthcare staffing by providing on-line services and tools to both our hospital and healthcare facility clients and our healthcare professionals. Our Staffing Service Center provides online resources for hospital and healthcare facility clients to streamline their communications and process flow to secure and manage staffing services. Another on-line resource, The Service Connection, provides our healthcare professionals the ability to track assignment information and complete key forms electronically. Both sites offer secure access and self-service features twenty-four hours a day, seven days a week. |
| • | Building the Strongest Management Team to Optimize Our Business Model. We continue to focus on training and professional development for all levels of management and sales staff and continue to hire skilled and experienced team members to deliver superior service to our hospital and healthcare facility clients. |
| • | Capitalizing on Strategic Acquisition Opportunities. In order to enhance our competitive position, we will continue to selectively explore strategic acquisitions, subject to credit availability or access to the capital markets. In the period following acquisitions, we have sought to leverage our client relationships and orders across our divisions, integrate back-office functions and, where appropriate, maintain brand differentiation in the recruitment of healthcare professionals. |
Business Overview
Services Provided
Nurse and Allied Healthcare Staffing Segment
Hospitals and healthcare facilities generally obtain supplemental staffing for nurses and allied healthcare professionals from two external sources, local temporary (per diem) agencies and regional and national travel healthcare staffing companies. Per diem staffing involves the placement of locally based healthcare professionals on daily shift work on an as needed basis. Hospitals and healthcare facilities often give only a few hours notice of their per diem assignments, which require a quick turnaround from their staffing agencies of generally less than 24 hours. Travel staffing, on the other hand, has historically provided hospital and healthcare facilities with staffing solutions to address anticipated or longer-term staffing requirements, typically for assignments of 13 weeks. In contrast to per diem agencies, travel staffing companies select from a national (and in some cases international) skilled labor pool and provide pre-screened candidates to their hospital and healthcare facility clients, often at a lower cost than per diem staffing. We have focused on the travel segment of the temporary healthcare staffing industry for our nurse and allied healthcare professionals. In the past few years we have expanded our service offerings to offer a broader range of assignment lengths, from four weeks to 24 months, and to offer home healthcare staffing, managed staffing services and recruitment process outsourcing services, where we conduct our clients’ recruitment for their permanent staffing needs. The nurse and allied healthcare staffing segment’s revenue and operating income are provided in “Item 8. Financial Statements and Supplementary Data—Notes to Consolidated Financial Statements—Note 1(t)”.
Nurses. We provide medical nurses, surgical nurses, specialty nurses, licensed practical or vocational nurses, advanced practice nurses, surgical technologists and dialysis technicians in a wide range of specialties for travel assignments throughout the United States. The majority of our assignments are in acute-care hospitals, including
6
teaching institutions, trauma centers and community hospitals. Nurses comprised approximately 84% of total nurse and allied temporary healthcare professionals working for us in 2009. We place our qualified nurse professionals with premier, nationally recognized hospitals and hospital systems. While the majority of nurses that we place on assignment have been educated and trained in the United States, we recruit English-speaking internationally trained nurses from foreign countries through our O’Grady Peyton International brand for 12-24 month assignments. In addition, we offer a shorter-term staffing solution of four to eight weeks under our NurseChoice brand to address hospitals’ urgent need for registered nurses. NurseChoice is targeted to recruit and staff nurses who can begin assignments within one to two weeks in acute-care facilities in contrast to the three to five week lead time that may be required for travel nurses.
Allied Health Professionals. We provide allied health professionals under our Med Travelers, Platinum Select Staffing and Rx Pro Health brands to acute-care hospitals and other healthcare facilities such as skilled nursing facilities, rehabilitation clinics, and retail and mail-order pharmacies. Allied health professionals include such disciplines as physical therapists, respiratory therapists, occupational therapists, medical and radiology technologists, speech pathologists, rehabilitation assistants, pharmacists and pharmacy technicians. Allied health professionals comprised approximately 16% of the total nurse and allied health temporary healthcare professionals working for us in 2009.
Locum Tenens Staffing Segment
Under our Staff Care brand, we place physicians of all specialties, certified registered nurse anesthetists (“CRNA”), nurse practitioners and dentists on a temporary basis (“locum tenens”) as independent contractors with all types of healthcare organizations throughout the United States, including hospitals, medical groups, occupational medical clinics, individual practitioners, networks, psychiatric facilities, government institutions, and managed care entities. These professionals are recruited nationwide and typically placed on multi-week contracts with assignment length ranging from a few days up to one year. The locum tenens staffing segment’s revenue and operating income are provided in “Item 8. Financial Statements and Supplementary Data—Notes to Consolidated Financial Statements—Note 1(t)”.
Physician Permanent Placement Services Segment
We provide permanent physician placement services under our Merritt Hawkins brand to hospitals, healthcare facilities and physician practice groups throughout the United States. Using a distinct consultative approach that we believe is more client-oriented, we are paid for our services through a blend of retained search fees and variable fees tied to work performed and successful placement. Our broad specialty offerings include over 70 specialist and sub-specialist opportunities such as internal medicine, family practice and surgery. The physician permanent placement services segment’s revenue and operating income are provided in “Item 8. Financial Statements and Supplementary Data—Notes to Consolidated Financial Statements—Note 1(t)”.
National Presence and Diversified Hospital and Healthcare Facility Client Base
We offer healthcare professionals placement opportunities and provide staffing solutions to our hospital and healthcare facility clients throughout the United States. We typically generate revenue in all 50 states. During 2009, the largest percentages of our revenue were concentrated in California, Texas, Florida, New York, Pennsylvania, and Washington.
The majority of our temporary healthcare professional assignments are at acute-care hospitals. In addition to acute-care hospitals, we provide services to sub-acute healthcare facilities, physician groups, rehabilitation centers, dialysis clinics, pharmacies, home health service providers and ambulatory surgery centers. Our clients include hospitals and healthcare systems such as Georgetown University Hospital, HCA, NYU Medical Center, Stanford Hospital and Clinics, UCLA Medical Center, The University of Chicago Hospitals and Mayo Health System. No single client healthcare system comprised more than 10% of revenue and no single client facility comprised more than 3% of revenue for the year ended December 31, 2009.
7
Our Business Model
We have developed and continually refine our business model to achieve greater levels of productivity and efficiency. Our model is designed to optimize the communication with, and service to, both our healthcare professionals and our hospital and healthcare facility clients.
Marketing and Recruitment of New Healthcare Professionals
We believe that physician, nursing and allied health professionals are attracted to us because of our customer service and relationship-oriented approach, our competitive compensation and benefits package, and our large and diverse offering of work assignments that provide the opportunity to work at numerous attractive locations throughout the United States. We believe that our multi-brand recruiting strategy makes us more effective at reaching a larger number of healthcare professionals, while still leveraging operational efficiencies.
In our effort to attract and retain highly qualified temporary healthcare professionals, we offer a variety of benefits to our employed professionals. These benefits may include: free or subsidized housing, meals and incidentals, free or reimbursed travel, competitive wages, professional development opportunities, professional liability insurance and, for employed professionals, a 401(k) plan and health insurance.
Screening, Licensing and Quality Management
Through our quality service departments, we screen all temporary nursing, allied and locum tenens candidates prior to placement. We continue to evaluate our temporary healthcare professionals after they are placed to ensure adequate performance and manage risk, as well as to determine feasibility for future placements. Our internal processes are designed to ensure that our temporary healthcare professionals have the appropriate experience, credentials and skills for the assignments they accept. Additionally, these processes enable us to assist with licensing and privileging for our physicians placed on temporary assignments. Our experience has shown us that well-matched placements result in more satisfied healthcare professionals and healthcare facility clients.
Placement
For our nurse and allied staffing services, orders are generally entered into our information network by our account managers and are available to the recruiters at all of our recruitment brands. The account managers develop a relationship with the healthcare facility, arrange telephone interviews between the temporary healthcare professional and the facility, and confirm offers and placements with the healthcare facility. At the same time, our recruiters seek to develop and maintain strong and lasting relationships with our healthcare professionals.
In the case of our international temporary healthcare professionals, the recruiters and placement coordinators at our O’Grady Peyton International brand, including those located in the United Kingdom, assist candidates in preparing for the United States nursing examination, obtaining a U.S. nursing license, and petitioning to become lawful permanent residents prior to their arrival in the United States. In some cases, we place candidates in positions in other international locations such as Australia and the Middle East, some of whom may later take positions with us in the United States.
For the locum tenens staffing and physician permanent placement services segments, orders for temporary physicians or permanent placement requests are generated by our national marketing team. Our national presence and infrastructure enable us to provide physicians with a variety of attractive client locations, perquisites and opportunities for career development. Our recruiters and account representatives work together using proprietary information systems to fill orders and schedule physicians on temporary assignments. Our permanent placement recruiters work closely with our clients and marketing team to recruit and fill permanent placement requests. We also have the ability to cross-sell our permanent placement and temporary placement services to our clients.
8
Client Billing
During 2009, we billed substantially all of the temporary nurse, allied and physician healthcare professionals on assignment based on hours and days worked contracts. Under hours and days worked contracts, the temporary healthcare professional is either our employee for payroll and benefits purposes or an independent contractor typically paid directly by us on behalf of the hospital and healthcare facility clients. Under this arrangement, we bill our hospital and healthcare facility clients at an hourly or daily rate that effectively includes reimbursement for recruitment fees, compensation and for the temporary healthcare professionals who are our employees, any benefits and any applicable employer taxes. Housing, travel expenses, and meals and incidentals, if applicable, are either included in the hourly/daily rate or billed separately. Overtime, shift differential and holiday hours worked are typically billed at a premium rate. In turn, we pay the temporary healthcare professional’s wages or contracted fees, housing, travel costs, and meals and incidentals costs if applicable, and any benefits. Providing payroll services is a value-added and convenient service that hospitals and healthcare facilities generally expect from their supplemental staffing sources.
For our physician permanent placement services, we typically bill clients for a search initiation fee, hours worked and expenses on the search engagement and a non-refundable placement fee once the placement occurs.
Information Systems
Our management information and communications systems, including our financial reporting systems, are primarily centralized and controlled in our corporate headquarters in San Diego, CA, with additional systems for our physician businesses centralized and controlled at our offices in Irving, TX. We have developed and currently operate proprietary information systems that include integrated processes for healthcare professional and healthcare facility contract management, matching of healthcare professionals with client assignments, healthcare professional file submissions for placements, quality management tracking, managing compensation packages and managing healthcare facility contract and billing terms. These systems provide our staff with fast, detailed information regarding individual healthcare professionals and hospital and other clients and are scalable to support future business growth. In addition, we maintain a backup data center to provide continued system operations in case of a major disaster or system outage.
Risk Management
We have developed an integrated risk management program that focuses on loss analysis, education and assessment in an effort to reduce our operational costs and risk exposure. We regularly analyze our losses on professional liability claims and workers compensation claims to identify trends. This allows us to focus our resources on those areas that may have the greatest impact on us and adjust our sales and operational approach to these areas. We have also developed educational materials for distribution to our temporary healthcare professionals that are targeted to address specific work-injury risks and documentation of clinical events.
In addition to our proactive measures, we engage in a review process for incidents involving our healthcare professionals. Upon notification of a healthcare professional’s involvement in an incident that may result in liability for us, the healthcare professional’s actions are reviewed and a prompt determination is made regarding whether the healthcare professional will continue the assignment and whether we will place him/her on future assignments. We also rely on our hospital and healthcare facility clients’ and the state professional associations’ investigation of incidents involving our healthcare professionals in determining continued and future assignments.
Regulation
The healthcare industry is subject to extensive and complex federal and state laws and regulations related to professional licensure, conduct of operations, payment for services and payment for referrals. Because we provide services on a contract basis and are paid directly by our hospital, healthcare facility and physician
9
practice group clients, Medicare, Medicaid and managed care reimbursement policies do not affect us directly. Nevertheless, reimbursement changes in government programs, particularly Medicare and Medicaid, can and do indirectly impact our business. As discussed in “Item 1A. Risk Factors”, we continue to monitor healthcare reform legislation and regulatory changes for potential impact on our business.
Some states require state licensure for businesses that employ, assign and/or place healthcare personnel to provide healthcare services at hospitals and other healthcare facilities. We are currently licensed in states that require such licenses and take measures to ensure compliance with all material state licensure requirements. Our travel nurse brands of American Mobile Healthcare, Medical Express, NursesRx, NurseChoice, and O’Grady-Peyton International and our allied healthcare staffing brands, Med Travelers and Platinum Select Staffing, have all received Joint Commission certification based on a review of our compliance with national standards. We were the first healthcare staffing firm in the country to receive the prestigious Joint Commission Certification as a corporate system with multiple staffing sites.
Most of the temporary healthcare professionals that we employ or independently contract with are required to be individually licensed or certified under applicable state laws. We take appropriate steps to validate that our healthcare professionals possess all necessary licenses and certifications.
We recruit nurses from Canada for placement in the United States. Canadian nurses can come to the United States on TN Visas under the North American Free Trade Agreement. TN Visas are three-year temporary work visas, which generally allow entrance into the United States provided the nurse presents at the border proof of waiting employment in the United States, evidence of the necessary healthcare practice licenses and a visa credentials assessment from the Commission on Graduates of Foreign Nursing Schools.
With respect to our recruitment of international temporary healthcare professionals through our O’Grady Peyton International brand, we must comply with certain United States immigration law requirements, including the Illegal Immigration Reform and Immigrant Responsibility Act of 1996. We primarily bring healthcare professionals to the United States on permanent immigrant visas, commonly referred to as “green cards”. Since late 2006, however, there have been virtually no permanent immigrant visas available for nurses overseas as a result of visa quotas.
Employees
As of December 31, 2009, we had approximately 1,130 corporate employees. During the fourth quarter of 2009, we had an average of about 2,400 nurse and allied healthcare professionals working on assignment, and days filled by our physician and CRNA independent contractors totaled 43,276. Days filled is calculated by dividing the physician independent contractor hours filled during the period by eight hours.
Additional Information
We were incorporated in the state of Delaware on November 10, 1997. We maintain a corporate website at www.amnhealthcare.com/investors. Our Annual Reports on Form 10-K, Quarterly Reports on Form 10-Q, Current Reports on Form 8-K and amendments to these reports, as well as other material information provided to investors, are made available, free of charge, through this website as soon as reasonably practicable after being filed with or furnished to the Securities and Exchange Commission. The information found on our website is not part of this or any other report we file with or furnish to the Securities and Exchange Commission.
| Item 1A. | Risk Factors |
The following risk factors should be read carefully in connection with evaluating us and the forward-looking statements contained in this Annual Report on Form 10-K. Any of the following risks could materially adversely affect our Company, operating results, financial condition, stock price, and the actual outcome of matters as to which forward-looking statements are made in this Annual Report on Form 10-K. Certain statements in “Risk
10
Factors” constitute “forward-looking statements.” Our actual results could differ materially from those projected in the forward-looking statements as a result of certain factors and uncertainties set forth below and elsewhere in this Annual Report on Form 10-K. See “Item 7. Management’s Discussion and Analysis of Financial Condition and Results of Operations—Special Note Regarding Forward-Looking Statements.”
A significant economic downturn could result in less demand from clients or otherwise negatively affect our clients, either of which could negatively impact our financial condition and results of operations.
Demand for staffing services is sensitive to changes in the level of economic activity. As economic activity slows down, hospitals and other healthcare entities tend to experience decreased attrition and reduce their use of temporary employees before undertaking layoffs of their regular employees and may increasingly rely on internal staff retention and recruitment efforts, resulting in decreased demand for our healthcare professionals. In times of economic downturn, permanent healthcare facility staff may be more inclined to work overtime, resulting in fewer available vacancies and less demand for our services. Fewer placement opportunities for our temporary healthcare professionals impairs our ability to recruit and place both temporary and permanent placement healthcare professionals and our revenues and profitability may decline as a result of this constricted demand and supply. Many healthcare facilities will utilize temporary healthcare professionals to accommodate an increase in hospital admissions. Alternatively, if hospital admissions decrease, due to reduced consumer spending affecting elective surgery volume, general unemployment causing an increase in under- and uninsured patients and other factors, the demand for our temporary healthcare professionals may decline. In addition, we may experience more competitive pricing pressure during periods of patient occupancy and hospital admission downturns, negatively impacting our revenue and profitability. Additionally, an economic downturn could result in higher unemployment claims. As a result, a significant economic downturn could have a material adverse effect on our business, financial condition and results of operations.
Over the past two years, general worldwide economic conditions resulted in a situation where there was limited availability and access to credit and capital markets, slower economic activity, decreased consumer confidence, reduced corporate profits and capital spending, higher unemployment and inflation. While indications are that our business has stabilized, it is unclear how long the current recession will last. These conditions make it extremely difficult for our clients and us to accurately forecast and plan future business activities. Furthermore, during challenging economic times, our clients may face issues gaining timely access to sufficient credit, which could result in an impairment of their ability to make payments to us, timely or otherwise, for services rendered. If that were to occur, we may be required to increase our allowance for doubtful accounts and our days sales outstanding would be negatively impacted. We cannot predict the timing, strength or duration of any economic slowdown or subsequent economic recovery. If the economy or markets in which we operate deteriorate further, we may record additional charges related to restructuring costs and the impairment of goodwill and other long-lived assets, and our business, financial condition and results of operations will likely be materially and adversely affected.
If we are unable to continue to recruit and retain healthcare professionals for our healthcare staffing business at reasonable costs, it could increase our operating costs and negatively impact our business.
We rely significantly on our ability to recruit and retain healthcare professionals who possess the skills, experience and licenses necessary to meet the requirements of our hospital, healthcare facility clients and physician practice groups. We compete for healthcare staffing personnel with other temporary healthcare staffing companies and with hospitals, healthcare facilities and physician practice groups based on the quantity, diversity and quality of assignments offered, compensation packages and the benefits that we provide to our healthcare professionals. We rely on our human capital intensive, relationship-oriented approach and national infrastructure to enable us to compete in all aspects of our business, but particularly in the permanent physician staffing business. We must continually evaluate and expand our temporary and permanent healthcare professional network to serve the needs of our hospital, physician practice groups and other clients.
11
Currently, there is a shortage of qualified nurses and certain allied healthcare professionals in the United States, and high general unemployment levels may reduce the number of healthcare professionals willing to take on temporary assignments as opposed to permanent positions. We may be unable to continue to maintain or increase the number of temporary and permanent healthcare professionals that we recruit, decreasing the potential for growth of our business. Our ability to recruit and retain temporary and permanent healthcare professionals depends on several factors, including our ability to provide our healthcare professionals with assignments and placements that they view as attractive and to provide our temporary healthcare professionals with competitive wages and benefits, including health insurance and housing. We cannot assure you that we will be successful in any of these areas as the costs of attracting healthcare professionals and providing them with attractive benefit packages may be higher than we anticipate, or we may be unable to pass these costs on to our hospital and healthcare facility clients. If we are unable to charge rates to our hospital and healthcare facility clients to cover these costs, our profitability could decline. Moreover, if we are unable to recruit temporary and permanent healthcare professionals, our service execution may deteriorate and, as a result, we could lose clients.
Our operations may deteriorate if we are unable to continue to attract, develop and retain our sales and operations personnel.
Our success is dependent upon the performance of our sales and operations personnel. The number of individuals who meet our qualifications for these positions is limited, and we may experience difficulty in attracting qualified candidates. In addition, we commit substantial resources to the training, development and support of our personnel. Competition for qualified sales personnel in the line of business in which we operate is strong, and there is a risk that we may not be able to retain our sales personnel after we have expended the time and expense to recruit and train them.
Our business depends upon our ability to secure and fill new profitable orders and searches from our hospital, healthcare facility and physician practice group clients because we do not have long-term, exclusive or guaranteed contracts.
While we increasingly have preferred staffing relationships with our hospital clients, especially in our nursing business, under which we receive a lead time for any new orders for temporary nurses, we generally do not have long-term, exclusive or guaranteed order contracts for temporary healthcare staffing with our clients. Our hospital, healthcare facility and physician practice group clients are free to award contracts, place orders and new searches with our competitors. Therefore, we must maintain positive relationships with these clients to continually secure new profitable searches and orders from them and then fill those needs.
Some hospitals and healthcare facility clients choose to utilize vendor management service companies or staffing associations owned by member healthcare facilities that may act as intermediaries with staffing firms such as us. In addition, we provide services to some of our government clients through businesses such as small businesses or minority-owned contractors who have received set-aside awards. These various intermediary organizations may impact our ability to obtain new clients and maintain our existing client relationships by impeding our ability to access and contract directly with healthcare facility clients, as well as impact the profitability of these client relationships.
Consolidation and concentration in buyers of healthcare staffing services could impact our ability to mitigate credit risk.
We extend credit and payment terms to our customers. In addition to ongoing credit evaluations of our clients’ financial condition, we traditionally seek to mitigate our credit risk by managing client concentration. We have seen an increase in staffing customers’ use of intermediaries such as vendor management service companies and group purchasing organizations. We have also seen some recent consolidation of healthcare systems. To the extent that these trends exist and continue, it could lead to a greater concentration of buyers of healthcare staffing services and less diversification of our customer base which could impact our ability to mitigate credit risk.
12
The demand for our services, and therefore the profitability of our business, may be adversely affected by changes in staffing needs due to the adoption of alternative modes of healthcare delivery, staffing preferences of our healthcare facility clients and fluctuations in hospital admissions.
The settings for the delivery of patient services are continually evolving and alternative modes of healthcare delivery, such as specialty hospitals and retail clinics, are becoming more prevalent. Demand for our services is affected by the public’s adoption and demand for such new modes of healthcare delivery, by our clients’ evolving needs in light of that demand, and by our ability to adapt to fill those needs. Demand for our services is also affected by the staffing needs and preferences of our healthcare facility clients, as well as by fluctuations in patient occupancy at our client healthcare facilities due to economic factors and seasonal fluctuations that are beyond our control. Historically, hospitals in certain geographical regions experience significant seasonal fluctuations in admissions, and needed to be able to adjust their staffing levels to accommodate the change in patient census; however, seasonal fluctuations have diminished in recent years, which may reduce future demand for our services.
The ability of our hospital, healthcare facility and physician practice group clients to retain and increase the productivity of their permanent staff may affect the demand for our services.
If our hospital, healthcare facility and physician practice group clients retain and increase the productivity of their permanent staff, their need for our services may decline. Higher permanent staff retention rates and increased productivity of permanent staff members could result in increased efficiencies, thereby reducing the demand for both our temporary staffing and permanent placement services, which could negatively impact our revenue and profitability.
We are subject to federal and state healthcare industry regulation including regarding professional licensure, conduct of operations, and costs and payment for services and payment for referrals, as well as laws regarding employment practices, government contracting and immigration.
The healthcare industry is subject to extensive and complex federal and state laws and regulations related to professional licensure, conduct of operations, costs and payment for services and payment for referrals.
Because we provide services on a contract basis and are paid directly by our hospital, healthcare facility and physician practice group clients, we are not directly impacted by Medicare, Medicaid and managed care reimbursement policy changes. Nevertheless, reimbursement changes in government programs, particularly Medicare and Medicaid, can and do indirectly affect the demand and the prices paid for our services. For example, our hospital, healthcare facility and physician practice group clients could receive reduced reimbursements or be excluded from coverage, because of a change in the rates or conditions set by federal or state governments, as we have experienced in the radiology specialties. In addition, our hospital, healthcare facility and physician practice group clients could suffer civil and criminal penalties as could we as a government contractor and be excluded from participating in Medicare, Medicaid and other healthcare programs for failure to comply with the laws and regulations. Such changes in federal reimbursement program laws and regulations, or the exclusion of our hospital, healthcare facility and physician practice group clients from such programs could adversely affect our clients which in turn could also adversely affect the prices and demand for our services. In addition, our exclusion as a government contractor could negatively impact our business.
Similarly, state legislation exists, such as legislation in Massachusetts that limits the hourly rate paid to temporary nursing agencies for registered nurses, licensed practical nurses and certified nurses’ aides. While our service offerings are exempt, in part, from this Massachusetts regulation, similar regulations may be enacted in other states in which we operate, and as a result revenue and margins could decrease. Furthermore, third party payers, such as federal and state government and health maintenance organizations, significantly impact the prices charged for medical care. Failure by hospitals, healthcare facilities and physician practice groups to obtain full reimbursement from those third party payers could reduce the demand or the price paid for our services, or result in some client solvency issues or cessation of business.
13
The success of our business depends on our ability to quickly and efficiently qualify healthcare professionals in the various jurisdictions and settings in which we operate, where we are subject to extensive state regulation of healthcare professional licensure and conduct of operations. The costs and requirements to comply with these regulations may impact the revenues and profitability of our business.
We are also subject to certain laws and regulations applicable to healthcare staffing agencies and general temporary staffing services. Like all employers, we must also comply with various laws and regulations relating to pay practices, workers compensation and immigration. There is a risk that we could be subject to payment of additional wages, insurance and employment and payroll related taxes if certain of our corporate employees classified as exempt from overtime and minimum wage requirements are re-classified as non-exempt from overtime and minimum wage requirements. Because of the nature of our business, the impact of these laws and regulations may have a more pronounced effect on our business. These laws and regulations may also impede our ability to grow our operations.
A significant portion of our hospital and healthcare facility clients are state and federal government agencies, where our ability to compete for new contracts and orders, and the profitability of these contracts and orders, may be affected by government legislation, regulation or policy. Additionally, in providing services to state and federal government clients, we are also subject to specific laws and regulations which government agencies have broad latitude to enforce. Any regulatory or policy changes or modification of application of existing regulations could adversely affect our ability to contract with these government agencies or the costs of operations of serving these clients, and as a result impact revenues and profitability.
We primarily draw our supply of healthcare professionals from the United States, but international supply channels have represented a small temporary nurse supply source. Our utilization of this international supply channel is reliant upon an increase or exemption from current permanent immigrant visa quotas, which means that since late 2006, there have been virtually no permanent immigrant visas available for nurses overseas. These laws have significantly constricted our ability to place new international nurses on assignment in recent years. As a result of these quotas, there are delays ranging from three to five years for foreign-trained nurses from certain countries, such as India and the Philippines, to enter into the United States on a permanent immigrant visa.
Legislation impacting the current delivery and third party payor system for healthcare may have significant and unforeseeable impacts on our business.
Members of Congress have introduced and extensively debated healthcare reform legislation. If such legislation is enacted, the impact on the health care industry could be extensive, including having the federal or one or more state governments assume a larger role in the health care system, expanding healthcare coverage of Americans, and imposing new and potentially significant restrictions on reimbursement. A number of state legislatures, including California, Colorado, New York, Ohio and Pennsylvania, have contemplated but have not enacted significant reform of their health insurance markets. Other states are expected to consider significant reform of their health insurance markets as well as more modest reforms aimed at expanding Medicaid and/or the State Children’s Health Insurance Program eligibility and new coverage options for those not eligible for government programs. The enactment of health care reforms at the federal or state level may affect certain aspects of our business, including provider reimbursement methods and payment rate; contracting with physicians, hospitals and/or other health care clients and professionals; medical, administrative, technology or other costs; and the collection, use, disclosure, maintenance and disposal of individually identifiable health information. We cannot predict if any of these proposals will ultimately become law, or, if enacted, what their terms or the regulations promulgated pursuant to such laws will be. Any health care reforms enacted may be phased in over a number of years but, if enacted, could reduce our revenues, increase our costs, or require us to revise the ways in which we conduct business or put us at risk for loss of business. In addition, our results of operations, our financial position, including our ability to maintain the value of our goodwill, and cash flows could be materially adversely affected by such changes.
14
Our profitability is impacted by our ability to leverage our cost structure.
We have technology, operations and human capital infrastructures to support our existing business and contemplated growth. In the event that our business does not perform as expected, our inability to reduce these costs would impair our profitability. Additionally, if we are not able to capitalize on this infrastructure, our earnings growth rate will be negatively impacted.
We may not be able to successfully implement our strategic growth, acquisition and integration strategies.
An effective growth management strategy is necessary to organically grow our current operations, and if we do not successfully execute on this growth strategy, our profitability could decline. We continue to explore strategic acquisition opportunities to supplement our organic growth strategy. The global financial markets have experienced significant disruptions which may prevent us from obtaining debt or equity financing on acceptable terms, if at all. In addition, our acquisition and integration strategy involves significant risks and uncertainties, including appropriate valuation of target companies, continuing severe liquidity issues in the credit markets, the assumption of liabilities and exposure to unforeseen liabilities of acquired companies, difficulties integrating acquired personnel and corporate cultures into our business, the potential loss of key employees or customers of acquired companies, and the diversion of management attention from existing operations. We may not be able to fully integrate the operations of the acquired businesses with our own in an efficient and cost-effective manner, including implementation or remediation of controls, procedures and policies at the acquired business, and integration of each company’s accounting, management information, human resource and other administrative systems. Acquisitions may also require significant expenditures of cash and other resources and assumption of debt that may ultimately negatively impact our overall financial performance.
Difficulties in maintaining our management information and communications systems may negatively impact our business operations and as a result, our financial performance.
Our ability to deliver our staffing services to our hospital, healthcare facility and physician practice group clients and manage our internal systems depends to a large extent upon our access to and the performance of our management information and communications systems. These systems also maintain accounting and financial information, which we depend upon to fulfill our financial reporting obligations. If these systems do not adequately support our operations, these systems are damaged or service is disrupted or if we are required to incur significant additional costs to repair, maintain or expand these systems, our business and financial results could be materially adversely affected. Although we have risk mitigation measures, these systems, and our access to these systems, are not impervious to floods, fire, storms, or other natural disasters or service interruptions, and the loss of systems information could result in disruption to our business.
The challenge to the classification of certain of our healthcare professionals as independent contractors could adversely impact our profitability.
Although it is general industry standard to treat certain healthcare professionals, such as physicians, as independent contractors, federal or state taxing authorities may take the position that such professionals are employees subjecting the company to additional wage and insurance claims, and employment and payroll-related taxes. The State of California taxing authorities have taken such position, which the Company has appealed, as further described under “Item 8. Financial Statements and Supplementary Data—Notes to Consolidated Financial Statements—Note 11(a), Commitments and Contingencies—Legal.” Such a reclassification could result in liability that could have a significant negative impact on the profitability of the period in which assessed, and would require changes to our payroll and related business processes, which could be costly. In addition, many states have laws which prohibit non-physician owned companies from employing physicians, referred to as the “corporate practice of medicine.” If our independent contractor physicians are classified as employees, we could be found in violation of state laws that prohibit the corporate practice of medicine, which would have a substantial negative impact on our profitability.
15
The impact of medical malpractice and other claims asserted against us could subject us to substantial liabilities.
In recent years, our hospital, healthcare facility and physician practice group clients are subject to a number of legal actions alleging malpractice or related legal theories. Because our temporary and permanent healthcare professionals provide medical care and we recruit and assist in credentialing of these healthcare professionals, claims may be brought against us and our healthcare professionals relating to the recruitment and qualification of these healthcare professionals and the quality of medical care provided by our temporary healthcare professionals while on assignment or after placement at our hospital, healthcare facility and physician practice group clients. We and the healthcare professional are at times named in these lawsuits regardless of our contractual obligations, the competency of the healthcare professional, the standard of care provided by the healthcare professional or the quality of service that we provided. In some instances, we are required to indemnify hospital, healthcare facility and physician practice group clients contractually against some or all of these potential legal actions.
Also, because some of our temporary healthcare professionals are our employees, we may be subject to various employment claims and contractual disputes regarding the terms of a temporary healthcare professional’s employment. Because we are in the business of placing our temporary healthcare professionals in the workplaces of other companies and through our recruitment process outsourcing service, of assisting clients in hiring, we are subject to possible claims by healthcare professionals alleging discrimination, sexual harassment and other similar activities by our hospital and healthcare facility clients or their agents. We maintain a policy for employment practices coverage. However, the cost of defending such claims, even if groundless, could be substantial and the associated negative publicity could adversely affect our ability to attract, retain and place qualified individuals in the future.
We maintain various types of insurance coverage, including professional liability, workers compensation and employment practices, through insurance carriers, and/or we self-insure for these claims through accruals for retention reserves. We may experience increased insurance costs and reserve accruals and may not be able to pass on all or any portion of increased insurance costs to our hospital, healthcare facility and physician practice group clients, thereby reducing our profitability. Our insurance coverage and reserve accruals may not be sufficient to cover all claims against us, and we may be exposed to substantial liabilities.
Terrorist threats or attacks may disrupt or adversely affect our business operations.
Our business operations may be interrupted or adversely impacted in the United States and abroad in the event of a terrorist attack or heightened security alerts. Our temporary healthcare professionals may become reluctant to travel and may decline assignments based upon the perceived risk of terrorist activity, which would reduce our revenue and profitability. In addition, terrorist activity or threats may impede our access to our management and information systems resulting in loss of revenue. We do not maintain insurance coverage against terrorist attacks.
If we are unable to execute our business strategy, our profitability, cash flow and, consequently, our compliance with debt covenants and our liquidity could be negatively impacted.
Our success is dependent on our ability to execute our business strategy, which necessarily involves the successful operation of a number of integral components and business objectives. Our ability to execute these business objectives is dependent upon a sufficient cash flow and capital structure to support the business. If general economic conditions or other factors result in our margins or cash flow being significantly impaired, our compliance with our debt covenants could be negatively impacted. Our credit facility contains financial covenants that require us to operate below a maximum leverage ratio and above a minimum fixed charge coverage ratio. Our ability to comply with these covenants will depend in part upon our reported financial results, which as indicated above are dependent on our ability to execute our business strategy. If we are not in compliance with such covenants, we would be in default under our credit facility, the lender could call the debt and we could be unable to secure further borrowing.
16
The loss of key officers and management personnel could adversely affect our ability to remain competitive.
We believe that the success of our business strategy and our ability to maintain our recent levels of profitability depends on the continued employment of our senior management team. We have an employment agreement only with Susan R. Nowakowski, our President and Chief Executive Officer, through May 4, 2011, which is renewable on an annual basis. If members of our senior management team become unable or unwilling to continue in their present positions, our business and financial results could be adversely affected.
We have valuable brand identities we have developed and acquired, and a substantial amount of goodwill and indefinite lived intangibles on our balance sheet that may have the effect of decreasing our earnings or increasing our losses in the event that we are required to recognize an impairment to goodwill or indefinite lived intangibles.
We have invested substantial amounts in acquiring, developing and maintaining our brands, and our success depends on our ability to maintain our brand identities for existing services and effectively build up brand image for new services. We cannot assure that additional expenditures and our continuing commitment to marketing will have the desired impact on our brands’ value. We have goodwill on our balance sheet, which represents the excess of the total purchase price of our acquisitions over the fair value of the net assets and indefinite lived intangibles acquired. We evaluate goodwill and indefinite lived intangibles for impairment annually, or when evidence of potential impairment exists. In the event impairment is identified, a charge to earnings would be recorded. Although an impairment charge to earnings for goodwill and indefinite lived intangibles would not affect our cash flow, it would decrease our earnings or increase our losses, as the case may be, and our stock price could be adversely affected. Due to the economic downturn and our lower market capitalization, we performed interim impairment testing during the first quarter of 2009 and completed the valuation during the second quarter of 2009. We recorded impairment charges of $175.7 million, pretax, pursuant to the interim impairment testing. In addition, we performed our annual impairment testing on the remaining goodwill and indefinite lived intangibles as of October 31, 2009, our annual impairment testing date, and no additional impairment was identified. The impairment test is based on several factors requiring judgment. If the current economic conditions continue to deteriorate causing further decline in our stock price, additional impairments to one or more reporting units could occur in future periods whether or not connected to the annual impairment analysis. We will continue to monitor the recoverability of the carrying value of our goodwill and indefinite lived intangibles. See additional information in “Critical Accounting Principles and Estimates in Part II, Item 7.”
We have a substantial accrual for self-insured retentions on our balance sheet, and any significant adverse adjustments in these accruals may have the effect of decreasing our earnings or increasing our losses.
We maintain accruals for self-insured retentions for professional liability, health insurance, workers compensation and other employment practices related matters on our balance sheet. Generally, increases to these accruals do not immediately affect our cash flow, but a significant increase to these self-insured retention accruals may decrease our earnings. We determine the adequacy of our self-insured retention accruals by evaluating our historical experience and trends, related to both insurance claims and payments, information provided to us by our insurance brokers, attorneys and third party administrators, as well as industry experience and trends. If such information indicates that our accruals are overstated or understated, we reduce or provide for additional accruals, as appropriate.
17
| Item 1B. | Unresolved Staff Comments |
None.
| Item 2. | Properties |
We believe that our leased space is adequate for our current needs. In addition, we believe that adequate space can be obtained to meet our foreseeable business needs. In accordance with, and as required by, the terms of our credit agreement, we have pledged substantially all of our assets and properties to our lenders under our credit agreement to secure our obligations thereunder. Our principal leases for office space as of December 31, 2009 are identified in the chart below:
| Location |
Square Feet (1) | |
| San Diego, California (corporate headquarters) |
171,944 | |
| Irving, Texas (all segments) |
117,467 | |
| Atlanta, Georgia (physician permanent placement services segment) |
9,578 | |
| Denver, Colorado (nurse and allied healthcare staffing segment) |
7,363 | |
| Salt Lake City, Utah (locum tenens staffing segment) |
5,768 | |
| Birmingham (United Kingdom) (nurse and allied healthcare staffing segment) |
2,633 | |
| Savannah, Georgia (nurse and allied healthcare staffing segment) |
1,996 |
| (1) | Represents the total leased space excluding sub-leased space. |
| Item 3. | Legal Proceedings |
We are subject to various claims and legal actions in the ordinary course of our business. Some of these matters include professional liability, tax, payroll and employee-related matters and inquiries and investigations by governmental agencies regarding our employment practices. We are not aware of any pending or threatened litigation that we believe is reasonably likely to have a material adverse effect on our results of operations, financial position or liquidity.
Our hospital, healthcare facility and physician practice group clients may also become subject to claims, governmental inquiries and investigations and legal actions to which we may become a party relating to services provided by our professionals. From time to time, and depending upon the particular facts and circumstances, we may be subject to indemnification obligations under our contracts with our hospital, healthcare facility and physician practice clients relating to these matters. At this time, we are not aware of any such pending or threatened litigation that we believe is reasonably likely to have a material adverse effect on our results of operations, financial position or liquidity.
See additional information in “Item 8. Financial Statements and Supplementary Data—Notes to Consolidated Financial Statements—Note 11(a), Commitments and Contingencies—Legal.”
| Item 4. | Submission of Matters to a Vote of Security Holders |
A special meeting of stockholders was held on December 9, 2009. The matter submitted to a vote of our stockholders was the approval of an equity exchange program under which eligible AMN employees, excluding executive officers and directors, would be able to exchange certain options and stock appreciation rights for a lesser number of restricted stock units (the “Equity Exchange”). The Equity Exchange was approved by our stockholders. The results of the voting were as follows:
| Votes For |
Votes Against |
Abstained |
% Votes For | |||
| 18,616,354 |
9,113,030 | 14,006 | 67.10% |
18
PART II
| Item 5. | Market for Registrant’s Common Equity, Related Stockholder Matters and Issuer Purchases of Equity Securities |
Our common stock trades on the New York Stock Exchange under the symbol “AHS”. The following table sets forth, for the periods indicated, the high and low sales prices reported by the New York Stock Exchange.
| Sales Price | ||||||
| High | Low | |||||
| Year Ended December 31, 2008 |
||||||
| First Quarter |
$ | 17.24 | $ | 14.25 | ||
| Second Quarter |
$ | 17.89 | $ | 14.48 | ||
| Third Quarter |
$ | 20.38 | $ | 16.20 | ||
| Fourth Quarter |
$ | 17.57 | $ | 7.45 | ||
| Year Ended December 31, 2009 |
||||||
| First Quarter |
$ | 8.92 | $ | 4.56 | ||
| Second Quarter |
$ | 8.07 | $ | 4.94 | ||
| Third Quarter |
$ | 10.61 | $ | 5.94 | ||
| Fourth Quarter |
$ | 11.00 | $ | 7.80 | ||
As of February 24, 2010, shares were held by approximately 130 stockholders of record, and the last reported sale of our common stock on the New York Stock Exchange was $9.62 per share. Because many of our shares of common stock are held by brokers and other institutions on behalf of stockholders, we are unable to estimate the total number of stockholders represented by these record holders.
From time to time, we repurchase our common stock in the open market pursuant to programs approved by our Board. We may repurchase our common stock for a variety of reasons, such as acquiring shares to offset dilution related to equity-based incentives and optimizing our capital structure. During the fourth quarter of 2009, we did not repurchase any shares of our common stock.
We have not paid any dividends in the past and currently do not expect to pay cash dividends or make any other distributions in the future. We expect to retain our future earnings, if any, for use in the operation and expansion of our business. Any future determination to pay dividends will be at the discretion of our board of directors and will depend upon our financial condition, results of operations, capital requirements and such other factors as our Board deems relevant. In addition, our ability to declare and pay dividends on our common stock is subject to covenants in our Credit Agreement. See “Item 7. Management’s Discussion and Analysis of Financial Condition and Results of Operations—Liquidity and Capital Resources.”
The following table sets forth information required by this item as of December 31, 2009 regarding compensation plans under which the Company’s equity securities are authorized for issuance:
| (a) | (b) | (c) | |||||
| Number of Securities to be Issued upon Exercise of Outstanding Options |
Weighted-Average Exercise Price of Outstanding Options ($) |
Number of Securities Remaining Available for Future Issuance Under Equity Compensation Plans (Excluding Securities Reflected in Column (a)) | |||||
| Plan Category |
|||||||
| Equity compensation plans approved by security holders |
3,147,234 | $ | 8.01 | 3,143,035 | |||
| Equity compensation plans not approved by security holders |
267,763 | 5.39 | — | ||||
| Total |
3,414,997 | $ | 7.81 | 3,143,035 | |||
19
Additional information regarding our equity award plans and plan activity for the years ended December 31, 2009, 2008 and 2007 is provided in our consolidated financial statements in this Annual Report on Form 10-K in “Item 8. Financial Statements and Supplementary Data—Notes to Consolidated Financial Statements—Note 10, Stock-Based Compensation.”
Performance Graph
This performance graph shall not be deemed “filed” with the SEC or subject to Section 18 of the Securities Exchange Act of 1934, as amended (the “Exchange Act”), nor shall it be deemed incorporated by reference in any of our filings under the Exchange Act or the Securities Act of 1933, as amended.
The graph below compares the total stockholder return on our common stock with the total stockholder return of (i) the NYSE Composite Index, and (ii) the Dow Jones US Business Training & Employment Agencies Index (“BTEA”), assuming an investment of $100 on December 31, 2004 in our common stock, the stocks comprising the NYSE Market Index, and the stocks comprising the BTEA.
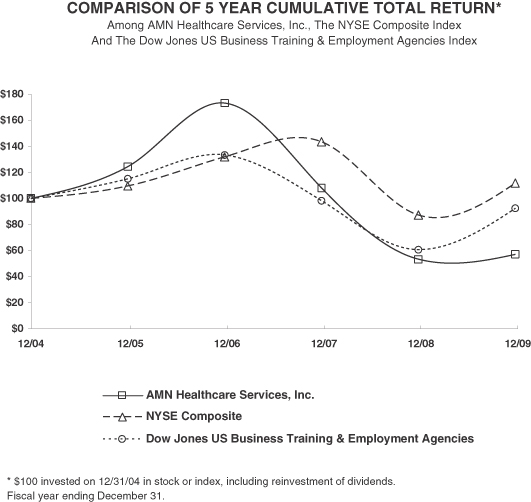
| 12/04 | 12/05 | 12/06 | 12/07 | 12/08 | 12/09 | |||||||
| AMN Healthcare Services, Inc. |
100.00 | 124.32 | 173.10 | 107.92 | 53.17 | 56.95 | ||||||
| NYSE Composite |
100.00 | 109.36 | 131.74 | 143.42 | 87.12 | 111.76 | ||||||
| Dow Jones US Business Training & Employment Agencies |
100.00 | 114.96 | 133.21 | 98.10 | 60.48 | 92.30 |
20
| Item 6. | Selected Financial Data |
The selected financial and operating data presented below should be read in conjunction with “Item 7. Management’s Discussion and Analysis of Financial Condition and Results of Operations” and “Item 8. Financial Statements and Supplemental Data” appearing elsewhere in this Annual Report on Form 10-K. Our statements of operations data for the years ended December 31, 2009, 2008 and 2007, and the balance sheet data at December 31, 2009 and 2008 are derived from the audited financial statements included elsewhere in this Annual Report on Form 10-K. The statements of operations data for the years ended December 31, 2006 and 2005 and the balance sheet data at December 31, 2007, 2006 and 2005 are derived from our audited financial statements that do not appear herein. Because of our acquisition of The MHA Group, Inc. (“MHA”) in November 2005, the consolidated statement of operations for the year ended December 31, 2005 only includes the results of operations of MHA since the date of acquisition. Our historical results are not necessarily indicative of our results of operations to be expected in the future.
| Years Ended December 31, | ||||||||||||||||
| 2009 | 2008 | 2007 | 2006 | 2005 | ||||||||||||
| (dollars and shares in thousands, except per share data) | ||||||||||||||||
| Consolidated Statements of Operations: |
||||||||||||||||
| Revenue |
$ | 759,790 | $ | 1,217,200 | $ | 1,164,022 | $ | 1,081,703 | $ | 705,843 | ||||||
| Cost of revenue |
555,369 | 900,211 | 860,857 | 792,415 | 535,608 | |||||||||||
| Gross profit |
204,421 | 316,989 | 303,165 | 289,288 | 170,235 | |||||||||||
| Operating expenses: |
||||||||||||||||
| Selling, general and administrative |
157,241 | 230,656 | 218,250 | 205,499 | 117,326 | |||||||||||
| Depreciation and amortization |
13,812 | 14,439 | 11,674 | 10,325 | 6,179 | |||||||||||
| Restructuring charges |
11,270 | — | — | — | — | |||||||||||
| Impairment charges (1) |
175,707 | — | — | — | — | |||||||||||
| Total operating expenses |
358,030 | 245,095 | 229,924 | 215,824 | 123,505 | |||||||||||
| Income (loss) from operations |
(153,609 | ) | 71,894 | 73,241 | 73,464 | 46,730 | ||||||||||
| Interest expense, net |
11,955 | 10,690 | 12,457 | 16,698 | 9,565 | |||||||||||
| Income (loss) before income taxes |
(165,564 | ) | 61,204 | 60,784 | 56,766 | 37,165 | ||||||||||
| Income tax expense (benefit) |
(43,387 | ) | 26,847 | 24,403 | 21,431 | 15,921 | ||||||||||
| Net income (loss) |
$ | (122,177 | ) | $ | 34,357 | $ | 36,381 | $ | 35,335 | $ | 21,244 | |||||
| Net income (loss) per common share: |
||||||||||||||||
| Basic |
$ | (3.75 | ) | $ | 1.03 | $ | 1.06 | $ | 1.08 | $ | 0.73 | |||||
| Diluted |
$ | (3.75 | ) | $ | 1.02 | $ | 1.04 | $ | 1.02 | $ | 0.66 | |||||
| Weighted average common shares outstanding: |
||||||||||||||||
| Basic |
32,615 | 33,375 | 34,377 | 32,662 | 29,130 | |||||||||||
| Diluted |
32,615 | 33,811 | 34,880 | 34,504 | 32,118 | |||||||||||
| (1) | Amount represents the impairment charges recorded in 2009 related to the Company’s goodwill and an indefinite-lived intangible asset. See additional information in “Item 8. Financial Statements and Supplementary Data—Notes to Consolidated Financial Statements—Note 4, Goodwill and Identifiable Intangible Assets.” |
| As of December 31, | |||||||||||||||
| 2009 | 2008 | 2007 | 2006 | 2005 | |||||||||||
| (dollars in thousands) | |||||||||||||||
| Consolidated Balance Sheet Data: |
|||||||||||||||
| Cash and cash equivalents |
$ | 27,053 | $ | 11,316 | $ | 18,495 | $ | 4,422 | $ | 19,110 | |||||
| Total assets |
389,004 | 642,817 | 623,658 | 615,562 | 600,352 | ||||||||||
| Total notes payable, including current portion |
105,621 | 114,816 | 146,968 | 173,380 | 205,000 | ||||||||||
| Total stockholders’ equity |
170,844 | 284,133 | 266,200 | 234,769 | 183,179 | ||||||||||
21
| Item 7. | Management’s Discussion and Analysis of Financial Condition and Results of Operations |
The following discussion should be read in conjunction with our consolidated financial statements and the notes thereto and other financial information included elsewhere in this Annual Report on Form 10-K. Certain statements in this “Management’s Discussion and Analysis (“MD&A”) of Financial Condition and Results of Operations” are “forward-looking statements.” See “Special Note Regarding Forward-Looking Statements” below. This MD&A section is intended to provide a reader of our financial statements with a narrative from the perspective of our management on our financial condition, results of operations, liquidity and certain other factors that may affect our future results. Our MD&A is presented in the following sections:
| • | Overview |
| • | Management Initiatives |
| • | Recent Trends |
| • | Critical Accounting Policies and Estimates |
| • | Results of Operations |
| • | Liquidity and Capital Resources |
| • | Off-Balance Sheet and Other Financing Arrangements |
| • | Potential Fluctuations in Quarterly Results and Seasonality |
| • | Inflation |
| • | Recent Accounting Pronouncements |
| • | Special Note Regarding Forward-looking Statements |
Overview
We are one of the nation’s leading providers of comprehensive healthcare staffing and management services. As a leading provider of travel nurse and allied staffing services, locum tenens (temporary physician staffing) and physician permanent placement services, we recruit and place healthcare professionals on assignments of variable lengths and in permanent positions with clients throughout the United States, who range from acute-care hospitals and physician practice groups to other healthcare settings, including rehabilitation centers, dialysis clinics, pharmacies, home health service providers and ambulatory surgery centers. We also offer a managed services program in which we provide flexible, customized solutions for our clients to manage their multiple clinical vendors, and recruitment process outsourcing services, where we conduct our clients’ recruitment for permanent clinical positions.
We conduct business through three reportable segments: nurse and allied healthcare staffing, locum tenens staffing and physician permanent placement services.
For the year ended December 31, 2009, we recorded revenue of $759.8 million, as compared to revenue of $1,217.2 million for 2008. We recorded a net loss of $(122.2) million, which includes goodwill impairment and restructuring charges of $129.9 million, net of tax, for the year ended December 31, 2009, as compared to net income of $34.4 million for 2008.
22
Nurse and allied healthcare staffing segment revenues comprised 57% and 69% of total consolidated revenues for the year ended December 31, 2009 and 2008, respectively. Through our nurse and allied healthcare staffing segment, we provide hospital and other healthcare facilities with staffing solutions to address anticipated or longer-term staffing requirements. With a core focus on the 13 week travel segment serving acute care facilities, we also offer a broader range of short and long-term assignment lengths, and service a wide range of client facility settings including home healthcare. We also provide managed staffing services, and in 2008, launched our recruitment process outsourcing program, which leverages our expertise and support systems to offer clients a means to replace or complement their existing internal recruitment function for permanent staffing needs.
Locum tenens staffing segment revenues comprised 38% and 27% of total consolidated revenues for the year ended December 31, 2009 and 2008, respectively. Through our locum tenens staffing segment, we place physicians of all specialties, as well as dentists, certified registered nurse anesthetists and nurse practitioners, with clients on a temporary basis as independent contractors. These locum tenens physicians and other professionals are used by our healthcare facility and physician practice group clients to fill temporary vacancies created by vacation and leave schedules and to bridge the gap while these clients seek permanent candidates or explore expansion. Our clients represent a diverse group of healthcare organizations throughout the United States, including hospitals, medical groups, occupational medical clinics, individual practitioners, networks, psychiatric facilities, government institutions, and managed care entities. The professionals we place are recruited nationwide and are typically placed on multi-week contracts with assignment lengths ranging from a few days up to one year.
Physician permanent placement services segment revenues comprised 5% and 4% of total consolidated revenues for the year ended December 31, 2009 and 2008, respectively. Through our physician permanent placement services segment, we assist hospitals, healthcare facilities and physician practice groups throughout the United States in identifying and recruiting physicians for permanent placement. Using a distinctive consultative approach, we are paid for our services through a blend of retained search fees and variable fees tied to our performance. Our broad specialty offerings include over 70 specialist and sub-specialist opportunities such as internal medicine, family practice and orthopedic surgery.
Management Initiatives
Like many companies in various industries, throughout 2009 we took a number of proactive steps to increase operational synergies and to reduce our operating cost structure to reflect the decline in volume and revenue experienced this year. These actions include consolidating offices and reorganizing back office and corporate functions to gain efficiency in operations by centralizing our primary operations in San Diego, California and Irving, Texas. In addition, during 2008 and the first half of 2009, we conducted a strategic review of our nursing brand strategy and decided to reduce the number of travel brand identities on which we focus our travel nurse marketing. As a result of these key initiatives, we recognized total pre-tax restructuring charges in 2009 of approximately $11.3 million.
Also, on December 23, 2009, we entered into a new $150.0 million credit agreement consisting of a $40.0 million secured revolving credit facility and a $110.0 million secured term loan facility. The proceeds from the initial drawdown were used to repay in full all outstanding indebtedness under a prior credit agreement, to cash collateralize certain letters of credit issued there under and to pay related transaction costs. The credit facilities are available for working capital, capital expenditures, permitted acquisitions and general corporate purposes.
Beginning in late 2008 and throughout much of 2009, we embarked on a disciplined process to evaluate the effectiveness of our brand strategy. Based on extensive research, decisions were made to evolve the brand to align with the company’s long-term business strategy. In January 2010, we launched a new corporate brand identity. Our new logo, which is displayed next to our brand names, is a visual representation of how the organization’s many parts collaborate, connect, and complement each other in a way that is totally unique to AMN Healthcare.
23
Recent Trends
Within our nurse and allied healthcare staffing segment, our travel nursing business continues to experience significantly lower demand and revenue that began in late 2008 with the deterioration in the general economy and rise in general unemployment. Demand for our services stabilized in the latter part of the third quarter of 2009, but remains at levels below what we have experienced during the past ten years. The reduction in nursing demand has been felt across the industry based on the most recent reports from our public competitors. For our clients, the economic conditions have severely constricted budgets and access to operating capital, lowered permanent staff attrition rates, and increased uncertainty regarding future patient admission levels and the collectability of receivables. These factors have, in turn, reduced demand for our services as hospitals have placed an increased reliance on permanent labor to meet staffing needs. More recent demand has favored nurses who can offer a more specialized skill-set with a shorter assignment length.
Within the allied staffing business, continued strength in demand for several supply-constrained therapy disciplines was tempered by a continued weakness in demand for imaging technicians due in large part to lower government reimbursement levels and a strong supply of available technicians.
Locum tenens demand continues to be impacted by changes in radiology reimbursement and is beginning to be impacted by lower demand for CRNAs as these nurses and clients begin to respond to the general economic conditions in a similar fashion as we have seen in our nurse and allied healthcare staffing segment. Demand for anesthesiologists and CRNAs is also being impacted by lower demand for anesthesia services due to the overall reduction in elective surgeries.
During late 2008 and early 2009, the physician permanent placement business experienced lower demand for services as clients responded to weak economic conditions and budget pressure by pursuing only critical searches and reducing their overall recruiting efforts. In addition, many clients have been attempting to conduct their searches internally or through alternative methods. Despite the stabilizing trends, overall demand is still at a relatively low level.
Critical Accounting Policies and Estimates
We have identified the following critical accounting policies that affect the more significant judgments and estimates used in the preparation of our consolidated financial statements. The preparation of our consolidated financial statements in conformity with United States generally accepted accounting principles requires us to make estimates and judgments that affect our reported amounts of assets and liabilities, revenue and expenses, and related disclosures of contingent assets and liabilities. On an ongoing basis, we evaluate our estimates, including those related to asset impairment, accruals for self-insurance and compensation and related benefits, accounts receivable and contingencies and litigation, valuation and recognition of share-based payments and income taxes. These estimates are based on the information that is currently available to us and on various other assumptions that we believe to be reasonable under the circumstances. Actual results could vary from these estimates under different assumptions or conditions.
We believe that the following critical accounting policies affect the more significant judgments and estimates used in the preparation of our consolidated financial statements:
Goodwill and Intangible Assets
We perform annual impairment analyses to assess the recoverability of the goodwill and indefinite-lived intangible assets. Application of the goodwill impairment test requires judgment, including the identification of reporting units, assigning assets and liabilities to reporting units, assigning goodwill to reporting units, and determining the fair value of each reporting unit. Valuation techniques consistent with the market approach and income approach are used to measure the fair value of each reporting unit. Significant judgments are required to estimate the fair value of reporting units including
24
estimating future cash flows, and determining appropriate discount rates, growth rates, company control premium and other assumptions. Changes in these estimates and assumptions could materially affect the determination of fair value for each reporting unit. Testing is required between annual tests if events occur or circumstances change that would, more likely than not, reduce the fair value of the reporting unit below its carrying value. We performed the annual impairment test at October 31, 2008 and determined there was no impairment of goodwill.
Due to the economic downturn and our lower market capitalization, we determined it was appropriate to perform interim impairment testing at our reporting unit level during the first quarter of 2009. Our five reporting units are domestic nurse staffing, international nurse staffing, allied healthcare staffing, locum tenens staffing and physician permanent placement services. The performance of the test involves a two-step process. The first step of the impairment test involves comparing the fair value of our reporting units with the reporting unit’s carrying amount, including goodwill. We generally determine the fair value of our reporting units using a combination of the income approach (using discounted future cash flows) and the market valuation approach. Cash flows beyond the discrete forecasts were estimated using a terminal value calculation, which incorporated historical and forecasted financial trends for each identified reporting unit and considered long-term earnings growth rates for publicly traded peer companies. Future cash flows were discounted to present value by incorporating the present value techniques. Publicly available information regarding the market capitalization of the Company was also considered in assessing the reasonableness of the cumulative fair values of our reporting units estimated using the discounted cash flow methodology. If the carrying amount of the reporting unit exceeds the reporting unit’s fair value, we perform the second step of the goodwill impairment test to determine the amount of impairment. During the first step, a control premium and average stock price close to the testing dates were utilized to compare the sum of the reporting units’ fair value to the market capitalization. This control premium is based on detailed analysis that considers appropriate industry, market, economic and other pertinent factors, including indications of such premium from data on recent acquisition transactions. The second step of the goodwill impairment test involved comparing the implied fair value of our reporting unit’s goodwill with the carrying amount of that goodwill. The implied fair value of goodwill was determined in the same manner utilized to estimate the amount of goodwill recognized in a business combination. As part of the second step of the performed impairment test, we calculated the fair value of certain assets, including tradenames, staffing databases and customer relationships. To determine the implied value of goodwill, fair values were allocated to the assets and liabilities of the reporting units, which failed the first step. The implied fair value of goodwill was measured as the excess of the fair value of the reporting units over the amounts assigned to its assets and liabilities. The impairment loss was measured by the amount the carrying value of goodwill exceeded the implied fair value of the goodwill.
During the first quarter of 2009, we completed the first step and a preliminary second step of our goodwill impairment testing and determined that the fair values of domestic nurse staffing, allied healthcare staffing and locum tenens reporting units were lower than their respective carrying values. The decrease in value was due to the depressed equity market value and lower projected near term growth rates in the healthcare staffing industry that rapidly deteriorated in the first quarter, lowering the anticipated growth trend used for goodwill impairment testing. We recognized a preliminary pre-tax goodwill impairment charge of approximately $173.0 million during the first quarter of 2009.
During the second quarter of 2009, we finalized the valuation of our identified tangible and intangible assets and liabilities for purposes of determining the implied fair value of its goodwill and any resulting goodwill impairment with no additional impairment charges recorded.
We also recorded a pre-tax impairment charge of $2.7 million related to an indefinite-lived intangible asset in our nurse and allied healthcare staffing segment as of March 31, 2009. This charge was also included in impairment charges on the consolidated statement of operations for the year ended December 31, 2009.
25
We performed the annual impairment test at October 31, 2009 and determined there was no further impairment of goodwill. In order to evaluate the sensitivity of the fair value calculation on the goodwill impairment test, we applied hypothetical decreases to the fair value of each reporting unit. We determined that hypothetical decreases in fair value of at least 15% would be required before any reporting unit would have a carrying value in excess of its fair value. No events or circumstances have occurred subsequent to October 31, 2009 that indicate impairment may have occurred. Given the current economic environment and uncertainties regarding the impact on our business and the sensitivity inherent in the fair value determination process, we will closely monitor potential indicators of impairment during 2010.
Intangible assets with estimable useful lives are required to be amortized over their respective estimated useful lives and reviewed for impairment whenever events or changes in circumstances indicate that the carrying amount may not be recoverable. An impairment evaluation is based on an undiscounted cash flow analysis at the lowest level at which cash flows of the long-lived assets are largely independent of other groups of assets and liabilities. We assess potential impairments to intangible assets when there is evidence that events or changes in circumstances indicate that the carrying amount of an asset or asset group may not be recovered. Our judgments regarding the existence of impairment indicators and future cash flows related to intangible assets are based on operational performance of our businesses, market conditions and other factors. Although there are inherent uncertainties in this assessment process, the estimates and assumptions we use, including estimates of future cash flows, volumes, market penetration and discount rates, are consistent with our internal planning. If these estimates or their related assumptions change in the future, we may be required to record an impairment charge on all or a portion of our long-lived intangible assets. Furthermore, we cannot predict the occurrence of future impairment-triggering events nor the impact such events might have on our reported asset values. Future events could cause us to conclude that impairment indicators exist and that long-lived intangible assets associated with our acquired businesses are impaired. Any resulting impairment loss could have an adverse impact on our results of operations. We have analyzed our amortizable long-lived assets for impairment and determined that there is no impairment at December 31, 2009 and 2008.
If we are required to record an impairment charge in the future, it could have an adverse impact on our results of operations.
Professional Liability Reserve
We maintain an accrual for professional liability self-insured retention limits, which is included in accounts payable and accrued expenses and other long-term liabilities in our consolidated balance sheets. We determine the adequacy of this undiscounted accrual by evaluating our historical experience and trends, loss reserves established by our insurance carriers, management and third party administrators, as well as through the use of independent actuarial studies. We obtain actuarial studies on a semi-annual basis that use our historical claims data and industry data to determine the appropriate reserves for incurred, but not reported, professional liability claims for each year. For the nurse and allied healthcare staffing segment, reserves for reported claims are based upon loss reserves established by management and our third party administrators. For the locum tenens staffing segment, reserves for reported claims are based upon actuarial studies which utilize our historical claims data and industry data.
Workers Compensation Reserve
We maintain an accrual for workers compensation self-insured retention limits, which is included in accrued compensation and benefits and other long-term liabilities in our consolidated balance sheets. We determine the adequacy of these undiscounted accruals by evaluating our historical experience and trends, loss reserves established by our insurance carriers and third party administrators, as well as
26
through the use of independent actuarial studies. We obtain updated actuarial studies on a semi-annual basis that use our payroll and actual claims data, as well as industry data, to determine the appropriate reserve both for reported claims and incurred, but not reported, claims for each policy year. The actuarial study for workers compensation provides us with the estimated losses for prior policy years and an estimated percentage of payroll compensation to be accrued for the current year. We record our accruals based on the amounts provided in the actuarial study, and we believe this is the best estimate of our liability.
Self-Insured Health Benefit Claims Reserve
We maintain an accrual for self-insured health benefits we provide to our corporate employees and nurse and allied healthcare professionals, which is included in accrued compensation and benefits in our consolidated balance sheets. We determine the adequacy of this undiscounted accrual by evaluating our historical experience and trends related to both health insurance claims and payments, information provided to us by our insurance broker and third party administrator and industry experience and trends. If such information indicates that our accruals are overstated or understated, we reduce or provide for additional accruals. Our accrual is based on (i) a monthly average of our actual historical health insurance claim amounts and (ii) the average period of time from the date the claim is incurred to the date that it is reported to us and paid. We believe this is the best estimate of the amount of incurred, but not reported, self-insured health benefit claims at year-end. Historically, our accrual for health insurance has fluctuated with increases or decreases in the average number of plan participants, changes in our claims experience and changes in the reporting and payment processing time for claims.
Accounts Receivable
Accounts receivable are recorded at the invoiced amount and are non-interest bearing. We maintain an allowance for doubtful accounts for estimated credit losses resulting from collection risks, including the inability of our customers to make required payments under contractual agreements. The allowance for doubtful accounts is reported as a reduction of accounts receivable in our consolidated balance sheets. We determine the adequacy of this allowance by evaluating historical delinquency and write-off trends, the financial condition and credit risk and histories of each customer, historical payment trends as well as the current economic conditions and the impact of such conditions on our customers’ liquidity and overall financial condition. If the financial condition of our customers deteriorates, affecting their ability to make payments, additional allowances would be provided. We also maintain a sales allowance to reserve for potential credits issued to customers. The amount of the reserve is determined based on historical credits issued.
Contingent Liabilities
We are subject to various claims and legal actions in the ordinary course of our business. Some of these matters include tax, payroll and employee-related matters and investigations by governmental agencies regarding our employment practices. As we become aware of such claims and legal actions, we provide accruals if the exposures are probable and estimable. If an adverse outcome of such claims and legal actions is reasonably possible, we assess materiality and provide disclosure, as appropriate.
Staff Care, Inc., an indirect wholly owned subsidiary of the Company, is the subject of an assessment by the California Employment Development Department (“EDD”) with respect to the payment of certain payroll related taxes in connection with locum tenens and allied providers, for the period between April 1, 2001 and June 30, 2007. We have appealed the EDD’s assessment as we do not believe the assessment has merit. However, on September 5, 2008 we made a payment to the EDD in the amount of $2.3 million to cease the accrual of interest while the appeal is pending. Of the $2.3 million payment, $1.8 million was related to periods prior to the MHA acquisition, which included
27
Staff Care, Inc., in November 2005 and $0.5 million was related to the post-acquisition period. As part of the acquisition agreement of MHA, the MHA selling shareholders indemnified us with respect to the $1.8 million related to the pre-acquisition period. On August 31, 2009, we signed a settlement agreement with the MHA selling shareholders to release them from any further liability under the assessment in exchange for their release of claim to an additional $1.5 million in the holdback reserve. As a result of this settlement, we recorded a benefit to pre-tax income in the third quarter of 2009 of $1.5 million, but will be liable for any future costs related to the EDD assessments. There is potential exposure subsequent to the assessment period, but we believe the exposure to be immaterial to our consolidated financial statements.
Our hospital, healthcare facility and physician practice group clients may also become subject to claims, governmental inquiries and investigations and legal actions to which we may become a party relating to services provided by our professionals. From time to time, and depending upon the particular facts and circumstances, we may be subject to indemnification obligations under our contracts with our hospital, healthcare facility and physician practice group clients relating to these matters.
We currently are not aware of any other pending or threatened litigation that would be considered reasonably likely to have a material adverse effect on our consolidated financial position, results of operations or liquidity.
Share-Based Payments
We expense the estimated fair value of share-based awards over the requisite employee service period. The measurement of stock-based compensation cost is based on several criteria including, but not limited to, the valuation model used and associated input factors such as expected term of the award, our stock price volatility, dividend rate, risk free interest rate, and award forfeiture rate. The input factors to use in the valuation model are based on subjective future expectations combined with management judgment. We estimate the fair value of stock options and stock appreciation rights granted using the Black-Scholes valuation model and the assumptions shown in Note 10(b) to the accompanying consolidated financial statements. We use historical data to estimate pre-vesting equity award forfeitures and record stock- based compensation expense only for those awards that are expected to vest. We estimate the expected term based on historical exercise patterns, including data related to equity award exercises, post-vesting termination and equity award contractual term. We base the dividend yield assumption on historical dividend payouts, which are zero. The risk-free interest rate assumption is based on observed interest rates appropriate for the expected term of our equity awards. After consideration of both our implied volatility and historical volatility, we determined our historical volatility to be the most accurate estimate of future volatility due to that we have very limited trading in options and have historical volatility data for a period that covers the expected term of the equity award and therefore utilize this measure. The fair value of equity awards granted is amortized on a straight-line basis over the requisite service periods of the awards, which are the vesting periods. If factors change, we may decide to use different assumptions under the Black-Scholes valuation model in the future, which could materially affect our results of operations.
Income Taxes
The objectives of accounting for income taxes are to recognize the amount of taxes payable or refundable for the current year and deferred tax liabilities and assets for the future tax consequences of events that have been recognized in an entity’s financial statements or tax returns. We evaluate our uncertain tax positions in accordance with the guidance for accounting for uncertainty in income taxes. We recognize the tax benefit from an uncertain tax position only if it is more likely than not that the tax position will be sustained on examination by the taxing authorities, based on the technical merits of the position. The tax benefits recognized in the financial statements from such a position are measured
28
based on the largest benefit that has a greater than 50% likelihood of being realized upon ultimate settlement. Guidance is also provided for derecognition of income tax assets and liabilities, classification of current and deferred income tax assets and liabilities, accounting for interest and penalties associated with tax positions, and income tax disclosures. Judgment is required in assessing the future tax consequences of events that have been recognized in our financial statements or tax returns. Variations in the actual outcome of these future tax consequences could materially affect our results of operations.
Results of Operations
The following table sets forth, for the periods indicated, certain statements of operations data as a percentage of revenue. Our results of operations include three reportable segments: (1) nurse and allied healthcare staffing; (2) locum tenens staffing; and (3) physician permanent placement services. Our historical results are not necessarily indicative of our results of operations to be expected in the future.
| Years Ended December 31, | |||||||||
| 2009 | 2008 | 2007 | |||||||
| Consolidated Statements of Operations: |
|||||||||
| Revenue |
100.0 | % | 100.0 | % | 100.0 | % | |||
| Cost of revenue |
73.1 | 74.0 | 74.0 | ||||||
| Gross profit |
26.9 | 26.0 | 26.0 | ||||||
| Selling, general and administrative |
20.7 | 18.9 | 18.7 | ||||||
| Depreciation and amortization |
1.8 | 1.2 | 1.0 | ||||||
| Restructuring charges |
1.5 | — | — | ||||||
| Impairment charges |
23.1 | — | — | ||||||
| Income (loss) from operations |
(20.2 | ) | 5.9 | 6.3 | |||||
| Interest expense, net |
1.6 | 0.9 | 1.1 | ||||||
| Income (loss) before income taxes |
(21.8 | ) | 5.0 | 5.2 | |||||
| Income tax expense (benefit) |
(5.7 | ) | 2.2 | 2.1 | |||||
| Net income (loss) |
(16.1 | )% | 2.8 | % | 3.1 | % | |||
Comparison of Results for the Year Ended December 31, 2009 to the Year Ended December 31, 2008
Revenue. Revenue decreased 38%, to $759.8 million for 2009 from $1,217.2 million for 2008, primarily due to a decrease in the average number of temporary healthcare professionals on assignment in the nurse and allied healthcare staffing segment. While our industry remains under pressure in this high unemployment and weak economic environment, there are indications that we will experience moderate growth in most of our businesses throughout 2010.
Nurse and allied healthcare staffing segment revenue decreased 49%, to $431.1 million for 2009 from $843.7 million for 2008. Of the $412.6 million decrease, $416.5 million was attributable to a decrease in the average number of temporary healthcare professionals on assignment, which was partially offset by an increase in the average bill rates charged to hospital and healthcare facilities. During 2009, the decline in the average number of temporary healthcare professionals on assignment was attributable to the considerable decrease in demand resulting from the widespread and unprecedented economic downturn, as well as from lower volume from our O’Grady Peyton business due to visa restrictions.
Locum tenens staffing segment revenue decreased 9%, to $291.8 million for 2009 from $322.0 million for 2008. Of the $30.2 million decrease, $27.3 million was attributable to a decrease in the number of days filled by healthcare professionals during 2009 and $2.9 million was attributable to the net of effect of a mix shift to our lower bill rate specialties partially offset by an increase in the average daily rate billed to clients.
29
Physician permanent placement services segment revenue decreased 28%, to $36.9 million for 2009 from $51.5 million for 2008. The decrease was primarily attributable to a decrease in the number of active searches and placements during 2009.
Cost of Revenue. Cost of revenue decreased 38%, to $555.4 million for 2009 from $900.2 million for 2008, primarily due to a decrease in the average number of temporary healthcare professionals on assignment. As we experience a moderate increase in demand, we anticipate some increase in cost of revenue due to a higher number of travelers on assignment and, in the case of the nurse and allied segment, we expect to see a nominal increase in compensation required to recruit healthcare professionals.
Nurse and allied healthcare staffing segment cost of revenue decreased 49%, to $325.7 million for 2009 from $642.0 million for 2008. The decrease of $316.3 million was almost entirely due to a decrease in the average number of temporary healthcare professionals on assignment.
Locum tenens staffing segment cost of revenue decreased 9%, to $214.8 million for 2009 from $237.3 million for 2008. Of the $22.5 million decrease, $20.1 million was attributable to a decrease in the number of days filled by healthcare professionals during 2009, and $2.4 million was attributable to the net of effect of a mix shift to our lower pay rate specialties partially offset by an increase in the average daily rate paid to the healthcare professionals.
Physician permanent placement services segment cost of revenue decreased 29%, to $14.9 million for 2009 from $20.9 million for 2008 primarily due to reduced direct marketing cost and lower recruiter headcount.
Gross Profit. Gross profit decreased 36%, to $204.4 million for 2009 from $317.0 million for 2008, representing gross margins of 26.9% and 26.0%, respectively. The increase in gross margin was due to our nurse and allied healthcare staffing segment decreasing in proportion to our higher margin locum tenens staffing and physician permanent placement services segments as well as an improvement in gross margin within the nurse and allied healthcare staffing segment. Gross margin by reportable segment for 2009 and 2008 was 24.4% and 23.9% for nurse and allied healthcare staffing, 26.4% and 26.3% for locum tenens staffing and 59.6% and 59.4% for physician permanent placement services, respectively. As indicated above, we expect to see an increase in compensation as we experience an increase in demand in our nurse and allied healthcare staffing segment which will have a moderate impact to segment gross margins in 2010.
Selling, General and Administrative Expenses. Selling, general and administrative expenses decreased 32%, to $157.2 million for 2009 from $230.7 million for 2008. The decrease was primarily due to lower employee and office related expenses as a result of cost-reduction actions taken throughout 2009, $4.5 million in actuarial-based reductions in the professional liability reserve as well as a benefit of $1.5 million due to the settlement with the selling shareholders of MHA recorded during 2009. Included in selling, general and administrative expenses were unallocated corporate overhead of $20.8 million and $31.1 million for 2009 and 2008, respectively. Excluding unallocated corporate overhead, selling, general and administrative expenses by reportable segment were $74.7 million and $124.5 million for nurse and allied healthcare staffing, $48.8 million and $59.1 million for locum tenens staffing and $12.9 million and $16.0 million for physician permanent placement services for 2009 and 2008, respectively. We anticipate overall selling, general and administrative expenses to be slightly lower in 2010, as management has proactively reduced infrastructure costs in response to lower demand levels in 2009, primarily in the nurse and allied healthcare staffing segment, but with some increase in unallocated corporate overhead as we position ourselves for growth opportunities both within our current business segments and other business lines.
Depreciation and Amortization Expenses. Amortization expense increased slightly to $4.8 million for 2009 from $4.7 million for 2008. Depreciation expense decreased to $9.0 million for 2009 from $9.7 million for 2008, with the decrease primary attributable to certain fixed assets having been fully depreciated during 2009.
30
Restructuring Charges. During 2009, the Company implemented strategic branding and consolidation initiatives resulting in the Company incurring termination costs for employees and lease liabilities. Restructuring charges of $11.3 million were recorded in 2009, of which $9.0 million was for nurse and allied healthcare staffing, $0.4 million for locum tenens staffing and $1.9 million for physician permanent placement services.
Impairment Charges. Due to the continued economic downturn and our lower market capitalization, we performed interim impairment testing during the first quarter of 2009. We determined that the fair values of certain reporting units were lower than their respective carrying values. The decrease in value was due to the depressed equity market values and lower projected near term growth rates in the healthcare staffing industry that rapidly deteriorated in the first quarter, lowering the anticipated growth trend used for goodwill impairment testing. Estimated impairment charges related to goodwill and indefinite-lived intangibles were $175.7 million for the three months ended March 31, 2009. No impairment charges were incurred for 2008. Estimated impairment charges by reportable segment recorded during the first quarter of 2009 were $143.5 million for nurse and allied healthcare staffing and $32.2 million for locum tenens staffing. During the second quarter of 2009, we finalized the fair value of our identified tangible and intangible assets and liabilities for purposes of determining the implied fair value of our goodwill and any resulting goodwill impairment with no additional impairment charges recorded. We also performed annual impairment testing as of October 31, 2009, and determined there was no further impairment of goodwill and indefinite-lived intangibles. No events have occurred subsequent to October 31, 2009 that indicate impairment may have occurred.
Interest Expense, Net. Interest expense, net, was $12.0 million for 2009 as compared to $10.7 million for 2008. The increase was primarily due to $3.5 million of costs associated with the write-off of deferred financing costs and settlement of interest rate hedging positions related to the refinancing of our credit facility in December 2009. The increase was partially offset by a decrease in interest expense primarily attributable to a lower average debt outstanding balance for 2009 as compared to 2008.
Income Tax Expense. We recorded an income tax benefit of $43.4 million for 2009 as compared to income tax expense of $26.8 million for 2008, reflecting effective income tax rates of 26.2% and 43.9% for these periods, respectively. The change in the effective income tax rate was primarily attributable to the goodwill impairment charges recorded during 2009, a portion of which was permanently nondeductible for tax purposes, and an increase in our unrecognized tax benefits. We expect our effective tax rate to increase in 2010 above both the 2009 and 2008 rates primarily due to the relationship of pre-tax income to permanent differences.
Comparison of Results for the Year Ended December 31, 2008 to the Year Ended December 31, 2007
Revenue. Revenue increased 5%, to $1,217.2 million for 2008 from $1,164.0 million for 2007, primarily due to the acquisitions in the nurse and allied healthcare staffing segment, and to a lesser extent, due to pricing increases in the nurse and allied and locum tenens staffing segments.
Nurse and allied healthcare staffing segment revenue increased 5%, to $843.7 million for 2008 from $802.0 million for 2007. Of the $41.7 million increase, $48.5 million was attributable to the acquisition of Platinum Select Staffing in February 2008 while Rx Pro Health, which was acquired in May 2007, contributed an additional $4.5 million in revenue, $17.3 million was due primarily to an increase in the average bill rates charged to hospital and healthcare facility clients, $1.2 million was attributable to a shift in the mix of temporary healthcare professionals working on flat rate contracts to hours and days worked contracts, and $2.2 million was attributable to one extra day during 2008. These increases were partially offset by a $32.0 million decrease primarily due to a decline in the average number of temporary healthcare professionals on assignment, excluding the impact from the acquisitions.
Locum tenens staffing segment revenue increased 4%, to $322.0 million for 2008 from $310.5 million for 2007. Of the $11.5 million increase, $11.9 million was attributable to increases in the average daily rate billed to
31
clients and $5.4 million was attributable to an increase in the number of days filled by healthcare professionals during 2008. These increases were partially offset by a $5.8 million decrease due to a shift in the mix of specialties worked at our lower bill rate specialties.
Physician permanent placement services segment revenue of $51.5 million for 2008 was flat compared to 2007.
Cost of Revenue. Cost of revenue increased 5%, to $900.2 million for 2008 from $860.9 million for 2007, primarily due to the acquisitions in the nurse and allied healthcare staffing segment, and to a lesser extent, due to an increase in the compensation and housing costs provided to the healthcare professionals. The increases were partially offset by lower workers compensation and medical insurance costs.
Nurse and allied healthcare staffing segment cost of revenue increased 5%, to $642.0 million for 2008 from $611.2 million for 2007. Of the $30.8 million increase, $12.8 million was attributable to net increases in compensation, primarily related to wages and housing costs provided to our temporary healthcare professionals partially offset by favorable insurance claims, $1.7 million was attributable to one extra billing day during 2008, $1.0 million was attributable to a shift in the mix of temporary healthcare professionals working on flat rate contracts to hours and days worked contracts, $37.3 million was attributable to the acquisition of Platinum Select Staffing in February 2008 and $2.5 million was attributable to the acquisition of Rx Pro Health in May 2007. These increases were partially offset by a $24.5 million decrease attributable to a reduced average number of temporary healthcare professionals on assignment, excluding the impact from the acquisitions.
Locum tenens staffing segment cost of revenue increased 3%, to $237.3 million for 2008 from $229.7 million for 2007. Of the $7.6 million increase, $8.5 million was attributable to an increase in the average daily rate paid to the healthcare professionals, and $3.9 million was attributable to an increase in the number of days filled during 2008. These increases were partially offset by a $4.8 million decrease due to a shift in the mix of physician specialties worked.
Physician permanent placement services segment cost of revenue increased 5%, to $20.9 million for 2008 from $20.0 million for 2007.
Gross Profit. Gross profit increased 5%, to $317.0 million for 2008 from $303.2 million for 2007, representing gross margins of 26.0% for both periods. Gross margin by reportable segment for 2008 and 2007 was 23.9% and 23.8% for nurse and allied healthcare staffing, 26.3% and 26.0% for locum tenens staffing and 59.4% and 61.3% for physician permanent placement services, respectively. The increase in the nurse and allied healthcare staffing segment gross margin was primarily attributable to a decrease in health insurance claims and improved pay-to-bill spreads in domestic travel nursing, and the increase in the locum tenens staffing segment gross margin was primarily attributable to a favorable pay-to-bill spread in the locum tenens staffing segment.
Selling, General and Administrative Expenses. Selling, general and administrative expenses increased 6%, to $230.7 million for 2008 from $218.3 million for 2007. Of the $12.4 million increase, $8.0 million was attributable to the acquisition of Platinum Select Staffing in February 2008, $0.6 million and $1.0 million were attributable to restructuring and legal costs, respectively, associated with Rx Pro Health, and the remaining increase was primarily attributable to increases in professional liability insurance costs and bad debt expense. Included in selling, general and administrative expenses were unallocated corporate overhead of $31.1 million and $35.4 million for 2008 and 2007, respectively. Excluding unallocated corporate overhead, selling, general and administrative expenses by reportable segment for 2008 and 2007, respectively, were $124.5 million and $114.6 million for nurse and allied healthcare staffing, $59.1 million and $54.8 million for locum tenens staffing and $16.0 million and $13.5 million for physician permanent placement services.
Depreciation and Amortization Expenses. Amortization expense increased 34%, to $4.7 million for 2008 from $3.5 million for 2007, with the increase primarily attributable to the amortization of identifiable amortizable
32
intangible assets acquired through the acquisition of Rx Pro Health in May 2007 and the Platinum Select Staffing acquisition in February 2008. Depreciation expense increased to $9.7 million for 2007 from $8.2 million for 2007, with the increase primarily attributable to additional internally developed software.
Interest Expense, Net. Interest expense, net, was $10.7 million for 2008 as compared to $12.5 million for 2007. The $1.8 million decrease was primarily attributable to a lower average debt outstanding balance for 2008 as compared to 2007.
Income Tax Expense. Income tax expense increased to $26.8 million for 2008 from $24.4 million for 2007, reflecting effective income tax rates of 43.9% and 40.1% for these periods, respectively. The increase in the effective income tax rate was primarily attributable to an increase in the tax liability related to uncertain tax benefits.
Liquidity and Capital Resources
In summary, our cash flows were:
| Year Ended December 31, | ||||||||||||
| 2009 | 2008 | 2007 | ||||||||||
| (in thousands) | ||||||||||||
| Net cash provided by operating activities |
$ | 98,732 | $ | 63,694 | $ | 79,636 | ||||||
| Net cash used in investing activities |
(29,245 | ) | (48,247 | ) | (14,629 | ) | ||||||
| Net cash used in financing activities |
(53,810 | ) | (22,334 | ) | (50,923 | ) | ||||||
Historically, our primary liquidity requirements have been for acquisitions, working capital requirements and debt service under our credit facility. We have funded these requirements through internally generated cash flow and funds borrowed under our credit facility. At December 31, 2009, $105.6 million, net of discount, was outstanding under our credit facility with $40.0 million of available credit under the secured revolver portion of this facility. The unprecedented disruption in the credit markets over the past two years has had a significant adverse impact on a number of financial institutions and other companies. Should a member of our credit party experience a material adverse event, our access to borrow additional funds under the secured revolving portion of our credit facility may be limited. At this point in time, our liquidity has not been impacted by the current credit environment, and we do not expect that it will be materially impacted in the near future. We will continue to closely monitor our liquidity and the credit markets. However, we cannot predict with any certainty the impact on the Company of any further disruption in the credit environment.
We believe that cash generated from operations and available borrowings under our revolving credit facility will be sufficient to fund our operations for the next 12 months. We intend to finance future acquisitions either with cash provided from operations, borrowings under our revolving credit facility, bank loans, debt or equity offerings, or some combination of the foregoing. The following discussion provides further details of our liquidity and capital resources.
Operating Activities:
Net cash provided by operations for 2009 was $98.7 million, compared to $63.7 million for 2008. The increase in net cash provided by operations was primarily driven by a decrease in accounts receivable as a result of lower sales and strong collection efforts, which was partially offset by a decrease in accrued compensation and benefits in 2009. Our Days Sales Outstanding (“DSO”) was 57 days at both December 31, 2009 and 2008.
Investing Activities:
We continue to have relatively low capital investment requirements. Capital expenditures were $3.8 million, $8.8 million and $9.2 million in 2009, 2008 and 2007, respectively. We expect our future capital expenditure requirements to be similar to 2009 in relation to revenue.
33
During 2009, we paid $3.4 million of cash for holdback liabilities for prior year acquisitions, of which, $2.4 million was paid to the selling shareholders of Platinum Select Staffing and $1.0 million was paid to the selling shareholders of MHA.
We did not incur any business acquisition expenditures in 2009. Our business acquisition expenditures were $39.5 million in 2008 and $5.5 million in 2007. We will continue to evaluate and look for acquisition opportunities that may require additional funding.
Financing Activities:
On December 23, 2009, we entered into a new credit agreement (the “New Credit Agreement”), by and among the Company, AMN Healthcare, Inc., (the “Borrower”), certain other subsidiaries of the Company, the several lenders, from time to time party thereto and Bank of America, N.A., as administrative agent for such lenders. Our New Credit Agreement provides for, among other things, a $40.0 million secured revolving credit facility maturing in December 2012 and a $110.0 million secured term loan facility maturing in December 2013. The new secured term loan facility was used primarily to pay off existing borrowings of $77.3 million of term debt, cash collateralize $21.8 million in existing letters of credit, and pay $4.4 million of discount on the term loan facility and $4.4 million in refinancing fees. In connection with the payoff of the existing indebtedness, we wrote off $2.3 million of unamortized deferred financing costs, which was recorded in interest expense for the year ended December 31, 2009. The discount paid on the term loan facility was netted against the par value of the term loan on the consolidated balance sheet. The discount paid on the revolving credit facility and the refinancing fees were deferred and are amortized over the terms of the new credit facilities. The new credit facilities are available for working capital, capital expenditures, permitted acquisitions and general corporate purposes of the Company and its subsidiaries.
The Company and each domestic subsidiary of the Borrower (the “Guarantors”) have guaranteed the obligation of the Borrower under the New Credit Agreement. Borrowings, under the New Credit Agreement, are secured by substantially all assets of the Borrower and the Guarantors.
The revolving credit facility portion of our New Credit Agreement currently carries an unused fee of between 0.5% and 0.75% per annum based on our consolidated leverage ratio as of the end of each fiscal quarter, and there are no mandatory reductions in the revolving commitment under the secured revolving credit facility portion of the New Credit Agreement. Borrowings under the revolving credit facility portion of the New Credit Agreement bear interest at floating rates based upon either a LIBOR or a prime interest rate option selected by us, plus a spread of 3.00% to 4.50% and 2.00% to 3.50%, respectively, to be determined based on our current consolidated leverage ratio as of the end of each fiscal quarter during which amounts would be outstanding. As of December 31, 2009, nothing was outstanding under our revolving credit facility.
The four year, $110.0 million term loan portion of our New Credit Agreement is subject to quarterly amortization of principal (in equal installments), with an amount equal to 5% of the initial aggregate principal amount of the secured term loan facility in 2010, 10% of the initial aggregate principal amount of the secured term loan facility in 2011 and 15% of the initial aggregate principal amount of the secured term loan facility in 2012 with the remaining 70% payable in 2013. Borrowings under the secured term loan facility portion of the New Credit Agreement bear interest at floating rates based upon either a LIBOR or a prime interest rate option selected by us, plus a spread of 4.00% and 3.00%, respectively. The LIBOR interest rate option for the term loan is subject to a minimum floor of 2.25%.
We are required to make additional customary mandatory prepayments under the New Credit Agreement with the proceeds of certain asset dispositions, extraordinary receipts, debt issuances and equity issuances. We are also required to make mandatory prepayments under the New Credit Agreement within ninety days after the end of each fiscal year, commencing with the fiscal year ended December 31, 2010, in an amount equal to 75%, and beginning with the fiscal year ended December 31, 2011, 50% or 75%, to be determined based on our
34
Consolidated Leverage Ratio, of the Company’s Excess Cash Flow (as defined in the New Credit Agreement), less any voluntary prepayments of the secured term loan facility portion of the New Credit Agreement made during the fiscal year.
As of December 31, 2009, the total term loan outstanding (including both the current and long term portions), net of discount, was $105.6 million.
The New Credit Agreement contains various financial ratio covenants, including a minimum fixed charge coverage ratio and maximum leverage ratio, as well as restrictions on assumption of additional indebtedness, declaration of dividends, dispositions of assets, consolidation into another entity, capital expenditures in excess of specified amounts and allowable investments. We were in compliance with these requirements as of December 31, 2009.
Under the New Credit Agreement, our subsidiaries are not permitted to pay dividends or distributions to us, except for certain permitted dividends and distributions, including those related to taxes, certain reporting obligations under federal and state law and certain other ordinary course operating expenses, subject to the limitations contained in our New Credit Agreement.
The New Credit Agreement contains various other customary affirmation and negative covenants and the payment obligation under the New Credit Agreement may also be accelerated upon the occurrence of customary events of default.
In connection with the payoff of the old term loan debt, we settled with cash on hand our outstanding interest rate swap agreements associated with cash flows under the then existing credit facility for approximately $1.9 million, which was included in interest expense for 2009.
Contractual Obligations
The following table summarizes our contractual obligations as of December 31, 2009 (in thousands):
| Fiscal Year | |||||||||||||||||||||
| 2010 | 2011 | 2012 | 2013 | 2014 | Thereafter | Total | |||||||||||||||
| Notes payable (1) |
$ | 12,339 | $ | 17,359 | $ | 22,030 | $ | 80,038 | $ | — | $ | — | $ | 131,766 | |||||||
| Capital lease obligations (2) |
730 | 728 | 688 | 650 | 72 | — | 2,868 | ||||||||||||||
| Operating lease obligations (3) |
12,925 | 12,500 | 11,720 | 10,026 | 10,013 | 36,439 | 93,623 | ||||||||||||||
| Cash holdback (4) |
400 | 161 | — | — | — | — | 561 | ||||||||||||||
| Total contractual obligations |
$ | 26,394 | $ | 30,748 | $ | 34,438 | $ | 90,714 | $ | 10,085 | $ | 36,439 | $ | 228,818 | |||||||
| (1) | Amounts represent contractual amounts due, including interest. |
| (2) | Amounts represent contractual amounts due, including interest, with initial or remaining lease terms in excess of one year. |
| (3) | Amounts represent minimum contractual amounts, with initial or remaining lease terms in excess of one year. We have assumed no escalations in rent or changes in variable expenses other than as stipulated in lease contracts. The amounts have not been reduced by minimum sublease rents of $2.8 million expected to be recovered under the operating subleases. |
| (4) | Amounts represent the cash holdback payable in cash in connection with the MHA and Platinum Select Staffing acquisitions. |
In addition to the above disclosed contractual obligations, the uncertain income tax liability including interest and penalties was $20.0 million at December 31, 2009. Based on the uncertainties associated with the settlement of these items, we are unable to make reasonably reliable estimates of the period of potential settlements, if any, with taxing authorities.
35
Off-Balance Sheet and Other Financing Arrangements
At December 31, 2009 and 2008, we did not have any relationships with unconsolidated entities or financial partnerships, such as entities often referred to as structured finance, variable interest or special purpose, which would have been established for the purpose of facilitating off-balance-sheet arrangements or other contractually narrow or limited purposes. In addition, we do not engage in trading activities involving non-exchange traded contracts. As such, we are not materially exposed to any financing, liquidity, market or credit risk that could arise if we had engaged in such relationships. We do not have relationships or transactions with persons or entities that derive benefits from their non-independent relationship with us or our related parties.
Potential Fluctuations in Quarterly Results and Seasonality
Due to the regional and seasonal fluctuations in the hospital patient census and staffing needs of our hospital and healthcare facility and other clients and due to the seasonal preferences for destinations of our temporary healthcare professionals, revenue, earnings and the number of temporary healthcare professionals on assignment are subject to moderate seasonal fluctuations. Many of our hospital and healthcare facility clients are located in areas that experience seasonal fluctuations in population during the winter and summer months. These facilities adjust their staffing levels to accommodate the change in this seasonal demand and many of these facilities utilize temporary healthcare professionals to satisfy these seasonal staffing needs. This historical seasonality of revenue and earnings may vary due to a variety of factors and the results of any one quarter are not necessarily indicative of the results to be expected for any other quarter or for any year.
Inflation
Although inflation has remained relatively stable during the last several years, the rate of inflation in healthcare related services continues to exceed the rate experienced by the economy as a whole. Our contracts typically provide for an annual increase in the fees paid to us by our clients based on increases in various inflation indices allowing us to pass on inflation costs to our clients.
Recent Accounting Pronouncements
In July 2009, the Financial Accounting Standards Board amended guidance on revenue arrangements with multiple deliverables to require an entity to apply the relative selling price allocation method in order to estimate a selling price for all units of accounting, including delivered items, when vendor-specific objective evidence (VSOE) or acceptable third-party evidence (TPE) does not exist and expands the disclosure requirements to require an entity to provide both qualitative and quantitative information about the significant judgments made in applying the amended guidance and subsequent changes in those judgments that may significantly affect the timing or amount of revenue recognition. This guidance is effective for revenue arrangements entered into or materially modified in fiscal years beginning on or after June 15, 2010 and shall be applied on a prospective basis. Earlier application is permitted. We are currently evaluating the impact of the adoption of this guidance will have on our consolidated financial statements.
See Note 1(s) of our Notes to the accompanying consolidated financial statements for information regarding the effect of recently adopted accounting pronouncements on our financial statements.
Special Note Regarding Forward-Looking Statements
This Annual Report on Form 10-K contains “forward-looking statements” within the meaning of Section 27A of the Securities Act of 1933, as amended, and Section 21E of the Securities Exchange Act of 1934, as amended. We based these forward-looking statements on our current expectations and projections about future events. Our actual results could differ materially from those discussed in, or implied by, these forward-looking statements. Forward-looking statements are identified by words such as “believe,” “anticipate,” “expect,” “intend,” “plan,” “will,” “may” and other similar expressions. In addition, any statements that refer to
36
expectations, projections or other characterizations of future events or circumstances are forward-looking statements. The following factors could cause our actual results to differ materially from those implied by the forward-looking statements in this Annual Report:
| • | our ability to sustain our business in a continued significant economic downturn; |
| • | our ability to continue to recruit and retain qualified temporary and permanent healthcare professionals at reasonable costs; |
| • | our ability to attract and retain sales and operational personnel; |
| • | our ability to secure new and profitable orders and searches from our hospital, healthcare facility, affiliated healthcare network and physician practice group clients, which may be impacted by the role of intermediary organizations, such as vendor management companies; |
| • | our ability to mitigate credit risk in light of concentration of buyers of healthcare staffing services; |
| • | the overall level of demand for services offered by temporary and permanent healthcare provider, which may be impacted by the general level of patient occupancy and utilization of services at our hospital and healthcare facility clients’ facilities, which may be affected by adoption of alternative modes of healthcare delivery; |
| • | the ability of our hospital, healthcare facility and physician practice group clients to retain and increase the productivity of their permanent staff; |
| • | our ability to successfully design our strategic growth, acquisition and integration strategies and to implement those strategies, which includes our ability to obtain credit at reasonable terms to complete acquisitions, integrate acquired companies’ accounting, management information, human resource and other administrative systems, and implement or remediate controls, procedures and policies at acquired companies; |
| • | our ability to leverage our cost structure; |
| • | access to and undisrupted performance of our management information and communication systems, including use of the Internet, and our candidate and client databases and payroll and billing software systems; |
| • | our ability to keep our web sites operational at a reasonable cost and without service interruptions; |
| • | the effect of existing or future government legislation and regulation, including proposed legislation impacting the current delivery and third party payor system for healthcare; |
| • | our ability to grow and operate our business in compliance with legislation and regulations, including regulations that may affect our clients and, in turn, affect demand for our services, such as Medicare reimbursement rates which may negatively affect both orders and client receivables; |
| • | the challenge to the classification of certain of our healthcare professionals as independent contractors; |
| • | the impact of medical malpractice and other claims asserted against us; |
37
| • | the disruption or adverse impact to our business as a result of a terrorist attack or breach of security of our data systems; |
| • | our ability to carry out our business strategy and maintain sufficient cash flow and capital structure to support our business; |
| • | our ability to meet our financial covenants, which if not met, could adversely affect our liquidity; |
| • | the loss of key officers and management personnel that could adversely affect our ability to remain competitive; |
| • | the effect of recognition by us of an impairment to goodwill; and |
| • | the effect of adjustments by us to accruals for self-insured retentions. |
Other factors that could cause actual results to differ from those implied by the forward-looking statements in this Annual Report on Form 10-K are more fully described in the “Risk Factors” section and elsewhere in this Annual Report on Form 10-K. We undertake no obligation to update the forward-looking statements in this filing.
38
| Item 7A. | Quantitative and Qualitative Disclosures about Market Risk |
Market risk is the risk of loss arising from adverse changes in market rates and prices, such as interest rates, foreign currency exchange rates and commodity prices.
During 2009 and 2008, our primary exposure to market risk was interest rate risk associated with our debt instruments. See “Item 7. Management’s Discussion and Analysis—Liquidity and Capital Resources—Financing Activities” for further description of our debt instruments. A 1% change in interest rates on our variable rate debt would have resulted in interest expense fluctuating by approximately $1.0 million in 2009 and $1.5 million in 2008.
Our international operations create exposure to foreign currency exchange rate risks. We believe that our foreign currency risk is immaterial.
39
| Item 8. | Financial Statements and Supplementary Data |
INDEX TO CONSOLIDATED FINANCIAL STATEMENTS
40
Report of Independent Registered Public Accounting Firm
The Board of Directors and Stockholders
AMN Healthcare Services, Inc.:
We have audited the accompanying consolidated balance sheets of AMN Healthcare Services, Inc. and subsidiaries (the Company) as of December 31, 2009 and 2008, and the related consolidated statements of operations, stockholders’ equity and comprehensive income (loss), and cash flows for each of the years in the three-year period ended December 31, 2009. In connection with our audits of the consolidated financial statements, we have also audited the financial statement schedule of valuation and qualifying accounts. These consolidated financial statements and financial statement schedule are the responsibility of the Company’s management. Our responsibility is to express an opinion on these consolidated financial statements and financial statement schedule based on our audits.
We conducted our audits in accordance with the standards of the Public Company Accounting Oversight Board (United States). Those standards require that we plan and perform the audit to obtain reasonable assurance about whether the financial statements are free of material misstatement. An audit includes examining, on a test basis, evidence supporting the amounts and disclosures in the financial statements. An audit also includes assessing the accounting principles used and significant estimates made by management, as well as evaluating the overall financial statement presentation. We believe that our audits provide a reasonable basis for our opinion.
In our opinion, the consolidated financial statements referred to above present fairly, in all material respects, the financial position of AMN Healthcare Services, Inc. and subsidiaries as of December 31, 2009 and 2008, and the results of their operations and their cash flows for each of the years in the three-year period ended December 31, 2009, in conformity with U.S. generally accepted accounting principles. Also in our opinion, the related financial statement schedule of valuation and qualifying accounts, when considered in relation to the basic consolidated financial statements taken as a whole, presents fairly, in all material respects, the information set forth therein.
We also have audited, in accordance with the standards of the Public Company Accounting Oversight Board (United States), the Company’s internal control over financial reporting as of December 31, 2009, based on criteria established in Internal Control—Integrated Framework issued by the Committee of Sponsoring Organizations of the Treadway Commission (COSO), and our report dated March 5, 2010 expressed an unqualified opinion on the effectiveness of the Company’s internal control over financial reporting.
/s/ KPMG LLP
San Diego, California
March 5, 2010
41
CONSOLIDATED BALANCE SHEETS
(in thousands, except par value)
| December 31, 2009 |
December 31, 2008 |
|||||||
| ASSETS | ||||||||
| Current assets: |
||||||||
| Cash and cash equivalents |
$ | 27,053 | $ | 11,316 | ||||
| Accounts receivable, net of allowances of $5,309 and $4,542 at December 31, 2009 and 2008, respectively |
89,498 | 182,562 | ||||||
| Prepaid expenses |
6,550 | 9,523 | ||||||
| Income taxes receivable |
3,900 | 3,440 | ||||||
| Deferred income taxes, net |
8,534 | 18,085 | ||||||
| Other current assets |
1,902 | 4,901 | ||||||
| Total current assets |
137,437 | 229,827 | ||||||
| Restricted cash and cash equivalents |
22,025 | — | ||||||
| Fixed assets, net |
19,970 | 24,018 | ||||||
| Deposits and other assets |
14,368 | 13,252 | ||||||
| Goodwill |
79,868 | 252,875 | ||||||
| Intangible assets, net |
115,336 | 122,845 | ||||||
| Total assets |
$ | 389,004 | $ | 642,817 | ||||
| LIABILITIES AND STOCKHOLDERS’ EQUITY | ||||||||
| Current liabilities: |
||||||||
| Bank overdraft |
$ | — | $ | 3,995 | ||||
| Accounts payable and accrued expenses |
18,057 | 24,420 | ||||||
| Accrued compensation and benefits |
24,054 | 44,871 | ||||||
| Revolving credit facility |
— | 31,500 | ||||||
| Current portion of notes payable |
5,500 | 14,580 | ||||||
| Deferred revenue |
5,084 | 7,184 | ||||||
| Other current liabilities |
10,404 | 14,722 | ||||||
| Total current liabilities |
63,099 | 141,272 | ||||||
| Notes payable, less current portion and discount |
100,121 | 100,236 | ||||||
| Deferred income taxes, net |
789 | 58,466 | ||||||
| Other long-term liabilities |
54,151 | 58,710 | ||||||
| Total liabilities |
218,160 | 358,684 | ||||||
| Commitments and contingencies (Notes 1 and 11) |
||||||||
| Stockholders’ equity: |
||||||||
| Preferred stock, $0.01 par value; 10,000 shares authorized; none outstanding at December 31, 2009 and December 31, 2008 |
— | — | ||||||
| Common stock, $0.01 par value; 200,000 shares authorized; 45,801 and 45,746 shares issued at December 31, 2009 and 2008, respectively |
458 | 457 | ||||||
| Additional paid-in capital |
417,693 | 410,425 | ||||||
| Treasury stock, at cost (13,170 shares at each December 31, 2009 and 2008) |
(230,138 | ) | (230,138 | ) | ||||
| Retained earnings (accumulated deficit) |
(16,712 | ) | 105,465 | |||||
| Accumulated other comprehensive loss |
(457 | ) | (2,076 | ) | ||||
| Total stockholders’ equity |
170,844 | 284,133 | ||||||
| Total liabilities and stockholders’ equity |
$ | 389,004 | $ | 642,817 | ||||
See accompanying notes to consolidated financial statements.
42
CONSOLIDATED STATEMENTS OF OPERATIONS
(in thousands, except per share amounts)
| Years Ended December 31, | ||||||||||
| 2009 | 2008 | 2007 | ||||||||
| Revenue |
$ | 759,790 | $ | 1,217,200 | $ | 1,164,022 | ||||
| Cost of revenue |
555,369 | 900,211 | 860,857 | |||||||
| Gross profit |
204,421 | 316,989 | 303,165 | |||||||
| Operating expenses: |
||||||||||
| Selling, general and administrative |
157,241 | 230,656 | 218,250 | |||||||
| Depreciation and amortization |
13,812 | 14,439 | 11,674 | |||||||
| Restructuring charges |
11,270 | — | — | |||||||
| Impairment charges |
175,707 | — | — | |||||||
| Total operating expenses |
358,030 | 245,095 | 229,924 | |||||||
| Income (loss) from operations |
(153,609 | ) | 71,894 | 73,241 | ||||||
| Interest expense, net |
11,955 | 10,690 | 12,457 | |||||||
| Income (loss) before income taxes |
(165,564 | ) | 61,204 | 60,784 | ||||||
| Income tax expense (benefit) |
(43,387 | ) | 26,847 | 24,403 | ||||||
| Net income (loss) |
$ | (122,177 | ) | $ | 34,357 | $ | 36,381 | |||
| Net income (loss) per common share: |
||||||||||
| Basic |
$ | (3.75 | ) | $ | 1.03 | $ | 1.06 | |||
| Diluted |
$ | (3.75 | ) | $ | 1.02 | $ | 1.04 | |||
| Weighted average common shares outstanding: |
||||||||||
| Basic |
32,615 | 33,375 | 34,377 | |||||||
| Diluted |
32,615 | 33,811 | 34,880 | |||||||
See accompanying notes to consolidated financial statements.
43
CONSOLIDATED STATEMENTS OF STOCKHOLDERS’ EQUITY AND
COMPREHENSIVE INCOME (LOSS)
Years Ended December 31, 2009, 2008 and 2007
(in thousands)
| Common Stock | Additional Paid-in Capital |
Treasury Stock | Retained Earnings (Accumulated Deficit) |
Accumulated Other Comprehensive Income (Loss) |
Total | ||||||||||||||||||||||
| Shares | Amount | Shares | Amount | ||||||||||||||||||||||||
| Balance, December 31, 2006 |
45,199 | $ | 452 | $ | 382,098 | 10,615 | $ | (183,182 | ) | $ | 35,259 | $ | 142 | $ | 234,769 | ||||||||||||
| Repurchase of common stock into treasury |
— | — | — | 1,000 | (18,510 | ) | — | — | (18,510 | ) | |||||||||||||||||
| Stock options and stock appreciation rights (SARs) exercised and restricted stock units (RSUs) vested and issued |
247 | 2 | 2,222 | — | — | — | — | 2,224 | |||||||||||||||||||
| Income tax benefit from stock options and SARs exercised and RSUs vested |
— | — | 4,525 | — | — | — | — | 4,525 | |||||||||||||||||||
| Stock-based compensation |
— | — | 8,392 | — | — | — | — | 8,392 | |||||||||||||||||||
| Adoption of Financial Accounting Standards Board Interpretation No. 48 |
— | — | — | — | — | (532 | ) | — | (532 | ) | |||||||||||||||||
| Comprehensive income (loss): |
|||||||||||||||||||||||||||
| Foreign currency translation adjustment |
— | — | — | — | — | — | (11 | ) | (11 | ) | |||||||||||||||||
| Unrealized loss on derivative financial instruments, net of tax |
— | — | — | — | — | — | (1,038 | ) | (1,038 | ) | |||||||||||||||||
| Net income |
— | — | — | — | — | 36,381 | — | 36,381 | |||||||||||||||||||
| Total comprehensive income |
35,332 | ||||||||||||||||||||||||||
| Balance, December 31, 2007 |
45,446 | $ | 454 | $ | 397,237 | 11,615 | $ | (201,692 | ) | $ | 71,108 | $ | (907 | ) | $ | 266,200 | |||||||||||
| Repurchase of common stock into treasury |
— | — | — | 1,555 | (28,446 | ) | — | — | (28,446 | ) | |||||||||||||||||
| Stock options and SARs exercised and RSUs vested |
300 | 3 | 3,991 | — | — | — | — | 3,994 | |||||||||||||||||||
| Income tax shortfall from stock options and SARs exercised and RSUs vested |
— | — | (125 | ) | — | — | — | — | (125 | ) | |||||||||||||||||
| Stock-based compensation |
— | — | 9,322 | — | — | — | — | 9,322 | |||||||||||||||||||
| Comprehensive income (loss): |
|||||||||||||||||||||||||||
| Foreign currency translation adjustment |
— | — | — | — | — | — | (292 | ) | (292 | ) | |||||||||||||||||
| Unrealized loss on derivative financial instruments, net of tax |
— | — | — | — | — | — | (877 | ) | (877 | ) | |||||||||||||||||
| Net income |
— | — | — | — | — | 34,357 | — | 34,357 | |||||||||||||||||||
| Total comprehensive income |
33,188 | ||||||||||||||||||||||||||
| Balance, December 31, 2008 |
45,746 | $ | 457 | $ | 410,425 | 13,170 | $ | (230,138 | ) | $ | 105,465 | $ | (2,076 | ) | $ | 284,133 | |||||||||||
| Stock options and SARs exercised and RSUs vested |
55 | 1 | (157 | ) | — | — | — | — | (156 | ) | |||||||||||||||||
| Income tax shortfall from stock options and SARs exercised and RSUs vested |
— | — | (1,284 | ) | — | — | — | — | (1,284 | ) | |||||||||||||||||
| Stock-based compensation |
— | — | 8,709 | — | — | — | — | 8,709 | |||||||||||||||||||
| Comprehensive income (loss): |
|||||||||||||||||||||||||||
| Foreign currency translation adjustment |
— | — | — | — | — | — | 60 | 60 | |||||||||||||||||||
| Settlement of derivative financial instruments, net of tax |
— | — | — | — | — | — | 1,559 | 1,559 | |||||||||||||||||||
| Net loss |
— | — | — | — | — | (122,177 | ) | — | (122,177 | ) | |||||||||||||||||
| Total comprehensive loss |
(120,558 | ) | |||||||||||||||||||||||||
| Balance, December 31, 2009 |
45,801 | $ | 458 | $ | 417,693 | 13,170 | $ | (230,138 | ) | $ | (16,712 | ) | $ | (457 | ) | $ | 170,844 | ||||||||||
See accompanying notes to consolidated financial statements.
44
CONSOLIDATED STATEMENTS OF CASH FLOWS
(in thousands)
| Years Ended December 31, | ||||||||||||
| 2009 | 2008 | 2007 | ||||||||||
| Cash flows from operating activities: |
||||||||||||
| Net income (loss) |
$ | (122,177 | ) | $ | 34,357 | $ | 36,381 | |||||
| Adjustments to reconcile net income (loss) to net cash provided by operating activities: |
||||||||||||
| Depreciation and amortization |
13,812 | 14,439 | 11,674 | |||||||||
| Non-cash interest expense |
4,583 | 1,614 | 1,618 | |||||||||
| Increase in allowances for doubtful accounts and sales credits |
4,334 | 6,404 | 4,002 | |||||||||
| Provision for deferred income taxes |
(51,721 | ) | (3,370 | ) | 1,291 | |||||||
| Stock-based compensation |
8,709 | 9,322 | 8,392 | |||||||||
| Excess tax benefit from stock options and SARs exercised and RSUs vested |
— | (79 | ) | (3,285 | ) | |||||||
| Impairment charges |
175,707 | — | — | |||||||||
| Loss on disposal or sale of fixed assets |
979 | 227 | 107 | |||||||||
| Changes in assets and liabilities, net of effects from acquisition: |
||||||||||||
| Accounts receivable |
88,730 | 4,002 | 5,223 | |||||||||
| Income taxes receivable |
(460 | ) | (3,440 | ) | — | |||||||
| Prepaid expenses and other current assets |
5,972 | (2,579 | ) | 570 | ||||||||
| Deposits and other assets |
971 | (2,688 | ) | (2,525 | ) | |||||||
| Accounts payable and accrued expenses |
(6,363 | ) | 1,941 | 1,722 | ||||||||
| Accrued compensation and benefits |
(20,817 | ) | 758 | 437 | ||||||||
| Income taxes payable |
— | (1,653 | ) | 7,410 | ||||||||
| Other liabilities |
(3,527 | ) | 4,439 | 6,619 | ||||||||
| Net cash provided by operating activities |
98,732 | 63,694 | 79,636 | |||||||||
| Cash flows from investing activities: |
||||||||||||
| Purchase and development of fixed assets |
(3,789 | ) | (8,755 | ) | (9,151 | ) | ||||||
| Purchase of intangible assets |
— | (40 | ) | — | ||||||||
| Change in restricted cash and cash equivalents balance |
(22,025 | ) | — | — | ||||||||
| Cash payment for holdback liability for prior year acquisitions |
(3,431 | ) | (8,500 | ) | — | |||||||
| Cash paid for acquisitions, net of cash received |
— | (30,952 | ) | (5,478 | ) | |||||||
| Net cash used in investing activities |
(29,245 | ) | (48,247 | ) | (14,629 | ) | ||||||
| Cash flows from financing activities: |
||||||||||||
| Capital lease repayments |
(889 | ) | (667 | ) | (631 | ) | ||||||
| Proceeds from revolving credit facility |
— | 66,500 | — | |||||||||
| Payments on revolving credit facility |
(31,500 | ) | (35,000 | ) | — | |||||||
| Payment of financing costs |
(6,199 | ) | (618 | ) | — | |||||||
| Payment of notes payable discount |
(4,400 | ) | — | — | ||||||||
| Proceeds from notes payable |
110,000 | — | — | |||||||||
| Payments on notes payable |
(114,816 | ) | (32,152 | ) | (26,843 | ) | ||||||
| Payments on termination of derivative contracts |
(1,855 | ) | — | — | ||||||||
| Repurchase of common stock |
— | (28,446 | ) | (18,510 | ) | |||||||
| Proceeds from exercise of equity awards |
12 | 3,994 | 2,224 | |||||||||
| Payments of employee tax withholdings from equity transactions |
(168 | ) | — | — | ||||||||
| Excess tax benefit from stock options and SARs exercised and RSUs vested |
— | 79 | 3,285 | |||||||||
| Change in bank overdraft, net of overdraft acquired |
(3,995 | ) | 3,976 | (10,448 | ) | |||||||
| Net cash used in financing activities |
(53,810 | ) | (22,334 | ) | (50,923 | ) | ||||||
| Effect of exchange rate changes on cash |
60 | (292 | ) | (11 | ) | |||||||
| Net increase (decrease) in cash and cash equivalents |
15,737 | (7,179 | ) | 14,073 | ||||||||
| Cash and cash equivalents at beginning of year |
11,316 | 18,495 | 4,422 | |||||||||
| Cash and cash equivalents at end of year |
$ | 27,053 | $ | 11,316 | $ | 18,495 | ||||||
| Supplemental disclosures of cash flow information: |
||||||||||||
| Cash paid for interest (net of $29, $70 and $245 capitalized in 2009, 2008 and 2007, respectively) |
$ | 7,387 | $ | 9,600 | $ | 11,825 | ||||||
| Cash paid for income taxes |
$ | 5,609 | $ | 32,947 | $ | 14,132 | ||||||
| Supplemental disclosures of noncash investing and financing activities: |
||||||||||||
| Fixed assets acquired through capital leases |
$ | 2,145 | $ | 243 | $ | 318 | ||||||
| Fair value of assets acquired in acquisitions, net of cash received |
$ | — | $ | 8,778 | $ | 1,493 | ||||||
| Goodwill |
— | 11,557 | 2,254 | |||||||||
| Intangible assets |
— | 13,960 | 4,909 | |||||||||
| Liabilities assumed |
— | (1,007 | ) | (1,421 | ) | |||||||
| Holdback provision |
— | (2,336 | ) | — | ||||||||
| Deferred tax liability |
— | — | (1,757 | ) | ||||||||
| Net cash paid for acquisitions |
$ | — | $ | 30,952 | $ | 5,478 | ||||||
See accompanying notes to consolidated financial statements.
45
NOTES TO CONSOLIDATED FINANCIAL STATEMENTS
December 31, 2009, 2008 and 2007
(in thousands, except per share amounts)
(1) Summary of Significant Accounting Policies
(a) General
AMN Healthcare Services, Inc. was incorporated in Delaware on November 10, 1997. AMN Healthcare Services, Inc. and its subsidiaries recruit and place physicians, nurses and allied health professionals on a temporary or permanent basis at acute-care hospitals and other healthcare facilities throughout the United States. AMN Healthcare Services, Inc. and its subsidiaries collectively are herein referred to as “the Company”.
(b) Principles of Consolidation
The accompanying consolidated financial statements include the accounts of AMN Healthcare Services, Inc. and its wholly-owned subsidiaries. All significant intercompany balances and transactions have been eliminated in consolidation.
(c) Cash and Cash Equivalents
The Company considers all highly liquid investments with an original maturity of three months or less to be cash equivalents. Cash and cash equivalents include currency on hand, deposits with financial institutions and highly liquid investments.
(d) Restricted Cash and Cash Equivalents
Restricted cash and cash equivalents primarily represent the cash on deposit with financial institutions which serve as collateral for the Company’s outstanding letters of credit. On December 23, 2009, the Company refinanced its credit facility. The Company has cash collateralized its outstanding letters of credit using proceeds from its new credit facility. See Note (3), “Fair Value Measurement” and Note (7), “Notes Payable and Related Derivative Instruments and Credit Agreement” for additional information.
(e) Fixed Assets
Furniture, equipment, leasehold improvements and internal-use software are recorded at cost less accumulated amortization and depreciation. Equipment acquired under capital leases is recorded at the present value of the future minimum lease payments. Major additions and improvements are capitalized and maintenance and repairs are expensed when incurred. Depreciation on furniture, equipment and software is calculated using the straight-line method based on the estimated useful lives of the related assets (generally three to five years). Leasehold improvements and equipment obtained under capital leases are amortized over the shorter of the term of the lease or their estimated useful life. Amortization of equipment obtained under capital leases is included with depreciation expense in the accompanying consolidated financial statements.
Costs incurred to develop internal-use software during the application development stage are capitalized and recorded at cost. Application development stage costs generally include costs associated with internal-use software configuration, coding, installation and testing. Costs of significant upgrades and enhancements that result in additional functionality also are capitalized, whereas costs incurred for maintenance and minor upgrades and enhancements are expensed as incurred. Capitalized costs are amortized using the straight-line method over three to five years once the software is ready for its intended use.
46
AMN HEALTHCARE SERVICES, INC.
NOTES TO CONSOLIDATED FINANCIAL STATEMENTS – (Continued)
The Company reviews long-lived assets for impairment annually and whenever events or changes in circumstances indicate that the carrying amount of an asset may not be recoverable. Recoverability of assets to be held and used is measured by a comparison of the carrying amount of an asset to the future undiscounted net cash flows that are expected to be generated by the asset. If such assets are considered to be impaired, the impairment to be recognized is measured by the amount by which the carrying amount of the assets exceeds the fair value of the assets. Assets to be disposed of are reported at the lower of the carrying amount or fair value less costs to sell. Due to the economic downturn, the Company performed impairment testing on its long-lived assets and determined that there was no impairment at either December 31, 2008 or December 31, 2009.
(f) Goodwill
The excess of purchase price and related costs over the fair value of net assets of entities acquired is recorded as goodwill. The Company evaluates goodwill annually for impairment at the reporting unit level and whenever circumstances occur indicating that goodwill might be impaired. The performance of the test involves a two-step process. The first step of the impairment test involves comparing the fair value of the Company’s reporting units with the reporting unit’s carrying amount, including goodwill. The Company generally determines the fair value of its reporting units using a combination of the income approach (using discounted future cash flows) and the market valuation approach. If the carrying amount of the Company’s reporting units exceeds the reporting unit’s fair value, the Company performs the second step of the goodwill impairment test to determine the amount of impairment loss. The second step of the goodwill impairment test involves comparing the implied fair value of the Company’s reporting unit’s goodwill with the carrying amount of that goodwill. The Company performed the annual impairment test at October 31, 2008 and determined there was no impairment of goodwill. Due to the continued economic downturn and its lower market capitalization, the Company performed interim impairment testing at its reporting unit level during the first quarter of 2009 and completed the valuation during the second quarter of 2009. As a result, the Company recognized a pre-tax goodwill impairment charge of $173,007 in 2009. See Note (4), “Goodwill and Identifiable Intangible Assets” for additional information. The Company also performed its annual impairment test at October 31, 2009 and determined there was no further impairment of goodwill. No events have occurred subsequent to October 31, 2009 that indicate impairment may have occurred.
(g) Intangible Assets
Intangible assets consist of identifiable intangible assets acquired through the Company’s acquisition of The MHA Group, Inc. (“MHA”) in November 2005, Lifework, Inc. and its wholly-owned subsidiaries (“Rx Pro Health”) in May 2007 and Platinum Select Staffing in February 2008, and other noncompete covenants from previous acquisitions. Identifiable intangible assets acquired through these acquisitions include tradenames and trademarks, customer relationships, noncompete agreements, staffing databases, acquired technology and online courses. Amortizable intangible assets, which do not include tradenames and trademarks with an indefinite life, are amortized using the straight-line method over their useful lives. Noncompete covenants are amortized using the straight-line method over the life of the related agreements. Intangible assets with estimable useful lives are reviewed for impairment whenever events or changes in circumstances indicate that the carrying amount may not be recoverable. Due to the economic downturn, the Company had performed impairment testing on its amortizable intangible assets and determined that there was no impairment at either December 31, 2008 or December 31, 2009.
Indefinite lived tradenames and trademarks are not amortized and are instead reviewed for impairment annually. This review includes comparing the fair value of the Company’s indefinite lived intangibles with their carrying amount. If the carrying amount exceeds the fair value, the Company records the excess as an impairment loss. The Company performed the annual impairment test at October 31, 2008 and determined there
47
AMN HEALTHCARE SERVICES, INC.
NOTES TO CONSOLIDATED FINANCIAL STATEMENTS – (Continued)
was no impairment. Due to the continued economic downturn and its lower market capitalization, the Company performed interim impairment testing at its reporting unit level during the first quarter of 2009 and recorded a pre-tax impairment charge of $2,700 related to an indefinite-lived intangible asset in its nurse and allied healthcare staffing segment as of March 31, 2009. This charge was also included in impairment charges on the consolidated statement of operations for 2009. The Company performed its annual impairment testing at October 31, 2009 and determined there was no further impairment of its indefinite lived tradenames and trademarks. No events have occurred subsequent to October 31, 2009 that indicate impairment may have occurred.
(h) Insurance Reserves
The Company maintains an accrual for professional liability self-insured retention limits, which is included in accounts payable and accrued expenses and other long term liabilities in the consolidated balance sheets. The Company determines the adequacy of this undiscounted accrual by evaluating its historical experience and trends, loss reserves established by the Company’s insurance carriers, management and third-party administrators, as well as through the use of independent actuarial studies. The Company obtains actuarial studies on a semi-annual basis that use the Company’s actual claims data and industry data to determine the appropriate reserves for incurred, but not reported, professional liability claims for each year. For the nurse and allied healthcare staffing segment, reserves for reported claims are based upon loss reserves established by management and the Company’s third party administrators. For the locum tenens staffing segment, reserves for reported claims are based upon the actuarial studies of historical claims data and industry data.
The Company maintains an accrual for workers compensation self-insured retention limits, which is included in accrued compensation and benefits and other long term liabilities in the consolidated balance sheets. The Company determines the adequacy of this undiscounted accrual by evaluating its historical experience and trends, loss reserves established by the Company’s insurance carriers and third party administrators, as well as through the use of independent actuarial studies. The Company obtains actuarial studies on a semi-annual basis that use the Company’s payroll and actual claims data, as well as industry data, to determine the appropriate reserve both for reported claims and incurred, but not reported, claims for each policy year. The actuarial study for workers compensation provides the Company with the estimated losses for prior policy years and an estimated percentage of payroll compensation to be accrued for the current year. The Company records its accruals based on the amounts provided in the actuarial study.
The Company maintains an accrual for self-insured health benefits provided to the Company’s nurse and allied healthcare professionals and corporate employees, which is included in accrued compensation and benefits in the consolidated balance sheets. The Company determines the adequacy of this undiscounted accrual by evaluating its historical experience and trends related to both health insurance claims and payments, information provided by its insurance broker and third party administrator, as well as industry experience and trends.
(i) Accounts Receivable
The Company records accounts receivable at the invoiced amount and accounts receivable are non-interest bearing. The Company maintains an allowance for doubtful accounts for estimated credit losses resulting from collection risks, including the inability of customers to make required payments under contractual agreements. The allowance for doubtful accounts is reported as a reduction of accounts receivable in the consolidated balance sheets. The adequacy of this allowance is determined by evaluating historical delinquency and write-off trends, the financial condition and credit risk and history of each customer, historical payment trends as well as current economic conditions and the impact of such conditions on the customers’ liquidity and overall financial condition. The Company also maintains a sales allowance to reserve for potential credits issued to customers. The amount of the reserve is determined based on historical credits issued.
48
AMN HEALTHCARE SERVICES, INC.
NOTES TO CONSOLIDATED FINANCIAL STATEMENTS – (Continued)
(j) Concentration of Credit Risk
The majority of the Company’s business activity is with hospitals located throughout the United States. Credit is extended based on the evaluation of each entity’s financial condition, and collateral is generally not required. Credit losses have been within management’s expectations. No single client healthcare system exceeded 10% of revenue for the years ended December 31, 2009, 2008 and 2007.
The Company’s cash and cash equivalents and restricted cash and cash equivalents accounts are also financial instruments that are exposed to concentration of credit risk. The Company places its cash balances with high-credit quality and federally insured institutions. Cash balances may be invested in a non-federally insured money market account. As of December 31, 2009 and 2008, there were $2,020 and $20, respectively, of cash and cash equivalent balances invested in a non-federally insured money market account. As of December 31, 2009, there was $22,025 of restricted cash and cash equivalents primarily invested in a non-federally insured U.S. Treasury security account. The Company did not have restricted cash and cash equivalents at December 31, 2008.
(k) Revenue Recognition
Revenue consists of fees earned from the permanent and temporary placement of healthcare professionals. Revenue is recognized when earned and realizable and therefore when the following criteria have been met: (a) persuasive evidence of an arrangement exists; (b) services have been rendered; (c) the fee is fixed or determinable; and (d) collectibility is reasonably assured. For temporary placements, revenue is recognized in the period in which services are provided based on hours worked by the temporary healthcare professionals. For retained permanent placements, revenue is recognized over the estimated maximum service period on a straight-line basis. For contingent permanent placement fees, revenue is recognized once the contingency is resolved. Billings in excess of immediately recognizable revenue are recorded as deferred revenue in the accompanying consolidated balance sheets.
(l) Advertising Expenses
Advertising costs are expensed as incurred. Advertising expenses were $3,583, $7,984 and $8,840 for the years ended December 31, 2009, 2008 and 2007, respectively.
(m) Income Taxes
The Company records income taxes using the asset and liability method. Deferred tax assets and liabilities are recognized for the future tax consequences attributable to differences between the financial statement carrying amounts of existing assets and liabilities and their respective tax basis. Deferred tax assets and liabilities are measured using enacted tax rates expected to apply to taxable income in the years in which those temporary differences are expected to be recovered or settled. The effect on deferred tax assets and liabilities of a change in tax rates is recognized in the period the changes are enacted. If it is more likely than not that some portion or all of a deferred tax asset will not be realized, a valuation allowance is recognized. As of January 1, 2007, the Company recognizes the effect of income tax positions only if those positions are more likely than not of being sustained. Recognized income tax positions are measured at the largest amount that is greater than 50% likely of being realized. Changes in recognition or measurement are reflected in the period in which the change in judgment occurs. Prior to January 1, 2007, the Company recognized the effect of income tax positions only if such positions were probable of being sustained.
The Company records interest and penalties related to unrecognized tax positions in income tax expense.
49
AMN HEALTHCARE SERVICES, INC.
NOTES TO CONSOLIDATED FINANCIAL STATEMENTS – (Continued)
(n) Fair Value of Financial Instruments
The carrying amounts of cash and cash equivalents, accounts receivable, income tax receivable, restricted cash and cash equivalents, bank overdraft, accounts payable and accrued expenses, accrued compensation and benefits and other current liabilities approximate their respective fair values due to the short-term nature and liquidity of these financial instruments. On December 23, 2009, the Company entered into a new credit agreement. The carrying amount of notes payable (both current and long-term portions) approximates to fair value as the instrument’s interest rates are comparable to rates currently offered for similar debt instruments of comparable maturity. See Note (7), “Notes Payable and Related Derivative Instruments and Credit Agreement” for additional information. The fair value of the long-term portion of the Company’s self insurance accruals cannot be estimated as the Company cannot reasonably determine the timing of future payments.
(o) Fair Value Measurement
On January 1, 2008, the Company adopted the authoritative guidance for fair value measurements of financial assets and financial liabilities and for fair value measurements of nonfinancial items that are recognized or disclosed at fair value in the financial statements on a recurring basis. The guidance defines fair value as the price that would be received to sell an asset or paid to transfer a liability in an orderly transaction between market participants at the measurement date. It also establishes a framework for measuring fair value and expands disclosures about fair value measurements.
On January 1, 2009, the Company adopted the authoritative guidance for fair value measurements of nonfinancial assets and nonfinancial liabilities that are recognized or disclosed at fair value in the financial statements on a nonrecurring basis.
See Note (3), “Fair Value Measurement” for additional information.
(p) Stock-Based Compensation
The Company accounts for its share-based employee compensation plans by expensing the estimated fair value of share-based awards over the requisite employee service period, which is the vesting period. The measurement of stock-based compensation expense is based on several criteria including, but not limited to, the valuation model used and associated input factors such as expected term of the award, stock price volatility, dividend rate, risk free interest rate, and award forfeiture rate. The input factors to use in the valuation model are based on subjective future expectations combined with management judgment. The Company estimates the fair value of stock options and stock appreciation rights granted using the Black-Scholes valuation model and the assumptions shown in Note 10(b). The Company uses historical data to estimate pre-vesting equity award forfeitures and records stock-based compensation expense only for those awards that are expected to vest. The Company estimates the expected term based on historical exercise patterns, and bases the dividend yield assumption on historical dividend payouts, which are zero. The risk-free interest rate assumption is based on observed interest rates appropriate for the expected term of the Company’s equity awards. After consideration of both its implied volatility and historical volatility, the Company determined its historical volatility to be the most accurate estimate of future volatility due to the fact that the Company has very limited trading in options and has historical volatility data for a period that covers the expected term of the equity award, and therefore utilizes this measure. The excess tax benefits recognized in equity related to equity award exercises are reflected as financing cash inflows.
50
AMN HEALTHCARE SERVICES, INC.
NOTES TO CONSOLIDATED FINANCIAL STATEMENTS – (Continued)
(q) Net Income (loss) per Common Share
Basic net income (loss) per common share is calculated by dividing net income (loss) by the weighted average number of common shares outstanding during the reporting period. Diluted net income per common share reflects the effects of potentially dilutive common stock-based equity instruments.
All of the 3,415 shares of outstanding equity awards as of December 31, 2009 were anti-dilutive due to the net loss in 2009. Options to purchase 1,809 and 839 shares of common stock in 2008 and 2007, respectively, were not included in the calculations of diluted net income per common share because the effect of these instruments was anti-dilutive.
The following table sets forth the computation of basic and diluted net income (loss) per common share for the years ended December 31, 2009, 2008 and 2007, respectively:
| Years Ended December 31, | ||||||||||
| 2009 | 2008 | 2007 | ||||||||
| Net income (loss) |
$ | (122,177 | ) | $ | 34,357 | $ | 36,381 | |||
| Net income (loss) per common share—basic |
$ | (3.75 | ) | $ | 1.03 | $ | 1.06 | |||
| Net income (loss) per common share—diluted |
$ | (3.75 | ) | $ | 1.02 | $ | 1.04 | |||
| Weighted average common shares outstanding—basic |
32,615 | 33,375 | 34,377 | |||||||
| Plus dilutive equity awards |
— | 436 | 503 | |||||||
| Weighted average common shares outstanding—diluted |
32,615 | 33,811 | 34,880 | |||||||
(r) Derivative Instruments
Derivative instruments are required to be recorded on the balance sheet at fair value. Gains or losses resulting from changes in the values of those derivatives depend upon accounting for whether they qualify for hedge accounting. Historically, the Company had used derivative instruments to manage the fluctuations in cash flows resulting from interest rate risk on variable-rate debt financing. On December 23, 2009, the Company entered into a new credit agreement, and in connection with the payoff of the old term loan debt, the Company settled its outstanding interest rate swaps associated with cash flows under the then existing credit facility for $1,855, which was included in interest expense for 2009.
At December 31, 2008, the interest rate swap agreements had a fair value of $(2,506), which was included in other long-term liabilities in the accompanying consolidated balance sheets.
(s) Recently Adopted Accounting Pronouncements
In June 2009, the Financial Accounting Standards Board (“FASB”) issued authoritative guidance for the FASB Accounting Standards Codification™ (“FASB ASC”) and the hierarchy of generally accepted accounting principles. This guidance establishes FASB ASC as the single source of authoritative U.S. generally accepted accounting principles (“U.S. GAAP”) recognized by the FASB to be applied by nongovernmental entities. Rules and interpretive releases of the SEC under authority of federal securities laws are also sources of authoritative U.S. GAAP for SEC registrants. This guidance and the FASB ASC were effective for financial statements issued for interim and annual periods ending after September 15, 2009. When effective, the FASB ASC superseded all existing non-SEC accounting and reporting standards. All other nongrandfathered non-SEC accounting literature not included in the FASB ASC became nonauthoritative. Following this guidance, the FASB will not issue new
51
AMN HEALTHCARE SERVICES, INC.
NOTES TO CONSOLIDATED FINANCIAL STATEMENTS – (Continued)
standards in the form of Statements, FASB Staff Positions, or Emerging Issues Task Force Abstracts. Instead, the FASB will issue Accounting Standards Updates, which will serve only to: (a) update the FASB ASC; (b) provide background information about the guidance; and (c) provide the bases for conclusions on the change(s) in the FASB ASC. The Company adopted the FASB ASC during the third quarter of 2009, and the adoption did not have an impact on its consolidated financial condition and results of operations.
In September 2006, the FASB issued authoritative guidance for fair value measurement, which defines fair value, establishes a framework for measuring fair value using U.S. GAAP, and expands disclosures related to fair value measurements. In February 2008, the FASB issued authoritative guidance, which allows for the delay of the effective date of the authoritative guidance for fair value measurements for one year for all nonfinancial assets and nonfinancial liabilities that are recognized or disclosed at fair value in the financial statements on a nonrecurring basis. The Company adopted the provisions of the guidance for financial assets and liabilities on January 1, 2008 with the exception of the application of the statement to non-recurring nonfinancial assets and nonfinancial liabilities. On January 1, 2009, the Company adopted the provisions of the guidance for non-recurring nonfinancial assets and liabilities and included disclosures on the use of fair value measurements for its nonfinancial assets and liabilities in the accompanying Note (3), “Fair Value Measurement”.
In December 2007, the FASB revised the authoritative guidance for business combinations, which establishes principles and requirements for the reporting entity in a business combination, including recognition and measurement in the financial statements of the identifiable assets acquired, the liabilities assumed, and any noncontrolling interest in the acquiree. The revised guidance also establishes disclosure requirements to enable financial statement users to evaluate the nature and financial effects of the business combination. The revised guidance applies prospectively to business combinations for which the acquisition date is on or after the beginning of the first annual reporting period beginning on or after December 15, 2008, and interim periods within those fiscal years. Accordingly, any business combinations the Company engaged in were recorded and disclosed according to the original guidance for business combinations until January 1, 2009. The Company expects the revised guidance will have an impact on its consolidated financial statements, but the nature and magnitude of the specific effects will depend upon the nature, terms and size of the acquisitions the Company consummates after the effective date of January 1, 2009.
In April 2009, the FASB issued authoritative guidance for accounting for assets acquired and liabilities assumed in a business combination that arise from contingencies. This guidance amends the guidance in business combinations relating to the initial recognition and measurement, subsequent measurement and accounting, and disclosures of assets and liabilities arising from contingencies in a business combination. This guidance is effective for fiscal years beginning after December 15, 2008. The Company did not initiate any acquisitions during 2009, but the Company expects to apply the requirements of this guidance to any acquisitions that it might commence subsequent to the adoption of it on January 1, 2009.
In March 2008, the FASB issued authoritative guidance for disclosures about derivative instruments and hedging activities. This guidance requires entities that utilize derivative instruments to provide qualitative disclosures about their objectives and strategies for using such instruments, as well as any details of credit-risk-related contingent features contained within derivatives. This guidance also requires entities to disclose additional information about the amounts and location of derivatives located within the financial statements, how the provisions of accounting for derivative instruments and hedging activities have been applied, and the impact that hedges have on an entity’s financial position, financial performance, and cash flows. This guidance is effective for fiscal years and interim periods beginning after November 15, 2008, with early application encouraged. The Company adopted this guidance beginning January 1, 2009, and the adoption did not have a material effect on its consolidated financial condition and results of operations.
52
AMN HEALTHCARE SERVICES, INC.
NOTES TO CONSOLIDATED FINANCIAL STATEMENTS – (Continued)
(t) Segment Information
The Company has three reportable segments: nurse and allied healthcare staffing, locum tenens staffing and physician permanent placement services.
The Company’s management relies on internal management reporting processes that provide revenue and segment operating income for making financial decisions and allocating resources. Segment operating income includes income from operations before depreciation, amortization of intangible assets, stock-based compensation expense, restructuring charges, impairment charges and other unallocated corporate overhead. Historically, the Company had allocated all selling, general and administrative costs to its reportable operating segments. Throughout 2009, the Company consolidated offices and reorganized back office and corporate functions to gain efficiency in operations. For the year ended December 31, 2009, the Company revised the measurement of its segment’s operating income to exclude certain corporate overhead costs that provide overall enterprise-wide back office support. Management believes that excluding certain corporate overhead from the segment operating income will allow management to better monitor the actual performance of the Company’s reportable segments. The Company has restated all periods presented for comparative purposes. The Company’s management does not evaluate, manage or measure performance of segments using asset information; accordingly, asset information by segment is not prepared or disclosed.
The following table provides a reconciliation of revenue and segment operating income by reportable segment to consolidated results and was derived from the segment’s internal financial information as used for corporate management purposes:
| Years Ended December 31, | ||||||||||
| 2009 | 2008 | 2007 | ||||||||
| Revenue |
||||||||||
| Nurse and allied healthcare staffing |
$ | 431,126 | $ | 843,747 | $ | 802,034 | ||||
| Locum tenens staffing |
291,822 | 321,954 | 310,525 | |||||||
| Physician permanent placement services |
36,842 | 51,499 | 51,463 | |||||||
| $ | 759,790 | $ | 1,217,200 | $ | 1,164,022 | |||||
| Segment Operating Income |
||||||||||
| Nurse and allied healthcare staffing |
$ | 38,076 | $ | 85,470 | $ | 83,820 | ||||
| Locum tenens staffing |
28,814 | 25,951 | 26,332 | |||||||
| Physician permanent placement services |
9,819 | 15,375 | 18,529 | |||||||
| 76,709 | 126,796 | 128,681 | ||||||||
| Depreciation and amortization |
13,812 | 14,439 | 11,674 | |||||||
| Stock-based compensation |
8,709 | 9,322 | 8,392 | |||||||
| Unallocated corporate overhead |
20,820 | 31,141 | 35,374 | |||||||
| Restructuring charges |
11,270 | — | — | |||||||
| Impairment charges |
175,707 | — | — | |||||||
| Interest expense, net |
11,955 | 10,690 | 12,457 | |||||||
| Income (loss) before income taxes |
$ | (165,564 | ) | $ | 61,204 | $ | 60,784 | |||
(u) Use of Estimates
The preparation of financial statements in conformity with accounting principles generally accepted in the United States of America requires management to make a number of estimates and assumptions relating to the reporting of assets and liabilities and the disclosure of contingent assets and liabilities at the dates of the financial
53
AMN HEALTHCARE SERVICES, INC.
NOTES TO CONSOLIDATED FINANCIAL STATEMENTS – (Continued)
statements and the reported amounts of revenue and expenses during the reporting periods. On an ongoing basis, the Company evaluates its estimates, including those related to asset impairment, accruals for self-insurance and compensation and related benefits, accounts receivable and contingencies and litigation, valuation and recognition of share-based payments and income taxes. Actual results could differ from those estimates under different assumptions or conditions.
(v) Reclassifications
Certain amounts in the 2007 and 2008 consolidated financial statements have been reclassified to conform to the 2009 presentation.
(w) Subsequent Events
The Company has evaluated subsequent events through the time of filing this Form 10-K with the SEC, and determined there were no other items to disclose.
(2) Acquisitions
Platinum Select Staffing Acquisition
On February 15, 2008, the Company acquired substantially all of the assets of Platinum Select Staffing, a national travel allied staffing firm. In August 2009, the Company made a cash payment of $2,181 to the selling shareholders representing a portion of the holdback of the initial purchase price. In October 2009, the Company made another cash payment of $250 to the selling shareholders. As of December 31, 2009, the Company’s remaining holdback liability in connection with Platinum Select Staffing was $50, which is included in other current liabilities in the accompanying consolidated balance sheet. The acquisition agreement provided for a contingent earn-out payment up to $17,445 to be paid in 2009 if certain annual financial goals were met. Based on the operating result of Platinum Select Staffing for fiscal year 2008, these financial goals were not met.
(3) Fair Value Measurement
The authoritative guidance defines fair value as the exchange price that would be received for an asset or paid to transfer a liability (an exit price) in the principal or most advantageous market for the asset or liability in an orderly transaction between market participants on the measurement date. It also establishes a fair value hierarchy which requires an entity to maximize the use of observable inputs and minimize the use of unobservable inputs when measuring fair value. The standard describes three levels of inputs that may be used to measure fair value:
Level 1—Quoted prices in active markets for identical assets or liabilities.
Level 2—Observable inputs other than Level 1 prices such as quoted prices for similar assets or liabilities; quoted prices in markets that are not active; or other inputs that are observable or can be corroborated by observable market data for substantially the full term of the assets or liabilities.
Level 3—Unobservable inputs that are supported by little or no market activity and that are significant to the fair value of the assets or liabilities.
54
AMN HEALTHCARE SERVICES, INC.
NOTES TO CONSOLIDATED FINANCIAL STATEMENTS – (Continued)
Financial assets and liabilities
The Company utilizes the market approach to measure fair value for its financial assets and liabilities. The market approach uses prices and other relevant information generated by market transactions involving identical or comparable assets or liabilities. As of December 31, 2009, the Company held certain assets that are required to be measured at fair value on a recurring basis. These included the restricted cash and cash equivalents and the Company’s investments associated with the Company’s Executive Nonqualified Excess Plan (“Excess Benefit Plan”). The Company’s restricted cash and cash equivalents typically consist of cash and U.S. Treasury securities, and the fair value is based on quoted prices in active markets for identical assets. The Company’s investments associated with its Excess Benefit Plan typically consist of money market funds and mutual funds that are publicly traded and for which market prices are readily available. As of December 31, 2008, the Company held certain assets that are required to be measured at fair value on a recurring basis. These included the Company’s investments associated with the Excess Benefit Plan and interest rate swaps. The Company’s interest rate swaps were valued using commonly quoted intervals from observable market data. In addition, the Company discounted the derivative liabilities to reflect the potential credit risk to lenders by using current interest rates available to the Company. On December 23, 2009, the Company settled its outstanding interest rate swaps. See Note (7), “Notes Payable and Related Derivative Instruments and Credit Agreement” for addition information.
Financial assets measured at fair value on a recurring basis are summarized below:
| Fair Value Measurements as of December 31, 2009 | ||||||||||||
| Total | Quoted Prices in Active Markets for Identical Assets (Level 1) |
Significant Other Observable Inputs (Level 2) |
Significant Unobservable Inputs (Level 3) | |||||||||
| U.S Treasury securities |
$ | 21,797 | $ | 21,797 | $ | — | $ | — | ||||
| Trading securities investment |
140 | 140 | — | — | ||||||||
| Total financial assets measured at fair value |
$ | 21,937 | $ | 21,937 | $ | — | $ | — | ||||
| Fair Value Measurements as of December 31, 2008 | ||||||||||||
| Total | Quoted Prices in Active Markets for Identical Assets (Level 1) |
Significant Other Observable Inputs (Level 2) |
Significant Unobservable Inputs (Level 3) | |||||||||
| Financial Assets: Trading securities investment |
$ | 1,871 | $ | 1,871 | $ | — | $ | — | ||||
| Financial Liabilities: Interest rate swaps |
$ | 2,506 | $ | — | $ | 2,506 | $ | — | ||||
Non-financial assets and liabilities
The Company applies fair value techniques on a non-recurring basis associated with valuing potential impairment losses related to goodwill and indefinite-lived intangible assets.
The Company evaluates goodwill annually for impairment at the reporting unit level and whenever circumstances occur indicating that goodwill might be impaired. The Company determines the fair value of its reporting units based on a combination of inputs including the market capitalization of the Company as well as Level 3 inputs such as discounted cash flows which are not observable from the market, directly or indirectly. Due to the economic downturn and the Company’s lower market capitalization, the Company performed interim impairment testing during the first quarter of 2009 and finalized the impairment charge during the second quarter
55
AMN HEALTHCARE SERVICES, INC.
NOTES TO CONSOLIDATED FINANCIAL STATEMENTS – (Continued)
of 2009. Goodwill for the Company’s impaired reporting units with a carrying amount of $205,987 was written down to the implied fair value of $32,980, resulting in an impairment charge of $173,007, which is included in net loss for the year ended December 31, 2009. In addition, the Company evaluates indefinite-lived intangible assets annually for impairment and whenever circumstances occur indicating that our indefinite-lived intangible assets might be impaired. Indefinite-lived intangible assets with a carrying amount of $9,000 were written down to fair value of $6,300, resulting in an impairment charge of $2,700, which is included in net loss for the year ended December 31, 2009. The Company determined the fair value of its indefinite-lived intangible assets using the income approach (relief-from-royalty method), based on level 3 inputs. See Note (4), “Goodwill and Identifiable Intangible Assets” for additional information.
(4) Goodwill and Identifiable Intangible Assets
As of December 31, 2009 and 2008, the Company had the following acquired intangible assets:
| December 31, 2009 | December 31, 2008 | |||||||||||||||||||
| Gross Carrying Amount |
Accumulated Amortization |
Net Carrying Amount |
Gross Carrying Amount |
Accumulated Amortization |
Net Carrying Amount | |||||||||||||||
| Intangible assets subject to amortization: |
||||||||||||||||||||
| Staffing databases |
$ | 2,430 | $ | (1,922 | ) | $ | 508 | $ | 2,430 | $ | (1,325 | ) | $ | 1,105 | ||||||
| Customer relationships |
36,400 | (10,910 | ) | 25,490 | 36,400 | (8,024 | ) | 28,376 | ||||||||||||
| Tradenames and trademarks |
13,551 | (2,230 | ) | 11,321 | 13,551 | (1,364 | ) | 12,187 | ||||||||||||
| Noncompete agreements |
1,430 | (1,003 | ) | 427 | 1,430 | (723 | ) | 707 | ||||||||||||
| Acquired technology |
800 | (418 | ) | 382 | 800 | (257 | ) | 543 | ||||||||||||
| Online courses |
59 | (51 | ) | 8 | 59 | (32 | ) | 27 | ||||||||||||
| $ | 54,670 | $ | (16,534 | ) | $ | 38,136 | $ | 54,670 | $ | (11,725 | ) | $ | 42,945 | |||||||
| Intangible assets not subject to amortization: |
||||||||||||||||||||
| Goodwill |
$ | 79,868 | $ | 252,875 | ||||||||||||||||
| Tradenames and trademarks |
77,200 | 79,900 | ||||||||||||||||||
| $ | 157,068 | $ | 332,775 | |||||||||||||||||
Aggregate amortization expense for intangible assets was $4,809 and $4,690 for the years ended December 31, 2009 and 2008, respectively. Based on the current amount of intangibles subject to amortization, the estimated amortization expense as of December 31, 2009 is as follows:
| Amount | |||
| Year ending December 31, 2010 |
$ | 4,613 | |
| Year ending December 31, 2011 |
3,788 | ||
| Year ending December 31, 2012 |
3,441 | ||
| Year ending December 31, 2013 |
3,173 | ||
| Year ending December 31, 2014 |
3,161 | ||
| Thereafter |
19,960 | ||
| $ | 38,136 | ||
56
AMN HEALTHCARE SERVICES, INC.
NOTES TO CONSOLIDATED FINANCIAL STATEMENTS – (Continued)
The changes in the carrying amount of goodwill by reportable segment for the year ended December 31, 2009 are as follows:
| Nurse and Allied Healthcare Staffing |
Locum Tenens Staffing |
Physician Permanent Placement Services |
Total | ||||||||||||
| Balance January 1, 2009 |
$ | 159,331 | $ | 58,022 | $ | 35,522 | $ | 252,875 | |||||||
| Impairment charges |
(140,788 | ) | (32,219 | ) | — | (173,007 | ) | ||||||||
| Balance December 31, 2009 |
$ | 18,543 | $ | 25,803 | $ | 35,522 | $ | 79,868 | |||||||
| Accumulated impairment loss as of December 31, 2009 |
$ | 140,788 | $ | 32,219 | $ | — | $ | 173,007 | |||||||
57
AMN HEALTHCARE SERVICES, INC.
NOTES TO CONSOLIDATED FINANCIAL STATEMENTS – (Continued)
(5) Balance Sheet Details
The consolidated balance sheets detail is as follows as of December 31, 2009 and 2008:
| December 31, | ||||||||
| 2009 | 2008 | |||||||
| Fixed assets: |
||||||||
| Furniture and equipment |
$ | 16,262 | $ | 18,937 | ||||
| Software |
43,367 | 40,604 | ||||||
| Leasehold improvements |
4,821 | 5,555 | ||||||
| 64,450 | 65,096 | |||||||
| Accumulated depreciation and amortization |
(44,480 | ) | (41,078 | ) | ||||
| Fixed assets, net |
$ | 19,970 | $ | 24,018 | ||||
| Accounts payable and accrued expenses: |
||||||||
| Trade and accrued accounts payable |
$ | 13,750 | $ | 20,215 | ||||
| Professional liability reserve |
2,845 | 2,193 | ||||||
| Other |
1,462 | 2,012 | ||||||
| Accounts payable and accrued expenses |
$ | 18,057 | $ | 24,420 | ||||
| Accrued compensation and benefits: |
||||||||
| Accrued payroll |
$ | 4,746 | $ | 20,898 | ||||
| Accrued bonuses |
4,323 | 6,821 | ||||||
| Accrued health insurance reserve |
2,208 | 3,000 | ||||||
| Accrued workers compensation reserve |
3,104 | 3,484 | ||||||
| Deferred compensation |
6,970 | 5,811 | ||||||
| Other |
2,703 | 4,857 | ||||||
| Accrued compensation and benefits |
$ | 24,054 | $ | 44,871 | ||||
| Other current liabilities: |
||||||||
| Acquisitions purchase price holdback liability |
$ | 400 | $ | 2,419 | ||||
| Facility client deposits |
2,867 | 3,570 | ||||||
| Restructuring reserve |
1,538 | — | ||||||
| Other |
5,599 | 8,733 | ||||||
| Other current liabilities |
$ | 10,404 | $ | 14,722 | ||||
| Other long-term liabilities: |
||||||||
| Workers compensation reserve |
$ | 5,825 | $ | 6,967 | ||||
| Professional liability reserve |
16,417 | 18,685 | ||||||
| Deferred rent |
7,812 | 7,885 | ||||||
| Restructuring reserve |
1,719 | — | ||||||
| Uncertain tax positions liability |
20,011 | 18,220 | ||||||
| Other |
2,367 | 6,953 | ||||||
| Other long-term liabilities |
$ | 54,151 | $ | 58,710 | ||||
58
AMN HEALTHCARE SERVICES, INC.
NOTES TO CONSOLIDATED FINANCIAL STATEMENTS – (Continued)
(6) Income Taxes
The provision for income taxes for the years ended December 31, 2009, 2008 and 2007 consists of the following:
| December 31, | ||||||||||||
| 2009 | 2008 | 2007 | ||||||||||
| Current income taxes: |
||||||||||||
| Federal |
$ | 7,145 | $ | 26,504 | $ | 20,345 | ||||||
| State |
1,258 | 3,726 | 2,729 | |||||||||
| Foreign |
(69 | ) | (13 | ) | 38 | |||||||
| Total |
8,334 | 30,217 | 23,112 | |||||||||
| Deferred income taxes: |
||||||||||||
| Federal |
(45,096 | ) | (3,397 | ) | 709 | |||||||
| State |
(6,630 | ) | (94 | ) | 754 | |||||||
| Foreign |
5 | 121 | (172 | ) | ||||||||
| Total |
(51,721 | ) | (3,370 | ) | 1,291 | |||||||
| Provision (benefit) for income taxes |
$ | (43,387 | ) | $ | 26,847 | $ | 24,403 | |||||
The Company’s income tax expense differs from the amount that would have resulted from applying the federal statutory rate of 35% to pretax income (loss) because of the effect of the following items during the years ended December 31, 2009, 2008 and 2007:
| December 31, | |||||||||||
| 2009 | 2008 | 2007 | |||||||||
| Tax expense at federal statutory rate |
$ | (57,947 | ) | $ | 21,421 | $ | 21,175 | ||||
| State taxes, net of federal benefit |
(3,218 | ) | 2,457 | 2,338 | |||||||
| Uncertain tax positions |
1,891 | 2,386 | 894 | ||||||||
| Non-deductible goodwill and intangibles impairment |
15,376 | — | — | ||||||||
| Other, net |
511 | 583 | (4 | ) | |||||||
| Income tax expense (benefit) |
$ | (43,387 | ) | $ | 26,847 | $ | 24,403 | ||||
59
AMN HEALTHCARE SERVICES, INC.
NOTES TO CONSOLIDATED FINANCIAL STATEMENTS – (Continued)
The tax effects of temporary differences that give rise to significant portions of deferred tax assets and deferred tax liabilities are presented below as of December 31, 2009 and 2008:
| December 31, | ||||||||
| 2009 | 2008 | |||||||
| Deferred tax assets: |
||||||||
| Stock compensation |
$ | 9,022 | $ | 7,979 | ||||
| Deferred revenue |
1,192 | 1,387 | ||||||
| Allowance for doubtful accounts |
1,687 | 1,492 | ||||||
| Deferred compensation |
2,409 | 1,871 | ||||||
| Accrued expenses, net |
14,359 | 15,003 | ||||||
| Deferred rent |
3,047 | 3,105 | ||||||
| Net operating losses |
1,248 | 1,137 | ||||||
| State taxes |
667 | 3,038 | ||||||
| Other |
1,512 | 1,780 | ||||||
| Total deferred tax assets |
$ | 35,143 | $ | 36,792 | ||||
| Deferred tax liabilities: |
||||||||
| Intangibles |
$ | (21,669 | ) | $ | (70,729 | ) | ||
| Fixed assets |
(4,775 | ) | (5,473 | ) | ||||
| Prepaid expenses |
(954 | ) | (971 | ) | ||||
| Total deferred tax liabilities |
$ | (27,398 | ) | $ | (77,173 | ) | ||
| Net deferred tax assets (liabilities) |
$ | 7,745 | $ | (40,381 | ) | |||
Management believes it is more likely than not that the results of operations will generate sufficient taxable income to realize the deferred tax assets, and accordingly, has not provided a valuation allowance for these assets.
As of December 31, 2009, the Company has no federal net operating loss carryforwards. As of December 31, 2009, the Company has state net operating loss carryforwards of $13,944 that are set to expire at various dates between 2010 and 2029.
As of December 31, 2009, the Company did not provide for United States income taxes or foreign withholding taxes on undistributed earnings from certain non-U.S. subsidiaries that will be permanently reinvested outside the United States. The Company intends to reinvest its foreign earnings indefinitely for certain entities. Should the Company repatriate foreign earnings, the Company would have to adjust the income tax provision in the period management determined that the Company would repatriate earnings, however the Company’s foreign earnings are insignificant.
A reconciliation of the beginning and ending amounts of unrecognized tax benefits is as follows:
| Balance at January 1, 2009, excluding interest and penalties of $951 |
$ | 17,269 | ||
| Additions based on tax positions related to the current year |
2,340 | |||
| Additions based on tax positions of prior year |
151 | |||
| Reductions for tax positions of prior year |
(196 | ) | ||
| Settlements |
(661 | ) | ||
| Reductions due to lapse of applicable statute of limitations |
(364 | ) | ||
| Balance at December 31, 2009, excluding interest and penalties of $1,472 |
$ | 18,539 | ||
60
AMN HEALTHCARE SERVICES, INC.
NOTES TO CONSOLIDATED FINANCIAL STATEMENTS – (Continued)
At December 31, 2009, if recognized, approximately $17,928, net of $2,083 of temporary differences, would affect the effective tax rate (including interest and penalties).
The Company recognizes interest and penalties related to unrecognized tax benefits in the provision for income taxes. The Company has approximately $1,472 of accrued interest and penalties related to unrecognized tax benefits in the provision for income taxes at December 31, 2009.
The Company is subject to taxation in the US and various states and foreign jurisdictions. With few exceptions, as of December 31, 2009, the Company is no longer subject to U.S. federal, state, local or foreign examinations by tax authorities for years before 2005, although carryforward attributes that were generated prior to 2005 may still be adjusted upon examination by the IRS or state authorities if they either have been or will be utilized in a future period.
The Company does not foresee material changes to its gross uncertain tax liability within the next twelve months.
(7) Notes Payable and Related Derivative Instruments and Credit Agreement
On December 23, 2009, the Company entered into a new credit agreement (the “New Credit Agreement”). The New Credit Agreement provides for, among other things, a $40,000 secured revolving credit facility maturing in December 2012 and a $110,000 secured term loan facility maturing in December 2013. The new secured term loan facility was used primarily to pay off existing borrowings of $77,270 of term debt, cash collateralize $21,797 in existing letters of credit, and pay $4,400 of discount on the term loan facility and $4,415 in refinancing fees. In connection with the payoff, the Company wrote off $2,252 of deferred financing costs related to the prior credit facility, including $1,784 incurred in connection with an amendment of the then existing credit agreement on May 7, 2009, which was recorded in interest expense for year ending December 31, 2009. The discount paid on the term loan facility was netted against the par value of the term loan on the consolidated balance sheet. The discount paid on the refinancing fees was deferred and is being amortized over the terms of the new credit facilities.
The revolving credit facility portion of the New Credit Agreement currently carries an unused fee of between 0.5% and 0.75% per annum based upon the Company’s current Consolidated Leverage Ratio, based on EBITDA, which excludes non-cash charges such as impairment charges, and funded indebtedness as defined in the New Credit Agreement, as of the end of each fiscal quarter, and there are no mandatory reductions in the revolving commitment under the secured revolving credit facility portion of the New Credit Agreement. Borrowings under the revolving credit facility portion of the New Credit Agreement bear interest at floating rates based upon either a LIBOR or a prime interest rate option selected by the Company, plus a spread of 3.00% to 4.50% and 2.00% to 3.50%, respectively, to be determined based on its current Consolidated Leverage Ratio. As of December 31, 2009, no balance was outstanding under the revolving credit facility.
The four year, $110,000 term loan portion of the New Credit Agreement is subject to quarterly amortization of principal (in equal installments), with an amount equal to 5% of the initial aggregate principal amount of the secured term loan facility in 2010, 10% of the initial aggregate principal amount of the secured term loan facility in 2011 and 15% of the initial aggregate principal amount of the secured term loan facility in 2012 with the remaining 70% payable in 2013. Borrowings under the secured term loan facility portion of the New Credit Agreement bear interest at floating rates based upon either a LIBOR or a prime interest rate option selected by the Company, plus a spread of 4.00% and 3.00%, respectively. The LIBOR interest rate option for the term loan is subject to a minimum floor of 2.25%.
61
AMN HEALTHCARE SERVICES, INC.
NOTES TO CONSOLIDATED FINANCIAL STATEMENTS – (Continued)
The Company is required to make additional customary mandatory prepayments under the New Credit Agreement with the proceeds of certain asset dispositions, extraordinary receipts, debt issuances and equity issuances. The Company is also required to make mandatory prepayments under the New Credit Agreement within ninety days after the end of each fiscal year, commencing with the fiscal year ended December 31, 2010, in an amount equal to 75%, and beginning with the fiscal year ended December 31, 2011, 50% or 75%, to be determined based on its Consolidated Leverage Ratio, of the Company’s Excess Cash Flow (as defined in the New Credit Agreement), less any voluntary prepayments of the secured term loan facility portion of the New Credit Agreement made during the fiscal year.
As of December 31, 2009, the total term loan outstanding (including both the current and long term portions) net of discount, was $105,621.
The Company’s New Credit Agreement and then existing credit agreement contain various financial ratio covenants, including a minimum fixed charge coverage ratio and maximum leverage ratio, as well as restrictions on assumption of additional indebtedness, declaration of dividends, dispositions of assets, consolidation into another entity, capital expenditures in excess of specified amounts and allowable investments. The Company was in compliance with these requirements as of December 31, 2009 and 2008.
In connection with payoff of the old term loan debt, the Company settled with cash on hand its outstanding interest rate swaps of approximately $1,855. Upon settlement, the Company discontinued hedge accounting and recognized immediately in earnings gains and losses that were accumulated in other comprehensive income (loss) related to the hedging relationship.
At December 31, 2009, the Company maintained outstanding standby letters of credit in total of $21,797 as collateral in relation to its professional liability insurance agreements, workers compensation insurance agreements, and a corporate office lease agreement. The Company has cash collateralized its outstanding letters of credit of $21,797 using proceeds from its new credit facility. Outstanding standby letters of credit at December 31 2008 totaled $18,414.
62
AMN HEALTHCARE SERVICES, INC.
NOTES TO CONSOLIDATED FINANCIAL STATEMENTS – (Continued)
Credit Agreement balances as of December 31, 2009 and 2008 consisted of the following:
| December 31, | ||||||||
| 2009 | 2008 | |||||||
| $40,000 Revolver expiring December 23, 2012 with variable interest rates. |
$ | — | $ | — | ||||
| $75,000 Revolver expiring November 2, 2010 with variable interest rates, which was terminated on December 23, 2009. The weighted average interest rate at December 31, 2008 was 3.0% |
— | 31,500 | ||||||
| $110,000 Term Loan due December 23, 2013 with variable interest rates. The weighted average interest rate at December 31, 2009 was 6.3% |
110,000 | — | ||||||
| $235,000 Term Loan due September 30, 2011 with variable interest rates, which was terminated on December 23, 2009. The weighted average interest rate at December 31, 2008 was 4.8% |
— | 114,816 | ||||||
| Total Credit Agreement debt |
110,000 | 146,316 | ||||||
| Less unamortized discount on the $110,000 Term Loan Facility |
(4,379 | ) | ||||||
| Less current portion of notes payable, including Revolver |
(5,500 | ) | (46,080 | ) | ||||
| Long-term portion of notes payable |
$ | 100,121 | $ | 100,236 | ||||
| Annual principal maturities of notes payable are as follows: |
||||||||
| 2010 |
5,500 | |||||||
| 2011 |
11,000 | |||||||
| 2012 |
16,500 | |||||||
| 2013 |
77,000 | |||||||
| $ | 110,000 | |||||||
The Company’s outstanding debt instruments at December 31, 2009 and 2008 were secured by all assets of the Company and the common stock of its subsidiaries.
(8) Retirement Plans
The Company maintains the Healthcare Staffing Retirement Savings Plan (the “AMN Plan”), a plan that complies with the Internal Revenue Code Section (IRC) 401(k) provisions. The AMN Plan covers all employees that meet certain age and other eligibility requirements. An annual discretionary matching contribution is determined by the Compensation and Stock Plan Committee of the Board of Directors each year and may be up to a maximum 6% of eligible compensation paid to all participants during the plan year. The amount of the employer contributions, net of forfeitures, under this plan were $224, $2,719 and $2,624 for the years ended December 31, 2009, 2008 and 2007, respectively. As of December 31, 2009, there was $783 related to forfeitures, which can be used for future employer contributions. The forfeiture balance was included in deposits and other assets in the accompanying consolidated balance sheet.
The Company has a defined compensation plan for certain executives and key employees (the “Plan”). The Plan is not intended to be tax qualified and is an unfunded plan. This plan is composed of deferred compensation and all related income and losses attributable thereto. Discretionary matching contributions to the plan are made that vest incrementally so that the employee is fully vested in the match following five years of employment with the Company. Under the Plan, participants can defer up to 80% of their base salary, 100% of their bonus and 100% of their grant of restricted stock units. An annual discretionary matching contribution is determined by the
63
AMN HEALTHCARE SERVICES, INC.
NOTES TO CONSOLIDATED FINANCIAL STATEMENTS – (Continued)
Compensation and Stock Plan Committee of the Board of Directors each year. The amount of the employer contributions, net of forfeitures, under this plan were $63, $228 and $243 for the years ended December 31, 2009, 2008 and 2007, respectively.
(9) Stockholders’ Equity
(a) Preferred Stock
The Company has 10,000 shares of preferred stock authorized for issuance in one or more series, at a par value of $0.01 per share. At December 31, 2009 and 2008, no shares of preferred stock were outstanding.
(b) Stock Repurchase Program
On May 7, 2008, the Company’s Board authorized the Company to repurchase up to $38,000 of its outstanding common stock in the open market through March 31, 2009. Under the repurchase program, share purchases may be made from time to time beginning in the second quarter of 2008, depending on prevailing market conditions and other considerations. During the second and third quarters of 2008, the Company repurchased 1,555 shares of its common stock at an average price of $18.30 per share, resulting in an aggregate purchase price of $28,446. The Company did not repurchase any additional shares during the fourth quarter of 2008 and first quarter of 2009 and the Board did not extend the repurchase program.
On July 10, 2007, our Board authorized the Company to repurchase up to 1,000 shares of its outstanding common stock in the open market commencing in the third quarter of 2007. The Company completed the repurchase of 1,000 shares at an average purchase price of $18.48 per share during August 2007, resulting in an aggregate purchase price of $18,510.
(10) Stock-Based Compensation
(a) Equity Award Plans
In November 1999, the Company established two performance stock option plans (the “1999 Plans”), which were approved by the Company’s shareholders prior to the Company’s initial public offering, to provide for the grant of options to the Company’s upper management. On April 12, 2006, 351 shares of common stock reserved for future issuance under the 1999 Plans were rolled into the Equity Plan. There will be no further equity awards granted from the 1999 Plans. All previously granted options under the 1999 Plans have been exercised or forfeited.
In July 2001, the Company established the 2001 Stock Option Plan to provide a means to attract and retain employees. In May 2004, the 2001 Stock Option Plan was renamed the Stock Option Plan, and an additional 2,000 options were authorized for issuance to increase the maximum number of options to be granted under the plan to 4,178. Unless otherwise provided at the time of the grant, the options vest and become exercisable in increments of 25% on each of the first four anniversaries of the date of grant. Options granted under the plan expire on the tenth anniversary of the grant date. On April 12, 2006, 371 shares of common stock reserved for future issuance under the Stock Option Plan were rolled into the Equity Plan, which is discussed below. There will be no further equity awards granted from the Stock Option Plan.
In April 2006, the Company established the AMN Healthcare Equity Plan (“Equity Plan”), which was approved by the Company’s shareholders. At the time of the Equity Plan’s adoption, equity awards, based on the Company’s common stock, could be issued for a maximum of 723 shares plus the number of shares of common
64
AMN HEALTHCARE SERVICES, INC.
NOTES TO CONSOLIDATED FINANCIAL STATEMENTS – (Continued)
stock underlying any grants under the Company’s Stock Option Plan that are forfeited, canceled or terminated (other than by exercise) from and after the effective date of the Equity Plan. Pursuant to the Equity Plan, stock options and stock appreciation rights (“SARs”) granted have a maximum contractual life of ten years and exercise prices will be determined at the time of grant and will be no less than fair market value of the underlying common stock on the date of grant. Any shares to be issued under the Equity Plan will be issued by the Company from authorized but unissued common stock or shares of common stock reacquired by the Company. On April 18, 2007 and April 9, 2009, the Company amended the Equity Plan, with stockholder approval, to increase the number of shares authorized under the plan by 3,000 (plus shares forfeited under the Company’s Stock Option Plan) and 1,850, respectively.
On October 15, 2009, the Company’s Board of Directors authorized, subject to shareholder approval, a one time equity exchange program (the “Equity Exchange”) that offered eligible employees, excluding executive officers and directors, the opportunity to exchange certain outstanding stock options and SARs with exercise prices substantially above the current market price of the Company’s common shares for a lesser number of restricted stock units (“RSUs”) that have a fair value that is lower than the fair value of the “out of the money” options and SARs. On December 10, 2009, the Company’s shareholders approved the Equity Exchange. The offer commenced on November 6, 2009 and expired on December 10, 2009. As a result of this program, 997 outstanding eligible stock options and SARs, which represented approximately 82% of the eligible awards, were canceled in exchange for 145 new RSUs. These new RSUs have a new minimum vesting condition of at least 12 months from December 10, 2009. In connection with the Equity Exchange, the Company is required to recognize incremental stock-based compensation expense over the remaining vesting period, if the number of shares underlying the RSUs multiplied by the market value of the Company’s common stock on the grant date of the RSUs exceeds the fair value of the eligible stock options and SARs immediately before their cancellation. The incremental expense associated with the modification is not material to the Company’s consolidated statements of operations.
For the year ended December 31, 2009, 861 SARs and 934 RSUs (excluding the RSUs issued from the Equity Exchange) were granted to employees, officers and directors of the Company. The SARs typically vest ratably over a three year period, with one third of the awards vesting annually. The RSUs typically vest at the end of a three year vesting period, however, 33% of the awards may vest on the 13th month anniversary of the grant date, and 34% on the 2nd anniversary of the grant date, if certain performance targets are met. At December 31, 2009 and 2008, respectively, 3,143 and 1,506 shares of equity awards were reserved for the future grants related to the Equity Plan.
(b) Stock-Based Compensation
Stock Options and SARs
Stock options entitle the holder to purchase, at the end of a vesting period, a specified number of shares of the Company’s common stock at a price per share set at the date of grant. SARs entitle the holder to receive, at the end of a vesting period, shares of the Company’s common stock equal to the difference between the exercise price of the SAR, which is set at the date of grant, and the fair market value of the Company’s common stock on the date of exercise.
65
AMN HEALTHCARE SERVICES, INC.
NOTES TO CONSOLIDATED FINANCIAL STATEMENTS – (Continued)
A summary of stock option and SAR activity under the 1999 Plans, the Stock Option Plan and the Equity Plan are as follows:
| 1999 Plans | Stock Option Plan | Equity Plan | ||||||||||||||||
| Number Outstanding |
Weighted- Average Exercise Price per Share |
Number Outstanding |
Weighted- Average Exercise Price per Share |
Number Outstanding |
Weighted- Average Exercise Price per Share | |||||||||||||
| Outstanding at December 31, 2006 |
10 | $ | 6.68 | 2,584 | $ | 15.65 | 370 | $ | 18.07 | |||||||||
| Granted |
— | — | — | — | 427 | $ | 24.47 | |||||||||||
| Exercised |
(10 | ) | $ | 6.68 | (199 | ) | $ | 12.59 | (23 | ) | $ | 18.03 | ||||||
| Canceled/forfeited/expired |
— | — | (27 | ) | $ | 18.55 | (52 | ) | $ | 21.52 | ||||||||
| Outstanding at December 31, 2007 |
— | — | 2,358 | $ | 15.88 | 722 | $ | 21.61 | ||||||||||
| Granted |
— | — | — | — | 618 | $ | 16.10 | |||||||||||
| Exercised |
— | — | (295 | ) | $ | 13.56 | (6 | ) | $ | 18.03 | ||||||||
| Canceled/forfeited/expired |
— | — | (261 | ) | $ | 22.17 | (149 | ) | $ | 19.96 | ||||||||
| Outstanding at December 31, 2008 |
— | — | 1,802 | $ | 15.35 | 1,185 | $ | 18.96 | ||||||||||
| Granted |
— | — | — | — | 861 | $ | 7.93 | |||||||||||
| Exercised |
— | — | — | — | — | — | ||||||||||||
| Canceled—Equity Exchange |
— | — | (500 | ) | $ | 17.36 | (497 | ) | $ | 19.18 | ||||||||
| Canceled/forfeited/expired |
— | — | (405 | ) | $ | 14.43 | (377 | ) | $ | 16.54 | ||||||||
| Outstanding at December 31, 2009 |
— | — | 897 | $ | 14.64 | 1,172 | $ | 11.55 | ||||||||||
| Vested and expected to vest at December 31, 2009 |
— | — | 897 | $ | 14.64 | 1,001 | $ | 11.55 | ||||||||||
| Exercisable at December 31, 2009 |
— | — | 897 | $ | 14.64 | 259 | $ | 19.09 | ||||||||||
66
AMN HEALTHCARE SERVICES, INC.
NOTES TO CONSOLIDATED FINANCIAL STATEMENTS – (Continued)
The following table summarizes stock options and SARs outstanding and exercisable as of December 31, 2009:
| Outstanding | Exercisable | ||||||||||||||||
| Range Of Exercise Price per Share |
Number Outstanding |
Weighted- Average Remaining Contractual Life (Years) |
Weighted- Average Exercise Price per Share |
Number Outstanding |
Weighted- Average Remaining Contractual Life (Years) |
Weighted- Average Exercise Price per Share | |||||||||||
| Stock Option Plan |
$ | 8.71 - $ 14.86 | 528 | 4.5 | $ | 13.18 | 528 | 4.5 | $ | 13.18 | |||||||
| 14.94 - 22.98 | 369 | 4.0 | 16.73 | 369 | 4.0 | 16.73 | |||||||||||
| 897 | 897 | ||||||||||||||||
| Equity Plan |
$ | 4.79 - $ 8.21 | 295 | 9.5 | $ | 6.45 | 2 | 9.0 | $ | 8.21 | |||||||
| 8.71 - 14.86 | 484 | 9.0 | 8.78 | 4 | 8.8 | 11.48 | |||||||||||
| 14.94 - 22.98 | 302 | 7.6 | 16.92 | 187 | 7.3 | 17.28 | |||||||||||
| 24.47 - 24.95 | 91 | 7.3 | 24.94 | 66 | 7.3 | 24.94 | |||||||||||
| 1,172 | 259 | ||||||||||||||||
| TOTAL |
2,069 | 6.8 | $ | 12.89 | 1,156 | 5.0 | $ | 15.64 | |||||||||
Stock-based compensation expense for 2009, 2008 and 2007 for SARs granted was estimated at the date of grant using the Black-Scholes valuation model based on the following weighted average assumptions:
| 2009 | 2008 | 2007 | |||||||
| Expected life |
3.9 years | 3.9 years | 3.8 years | ||||||
| Risk-free interest rate |
2.0 | % | 2.5 | % | 4.5 | % | |||
| Volatility |
36 | % | 30 | % | 31 | % | |||
| Dividend yield |
0 | % | 0 | % | 0 | % |
The weighted average grant date fair value of the 861, 618 and 427 SARs granted during 2009, 2008 and 2007 was $2.39, $4.35 and $7.41, respectively. As of December 31, 2009, there was $1,989 of pre-tax total unrecognized compensation cost related to non-vested stock options and SARs, which will be adjusted for future changes in forfeitures. The Company expects to recognize such cost over a weighted average period of 1.8 years. There was no option or SAR exercised during 2009. The total intrinsic value of stock options and SARs exercised was $1,125 and $2,071 for 2008 and 2007, respectively. At both December 31, 2009 and 2008, the total intrinsic value of stock options and SARs outstanding and exercisable were $0.
Restricted Stock Units
RSUs, granted under the Company’s Equity Plan, entitle the holder to receive, at the end of a vesting period, a specified number of shares of the Company’s common stock. Stock-based compensation cost of RSUs is measured by the market value of the Company’s common stock on the date of grant. The weighted average grant date intrinsic value was $7.00 per RSU for the 934 RSUs granted during 2009. The Company uses historical data to estimate pre-vesting award forfeitures and records stock-based compensation expense only for those awards that are expected to vest. The grant date intrinsic value of awards granted is amortized on a straight-line basis over the requisite service periods of the awards, which are the vesting periods.
67
AMN HEALTHCARE SERVICES, INC.
NOTES TO CONSOLIDATED FINANCIAL STATEMENTS – (Continued)
The following table summarizes RSU activity for non-vested awards for the twelve months ended December 31, 2009, 2008 and 2007:
| Number of Shares | Weighted Average Grant Date Fair Value per Share | |||||
| Unvested at January 1, 2007 |
255 | $ | 18.08 | |||
| Granted |
268 | $ | 24.35 | |||
| Vested |
(84 | ) | $ | 18.04 | ||
| Canceled/forfeited/expired |
(31 | ) | $ | 21.60 | ||
| Unvested at December 31, 2007 |
408 | $ | 21.94 | |||
| Granted |
399 | $ | 16.16 | |||
| Vested |
(15 | ) | $ | 22.04 | ||
| Canceled/forfeited/expired |
(68 | ) | $ | 20.23 | ||
| Unvested at December 31, 2008 |
724 | $ | 18.90 | |||
| Granted |
934 | $ | 7.00 | |||
| Granted – Equity Exchange |
145 | $ | 8.27 | |||
| Vested |
(146 | ) | $ | 18.19 | ||
| Canceled/forfeited/expired |
(311 | ) | $ | 11.88 | ||
| Unvested at December 31, 2009 |
1,346 | $ | 10.95 | |||
As of December 31, 2009, there was $7,690 of pre-tax total unrecognized compensation cost related to non-vested RSUs, which will be adjusted for future changes in forfeitures. The Company expects to recognize such cost over a period of 1.7 years. As of December 31, 2009 and 2008, the aggregate intrinsic value of the RSUs outstanding was $12,534 and $5,881, respectively.
Stock-Based Compensation
The following table shows the total stock-based compensation expense, related to all of the Company’s equity awards, recognized for the twelve month periods ended December 31, 2009, 2008 and 2007:
| Years Ended December 31, | ||||||||||||
| 2009 | 2008 | 2007 | ||||||||||
| Stock-based employee compensation, before tax |
$ | 8,709 | $ | 9,322 | $ | 8,392 | ||||||
| Related income tax benefits |
(3,377 | ) | (3,614 | ) | (3,348 | ) | ||||||
| Stock-based employee compensation, net of tax |
$ | 5,332 | $ | 5,708 | $ | 5,044 | ||||||
For the years ended December 31, 2009, 2008 and 2007, there was $0, $79 and $3,285, respectively, of cash flow from financing activities for excess tax benefits related to equity awards exercised and vested during the year.
68
AMN HEALTHCARE SERVICES, INC.
NOTES TO CONSOLIDATED FINANCIAL STATEMENTS – (Continued)
(11) Commitments and Contingencies
(a) Legal
The Company is subject to various claims and legal actions in the ordinary course of business. Some of these matters include tax, payroll and employee-related matters and investigations by governmental agencies regarding employment practices. As the Company becomes aware of such claims and legal actions, the Company provides accruals if the exposures are probable and estimable. If an adverse outcome of such claims and legal actions is reasonably possible, the Company assesses materiality and provides disclosure, as appropriate.
Staff Care, Inc., an indirect wholly owned subsidiary of the Company, is the subject of an assessment by the California EDD with respect to the payment of certain payroll related taxes, in connection with locum tenens and allied providers, for the period between April 1, 2001 and June 30, 2007. The Company has appealed the EDD’s assessment, but on September 5, 2008 the Company made a payment to the EDD in the amount of $2,295 to cease the accrual of interest while the appeal is pending. Of the $2,295 payment, $1,797 was related to the periods prior to the MHA acquisition, which included Staff Care, Inc., in November 2005 and $498 was related to the post-acquisition period. As part of the acquisition agreement of MHA, the MHA selling shareholders indemnified the Company with respect to the $1,797 related to the pre-acquisition period. On August 31, 2009, the Company signed a settlement agreement with the MHA selling shareholders to release them from any further liability under the assessment in exchange for their release of claim to an additional $1,500 in the holdback reserve. As a result of this settlement, the Company recorded a benefit to pre-tax income in the third quarter of 2009 of $1,500, but will be liable for any future costs related to the EDD assessments. There is potential exposure subsequent to the EDD assessment period, but the Company believes the exposure to be immaterial to its consolidated financial statements.
The Company’s hospital, healthcare facility and physician practice group clients may also become subject to claims, governmental inquiries and investigations and legal actions to which the Company may become a party relating to services provided by its professionals. From time to time, and depending upon the particular facts and circumstances, the Company may be subject to indemnification obligations under its contracts with its hospital, healthcare facility and physician practice group clients relating to these matters.
The Company is currently not aware of any pending or threatened litigation or indemnification claim that would be considered reasonably likely to have a material adverse effect on the Company’s consolidated financial position, results of operations or liquidity.
69
AMN HEALTHCARE SERVICES, INC.
NOTES TO CONSOLIDATED FINANCIAL STATEMENTS – (Continued)
(b) Leases
The Company leases certain office facilities and equipment under various operating and capital leases over the next five years. The Company recognizes rent expense on a straight-line basis over the lease term. Future minimum lease payments under noncancelable operating leases (with initial or remaining lease terms in excess of one year) and future minimum capital lease payments as of December 31, 2009 are as follows:
| Capital Leases |
Operating Leases (1) | ||||||
| Years ending December 31: |
|||||||
| 2010 |
$ | 730 | $ | 12,925 | |||
| 2011 |
728 | 12,500 | |||||
| 2012 |
688 | 11,720 | |||||
| 2013 |
650 | 10,026 | |||||
| 2014 |
72 | 10,013 | |||||
| Thereafter |
— | 36,439 | |||||
| Total minimum lease payments |
$ | 2,868 | $ | 93,623 | |||
| Less amount representing interest (at rates ranging from 0.6% to 11.3%) |
(202 | ) | |||||
| Present value of minimum lease payments |
2,666 | ||||||
| Less current installments of obligations under capital leases |
(644 | ) | |||||
| Obligations under capital leases, excluding current installments |
$ | 2,022 | |||||
| (1) | Total future minimum lease payments have not been reduced by minimum sublease rents of $2,758 expected to be recovered under the operating subleases. |
Fixed assets obtained through capital leases as of December 31, 2009 and 2008 are as follows:
| December 31, | ||||||||
| 2009 | 2008 | |||||||
| Fixed assets |
$ | 3,112 | $ | 3,337 | ||||
| Accumulated amortization |
(687 | ) | (2,013 | ) | ||||
| Fixed assets, net |
$ | 2,425 | $ | 1,324 | ||||
Obligations under capital leases are included in other current and other long-term liabilities in the accompanying consolidated balance sheets. Rent expense under operating leases was $14,551, $16,014, and $16,491 for the years ended December 31, 2009, 2008 and 2007, respectively.
(12) Restructuring
During 2009, the Company made adjustments to its branding strategy and infrastructure. These actions included consolidating office locations and nursing brands and centralizing back office and corporate functions, resulting in reduced overall headcount and facility costs. The restructuring was driven by long-term strategic branding and operational decisions as well as responding to the current economic conditions.
70
AMN HEALTHCARE SERVICES, INC.
NOTES TO CONSOLIDATED FINANCIAL STATEMENTS – (Continued)
A reconciliation of amounts accrued as of December 31, 2009, which was approximate to their fair value due to the short term payment period, is as follows:
| Balance December 31, 2008 |
Accruals | Cash Payments |
Balance December 31, 2009 | ||||||||||
| Employee termination benefits |
$ | — | $ | 4,434 | $ | (4,243 | ) | $ | 191 | ||||
| Contract termination costs and other |
— | 5,950 | (2,884 | ) | 3,066 | ||||||||
| Total |
$ | — | $ | 10,384 | $ | (7,127 | ) | $ | 3,257 | ||||
As of December 31, 2009, $1,538 of the accrued restructuring balance was included in other current liabilities and $1,719 was included in other long-term liabilities in the consolidated balance sheet. The Company expects to substantially utilize the accruals by 2011. Restructuring expenses for the twelve months ended December 31, 2009 include asset impairment charges of $886.
Restructuring expenses by reportable segments are as follows:
| Twelve Months Ended December 31, 2009 | |||
| Nurse and allied healthcare staffing |
$ | 8,993 | |
| Locum tenens staffing |
429 | ||
| Physician permanent placement services |
1,848 | ||
| Total |
$ | 11,270 | |
(13) Quarterly Financial Data (Unaudited)
| Year Ended December 31, 2009 | |||||||||||||||||||
| First Quarter* |
Second Quarter |
Third Quarter |
Fourth Quarter |
Total Year | |||||||||||||||
| (In thousands, except per share data) | |||||||||||||||||||
| Revenue |
$ | 249,595 | $ | 199,140 | $ | 166,357 | $ | 144,698 | $ | 759,790 | |||||||||
| Gross profit |
$ | 63,983 | $ | 53,677 | $ | 45,608 | $ | 41,153 | $ | 204,421 | |||||||||
| Net income (loss) |
$ | (121,834 | ) | $ | 4,374 | $ | (1,995 | ) | $ | (2,722 | ) | $ | (122,177 | ) | |||||
| Net income (loss) per share: |
|||||||||||||||||||
| Basic |
$ | (3.74 | ) | $ | 0.13 | $ | (0.06 | ) | $ | (0.08 | ) | $ | (3.75 | ) | |||||
| Diluted |
$ | (3.74 | ) | $ | 0.13 | $ | (0.06 | ) | $ | (0.08 | ) | $ | (3.75 | ) | |||||
| * | includes impairment charges of $173,007 on goodwill and $2,700 on an indefinite-lived intangible asset. |
| Year Ended December 31, 2008 | |||||||||||||||
| First Quarter |
Second Quarter |
Third Quarter |
Fourth Quarter |
Total Year | |||||||||||
| (In thousands, except per share data) | |||||||||||||||
| Revenue |
$ | 293,593 | $ | 312,691 | $ | 315,014 | $ | 295,902 | $ | 1,217,200 | |||||
| Gross profit |
$ | 77,455 | $ | 82,538 | $ | 81,060 | $ | 75,936 | $ | 316,989 | |||||
| Net income |
$ | 8,723 | $ | 8,515 | $ | 9,495 | $ | 7,624 | $ | 34,357 | |||||
| Net income per share: |
|||||||||||||||
| Basic |
$ | 0.26 | $ | 0.25 | $ | 0.29 | $ | 0.23 | $ | 1.03 | |||||
| Diluted |
$ | 0.26 | $ | 0.25 | $ | 0.28 | $ | 0.23 | $ | 1.02 | |||||
71
| Item 9. | Changes In and Disagreements With Accountants on Accounting and Financial Disclosure |
None.
| Item 9A. | Controls and Procedures |
(1) Evaluation of Disclosure Controls and Procedures
We carried out an evaluation, under the supervision and with the participation of our management, including our principal executive officer and principal financial officer, of the effectiveness of our disclosure controls and procedures, as defined in Rules 13a-15(e) and 15d-15(e) of the Exchange Act. Based on that evaluation, our Chief Executive Officer and Chief Financial Officer have concluded that our disclosure controls and procedures as of December 31, 2009 were effective to ensure that information required to be disclosed by us in reports that we file or submit under the Exchange Act is recorded, processed, summarized and reported within the time periods specified in the Securities and Exchange Commission’s rules and forms.
(2) Management’s Annual Report on Internal Control Over Financial Reporting
Our management is responsible for establishing and maintaining adequate internal control over financial reporting, as such term is defined in Rules 13a-15(f) of the Exchange Act. Under the supervision and with the participation of our management, including our Chief Executive Officer and Chief Financial Officer, we conducted an evaluation of the effectiveness of our internal control over financial reporting based on the framework in Internal Control—Integrated Framework issued by the Committee of Sponsoring Organizations of the Treadway Commission (COSO). Because of its inherent limitations, internal control over financial reporting may not prevent or detect misstatements. Also, projections of any evaluation of effectiveness to future periods are subject to the risk that controls may become inadequate because of changes in conditions, or that the degree of compliance with the policies or procedures may deteriorate. Based on our evaluation, management concluded that our internal control over financial reporting was effective as of December 31, 2009.
The effectiveness of our internal control over financial reporting as of December 31, 2009 has been audited by KPMG LLP, an independent registered public accounting firm, as stated in their report which is included herein.
(3) Changes in Internal Control Over Financial Reporting
There were no changes in our internal control over financial reporting that occurred during the quarter ended December 31, 2009 that have materially affected, or are reasonably likely to materially affect, our internal control over financial reporting.
72
(4) Report of Independent Registered Public Accounting Firm
The Board of Directors and Stockholders
AMN Healthcare Services, Inc.:
We have audited AMN Healthcare Services, Inc. and subsidiaries (the Company), internal control over financial reporting as of December 31, 2009, based on criteria established in Internal Control—Integrated Framework issued by the Committee of Sponsoring Organizations of the Treadway Commission (COSO). The Company’s management is responsible for maintaining effective internal control over financial reporting and for its assessment of the effectiveness of internal control over financial reporting, included in the accompanying Managements’ Annual Report on Internal Control over Financial Reporting. Our responsibility is to express an opinion on the Company’s internal control over financial reporting based on our audit.
We conducted our audit in accordance with the standards of the Public Company Accounting Oversight Board (United States). Those standards require that we plan and perform the audit to obtain reasonable assurance about whether effective internal control over financial reporting was maintained in all material respects. Our audit included obtaining an understanding of internal control over financial reporting, assessing the risk that a material weakness exists, and testing and evaluating the design and operating effectiveness of internal control based on the assessed risk. Our audit also included performing such other procedures as we considered necessary in the circumstances. We believe that our audit provides a reasonable basis for our opinion.
A company’s internal control over financial reporting is a process designed to provide reasonable assurance regarding the reliability of financial reporting and the preparation of financial statements for external purposes in accordance with generally accepted accounting principles. A company’s internal control over financial reporting includes those policies and procedures that (1) pertain to the maintenance of records that, in reasonable detail, accurately and fairly reflect the transactions and dispositions of the assets of the company; (2) provide reasonable assurance that transactions are recorded as necessary to permit preparation of financial statements in accordance with generally accepted accounting principles, and that receipts and expenditures of the company are being made only in accordance with authorizations of management and directors of the company; and (3) provide reasonable assurance regarding prevention or timely detection of unauthorized acquisition, use, or disposition of the company’s assets that could have a material effect on the financial statements.
Because of its inherent limitations, internal control over financial reporting may not prevent or detect misstatements. Also, projections of any evaluation of effectiveness to future periods are subject to the risk that controls may become inadequate because of changes in conditions, or that the degree of compliance with the policies or procedures may deteriorate.
In our opinion, AMN Healthcare Services, Inc. and subsidiaries maintained, in all material respects, effective internal control over financial reporting as of December 31, 2009, based on criteria established in Internal Control—Integrated Framework issued by the Committee of Sponsoring Organizations of the Treadway Commission (COSO).
We also have audited, in accordance with the standards of the Public Company Accounting Oversight Board (United States), the consolidated balance sheets of AMN Healthcare Services, Inc. and subsidiaries as of December 31, 2009 and 2008, and the related consolidated statements of operations, stockholders’ equity and comprehensive income (loss), and cash flows for each of the years in the three-year period ended December 31, 2009, and the related financial statement schedule of valuation and qualifying accounts, and our report dated March 5, 2010 expressed an unqualified opinion on those consolidated financial statements and financial statement schedule.
/s/ KPMG LLP
San Diego, California
March 5, 2010
73
| Item 9B. | Other Information |
None.
PART III
| Item 10. | Directors, Executive Officers and Corporate Governance |
Information required by this item, other than the following information concerning our Code of Ethics for Senior Financial Officers, is incorporated by reference to the Proxy Statement under the headings “Nominees for the Board of Directors” and “Non-Director Executive Officers” to be distributed in connection with our Annual Meeting of Stockholders to be held on April 14, 2010.
We have adopted a Code of Ethics for Senior Financial Officers that applies to our principal executive officer, principal financial officer, and principal accounting officer or any person performing similar functions, which is posted on our website at www.amnhealthcare.com/investors. We intend to publish any amendment to, or waiver from, the Code of Ethics for Senior Financial Officers on our website.
| Item 11. | Executive Compensation |
Information required by this item is incorporated by reference to the Proxy Statement under the heading “Executive Compensation Disclosure” to be distributed in connection with our Annual Meeting of Stockholders to be held on April 14, 2010.
| Item 12. | Security Ownership of Certain Beneficial Owners and Management and Related Stockholder Matters |
Information required by this item is incorporated by reference to the Proxy Statement under the heading “Security Ownership of Certain Beneficial Owners and Management” to be distributed in connection with our Annual Meeting of Stockholders to be held on April 14, 2010.
| Item 13. | Certain Relationships and Related Transactions, and Director Independence |
Information required by this item is incorporated by reference to the Proxy Statement under the heading “Director Independence” to be distributed in connection with our Annual Meeting of Stockholders to be held on April 14, 2010.
| Item 14. | Principal Accountant Fees and Services |
Information required by this item is incorporated by reference to the Proxy Statement under the heading “Independent Registered Public Accounting Firm” to be distributed in connection with our Annual Meeting of Stockholders to be held on April 14, 2010.
74
PART IV
| Item 15. | Exhibits and Financial Statement Schedules |
(a) Documents filed as part of the report.
| (1) Consolidated Financial Statements |
| Report of Independent Registered Public Accounting Firm |
| Consolidated Balance Sheets as of December 31, 2009 and 2008 |
| Consolidated Statements of Operations for the years ended December 31, 2009, 2008 and 2007 |
| Consolidated Statements of Stockholders’ Equity and Comprehensive Income (Loss) for the years ended December 31, 2009, 2008 and 2007 |
| Consolidated Statements of Cash Flows for the years ended December 31, 2009, 2008 and 2007 |
| Notes to Consolidated Financial Statements |
| (2) Financial Statement Schedules |
| Schedule II—Valuation and Qualifying Accounts |
All other schedules have been omitted because the required information is presented in the financial statements or notes thereto, the amounts involved are not significant or the schedules are not applicable.
| (3) Exhibits |
| Exhibit |
Description | |
| 3.1 | Amended and Restated Certificate of Incorporation of AMN Healthcare Services, Inc.*** | |
| 3.2 | Sixth Amended and Restated By-Laws of AMN Healthcare Services, Inc., dated February 17, 2009 (incorporated by reference to the exhibit filed with the Registrant’s Current Report on Form 8-K dated February 17, 2009). | |
| 4.1 | Specimen Stock Certificate.*** | |
| 4.2 | Credit Agreement, dated as of December 23, 2009, by and among AMN Healthcare, Inc., as borrower (the “Borrower”), AMN Healthcare Services, Inc., AMN Services, Inc., O’Grady-Peyton International (USA), Inc., International Healthcare Recruiters, Inc., AMN Staffing Services, Inc., The MHA Group Inc., Merritt, Hawkins & Associates, AMN Healthcare Allied, Inc., RN Demand, Inc., Staff Care, Inc., MHA Allied Consulting, Inc., AMN Allied Services, LLC, Lifework, Inc., Pharmacy Choice, Inc., and Rx Pro Health, Inc. as guarantors, the lenders identified on the signature pages thereto and Bank of America, N.A., as administrative agent (incorporated by reference to the exhibits filed with the Registrant’s Current Report on Form 8-K dated December 29, 2009). | |
| 10.1 | Office Lease, dated as of April 2, 2002, between Kilroy Realty, L.P. and AMN Healthcare, Inc.**** | |
| 10.2 | AMN Healthcare Services, Inc. 2001 Stock Option Plan. (Management Contract or Compensatory Plan or Arrangement)** | |
| 10.3 | AMN Healthcare Services, Inc. Senior Management Bonus Plan. (Management Contract or Compensatory Plan or Arrangement) (incorporated by reference to the exhibits filed with the Registrant’s 2008 Proxy Statement, filed March 3, 2009). | |
| 10.4 | 2001 Stock Option Plan Stock Option Agreement, dated as of January 17, 2002, between the Registrant and Susan Nowakowski (Management Contract or Compensatory Plan or Arrangement).**** | |
75
| 10.5 | 2001 Stock Option Plan Stock Option Agreement, dated as of January 17, 2002, between the Registrant and Andrew Stern (Management Contract or Compensatory Plan or Arrangement).**** | |
| 10.6 | Stock Option Plan (incorporated herein by reference to the Registrant’s Proxy Statement, Schedule 14A filed with the Commission on April 14, 2004 (SEC File No. 1-16753)). | |
| 10.7 | Stock Option Plan Stock Option Agreement, dated as of May 18, 2004, between the Registrant and Andrew M. Stern (Management Contract or Compensatory Plan or Arrangement)***** | |
| 10.8 | Stock Option Plan Stock Option Agreement, dated as of May 18, 2004, between the Registrant and Susan R. Nowakowski (Management Contract or Compensatory Plan or Arrangement)***** | |
| 10.9 | Stock Option Plan Stock Option Agreement, dated as of May 18, 2004, between the Registrant and Denise L. Jackson (Management Contract or Compensatory Plan or Arrangement)***** | |
| 10.10 | Stock Option Plan Stock Option Agreement, dated as of January 17, 2002, between the Registrant and Denise L. Jackson (Management Contract or Compensatory Plan or Arrangement)***** | |
| 10.11 | Stock Option Plan Stock Option Agreement, dated as of May 8, 2003, between the Registrant and Denise L. Jackson (Management Contract or Compensatory Plan or Arrangement)***** | |
| 10.12 | Employment Agreement, dated as of May 4, 2005, between AMN Healthcare, Inc. and Susan R. Nowakowski. (Management Contract or Compensatory Plan or Arrangement)******* | |
| 10.13 | Stock Option Plan Stock Option Agreement, dated as of September 28, 2005, between the Registrant and Douglas D. Wheat (incorporated by reference to the exhibits filed with the Registrant’s Quarterly Report on Form 10-Q for the quarter ended September 30, 2005). | |
| 10.14 | Form of Indemnification Agreement—Officer and Director* | |
| 10.15 | Form of AMN Healthcare Equity Plan Stock Appreciation Right Agreement—Director****** | |
| 10.16 | Form of AMN Healthcare Equity Plan Restricted Stock Unit Agreement—Director****** | |
| 10.17 | Form of AMN Healthcare Equity Plan Stock Appreciation Right Agreement—Officer****** | |
| 10.18 | Form of AMN Healthcare Equity Plan Restricted Stock Unit Agreement—Officer****** | |
| 10.19 | AMN Healthcare Equity Plan, as Amended and Restated (incorporated by reference to Appendix 1 of AMN Healthcare Services, Inc.’s 2009 Definitive Proxy Statement on Schedule 14A, filed on March 4, 2009). | |
| 10.20 | Executive Severance Agreement between AMN Healthcare, Inc. and Denise J. Jackson, dated February 6, 2008. (Management Contract or Compensatory Plan or Arrangement)******** | |
| 10.21 | Executive Severance Agreement between AMN Healthcare, Inc. and David C, Dreyer, dated February 6, 2008. (Management Contract or Compensatory Plan or Arrangement)******** | |
| 10.22 | Executive Severance Agreement between AMN Healthcare, Inc. and Ralph Henderson, dated February 6, 2008. (Management Contract or Compensatory Plan or Arrangement)******** | |
| 10.23 | First Amendment to Employment Agreement, dated as of February 6, 2008, between AMN Healthcare, Inc. and Susan R. Nowakowski. (Management Contract or Compensatory Plan or Arrangement)******** | |
| 10.24 | The 2005 Amended and Restated Executive Nonqualified Excess Plan of AMN Healthcare, Inc., effective January 1, 2009 (incorporated by reference to the exhibits filed with the Registrant’s Quarterly Report on Form 10-Q for the quarter ended September 30, 2008). | |
| 10.25 | Employment Offer Letter to Bary Bailey, dated July 12, 2009 (incorporated by reference to the exhibits filed with the Registrant’s Quarterly Report on Form 10-Q for the quarter ended June 30, 2009). | |
76
| 10.26 | Executive Severance Agreement between AMN Healthcare, Inc., and Bary Bailey, dated August 10, 2009 (incorporated by reference to the exhibits filed with the Registrant’s Quarterly Report on Form 10-Q for the quarter ended June 30, 2009). | |
| 21.1 | Subsidiaries of the Registrant.* | |
| 23.1 | Consent of Independent Registered Public Accounting Firm.* | |
| 31.1 | Certification by Susan R. Nowakowski pursuant to Rule 13a-14(a) of the Securities Exchange Act of 1934* | |
| 31.2 | Certification by Bary G. Bailey pursuant to Rule 13a-14(a) of the Securities Exchange Act of 1934* | |
| 32.1 | Certification by Susan R. Nowakowski pursuant to 18 U.S.C. Section 1350, as adopted pursuant to Section 906 of the Sarbanes-Oxley Act of 2002* | |
| 32.2 | Certification by Bary G. Bailey pursuant to 18 U.S.C. Section 1350, as adopted pursuant to Section 906 of the Sarbanes-Oxley Act of 2002* | |
| * | Filed herewith. |
| ** | Incorporated by reference to the exhibits filed with the Registrant’s Registration Statement on Form S-1 (File No. 333-65168). |
| *** | Incorporated by reference to the exhibits filed with the Registrant’s Annual Report on Form 10-K for the fiscal year ended December 31, 2001. |
| **** | Incorporated by reference to the exhibits filed with the Registrant’s Registration Statement on Form S-1 (File No. 333-86952). |
| ***** | Incorporated by reference to the exhibits filed with the Registrant’s Annual Report on Form 10-K for the fiscal year ended December 31, 2004. |
| ****** | Incorporated by reference to the exhibit filed with the Registrant’s Current Report on Form 8-K dated April 13, 2006. |
| ******* | Incorporated by reference to the exhibits filed with the Registrant’s Quarterly Report on Form 10-Q for the quarter ended March 31, 2005. |
| ******** | Incorporated by reference to the exhibit filed with the Registrant’s Current Report on Form 8-K dated February 12, 2008. |
77
Pursuant to the requirements of Section 13 or 15(d) of the Securities Exchange Act of 1934, the registrant has duly caused this report to be signed on its behalf by the undersigned thereunto duly authorized.
| AMN HEALTHCARE SERVICES, INC. | ||
| /s/ SUSAN R. NOWAKOWSKI | ||
| Susan R. Nowakowski President and Chief Executive Officer | ||
Date: March 5, 2010
Pursuant to the requirements of the Securities Exchange Act of 1934, this report has been signed below by the following persons on behalf of the registrant and in the capacities indicated and on the 5th day of March, 2010.
| /S/ SUSAN R. NOWAKOWSKI Susan R. Nowakowski Director, President and Chief Executive Officer (Principal Executive Officer) |
| /S/ BARY G. BAILEY Bary G. Bailey Chief Accounting Officer, Chief Financial Officer and Treasurer (Principal Accounting and Financial Officer) |
| /S/ DOUGLAS D. WHEAT Douglas D. Wheat Director and Chairman of the Board |
| /S/ R. JEFFREY HARRIS R. Jeffrey Harris Director |
| /S/ MICHAEL M.E. JOHNS Michael M.E. Johns Director |
| /S/ HALA MODDELMOG Hala Moddelmog Director |
| /S/ ANDREW M. STERN Andrew M. Stern Director |
| /S/ PAUL E. WEAVER Paul E. Weaver Director |
78
Schedule II
AMN HEALTHCARE SERVICES, INC.
VALUATION AND QUALIFYING ACCOUNTS
For Years Ended December 31, 2009, 2008 and 2007
(in thousands)
| Allowances for Doubtful Accounts and Sales Credits |
Additions | |||||||||||||||
| Balance at the Beginning of Year |
Expenses and Other Costs (A) |
Revenue Reductions (B) |
Deduction (C) | Balance at End of Year | ||||||||||||
| Year ended December 31, 2007 |
$ | 3,250 | $ | 3,712 | $ | 290 | $ | (3,647 | ) | $ | 3,605 | |||||
| Year ended December 31, 2008 |
$ | 3,605 | $ | 4,564 | $ | 1,840 | $ | (5,467 | ) | $ | 4,542 | |||||
| Year ended December 31, 2009 |
$ | 4,542 | $ | 3,143 | $ | 1,191 | $ | (3,567 | ) | $ | 5,309 | |||||
| (A) | Includes increases in allowance for doubtful accounts. |
| (B) | Includes increases in sales allowance for potential credits issued to customers. |
| (C) | Includes actual write-offs of uncollectible accounts receivable and credits issued for sales adjustments. |
See accompanying report of independent registered public accounting firm.
79