Attached files
| file | filename |
|---|---|
| EX-21 - EXHIBIT 21 - SAUER DANFOSS INC | a2196918zex-21.htm |
| EX-23.1 - EXHIBIT 23.1 - SAUER DANFOSS INC | a2196918zex-23_1.htm |
| EX-32.2 - EXHIBIT 32.2 - SAUER DANFOSS INC | a2196918zex-32_2.htm |
| EX-32.1 - EXHIBIT 32.1 - SAUER DANFOSS INC | a2196918zex-32_1.htm |
| EX-31.1 - EXHIBBIT 31.1 - SAUER DANFOSS INC | a2196918zex-31_1.htm |
| EX-31.2 - EXHIBIT 31.2 - SAUER DANFOSS INC | a2196918zex-31_2.htm |
| EX-10.1(Q) - EXHIBIT 10.1(Q) - SAUER DANFOSS INC | a2196918zex-10_1q.htm |
| EX-10.1(L) - EXHIBIT 10.1(L) - SAUER DANFOSS INC | a2196918zex-10_1l.htm |
| EX-10.1(K) - EXHIBIT 10.1(K) - SAUER DANFOSS INC | a2196918zex-10_1k.htm |
| EX-10.1(X) - EXHIBIT 10.1(X) - SAUER DANFOSS INC | a2196918zex-10_1x.htm |
| EX-10.1(Y) - EXHIBIT 10.1(Y) - SAUER DANFOSS INC | a2196918zex-10_1y.htm |
| EX-10.1(AQ) - EXHIBIT 10.1(AQ) - SAUER DANFOSS INC | a2196918zex-10_1aq.htm |
QuickLinks -- Click here to rapidly navigate through this document
SECURITIES AND EXCHANGE COMMISSION
Washington, DC 20549
FORM 10-K
ANNUAL REPORT PURSUANT TO SECTION 13 OR 15(d)
OF THE SECURITIES EXCHANGE ACT OF 1934
FOR THE FISCAL YEAR ENDED DECEMBER 31, 2009
COMMISSION FILE NUMBER: 1-14097
SAUER-DANFOSS INC.
(Exact name of registrant as specified in its charter)
| Delaware | 36-3482074 | |
| (State or other jurisdiction of incorporation or organization) |
(I.R.S. Employer Identification No.) |
|
2800 E. 13th Street, Ames, Iowa |
50010 |
|
| Krokamp 35, Neumünster, Germany | 24539 | |
| (Address of principal executive offices) | (Zip Code) |
(515) 239-6000
(Registrant's telephone number, including Area Code)
Securities registered pursuant to Section 12(b) of the Act:
| Common Stock, par value $0.01 per share | New York Stock Exchange | |
|---|---|---|
| (Title of each class) | (Name of each exchange on which registered) |
Securities registered pursuant to Section 12(g) of the Act:
None
(Title of class)
Indicate by check mark if the registrant is a well-known seasoned issuer, as defined in Rule 405 of the Securities Act of 1933. Yes o No ý
Indicate by check mark if the registrant is not required to file reports pursuant to Section 13 or 15(d) of the Securities Exchange Act of 1934 (the "Act"). Yes o No ý
Indicate by check mark whether the registrant: (1) has filed all reports required to be filed by Section 13 or 15(d) of the Act during the preceding 12 months (or for such shorter periods that the Registrant was required to file such reports), and (2) has been subject to such filing requirements for the past 90 days. Yes ý No o
Indicate by check mark whether the registrant has submitted electronically and posted on its corporate Web site, if any, every Interactive Data File required to be submitted and posted pursuant to Rule 405 of Regulation S-T (§ 232.405 of this chapter) during the preceding 12 months (or for such shorter period that the registrant was required to submit and post such files). Yes o No o
Indicate by check mark if disclosure of delinquent filers pursuant to Item 405 of Regulation S-K is not contained herein, and will not be contained, to the best of registrant's knowledge, in definitive proxy or information statements incorporated by reference in Part III of this Form 10-K or any amendment to this Form 10-K: ý
Indicate by check mark whether the registrant is a large accelerated filer, an accelerated filer, a non-accelerated filer, or a smaller reporting company. See the definitions of "large accelerated filer," "accelerated filer," and "smaller reporting company" in Rule 12b-2 of the Exchange Act.
| Large accelerated filer o | Accelerated filer ý | Non-accelerated filer o (Do not check if a smaller reporting company) |
Smaller reporting company o |
Indicate by check mark whether the registrant is a shell company (as defined in Rule 12b-2 of the Act): Yes o No ý
The aggregate market value of the voting common stock of the registrant held by nonaffiliates based on the last sale price on June 30, 2009 was $69,370,059. (The registrant does not have any other authorized common equity.)
As of March 1, 2010 there were 48,389,406 shares of common stock, $0.01 par value, of the registrant outstanding.
DOCUMENTS INCORPORATED BY REFERENCE
Portions of the Proxy Statement for the annual meeting of stockholders to be held June 11, 2010 are incorporated by reference into Part III.
(a) General Development of Business
Sauer-Danfoss Inc. (the Company), a U.S. Delaware corporation, and its predecessor organizations have been active in the mobile hydraulics industry since the 1960s. Sauer-Danfoss is a global leader in the development, manufacture, and marketing of advanced systems for the distribution and control of power in mobile equipment. The Company designs, manufactures, and markets hydraulic, electronic, electric, and mechanical components, as well as software and integrated systems that generate, transmit, and control power in mobile equipment. Principal products are hydrostatic transmissions, open circuit piston pumps, open circuit gear pumps and motors, low speed high torque motors, steering units, microprocessor controls, electrohydraulics, and control valves. The Company sells its products to original equipment manufacturers (OEMs) of highly engineered, off-road vehicles who use Sauer-Danfoss products to provide the hydraulic and electronic power for the propel, work, and control functions of their vehicles. The Company's products are sold primarily to the agriculture, construction, road building, turf care, material handling, and specialty vehicle markets. The Company conducts its business globally under the Sauer-Danfoss name.
In 2009 the Company completed the sale of its alternating current (AC) electric motor business which sold products into the material handling market. This resulted in total expense of approximately $14.7 million, of which $6.3 million and $8.4 million was recognized in 2009 and 2008, respectively. This expense was reported in the Controls segment. During 2009 the Company also sold the assets of its steering column business which was located in Kolding, Denmark. The loss on sale of the business of $2.7 million was reported in the Work Function segment.
In July 2009 the Company and Topcon Positioning Systems, Inc. (Topcon), the noncontrolling interest partner, agreed to terminate the joint venture they have operated since April 2001 through TSD Integrated Controls, LLC (TSD). The termination was effective September 1, 2009 but is subject to a three-year wind-down period as contemplated in the 2001 Joint Venture Agreement.
On December 22, 2009 Danfoss A/S, the majority stockholder of the Company, issued a press release announcing its intention, through its wholly owned subsidiary, Danfoss Acquisition, Inc., to commence a cash tender offer to be followed (in certain circumstances) by a statutory merger for the purpose of acquiring all the outstanding shares of Company common stock not already owned, directly or indirectly, by Danfoss A/S for a price of $10.10 per share. On January 15, 2010 Danfoss issued a press release announcing an indeterminate delay in launching its proposed tender offer. As of March 3, 2010 Danfoss had not commenced the proposed tender offer.
(b) Financial Information About Segments
The Company reports its operating segments based on its product lines of Propel, Work Function, and Controls. Propel products include hydrostatic transmissions and related products that transmit the power from the engine to the wheel to propel a vehicle. Work Function products include steering motors as well as gear pumps and motors that transmit power for the work functions of the vehicle. Products in the Controls segment include electrohydraulic controls, microprocessors, and valves that control and direct the power of a vehicle. Information about the Company's reportable segments defined by product lines is set forth in Note 17 in the Notes to Consolidated Financial Statements on pages F-37 through F-39 of this report and is incorporated herein by reference.
(c) Description of Business
Information regarding the Company's principal products, by segment, and the business in general is presented below. Information regarding sales by the Company's segments and geographic regions is set
2
forth in Note 17 in the Notes to Consolidated Financial Statements on pages F-37 through F-39, and is incorporated herein by reference. No individual customer accounted for 10 percent or more of the Company's total net sales in 2009, 2008, or 2007.
Propel Segment
Hydrostatic Transmissions
Sauer-Danfoss designs, manufactures, and markets a range of closed circuit axial and bent axis piston hydrostatic transmissions for the propulsion of mobile equipment in the Americas, Europe, and Asia-Pacific region. High-power (typically over 50 HP) and medium-power (typically 25 to 50 HP) applications for hydrostatic transmissions manufactured by the Company include construction, road building, specialty, and agricultural mobile equipment. Light-power (typically 15 to 25 HP) and bantam-power (typically under 15 HP) applications for hydrostatic transmissions manufactured by the Company include light agricultural and turf care mobile equipment. The Company manufactures these hydrostatic transmissions at its facilities in Ames, Iowa; Sullivan, Illinois; Princeton, Kentucky; Freeport, Illinois; Neumünster, Germany; Dubnica nad Váhom, Slovakia; Povazská Bystrica, Slovakia; Shanghai, China; and Osaka, Japan.
Open Circuit Piston Pumps
Sauer-Danfoss designs, manufactures, and markets open circuit piston pumps used to transform mechanical power from the engine to hydraulic power for the various functions of the vehicle. The advantages of open circuit piston pumps compared to other types of pumps, such as vane or gear pumps, are the high degree of control within the work function hydraulic system and the more efficient use of engine power. These products are designed and manufactured at facilities in Ames, Iowa and Dubnica nad Váhom, Slovakia.
Work Function Segment
Open Circuit Gear Pumps and Motors
Sauer-Danfoss designs, manufactures, and markets a broad range of high-performance standard gear pumps and motors. Gear pumps and motors are the most widely used type of mobile hydraulic pumps and motors in the industry. The Company manufactures gear pumps and motors at its Lawrence, Kansas; Bologna, Italy; and Povazská Bystrica, Slovakia facilities.
Low Speed High Torque Motors
Sauer-Danfoss designs, manufactures, and markets a complete line of geroller and gerotor motors used for both propel and work functions in all served markets. These motors are manufactured at the Company's Lawrence, Kansas; Nordborg, Denmark; and Bielany Wroclawskie, Poland facilities.
Steering Units
Sauer-Danfoss designs, manufactures, and markets hydrostatic steering units to customers throughout the world. These steering units convert steering wheel motion into hydraulic flow and pressure to provide steering motion for agricultural tractors, combines, turf care, marine, and earthmoving equipment. The Company manufactures steering units in Nordborg, Denmark; Wroclaw, Poland; and Pune, India.
3
Controls Segment
Mobile Electronics
Sauer-Danfoss designs, manufactures and markets a portfolio of electronic controls, including microprocessor-based controllers (both generic type to control any mobile machinery and specialized to control speed variability of alternating current electric motors), intelligent displays, joysticks and electronic sensors through its electronic and mechatronic operations in Minneapolis, Minnesota; Älmhult, Sweden; Kaiserslautern, Germany; Neumünster, Germany; and Nordborg, Denmark. The software to integrate all these components into systems is also developed by Sauer-Danfoss and licensed to customers to let them develop their own solutions in an easy-to-use, graphical environment. Electronic controls and software are used by OEMs to network hydrostatic transmissions and work function hydraulics of mobile equipment into comfortable, safe and efficient systems. The Company divested its alternating current (AC) electric motors and generators business in 2009.
Control Valves
Sauer-Danfoss designs, manufactures and markets a variety of spool type control valves to meet its customers' needs, ranging from very sophisticated electrohydraulic valves for highly sophisticated forestry and agricultural harvesting equipment, to very simple low-cost valves for compact utility tractors. These products are manufactured in facilities located in Caxias do Sul, Brazil; Nordborg, Denmark; Easley, South Carolina; and Pune, India.
The Company also designs, manufactures and markets a complete line of cartridge valves and hydraulic integrated circuits in facilities located in Reggio Emilia, Italy; Easley, South Carolina; and Caxias do Sul, Brazil. Aerial lift platforms and road building equipment are significant users of cartridge valves.
Major Markets and Applications
Construction and Road Building
|
Agriculture and Turf Care | Material Handling and Specialty Vehicles |
||
|---|---|---|---|---|
Chip spreaders |
Combines |
Industrial lift trucks | ||
Concrete pumps |
Commercial wide-area, |
Logging equipment | ||
Concrete saws |
walk-behind mowers |
Marine equipment | ||
Crawler dozers |
Commercial zero-turn mowers |
Mining equipment | ||
Crawler loaders |
Cotton pickers |
Oil field equipment | ||
Ditchers/trenchers |
Detasslers |
Railway maintenance vehicles | ||
Excavators |
General turf maintenance |
Rough terrain fork lifts | ||
Grinders |
equipment |
Self-propelled boom aerial lifts | ||
Landfill compactors |
Harvesters |
Self-propelled scissor aerial lifts | ||
Pavers |
Lawn and garden tractors |
Snow groomers | ||
Planers |
Seeders |
Sweepers | ||
Rollers |
Sprayers |
Tree shakers | ||
Skid steer loaders |
Tractors |
Truck and bus fan drives | ||
Transit mixers |
Windrowers |
Warehouse trucks | ||
Utility tractors |
||||
Wheel loaders |
General Characteristics
Sauer-Danfoss sells both standard and customized products, with most products being built to order. With respect to some of the most technologically demanding vehicles, such as those used in agriculture, forestry, construction, and road building, Sauer-Danfoss' engineers work closely with customers from design through manufacture of the final product. The research and design phase, which is funded by the
4
Company, can range from a few weeks to as long as four to six years for a major application. Once the design has been accepted and the customer has placed an order, the manufacturing process typically takes only a few days.
Sauer-Danfoss operates 20 manufacturing facilities in the Americas, Europe, and the Asia-Pacific region. The Company's decentralized manufacturing capabilities allow it to adapt its products to local market needs and to provide flexibility to meet customer delivery requirements. The Company sells and distributes its products directly to large OEMs and serves smaller OEMs through Company-owned sales companies or independent distributors.
In accordance with standard industry practice for the mobile equipment industry, the Company warrants its products to be free from defects in material and workmanship. The warranty period varies from one to three years, from the date of first use or date of manufacture, depending on the type of product or, in some cases, the application. The Company's warranty expense has been two percent or less of net sales in each of the past three years.
Because many of its products are designed and developed in conjunction with its customers' design teams to fit their specific needs and to minimize inventory levels, the Company primarily manufactures products to order. The Company typically machines components with long lead times according to a sales forecast and machines certain unique components for specific customers according to firm orders. Inventories at the Company's manufacturing sites consist primarily of raw materials and machined iron housings and components. Limited amounts of assembled finished units are maintained in inventory at the manufacturing sites. Some of the Company's sales locations maintain inventory that consists primarily of finished units manufactured specifically for distribution to customers in those locations.
The Company does not accept orders subject to late delivery penalties. On occasion, the Company sells its products to government agencies, including those used for military applications, but it does not design its products to meet specific government standards and usually only enters into contracts for the supply of commercial products. There are no government contracts of material value to the Company.
Raw Materials
The Company purchases iron housings and components from various U.S., European, and Asian foundries and metal suppliers. The principal materials used by the Company are iron, steel, brass, and aluminum. All materials used by the Company are generally available from a number of sources in quantities sufficient to meet current requirements. The Company has a global supplier quality program that it uses to ensure all suppliers meet the Company's quality expectations.
Patents, Trademarks, and Licenses
The Company owns or licenses rights to approximately 560 patents and trademarks relating to its business. While the Company considers its patents and trademarks important in the operation of its business and in protecting its technology from being used by competitors, its business is not dependent on any single patent or trademark or group of related patents or trademarks.
To ensure worldwide availability of the Company's design of products, the Company has, in the past, licensed its technology to unaffiliated companies in certain countries. The Company does not currently have any such license agreements in place. The Company currently has license agreements in place as part of joint ventures in which the Company participates to manufacture or distribute the Company's technology.
Seasonality
Seasonal patterns in retail demand for agricultural, construction, road building, and turf care equipment sold by the Company's customers result in variations in the volume and mix of products sold by
5
the Company during various times of the year. Historically, the Company has higher sales levels in the first half of the year. Seasonal demand must be estimated in advance, and products must be manufactured in anticipation of such demand in order to achieve efficient utilization of labor and production resources.
Working Capital
The Company has historically funded its working capital requirements through cash flow from operations and its various credit facilities. As described in Note 8 in the Notes to the Consolidated Financial Statements on page F-21 of this report, the Company has a credit facility in place which allows them to borrow up to $690 million from Danfoss A/S, the Company's majority shareholder. The Company is heavily reliant on Danfoss A/S as its primary external source of working capital financing.
Backlog
At December 31, 2009 the Company's backlog (consisting of accepted but unfilled customer orders primarily scheduled for delivery during 2010) was $509 million, a decrease of 33 percent from December 31, 2008, excluding the impact of currency fluctuation. Historically, backlog comparisons have been a good indicator of the Company's future business level, but the value of those comparisons depends on the degree to which customer ordering behavior remains constant from year to year. Customers can increase, cancel, or reschedule orders, so some customers place orders in excess of their actual needs in order to ensure that adequate quantities will be available. In such a case, the customer may ultimately cancel a portion of its order. The 33 percent decline in backlog is compared to an inflated backlog from a year ago before many of the Company's customers had started to cut orders and is not reflective of the improvement in sales the Company is seeing in 2010.
Competition
The mobile hydraulics industry is very competitive. Sauer-Danfoss competes based on technological product innovation, quality, and customer service. The Company believes that to be successful over the long term, suppliers to mobile equipment manufacturers must have the ability to capitalize on the changing needs of the industry by providing technological innovation, shorter product development times, and reduced manufacturing lead times at globally competitive price levels.
Hydrostatic Transmission Market
The closed circuit hydrostatic transmission market is highly concentrated and intensely competitive. There are a small number of manufacturers of hydrostatic transmissions with which the Company competes worldwide that are not captive suppliers of OEMs. These include Bosch Rexroth AG, Eaton Corporation, and Linde AG. In addition, the Company competes with alternative products, such as mechanical transmissions of other manufacturers.
The Company competes with a number of smaller companies that typically offer a single, specialized product on a more limited geographic basis as a component of a closed circuit hydrostatic transmission system.
In terms of global supply of closed circuit hydrostatic transmissions, the Company believes it is the world leader in terms of product range, market share, and geographic coverage. Only Bosch Rexroth AG offers similar geographic coverage.
Open Circuit Piston Pumps, Gear Pumps and Motors Market
The open circuit work function market is fragmented with a large number of suppliers of all types of products and with intensive competition on pricing at the component level. There are approximately ten major companies that compete on a global basis, including Bosch Rexroth AG, Parker-Hannifin
6
Corporation, Casappa S.p.A. and Haldex, and in Japan, Shimadzu Corporation. The supply of standard gear pumps and motors is particularly fragmented with more than 50 companies worldwide in each respective area. Most of these competitors have a limited product range and operate in a limited geographic market. The market for these products is rapidly increasing for engine cooling fan drive applications being requested for upcoming new emissions regulations.
Low Speed High Torque Motor Market
There are a limited number of competitors who can provide a complete line of low speed, high torque motors (LSHT). Competitors include Eaton Corporation, Bosch Rexroth AG, White Drive Products, Parker-Hannifin Corporation, and M+S Hydraulic. This market is highly price-competitive and is growing, providing Sauer-Danfoss opportunity to develop new products to increase market share.
Steering Unit Market
Hydrostatic steering units are provided to the market from more than ten competitors, the major ones being Eaton Corporation, Zhenjiang Hydraulic Components Manufacturing Co., Ltd., Ognibene S.p.A., Bosch Rexroth AG, M+S Hydraulic and Parker-Hannifin Corporation. Sauer-Danfoss believes it has the largest European market share for steering units and an increasing share globally. As steering systems grow and needs expand, Sauer-Danfoss is providing electronic control of steering and complete electrical steering solutions to meet the growing demands of the steering market. Today, Sauer-Danfoss believes that it leads the industry in this direction for steering technology.
Mobile Electronics Market
In the mobile electronics market, which covers both propulsion and work function systems, there are few suppliers of propulsion system controls and only three are worldwide competitors. The main competition in this area comes from major OEMs, who produce controls for their own use. In work function electrohydraulic valves and electronic controls, there is a wide range of niche suppliers in limited geographic markets. In recent years, larger companies have increasingly acquired these niche or regional suppliers and thereby have improved their ability to offer integrated systems. The Company believes it is well positioned to establish itself as a technology leader in the work function and propel segments, as there is no clearly established technology in this sector that is deemed to be an industry standard.
Control Valves Market
The control valves marketplace is fragmented with a large number of suppliers, most of which are focused on limited valve types or flow ranges. Sauer-Danfoss provides a comprehensive line of both spool valves and cartridge valves to meet the specific needs of its customers. Competitors who provide partial lines include HydraForce, Sterling Hydraulics, HUSCO International, Sun Hydraulics Corporation, Integrated Hydraulics Limited, Walvoil S.p.A., and Bosch Rexroth Oil Control S.p.A., plus many others. Complete global control valve line competitors are limited to Parker-Hannifin Corporation, Bosch Rexroth AG, and Eaton Corporation. Sauer-Danfoss believes growth in this market will be higher than historical levels related to its new product introductions and the implementation of new emissions regulations.
Research and Development
The Company's research and development expenditures during 2009, 2008, and 2007 were approximately $61.4 million, $82.9 million, and $70.6 million, respectively.
7
Environmental Matters
In all countries in which it operates, the Company is subject to environmental laws and regulations concerning emissions to air, discharge to waterways, and the generation, handling, storage, transportation, treatment, and disposal of waste materials. These laws and regulations are constantly evolving, and it is impossible to predict accurately the effect they will have on the Company in the future. The regulations are subject to varying and conflicting interpretations and implementation. In some cases, compliance can only be achieved by additional capital expenditures. The Company cannot accurately predict what capital expenditures, if any, may be required to comply with applicable environmental laws and regulations in the future; however, the Company does not currently estimate that any future capital expenditures for environmental control facilities will be material. The Company is not currently subject to any governmental remediation order, nor is the Company aware of any environmental issues that would have a materially adverse effect on the Company.
Employees
As of December 31, 2009, 2008, and 2007 the Company had approximately 6,100, 9,600, and 9,800, employees, respectively. Of its full-time employees at December 31, 2009, approximately 1,800 were located in the Americas with the remaining located in Europe and the Asia-Pacific region. From time to time, the Company also retains consultants, independent contractors, and temporary and part-time workers.
Financial Information about Geographic Areas
Information regarding the Company's net sales and long-lived assets by geographic area is set forth in Note 17 in the Notes to Consolidated Financial Statements on pages F-40 through F-42 of this report, and is incorporated herein by reference.
Available Information
The Company maintains an internet website and the address of that site is http://www.sauer-danfoss.com. The Company provides access to its annual report on Form 10-K, quarterly reports on Form 10-Q, current reports on Form 8-K, and amendments to those reports filed or furnished pursuant to Section 13(a) of the Securities Exchange Act of 1934 through its internet website as soon as reasonably practicable after the Company electronically files such material with, or furnishes it to, the Securities and Exchange Commission (SEC). The SEC maintains an internet website that contains reports, proxy and information statements, and other information regarding issuers that file electronically with the SEC. The address of the SEC site is http://www.sec.gov.
The Company's business, financial condition, results of operations and cash flows can be affected by a number of factors, including but not limited to those set forth below and elsewhere in this annual report on Form 10-K, any one of which could cause actual results to vary materially from recent results or from anticipated future results.
Worldwide Economic Conditions
As has been widely reported, the financial markets in the U.S., Europe, and the Asia-Pacific region have been in a period of severe disruption over the last year. The turbulence has been most immediately evident in the extreme tightening of credit markets, the resulting loss of liquidity, and historic drops in stock prices. In response, governments around the world have taken unprecedented steps intended to minimize the depth and breadth of the crisis. There are indications that the economic situation may be
8
beginning to improve in 2010, however it is impossible to predict if the improvement will continue and at what rate the improvement will occur.
These economic developments in 2008 and 2009 have adversely affected the Company's business, financial condition, and results of operations in a number of ways, and they will likely continue to adversely impact the Company until the economic conditions improve. Tightening credit markets could have a material impact on the Company's customers and suppliers and their ability to finance their operations, which could result in a decrease in, or deferral of, orders for the Company's products or an increase in the Company's cost of production. A prolonged economic slowdown, recession, or depression could similarly have a material and adverse impact on the Company's business, financial condition, and results of operations.
The Company experienced a significant decline in the demand for its products during 2009 as a result of the substantial deterioration in economic conditions. Many of the Company's customers chose to delay their purchases of the Company's products. Current indications are that demand for the Company's products will increase in 2010. Customer spending on the Company's products is not discretionary, but the Company is unable to predict the level of growth expected in 2010 as customers increase their spending. Ongoing depressed demand for the Company's products could result in decreased revenues, profitability and cash flows and may impair the Company's ability to maintain operations and fund obligations to others.
Avoidance of Credit Default; Dependence on Affiliate Borrowing
As a result of the deterioration of its financial condition in early 2009 resulting from the impact of the worldwide economic downturn on its business, the Company entered into a Credit Agreement with Danfoss A/S, the Company's majority stockholder, in March 2009, to refinance and avoid default on certain credit agreements in existence at that time and to fund a significant portion of the Company's working capital and other needs. In November 2009 the Company refinanced that agreement with a new agreement with Danfoss A/S which requires repayment in April 2011.
In borrowing significant funds from Danfoss A/S, the Company is heavily dependent on Danfoss A/S for the Company's working capital and other funding needs. In light of the Company's anticipated leverage ratios over at least the near term, the Company may not be able to borrow from sources other than Danfoss A/S on reasonable terms. If Danfoss A/S were unable to borrow or otherwise generate sufficient funds to meet the Company's borrowing requirements or were to become unwilling to continue lending to the Company on favorable terms, the Company's business, results of operations, and financial position could be materially and adversely affected.
Goodwill and Long-Lived Assets Impairment
If the price of the Company's stock were to decline to the point that its market capitalization were lower than its carrying value, the Company may be required to perform interim impairment tests on goodwill or other long-lived assets. There may be other triggering events that indicate that the carrying amount of goodwill or long-lived assets may not be recoverable from future cash flows. If the Company determines that any goodwill or other long-lived asset amounts need to be written down to fair values, this could result in a charge that may be material to the Company's operating results and financial condition.
International Operations
The Company depends on the strength of the economies in various parts of the world, particularly in the U.S. and Europe. As a result of this worldwide exposure, net revenue and profitability may be harmed as a result of economic conditions in the major markets in which the Company operates, including, but not limited to, recessions, inflation and deflation, general weakness in the agriculture, construction and
9
specialty markets, changes in governmental laws and policies, government embargoes or foreign trade restrictions, duties and tariffs, import and export controls, and changes in consumer purchasing power.
Technology Change
The hydraulic industry and markets for component parts of mobile hydraulics are subject to technological change, evolving industry standards, changing customer requirements and improvements in and expansion of product offerings. Although the Company believes that it has the technological capabilities to remain competitive, technological advances or developments by competitors or others could result in the Company needing to make significant capital expenditures in order to remain competitive and to avoid material adverse effects on its business, financial conditions and results of operations.
Common Business System
The Company has implemented a common business system at the majority of its locations. Any significant problems incurred related to operation of the system may delay or stop manufacturing and hinder the Company's ability to ship product in a timely manner or affect the Company's ability to access financial information. These problems could result in the loss of customers, a decrease in revenue, or significant costs to correct the problem.
Raw Material Availability
The Company purchases raw materials and component parts from suppliers to be used in the manufacture of products. Due to the worldwide economic situation many of the raw material suppliers have reduced their output accordingly. In the past year the Company has been able to reduce its inventory levels significantly; this, accordingly, has led to a decrease in its demand for raw materials. In the event of a substantial increase in demand, difficulties in purchasing raw materials and price increases may be experienced.
Pricing and Competitive Pressures from OEM Customers
A majority of the Company's sales are directly to OEM customers. OEM customers continue to use their positions as volume purchasers in the mobile hydraulics market to obtain preferential pricing and to obtain substantial quality assurance protection from suppliers.
Currency Exchange Rates
The Company has a number of manufacturing sites throughout the world and sells products in several countries other than those where the product is manufactured. As a result, the Company has exposure to changing exchange rates between the various currencies in its customers' countries and the currencies in which the Company's manufacturing facilities are located. The Company's most significant foreign currency exposures are the euro, Japanese yen, Polish zloty, Chinese yuan and Danish kroner. Exchange rate fluctuations between these currencies and against the U.S. dollar or euro could adversely affect the Company's results of operations. The Company enters into forward contracts to reduce the impact of currency fluctuations on cash flows related to forecasted sales denominated in currencies other than the functional currency of the selling location.
Cyclicality: Risks Associated with General Economic Conditions
The capital goods industry in general, and mobile hydraulics industry in particular, are subject to economic cycles. Cyclical downturns had a material adverse effect on the demand for the Company's products in 2009, as well as in past years. Future cyclical downturns may negatively impact the Company's business, financial condition, and results of operations. Demand for the Company's products is dependent upon the general condition of the off-highway mobile equipment industry which may be affected by
10
numerous factors, including levels of construction activity, weather conditions, interest rates and access to financing. The Company's results of operations are also subject to price competition and the cost of supplies and labor, both of which are affected by general economic conditions. The Company derives substantial sales from cyclical industries, including the turf care, material handling, construction and agricultural equipment industries.
Income Tax Estimates
The Company is subject to income taxes in the U.S. and numerous non-U.S. jurisdictions. Significant judgment is required in determining the Company's worldwide provision for income taxes. In the ordinary course of business, there are many transactions and calculations where the ultimate tax determination is uncertain. The Company is periodically under audit by tax authorities. Although management believes its tax estimates are reasonable, the final outcome of tax audits and any related litigation could be materially different than that which is reflected in historical income tax provisions and accruals. If the outcome of a given tax audit or related litigation is materially different from the Company's estimates, the determination could result in material differences between the Company's originally reported income tax provision or net income (loss) and the final reported financial results.
Catastrophic Events
Unforeseen events, including war, terrorism and other international conflicts, public health issues, and natural disasters such as earthquakes, hurricanes or other adverse weather and climate conditions, whether occurring in the U.S. or abroad, could disrupt the Company's operations, disrupt the operations of suppliers or customers, or result in political or economic instability. These events could reduce demand for hydraulic and electric products and make it difficult or impossible for the Company to manufacture products, deliver products to customers, or to receive products from suppliers.
The foregoing list is not exhaustive. There can be no assurance that the Company has correctly identified and appropriately assessed all factors affecting the Company or that the publicly available and other information with respect to these matters is complete and correct. Additional risks and uncertainties not presently known to the Company or that are currently believed to be immaterial also may adversely impact the business. Should any risks or uncertainties develop into actual events, these developments could have a material adverse effect on the Company's business, financial condition, and results of operations.
11
Sauer-Danfoss Inc. conducts its manufacturing operations at 20 locations; seven in the United States, two each in Slovakia, Poland and Italy, and one each in Brazil, China, Denmark, Germany, India, Japan, and Sweden. The following table sets forth certain information relating to the Company's principal manufacturing facilities:
Location
|
Segment that Uses the Facility | Approx. Area in Sq. Ft. |
Owned/Leased | |||||
|---|---|---|---|---|---|---|---|---|
United States |
||||||||
Ames, Iowa |
Propel | 359,100 | Owned | |||||
Sullivan, Illinois |
Propel | 205,000 | Owned | |||||
Freeport, Illinois |
Propel | 197,000 | Owned | |||||
Easley, South Carolina |
Controls | 184,000 | Owned | |||||
Lawrence, Kansas |
Work Function | 157,500 | Owned | |||||
Minneapolis, Minnesota |
Controls | 75,000 | Leased | |||||
Princeton, Kentucky |
Propel | 68,000 | Owned | |||||
South America |
||||||||
Caxias do Sul, Brazil |
Controls | 90,000 | Leased | |||||
Europe |
||||||||
Nordborg, Denmark |
Work Function and Controls | 818,000 | Leased | |||||
Neumünster, Germany |
Propel and Controls | 421,500 | Owned | |||||
Povazská Bystrica, Slovakia |
Propel, Work Function and Controls | 357,000 | Owned | |||||
Dubnica nad Váhom, Slovakia |
Propel | 251,000 | Owned | |||||
Bielany Wroclawskie, Poland |
Work Function | 223,000 | Leased | |||||
Wroclaw, Poland |
Work Function | 126,000 | Owned | |||||
Bologna, Italy |
Work Function | 85,000 | Owned | |||||
Reggio Emilia, Italy |
Controls | 76,500 | Leased | |||||
Älmhult, Sweden |
Controls | 50,000 | Leased | |||||
India |
||||||||
Pune, India |
Work Function and Controls | 63,500 | Owned | |||||
Asia |
||||||||
Shanghai/Pudong, China |
Propel and Controls | 105,000 | Leased | |||||
Osaka, Japan |
Propel | 94,000 | Leased | |||||
Total |
4,006,100 | |||||||
The Company has been named as a defendant in four putative stockholder class action complaints (collectively, the Lawsuits) challenging the proposal by Danfoss Acquisition Inc. (Danfoss Acquisition), a wholly owned subsidiary of Danfoss A/S (Danfoss), to make a tender offer to purchase all of the outstanding shares of Company common stock not presently held, directly or indirectly, by Danfoss (Proposed Tender Offer). Three of the Lawsuits were filed on December 23, 2009, two in the Court of Chancery of the State of Delaware by Kenneth R. Loiselle and Laurie Forrest, respectively, and the other in the Iowa District Court for Story County by John and Michelle Freise. The two Delaware lawsuits have been consolidated into a single proceeding. The fourth Lawsuit was filed on February 10, 2010, in the Iowa District Court for Story County by Scott Crouthamel. Each of the Lawsuits was filed on behalf of the named plaintiffs and the other minority stockholders of the Company. The defendants in the Lawsuits are the Company, Danfoss, Danfoss Acquisition, the directors of the Company, Klaus Murmann (a former director and current Chairman Emeritus of the Company), David J. Anderson (a former director and former Chief Executive Officer of the Company), and Frederik Lotz (a former director of the Company
12
and the former Chief Financial Officer of Danfoss). Each Lawsuit is premised on allegations that the price offered in the Proposed Tender Offer is inadequate and that the defendants have breached their fiduciary duties to the Company's stockholders in connection with the Proposed Tender Offer. The plaintiffs seek, among other things, preliminary and permanent injunctive relief enjoining the Proposed Tender Offer, rescission of the Proposed Tender Offer, and payment of damages and costs incurred as a result of the Proposed Tender Offer. The Company believes that it has valid defenses with respect to these claims and intends to defend itself vigorously against them. The Lawsuits are all in preliminary stages, so it is not possible for the Company to predict their outcomes with any certainty. It is possible that one or more of the Lawsuits could have a materially adverse effect on the Company's results of operations, liquidity, or financial position.
From time to time, the Company is involved in other legal matters in the ordinary course of its business. The Company intends to defend itself vigorously against all such claims. It is the Company's policy to accrue for amounts related to lawsuits brought against it if it is probable that a liability has been incurred and an amount can be reasonably estimated. Although the outcome of such matters cannot be predicted with certainty and no assurances can be given with respect to such matters, the Company believes that the outcome of those ordinary-course matters in which it is currently involved will not have a materially adverse effect on its results of operations, liquidity, or financial position.
EXECUTIVE OFFICERS OF THE COMPANY
The following table sets forth certain information regarding the executive officers of the Company:
Name
|
Age | Position | Year Appointed |
||||||
|---|---|---|---|---|---|---|---|---|---|
Sven Ruder(1) |
53 | President and Chief Executive Officer | 2009 | ||||||
Jesper V. Christensen(2) |
40 | Executive Vice President and Chief Financial Officer | 2009 | ||||||
C. Kells Hall(3) |
61 | Executive Vice President and President Propel Division | 2009 | ||||||
Timothy P. Hanson(3)(4) |
59 | Vice President—Sales and Marketing | 2010 | ||||||
Wolfgang Schramm(5) |
55 | Executive Vice President and President Controls Division | 2007 | ||||||
Kenneth D. McCuskey(3) |
55 | Vice President and Chief Accounting Officer, Secretary | 2000 | ||||||
Charles M. Cohrs(3) |
47 | Treasurer | 2005 | ||||||
- (1)
- Prior
to joining the Company, Mr. Ruder was employed as President of the Motion Controls Division of Danfoss A/S, the majority stockholder of the
Company.
- (2)
- Prior
to joining the Company, Mr. Christensen was employed as Vice President, Finance, IT & HR in the Motion Controls Division of Danfoss A/S,
the majority stockholder of the Company.
- (3)
- These
executive officers have served in various capacities with the Company or its subsidiaries for more than the past five years.
- (4)
- Mr. Hanson
is filling the position of Chief Marketing Officer on an interim basis until a permanent replacement is identified. Mr. Hanson
plans to retire in August 2010.
- (5)
- Prior to joining the Company, Mr. Schramm was employed by Visteon Corporation as Executive Director Advanced Technology.
13
Item 5. Market for the Company's Common Stock, Related Stockholder Matters and Company Purchases of Common Stock.
Market and Dividend Information
The Company's Common Stock is traded on the New York Stock Exchange. As of March 1, 2010 there were 202 stockholders of record.
The Company historically paid a quarterly dividend. Quarterly dividends are subject to Board of Directors approval. On March 13, 2009 the Board of Directors voted to suspend the Company's quarterly dividend indefinitely, beginning with the dividend that would ordinarily have been declared during the first quarter of 2009.
The following table sets forth the high and low prices on the New York Stock Exchange for the Company's Common Stock since January 1, 2008, and the quarterly cash dividends declared in 2009 and 2008:
| |
1st | 2nd | 3rd | 4th | Full Year | |||||||||||
|---|---|---|---|---|---|---|---|---|---|---|---|---|---|---|---|---|
2009 |
||||||||||||||||
High |
$ | 10.13 | $ | 7.08 | $ | 8.19 | $ | 12.68 | $ | 12.68 | ||||||
Low |
$ | 2.43 | $ | 2.37 | $ | 4.50 | $ | 6.71 | $ | 2.37 | ||||||
Dividends |
$ | 0.00 | $ | 0.00 | $ | 0.00 | $ | 0.00 | $ | 0.00 | ||||||
2008 |
||||||||||||||||
High |
$ | 25.41 | $ | 37.93 | $ | 35.10 | $ | 24.75 | $ | 37.93 | ||||||
Low |
$ | 17.68 | $ | 22.23 | $ | 22.63 | $ | 5.52 | $ | 5.52 | ||||||
Dividends |
$ | 0.18 | $ | 0.18 | $ | 0.18 | $ | 0.18 | $ | 0.72 | ||||||
Performance Graph
The following graph shows a comparison of the cumulative total returns from December 31, 2004 to December 31, 2009, for the Company, the Russell 2000 Index and the Hemscott, Inc.—Diversified Machinery Index ("Hemscott Group Index"). The graph assumes that $100 was invested on December 31, 2004 in the Company's common stock, the Russell 2000 Index and the Hemscott Group Index, a peer group index, and that all dividends were reinvested.
COMPARISON OF 5-YEAR CUMULATIVE TOTAL RETURN
AMONG SAUER-DANFOSS INC.,
RUSSELL 2000 INDEX AND HEMSCOTT GROUP INDEX
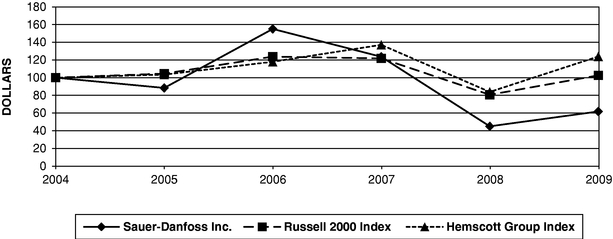
ASSUMES $100 INVESTED ON 12/31/04
ASSUMES DIVIDEND REINVESTMENT
FISCAL YEAR ENDING 12/31/09
14
Equity Compensation Plan Information
The following table summarizes, as of December 31, 2009, information about compensation plans under which equity securities of the Company are authorized for issuance:
Plan Category
|
Number of Securities to be Issued upon Exercise of Outstanding Options, Warrants and Rights (a) |
Weighted-Average Exercise Price of Outstanding Options, Warrants and Rights (b) |
Number of Securities Remaining Available for Future Issuance under Equity Compensation Plans (Excluding Securities Reflected in Column(a)) (c) |
|||||||
|---|---|---|---|---|---|---|---|---|---|---|
Equity compensation plans approved by security holders |
293,803 | $ | 0.00 | 4,691,210 | ||||||
The Company does not have any equity compensation plans that were not approved by security holders. Refer to Note 13 in the Notes to the Consolidated Financial Statements on pages F-35 through F-37 of this report for a description of the equity compensation plans.
Column (a) includes performance units granted in 2008. The extent to which the performance goals established for each grant are met will determine how many shares of common stock are issued upon completion of the three-year performance period. Subsequent to December 31, 2009, the Company's Compensation Committee determined that the 2007 performance units would vest at 0.0 percent of the target levels, because the performance criteria established when such units were awarded had not been met. Therefore no amounts are included above for the 2007 performance units. The 2008 performance units are included at 100 percent of the target levels.
Column (c) includes 1,343,294 shares available for future issuance under the Company's 1998 Long-Term Incentive Plan, 3,192,559 shares available for issuance under the Company's 2006 Omnibus Incentive Plan, and 155,357 shares available for issuance under the Company's Non-Employee Director Stock Option and Restricted Stock Plan. Each of these plans permits the Company to issue common stock at times other than upon the exercise of options, warrants, or rights; for example, issuance in the form of restricted stock grants.
15
Item 6. Selected Financial Data.
| |
2009 | 2008 | 2007 | 2006 | 2005 | ||||||||||||
|---|---|---|---|---|---|---|---|---|---|---|---|---|---|---|---|---|---|
| |
(in millions except per share) |
||||||||||||||||
Operating Data: |
|||||||||||||||||
Net sales |
$ | 1,159.0 | $ | 2,090.5 | $ | 1,972.5 | $ | 1,739.1 | $ | 1,547.8 | |||||||
Gross profit |
128.0 | 435.6 | 427.7 | 396.8 | 357.7 | ||||||||||||
Selling, general and administrative |
209.7 | 258.5 | 233.8 | 215.6 | 217.1 | ||||||||||||
Research and development |
61.4 | 82.9 | 70.6 | 61.9 | 58.7 | ||||||||||||
Impairment charges |
50.8 | 58.2 | — | 1.5 | — | ||||||||||||
Loss on sale of businesses and asset disposals |
16.4 | 9.6 | 9.4 | 1.7 | 1.4 | ||||||||||||
Total operating expenses |
338.3 | 409.2 | 313.8 | 280.7 | 277.2 | ||||||||||||
Total interest expense, net |
48.4 | 24.6 | 22.7 | 17.8 | 15.7 | ||||||||||||
Net income (loss) |
(345.8 | ) | (29.1 | ) | 47.2 | 54.0 | 34.8 | ||||||||||
Per Share Data: |
|||||||||||||||||
Income (loss) per common share, basic |
$ | (7.15 | ) | $ | (0.60 | ) | $ | 0.98 | $ | 1.13 | $ | 0.73 | |||||
Income (loss) per common share, diluted |
$ | (7.15 | ) | $ | (0.60 | ) | $ | 0.98 | $ | 1.12 | $ | 0.73 | |||||
Cash dividends declared per share |
$ | — | $ | 0.72 | $ | 0.72 | $ | 0.60 | $ | 0.48 | |||||||
Weighted average basic shares outstanding |
48.3 | 48.2 | 48.1 | 47.7 | 47.5 | ||||||||||||
Weighted average diluted shares outstanding |
48.3 | 48.2 | 48.3 | 48.2 | 47.8 | ||||||||||||
Balance Sheet Data: |
|||||||||||||||||
Inventories |
$ | 177.6 | $ | 325.5 | $ | 318.8 | $ | 272.3 | $ | 238.9 | |||||||
Property, plant and equipment, net |
513.5 | 598.4 | 562.8 | 504.0 | 450.4 | ||||||||||||
Total assets |
1,068.3 | 1,467.7 | 1,500.4 | 1,307.1 | 1,166.5 | ||||||||||||
Total debt |
533.2 | 491.4 | 444.0 | 349.6 | 332.3 | ||||||||||||
Stockholders' equity |
154.6 | 477.9 | 586.0 | 515.5 | 494.2 | ||||||||||||
Debt to total capital |
77.5 | % | 50.7 | % | 43.1 | % | 40.4 | % | 40.6 | % | |||||||
Other Data: |
|||||||||||||||||
Backlog (at year-end) |
$ | 509.5 | $ | 743.7 | $ | 921.4 | $ | 631.0 | $ | 504.2 | |||||||
Depreciation and amortization |
117.1 | 113.0 | 102.3 | 95.7 | 88.3 | ||||||||||||
Capital expenditures |
43.0 | 198.6 | 135.6 | 116.2 | 95.2 | ||||||||||||
EBITDA (1) |
(89.9 | ) | 175.6 | 212.6 | 207.6 | 172.3 | |||||||||||
Cash flows from (used in): |
|||||||||||||||||
Operating activities |
86.8 | 183.5 | 98.1 | 167.9 | 116.3 | ||||||||||||
Investing activities |
(42.2 | ) | (187.5 | ) | (122.2 | ) | (109.3 | ) | (93.3 | ) | |||||||
Financing activities |
(24.7 | ) | 4.7 | 22.1 | (45.0 | ) | (20.1 | ) | |||||||||
- (1)
- EBITDA represents net income plus net interest expense, income tax expense, depreciation and amortization, long-lived asset impairment charge and noncontrolling interest. The impairment charge is included as it will reduce depreciation in future years. EBITDA may not be comparable to similarly titled measures reported by other companies. While EBITDA should not be construed as a substitute for operating income or a better indicator of liquidity than cash flow from operating activities, which are determined in accordance with accounting principles generally accepted in the United States, it is included herein to provide additional information as management of the Company believes it provides an indication with respect to the ability of Sauer-Danfoss to meet its future debt service, capital
16
expenditures, and working capital requirements. The following table further demonstrates how EBITDA is derived from cash flows from operating activities:
| |
2009 | 2008 | 2007 | 2006 | 2005 | ||||||||||||
|---|---|---|---|---|---|---|---|---|---|---|---|---|---|---|---|---|---|
Cash flows from operating activities |
$ | 86.8 | $ | 183.5 | $ | 98.1 | $ | 167.9 | $ | 116.3 | |||||||
Increase (decrease) in working capital, excluding the effects of acquisitions Accounts receivable, net |
(91.4 | ) | (71.7 | ) | 38.5 | 24.5 | 4.8 | ||||||||||
Inventories |
(153.4 | ) | 16.8 | 36.6 | 14.2 | 24.9 | |||||||||||
Prepaid and other current assets |
5.0 | 7.9 | 11.1 | 6.1 | (7.9 | ) | |||||||||||
Accounts payable |
54.2 | 14.5 | (11.0 | ) | (27.2 | ) | 13.3 | ||||||||||
Accrued liabilities |
20.7 | (23.6 | ) | 1.5 | (14.0 | ) | (17.6 | ) | |||||||||
Deferred income taxes and other |
(121.2 | ) | 9.5 | (3.7 | ) | 1.3 | 7.9 | ||||||||||
Interest expense, net |
48.4 | 24.6 | 22.7 | 17.8 | 15.7 | ||||||||||||
Tax expense |
61.0 | 14.1 | 18.8 | 17.0 | 14.9 | ||||||||||||
EBITDA |
$ | (89.9 | ) | $ | 175.6 | $ | 212.6 | $ | 207.6 | $ | 172.3 | ||||||
17
Item 7. Management's Discussion and Analysis of Financial Condition and Results of Operations.
Safe Harbor Statement
This Management's Discussion and Analysis of Financial Condition and Results of Operations, as well as other portions of this annual report on Form 10-K, contain certain statements that constitute "forward-looking statements" within the meaning of the Private Securities Litigation Reform Act of 1995. Forward-looking statements provide current expectations of future events based on certain assumptions and include any statement that does not directly relate to any historical or current fact. All statements regarding future performance, growth, sales and earnings projections, conditions or developments are forward-looking statements. Words such as "anticipates," "in the opinion," "believes," "intends," "expects," "may," "will," "should," "could," "plans," "forecasts," "estimates," "predicts," "projects," "potential," "continue," and similar expressions may be intended to identify forward-looking statements.
Actual future results may differ materially from those described in the forward-looking statements due to a variety of factors. Readers should bear in mind that past experience may not be a good guide to anticipating actual future results. Throughout 2009 the economies in the U.S., Europe, and Asia-Pacific suffered from the global recession and credit crisis, weakness in the housing and residential construction markets, weakness in the commercial and public-sector construction markets, job losses, and uncertainty surrounding the effects of government fiscal stimulus plans, interest rates, and crude oil prices. A prolonged downturn in the Company's business segments could adversely affect the Company's revenues and results of operations. Other factors affecting forward-looking statements include, but are not limited to, the following: specific economic conditions in the agriculture, construction, road building, turf care, material handling and specialty vehicle markets and the impact of such conditions on the Company's customers in such markets; the cyclical nature of some of the Company's businesses; the ability of the Company to win new programs and maintain existing programs with its original equipment manufacturer (OEM) customers; the highly competitive nature of the markets for the Company's products as well as pricing pressures that may result from such competitive conditions; the continued operation and viability of the Company's significant customers; the Company's execution of internal performance plans; difficulties or delays in manufacturing; the effectiveness of the Company's cost-reduction and productivity improvement efforts; competing technologies and difficulties entering new markets, both domestic and foreign; changes in the Company's product mix; future levels of indebtedness and capital spending; the ability and willingness of Danfoss A/S, the Company's majority stockholder, to lend money to the Company at sufficient levels and on terms favorable enough to enable the Company to meet its capital needs; the Company's ability to access the capital markets or traditional credit sources to supplement or replace the Company's borrowings from Danfoss A/S if the need should arise; the Company's ability over time to reduce the relative level of debt compared to equity on its balance sheet; claims, including, without limitation, warranty claims, field recall claims, product liability claims, charges or dispute resolutions; ability of suppliers to provide materials as needed and the Company's ability to recover any price increases for materials in product pricing; the Company's ability to attract and retain key technical and other personnel; labor relations; the failure of customers to make timely payment, especially in light of the current credit crisis; any inadequacy of the Company's intellectual property protection or the potential for third-party claims of infringement; global economic factors, including currency exchange rates; credit market disruptions and significant changes in capital market liquidity and funding costs affecting the Company and its customers; general economic conditions, including interest rates, the rate of inflation, and commercial and consumer confidence; energy prices; the impact of new or changed tax and other legislation and regulations in jurisdictions in which the Company and its affiliates operate; actions by the U.S. Federal Reserve Board and the central banks of other nations; actions by other regulatory agencies, including those taken in response to the global credit crisis; actions by rating agencies; changes in accounting standards; worldwide political stability; the effects of terrorist activities and resulting political or economic instability; natural catastrophes; U.S. military action overseas; and the effect of acquisitions, divestitures, restructurings, product withdrawals, and other unusual events.
18
The Company cautions the reader that this list of cautionary statements and risk factors is not exhaustive. The Company expressly disclaims any obligation or undertaking to release publicly any updates or changes to these forward-looking statements to reflect future events or circumstances.
About the Company
Sauer-Danfoss Inc. and subsidiaries (the Company) is a worldwide leader in the design, manufacture, and sale of engineered hydraulic and electronic systems and components that generate, transmit and control power in mobile equipment. The Company's products are used by original equipment manufacturers (OEMs) of mobile equipment, including construction, road building, agricultural, turf care, material handling, and specialty equipment. The Company designs, manufactures, and markets its products in the Americas, Europe, and the Asia-Pacific region, and markets its products throughout the rest of the world either directly or through distributors.
Executive Summary of 2009 Compared to 2008
The nature of the Company's operations as a global producer and supplier in the fluid power industry means the Company is impacted by changes in local economies, including currency exchange rate fluctuations. In order to gain a better understanding of the Company's base results, a financial statement user needs to understand the impact of those currency exchange rate fluctuations. The following table summarizes the change in the Company's results from operations by separately identifying changes due to currency fluctuations and the underlying change in operations from 2008 to 2009. This analysis is more consistent with how the Company's management internally evaluates results.
(in millions)
|
2008 | Currency fluctuations | Underlying change | 2009 | ||||||||||
|---|---|---|---|---|---|---|---|---|---|---|---|---|---|---|
Net Sales |
$ | 2,090.5 | $ | (36.1 | ) | $ | (895.4 | ) | $ | 1,159.0 | ||||
Gross Profit |
435.6 | (4.2 | ) | (303.5 | ) | 127.9 | ||||||||
% of Net Sales |
20.8 | % | 11.0 | % | ||||||||||
Selling, general and administrative |
258.5 | (8.4 | ) | (40.4 | ) | 209.7 | ||||||||
Research and development |
82.9 | (2.3 | ) | (19.2 | ) | 61.4 | ||||||||
Impairment charges |
58.2 | — | (7.4 | ) | 50.8 | |||||||||
Loss on sale of businesses and asset disposals |
9.6 | 0.1 | 6.7 | 16.4 | ||||||||||
Total operating costs |
409.2 | (10.6 | ) | (60.3 | ) | 338.3 | ||||||||
Operating income (loss) |
26.4 | 6.4 | (243.2 | ) | (210.4 | ) | ||||||||
% of Net Sales |
1.3 | % | (18.2 | )% | ||||||||||
Interest expense, net |
(24.6 | ) | 1.3 | (25.1 | ) | (48.4 | ) | |||||||
Loss on early retirement of debt |
— | — | (15.8 | ) | (15.8 | ) | ||||||||
Other, net |
0.9 | 0.1 | 2.3 | 3.3 | ||||||||||
Income (loss) before income taxes |
2.7 | 7.8 | (281.8 | ) | (271.3 | ) | ||||||||
% of Net Sales |
0.1 | % | (23.4 | )% | ||||||||||
Income tax expense |
(14.0 | ) | 0.6 | (47.6 | ) | (61.0 | ) | |||||||
Net income (loss) |
(11.3 | ) | 8.4 | (329.4 | ) | (332.3 | ) | |||||||
Net income (loss) attributable to noncontrolling interest, net of tax |
(17.8 | ) | — | 4.3 | (13.5 | ) | ||||||||
Net income (loss) attributable to Sauer-Danfoss Inc. |
$ | (29.1 | ) | $ | 8.4 | $ | (325.1 | ) | $ | (345.8 | ) | |||
Net sales for the year ended December 31, 2009 decreased 43 percent compared to the year ended December 31, 2008, excluding the effects of currency. Net sales decreased in all regions and segments. Excluding the impacts of currency, sales declined 48 percent in Europe, 42 percent in the Americas and
19
27 percent in Asia-Pacific. Sales in the Work Function segment decreased by 49 percent, sales in the Controls segment were down 44 percent, followed by a reduction of 39 percent in the Propel segment.
Gross profit declined 70 percent during the year ended December 31, 2009, excluding the impact of currency. This decline was primarily driven by reduced sales volume. Other contributing factors included inventory valuation allowances of $13.8 million, accelerated depreciation of $4.0 million, and restructuring charges of $5.8 million related to the closure of the Hillsboro, Oregon; Lawrence, Kansas; and Odense, Denmark locations.
Selling, general and administrative costs decreased 16 percent during 2009 when compared to the same period in 2008, excluding the effects of currency. This decrease is primarily due to cost reduction efforts taken as a result of the economic downturn, as well as a reduction in costs of $6.6 million related to the implementation of a common business system. Offsetting these cost reductions were severance costs of $18.2 million and $4.5 million of restructuring costs related to the closure of the Hillsboro location and the exit from the electric drives business in 2009, compared to similar costs of $4.9 million in 2008. Research and development costs decreased 23 percent excluding the effects of currency due to cost reduction efforts.
The Company reported goodwill impairment charges of $50.8 million during the first quarter of 2009 related to the valves reporting unit within the Controls segment. In 2008 the Company reported impairment charges of $58.2 million, consisting of $22.9 million of goodwill impairment, and property, plant and equipment impairment of $35.3 million. The goodwill impairment related to the motors and steering reporting units within the Work Function segment and the electric drives reporting unit within the Controls segment. The impairment charges were incurred as a result of lower profitability in the reporting units than the Company had previously expected, and lower future expectations in certain end markets. The property, plant and equipment impairment related to the Work Function segment and resulted from lower earnings expectations related to the products produced within the asset group.
During the year ended December 31, 2009 the Company sold its alternating current (AC) electric motor business for the material handling market. In connection with this transaction the Company incurred charges of $6.3 million during 2009 and $8.4 million in 2008. In addition, during 2009 the Company incurred a loss of $2.7 million on the sale of its steering column business in Kolding, Denmark. These activities were part of the Company's plan to divest of product lines that do not fit the Company's long-term strategic direction. During the year ended December 31, 2008, the Propel segment recorded a gain of $1.4 million related to the sale of the LaSalle, Illinois plant.
The Company refinanced various credit agreements during 2009, which resulted in higher interest rates and an increase to interest expense of $25.1 million over 2008. This also resulted in a $15.8 million loss on early retirement of debt in 2009.
Operating Results—2009 Compared to 2008
Sales Growth by Market
The following table summarizes the Company's sales growth by market. The table and following discussion is on a comparable basis, which excludes the effects of currency fluctuations.
| |
Americas | Asia-Pacific | Europe | Total | |||||||||
|---|---|---|---|---|---|---|---|---|---|---|---|---|---|
Agriculture/Turf Care |
(24 | )% | (24 | )% | (31 | )% | (26 | )% | |||||
Construction/Road Building |
(58 | ) | (36 | ) | (66 | ) | (57 | ) | |||||
Specialty |
(71 | ) | (15 | ) | (51 | ) | (53 | ) | |||||
Distribution |
(46 | ) | (25 | ) | (39 | ) | (39 | ) | |||||
20
Agriculture/Turf Care
Sales into the agriculture/turf care market decreased in all regions during the year ended December 31, 2009 compared to 2008. Sales into the agriculture market in the Americas remained strong during the first quarter, then declined sharply as commodity prices began a downward trend and customers focused on inventory reduction. Commodity prices began to stabilize during the fourth quarter, while the Brazilian market showed improvement during the second half of the year compared to the first and second quarters. The European agriculture market continued to decline due to falling commodity prices and the worldwide economic crisis. Turf care sales continue to suffer from depressed housing markets and reduced consumer spending. The Asia-Pacific region contributes less than 5 percent of the sales in the agriculture/turf care market, and therefore does not significantly impact the total.
Construction/Road Building
Construction /road building sales were down in all regions during the year ended December 31, 2009 compared to 2008. The sales decline was due to poor economic conditions worldwide, depressed housing and non-residential construction markets, and customers' focus on reducing inventory levels. Non-residential construction slowed rapidly in the Americas, and state government budget problems caused road building to remain at extraordinarily low levels. The Asia-Pacific region experienced strong sales in China due to government stimulus programs and strong demand for mixers. However, this was more than offset by reduced sales in Japan, which depends heavily on export markets.
Specialty
Specialty vehicles are comprised of a variety of markets including forestry, material handling, marine, waste management and waste recycling. Overall sales into the specialty vehicle market decreased 53 percent compared to 2008. Material handling sales were down across all regions due to poor economic conditions worldwide and severely depressed non-residential construction markets. Offsetting the reduced material handling sales in the Asia-Pacific region was an increase in specialty sales in China due to investments made by the Chinese government, as well as increased sales related to the carrier business for railroad construction. The divestiture of the electric drives business also had a negative impact on sales in Europe and Asia-Pacific.
Distribution
Products related to all of the above markets are sold to distributors, who then serve smaller OEMs.
21
Order Backlog
The following table shows the Company's order backlog and orders written activity for 2008 and 2009, separately identifying the impact of currency fluctuations.
| (in millions) |
2008 | Currency fluctuation |
Underlying change |
2009 | |||||||||
|---|---|---|---|---|---|---|---|---|---|---|---|---|---|
Backlog at December 31 |
$ | 743.7 | $ | 9.8 | $ | (244.0 | ) | $ | 509.5 | ||||
Orders written |
1,927.7 | (24.9 | ) | (989.5 | ) | 913.3 | |||||||
Total order backlog at the end of 2009 was $509.5 million, compared to $743.7 million at the end of 2008. On a comparable basis, excluding the impact of currency fluctuation, order backlog decreased 33 percent compared to 2008. New sales orders written for 2009 were $913.3 million, a decrease of 51 percent compared to 2008, excluding the impact of currency fluctuations. The decrease in backlog and order entry is due to the global recession.
Business Segment Results
The following discussion of operating results by reportable segment relates to information as presented in Note 17 in the Notes to Consolidated Financial Statements. Segment income is defined as the respective segment's portion of the total Company's net income, excluding net interest expense, income taxes, noncontrolling interest, and global service expenses. Propel products include hydrostatic transmissions and related products that transmit the power from the engine to the wheel to propel a vehicle. Work Function products include steering motors as well as gear pumps and motors that transmit power for the work functions of the vehicle. Controls products include electrohydraulic controls, microprocessors, electric drives and valves that control and direct the power of a vehicle.
The following table provides a summary of each segment's net sales and segment income, separately identifying the impact of currency fluctuations during the year.
| (in millions) |
2008 | Currency fluctuation |
Underlying change |
2009 | ||||||||||
|---|---|---|---|---|---|---|---|---|---|---|---|---|---|---|
Net sales |
||||||||||||||
Propel |
$ | 1,016.6 | $ | (7.5 | ) | $ | (395.7 | ) | $ | 613.4 | ||||
Work Function |
561.4 | (14.1 | ) | (272.6 | ) | 274.7 | ||||||||
Controls |
512.5 | (14.5 | ) | (227.1 | ) | 270.9 | ||||||||
Segment income (loss) |
||||||||||||||
Propel |
$ | 156.8 | $ | 1.1 | (157.9 | ) | $ | 0.0 | ||||||
Work Function |
(65.7 | ) | 4.4 | (20.6 | ) | (81.9 | ) | |||||||
Controls |
(21.4 | ) | 2.5 | (82.2 | ) | (101.1 | ) | |||||||
Global Services and other expenses, net |
(42.4 | ) | (0.1 | ) | 18.6 | (23.9 | ) | |||||||
Propel Segment
The Propel segment experienced a 39 percent decrease in sales, excluding the effects of currency fluctuations, during 2009 due to weak global economic conditions. The Propel segment experienced an 11 percentage point decrease in operating profit margin in 2009 compared to 2008 mainly due to reduced sales volume resulting in less absorption of fixed production costs, as well as additional inventory reserves of $8.3 million and accelerated depreciation of $3.4 million due to changing the production location of a product line. Contributing to the reduction in segment income was a $12.7 million increase in severance costs over 2008, an increase in field recall costs of $6.6 million, and a loss on disposal of fixed assets of $3.1 million. Operating expenses were reduced by $19.7 million due to a focus on reducing costs and lower payroll costs as a result of headcount reductions. In addition, in 2008 the Propel segment recognized a gain on sale of a building of $1.4 million.
22
Work Function Segment
Sales in the Work Function segment decreased 49 percent in 2009 compared to 2008, excluding the effects of currency fluctuations, due to weak global economic conditions. The reduction in segment income of $20.6 million, excluding the effects of currency fluctuations, was driven by reduced sales, restructuring costs of $3.7 million related to the closure of the Lawrence, Kansas facility, $2.7 million related to the sale of the steering column business in Kolding, Denmark, and an increase in severance costs of $1.7 million over 2008 due to headcount reductions related to lower sales. Offsetting the impact of these items in the year-over-year comparison was a reduction in expedited freight costs of $8.4 million, reduced depreciation of $4.4 million due to the impairment of long-lived assets at December 31, 2008, and a reduction in total operating expenses of $18.7 million. In 2008 the Work Function segment recognized impairment charges of $17.4 million and $35.3 million, for goodwill and property, plant and equipment, respectively.
Controls Segment
Net sales in the Controls segment decreased 44 percent from 2008, excluding the effects of currency fluctuations, due to weak global economic conditions. Segment income decreased $82.2 million during 2009 due to decreased sales levels, a goodwill impairment charge of $50.8 million related to the valves reporting unit, and an increase to employee severance costs of $2.2 million compared to 2008. In addition, costs of $6.3 million related to the alternating current (AC) product line, which was sold in the second quarter of 2009, and restructuring costs of $8.7 million related to the closure of the Hillsboro, Oregon facility and the exit of the electric drives business were recognized in 2009. Excluding the restructuring and severance costs, operating expenses were reduced by $22.5 million. Also, in 2008 the Controls segment recognized goodwill impairment charges of $5.5 million.
Global Services and other expenses, net
Segment costs in Global Services and other expenses, net, relate to internal global service departments, along with the operating costs of the Company's executive office. Global services include such costs as consulting for special projects, tax and accounting fees paid to outside third parties, internal audit, certain insurance premiums, and the amortization of intangible assets from certain business combinations. Global services and other expenses decreased $18.6 million, or 44 percent excluding the impacts of currency. This was partially due to fact that 2008 costs included $1.6 million for an acquisition that was not consummated and $6.6 million associated with the implementation of a common business system. In 2009 the Company recognized a $4.4 million gain of foreign currency transactions in 2009 compared to a $1.0 million gain in 2008.
Income Taxes
The Company incurred income tax expense of $61.0 million on a loss of $271.2 million in 2009.
In 2009 the Company recorded $50.8 million for the impairment of goodwill which was not deductible for income tax purposes and therefore no tax benefit was recorded on this expense. Valuation allowances of $126.9 million were recorded as tax expense in 2009 which relates to impaired tax assets in the U.S., Italy, China and Denmark. Other non-deductible expenses and the worldwide earnings mix also impacted 2009 income tax expense.
23
Executive Summary of 2008 Compared to 2007
The following table summarizes the change in the Company's results from operations by separately identifying changes due to currency fluctuations and the underlying change in operations from 2007 to 2008. This analysis is more consistent with how the Company's management internally evaluates results.
| (in millions) |
2007 | Currency fluctuations | Underlying change | 2008 | ||||||||||
|---|---|---|---|---|---|---|---|---|---|---|---|---|---|---|
Net Sales |
$ | 1,972.5 | $ | 85.0 | $ | 33.0 | $ | 2,090.5 | ||||||
Gross Profit |
427.7 | 21.9 | (14.0 | ) | 435.6 | |||||||||
% of Net Sales |
21.7 | % | 20.8 | % | ||||||||||
Selling, general and administrative |
233.8 | 10.4 | 14.3 | 258.5 | ||||||||||
Research and development |
70.6 | 3.6 | 8.7 | 82.9 | ||||||||||
Impairment charges |
— | — | 58.2 | 58.2 | ||||||||||
Loss on sale of businesses and asset disposals |
9.4 | 0.5 | (0.3 | ) | 9.6 | |||||||||
Total operating costs |
313.8 | 14.5 | 80.9 | 409.2 | ||||||||||
Operating income |
113.9 | 7.4 | (94.9 | ) | 26.4 | |||||||||
% of Net Sales |
5.8 | % | 1.3 | % | ||||||||||
Interest expense, net |
(22.7 | ) | (0.9 | ) | (1.0 | ) | (24.6 | ) | ||||||
Other, net |
(3.6 | ) | (2.3 | ) | 6.8 | 0.9 | ||||||||
Income (loss) before income taxes |
87.6 | 4.2 | (89.1 | ) | 2.7 | |||||||||
% of Net Sales |
4.4 | % | 0.1 | % | ||||||||||
Income tax expense |
(18.8 | ) | (0.8 | ) | 5.6 | (14.0 | ) | |||||||
Net income (loss) |
68.8 | 3.4 | (83.5 | ) | (11.3 | ) | ||||||||
Net income (loss) attributable to noncontrolling interest, net of tax |
(21.6 | ) | (0.5 | ) | 4.3 | (17.8 | ) | |||||||
Net income (loss) attributable to Sauer-Danfoss Inc. |
$ | 47.2 | $ | 2.9 | $ | (79.2 | ) | $ | (29.1 | ) | ||||
Net sales for the year ended December 31, 2008 increased 2 percent compared to the year ended December 31, 2007, excluding the effects of currency. Sales increased 3 percent excluding the effects of currency and divestitures. Excluding the effects of currency and divestitures, sales increased 3 percent in the Americas and 23 percent in Asia-Pacific, while sales remained nearly level in Europe. Sales in the Propel segment were up 4 percent, sales in the Work Function segment increased 2 percent and sales in the Controls segment increased 1 percent.
Gross profit declined 3 percent during the year ended December 31, 2008, excluding the impact of currency. This decline was primarily driven by $11.2 million in severance costs related to actions taken in response to the slowing economy, and a $10.4 million increase in field recall costs, primarily related to the Controls segment. During the year ended December 31, 2007, the Propel and Controls segments incurred $10.4 million of restructuring costs primarily to relocate production lines to other production facilities within the Company and remaining costs to close the LaSalle, Illinois plant.
Selling, general and administrative costs increased 6 percent during 2008 when compared to the same period in 2007, excluding the effects of currency. This increase was primarily attributed to $4.9 million of severance costs, and a $7.8 million increase in sales and marketing costs, excluding the impacts of currency, due primarily to the addition of a new sales office in Russia, as well as increases in headcount earlier in 2008. Research and development costs increased 12 percent excluding the impacts of currency, primarily driven by increasing product development, particularly in the Controls and Propel segments.
The Company reported impairment charges of $58.2 million, consisting of goodwill impairment charges of $22.9 million and property, plant, and equipment impairment charges of $35.3 million. The
24
goodwill impairment related to the motors and steering reporting units within the Work Function segment and the electric drives reporting unit within the Controls segment. It was incurred as a result of lower profitability in the reporting units than the Company had previously expected, and lower future expectations in certain end markets. The property, plant and equipment impairment related to the Work Function segment and resulted from lower expectations related to the products produced within the asset group.
During the year ended December 31, 2008 the Company signed an agreement to sell its alternating current (AC) electric motor business for the material handling market. In connection with this transaction, which closed in 2009, the Company incurred charges of $8.4 million in 2008. During the year ended December 31, 2007 the Company incurred a loss of $6.6 million related to the sale of the direct current (DC) electric motor business located in Berching, Germany and a loss of $2.4 million on the sale of the assets and product lines which were manufactured in Swindon, England. These activities were part of the Company's plan to divest of product lines that do not fit the Company's long-term strategic direction.
During the year ended December 31, 2008, the Propel segment recorded a gain of $1.4 million related to the sale of the LaSalle, Illinois plant and the Controls segment incurred $0.4 million of equipment write-off costs related to the closure of the facility in Hillsboro, Oregon.
Operating Results—2008 Compared to 2007
Sales Growth by Market
The following table summarizes the Company's sales growth by market. The table and following discussion is on a comparable basis, which excludes the effects of currency fluctuations.
| |
Americas | Asia-Pacific | Europe | Total | |||||||||
|---|---|---|---|---|---|---|---|---|---|---|---|---|---|
Agriculture/Turf Care |
4 | % | 3 | % | 22 | % | 10 | % | |||||
Construction/Road Building |
(5 | ) | 12 | (11 | ) | (5 | ) | ||||||
Material Handling/Specialty |
(13 | ) | 77 | (8 | ) | (5 | ) | ||||||
Distribution |
9 | 14 | 0 | 7 | |||||||||
Agriculture/Turf Care
Sales into the agriculture/turf care markets increased 10 percent during the year ended December 31, 2008 compared to 2007. Agriculture sales in Europe remained strong throughout 2008, but started to show signs of slowing towards the end of the year. Agriculture sales increased in the Americas due to strong commodity prices, however they started to show signs of weakening late in 2008. Increased sales into the Americas agriculture market were offset by decreased sales into the turf care market, primarily driven by the decline in housing starts and concerns regarding the slowing economic conditions.
Construction/Road Building
Sales into the construction/road building markets decreased 5 percent during 2008, with the majority of the decrease occurring in the fourth quarter. The decrease is driven by an 11 percent decrease in the European market and a 5 percent decrease in the Americas market, both due to weakening economic conditions, reduced housing starts, and customers' focus on reducing inventory levels. Asia-Pacific experienced a 12 percent increase due to strength in the Chinese road building market throughout most of 2008, although this market began to show signs of weakening during the fourth quarter of 2008. Export sales out of the Asia-Pacific region also started to weaken during the fourth quarter of 2008.
25
Material Handling/Specialty
Specialty vehicles are comprised of a variety of markets including forestry, material handling, marine, waste management and waste recycling. Overall the material handling/specialty markets declined 5 percent, driven by declines in Europe and the Americas due to weak non-residential construction and reductions in capital expenditures by rental companies. Sales through the third quarter of 2008 were level with 2007 but decreased in the fourth quarter as a result of the economic downturn. The decreases in Europe and the Americas were partly offset by strength in the Asia-Pacific region due primarily to a strong market for railway construction machines.
Distribution
Products related to all of the above markets are sold to distributors, who then serve smaller OEMs.
Order Backlog
The following table shows the Company's order backlog and orders written activity for 2007 and 2008, separately identifying the impact of currency fluctuations.
| (in millions) |
2007 | Currency fluctuation | Underlying change | 2008 | |||||||||
|---|---|---|---|---|---|---|---|---|---|---|---|---|---|
Backlog at December 31 |
$ | 921.4 | $ | (16.2 | ) | $ | (161.5 | ) | $ | 743.7 | |||
Orders written |
2,214.8 | 77.8 | (364.9 | ) | 1,927.7 | ||||||||
Total order backlog at the end of 2008 was $743.7 million, compared to $921.4 million at the end of 2007. On a comparable basis, excluding the impact of currency fluctuation, order backlog decreased 18 percent compared to 2007. New sales orders written for 2008 were $1,927.7 million, a decrease of 16 percent compared to 2007, excluding the impact of currency fluctuations.
Backlog information can vary as customers alter their sales order patterns. The 16 percent decrease in orders written in 2008 reflects the downturn experienced in almost all markets and regions during the fourth quarter of 2008. This downturn is also reflected in our order backlog which declined 18 percent excluding the impacts of currency.
Business Segment Results
The following table provides a summary of each segment's net sales and segment income, separately identifying the impact of currency fluctuations during the year.
| (in millions) |
2007 | Currency fluctuation | Underlying change | 2008 | ||||||||||
|---|---|---|---|---|---|---|---|---|---|---|---|---|---|---|
Net sales |
||||||||||||||
Propel |
$ | 940.7 | $ | 37.8 | $ | 38.1 | $ | 1,016.6 | ||||||
Work Function |
534.0 | 26.0 | 1.4 | 561.4 | ||||||||||
Controls |
497.8 | 21.2 | (6.5 | ) | 512.5 | |||||||||
Segment income (loss) |
||||||||||||||
Propel |
$ | 146.6 | $ | 8.3 | $ | 1.9 | $ | 156.8 | ||||||
Work Function |
(2.9 | ) | 0.7 | (63.5 | ) | (65.7 | ) | |||||||
Controls |
17.7 | 0.0 | (39.1 | ) | (21.4 | ) | ||||||||
Global Services and other expenses, net |
(51.1 | ) | (4.1 | ) | 12.8 | (42.4 | ) | |||||||
Propel Segment
The Propel segment experienced a 4 percent increase in sales, excluding the effects of currency fluctuations, during 2008. Segment income increased 1 percent during the same period. Segment income
26
was negatively impacted by $2.3 million of severance costs, offset by a gain of $1.4 million related to the sale of a building. Field recall costs increased $1.5 million during 2008 and administrative costs increased $3.5 million. Restructuring costs of $5.5 million were recorded during 2007.
Work Function Segment
Sales in the Work Function segment increased slightly, excluding the effects of currency fluctuations, during the year ended December 31, 2008. Sales increased 2 percent excluding the effects of both currency and the divestiture of product lines in Swindon, England in June 2007. Segment income was negatively impacted by goodwill impairment charges of $17.4 million. These charges were incurred as a result of lower profitability in the motors and steering reporting units than the Company had previously expected and lower future expectations in certain end markets. The Work Function segment incurred property, plant and equipment impairment charges of $35.3 million as a result of lower expected cash flow related to the products produced within the motors asset group. Segment income was also negatively impacted by severance costs of $6.5 million as a result of recent actions taken in response to the slowing economy.
Controls Segment
Sales in the Controls segment decreased 1 percent for the year ended December 31, 2008, excluding the effects of currency fluctuations, compared to 2007. Segment income declined $39.1 million. This decrease is due to several factors, including an $8.4 million increase in field recall costs and a $6.8 million increase in fixed overhead costs due to increases in production capacity. Also contributing to the decline in segment income was an additional $4.5 million of research and development costs.
During 2008, the Controls segment recognized $8.4 million of charges related to the expected sale of the AC electric motor business for the material handling market in 2009, goodwill impairment charges of $5.5 million, severance costs of $5.1 million, and a $0.4 million write-down of fixed assets related to the decision to close the facility in Hillsboro, Oregon. During 2007, the Controls segment recognized a loss of $6.6 million related to the sale of the DC electric motor business and $3.2 million of costs to reorganize the DC and AC electric motor business prior to the sale.
Global Services and other expenses, net
Global services and other expenses decreased $12.8 million excluding the impacts of currency, or 25 percent. This is primarily due to a $6.6 million reduction in incentive costs during the year ended December 31, 2008, a reduction of $4.6 million in costs associated with the implementation of the Company's common business system, and a $5.1 million reduction in losses related to foreign currency transactions.
Income Taxes
The Company incurred income tax expense of $14.1 million on income of $2.7 million in 2008.
In 2008 the Company recorded $22.9 million for the impairment of goodwill, of which $18.8 million was not deductible for income tax purposes and therefore no tax benefit was recorded on this expense. Valuation allowances and contingency reserves of $3.0 million were recorded as tax expense in 2008 which relates to impaired tax assets in the U.S., Italy and Germany. Other non-deductible expenses and the worldwide earnings mix also impacted the 2008 effective tax rate.
Market Risk
The Company is naturally exposed to various market risks, including changes in foreign currency exchange rates and interest rates.
27
Foreign Currency Changes
The Company has operations and sells its products in many different countries of the world and therefore, conducts its business in various currencies. The Company's financial statements, which are presented in U.S. dollars, can be impacted by foreign exchange fluctuations through both translation risk and transaction risk. Translation risk is the risk that the financial statements of the Company, for a particular period or as of a certain date, may be affected by changes in the exchange rates that are used to translate the financial statements of the Company's operations from foreign currencies into U.S. dollars. Transaction risk is the risk from the Company receiving its sale proceeds or holding its assets in a currency different from that in which it pays its expenses and holds its liabilities.
In previous years, the Company had been well balanced between its U.S. and European operations because the Company generated its sales in the same region in which it incurred its expenses, or shipped products between geographic regions on a balanced basis. However, in recent years the balance has shifted and the amount of sales made in U.S. dollars has increased, whereas the production costs are in a currency other than the U.S. dollar, increasing the Company's exposure to transaction risk. In 2009 the Company sold a total of $95.9 million of product into the U.S. that had been produced in European-based currencies compared to sales into Europe of $34.3 million of product produced in U.S. dollars. This imbalance had a significant impact on the results of the Company. In 2009 the results were favorable as the dollar strengthened in comparison to other currencies. The Company produces and sells its product in several regions of the world, however the U.S. and European transactions comprise the majority of the imbalance between regions.
The Company enters into forward contracts to minimize the impact of currency fluctuations on cash flows related to forecasted sales denominated in currencies other than the functional currency of the selling location. The forecasted sales represent sales to both external and internal parties. Any effects of the forward contracts related to sales to internal parties are eliminated in the consolidation process until the related inventory has been sold to an external party. The forward contracts qualify for hedge accounting and therefore are subject to effectiveness testing at the inception of the contract and throughout the life of the contract. In 2009, as a result of hedge accounting for the forward contracts, the Company recognized a decrease to net sales of $5.5 million and other income of $0.9 million. The fair value of forward contracts included on the balance sheet at December 31, 2009 was a net asset of $0.5 million.
The Company is also impacted by translation risk in terms of comparing results from period to period. Fluctuations of currencies against the U.S. dollar can be substantial and therefore, significantly impact comparisons with prior periods. Translation affects the comparability of both the income statement and the balance sheet. As shown in the table below, the translation impact on net sales was not significant in 2009. This is because the U.S. dollar strengthened against the euro during the first half of the year, while it weakened during the second half of the year.
| |
Percentage Sales Growth Over Prior Year | |||||||||
|---|---|---|---|---|---|---|---|---|---|---|
| |
2009 | 2008 | 2007 | |||||||
As Reported |
(44.6 | )% | 6.0 | % | 13.4 | % | ||||
Without Currency Translation Impact |
(42.8 | ) | 1.7 | 7.8 | ||||||
The change in the exchange rate does affect the comparability of the balance sheet between 2009 and 2008 as the balance sheet accounts are translated at the exchange rate as of December 31. The U.S. dollar weakened 2.6 percent against the euro and 2.4 percent against the Danish kroner from December 31, 2008 to December 31, 2009. The weakening of the dollar has resulted in approximately 36 percent of the Company's total balance sheet being stated approximately 2.5 percent higher than the prior year.
28
Interest Rate Changes
The Company has used interest rate swap agreements on a limited basis to manage the interest rate risk on its total debt portfolio. During March 2009 the Company settled both of its interest rate swap agreements due to repayment of the underlying debt agreements, resulting in a loss of $2.0 million recognized in the consolidated statement of operations as a component of loss on early retirement of debt.
The following table summarizes the maturity of the Company's debt obligations for fixed and variable rate debt (amounts in millions):
| |
Fixed Rate Debt | Variable Rate Debt | |||||
|---|---|---|---|---|---|---|---|
2010 |
$ | 1.1 | $ | 140.9 | |||
2011 |
334.0 | — | |||||
2012 |
1.4 | — | |||||
2013 |
1.0 | — | |||||
2014 |
0.7 | — | |||||
2015 and Thereafter |
— | — | |||||
Total |
$ | 338.2 | $ | 140.9 | |||
Liquidity and Capital Resources
The Company's principal sources of liquidity have been cash flow from operations and from its various credit facilities. The Company historically has accessed diverse funding sources, including short-term and long-term unsecured bank lines of credit in the U.S., Europe, and Asia-Pacific, as well as the private debt markets in the U.S. as discussed in Note 8 in the Notes to Consolidated Financial Statements.
The Company determined, following the close of its 2008 fiscal year, that it would likely be unable to continue to meet the leverage ratio covenants in its various credit agreements as of the end of the first quarter of 2009. To avoid a default under the credit agreements, the Company entered into a Credit Agreement with Danfoss A/S on March 12, 2009, pursuant to which the Company had the ability to borrow up to $490 million (Original Credit Agreement). The Agreement had no financial covenants and was set to mature on September 30, 2010. Danfoss A/S is the Company's majority stockholder.
During the third quarter of 2009, the Company determined that it would require additional liquidity of between $100 million and $150 million over the course of 2010 to meet its projected cash commitments. This additional cash requirement was driven by the Company's greatly reduced operating cash flows in 2009, the continued weakness in the global economy, and an anticipated increase in sales with the accompanying need to fund production activities and customer accounts receivable.
On November 9, 2009, the Company entered into a new Credit Agreement (Danfoss Agreement) with Danfoss A/S. The Agreement was approved by the Company's Board of Directors on November 9, 2009 upon the recommendation of a special committee of the Board comprised exclusively of independent directors. Pursuant to the Danfoss Agreement, the Original Credit Agreement and a $50 million term loan from Danfoss A/S were terminated and replaced by a new unsecured credit facility permitting the Company to borrow up to $690 million from Danfoss A/S. The Company's borrowings under the Agreement will be due and payable in full on April 29, 2011. The Danfoss Agreement contains no financial covenants but it does contain a number of affirmative and negative covenants that, among other things, require the Company to obtain the consent of Danfoss A/S prior to engaging in certain types of transactions.
The principal amount outstanding under the Danfoss Agreement bears interest at a rate equal to the U.S. prime rate or LIBOR, as in effect at times specified in the Agreement, plus 10.0 percent. The Company was required to pay a closing fee of $2.0 million to Danfoss A/S. The Agreement also requires
29
the Company to pay a quarterly fee equal to 4.0 percent of the average daily unused portion of the $690 million credit facility. The Agreement contains customary representations and warranties regarding the Company and its business and operations. It also sets forth a number of events of default for, among other things, failure to pay principal and interest, breaches of representations, warranties and covenants and various events relating to the bankruptcy or insolvency of the Company or its subsidiaries.
The Company expects to have sufficient sources of liquidity to meet its funding needs for the foreseeable future, recognizing that prior to April 29, 2011 the Company will need to either extend its current Credit Agreement with Danfoss A/S or obtain an alternative source of funding from either Danfoss A/S or a third party. However, unexpected events or circumstances, such as further reduced operating cash flows or prolonged or increased weakness in the global economy, could negatively impact the Company's liquidity to an extent that may require the Company to seek new or additional sources of cash prior to April 29, 2011.
Cash Flows from Operations
Cash provided by operations was $86.8 million in 2009. Cash increased as a result of a $91.4 million decrease in accounts receivable, excluding the effects of currency, due primarily to reduced sales levels in 2009, as well as a $153.4 million decrease in inventories, excluding currency, due to lower production volume and inventory reduction efforts. These changes were offset by a $54.2 million decrease in accounts payable at the end of 2009 compared with the end of 2008, as well as a decrease in accrued liabilities of $20.7 million.
Total cash of the Company increased $15.6 million from December 31, 2008 to December 31, 2009 largely due to the fact that borrowings from Danfoss require a 10-day notice, which makes it necessary for the Company to maintain a cash surplus to fund day-to-day operations. At December 31, 2009 cash balances in China totaled $21.9 million, an increase of $3.3 million from December 31, 2008. The Company is paying dividends from its Chinese entities to the maximum extent possible under current regulations; however, due to the nature of the governmental and other regulatory controls, it is difficult to transfer cash out of China for reasons other than payment for goods shipped into that country. As the Company continues to consider expanding its manufacturing capabilities in low-cost regions, it will make every effort to utilize the cash balances in those regions to fund future expansions. Total cash outside of China increased by $12.3 million in 2009.
Cash Used in Investing Activities
Capital expenditures for 2009 totaled $43.0 million compared to $198.6 million in 2008. The decrease in 2009 is the result of lower capacity needs as sales were reduced due to the global economic downturn and management's increased focus on conserving cash.
Cash Used in Financing Activities
The Company paid dividends of $8.7 million in the first quarter of 2009, which were declared in fourth quarter 2008. In 2008 the Company paid dividends of $34.7 million. Net borrowings provided approximately $22.3 million of cash during 2009 compared to $51.8 million in 2008. During 2009 the Company paid $10.6 million in debt origination fees related to the Original Credit Agreement and the Danfoss Agreement, and $10.1 million in debt extinguishment and interest rate swap settlement costs. In addition, the Company makes varying distributions to its noncontrolling interest partners from its various joint venture activities depending on the amount of undistributed earnings of the business and the needs of the partners. Distributions totaled approximately $17.7 million in 2009 compared to $13.9 million in 2008.
30
Contractual Cash Obligations
The majority of the Company's contractual obligations to make cash payments to third parties are for financing obligations. These include future lease payments under both operating and capital leases. The following table discloses the Company's future commitments under contractual obligations as of December 31, 2009:
Contractual Cash Obligations(1)
|
Total | 2010 | 2011 | 2012 | 2013 | 2014 | 2015 and Thereafter | |||||||||||||||
|---|---|---|---|---|---|---|---|---|---|---|---|---|---|---|---|---|---|---|---|---|---|---|
Long-term debt(2) |
$ | 479.1 | $ | 142.0 | $ | 334.0 | $ | 1.4 | $ | 1.0 | $ | 0.7 | $ | 0.0 | ||||||||
Interest on long-term debt(3) |
70.5 | 52.0 | 18.2 | 0.2 | 0.1 | 0.0 | 0.0 | |||||||||||||||
Capital leases |
1.6 | 0.7 | 0.6 | 0.3 | 0.0 | 0.0 | 0.0 | |||||||||||||||
Operating leases |
57.2 | 13.7 | 10.5 | 8.1 | 7.1 | 6.8 | 11.0 | |||||||||||||||
Rental and service agreements with related person Danfoss A/S |
68.8 | 9.3 | 9.3 | 9.2 | 9.0 | 9.0 | 23.0 | |||||||||||||||
Total contractual cash obligations |
$ | 677.2 | $ | 217.7 | $ | 372.6 | $ | 19.2 | $ | 17.2 | $ | 16.5 | $ | 34.0 | ||||||||
The following assumptions are used in the calculation of the contractual cash obligations:
- (1)
- Commitments
denominated in a currency other than the U.S. dollar are translated at the December 31, 2009 exchange rate.
- (2)
- The
annual amount borrowed under revolving credit agreements does not change from the $140.9 million borrowed at December 31, 2009, through
the maturity date of the agreements.
- (3)
- The margin rate on variable interest rate debt does not change from December 31, 2009. The base interest rate for future years is based on the interest yield curves as of December 31, 2009.
In addition to the above contractual obligations, the Company has certain other funding needs that are non-contractual by nature, including funding of certain pension plans. In 2010 the Company anticipates contributing $13.0 million to its pension and health benefit plans.
Other Matters
Critical Accounting Estimates
The SEC's guidance surrounding the disclosure of critical accounting estimates requires disclosures about estimates a company makes in applying its accounting policies. However, such discussion is limited to "critical accounting estimates," or those that management believes meet two criteria: 1) the accounting estimate must require a company to make assumptions about matters that are highly uncertain at the time the accounting estimate is made, and 2) different estimates that the company reasonably could have used for the accounting estimate in the current period, or changes in the accounting estimate that are reasonably likely to occur from period to period, could have a material impact on the presentation of the company's financial condition, changes in financial condition or results of operations.
Besides the estimates that meet the two criteria for a "critical estimate" above, the Company makes many other accounting estimates in preparing its financial statements and related disclosures. All estimates, whether or not deemed critical, can affect the reported amounts of assets, liabilities, revenues, and expenses as well as disclosures of contingent assets and liabilities. Estimates are based on experience and information available prior to the issuance of the financial statements. Materially different results can occur as circumstances change and additional information becomes known, including estimates not deemed "critical" under the SEC's guidance.
The discussion below should be read in conjunction with disclosures elsewhere in this discussion and in the Notes to the Consolidated Financial Statements related to estimates, uncertainties, contingencies,
31
and new accounting standards. Significant accounting policies are discussed in Note 1 to the Consolidated Financial Statements beginning on page F-5. The development and selection of accounting estimates, including those deemed "critical," and the associated disclosures in this discussion, have been discussed by management with the audit committee of the Board of Directors.
Inventory Valuation As a manufacturer in the capital goods industry, inventory is a substantial portion of the assets of the Company, amounting to over 15 percent of total assets at December 31, 2009. The Company must periodically evaluate the carrying value of its inventory to assess the proper valuation. This includes recording period adjustments as needed to 1) record expenses due to excess capacity, 2) provide for excess and obsolete inventory, and 3) ensure that inventory is valued at the lower of cost or market. On a quarterly basis, management within each segment performs an analysis of the underlying inventory to identify the need for appropriate write-downs to cover each of these items. In doing so, management applies consistent practices based upon historical data such as actual loss experience, past and projected usage, actual margins generated from trade sales of its products, and finally its best judgment to estimate the appropriate carrying value of the inventory.
Warranty Provisions The Company warrants its various products over differing periods depending upon the type of product and application. Consequently, the Company records liabilities for the estimated warranty costs that may be incurred under its basic warranty based on past trends of actual warranty claims compared to the actual sales levels to which those claims apply. These liabilities are accrued at the time the sales of the products are recorded. Factors that affect the Company's warranty liability include the number of units in the field currently under warranty, historical and anticipated rates of warranty claims on those units and the cost per claim to satisfy the Company's warranty obligation. The anticipated rate of warranty claims is the primary factor impacting the Company's estimated warranty obligation. Each quarter, the Company reevaluates its estimates to assess the adequacy of its recorded warranty liabilities and adjusts the amounts as necessary.
In addition to its normal warranty liability, the Company, from time to time in the normal course of business, incurs costs to repair or replace defective products with a specific customer or group of customers. The Company refers to these as "field recalls" and in these instances, the Company will record a specific provision for the expected costs it will incur to repair or replace these products utilizing information from customers and internal information regarding the specific cost of materials and labor. Typically, field recalls are infrequent in occurrence, however, when they occur, field recalls can be for a large number of units and quite costly to rectify. Because of the sporadic and infrequent nature of field recalls, and due to the range of costs associated with field recalls, the Company cannot accurately estimate these costs at the time the products are sold. Therefore, these costs are recorded at the time information becomes known to the Company. As the field recalls are settled, the Company relieves the specific liability related to that field recall. These specific field recall liabilities are reviewed on a quarterly basis.
Goodwill and Long-Lived Asset Recovery A significant portion of the Company's total assets consist of property, plant and equipment (PP&E) and definite life intangibles, as well as goodwill. Changes in technology or in the Company's intended use of these assets, as well as changes in the broad global economy in which the Company operates, may cause the estimated period of use or the carrying value of these assets to change.
This requires the Company to periodically assess the estimated useful lives of its assets in order to match, through depreciation and amortization, the cost of those assets with the benefits derived over the period of usefulness. The useful lives of these assets can be shortened through greater use due to volume increases, a change in strategy regarding production of a certain product, rapidly changing technology such as the use of electronics and computer-operated controls, and through inadequate maintenance. Despite management's best efforts to determine the appropriate useful lives of its equipment, certain situations may arise that lead to an asset or group of assets becoming impaired, meaning their economic value becomes less than the value at which the Company is carrying the asset on its books. Examples of these
32
situations are product rationalization efforts or restructuring of manufacturing facilities. When these situations arise, the Company tests the assets for impairment and will write down the asset in the period when the impairment becomes known. Goodwill is tested for impairment at least annually. Goodwill is also tested if an event occurs or conditions change that would more likely than not reduce the fair value of a reporting unit below its carrying value (triggering event).
The Company completes its annual goodwill impairment valuation on December 31 each year. In the first quarter of 2009 the market value of the Company had decreased and therefore was considered a triggering event which required goodwill to be tested for impairment. The Company has identified seven reporting units that are either operating segments or one level below operating segments. In performing the impairment valuation, the Company considers declines in market values, and reconciles the sum of the estimated fair values of its reporting units to the Company's market value (based on its stock price), plus a reasonable control premium, which is estimated as that amount which would be received to sell the Company as a whole in an orderly transaction between market participants.
When testing for goodwill impairment, the Company performs a first step of the goodwill impairment test to identify a potential impairment. In doing so, the Company compares the fair value of a reporting unit with its carrying amount. If the carrying amount of a reporting unit exceeds its fair value, goodwill may be impaired and a second step is performed to measure the amount of any impairment loss. The Company determined that the fair value of goodwill for the propel and mobile electronics reporting units was greater than their carrying values at both March 31, 2009 and December 31, 2009. However, the fair value of goodwill for the valves reporting unit was less than its carrying value at March 31, 2009 and the second step of testing was required to be performed.
In the second step, the Company compares the implied fair value of reporting unit goodwill with the carrying amount of that goodwill. If the carrying amount of reporting unit goodwill exceeds the implied fair value of that goodwill, an impairment loss is recognized in an amount equal to that excess. The implied fair value of goodwill is determined in the same manner that the amount of goodwill recognized in a business combination is determined. The Company allocates the fair value of a reporting unit to all of the assets and liabilities of that unit, including intangible assets, as if the reporting unit had been acquired in a business combination. Any excess of the value of a reporting unit over the amounts assigned to its assets and liabilities is the implied fair value of goodwill. The Company determined that the implied fair value of goodwill for the valves reporting unit was less than its carrying value by $50.8 million which was recorded as a goodwill impairment charge in 2009.
Estimates about fair value used in the first step of the goodwill impairment tests are calculated using an income approach based on the present value of future cash flows of each reporting unit. The income approach is supported by other valuation approaches, such as similar transaction and guideline analyses. Under the income approach, the Company determines fair value based on estimated future cash flows of each reporting unit, discounted by an estimated weighted-average cost of capital, which reflects the overall level of inherent risk of a reporting unit and the rate of return an outside investor would expect to earn. Determining the fair value of a reporting unit is judgmental in nature and requires the use of significant estimates and assumptions, including revenue growth rates and operating margins, discount rates and future market conditions among others. Changes in economic and operating conditions impacting these assumptions could result in goodwill impairments in future periods. At December 31, 2009 the Company had $35.9 million of goodwill related to its propel and electronic components reporting units, which was tested for impairment and determined to not be impaired.
The Company tests its long-lived assets for recoverability at any time that an event or change in circumstances occurs that indicates the carrying amount of the long-lived assets may not be recoverable. Events or circumstances that may trigger a recoverability test include a significant change in the market price of similar long-lived assets; a change in the use of the long-lived asset due to product rationalization efforts or restructuring of manufacturing facilities; a significant adverse change in legal factors, business
33
climate, industry or economic conditions ; an accumulation of costs significantly in excess of the amount originally expected for the acquisition or construction of a long-lived asset; historical and projected operating losses associated with the use of a long-lived asset; or an expectation that more likely than not, a long-lived asset will be disposed of significantly before the end of its previously estimated useful life. The Company reviews these factors quarterly to determine whether a trigger event has occurred. As a result of the challenging economic environment in 2009 the Company determined that the long-lived asset groups should be tested for recoverability.
The Company has seven asset groups, which are the lowest level for which identifiable cash flows are largely independent of other groups of assets and liabilities. Projected cash flows for each asset group are forecasted by the controllers responsible for the business of each asset group and evaluated by management. Revenue forecasts for 2010 through 2014 were derived consistently with the Company's long-term planning and forecasting process, taking into account such factors as historical growth rates, foreseen changes in future product offerings, government regulations, and improving market conditions. For years after 2014 the Company assumed a 3 percent growth rate. In the Company's testing at December 31, 2009, capital expenditures for maintenance were assumed to be approximately 2.5 percent of revenues for the motors asset group and 2 percent of revenues for the open circuit and steering asset groups due to the nature of the long-lived assets included in each of the asset groups and planned capital expenditures to maintain the current long-lived assets.
Corporate costs for each functional area are forecasted, as well, and allocated to each asset group by the corporate controller using the same basis used for allocating actual costs for financial reporting. Allocated costs include sales and marketing, finance, human resources, and information technology. Each functional area is allocated based on an underlying allocation key. For example, sales and marketing costs are allocated based on a periodic time study that determines the amount of time spent to sell and market products in each asset group; information technology costs are allocated base on the number of licensed users working for each asset group, and finance and human resources are allocated based on sales revenue recognized by each asset group as a percent of total revenues.
At December 31, 2009 the Company tested its asset groups for recoverability by comparing the carrying value of the net assets for each asset group to the number of years needed when summing the undiscounted operating cash flows for a projected period. The Company determined that no long-lived assets were impaired. Four of the asset groups had excess cash flows that were significant and required no further evaluation. The motors, open circuit and steering asset groups had lower levels of excess cash flow and were analyzed further as follows:
Asset Group
|
Projected Cash Flows Over Remaining Life | Projection Period(1) |
Carrying Value of Net Assets |
Excess | |||||||||
|---|---|---|---|---|---|---|---|---|---|---|---|---|---|
Motors |
$ | 103 | 7 | $ | 95 | $ | 8 | ||||||
Open Circuit |
32 | 8 | 26 | 6 | |||||||||
Steering |
122 | 7 | 104 | 18 | |||||||||
- (1)
- Number of years of projected cash flow needed to equal the carrying value of net assets.
For all three assets groups tested the projected operating cash flows during the life of the primary asset were sufficiently greater than the carrying value of the asset group, and therefore residual values of long-lived assets at the end of that period were not quantified and additional testing to quantify the fair value of long-lived assets was not performed.
Although the current economic environment appears to be improving, if it were to decline and negatively impact the Company's business, there can be no assurance that the Company's estimates and assumptions made for purposes of the Company's goodwill and long-lived asset impairment testing as of December 31, 2009 will prove to be accurate predictions of the future. If the Company's assumptions
34
regarding forecasted revenue or margin growth rates of certain reporting units are not achieved, or the Company's stock price were to decline, the Company may be required to record additional goodwill impairment charges in future periods, whether in connection with the next annual impairment test or if a triggering event requires an earlier impairment test to be performed. It is not possible at this time to determine if any such future impairment charge would result, or if it does, whether the charge would be significant.
Valuation of Trade Receivables The Company records trade receivables due from its customers at the time a sale is recorded in accordance with its revenue recognition policy. The future collectability of these amounts can be impacted by the Company's collection efforts, the financial stability of its customers, and the general economic climate in which it operates. The Company applies a consistent practice of establishing an allowance for accounts that it believes may become uncollectible through reviewing the historical aging of its receivables, looking at the historical losses incurred as a percentage of net sales, and by monitoring the financial strength of its customers regarding specific outstanding accounts receivable balances. In addition, local customary practices have to be taken into account due to varying payment terms being applied in various parts of the world where the Company conducts its business. If the Company becomes aware of a customer's inability to meet its financial obligations (e.g., where it has filed for bankruptcy), the Company establishes a specific allowance for the potential bad debt to reduce the net recognized receivable to the amount it reasonably believes will be collected. The valuation of trade receivables is reviewed quarterly.
Workers Compensation The Company has an insurance policy to cover workers compensation claims in the U.S., in which the Company pays the first $0.25 million per claim, per incident. The Company establishes its workers compensation reserve based on historic growth factors of claims and an estimate of incurred, but not reported claims. This analysis is performed on a quarterly basis.
U.S. Health Care Costs The Company self insures its U.S. health care costs for eligible employees and their qualified dependents with exposure for any one year, excluding prescription costs, limited to $0.2 million per individual. The Company establishes reserves for its health care cost based on historic claims data and an estimate of incurred, but not reported claims. This analysis is performed on a quarterly basis.
Pensions The Company has noncontributory defined benefit pension plans for a portion of its employees. In certain countries, such as the U.S. and the U.K., these plans are funded with plan assets whereas in other countries such as Germany, the plans have historically been unfunded, which is customary. In 2007 the Company started contributing to the German pension plans. The measurement of the Company's pension obligations and costs is dependent on a variety of assumptions determined by management and used by the Company's actuaries. These assumptions include estimates of the present value of projected future pension payments to all plan participants, taking into consideration the likelihood of potential future events such as salary increases and other experience. These assumptions may have an effect on the amount and timing of future contributions. The plan trustee conducts an independent valuation of the fair value of pension plan assets.
The assumptions used in developing the required estimates include the following key factors:
| Discount rates | Inflation | |
| Salary growth | Expected return on plan assets | |
| Retirement rates | Mortality rates |
The Company bases the discount rate assumption on investment yields available at or near year-end on corporate long-term bonds rated AA. The inflation assumption is based on an evaluation of external market indicators. The salary growth assumptions reflect the Company's long-term actual experience, the near-term outlook and assumed inflation. The expected return on plan assets reflects asset allocations,
35
investment strategy, and the views of investment managers and other large pension plan sponsors. Retirement and mortality rates are based primarily on actual plan experience and standard industry actuarial tables, respectively. The effects of actual results differing from our assumptions are accumulated and amortized over future periods and, therefore, generally affect recognized expense in such future periods.
The Company's funding policy for the U.S. plans is to contribute amounts sufficient to meet the minimum funding requirement of the Employee Retirement Income Security Act of 1974, plus any additional amounts the Company may deem to be appropriate. In 2010 the Company anticipates contributing $7.3 million to its U.S. plans, $2.2 million to its German plans, and $0.7 million to its U.K. plans.
Postretirement Benefits Other Than Pensions The Company provides postretirement health care benefits for certain employee groups in the U.S. This plan is contributory and contains certain other cost-sharing features such as deductibles and coinsurance. The Company does not pre-fund this plan and has the right to modify or terminate this plan in the future.
The postretirement liability, which is determined on an actuarial basis, is recognized in the Company's Consolidated Balance Sheets and the postretirement expense is recognized in the Consolidated Statements of Operations. The Company must determine the actuarial assumption for the discount rate used to reflect the time value of money in the calculation of the accumulated postretirement benefit obligation for the end of the current year and to determine the postretirement cost for the subsequent year. For guidance in determining this rate, the Company looks at investment yield trends available near year-end on corporate bonds rated AA. In addition, the Company must determine the actuarial assumption for the health care cost trend rate used in the calculation of the accumulated postretirement benefit obligation for the end of the current year and to determine the net periodic postretirement benefit cost for the subsequent year. As of December 31, 2009 a one-percentage point change in the assumed health care cost trend rate would impact the expense recognized in 2009 by $0.2 million and would affect the postretirement benefit obligation by $4.3 million. In 2010 the Company anticipates contributing $2.8 million to this plan.
Deferred Income Taxes and Valuation Allowances Tax regulations may require items to be included in the tax return at different times than the items are reflected in the financial statements. Some of the differences are permanent, such as expenses that are not deductible on a tax return, and some of the differences are temporary such as the rate of depreciation expense. Temporary differences create deferred tax assets and liabilities. Deferred tax assets generally are attributable to items that can be used as a tax deduction or credit in a tax return in future years but the amount has already been included as an expense in the financial statements. Deferred tax liabilities generally represent deductions that have been taken on the tax return but have not been recognized as expense in the financial statements. Valuation allowances are recorded to reduce deferred tax assets when it is more likely than not that a tax benefit will not be realized. Management believes it is more likely than not that the Company will realize the benefits of the net deferred tax assets reported on the consolidated balance sheets.
New Accounting Policies
In June 2009 the Financial Accounting Standards Board (FASB) issued Accounting Standards Codification (ASC) 105-10, "The FASB Accounting Standards Codification and the Hierarchy of Generally Accepted Accounting Principles-a replacement of FASB Statement No. 162." The FASB Accounting Standards Codification is intended to be the source of authoritative U.S. generally accepted accounting principles (GAAP) and reporting standards recognized by the FASB. Its primary purpose is to improve clarity and use of existing standards by grouping authoritative literature under common topics. The Codification does not change or alter existing GAAP and there was no impact on the Company's consolidated financial position or results of operations when it was adopted in the third quarter of 2009.
36
FASB ASC 805 establishes requirements for recognition and measurement of identifiable assets acquired, liabilities assumed, noncontrolling interest of the acquiree, goodwill acquired, and gain from bargain purchase. The guidance within FASB ASC 805 was issued in December 2007 and applies prospectively to business combinations for which the acquisition date is on or after the beginning of the annual reporting period beginning on or after December 15, 2008. The Company adopted this guidance as of January 1, 2009 with no impact on the consolidated financial statements.
The FASB issued new guidance contained within ASC 810-10, "Noncontrolling Interests in Consolidated Financial Statements—an amendment of ARB No. 51" in December 2007. The new guidance was issued to improve the relevance, comparability, and transparency of financial information provided to investors by requiring all entities to report noncontrolling (minority) interests in subsidiaries as equity in the consolidated financial statements. The Company adopted this guidance in the first quarter of 2009. Upon adoption, certain prior period amounts have been reclassified to conform to the current period financial statement presentation. These reclassifications have no impact on the previously reported financial position or results of operations.
In March 2008 the FASB issued guidance contained within ASC 815-10, "Disclosures about Derivative Instruments and Hedging Activities—an amendment of FASB Statement No. 133." The guidance amends and expands disclosure requirements for derivative instruments in order to provide users of financial statements with an enhanced understanding of (i) how and why an entity uses derivative instruments, (ii) how derivative instruments and related hedged items are accounted for and (iii) how derivative instruments and related hedged items affect an entity's financial position, financial performance, and cash flows. The Company adopted this guidance in the first quarter of 2009 and has included the expanded disclosures in the footnotes to the Consolidated Financial Statements.
The FASB issued new guidance contained within ASC 260-10, "Determining Whether Instruments Granted in Share-Based Payment Transactions Are Participating Securities" in June 2008. The guidance provides guidance on the calculation of earnings per share and indicates that all outstanding unvested share-based payment awards that contain rights to nonforfeitable dividends or dividend equivalents are considered participating securities and therefore the two-class method should be applied in calculating basic and diluted earnings per share. The guidance is effective for fiscal years, and interim periods within those fiscal years, beginning on or after December 15, 2008. The Company adopted this guidance in first quarter 2009 with no impact on the consolidated financial statements.
In May 2009 the FASB issued guidance contained within ASC 855-10, "Subsequent Events." This Statement incorporates guidance into accounting literature that was previously addressed only in auditing standards. The statement refers to subsequent events that provide additional evidence about conditions that existed at the balance-sheet date as "recognized subsequent events." Subsequent events which provide evidence about conditions that arose after the balance-sheet date but prior to the issuance of the financial statements are referred to as "non-recognized subsequent events." It also requires companies to disclose the date through which subsequent events have been evaluated and whether this date is the date the financial statements were issued or the date the financial statements were available to be issued. The Company adopted this guidance in the second quarter of 2009 with appropriate disclosures added in Note 18.
Non-Audit Services of Independent Registered Public Accounting Firm
The Company's Independent Registered Public Accounting Firm, KPMG LLP, performed the following non-audit services that have been approved by the Audit Committee of the Board of Directors: international tax planning and compliance services, expatriate tax services for persons not in a financial reporting oversight role, and statutory audits and related matters.
37
Outlook
Management expects sales to increase in 2010 compared to 2009 due to improved conditions in the markets the Company serves, in addition to customers who need to replenish their inventory levels. The growth in sales, combined with the fixed cost reductions achieved in 2009, should result in positive earnings from operations in 2010.
Item 7A. Quantitative and Qualitative Disclosures about Market Risk.
Certain market risks are discussed on pages 27-28 of this report, and the other disclosure requirements are considered either not applicable or not material.
Item 8. Financial Statements and Supplementary Data.
The Consolidated Financial Statements, Report of Management, and Report of Independent Registered Public Accounting Firm are presented on pages F-1 through F-42 of this report.
38
Item 9A. Controls and Procedures.
Conclusion Regarding the Effectiveness of Disclosure Controls and Procedures
As required by Rule 13a-15(b) and 15d-15(b) under the Securities Exchange Act of 1934 (Exchange Act) the Company's management carried out an evaluation, with the participation of the Company's Chief Executive Officer and Chief Financial Officer, of the effectiveness of the design and operation of the Company's disclosure controls and procedures as of December 31, 2009. Based upon that evaluation, the Chief Executive Officer and Chief Financial Officer have concluded that, as of December 31, 2009, the Company's disclosure controls and procedures were effective to ensure that (a) information required to be disclosed in the reports that the Company files or submits under the Exchange Act is recorded, processed, summarized, and reported within the time periods specified in the Securities and Exchange Commission's rules and forms and (b) such information is accumulated and communicated to the Company's management, including the Chief Executive Officer and Chief Financial Officer, as appropriate to allow timely decisions regarding required disclosure.
Management's Report on Internal Control Over Financial Reporting
The Registrant's management is responsible for establishing and maintaining a system of internal controls over financial reporting, as such term is defined in Exchange Act Rules 13a-15(f) and 15d-15(f). This system is augmented by written policies and procedures, careful selection and training of financial management personnel, a continuing management commitment to the integrity of the system, and examinations by an internal audit function that coordinates its activities with the Registrant's Independent Registered Public Accounting Firm. Because of its inherent limitations, however, even the best internal control over financial reporting may not prevent or detect misstatements. It is also important to note that controls that are effective at a particular point in time may become ineffective at a later time due to changed conditions that may require new or modified controls or due to a deterioration in compliance with the controls. There were no changes in the Registrant's internal control over financial reporting during the fourth quarter that have materially affected, or are reasonably likely to materially affect, the Registrant's internal control over financial reporting.
Under the supervision and with the participation of the Registrant's management, including the Registrant's Chief Executive Officer and Chief Financial Officer, the Registrant conducted an evaluation of the effectiveness of the Registrant's internal controls over financial reporting based on the framework in Internal Control—Integrated Framework issued by the Committee of Sponsoring Organizations of the Treadway Commission (COSO). Based on the Registrant's evaluation under the framework in Internal Control—Integrated Framework, the Registrant's management concluded that its internal control over financial reporting was effective as of December 31, 2009.
KPMG LLP, an independent registered public accounting firm has audited the consolidated financial statements included in this Annual Report on Form 10-K and, as a part of the audit, has issued their report, included in Item 8, on the effectiveness of the Registrant's internal control over financial reporting.
Attestation Report of Independent Registered Public Accounting Firm
The attestation report required under this item is contained in Item 8 of this Annual Report on Form 10-K.
39
Item 10. Directors, Executive Officers and Corporate Governance
Information regarding directors of the Company is set forth under the section entitled "ELECTION OF DIRECTORS" of the Company's Proxy Statement for the annual meeting of stockholders to be held June 11, 2010 (the "Proxy Statement"), and is incorporated herein by reference. Information regarding executive officers of the Company is set forth in Part I of this report under the caption "Executive Officers of the Company." Information regarding the Company's code of conduct and code of ethics is set forth under the section entitled "GOVERNANCE OF THE COMPANY—Code of Conduct and Code of Ethics" of the Proxy Statement, and is incorporated herein by reference. Information regarding the Company's audit committee is set forth under the section entitled "GOVERNANCE OF THE COMPANY—Audit Committee" of the Proxy Statement and is incorporated herein by reference. Copies of the Worldwide Code of Legal and Ethical Business Conduct and the Code of Ethics for Chief Executive Officer, Chief Financial Officer, Principal Accounting Officer or Controller and other Senior Financial Staff are posted on the Company's website at http://ir.sauer-danfoss.com, and printed copies of such codes may be obtained, without charge, by written request addressed to Kenneth D. McCuskey, Corporate Secretary, 2800 E. 13th Street, Ames, Iowa 50010.
The Company's Audit Committee Charter, Compensation Committee Charter, and Corporate Governance Guidelines are posted on the Company's website set forth in the preceding paragraph. Also, printed copies of such charters and guidelines may be obtained, without charge, by sending a written request to the Corporate Secretary at the address set forth in the preceding paragraph.
Item 11. Executive Compensation
Information as to Executive Compensation is set forth under the section entitled "EXECUTIVE COMPENSATION" of the Proxy Statement, and is incorporated herein by reference. Information regarding compensation committee interlocks is set forth under the section entitled "Compensation Committee Interlocks and Insider Participation" of the Proxy Statement, and is incorporated herein by reference. The Company's compensation committee's report is set forth under the section entitled "Compensation Committee Report" of the Proxy Statement, and is incorporated herein by reference.
Item 12. Security Ownership of Certain Beneficial Owners and Management and Related Stockholder Matters
Information regarding securities authorized for issuance under equity compensation plans is set forth in Part II on page 16 of this report. Information regarding security ownership is set forth under the section entitled "SECURITY OWNERSHIP OF CERTAIN BENEFICIAL OWNERS AND MANAGEMENT" of the Proxy Statement, and is incorporated herein by reference.
Item 13. Certain Relationships and Related Transactions, and Director Independence
In connection with the acquisition of Danfoss Fluid Power in May 2000 and the acquisition of additional assets and business operations of the fluid power business of Danfoss A/S in January 2001, the Company has entered into several agreements with Danfoss A/S to purchase ongoing operational services from Danfoss A/S. Information regarding these relationships and agreements, in addition to other related person transactions, is set forth in Note 15 in the Notes to Consolidated Financial Statements on pages F-38 and F-39 of this report, and is incorporated herein by reference.
On November 9, 2009, the Company entered into a Credit Agreement (Danfoss Credit Agreement) with Danfoss A/S, which allows the Company to borrow up to $690 million under an unsecured revolving credit facility. The Danfoss Credit Agreement replaced a $490 million revolving credit facility and a $50 million term loan, both with Danfoss A/S, which had been entered in March 2009 and December 2008,
40
respectively. Information regarding these relationships and loan transactions is set forth in Notes 8 and 15 in the Notes to Consolidated Financial Statements on pages F-21 through F-23 and F-38 through F-39 of this report, respectively, and is incorporated herein by reference.
Additional information regarding related person transactions is set forth under the section entitled "GOVERNANCE OF THE COMPANY—Transactions with Related Persons" of the Proxy Statement, and is incorporated herein by reference. Information about the independence of the Company's directors is set forth in the Proxy Statement under the section entitled 'GOVERNANCE OF THE COMPANY' under the subheadings 'Board of Directors' and 'Basis for Board Determination of Independence of Directors', and is incorporated herein by reference.
Item 14. Principal Accountant Fees and Services
Information regarding accounting services and fees is set forth under the section entitled "RATIFICATION OF APPOINTMENT OF INDEPENDENT REGISTERED PUBLIC ACCOUNTING FIRM" of the Proxy Statement, and is incorporated herein by reference.
41
Item 15. Exhibits and Financial Statement Schedules.
- (a)
- The
following documents are filed as a part of this report.
- (1)
- The following consolidated financial statements and related information, included in Item 8, are filed as a separate section of this report:
- (2)
- The following schedule:
Consolidated Statements of Operations for the years ended December 31, 2009, 2008, and 2007, on page F-1.
Consolidated Balance Sheets as of December 31, 2009 and 2008, on page F-2.
Consolidated Statements of Stockholders' Equity and Comprehensive Income (Loss) for the years ended December 31, 2009, 2008, and 2007, on page F-3.
Consolidated Statements of Cash Flows for the years ended December 31, 2009, 2008, and 2007, on page F-4.
Notes to Consolidated Financial Statements, December 31, 2009, 2008, and 2007, on pages F-5 through F-42.
Report of Management and Report of Independent Registered Public Accounting Firm, KPMG LLP, on pages F-43 through F-45.
- (3)
- Exhibits
Schedule II, Valuation and Qualifying Accounts, on page F-46.
All other schedules for which provision is made in Regulation S-X of the Securities and Exchange Commission are not required under the related instructions or are inapplicable and, therefore, have been omitted.
| Exhibit No. | Description of Document | |
|---|---|---|
| 3.1 | The Amended and Restated Certificate of Incorporation of the Company dated July 10, 2008, is attached as Exhibit 3.1 to the Company's Form 8-K filed on July 11, 2008, and is incorporated herein by reference. | |
| 3.2 | The Amended and Restated Bylaws of the Company dated July 10, 2008, are attached as Exhibit 3.2 to the Company's Form 8-K filed on July 11, 2008, and are incorporated herein by reference. | |
| 4 | The form of Certificate of the Company's Common Stock, $.01 Par Value, is attached as Exhibit 4 to the Company's Form 10-Q filed on August 16, 2000 and is incorporated herein by reference. | |
| 10.1(a) | The Registration Rights Agreement is attached as Exhibit 10.1(b) to Amendment No. 1 to the Company's Form S-1 Registration Statement filed on April 23, 1998, and is incorporated herein by reference. | |
| 10.1(b) | The form of Indemnification Agreement entered into between the Company and each of its directors and certain officers is attached as Exhibit 10.1(c) to Amendment No. 1 to the Company's Form S-1 Registration Statement filed on April 23, 1998, and is incorporated herein by reference. | |
| 10.1(c) | The Lease Agreement for the Company's Osaka, Japan, facility is attached as Exhibit 10.1(d) to the Company's Form 10-K filed March 14, 2005, and is incorporated herein by reference. |
42
| Exhibit No. | Description of Document | |
|---|---|---|
| 10.1(d) | The Lease Agreement for the Company's Minneapolis, Minnesota, facility is attached as Exhibit 10.1(h) to Amendment No. 1 to the Company's Form S-1 Registration Statement filed on April 23, 1998, and is incorporated herein by reference. | |
| 10.1(e) | Amendment No. 1 to the Lease Agreement for the Company's Minneapolis, Minnesota facility, effective March 1, 2003, is attached as Exhibit 10.1(e) to the Company's Form 10-K filed on March 24, 2009, and is incorporated herein by reference. | |
| 10.1(f) | Amendment No. 2 to the Lease Agreement for the Company's Minneapolis, Minnesota facility, effective March 28, 2007, is attached as Exhibit 10.1(f) to the Company's Form 10-K filed on March 24, 2009, and is incorporated herein by reference. | |
| 10.1(g) | The Lease Agreement for the Company's Shanghai/Pudong, China, facility is attached as Exhibit 10.1(j) to Amendment No. 1 to the Company's Form S-1 Registration Statement filed on April 23, 1998, and is incorporated herein by reference. | |
| 10.1(h) | The Indenture of Lease agreement for the Company's Nordborg, Denmark, facility effective May 3, 2000, is attached as Exhibit 10.1(ah) to the Company's Form 10-K filed on March 30, 2001, and is incorporated herein by reference. | |
| 10.1 (i) | The Lease Agreement for the Company's leased facility in Caxias do Sul, Brazil, effective July 1, 2007, is attached as Exhibit 10.1(l) to the Company's Form 10-K filed on March 11, 2008, and is incorporated herein by reference. | |
| 10.1 (j) | The Lease Agreement for the Company's leased facility in Reggio Emilia, Italy, effective October 1, 2003, is attached as Exhibit 10.1(m) to the Company's Form 10-K filed on March 11, 2008, and is incorporated herein by reference. | |
| 10.1(k) | The Lease Agreement for the Company's leased facility in Bielany Wroclawskie, Poland, including Annex 1 effective May 16, 2008, and Annex 2 effective October 28, 2009, is attached hereto. | |
| 10.1(l) | The Lease Agreement for the Company's leased facility in Älmhult, Sweden, effective May 2007, is attached hereto. | |
| 10.1(m) | The Executive Employment Agreement with David J. Anderson dated January 1, 2003, is attached as Exhibit 10.1(m) to the Company's Form 10-K filed on March 12, 2003, and is incorporated herein by reference. | |
| 10.1(n) | The Employment Contract effective as of January 1, 2009 by and between Sauer-Danfoss GmbH & Co. OHG and Sven Ruder is attached as Exhibit 10.2 to the Company's Form 8-K filed on January 21, 2009, and is incorporated herein by reference. | |
| 10.1(o) | The Executive Employment Agreement with Karl J. Schmidt dated December 15, 2008 and effective December 31, 2008, is attached as Exhibit 10.1(q) to the Company's Form 10-K filed on March 24, 2009, and is incorporated herein by reference. | |
| 10.1(p) | The Employment Contract by and between Sauer-Danfoss GmbH & Co. OHG and Hans J. Cornett dated December 12, 2008, is attached as Exhibit 10.1(r) to the Company's Form 10-K filed on March 24, 2009, and is incorporated herein by reference. | |
| 10.1(q) | The Termination Agreement between Sauer-Danfoss GmbH & Co. OHG and Hans J. Cornett dated October 23, 2009, and is attached hereto. | |
| 10.1(r) | The Employment Contract by and between Sauer-Danfoss GmbH & Co. OHG and Thomas Kittel dated January 23, 2009, is attached as Exhibit 10.1(s) to the Company's Form 10-K filed on March 24, 2009, and is incorporated herein by reference. | |
| 10.1(s) | The Executive Employment Agreement with Henrik Krabsen dated December 15, 2008 and effective December 31, 2008, is attached as Exhibit 10.1(t) to the Company's Form 10-K filed on March 24, 2009, and is incorporated herein by reference. |
43
| Exhibit No. | Description of Document | |
|---|---|---|
| 10.1(t) | The Executive Employment Agreement with Kenneth D. McCuskey dated December 15, 2008 and effective December 31, 2008, is attached as Exhibit 10.1(u) to the Company's Form 10-K filed on March 24, 2009, and is incorporated herein by reference. | |
| 10.1(u) | The Executive Employment Agreement with Ronald C. Hanson dated December 15, 2008 and effective December 31, 2008, is attached as Exhibit 10.1(v) to the Company's Form 10-K filed on March 24, 2009, and is incorporated herein by reference. | |
| 10.1(v) | The Executive Employment Agreement with Wolfgang Schramm dated December 15, 2008 and effective December 31, 2008, is attached as Exhibit 10.1(w) to the Company's Form 10-K filed on March 24, 2009, and is incorporated herein by reference. | |
| 10.1(w) | The Employment Contract dated April 6, 2009 and effective as of May 1, 2009 by and between Sauer-Danfoss GmbH & Co. OHG and Jesper V. Christensen is attached as Exhibit 10.1 to the Company's Form 10-Q filed on May 6, 2009, and is incorporated herein by reference. | |
| 10.1(x) | The Change in Control Agreement between Sauer-Danfoss (US) Company Inc. and Charles K. Hall dated March 8, 2004, is attached hereto. | |
| 10.1(y) | The First Amendment to the Change in Control Agreement between Sauer-Danfoss (US) Company and Charles K. Hall dated December 20, 2008, is attached hereto. | |
| 10.1(z) | The Sauer-Danfoss Inc. 1998 Long-Term Incentive Plan is attached as Exhibit 10.1(p) to Amendment No. 1 to the Company's Form S-1 Registration Statement filed on April 23, 1998, and is incorporated herein by reference. | |
| 10.1(aa) | The Amendment, effective May 3, 2000, to the Sauer-Danfoss Inc. 1998 Long-Term Incentive Plan referred to in 10.1(z) above is attached as Exhibit 10.1(v) to the Company's Form 10-Q filed on August 16, 2000, and is incorporated herein by reference. | |
| 10.1(ab) | The Amendment to the Sauer-Danfoss Inc. 1998 Long-Term Incentive Plan effective December 4, 2002, is attached as Exhibit 10.1(bd) to the Company's Form 10-K filed on March 12, 2003, and is incorporated herein by reference. | |
| 10.1(ac) | The Second Amendment to Sauer-Danfoss Inc. 1998 Long-Term Incentive Plan is attached as Exhibit 10 to the Company's Form 8-K filed on August 24, 2006, and is incorporated herein by reference. | |
| 10.1(ad) | The Sauer-Danfoss Inc. Non-employee Director Stock Option and Restricted Stock Plan is attached as Exhibit 10.1(q) to Amendment No. 1 to the Company's Registration Statement filed on April 23, 1998, and is incorporated herein by reference. | |
| 10.1(ae) | The Amendment, effective May 3, 2000, to the Sauer-Danfoss Inc. Non-Employee Director Stock Option and Restricted Stock Plan referred to in 10.1(ad) above is attached as Exhibit 10.1(x) to the Company's Form 10-Q filed on August 16, 2000, and is incorporated herein by reference. | |
| 10.1(af) | The Amendment to the Sauer-Danfoss Inc. Non-Employee Director Stock Option and Restricted Stock Plan effective December 4, 2002, is attached as Exhibit 10.1(ak) to the Company's Form 10-K filed on March 12, 2003, and is incorporated herein by reference. | |
| 10.1(ag) | The Trademark and Trade Name Agreement dated May 3, 2000, between the Company and Danfoss A/S is attached as Exhibit 10.1(ac) to the Company's Form 10-Q filed on August 16, 2000, and is incorporated herein by reference. | |
| 10.1(ah) | The Sauer-Danfoss Inc. Deferred Compensation Plan for Selected Employees dated December 9, 2003, is attached as exhibit 10.1(bk) to the Company's Form 10-K filed on March 15, 2004, and is incorporated herein by reference. |
44
| Exhibit No. | Description of Document | |
|---|---|---|
| 10.1(ai) | First Amendment to the Sauer-Danfoss Inc. Deferred Compensation Plan for Selected Employees, effective December 31, 2005, is attached as exhibit 9.1 to the Company's Form 8-K filed on December 7, 2005, and is incorporated herein by reference. | |
| 10.1(aj) | The Sauer-Danfoss Inc. Supplemental Executive Savings & Retirement Plan (As Amended and Restated Effective as of January 1, 2008), is attached as Exhibit 10.1(ao) to the Company's Form 10-K filed on March 24, 2009, and is incorporated herein by reference. | |
| 10.1(ak) | Form of 2005 Performance Unit Award Agreement under the Sauer-Danfoss Inc. 1998 Long-Term Incentive Plan is attached as exhibit 10.1(bx) to the Company's Form 10-Q filed on May 10, 2005, and is incorporated herein by reference. | |
| 10.1(al) | Form of Non-employee Director Restricted Stock Award Agreement under the Sauer-Danfoss Inc. Non-employee Director Stock Option and Restricted Stock Plan is attached as Exhibit 10.1(by) to the Company's Form 10-Q filed on May 10, 2005, and is incorporated herein by reference. | |
| 10.1(am) | The Sauer-Danfoss Inc. 409A Deferred Compensation Plan for Selected Employees (As Amended and Restated Effective as of January 1, 2008), is attached as Exhibit 10.1(ar) to the Company's Form 10-K filed on March 24, 2009, and is incorporated herein by reference. | |
| 10.1(an) | The Sauer-Danfoss Inc. 2006 Omnibus Incentive Plan is filed as Appendix A to the Company's Definitive Proxy Statement filed on April 24, 2006, and is incorporated herein by reference. | |
| 10.1(ao) | Form of Performance Unit Award Agreement under the Sauer-Danfoss Inc. 2006 Omnibus Incentive Plan is attached as Exhibit 10.2 to the Company's Form 8-K filed on June 7, 2006, and is incorporated herein by reference. | |
| 10.1(ap) | Form of Performance Unit Award Agreement under the Sauer-Danfoss Inc. 2006 Omnibus Incentive Plan is attached as Exhibit 10.1 to the Company's Form 8-K filed on April 5, 2007, and is incorporated herein by reference. | |
| 10.1(aq) | Form of Sauer-Danfoss Inc. 2006 Omnibus Incentive Plan Restricted Stock Award Agreement is attached hereto. | |
| 10.1(ar) | The 2008 Performance Unit Award Agreement with David J. Anderson dated March 12, 2008, is attached as Exhibit 10.1 to the Company's 10-Q filed on May 1, 2008, and is incorporated herein by reference. | |
| 10.1(as) | The Amended and Restated Award Agreement with David J. Anderson dated January 2, 2008, is attached as Exhibits 10.1 to the Company's Form 8-K filed on January 4, 2008, and is incorporated herein by reference. | |
| 10.1(at) | The Amended and Restated Award Agreement with David J. Anderson dated January 2, 2008, is attached as Exhibits 10.2 to the Company's Form 8-K filed on January 4, 2008, and is incorporated herein by reference. | |
| 10.1(au) | The Sauer-Danfoss Inc. Final Average Pay Supplemental Retirement Benefit Plan is attached as Exhibit 10 to the Company's Form 8-K filed on September 17, 2007, and is incorporated herein by reference. | |
| 10.1(av) | The Agreement dated December 8, 2008, by and among Sauer-Danfoss ApS, Schabmuller GmbH, Aurelius AG, and Aurelius Industriekapital GmbH is attached as Exhibit 10.1(bf) to the Company's Form 10-K filed on March 24, 2009, and is incorporated herein by reference. |
45
| Exhibit No. | Description of Document | |
|---|---|---|
| 10.1(aw) | The Credit Agreement dated as of November 9, 2009 by and between Sauer-Danfoss and Danfoss A/S is attached as Exhibit 10.1 to the Company's Form 10-Q filed on November 9, 2009, and is incorporated herein by reference. | |
| 21 | Subsidiaries of the Registrant. | |
| 23.1 | Consent of Independent Registered Public Accounting Firm. | |
| 31.1 | Certification by the Chief Executive Officer Pursuant to Rule 13a-14(a). | |
| 31.2 | Certification by the Chief Financial Officer Pursuant to Rule 13a-14(a). | |
| 32.1 | Certification by the Chief Executive Officer Pursuant to 18 U.S.C. Section 1350. | |
| 32.2 | Certification by the Chief Financial Officer Pursuant to 18 U.S.C. Section 1350. |
- (b)
- The exhibits that are listed under Item 15(a)(3) above are filed or incorporated by reference hereunder.
46
Pursuant to the requirements of Section 13 or 15(d) of the Securities Exchange Act of 1934, the registrant has duly caused this report to be signed on its behalf by the undersigned, thereunto duly authorized.
| SAUER-DANFOSS INC. | ||||
By: |
/s/ KENNETH D. MCCUSKEY Kenneth D. McCuskey Vice President and Chief Accounting Officer, Secretary |
|||
Date: March 4, 2010
Pursuant to the requirements of the Securities Exchange Act of 1934, this report has been signed below by the following persons on behalf of the registrant and in the capacities and on the dates indicated. Each person signing below also hereby appoints Sven Ruder and Kenneth D. McCuskey, and each of them singly, his or her lawful attorney-in-fact with full power to execute and file any and all amendments to this report together with exhibits thereto and generally to do all such things as such attorney-in-fact may deem appropriate to enable Sauer-Danfoss Inc. to comply with the provisions of the Securities Exchange Act of 1934 and all requirements of the Securities and Exchange Commission.
Signature
|
Title
|
Date
|
||
|---|---|---|---|---|
| /s/ SVEN RUDER Sven Ruder |
Director and President and Chief Executive Officer | March 4, 2010 | ||
/s/ JESPER V. CHRISTENSEN Jesper V. Christensen |
Executive Vice President and Chief Financial Officer |
March 4, 2010 |
||
/s/ KENNETH D. MCCUSKEY Kenneth D. McCuskey |
Vice President and Chief Accounting Officer, Secretary |
March 4, 2010 |
||
/s/ NIELS B. CHRISTIANSEN Niels B. Christiansen |
Director |
March 4, 2010 |
||
/s/ JØRGEN M. CLAUSEN Jørgen M. Clausen |
Director |
March 4, 2010 |
||
/s/ KIM FAUSING Kim Fausing |
Director |
March 4, 2010 |
47
| /s/ PER HAVE Per Have |
Director | March 4, 2010 | ||
/s/ WILLIAM E. HOOVER, JR. William E. Hoover, Jr. |
Director |
March 4, 2010 |
||
/s/ JOHANNES F. KIRCHHOFF Johannes F. Kirchhoff |
Director |
March 4, 2010 |
||
/s/ JOSEPH LOUGHREY Joseph Loughrey |
Director |
March 4, 2010 |
||
/s/ SVEN MURMANN Sven Murmann |
Director |
March 4, 2010 |
||
/s/ STEVEN H. WOOD Steven H. Wood |
Director |
March 4, 2010 |
48
Sauer-Danfoss Inc. and Subsidiaries
Consolidated Statements of Operations
(Dollars in thousands, except per share data)
| |
For the Years Ended December 31, | |||||||||||
|---|---|---|---|---|---|---|---|---|---|---|---|---|
| |
2009 | 2008 | 2007 | |||||||||
Net sales |
$ | 1,159,031 | $ | 2,090,513 | $ | 1,972,548 | ||||||
Cost of sales |
1,031,078 | 1,654,903 | 1,544,846 | |||||||||
Gross profit |
127,953 | 435,610 | 427,702 | |||||||||
Selling, general and administrative |
209,713 | 258,491 | 233,809 | |||||||||
Research and development |
61,418 | 82,915 | 70,552 | |||||||||
Impairment charges |
50,841 | 58,208 | — | |||||||||
Loss on sale of businesses and asset disposals |
16,351 | 9,604 | 9,412 | |||||||||
Total operating expenses |
338,323 | 409,218 | 313,773 | |||||||||
Operating income (loss) |
(210,370 | ) | 26,392 | 113,929 | ||||||||
Nonoperating Income (Expenses): |
||||||||||||
Interest expense |
(50,171 | ) | (25,654 | ) | (23,789 | ) | ||||||
Interest income |
1,775 | 1,026 | 1,048 | |||||||||
Loss on early retirement of debt |
(15,838 | ) | — | — | ||||||||
Other, net |
3,369 | 966 | (3,589 | ) | ||||||||
Nonoperating expenses, net |
(60,865 | ) | (23,662 | ) | (26,330 | ) | ||||||
Income (loss) before income taxes |
(271,235 | ) | 2,730 | 87,599 | ||||||||
Income tax |
(61,019 | ) | (14,060 | ) | (18,839 | ) | ||||||
Net income (loss) |
(332,254 | ) | (11,330 | ) | 68,760 | |||||||
Net income attributable to noncontrolling interest, net of tax |
(13,512 | ) | (17,811 | ) | (21,562 | ) | ||||||
Net Income (Loss) attributable to Sauer-Danfoss Inc. |
$ | (345,766 | ) | $ | (29,141 | ) | $ | 47,198 | ||||
Net Income (Loss) per common share, basic |
$ | (7.15 | ) | $ | (0.60 | ) | $ | 0.98 | ||||
Net Income (Loss) per common share, diluted |
$ | (7.15 | ) | $ | (0.60 | ) | $ | 0.98 | ||||
Weighted average basic shares outstanding |
48,337,923 | 48,226,184 | 48,094,375 | |||||||||
Weighted average diluted shares outstanding |
48,337,923 | 48,226,184 | 48,326,637 | |||||||||
See accompanying notes to consolidated financial statements.
F-1
Sauer-Danfoss Inc. and Subsidiaries
Consolidated Balance Sheets
(Dollars in thousands, except per share data)
| |
December 31, | ||||||||
|---|---|---|---|---|---|---|---|---|---|
| |
2009 | 2008 | |||||||
Assets |
|||||||||
Current Assets: |
|||||||||
Cash and cash equivalents |
$ | 38,790 | $ | 23,145 | |||||
Accounts receivable (net of allowances of $5,640 and $5,210 in 2009 and 2008, respectively) |
155,968 | 239,881 | |||||||
Inventories |
177,574 | 325,496 | |||||||
Other current assets |
65,553 | 51,946 | |||||||
Total current assets |
437,885 | 640,468 | |||||||
Property, Plant and Equipment, net |
513,487 | 598,435 | |||||||
Other Assets: |
|||||||||
Goodwill |
35,903 | 86,146 | |||||||
Other intangible assets, net |
19,584 | 23,971 | |||||||
Deferred income taxes |
54,458 | 106,984 | |||||||
Other |
7,000 | 11,672 | |||||||
Total other assets |
116,945 | 228,773 | |||||||
|
$ | 1,068,317 | $ | 1,467,676 | |||||
Liabilities and Stockholders' Equity |
|||||||||
Current Liabilities: |
|||||||||
Notes payable and bank overdrafts |
$ | 54,069 | $ | 65,512 | |||||
Long-term debt due within one year |
142,007 | 58,005 | |||||||
Accounts payable |
101,719 | 149,512 | |||||||
Accrued salaries and wages |
58,169 | 79,322 | |||||||
Accrued warranty |
28,820 | 25,491 | |||||||
Other accrued liabilities |
30,806 | 42,075 | |||||||
Total current liabilities |
415,590 | 419,917 | |||||||
Long-Term Debt |
337,089 | 367,922 | |||||||
Other Liabilities |
|||||||||
Long-term pension liability |
72,400 | 90,966 | |||||||
Postretirement benefits other than pensions |
41,047 | 37,971 | |||||||
Deferred income taxes |
33,708 | 44,243 | |||||||
Other |
13,889 | 28,756 | |||||||
Total other liabilities |
161,044 | 201,936 | |||||||
Total liabilities |
913,723 | 989,775 | |||||||
Stockholders' Equity: |
|||||||||
Preferred stock, par value $.01 per share, authorized 4,500,000 shares, no shares issued or outstanding |
— | — | |||||||
Common stock, par value $.01 per share, authorized shares 75,000,000 in 2009 and 2008; issued and outstanding 48,384,205 in 2009 and 48,271,806 in 2008 |
484 | 483 | |||||||
Additional paid-in capital |
334,873 | 334,847 | |||||||
Retained earnings (accumulated deficit) |
(298,845 | ) | 46,921 | ||||||
Accumulated other comprehensive income |
55,422 | 27,995 | |||||||
Total Sauer-Danfoss Inc. stockholders' equity |
91,934 | 410,246 | |||||||
Noncontrolling interest |
62,660 | 67,655 | |||||||
Total stockholders' equity |
154,594 | 477,901 | |||||||
|
$ | 1,068,317 | $ | 1,467,676 | |||||
See accompanying notes to consolidated financial statements.
F-2
Sauer-Danfoss Inc. and Subsidiaries
Consolidated Statements of Stockholders' Equity and Comprehensive Income (Loss)
(Dollars in thousands, except
per share data)
| |
Number of Shares Outstanding |
Common Stock |
Additional Paid-in Capital |
Retained Earnings (Accumulated Deficit) |
Accumulated Other Comprehensive Income |
Noncontrolling Interest |
Total | |||||||||||||||||
|---|---|---|---|---|---|---|---|---|---|---|---|---|---|---|---|---|---|---|---|---|---|---|---|---|
Year Ended December 31, 2007: |
||||||||||||||||||||||||
Beginning Balance |
47,746,279 | $ | 477 | $ | 336,962 | $ | 98,277 | $ | 26,343 | $ | 53,448 | $ | 515,507 | |||||||||||
Comprehensive income: |
||||||||||||||||||||||||
Net income |
— | — | — | 47,198 | — | 21,562 | ||||||||||||||||||
Pension and postretirement adjustment |
— | — | — | — | 12,462 | — | ||||||||||||||||||
Unrealized gains on hedging activities |
— | — | — | — | 2,144 | — | ||||||||||||||||||
Currency translation |
— | — | — | — | 40,736 | 1,423 | ||||||||||||||||||
Total comprehensive income |
125,525 | |||||||||||||||||||||||
Performance units vested |
379,682 | 4 | (4 | ) | — | — | — | — | ||||||||||||||||
Restricted stock grant |
23,500 | — | — | — | — | — | — | |||||||||||||||||
Restricted stock and |
||||||||||||||||||||||||
performance unit compensation |
— | — | 4,390 | — | — | — | 4,390 | |||||||||||||||||
Tax benefits on |
||||||||||||||||||||||||
performance unit compensation |
— | — | 145 | — | — | — | 145 | |||||||||||||||||
Minimum tax withholding settlement |
— | — | (8,971 | ) | — | — | — | (8,971 | ) | |||||||||||||||
Noncontrolling interest distribution |
— | — | — | — | (15,889 | ) | (15,889 | ) | ||||||||||||||||
Cash dividends declared ($.72 per share) |
— | — | — | (34,663 | ) | — | — | (34,663 | ) | |||||||||||||||
Balance December 31, 2007 |
48,149,461 | 481 | 332,522 | 110,812 | 81,685 | 60,544 | 586,044 | |||||||||||||||||
Year Ended December 31, 2008: |
||||||||||||||||||||||||
Net income (loss) |
— | — | — | (29,141 | ) | — | 17,811 | |||||||||||||||||
Pension and postretirement adjustment |
— | — | — | — | (22,440 | ) | — | |||||||||||||||||
Unrealized losses on hedging activities |
— | — | — | — | (6,861 | ) | — | |||||||||||||||||
Currency translation |
— | — | — | — | (24,389 | ) | 3,181 | |||||||||||||||||
Total comprehensive loss |
(61,839 | ) | ||||||||||||||||||||||
Performance units vested |
110,837 | 2 | (2 | ) | — | — | — | — | ||||||||||||||||
Restricted stock grant |
15,000 | — | — | — | — | — | — | |||||||||||||||||
Restricted stock and |
||||||||||||||||||||||||
performance unit compensation |
— | — | (2,070 | ) | — | — | — | (2,070 | ) | |||||||||||||||
Tax benefits on performance unit compensation |
— | — | 1,534 | — | — | — | 1,534 | |||||||||||||||||
Minimum tax withholding settlement |
(3,492 | ) | — | (1,590 | ) | — | — | — | (1,590 | ) | ||||||||||||||
Reversal of tax valuation allowance |
— | — | 4,453 | — | — | — | 4,453 | |||||||||||||||||
Noncontrolling interest distribution |
— | — | — | — | — | (13,881 | ) | (13,881 | ) | |||||||||||||||
Cash dividends declared ($.72 per share) |
— | — | — | (34,750 | ) | — | — | (34,750 | ) | |||||||||||||||
Balance December 31, 2008 |
48,271,806 | 483 | 334,847 | 46,921 | 27,995 | 67,655 | 477,901 | |||||||||||||||||
Year Ended December 31, 2009: |
||||||||||||||||||||||||
Net income (loss) |
— | — | — | (345,766 | ) | — | 13,512 | |||||||||||||||||
Pension and postretirement adjustment |
— | — | — | — | 6,386 | — | ||||||||||||||||||
Unrealized gains on hedging activities |
— | — | — | — | 4,357 | — | ||||||||||||||||||
Currency translation |
— | — | — | — | 16,684 | 712 | ||||||||||||||||||
Total comprehensive loss |
— | (304,115 | ) | |||||||||||||||||||||
Performance units vested |
101,899 | 1 | (1 | ) | — | — | — | — | ||||||||||||||||
Restricted stock grant, net of fortitures |
10,500 | — | — | — | — | — | ||||||||||||||||||
Restricted stock compensation |
— | — | 253 | — | — | — | 253 | |||||||||||||||||
Minimum tax withholding settlement |
— | — | (226 | ) | — | — | — | (226 | ) | |||||||||||||||
Noncontrolling interest distribution |
— | — | — | — | — | (19,219 | ) | (19,219 | ) | |||||||||||||||
Balance December 31, 2009 |
48,384,205 | $ | 484 | $ | 334,873 | $ | (298,845 | ) | $ | 55,422 | $ | 62,660 | $ | 154,594 | ||||||||||
See accompanying notes to consolidated financial statements
F-3
Sauer-Danfoss Inc. and Subsidiaries
Consolidated Statements of Cash Flows
(Dollars in thousands)
| |
For the Years Ended December 31, | ||||||||||||||
|---|---|---|---|---|---|---|---|---|---|---|---|---|---|---|---|
| |
2009 | 2008 | 2007 | ||||||||||||
Cash Flows from Operating Activities: |
|||||||||||||||
Net income (loss) attributable to Sauer-Danfoss Inc. |
$ | (345,766 | ) | $ | (29,141 | ) | $ | 47,198 | |||||||
Adjustments to reconcile net income(loss) to net cash provided by (used in) operating activities: |
|||||||||||||||
Depreciation and amortization |
117,130 | 112,962 | 102,303 | ||||||||||||
Noncontrolling interest |
13,512 | 17,811 | 21,562 | ||||||||||||
Restricted stock and performance unit compensation |
253 | (2,070 | ) | 4,390 | |||||||||||
Impairment charges |
50,841 | 58,208 | — | ||||||||||||
Loss on sale of businesses and asset disposals |
16,351 | 9,604 | 9,412 | ||||||||||||
Loss on early retirement of debt |
15,838 | — | — | ||||||||||||
Change in net pension and post-retirement benefits |
(2,794 | ) | (5,585 | ) | (2,869 | ) | |||||||||
Change in deferred income taxes |
51,894 | (25,937 | ) | (1,983 | ) | ||||||||||
Minimum tax withholding payments on performance units |
(226 | ) | (1,590 | ) | (8,971 | ) | |||||||||
Change in operating assets and liabilities |
|||||||||||||||
Accounts receivable, net |
91,434 | 71,679 | (38,491 | ) | |||||||||||
Inventories |
153,386 | (16,799 | ) | (36,578 | ) | ||||||||||
Prepaid and other current assets |
(4,990 | ) | (7,918 | ) | (11,136 | ) | |||||||||
Accounts payable |
(54,197 | ) | (14,495 | ) | 11,036 | ||||||||||
Accrued liabilities |
(20,680 | ) | 23,596 | (1,453 | ) | ||||||||||
Other |
4,858 | (6,807 | ) | 3,720 | |||||||||||
Net cash provided by operating activities |
86,844 | 183,518 | 98,140 | ||||||||||||
Cash Flows from Investing Activities: |
|||||||||||||||
Purchases of property, plant and equipment |
(42,972 | ) | (198,634 | ) | (135,633 | ) | |||||||||
Proceeds from sale of property, plant and equipment |
4,507 | 11,141 | 6,496 | ||||||||||||
Proceeds from sale of businesses, net of payment for acquisition, net of cash acquired |
744 | — | 6,932 | ||||||||||||
Advances to noncontrolling interest partners |
(4,500 | ) | — | — | |||||||||||
Net cash used in investing activities |
(42,221 | ) | (187,493 | ) | (122,205 | ) | |||||||||
Cash Flows from Financing Activities: |
|||||||||||||||
Net borrowings (repayments) on notes payable and bank overdrafts |
(15,685 | ) | 3,493 | 6,114 | |||||||||||
Net borrowings (repayments) on revolving credit facility |
(58,705 | ) | 17,019 | 77,264 | |||||||||||
Repayments of long-term debt |
(540,500 | ) | (22,948 | ) | (18,817 | ) | |||||||||
Borrowings of long-term debt |
637,232 | 54,235 | 6,875 | ||||||||||||
Payments for debt financing costs |
(10,575 | ) | — | — | |||||||||||
Payments of prepayment penalties |
(8,064 | ) | — | — | |||||||||||
Settlement of interest rate swaps |
(2,000 | ) | — | — | |||||||||||
Cash dividends |
(8,689 | ) | (34,728 | ) | (33,636 | ) | |||||||||
Distribution to noncontrolling interest partners |
(17,694 | ) | (13,881 | ) | (15,889 | ) | |||||||||
Other |
— | 1,534 | 145 | ||||||||||||
Net cash provided by (used in) financing activities |
(24,680 | ) | 4,724 | 22,056 | |||||||||||
Effect of Exchange Rate Changes on Cash |
(4,298 | ) | (4,393 | ) | (314 | ) | |||||||||
Cash and Cash Equivalents: |
|||||||||||||||
Net increase (decrease) during the year |
15,645 | (3,644 | ) | (2,323 | ) | ||||||||||
Beginning balance |
23,145 | 26,789 | 29,112 | ||||||||||||
Ending balance |
$ | 38,790 | $ | 23,145 | $ | 26,789 | |||||||||
Supplemental Cash Flow Disclosures: |
|||||||||||||||
Interest paid |
$ | 43,345 | $ | 22,876 | $ | 20,248 | |||||||||
Income taxes paid |
$ | 2,741 | $ | 34,351 | $ | 26,933 | |||||||||
See accompanying notes to consolidated financial statements.
F-4
Sauer-Danfoss Inc. and Subsidiaries
Notes to Consolidated Financial Statements
December 31, 2009, 2008, and 2007
(Dollars in
thousands, except per share data)
(1) Summary of Significant Accounting Policies:
Basis of Presentation and Principles of Consolidation—
Sauer-Danfoss Inc., a U.S. Delaware corporation, and subsidiaries (the Company) is a worldwide leader in the design, manufacture, and sale of engineered hydraulic and electronic systems and components that generate, transmit and control power in mobile equipment. The Company's products are used by original equipment manufacturers of mobile equipment, including construction, road building, agricultural, turf care, material handling, and specialty vehicle equipment. The Company's products are sold throughout the world either directly or through distributors.
The consolidated financial statements represent the consolidation of all companies in which the Company has a controlling interest and are stated in accordance with accounting principles generally accepted in the U.S. All significant intercompany balances, transactions, and profits have been eliminated in the consolidated financial statements.
Use of Estimates—
In preparing the consolidated financial statements in conformity with U.S. generally accepted accounting principles, management must make decisions that impact the reported amounts of assets, liabilities, revenues, expenses, and the related disclosures, including disclosures of contingent assets and liabilities. Such decisions include the selection of the appropriate accounting principles to be applied and the assumptions on which to base accounting estimates. Estimates are used in determining, among other items, incentive accruals, inventory valuation, warranty reserves, allowance for doubtful accounts, pension and postretirement accruals, useful lives for intangible assets, and future cash flows associated with impairment testing for goodwill and other long-lived assets. These estimates and assumptions are based on management's best estimates and judgments. Management evaluates its estimates and assumptions on an ongoing basis using historical experience and other factors that management believes to be reasonable under the circumstances, including the current economic environment, adjusting such estimates and assumptions when facts and circumstances dictate. A number of these factors include, among others, the recessionary economic conditions, tight credit markets, foreign currency, higher commodity costs, and a decline in consumer spending and confidence, all of which have combined to increase the uncertainty inherent in such estimates and assumptions. As future events and their effects cannot be determined with precision, actual amounts could differ significantly from those estimated at the time the consolidated financial statements are prepared. Changes in those estimates resulting from continuing changes in the economic environment will be reflected in the financial statements in future periods.
Revenue Recognition—
Net sales are recorded when all of the following criteria are met: persuasive evidence of an arrangement exists, delivery has occurred, the price is fixed or determinable, and collectability is reasonably assured. Estimates for future warranty expense are recorded when the related revenue is recognized. Timing of revenue recognition is consistent with when the risks and rewards of ownership and title to the product have transferred to the customer.
F-5
Sauer-Danfoss Inc. and Subsidiaries
Notes to Consolidated Financial Statements (Continued)
December 31, 2009, 2008, and 2007
(Dollars in thousands, except per share data)
(1) Summary of Significant Accounting Policies: (Continued)
Cash and Cash Equivalents—
Cash equivalents are considered by the Company to be all highly liquid instruments purchased with original maturities of three months or less. At December 31, 2009 cash and cash equivalents balances in China totaled approximately $21,900. The Company is paying dividends from its Chinese entities to the maximum extent possible under current regulations; however, due to the nature of the governmental and other regulatory controls it is difficult to transfer cash out of this country for reasons other than payment for goods shipped into the country.
Trade Receivables—
The Company records trade receivables due from its customers at the time sales are recorded in accordance with its revenue recognition policy. The future collectability of these amounts can be impacted by the Company's collection efforts, the financial stability of its customers, and the general economic climate in which it operates. The Company applies a consistent practice of establishing an allowance for accounts that it believes may become uncollectible through reviewing the historical write-offs of accounts, aging of its receivables, and by monitoring the economic environment and financial strength of its customers. If the Company becomes aware of a customer's inability to meet its financial obligations (e.g., where it has filed for bankruptcy), the Company establishes a specific allowance for the potential bad debt to reduce the net recognized receivable to the amount it reasonably believes will be collected. The analysis of the valuation of trade receivables is performed quarterly.
Inventories—
Inventories are valued at the lower of cost or market, using various cost methods, and include the cost of material, labor, and factory overhead. The last-in, first-out (LIFO) method was adopted in 1987 and is used to value inventories at the U.S. locations which existed at that time. Inventories at all of the non-U.S. locations and the U.S. locations obtained through acquisition after 1987, which produce products different than those produced at U.S. locations existing at 1987, are valued under the first-in, first-out (FIFO) inventory valuation method. The percentage of year-end inventory valued under the LIFO and FIFO cost methods was 9% and 91%, respectively, for 2009, and 11% and 89%, respectively, for 2008.
Property, Plant and Equipment and Depreciation—
Property, plant and equipment are stated at historical cost, net of accumulated depreciation. Depreciation is generally computed using the straight-line method for building equipment and buildings over 10 to 37 years and for machinery and equipment over 3 to 8 years (3 to 12 years for additions in 1999 and prior). Additions and improvements that substantially extend the useful life of a particular asset are capitalized. Repair and maintenance costs ($21,732, $45,818, and $45,580 in 2009, 2008, and 2007, respectively) are charged to expense. When property, plant and equipment are retired or otherwise disposed of, the cost and related accumulated depreciation are removed from the accounts and any gain or loss is included in the consolidated statements of operations.
F-6
Sauer-Danfoss Inc. and Subsidiaries
Notes to Consolidated Financial Statements (Continued)
December 31, 2009, 2008, and 2007
(Dollars in thousands, except per share data)
(1) Summary of Significant Accounting Policies: (Continued)
Goodwill and Other Intangible Assets—
Goodwill represents the excess of the purchase price over the estimated fair values of net assets acquired in the purchase of businesses. Goodwill is not amortized, but tested for impairment at least annually or when events or changes in circumstances indicate that the carrying value of such assets may not be recoverable. The Company recorded a goodwill impairment charge of $50,841 and $22,900 in 2009 and 2008, respectively. See Note 6 for further discussion.
Intangible assets consist primarily of trade names, technology, and customer relationships and are recorded at fair value at the time of acquisition. Intangible assets are amortized on a straight-line basis over their estimated useful lives, which range from three to thirty five years.
Impairment of Long-Lived Assets and Assets to be Disposed Of—
The Company periodically assesses whether events or circumstances have occurred that may indicate the carrying value of its long-lived tangible and intangible assets may not be recoverable. The carrying value of long-lived tangible and intangible assets to be held and used is evaluated for recoverability based on the expected future undiscounted operating cash flows. When the evaluation indicates the carrying value of an asset or group of assets is impaired, the Company determines the fair value of assets, using discounted cash flows or determining the liquidation value of the long-lived assets, and recognizes an impairment loss to the extent that the carrying value of the assets exceeds the fair value of the assets. In 2008 the Company recognized an impairment charge for long-lived assets of $35,300 in the Work Function segment as discussed in Note 5.
Product Warranty—
The Company warrants its various products over differing periods depending upon the type of product and application. Consequently, the Company records warranty liabilities for the estimated costs that may be incurred under its basic warranty based on past trends of actual warranty claims compared to the actual sales levels to which those claims apply. These liabilities are accrued at the time the sales of the products are recorded. Factors that affect the Company's warranty liability include the number of units in the field currently under warranty, historical and anticipated rates of warranty claims on those units and the cost per claim to satisfy the Company's warranty obligation. The anticipated rate of warranty claims is the primary factor impacting the Company's estimated warranty obligation.
In addition to its normal warranty liability, the Company, from time to time in the normal course of business, incurs costs to repair or replace defective products with a specific customer or group of customers. The Company refers to these as field recalls and in these instances, the Company records a specific provision for the expected costs it will incur to repair or replace these products utilizing information from customers and internal information regarding the specific cost of materials and labor. Due to the sporadic and infrequent nature of field recalls, and the potential for a range of costs associated with field recalls, the Company cannot accurately estimate these costs at the time the products are sold. Therefore, these costs are recorded at the time information becomes known to the Company. As the field recalls are carried out, the Company relieves the specific liability related to that field recall. These specific field recall liabilities are reviewed on a quarterly basis. In December 2009 the Company became aware of a
F-7
Sauer-Danfoss Inc. and Subsidiaries
Notes to Consolidated Financial Statements (Continued)
December 31, 2009, 2008, and 2007
(Dollars in thousands, except per share data)
(1) Summary of Significant Accounting Policies: (Continued)
new field recall for which the number of units and cost per unit to repair are still uncertain as no loss estimate within this range is more likely than another. The Company had determined that the range of probable loss for this field recall is from $8,000 to $26,000. The Company has accrued $8,000 for this field recall as of December 31, 2009.
The following table represents the change in the Company's accrued warranty and field recall liability:
| |
December 31, | |||||||||
|---|---|---|---|---|---|---|---|---|---|---|
| |
2009 | 2008 | 2007 | |||||||
Balance, beginning of period |
$ | 25,491 | $ | 19,401 | $ | 17,022 | ||||
Payments |
(18,474 | ) | (22,856 | ) | (17,664 | ) | ||||
Provisions for warranties and field recalls |
21,456 | 28,996 | 19,167 | |||||||
Currency impact |
347 | (50 | ) | 876 | ||||||
Balance, end of period |
$ | 28,820 | $ | 25,491 | $ | 19,401 | ||||
Income Taxes—
The provision for income taxes has been determined using the asset and liability approach of accounting for income taxes. Under this approach, deferred taxes represent the future tax consequences expected to occur when the reported amounts of assets and liabilities are recovered or paid. The provision for income taxes represents income taxes paid or payable for the current year plus the change in deferred taxes during the year. Deferred taxes result from differences between the financial and tax bases of the Company's assets and liabilities, net operating loss carryforwards, and tax credit carryforwards and are adjusted for changes in tax rates and tax laws when changes are enacted. Valuation allowances are recorded to reduce deferred tax assets when the Company is unable to conclude that realization of the deferred tax assets is more likely than not.
Income (Loss) Per Share—
Basic net income (loss) per common share is based on the weighted average number of common shares outstanding in each year. Diluted net income per common share assumes that outstanding common shares were increased by shares issuable upon (i) exercise of restricted stock shares, and (ii) granting of shares under the long-term incentive plan, after it becomes certain that the performance requirements needed to be met in accordance with the incentive plan will be achieved. Shares under both the restricted stock plan and the long term incentive plan have an exercise price of zero. Diluted net loss per share for
F-8
Sauer-Danfoss Inc. and Subsidiaries
Notes to Consolidated Financial Statements (Continued)
December 31, 2009, 2008, and 2007
(Dollars in thousands, except per share data)
(1) Summary of Significant Accounting Policies: (Continued)
2009 and 2008 excludes the dilutive effect of restricted stock and performance units as these shares are anti-dilutive.
| |
Net Income (Loss) | Shares | Earnings (Loss) Per Share |
||||||||
|---|---|---|---|---|---|---|---|---|---|---|---|
December 31, 2009 |
|||||||||||
Basic net loss |
$ | (345,766 | ) | 48,337,923 | $ | (7.15 | ) | ||||
Effect of dilutive securities: |
|||||||||||
Restricted stock |
— | — | — | ||||||||
Performance units |
— | — | — | ||||||||
Diluted net loss |
$ | (345,766 | ) | 48,337,923 | $ | (7.15 | ) | ||||
December 31, 2008 |
|||||||||||
Basic net loss |
$ | (29,141 | ) | 48,226,184 | $ | (0.60 | ) | ||||
Effect of dilutive securities: |
|||||||||||
Restricted stock |
— | — | — | ||||||||
Performance units |
— | — | — | ||||||||
Diluted net loss |
$ | (29,141 | ) | 48,226,184 | $ | (0.60 | ) | ||||
December 31, 2007 |
|||||||||||
Basic net income |
$ | 47,198 | 48,094,375 | $ | 0.98 | ||||||
Effect of dilutive securities: |
|||||||||||
Restricted stock |
— | 24,696 | — | ||||||||
Performance units |
— | 207,566 | — | ||||||||
Diluted net income |
$ | 47,198 | 48,326,637 | $ | 0.98 | ||||||
Fair Value of Financial Instruments—
The carrying values of cash and cash equivalents, accounts and other receivables, notes payable and bank overdrafts, and accounts payable approximate fair value because of the short-term nature of these instruments.
The fair value of long-term debt is calculated by discounting scheduled cash flows through maturity using estimated market discount rates. The discount rate is estimated using the rates currently offered for long-term debt of similar remaining maturities and credit characteristics. At December 31, 2009 the Company estimated the fair value of its long-term debt, including amounts due within one year, to be the same as its carrying value of $479,096. At December 31, 2008 the Company estimated the fair value of its long-term debt, including amounts due within one year, at $425,273 compared to its carrying value of $425,927. These estimates are subjective in nature and involve uncertainties and, therefore, cannot be determined with precision. Changes in assumptions could significantly affect these estimates.
The fair value of derivative instruments is discussed in Note 7.
F-9
Sauer-Danfoss Inc. and Subsidiaries
Notes to Consolidated Financial Statements (Continued)
December 31, 2009, 2008, and 2007
(Dollars in thousands, except per share data)
(1) Summary of Significant Accounting Policies: (Continued)
Translation of Non-U.S. Currencies—
Assets and liabilities of consolidated non-U.S. subsidiaries are translated into U.S. dollars at exchange rates in effect at the end of each period, while revenues and expenses are translated at average exchange rates prevailing during the period. The resulting translation adjustments are included in stockholders' equity. Gains or losses on transactions denominated in non-functional currencies and the related tax effects are reflected in the consolidated statements of operations.
Derivatives and Hedging—
It is the Company's policy that derivative transactions are executed only to manage exposures arising in the normal course of business and not for the purpose of creating speculative positions or trading. All derivatives are recorded at fair value on the balance sheet as current or long-term other assets or other liabilities depending on whether the maturity date of the derivative contract is within one year from the balance sheet date.
Until March 2009, the Company used interest rate swaps to establish fixed interest rates on outstanding borrowings. There was no ineffectiveness of the interest rate swaps and therefore, the changes in fair value of the derivatives was recorded in accumulated other comprehensive income (loss). The Company utilizes forward contracts to minimize the impact of currency fluctuations on cash flows related to forecasted sales denominated in currencies other than the functional currency of the selling location. The forward contracts qualify for hedge accounting and therefore are subject to effectiveness testing at the inception of the contract and throughout the life of the contract.
When, and if, a derivative is determined not to be highly effective as a hedge, or the underlying hedged transaction is no longer likely to occur, or the derivative is terminated, the hedge accounting is discontinued and any past or future changes in the derivative's fair value that will not be effective as an offset to the income effects of the item being hedged are recognized currently in the statement of operations. Any changes in fair values of derivatives not qualifying as hedges would be reported immediately in other income (expense) on the consolidated statement of operations; however, the Company did not have any derivatives that did not qualify as hedges in 2009 or 2008, other than disclosed in Note 7.
Employee Stock-Based Compensation—
The fair value method is used to account for employee-stock compensation.
New Accounting Principles—
In June 2009 the Financial Accounting Standards Board (FASB) issued Accounting Standards Codification (ASC) 105-10, "The FASB Accounting Standards Codification and the Hierarchy of Generally Accepted Accounting Principles—a replacement of FASB Statement No. 162." The FASB Accounting Standards Codification is intended to be the source of authoritative U.S. generally accepted accounting principles (GAAP) and reporting standards recognized by the FASB. Its primary purpose is to improve clarity and use of existing standards by grouping authoritative literature under common topics.
F-10
Sauer-Danfoss Inc. and Subsidiaries
Notes to Consolidated Financial Statements (Continued)
December 31, 2009, 2008, and 2007
(Dollars in thousands, except per share data)
(1) Summary of Significant Accounting Policies: (Continued)
The Codification does not change or alter existing GAAP and there was no impact on the Company's consolidated financial position or results of operations when it was adopted in the third quarter of 2009.
FASB ASC 805 establishes requirements for recognition and measurement of identifiable assets acquired, liabilities assumed, noncontrolling interest of the acquiree, goodwill acquired, and gain from bargain purchase. The guidance within FASB ASC 805 was issued in December 2007 and applies prospectively to business combinations for which the acquisition date is on or after the beginning of the annual reporting period beginning on or after December 15, 2008. The Company adopted this guidance as of January 1, 2009 with no impact on the consolidated financial statements.
The FASB issued new guidance contained within ASC 810-10, "Noncontrolling Interests in Consolidated Financial Statements—an amendment of ARB No. 51" in December 2007. The new guidance was issued to improve the relevance, comparability, and transparency of financial information provided to investors by requiring all entities to report noncontrolling (minority) interests in subsidiaries as equity in the consolidated financial statements. The Company adopted this guidance in the first quarter of 2009. Upon adoption, certain prior period amounts have been reclassified to conform to the current period financial statement presentation. These reclassifications have no impact on the previously reported financial position or results of operations.
In March 2008 the FASB issued guidance contained within ASC 815-10, "Disclosures about Derivative Instruments and Hedging Activities—an amendment of FASB Statement No. 133." The guidance amends and expands disclosure requirements for derivative instruments in order to provide users of financial statements with an enhanced understanding of (i) how and why an entity uses derivative instruments, (ii) how derivative instruments and related hedged items are accounted for and (iii) how derivative instruments and related hedged items affect an entity's financial position, financial performance, and cash flows. The Company adopted this guidance in the first quarter of 2009 and has included the expanded disclosures in Note 7.
The FASB issued new guidance contained within ASC 260-10, "Determining Whether Instruments Granted in Share-Based Payment Transactions Are Participating Securities" in June 2008. The guidance provides guidance on the calculation of earnings per share and indicates that all outstanding unvested share-based payment awards that contain rights to nonforfeitable dividends or dividend equivalents are considered participating securities and therefore the two-class method should be applied in calculating basic and diluted earnings per share. The guidance is effective for fiscal years, and interim periods within those fiscal years, beginning on or after December 15, 2008. The Company adopted this guidance in first quarter 2009 with no impact on the consolidated financial statements.
In May 2009 the FASB issued guidance contained within ASC 855-10, "Subsequent Events." This Statement incorporates guidance into accounting literature that was previously addressed only in auditing standards. The statement refers to subsequent events that provide additional evidence about conditions that existed at the balance-sheet date as "recognized subsequent events." Subsequent events which provide evidence about conditions that arose after the balance-sheet date but prior to the issuance of the financial statements are referred to as "non-recognized subsequent events." It also requires companies to disclose the date through which subsequent events have been evaluated and whether this date is the date the financial statements were issued or the date the financial statements were available to be issued. The
F-11
Sauer-Danfoss Inc. and Subsidiaries
Notes to Consolidated Financial Statements (Continued)
December 31, 2009, 2008, and 2007
(Dollars in thousands, except per share data)
(1) Summary of Significant Accounting Policies: (Continued)
Company adopted this guidance in the second quarter of 2009 with appropriate disclosures added in Note 18.
(2) Sale of Businesses and Termination of Joint Venture:
In 2009 the Company sold the assets of its steering column business which was located in Kolding, Denmark, recognizing a loss on sale of approximately $2,700 in the Work Function segment. The loss was related to the write-down of inventory and machinery to the proceeds of the sale, which approximated fair value. Also included in the loss amount was severance costs for employees at the Kolding location because the buyer moved production operations to a different location. The Company acquired the steering column business in May 2007 in a stock transaction. The purchase price was allocated to inventory and property, plant, and equipment. Goodwill of approximately $2,800 represented the excess of cost over the fair value of net tangible assets. The goodwill was impaired in 2008 in connection with the impairment of the steering reporting unit. The Company had consolidated the financial results since the date of acquisition through the date of disposition.
In December 2008 the Company signed a sales agreement to sell its alternating current (AC) motor business related to the material handling market. The closing of the transaction occurred in 2009 when the transfer of the machinery and inventory covered by the purchase agreement was completed. A loss of approximately $6,300 and $8,400 in 2009 and 2008, respectively, is reported in the Controls segment. In 2008 the machinery and inventory were written down to the proceeds expected to be received upon transfer of the assets. The expense in 2009 relates to the write-off of a customer relationship intangible asset, employee retention costs, and additional write-downs to machinery and inventory balances due to revisions of the sales agreement during 2009. The Company will receive a commission payment from the purchaser through 2012; the amount will be based on the level of electric motors sales made by the purchaser.
In April 2007 the Company sold its direct current (DC) motor business. The sale resulted in a loss of approximately $6,600, including transaction costs. The loss is reported in the Controls segment.
The Company sold the assets and product lines located in the Swindon, England location in June 2007. The Company recognized a net loss on the sale of approximately $2,400, including transaction costs, reported in the Work Function segment. The Company had anticipated ending production at this location by the end of 2006 and had established an accrual with the expectation that termination payments would be made to employees at the time production ended. A severance accrual of approximately $1,900, established during 2006, was reversed at the time of sale. The reversal of the accrual was reflected as an offset to the loss on sale of business calculation.
In July 2009 the Company and Topcon Positioning Systems, Inc. (Topcon), the noncontrolling interest partner, agreed to terminate the joint venture they have operated since April 2001 through TSD Integrated Controls, LLC (TSD). The termination was effective September 1, 2009 but is subject to a three-year wind down period as contemplated in the 2001 Joint Venture Agreement. During the wind-down period, the Company and Topcon will each receive distributions of certain assets of TSD and royalties on sales of TSD products. The effects of this wind-down will not have a material impact on the Company's operations.
F-12
Sauer-Danfoss Inc. and Subsidiaries
Notes to Consolidated Financial Statements (Continued)
December 31, 2009, 2008, and 2007
(Dollars in thousands, except per share data)
(3) Restructuring Charges:
In September 2009 the Company announced its plans to close the Lawrence, Kansas plant, and transfer the majority of the production lines to the Ames, Iowa and Freeport, Illinois locations to reduce costs and increase efficiencies. Costs related to the Lawrence plant closing are included in the Work Function segment. This project is expected to be completed in the first half of 2010.
In December 2008 the Company decided to close the Hillsboro, Oregon plant and transfer the production lines to the Easley, South Carolina location. In 2007, in preparation for disposing of the direct current (DC) electric motor business the Company incurred restructuring costs to transfer all DC production lines to one location and all alternating current (AC) production lines to another location. The costs related to the closure of Hillsboro, the transfer of electric motors production lines, and costs related to the relocation of certain production lines between facilities are included in the Controls segment. The relocation of production activities from Hillsboro was completed in 2009. The other projects were completed in 2008. The Company sold its AC electric motor business related to the material handling market in June 2009 and its DC electric motor business in April 2007. The losses related to the sale of businesses of approximately $6,300, $8,400 and $6,600, in 2009, 2008 and 2007, respectively, are not included in the restructuring numbers below.
The Company announced its plans to close its LaSalle, Illinois plant, outsourcing certain products to reduce costs and increase efficiencies in March 2006. Costs related to the LaSalle plant closing, in addition to costs related to the relocation of certain production lines between production facilities in the U.S are included in the Propel segment. These projects were completed in 2007.
In 2006 the Company announced plans to discontinue production of certain product lines manufactured in Swindon, England and incurred restructuring costs in anticipation of this shutdown. In June 2007, the assets related to this production facility were sold and accruals which were no longer needed were reversed. This activity is included in the Work Function segment. The approximately $2,400 of costs incurred in 2007 related to the sale of the production assets are not included in the restructuring numbers below.
The following table summarizes the restructuring charges incurred, as well as the cumulative charges incurred to date on these projects.
| |
Propel | Work Function |
Controls | Total | |||||||||
|---|---|---|---|---|---|---|---|---|---|---|---|---|---|
Charges incurred in 2009 |
$ | — | $ | 3,699 | $ | 8,704 | $ | 12,403 | |||||
Charges incurred in 2008 |
— | — | 1,007 | 1,007 | |||||||||
Charges incurred in 2007 |
5,477 | — | 4,874 | 10,351 | |||||||||
Cumulative charges incurred |
13,767 |
3,699 |
14,585 |
32,051 |
|||||||||
Cumulative charges expected to be incurred |
13,767 | 8,100 | 14,585 | 36,452 | |||||||||
F-13
Sauer-Danfoss Inc. and Subsidiaries
Notes to Consolidated Financial Statements (Continued)
December 31, 2009, 2008, and 2007
(Dollars in thousands, except per share data)
(3) Restructuring Charges: (Continued)
The restructuring costs incurred are reported in the statement of operations as detailed in the following table:
| |
Cost of Sales | Selling, General and Administrative Expenses |
Loss on Disposal of Fixed Assets |
Total | |||||||||
|---|---|---|---|---|---|---|---|---|---|---|---|---|---|
Charges incurred in 2009 |
$ | 5,813 | $ | 4,500 | $ | 2,090 | $ | 12,403 | |||||
Charges incurred in 2008 |
40 | 585 | 382 | 1,007 | |||||||||
Charges incurred in 2007 |
9,662 | 669 | 20 | 10,351 | |||||||||
Cumulative charges incurred |
23,805 |
5,754 |
2,492 |
32,051 |
|||||||||
Cumulative charges expected to be incurred |
25,706 | 8,254 | 2,492 | 36,452 | |||||||||
The following table summarizes the restructuring charges incurred and the activity in accrued liabilities during 2009, 2008 and 2007.
| |
Employee Termination Costs |
Building and Lease Cancellation Costs |
Accelerated Depreciation and Loss on Asset Disposals |
Equipment Moving Costs |
Other | Total | |||||||||||||
|---|---|---|---|---|---|---|---|---|---|---|---|---|---|---|---|---|---|---|---|
Balance as of January 1, 2007 |
$ | 3,115 | $ | — | $ | — | $ | — | $ | — | $ | 3,115 | |||||||
Charges to expense |
600 | — | 20 | 3,993 | 5,738 | 10,351 | |||||||||||||
Reversal of accrual due to sale of business |
(1,915 | ) | — | — | — | — | (1,915 | ) | |||||||||||
Payments made |
(1,425 | ) | — | (20 | ) | (3,993 | ) | (5,738 | ) | (11,176 | ) | ||||||||
Balance as of December 31, 2007 |
375 | — | — | — | — | 375 | |||||||||||||
Charges to expense |
625 | — | 382 | — | — | 1,007 | |||||||||||||
Payments made |
(375 | ) | — | (382 | ) | — | — | (757 | ) | ||||||||||
Balance as of December 31, 2008 |
625 | — | — | — | — | 625 | |||||||||||||
Charges to expense |
2,275 | 2,162 | 4,569 | 829 | 2,568 | 12,403 | |||||||||||||
Payments made |
(2,049 | ) | (1,607 | ) | (4,569 | ) | (829 | ) | (2,568 | ) | (11,622 | ) | |||||||
Balance as of December 31, 2009(1) |
$ | 851 | $ | 555 | $ | — | $ | — | $ | — | $ | 1,406 | |||||||
- (1)
- The remaining $851 of accrued employee termination costs will be paid in 2010. The $555 of accrued lease costs relate to future lease payments that will be paid through December 2010.
The employee termination costs in the table above relate to the restructuring projects described in this footnote. The table excludes approximately $32,600 and $15,500 of employee termination costs in 2009 and 2008, respectively, related to headcount reductions that were the result of reduced sales volumes related to
F-14
Sauer-Danfoss Inc. and Subsidiaries
Notes to Consolidated Financial Statements (Continued)
December 31, 2009, 2008, and 2007
(Dollars in thousands, except per share data)
(3) Restructuring Charges: (Continued)
the worldwide economic downturn. The liability in the balance sheet related to these employee termination costs was approximately $12,000 and $10,200 at December 31, 2009 and 2008, respectively.
(4) Inventories:
The composition of inventories is as follows:
| |
December 31, | |||||||
|---|---|---|---|---|---|---|---|---|
| |
2009 | 2008 | ||||||
Raw materials |
$ | 89,063 | $ | 153,570 | ||||
Work in progress |
44,176 | 64,329 | ||||||
Finished goods and parts |
64,263 | 131,758 | ||||||
LIFO allowance |
(19,928 | ) | (24,161 | ) | ||||
Total |
$ | 177,574 | $ | 325,496 | ||||
The Company recorded LIFO decrements of approximately $25,900 and $8,800 in 2009 and 2008, respectively.
F-15
Sauer-Danfoss Inc. and Subsidiaries
Notes to Consolidated Financial Statements (Continued)
December 31, 2009, 2008, and 2007
(Dollars in thousands, except per share data)
(5) Property, Plant and Equipment and Property Held for Disposal:
The cost and related accumulated depreciation of property, plant and equipment are summarized as follows:
| |
December 31, | |||||||
|---|---|---|---|---|---|---|---|---|
| |
2009 | 2008 | ||||||
Cost— |
||||||||
Land and improvements |
$ | 16,785 | $ | 16,624 | ||||
Buildings and improvements |
156,008 | 152,929 | ||||||
Machinery and equipment |
1,022,728 | 1,021,851 | ||||||
Construction in progress |
46,418 | 103,545 | ||||||
Plant and equipment under capital leases |
4,700 | 17,998 | ||||||
Total costs |
1,246,639 | 1,312,947 | ||||||
Less—accumulated depreciation |
(733,152 | ) | (714,512 | ) | ||||
Net property, plant and equipment |
$ | 513,487 | $ | 598,435 | ||||
Depreciation expense for 2009, 2008, and 2007 was $115,252, $110,934, and $100,074, respectively.
In 2008 the Company determined that an impairment test of property, plant, and equipment was necessary due to the change in worldwide economic conditions and resulting decrease in Company sales. The Company determined that an impairment charge of $35,300 was required to write down the carrying value of the motors asset group within the Work Function segment. The assets were written down to fair value as measured by the liquidation value of the assets.
The Company exercised the buy-out option in the capital lease for the building in Odense, Denmark in 2009. This location was previously used for the design and manufacture of electric drives until the business was exited in the second quarter of 2009 as discussed in Note 3. The Company intends to sell the building, which has a carrying value of approximately $9,600. The building is classified in other current assets in the Controls segment.
In 2007 the Company decided that the land and building at the LaSalle, Illinois location would be sold. This property was classified in other current assets with a carrying value of approximately $1,800 in the Propel segment on the consolidated balance sheet at December 31, 2007. In 2008 the property was sold for a gain of approximately $1,400. The gain was reported in the Propel segment.
In 2003 the Company closed a manufacturing facility in West Branch, Iowa and determined the land and building would be sold. In 2007 the location was sold for approximately $3,300. The loss on sale of land and building of approximately $300 is reported in the Work Function segment.
(6) Goodwill and Intangible Assets:
Goodwill is required to be tested for impairment annually and if an event or conditions change that would more likely than not reduce the fair value of a reporting unit below its carrying value. As a result of deteriorating economic conditions the Company completed a goodwill impairment test as of March 31, 2009, in addition to its annual impairment test as of December 31, 2009.
F-16
Sauer-Danfoss Inc. and Subsidiaries
Notes to Consolidated Financial Statements (Continued)
December 31, 2009, 2008, and 2007
(Dollars in thousands, except per share data)
(6) Goodwill and Intangible Assets: (Continued)
The Company has identified seven reporting units that are either operating segments or one level below operating segments. As an overall reasonableness test in its step one analysis the Company reconciled the sum of the estimated fair values of its reporting units to the Company's market value (based on its stock price at the measurement date), plus a reasonable control premium, which is estimated as that amount which would be received to sell a majoity share of the Company in an orderly transaction between market participants versus the market value of the minority shares as evidenced by the stock price.
When testing for goodwill impairment, the Company performs a first step of the goodwill impairment test to identify a potential impairment. In doing so, the Company compares the fair value of a reporting unit with its carrying amount. If the carrying amount of a reporting unit exceeds its fair value, goodwill may be impaired and a second step of the goodwill impairment test is performed to measure the amount of any impairment loss. Estimates about fair value used in the first step of the goodwill impairment tests have been calculated using an income approach based on the present value of future cash flows of each reporting unit. The income approach has been supported by other valuation approaches, such as similar transaction and guideline analyses. Under the income approach, the Company determined fair value based on estimated future cash flows of each reporting unit, discounted by an estimated weighted-average cost of capital, which reflects the overall level of inherent risk of a reporting unit and the rate of return an outside investor would expect to earn. Determining the fair value of a reporting unit is judgmental in nature and requires the use of significant estimates and assumptions, including revenue growth rates and operating margins, discount rates and future market conditions among others. Changes in economic and operating conditions impacting these assumptions could result in goodwill impairments in future periods.
In the second step of the goodwill impairment test, the Company compares the implied fair value of reporting unit goodwill with the carrying amount of that goodwill. If the carrying amount of reporting unit goodwill exceeds the implied fair value of that goodwill, an impairment loss is recognized in an amount equal to that excess. The implied fair value of goodwill is determined in the same manner that the amount of goodwill recognized in a business combination is determined. The Company allocates the fair value of a reporting unit to all of the assets and liabilities of that unit, including intangible assets, as if the reporting unit had been acquired in a business combination. Any excess of the value of a reporting unit over the amounts assigned to its assets and liabilities is the implied fair value of goodwill.
The Company considered the decrease in its market value in the first quarter of 2009 to be a triggering event that required goodwill to be tested for impairment at March 31, 2009. As a result of that testing the Company determined that the implied fair value of goodwill for the valves reporting unit was less than its carrying value by $50,841, which was recorded as a goodwill impairment charge. At December 31, 2009 the Company has $35,903 of goodwill related to its propel and mobile electronics reporting units which was tested for impairment, as required annually. The fair value of the propel and mobile electronics reporting units substantially exceeded the goodwill amounts, resulting in no impairment.
In 2008 the Company determined that the implied fair value of goodwill for the motors, steering, and electric drives reporting units was less than its carrying value by $22,908, which was recorded as a goodwill impairment charge in 2008.
F-17
Sauer-Danfoss Inc. and Subsidiaries
Notes to Consolidated Financial Statements (Continued)
December 31, 2009, 2008, and 2007
(Dollars in thousands, except per share data)
(6) Goodwill and Intangible Assets: (Continued)
The changes in the carrying amounts of goodwill for the years ended December 31, 2008 and 2009 are as follows:
| |
Propel Segment |
Work Function Segment |
Controls Segment |
Total | |||||||||
|---|---|---|---|---|---|---|---|---|---|---|---|---|---|
Balance at January 1, 2008 |
$ | 27,910 | $ | 18,018 | $ | 68,572 | $ | 114,500 | |||||
Purchase price adjustment on 2007 acquisition |
— | 243 | — | 243 | |||||||||
Reversal of valuation allowance on deferred tax asset |
(426 | ) | (219 | ) | (263 | ) | (908 | ) | |||||
Impairment |
— | (17,361 | ) | (5,547 | ) | (22,908 | ) | ||||||
Translation adjustment |
(833 | ) | (681 | ) | (3,267 | ) | (4,781 | ) | |||||
Balance at December 31, 2008 |
26,651 | — | 59,495 | 86,146 | |||||||||
Impairment |
— | — | (50,841 | ) | (50,841 | ) | |||||||
Translation adjustment |
440 | — | 158 | 598 | |||||||||
Balance at December 31, 2009 |
$ | 27,091 | $ | — | $ | 8,812 | $ | 35,903 | |||||
The following table summarizes the components of the other intangible asset balances at December 31, 2009 and 2008:
| |
Trade Name | Technology | Customer Relationships |
Other | Total | |||||||||||
|---|---|---|---|---|---|---|---|---|---|---|---|---|---|---|---|---|
December 31, 2009 |
||||||||||||||||
Cost |
$ | 19,000 | $ | 10,700 | $ | 1,334 | $ | 2,137 | $ | 33,171 | ||||||
Accumulated amortization |
(4,887 | ) | (6,417 | ) | (320 | ) | (1,963 | ) | (13,587 | ) | ||||||
Other intangible assets, net |
$ | 14,113 | $ | 4,283 | $ | 1,014 | $ | 174 | $ | 19,584 | ||||||
December 31, 2008 |
||||||||||||||||
Cost |
$ | 19,000 | $ | 11,366 | $ | 7,836 | $ | 2,291 | $ | 40,493 | ||||||
Accumulated amortization |
(4,344 | ) | (6,370 | ) | (4,168 | ) | (1,640 | ) | (16,522 | ) | ||||||
Other intangible assets, net |
$ | 14,656 | $ | 4,996 | $ | 3,668 | $ | 651 | $ | 23,971 | ||||||
The weighted average useful lives for the intangible assets are 35, 15, and 4 years for trade name, technology, and customer relationships, respectively. Amortization of intangible assets was $1,878, $2,028, and $2,229 in 2009, 2008, and 2007, respectively. Amortization expense is expected to be approximately $1,400 annually in 2010 through 2013, and $1,300 in 2014.
(7) Fair Value and Derivative Financial Instruments:
The Company holds certain assets and liabilities that are required to be measured at fair value on a recurring basis. These include the Company's derivative instruments, related to both foreign currency exchange and interest rates, which are recognized at fair value. All derivative instruments are designated as
F-18
Sauer-Danfoss Inc. and Subsidiaries
Notes to Consolidated Financial Statements (Continued)
December 31, 2009, 2008, and 2007
(Dollars in thousands, except per share data)
(7) Fair Value and Derivative Financial Instruments: (Continued)
and qualify for hedge accounting treatment, other than those contracts that no longer qualify as highly effective. Fair value is based on the price that would be received to sell an asset or paid to transfer a liability in an orderly transaction between market participants at the measurement date. It is the Company's policy to maximize the use of observable inputs and minimize the use of unobservable inputs when developing fair value measurements. The fair values of the foreign currency exchange and interest rate contracts are determined based on inputs that are readily available in public markets or can be derived from information available in publicly quoted markets. Therefore, the Company has categorized these contracts as Level 2 in the fair value hierarchy.
The following table shows the Company's financial assets and liabilities that were accounted for at fair value on a recurring basis:
| |
|
December 31, | ||||||||
|---|---|---|---|---|---|---|---|---|---|---|
| |
Balance Sheet Classification |
|||||||||
| |
2009 | 2008 | ||||||||
Assets: |
||||||||||
Foreign currency exchange contracts |
Other current assets | $ | 791 | $ | 1,560 | |||||
Foreign currency exchange contracts |
Other assets | — | 547 | |||||||
|
$ | 791 | $ | 2,107 | ||||||
Liabilities: |
||||||||||
Foreign currency exchange contracts |
Other accrued liabilities | $ | 322 | $ | 5,434 | |||||
Interest rate swap contracts |
Other liabilities | — | 1,897 | |||||||
|
$ | 322 | $ | 7,331 | ||||||
The Company uses derivative financial instruments to manage risk and not for trading or other speculative purposes.
The Company enters into forward contracts to hedge the value of the U.S. dollar or euro cash flow at locations that do not have the U.S. dollar or euro as their functional currency but conduct certain transactions in U.S. dollars or euros. The objective of all outstanding forward contracts is to hedge forecasted transactions in U.S. dollars or euros through the cash settlement date. The Company enters forward contracts that mature from two to eighteen months after the contract date.
The Company had foreign currency forward contracts outstanding in notional amounts as follows:
| |
December 31, | ||||||
|---|---|---|---|---|---|---|---|
| |
2009 | 2008 | |||||
U.S. dollar |
19,800 | 60,550 | |||||
Euro |
— | 22,000 | |||||
Interest rate swaps, designated as cash flow hedges, were used by the Company to establish fixed interest rates on outstanding borrowings. At December 31, 2008 the Company had two interest rate swaps outstanding, with a combined notional amount of $34,027. The interest rate swaps were settled in 2009 for a loss of $2,000 in connection with the debt repayment discussed in Note 8.
F-19
Sauer-Danfoss Inc. and Subsidiaries
Notes to Consolidated Financial Statements (Continued)
December 31, 2009, 2008, and 2007
(Dollars in thousands, except per share data)
(7) Fair Value and Derivative Financial Instruments: (Continued)
Changes in the fair value of derivative financial instruments are recognized in the statement of operations or in stockholders' equity as a component of other comprehensive income depending on whether the transaction related to the hedged risk has occurred and whether the contract qualifies as highly effective. Changes in fair values of derivatives that are accounted for as cash flow hedges are recorded in other comprehensive income. The amount of gain (loss), net of tax, recorded as a component of accumulated other comprehensive income was:
| |
December 31, | ||||||
|---|---|---|---|---|---|---|---|
| |
2009 | 2008 | |||||
Foreign currency exchange contracts |
$ | 208 | $ | (2,962 | ) | ||
Interest rate swap contracts |
— | (1,187 | ) | ||||
|
$ | 208 | $ | (4,149 | ) | ||
At December 31, 2009 the Company expects to reclassify $208 of gain, net of tax, on derivative instruments from accumulated other comprehensive income to the income statement during the next twelve months due to the actual fulfillment of forecasted transactions.
The following table summarizes the amount of gain (loss) reclassified from accumulated other comprehensive income into the consolidated statement of operations for 2009 and 2008:
| |
December 31, | ||||||
|---|---|---|---|---|---|---|---|
Statement of Operations Classification
|
2009 | 2008 | |||||
Net Sales |
$ | (5,487 | ) | $ | 7,805 | ||
Other, net |
864 | (504 | ) | ||||
Interest expense, net |
(151 | ) | (278 | ) | |||
|
$ | (4,774 | ) | $ | 7,023 | ||
The Company formally assesses at a hedge's inception, and on an ongoing basis, whether the derivatives that are used in the hedging transaction have been highly effective in offsetting changes in the cash flows of the hedged items and whether those derivatives are expected to remain highly effective. When it is determined that a derivative has ceased to be highly effective as a hedge the Company discontinues hedge accounting prospectively. When the Company discontinues hedge accounting because it is no longer probable that the forecasted transaction will occur by the end of the originally expected period, but it is probable that the transaction will occur within the two months following the forecasted period, the gain or loss on the derivative remains in accumulated other comprehensive income and is reclassified to net earnings when the forecasted transaction affects net earnings. However, if it is probable that a forecasted transaction will not occur within two months after the forecasted period, the gains and losses that were accumulated in other comprehensive income will be recognized immediately in net earnings. In all situations in which hedge accounting is discontinued and the derivative remains outstanding, the Company carries the derivative at its fair value on the consolidated balance sheet, recognizing future changes in the fair value in other income or expense, net. In 2009 the Company had derivative contracts with notional amounts of $3,300 that no longer qualified for hedge accounting as the
F-20
Sauer-Danfoss Inc. and Subsidiaries
Notes to Consolidated Financial Statements (Continued)
December 31, 2009, 2008, and 2007
(Dollars in thousands, except per share data)
(7) Fair Value and Derivative Financial Instruments: (Continued)
sales were not expected to occur in the month originally specified. In 2009 income of $376 was recognized in other, net related to changes in the fair value of derivative contracts that were no longer deemed highly effective, which is included in the $864 in the table above. The sales related to the derivative contracts no longer deemed highly effective occurred within two months following the originally specified period. All derivative contracts qualified for hedge accounting in 2008.
In addition, any portion of the hedge that is deemed ineffective due to the absolute value of the cumulative change in the derivative being greater than the cumulative change in the hedged item is recorded immediately in other income (expense) on the consolidated statement of operations. Except for the hedge ineffectiveness discussed above, there was no other significant hedge ineffectiveness in 2009. There was no significant hedge ineffectiveness in 2008.
(8) Long-Term Debt:
Long-term debt outstanding at December 31, 2009 and 2008 consisted of the following:
| |
2009 | 2008 | ||||||||||||
|---|---|---|---|---|---|---|---|---|---|---|---|---|---|---|
| |
Long-term Debt Due Within One Year |
Long-term Debt |
Long-term Debt Due Within One Year |
Long-term Debt |
||||||||||
Danfoss A/S Multicurrency Term Loan and Revolving Credit Facilities |
$ | 140,869 | $ | 332,370 | $ | — | $ | — | ||||||
Danfoss A/S Loan |
— | — | 50,000 | |||||||||||
Multicurrency Revolving and Term Loan Facility |
— | — | 56,461 | 201,115 | ||||||||||
Multicurrency Term Loan Facility |
— | — | — | 83,934 | ||||||||||
U.S. 2000 Senior Notes |
— | — | — | 24,000 | ||||||||||
Other Borrowings |
1,138 | 4,719 | 1,544 | 8,873 | ||||||||||
Total |
$ | 142,007 | $ | 337,089 | $ | 58,005 | $ | 367,922 | ||||||
Related Person Loans
In November 2009, the Company entered into a new unsecured term loan and revolving credit facility with Danfoss A/S (the Danfoss Agreement), the Company's majority stockholder, which replaced the Original Credit Agreement discussed below. Under the Danfoss Agreement the Company may borrow up to $690,000. The principal amount outstanding under the Danfoss Agreement bears interest at a rate equal to the U.S. prime rate or LIBOR, as in effect at times specified in the Danfoss Agreement, plus 10%. The balance of the revolving credit facilities at December 31, 2009 was $140,869, and the loans had a weighted average interest rate of 10.3%. The Danfoss Agreement also includes term loans of 92,000 euro (approximately $132,000) and $200,000, which accrue interest at an annual rate of 11.8% and 11.4%, respectively. The Company was required to pay a closing fee of $2,000 to Danfoss A/S, which was capitalized and will be amortized to interest expense over the term of the Danfoss Agreement. The Company pays a quarterly commitment fee equal to 4% of the average daily unused portion of the Danfoss Agreement. The Company incurred commitment fee expense of $1,231 in 2009. The Company's
F-21
Sauer-Danfoss Inc. and Subsidiaries
Notes to Consolidated Financial Statements (Continued)
December 31, 2009, 2008, and 2007
(Dollars in thousands, except per share data)
(8) Long-Term Debt: (Continued)
borrowings under the Danfoss Agreement will be due and payable in full on April 29, 2011. Prior to April 29, 2011 the Company will need to either extend its current Credit Agreement with Danfoss A/S or obtain an alternative source of funding from either Danfoss A/S or a third party. The Danfoss Agreement contains no financial covenants but it does contain a number of affirmative and negative covenants that, among other things, require the Company to obtain the consent of Danfoss A/S prior to engaging in certain types of transactions. The Danfoss Agreement contains customary representations and warranties regarding the Company and its business and operations. It also sets forth a number of events of default for, among other things, failure to pay principal or interest, breaches of representations, warranties and covenants and various events relating to the bankruptcy or insolvency of the Company or its subsidiaries.
In March 2009, the Company entered into a Multicurrency Term Loan and Revolving Credit Facilities agreement with Danfoss A/S (the Original Credit Agreement), which was scheduled to mature on September 30, 2010, but was terminated in November, 2009 and replaced by the Danfoss Agreement discussed above. Under the Original Credit Agreement the Company was able to borrow up to $490,000. Borrowings under the Original Credit Agreement bore interest at LIBOR, CIBOR or EURIBOR, plus a margin of 8.0%. The Original Credit Agreement also included term loans of 92,000 euro and $180,000, which accrued interest at an annual rate of 9.8% and 9.4%, respectively. Debt issuance costs of approximately $8,600 were capitalized but subsequently taken to interest expense when the Original Credit Agreement was replaced by the Danfoss Agreement. The Company was also required to pay a commitment fee of 4.0% on the unused portion of the Original Credit Agreement. In 2009 the Company recognized commitment fee expense of $2,311. Proceeds from these borrowings were used to pay off the Multicurrency Revolving and Term Loan Facilities and the U.S. 2000 Senior Notes.
In December 2008, the Company borrowed $50,000 from Danfoss A/S (the Danfoss A/S Loan). The unsecured term loan had a maturity date of December 9, 2011 and bore interest at an annual rate of 4.02%. The Company paid a facility fee of 10 basis points. The Danfoss A/S Loan was terminated in November, 2009 with its balance rolled into the Danfoss Agreement, as described above.
Approximately $5,100 of unamortized debt issuance costs related to both the Original Credit Agreement and the Danfoss A/S Loan were expensed in 2009 as a result of the Danfoss Agreement.
Multicurrency Facilities
In December 2005, the Company entered into a Multicurrency Revolving Facility Agreement which was modified in July 2006 (the Agreement). Borrowings under the Agreement bore interest at a rate based on either the relevant interbank offering rate plus a margin, Federal Funds plus 0.5%, or the prevailing Prime Rate. The margin on the interbank offering rate option ranged from 0.5% to 1.125%, depending upon the Company's ratio of net debt to EBITDA, as defined. Outstanding borrowings under the Agreement were repaid during March 2009. The Company wrote off $600 of unamortized debt issuance costs related to the loans.
In December 2005, the Company entered a term loan facility, under which it borrowed $30,000 in U.S. dollars at a fixed interest rate of 5.74% and 38,450 euro (approximately $53,900 using the December 31, 2008 exchange rate) at a fixed interest rate of 4.05% over the ten-year term of the loan. The U.S. dollar portion of the loan was repaid in March 2009 along with a prepayment penalty of approximately $4,400.
F-22
Sauer-Danfoss Inc. and Subsidiaries
Notes to Consolidated Financial Statements (Continued)
December 31, 2009, 2008, and 2007
(Dollars in thousands, except per share data)
(8) Long-Term Debt: (Continued)
The euro portion of the loan was repaid in April 2009 along with a prepayment penalty of approximately $3,300.
U.S Borrowings
In October 2000, the Company issued $35,000 of 8.07% Senior Notes with scheduled annual payments starting on September 30, 2008, through September 30, 2010. The Notes were repaid during March 2009. The Company paid a prepayment penalty of approximately $400 and in addition, wrote off $50 of unamortized debt issuance costs related to the loans.
Other Borrowings
The Company borrows locally when favorable terms are available. In May 2007, the Company borrowed $150 from the Ames, Iowa Economic Development Commission. The loan bears interest at an annual rate of 4.13%, and the outstanding balance on the loan at December 31, 2009 was $103. In December 2006, the Company borrowed $750 from the Iowa Department of Economic Development. The loan does not bear interest, and the outstanding balance at December 31, 2009 was $643. In April, 2005 the Company borrowed 150,000 Indian rupee from The Hong Kong and Shanghai Banking Corporation. The loan bears interest at a variable rate ranging from 8.20% to 9.36%, and had an outstanding balance of 134,488 Indian rupee (approximately $2,870) at December 31, 2009. In February, 2007 the Company borrowed 150,000 Indian rupee from Deutsche Bank AG. The loan bears interest at an annual rate of 11.75%, and the outstanding balance at December 31, 2009 was 105,000 Indian rupee (approximately $2,241). A Danish subsidiary maintains a line of credit for purposes of centralizing cash management for the European locations. Sauer-Danfoss Inc. guarantees this line of credit up to 20,000 euro (approximately $28,000).
Loss on Early Retirement of Debt
A loss on early retirement of debt of $15,838 was recognized during 2009. The total loss consisted of $8,064 of prepayment penalties, $2,000 to settle outstanding interest rate swap agreements related to the debt repaid, and $5,774 to write-off unamortized deferred financing costs.
Repayment of Borrowings
Payments required to be made on long-term debt outstanding as of December 31, 2009 during the years ending 2010 through 2014 and for 2015 and thereafter are $142,007, $334,071, $1,367, $986, $665 and $0, respectively.
F-23
Sauer-Danfoss Inc. and Subsidiaries
Notes to Consolidated Financial Statements (Continued)
December 31, 2009, 2008, and 2007
(Dollars in thousands, except per share data)
(9) Pension and Postretirement Benefits other than Pensions:
The Company has noncontributory defined benefit pension plans covering a significant number of its employees. The benefits under these plans are based primarily on years of service and compensation levels. The Company also provides health benefits for certain retired employees and certain dependents when the employee becomes eligible for these benefits by satisfying plan provisions that include certain age and service requirements. The measurements for the pension and health benefits plans were performed at December 31.
Pension Benefits
Pension expense for 2009, 2008, and 2007 for these defined benefit plans consists of the following components:
| |
December 31, | ||||||||||
|---|---|---|---|---|---|---|---|---|---|---|---|
| |
2009 | 2008 | 2007 | ||||||||
Service cost |
$ | 4,021 | $ | 4,371 | $ | 4,637 | |||||
Interest cost |
13,573 | 13,635 | 12,593 | ||||||||
Expected return on plan assets |
(11,144 | ) | (12,202 | ) | (10,643 | ) | |||||
Amortization of prior service cost |
(231 | ) | (318 | ) | 49 | ||||||
Amortization of net loss |
2,886 | 1,871 | 2,847 | ||||||||
Net periodic pension expense |
$ | 9,105 | $ | 7,357 | $ | 9,483 | |||||
The Company incurred $1,036 of curtailment expense in 2007 related to discontinuing production of certain product lines manufactured in Swindon, England. The curtailment expense is not included in the net periodic pension expense disclosed above.
The Company expects to incur income of $303 related to the amortization of prior service costs and expense of $5,431 for amortization of net loss in 2010.
F-24
Sauer-Danfoss Inc. and Subsidiaries
Notes to Consolidated Financial Statements (Continued)
December 31, 2009, 2008, and 2007
(Dollars in thousands, except per share data)
(9) Pension and Postretirement Benefits other than Pensions: (Continued)
The following table sets forth the plans' funded status as of the respective balance sheet dates:
| |
December 31, | ||||||
|---|---|---|---|---|---|---|---|
| |
2009 | 2008 | |||||
Reconciliation of benefit obligation: |
|||||||
Benefit obligation at January 1 |
$ | (220,473 | ) | $ | (228,931 | ) | |
Service cost |
(4,021 | ) | (4,371 | ) | |||
Interest cost |
(13,573 | ) | (13,635 | ) | |||
Plan participant contributions |
(1,068 | ) | (1,411 | ) | |||
Plan amendments |
— | (100 | ) | ||||
Plan curtailment(1) |
2,427 | — | |||||
Actuarial gain (loss) |
(9,554 | ) | 2,363 | ||||
Benefit payments |
13,648 | 10,412 | |||||
Effect of exchange rate changes |
(5,667 | ) | 15,200 | ||||
Benefit obligation at December 31 |
(238,281 | ) | (220,473 | ) | |||
Reconciliation of fair value of plan assets: |
|||||||
Fair value of plan assets at January 1 |
135,550 | 160,095 | |||||
Actual return on plan assets |
23,353 | (28,896 | ) | ||||
Employer contributions |
10,415 | 27,574 | |||||
Effect of exchange rate changes |
5,019 | (16,103 | ) | ||||
Plan participant contributions |
1,068 | 1,411 | |||||
Benefit payments |
(11,045 | ) | (8,531 | ) | |||
Fair value of plan assets at December 31 |
164,360 | 135,550 | |||||
Funded status at December 31 |
(73,921 | ) | (84,923 | ) | |||
Net amount recognized |
$ | (73,921 | ) | $ | (84,923 | ) | |
- (1)
- Reduced benefit obligation due to plan curtailment related to the significant reduction in plan participants in the U.S. plan.
Amounts recognized in the consolidated balance sheets as of:
| |
December 31, | ||||||
|---|---|---|---|---|---|---|---|
| |
2009 | 2008 | |||||
Long-term pension liability, net(1) |
$ | (72,029 | ) | $ | (84,923 | ) | |
Current pension liability |
(1,892 | ) | — | ||||
Net amount recognized |
$ | (73,921 | ) | $ | (84,923 | ) | |
- (1)
- Includes plan assets of $371 and $6,043 in 2009 and 2008, respectively, that is included in other assets.
F-25
Sauer-Danfoss Inc. and Subsidiaries
Notes to Consolidated Financial Statements (Continued)
December 31, 2009, 2008, and 2007
(Dollars in thousands, except per share data)
(9) Pension and Postretirement Benefits other than Pensions: (Continued)
The aggregate projected benefit obligation, accumulated benefit obligation, and fair value of plan assets for pension plans with projected and accumulated benefit obligations in excess of plan assets as of December 31, 2009 and 2008 were as follows:
| |
Projected and Accumulated Benefit Obligation Exceeds the Fair Value of Plan Assets |
||||||||||||
|---|---|---|---|---|---|---|---|---|---|---|---|---|---|
| |
U.S. Plans | Non-U.S. Plans | |||||||||||
| |
December 31, | December 31, | |||||||||||
| |
2009 | 2008 | 2009 | 2008 | |||||||||
Projected benefit obligation |
$ | 133,780 | $ | 135,909 | $ | 54,199 | $ | 48,606 | |||||
Accumulated benefit obligation |
124,967 | 121,046 | 52,475 | — | |||||||||
Fair value of plan assets |
90,988 | 75,502 | 22,702 | 18,048 | |||||||||
Amounts recorded in accumulated other comprehensive income as of:
| |
December 31, | ||||||
|---|---|---|---|---|---|---|---|
| |
2009 | 2008 | |||||
Actuarial loss |
$ | 65,002 | $ | 71,899 | |||
Prior service cost |
(3,391 | ) | (3,607 | ) | |||
|
$ | 61,611 | $ | 68,292 | |||
These amounts have not yet been recognized as components of net periodic pension expense.
Significant assumptions used in determining pension expense and related pension obligations are as follows:
| |
December 31, | ||||||||||
|---|---|---|---|---|---|---|---|---|---|---|---|
| |
2009 | 2008 | 2007 | ||||||||
Discount Rates |
|||||||||||
United States |
6.00 | % | 6.25 | % | 6.50 | % | |||||
Germany |
5.30 | 5.75 | 5.50 | ||||||||
United Kingdom |
5.70 | 6.70 | 6.00 | ||||||||
Rates of increase in compensation levels |
|||||||||||
United States |
3.50 | 3.50 | 3.50 | ||||||||
Germany |
2.50 | 3.50 | 3.50 | ||||||||
United Kingdom |
4.60 | 3.70 | 4.50 | ||||||||
Expected long-term rate of return on assets |
|||||||||||
United States |
8.50 | 8.50 | 8.50 | ||||||||
Germany |
5.25 | 4.66 | 4.84 | ||||||||
United Kingdom |
6.10 | 6.30 | 6.30 | ||||||||
The discount rate assumptions were based on investment yields available on AA rated long-term corporate bonds with cash flows that are similar to expected benefit payments.
F-26
Sauer-Danfoss Inc. and Subsidiaries
Notes to Consolidated Financial Statements (Continued)
December 31, 2009, 2008, and 2007
(Dollars in thousands, except per share data)
(9) Pension and Postretirement Benefits other than Pensions: (Continued)
The expected return on plan assets is based on the asset allocation mix and the historical return, taking into account current and expected market conditions.
Plan Assets
The target asset allocation for the U.S. pension assets, on average, is 60% in equity securities and 40% in fixed income securities. This allocation is expected to earn an average annual rate of return of approximately 8.5% measured over a planning horizon of twenty years with reasonable and acceptable levels of risk. This expected level will be obtained, with an allowance for expenses, and cash investments, if equity securities realize an average annual return of 11.0% and fixed income securities produce an average annual yield of 6.0%.
The target asset allocation for the U.K. pension assets, on average, is 42% in equity securities, 50% in fixed income securities, and 8% in cash. This allocation is expected to earn an average annual rate of return of approximately 6.0%.
The target asset allocation for the German pension assets is 10% in equity securities and 90% in fixed income securities. This allocation is expected to earn an average annual rate of return of approximately 4.5% measured over a long-term planning horizon. This expected level will be obtained, with an allowance for expenses, and cash investments, if equity securities realize an average annual return of 7 to 8% and fixed income securities produce an average annual yield of 2.5 to 3%.
The weighted average asset allocations by asset category for the pension plans at December 31 are as follows:
| |
U.S. Plans | U.K. Plans | German Plans | |||||||||||||||||
|---|---|---|---|---|---|---|---|---|---|---|---|---|---|---|---|---|---|---|---|---|
| |
2009 | 2008 | 2009 | 2008 | 2009 | 2008 | ||||||||||||||
Equity securities |
66 | % | 53 | % | 42 | % | 39 | % | 14 | % | 7 | % | ||||||||
Fixed income securities |
33 | 45 | 50 | 48 | 81 | 91 | ||||||||||||||
Other |
1 | 2 | 8 | 13 | 5 | 2 | ||||||||||||||
Total |
100 | 100 | 100 | 100 | 100 | 100 | ||||||||||||||
The following table presents the Company's plan assets using the fair value hierarchy as of December 31, 2009. The fair value hierarchy has three levels based on the reliability of the inputs used to determine fair value. Level 1 refers to fair values determined based on quoted prices in active markets for
F-27
Sauer-Danfoss Inc. and Subsidiaries
Notes to Consolidated Financial Statements (Continued)
December 31, 2009, 2008, and 2007
(Dollars in thousands, except per share data)
(9) Pension and Postretirement Benefits other than Pensions: (Continued)
identical assets. Level 2 refers to fair values estimated using significant other observable inputs, and Level 3 includes fair values estimated using significant non-observable inputs.
| |
Level 1 | Level 2 | Level 3 | Total | |||||||||||
|---|---|---|---|---|---|---|---|---|---|---|---|---|---|---|---|
Fixed income securities |
|||||||||||||||
Corporate bonds |
$ | — | $ | 23,966 | $ | — | $ | 23,966 | |||||||
U.S. government and agencies |
— | 8,059 | — | 8,059 | |||||||||||
Mortgage backed and asset backed securities |
— | 5,765 | — | 5,765 | |||||||||||
International index-linked government securities |
31,938 | — | — | 31,938 | |||||||||||
Other |
— | 875 | — | 875 | |||||||||||
Cash equivalents and short-term investments |
5,896 | 2,113 | — | 8,009 | |||||||||||
Equity securities |
|||||||||||||||
Common and preferred stock |
2,305 | — | — | 2,305 | |||||||||||
Common/collective/pooled funds |
690 | 37,633 | — | 38,323 | |||||||||||
Derivatives |
29 | — | — | 29 | |||||||||||
International equity |
44,871 | — | — | 44,871 | |||||||||||
Total |
$ | 85,729 | $ | 78,411 | $ | — | $ | 164,140 | |||||||
Receivables |
244 | ||||||||||||||
Payables |
(24 | ) | |||||||||||||
Total plan assets |
$ | 164,360 | |||||||||||||
Fixed income securities are primarily valued using a market approach with inputs that include broker quotes, benchmark yields, base spreads and reported trades.
Cash equivalents and short-term investments are primarily held in registered money market funds which are valued using a market approach based on the quoted market prices of identical instruments.
Common and preferred stock equity securities and international equity securities are valued using a market approach based on quoted market prices. Common/collective/pooled funds are common or collective trusts valued at their net asset values that are calculated by the investment manager or fund sponsor based on the quoted market prices of the underlying investments.
Postretirement Benefits
The health benefit plans covering certain groups of U.S. employees are contributory, with contributions reviewed annually and adjusted as appropriate. These plans contain other cost-sharing features such as deductibles and coinsurance. The Company does not pre-fund these plans and has the right to modify or terminate any of these plans in the future. Health benefits for retirees of non-U.S. operations, where applicable, are provided through government-sponsored plans to which the Company contributes funds during the individuals' employment periods.
F-28
Sauer-Danfoss Inc. and Subsidiaries
Notes to Consolidated Financial Statements (Continued)
December 31, 2009, 2008, and 2007
(Dollars in thousands, except per share data)
(9) Pension and Postretirement Benefits other than Pensions: (Continued)
The components of the postretirement benefit expense of the Company-sponsored health benefit plans for 2009, 2008, and 2007, were as follows:
| |
2009 | 2008 | 2007 | |||||||
|---|---|---|---|---|---|---|---|---|---|---|
Service cost |
$ | 211 | $ | 225 | $ | 385 | ||||
Interest cost |
2,597 | 2,634 | 2,212 | |||||||
Net deferral and amortization |
921 | 1,030 | 947 | |||||||
Postretirement benefit expense |
$ | 3,729 | $ | 3,889 | $ | 3,544 | ||||
The Company expects to incur income of $128 for amortization of prior service costs and expense of $1,201 for amortization of net loss in 2010.
The funded status of the Company-sponsored health benefit plans was as follows:
| |
December 31, | ||||||
|---|---|---|---|---|---|---|---|
| |
2009 | 2008 | |||||
Reconciliation of benefit obligation: |
|||||||
Benefit obligation at January 1 |
$ | (41,060 | ) | $ | (38,648 | ) | |
Service cost |
(211 | ) | (225 | ) | |||
Interest cost |
(2,597 | ) | (2,634 | ) | |||
Plan participant contributions |
(495 | ) | (447 | ) | |||
Plan amendment |
2,081 | — | |||||
Plan curtailment |
779 | — | |||||
Actuarial loss |
(6,296 | ) | (2,495 | ) | |||
Benefit payments |
4,011 | 3,470 | |||||
Health care subsidy receipts |
(87 | ) | (81 | ) | |||
Benefit obligation at December 31 |
(43,875 | ) | (41,060 | ) | |||
Reconciliation of fair value of plan assets: |
|||||||
Fair value of plan assets at January 1 |
— | — | |||||
Employer contributions |
3,429 | 2,942 | |||||
Plan participant contributions |
495 | 447 | |||||
Health care subsidy receipts |
87 | 81 | |||||
Benefit payments |
(4,011 | ) | (3,470 | ) | |||
Fair value of plan assets at December 31 |
— | — | |||||
Benefit obligation |
(43,875 | ) | (41,060 | ) | |||
Less current portion |
2,828 | 3,089 | |||||
Postretirement benefit obligation, long-term |
$ | (41,047 | ) | $ | (37,971 | ) | |
F-29
Sauer-Danfoss Inc. and Subsidiaries
Notes to Consolidated Financial Statements (Continued)
December 31, 2009, 2008, and 2007
(Dollars in thousands, except per share data)
(9) Pension and Postretirement Benefits other than Pensions: (Continued)
Amounts recognized in accumulated other comprehensive income as of:
| |
December 31, | ||||||
|---|---|---|---|---|---|---|---|
| |
2009 | 2008 | |||||
Actuarial loss |
$ | 24,430 | $ | 19,834 | |||
Prior service credit |
(2,081 | ) | — | ||||
|
$ | 22,349 | $ | 19,834 | |||
The assumed weighted average annual rate of increase in the per capita cost of medical benefits is 8.0% for 2009 and is assumed to decrease ratably in 2010 through 2013 and remain level at 4.5% thereafter.
U.S. employees retiring after March 1, 1993, and hired prior to January 1, 1993, will receive the standard health benefits up to age 65 and then will be eligible for a Medicare reimbursement allowance based on years of service. U.S. employees hired after January 1, 1993, and retiring after age 65 with ten years of service, will be eligible at age 65 for a Medicare reimbursement allowance based on years of service.
A one percent increase or decrease in the annual health care trend rates would have increased or decreased the accumulated postretirement benefit obligation at December 31, 2009, by $4,321, and increased or decreased postretirement benefit expense for 2009 by $244. The weighted average discount rate used to estimate the accumulated postretirement benefit obligation was 6.0%, 6.25%, and 6.5% for 2009, 2008, and 2007, respectively.
The benefits expected to be paid from the benefit plans, which reflect expected future years of service, and the Medicare subsidy expected to be received are as follows:
| |
Pensions | Health Care | Health Care Subsidy Receipts |
|||||||
|---|---|---|---|---|---|---|---|---|---|---|
2010 |
$ | 12,185 | $ | 2,904 | $ | 76 | ||||
2011 |
10,999 | 3,096 | 82 | |||||||
2012 |
11,497 | 3,246 | 87 | |||||||
2013 |
12,324 | 3,322 | 92 | |||||||
2014 |
13,037 | 3,445 | 97 | |||||||
2015-2019 |
76,794 | 17,842 | 520 | |||||||
The Company plans to contribute approximately $13,000 to the Company pension and health benefit plans in 2010.
The Company also maintains two defined contribution plans, the Sauer-Danfoss Employees' Savings Plan and the Sauer-Danfoss LaSalle Factory Employee Savings Plan, for eligible employees. Company contributions include both base and matching amounts. The Company contributed approximately $2,400, $3,100, and $2,900 to these plans in 2009, 2008 and 2007, respectively.
F-30
Sauer-Danfoss Inc. and Subsidiaries
Notes to Consolidated Financial Statements (Continued)
December 31, 2009, 2008, and 2007
(Dollars in thousands, except per share data)
(10) Income Taxes:
The Company's income (loss) before income taxes is as follows:
| |
Years Ended December 31, | ||||||||||
|---|---|---|---|---|---|---|---|---|---|---|---|
| |
2009 | 2008 | 2007 | ||||||||
United States |
$ | (97,054 | ) | $ | 15,387 | $ | 22,164 | ||||
European and other |
(174,181 | ) | (12,657 | ) | 65,435 | ||||||
Total |
$ | (271,235 | ) | $ | 2,730 | $ | 87,599 | ||||
The Company's primary German operation is treated as a flow-through entity for U.S. tax purposes. The above analysis of pretax income (loss) and the following analysis of the income tax provision by taxing jurisdiction are therefore not directly related.
The benefit (expense) for income taxes by taxing jurisdiction is as follows:
| |
Years Ended December 31, | |||||||||||
|---|---|---|---|---|---|---|---|---|---|---|---|---|
| |
2009 | 2008 | 2007 | |||||||||
Current |
||||||||||||
United States |
||||||||||||
Federal |
$ | 225 | $ | (1,575 | ) | $ | (656 | ) | ||||
State |
254 | (1,487 | ) | (1,339 | ) | |||||||
European and other |
(9,779 | ) | (30,012 | ) | (20,288 | ) | ||||||
Total Current |
(9,300 | ) | (33,074 | ) | (22,283 | ) | ||||||
Deferred |
||||||||||||
United States |
||||||||||||
Federal |
(50,659 | ) | (3,454 | ) | (3,923 | ) | ||||||
State |
(4,960 | ) | (102 | ) | (280 | ) | ||||||
European and other |
3,900 | 22,570 | 7,647 | |||||||||
Total Deferred |
(51,719 | ) | 19,014 | 3,444 | ||||||||
Total income tax expense |
$ | (61,019 | ) | $ | (14,060 | ) | $ | (18,839 | ) | |||
F-31
Sauer-Danfoss Inc. and Subsidiaries
Notes to Consolidated Financial Statements (Continued)
December 31, 2009, 2008, and 2007
(Dollars in thousands, except per share data)
(10) Income Taxes: (Continued)
A reconciliation of tax benefit (expense) calculated using the U.S. statutory tax rate and recorded income tax expense based on the Company's income before income taxes is as follows:
| |
Years Ended December 31, | ||||||||||
|---|---|---|---|---|---|---|---|---|---|---|---|
| |
2009 | 2008 | 2007 | ||||||||
Tax benefit (expense) based on U.S. statutory tax rate |
$ | 94,932 | $ | (956 | ) | $ | (30,659 | ) | |||
Statutory tax rate change |
— | 93 | 393 | ||||||||
Foreign taxes (rate and other differences)—net |
(14,652 | ) | (5,890 | ) | (2,528 | ) | |||||
State income taxes–net of federal benefit |
(3,059 | ) | (1,033 | ) | (777 | ) | |||||
Tax effect of minority interest |
3,242 | 3,869 | 5,815 | ||||||||
Tax reserves and allowances—net |
(123,305 | ) | (3,051 | ) | 9,910 | ||||||
Non-deductible expenses/Non-taxable income—net |
(1,884 | ) | (971 | ) | (1,681 | ) | |||||
U.S. & foreign goodwill impairment |
(17,163 | ) | (6,281 | ) | — | ||||||
Other |
870 | 160 | 688 | ||||||||
Total income tax expense |
$ | (61,019 | ) | $ | (14,060 | ) | $ | (18,839 | ) | ||
The components of the Company's net deferred tax assets and liabilities, determined on a jurisdictional and entity basis, are attributable to the following:
| |
December 31, | |||||||||||||
|---|---|---|---|---|---|---|---|---|---|---|---|---|---|---|
| |
2009 | 2008 | ||||||||||||
| |
Assets | Liabilities | Assets | Liabilities | ||||||||||
Net operating loss (NOL) and tax credit carryforwards |
$ | 77,565 | $ | — | $ | 18,057 | $ | — | ||||||
Deferred compensation, postretirement medical |
||||||||||||||
and accrued pension benefits |
39,288 | — | 44,760 | (871 | ) | |||||||||
Fixed asset basis differences |
22,440 | (12,998 | ) | 7,241 | (22,303 | ) | ||||||||
Inventory and warranty accruals |
13,660 | (1,574 | ) | 9,628 | (2,349 | ) | ||||||||
Intangible asset fair market value step-up |
6,394 | (9,421 | ) | 8,908 | (8,894 | ) | ||||||||
Other items |
29,498 | (10,964 | ) | 37,594 | (11,141 | ) | ||||||||
Gross deferred tax assets/liabilities |
188,845 | (34,957 | ) | 126,188 | (45,558 | ) | ||||||||
Valuation allowance |
(130,475 | ) | — | (6,103 | ) | — | ||||||||
Net deferred tax assets/liabilities |
58,370 | (34,957 | ) | 120,085 | (45,558 | ) | ||||||||
Less current portion |
(3,912 | ) | 1,249 | (13,101 | ) | 1,315 | ||||||||
Net deferred tax assets/liabilities, long-term |
$ | 54,458 | $ | (33,708 | ) | $ | 106,984 | $ | (44,243 | ) | ||||
The ultimate realization of net deferred tax assets is dependent upon the generation of future taxable income during (i) the years in which temporary differences reverse and (ii) the years prior to the expiration of NOL and credit carryforwards. Management considers projected future taxable income and tax planning strategies in making this assessment.
F-32
Sauer-Danfoss Inc. and Subsidiaries
Notes to Consolidated Financial Statements (Continued)
December 31, 2009, 2008, and 2007
(Dollars in thousands, except per share data)
(10) Income Taxes: (Continued)
In 2009 the Company determined that all of the net deferred tax assets in the U.S., Denmark and Italy that have not been supported by tax planning strategies would expire unused. This resulted in the majority of the increase in valuation allowances of approximately $125,000.
As of December 31, 2009 and 2008, the Company had not provided U.S. federal income taxes on $126,686 and $170,556, respectively, of undistributed earnings recorded by certain subsidiaries outside the U.S. since these earnings were deemed permanently invested. Although it is not practicable to determine the deferred tax liability on the unremitted earnings, foreign tax credits would be available to reduce U.S. tax liability if these foreign earnings were remitted.
The Company files income tax returns in the U.S. federal jurisdiction, and various states and foreign jurisdictions. With few exceptions, the Company is no longer subject to U.S. federal, state and local, or non-U.S. income tax examinations by tax authorities for years before 2005. During 2009, the Internal Revenue Service completed a limited scope audit of the Company's 2007 federal income tax return. The audit resulted in immaterial adjustments and has been incorporated into the Consolidated Financial Statements.
A reconciliation of the beginning and ending gross unrecognized tax benefits (UTB) is as follows:
| |
Amount | |||
|---|---|---|---|---|
Gross UTB Balance at January 1, 2009 |
$ | 2,317 | ||
Additions based on tax positions related to the current year |
144 | |||
Additions for tax positions of prior years |
— | |||
Reductions for tax positions of prior years |
— | |||
Settlements |
(959 | ) | ||
Foreign currency adjustments |
44 | |||
Reductions due to lapse of applicable statute of limitations |
— | |||
Gross UTB Balance at December 31, 2009 |
1,546 | |||
Net UTB impacting the effective tax rate at December 31, 2009 |
144 | |||
The total amount of UTB that, if recognized, would affect the effective tax rate as of December 31, 2009 and 2008 were $144 and $743, respectively. The total amount of UTB is not expected to significantly increase or decrease within the next twelve months. The net UTBs are included as components of deferred income tax assets and other liabilities in the Consolidated Balance Sheets.
The Company recognizes interest and penalties related to unrecognized tax benefits in interest expense and other expense. Interest and penalties of $288 and $194 have been accrued as of December 31, 2009 and December 31, 2008, respectively. Interest and penalty expense of $90 and $198 were recognized for years ending December 31, 2009 and December 31, 2008, respectively.
F-33
Sauer-Danfoss Inc. and Subsidiaries
Notes to Consolidated Financial Statements (Continued)
December 31, 2009, 2008, and 2007
(Dollars in thousands, except per share data)
(10) Income Taxes: (Continued)
The Company had the following tax return carryforwards available to offset future years' taxable income at December 31, 2009:
| |
Amount | Expiration Dates | |||||
|---|---|---|---|---|---|---|---|
German NOL—National |
$ | 49,168 | None | ||||
German NOL—Trade |
18,596 | None | |||||
U.S. NOL |
106,482 | 2010-2029 | |||||
U.K. NOL |
11,506 | None | |||||
Denmark NOL |
68,555 | None | |||||
Italy NOL |
12,436 | 2013-2014 | |||||
Brazil NOL |
10,785 | None | |||||
China NOL |
6,136 | 2010-2014 | |||||
Japan NOL |
5,492 | 2017 | |||||
Other non-U.S. NOL |
7,085 | Various | |||||
State NOL |
50,752 | 2010-2029 | |||||
Foreign tax credits (available to offset U.S. taxes) |
1,750 | 2029 | |||||
State tax credits |
835 | 2010-2019 | |||||
(11) Accumulated Other Comprehensive Income:
The changes in accumulated other comprehensive income for the years ended December 31, 2007, 2008, and 2009 follows:
| |
Currency Translation |
Pension/ Postretirement Benefit Adjustment |
Hedging Activities |
Accumulated Other Comprehensive Income |
|||||||||
|---|---|---|---|---|---|---|---|---|---|---|---|---|---|
Balance as of January 1, 2007 |
$ | 77,331 | $ | (51,556 | ) | $ | 568 | $ | 26,343 | ||||
Change in period |
40,736 | 16,202 | 2,551 | 59,489 | |||||||||
Effect of exchange rate changes |
— | (1,288 | ) | 120 | (1,168 | ) | |||||||
Income tax expense |
— | (2,452 | ) | (527 | ) | (2,979 | ) | ||||||
Balance as of December 31, 2007 |
118,067 | (39,094 | ) | 2,712 | 81,685 | ||||||||
Change in period |
(24,389 | ) | (38,719 | ) | (9,185 | ) | (72,293 | ) | |||||
Effect of exchange rate changes |
— | 1,844 | (85 | ) | 1,759 | ||||||||
Income tax benefit |
— | 14,435 | 2,409 | 16,844 | |||||||||
Balance as of December 31, 2008 |
93,678 | (61,534 | ) | (4,149 | ) | 27,995 | |||||||
Change in period |
16,684 | 5,196 | 6,174 | 27,924 | |||||||||
Effect of exchange rate changes |
— | (1,016 | ) | (44 | ) | (956 | ) | ||||||
Income tax benefit (expense) |
— | 2,206 | (1,773 | ) | 459 | ||||||||
Balance as of December 31, 2009 |
$ | 110,362 | $ | (55,148 | ) | $ | 208 | $ | 55,422 | ||||
F-34
Sauer-Danfoss Inc. and Subsidiaries
Notes to Consolidated Financial Statements (Continued)
December 31, 2009, 2008, and 2007
(Dollars in thousands, except per share data)
(12) Noncontrolling Interests:
Noncontrolling interests in net assets and income reflected in the accompanying consolidated financial statements for 2009, 2008, and 2007 consists of:
- a)
- A
40% noncontrolling interest held by Agri-Fab, Inc. in Hydro-Gear Limited Partnership, a U.S. limited partnership.
- b)
- A
40% noncontrolling interest held by Shanghai Hydraulics and Pneumatics in Sauer Shanghai Hydraulic Transmission Co., Ltd., a Chinese equity
business venture.
- c)
- A
35% noncontrolling interest held by Daikin Industries Ltd. in Sauer-Danfoss-Daikin, Ltd., a Japanese corporation.
- d)
- A
49.9% noncontrolling interest held by Topcon Positioning Systems in TSD Integrated Controls LLC, a U.S. limited partnership.
- e)
- A 55% noncontrolling interest held by Daikin Industries Ltd. in Daikin-Sauer-Danfoss Manufacturing, Ltd., a Japanese corporation.
The following table sets forth the components of noncontrolling interest in the consolidated balance sheets:
| |
December 31, | |||||||
|---|---|---|---|---|---|---|---|---|
| |
2009 | 2008 | ||||||
Hydro-Gear Limited Partnership |
$ | 28,187 | $ | 32,453 | ||||
Sauer Shanghai Hydraulic Transmission Co., Ltd. |
13,699 | 13,448 | ||||||
Sauer-Danfoss-Daikin, Ltd. |
11,543 | 9,500 | ||||||
TSD Integrated Controls LLC(1) |
(864 | ) | 1,128 | |||||
Daikin-Sauer-Danfoss Manufacturing, Ltd. |
10,095 | 11,126 | ||||||
Total |
$ | 62,660 | $ | 67,655 | ||||
- (1)
- In connection with the wind-down of the TSD joint venture discussed in Note 2 the noncontrolling interest partner has received distribution of assets in excess of their interest in the joint venture. There will be a settlement between the joint venture partners at the end of the wind-down period.
The Hydro-Gear Limited Partnership agreement indicates a termination date of December 31, 2035. This entity is consolidated in the Company's financial statements. The agreement indicates that if the partnership were to terminate the partnership would be liquidated and the resulting proceeds would be distributed in accordance with each partner's ownership percentage
(13) Long-Term Incentive Plan:
The Company's 2006 Omnibus Incentive Plan (2006 Incentive Plan) and 1998 Long-Term Incentive Plan (1998 Incentive Plan) provide for the grant of stock options, stock appreciation rights, restricted stock, performance units, performance shares, and other incentive awards to officers and key employees.
F-35
Sauer-Danfoss Inc. and Subsidiaries
Notes to Consolidated Financial Statements (Continued)
December 31, 2009, 2008, and 2007
(Dollars in thousands, except per share data)
(13) Long-Term Incentive Plan: (Continued)
The 2006 Incentive Plan qualifies certain awards for the performance-based exception to obtain favorable tax treatment. The total number of shares of common stock that may be subject to awards or be issued under the 2006 Incentive Plan and the 1998 Incentive Plan shall not exceed 3,500,000 shares and 2,400,000 shares, respectively, of which no more than 1,200,000 shares may be issued as restricted stock under the 1998 Incentive Plan. The settlement of performance units is in shares of Company stock or cash as determined by the Compensation Committee of the Board of Directors. The performance units entitle the participants to receive an amount equal to the Company's dividends during the vesting period.
No performance units were granted in 2009. In 2008 the Compensation Committee granted 328,053 performance units under the 2006 Incentive Plan, 307,945 of which were to be settled 100 percent in Company stock with shares withheld having a value to meet the minimum statutory withholding requirements and 20,108 performance units granted to certain individuals that were to be settled in cash. In 2007 the Compensation Committee granted 273,101 performance units under the 2006 Incentive Plan, 213,553 of which were to be settled 100 percent in Company stock with shares withheld having a value to meet the minimum statutory withholding requirements and 59,548 performance units granted to certain individuals that were to be settled in cash. The units to be settled in cash are accounted for as liability units, with the remainder of the units accounted for as equity units.
The following chart summarizes performance unit activity under the Plan for the year ended December 31, 2009:
Equity Units
|
Number | Weighted Average Grant Date Fair Value |
Weighted Average Vesting Period in Years |
|||||||
|---|---|---|---|---|---|---|---|---|---|---|
Units oustanding at January 1 |
705,609 | $ | 24.34 | 3.0 | ||||||
Units settled |
(249,322 | ) | 25.04 | 3.0 | ||||||
Units forfeited |
(116,289 | ) | 24.11 | 3.0 | ||||||
Units outstanding at December 31 |
339,998 | 23.90 | 3.0 | |||||||
Cash Units
|
|
|
|
|||||||
|---|---|---|---|---|---|---|---|---|---|---|
Units oustanding at January 1 |
117,304 | |||||||||
Units settled |
(83,164 | ) | ||||||||
Units forfeited |
(34,140 | ) | ||||||||
Units outstanding at December 31 |
— | |||||||||
The Compensation Committee sets performance goals for each performance unit grant and depending on the extent to which these goals are met will determine the number of performance units that will be paid out to the participants. Based on performance results for 2007 through 2009 the performance units granted in 2007 are not expected to receive a payout as the minimum performance threshold was not met.
Compensation expense is recognized over the vesting period of three years, measured based on the market price of the Company's stock at the date of grant with an offsetting increase in additional paid-in capital. The expense related to the grants that will be settled in cash is based on the market price of the Company's stock as of the balance sheet date. In accordance with the terms of the performance unit grants
F-36
Sauer-Danfoss Inc. and Subsidiaries
Notes to Consolidated Financial Statements (Continued)
December 31, 2009, 2008, and 2007
(Dollars in thousands, except per share data)
(13) Long-Term Incentive Plan: (Continued)
of the previous President and CEO of the Company, who retired on January 1, 2009, the grants related to performance periods after he left the company would be paid at 100% of the performance target and therefore the expense for his 2007 and 2008 grants were fully expensed in 2008, rather than over the three year performance period.
In 2007 the Compensation Committee awarded 10,000 shares of restricted stock under the 2006 Incentive Plan. Vesting of 5,000 of the shared occurred in both 2009 and 2008. The restricted stock awards entitle the participants to full dividend and voting rights. The value of the award was established based on the market value of the stock as of the grant date.
Compensation income or expense recognized in selling, general, and administrative expenses in conjunction with the performance units and restricted stock outstanding was expense of $18 in 2009, income of $2,260 in 2008, and expense of $4,301 in 2007. The income recognized in 2008 was due to reducing the accrual related to the performance units to be settled in cash and the accrual related to the 2007 performance unit grant due to the decrease in financial performance during 2008. The tax expense recognized related to the 2008 income was $814 and tax benefits recognized related to expense was $6 and $1,555, in 2009 and 2007, respectively. The Company does not expect to recognize any additional compensation expense related to the outstanding performance units and restricted stock under these two plans.
The Company also has a Non-employee Director Stock Option and Restricted Stock Plan which permits the granting of non-qualified stock options and restricted common stock to directors of the Company who are not employees of the Company. The total number of shares of common stock to be issued under this plan shall not exceed 250,000 shares. The 2006 Incentive Plan also allows for grants of equity based shares to directors of the Company.
Under the 2006 Incentive Plan the Company awarded 13,500 shares of restricted stock in 2009 and 15,000 shares of restricted stock in 2008 to non-employee directors. Under the Non-employee Director Stock Option and Restricted Stock Plan the Company awarded 13,500 shares of restricted stock in 2007 to non-employee directors. In 2009, 3,000 shares of restricted stock were forfeited prior to being vested. The restricted stock awards entitle the participants to full dividend and voting rights. Unvested shares are restricted as to disposition and subject to forfeiture under certain circumstances. The value of each award was established based on the market value of the stock as of the grant date. The shares vest over three years. Compensation expense is computed based on the market value of the restricted shares at the grant date, which is amortized ratably over the vesting period of the grants. Compensation expense recognized in conjunction with the restricted stock outstanding to non-employee directors in 2009, 2008, and 2007 amounted to $235, $448, and $316, respectively.
(14) Related Person Transactions:
In connection with the acquisition of Danfoss Fluid Power on May 3, 2000, the Company entered into several agreements with Danfoss A/S to purchase ongoing operational services from Danfoss A/S. These services include rental of shared facilities, administrative support and information technology support. These fees are paid on a monthly basis. Total expense recognized for goods and services purchased from Danfoss A/S for 2009, 2008, and 2007 was approximately $43,800, $87,100, and $72,400, respectively. At
F-37
Sauer-Danfoss Inc. and Subsidiaries
Notes to Consolidated Financial Statements (Continued)
December 31, 2009, 2008, and 2007
(Dollars in thousands, except per share data)
(14) Related Person Transactions: (Continued)
December 31, 2009 and 2008 approximately $10,000 and $7,900 owed to Danfoss A/S is included in accounts payable on the consolidated balance sheet. Payments required under these agreements as of December 31, 2008, during the years ending 2010 though 2014 and 2015 and thereafter, are $9,321, $9,331, $9,238, $8,994, $8,994, and $23,020, respectively. The Company also sold products to Danfoss A/S totaling approximately $3,200, $6,800, and $8,000 during 2009, 2008, and 2007, respectively. At December 31, 2009 and 2008 approximately $800 and $1,500 due from Danfoss A/S is included in accounts receivable on the consolidated balance sheet.
The subsidiaries in Denmark file a joint tax return with Danfoss A/S as required under the laws of Denmark.
The Company can borrow up to $690,000 under a term loan and revolving credit facility with Danfoss A/S. Refer to Note 8 for additional discussion of the Danfoss Credit Agreement which was entered into in November 2009.
In 2008 the Company entered an Agreement for Transfer of Business and Sale of Inventory (Agreement) with Danfoss LLC, a subsidiary of Danfoss A/S. The Agreement replaced a Distribution and Service Agreement which had been in place with Danfoss A/S under which Sauer-Danfoss product had been sold in the Commonwealth of Independent States. The Company purchased primarily customer relationships and inventory in this transaction for approximately $1,200.
The Company purchases inventory components from Shanghai Hydraulics and Pneumatics, a noncontrolling interest owner in an entity included in the Company's consolidated financial statements. Purchases were approximately $4,000, $5,600, and, $4,900 in 2009, 2008, and 2007, respectively.
The Company sold product totaling approximately $2,300, $4,100 and $4,900 in 2009, 2008 and 2007, respectively, to Daikin Industries Ltd. (Daikin), a minority interest owner in an entity consolidated by the Company. The Company also purchases inventory components and ongoing operational services from Daikin. These services include shared facilities and administrative support. Total expense recognized for goods and services purchased from Daikin in 2009, 2008, and 2007 were approximately $5,200, $6,500 and $6,000, respectively.
The Company had sales to Faun Umwelttechnik GmbH & Co., a company owned by a director of the Company, of approximately $2,000, $1,000 and $1,700 in 2009, 2008 and 2007, respectively.
(15) Commitments, Contingencies, and Guarantees:
The Company leases certain facilities and equipment under operating leases, many of which contain renewal options. Total rental expense on all operating leases during 2009, 2008, and 2007 was $23,910, $26,254, and $20,477, respectively. Rent is expensed on a straight-line basis over the term of the leases.
Minimum future rental commitments under all noncancelable operating leases as of December 31, 2009, during the years ending 2010 through 2014 and for 2015 and thereafter, are $13,664, $10,474, $8,116, $7,109, $6,750, and $10,997, respectively.
The Company also leases certain facilities and equipment under capital leases. The liability related to these capital leases is included in current other accrued liabilities and other long-term liabilities on the
F-38
Sauer-Danfoss Inc. and Subsidiaries
Notes to Consolidated Financial Statements (Continued)
December 31, 2009, 2008, and 2007
(Dollars in thousands, except per share data)
(15) Commitments, Contingencies, and Guarantees: (Continued)
consolidated balance sheets. Minimum future lease payments under all noncancelable capital leases as of December 31, 2009, during the years ending 2010 through 2014 and for 2015 and thereafter, are $663, $604, $329, $33, $4, and $0, respectively.
The Company has been named as a defendant in four putative stockholder class action complaints (collectively, the Lawsuits) challenging the proposal by Danfoss Acquisition Inc., a wholly owned subsidiary of Danfoss A/S, to make a tender offer to purchase all the outstanding shares of Company common stock not presently held, directly or indirectly, by Danfoss A/S. Each of the Lawsuits was filed on behalf of the named plaintiffs and the other minority stockholders on the Company. The defendants in the Lawsuits are the Company, Danfoss A/S, Danfoss Acquisition Inc., and current and former directors of the Company. Each lawsuit is premised on allegations that the price offered in the proposed tender offer is inadequate and that the defendants have breached their fiduciary duties to the Company's stockholders in connection with the proposed tender offer. The Company believes that it has valid defenses with respect to these claims and intends to defend itself against them. The Lawsuits are all in preliminary stages, so it is not possible for the Company to predict their outcomes with any certainty.
The Company, from time to time, is involved in various legal matters considered normal in the course of its business. The Company intends to vigorously defend against all such claims. It is the Company's policy to accrue for amounts related to these matters if it is probable that a liability has been incurred and an amount can be reasonably estimated. Although the outcome of such matters cannot be predicted with certainty and no assurances can be given with respect to such matters, the Company believes that the outcome of these matters in which it is currently involved will not have a materially adverse effect on its results of operations, liquidity or financial position.
F-39
Sauer-Danfoss Inc. and Subsidiaries
Notes to Consolidated Financial Statements (Continued)
December 31, 2009, 2008, and 2007
(Dollars in thousands, except per share data)
(16) Quarterly Financial Data (Unaudited):
Summarized quarterly data is set forth in the following table:
| |
First | Second | Third | Fourth | Total | |||||||||||
|---|---|---|---|---|---|---|---|---|---|---|---|---|---|---|---|---|
2009 |
||||||||||||||||
Net sales |
$ | 349,695 | $ | 277,411 | $ | 253,074 | $ | 278,851 | $ | 1,159,031 | ||||||
Gross profit |
58,018 | 30,803 | 14,954 | 24,178 | 127,953 | |||||||||||
Net loss |
(78,406 | ) | (121,826 | ) | (70,801 | ) | (74,733 | ) | (345,766 | ) | ||||||
Basic net loss per common share |
$ | (1.62 | ) | $ | (2.52 | ) | $ | (1.46 | ) | $ | (1.55 | ) | $ | (7.15 | ) | |
Diluted net loss per common share |
$ | (1.62 | ) | $ | (2.52 | ) | $ | (1.46 | ) | $ | (1.55 | ) | $ | (7.15 | ) | |
2008 |
||||||||||||||||
Net sales |
$ | 617,399 | $ | 611,538 | $ | 490,188 | $ | 371,388 | $ | 2,090,513 | ||||||
Gross profit |
147,725 | 138,006 | 111,866 | 38,013 | 435,610 | |||||||||||
Net income (loss) |
27,863 | 22,706 | 10,901 | (90,611 | ) | (29,141 | ) | |||||||||
Basic net income (loss) per common share |
$ | 0.58 | $ | 0.47 | $ | 0.23 | $ | (1.88 | ) | $ | (0.60 | ) | ||||
Diluted net income (loss) per common share(1) |
$ | 0.57 | $ | 0.47 | $ | 0.22 | $ | (1.88 | ) | $ | (0.60 | ) | ||||
2007 |
||||||||||||||||
Net sales |
$ | 523,132 | $ | 503,472 | $ | 451,771 | $ | 494,173 | $ | 1,972,548 | ||||||
Gross profit |
124,585 | 112,295 | 94,221 | 96,601 | 427,702 | |||||||||||
Net income |
15,369 | 17,633 | 5,499 | 8,697 | 47,198 | |||||||||||
Basic net income per common share |
$ | 0.32 | $ | 0.37 | $ | 0.11 | $ | 0.18 | $ | 0.98 | ||||||
Diluted net income per common share |
$ | 0.32 | $ | 0.37 | $ | 0.11 | $ | 0.18 | $ | 0.98 | ||||||
- (1)
- Basic and diluted net income (loss) per common share is computed independently for each of the periods presented. Accordingly, the sum of the quarterly basic and diluted net income (loss) per common share may not agree to the annual total.
(17) Segment and Geographic Information:
The Company reports its operating segments around its various product lines of Propel, Work Function and Controls. Propel products include hydrostatic transmissions and related products that transmit the power from the engine to the wheel to propel a vehicle. Work Function products include steering motors as well as gear pumps and motors that transmit power for the work functions of the vehicle. Controls products include electrohydraulic controls, microprocessors, and valves that control and direct the power of a vehicle. Segment costs in Global Services relate to internal global service departments and include costs such as consulting for special projects, tax and accounting fees paid to
F-40
Sauer-Danfoss Inc. and Subsidiaries
Notes to Consolidated Financial Statements (Continued)
December 31, 2009, 2008, and 2007
(Dollars in thousands, except per share data)
(17) Segment and Geographic Information: (Continued)
outside third parties, certain insurance premiums, and amortization of intangible assets from certain business combinations.
The accounting policies of the segments are the same as those described in the summary of significant accounting policies. The Company evaluates individual segment performance based on segment income or loss defined as the respective segment's portion of the total Company's net income, excluding net interest expense, income taxes, minority interest, and equity in net earnings of affiliates.
The following table presents the significant items by operating segment for the results of operations for the years ended December 31, 2009, 2008, and 2007, respectively:
| |
Propel | Work Function |
Controls | Global Services |
Total | |||||||||||
|---|---|---|---|---|---|---|---|---|---|---|---|---|---|---|---|---|
2009 |
||||||||||||||||
Trade sales |
$ | 613,433 | $ | 274,654 | $ | 270,944 | $ | — | $ | 1,159,031 | ||||||
Segment loss |
(24 | ) | (81,932 | ) | (101,107 | ) | (23,938 | ) | (207,001 | ) | ||||||
Interest income |
1,775 | |||||||||||||||
Interest expense |
(50,171 | ) | ||||||||||||||
Loss on early retirement of debt |
(15,838 | ) | ||||||||||||||
Loss before income taxes |
(271,235 | ) | ||||||||||||||
Total assets |
404,990 | 243,947 | 197,257 | 222,123 | 1,068,317 | |||||||||||
Depreciation and amortization |
57,584 | 31,740 | 25,201 | 2,605 | 117,130 | |||||||||||
Capital expenditures |
19,336 | 14,390 | 8,670 | 576 | 42,972 | |||||||||||
2008 |
||||||||||||||||
Trade sales |
$ | 1,016,609 | $ | 561,416 | $ | 512,488 | $ | — | $ | 2,090,513 | ||||||
Segment income (loss) |
156,805 | (65,699 | ) | (21,386 | ) | (42,362 | ) | 27,358 | ||||||||
Interest income |
1,026 | |||||||||||||||
Interest expense |
(25,654 | ) | ||||||||||||||
Income before income taxes |
2,730 | |||||||||||||||
Total assets |
541,489 | 330,628 | 272,186 | 323,373 | 1,467,676 | |||||||||||
Depreciation and amortization |
48,111 | 38,411 | 23,485 | 2,955 | 112,962 | |||||||||||
Capital expenditures |
98,982 | 54,312 | 36,714 | 8,626 | 198,634 | |||||||||||
2007 |
||||||||||||||||
Trade sales |
$ | 940,692 | $ | 534,040 | $ | 497,816 | $ | — | $ | 1,972,548 | ||||||
Segment income (loss) |
146,617 | (2,886 | ) | 17,740 | (51,131 | ) | 110,340 | |||||||||
Interest income |
1,048 | |||||||||||||||
Interest expense |
(23,789 | ) | ||||||||||||||
Income before income taxes |
87,599 | |||||||||||||||
Total assets |
496,021 | 372,775 | 301,214 | 330,412 | 1,500,422 | |||||||||||
Depreciation and amortization |
43,882 | 32,987 | 20,422 | 5,012 | 102,303 | |||||||||||
Capital expenditures |
61,129 | 35,804 | 30,189 | 8,511 | 135,633 | |||||||||||
F-41
Sauer-Danfoss Inc. and Subsidiaries
Notes to Consolidated Financial Statements (Continued)
December 31, 2009, 2008, and 2007
(Dollars in thousands, except per share data)
(17) Segment and Geographic Information: (Continued)
A summary of the Company's net sales and long-lived assets by geographic area is presented below:
| |
Net Sales(1) | Long-Lived Assets(2) | |||||||||||||||
|---|---|---|---|---|---|---|---|---|---|---|---|---|---|---|---|---|---|
| |
2009 | 2008 | 2007 | 2009 | 2008 | ||||||||||||
United States |
$ | 424,680 | $ | 740,506 | $ | 744,560 | $ | 138,416 | $ | 193,144 | |||||||
Germany |
120,084 | 229,101 | 205,661 | 71,354 | 76,801 | ||||||||||||
Italy |
64,021 | 145,666 | 147,614 | 16,316 | 36,424 | ||||||||||||
Denmark(3) |
16,405 | 36,146 | 31,423 | 144,282 | 185,785 | ||||||||||||
Other countries |
533,841 | 939,094 | 843,290 | 205,606 | 228,070 | ||||||||||||
Total |
$ | 1,159,031 | $ | 2,090,513 | $ | 1,972,548 | $ | 575,974 | $ | 720,224 | |||||||
- (1)
- Net
sales are attributed to countries based on location of customer.
- (2)
- Long-lived
assets include property, plant and equipment net of accumulated depreciation, goodwill, intangible assets net of accumulated
amortization, and certain other long-lived assets.
- (3)
- Majority of this country's sales are shipped outside of the home country where the product is produced.
No single customer accounted for 10% or more of total consolidated sales in any year presented.
(18) Subsequent Events:
On December 22, 2009 Danfoss A/S, the majority stockholder of the Company, issued a press release announcing its intention, through its wholly owned subsidiary, Danfoss Acquisition, Inc., to commence a cash tender offer to be followed (in certain circumstances) by a statutory merger for the purpose of acquiring all the outstanding shares of Company common stock not already owned, directly or indirectly, by Danfoss A/S for a price of $10.10 per share. On January 15, 2010 Danfoss issued a press release announcing an indeterminate delay in launching its proposed tender offer. As of March 3, 2010 Danfoss had not commenced the proposed tender offer.
The Company has evaluated subsequent events through March 4, 2010, the date the financial statements were issued, to ensure that the Form 10-K includes appropriate disclosure of events recognized in the financial statements as of December 31, 2009, and events that occurred subsequent to December 31, 2009 but were not recognized in the financial statements.
F-42
Management Oversight
Sauer-Danfoss believes that good corporate governance promotes ethical business practices, demands meticulous accounting policies and procedures, and includes a structure with effective checks and balances. The management of Sauer-Danfoss is responsible for the integrity and objectivity of the financial information presented in this annual report on Form 10-K. Sauer-Danfoss believes that the consolidated financial statements have been prepared in conformity with accounting principles generally accepted in the United States applying certain estimates and judgments as required.
Our management is responsible for establishing and maintaining a system of internal controls over financial reporting. This system is augmented by written policies and procedures, careful selection and training of financial management personnel, a continuing management commitment to the integrity of the system, and through examinations by an internal audit function that coordinates its activities with the Company's independent auditors.
Under the supervision and with the participation of our management, including our Chief Executive Officer and Chief Financial Officer, we conducted an evaluation of the effectiveness of our internal controls over financial reporting based on the framework in Internal Control—Integrated Framework issued by the Committee of Sponsoring Organizations of the Treadway Commission (COSO). Based on our evaluation under the framework in Internal Control—Integrated Framework, our management concluded that our internal control over financial reporting was effective as of December 31, 2009.
Independent Oversight
All of our directors are skilled business leaders. The members of the Board and each committee have express authority to retain outside advisors. The Board and each committee perform annual self-evaluations in order to assess their performance and to ensure that the Board and committee structure is providing effective oversight of corporate management.
Our Audit Committee is composed entirely of independent outside directors. The Committee meets periodically with management, the internal auditors, and the independent auditors, both separately and jointly, to discuss internal accounting controls and the quality of financial reporting. To ensure complete independence, the internal auditors and representatives of KPMG LLP have full access to meet with the Audit Committee, with or without management representatives present, to discuss the results of their audits and their opinions on the adequacy of internal controls and the quality of financial reporting. The Audit Committee has the direct responsibility for the appointment of the independent registered accounting firm to be retained for the coming year, subject to stockholder approval.
Disclosure Controls
We have established rigorous procedures to ensure that we provide complete and accurate disclosure in our publicly filed documents. Our Disclosure Committee, made up of key individuals from various corporate functions, meets at least quarterly to review public filings and earnings releases, and to discuss any potential disclosure issues that may arise. We have established a "whistle-blower" hotline for employees, customers, suppliers or any stakeholder anywhere in the world to anonymously submit any concern they may have regarding corporate controls or ethical breaches. All complaints are investigated, and where necessary, concerns involving our financial statements, public disclosures or management are directed to our Audit Committee.
Code of Legal and Ethical Business Conduct
The Sauer-Danfoss Code of Legal and Ethical Business Conduct is based not just solely on what we have a right to do, but even more importantly, on what is the right thing to do. Annually, we reiterate the vital importance of our Code of Legal and Ethical Business Conduct by requiring employees in key functional areas to certify their compliance with the standards of the Code.
| SVEN RUDER President and Chief Executive Officer |
JESPER V. CHRISTENSEN Executive Vice President and Chief Financial Officer |
F-43
Report of Independent Registered Public Accounting Firm
The
Board of Directors and Shareholders
Sauer-Danfoss Inc.:
We have audited the accompanying consolidated balance sheets of Sauer-Danfoss Inc. and subsidiaries (the Company) as of December 31, 2009 and 2008, and the related consolidated statements of operations, stockholders' equity and comprehensive income (loss), and cash flows for each of the years in the three-year period ended December 31, 2009. In connection with our audits of the consolidated financial statements, we also have audited the related financial statement schedule (as listed in Part IV, Item 14 (a) 2 of this Form 10-K). We also have audited the Company's internal control over financial reporting as of December 31, 2009, based on criteria established in Internal Control—Integrated Framework issued by the Committee of Sponsoring Organizations of the Treadway Commission (COSO). The Company's management is responsible for these consolidated financial statements and financial statement schedule, for maintaining effective internal control over financial reporting, and for its assessment of the effectiveness of internal control over financial reporting, included in the accompanying Management's Report on Internal Control over Financial Reporting (as included in Part II, Item 9A). Our responsibility is to express an opinion on these consolidated financial statements and financial statement schedule and an opinion on the Company's internal control over financial reporting based on our audits.
We conducted our audits in accordance with the standards of the Public Company Accounting Oversight Board (United States). Those standards require that we plan and perform the audits to obtain reasonable assurance about whether the financial statements are free of material misstatement and whether effective internal control over financial reporting was maintained in all material respects. Our audits of the consolidated financial statements included examining, on a test basis, evidence supporting the amounts and disclosures in the financial statements, assessing the accounting principles used and significant estimates made by management, and evaluating the overall financial statement presentation. Our audit of internal control over financial reporting included obtaining an understanding of internal control over financial reporting, assessing the risk that a material weakness exists, and testing and evaluating the design and operating effectiveness of internal control based on the assessed risks. Our audits also included performing such other procedures as we considered necessary in the circumstances. We believe that our audits provide a reasonable basis for our opinions.
A company's internal control over financial reporting is a process designed to provide reasonable assurance regarding the reliability of financial reporting and the preparation of financial statements for external purposes in accordance with generally accepted accounting principles. A company's internal control over financial reporting includes those policies and procedures that (1) pertain to the maintenance of records that, in reasonable detail, accurately and fairly reflect the transactions and dispositions of the assets of the company; (2) provide reasonable assurance that transactions are recorded as necessary to permit preparation of financial statements in accordance with generally accepted accounting principles, and that receipts and expenditures of the company are being made only in accordance with authorizations of management and directors of the company; and (3) provide reasonable assurance regarding prevention or timely detection of unauthorized acquisition, use, or disposition of the company's assets that could have a material effect on the financial statements.
Because of its inherent limitations, internal control over financial reporting may not prevent or detect misstatements. Also, projections of any evaluation of effectiveness to future periods are subject to the risk that controls may become inadequate because of changes in conditions, or that the degree of compliance with the policies or procedures may deteriorate.
In our opinion, the consolidated financial statements referred to above present fairly, in all material respects, the financial position of Sauer-Danfoss Inc. and subsidiaries as of December 31, 2009 and 2008, and the results of their operations and their cash flows for each of the years in the three-year period ended
F-44
December 31, 2009, in conformity with U.S. generally accepted accounting principles. Also in our opinion, the related financial statement schedule, when considered in relation to the basic consolidated financial statements taken as a whole, presents fairly, in all material respects, the information set forth therein. Also in our opinion, the Company maintained, in all material respects, effective internal control over financial reporting as of December 31, 2009, based on criteria established in Internal Control—Integrated Framework issued by the Committee of Sponsoring Organizations of the Treadway Commission.
/s/ KPMG LLP
Des
Moines, Iowa
March 4, 2010
F-45
Schedule II
Sauer-Danfoss Inc. and Subsidiaries
Valuation and Qualifying Accounts
Years Ended December 31, 2007, 2008, and 2009
(in thousands)
| |
Balance at Beginning of Year | Charged to Costs and Expenses | Receivables Written Off/ Settlement of Claims |
Divestiture of Business | Foreign Currency Translation Adjustment | Balance at End of Year | |||||||||||||
|---|---|---|---|---|---|---|---|---|---|---|---|---|---|---|---|---|---|---|---|
For the year ended December 31, 2007 |
|||||||||||||||||||
Allowance for doubtful accounts |
$ | 5,705 | 728 | (1,219 | ) | (459 | ) | 378 | $ | 5,133 | |||||||||
For the year ended December 31, 2008 |
|||||||||||||||||||
Allowance for doubtful accounts |
$ |
5,133 |
1,394 |
(1,000 |
) |
— |
(317 |
) |
$ |
5,210 |
|||||||||
For the year ended December 31, 2009 |
|||||||||||||||||||
Allowance for doubtful accounts |
$ |
5,210 |
728 |
(860 |
) |
— |
562 |
$ |
5,640 |
||||||||||
F-46
PART I
EXECUTIVE OFFICERS OF THE COMPANY
PART II
COMPARISON OF 5-YEAR CUMULATIVE TOTAL RETURN AMONG SAUER-DANFOSS INC., RUSSELL 2000 INDEX AND HEMSCOTT GROUP INDEX
SELECTED FINANCIAL DATA
-
Item 7A. Quantitative and Qualitative Disclosures about Market Risk.
Item 8. Financial Statements and Supplementary Data.
-
Item 10. Directors, Executive Officers and Corporate Governance
Item 11. Executive Compensation
Item 12. Security Ownership of Certain Beneficial Owners and Management and Related Stockholder Matters
Item 13. Certain Relationships and Related Transactions, and Director Independence
Item 14. Principal Accountant Fees and Services
SIGNATURES
Sauer-Danfoss Inc. and Subsidiaries Consolidated Statements of Operations (Dollars in thousands, except per share data)
Sauer-Danfoss Inc. and Subsidiaries Consolidated Balance Sheets (Dollars in thousands, except per share data)
Sauer-Danfoss Inc. and Subsidiaries Consolidated Statements of Stockholders' Equity and Comprehensive Income (Loss) (Dollars in thousands, except per share data)
Sauer-Danfoss Inc. and Subsidiaries Consolidated Statements of Cash Flows (Dollars in thousands)
Sauer-Danfoss Inc. and Subsidiaries Notes to Consolidated Financial Statements December 31, 2009, 2008, and 2007 (Dollars in thousands, except per share data)
Report of Management
Report of Independent Registered Public Accounting Firm
Schedule II Sauer-Danfoss Inc. and Subsidiaries Valuation and Qualifying Accounts Years Ended December 31, 2007, 2008, and 2009 (in thousands)