Attached files
| file | filename |
|---|---|
| EX-10.9 - COMPX INTERNATIONAL INC. - 10K FOR PERIOD ENDING 12-31-2009 EXHIBIT 10.9 - COMPX INTERNATIONAL INC | cix10k12312009_exh109.htm |
| EX-23.1 - COMPX INTERNATIONAL INC. - 10K FOR PERIOD ENDING 12-31-2009 EXHIBIT 23.1 - COMPX INTERNATIONAL INC | cix110k12312009_exh231.htm |
| EX-31.2 - COMPX INTERNATIONAL INC. - 10K FOR PERIOD ENDING 12-31-2009 EXHIBIT 31.2 - COMPX INTERNATIONAL INC | cix110k12312009_exh312.htm |
| EX-21.1 - COMPX INTERNATIONAL INC. - 10K FOR PERIOD ENDING 12-31-2009 EXHIBIT 21.1 - COMPX INTERNATIONAL INC | cix110k12312009_exh211.htm |
| EX-32.1 - COMPX INTERNATIONAL INC. - 10K FOR PERIOD ENDING 12-31-2009 EXHIBIT 32.1 - COMPX INTERNATIONAL INC | cix110k12312009_exh321.htm |
| EX-10.13 - COMPX INTERNATIONAL INC. - 10K FOR PERIOD ENDING 12-31-2009 EXHIBIT 10.13 - COMPX INTERNATIONAL INC | cix110k12312009_exh1013.htm |
| EX-31.1 - COMPX INTERNATIONAL INC. - 10K FOR PERIOD ENDING 12-31-2009 EXHIBIT 31.1 - COMPX INTERNATIONAL INC | cix110k12312009_exh311.htm |
SECURITIES
AND EXCHANGE COMMISSION
Washington,
D.C. 20549
FORM
10-K
ANNUAL
REPORT PURSUANT TO SECTION 13 OR 15(d) OF THE SECURITIES
EXCHANGE
ACT OF 1934 – For the fiscal year ended December 31, 2009
Commission
file number 1-13905
|
COMPX
INTERNATIONAL INC.
|
|
(Exact
name of Registrant as specified in its
charter)
|
|
Delaware
|
57-0981653
|
|
|
(State
or other jurisdiction of
incorporation
or organization)
|
(IRS
Employer
Identification
No.)
|
|
|
5430
LBJ Freeway, Suite 1700,
Three
Lincoln Centre, Dallas, Texas
|
75240-2697
|
|
|
(Address
of principal executive offices)
|
(Zip
Code)
|
|
|
Registrant’s
telephone number, including area code
|
(972)
448-1400
|
|
|
Securities
registered pursuant to Section 12(b) of the Act:
|
||
|
Title of each class
|
Name
of each exchange
on which registered
|
|
|
Class
A common stock
($.01
par value per share)
|
New
York Stock Exchange
|
|
|
Securities
registered pursuant to Section 12(g) of the
Act: None.
|
||
Indicate
by check mark:
If the
Registrant is a well-known seasoned issuer, as defined in Rule 405 of the
Securities Act. Yes £ No
S
If the
Registrant is not required to file reports pursuant to Section 13 or Section
15(d) of the Act. Yes £ No
S
Whether
the Registrant (1) has filed all reports required to be filed by Section 13 or
15(d) of the Securities Exchange Act of 1934 during the preceding 12 months (or
for such shorter period that the Registrant was required to file such reports),
and (2) has been subject to such filing requirements for the past 90
days. Yes S No
£
Whether
the registrant has submitted electronically and posted on its corporate website,
if any, every Interactive Data File required to be submitted and posted pursuant
to Rule 405 of Regulation S-T during the preceding 12 months (or for such
shorter period that the registration was required to submit and post such file).
* Yes £ No
£
* The
registrant has not yet been phased into the interactive data
requirements.
- 1
-
If
disclosure of delinquent filers pursuant to Item 405 of Regulation S-K is not
contained herein, and will not be contained, to the best of Registrant's
knowledge, in definitive proxy or information statements incorporated by
reference in Part III of this Form 10-K or any amendment to this Form 10-K.
S
Whether
the registrant is a large accelerated filer, an accelerated filer or a
non-accelerated filer (as defined in Rule 12b-2 of the Act). Large
accelerated filer £ Accelerated
filer £ Non-accelerated
filer S Smaller
reporting company £
Whether
the Registrant is a shell Company (as defined in Rule 12b-2 of the Exchange
Act). Yes £ No
S
The
aggregate market value of the 1.3 million shares of voting stock held by
nonaffiliates of CompX International Inc. as of June 30, 2009 (the last business
day of the Registrant’s most recently completed second fiscal quarter)
approximated $7.9 million.
As of
February 25, 2010, 2,370,307 shares of Class A common stock were
outstanding.
Documents incorporated by
reference
The
information required by Part III is incorporated by reference from the
Registrant's definitive proxy statement to be filed with the Commission pursuant
to Regulation 14A not later than 120 days after the end of the fiscal year
covered by this report.
- 2
-
PART
I
ITEM
1. BUSINESS
General
CompX
International Inc. (NYSE:CIX), incorporated in Delaware in 1993, is a leading
manufacturer of security products, precision ball bearing slides and ergonomic
computer support systems used in the office furniture, transportation, postal,
tool storage, appliance and a variety of other industries. We are
also a leading manufacturer of stainless steel exhaust systems, gauges, and
throttle controls for the performance marine industry. Our products are
principally designed for use in medium to high-end product applications, where
design, quality and durability are valued by our customers.
At
December 31, 2009, (i) NL Industries, Inc. (NYSE: NL) owned 87% of our
outstanding common stock; (ii) Valhi, Inc. (NYSE: VHI) holds approximately 83%
of NL’s outstanding common stock; and (iii) subsidiaries of Contran Corporation
hold approximately 93% of Valhi's outstanding common stock. Substantially all of
Contran's outstanding voting stock is held by trusts established for the benefit
of certain children and grandchildren of Harold C. Simmons, (for which Mr.
Simmons is sole trustee) or is held by Mr. Simmons or other persons or related
companies to Mr. Simmons. Consequently, Mr. Simmons may be deemed to
control each of these companies and us.
Our
corporate offices are located at Three Lincoln Centre, 5430 LBJ Freeway, Suite
1700, Dallas, Texas 75240. Our telephone number is (972)
448-1400. We maintain a website at www.compx.com.
Unless
otherwise indicated, references in this report to “we,” “us,” or “our” refer to
CompX International Inc. and its subsidiaries taken as a whole.
Forward-Looking
Statements
This
Annual Report contains forward-looking statements within the meaning of the
Private Securities Litigation Reform Act of 1995. Statements in this Annual
Report on Form 10-K that are not historical in nature are forward-looking in
nature about our future, and are not statements of historical fact. Such
statements are found in this report, including, but not limited to, statements
found in Item 1 – "Business," Item 1A – “Risk Factors,” Item 3 - "Legal
Proceedings," Item 7 - "Management’s Discussion and Analysis of Financial
Condition and Results of Operations" and Item 7A - "Quantitative and Qualitative
Disclosures About Market Risk." These statements are forward-looking statements
that represent our beliefs and assumptions based on currently available
information. In some cases you can identify these forward-looking
statements by the use of words such as "believes," "intends," "may,"
"should," "could," "anticipates," "expects" or comparable
terminology or by discussions of strategies or trends. Although we
believe the expectations reflected in forward-looking statements are reasonable,
we do not know if these expectations will be correct. Forward-looking
statements by their nature involve substantial risks and uncertainties that
could significantly impact expected results. Actual future results
could differ materially from those predicted. Among the factors that
could cause actual future results to differ materially from those described
herein are the risks and uncertainties discussed in this Annual Report and those
described from time to time in our other filings with the SEC including, but not
limited to, the following:
|
·
|
Future
supply and demand for our products,
|
|
·
|
Changes
in our raw material and other operating costs (such as steel and energy
costs),
|
|
·
|
General
global economic and political conditions (such as changes in the level of
gross domestic product in various regions of the
world),
|
- 3
-
|
·
|
Demand
for office furniture,
|
|
·
|
Service
industry employment levels,
|
|
·
|
Demand
for high performance marine
components,
|
|
·
|
Competitive
products and prices, including competition from low-cost manufacturing
sources (such as China),
|
|
·
|
Substitute
products,
|
|
·
|
Customer
and competitor strategies,
|
|
·
|
The
introduction of trade barriers,
|
|
·
|
The
impact of pricing and production
decisions,
|
|
·
|
Fluctuations
in the value of the U.S. dollar relative to other currencies (such as the
Canadian dollar and New Taiwan
dollar),
|
|
·
|
Potential
difficulties in integrating completed or future
acquisitions,
|
|
·
|
Decisions
to sell operating assets other than in the ordinary course of
business,
|
|
·
|
Uncertainties
associated with the development of new product
features,
|
|
·
|
Environmental
matters (such as those requiring emission and discharge standards for
existing and new facilities),
|
|
·
|
Our
ability to comply with covenants contained in our revolving bank credit
facility,
|
|
·
|
The
ultimate outcome of income tax audits, tax settlement initiatives or other
tax matters,
|
|
·
|
The
impact of current or future government
regulations,
|
|
·
|
Current
and future litigation,
|
|
·
|
Possible
disruption of our business or increases in the cost of doing business
resulting from terrorist activities or global conflicts;
and
|
|
·
|
Operating
interruptions (including, but not limited to labor disputes, hazardous
chemical leaks, natural disasters, fires, explosions, unscheduled or
unplanned downtime and transportation
interruptions).
|
Should
one or more of these risks materialize or if the consequences worsen, or if the
underlying assumptions prove incorrect, actual results could differ materially
from those currently forecasted or expected. We disclaim any
intention or obligation to update or revise any forward-looking statement
whether as a result of changes in information, future events or
otherwise.
Industry
Overview
We
manufacture engineered components that are sold to a variety of industries
including office furniture, recreational transportation (including performance
boats), mailboxes, toolboxes, appliances, banking equipment, vending equipment,
computers and related equipment. Approximately 34% of our total sales
in 2009 are to the office furniture manufacturing industry, compared to 33% in
2008 and 32% in 2007. We believe that our emphasis on new product
features and sales of our products to additional markets has resulted in our
potential for higher rates of earnings growth and diversification of
risk. See also Item 6 – "Selected Financial Data" and Item 7 –
"Management's Discussion and Analysis of Financial Condition and Results of
Operations."
Business
Segments
We
currently have three operating business segments – Security Products, Furniture
Components and Marine Components. For additional information
regarding our segments, see “Part II – Item 7. Management’s Discussion and
Analysis of Financial Condition and Results of Operations” and Note 2 to our
Consolidated Financial Statements.
- 4
-
Manufacturing,
Operations, and Products
Security Products. Our Security
Products segment, with a manufacturing facility in South Carolina and one in
Illinois shared with Marine Components, manufactures locking mechanisms and
other security products for sale to the postal, transportation, office and
institutional furniture, toolbox, banking, vending, general cabinetry and other
industries. We believe we are a North American market leader in the
manufacture and sale of cabinet locks and other locking
mechanisms. Our security products are used in a variety of
applications including ignition systems, mailboxes, toolboxes, vending and
gaming machines, parking meters, electrical circuit panels, storage
compartments, office furniture and medical cabinet security. These products
include:
|
·
|
disc
tumbler locks which provide moderate security and generally represent the
lowest cost lock to produce;
|
|
·
|
pin
tumbler locking mechanisms which are more costly to produce and are used
in applications requiring higher levels of security, including our KeSet high security
system, which allows the user to change the keying on a single lock 64
times without removing the lock from its enclosure;
and
|
|
·
|
our
innovative eLock electronic locks which provide stand alone or networked
security and audit trail capability for drug storage and other valuables
through the use of a proximity card, magnetic stripe or keypad
credentials.
|
A
substantial portion of our Security Products’ sales consist of products with
specialized adaptations to an individual manufacturer’s specifications, some of
which are listed above. We also have a standardized product line
suitable for many customers, which is offered through a North American
distribution network to lock distributors and smaller original equipment
manufacturers (“OEMs”) via our STOCK LOCKS distribution
program.
Furniture
Components. Our Furniture Components segment, with facilities
in Canada, Michigan and Taiwan, manufactures a complete line of precision ball
bearing slides and ergonomic computer support systems for use in applications
such as computer related equipment, appliances, tool storage cabinets, imaging
equipment, file cabinets, desk drawers, automated teller machines and other
applications. These products include:
|
·
|
our
patented Integrated
Slide Lock which allows a file cabinet manufacturer to reduce the
possibility of multiple drawers being opened at the same
time;
|
|
·
|
our
patented adjustable Ball
Lock which reduces the risk of heavily-filled drawers, such as auto
mechanic toolboxes, from opening while in
movement;
|
|
·
|
our
Self-Closing
Slide, which is designed to assist in closing a drawer and is used
in applications such as bottom mount
freezers;
|
|
·
|
articulating
computer keyboard support arms (designed to attach to desks in the
workplace and home office environments to alleviate possible user strains
and stress and maximize usable workspace), along with our patented LeverLock keyboard arm,
which is designed to make ergonomic adjustments to the keyboard arm
easier;
|
|
·
|
CPU
storage devices which minimize adverse effects of dust and moisture on
desktop computers; and
|
|
·
|
complementary
accessories, such as ergonomic wrist rest aids, mouse pad supports and
flat screen computer monitor support
arms.
|
Marine Components. Our Marine
Components segment, with a facility in Wisconsin and a facility in Illinois
shared with Security Products, manufactures and distributes marine instruments,
hardware and accessories for performance boats. Our specialty marine
component products are high performance components designed to operate within
precise tolerances in the highly corrosive marine environment. These
products include:
- 5
-
|
·
|
original
equipment and aftermarket stainless steel exhaust headers, exhaust pipes,
mufflers and other exhaust
components;
|
|
·
|
high
performance gauges such as GPS speedometers and
tachometers;
|
|
·
|
controls,
throttles, steering wheels and other billet accessories;
and
|
|
·
|
dash
panels, LED lighting, rigging and other
accessories.
|
Our
business segments operated six manufacturing facilities at December 31, 2009
including one facility in Grayslake, Illinois that houses operations relating to
Security Products and Marine Components. For additional information,
see also “Item 2 – Properties”, including information regarding leased and
distribution-only facilities.
|
Security Products
|
Furniture Components
|
Marine Components
|
||
|
Mauldin,
SC
Grayslake,
IL
|
Kitchener,
Ontario
Byron
Center, MI
Taipei,
Taiwan
|
Neenah,
WI
Grayslake,
IL
|
Raw
Materials
Our
primary raw materials are:
|
·
|
zinc,
copper and brass (used in the Security Products segment for the
manufacture of locking mechanisms);
|
|
·
|
coiled
steel (used in the Furniture Components segment for the manufacture of
precision ball bearing slides and ergonomic computer support
systems);
|
|
·
|
stainless
steel (used in the Marine Components segment for the manufacture of
exhaust headers and pipes and other components;
and
|
|
·
|
plastic
resins (used primarily in the Furniture Components segment for injection
molded plastics employed in the manufacturing of ergonomic computer
support systems).
|
These raw
materials are purchased from several suppliers and are readily available from
numerous sources and accounted for approximately 18% of our total cost of sales
for 2009.
We
occasionally enter into raw material arrangements to mitigate the short-term
impact of future increases in raw materials that are affected by commodity
markets. While these arrangements do not necessarily commit us to a
minimum volume of purchases, they generally provide for stated unit prices based
upon achievement of specified purchase volumes. We utilize purchase
arrangements to stabilize our commodity related raw material prices provided we
meet the specified minimum monthly purchase quantities. Commodity related raw
materials purchased outside of these arrangements are sometimes subject to
unanticipated and sudden price increases. We generally seek to mitigate the
impact of fluctuations in raw material costs on our margins through improvements
in production efficiencies or other operating cost reductions. In the
event we are unable to offset raw material cost increases with other cost
reductions, it may be difficult to recover those cost increases through
increased product selling prices or raw material surcharges due to the
competitive nature of the markets served by our
products. Consequently, overall operating margins can be affected by
commodity related raw material cost pressures. Commodity market
prices are cyclical, reflecting overall economic trends and specific
developments in consuming industries.
- 6
-
Patents
and Trademarks
We hold a
number of patents relating to our component products, certain of which are
believed to be important to us and our continuing business
activity. Patents generally have a term of 20 years, and our patents
have remaining terms ranging from less than one year to 15 years at December 31,
2009. Our major trademarks and brand names include:
|
Furniture
Components
|
Security
Products
|
Marine
Components
|
||
|
CompX
Precision Slides®
|
CompX
Security Products®
|
Custom
Marine®
|
||
|
CompX
Waterloo®
|
National
Cabinet Lock®
|
Livorsi
Marine®
|
||
|
CompX
ErgonomX®
|
Fort
Lock®
|
CMI
Industrial Mufflers™
|
||
|
CompX
DurISLide®
|
Timberline®
|
Custom
Marine Stainless
|
||
|
Dynaslide®
|
Chicago
Lock®
|
Exhaust™
|
||
|
Waterloo
Furniture
|
STOCK
LOCKS®
|
The
#1 Choice in
|
||
|
Components
Limited®
|
KeSet®
|
Performance
Boating®
|
||
|
TuBar®
|
Mega
Rim™
|
|||
|
ACE
II®
|
Race
Rim™
|
|||
|
CompX
eLock®
|
CompX
Marine™
|
|||
|
Lockview®
Software
|
Sales, Marketing
and Distribution.
We sell
components directly to large OEM customers through our factory-based sales and
marketing professionals and with engineers working in concert with field
salespeople and independent manufacturers' representatives. We select
manufacturers' representatives based on special skills in certain markets or
relationships with current or potential customers.
A
significant portion of our sales are also made through
distributors. We have a significant market share of cabinet lock
sales as a result of the locksmith distribution channel. We support
our distributor sales with a line of standardized products used by the largest
segments of the marketplace. These products are packaged and merchandised for
easy availability and handling by distributors and end users. Due to
our success with the STOCK
LOCKS inventory program within the Security Products segment, similar
programs have been implemented for distributor sales of ergonomic computer
support systems within the Furniture Components segment.
In 2009,
our ten largest customers accounted for approximately 39% of our total sales;
however, no one customer accounted for sales of 10% or more in
2009. Of the 39% of total sales, 18% (7 customers) was related to
Security Products sales and 21% (7 customers) was related to Furniture
Components sales, including 4 customers for which we sell both Security Products
and Furniture Components. Overall, our customer base is diverse and
the loss of any single customer would not have a material adverse effect on our
operations.
Competition
The
markets in which we participate are highly competitive. We compete
primarily on the basis of product design, including ergonomic and aesthetic
factors, product quality and durability, price, on-time delivery, service and
technical support. We focus our efforts on the middle and high-end
segments of the market, where product design, quality, durability and service
are valued by the customer. Our Marine Components segment competes
with small domestic manufacturers and is minimally affected by foreign
competitors. Our Security Products and Furniture Components segments
compete against a number of domestic and foreign manufacturers.
- 7
-
International
Operations
We have
substantial operations and assets located outside the United States, principally
Furniture Component operations in Canada and Taiwan. The majority of
our 2009 non-U.S. sales are to customers located in Canada. These
operations are subject to, among other things, currency exchange rate
fluctuations. Our results of operations have in the past been both
favorably and unfavorably affected by fluctuations in currency exchange
rates. Political and economic uncertainties in certain of the
countries in which we operate may expose us to risk of loss. We do
not believe that there is currently any likelihood of material loss through
political or economic instability, seizure, nationalization or similar
event. We cannot predict, however, whether events of this type in the
future could have a material effect on our operations. See Item 7 -
"Management's Discussion and Analysis of Financial Condition and Results of
Operations," Item 7A – "Quantitative and Qualitative Disclosures About Market
Risk" and Note 1 to the Consolidated Financial Statements.
Regulatory
and Environmental Matters
Our
operations are subject to federal, state, local and foreign laws and regulations
relating to the use, storage, handling, generation, transportation, treatment,
emission, discharge, disposal, remediation of and exposure to hazardous and
non-hazardous substances, materials and wastes ("Environmental
Laws"). Our operations also are subject to federal, state, local and
foreign laws and regulations relating to worker health and safety. We
believe that we are in substantial compliance with all such laws and
regulations. To date, the costs of maintaining compliance with such
laws and regulations have not significantly impacted our results. We
currently do not anticipate any significant costs or expenses relating to such
matters; however, it is possible future laws and regulations may require us to
incur significant additional expenditures.
Employees
As of
December 31, 2009, we employed the following number of people:
|
United
States
|
528
|
|
Canada(1)
|
211
|
|
Taiwan
|
76
|
|
Total
|
815
|
(1) Approximately
77% of our Canadian employees are represented by a labor union covered by a
collective bargaining agreement that expires in January 2012 which provides for
wage increases from 0% to 1% over the term of the contract.
We
believe our labor relations are good at all of our facilities.
Available
Information
Our
fiscal year end is always the Sunday closest to December 31, and our operations
are reported on a 52 or 53-week fiscal year. We furnish our
stockholders with annual reports containing audited financial
statements. In addition, we file annual, quarterly and current
reports, proxy and information statements and other information with the
SEC. We also make our annual report on Form 10-K, quarterly reports
on Form 10-Q, current reports on Form 8-K and all related amendments, available
free of charge through our website at www.compx.com as soon
as reasonably practical after they have been filed with the SEC. We
also provide to anyone, without charge, copies of the documents upon written
request. Requests should be directed to the attention of the
Corporate Secretary at our address on the cover page of this Form
10-K.
- 8
-
Additional
information, including our Audit Committee Charter, our Code of Business Conduct
and Ethics and our Corporate Governance Guidelines, can also be found on our
website. Information contained on our website is not a part of this
Annual Report.
The
general public may read and copy any materials we file with the SEC at the SEC’s
Public Reference Room at 100 F. Street, NE, Washington, DC 20549. The
public may obtain information on the operation of the Public Reference Room by
calling the SEC at 1-800-SEC-0330. We are an electronic
filer. The SEC maintains an Internet website at www.sec.gov that
contains reports, proxy and information statements and other information
regarding issuers that file electronically with the SEC, including
us.
Item
1A. RISK
FACTORS
Listed
below are certain risk factors associated with us and our
businesses. In addition to the potential effect of these risk factors
discussed below, any risk factor which could result in reduced earnings or
operating losses, or reduced liquidity, could in turn adversely affect our
ability to service our liabilities or pay dividends on our common stock or
adversely affect the quoted market prices for our securities.
Many of the markets in which we
operate are mature and highly competitive resulting in pricing pressure and the
need to continuously reduce costs.
Many of
the markets we serve are highly competitive, with a number of competitors
offering similar products. We focus our efforts on the middle and
high-end segment of the market where we feel that we can compete due to the
importance of product design, quality and durability to the
customer. However, our ability to effectively compete is impacted by
a number of factors. The occurrence of any of these factors could
result in reduced earnings or operating losses.
|
·
|
Competitors
may be able to drive down prices for our products because their costs are
lower than our costs, especially those sourced from
Asia.
|
|
·
|
Competitors'
financial, technological and other resources may be greater than our
resources, which may enable them to more effectively withstand changes in
market conditions.
|
|
·
|
Competitors
may be able to respond more quickly than we can to new or emerging
technologies and changes in customer
requirements.
|
|
·
|
Consolidation
of our competitors or customers in any of the markets in which we compete
may result in reduced demand for our
products.
|
|
·
|
New
competitors could emerge by modifying their existing production facilities
to manufacture products that compete with our
products.
|
|
·
|
Our
ability to sustain a cost structure that enables us to be
cost-competitive.
|
|
·
|
Our
ability to adjust costs relative to our
pricing.
|
|
·
|
Customers
may no longer value our product design, quality or durability over lower
cost products of our competitors.
|
Sales for certain precision slides
and ergonomic products are concentrated in the office furniture industry, which
has periodically experienced significant reductions in demand that could result
in reduced earnings or operating losses.
Sales of
our products to the office furniture manufacturing industry accounted for
approximately 34%, 33% and 32% for 2009, 2008 and 2007, respectively, of our net
sales. The future growth, if any, of the office furniture industry
will be affected by a variety of macroeconomic factors, such as service industry
employment levels, corporate cash flows and non-residential commercial
construction, as well as industry factors such as corporate reengineering and
restructuring, technology demands, ergonomic, health and safety concerns and
corporate relocations. There can be no assurance that current or future economic
or industry trends will not materially and adversely affect our
business.
- 9
-
Our
failure to enter into new markets with our current businesses would result in
the continued significant impact of fluctuations in demand within the office
furniture manufacturing industry on our operating results.
In an
effort to reduce our dependence on the office furniture market for certain
products and to increase our participation in other markets, we have been
devoting resources to identify new customers and develop new applications for
those products in markets outside of the office furniture industry, such as home
appliances, toolboxes and server racks. Developing these new
applications for our products involves substantial risk and uncertainties due to
our limited experience with customers and applications in these markets as well
as facing competitors who are already established in these
markets. We may not be successful in developing new customers or
applications for our products outside of the office furniture
industry. Significant time may be required to develop new
applications and uncertainty exists as to the extent to which we will face
competition in this regard.
Our development of innovative
features for current products is critical to sustaining and growing our
sales.
Historically,
our ability to provide value-added custom engineered products that address
requirements of technology and space utilization has been a key element of our
success. We spend a significant amount of time and effort to refine,
improve and adapt our existing products for new customers and
applications. Since expenditures for these types of activities are
not considered research and development expense under accounting principles
generally accepted in the United States of America, the amount of our research
and development expenditures, which is not significant, is not indicative of the
overall effort involved in the development of new product
features. The introduction of new product features requires the
coordination of the design, manufacturing and marketing of the new product
features with current and potential customers. The ability to
coordinate these activities with current and potential customers may be affected
by factors beyond our control. While we will continue to emphasize
the introduction of innovative new product features that target
customer-specific opportunities, there can be no assurance that any new product
features we introduce will achieve the same degree of success that we have
achieved with our existing products. Introduction of new product
features typically requires us to increase production volume on a timely basis
while maintaining product quality. Manufacturers often encounter
difficulties in increasing production volumes, including delays, quality control
problems and shortages of qualified personnel or raw materials. As we
attempt to introduce new product features in the future, there can be no
assurance that we will be able to increase production volume without
encountering these or other problems, which might negatively impact our
financial condition or results of operations.
Recent
and future acquisitions could subject us to a number of operational
risks.
A key
component of our strategy is to grow and diversify our business through
acquisitions. Our ability to successfully execute this component of
our strategy entails a number of risks, including:
|
·
|
the
identification of suitable growth
opportunities;
|
|
·
|
an
inaccurate assessment of acquired liabilities that were undisclosed or not
properly disclosed;
|
|
·
|
the
entry into markets in which we may have limited or no
experience;
|
|
·
|
the
diversion of management’s attention from our core
businesses;
|
|
·
|
the
potential loss of key employees or customers of the acquired
businesses;
|
|
·
|
difficulties
in realizing projected efficiencies, synergies and cost savings;
and
|
|
·
|
an
increase in our indebtedness and a limitation in our ability to access
additional capital when needed.
|
- 10
-
Higher
costs of our raw materials may decrease our liquidity.
Certain
of the raw materials used in our products are commodities that are subject to
significant fluctuations in price in response to world-wide supply and
demand. Coiled steel is the major raw material used in the
manufacture of precision ball bearing slides and ergonomic computer support
systems. Plastic resins for injection molded plastics are also an
integral material for ergonomic computer support systems. Zinc is a
principal raw material used in the manufacture of security
products. Stainless steel tubing is the major raw material used in
the manufacture of marine exhaust systems. These raw materials are
purchased from several suppliers and are generally readily available from
numerous sources. We occasionally enter into raw material supply
arrangements to mitigate the short-term impact of future increases in raw
material costs. Materials purchased outside of these arrangements are
sometimes subject to unanticipated and sudden price increases. Should
our vendors not be able to meet their contractual obligations or should we be
otherwise unable to obtain necessary raw materials, we may incur higher costs
for raw materials or may be required to reduce production levels, either of
which may decrease our liquidity as we may be unable to offset the higher costs
with increased selling prices for our products.
Negative
worldwide economic conditions could continue to result in a decrease in our
sales and an increase in our operating costs, which could continue to adversely
affect our business and operating results.
If the
current worldwide economic downturn continues, many of our direct and indirect
customers may continue to delay or reduce their purchases of the components we
manufacture or products that utilize our components. In addition, many of our
customers rely on credit financing for their working capital needs. If the
negative conditions in the global credit markets continue to prevent our
customers' access to credit, product orders may continue to decrease which could
result in lower sales. Likewise, if our suppliers continue to face challenges in
obtaining credit, in selling their products or otherwise in operating their
businesses, they may become unable to continue to offer the materials we use to
manufacture our products. These actions could continue to result in reductions
in our sales, increased price competition and increased operating costs, which
could adversely affect our business, results of operations and financial
condition.
Negative
global economic conditions increase the risk that we could suffer unrecoverable
losses on our customers' accounts receivable which would adversely affect our
financial results.
We extend
credit and payment terms to some of our customers. Although we have an ongoing
process of evaluating our customers' financial condition, we could suffer
significant losses if a customer fails and is unable to pay us. A significant
loss of an accounts receivable would have a negative impact on our financial
results.
Global
climate change legislation could negatively impact our financial results or
limit our ability to operate our businesses.
We
operate production facilities in several countries (the United States, Canada,
and Taiwan), and we believe all of our worldwide production facilities are in
substantial compliance with applicable environmental laws. In many of the
countries in which we operate, legislation has been passed, or proposed
legislation is being considered, to limit green house gases through various
means, including emissions permits and/or energy taxes. To date the
climate change legislation in effect in the various countries in which we
operate has not had a material adverse effect on our financial results.
However, if green house gas legislation were to be enacted in one or more
countries, it could negatively impact our future results from operations through
increased costs of production, particularly as it relates to our energy
requirements. If such increased costs of production were to materialize, we may
be unable to pass price increases onto our customers to compensate for increased
production costs, which may decrease our liquidity, operating income and results
of operations.
- 11
-
ITEM
1B. UNRESOLVED STAFF
COMMENTS
None.
ITEM
2. PROPERTIES
Our
principal executive offices are located in approximately 1,000 square feet
of leased space at 5430 LBJ Freeway, Dallas,
Texas 75240. The following table sets forth the location,
size, business operating segment and general product types produced for each of
our operating facilities.
|
Facility Name
|
Business
Segment
|
Location
|
Size
(square
feet)
|
Products Produced
|
|||
|
Owned Facilities:
|
|||||||
|
Waterloo(1)
|
FC
|
Kitchener,
Ontario
|
276,000 |
Slides/ergonomic
products
|
|||
|
Durislide(1)
|
FC
|
Byron
Center, MI
|
143,000 |
Slides
|
|||
|
National
(1)
|
SP
|
Mauldin,
SC
|
198,000 |
Security
products
|
|||
|
Dynaslide(2)
|
FC
|
Taipei,
Taiwan
|
45,500 |
Slides
|
|||
|
Custom(2)
|
MC
|
Neenah,
WI
|
95,000 |
Specialty
marine products
|
|||
|
Fort,
Timberline and Livorsi(1)
|
SP/MC
|
Grayslake,
IL
|
120,000 |
Security
products/specialty marine products
|
|||
|
Leased Facilities:
|
|||||||
|
Dynaslide
|
FC
|
Taipei,
Taiwan
|
36,000 |
Slides
|
|||
|
Dynaslide
|
FC
|
Taipei,
Taiwan
|
22,000 |
Slides
|
|||
|
Distribution
Center
|
SP/FC/MC
|
Rancho
Cucamonga, CA
|
12,000 |
Product
distribution
|
|||
FC –
Furniture Components business segment
SP –
Security Products business segment
MC –
Marine Components business segment
(1) ISO-9001
registered facilities
(2) ISO-9002
registered facilities
We
believe all of our facilities are well maintained and satisfactory for their
intended purposes.
ITEM
3. LEGAL
PROCEEDINGS
We are
involved, from time to time, in various environmental, contractual, product
liability, patent (or intellectual property) and other claims and disputes
incidental to our business. See Note 12 to the Consolidated Financial
Statements. While we currently believe that the disposition of all
claims and disputes, individually or in the aggregate, should not have a
material adverse effect on our consolidated financial condition, results of
operations or liquidity, we expect to incur costs defending against such claims
during the short-term that are likely to be material.
ITEM
4. RESERVED
- 12
-
PART
II
ITEM
5. MARKET
FOR REGISTRANT'S COMMON EQUITY AND RELATED STOCKHOLDER
MATTERS
Common Stock and
Dividends. Our Class A common stock is listed and traded on the New York
Stock Exchange (symbol: CIX). As of February 25, 2010, there were
approximately 15 holders of record of CompX Class A common stock. The
following table sets forth the high and low closing sales prices per share for
our Class A common stock for the periods indicated, according to Bloomberg, and
dividends paid during each period. On February 25, 2010, the closing
price per share of our Class A common stock was $8.26.
|
High
|
Low
|
Dividends
paid
|
||||||||||
|
Year
ended December 31, 2008
|
||||||||||||
|
First
Quarter
|
$ | 14.62 | $ | 8.07 | $ | .125 | ||||||
|
Second
Quarter
|
9.20 | 5.01 | .125 | |||||||||
|
Third
Quarter
|
7.70 | 5.02 | .125 | |||||||||
|
Fourth
Quarter
|
7.53 | 4.76 | .125 | |||||||||
|
Year
ended December 31, 2009
|
||||||||||||
|
First
Quarter
|
$ | 5.82 | $ | 4.70 | $ | .125 | ||||||
|
Second
Quarter
|
6.53 | 4.82 | .125 | |||||||||
|
Third
Quarter
|
8.03 | 5.50 | .125 | |||||||||
|
Fourth
Quarter
|
8.00 | 6.80 | .125 | |||||||||
|
January 1, 2010 through
February 25, 2010
|
$ | 8.26 | $ | 7.19 | $ | - | ||||||
We paid
regular quarterly dividends of $.125 per share during 2008 and
2009. In February of 2010, our board of directors declared a first
quarter 2010 dividend of $.125 per share, to be paid on March 23, 2010 to CompX
shareholders of record as of March 10, 2010. However, declaration and
payment of future dividends and the amount thereof, if any, is discretionary and
is dependent upon our results of operations, financial condition, cash
requirements for our businesses, contractual requirements and restrictions and
other factors deemed relevant by our board of directors. The amount
and timing of past dividends is not necessarily indicative of the amount or
timing of any future dividends which we might pay. In this regard,
our revolving bank credit facility places certain restrictions on the payment of
dividends. We are limited to (i) a $.125 per share quarterly
dividend, not to exceed $8.0 million in any calendar year, plus (ii) $20.0
million plus 50% of net income since September 30, 2008 over the term of the
credit facility.
- 13
-
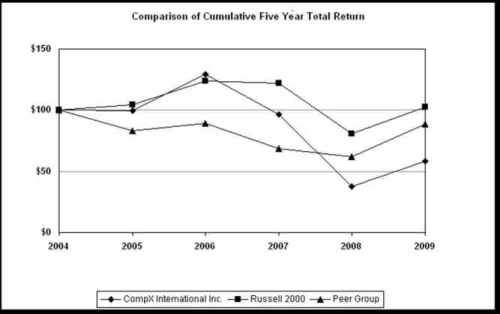
Performance
Graph. Set forth below is a line graph comparing the yearly
change in our cumulative total stockholder returns on our Class A common stock
against the cumulative total return of the Russell 2000 Index and an index of a
self-selected peer group of companies for the period from December 31, 2004
through December 31, 2009. The peer group index is comprised of The
Eastern Company and Leggett & Platt Inc. The graph shows the
value at December 31 of each year assuming an original investment of $100 at
December 31, 2004 and reinvestment of dividends.
|
December
31,
|
||||||||||||||||||||||||
|
2004
|
2005
|
2006
|
2007
|
2008
|
2009
|
|||||||||||||||||||
|
CompX
International Inc.
|
$ | 100 | $ | 99 | $ | 129 | $ | 97 | $ | 38 | $ | 58 | ||||||||||||
|
Russell
2000 Index
|
100 | 105 | 124 | 122 | 81 | 103 | ||||||||||||||||||
|
Peer
Group
|
100 | 83 | 90 | 68 | 62 | 89 | ||||||||||||||||||
Equity
compensation plan information. We have an equity compensation
plan, approved by our stockholders, which provides for the discretionary grant
to our employees and directors of, among other things, options to purchase our
Class A common stock and stock awards. As of December 31, 2009, there
were 81,000 options outstanding to purchase an equivalent number of shares of
our Class A common stock, and approximately 922,820 shares of our Class A common
stock were available for future grant or issuance. We do not have any
equity compensation plans that were not approved by our
stockholders. See Note 8 to the Consolidated Financial
Statements.
Treasury Stock
Purchases. Our board of directors
has previously authorized the repurchase of our Class A common stock in open
market transactions, including block purchases, or in privately-negotiated
transactions at unspecified prices and over an unspecified period of time, which
may include transactions with our affiliates. We may repurchase our
common stock from time to time as market conditions permit. The stock
repurchase program does not include specific price targets or timetables and may
be suspended at any time. Depending on market conditions, we may
terminate the program prior to its completion. We will use cash on
hand to acquire the shares. Repurchased shares will be added to our
treasury and cancelled. We did not purchase any shares of our common stock
during the fourth quarter of 2009. See Note 8 to the Consolidated Financial
Statements.
- 14
-
ITEM
6. SELECTED
FINANCIAL DATA
The
following selected financial data should be read in conjunction with our
Consolidated Financial Statements and Item 7 - "Management's Discussion and
Analysis of Financial Condition and Results of Operations."
Our
fiscal year end is always the Sunday closest to December 31, and our operations
are reported on a 52 or 53-week fiscal year. 2009 was a 53-week year,
all other years shown are 52-week years.
|
Years ended December 31,
|
||||||||||||||||||||
|
2005
|
2006
|
2007
|
2008
|
2009
|
||||||||||||||||
|
($
in millions, except per share data)
|
||||||||||||||||||||
|
Statements
of Operations Data:
|
||||||||||||||||||||
|
Net
sales
|
$ | 186.3 | $ | 190.1 | $ | 177.7 | $ | 165.5 | $ | 116.1 | ||||||||||
|
Gross
margin
|
43.8 | 46.5 | 45.2 | 40.3 | 23.8 | |||||||||||||||
|
Operating
income (loss)
|
19.1 | 20.3 | 15.6 | 6.2 | (1) | (4.0 | ) | |||||||||||||
|
Provision
(benefit) for income
taxes
|
18.6 | 9.7 | 6.9 | 7.2 | (3.1 | ) | ||||||||||||||
|
Income
(loss) from continuing operations
|
$ | 0.9 | $ | 11.7 | $ | 9.0 | $ | (3.1 | ) | $ | (2.0 | ) | ||||||||
|
Discontinued
operations
|
(0.5 | ) | - | - | - | - | ||||||||||||||
|
Net
income (loss)
|
$ | 0.4 | $ | 11.7 | $ | 9.0 | $ | (3.1 | ) | $ | (2.0 | ) | ||||||||
|
Diluted
Earnings Per Share Data:
|
||||||||||||||||||||
|
Income
(loss) from:
|
||||||||||||||||||||
|
Continuing
operations
|
$ | .06 | $ | .76 | $ | .61 | $ | (.25 | ) | $ | (.16 | ) | ||||||||
|
Discontinued
operations
|
(.03 | ) | - | - | - | - | ||||||||||||||
| $ | .03 | $ | .76 | $ | .61 | $ | (.25 | ) | $ | (.16 | ) | |||||||||
|
Cash
dividends
|
$ | .50 | $ | .50 | $ | .50 | $ | .50 | $ | .50 | ||||||||||
|
Weighted
average common shares outstanding
|
15.2 | 15.3 | 14.8 | 12.4 | 12.4 | |||||||||||||||
|
Balance
Sheet Data (at year end):
|
||||||||||||||||||||
|
Cash
and other current assets
|
$ | 80.8 | $ | 76.2 | $ | 68.2 | $ | 59.5 | $ | 55.1 | ||||||||||
|
Total
assets
|
188.6 | 192.0 | 187.7 | 163.4 | 154.0 | |||||||||||||||
|
Current
liabilities
|
20.3 | 17.8 | 18.9 | 17.0 | 14.6 | |||||||||||||||
|
Long-term
debt and note payable to affiliate, including current
maturities
|
1.6 | - | 50.0 | 43.0 | 42.2 | |||||||||||||||
|
Stockholders'
equity
|
150.1 | 153.7 | 104.1 | 91.3 | 85.0 | |||||||||||||||
|
Statements
of Cash Flow Data:
|
||||||||||||||||||||
|
Cash
provided by (used in):
|
||||||||||||||||||||
|
Operating
activities
|
$ | 20.0 | $ | 27.4 | $ | 11.9 | $ | 15.7 | $ | 15.3 | ||||||||||
|
Investing
activities
|
(3.7 | ) | (19.3 | ) | (12.4 | ) | (5.1 | ) | (2.1 | ) | ||||||||||
|
Financing
activities
|
(7.2 | ) | (8.8 | ) | (11.7 | ) | (14.2 | ) | (7.1 | ) | ||||||||||
(1)
Includes a $9.9 million goodwill impairment charge related to our Marine
Components Segment. See Note 4 to our Consolidated Financial
Statements.
- 15
-
ITEM
7. MANAGEMENT'S
DISCUSSION AND ANALYSIS OF FINANCIAL CONDITION AND RESULTS OF
OPERATIONS
Business
Overview
We are a
leading manufacturer of engineered components utilized in a variety of
applications and industries. Through our Security Products Segment we
manufacture mechanical and electrical cabinet locks and other locking mechanisms
used in postal, office and institutional furniture, transportation, vending,
tool storage and other general cabinetry applications. Our Furniture
Components Segment manufacturers precision ball bearing slides and ergonomic
computer support systems used in office and institutional furniture, home
appliances, tool storage and a variety of other applications. We also
manufacture stainless steel exhaust systems, gauges and throttle controls for
the performance boat industry through our Marine Components
Segment.
The
economic slow down that had negatively affected our 2008 results became even
more severe in 2009, resulting in a 30% decrease in sales from
2008. In response, we quickly reduced costs to the extent possible
while continuing to focus on gaining new customers, expanding into new markets
and enhancing the product offerings in each of our segments.
Operating
Income Overview
We
reported an operating loss of $4.0 million in 2009 compared to operating income
of $6.2 million in 2008 and $15.6 million in 2007. Our 2008 results
include a $9.9 million goodwill impairment charge related to our Marine
Components unit. See Note 4 to the Consolidated Financial
Statements.
The 2008
goodwill impairment charge had no impact on our liquidity, cash flows from
operating activities, or debt covenant compliance, and does not have any impact
on future operations. In an effort to provide investors with
additional information regarding our results of operations as determined by
accounting principles generally accepted in the United States of America
(“GAAP”), we have disclosed below our operating income, excluding the impact of
the goodwill impairment charge, which is a non-GAAP measure that is used by our
management to assess the performance of our operations. We believe
the disclosure of operating income, exclusive of the goodwill impairment charge,
provides useful information to investors because it allows investors to analyze
the performance of our operations in the same way that our management assesses
performance.
|
Year
Ended
December 31, 2008
|
||||
|
(Dollars
in thousands)
|
||||
|
Operating
income (GAAP)
|
$ | 6,186 | ||
|
Goodwill
impairment charge
|
9,881 | |||
|
Operating
income excluding goodwill impairment charge
(Non-GAAP)
|
$ | 16,067 | ||
We
reported an operating loss of $4.0 million in 2009 compared to operating income
of $16.1 million in 2008, excluding the 2008 goodwill impairment
charge. The change in operating income is primarily due
to
|
·
|
the
negative effects of lower order rates from our customers as a result of
unfavorable economic conditions in North
America,
|
|
·
|
reduced
coverage of overhead and fixed manufacturing costs from the resulting
under-utilization of production
capacity,
|
|
·
|
legal
expense associated with certain patent related litigation,
and
|
|
·
|
a
write-down on assets held for sale.
|
- 16
-
These
items were partially offset by the positive effects of cost reductions
implemented in response to lower sales.
Excluding
the goodwill impairment charge, our operating income was $16.1 million in 2008
compared to $15.6 million in 2007, although 2007 operating income was impacted
by $2.7 million in facility consolidation costs. The change in
operating income compared to 2007, excluding the 2008 goodwill impairment
charge, was primarily the net result of lower order rates from many of our
customers due to unfavorable economic conditions in North America and increased
raw material costs, offset by the favorable comparative impact of facility
consolidation costs incurred in 2007, the continuation of cost reductions
throughout 2008 and a $1.3 million favorable comparative impact in foreign
currency transaction gains and losses.
Results
of Operations - 2009 Compared to 2008 and 2008 Compared to 2007
|
Years ended December 31,
|
%Change
|
|||||||||||||||||||
|
2007
|
2008
|
2009
|
2007-08 | 2008-09 | ||||||||||||||||
|
(Dollars
in millions)
|
||||||||||||||||||||
|
Net
sales
|
$ | 177.7 | $ | 165.5 | $ | 116.1 | (7 | %) | (30 | %) | ||||||||||
|
Cost
of goods sold
|
132.5 | 125.2 | 92.3 | (6 | %) | (26 | %) | |||||||||||||
|
Gross
margin
|
45.2 | 40.3 | 23.8 | (11 | %) | (41 | %) | |||||||||||||
|
Operating
costs and expenses
|
29.6 | 24.2 | 22.5 | (18 | %) | (7 | %) | |||||||||||||
|
Goodwill
impairment
|
- | 9.9 | - |
n.m.
|
n.m.
|
|||||||||||||||
|
Legal
expenses
|
- | - | 4.6 | - |
n.m.
|
|||||||||||||||
|
Asset
held for sale write-down
|
- | - | 0.7 | - |
n.m.
|
|||||||||||||||
|
Operating
income (loss)
|
$ | 15.6 | $ | 6.2 | $ | (4.0 | ) | (60 | %) | (165 | %) | |||||||||
|
Percent
of net sales:
|
||||||||||||||||||||
|
Cost
of goods sold
|
75 | % | 76 | % | 80 | % | ||||||||||||||
|
Gross
margin
|
25 | % | 24 | % | 20 | % | ||||||||||||||
|
Operating
costs and expenses
|
17 | % | 15 | % | 19 | % | ||||||||||||||
|
Goodwill
impairment
|
- | 6 | % | - | ||||||||||||||||
|
Legal
expenses
|
- | - | 4 | % | ||||||||||||||||
|
Asset held
for sale write-down
|
- | - | 1 | % | ||||||||||||||||
|
Operating
income (loss)
|
9 | % | 4 | % | (3 | %) | ||||||||||||||
|
n.m.
- not meaningful
|
||||||||||||||||||||
Net Sales. Net
sales decreased approximately $49.4 million in 2009 as compared to 2008
principally due to lower order rates from our customers resulting from
unfavorable economic conditions in North America. Our Furniture
Components, Security Products and Marine Components segments accounted for
approximately 57%, 32% and 11%, respectively, of the total decrease in sales
year over year. Furniture Components sales was a greater percentage of the total
decrease due to Furniture Components’ greater reliance on sales to a small
number of original equipment manufacturers in a few markets such as office
furniture, tool storage and appliances that were more severely impacted by the
economic slow down compared to the greater diversification of Security Products
customers and markets which more closely matched the overall decline in the
economy. The Marine Segment accounted for a smaller percentage of the
total decrease due to the smaller sales volume associated with that
segment.
Net sales
decreased in 2008 as compared to 2007 principally due to lower order rates from
many of our customers resulting from unfavorable economic conditions in North
America, offset in part by the effect of sales price increases for certain
products to mitigate the effect of higher raw material costs. Our Furniture
Components, Marine Components, and Security Products segments accounted for
approximately 41%, 35%, and 24%, respectively, of the total decrease in sales
year over year.
- 17
-
Costs of Goods Sold and Gross
Margin. Cost of goods sold decreased from 2008 to 2009
primarily due to decreased sales volumes. As a percentage of sales,
gross margin decreased in 2009 from the prior year. The decrease in
gross margin percentage is primarily due to reduced coverage of overhead and
fixed manufacturing costs from lower sales volume and the related
under-utilization of capacity, partially offset by a net $4.8 million in fixed
manufacturing cost reductions implemented in response to lower
sales.
Cost of
goods sold decreased from 2007 to 2008 primarily due to decreased sales
volumes. As a percentage of sales, gross margin decreased slightly in
2008 from the prior year. The slight decrease in gross margin
percentage was due to the net impact of a number of factors including lower
facility utilization rates relating to the decrease in sales, lower depreciation
expense resulting from lower capital requirements relating to lower sales and
minor increases in variable production costs not fully offset by price
increases.
Operating Costs and
Expenses. Operating costs and expenses consists primarily of
salaries, commissions and advertising expenses directly related to product sales
and administrative costs relating to business unit and corporate management
activities. While operating cost and expenses were reduced by $1.7
million from 2008 to 2009 in response to lower sales, it increased as a
percentage of net sales due to the significant reduction in sales
volumes.
As a
percentage of net sales, operating costs and expenses decreased from 2007 to
2008 primarily as a result of $2.7 million of costs recorded in 2007 related to
the consolidation of three of our northern Illinois facilities into one facility
(see Note 9 to the Consolidated Financial Statements) and a $1.8 million
favorable change in currency gains and losses.
Goodwill
Impairment. In 2008, we recorded a goodwill impairment charge
of $9.9 million for our Marine Components reporting unit. See Note 4
to the Consolidated Financial Statements.
Legal Expenses. In
2009, we recorded $4.6 million of patent litigation expenses relating to
Furniture Components. See Note 12 to the Consolidated Financial
Statements.
Assets Held for Sale
Write-down. In 2009, we recorded a write-down on assets held
for sale of $717,000 relating to certain facilities held for sale that are no
longer in use. See Note 9 to the Consolidated Financial
Statements.
Operating
Income. Excluding the 2008 goodwill impairment charge
discussed above, the comparison of operating income for 2009 to 2008 was
primarily impacted by:
|
·
|
a
negative impact of approximately $21.2 million relating to lower order
rates from many of our customers resulting from unfavorable economic
conditions in North America,
|
|
·
|
approximately
$4.6 million of patent litigation expenses relating to Furniture
Components, and
|
|
·
|
a
write-down on assets held for sale of approximately
$717,000.
|
The above
decreases were primarily offset by:
|
·
|
a
$3.8 million reduction in fixed manufacturing expenses (excluding
depreciation) in response to the lower sales
volume,
|
|
·
|
a
$1.7 million reduction in lower operating costs and expenses in response
to the lower sales volume, and
|
|
·
|
$900,000
in lower depreciation expense in 2009 due to a reduction in capital
expenditures for shorter lived assets over the last several years in
response to lower sales.
|
- 18
-
Excluding
the 2008 goodwill impairment charge, the comparison of operating income for 2008
to 2007 was primarily impacted by:
|
·
|
a
negative impact of approximately $5.4 million relating to lower order
rates from many of our customers resulting from unfavorable economic
conditions in North America, and
|
|
·
|
increased
raw material costs that we were not able to fully recover through sales
price increases by approximately $1.0 million due to the competitive
nature of the markets we serve.
|
The above
decreases were primarily offset by:
|
·
|
the
one-time $2.7 million of facility consolidation costs incurred in
2007,
|
|
·
|
$1.8
million in lower depreciation expense in 2008 due to a reduction in
capital expenditures for shorter lived assets over the last several years
in response to lower sales, and
|
|
·
|
the
$1.3 million favorable effect on operating income of changes in foreign
currency exchange rates.
|
Currency. Our
Furniture Components segment has substantial operations and assets located
outside the United States (in Canada and Taiwan). The majority of
sales generated from our non-U.S. operations are denominated in the U.S. dollar
with the remainder denominated in other currencies, principally the Canadian
dollar and the New Taiwan dollar. Most raw materials, labor and other
production costs for our non-U.S. operations are denominated primarily in local
currencies. Consequently, the translated U.S. dollar values of our
non-U.S. sales and operating results are subject to currency exchange rate
fluctuations which may favorably or unfavorably impact reported earnings and may
affect comparability of period-to-period operating results. In
addition to the impact of the translation of sales and expenses over time, our
non-U.S. operations also generate currency transaction gains and losses which
primarily relate to the difference between the currency exchange rates in effect
when non-local currency sales or operating costs are initially
accrued and when such amounts are settled with the non-local
currency.
Overall,
fluctuations in currency exchange rates had the following effects on our
Furniture Component segment’s net sales and operating
income:
|
Impact of changes in currency exchange
rates - 2008 vs 2009 (in thousands)
|
||||||||||||||||||||
|
Transaction
gains/(losses)
|
Translation
gain/loss-
impact
of rate
|
Total
currency impact
|
||||||||||||||||||
|
2008
|
2009
|
Change
|
changes
|
2008 vs 2009
|
||||||||||||||||
|
Impact
on:
|
||||||||||||||||||||
|
Net
Sales
|
$ | - | $ | - | $ | - | $ | (848 | ) | $ | (848 | ) | ||||||||
|
Operating
income
|
679 | (236 | ) | (915 | ) | 907 | (8 | ) | ||||||||||||
|
Impact of changes in currency exchange rates -
2007 vs 2008 (in thousands)
|
||||||||||||||||||||
|
Transaction gains/(losses)
|
Translation
gain/loss-
impact
of rate
|
Total
currency impact
|
||||||||||||||||||
|
2007
|
2008
|
Change
|
changes
|
2007 vs 2008
|
||||||||||||||||
|
Impact
on:
|
||||||||||||||||||||
|
Net
Sales
|
$ | - | $ | - | $ | - | $ | 406 | $ | 406 | ||||||||||
|
Operating
income
|
(1,085 | ) | 679 | 1,764 | (460 | ) | 1,304 | |||||||||||||
- 19
-
The net
impact on operations of changes in currency rates from 2008 to 2009 was not
significant. The positive impact on operating income for the 2007
versus 2008 comparison is due to transactional currency exchange gains in 2008
as compared to losses in 2007 which were a function of the timing of currency
exchange rate changes and the settlement of non-local currency receivables and
payables.
General
Our
profitability primarily depends on our ability to utilize our production
capacity effectively, which is affected by, among other things, the demand for
our products and our ability to control our manufacturing costs, primarily
comprised of labor costs and materials. The materials used in our
products consist of purchased components and raw materials some of which are
subject to fluctuations in the commodity markets such as zinc, copper, plastic
resin, coiled steel and stainless steel. Total material costs represent
approximately 44% of our cost of sales in 2009, with commodity related raw
materials accounting for approximately 18% of our cost of
sales. During 2007 and most of 2008, worldwide raw material costs
increased significantly and then declined in 2009. We occasionally
enter into commodity related raw material supply arrangements to mitigate the
short-term impact of future increases in commodity related raw material
costs. While these arrangements do not necessarily commit us to a
minimum volume of purchases, they generally provide for stated unit prices based
upon achievement of specified volume purchase levels. This allows us to
stabilize commodity related raw material purchase prices to a certain extent,
provided the specified minimum monthly purchase quantities are met. We enter
into such arrangements for zinc and coiled steel. While commodity
related raw material purchase prices stabilized to a certain extent in 2009, it
is uncertain whether the current prices will remain near the current levels
during 2010. Materials purchased on the spot market are sometimes
subject to unanticipated and sudden price increases. We generally
seek to mitigate the impact of fluctuations in raw material costs on our margins
through improvements in production efficiencies or other operating cost
reductions. In the event we are unable to offset raw material cost
increases with other cost reductions, it may be difficult to recover those cost
increases through increased product selling prices or raw material surcharges
due to the competitive nature of the markets served by our
products. Consequently, overall operating margins may be affected by
raw material cost pressures.
Other
non-operating income, net
As
summarized in Note 10 to the Consolidated Financial Statements, “other
non-operating income, net” primarily includes interest
income. Interest income decreased approximately $350,000 in 2009
compared to 2008 and decreased $900,000 in 2008 compared to 2007 due to lower
interest rates on lower invested cash balances.
Interest expense
Interest
expense decreased approximately $1.3 million in 2009 compared to 2008 as the
result of a lower interest rate on the outstanding principal amount of our note
payable to affiliate (5.05% at December 31, 2008 as compared to 1.25% at
December 31, 2009). Interest expense increased approximately $1.6
million in 2008 compared to 2007 as a result of financing the October 2007
repurchase and/or cancellation of a net 2.7 million shares of our Class A common
stock from an affiliate with a promissory note. See Note 11 to the
Consolidated Financial Statements. We expect 2010 interest expense to
be comparable to 2009.
Provision
for income taxes
As a
member of the Contran Tax Group, we compute our provision for income taxes on a
separate company basis, using the tax elections made by Contran. One
such election is whether to claim a deduction or a tax credit against U.S.
taxable income with respect to foreign income taxes paid. Consistent with
elections of the Contran Tax Group, in the last three years we did not claim a
credit with respect to foreign income taxes paid but instead we claimed a tax
deduction for related withholding taxes. This resulted in an increase
in our effective income tax rate.
- 20
-
Excluding
the 2008 goodwill impairment charge, our effective income tax rate increased
from 51% in 2008 to 61% in 2009 and increased from 44% in 2007 to 51% in 2008.
The increases in our effective income tax rates over the three year period are
primarily due to a higher percentage of our results being sourced from Canada
and as noted above, the taxes on these results are not claimed as a credit on
our U.S. tax return. We currently expect our effective income tax
rate for 2010 will be lower than our effective rate for 2009.
Segment
Results
The key
performance indicator for our segments is the level of their operating income
(see discussion below). For additional information regarding our
segments refer to Note 2 to the Consolidated Financial Statements.
|
Years ended December 31,
|
% Change
|
|||||||||||||||||||
|
2007
|
2008
|
2009
|
2007 – 2008 | 2008 – 2009 | ||||||||||||||||
|
(In
millions)
|
||||||||||||||||||||
|
Net
sales:
|
||||||||||||||||||||
|
Security
Products
|
$ | 80.1 | $ | 77.1 | $ | 61.4 | (4 | %) | (20 | %) | ||||||||||
|
Furniture
Components
|
81.3 | 76.4 | 48.2 | (6 | %) | (37 | %) | |||||||||||||
|
Marine
Components
|
16.3 | 12.0 | 6.5 | (26 | %) | (46 | %) | |||||||||||||
|
Total
net sales
|
$ | 177.7 | $ | 165.5 | $ | 116.1 | (7 | %) | (30 | %) | ||||||||||
|
Gross
margin:
|
||||||||||||||||||||
|
Security
Products
|
$ | 24.1 | $ | 21.7 | $ | 17.8 | (10 | %) | (18 | %) | ||||||||||
|
Furniture
Components
|
16.7 | 16.1 | 6.5 | (4 | %) | (60 | %) | |||||||||||||
|
Marine
Components
|
4.4 | 2.5 | (0.5 | ) | (43 | %) | (120 | %) | ||||||||||||
|
Total
gross margin
|
$ | 45.2 | $ | 40.3 | $ | 23.8 | (11 | %) | (41 | %) | ||||||||||
|
Operating
income (loss):
|
||||||||||||||||||||
|
Security
Products
|
$ | 12.2 | $ | 12.7 | $ | 9.7 | 4 | % | (24 | %) | ||||||||||
|
Furniture
Components
|
8.0 | 9.2 | (4.7 | ) | 15 | % | (151 | %) | ||||||||||||
|
Marine
Components
|
0.8 | (10.4 | ) | (3.0 | ) |
n.m.
|
71 | % | ||||||||||||
|
Corporate
operating expenses
|
(5.4 | ) | (5.3 | ) | (6.0 | ) | (2 | %) | (13 | %) | ||||||||||
|
Total
operating income (loss)
|
$ | 15.6 | $ | 6.2 | $ | (4.0 | ) | (60 | %) | (165 | %) | |||||||||
|
Operating
income margin:
|
||||||||||||||||||||
|
Security
Products
|
15 | % | 16 | % | 16 | % | ||||||||||||||
|
Furniture
Components
|
10 | % | 12 | % | (10 | %) | ||||||||||||||
|
Marine
Components
|
5 | % | (87 | %) | (46 | %) | ||||||||||||||
|
Total
operating income margin
|
9 | % | 4 | % | (3 | %) | ||||||||||||||
|
n.m.
- not meaningful
|
||||||||||||||||||||
Security
Products. Security Products net sales decreased 20% to $61.4
million in 2009 compared to $77.1 million in 2008. The decrease in
sales is primarily due to lower customer order rates from most of our customers
resulting from unfavorable economic conditions in North
America. Gross margin percentage increased slightly (less than 1%) in
2009 compared to 2008 and operating income percentage was comparable at 16% for
the same periods. The comparable gross margin and operating income percentages
were achieved despite the significant decrease in sales due to the positive
impact of (i) a $2.1 million reduction in fixed manufacturing costs implemented
in response to lower sales, (ii) a $1.6 million improvement in variable
contribution margin through a combination of sales price increases implemented
at the beginning of 2009 in response to cost increases experienced in 2008 and a
more favorable product mix and (iii) a $900,000 reduction in selling, general
and administrative costs in response to lower sales which were partially offset
by reduced fixed costs coverage from lower sales and the related
under-utilization of capacity.
- 21
-
Security
Products net sales decreased 4% to $77.1 million in 2008 compared to $80.1
million in 2007. The decrease in sales is primarily due to lower
order rates from many of our customers resulting from unfavorable economic
conditions in North America, offset in part by the effect of sales price
increases for certain products to mitigate the effect of higher raw material
costs. As a percentage of sales, gross margin decreased in 2008
compared to 2007 primarily due to increased raw material costs that were not
fully recovered through price increases by $1.5 million. Operating
income percentage increased slightly in 2008 primarily as a result of $2.7
million of costs incurred in 2007 related to the consolidation of two of our
northern Illinois Security Products facilities shared with a Marine Components
operation.
Furniture
Components. Furniture Components net sales decreased 37% to
$48.2 million in 2009 from $76.4 million in 2008, primarily due
to lower order rates from most of our customers resulting from unfavorable
economic conditions in North America. Gross margin percentage
decreased approximately 8% in 2009 compared to 2008. Operating income
decreased to a loss of $4.7 million in 2009 as compared to income of $9.2
million in 2008. The decreases in the gross margin percentage and
operating income are primarily the result of approximately $2.3 million in
reduced fixed manufacturing cost coverage from lower sales and the related
under-utilization of capacity combined with approximately $4.6 million of patent
litigation expenses recorded in selling, general and administrative expense
partially offset by reduced fixed manufacturing costs of approximately $2.4
million and reduced selling, general and administrative expenses of
approximately $1.2 million in response to lower sales. See Note 12 to
the Consolidated Financial Statements.
Furniture
Components net sales decreased 6% to $76.4 million in 2008 from $81.3
million in 2007,
primarily due to lower order rates from many of our customers resulting from
unfavorable economic conditions in North America, offset in part by the effect
of sales price increases for certain products to mitigate the effect of higher
raw material costs. Gross margin percentage was comparable year over
year. Operating income percentage increased in 2008 compared to 2007
primarily due to a $1.3 million favorable change in the effect of currency
exchange rates.
Marine
Components. Marine Components net sales decreased 46% in 2009
as compared to 2008 primarily due to a dramatic overall downturn in the marine
industry. Gross margin decreased to a loss in 2009 as compared to
2008. The 2008 operating loss for the Marine Components segment
includes a goodwill impairment charge of approximately $9.9
million. Excluding the goodwill impairment charge, our operating loss
increased approximately $2.5 million in 2009 as compared to 2008. The
decrease in gross margin and increase in operating loss are the result of
reduced coverage of fixed costs from lower sales volume, partially offset by
reduced fixed manufacturing costs of approximately $270,000 and reduced selling,
general and administrative expenses of approximately $610,000 in response to
lower sales.
Marine
Components net sales decreased 26% in 2008 as compared to 2007 primarily due to
an overall downturn in the marine industry. Gross margin percentage
decreased from 27% in 2007 to 21% in 2008. Excluding the goodwill
impairment charge discussed above, operating income decreased from approximately
$800,000 of income in 2007 to an operating loss of approximately $500,000 in
2008. The decreases in gross margin and operating income are the
result of reduced coverage of fixed costs from lower sales volume.
Outlook
Demand
for our components continues to be slow and unstable as customers react to the
condition of the overall economy. While changes in market demand are not within
our control, we are focused on the areas we can impact. Staffing
levels are continuously being evaluated in relation to sales order rates
resulting in headcount adjustments, to the extent possible, to match staffing
levels with demand. We expect our lean manufacturing and cost
improvement initiatives to continue to positively impact our productivity and
result in a more efficient infrastructure that we can leverage when demand
growth returns. Additionally, we continue to seek opportunities to
gain market share in markets we currently serve, expand into new markets and
develop new product features in order to mitigate the impact of reduced demand
as well as broaden our sales base.
- 22
-
In
addition to challenges with overall demand, volatility in the cost of our
commodity related raw materials is ongoing. We currently expect these
costs to be volatile for 2010. We generally seek to mitigate the
impact of fluctuations in raw material costs on our margins through improvements
in production efficiencies or other operating cost reductions. In the
event we are unable to offset raw material cost increases with other cost
reductions, it may be difficult to recover those cost increases through
increased product selling prices or raw material surcharges due to the
competitive nature of the markets served by our products.
As
discussed in Note 12 to the Consolidated Financial Statements, a competitor has
filed claims against us for patent infringement. We have denied the
allegations of patent infringement and are seeking to have the claims
dismissed. While we currently believe the disposition of these claims
should not have a material, long-term adverse effect on our consolidated
financial condition, results of operations or liquidity, we expect to continue
to incur costs defending against such claims during the short-term that are
likely to be material.
During
the third quarter of 2009, we entered into a Third Amendment to our $37.5
million Credit Agreement (the “Third Amendment”). The primary purpose of
the Third Amendment was to adjust certain covenants in the Credit Agreement in
order to take into consideration our current and expected future financial
performance. See Note 6 to the Consolidated Financial
Statements. We believe the adjustments to the covenants will allow us
to comply with the covenant restrictions through the maturity of the facility in
January 2012; however, if future operating results differ materially from our
expectations we may be unable to maintain compliance. At December 31,
2009, no amounts were outstanding under the facility. We are currently in
compliance with all covenant restrictions under the Credit
Agreement. Maintaining compliance with certain of the covenant
restrictions is dependent upon our current financial performance as measured at
the end of each quarter. One of the financial performance covenants
requires earnings before interest and taxes for the trailing four quarters (not
including quarters prior to September 2009) to be 2.5 times cash interest
expense. Since our earnings before interest and taxes was a loss of
$147,000 and $2.0 million for the third and fourth quarters of 2009,
respectively, as measured under the terms of the Credit Agreement, effectively
we could not have had any borrowings outstanding under the Credit Agreement
during these periods of 2009 without violating the covenant as any cash interest
expense incurred would have exceeded the required 2.5 to 1 ratio. In
the future, to the extent we do not generate the required amount of earnings
before interest and taxes, as measured under the Credit Agreement, we would
similarly be unable to borrow on the Credit Agreement without violating this
financial performance covenant. However, there are no current
expectations that we will be required to borrow on the revolving credit facility
in the near term as cash flows from operations are expected to be sufficient to
fund our future liquidity requirements.
As a
condition to the Third Amendment, in the third quarter of 2009 we executed with
TIMET Finance Management Company, a subsidiary of Titanium Metals Corporation
and an affiliate of ours (“TFMC”), an Amended and Restated Subordinated Term
Loan Promissory Note payable to the order of TFMC. The material
changes effected by the Amended and Restated TFMC Note were the deferral of
required principal and interest payments on the note until on or after January
1, 2011 and certain restrictions on the amount of payments that could be made
after that date. See Note 11 to the Consolidated Financial
Statements.
- 23
-
Liquidity
and Capital Resources
Summary.
Our
primary source of liquidity on an on-going basis is our cash flow from operating
activities, which is generally used to (i) fund capital expenditures, (ii) repay
short-term or long-term indebtedness incurred primarily for working capital,
capital expenditures or reducing our outstanding stock and (iii) provide for the
payment of dividends (if declared). From time-to-time, we will incur
indebtedness, primarily for short-term working capital needs, or to fund capital
expenditures or business combinations. In addition, from
time-to-time, we may also sell assets outside the ordinary course of business,
the proceeds of which are generally used to repay indebtedness (including
indebtedness which may have been collateralized by the assets sold) or to fund
capital expenditures or business combinations.
Consolidated
cash flows.
Operating
activities. Trends in cash flows from operating activities,
excluding changes in assets and liabilities, for the last three years have
generally been similar to the trends in our earnings. Depreciation and
amortization expense decreased in 2009 compared to 2008, and in 2008 compared to
2007 due to the timing of capital expenditures placed into service each
year. See Notes 1 and 4 to the Consolidated Financial
Statements.
Changes
in assets and liabilities result primarily from the timing of production, sales
and purchases. Such changes in assets and liabilities generally tend
to even out over time. However, year-to-year relative changes in
assets and liabilities can significantly affect the comparability of cash flows
from operating activities. Cash provided by operating activities was
$15.3 million in 2009 compared to $15.7 million in 2008. The cash
provided by operating activities in 2009 was comparable to 2008 despite the
significant decrease in operating results excluding the impact of the goodwill
impairment. Comparable cash provided by operating activities in 2009
as compared to 2008 is primarily the net result of:
| · |
Lower
operating results in 2009 of approximately $19.4 million (exclusive of the
$9.9 million goodwill impairment charge in 2008 and the $717,000 asset
held for sale write-down in 2009;
|
|
·
|
Higher
net cash provided by relative changes in our inventories, receivables,
payables and non-tax related accruals of $10.8 million in
2009;
|
|
·
|
Lower
cash paid for income taxes in 2009 of $6.2 million due to lower earnings
in 2009;
|
|
·
|
Lower
depreciation and amortization in 2009 of $1.0
million;
|
|
·
|
Lower
cash paid for interest in 2009 of $1.0 million due to lower interest
rates; and
|
|
·
|
Higher
adjustments to the provision for inventory reserves in 2009 of
approximately $827,000 due to an increase in obsolete inventory resulting
from reduced demand.
|
Cash
provided by operating activities was $15.7 million in 2008, an increase of $3.8
million over 2007 cash provided by operating activities. The increase
in cash provided by operating activities in 2008 compared to 2007 is primarily
the net result of:
|
·
|
Higher
operating income in 2008 of approximately $500,000 (exclusive of the $9.9
million goodwill impairment
charge);
|
|
·
|
Lower
depreciation and amortization in 2008 of $1.8
million;
|
|
·
|
Higher
net cash provided by relative changes in our inventories, receivables,
payables and non-tax related accruals of $1.8 million in
2008;
|
|
·
|
Lower
cash paid for income taxes in 2008 of $6.3 million due to lower
repatriations of non-US earnings in
2008;
|
|
·
|
Higher
cash paid for interest in 2008 of $2.2 million due to the October 2007
issuance of our promissory note to an affiliate;
and
|
|
·
|
Lower
interest income of approximately $900,000 in 2008 due to lower average
cash balances during 2008 resulting from the use of excess cash to prepay
principle on our promissory note payable to an
affiliate.
|
- 24
-
Relative
changes in working capital can have a significant effect on cash flows from
operating activities. As shown below, our average days sales
outstanding decreased from December 31, 2008 to December 31, 2009 across all
segments. In absolute terms, we reduced accounts receivable by $5.1 million in
2009 as compared to 2008. The reduction in our average days sales outstanding
was the result of our efforts to increase our accounts receivable collection
efforts in order to reduce our exposure to bad debts in light of the challenging
economic environment. See also days sales outstanding at December 31,
2007 for comparative purposes.
|
December
31,
|
December
31,
|
December
31,
|
|
|
Days Sales Outstanding:
|
2007
|
2008
|
2009
|
|
Security
Products
|
40
Days
|
39
Days
|
34
Days
|
|
Furniture
Components
|
48
Days
|
43
Days
|
40
Days
|
|
Marine
Components
|
44
Days
|
43
Days
|
33
Days
|
|
Total
|
44
Days
|
41
Days
|
37
Days
|
As shown
below, our average number of days in inventory decreased from December 31, 2008
to December 31, 2009. In addition, we reduced inventory by $6.4
million in 2009 as compared to 2008. For comparative purposes, we
have provided 2007 numbers below. The overall decrease in days in
inventory was the result of our focus on inventory management controls in order
to ensure our inventory balances are aligned with the current needs of our
business in light of the reduction in customer demand. The
variability in days in inventory among our segments primarily relates to the
complexity of the production processes and therefore the length of time it takes
to produce end products.
|
December
31,
|
December
31,
|
December
31,
|
|
|
Days in Inventory:
|
2007
|
2008
|
2009
|
|
Security
Products
|
74
Days
|
77
Days
|
77
Days
|
|
Furniture
Components
|
42
Days
|
53
Days
|
44
Days
|
|
Marine
Components
|
137
Days
|
180
Days
|
109
Days
|
|
Total
|
63
Days
|
70
Days
|
64
Days
|
Investing activities. Net
cash used by investing activities totaled $12.4 million, $5.1 million, and $2.1
million for the years ended December 31, 2007, 2008 and 2009,
respectively. Capital expenditures in the past three years have
primarily emphasized improving our manufacturing facilities and investing in
manufacturing equipment which utilizes new technologies and increases automation
of the manufacturing process to provide for increased productivity and
efficiency.
During
2007, we constructed a new facility and consolidated three of our northern
Illinois facilities into one facility at a cost of approximately $9.6
million. As a part of the facility consolidation project, the Lake
Bluff, Illinois facility was sold in 2006 for approximately $1.3 million which
approximated book value. The River Grove, Illinois facility is no
longer being utilized and is being actively marketed for sale. See
Note 9 to the Consolidated Financial Statements.
In April
of 2007 and 2008 we collected payments of $1.3 million, respectively, related to
the sale of our European Thomas Regout operations, completed in 2005, which
required annual payments over a period of four years. In April of
2009, we received our final payment totaling approximately $948,000, of which
$261,000 related to principal and the remaining $687,000 related to interest
that had accrued over the four year period.
- 25
-
Capital
expenditures for 2010 are estimated at approximately $3.6 million compared to
capital expenditures of $2.3 million in 2009 and $6.8 million in
2008. Our planned capital expenditures in 2009 were limited to
expenditures required to meet expected customer demand and properly maintain our
facilities. Capital spending for 2010 is expected to be funded
through cash on hand and cash generated from operations and relates to
expenditures required to meet expected customer demand and properly maintain our
facilities.
In
February 2010, we entered into an unsecured demand promissory note with NL
whereby we agreed to loan NL up to $8 million. Our loans to NL will
bear interest at the prime rate less .75%, with all principal due on demand on
or after March 31, 2011 (and in any event no later than December 31, 2012), with
interest payable quarterly. The amount of our outstanding loans to NL
at any time is at our discretion. It is probable during 2010 that we
will loan amounts to NL in addition to the $8 million available under the
promissory note. See Note 11 to the Consolidated Financial
Statements.
Financing activities. Net
cash used by financing activities totaled $11.7 million, $14.2 million, and $7.1
million in 2007, 2008 and 2009, respectively. Cash dividends paid
totaled $7.3 million in 2007 and $6.2 million ($.50 per share) in each of 2008
and 2009. Dividends paid decreased in 2008 as a result of the
repurchase and/or cancellation of a net 2.7 million shares of our Class A common
stock held by TFMC, an affiliate in the fourth quarter of 2007. We
purchased these shares for $19.50 per share, or aggregate consideration of $52.6
million, which we paid in the form of a consolidated promissory
note. The price per share was determined based on open market
transactions of our Class A common stock around the time the repurchase from
TFMC was approved. We prepaid approximately $2.6 million and $7.0
million toward the promissory note in 2007 and 2008,
respectively. See Notes 8 and 11 to the Consolidated Financial
Statements.
In 2007,
we repurchased approximately 179,100 shares of our Class A common stock in
market transactions for an aggregate of $3.3 million. In 2008, we
also repurchased approximately 126,000 shares of our Class A common stock in
market transactions for an aggregate of $1.0 million. See
Note 8 to the Consolidated Financial Statements.
At
December 31, 2009, there were no amounts outstanding under our $37.5 million
revolving credit facility that matures in January 2012 and there are no current
expectations to borrow on the revolving credit facility in the near
term. As a result of covenant restrictions relating to the ratio of
earnings before interest and tax to cash interest expense, as defined in the
Credit Agreement, we would not have been able to borrow under the Credit
Agreement during the third or fourth quarters of 2009 due to a loss before
interest and tax incurred in each of those quarters,
respectively. Any future losses before interest and tax would also
likely restrict or prohibit borrowings under the Credit
Agreement. However, there are no current expectations that we will be
required to borrow on the revolving credit facility in the near term as cash
flows from operations are expected to be sufficient to fund our future liquidity
requirements. See “Outlook” for further discussion of expectations
relating to compliance with credit facility debt covenants.
While the
required ratio of earnings before interest and tax to cash interest expense
prohibited our ability to borrow under the Credit Agreement during the third and
fourth quarters of 2009, the financial covenant does not directly impact our
ability to pay dividends on our common stock. We believe cash
generated from operations together with cash on hand will be sufficient to meet
our liquidity needs for working capital, capital expenditures, debt service and
dividends (if declared) for at least the next twelve months. To the
extent that actual operating results or other developments differ from our
expectations, our liquidity could be adversely affected.
- 26
-
Provisions
contained in our revolving credit facility could result in the acceleration of
any outstanding indebtedness prior to its stated maturity for reasons other than
defaults from failing to comply with typical financial covenants. For
example, our revolving credit facility allows the lender to accelerate the
maturity of the indebtedness upon a change of control (as defined) of the
borrower. The terms of our revolving credit facility could result in
the acceleration of all or a portion of the indebtedness following a sale of
assets outside of the ordinary course of business. Although there are
no current expectations to borrow on the revolving credit facility, lower future
operating results would likely reduce or eliminate our amount available to
borrow and restrict future dividends. See “Outlook” for further
discussion of expectations relating to compliance with credit facility debt
covenants. See also Note 6 to the Consolidated Financial
Statements.
Off balance sheet financing
arrangements. Other than certain operating leases discussed in
Note 12 to the Consolidated Financial Statements, neither we nor any of our
subsidiaries or affiliates are parties to any off-balance sheet financing
arrangements.
Other
We
believe that cash generated from operations together with cash on hand will be
sufficient to meet our liquidity needs for working capital, capital
expenditures, debt service and dividends (if declared). To the extent
that our actual operating results or other developments differ from our
expectations, our liquidity could be adversely affected.
We
periodically evaluate our liquidity requirements, alternative uses of capital,
capital needs and available resources in view of, among other things, our
capital expenditure requirements, dividend policy and estimated future operating
cash flows. As a result of this process, we have in the past and may
in the future seek to raise additional capital, refinance or restructure
indebtedness, issue additional securities, repurchase shares of our common
stock, modify our dividend policy or take a combination of such steps to manage
our liquidity and capital resources. In the normal course of
business, we may review opportunities for acquisitions, joint ventures or other
business combinations in the component products industry. In the
event of any such transaction, we may consider using available cash, issuing
additional equity securities or increasing our indebtedness or that of our
subsidiaries.
Contractual
obligations. As more fully described in the notes to the
Consolidated Financial Statements, we are a party to various debt, lease and
other agreements which contractually and unconditionally commit us to pay
certain amounts in the future. See Notes 6 and 12 to the Consolidated
Financial Statements. The following table summarizes such contractual
commitments as of December 31, 2009 by the type and date of
payment.
|
Payments due by
period
|
||||||||||||||||||||
|
Total
|
2010
|
2011–2012 | 2013-2014 |
2015
and after
|
||||||||||||||||
|
(In
thousands)
|
||||||||||||||||||||
|
Note
and interest payable to affiliate
|
$ | 44,631 | $ | - | $ | 3,548 | $ | 41,083 | $ | - | ||||||||||
|
Operating
leases
|
789 | 409 | 380 | - | - | |||||||||||||||
|
Purchase
obligations
|
11,363 | 11,363 | - | - | - | |||||||||||||||
|
Income
taxes
|
15 | 15 | - | - | - | |||||||||||||||
|
Fixed
asset acquisitions
|
386 | 386 | - | - | - | |||||||||||||||
|
Total
contractual cash obligations
|
$ | 57,184 | $ | 12,173 | $ | 3,928 | $ | 41,083 | $ | - | ||||||||||
The
timing and amount shown for our commitments related to long-term debt, operating
leases and fixed asset acquisitions are based upon the contractual payment
amount and the contractual payment date for those commitments. The
timing and amount shown for purchase obligations, which consist of all open
purchase orders and contractual obligations (primarily commitments to purchase
raw materials) is also based on the contractual payment amount and the
contractual payment date for those commitments. The amount shown for
income taxes is the consolidated amount of income taxes payable at December 31,
2009, which is assumed to be paid during 2010. Fixed asset
acquisitions include firm purchase commitments for capital
projects.
- 27
-
Commitments and
contingencies. See Note 12 to the Consolidated Financial
Statements.
Critical
Accounting Policies and Estimates
We have
based the accompanying "Management's Discussion and Analysis of Financial
Condition and Results of Operations" upon our Consolidated Financial Statements.
We prepared our Consolidated Financial Statements in accordance with accounting
principles generally accepted in the United States of America ("GAAP"). In
preparing our Consolidated Financial Statements, we are required to make
estimates and judgments that affect the reported amounts of assets and
liabilities and disclosure of contingent assets and liabilities at the date of
the financial statements, and the reported amount of revenues and expenses
during the reported period. On an on-going basis, we evaluate our
estimates, including those related to inventory reserves, the recoverability of
long-lived assets (including goodwill and other intangible assets) and the
realization of deferred income tax assets. We base our estimates on
historical experience and on various other assumptions that we believe are
reasonable under the circumstances, the results of which form the basis for
making judgments about the reported amounts of assets, liabilities, revenues and
expenses. Our actual future results might differ from
previously-estimated amounts under different assumptions or
conditions.
We
believe the following critical accounting policies affect our more significant
judgments and estimates used in the preparation of our Consolidated Financial
Statements and are applicable to all of our operating segments:
|
·
|
Inventory reserves - We
provide reserves for estimated obsolete or unmarketable inventories equal
to the difference between the cost of inventories and the estimated net
realizable value using assumptions about future demand for our products
and market conditions. We also consider the age and the quantity of
inventory on hand in estimating the reserve. If actual market
conditions are less favorable than those we projected, we may be required
to recognize additional inventory
reserves.
|
|
·
|
Goodwill – Our goodwill
totaled $30.9 million at December 31, 2009. We perform a
goodwill impairment test annually in the third quarter of each
year. Goodwill is also evaluated for impairment at other times
whenever an event occurs or circumstances change that would more likely
than not reduce the fair value of a reporting unit below its carrying
value. The estimated fair values of our three reporting units
are determined using Level 3 inputs of a discounted cash flow technique
since Level 1 inputs of market prices are not available at the reporting
unit level. We also consider control premiums when assessing
fair value of our segments. If the fair value is less than the
book value, the asset is written down to the estimated fair
value.
|
Considerable
management judgment is necessary to evaluate the impact of operating changes and
to estimate future cash flows. Assumptions used in our impairment
evaluations, such as forecasted growth rates and our cost of capital, are
consistent with our internal projections and operating
plans. However, different assumptions and estimates could result in
materially different findings which could result in the recognition of a
material goodwill impairment.
During
2009, we evaluated our Furniture Components reporting unit for goodwill
impairment at each of the first, second and third quarter interim
dates. We tested this reporting unit for impairment because, while
continuing to generate positive operating cash flows, it reported sales and
operating income significantly below our expectations as a result of the severe
contraction in demand in the office furniture and appliance
markets. At each of these impairment review dates in 2009, we
concluded no impairments were present. However, if our future cash
flows from operations less capital expenditures for this reporting unit were to
be significantly below our current expectations (approximately 20% below our
current expectations), it is reasonably likely that we would conclude an
impairment of the goodwill associated with this reporting unit would be present
under ASC Topic 350-20-20, Goodwill. Per our
annual impairment review during the third quarter, the estimated fair value of
our Furniture Components reporting unit exceeded its carrying value by
30%. The carrying value included approximately $7.2 million of
goodwill. Holding all other assumptions constant at the re-evaluation
date, an increase in the rate used to discount our expected cash flows of
approximately 200 basis points would reduce the enterprise value for our
Furniture Components unit sufficiently to indicate a potential
impairment.
- 28
-
During
the third quarter of 2008, we determined that all of the goodwill associated
with our Marine Components reporting unit was impaired. As a result,
we recognized a goodwill impairment charge of $9.9 million for our Marine
Components reporting unit, which represented all of the goodwill we had
previously recognized for this reporting unit. The factors that led
us to conclude goodwill associated with the Marine Components reporting unit was
fully impaired include the continued decline in consumer spending in the marine
market as well as the overall negative economic outlook, both of which resulted
in near-term and longer-term reduced revenue, profit and cash flow forecasts for
the Marine Components unit. While we continue to believe in the long
term potential of the Marine Components unit, due to the extraordinary economic
downturn in the boating industry we are not currently able to foresee when the
industry and our business will recover. In response to the present
economic conditions, we have taken steps to reduce operating costs without
inhibiting our ability to take advantage of opportunities to expand our market
share.
We
performed our annual goodwill impairment analysis in the third quarter of 2009
for our Security Products reporting unit and concluded there was no impairment
of the goodwill for this reporting unit. The estimated fair value of
our Security Products reporting unit was substantially in excess of their
respective carrying value.
|
·
|
Long-lived assets – We
account for our long-lived assets in accordance with applicable
GAAP. We assess property and equipment for impairment only when
circumstances (as specified in ASC 360-10-35, Property, Plant, and
Equipment) indicate an impairment may
exist.
|
Due to
the continued decline in the marine industry and lower than expected results of
our Custom Marine and Livorsi Marine operations comprising our Marine Components
reporting unit, we evaluated the long-lived assets for our Marine Components
reporting unit in the third quarter of 2009 and concluded no impairments were
present. However, if our future cash flows from operations less
capital expenditures were to drop significantly below our current expectations
(approximately 45% for Custom Marine and 75% for Livorsi Marine), it is
reasonably likely we would conclude an impairment was present. At
December 31, 2009 the asset carrying values of Custom Marine and Livorsi Marine
were $6.3 million and $4.6 million, respectively.
No other
long-lived assets in our other reporting units were tested for impairment during
2009 because there were no circumstances to indicate impairment may exist at
these units.
|
·
|
Income taxes – We
recognize deferred taxes for future tax effects of temporary differences
between financial and income tax reporting in accordance with applicable
GAAP for accounting for income taxes. While we have considered
future taxable income and ongoing prudent and feasible tax planning
strategies in assessing the need for a valuation allowance, it is possible
that in the future we may change our estimate of the amount of the
deferred income tax assets that would more-likely-than-not be realized in
the future resulting in an adjustment to the deferred income tax asset
valuation allowance that would either increase or decrease, as applicable,
reported net income in the period the change in estimate was
made.
|
- 29
-
We also
evaluate at the end of each reporting period whether or not some or all of the
undistributed earnings of our foreign subsidiaries are permanently reinvested
(as that term is defined in GAAP). While we may have concluded in the
past that some of the undistributed earnings are permanently reinvested, facts
and circumstances can change in the future, and it is possible that a change in
facts and circumstances, such as a change in the expectation regarding the
capital needs of our foreign subsidiaries, could result in a conclusion that
some or all of the undistributed earnings are no longer permanently
reinvested. If our prior conclusions change, we would be required to
recognize a deferred income tax liability in an amount equal to the estimated
incremental U.S. income tax and withholding tax liability that would be
generated if all of the previously-considered permanently reinvested
undistributed earnings were distributed to us in the U.S. We did not
change our conclusions on our undistributed foreign earnings in
2009.
Beginning
in 2007, we record a reserve for uncertain tax positions in accordance with the
then new provisions of ASC Topic 740, Income Taxes, for tax
positions where we believe it is more-likely-than-not our position will not
prevail with the applicable tax authorities. From time to time, tax
authorities will examine certain of our income tax returns. Tax
authorities may interpret tax regulations differently than we
do. Judgments and estimates made at a point in time may change based
on the outcome of tax audits and changes to or further interpretations of
regulations, thereby resulting in an increase or decrease in the amount we are
required to accrue for uncertain tax positions (and therefore a decrease or
increase in our reported net income in the period of such change).
|
·
|
Accruals - We record
accruals for environmental, legal and other contingencies and commitments
when estimated future expenditures associated with the contingencies
become probable, and we can reasonably estimate the amounts of the future
expenditures. However, new information may become available to
us, or circumstances (such as applicable laws and regulations) may change,
thereby resulting in an increase or decrease in the amount we are required
to accrue for such matters (and, therefore, a corresponding decrease or
increase of our reported net income in the period of such
change.) At December 31, 2009 we have accrued legal costs of
approximately $1.4 million.
|
|
·
|
Assets Held for Sale -
Our assets held for sale at December 31, 2009, consist of a facility in
River Grove, Illinois and a facility in Neenah,
Wisconsin. These two properties (primarily land, buildings and
building improvements) were formerly used in our
operations. Discussions with potential buyers of both
properties had been active through the first quarter of
2009. Subsequently during the second quarter of 2009, and as
weak economic conditions continued longer than expected, we concluded that
it was unlikely we would sell these properties at or above their previous
carrying values in the near term and therefore an adjustment to their
carrying values was appropriate. In determining the estimated
fair values of the properties, we considered recent sales prices for other
properties near the facilities, which prices are Level 2 inputs as defined
by ASC 820-10-35. Accordingly, during the second quarter of
2009, we recorded a write-down of approximately $717,000 to reduce the
carrying value of these assets to their aggregate estimated fair value
less cost to sell of $2.8 million. This charge is included in
corporate operating expense. Both properties are being actively
marketed. However, due to the current state of the commercial
real estate market, we can not be certain of the timing of the disposition
of the assets. If we continue to experience difficulty in
disposing of the assets at or above their carrying value, we may have to
record additional write-downs of the assets in the
future.
|
- 30
-
Recent accounting
pronouncements. See Note 13 to the Consolidated Financial
Statements.
ITEM
7A. QUANTITATIVE
AND QUALITATIVE DISCLOSURES ABOUT MARKET RISK
General. We are
exposed to market risk from changes in interest rates, currency exchange rates
and raw materials prices.
Interest rates. We
are exposed to market risk from changes in interest rates, primarily related to
indebtedness.
At
December 31, 2008 and 2009, we had no amounts outstanding under our secured
Revolving Bank Credit Agreement. In conjunction with the repurchase
and/or cancellation of a net 2.7 million shares of our class A common stock,
during the fourth quarter of 2007, we issued a promissory note for $52.6
million. At December 31, 2009, there was $42.2 million of principle
outstanding on the promissory note ($43.0 million at December 31, 2008) which
bears interest at LIBOR plus 1%, (1.25% and 5.05% at December 31, 2009 and 2008,
respectively) and the fair value of such indebtedness approximates its carrying
value. The interest rate is reset quarterly based on the three month
LIBOR. See Note 11 to the Consolidated Financial Statements regarding
the Amended and Restated Subordinated Term Loan Promissory Note payable to the
order of TFMC.
Currency exchange
rates. We are exposed to market risk arising from changes in
currency exchange rates as a result of manufacturing and selling our products
outside the United States (principally Canada and Taiwan). A portion
of our sales generated from our non-U.S. operations are denominated in
currencies other than the U.S. dollar, principally the Canadian dollar and the
New Taiwan dollar. In addition, a portion of our sales generated from
our non-U.S. operations are denominated in the U.S. dollar. Most
materials, labor and other production costs for these non-U.S. operations are
denominated primarily in local currencies. As a result, the
translated U.S. dollar value of our non-U.S. sales and operating results are
subject to currency exchange rate fluctuations which may favorably or
unfavorably impact reported earnings and may affect comparability of
period-to-period operating results.
As
previously noted certain of our sales generated by our Canadian operations are
denominated in U.S. dollars. Consequently, we periodically enter into
forward currency contracts to mitigate the financial statement impact of changes
in currency exchange rates. At each balance sheet date, outstanding
forward currency contracts are marked-to-market with any resulting gain or loss
recognized in income currently unless the contract is designated as a hedge upon
which the mark-to-market adjustment is recorded in other comprehensive
income. We had no forward currency contracts outstanding at December
31, 2009. At December 31, 2008 we had entered into a series of
short-term forward currency exchange contracts to exchange an aggregate of $7.5
million for an equivalent value of Canadian dollars at exchange rates of Cdn.
$1.25 to $1.26 per U.S. dollar. These contracts qualified for hedge
accounting and matured through June 2009. At December 31, 2008, the
actual exchange rate was Cdn. $1.22 per U.S. dollar. The estimated
fair value of such contracts was not material at December 31, 2008.
Raw materials. We will occasionally
enter into raw material arrangements to mitigate the short-term impact of future
increases in raw material costs. Otherwise, we generally do not have
long-term supply agreements for our raw material requirements because either we
believe the risk of unavailability of those raw materials is low and we believe
the price to be stable or because long-term supply agreements for those
materials are generally not available. We do not engage in commodity
hedging programs.
Other. The above
discussion includes forward-looking statements of market risk which assumes
hypothetical changes in market prices. Actual future market
conditions will likely differ materially from such
assumptions. Accordingly, such forward-looking statements should not
be considered to be our projections of future events, gains or
losses. Such forward-looking statements are subject to certain risks
and uncertainties some of which are listed in “Business-General.”
- 31
-
ITEM
8. FINANCIAL
STATEMENTS AND SUPPLEMENTARY DATA
The
information called for by this Item is contained in a separate section of this
Annual Report. See "Index of Financial Statements" (page
F-1).
ITEM
9. CHANGES
IN AND DISAGREEMENTS WITH ACCOUNTANTS ON ACCOUNTING AND FINANCIAL
DISCLOSURE
None.
ITEM
9A(T). CONTROLS
AND PROCEDURES
Evaluation of Disclosure Controls and
Procedures. We maintain a system of disclosure controls and
procedures. The term "disclosure controls and procedures," as defined
by regulations of the Securities and Exchange Commission (the "SEC"), means
controls and other procedures that are designed to ensure that information
required to be disclosed in the reports that we file or submit to the SEC under
the Securities Exchange Act of 1934, as amended (the "Act"), is recorded,
processed, summarized and reported, within the time periods specified in the
SEC's rules and forms. Disclosure controls and procedures include,
without limitation, controls and procedures designed to ensure that information
required to be disclosed by us in the reports that we file or submit to the SEC
under the Act is accumulated and communicated to our management, including its
principal executive officer and its principal financial officer, or persons
performing similar functions, as appropriate to allow timely decisions to be
made regarding required disclosure. Each of David A. Bowers, our Vice
Chairman of the Board, President and Chief Executive Officer, and Darryl R.
Halbert, our Vice President, Chief Financial Officer and Controller, have
evaluated our disclosure controls and procedures as of December 31,
2009. Based upon their evaluation, these executive officers have
concluded that our disclosure controls and procedures are effective as of the
date of such evaluation.
Scope of Management Report on
Internal Control Over Financial Reporting. We also maintain a
system of internal control over financial reporting. The term
“internal control over financial reporting,” as defined by regulations of the
SEC, means a process designed by, or under the supervision of, our principal
executive and principal financial officers, or persons performing similar
functions, and effected by our board of directors, management and other
personnel, to provide reasonable assurance regarding the reliability of
financial reporting and the preparation of financial statements for external
purposes in accordance with accounting principles generally accepted in the
United States of America (“GAAP”), and includes those policies and procedures
that:
|
·
|
Pertain
to the maintenance of records that in reasonable detail accurately and
fairly reflect the transactions and dispositions of our
assets.
|
|
·
|
Provide
reasonable assurance that transactions are recorded as necessary to permit
preparation of financial statements in accordance with GAAP, and that
receipts and expenditures are being made only in accordance with
authorizations of our management and directors,
and
|
|
·
|
Provide
reasonable assurance regarding prevention or timely detection of
unauthorized acquisition, use or disposition of our assets that could have
a material effect on our consolidated financial
statements.
|
Section
404 of the Sarbanes-Oxley Act of 2002, requires us to include a management
report on internal control over financial reporting in the Annual Report on Form
10-K for the year ended December 31, 2009. Our independent registered
public accounting firm will also be required to annually attest to the
effectiveness of our internal control over financial reporting, but under the
rules of the SEC this attestation is not required until our Annual Report on
Form 10-K for the year ended December 31, 2010.
- 32
-
Management’s Report on Internal
Control Over Financial Reporting. Our management is
responsible for establishing and maintaining adequate internal control over
financial reporting, as such term is defined in Exchange Act Rule 13a-15(f). Our
evaluation of the effectiveness of our internal control over financial reporting
is based upon the framework established in Internal Control - Integrated
Framework issued by the Committee of Sponsoring Organizations of the
Treadway Commission (commonly referred to as the “COSO” framework). Based on our
evaluation under that framework, our management has concluded that our internal
control over financial reporting was effective as of December 31,
2009. This annual report does not include an attestation report of
our registered public accounting firm regarding internal control over financial
reporting. Management’s report was not subject to attestation by our
registered public accounting firm pursuant to temporary rules of the Securities
and Exchange Commission that permit us to provide only management’s report in
this annual report. See “Scope of Management’s Report on Internal
Control Over Financial Reporting” above.
Changes in Internal Control Over
Financial Reporting. There has been no change to our system of
internal control over financial reporting during the quarter ended December 31,
2009 that has materially affected, or is reasonably likely to materially affect,
our system of internal control over financial reporting.
Certifications. Our
chief executive officer is required to annually file a certification with the
New York Stock Exchange (“NYSE”), certifying our compliance with the corporate
governance listing standards of the NYSE. During 2009, our chief
executive officer filed such annual certification with the NYSE, indicating we
were in compliance with such listed standards. Our chief executive
officer and chief financial officer are also required to, among other things,
quarterly file a certification with the SEC regarding the quality of our public
disclosures, as required by Section 302 of the Sarbanes-Oxley Act of
2002. We have filed the certifications for the quarter ended December
31, 2009 as exhibits 31.1 and 31.2 to this Annual Report on Form
10-K.
ITEM
9B. OTHER
INFORMATION
Not
applicable.
- 33
-
PART
III
ITEM
10. DIRECTORS,
EXECUTIVE OFFICERS AND CORPORATE GOVERNANCE
The
information required by this Item is incorporated by reference to our definitive
Proxy Statement to be filed with the Securities and Exchange Commission pursuant
to Regulation 14A within 120 days after the end of the fiscal year covered by
this report ("Proxy Statement").
ITEM
11. EXECUTIVE
COMPENSATION
The
information required by this Item is incorporated by reference to our Proxy
Statement.
ITEM
12. SECURITY OWNERSHIP OF CERTAIN
BENEFICIAL OWNERS AND MANAGEMENT AND RELATED
STOCKHOLDER MATTERS
The
information required by this Item is incorporated by reference to our Proxy
Statement.
ITEM
13. CERTAIN
RELATIONSHIPS AND RELATED TRANSACTIONS AND DIRECTOR INDEPENDENCE
The
information required by this Item is incorporated by reference to our Proxy
Statement. See also Note 11 to the Consolidated Financial
Statements.
ITEM
14. PRINCIPAL
ACCOUNTING FEES AND SERVICES
The
information required by this Item is incorporated by reference to our Proxy
Statement.
- 34
-
PART
IV
ITEM
15. EXHIBITS,
FINANCIAL STATEMENT SCHEDULES
(a) and
(c) Financial
Statements
The
consolidated financial statements listed on the accompanying Index of Financial
Statements (see page F-1) are filed as part of this Annual Report.
All
financial statement schedules have been omitted either because they are not
applicable or required, or the information that would be required to be included
is disclosed in the notes to the consolidated financial statements.
(b) Exhibits
We have
retained a signed original of any of these exhibits that contain signatures, and
we will provide such exhibits to the Commission or its
staff. Included as exhibits are the items listed in the Exhibit
Index. We, upon request, will furnish a copy of any of the exhibits
listed below upon payment of $4.00 per exhibit to cover our costs of furnishing
the exhibits. Instruments defining the rights of holders of long-term
debt issues which do not exceed 10% of consolidated total assets will be
furnished to the Commission upon request. We, upon request, will also
furnish, without charge, a copy of our Code of Business Conduct and Ethics, as
adopted by the board of directors on February 24, 2004, upon
request. Such requests should be directed to the attention of our
Corporate Secretary at our corporate offices located at 5430 LBJ Freeway, Suite
1700, Dallas, Texas 75240.
Item
No. Exhibit
Item
|
3.1
|
Restated
Certificate of Incorporation of Registrant - incorporated by reference to
Exhibit 3.1 of the Registrant's Registration Statement on Form S-1 (File
No. 333-42643).
|
|
3.2
|
Amended
and Restated Bylaws of Registrant, adopted by the Board of Directors
October 24, 2007 – incorporated by reference to Exhibit 3.1 of the
Registrant’s Current Report on Form 8-K filed October 30, 2007 (File No
1-13905).
|
|
10.1
|
Intercorporate
Services Agreement between the Registrant and Contran Corporation
effective as of January 1, 2004 – incorporated by reference to Exhibit
10.2 of the Registrant’s Annual Report on Form 10-K for the year ended
December 31, 2003 (File No. 1-13905).
|
|
10.2*
|
CompX
International Inc. 1997 Long-Term Incentive Plan – incorporated by
reference to Exhibit 10.2 of the Registrant's Registration Statement on
Form S-1 (File No. 333-42643).
|
|
10.3
|
Tax
Sharing Agreement between the Registrant, NL Industries, Inc. and Contran
Corporation dated as of October 5, 2004 - incorporated by reference to
Exhibit 10.6 of the Registrant’s Annual Report on Form 10-K for the year
ended December 31, 2004 (File No. 1-13905).
|
|
10.4
|
Form
of Subordination Agreement among the Registrant, TIMET Finance Management
Company, CompX Security Products Inc., CompX Precision Slides Inc., CompX
Marine Inc., Custom Marine Inc., Livorsi Marine Inc., Wachovia Bank,
National Association as administrative agent for itself, Compass Bank and
Comerica Bank – incorporated by reference to Exhibit 10.4 of the
Registrant’s Current Report on Form 8-K filed on October 22, 2007 (File
No. 1-13905).
|
- 35
-
Item
No. Exhibit Item
(continued)
|
10.5
|
First
Amendment to Subordination Agreement dated as of the September 21, 2009 by
TIMET Finance Management Company and Wachovia Bank,
National
Association – incorporated by reference to Exhibit 10.2 of the
Registrant’s Current Report on Form 8-K filed on September 24, 2009 (File
No. 1-13905).
|
|
10.6
|
Subordinated
Term Loan Promissory Note dated October 26, 2007 executed by the
Registrant and payable to the order of TIMET Finance Management Company –
incorporated by reference to Exhibit 10.4 of the Registrant’s Current
Report on Form 8-K filed on October 30, 2007 (File No.
1-13905).
|
|
10.7
|
Amended
and Restated Subordinated Term Loan Promissory Note dated September 21,
2009 in the original principal amount of $42,230,190 payable to the order
of TIMET Finance Management Company by CompX International Inc. –
incorporated by reference to Exhibit 10.3 of the Registrant’s Current
Report on Form 8-K filed on September 24, 2009 (File No.
1-13905).
|
|
10.8
|
Agreement
Regarding Shared Insurance between the Registrant, Contran Corporation,
Keystone Consolidated Industries, Inc., Kronos Worldwide, Inc., NL
Industries, Inc., Titanium Metals Corporation, and Valhi, Inc. dated
October 30, 2003 – incorporated by reference to Exhibit 10.12 of the
Registrant’s Annual Report on Form 10-K for the year ended December 31,
2003 (File No. 1-13905).
|
|
10.9**
|
$50,000,000
Credit Agreement between the Registrant and Wachovia Bank, National
Association, as Agent and various lending institutions dated December 23,
2005(File No. 1-13905).
|
|
10.10
|
First
Amendment to Credit Agreement dated as of October 16, 2007 among CompX
International Inc., CompX Security Products Inc., CompX Precision Slides
Inc., CompX Marine Inc., Custom Marine Inc., Livorsi Marine Inc., Wachovia
Bank, National Association for itself and as administrative agent for
Compass Bank and Comerica Bank - incorporated by reference to Exhibit 10.3
of the Registrant’s Current Report on Form 8-K filed on October 22, 2007
(File No. 1-13905).
|
|
10.11
|
Second
Amendment to Credit Agreement dated as of January 15, 2009 among CompX
International Inc., CompX Security Products Inc., CompX Precision Slides
Inc., CompX Marine Inc., Custom Marine Inc., Livorsi Marine Inc., Wachovia
Bank, National Association for itself and as administrative agent for
Compass Bank and Comerica Bank - incorporated by reference to Exhibit 10.1
of the Registrant’s Current Report on Form 8-K filed on January 21, 2009
(File No. 1-13905).
|
|
10.12
|
Third
Amendment to Credit Agreement dated as of September 21, 2009 by and among
CompX International Inc., CompX Security Products Inc., CompX Precision
Slides Inc., CompX Marine Inc., Custom Marine Inc., Livorsi Marine Inc.,
Wachovia Bank, National Association and Comerica Bank - incorporated by
reference to Exhibit 10.1 of the Registrant’s Current Report on Form 8-K
filed on September 24, 2009 (File No. 1-13905).
|
|
10.13**
|
Unsecured
Revolving Demand Promissory Note dated February 3, 2010 between the
Registrant and NL Industries,
Inc.
|
- 36
-
Item
No. Exhibit Item
(continued)
|
21.1**
|
Subsidiaries
of the Registrant.
|
|
23.1**
|
Consent
of PricewaterhouseCoopers LLP.
|
|
31.1**
|
Certification
|
|
31.2**
|
Certification
|
|
32.1**
|
Certification
|
|
*
Management contract, compensatory plan or agreement.
**
Filed herewith.
|
- 37
-
SIGNATURES
Pursuant
to the requirements of Section 13 or 15(d) of the Securities Exchange Act of
1934, the Registrant has duly caused this report to be signed on its behalf by
the undersigned, thereunto duly authorized.
COMPX
INTERNATIONAL INC.
Date: March
3,
2010 By: /s/ David A.
Bowers
David A.
Bowers
Vice
Chairman of the Board,
President
and Chief Executive Officer
(Principal
Executive Officer)
Pursuant
to the requirements of the Securities Exchange Act of 1934, this report has been
signed by the following persons in the capacities and on the dates
indicated.
|
Signature
|
Title
|
Date
|
||
|
/s/ Glenn
R.
Simmons
Glenn
R. Simmons
|
Chairman
of the Board
|
March
3, 2010
|
||
|
/s/ David A.
Bowers
David
A. Bowers
|
Vice
Chairman of the
Board,
President and Chief Executive Officer (Principal Executive
Officer)
|
March
3, 2010
|
||
|
/s/ Darryl R.
Halbert
Darryl
R. Halbert
|
Vice
President,
Chief
Financial Officer
and
Controller
(Principal
Financial and Accounting Officer)
|
March
3, 2010
|
||
|
Paul
M. Bass, Jr.
|
Director
|
March
3, 2010
|
||
|
/s/ Norman S.
Edelcup
Norman
S. Edelcup
|
Director
|
March
3, 2010
|
||
|
/s/ Edward J.
Hardin
Edward
J. Hardin
|
Director
|
March
3, 2010
|
||
|
/s/ Ann
Manix
Ann
Manix
|
Director
|
March
3, 2010
|
||
|
/s/
Steven L.
Watson
Steven
L. Watson
|
Director
|
March
3, 2010
|
||
- 38
-
Annual
Report on Form 10-K
Items
8 and 15(a)
Index
of Financial Statements
|
Financial
Statements
|
Page
|
|
Report
of Independent Registered Public Accounting Firm
|
F-2
|
|
Consolidated
Balance Sheets - December 31, 2008 and 2009
|
F-3
|
|
Consolidated
Statements of Operations -
|
|
|
Years
ended December 31, 2007, 2008 and 2009
|
F-5
|
|
Consolidated
Statements of Comprehensive Income (Loss) -
|
|
|
Years
ended December 31, 2007, 2008 and 2009
|
F-6
|
|
Consolidated
Statements of Cash Flows -
|
|
|
Years
ended December 31, 2007, 2008 and 2009
|
F-7
|
|
Consolidated
Statements of Stockholders' Equity -
|
|
|
Years
ended December 31, 2007, 2008 and 2009
|
F-9
|
|
Notes
to Consolidated Financial Statements
|
F-10
|
All
financial statement schedules have been omitted either because they are not
applicable or required, or the information that would be required to be included
is disclosed in the notes to the consolidated financial
statements.
F - 1
REPORT OF
INDEPENDENT REGISTERED PUBLIC ACCOUNTING FIRM
To the
Board of Directors and Stockholders of CompX International Inc.:
In our
opinion, the consolidated financial statements listed in the accompanying index
present fairly, in all material respects, the financial position of CompX
International Inc. and its Subsidiaries at December 31, 2008 and 2009, and the
results of their operations and their cash flows for each of the three years in
the period ended December 31, 2009 in conformity with accounting principles
generally accepted in the United States of America. These financial statements
are the responsibility of the Company's management. Our
responsibility is to express an opinion on these financial statements based on
our audits. We conducted our audits of these statements in accordance
with the standards of the Public Company Accounting Oversight Board (United
States). Those standards require that we plan and perform the audit
to obtain reasonable assurance about whether the financial statements are free
of material misstatement. An audit includes examining, on a test
basis, evidence supporting the amounts and disclosures in the financial
statements, assessing the accounting principles used and significant estimates
made by management, and evaluating the overall financial statement
presentation. We believe that our audits provide a reasonable basis
for our opinion.
/s/PricewaterhouseCoopers
LLP
Dallas,
Texas
March 3,
2010
F - 2
COMPX
INTERNATIONAL INC. AND SUBSIDIARIES
CONSOLIDATED
BALANCE SHEETS
(In
thousands, except share data)
|
December 31,
|
||||||||
|
ASSETS
|
2008
|
2009
|
||||||
|
Current
assets:
|
||||||||
|
Cash
and cash equivalents
|
$ | 14,411 | $ | 20,788 | ||||
|
Accounts
receivable, less allowance for doubtful
accounts of $711 and $481
|
16,837 | 11,690 | ||||||
|
Receivables
from affiliates
|
1,472 | 1,487 | ||||||
|
Refundable
income taxes
|
83 | 1,844 | ||||||
|
Inventories
|
22,661 | 16,266 | ||||||
|
Prepaid
expenses and other current assets
|
1,300 | 1,132 | ||||||
|
Deferred
income taxes
|
1,841 | 1,928 | ||||||
|
Current
portion of note and interest receivable
|
943 | - | ||||||
|
Total
current assets
|
59,548 | 55,135 | ||||||
|
Other
assets:
|
||||||||
|
Goodwill
|
30,827 | 30,949 | ||||||
|
Other
intangible assets
|
1,991 | 1,408 | ||||||
|
Assets
held for sale
|
3,517 | 2,800 | ||||||
|
Other
|
90 | 119 | ||||||
|
Total
other assets
|
36,425 | 35,276 | ||||||
|
Property
and equipment:
|
||||||||
|
Land
|
11,858 | 12,051 | ||||||
|
Buildings
|
36,642 | 39,201 | ||||||
|
Equipment
|
110,915 | 120,574 | ||||||
|
Construction
in progress
|
4,406 | 1,180 | ||||||
| 163,821 | 173,006 | |||||||
|
Less
accumulated depreciation
|
96,392 | 109,370 | ||||||
|
Net
property and equipment
|
67,429 | 63,636 | ||||||
|
Total
assets
|
$ | 163,402 | $ | 154,047 | ||||
F - 3
COMPX
INTERNATIONAL INC. AND SUBSIDIARIES
CONSOLIDATED
BALANCE SHEETS (CONTINUED)
(In
thousands, except share data)
|
December 31,
|
||||||||
|
LIABILITIES
AND STOCKHOLDERS' EQUITY
|
2008
|
2009
|
||||||
|
Current
liabilities:
|
||||||||
|
Current
maturities of note payable to affiliate
|
$ | 1,000 | $ | - | ||||
|
Accounts
payable and accrued liabilities
|
14,256 | 14,567 | ||||||
|
Interest
payable to affiliate
|
528 | - | ||||||
|
Income
taxes payable to affiliates and other
|
20 | - | ||||||
|
Income
taxes
|
1,167 | 15 | ||||||
|
Total
current liabilities
|
16,971 | 14,582 | ||||||
|
Noncurrent
liabilities:
|
||||||||
|
Note
payable to affiliate
|
41,980 | 42,230 | ||||||
|
Deferred
income taxes and other
|
13,174 | 11,897 | ||||||
|
Interest
payable to affiliate
|
- | 311 | ||||||
|
Total
noncurrent liabilities
|
55,154 | 54,438 | ||||||
|
Stockholders'
equity:
|
||||||||
|
Preferred
stock, $.01 par value; 1,000 shares authorized,
none issued
|
- | - | ||||||
|
Class
A common stock, $.01 par value;
20,000,000
shares authorized; 2,361,307 and
2,370,307
shares issued and outstanding
|
24 | 24 | ||||||
|
Class
B common stock, $.01 par value;
10,000,000
shares authorized, issued and outstanding
|
100 | 100 | ||||||
|
Additional
paid-in capital
|
54,873 | 54,928 | ||||||
|
Retained
earnings
|
27,798 | 19,621 | ||||||
|
Accumulated
other comprehensive income
|
8,482 | 10,354 | ||||||
|
Total
stockholders' equity
|
91,277 | 85,027 | ||||||
|
Total
liabilities and stockholders’ equity
|
$ | 163,402 | $ | 154,047 | ||||
Commitments
and contingencies (Note 12)
See
accompanying Notes to Consolidated Financial Statements.
F - 4
COMPX
INTERNATIONAL INC. AND SUBSIDIARIES
CONSOLIDATED
STATEMENTS OF OPERATIONS
(In
thousands, except per share data)
|
Years Ended December 31,
|
||||||||||||
|
2007
|
2008
|
2009
|
||||||||||
|
Net
sales
|
$ | 177,683 | $ | 165,502 | $ | 116,125 | ||||||
|
Cost
of goods sold
|
132,455 | 125,248 | 92,345 | |||||||||
|
Gross
margin
|
45,228 | 40,254 | 23,780 | |||||||||
|
Selling,
general and administrative expense
|
25,846 | 24,818 | 26,722 | |||||||||
|
Goodwill
impairment
|
- | 9,881 | - | |||||||||
|
Facility
consolidation expense
|
2,665 | - | - | |||||||||
|
Assets
held for sale write-down
|
- | - | 717 | |||||||||
|
Other
operating income (expense):
|
||||||||||||
|
Currency
transaction gains (losses), net
|
(1,086 | ) | 679 | (236 | ) | |||||||
|
Disposition
of property and equipment
|
(75 | ) | (48 | ) | (141 | ) | ||||||
|
Operating
income (loss)
|
15,556 | 6,186 | (4,036 | ) | ||||||||
|
Other
non-operating income, net
|
1,133 | 240 | 45 | |||||||||
|
Interest
expense
|
(760 | ) | (2,362 | ) | (1,060 | ) | ||||||
|
Income
(loss) before income taxes
|
15,929 | 4,064 | (5,051 | ) | ||||||||
|
Provision
(benefit) for income taxes
|
6,949 | 7,165 | (3,058 | ) | ||||||||
|
Net
income (loss)
|
$ | 8,980 | $ | (3,101 | ) | $ | (1,993 | ) | ||||
|
Basic
and diluted earnings (loss) per common
share
|
$ | .61 | $ | (.25 | ) | $ | (.16 | ) | ||||
|
Cash
dividends per share
|
$ | .50 | $ | .50 | $ | .50 | ||||||
|
Shares
used in the calculation of earnings per
share amounts for:
|
||||||||||||
|
Basic
earnings per share
|
14,764 | 12,386 | 12,367 | |||||||||
|
Dilutive
impact of stock options
|
8 | - | - | |||||||||
|
Diluted
shares
|
14,772 | 12,386 | 12,367 | |||||||||
See
accompanying Notes to Consolidated Financial Statements.
F - 5
COMPX
INTERNATIONAL INC. AND SUBSIDIARIES
CONSOLIDATED
STATEMENTS OF COMPREHENSIVE INCOME (LOSS)
(In
thousands)
|
Years Ended December 31,
|
||||||||||||
|
2007
|
2008
|
2009
|
||||||||||
|
Net
income (loss)
|
$ | 8,980 | $ | (3,101 | ) | $ | (1,993 | ) | ||||
|
Other
comprehensive income (loss), net of tax:
|
||||||||||||
|
Currency
translation adjustment
|
2,996 | (2,718 | ) | 1,998 | ||||||||
|
Impact
from cash flow hedges, net
|
- | 126 | (126 | ) | ||||||||
|
Total
other comprehensive income (loss), net
|
2,996 | (2,592 | ) | 1,872 | ||||||||
|
Comprehensive
income (loss)
|
$ | 11,976 | $ | (5,693 | ) | $ | (121 | ) | ||||
See
accompanying Notes to Consolidated Financial Statements.
F - 6
COMPX
INTERNATIONAL INC. AND SUBSIDIARIES
CONSOLIDATED
STATEMENTS OF CASH FLOWS
(In
thousands)
|
Years Ended December 31,
|
||||||||||||
|
2007
|
2008
|
2009
|
||||||||||
|
Cash
flows from operating activities:
|
||||||||||||
|
Net
income (loss)
|
$ | 8,980 | $ | (3,101 | ) | $ | (1,993 | ) | ||||
|
Depreciation
and amortization
|
11,010 | 9,231 | 8,209 | |||||||||
|
Goodwill
impairment
|
- | 9,881 | - | |||||||||
|
Deferred
income taxes
|
(6,549 | ) | (45 | ) | (2,093 | ) | ||||||
|
Provision
for inventory reserves
|
141 | 195 | 1,022 | |||||||||
|
Assets
held for sale write-down
|
- | - | 717 | |||||||||
|
Other,
net
|
938 | 327 | 458 | |||||||||
|
Change
in assets and liabilities:
|
||||||||||||
|
Accounts
receivable
|
633 | 2,441 | 5,318 | |||||||||
|
Inventories
|
(1,813 | ) | 389 | 5,878 | ||||||||
|
Accounts
payable and accrued liabilities
|
(619 | ) | (2,810 | ) | (356 | ) | ||||||
|
Accounts
with affiliates
|
182 | (1,531 | ) | (15 | ) | |||||||
|
Income
taxes
|
(715 | ) | 1,047 | (2,778 | ) | |||||||
|
Other,
net
|
(296 | ) | (307 | ) | 899 | |||||||
|
Net
cash provided by operating activities
|
11,892 | 15,717 | 15,266 | |||||||||
|
Cash
flows from investing activities:
|
||||||||||||
|
Capital
expenditures
|
(13,820 | ) | (6,791 | ) | (2,321 | ) | ||||||
|
Proceeds
from disposal of assets held for sale
|
- | 250 | - | |||||||||
|
Proceeds
from sale of fixed assets
|
73 | 127 | - | |||||||||
|
Cash
collected on note receivable
|
1,306 | 1,306 | 261 | |||||||||
|
Net
cash used by investing activities
|
(12,441 | ) | (5,108 | ) | (2,060 | ) | ||||||
|
Cash
flows from financing activities:
|
||||||||||||
|
Repayment
of loan from affiliate
|
(2,600 | ) | (7,000 | ) | (750 | ) | ||||||
|
Issuance
of common stock
|
1,395 | - | - | |||||||||
|
Dividends
paid
|
(7,294 | ) | (6,181 | ) | (6,184 | ) | ||||||
|
Tax
benefit from exercise of stock options
|
73 | - | - | |||||||||
|
Treasury
stock acquired
|
(3,309 | ) | (1,006 | ) | - | |||||||
|
Other,
net
|
- | (56 | ) | (133 | ) | |||||||
|
Net
cash used by financing activities
|
(11,735 | ) | (14,243 | ) | (7,067 | ) | ||||||
|
Net
increase (decrease)
|
$ | (12,284 | ) | $ | (3,634 | ) | $ | 6,139 | ||||
See
accompanying Notes to Consolidated Financial Statements.
F - 7
COMPX
INTERNATIONAL INC. AND SUBSIDIARIES
CONSOLIDATED
STATEMENTS OF CASH FLOWS (CONTINUED)
(In
thousands)
|
Years Ended December 31,
|
||||||||||||
|
2007
|
2008
|
2009
|
||||||||||
|
Cash
and cash equivalents:
|
||||||||||||
|
Net
increase (decrease) from -
|
||||||||||||
|
Operating,
investing and financing activities
|
$ | (12,284 | ) | $ | (3,634 | ) | $ | 6,139 | ||||
|
Effect
of exchange rate on cash
|
995 | (354 | ) | 238 | ||||||||
|
Balance
at beginning of year
|
29,688 | 18,399 | 14,411 | |||||||||
|
Balance
at end of year
|
$ | 18,399 | $ | 14,411 | $ | 20,788 | ||||||
|
Supplemental
disclosures:
|
||||||||||||
|
Cash
paid for:
|
||||||||||||
|
Interest
|
$ | 109 | $ | 2,278 | $ | 1,246 | ||||||
|
Income
taxes
|
14,365 | 8,062 | 1,819 | |||||||||
|
Noncash
investing and financing activities:
|
||||||||||||
|
Note
payable to affiliate issued for repurchase
of common stock
|
$ | 52,580 | $ | - | $ | - | ||||||
|
Accrual
for capital expenditures
|
$ | 665 | $ | 511 | $ | 101 | ||||||
See
accompanying Notes to Consolidated Financial Statements.
F - 8
COMPX
INTERNATIONAL INC. AND SUBSIDIARIES
CONSOLIDATED
STATEMENTS OF STOCKHOLDERS' EQUITY
Years
ended December 31, 2007, 2008 and 2009
(In
thousands)
|
Accumulated
other
comprehensive income
|
||||||||||||||||||||||||||||||||
|
Common stock
|
Additional
paid-in
|
Retained
|
Currency
|
Hedging
|
Treasury
|
Total
stockholders'
|
||||||||||||||||||||||||||
|
Class A
|
Class B
|
Capital
|
earnings
|
translation
|
derivatives
|
stock
|
equity
|
|||||||||||||||||||||||||
|
Balance
at December 31, 2006
|
$ | 53 | $ | 100 | $ | 110,106 | $ | 35,353 | $ | 8,078 | $ | - | $ | - | $ | 153,690 | ||||||||||||||||
|
Net
income
|
- | - | - | 8,980 | - | - | - | 8,980 | ||||||||||||||||||||||||
|
Other
comprehensive income
|
- | - | - | - | 2,996 | - | - | 2,996 | ||||||||||||||||||||||||
|
Change
in accounting principle-
Uncertain
tax positions provision of ASC Topic 740
|
- | - | - | 41 | - | - | - | 41 | ||||||||||||||||||||||||
|
Cash
dividends
|
- | - | - | (7,294 | ) | - | - | - | (7,294 | ) | ||||||||||||||||||||||
|
Issuance
of common stock and other, net
|
- | - | 1,579 | - | - | - | - | 1,579 | ||||||||||||||||||||||||
|
Treasury
stock:
|
||||||||||||||||||||||||||||||||
|
Acquired
|
- | - | - | - | - | - | (55,889 | ) | (55,889 | ) | ||||||||||||||||||||||
|
Retired
|
(28 | ) | - | (55,861 | ) | - | - | - | 55,889 | - | ||||||||||||||||||||||
|
Balance
at December 31, 2007
|
25 | 100 | 55,824 | 37,080 | 11,074 | - | - | 104,103 | ||||||||||||||||||||||||
|
Net
loss
|
- | - | - | (3,101 | ) | - | - | - | (3,101 | ) | ||||||||||||||||||||||
|
Other
comprehensive income
|
- | - | - | - | (2,718 | ) | 126 | - | (2,592 | ) | ||||||||||||||||||||||
|
Cash
dividends
|
- | - | - | (6,181 | ) | - | - | - | (6,181 | ) | ||||||||||||||||||||||
|
Issuance
of common stock and other, net
|
- | - | 54 | - | - | - | - | 54 | ||||||||||||||||||||||||
|
Treasury
stock:
|
||||||||||||||||||||||||||||||||
|
Acquired
|
- | - | - | - | - | - | (1,006 | ) | (1,006 | ) | ||||||||||||||||||||||
|
Retired
|
(1 | ) | - | (1,005 | ) | - | - | - | 1,006 | - | ||||||||||||||||||||||
|
Balance
at December 31, 2008
|
24 | 100 | 54,873 | 27,798 | 8,356 | 126 | - | 91,277 | ||||||||||||||||||||||||
|
Net
loss
|
- | - | - | (1,993 | ) | - | - | - | (1,993 | ) | ||||||||||||||||||||||
|
Other
comprehensive income
|
- | - | - | - | 1,998 | (126 | ) | - | 1,872 | |||||||||||||||||||||||
|
Cash
dividends
|
- | - | - | (6,184 | ) | - | - | - | (6,184 | ) | ||||||||||||||||||||||
|
Issuance
of common stock and other, net
|
- | - | 55 | - | - | - | - | 55 | ||||||||||||||||||||||||
|
Balance
at December 31, 2009
|
$ | 24 | $ | 100 | $ | 54,928 | $ | 19,621 | $ | 10,354 | $ | - | $ | - | $ | 85,027 | ||||||||||||||||
See
accompanying Notes to Consolidated Financial Statements.
F - 9
COMPX
INTERNATIONAL INC. AND SUBSIDIARIES
NOTES
TO CONSOLIDATED FINANCIAL STATEMENTS
December
31, 2009
Note
1 - Summary of significant accounting policies:
Organization. We
(NYSE: CIX) are 87% owned by NL Industries, Inc. (NYSE: NL) at December 31,
2009. We manufacture and sell component products (security products,
precision ball bearing slides, ergonomic computer support systems and
performance marine components). At December 31, 2009, (i) Valhi, Inc.
holds approximately 83% of NL’s outstanding common stock and (ii) subsidiaries
of Contran Corporation hold approximately 93% of Valhi’s outstanding common
stock. Substantially all of Contran's outstanding voting stock is
held by trusts established for the benefit of certain children and grandchildren
of Harold C. Simmons (of which Mr. Simmons is sole trustee), or is held by Mr.
Simmons or persons or other entities related to Mr.
Simmons. Consequently, Mr. Simmons may be deemed to control each of
these companies and us.
Unless
otherwise indicated, references in this report to “we,” “us,” or “our” refer to
CompX International Inc. and its subsidiaries, taken as a whole.
Management
estimates. In preparing our financial statements in conformity
with accounting principles generally accepted in the United States of America
(“GAAP”) we are required to make estimates and assumptions that affect the
reported amounts of assets and liabilities and disclosure of contingent assets
and liabilities at each balance sheet date and the reported amounts of our
revenues and expenses during each reporting period. Actual results
may differ significantly from previously-estimated amounts under different
assumptions or conditions.
Principles of
consolidation. Our consolidated
financial statements include the accounts of CompX International Inc. and our
wholly-owned subsidiaries. We eliminate all material intercompany
accounts and balances.
Fiscal
year. Our
fiscal year end is always the Sunday closest to December 31, and our operations
are reported on a 52 or 53-week fiscal year. Each of the years ended
December 31, 2007 and 2008 consisted of 52 weeks. The year ended
December 31, 2009 consisted of 53 weeks.
Translation of
foreign currencies. We translate the
assets and liabilities of our subsidiaries whose functional currency is other
than the U.S. dollar at year-end rates of exchange, while we translate their
revenues and expenses at average exchange rates prevailing during the
year. We accumulate the resulting translation adjustments in
stockholders' equity as part of accumulated other comprehensive income, net of
related deferred income taxes. We recognize currency transaction
gains and losses in income.
Cash and cash
equivalents. We classify as
cash and cash equivalents bank time deposits and government and commercial notes
and bills with original maturities of three months or less.
Net
sales. We record sales
when products are shipped and title and other risks and rewards of ownership
have passed to the customer. Amounts charged to customers for
shipping and handling are not material. Sales are stated net of
price, early payment and distributor discounts and volume rebates. We
report any tax assessed by a governmental authority that we collect from our
customers that is both imposed on and concurrent with our revenue producing
activities (such as sales, use, value added and excise taxes) on a net basis
(meaning we do not recognize these taxes either in our revenues or in our costs
and expenses.)
F - 10
Accounts
receivable. We provide an allowance
for doubtful accounts for known and estimated potential losses rising from our
sales to customers based on a periodic review of these accounts.
Inventories and
cost of sales. We state inventories at the lower
of cost or market, net of allowance for obsolete and slow-moving
inventories. We generally base inventory costs for all inventory
categories on average cost that approximates the first-in, first-out
method. Inventories include the costs for raw materials, the cost to
manufacture the raw materials into finished goods and
overhead. Depending on the inventory’s stage of completion, our
manufacturing costs can include the costs of packing and finishing, utilities,
maintenance and depreciation, shipping and handling, and salaries and benefits
associated with our manufacturing process. We allocate fixed
manufacturing overheads based on normal production
capacity. Unallocated overhead costs resulting from periods with
abnormally low production levels are charged to expense as
incurred. As inventory is sold to third parties, we recognize the
cost of sales in the same period that the sale occurs. We
periodically review our inventory for estimated obsolescence or instances when
inventory is no longer marketable for its intended use, and we record any
write-down equal to the difference between the cost of inventory and its
estimated net realizable value based on assumptions about alternative uses,
market conditions and other factors.
Selling, general
and administrative expenses; advertising costs. Selling, general and
administrative expenses include costs related to marketing, sales, distribution,
research and development and administrative functions such as accounting,
treasury and finance, and includes costs for salaries and benefits, travel and
entertainment, promotional materials and professional fees. We
expense advertising and research development costs as
incurred. Advertising costs were approximately $804,000 in 2007,
$840,000 in 2008, and $466,000 in 2009.
Goodwill and
other intangible assets; amortization expense. Goodwill
represents the excess of cost over fair value of individual net assets acquired
in business combinations. Goodwill is not subject to periodic
amortization. We amortize other intangible assets, consisting
principally of certain acquired patents and tradenames, using the straight line
method over their estimated lives and state them net of accumulated
amortization. We evaluate goodwill for impairment, annually, or when
circumstances indicate the carrying value may not be recoverable. We
evaluate other intangible assets for impairment when events or changes in
circumstances indicate the carrying value may not be recoverable. See
Note 4.
Property and
equipment; depreciation expense. We state property and
equipment, including purchased computer software for internal use, at
cost. We compute depreciation of property and equipment for financial
reporting purposes principally by the straight-line method over the estimated
useful lives of 15 to 40 years for buildings and 3 to 20 years for equipment and
software. We use accelerated depreciation methods for income tax
purposes, as permitted. Depreciation expense was $10.4 million in
2007, $8.6 million in 2008, and $7.6 million in 2009. Upon sale or
retirement of an asset, the related cost and accumulated depreciation are
removed from the accounts and any gain or loss is recognized in income
currently. Expenditures for maintenance, repairs and minor renewals
are expensed; expenditures for major improvements are capitalized.
We
perform impairment tests when events or changes in circumstances indicate the
carrying value may not be recoverable. We consider all relevant
factors. We perform the impairment test by comparing the
estimated future undiscounted cash flows associated with the asset to the
asset’s net carrying value to determine if impairment exists. See
Note 9.
F - 11
Employee benefit
plans. We maintain various defined contribution plans in which
we make contributions based on matching or other formulas. Defined
contribution plan expense approximated $2.5 million in 2007, $2.1 million in
2008 and $1.5 million in 2009.
Self-insurance. We are partially
self-insured for workers' compensation and certain employee health benefits and
self-insured for most environmental issues. We purchase coverage in
order to limit our exposure to any significant levels of workers' compensation
or employee health benefit claims. We accrue self-insured losses
based upon estimates of the aggregate liability for uninsured claims incurred
using certain actuarial assumptions followed in the insurance industry and our
own historical claims experience.
Derivatives and
hedging activities. Certain of our sales generated by our
non-U.S. operations are denominated in U.S. dollars. We periodically
use currency forward contracts to manage a portion of currency exchange rate
market risk associated with receivables, or similar exchange rate risk
associated with future sales, denominated in a currency other than the holder's
functional currency. We have not entered into these contracts for
trading or speculative purposes in the past, nor do we anticipate entering into
such contracts for trading or speculative purposes in the
future. Most of our currency forward contracts meet the criteria for
hedge accounting under GAAP and are designated as cash flow
hedges. For these currency forward contracts, gains and losses
representing the effective portion of our hedges are deferred as a component of
accumulated other comprehensive income, and are subsequently recognized in
earnings at the time the hedged item affects earnings. Occasionally,
we enter into currency forward contracts which do not meet the criteria for
hedge accounting. For these contracts, we mark-to-market
the estimated fair value of the contracts at each balance sheet date based on
quoted market prices for the forward contracts, with any resulting gain or loss
recognized in income currently as part of net currency
transactions. The quoted market prices for the forward contracts are
a Level 1 input as defined by ASC 820-10-35. We had no
currency forward contracts outstanding at December 31, 2009. At
December 31, 2008, we held a series of contracts to exchange an aggregate of
U.S. $7.5 million for an equivalent value of Canadian dollars at exchange rates
ranging from Cdn. $1.25 to $1.26 per U.S. dollar. These contracts
qualified for hedge accounting and matured through June 2009. The
exchange rate was $1.22 per U.S. dollar at December 31, 2008. The
estimated fair value of the contracts was not material at December 31,
2008.
Income
taxes. We are a member
of the Contran Tax Group. We have been and currently are a part of
the consolidated tax returns filed by Contran in certain United States state
jurisdictions. As a member of the Contran Tax Group, we are jointly
and severally liable for the federal income tax liability of Contran and the
other companies included in the Contran Tax Group for all periods in which we
are included in the Contran Tax Group. See Note 12.
As a
member of the Contran Tax Group, we are a party to a tax sharing agreement which
provides that we compute our provision for U.S. income taxes on a
separate-company basis. Pursuant to the tax sharing agreement, we make payments
to or receive payments from NL in amounts we would have paid to or received from
the U.S. Internal Revenue Service or the applicable state tax authority had we
not been a member of the Contran Tax Group. The separate company provisions and
payments are computed using the tax elections made by Contran. Under
certain circumstances, such tax elections could require Contran to treat items
differently than we would on a stand alone basis, and in such instances GAAP
requires us to conform to Contran’s tax election. We made net cash
payments for taxes to NL of $9.5 million and $5.2 million in 2007 and 2008,
respectively, and received a net refund from NL of approximately $360,000 in
2009.
F - 12
Deferred
income tax assets and liabilities are recognized for the expected future tax
consequences of temporary differences between the income tax and financial
reporting carrying amounts of assets and liabilities, including undistributed
earnings of foreign subsidiaries which are not permanently reinvested. Earnings
of foreign subsidiaries subject to permanent reinvestment plans aggregated $5.7
million, $5.6 million, and $5.7 million at December 31, 2007, 2008 and 2009,
respectively. Determination of the amount of unrecognized deferred tax liability
on such permanent reinvestment plans was not practicable. We
periodically evaluate our deferred tax assets in the various taxing
jurisdictions in which we operate and adjust any related valuation allowance
based on the estimate of the amount of such deferred tax assets which we believe
do not meet the more-likely-than-not recognition criteria.
We record
a reserve for uncertain tax positions for tax positions where we believe it is
more-likely-than-not our position will not prevail with the applicable tax
authorities. See Note 13.
Earnings per
share. Basic earnings
per share of common stock is computed using the weighted average number of
common shares actually outstanding during each period. Diluted
earnings per share of common stock includes the impact of outstanding dilutive
stock options. The weighted average number of outstanding stock
options excluded from the calculation of diluted earnings per share because
their impact would have been antidilutive aggregated approximately 368,000 in
2007, 172,000 in 2008 and 91,000 in 2009.
Note
2 - Business and geographic segments:
Our
operating segments are defined as components of our operations about which
separate financial information is available that is regularly evaluated by our
chief operating decision maker in determining how to allocate resources and in
assessing performance. Our chief operating decision maker is Mr.
David A. Bowers, our president and chief executive officer. We have
three operating segments – Security Products, Furniture Components and Marine
Components. The Security Products segment, with a facility in South
Carolina and a facility shared with Marine Components in Illinois, manufactures
locking mechanisms and other security products for sale to the office furniture,
transportation, postal, banking, vending and other industries. The
Furniture Components segment, with facilities in Canada, Michigan and Taiwan,
manufactures and distributes a complete line of precision ball bearing slides
and ergonomic computer support systems for use in office furniture,
computer-related equipment, tool storage cabinets, appliances and other
applications. Our Marine Components segment with a facility in
Wisconsin and a facility shared with Security Products in Illinois manufactures
and distributes marine instruments, hardware and accessories for performance
boats.
The chief
operating decision maker evaluates segment performance based on segment
operating income, which is defined as income before income taxes, and interest
expense, exclusive of certain general corporate income and expense items
(primarily interest income) and certain non-recurring items (such as gains or
losses on the disposition of business units and other long-lived assets outside
the ordinary course of business). The accounting policies of the
reportable operating segments are the same as those described in Note
1. Capital expenditures include additions to property and equipment,
but exclude amounts attributable to business combinations.
Segment
assets are comprised of all assets attributable to the reportable
segments. Corporate assets are not attributable to the operating
segments and consist primarily of cash, cash equivalents and notes receivable
and, at December 31, 2007 and 2008, assets held for sale. See Note
9. For geographic information, net sales are attributable to the
place of manufacture (point of origin) and the location of the customer (point
of destination); property and equipment are attributable to their physical
location. At December 31, 2008 and 2009, the net assets of non-U.S.
subsidiaries included in consolidated net assets approximated $32.8 million and
$32.1 million, respectively. Intersegment sales are not
material.
F - 13
|
Years ended December 31,
|
||||||||||||
|
2007
|
2008
|
2009
|
||||||||||
|
(In
thousands)
|
||||||||||||
|
Net
sales:
|
||||||||||||
|
Security
Products
|
$ | 80,085 | $ | 77,094 | $ | 61,429 | ||||||
|
Furniture
Components
|
81,331 | 76,405 | 48,212 | |||||||||
|
Marine
Components
|
16,267 | 12,003 | 6,484 | |||||||||
|
Total
net sales
|
$ | 177,683 | $ | 165,502 | $ | 116,125 | ||||||
|
Operating
income:
|
||||||||||||
|
Security
Products
|
$ | 12,218 | (a) | $ | 12,715 | $ | 9,714 | |||||
|
Furniture
Components
|
8,001 | 9,205 | (4,693 | )(c) | ||||||||
|
Marine
Components
|
799 | (10,456 | )(b) | (3,046 | ) | |||||||
|
Corporate
operating expenses
|
(5,462 | ) | (5,278 | ) | (6,011 | )(d) | ||||||
|
Total
operating income (loss)
|
15,556 | 6,186 | (4,036 | ) | ||||||||
|
Other
non-operating income, net
|
1,133 | 240 | 45 | |||||||||
|
Interest
expense
|
(760 | ) | (2,362 | ) | (1,060 | ) | ||||||
|
Income
(loss) from continuing operations before income taxes
|
$ | 15,929 | $ | 4,064 | $ | (5,051 | ) | |||||
|
Depreciation
and amortization:
|
||||||||||||
|
Security
Products
|
$ | 4,574 | $ | 3,557 | $ | 3,560 | ||||||
|
Furniture
Components
|
5,457 | 4,583 | 3,475 | |||||||||
|
Marine
Components
|
958 | 1,080 | 1,170 | |||||||||
|
Corporate
Depreciation
|
21 | 11 | 4 | |||||||||
|
Total
|
$ | 11,010 | $ | 9,231 | $ | 8,209 | ||||||
|
Capital
expenditures:
|
||||||||||||
|
Security
Products
|
$ | 12,240 | $ | 4,348 | $ | 1,361 | ||||||
|
Furniture
Components
|
1,349 | 1,823 | 1,010 | |||||||||
|
Marine
Components
|
896 | 1,131 | 51 | |||||||||
|
Total
|
$ | 14,485 | $ | 7,302 | $ | 2,422 | ||||||
(a)
Includes $2.7 million of costs related to the consolidation of three of our
northern Illinois facilities into one facility. See Note
9.
(b) We
recorded a $9.9 million goodwill impairment charge for Marine Components in
2008. This represents all of the goodwill we had previously
recognized for this reporting unit. See Note 4.
(c)
Includes $4.6 million of patent litigation expenses. See Note
12
(d) We
recorded a $717,000 write-down to corporate operating expenses related to our
assets held for sale at December 31, 2009. See Note
9.
F - 14
|
Years ended December 31,
|
||||||||||||
|
2007
|
2008
|
2009
|
||||||||||
|
(In
thousands)
|
||||||||||||
|
Net
sales:
|
||||||||||||
|
Point
of origin:
|
||||||||||||
|
United
States
|
$ | 118,460 | $ | 115,470 | $ | 84,786 | ||||||
|
Canada
|
52,684 | 46,519 | 29,065 | |||||||||
|
Taiwan
|
11,714 | 8,268 | 5,811 | |||||||||
|
Eliminations
|
(5,175 | ) | (4,755 | ) | (3,537 | ) | ||||||
|
Total
|
$ | 177,683 | $ | 165,502 | $ | 116,125 | ||||||
|
Point
of destination:
|
||||||||||||
|
United
States
|
$ | 147,716 | $ | 134,247 | $ | 95,974 | ||||||
|
Canada
|
19,251 | 16,920 | 10,445 | |||||||||
|
Other
|
10,716 | 14,335 | 9,706 | |||||||||
|
Total
|
$ | 177,683 | $ | 165,502 | $ | 116,125 | ||||||
|
December 31,
|
||||||||||||
| 2007 | 2008 | 2009 | ||||||||||
|
(In
thousands)
|
||||||||||||
|
Total
assets:
|
||||||||||||
|
Security
Products
|
$ | 80,051 | $ | 77,681 | $ | 72,210 | ||||||
|
Furniture
Components
|
67,184 | 59,148 | 54,229 | |||||||||
|
Marine
Components
|
26,436 | 14,953 | 11,129 | |||||||||
|
Corporate
and eliminations
|
14,044 | 11,620 | 16,479 | |||||||||
|
Total
|
$ | 187,715 | $ | 163,402 | $ | 154,047 | ||||||
|
Net
property and equipment:
|
||||||||||||
|
United
States
|
$ | 50,876 | $ | 51,327 | $ | 47,086 | ||||||
|
Canada
|
13,912 | 8,987 | 9,224 | |||||||||
|
Taiwan
|
7,363 | 7,115 | 7,326 | |||||||||
|
Total
|
$ | 72,151 | $ | 67,429 | $ | 63,636 | ||||||
F - 15
Note
3 – Inventories:
|
December 31,
|
||||||||
|
2008
|
2009
|
|||||||
|
(In
thousands)
|
||||||||
|
Raw
materials:
|
||||||||
|
Security
Products
|
$ | 2,406 | $ | 2,037 | ||||
|
Furniture
Components
|
4,077 | 1,964 | ||||||
|
Marine
Components
|
1,069 | 829 | ||||||
|
Total
raw materials
|
7,552 | 4,830 | ||||||
|
Work-in-process:
|
||||||||
|
Security
Products
|
6,244 | 4,917 | ||||||
|
Furniture
Components
|
1,333 | 948 | ||||||
|
Marine
Components
|
648 | 286 | ||||||
|
Total
work-in-process
|
8,225 | 6,151 | ||||||
|
Finished
products
|
||||||||
|
Security
Products
|
2,268 | 1,747 | ||||||
|
Furniture
Components
|
3,068 | 2,601 | ||||||
|
Marine
Components
|
1,548 | 937 | ||||||
|
Total
finished goods
|
6,884 | 5,285 | ||||||
|
Total
inventories, net
|
$ | 22,661 | $ | 16,266 | ||||
Note
4 – Goodwill and other intangible assets:
We have
assigned goodwill to each of our reporting units (as that term
is defined in ASC Topic 350-20-20, Goodwill) which correspond to
our operating segments. We test for goodwill impairment at the
reporting unit level. In accordance with the requirements of ASC
Topic 350-20-20, we review goodwill for each of our three reporting units for
impairment during the third quarter of each year or when circumstances arise
that indicate an impairment might be present. In determining the
estimated fair value of the reporting units, we use appropriate valuation
techniques, such as discounted cash flows. Such discounted cash flows
are a Level 3 input as defined by ASC 820-10-35 (although this guidance was not
in effect with respect to estimating the fair value of a reporting unit until
January 1, 2009). If the carrying amount of goodwill exceeds its
implied fair value, an impairment charge is recorded. Our 2007 and
2009 annual impairment reviews of goodwill indicated no
impairments. The only goodwill impairment we have recorded since we
began testing goodwill on an annual basis in the 2008 impairment noted
below.
During
the third quarter of 2008, we recorded a goodwill impairment charge of $9.9
million for our Marine Components reporting unit, which represented all of the
goodwill we had previously recognized for this reporting unit. We
used a discounted cash flow methodology in determining the estimated fair value
of our Marine Components reporting unit. The factors that led us to
conclude goodwill associated with our Marine Components reporting unit was fully
impaired include the continued decline in consumer spending in the marine market
as well as the overall negative economic outlook, both of which resulted in
near-term and longer-term reduced revenue, profit and cash flow forecasts for
the Marine Components unit. While we continue to believe in the long
term potential of the Marine Components reporting unit, due to the extraordinary
economic downturn in the marine industry we are not currently able to foresee
when the industry and our business will recover. In response to the
present economic conditions, we have taken steps to reduce operating costs
without inhibiting our ability to take advantage of opportunities to expand our
market share.
F - 16
During
2009 due to the continued unfavorable economic trends associated with our
Furniture Components reporting unit including, among other things, sales and
operating income falling materially below our projections, we re-evaluated
goodwill associated with this reporting unit at the first and second interim
periods of 2009, along with the annual testing date in the third
quarter. At each interim and annual testing date, we concluded that
no impairments were present. At December 31, 2009 our Furniture
Components reporting unit had approximately $7.2 million of
goodwill.
Changes
in the carrying amount of goodwill related to our operations during the past
three years are presented in the table below. Goodwill was generated
principally from acquisitions of certain business units during 1998, 1999, 2000,
and Marine Components acquisitions in August 2005 and April 2006.
|
Security
Products
|
Furniture
Components
|
Marine
Components
|
Total
|
|||||||||||||
|
(In
millions)
|
||||||||||||||||
|
Balance
at December 31, 2006
|
$ | 23.7 | $ | 7.1 | $ | 9.9 | $ | 40.7 | ||||||||
|
Changes
in currency exchange rates
|
- | 0.1 | - | 0.1 | ||||||||||||
|
Balance
at December 31, 2007
|
23.7 | 7.2 | 9.9 | 40.8 | ||||||||||||
|
Goodwill
impairment
|
- | - | (9.9 | ) | (9.9 | ) | ||||||||||
|
Changes
in currency exchange rates
|
- | (0.1 | ) | - | (0.1 | ) | ||||||||||
|
Balance
at December 31, 2008
|
23.7 | 7.1 | - | 30.8 | ||||||||||||
|
Changes
in currency exchange rates
|
- | 0.1 | - | 0.1 | ||||||||||||
|
Balance
at December 31, 2009
|
$ | 23.7 | $ | 7.2 | $ | - | $ | 30.9 | ||||||||
Other
intangible assets totaled $2.0 million and $1.4 million net of accumulated
amortization of $3.6 million and $4.2 million at December 31, 2008 and 2009,
respectively.
Amortization
of intangible assets was $604,000 in 2007, $591,000 in 2008, and $588,000 in
2009, respectively. Estimated aggregate intangible asset amortization
expense for the next five years is as follows:
|
Years ending December 31,
|
Amount
|
|||
|
(In
thousands)
|
||||
|
2010
|
$ | 600 | ||
|
2011
|
400 | |||
|
2012
|
300 | |||
|
2013
|
108 | |||
|
2014
|
- | |||
|
Total
|
$ | 1,408 | ||
F - 17
Note
5 - Accounts payable and accrued liabilities:
|
December 31,
|
||||||||
|
2008
|
2009
|
|||||||
|
(In
thousands)
|
||||||||
|
Accounts
payable
|
$ | 4,985 | $ | 4,309 | ||||
|
Accrued
liabilities:
|
||||||||
|
Employee
benefits
|
6,571 | 6,003 | ||||||
|
Professional
|
222 | 1,805 | ||||||
|
Customer
tooling
|
787 | 761 | ||||||
|
Insurance
|
458 | 601 | ||||||
|
Taxes
other than on income
|
447 | 422 | ||||||
|
Other
|
786 | 666 | ||||||
|
Total
|
$ | 14,256 | $ | 14,567 | ||||
Note
6 - Credit facility:
At
December 31, 2009, we had a $37.5 million revolving credit facility that matures
in January 2012. Until the end of March 2011, any outstanding
borrowings are limited to the sum of 80% of our consolidated net accounts
receivable, 50% of our consolidated raw material inventory, 50% of our
consolidated finished goods inventory and 100% of our consolidated unrestricted
cash and cash equivalents. Any amounts outstanding under the credit
facility bear interest, at our option, at either the prime rate plus a margin or
LIBOR plus a margin. The credit facility is collateralized by 65% of
the ownership interests in our first-tier non-U.S. subsidiaries. The
facility as amended, contains certain covenants and restrictions customary in
lending transactions of this type, which among other things restricts our
ability and that of our subsidiaries to incur debt, incur liens, pay dividends
or merge or consolidate with, or transfer all or substantially all assets to,
another entity. The facility also requires maintenance of specified
levels of net worth (as defined). In the event of a change of
control, as defined, the lenders would have the right to accelerate the maturity
of the facility. One of our financial performance covenants requires
earnings before interest and taxes for the trailing four quarters (not including
quarters prior to September 2009) to be 2.5 times cash interest
expense. As a result of our loss before interest and taxes at
December 31, 2009, we could not have had any borrowings outstanding under the
Credit Agreement without violating the covenant as any cash interest incurred
would have exceeded our required 2.5 to 1 ratio. At December 31, 2008
and 2009, no amounts were outstanding under the facility. We believe
we will be able to comply with the current covenants through the maturity of the
facility in January 2012; however if future operating results differ materially
from our predictions we may be unable to maintain compliance.
The
credit facility permits us to pay dividends and/or repurchase common stock in an
amount equal to the sum of (i) $.125 per share in any calendar quarter, not to
exceed $8.0 million in any calendar year, plus (ii) $20.0 million plus 50% of
aggregate net income over the term of the credit facility. In
addition to the permitted $.125 per share amount to repurchase our common stock
and/or to pay dividends, at December 31, 2009, $19.4 million was available for
dividends and/or repurchases of our common stock under the terms of the
facility.
F - 18
Note
7 - Income taxes:
The
components of pre-tax income, the provision for income taxes attributable to
continuing operations, the difference between the provision for income taxes and
the amount that would be expected using the U.S. federal statutory income tax
rate of 35%, and the comprehensive provision for income taxes are presented
below.
|
Years ended December 31,
|
||||||||||||
|
2007
|
2008
|
2009
|
||||||||||
|
(In
thousands)
|
||||||||||||
|
Components
of pre-tax income (loss):
|
||||||||||||
|
United
States
|
$ | 8,647 | $ | (5,253 | ) | $ | (3,063 | ) | ||||
|
Non-U.S.
|
7,282 | 9,317 | (1,988 | ) | ||||||||
|
Total
|
$ | 15,929 | $ | 4,064 | $ | (5,051 | ) | |||||
|
Provision
(benefit) for income taxes:
|
||||||||||||
|
Currently
payable (refundable:
|
||||||||||||
|
U.S.
federal and state
|
$ | 9,902 | $ | 3,570 | $ | (271 | ) | |||||
|
Foreign
|
3,596 | 3,640 | (694 | ) | ||||||||
| 13,498 | 7,210 | (965 | ) | |||||||||
|
Deferred
income taxes (benefit):
|
||||||||||||
|
U.S.
federal and state
|
(6,503 | ) | 117 | (1,992 | ) | |||||||
|
Foreign
|
(46 | ) | (162 | ) | (101 | ) | ||||||
| (6,549 | ) | (45 | ) | (2,093 | ) | |||||||
|
Total
|
$ | 6,949 | $ | 7,165 | $ | (3,058 | ) | |||||
|
Expected
tax expense (benefit), at the U.S. federal
statutory income tax rate of 35%
|
$ | 5,575 | $ | 1,422 | $ | (1,768 | ) | |||||
|
Non-U.S.
tax rates
|
(237 | ) | (328 | ) | 74 | |||||||
|
Incremental
U.S. tax on earnings of foreign subsidiaries
|
1,384 | 2,777 | (1,092 | ) | ||||||||
|
State
income taxes and other, net
|
404 | 255 | 3 | |||||||||
|
No
income tax benefit on goodwill impairment
|
- | 3,459 | - | |||||||||
|
Impact
of tax rate changes
|
152 | (4 | ) | (76 | ) | |||||||
|
Tax
credits
|
(329 | ) | (195 | ) | (199 | ) | ||||||
|
Tax
contingency reserve adjustments, net
|
- | (221 | ) | - | ||||||||
|
Total
|
$ | 6,949 | $ | 7,165 | $ | (3,058 | ) | |||||
F - 19
The
goodwill impairment charge in 2008 was not deductible for income tax purposes,
and therefore we did not recognize an income tax benefit related to the
charge.
The
components of net deferred tax assets (liabilities) are summarized
below.
|
December 31,
|
||||||||
|
2008
|
2009
|
|||||||
|
(In
thousands)
|
||||||||
|
Tax
effect of temporary differences related to:
|
||||||||
|
Inventories
|
$ | 850 | $ | 820 | ||||
|
Tax
on unremitted earnings of non-U.S. subsidiaries
|
(5,615 | ) | (4,464 | ) | ||||
|
Property
and equipment
|
(5,442 | ) | (5,441 | ) | ||||
|
Accrued
liabilities and other deductible differences
|
987 | 1,122 | ||||||
|
Tax
loss and credit carryforwards
|
4,112 | 4,180 | ||||||
|
Other
taxable differences
|
(2,291 | ) | (2,263 | ) | ||||
|
Valuation
allowance
|
(3,901 | ) | (3,901 | ) | ||||
|
Total
|
$ | (11,300 | ) | $ | (9,947 | ) | ||
|
Net
current deferred tax assets
|
1,821 | 1,928 | ||||||
|
Net
noncurrent deferred tax liabilities
|
(13,121 | ) | (11,875 | ) | ||||
|
Total
|
$ | (11,300 | ) | $ | (9,947 | ) | ||
Utilization
of our net operating loss carryforwards has been limited to approximately
$400,000 per tax year, and we utilized such $400,000 amount in each of 2007,
2008, and 2009. At December 31, 2009, our remaining net operating
loss carryforward is immaterial and will be fully utilized in
2010. Accordingly, we have not provided a deferred income tax asset
valuation allowance to offset the benefit of the carryforwards.
We
generated a $3.9 million federal income tax benefit associated with a U.S.
capital loss realized in 2005. We determined based on the weight of
the available evidence that realization of the benefit of the capital loss did
not and continues not to meet the more-likely-than-not recognition
criteria. Therefore, we have also recognized a deferred income tax
asset valuation allowance to fully offset the deferred tax asset related to the
capital loss carryforward. This capital loss carryforward expires in
2010.
F - 20
Note
8 – Stockholders’ equity:
|
Shares of common
stock
|
||||||||||||||||
|
Class A
|
Class B
|
|||||||||||||||
|
Issued
|
Treasury
|
Outstanding
|
Issued
and
outstanding
|
|||||||||||||
|
Balance
at December 31, 2006
|
5,266,980 | - | 5,266,980 | 10,000,000 | ||||||||||||
|
Affiliate
repurchase:
|
||||||||||||||||
|
Issued
|
374,000 | - | 374,000 | 10,000,000 | ||||||||||||
|
Reacquired
|
- | (483,600 | ) | (483,600 | ) | - | ||||||||||
|
Retirement
|
(3,070,420 | ) | 483,600 | (2,586,820 | ) | (10,000,000 | ) | |||||||||
|
Total
affiliate repurchase
|
(2,696,420 | ) | - | (2,696,420 | ) | - | ||||||||||
|
Other:
|
||||||||||||||||
|
Issued
|
87,300 | - | 87,300 | - | ||||||||||||
|
Reacquired
|
- | (179,100 | ) | (179,100 | ) | - | ||||||||||
|
Retirement
|
(179,100 | ) | 179,100 | - | - | |||||||||||
|
Total
other
|
(91,800 | ) | - | (91,800 | ) | - | ||||||||||
|
Balance
at December 31, 2007
|
2,478,760 | - | 2,478,760 | 10,000,000 | ||||||||||||
|
Issued
|
9,000 | - | 9,000 | - | ||||||||||||
|
Reacquired
|
- | (126,453 | ) | (126,453 | ) | - | ||||||||||
|
Retirement
|
(126,453 | ) | 126,453 | - | - | |||||||||||
|
Balance
at December 31, 2008
|
2,361,307 | - | 2,361,307 | 10,000,000 | ||||||||||||
|
Issued
|
9,000 | - | 9,000 | - | ||||||||||||
|
Balance
at December 31, 2009
|
2,370,307 | - | 2,370,307 | 10,000,000 | ||||||||||||
Class A and Class B common
stock. The shares of Class A common stock and Class B common
stock are identical in all respects, except for certain voting rights and
certain conversion rights in respect of the shares of the Class B common
stock. Holders of Class A common stock are entitled to one vote per
share. NL, which holds all of the outstanding shares of Class B
common stock, is entitled to one vote per share in all matters except for
election of directors, for which NL is entitled to ten votes per
share. Holders of all classes of common stock entitled to vote will
vote together as a single class on all matters presented to the stockholders for
their vote or approval, except as otherwise required by applicable
law. Each share of Class A common stock and Class B common stock have
an equal and ratable right to receive dividends to be paid from our assets when,
and if declared by the board of directors. In the event of the
dissolution, liquidation or winding up of our operations, the holders of Class A
common stock and Class B common stock will be entitled to share equally and
ratably in the assets available for distribution after payments are made to our
creditors and to the holders of any of our preferred stock that may be
outstanding at the time. Shares of the Class A common stock have no
conversion rights. Under certain conditions, shares of Class B common
stock will convert, on a share-for-share basis, into shares of Class A common
stock.
Share repurchases and
cancellations. In August 2007, our board of directors
authorized the repurchase of up to 500,000 shares of our Class A common stock in
open market transactions, including block purchases, or in privately-negotiated
transactions at unspecified prices and over an unspecified period of
time. This authorization was in addition to the 467,000 shares of
Class A common stock that remained available at the close of business on August
9, 2007 for repurchase under prior authorizations of our board of
directors. We may repurchase our common stock from time to time as
market conditions permit. The stock repurchase program does not
include specific price targets or timetables and may be suspended at any
time. Depending on market conditions, we may terminate the program
prior to its completion. We will use cash on hand to acquire the
shares. Repurchased shares will be added to our treasury and
cancelled.
F - 21
During
2007 and 2008, we purchased approximately 179,100 and 126,453 shares of our
Class A common stock in market transactions for an aggregate of $3.3 million and
$1.0 million in cash, respectively. We cancelled these treasury
shares and allocated their cost to common stock at par value and additional
paid-in capital. We made no treasury purchases during 2009 and at
December 31, 2009, approximately 678,000 shares were available for purchase
under these authorizations.
In
October 2007, our board of directors authorized the repurchase or cancellation
of a net 2.7 million shares of our Class A common stock held directly and
indirectly by Timet Finance Management Company, a subsidiary of Titanium Metals
Corporation and an affiliate of ours (“TFMC”). We purchased or
cancelled these shares for $19.50 per share, or aggregate consideration of $52.6
million, which we paid in the form of a promissory note. The price
per share was determined based on open market transactions of our Class A common
stock around the time the repurchase or cancellation of these shares was
approved. The authorization for the repurchase or cancellation of
these Class A shares from TFMC was in addition to the share repurchase
authorizations discussed above. See Note 11. We
allocated the cost of these repurchases and/or cancellations to common stock at
par value and additional paid-in capital.
Incentive compensation
plan. The CompX International Inc. 1997 Long-Term Incentive
Plan provides for the award or grant of stock options, stock appreciation
rights, performance grants and other awards to employees and other individuals
who provide services to us. Up to 1.5 million shares of Class A
Common Stock may be issued pursuant to the plan. Employee stock
options are granted at prices not less than the market price of our stock on the
date of grant, vest over five years and expire ten years from the date of
grant. The following table sets forth changes in outstanding options
during the past three years.
|
Shares
|
Exercise
price
per
share
|
Amount
payable
upon
exercise
|
Weighted
average
exercise
price
|
|||||||||||||
|
(In
000’s)
|
(In
000’s)
|
|||||||||||||||
|
Outstanding at December 31, 2006
|
437 | $ | 10.00 – 20.00 | $ | 8,170 | $ | 18.70 | |||||||||
|
Exercised
|
(81 | ) | 10.00 – 20.00 | (1,394 | ) | 17.21 | ||||||||||
|
Canceled
|
(7 | ) | 17.94 - 20.00 | (133 | ) | 19.00 | ||||||||||
|
Outstanding at December 31, 2007
|
349 | $ | 12.15 – 20.00 | $ | 6,643 | $ | 19.03 | |||||||||
|
Canceled
|
(215 | ) | 20.00 | (4,300 | ) | 20.00 | ||||||||||
|
Outstanding at December 31, 2008
|
134 | $ | 12.15 – 19.25 | $ | 2,343 | $ | 17.49 | |||||||||
|
Canceled
|
(53 | ) | 15.88 - 18.38 | (936 | ) | 17.66 | ||||||||||
|
Outstanding at December 31, 2009
|
81 | $ | 12.15 – 19.25 | $ | 1,407 | $ | 17.37 | |||||||||
Outstanding
options at December 31, 2009 represent less than 1% of our total outstanding
shares of common stock at that date and expire at various dates through 2012
with a weighted-average remaining term of less than 1 year. Our
market price per share at December 31, 2009 was $7.57. All of the
fully-vested 81,000 outstanding options at December 31, 2009 were exercisable at
prices higher than such December 31, 2009 market price per share. At
December 31, 2009, an aggregate of 922,820 shares were available for future
grants. Shares issued under the incentive stock plan are generally
newly-issued shares. The intrinsic value of our options exercised in
2007 aggregate to approximately $241,400 and the related income tax benefit from
the exercises was $77,000. No stock options were exercised in 2008 or
2009.
F - 22
Note
9 – Facility consolidation and assets held for sale
Prior to
2007, we had three facilities in northern Illinois, two Security Products
facilities (located in Lake Bluff, Illinois and River Grove, Illinois) and one
Marine Components facility (located in Grayslake, Illinois). In order
to create opportunities to reduce operating costs and improve operating
efficiencies, we determined that it would be more effective to consolidate these
three operations into one location. In 2006, we acquired land
adjacent to the Marine Components facility for approximately $1.8 million in
order to expand the facility, and during 2007 we incurred approximately $9.6
million of capital expenditures in connection with the expansion.
In
addition to the capital expenditures, during 2007, we incurred approximately
$2.7 million in expenses relating to the facility consolidation including
physical move costs, equipment installation, redundant labor and recruiting fees
and write downs for fixed assets no longer in use, all of which are included in
facility consolidation expense in the accompanying Consolidated Statements of
Operations. The majority of these costs were incurred during the
fourth quarter of 2007.
The fixed
asset write downs amounted to $765,000 of which $600,000 related to the
classification of the River Grove facility as an “asset held for sale” in
November 2007 as it was no longer being utilized and met all of the criteria
under GAAP to be classified as an “asset held for sale.” In
classifying the facility and related assets (primarily land, building, and
building improvements) as held for sale, we concluded that the carrying amount
of the assets exceeded the estimated fair value less costs to sell such
assets. In determining the estimated fair value of such assets, we
considered recent sales prices for other property near the facility, Level 2
inputs as defined by Accounting Standards Topic (“ASC”) 820-10-35, Fair Value Measurements and
Disclosures. Accordingly, we recognized $600,000 to write-down
the assets to their estimated net realizable value of approximately $3.1 million
at December 31, 2007.
Our
assets held for sale at December 31, 2009, consist of the River Grove facility
discussed above and a facility in Neenah, Wisconsin. These two
properties (primarily land, buildings and building improvements) were formerly
used in our operations. Discussions with potential buyers of both
properties had been active through the first quarter of
2009. Subsequently during the second quarter of 2009, and as weak
economic conditions continued longer than expected, we concluded that it was
unlikely we would sell these properties at or above their previous carrying
values in the near term and therefore an adjustment to their carrying values was
appropriate. In determining the estimated fair values of the
properties, we considered recent sales prices for other properties near the
facilities, which prices are Level 2 inputs as defined by ASC
820-10-35. Accordingly, during the second quarter of 2009, we
recorded a write-down of approximately $717,000 to reduce the carrying value of
these assets to their aggregate estimated fair value less cost to sell of $2.8
million. This charge is included in corporate operating
expense. Both properties are being actively
marketed. However, due to the current state of the commercial real
estate market, we can not be certain of the timing of the disposition of the
assets.
F - 23
Note
10 – Other non-operating income, net:
|
Years ended December 31,
|
||||||||||||
|
2007
|
2008
|
2009
|
||||||||||
|
(In
thousands)
|
||||||||||||
|
Interest
income
|
$ | 1,324 | $ | 389 | $ | 43 | ||||||
|
Other
income (expense), net
|
(191 | ) | (149 | ) | 2 | |||||||
|
Total
|
$ | 1,133 | $ | 240 | $ | 45 | ||||||
Note
11
- Related
party transactions:
We may be
deemed to be controlled by Harold C. Simmons. See Note
1. Corporations that may be deemed to be controlled by or affiliated
with Mr. Simmons sometimes engage in (a) intercorporate transactions such as
guarantees, management and expense sharing arrangements, shared fee
arrangements, joint ventures, partnerships, loans, options, advances of funds on
open account, and sales, leases and exchanges of assets, including securities
issued by both related and unrelated parties and (b) common investment and
acquisition strategies, business combinations, reorganizations,
recapitalizations, securities repurchases, and purchases and sales (and other
acquisitions and dispositions) of subsidiaries, divisions or other business
units, which transactions have involved both related and unrelated parties and
have included transactions which resulted in the acquisition by one related
party of a publicly-held minority equity interest in another related
party. We continuously consider, review and evaluate, and understand
that Contran and related entities consider, review and evaluate such
transactions. Depending upon the business, tax and other objectives
then relevant, it is possible that we might be a party to one or more such
transactions in the future.
From time
to time, we will have loans and advances outstanding between us and various
related parties pursuant to term and demand notes. We generally enter
into these loans and advances for cash management purposes. When we
loan funds to related parties, we are generally able to earn a higher rate of
return on the loan than we would earn if we invested the funds in other
instruments. While certain of these loans may be of a lesser credit
quality than cash equivalent instruments otherwise available to us, we believe
we have evaluated the credit risks in the terms of the applicable
loans. In this regard, in February 2010 we entered into an unsecured
revolving demand promissory note with NL whereby we agreed to loan NL up to $8.0
million. Our loans to NL will bear interest at the prime less .75%,
with all principal due on demand on or after March 31, 2011 (and in any event no
later than December 31, 2012), with interest payable quarterly. The
amount of our outstanding loans to NL at any time is at our
discretion.
In
October 2007, we purchased and/or cancelled a net 2.7 million shares of our
Class A common stock from TFMC. We purchased and/or cancelled these
shares for $19.50 per share, or aggregate consideration of $52.6 million, which
we paid in the form of a promissory note. The promissory note, as
amended, bears interest at LIBOR plus 1% (1.25% at December 31, 2009) and
provides for quarterly principal repayments of $250,000 commencing in March
2011, with the balance due at maturity in September 2014. The
promissory note is subordinated to our U.S. revolving bank credit
agreement. See Note 6. Prior to September 2009, we made
required quarterly interest payments and made quarterly principal repayments of
$250,000 commencing in September 2008, and we could also make principal
prepayments at any time, in any amount, without penalty, including $2.6 million
paid in the fourth quarter of 2007 and $7.0 million paid during
2008. The promissory note is subordinated to our U.S. revolving bank
credit agreement, and no further payments or interest are due until March
2011. See Note 6. We may make additional prepayments on or
after March 31, 2011, subject to meeting certain conditions specified in the
revolving bank credit agreement. At December 31, 2009, the principal
amount outstanding under the promissory note was approximately $42.2 million and
the amount of related accrued and unpaid interest was approximately
$311,000. We recognized interest expense of approximately $559,000 in
2007, $2.2 million in 2008 and $816,000 in 2009 on the promissory
note. The scheduled principal repayments of the promissory note are
shown in the table below.
F - 24
|
Years ending December 31,
|
Amount
|
|||
|
(In
thousands)
|
||||
|
2010
|
$ | - | ||
|
2011
|
1,000 | |||
|
2012
|
1,000 | |||
|
2013
|
1,000 | |||
|
2014
|
39,230 | |||
|
Thereafter
|
- | |||
|
Total
|
$ | 42,230 | ||
Under the
terms of various Intercorporate Service Agreements (“ISAs”) with Contran,
employees of Contran perform certain management, tax planning, financial, legal
and administrative services for us on a fee basis. Such fees are
based upon estimates of time devoted to our affairs by individual Contran
employees and the compensation of such persons. Because of the large
number of companies affiliated with Contran, we believe we benefit from cost
savings and economies of scale gained by not having certain management,
financial and administrative staffs duplicated at each entity, thus allowing
certain individuals to provide services to multiple companies but only be
compensated by one entity. Fees pursuant to these agreements
aggregated $2.9 million in 2007, $3.1 million in 2008 and $3.2 million in
2009.
Tall
Pines Insurance Company and EWI RE, Inc. provide for or broker certain insurance
policies for Contran and certain of its subsidiaries and affiliates, including
us. Tall Pines and EWI are subsidiaries of
Valhi. Consistent with insurance industry practices, Tall Pines and
EWI receive commissions from the insurance and reinsurance underwriters and/or
assess fees for the policies that they provide or broker. The
aggregate premiums paid to Tall Pines and EWI were approximately $1.1 million in
2007, $1.2 million in 2008 and $1.1 million in 2009. These amounts
principally included payments for insurance, but also included commissions paid
to Tall Pines and EWI. Tall Pines purchases reinsurance for
substantially all of the risks it underwrites. We expect that these
relationships with Tall Pines and EWI will continue in 2010.
Contran
and certain of its subsidiaries and affiliates, including us, purchase certain
of their insurance policies as a group, with the costs of the jointly-owned
policies being apportioned among the participating companies. With
respect to certain of these policies, it is possible that unusually large losses
incurred by one or more insureds during a given policy period could leave the
other participating companies without adequate coverage under that policy for
the balance of the policy period. As a result, Contran and certain of
its subsidiaries and affiliates, including us, have entered into a loss sharing
agreement under which any uninsured loss is shared by those entities who have
submitted claims under the relevant policy. We believe the benefits
in the form of reduced premiums and broader coverage associated with the group
coverage for such policies justifies the risk associated with the potential for
any uninsured loss.
Note
12 - Commitments and contingencies
Legal
proceedings. We are involved, from time to time, in various
contractual, product liability, patent (or intellectual property), employment
and other claims and disputes incidental to our business. On February
10, 2009, a complaint (Doc. No. DN2650) was filed with the U.S. International
Trade Commission (“ITC”) by Humanscale Corporation requesting that the ITC
commence an investigation pursuant to Section 337 of the Tariff Act of 1930 to
evaluate allegations concerning the unlawful importation of certain adjustable
keyboard related products into the U.S. by our Canadian
subsidiary. The products are alleged to infringe certain claims under
U.S. patent No. 5,292,097C1 (the “‘097 Patent”) held by
Humanscale. The complaint seeks as relief the barring of future
imports of the products into the U.S. until the expiration of the related patent
in March 2011. In March 2009 the ITC agreed to undertake the investigation and
set a procedural schedule with a hearing set for December 12, 2009 and a target
date of June 2010 for its findings. The hearing was completed on
December 4, 2009. On February 23, 2010, the administrative law judge
overseeing the investigation issued his opinion, finding that a significant
independent claim within the ‘097 Patent was determined to be “obvious” under 35
U.S.C. Section 102, which generally results in the lack of enforceability of
such a claim against infringement. The Judge further found that 38 of
the 40 keyboard support products in question that we import into the United
States from our Canadian subsidiary did not infringe on the ‘097 Patent. Sales
of the remaining two products found to be infringing are not
significant. We deny any infringement alleged in the investigation
and plan to defend ourselves with respect to any claims of infringement by
Humanscale through the Presidential review process of the ruling, which is
expected to conclude in August 2010.
F - 25
On
February 13, 2009, a Complaint for patent infringement was filed in the United
States District Court, Eastern District of Virginia, Alexandria Division (CV No.
3:09CV86-JRS) by Humanscale Corporation against CompX International Inc. and
CompX Waterloo. We answered the allegations of infringement of
Humanscale’s ‘097 Patent set forth in the complaint on March 30,
2009. We filed for a stay in the U.S. District Court Action pending
the completion of the related case before the ITC with respect to Humanscale’s
claims (as a matter of legislated right because of the ITC action) while at the
same time counterclaiming patent infringement claims against Humanscale for
infringement of our keyboard support arm patents (U.S. No. 5,037,054 and U.S.
No. 5,257,767) by Humanscale’s models 2G, 4G and 5G support
arms. Humanscale filed a response not opposing our motion to stay
their patent infringement claims but opposing our patent infringement
counterclaims against them and asking the Court to stay all claims in the matter
until the ITC investigation is concluded. We filed our response to
their motions. At a hearing before the court held on May 19, 2009,
CompX’s motion to stay the Humanscale claim of patent infringement was granted
and Humanscale’s motion to stay our counterclaims was denied. A jury
trial was completed on February 25, 2010 relating to our counter claims with the
jury finding that Humanscale infringed on our patents and awarded damages to us
in excess of $19 million for past royalties. The verdict is subject to
appeal. Due to the uncertain nature of the on-going legal proceedings we
have not accrued a receivable for the amount of the award.
While we
currently believe the disposition of all claims and disputes, individually or in
the aggregate, should not have a material long-term adverse effect on our
consolidated financial condition, results of operations or liquidity, we expect
to incur costs defending against such claims during the short-term that are
likely to be material.
Environmental matters and
litigation. Our operations are governed by various federal,
state, local and foreign environmental laws and regulations. Our
policy is to comply with environmental laws and regulations at all of our plants
and to continually strive to improve environmental performance in association
with applicable industry initiatives. We believe that our operations
are in substantial compliance with applicable requirements of environmental
laws. From time to time, we may be subject to environmental
regulatory enforcement under various statutes, resolution of which typically
involves the establishment of compliance programs.
F - 26
Income taxes. From
time to time, we undergo examinations of our income tax returns, and tax
authorities have or may propose tax deficiencies. We believe that we
have adequately provided accruals for additional income taxes and related
interest expense which may ultimately result from such examinations and we
believe that the ultimate disposition of all such examinations should not have a
material adverse effect on our consolidated financial position, results of
operations or liquidity.
We have
agreed to a policy with Contran providing for the allocation of tax liabilities
and tax payments as described in Note 1. Under applicable law, we, as
well as every other member of the Contran Tax Group, are each jointly and
severally liable for the aggregate federal income tax liability of Contran and
the other companies included in the Contran Tax Group for all periods in which
we are included in the Contran Tax Group. NL has agreed, however, to
indemnify us for any liability for income taxes of the Contran Tax Group in
excess of our tax liability previously computed and paid by us in accordance
with the tax allocation policy.
Concentration of credit
risk. Our products are sold primarily in North America to
original equipment manufacturers. The ten largest customers accounted
for approximately 31% of sales in 2007, 35% in 2008 and 39% in
2009. No customer accounted for sales of 10% or more in 2007, 2008,
or 2009.
Rent
expense, principally for buildings, was $429,000 in 2007, $461,000 in 2008 and
$478,000 in 2009. At December 31, 2009, future minimum rentals under
noncancellable operating leases are shown below.
|
Years ending December 31,
|
Amount
|
|||
|
(In
thousands)
|
||||
|
2010
|
$ | 409 | ||
|
2011
|
342 | |||
|
2012
|
38 | |||
|
2013
|
- | |||
|
Total
|
$ | 789 | ||
Note
13 – Recent accounting pronouncements:
Derivative Disclosures – In
March 2008, the FASB issued SFAS No. 161, Disclosures about Derivative
Instruments and Hedging Activities, an Amendment of FASB Statement No. 133,
which is now included with ASC Topic 815 Derivatives and
Hedging. SFAS No. 161 changes the disclosure requirements for
derivative instruments and hedging activities to provide enhanced disclosures
about how and why we use derivative instruments, how derivative instruments and
related hedged items are accounted for under SFAS No. 133 and how derivative
instruments and related hedged items affect our financial position and
performance and cash flows. This statement became effective for us in the
first quarter of 2009. We periodically use currency forward contracts to
manage a portion of our currency exchange rate market risk associated with trade
receivables or future sales. Because our prior disclosures regarding
these forward contracts substantially met all of the applicable disclosure
requirements of the new standard, its effectiveness did not have a significant
effect on our Consolidated Financial Statements. We had no outstanding forward
contracts at December 31, 2009.
Fair Value Disclosures - Also
in April 2009, the FASB issued FSP FAS 107-1 and APB 28-1, Interim Disclosures about Fair Value
of Financial Instruments, which is now included with ASC Topic 825 Financial
Instruments. This FSP will require us to disclose the fair
value of all financial instruments for which it is practicable to estimate the
value, whether recognized or not recognized in the statement of financial
position, as required by SFAS No. 107, Disclosures about Fair Value of Financial
Instruments for interim as well as annual periods. Prior to
the adoption of the FSP we were only required to disclose this information
annually. This FSP became effective for us in the second quarter of
2009, see Note 14.
F - 27
Subsequent Events – In May
2009, the FASB issued SFAS No. 165, Subsequent Events, which is
now included with ASC Topic 855 Subsequent Events, which was
subsequently amended by Accounting Standards Updated (“ASU”)
2010-09. SFAS No. 165 establishes general standards of accounting for
and disclosure of events that occur after the balance sheet date but before
financial statements are issued, which are referred to as subsequent events. The
statement clarifies existing guidance on subsequent events including a
requirement that a public entity should evaluate subsequent events through the
issue date of the financial statements, the determination of when the effects of
subsequent events should be recognized in the financial statements and
disclosures regarding all subsequent events. SFAS No. 165 became
effective for us in the second quarter of 2009 and its adoption did not have a
material effect on our Consolidated Financial Statements.
Uncertain Tax Positions - In the second quarter
of 2006 the FASB issued FIN No. 48, Accounting for Uncertain Tax
Positions, which is now included with ASC Topic 740 Income Taxes, which we
adopted on January 1, 2007. FIN No. 48 clarifies when and how much of
a benefit we can recognize in our consolidated financial statements for certain
positions taken in our income tax returns and enhances the disclosure
requirements for our income tax policies and reserves. Among other
things, FIN No. 48 prohibits us from recognizing the benefits of a tax position
unless we believe it is more-likely-than-not our position will prevail with the
applicable tax authorities and limits the amount of the benefit to the largest
amount for which we believe the likelihood of realization is greater than
50%. FIN No. 48 also requires companies to accrue penalties and
interest on the difference between tax positions taken on their tax returns and
the amount of benefit recognized for financial reporting purposes under the new
standard. We are required to classify any future reserves for
uncertain tax positions in a separate current or noncurrent liability, depending
on the nature of the tax position. Our adoption of FIN 48 did not
have a material impact on our consolidated financial position or results of
operations. Upon adopting FIN 48 on January 1, 2007, we recognized a
$41,000 increase to retained earnings.
We accrue
interest and penalties on our uncertain tax positions as a component of our
provision for income taxes. The amount of interest and penalties we
accrued at December 31, 2007 was $45,000 and nil at December 31, 2008 and
2009.
Other
than a $300,000 decrease in our reserve for uncertain tax positions in 2007
relating to cash paid for income taxes upon settlement of certain matters with
tax authorities, there were no material changes to our reserve for uncertain tax
positions during 2007. Upon the expiration of certain statute of
limitations, we released the $192,000 balance of our remaining reserve for
uncertain tax positions in 2008. We had no reserve for uncertain tax positions
at December 31, 2008 and 2009.
We file
income tax returns in various U.S. federal, state and local jurisdictions.
We also file income tax returns in various foreign jurisdictions, principally in
Canada and Taiwan. Our domestic income tax returns prior to 2006 are
generally considered closed to examination by applicable tax authorities.
Our foreign income tax returns are generally considered closed to examination
for years prior to 2004 for Taiwan, and 2005 for Canada.
Note
14 – Financial instruments:
The
carrying amounts of accounts receivable and accounts payable approximates fair
value due to their short-term nature. The carrying amount of our
indebtedness approximates fair value due to the stated variable interest rate
approximating a market rate. The fair value of our indebtedness is a
Level 2 input as defined by ASC Topic 820-10-35.
F - 28
Note
15 – Quarterly results of operations (unaudited):
|
Quarter ended
|
||||||||||||||||
|
March 31
|
June 30
|
Sept. 30
|
Dec. 31
|
|||||||||||||
|
(In
millions, except per share amounts)
|
||||||||||||||||
|
2008:
|
||||||||||||||||
|
Net
sales
|
$ | 40.5 | $ | 43.7 | $ | 43.9 | $ | 37.4 | ||||||||
|
Gross
profit
|
9.9 | 11.0 | 11.2 | 8.1 | ||||||||||||
|
Operating
income (loss)
|
3.5 | 4.5 | (4.9 | )(a) | 3.1 | |||||||||||
|
Net
income (loss)
|
1.6 | 2.1 | (7.5 | )(a) | 0.7 | |||||||||||
|
Basic
and diluted earnings (loss) per
share
|
$ | .13 | $ | .17 | $ | (.61 | ) | $ | .06 | |||||||
|
2009:
|
||||||||||||||||
|
Net
sales
|
$ | 28.5 | $ | 29.2 | $ | 29.4 | $ | 29.0 | ||||||||
|
Gross
profit
|
4.8 | 6.2 | 7.0 | 5.8 | (c) | |||||||||||
|
Operating
income (loss)
|
0.9 | (0.9 | ) | (0.1 | ) | (2.0 | )(b) | |||||||||
|
Net
income (loss)
|
0.6 | (1.6 | ) | 0.5 | (0.3 | )(c) | ||||||||||
|
Basic
and diluted earnings (loss) per
share
|
$ | (.05 | ) | $ | (.13 | ) | $ | .04 | $ | (.03 | ) | |||||
The sum
of the quarterly per share amounts may not equal the annual per share amounts
due to relative changes in the weighted-average number of shares used in the per
share computations.
(a) We
recorded a goodwill impairment charge of $9.9 million for our Marine Components
reporting unit in the third quarter of 2008. See Note 4.
(b) We
recorded $2.1 million of patent litigation expense in the fourth quarter of
2009. See Note 12.
(c) In
the fourth quarter of 2009, we recognized an inventory adjustment to correct an
error in the valuation of certain of our raw material inventories at one of our
locations, which negatively impacted gross profit by approximately
$300,000. Net income in the fourth quarter of 2009 includes a
$190,000 charge, net of income tax, or $.02 per diluted share, related to this
item.
F - 29